 Deutsch
 English
 Español
 Français
 Italiano
 Nederlands
 Polski
 Português
 Русский
 Türkçe
 Svenska
 Chinese
 Magyar
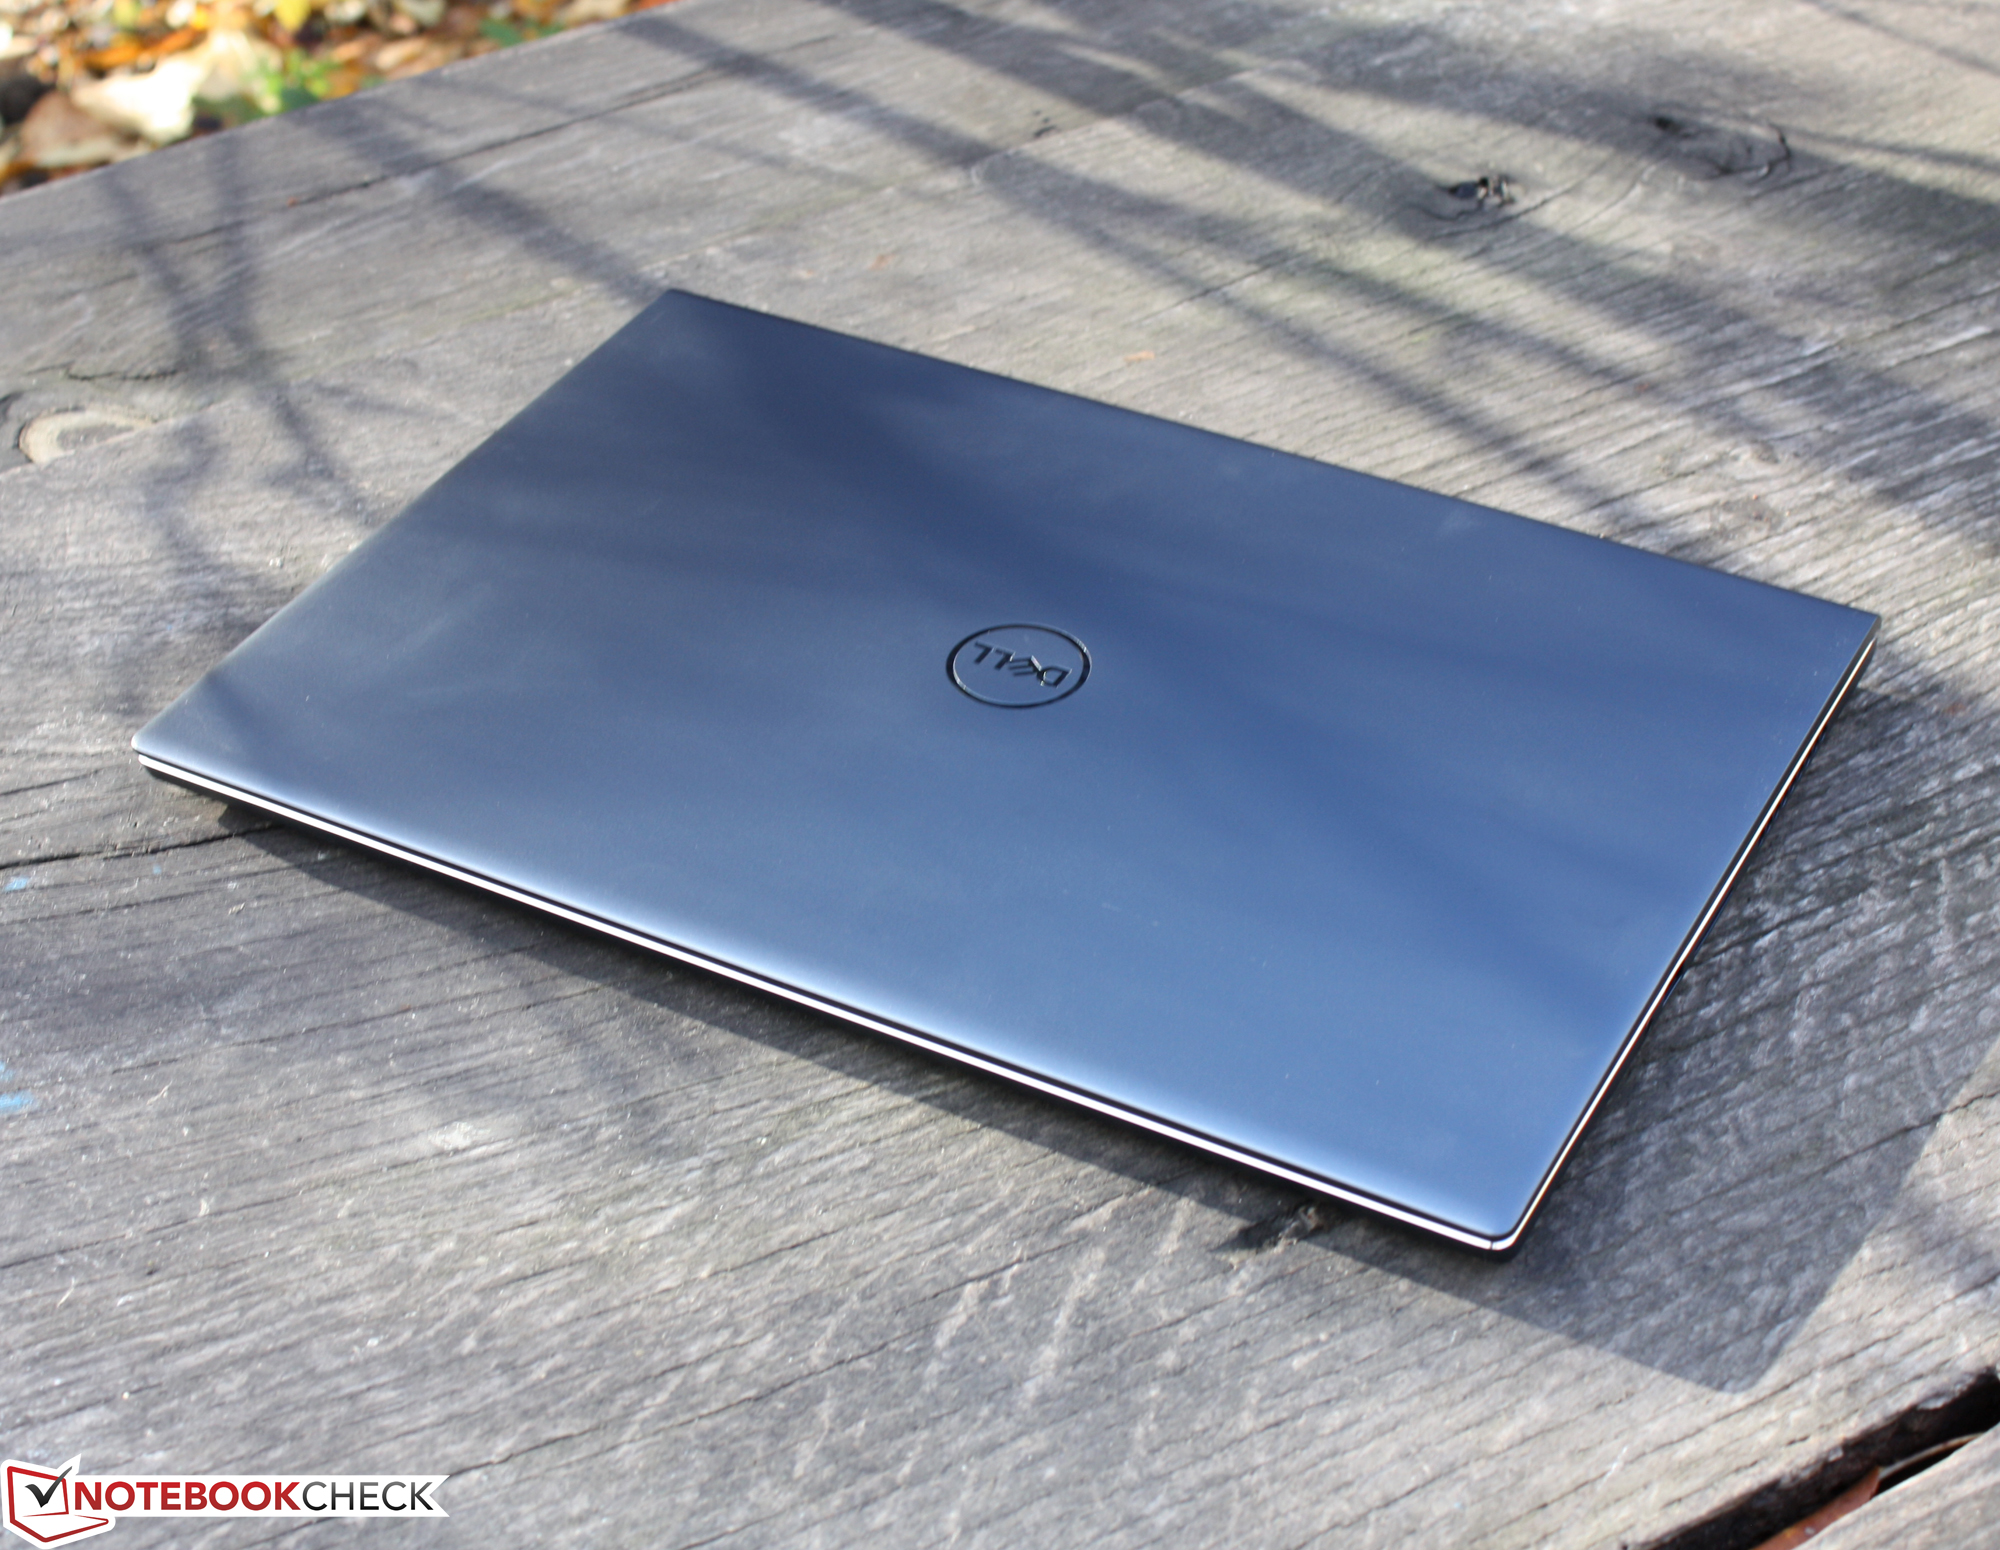
Dell Inspiron 16 Plus 7610 review: More performance without Nvidia?

Would an Inspiron 16 Plus 7610 without the Nvidia graphics card perhaps be better for me as a non-gamer than the dGPU version? We acquired an Inspiron 16 Plus 7610 MHJ8F with an i7-11800H, 16 GB of RAM, and 512-GB SSD to answer exactly this question. In the test of the Inspiron 16 Plus 7610 with RTX, our colleagues had complained about the below-average performance development of the processor. So does the Core i7 now have more headroom in terms of the cooling? Is the heat development perhaps lower or the battery life longer? We find out the answers in this test.
Possible Competitors in Comparison
Rating | Date | Model | Weight | Height | Size | Resolution | Best Price |
|---|---|---|---|---|---|---|---|
| 82.6 % | 11/2021 | Dell Inspiron 16 Plus 7610-MHJ8F i7-11800H, UHD Graphics Xe 32EUs (Tiger Lake-H) | 2 kg | 19 mm | 16.00" | 3072x1920 | |
| 86.7 % | 08/2021 | Dell Inspiron 16 Plus 7610 i7-11800H, GeForce RTX 3050 4GB Laptop GPU | 2 kg | 18.99 mm | 16.00" | 3072x1920 | |
| 86.3 % | 06/2021 | LG Gram 16 (2021) i7-1165G7, Iris Xe G7 96EUs | 1.2 kg | 16.8 mm | 16.00" | 2560x1600 | |
| 87.4 % | 08/2021 | Lenovo Legion 5 Pro 16ACH6H (82JQ001PGE) R7 5800H, GeForce RTX 3070 Laptop GPU | 2.6 kg | 26.85 mm | 16.00" | 2560x1600 | |
| 82.4 % | 01/2021 | Dell Inspiron 15 7000 7506 2-in-1 Black Edition i7-1165G7, Xe MAX | 1.9 kg | 17.94 mm | 15.60" | 3840x2160 | |
| 82.7 % | 03/2021 | Acer Aspire 5 A517-52G-79Z5 i7-1165G7, GeForce MX350 | 2.2 kg | 19.9 mm | 17.30" | 1920x1080 |
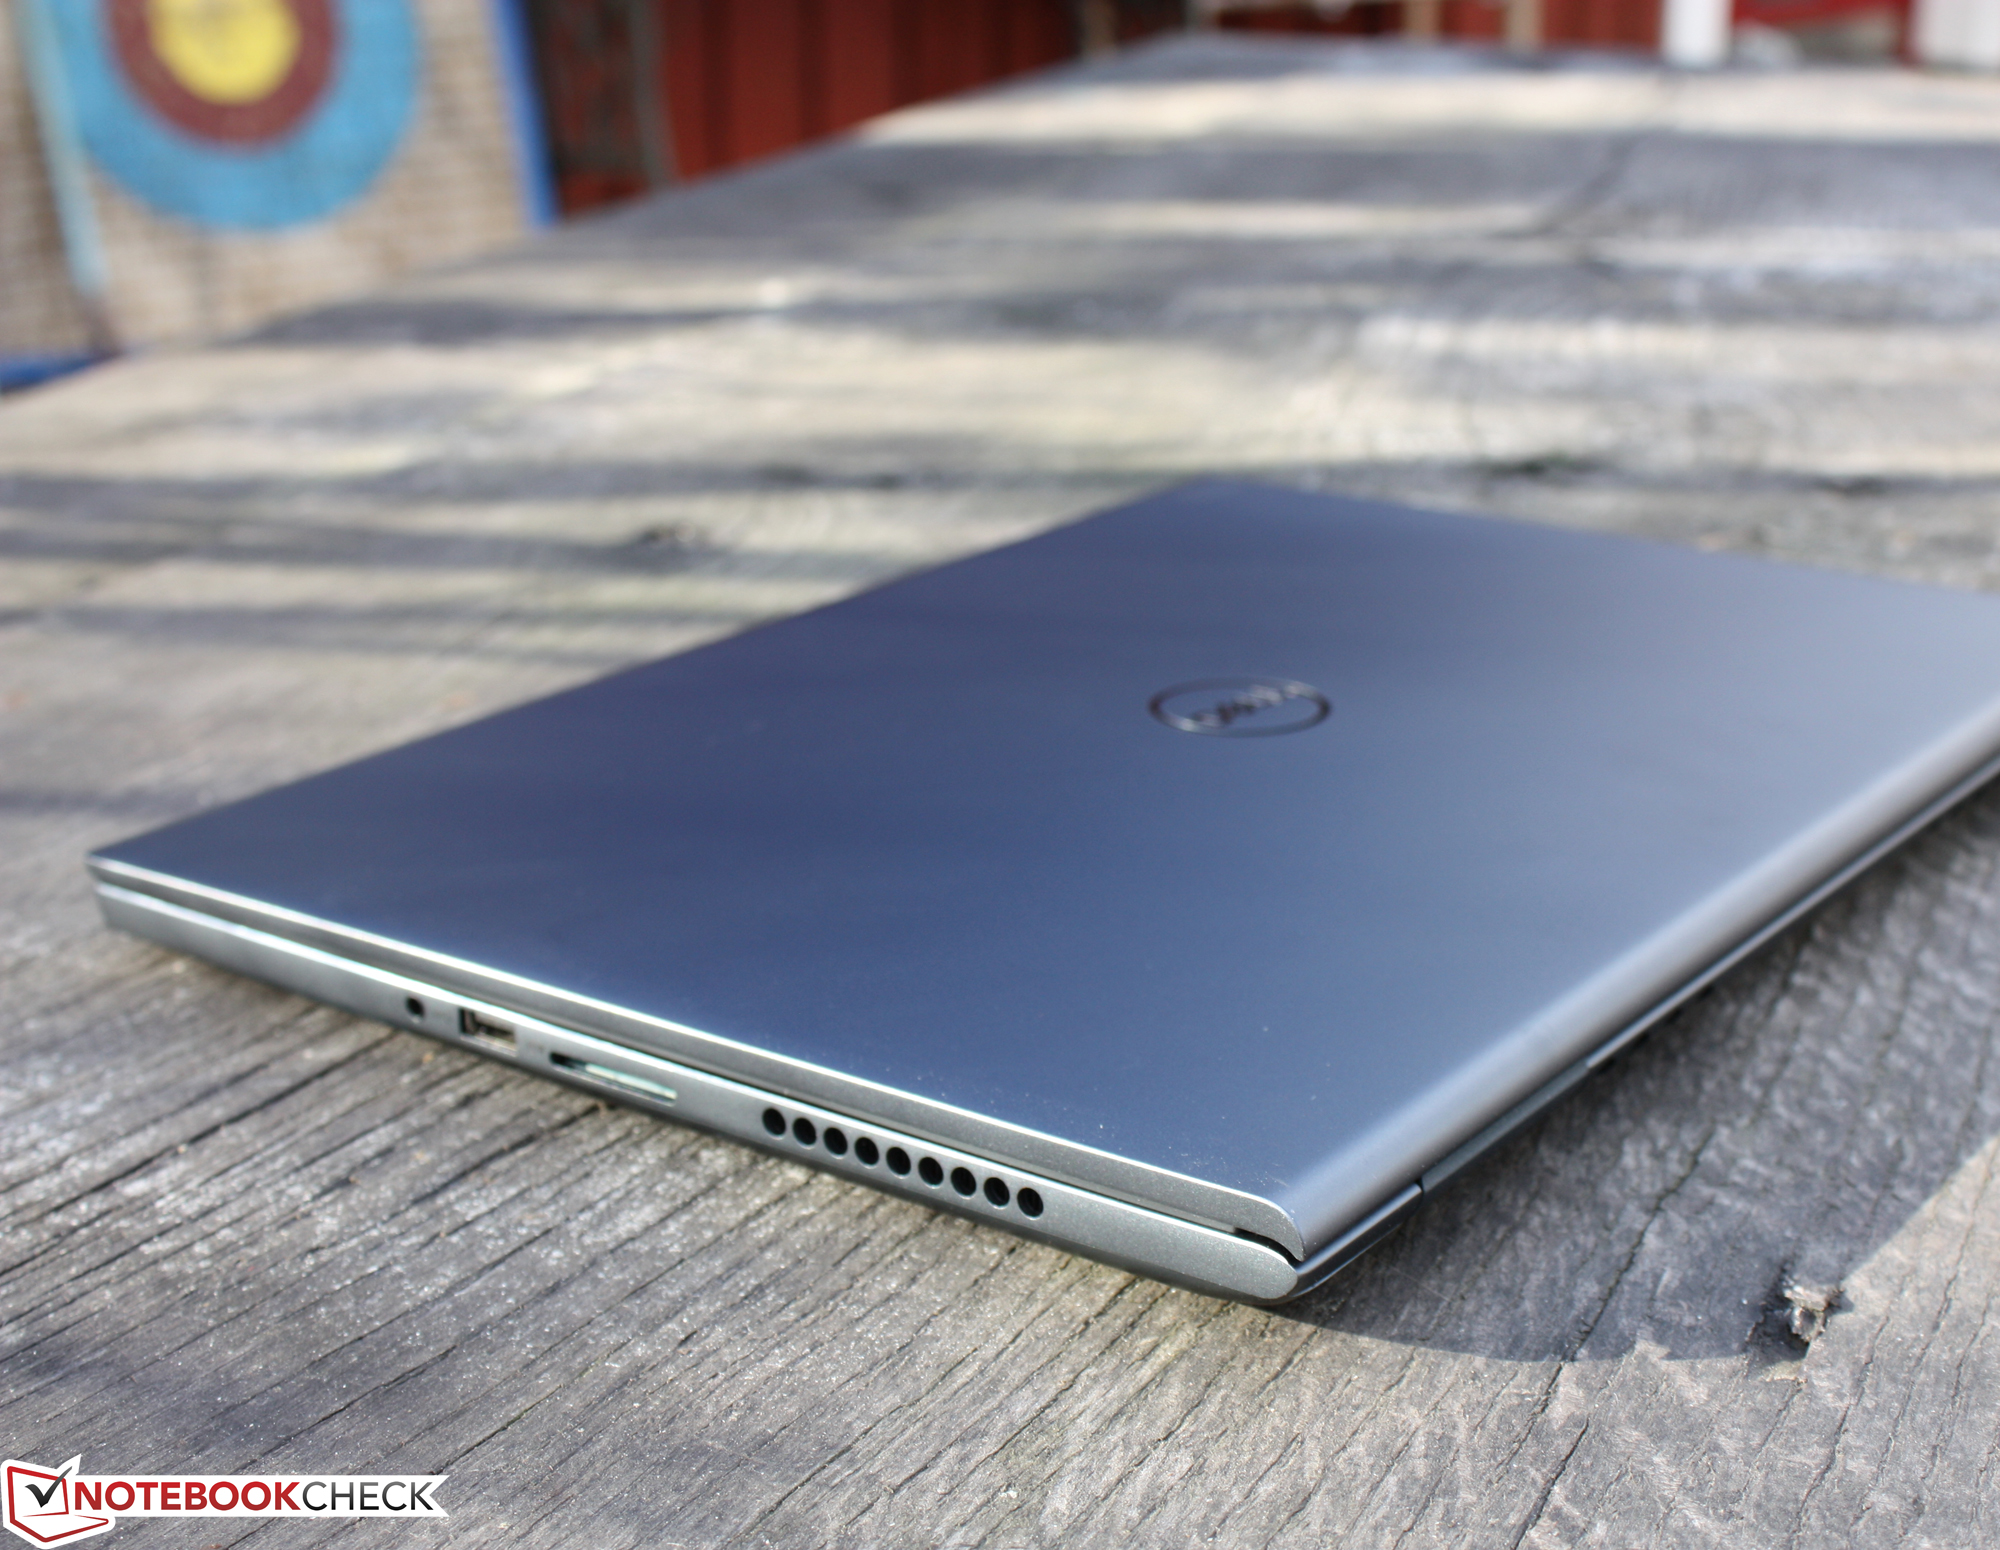
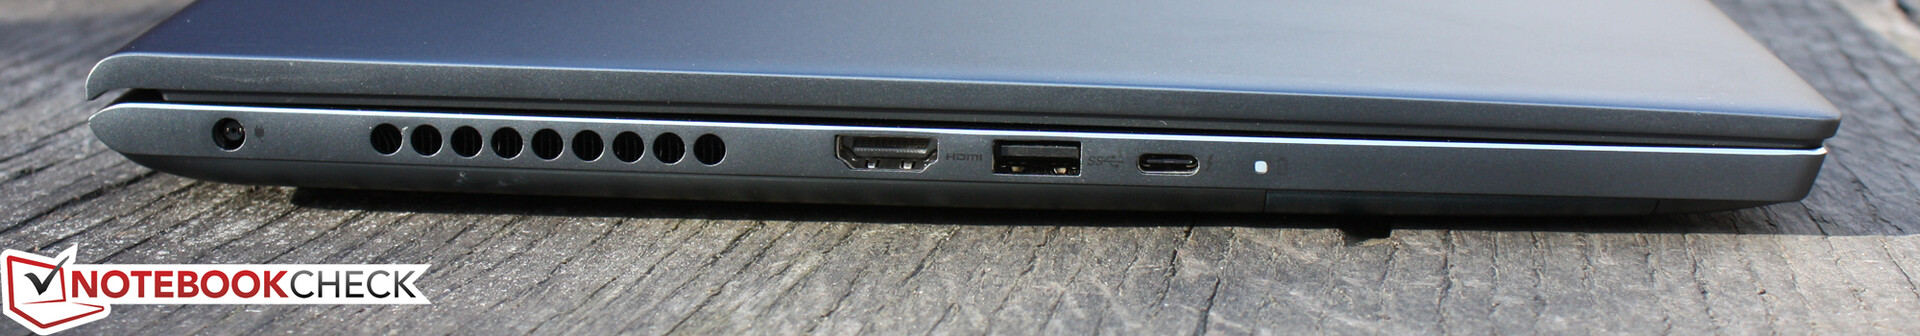
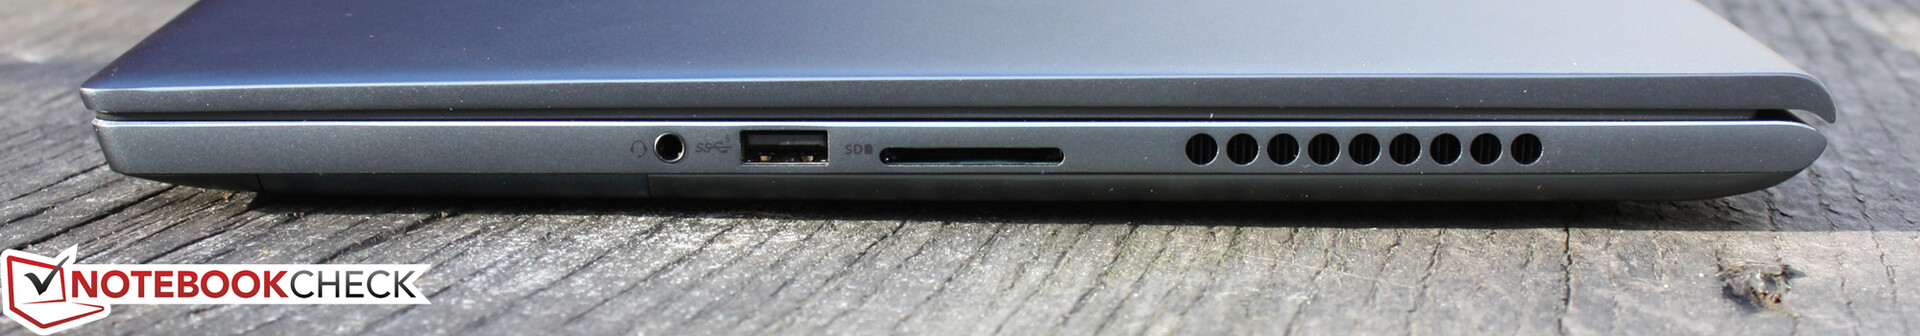
Case and Equipment
You can find out all the details on this subject in our complete test of the Dell Inspiron 16 Plus 7610 GPU version.

| SD Card Reader | |
| average JPG Copy Test (av. of 3 runs) | |
| Average of class Multimedia (17.6 - 205, n=66, last 2 years) | |
| LG Gram 16 (2021) (Toshiba Exceria Pro M501 microSDXC 64GB) | |
| Dell Inspiron 15 7000 7506 2-in-1 Black Edition (Toshiba Exceria Pro M501 microSDXC 32GB) | |
| Dell Inspiron 16 Plus 7610-MHJ8F (AV Pro SD microSD 128 GB V60) | |
| Dell Inspiron 16 Plus 7610 (AV PRO microSD 128 GB V60) | |
| maximum AS SSD Seq Read Test (1GB) | |
| Average of class Multimedia (16.8 - 266, n=62, last 2 years) | |
| LG Gram 16 (2021) (Toshiba Exceria Pro M501 microSDXC 64GB) | |
| Dell Inspiron 15 7000 7506 2-in-1 Black Edition (Toshiba Exceria Pro M501 microSDXC 32GB) | |
| Dell Inspiron 16 Plus 7610-MHJ8F (AV Pro SD microSD 128 GB V60) | |
| Dell Inspiron 16 Plus 7610 (AV PRO microSD 128 GB V60) | |
, i7-11800H, OM3PDP3-AD NVMe KDI 512GB")
, i7-11800H, OM3PDP3-AD NVMe KDI 512GB")
Display - Good colors, acceptable brightness, and slow response times
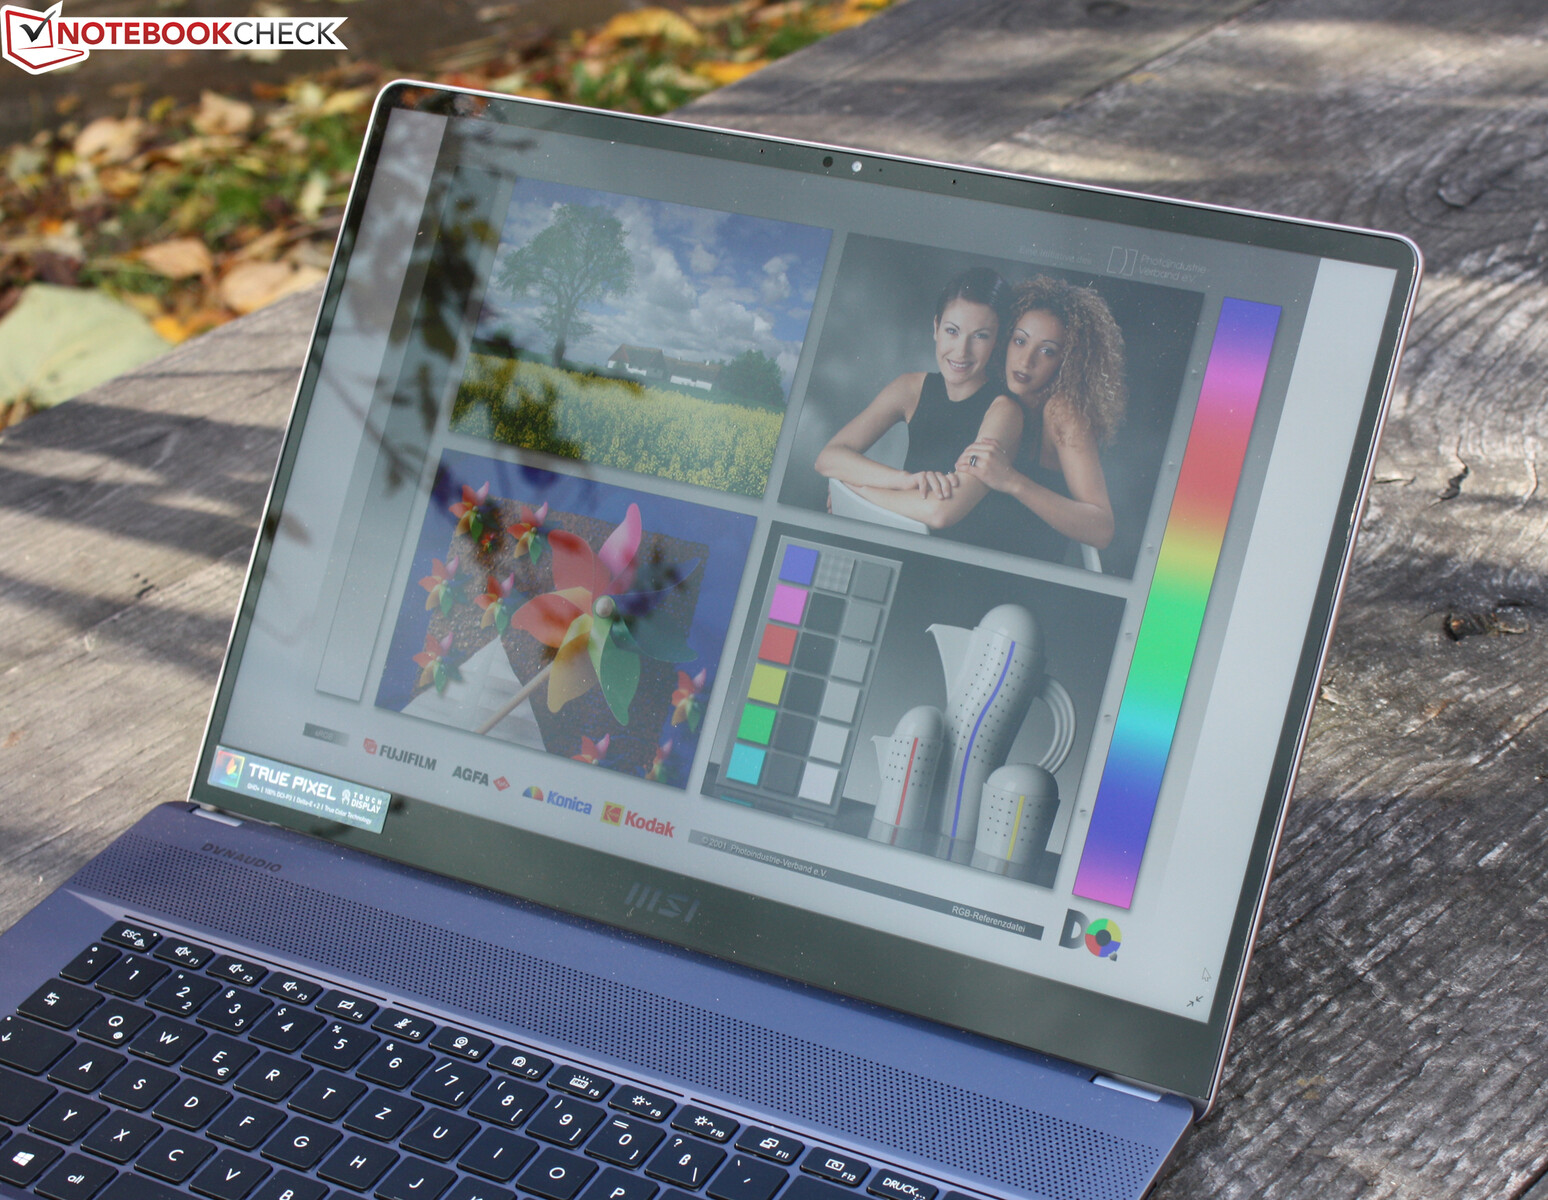
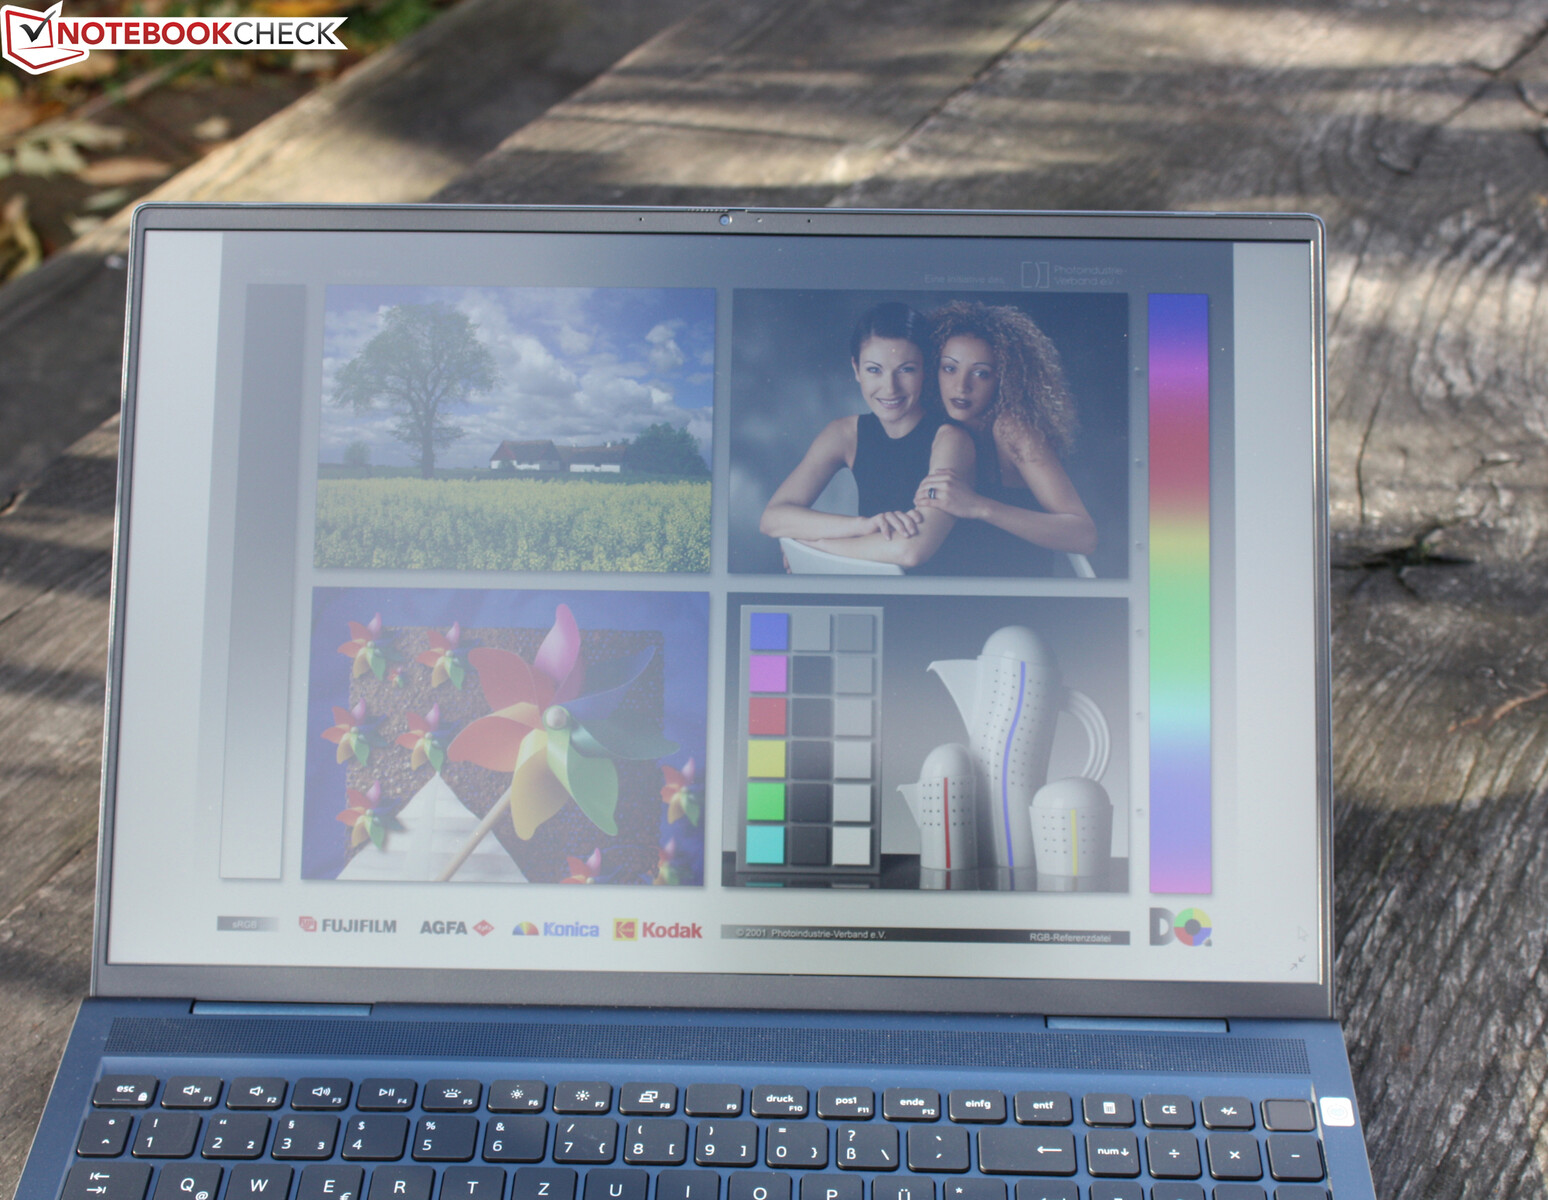
Our test unit also uses the 3K AU Optronics B160QAN IPS panel, which is apparently the standard for all 7610 models. The resolution is identical to that of the MacBook Pro 16. Since the DPI turns out almost as high as in a 4K display, you might need to adjust your text scaling in order to improve readability.
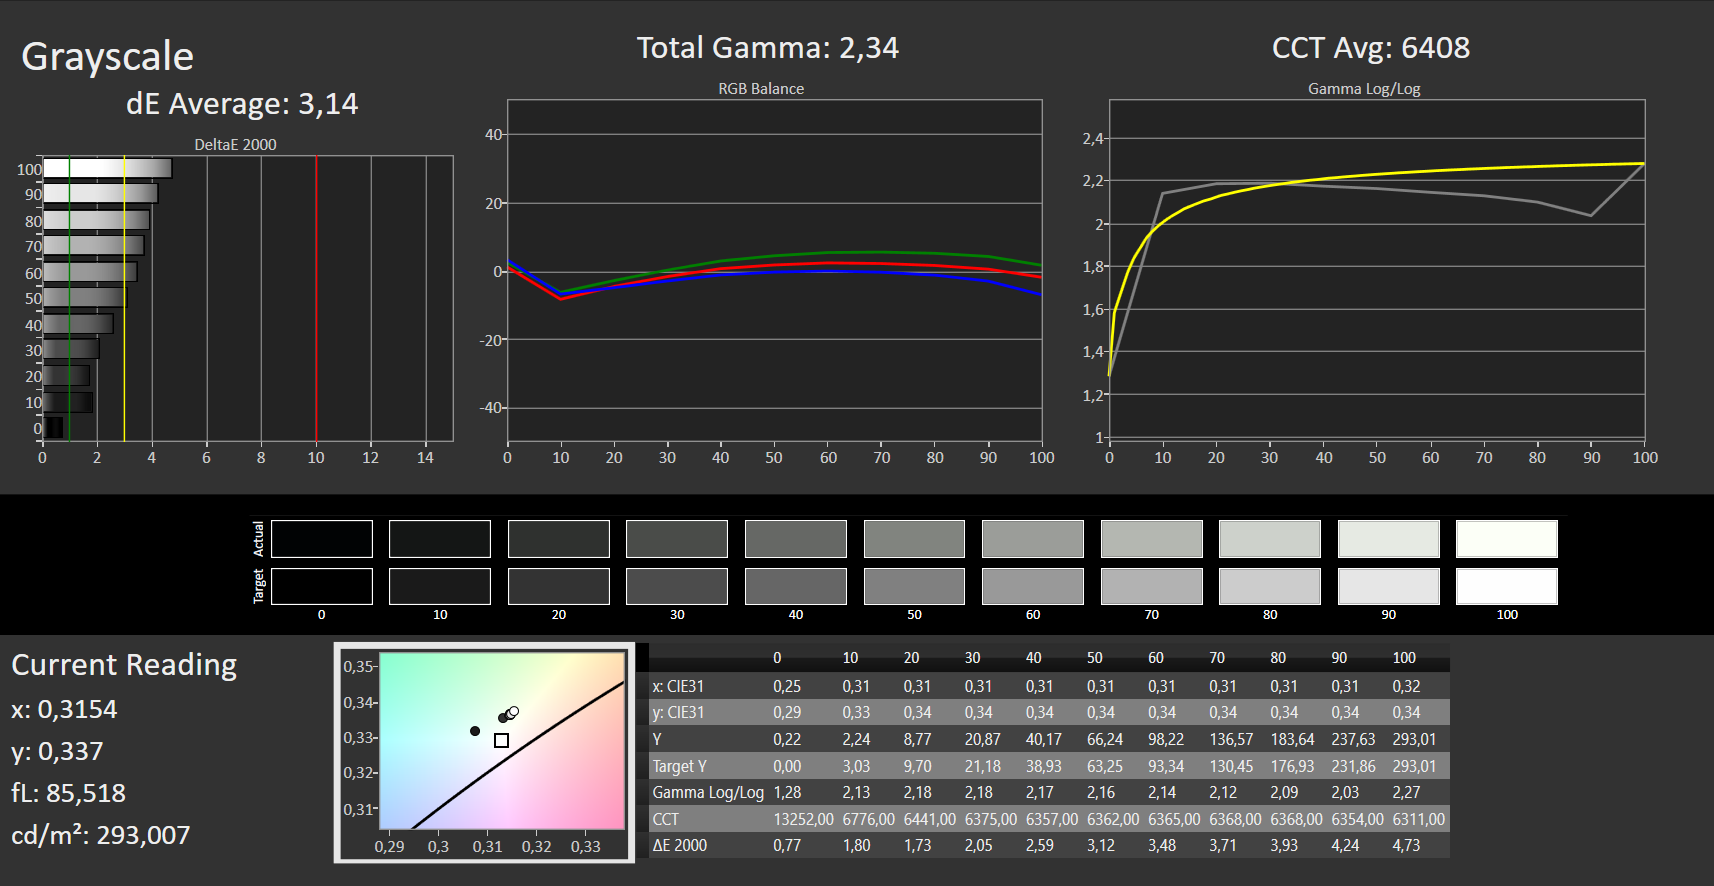
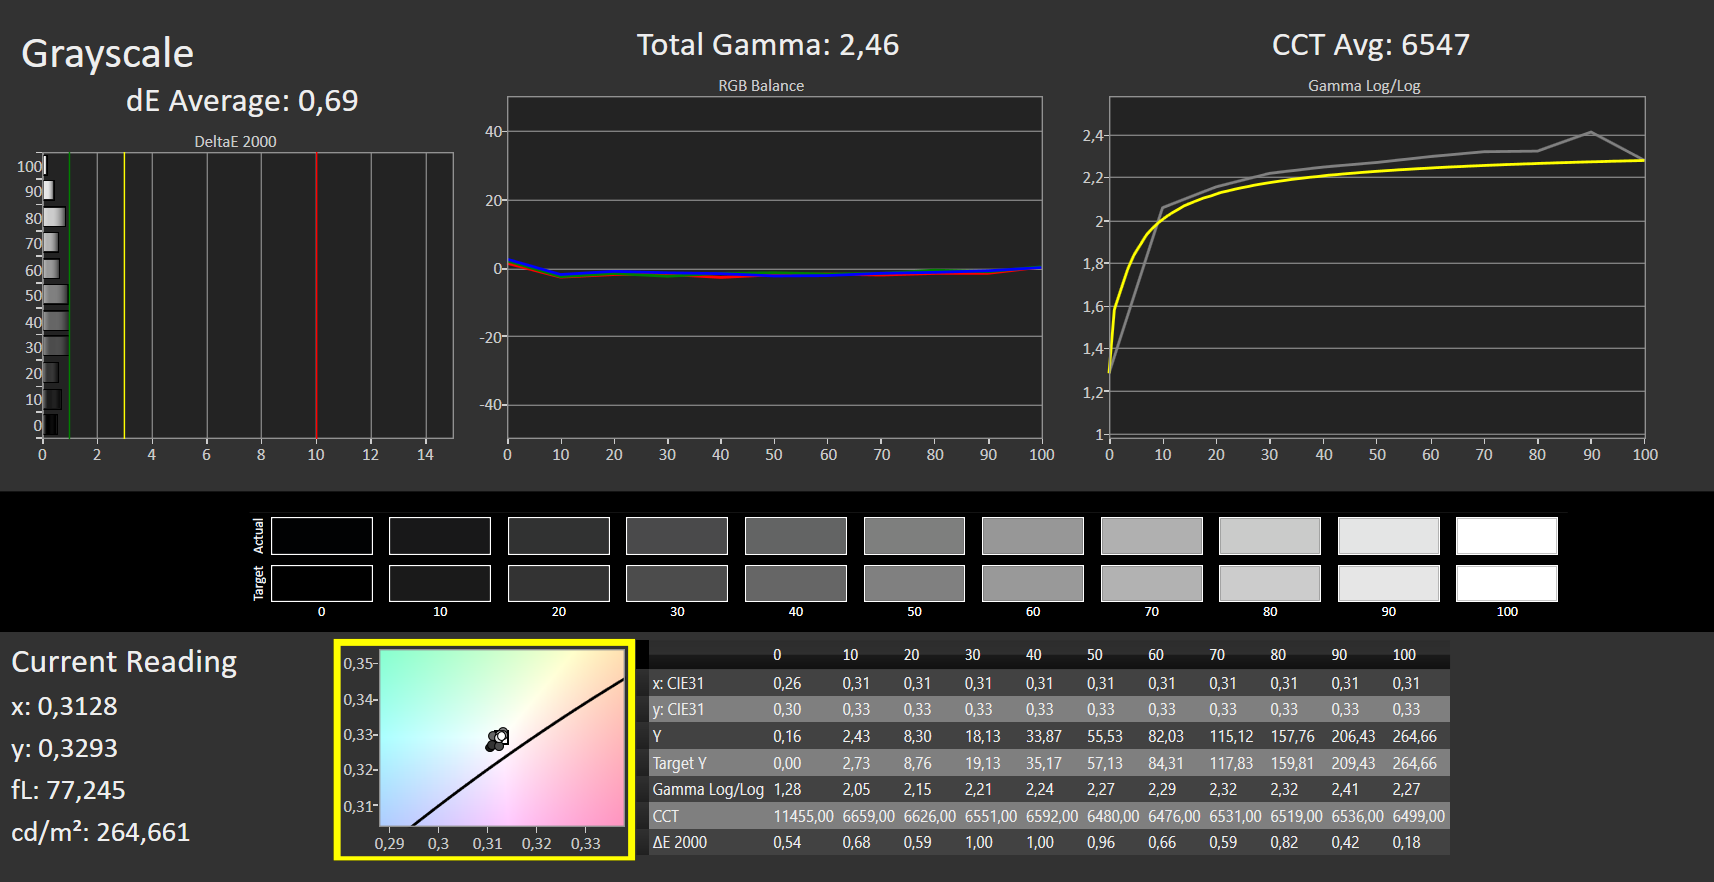
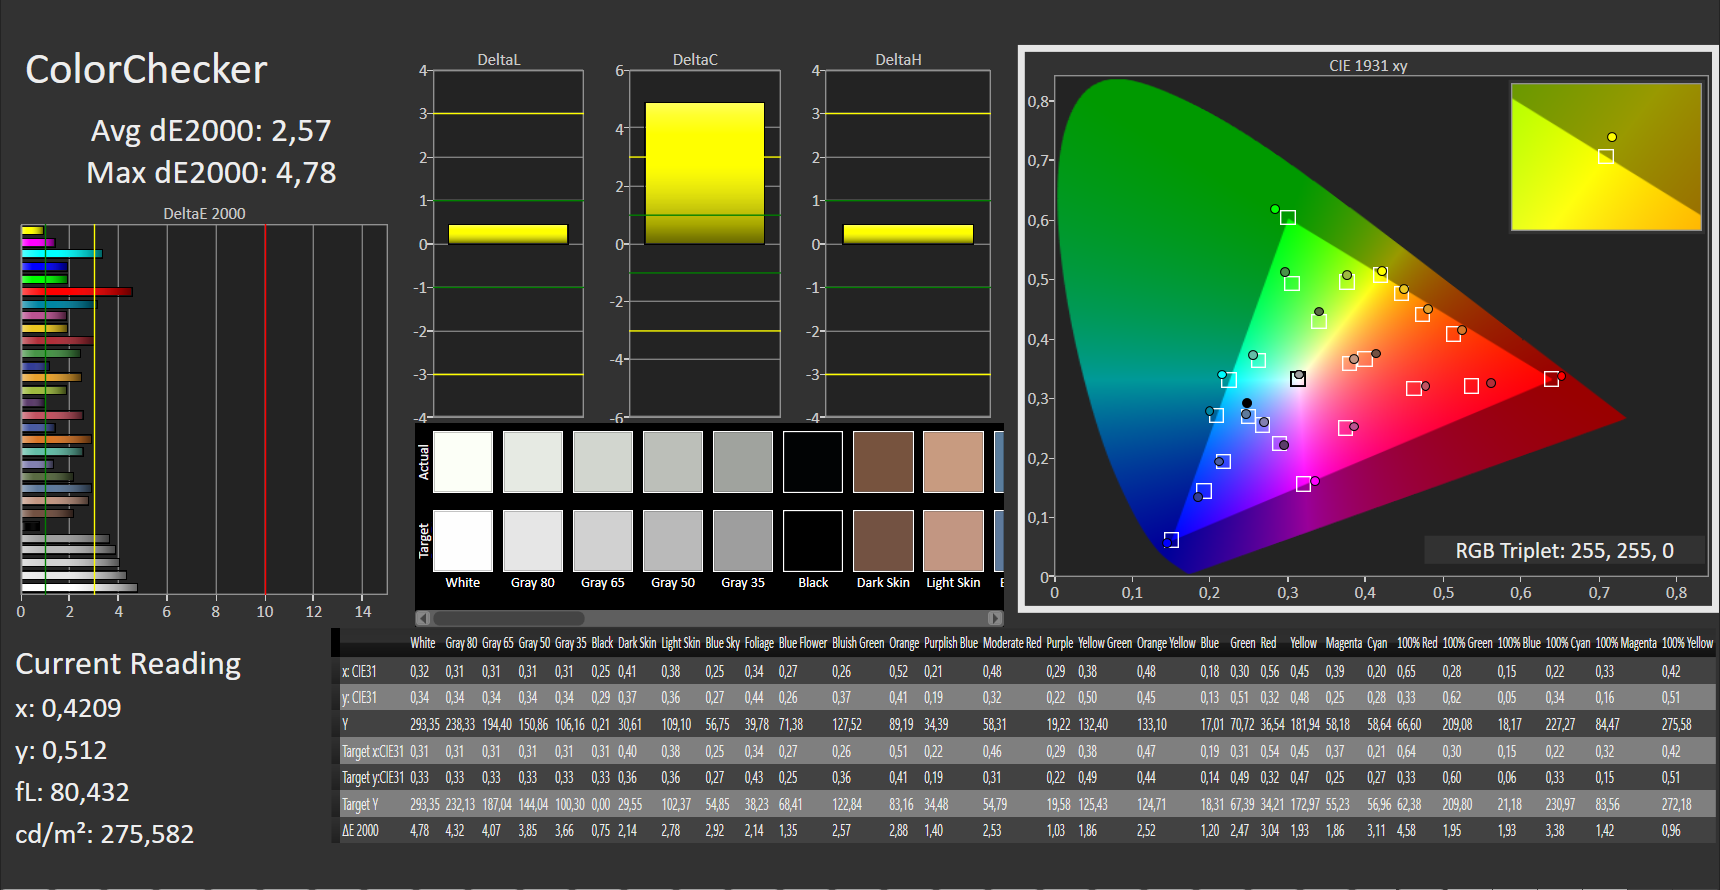
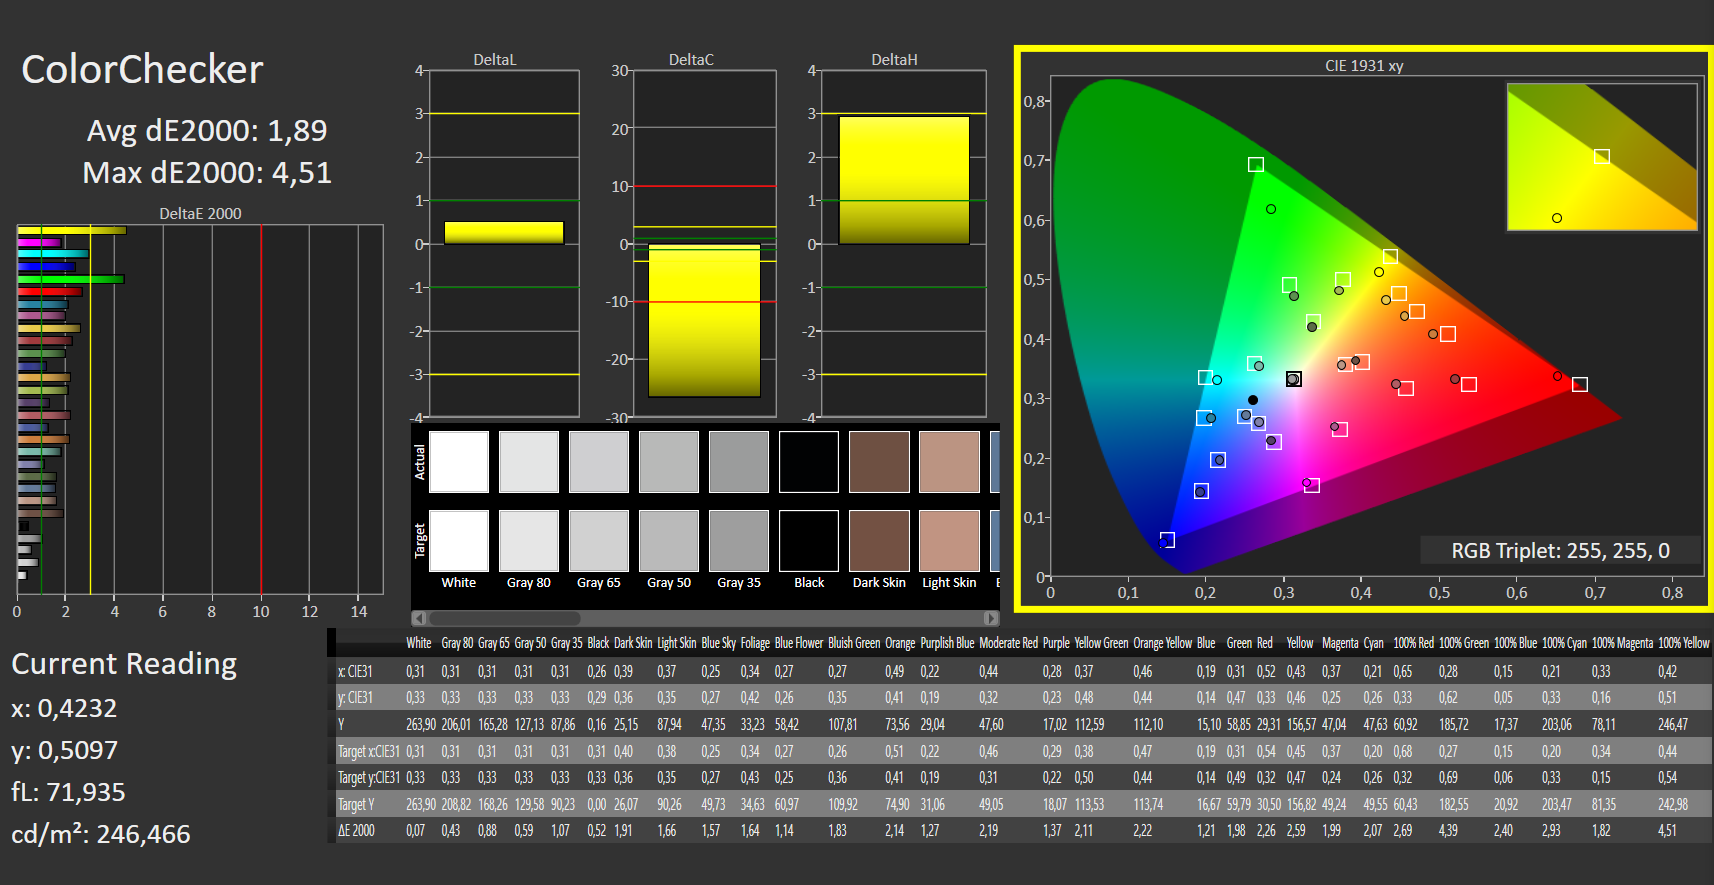
Because of the identical build of the panel as in the Geforce model, the same points are also valid here: the display quality is good but not excellent, the contrast ratio is at almost 1400:1, the DeltaE deviations are low, and sRGB is covered - but not the Adobe color space. The Inspiron 16 distinguishes itself with its slow response times from 16-inch gaming laptops such as the Legion 5 Pro, which offers significantly faster response times. Compared to the competitors, the brightness is moderate, but evenly distributed. There is no PWM.
| |||||||||||||||||||||||||
Brightness Distribution: 88 %
Center on Battery: 275 cd/m²
Contrast: 1381:1 (Black: 0.21 cd/m²)
ΔE Color 2.57 | 0.5-29.43 Ø5, calibrated: 1.89
ΔE Greyscale 3.14 | 0.57-98 Ø5.3
76% AdobeRGB 1998 (Argyll 2.2.0 3D)
100% sRGB (Argyll 2.2.0 3D)
75% Display P3 (Argyll 2.2.0 3D)
Gamma: 2.34
| Dell Inspiron 16 Plus 7610-MHJ8F AU Optronics B160QAN, AUO9F91, IPS, 3072x1920, 16.00 | Dell Inspiron 16 Plus 7610 AU Optronics B160QAN, IPS, 3072x1920, 16.00 | LG Gram 16 (2021) LG Philips LP160WQ1-SPA1, IPS, 2560x1600, 16.00 | Lenovo Legion 5 Pro 16ACH6H (82JQ001PGE) CSOT T3 MNG007DA1-1, IPS, 2560x1600, 16.00 | Dell Inspiron 15 7000 7506 2-in-1 Black Edition AU Optronics B156ZAN, IPS, 3840x2160, 15.60 | Acer Aspire 5 A517-52G-79Z5 BOE084E, IPS, 1920x1080, 17.30 | |
|---|---|---|---|---|---|---|
| Display | -1% | 13% | -3% | -1% | -45% | |
| Display P3 Coverage | 75 | 74.1 -1% | 95.8 28% | 74.3 -1% | 39.98 -47% | |
| sRGB Coverage | 100 | 99.4 -1% | 99.8 0% | 99 -1% | 99 -1% | 59.3 -41% |
| AdobeRGB 1998 Coverage | 76 | 75.8 0% | 83.8 10% | 73 -4% | 74.6 -2% | 41.3 -46% |
| Response Times | -3% | 28% | 84% | -4% | 75% | |
| Response Time Grey 50% / Grey 80% * | 54 ? | 49.2 ? 9% | 44 ? 19% | 9.2 ? 83% | 55.2 ? -2% | 14 ? 74% |
| Response Time Black / White * | 32 ? | 36.8 ? -15% | 20 ? 37% | 4.8 85% | 34 ? -6% | 8 ? 75% |
| PWM Frequency | ||||||
| Screen | 3% | -39% | 13% | -33% | -24% | |
| Brightness middle | 290 | 296.8 2% | 331 14% | 551 90% | 303.8 5% | 321 11% |
| Brightness | 285 | 292 2% | 309 8% | 523 84% | 296 4% | 282 -1% |
| Brightness Distribution | 88 | 87 -1% | 88 0% | 88 0% | 93 6% | 81 -8% |
| Black Level * | 0.21 | 0.21 -0% | 0.22 -5% | 0.54 -157% | 0.24 -14% | 0.36 -71% |
| Contrast | 1381 | 1413 2% | 1505 9% | 1020 -26% | 1266 -8% | 892 -35% |
| Colorchecker dE 2000 * | 2.57 | 2.56 -0% | 4.64 -81% | 1.8 30% | 4.58 -78% | 4.3 -67% |
| Colorchecker dE 2000 max. * | 4.78 | 4.76 -0% | 9.82 -105% | 2.53 47% | 9.4 -97% | 7.1 -49% |
| Colorchecker dE 2000 calibrated * | 1.89 | 1.86 2% | 3.16 -67% | 1.66 12% | 2.17 -15% | |
| Greyscale dE 2000 * | 3.14 | 2.6 17% | 6.9 -120% | 1.85 41% | 6.4 -104% | 2.26 28% |
| Gamma | 2.34 94% | 2.07 106% | 2.34 94% | 2.3 96% | 2.3 96% | 2.36 93% |
| CCT | 6408 101% | 6628 98% | 7904 82% | 6338 103% | 7414 88% | 6650 98% |
| Color Space (Percent of AdobeRGB 1998) | 75.1 | 72.81 | 66.7 | 38 | ||
| Color Space (Percent of sRGB) | 100 | 99.41 | 99 | 59 | ||
| Total Average (Program / Settings) | -0% /
1% | 1% /
-18% | 31% /
22% | -13% /
-22% | 2% /
-14% |
* ... smaller is better
Display Response Times
| ↔ Response Time Black to White | ||
|---|---|---|
| 32 ms ... rise ↗ and fall ↘ combined | ↗ 15 ms rise |  |
| ↘ 17 ms fall | ||
| The screen shows slow response rates in our tests and will be unsatisfactory for gamers. In comparison, all tested devices range from 0.1 (minimum) to 240 (maximum) ms. » 84 % of all devices are better. This means that the measured response time is worse than the average of all tested devices (21.5 ms). | ||
| ↔ Response Time 50% Grey to 80% Grey | ||
| 54 ms ... rise ↗ and fall ↘ combined | ↗ 24 ms rise |  |
| ↘ 30 ms fall | ||
| The screen shows slow response rates in our tests and will be unsatisfactory for gamers. In comparison, all tested devices range from 0.2 (minimum) to 636 (maximum) ms. » 89 % of all devices are better. This means that the measured response time is worse than the average of all tested devices (33.7 ms). | ||
Screen Flickering / PWM (Pulse-Width Modulation)
| Screen flickering / PWM not detected |  | ||
In comparison: 53 % of all tested devices do not use PWM to dim the display. If PWM was detected, an average of 17900 (minimum: 5 - maximum: 3846000) Hz was measured. | |||
Performance
As the standard, Intel's Tiger Lake H CPUs (11400H, 11800H) and optionally, a GeForce RTX 3050 or RTX 3060 are used. While our test unit does not have a dGPU, it isn't quite low-end with its 16 GB of RAM. At the time of the test, there are no AMD models.
Test Conditions
The benchmarks were run in mains operation using the highest performance profile.
Processor
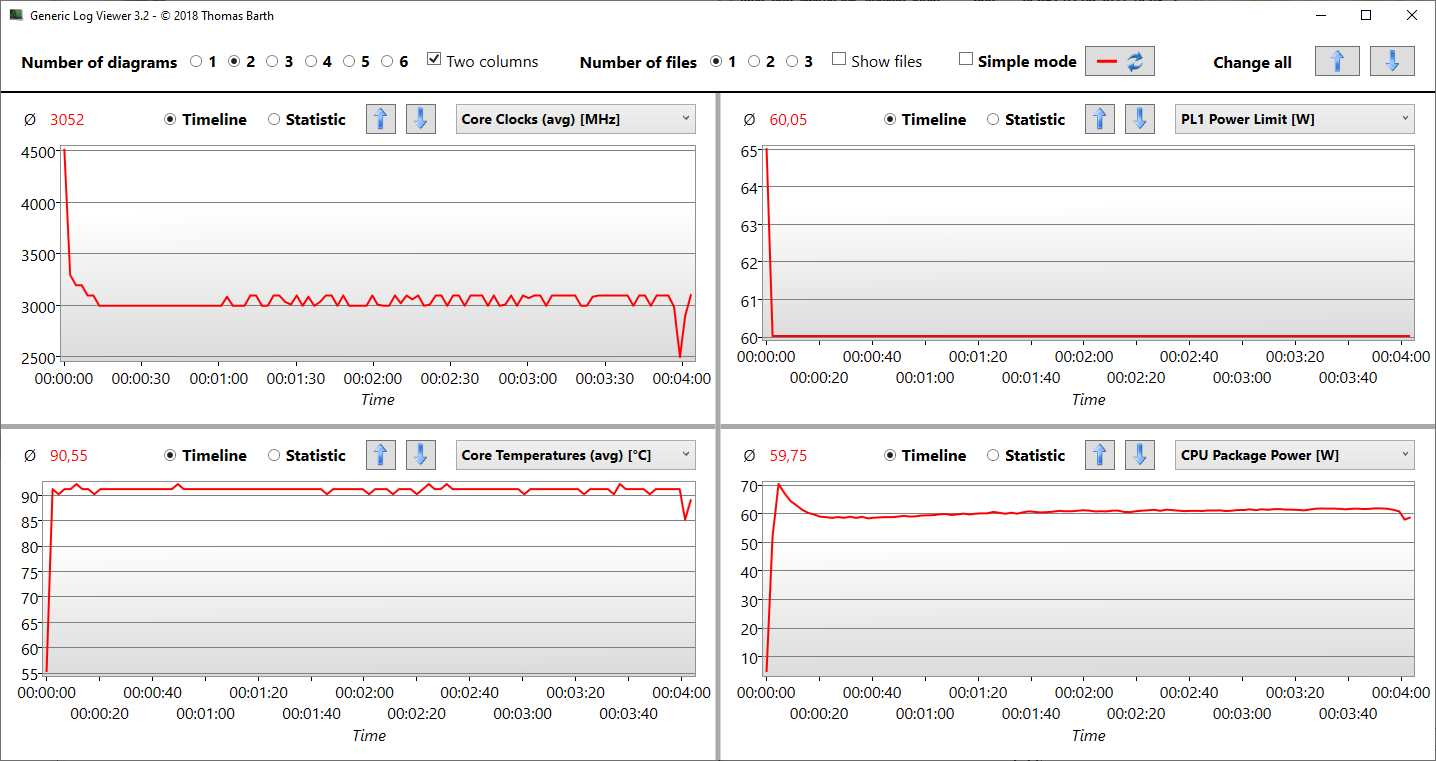
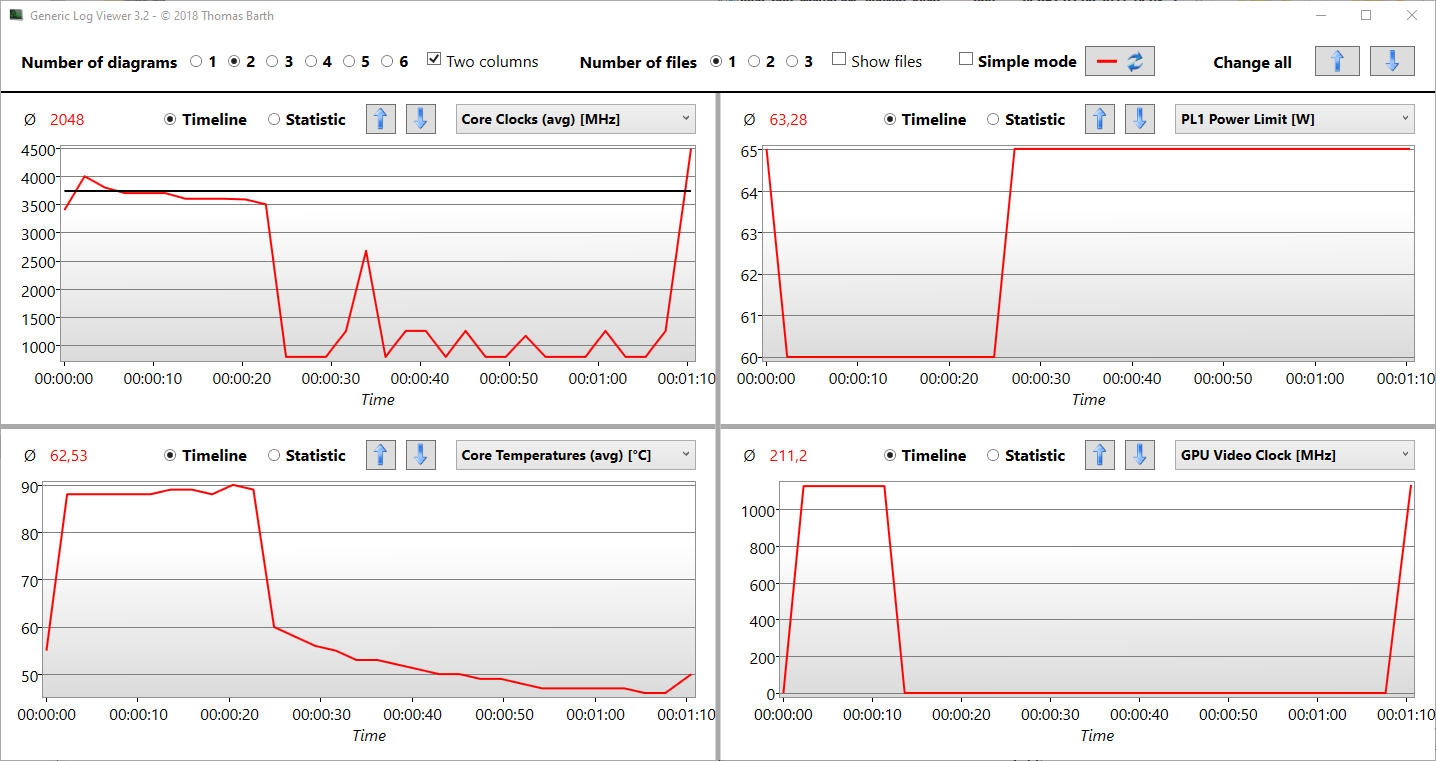
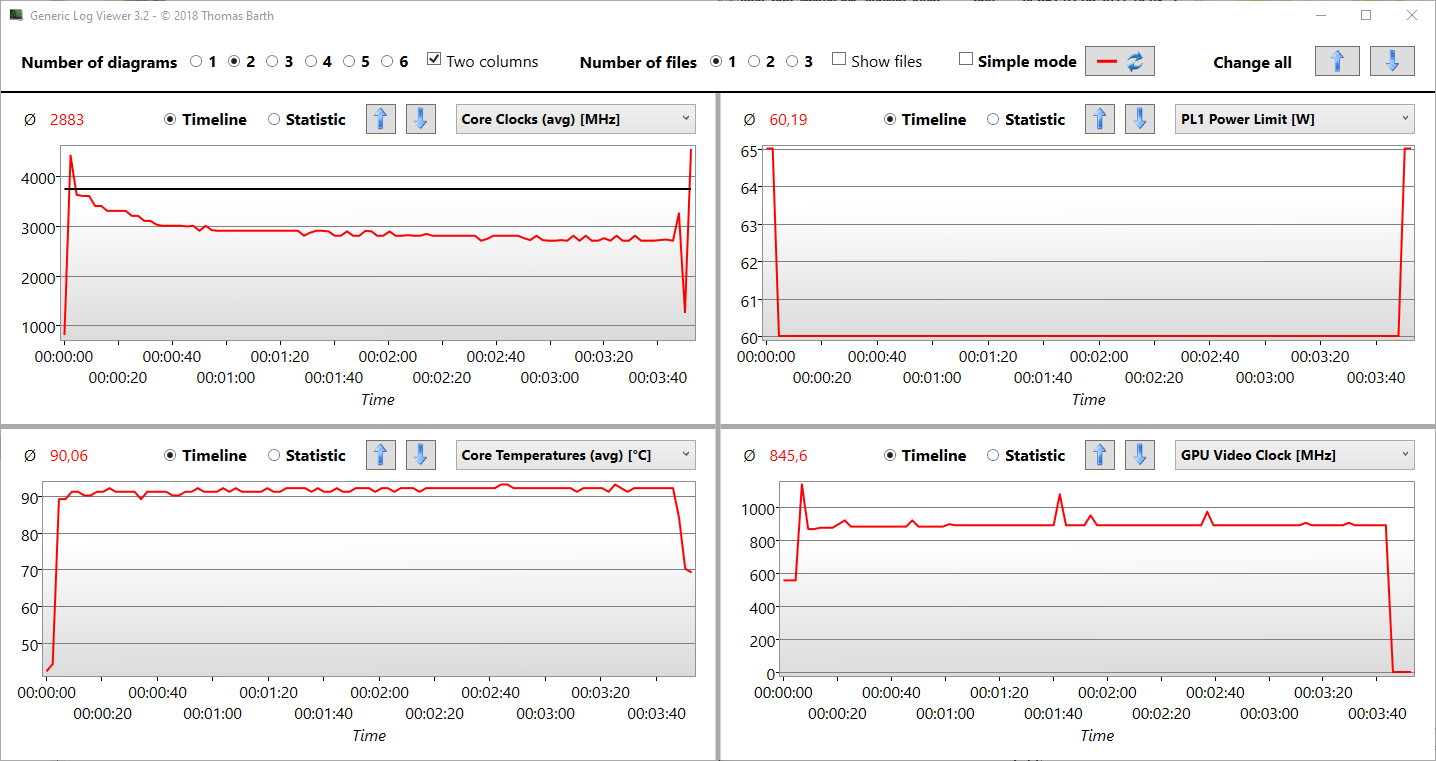
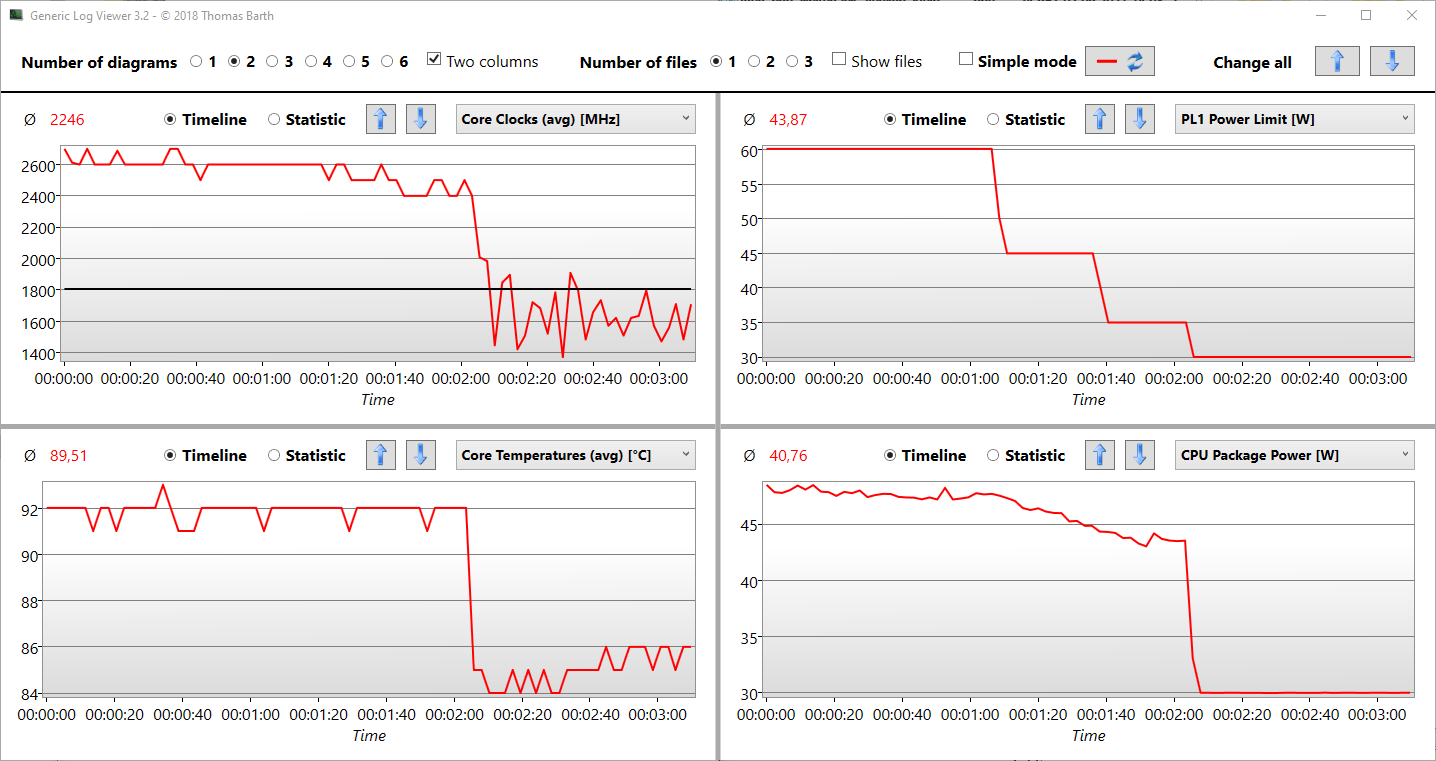
The CPU performance could be better, and the Cinebench multi-thread results fall 5 to 20% behind those of an average laptop equipped with the Core i7-11800H. The Inspiron 16 Plus 7610 without dGPU only achieves 13% more points in a single benchmark, the R15, than the identical SoC in the model with a Geforce. So it looks like the non-dGPU model does not have any thermal advantages. The single-thread performance is excellent and corresponds to our expectations on an 11800H. From the first to the third run, the R15 loop shows an advantage of the test unit, so some more thermal headroom might be possible here, allowing the clock speed to remain at a high level for several seconds longer. The Graphics Log 15 shows in detail what happens: It briefly scrapes the 4 GHz mark before dropping to to 3.6 GHz and the PL1 being lowered by 5 watts. But as already said, the i7-11800H without dGPU accompaniment only achieves better scores in the R15 and Blender benchmarks.
Cinebench R15 Multi Constant Load Test
Cinebench R23: Multi Core | Single Core
Cinebench R20: CPU (Multi Core) | CPU (Single Core)
Cinebench R15: CPU Multi 64Bit | CPU Single 64Bit
Blender: v2.79 BMW27 CPU
7-Zip 18.03: 7z b 4 | 7z b 4 -mmt1
Geekbench 5.5: Multi-Core | Single-Core
HWBOT x265 Benchmark v2.2: 4k Preset
LibreOffice : 20 Documents To PDF
R Benchmark 2.5: Overall mean
| CPU Performance Rating | |
| Average of class Multimedia | |
| Average Intel Core i7-11800H | |
| Lenovo Legion 5 Pro 16ACH6H (82JQ001PGE) | |
| Dell Inspiron 16 Plus 7610-MHJ8F | |
| Dell Inspiron 16 Plus 7610 -2! | |
| Acer Aspire 5 A517-52G-79Z5 | |
| Dell Inspiron 15 7000 7506 2-in-1 Black Edition -1! | |
| LG Gram 16 (2021) | |
| Cinebench R23 / Multi Core | |
| Average of class Multimedia (4624 - 30789, n=101, last 2 years) | |
| Lenovo Legion 5 Pro 16ACH6H (82JQ001PGE) | |
| Lenovo Legion 5 Pro 16ACH6H (82JQ001PGE) | |
| Average Intel Core i7-11800H (6508 - 14088, n=48) | |
| Dell Inspiron 16 Plus 7610-MHJ8F | |
| Dell Inspiron 16 Plus 7610 | |
| Acer Aspire 5 A517-52G-79Z5 | |
| Dell Inspiron 15 7000 7506 2-in-1 Black Edition | |
| LG Gram 16 (2021) | |
| Cinebench R23 / Single Core | |
| Average of class Multimedia (878 - 2110, n=99, last 2 years) | |
| Dell Inspiron 16 Plus 7610 | |
| Acer Aspire 5 A517-52G-79Z5 | |
| Dell Inspiron 16 Plus 7610-MHJ8F | |
| Average Intel Core i7-11800H (1386 - 1522, n=45) | |
| Lenovo Legion 5 Pro 16ACH6H (82JQ001PGE) | |
| Lenovo Legion 5 Pro 16ACH6H (82JQ001PGE) | |
| LG Gram 16 (2021) | |
| Cinebench R20 / CPU (Multi Core) | |
| Average of class Multimedia (1783 - 11768, n=97, last 2 years) | |
| Lenovo Legion 5 Pro 16ACH6H (82JQ001PGE) | |
| Lenovo Legion 5 Pro 16ACH6H (82JQ001PGE) | |
| Average Intel Core i7-11800H (2498 - 5408, n=50) | |
| Dell Inspiron 16 Plus 7610 | |
| Dell Inspiron 16 Plus 7610-MHJ8F | |
| Acer Aspire 5 A517-52G-79Z5 | |
| Dell Inspiron 15 7000 7506 2-in-1 Black Edition | |
| LG Gram 16 (2021) | |
| Cinebench R20 / CPU (Single Core) | |
| Average of class Multimedia (341 - 812, n=97, last 2 years) | |
| Dell Inspiron 16 Plus 7610 | |
| Dell Inspiron 16 Plus 7610-MHJ8F | |
| Average Intel Core i7-11800H (520 - 586, n=47) | |
| Acer Aspire 5 A517-52G-79Z5 | |
| Lenovo Legion 5 Pro 16ACH6H (82JQ001PGE) | |
| Lenovo Legion 5 Pro 16ACH6H (82JQ001PGE) | |
| LG Gram 16 (2021) | |
| Dell Inspiron 15 7000 7506 2-in-1 Black Edition | |
| Cinebench R15 / CPU Multi 64Bit | |
| Average of class Multimedia (785 - 4703, n=106, last 2 years) | |
| Lenovo Legion 5 Pro 16ACH6H (82JQ001PGE) | |
| Average Intel Core i7-11800H (1342 - 2173, n=50) | |
| Dell Inspiron 16 Plus 7610-MHJ8F | |
| Dell Inspiron 16 Plus 7610 | |
| Acer Aspire 5 A517-52G-79Z5 | |
| LG Gram 16 (2021) | |
| Dell Inspiron 15 7000 7506 2-in-1 Black Edition | |
| Cinebench R15 / CPU Single 64Bit | |
| Average of class Multimedia (142.6 - 308, n=99, last 2 years) | |
| Lenovo Legion 5 Pro 16ACH6H (82JQ001PGE) | |
| Lenovo Legion 5 Pro 16ACH6H (82JQ001PGE) | |
| Dell Inspiron 16 Plus 7610 | |
| Dell Inspiron 16 Plus 7610-MHJ8F | |
| Average Intel Core i7-11800H (201 - 231, n=46) | |
| Acer Aspire 5 A517-52G-79Z5 | |
| LG Gram 16 (2021) | |
| Dell Inspiron 15 7000 7506 2-in-1 Black Edition | |
| Blender / v2.79 BMW27 CPU | |
| LG Gram 16 (2021) | |
| Dell Inspiron 15 7000 7506 2-in-1 Black Edition | |
| Acer Aspire 5 A517-52G-79Z5 | |
| Dell Inspiron 16 Plus 7610-MHJ8F | |
| Average Intel Core i7-11800H (217 - 454, n=46) | |
| Dell Inspiron 16 Plus 7610 | |
| Average of class Multimedia (107 - 662, n=95, last 2 years) | |
| Lenovo Legion 5 Pro 16ACH6H (82JQ001PGE) | |
| Lenovo Legion 5 Pro 16ACH6H (82JQ001PGE) | |
| 7-Zip 18.03 / 7z b 4 | |
| Average of class Multimedia (20166 - 119900, n=90, last 2 years) | |
| Lenovo Legion 5 Pro 16ACH6H (82JQ001PGE) | |
| Lenovo Legion 5 Pro 16ACH6H (82JQ001PGE) | |
| Average Intel Core i7-11800H (33718 - 56758, n=46) | |
| Dell Inspiron 16 Plus 7610 | |
| Dell Inspiron 16 Plus 7610-MHJ8F | |
| Acer Aspire 5 A517-52G-79Z5 | |
| Dell Inspiron 15 7000 7506 2-in-1 Black Edition | |
| LG Gram 16 (2021) | |
| 7-Zip 18.03 / 7z b 4 -mmt1 | |
| Average of class Multimedia (3398 - 7163, n=90, last 2 years) | |
| Dell Inspiron 16 Plus 7610 | |
| Lenovo Legion 5 Pro 16ACH6H (82JQ001PGE) | |
| Lenovo Legion 5 Pro 16ACH6H (82JQ001PGE) | |
| Average Intel Core i7-11800H (5138 - 5732, n=46) | |
| Acer Aspire 5 A517-52G-79Z5 | |
| Dell Inspiron 16 Plus 7610-MHJ8F | |
| Dell Inspiron 15 7000 7506 2-in-1 Black Edition | |
| LG Gram 16 (2021) | |
| Geekbench 5.5 / Multi-Core | |
| Average of class Multimedia (3828 - 23059, n=100, last 2 years) | |
| Average Intel Core i7-11800H (4655 - 9851, n=40) | |
| Lenovo Legion 5 Pro 16ACH6H (82JQ001PGE) | |
| Lenovo Legion 5 Pro 16ACH6H (82JQ001PGE) | |
| Dell Inspiron 16 Plus 7610-MHJ8F | |
| Dell Inspiron 16 Plus 7610-MHJ8F | |
| Dell Inspiron 16 Plus 7610-MHJ8F | |
| Dell Inspiron 15 7000 7506 2-in-1 Black Edition | |
| LG Gram 16 (2021) | |
| Acer Aspire 5 A517-52G-79Z5 | |
| Geekbench 5.5 / Single-Core | |
| Average of class Multimedia (926 - 2342, n=100, last 2 years) | |
| Dell Inspiron 16 Plus 7610-MHJ8F | |
| Dell Inspiron 16 Plus 7610-MHJ8F | |
| Dell Inspiron 16 Plus 7610-MHJ8F | |
| Acer Aspire 5 A517-52G-79Z5 | |
| Average Intel Core i7-11800H (1429 - 1625, n=40) | |
| LG Gram 16 (2021) | |
| Dell Inspiron 15 7000 7506 2-in-1 Black Edition | |
| Lenovo Legion 5 Pro 16ACH6H (82JQ001PGE) | |
| Lenovo Legion 5 Pro 16ACH6H (82JQ001PGE) | |
| HWBOT x265 Benchmark v2.2 / 4k Preset | |
| Lenovo Legion 5 Pro 16ACH6H (82JQ001PGE) | |
| Lenovo Legion 5 Pro 16ACH6H (82JQ001PGE) | |
| Average of class Multimedia (4.99 - 30.5, n=88, last 2 years) | |
| Average Intel Core i7-11800H (7.38 - 17.4, n=46) | |
| Dell Inspiron 16 Plus 7610 | |
| Dell Inspiron 16 Plus 7610-MHJ8F | |
| Dell Inspiron 15 7000 7506 2-in-1 Black Edition | |
| Acer Aspire 5 A517-52G-79Z5 | |
| LG Gram 16 (2021) | |
| LibreOffice / 20 Documents To PDF | |
| Lenovo Legion 5 Pro 16ACH6H (82JQ001PGE) | |
| Lenovo Legion 5 Pro 16ACH6H (82JQ001PGE) | |
| Acer Aspire 5 A517-52G-79Z5 | |
| Average of class Multimedia (6.7 - 84.9, n=92, last 2 years) | |
| Dell Inspiron 15 7000 7506 2-in-1 Black Edition | |
| Average Intel Core i7-11800H (38.6 - 59.9, n=45) | |
| Dell Inspiron 16 Plus 7610 | |
| LG Gram 16 (2021) | |
| Dell Inspiron 16 Plus 7610-MHJ8F | |
| R Benchmark 2.5 / Overall mean | |
| LG Gram 16 (2021) | |
| Dell Inspiron 15 7000 7506 2-in-1 Black Edition | |
| Dell Inspiron 16 Plus 7610-MHJ8F | |
| Acer Aspire 5 A517-52G-79Z5 | |
| Average Intel Core i7-11800H (0.548 - 0.615, n=46) | |
| Dell Inspiron 16 Plus 7610 | |
| Lenovo Legion 5 Pro 16ACH6H (82JQ001PGE) | |
| Lenovo Legion 5 Pro 16ACH6H (82JQ001PGE) | |
| Average of class Multimedia (0.3826 - 0.723, n=90, last 2 years) | |
* ... smaller is better
AIDA64: FP32 Ray-Trace | FPU Julia | CPU SHA3 | CPU Queen | FPU SinJulia | FPU Mandel | CPU AES | CPU ZLib | FP64 Ray-Trace | CPU PhotoWorxx
| Performance Rating | |
| Lenovo Legion 5 Pro 16ACH6H (82JQ001PGE) | |
| Average of class Multimedia | |
| Average Intel Core i7-11800H | |
| Dell Inspiron 16 Plus 7610-MHJ8F | |
| LG Gram 16 (2021) | |
| Dell Inspiron 16 Plus 7610 -9! | |
| AIDA64 / FP32 Ray-Trace | |
| Lenovo Legion 5 Pro 16ACH6H (82JQ001PGE) | |
| Lenovo Legion 5 Pro 16ACH6H (82JQ001PGE) | |
| Average Intel Core i7-11800H (8772 - 15961, n=20) | |
| Average of class Multimedia (3804 - 27411, n=88, last 2 years) | |
| Dell Inspiron 16 Plus 7610-MHJ8F | |
| LG Gram 16 (2021) | |
| AIDA64 / FPU Julia | |
| Lenovo Legion 5 Pro 16ACH6H (82JQ001PGE) | |
| Lenovo Legion 5 Pro 16ACH6H (82JQ001PGE) | |
| Average of class Multimedia (16379 - 136048, n=88, last 2 years) | |
| Average Intel Core i7-11800H (39404 - 65636, n=20) | |
| Dell Inspiron 16 Plus 7610-MHJ8F | |
| LG Gram 16 (2021) | |
| AIDA64 / CPU SHA3 | |
| Average Intel Core i7-11800H (2599 - 4439, n=20) | |
| Dell Inspiron 16 Plus 7610-MHJ8F | |
| Lenovo Legion 5 Pro 16ACH6H (82JQ001PGE) | |
| Lenovo Legion 5 Pro 16ACH6H (82JQ001PGE) | |
| Average of class Multimedia (1099 - 6681, n=88, last 2 years) | |
| LG Gram 16 (2021) | |
| AIDA64 / CPU Queen | |
| Lenovo Legion 5 Pro 16ACH6H (82JQ001PGE) | |
| Lenovo Legion 5 Pro 16ACH6H (82JQ001PGE) | |
| Average of class Multimedia (21547 - 134321, n=88, last 2 years) | |
| Dell Inspiron 16 Plus 7610-MHJ8F | |
| Average Intel Core i7-11800H (85233 - 91941, n=20) | |
| LG Gram 16 (2021) | |
| AIDA64 / FPU SinJulia | |
| Lenovo Legion 5 Pro 16ACH6H (82JQ001PGE) | |
| Lenovo Legion 5 Pro 16ACH6H (82JQ001PGE) | |
| Average Intel Core i7-11800H (6420 - 9792, n=20) | |
| Average of class Multimedia (3099 - 15484, n=88, last 2 years) | |
| Dell Inspiron 16 Plus 7610-MHJ8F | |
| LG Gram 16 (2021) | |
| AIDA64 / FPU Mandel | |
| Lenovo Legion 5 Pro 16ACH6H (82JQ001PGE) | |
| Lenovo Legion 5 Pro 16ACH6H (82JQ001PGE) | |
| Average Intel Core i7-11800H (23365 - 39464, n=20) | |
| Average of class Multimedia (9602 - 68591, n=88, last 2 years) | |
| Dell Inspiron 16 Plus 7610-MHJ8F | |
| LG Gram 16 (2021) | |
| AIDA64 / CPU AES | |
| Lenovo Legion 5 Pro 16ACH6H (82JQ001PGE) | |
| Lenovo Legion 5 Pro 16ACH6H (82JQ001PGE) | |
| Average Intel Core i7-11800H (74617 - 149388, n=20) | |
| Dell Inspiron 16 Plus 7610-MHJ8F | |
| Average of class Multimedia (23702 - 169946, n=88, last 2 years) | |
| LG Gram 16 (2021) | |
| AIDA64 / CPU ZLib | |
| Average of class Multimedia (302 - 1901, n=88, last 2 years) | |
| Lenovo Legion 5 Pro 16ACH6H (82JQ001PGE) | |
| Lenovo Legion 5 Pro 16ACH6H (82JQ001PGE) | |
| Dell Inspiron 16 Plus 7610-MHJ8F | |
| Average Intel Core i7-11800H (461 - 830, n=43) | |
| LG Gram 16 (2021) | |
| Dell Inspiron 16 Plus 7610 | |
| AIDA64 / FP64 Ray-Trace | |
| Lenovo Legion 5 Pro 16ACH6H (82JQ001PGE) | |
| Lenovo Legion 5 Pro 16ACH6H (82JQ001PGE) | |
| Average Intel Core i7-11800H (4545 - 8717, n=21) | |
| Average of class Multimedia (1996 - 14590, n=88, last 2 years) | |
| Dell Inspiron 16 Plus 7610-MHJ8F | |
| LG Gram 16 (2021) | |
| AIDA64 / CPU PhotoWorxx | |
| LG Gram 16 (2021) | |
| Average of class Multimedia (7419 - 53918, n=88, last 2 years) | |
| Average Intel Core i7-11800H (11898 - 26757, n=21) | |
| Lenovo Legion 5 Pro 16ACH6H (82JQ001PGE) | |
| Lenovo Legion 5 Pro 16ACH6H (82JQ001PGE) | |
| Dell Inspiron 16 Plus 7610-MHJ8F | |
System Performance
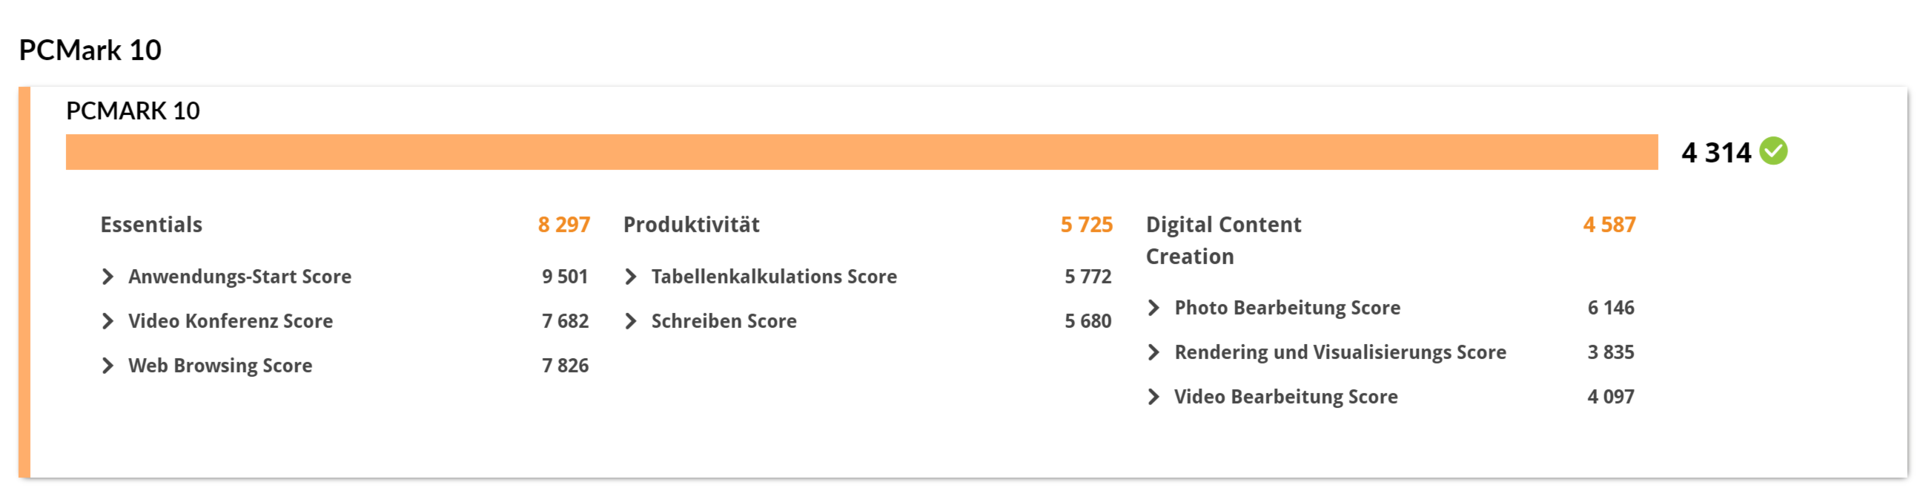
The PCMark score suffers from the lack of the Geforce, and we see a 25 to 50% difference in the sub scores. However, this is not the case with the Essentials, which turn out even higher than with the dGPU. In battery operation, the performance drops slightly but not by much.
| PCMark 10 / Score | |
| Lenovo Legion 5 Pro 16ACH6H (82JQ001PGE) | |
| Average of class Multimedia (4635 - 8670, n=85, last 2 years) | |
| Dell Inspiron 16 Plus 7610 | |
| Acer Aspire 5 A517-52G-79Z5 | |
| Dell Inspiron 16 Plus 7610-MHJ8F | |
| Average Intel Core i7-11800H, Intel UHD Graphics Xe 32EUs (Tiger Lake-H) (5036 - 5067, n=2) | |
| Dell Inspiron 15 7000 7506 2-in-1 Black Edition | |
| LG Gram 16 (2021) | |
| PCMark 10 / Essentials | |
| Average of class Multimedia (8480 - 12420, n=85, last 2 years) | |
| LG Gram 16 (2021) | |
| Dell Inspiron 16 Plus 7610-MHJ8F | |
| Dell Inspiron 16 Plus 7610 | |
| Average Intel Core i7-11800H, Intel UHD Graphics Xe 32EUs (Tiger Lake-H) (9694 - 9847, n=2) | |
| Dell Inspiron 15 7000 7506 2-in-1 Black Edition | |
| Lenovo Legion 5 Pro 16ACH6H (82JQ001PGE) | |
| Acer Aspire 5 A517-52G-79Z5 | |
| PCMark 10 / Productivity | |
| Acer Aspire 5 A517-52G-79Z5 | |
| Lenovo Legion 5 Pro 16ACH6H (82JQ001PGE) | |
| Average of class Multimedia (5845 - 11186, n=85, last 2 years) | |
| Dell Inspiron 16 Plus 7610 | |
| LG Gram 16 (2021) | |
| Average Intel Core i7-11800H, Intel UHD Graphics Xe 32EUs (Tiger Lake-H) (6562 - 6723, n=2) | |
| Dell Inspiron 15 7000 7506 2-in-1 Black Edition | |
| Dell Inspiron 16 Plus 7610-MHJ8F | |
| PCMark 10 / Digital Content Creation | |
| Lenovo Legion 5 Pro 16ACH6H (82JQ001PGE) | |
| Average of class Multimedia (4688 - 13548, n=85, last 2 years) | |
| Dell Inspiron 16 Plus 7610 | |
| Dell Inspiron 16 Plus 7610-MHJ8F | |
| Dell Inspiron 15 7000 7506 2-in-1 Black Edition | |
| Average Intel Core i7-11800H, Intel UHD Graphics Xe 32EUs (Tiger Lake-H) (5318 - 5464, n=2) | |
| Acer Aspire 5 A517-52G-79Z5 | |
| LG Gram 16 (2021) | |
| PCMark 10 Score | 5067 points | |
Help | ||
| AIDA64 / Memory Copy | |
| LG Gram 16 (2021) | |
| Average of class Multimedia (20513 - 94254, n=88, last 2 years) | |
| Average Intel Core i7-11800H (24508 - 48144, n=21) | |
| Dell Inspiron 16 Plus 7610-MHJ8F | |
| Lenovo Legion 5 Pro 16ACH6H (82JQ001PGE) | |
| Lenovo Legion 5 Pro 16ACH6H (82JQ001PGE) | |
| AIDA64 / Memory Read | |
| LG Gram 16 (2021) | |
| Average of class Multimedia (22917 - 90142, n=88, last 2 years) | |
| Lenovo Legion 5 Pro 16ACH6H (82JQ001PGE) | |
| Lenovo Legion 5 Pro 16ACH6H (82JQ001PGE) | |
| Dell Inspiron 16 Plus 7610-MHJ8F | |
| Average Intel Core i7-11800H (25882 - 50365, n=20) | |
| AIDA64 / Memory Write | |
| LG Gram 16 (2021) | |
| Average of class Multimedia (20226 - 95196, n=88, last 2 years) | |
| Dell Inspiron 16 Plus 7610-MHJ8F | |
| Average Intel Core i7-11800H (22240 - 46214, n=20) | |
| Lenovo Legion 5 Pro 16ACH6H (82JQ001PGE) | |
| Lenovo Legion 5 Pro 16ACH6H (82JQ001PGE) | |
| AIDA64 / Memory Latency | |
| Average of class Multimedia (75 - 346, n=87, last 2 years) | |
| Dell Inspiron 16 Plus 7610-MHJ8F | |
| LG Gram 16 (2021) | |
| Lenovo Legion 5 Pro 16ACH6H (82JQ001PGE) | |
| Lenovo Legion 5 Pro 16ACH6H (82JQ001PGE) | |
| Average Intel Core i7-11800H (71.9 - 104.1, n=44) | |
| Dell Inspiron 16 Plus 7610 | |
* ... smaller is better
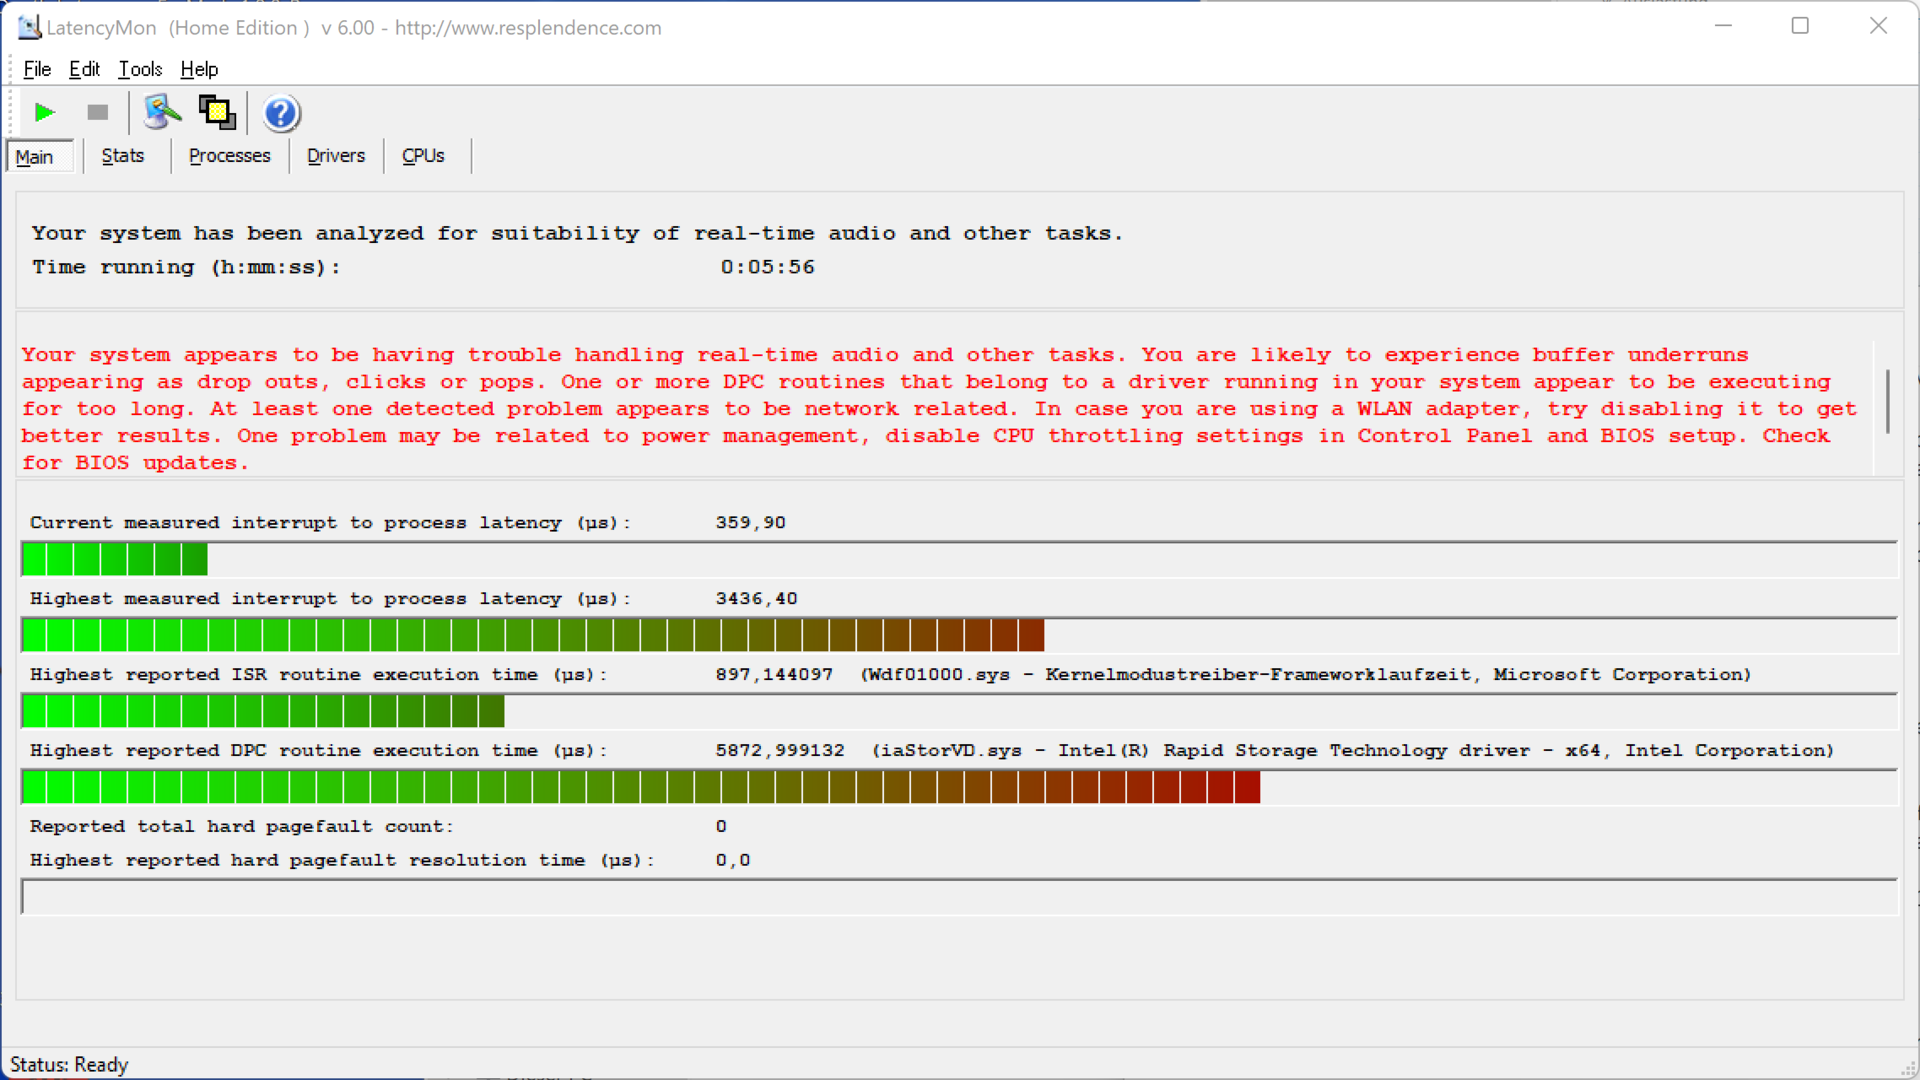
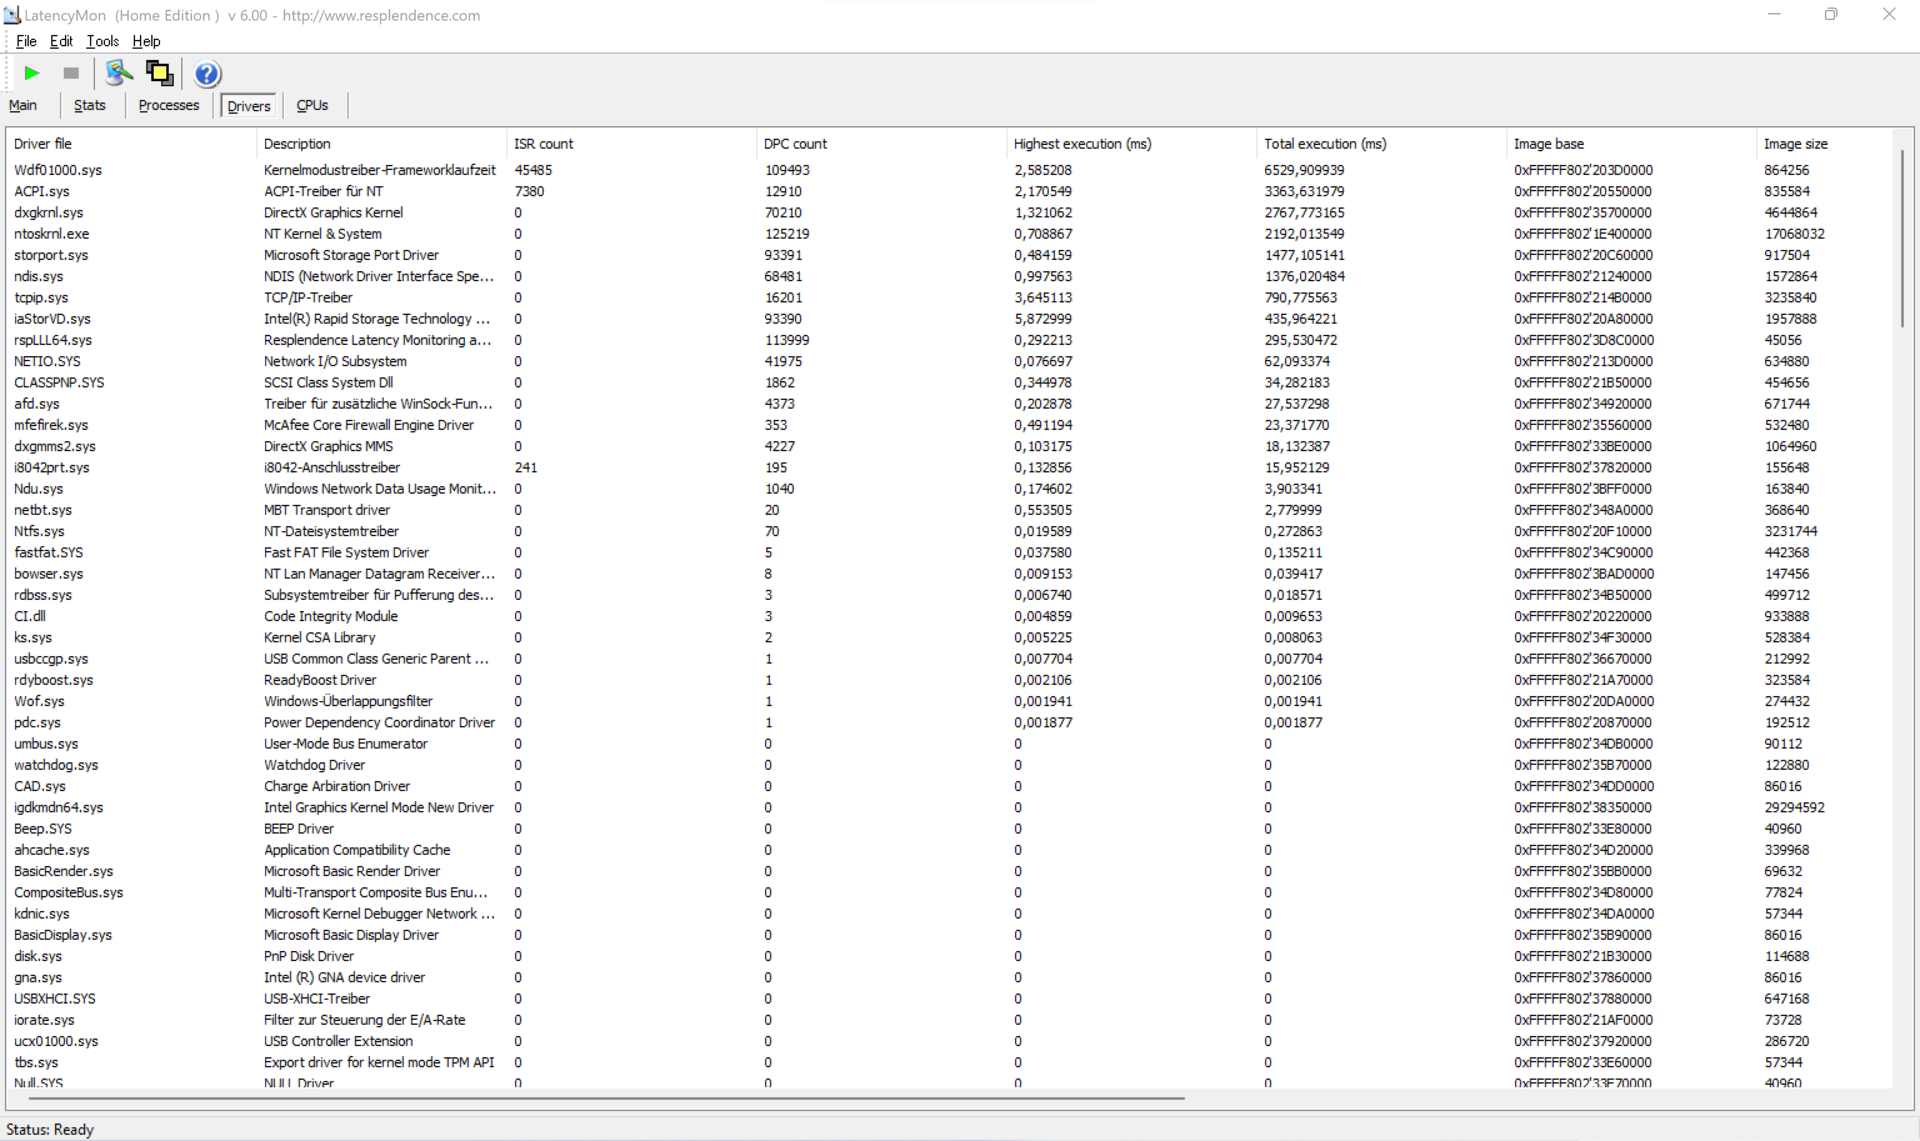
DPC Latencies
When opening our homepage in several tabs or while running Prime95, LatencyMon reports some problematic DPC latencies. The reproduction of a 4K video also doesn't work completely seamlessly, with 37 frames being dropped while running the 60-second video. The reason lies in the Kernel and ACPI driver.
| DPC Latencies / LatencyMon - interrupt to process latency (max), Web, Youtube, Prime95 | |
| Dell Inspiron 16 Plus 7610 | |
| Acer Aspire 5 A517-52G-79Z5 | |
| Lenovo Legion 5 Pro 16ACH6H (82JQ001PGE) | |
| LG Gram 16 (2021) | |
| Dell Inspiron 15 7000 7506 2-in-1 Black Edition | |
* ... smaller is better
Storage Solution - An internal drive
Our 7610 model is equipped with the unusual Kingston OM3PDP3-AD NVMe SSD. With up to half the performance of the Micron 2300 in the XPS 15 9510, its speed is average at best. Since Dell gets its drives from several SSD manufacturers that include Samsung, Micron, Western Digital, Toshiba, and apparently also Kingston, it is difficult to predict which drive an Inspiron laptop available from vendors will be equipped with.
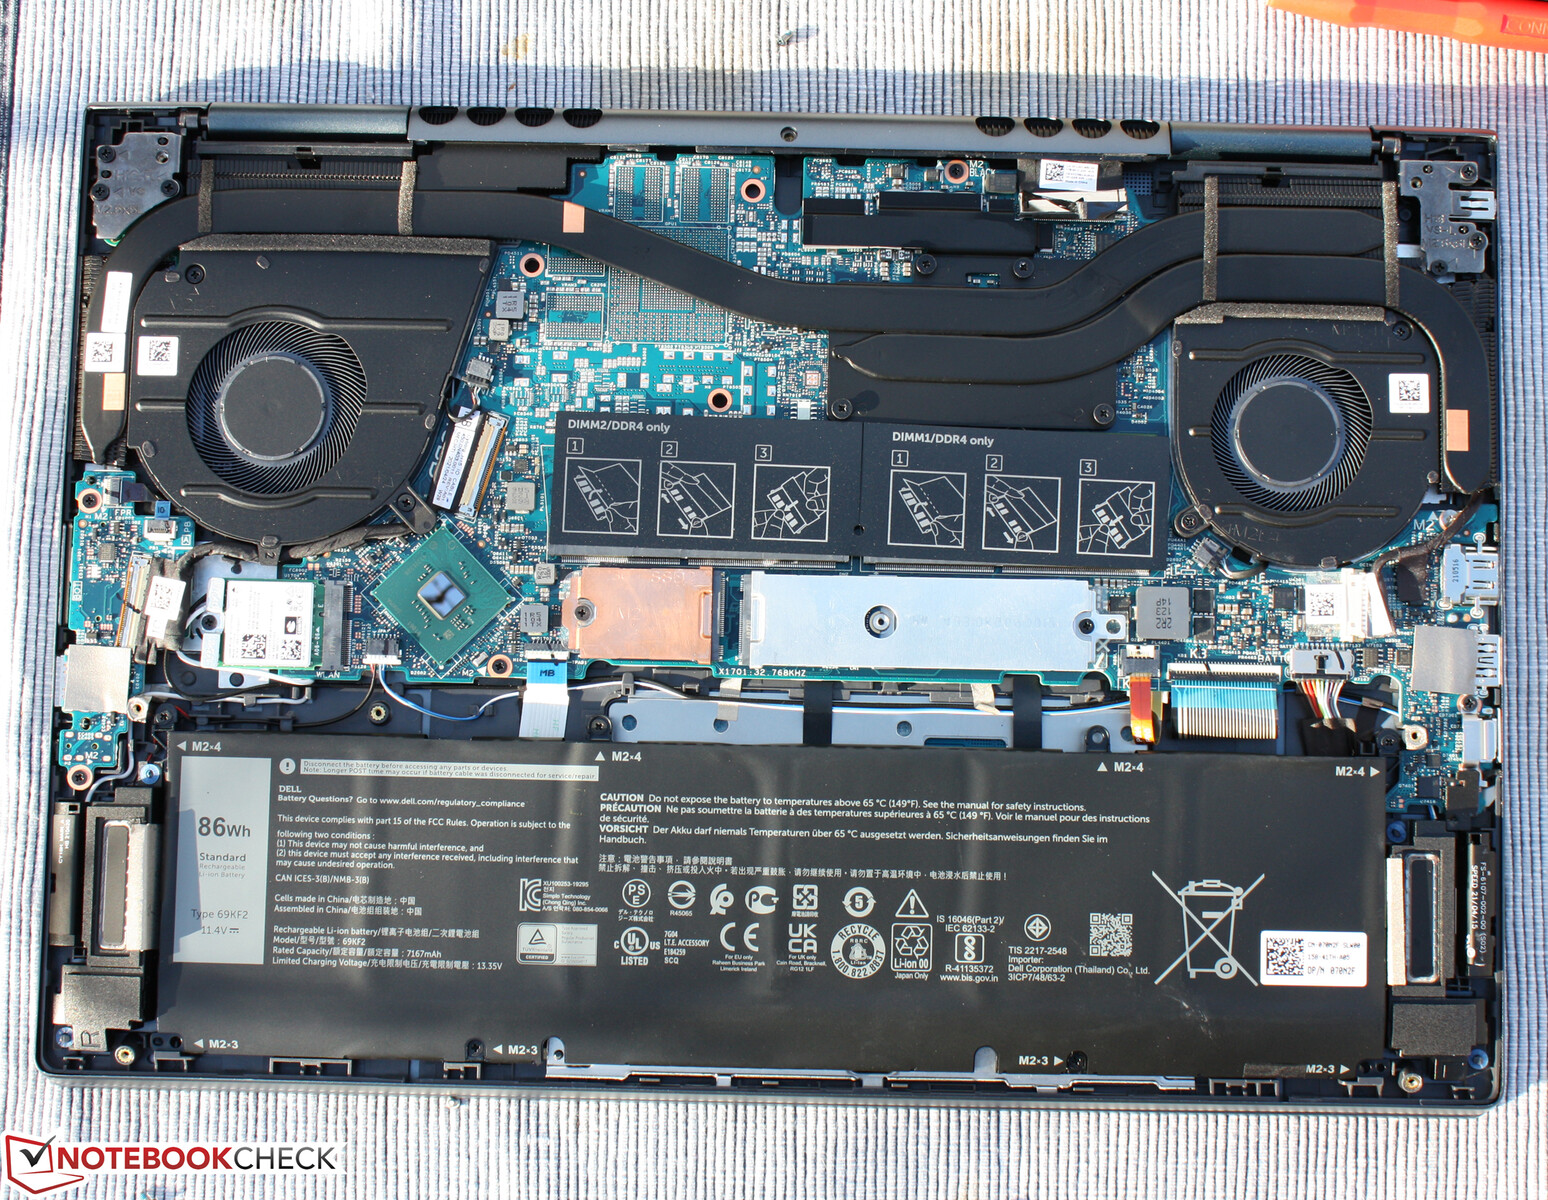
Note: While you can insert up to two internal drives, at least one of them has to have the smaller 2230 format.

* ... smaller is better
Constant Performance Reading: DiskSpd Read Loop, Queue Depth 8
Graphics Card
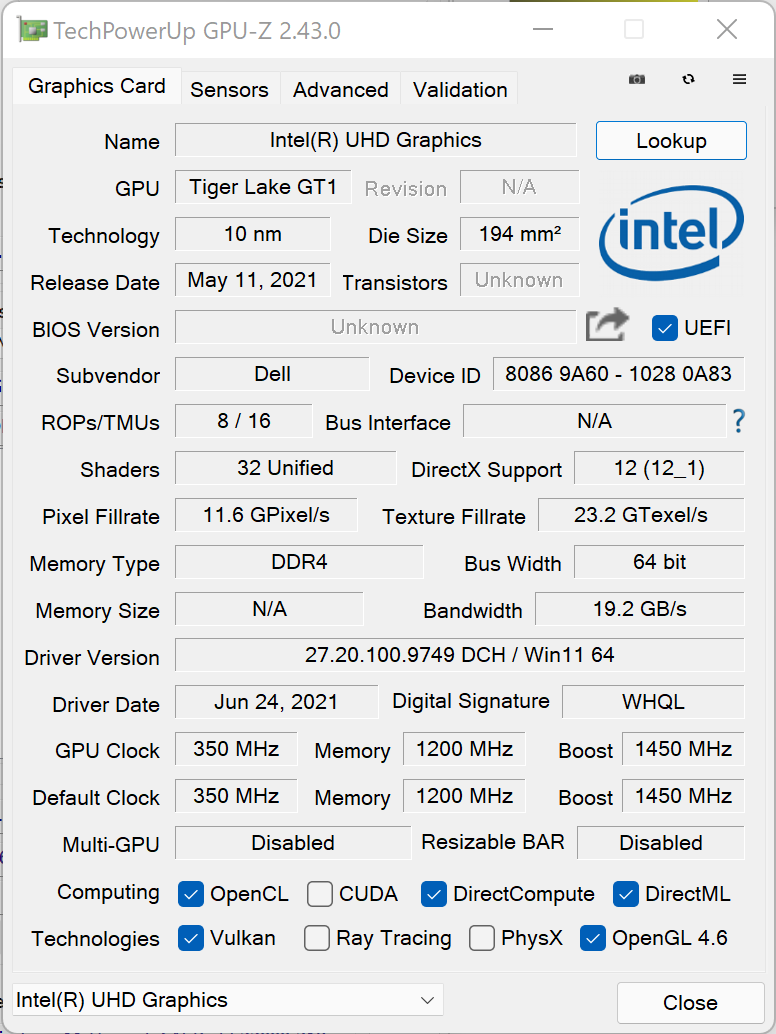
There is no question about it, but the Intel UHD Xe (32 EUs) doesn't bring a lot of performance, which is confirmed by all the benchmarks. The RTX-equipped Inspiron 16 Plus 7610 is 500% ahead, and in games, between 250 and almost 500%.
Those who decide for the iGPU version have to live with the fact that then the hardware support through Nvidia's CUDA cores will also be missing. This will decrease for example the rendering speed during video or image processing significantly. Smooth gameplay is only possible in some selected older games or those that are less demanding.
| 3DMark 11 Performance | 3691 points | |
| 3DMark Fire Strike Score | 2345 points | |
| 3DMark Time Spy Score | 805 points | |
Help | ||
| low | med. | high | ultra | 4K | |
| The Witcher 3 (2015) | 50.1 | 31.1 | 15.8 | 7.5 | |
| Dota 2 Reborn (2015) | 126.2 | 76.6 | 36.3 | 33.3 | 12.1 |
| X-Plane 11.11 (2018) | 21.3 | 17.6 | 11.1 | 9.43 | |
| Strange Brigade (2018) | 56.7 | 21.7 | 16.9 | 16.2 |
Emissions and Power Management - A cool Dell laptop
Noise Emissions
The fans of the Inspiron 16 succeed in remaining silent or at least very quiet for a long time. With the best power savings mode, the fans almost never turn on. In Balanced mode, the two fans run sporadically for a few seconds. Both these statements concern idle operation. It is striking that load will not cause an immediate revving of the fans but only a very delayed response, even in Performance mode. In 3DMark, for example, they only become noticeable after about 40 seconds. As soon as their speed increases, at 49 dB(A), the laptop quickly becomes similarly loud as gaming laptops. The maximum value is identical to that of the Nvidia version of the laptop, the fan characteristics are identical.
Noise Level
| Idle |
| 26.3 / 26.3 / dB(A) |
| Load |
| 33 / 49.2 dB(A) |
 | ||
30 dB silent 40 dB(A) audible 50 dB(A) loud |
||
min: | ||
| Dell Inspiron 16 Plus 7610-MHJ8F UHD Graphics Xe 32EUs (Tiger Lake-H), i7-11800H, OM3PDP3-AD NVMe KDI 512GB | Dell Inspiron 16 Plus 7610 GeForce RTX 3050 4GB Laptop GPU, i7-11800H, Kingston OM3PDP3512B | LG Gram 16 (2021) Iris Xe G7 96EUs, i7-1165G7, SK Hynix PC601 1TB HFS001TD9TNG | Lenovo Legion 5 Pro 16ACH6H (82JQ001PGE) GeForce RTX 3070 Laptop GPU, R7 5800H, WDC PC SN730 SDBPNTY-1T00 | Dell Inspiron 15 7000 7506 2-in-1 Black Edition Xe MAX, i7-1165G7, Micron 2300 1TB MTFDHBA1T0TDV | Acer Aspire 5 A517-52G-79Z5 GeForce MX350, i7-1165G7, WDC PC SN530 SDBPNPZ-1T00 | |
|---|---|---|---|---|---|---|
| Noise | -6% | 9% | 1% | -10% | -2% | |
| off / environment * | 26.3 | 24.4 7% | 26 1% | 23 13% | 27.3 -4% | 24.9 5% |
| Idle Minimum * | 26.3 | 24.4 7% | 26 1% | 25 5% | 27.3 -4% | 24.9 5% |
| Idle Average * | 26.3 | 24.4 7% | 26 1% | 25 5% | 27.3 -4% | 24.9 5% |
| Load Average * | 33 | 48.3 -46% | 30.8 7% | 35.5 -8% | 47.4 -44% | 44.1 -34% |
| Witcher 3 ultra * | 44 | 48.9 -11% | 46.67 -6% | 47.4 -8% | ||
| Load Maximum * | 49.2 | 48.9 1% | 31.1 37% | 50.35 -2% | 47.5 3% | 44.8 9% |
| Idle Maximum * | 24.4 | 26 | 25 | 27.3 | 27 |
* ... smaller is better
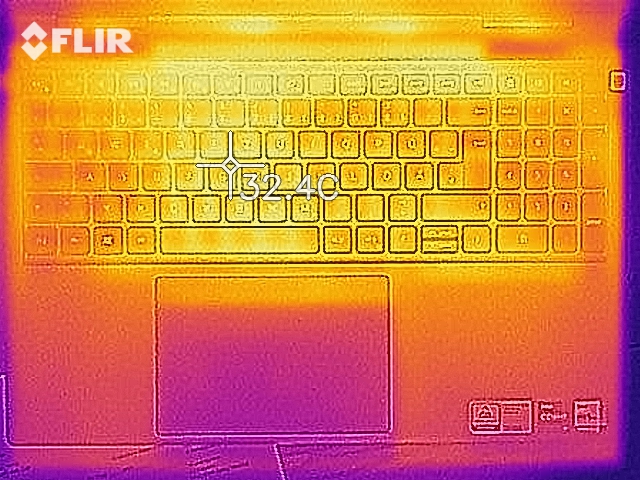
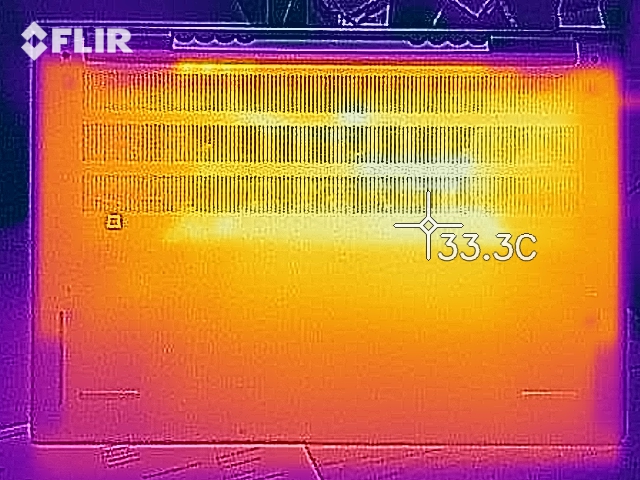
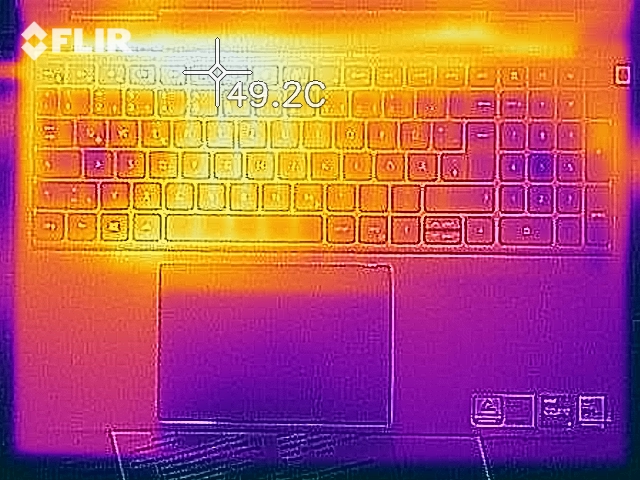
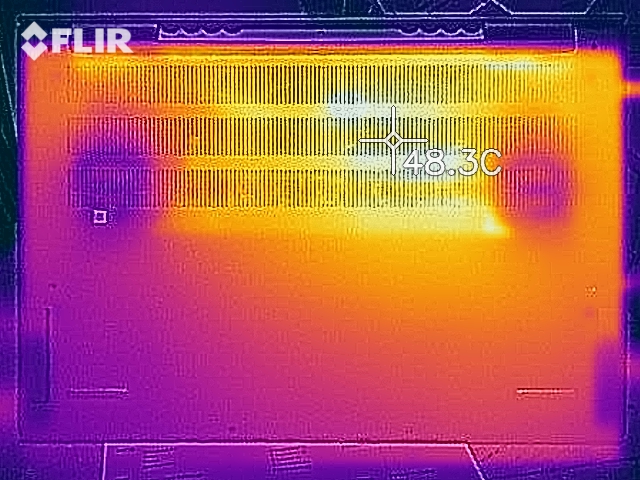
Temperature
Despite the sluggish fans, the surface temperatures are not high, ranging around 29 ºC (~84 ºF) on average. The dGPU model has a 3-ºC (~5 ºF) higher average, but only on the bottom. As to be expected, there is a significant difference under load: In the hotspot at the bottom, the Geforce model is around 10 ºC (~18 ºF) warmer than the iGPU version.
Under load from Prime95, the clock speed increases to 4.3 GHz for one or two seconds, after which a core temperature of 90 °C (194 °F) is reached. The clock speed then drops into the 2.8 to 3.0-GHz range, in order to maintain a temperature of around 90 °C (194 °F). The difference is that the dGPU model tries to maintain 83 °C (181 °F), leveling out in the 2.4 to 3.2-GHz range.
(±) The maximum temperature on the upper side is 43.4 °C / 110 F, compared to the average of 36.9 °C / 98 F, ranging from 21.1 to 71 °C for the class Multimedia.
(-) The bottom heats up to a maximum of 45.1 °C / 113 F, compared to the average of 39.1 °C / 102 F
(+) In idle usage, the average temperature for the upper side is 28.4 °C / 83 F, compared to the device average of 31.2 °C / 88 F.
(+) The palmrests and touchpad are reaching skin temperature as a maximum (34.8 °C / 94.6 F) and are therefore not hot.
(-) The average temperature of the palmrest area of similar devices was 28.8 °C / 83.8 F (-6 °C / -10.8 F).
| Dell Inspiron 16 Plus 7610-MHJ8F Intel Core i7-11800H, Intel UHD Graphics Xe 32EUs (Tiger Lake-H) | Dell Inspiron 16 Plus 7610 Intel Core i7-11800H, NVIDIA GeForce RTX 3050 4GB Laptop GPU | LG Gram 16 (2021) Intel Core i7-1165G7, Intel Iris Xe Graphics G7 96EUs | Lenovo Legion 5 Pro 16ACH6H (82JQ001PGE) AMD Ryzen 7 5800H, NVIDIA GeForce RTX 3070 Laptop GPU | Dell Inspiron 15 7000 7506 2-in-1 Black Edition Intel Core i7-1165G7, Intel Iris Xe MAX Graphics | Acer Aspire 5 A517-52G-79Z5 Intel Core i7-1165G7, NVIDIA GeForce MX350 | |
|---|---|---|---|---|---|---|
| Heat | -13% | 7% | -17% | -9% | 16% | |
| Maximum Upper Side * | 43.4 | 46.4 -7% | 46.9 -8% | 50 -15% | 43 1% | 35 19% |
| Maximum Bottom * | 45.1 | 54.8 -22% | 45.1 -0% | 55 -22% | 48.8 -8% | 40 11% |
| Idle Upper Side * | 30.6 | 31.4 -3% | 26.4 14% | 34 -11% | 31.6 -3% | 25.6 16% |
| Idle Bottom * | 31.1 | 36.6 -18% | 24.1 23% | 37 -19% | 38.6 -24% | 25.3 19% |
* ... smaller is better
Dell Inspiron 16 Plus 7610-MHJ8F audio analysis
(±) | speaker loudness is average but good (73.2 dB)
Bass 100 - 315 Hz
(-) | nearly no bass - on average 19.5% lower than median
(±) | linearity of bass is average (11.1% delta to prev. frequency)
Mids 400 - 2000 Hz
(+) | balanced mids - only 4.6% away from median
(+) | mids are linear (6.4% delta to prev. frequency)
Highs 2 - 16 kHz
(±) | higher highs - on average 6.1% higher than median
(±) | linearity of highs is average (7.7% delta to prev. frequency)
Overall 100 - 16.000 Hz
(±) | linearity of overall sound is average (22.5% difference to median)
Compared to same class
» 77% of all tested devices in this class were better, 5% similar, 18% worse
» The best had a delta of 5%, average was 18%, worst was 45%
Compared to all devices tested
» 61% of all tested devices were better, 6% similar, 33% worse
» The best had a delta of 4%, average was 25%, worst was 134%
LG Gram 16 (2021) audio analysis
(±) | speaker loudness is average but good (76.1 dB)
Bass 100 - 315 Hz
(-) | nearly no bass - on average 18.8% lower than median
(±) | linearity of bass is average (12.2% delta to prev. frequency)
Mids 400 - 2000 Hz
(+) | balanced mids - only 2.2% away from median
(+) | mids are linear (5.4% delta to prev. frequency)
Highs 2 - 16 kHz
(+) | balanced highs - only 2.5% away from median
(+) | highs are linear (3.7% delta to prev. frequency)
Overall 100 - 16.000 Hz
(+) | overall sound is linear (14.7% difference to median)
Compared to same class
» 9% of all tested devices in this class were better, 4% similar, 88% worse
» The best had a delta of 7%, average was 22%, worst was 53%
Compared to all devices tested
» 15% of all tested devices were better, 4% similar, 81% worse
» The best had a delta of 4%, average was 25%, worst was 134%
Power Management
Power Consumption
During idle operation, the laptop uses slightly more than 5 watts at the lowest brightness level and in the most power-saving performance profile. The maximum during idle is at 14 watts, which is a moderate value. In similar scenarios, the LG Gram 16 consumes only between 4 and 11 watts. The corresponding Inspiron 16 Plus 7610 with Geforce consumes between 8 and 17 watts despite its dGPU being turned off by the Optimus switching.
Under load, the differences are naturally huge. Under extremely high load, we measured a maximum consumption of just 76 watts at the 130-Watt power supply. As the chart below shows, the iGPU model is able to consume more power (stress test with Prime95 and Furmark), reaching 100 watts. During the stress test, it levels out at 90 watts. Running The Witcher 3 Ultra, it ranges around an average of 44 watts.
| Off / Standby | |
| Idle | |
| Load |
|
Power Consumption The Witcher 3 / Stress Test
| Dell Inspiron 16 Plus 7610-MHJ8F i7-11800H, UHD Graphics Xe 32EUs (Tiger Lake-H), OM3PDP3-AD NVMe KDI 512GB, IPS, 3072x1920, 16.00 | Dell Inspiron 16 Plus 7610 i7-11800H, GeForce RTX 3050 4GB Laptop GPU, Kingston OM3PDP3512B, IPS, 3072x1920, 16.00 | LG Gram 16 (2021) i7-1165G7, Iris Xe G7 96EUs, SK Hynix PC601 1TB HFS001TD9TNG, IPS, 2560x1600, 16.00 | Lenovo Legion 5 Pro 16ACH6H (82JQ001PGE) R7 5800H, GeForce RTX 3070 Laptop GPU, WDC PC SN730 SDBPNTY-1T00, IPS, 2560x1600, 16.00 | Dell Inspiron 15 7000 7506 2-in-1 Black Edition i7-1165G7, Xe MAX, Micron 2300 1TB MTFDHBA1T0TDV, IPS, 3840x2160, 15.60 | Acer Aspire 5 A517-52G-79Z5 i7-1165G7, GeForce MX350, WDC PC SN530 SDBPNPZ-1T00, IPS, 1920x1080, 17.30 | |
|---|---|---|---|---|---|---|
| Power Consumption | -69% | 24% | -129% | -17% | 16% | |
| Idle Minimum * | 5.4 | 7.7 -43% | 3.8 30% | 10.45 -94% | 4 26% | 4.1 24% |
| Idle Average * | 9.8 | 10.7 -9% | 9 8% | 14.92 -52% | 15.5 -58% | 7.8 20% |
| Idle Maximum * | 14 | 16.8 -20% | 11.3 19% | 16.02 -14% | 16.2 -16% | 10 29% |
| Load Average * | 44 | 100.39 -128% | 35.2 20% | 119.65 -172% | 49.7 -13% | 47 -7% |
| Witcher 3 ultra * | 44 | 108 -145% | 174.9 -298% | 52.2 -19% | ||
| Load Maximum * | 76.8 | 129 -68% | 43.5 43% | 187.26 -144% | 92.7 -21% | 64.7 16% |
* ... smaller is better
Battery Life
The difference in the battery life of the iGPU and dGPU versions is only marginal in the WiFi test, and the Geforce model lasts even a few minutes longer here. On the other hand, under load the iGPU model is able to last for 50 more minutes (Battery Eater Classic). The iGPU model also wins in terms of the idle battery life, and a plus of 120 minutes allows the test unit to last for 22:30 hours. However, this value isn't really realistic, since it is measured at minimal brightness and in the Airplane mode. The 86 Wh are identical in both models.
| Dell Inspiron 16 Plus 7610-MHJ8F i7-11800H, UHD Graphics Xe 32EUs (Tiger Lake-H), 86 Wh | Dell Inspiron 16 Plus 7610 i7-11800H, GeForce RTX 3050 4GB Laptop GPU, 86 Wh | LG Gram 16 (2021) i7-1165G7, Iris Xe G7 96EUs, 80 Wh | Lenovo Legion 5 Pro 16ACH6H (82JQ001PGE) R7 5800H, GeForce RTX 3070 Laptop GPU, 80 Wh | Dell Inspiron 15 7000 7506 2-in-1 Black Edition i7-1165G7, Xe MAX, 68 Wh | Acer Aspire 5 A517-52G-79Z5 i7-1165G7, GeForce MX350, 50.2 Wh | Average of class Multimedia | |
|---|---|---|---|---|---|---|---|
| Battery Runtime | -8% | 32% | -56% | -15% | -36% | -30% | |
| Reader / Idle | 1350 | 1230 -9% | 1713 27% | 548 -59% | 1498 11% | 827 -39% | 933 ? -31% |
| WiFi | 569 | ||||||
| WiFi v1.3 | 567 | 591 4% | 943 66% | 420 -26% | 583 3% | 441.4 -22% | 572 ? 1% |
| Load | 247 | 199 -19% | 258 4% | 44 -82% | 98 -60% | 133 -46% | 97.7 ? -60% |
| H.264 | 1204 | 292 | 710 ? | ||||
| Witcher 3 ultra | 77 | 81.8 ? |
Pros
Cons
Verdict - Cooler and more endurance
The Inspiron 16 is a laptop to show off: The heavy metal case communicates a haptic quality that comes close to that of the more expensive XPS 15. The bezels are slim, and the connection equipment is extensive. Maintenance turns out to be easy, and the matte 3K display perfectly tops off the whole package.
In the performance, things don't look quite as good. Compared to similarly or almost similarly equipped competitors, the CPU is slower than expected, which is also the case with the iGPU model. However, our test unit was able to catch up slightly in terms of points, which means that it initially computed faster than the version with the Nvidia graphics chip.
While the Dell Inspiron 16 Plus 7610 shares the advantages of its sibling model, it foregoes the performance of the Geforce graphics. This brings a longer battery life, lower power consumption, and a cooler case.
Those who feel enthusiastic about the Inspiron 16 Plus 7610 in general but are considering whether the more affordable iGPU version is sufficient should understand this: There is no difference in the WiFi battery life, which is the most realistic measurement in practice. However, the test unit lasts longer during idle operation or under constant load. Its operation is more efficient, and it does not warm up as much under load. So those who are looking for a 16-inch office companion with a good 3K display won't be disappointed by the Inspiron 16 Plus 7610.
Currently, the price difference between our iGPU test unit (1200 Euros = ~$1348, i7, 512 GB, 16 GB, shop version) and the most affordable Geforce version with an RTX 3050 but otherwise similar equipment is 200 Euros (~$225). If you pick the i5, it is only a 50-Euro difference (~$56).
A more powerful and affordable alternative to the Dell is the Legion 5 Pro from Lenovo, which scores with a more powerful Ryzen 5000H and already includes an RTX 3050 Ti together with a 165-Hz display for 1300 Euros (~$1461). The LG Gramm 16 places the focus on low weight and a considerably longer battery life at a lower performance. Those for whom all these are too expensive can take a look at the 17-inch Acer Aspire 5 A517. For barely 800 Euros (~$899), you get less display and a lower performance than with the iGPU Dell, but an entry-level dGPU instead.
Price and Availability
The test unit configured with a i7-11800H, 16 GB RAM, and 512-GB SSD is currently available from Dell for $999.

Dell Inspiron 16 Plus 7610-MHJ8F
-
11/22/2021 v7
Sebastian Jentsch
More articles related to this device
Dell Inspiron 16 Plus 7610-MHJ8F (Inspiron 16 Series)Related Articles


Pricecompare

