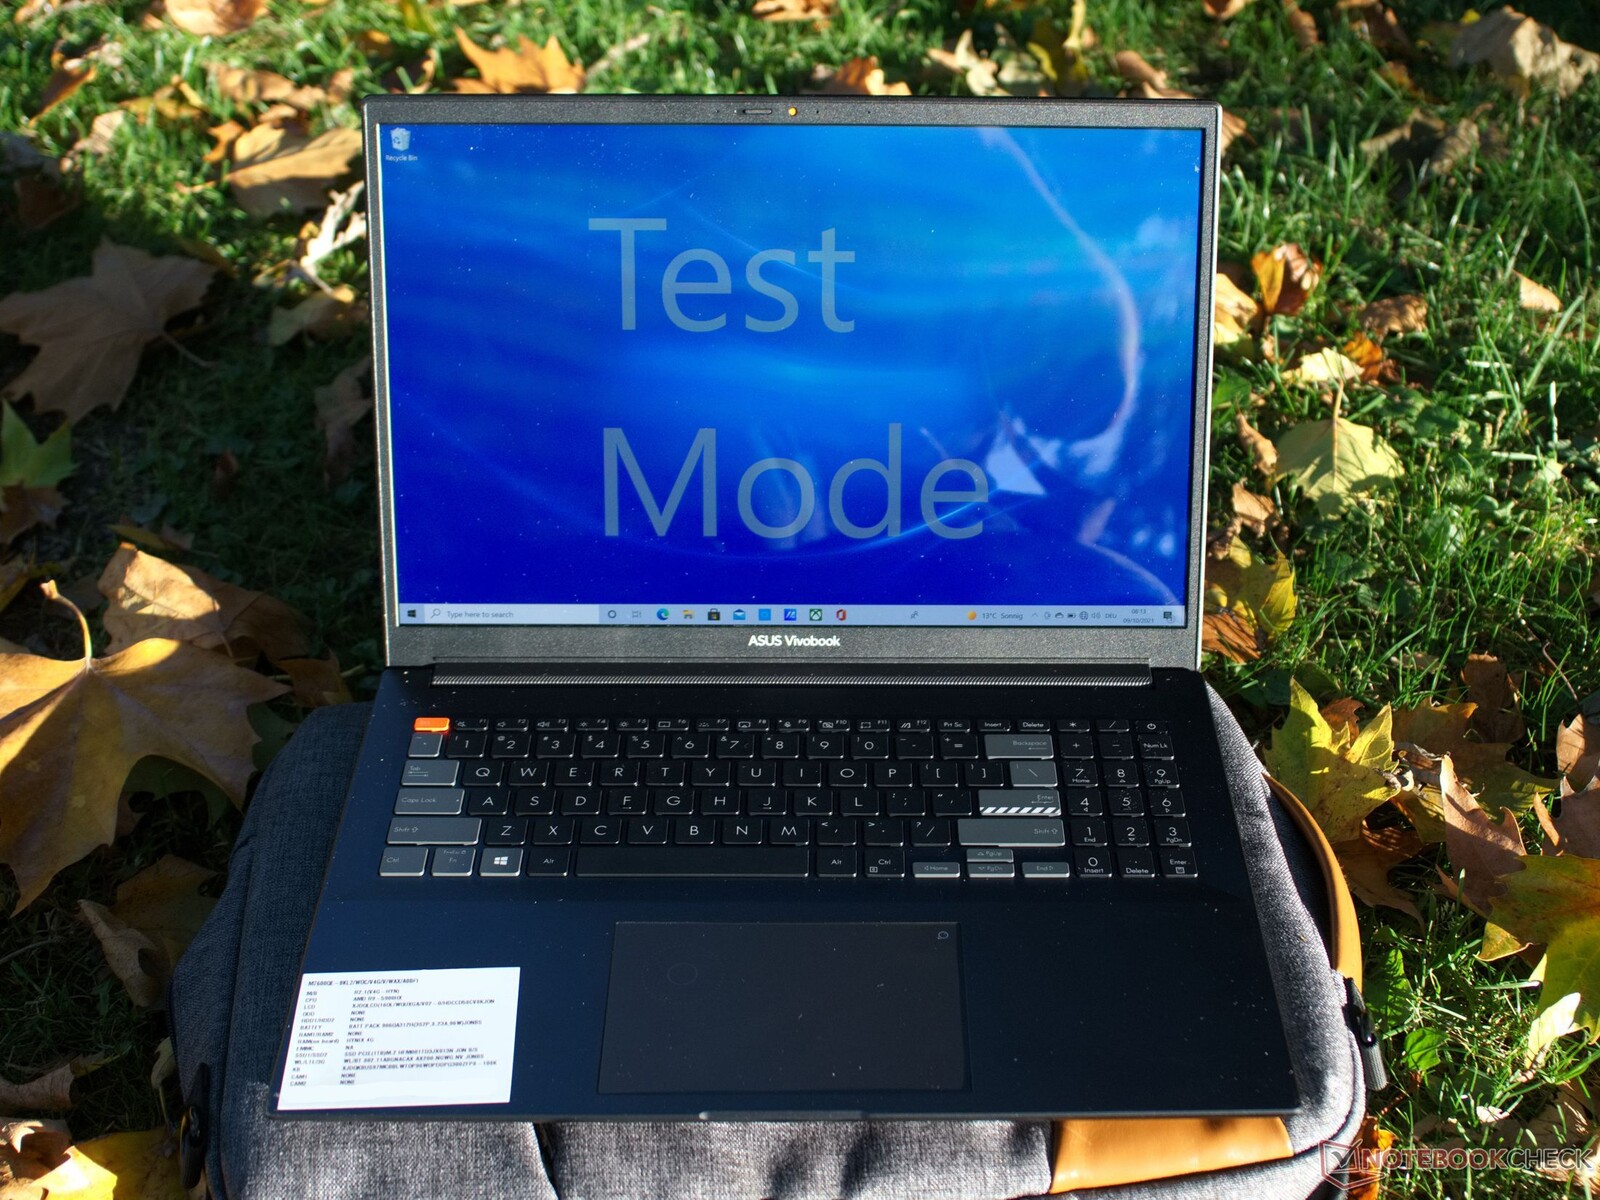
Asus Vivobook Pro 16X pre-production unit review: Performance, endurance and mighty OLED display

With a very good OLED display, Harman Kardon sound, and a lot of computing power, the Asus Vivobook Pro 16x should primarily appeal to media designers and content creators. A Microsoft Surface Dial integrated into the touchpad underlines this aspect. The laptop, which we were allowed to test as a pre-production device, shows a well-thought-out design and high performance readiness. The dark aluminum case looks both stable and elegant.
At the heart of the multimedia laptop is the fast AMD Ryzen R9-5900HX together with the Nvidia GeForce RTX 3050 Ti. Thus, the laptop has enough graphics performance for many games and video editing programs.
The competition for the Asus Vivobook Pro comes from all areas of our database, because the laptop is very powerful for a multimedia notebook. Thus, the Vivobook Pro can also keep up with the entry-level class of current gaming laptops and some workstations.
As a further preview of the latest Asus devices, the Review of the Asus Zenbook 14X is available.
Possible competitors in comparison
Rating | Date | Model | Weight | Height | Size | Resolution | Price |
|---|---|---|---|---|---|---|---|
v (old) | 12 / 2021 | Asus Vivobook Pro 16X-M7600QE R9 5900HX, GeForce RTX 3050 Ti Laptop GPU | 1.9 kg | 19 mm | 16.10" | 3840x2400 | |
| 87.8 % v7 (old) | 08 / 2021 | HP ZBook Studio 15 G8 i9-11950H, GeForce RTX 3070 Laptop GPU | 1.9 kg | 18 mm | 15.60" | 3840x2160 | |
| 86.5 % v7 (old) | 10 / 2021 | Huawei MateBook 16 R7 5800H R7 5800H, Vega 8 | 2 kg | 17.8 mm | 16.00" | 2520x1680 | |
| 85.6 % v7 (old) | 03 / 2021 | Gigabyte Aero 15 OLED XC i7-10870H, GeForce RTX 3070 Laptop GPU | 2.2 kg | 20 mm | 15.60" | 3840x2160 | |
| 86 % v7 (old) | 08 / 2021 | Lenovo IdeaPad 5 Pro 16IHU6 i5-11300H, GeForce MX450 | 1.9 kg | 18.4 mm | 16.00" | 2560x1600 | |
| 88.4 % v7 (old) | 08 / 2021 | Dell XPS 15 9510 11800H RTX 3050 Ti OLED i7-11800H, GeForce RTX 3050 Ti Laptop GPU | 1.9 kg | 18 mm | 15.60" | 3456x2160 |
Case - anodized aluminum and little plastic
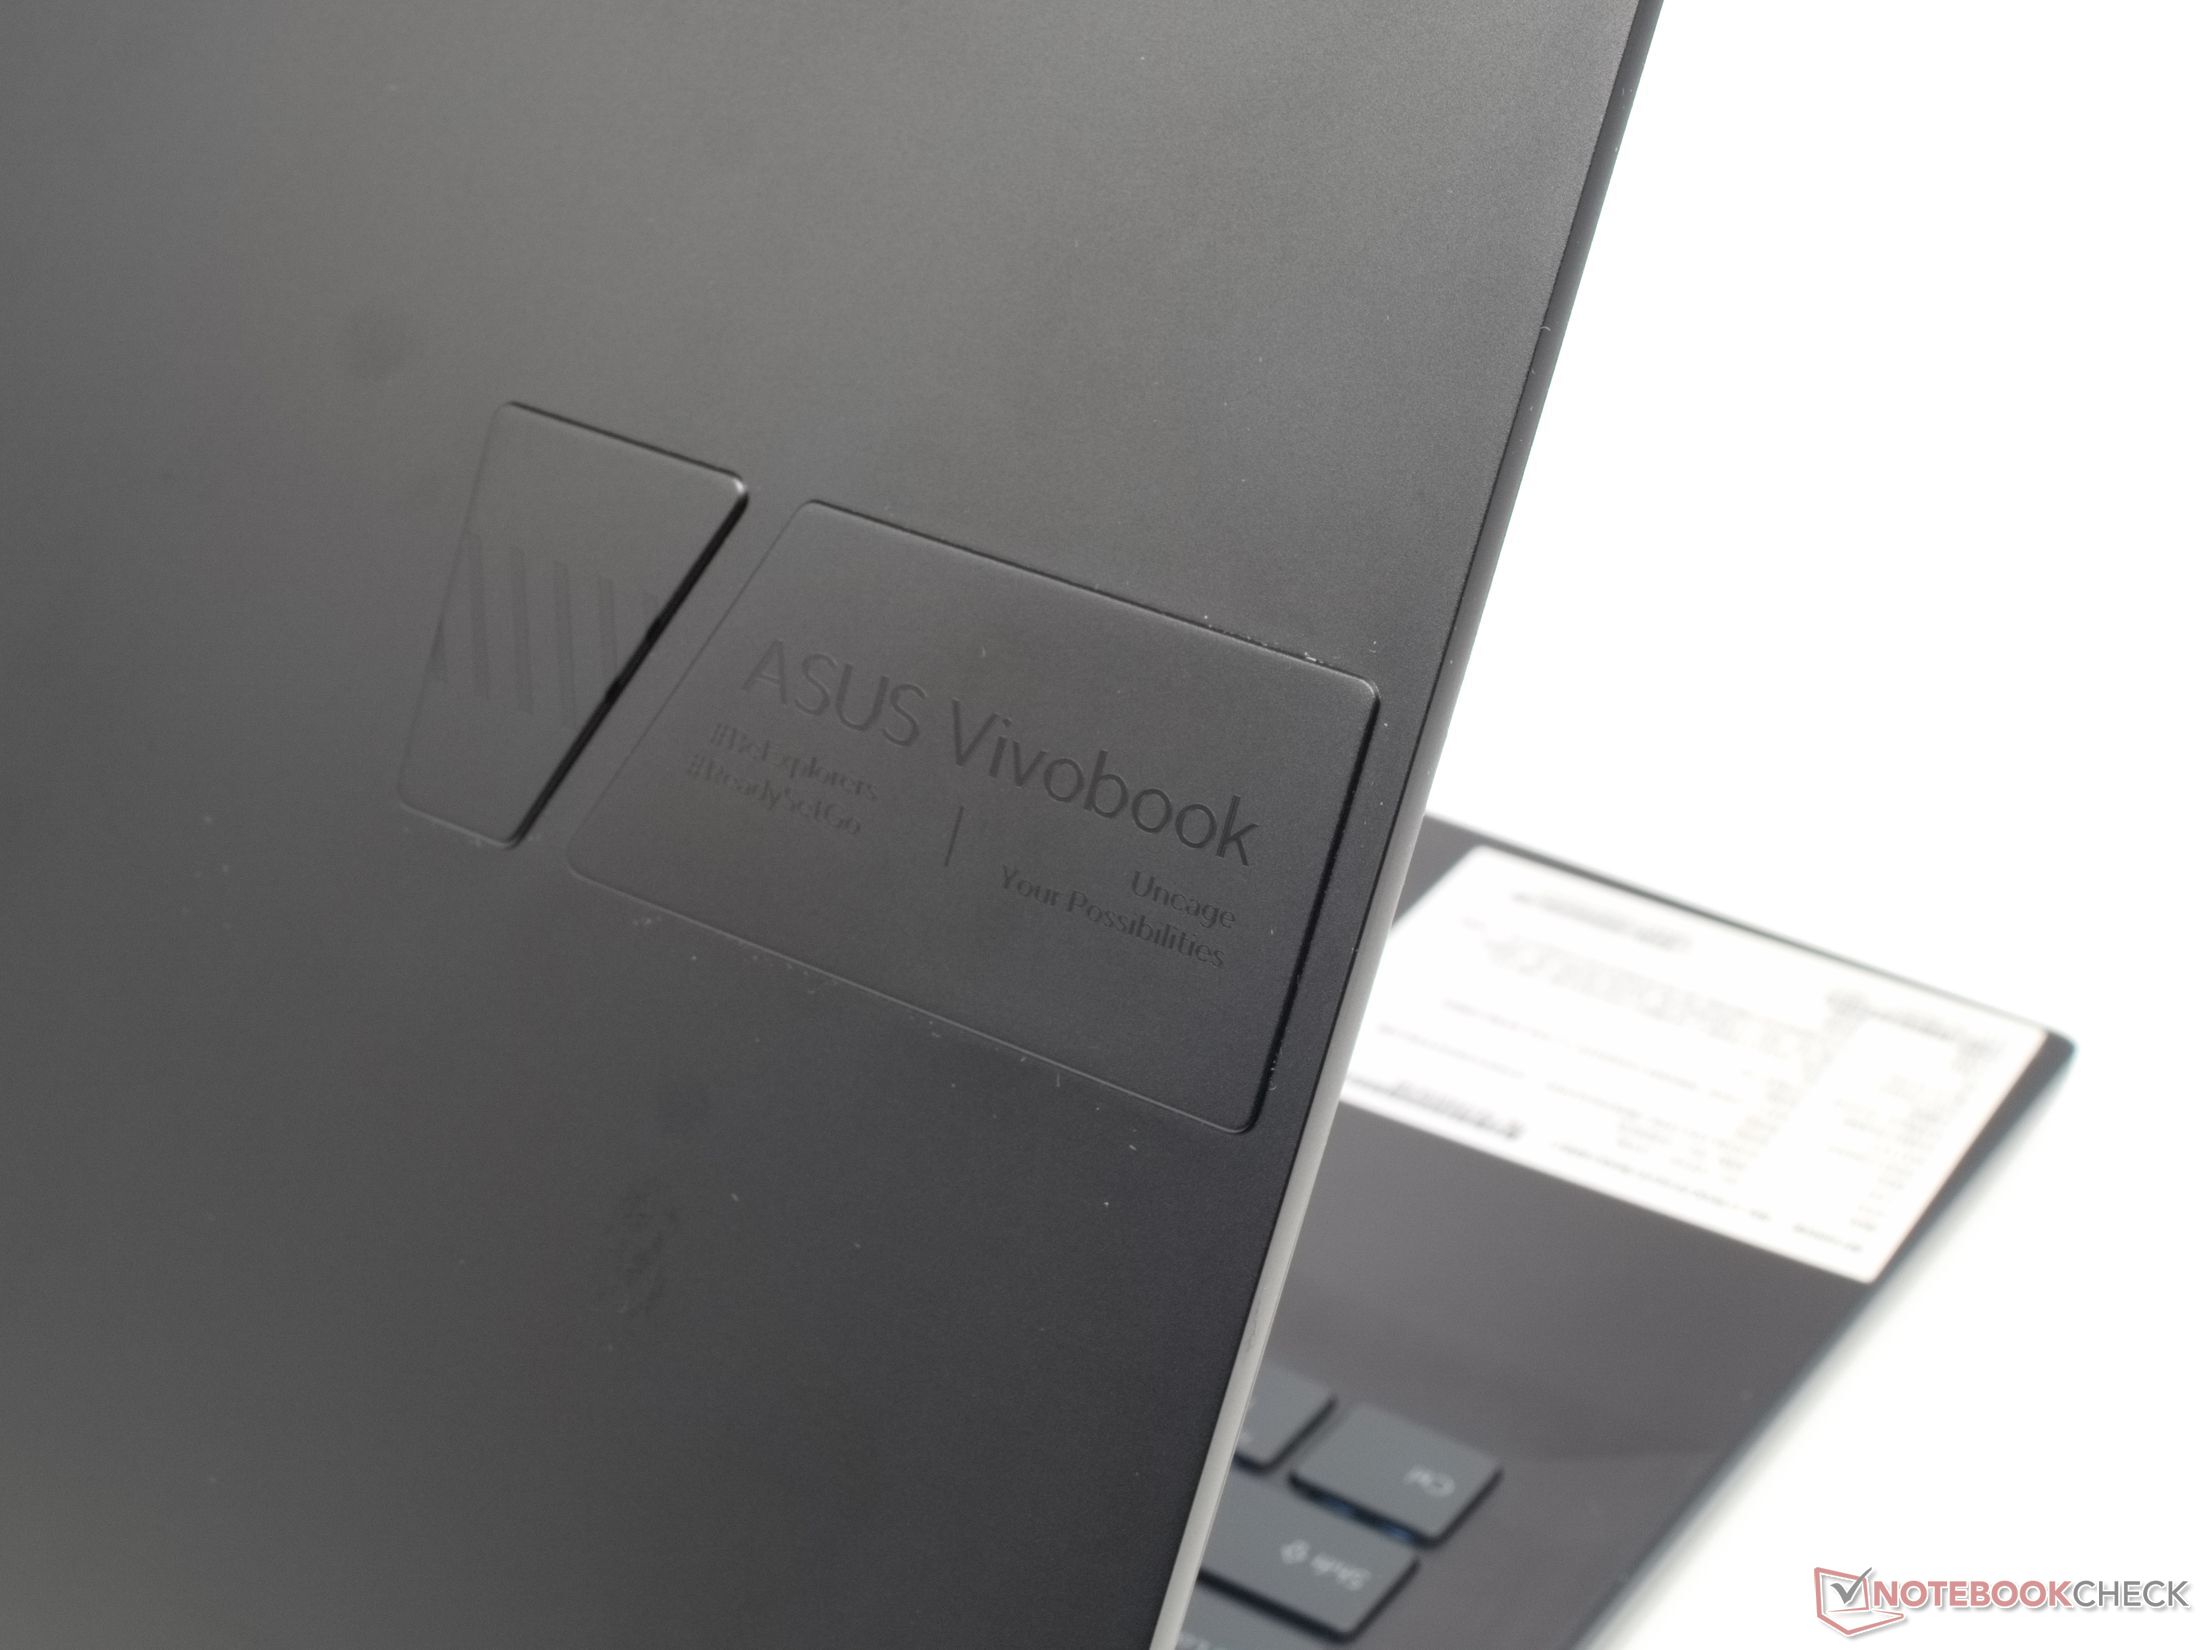
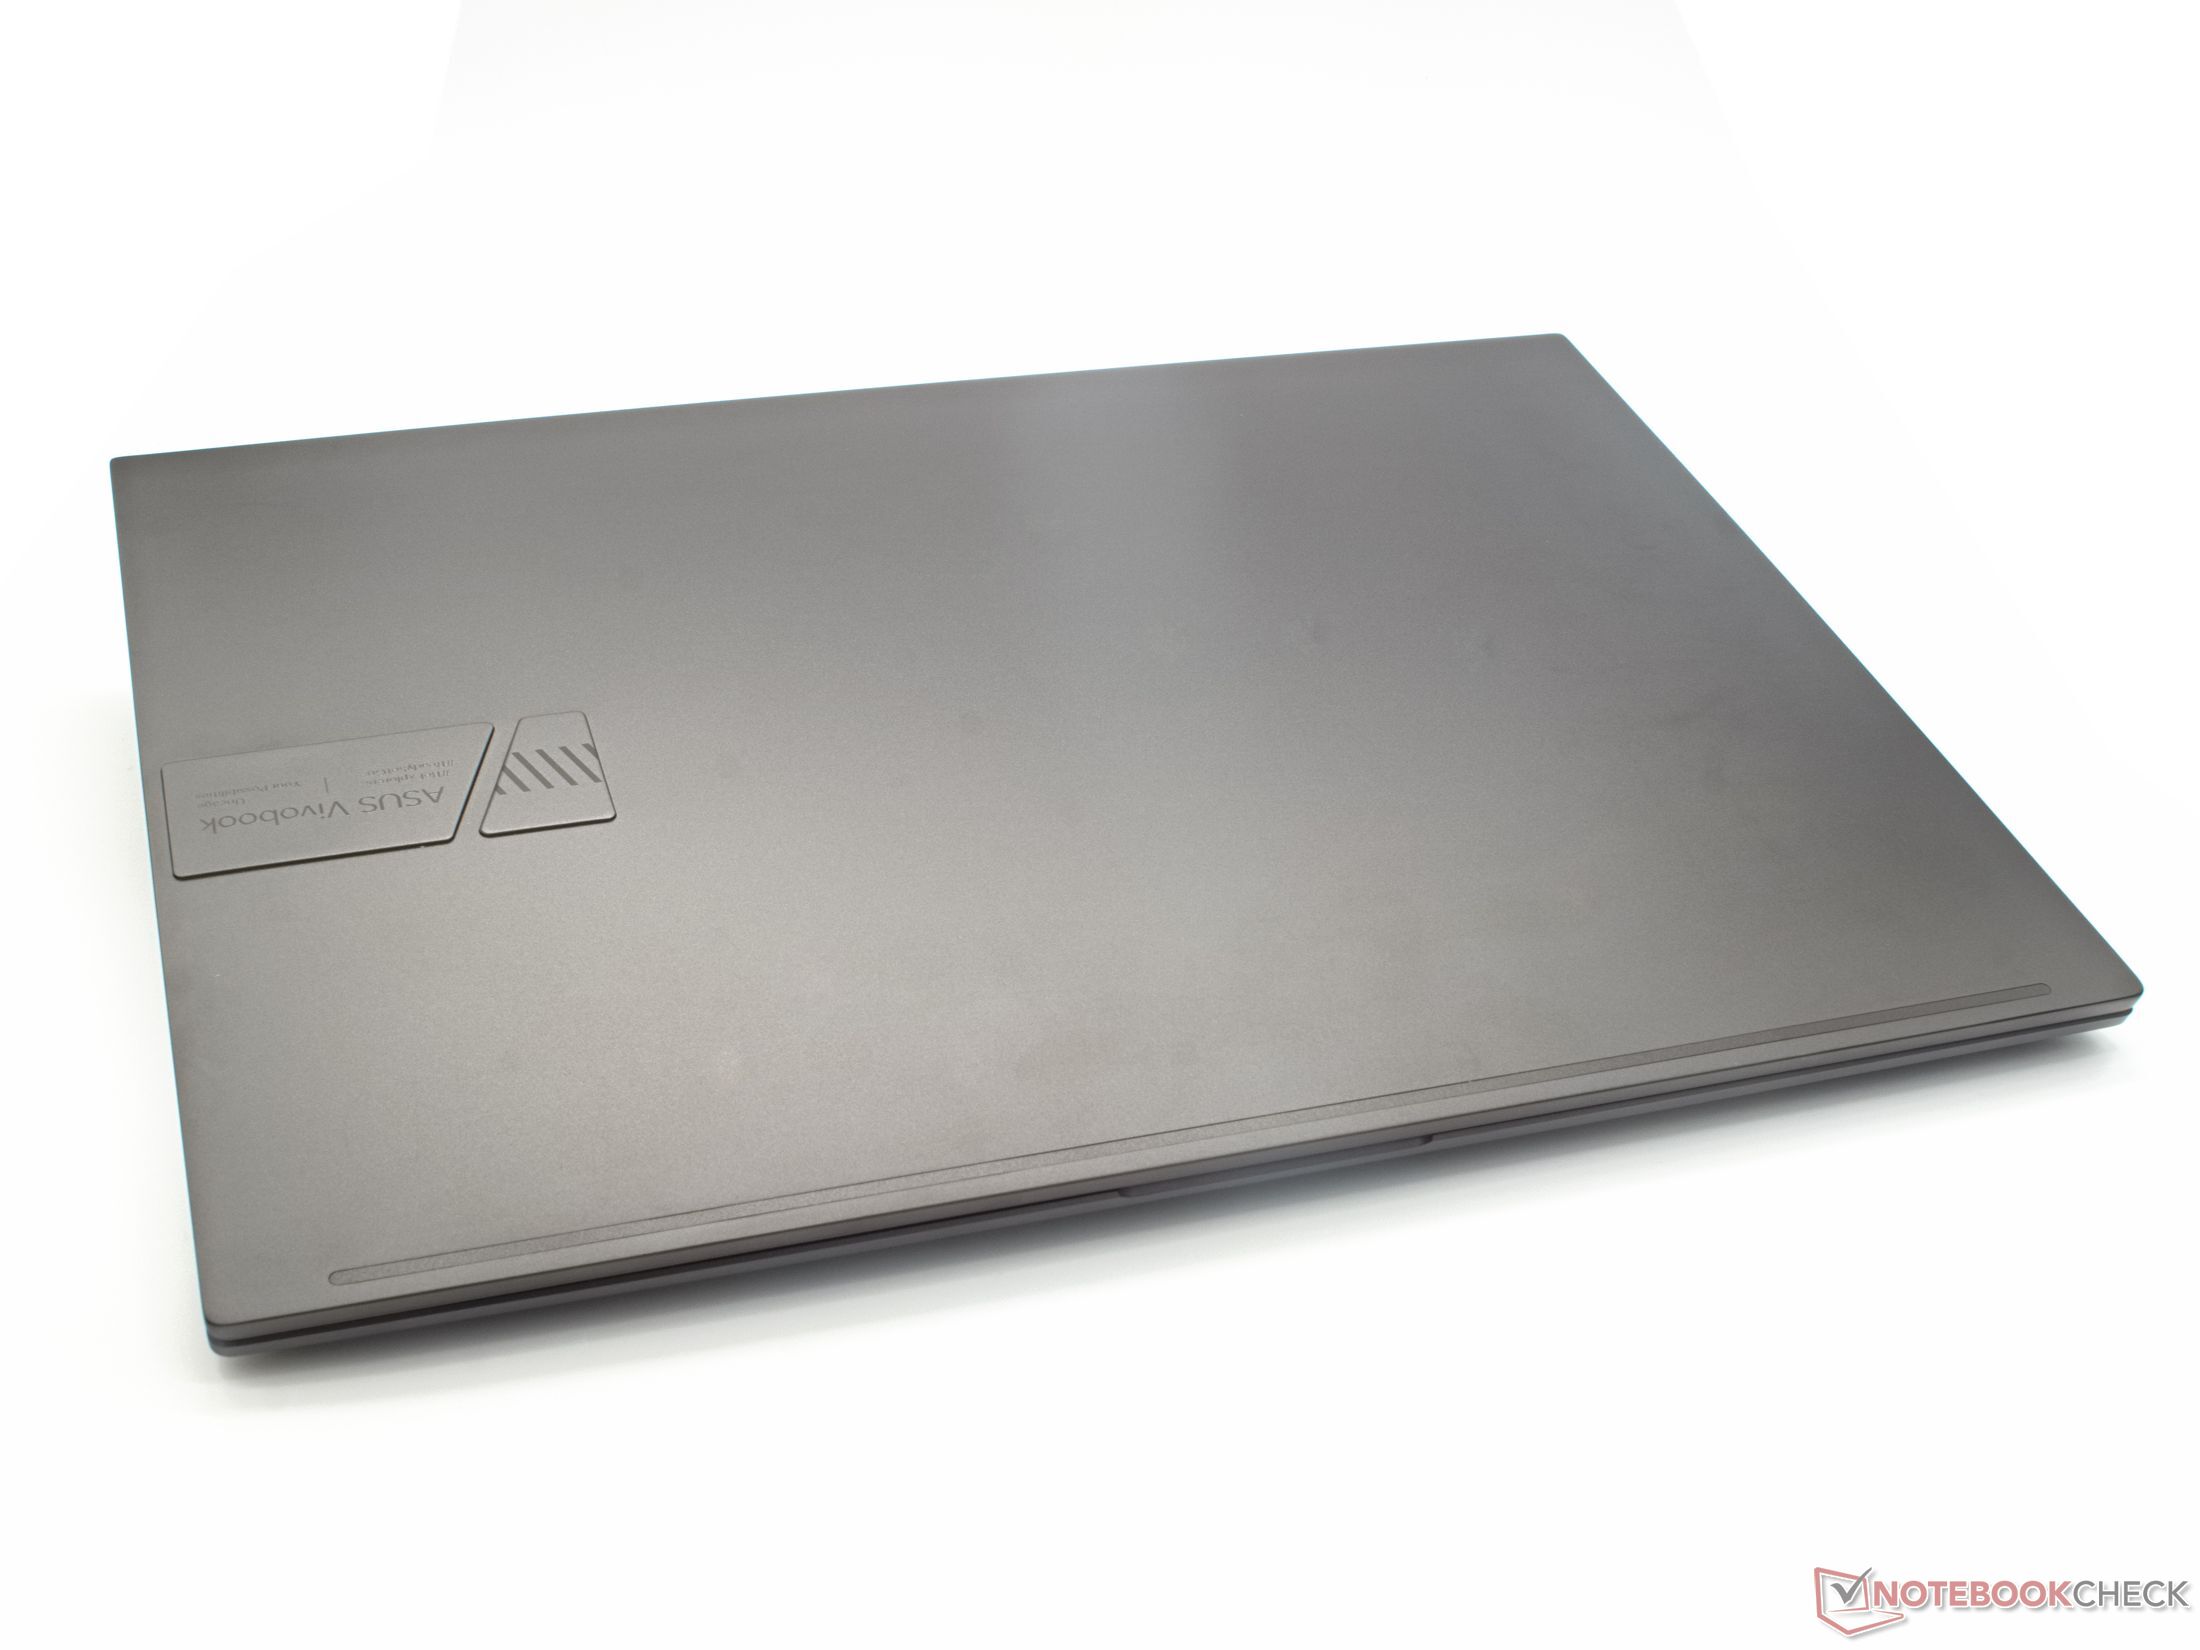
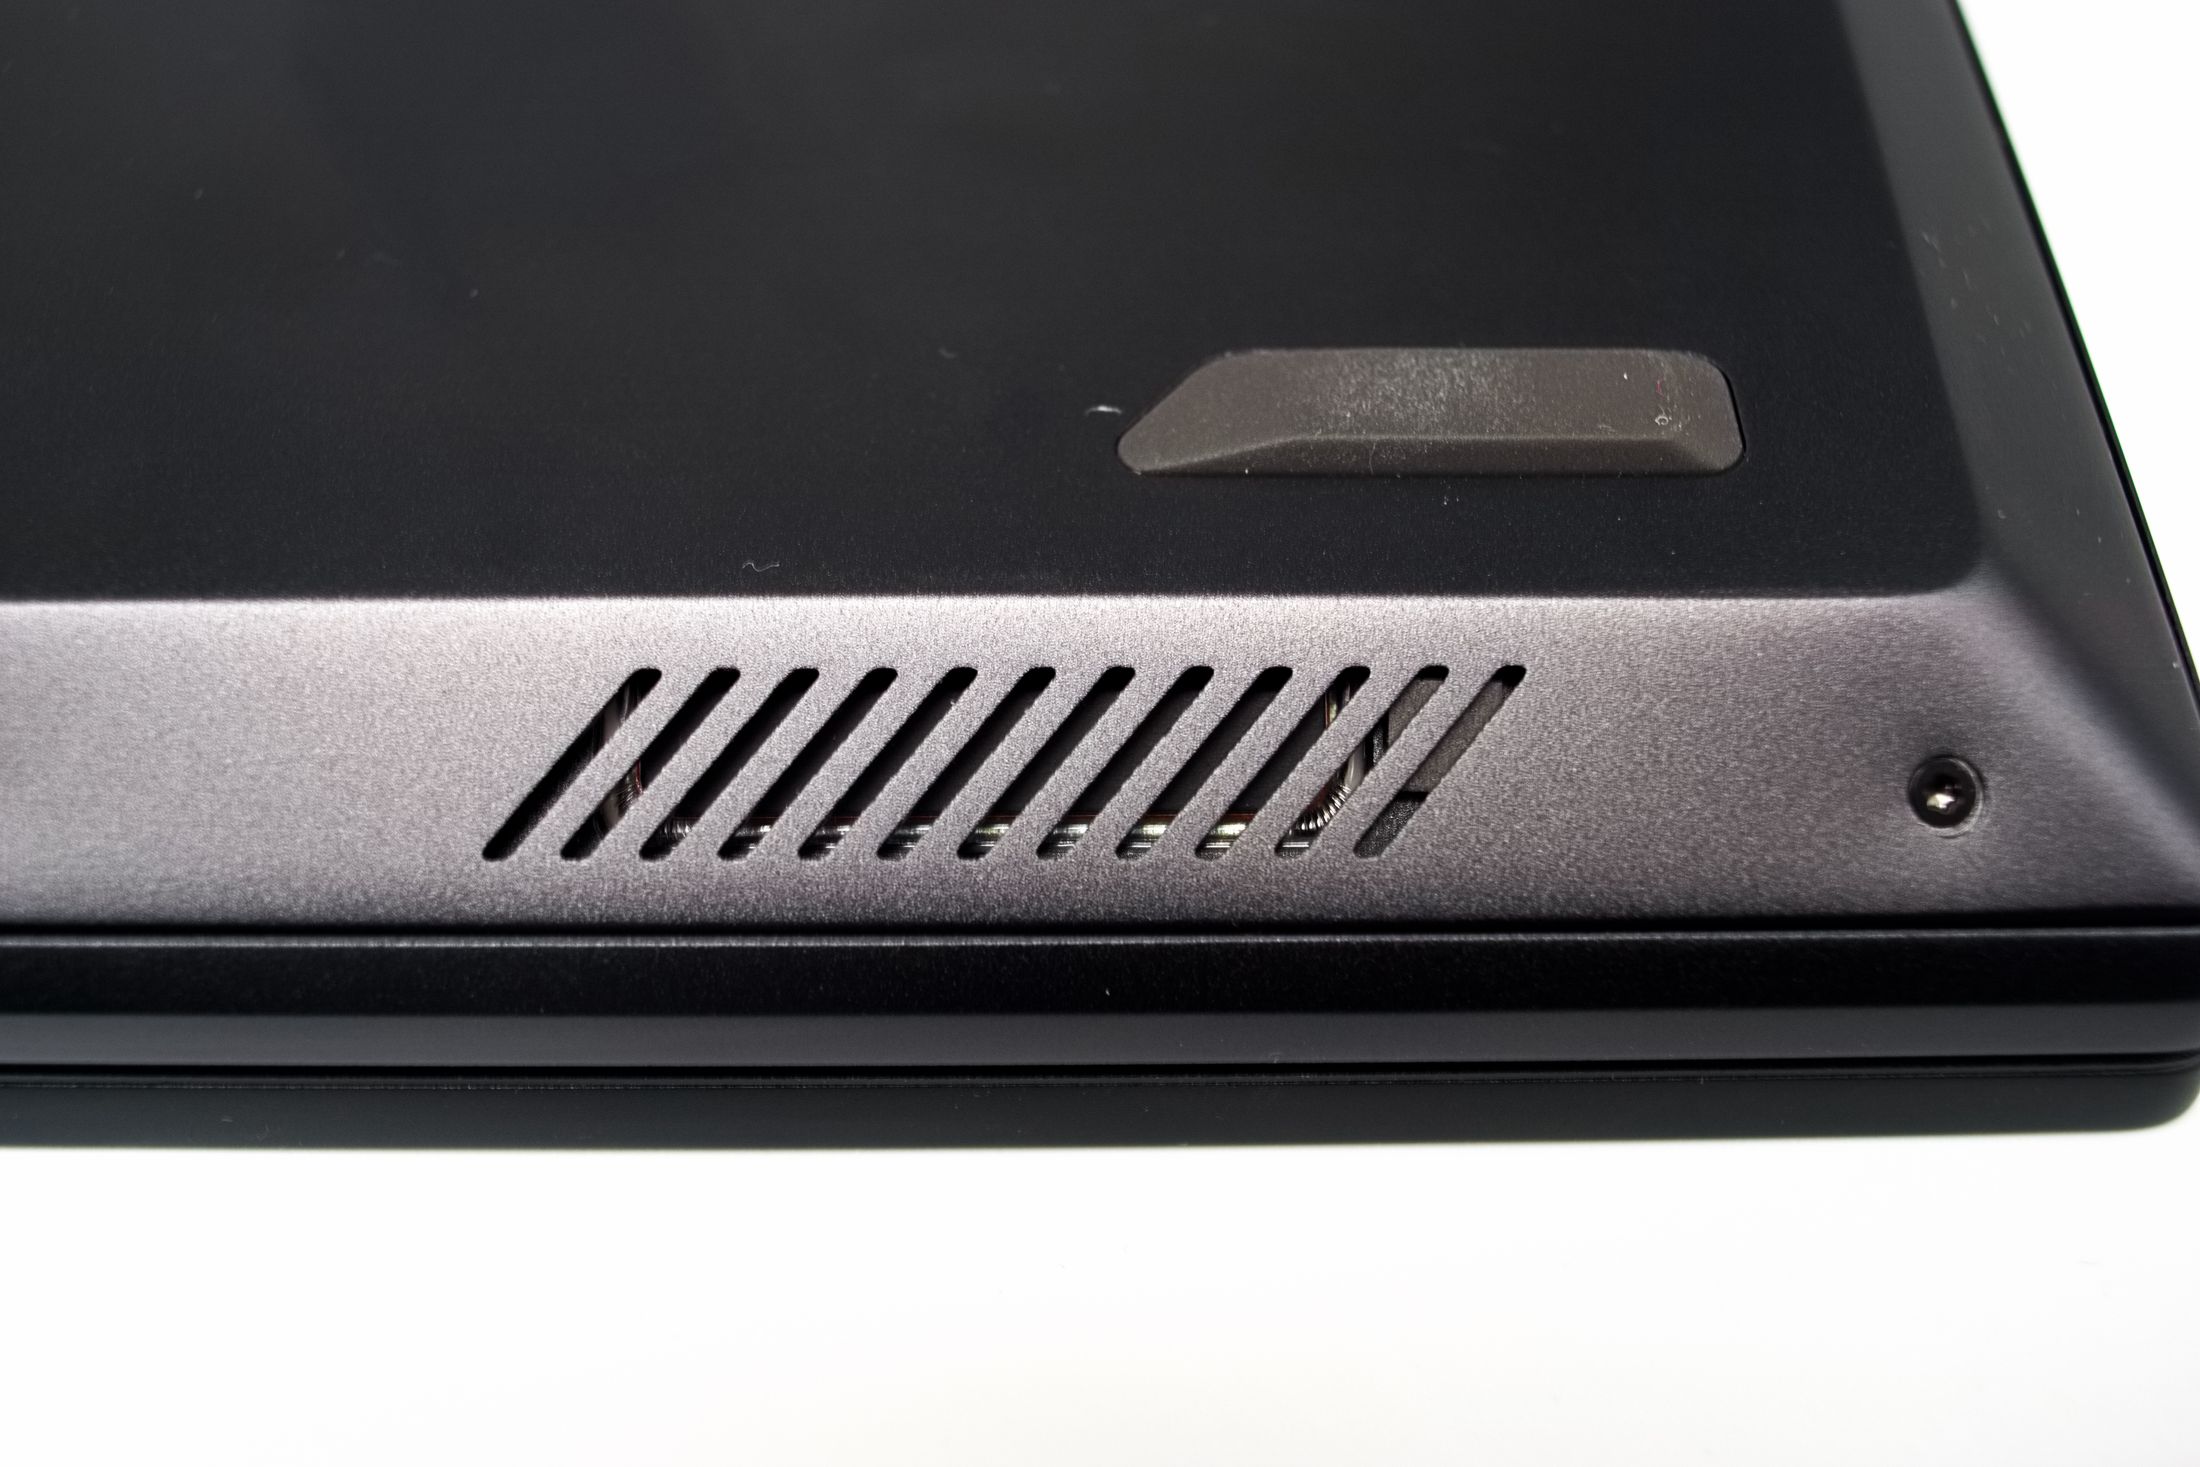
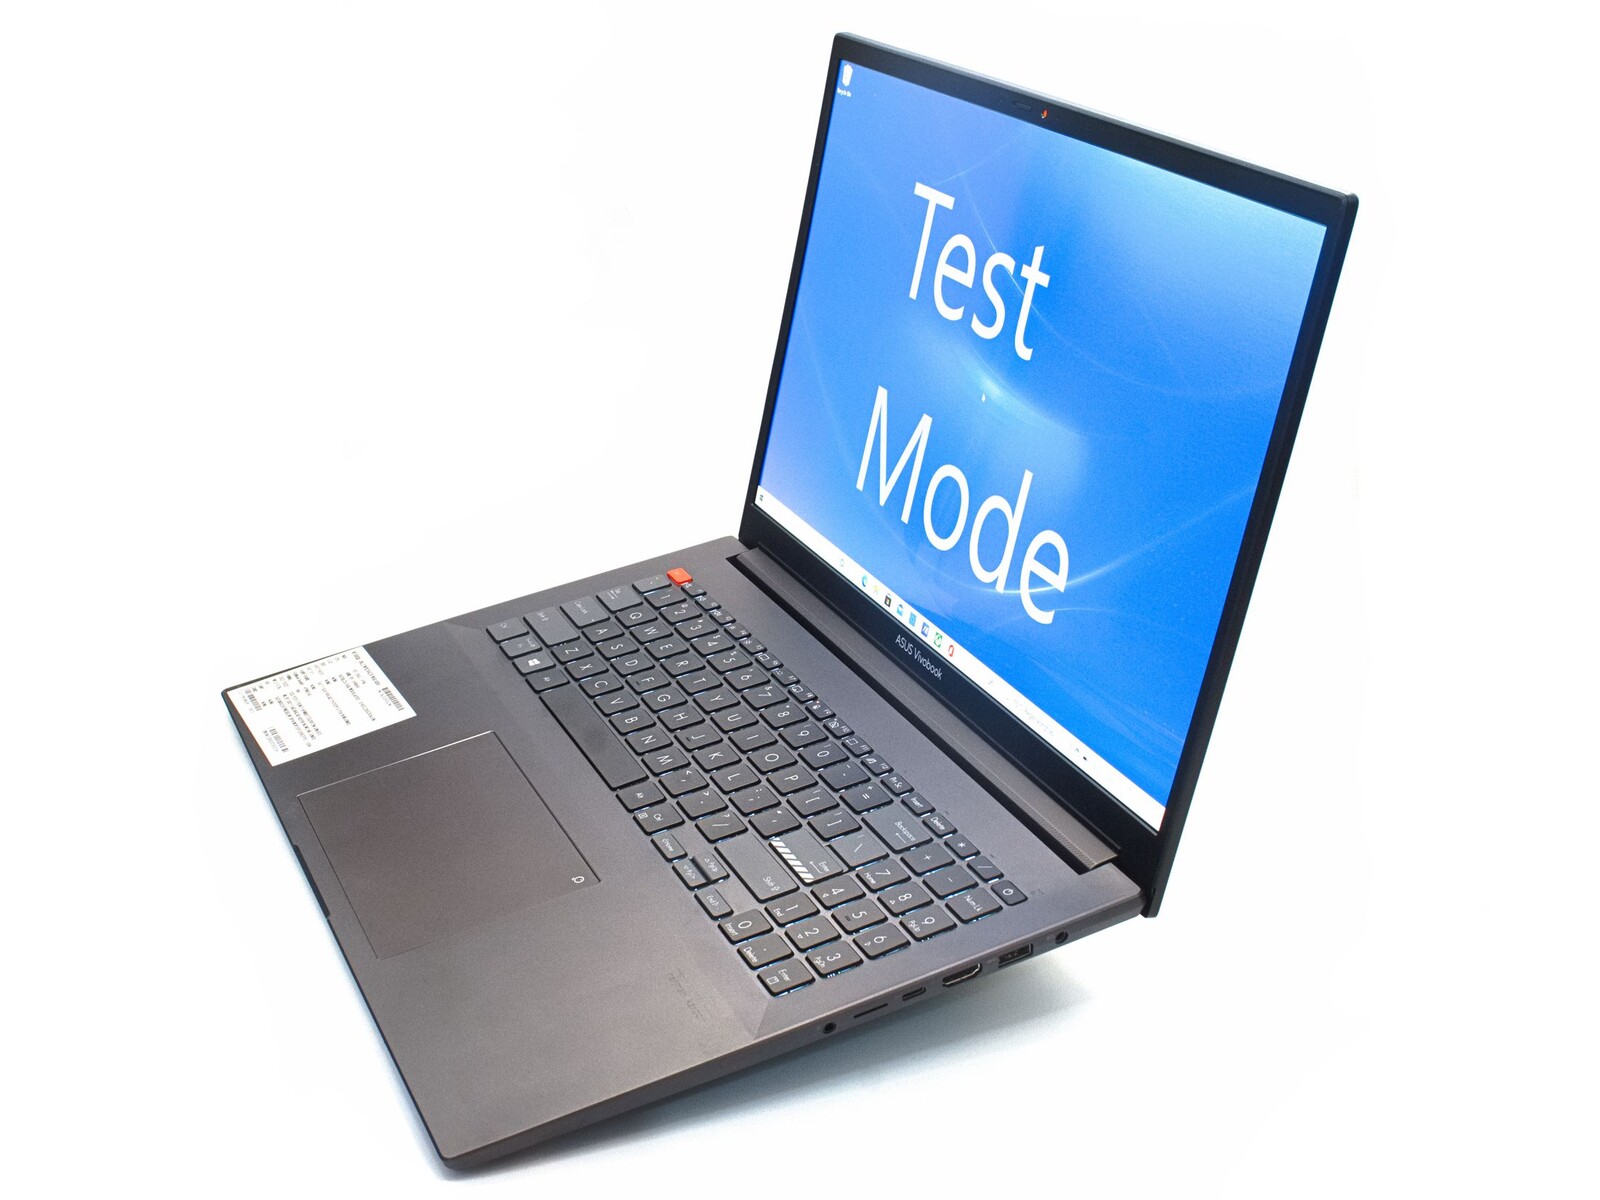
A lot of dark gray to black anodized aluminum with a few accents of black plastic determine the exterior of the Asus Vivobook. Although the laptop is not really thin, the device looks less bulky thanks to a Swiss edge. Small design elements, such as embossments on the display hinge, also liven things up.
The matte aluminum with its smooth surface is always pleasantly cool to the touch. Except for the somewhat flexible display, the laptop looks very stable and hardly shows any manufacturing problems. The somewhat uneven gaps on the underside are not untypical for a pre-production device.
The display can be opened up to an angle of 160° with one hand. A keyboard with gray and red color accents as well as the large touchpad can be seen underneath.
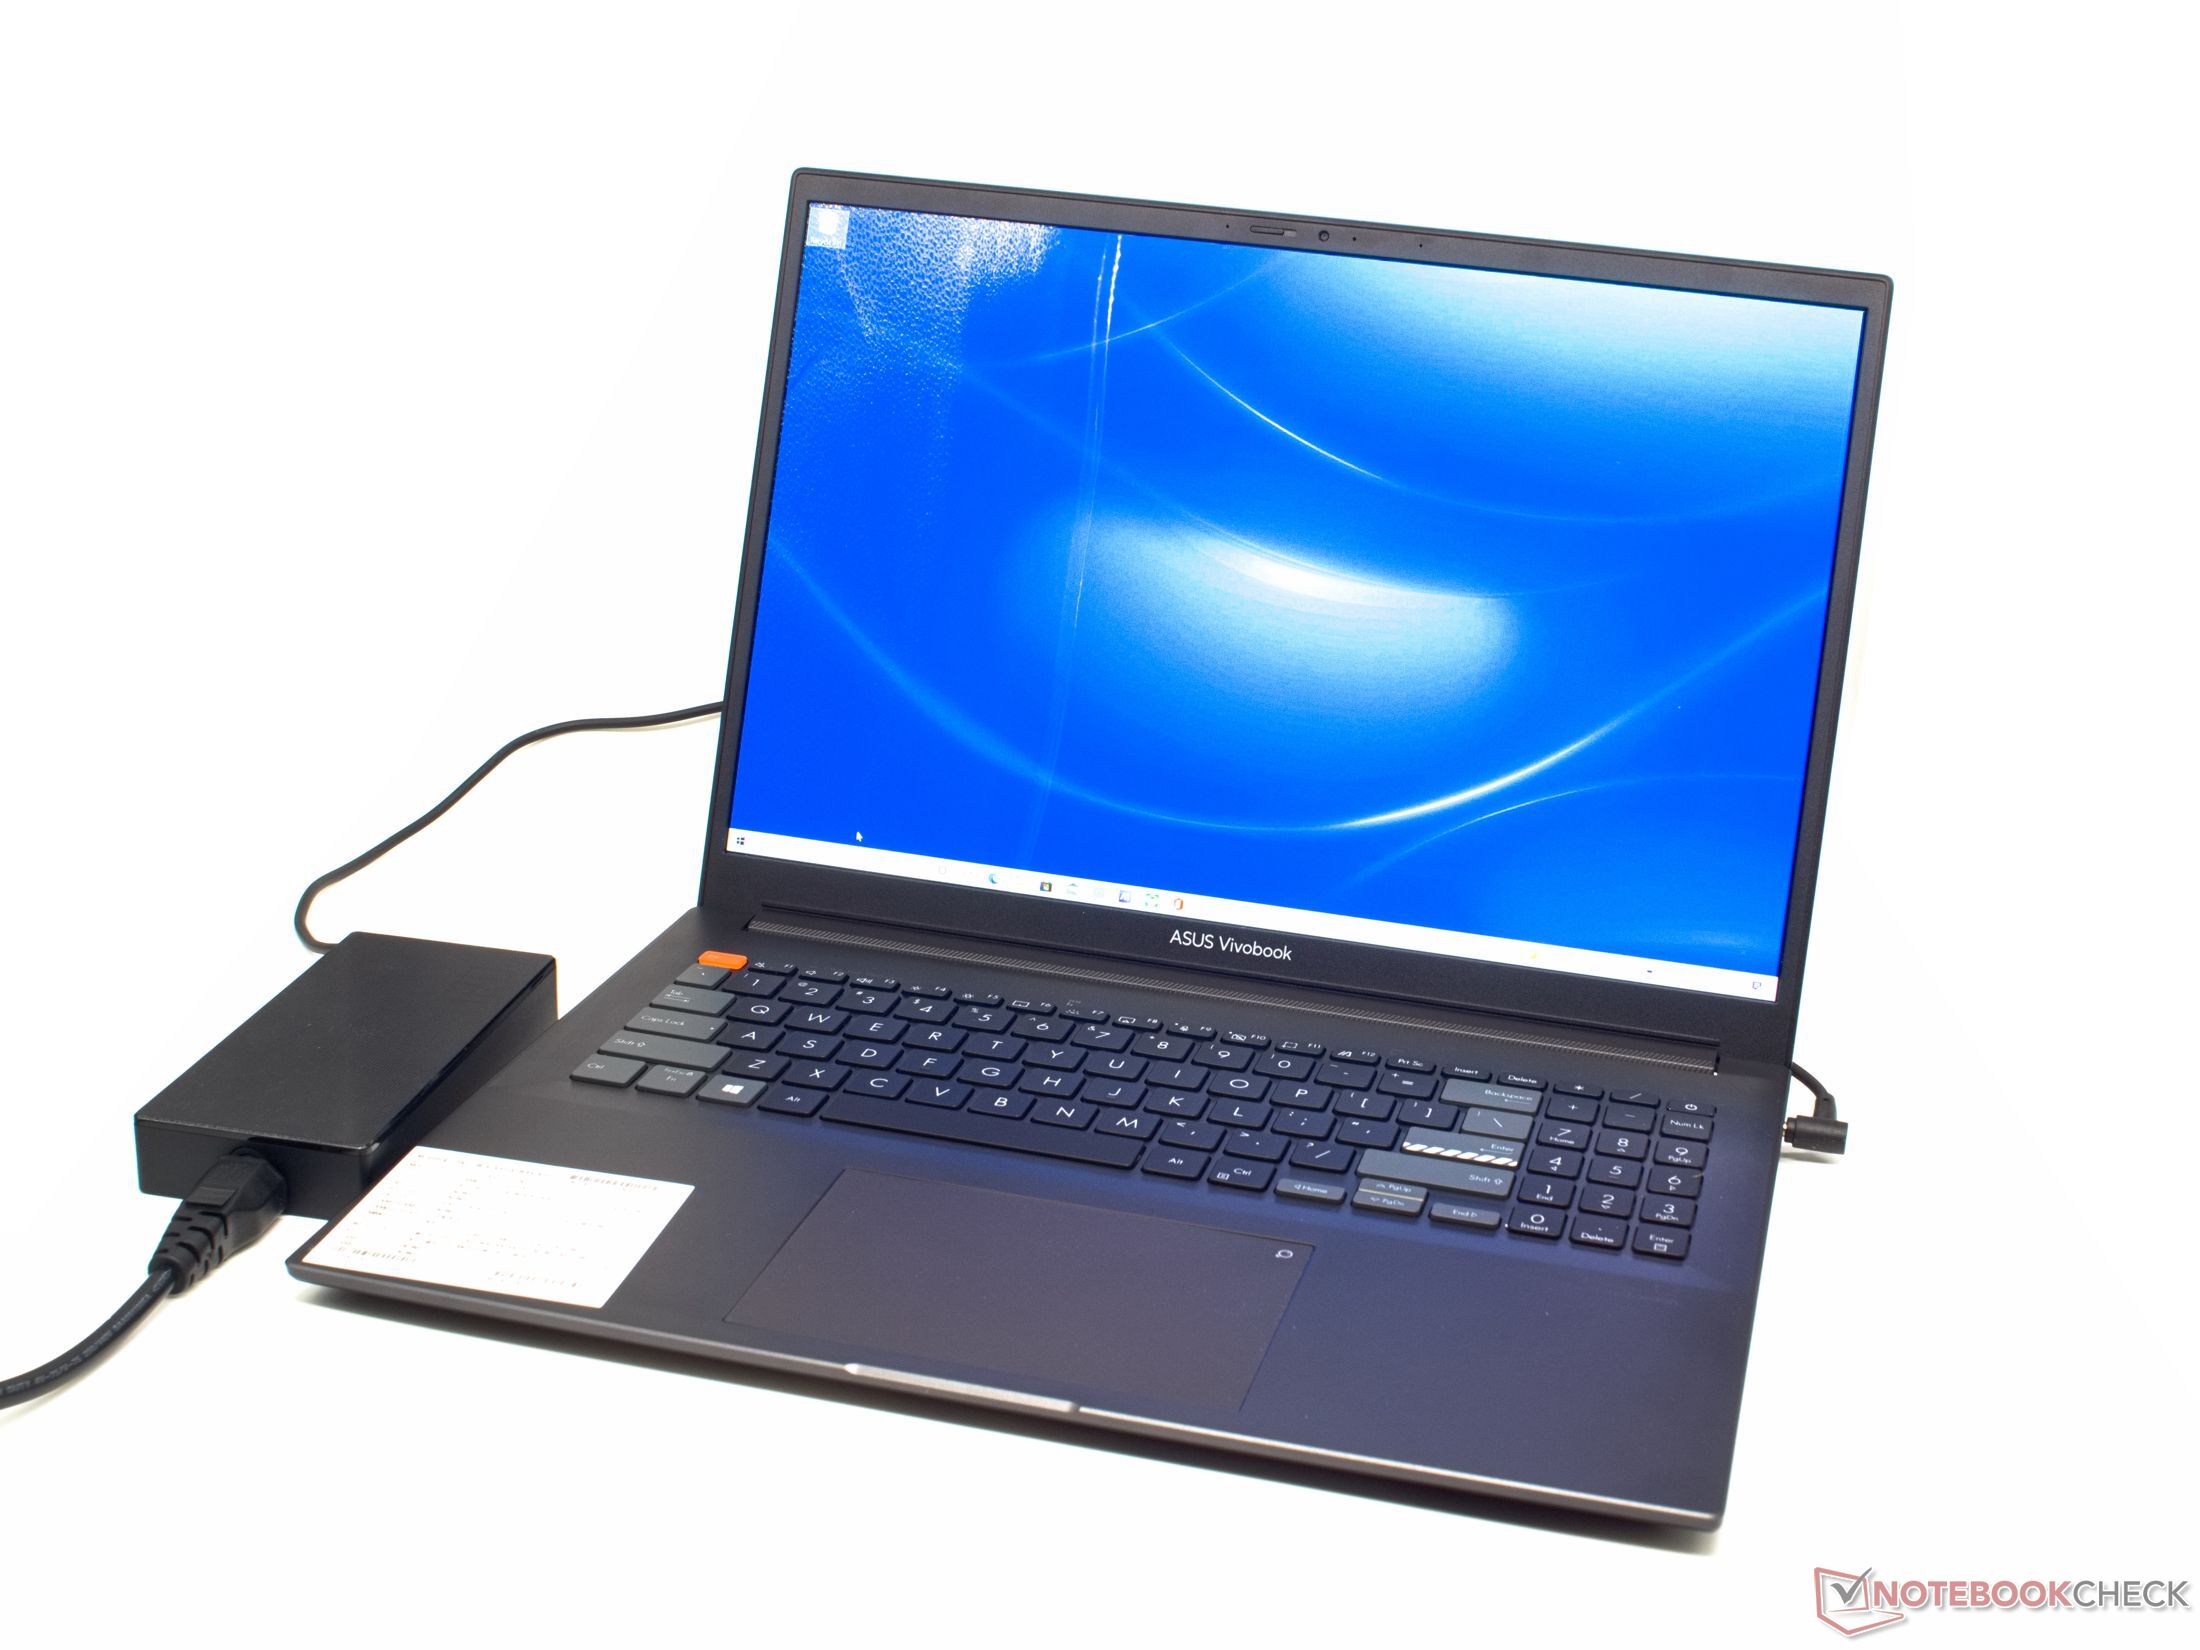


The Asus Vivobook is relatively slim for a 16-inch laptop of the given performance class. Weight and thickness are in the same range as the competition.
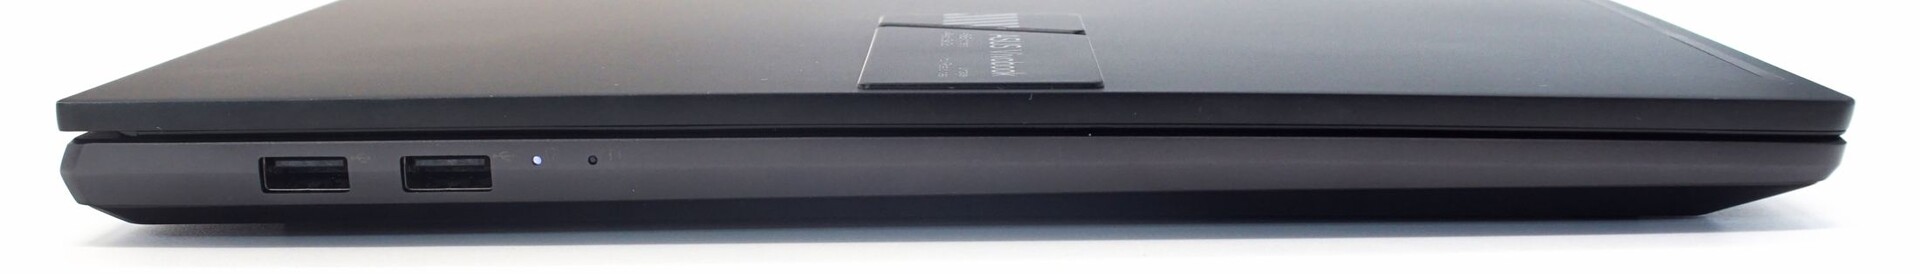
Equipment - without Thunderbolt, the Vivobook offers little connectivity
The notebook does not offer many connectivity options with its four USB ports (one of them USB Type-C). PowerDelivery and Thunderbolt 4 are not available here. The HDMI port is the only option for connecting an external display via cable.

SDCardreader
The microSD card reader is quite slow with a transfer rate of 38 MB/s. The AV PRO microSD with 128 GB used in the test usually delivers much faster data transfer rates.
| SD Card Reader | |
| average JPG Copy Test (av. of 3 runs) | |
| Dell XPS 15 9510 11800H RTX 3050 Ti OLED (AV Pro V60) | |
| Gigabyte Aero 15 OLED XC (Toshiba Exceria Pro SDXC 64 GB UHS-II) | |
| Average of class Multimedia (22.2 - 531, n=45, last 2 years) | |
| HP ZBook Studio 15 G8 (AV Pro V60) | |
| Asus Vivobook Pro 16X-M7600QE (AV Pro SD microSD 128 GB V60) | |
| maximum AS SSD Seq Read Test (1GB) | |
| Gigabyte Aero 15 OLED XC (Toshiba Exceria Pro SDXC 64 GB UHS-II) | |
| Dell XPS 15 9510 11800H RTX 3050 Ti OLED (AV Pro V60) | |
| Average of class Multimedia (27.9 - 1455, n=44, last 2 years) | |
| Lenovo IdeaPad 5 Pro 16IHU6 (AV PRO microSD 128 GB V60) | |
| HP ZBook Studio 15 G8 (AV Pro V60) | |
| Asus Vivobook Pro 16X-M7600QE (AV Pro SD microSD 128 GB V60) | |
Communication
An Intel AX200 module is responsible for Wi-Fi 6 and Bluetooth 5.1 in the Asus Vivobook. However, the otherwise very fast WLAN module is below its potential in the test device's transmission speeds. Positioning the antenna is often particularly difficult in laptops with a metal casing.
Webcam
The 0.9 MP webcam of the all-round laptop shows a typical image quality for laptops. A mechanical shutter protects against unwanted glances through the camera here. The microphone and webcam can also be disabled via a function key on the keyboard. Small orange LEDs indicate the state of both.


Security
The Asus Vivobook has up-to-date security features like SecureBoot and TPM 2.0 thanks to the AMD Ryzen R9. Windows Update reports full compatibility with Windows 11.
A fingerprint sensor integrated into the power button can be used as an authentication method for logging in.
Accessories
Apart from an appropriate power supply unit, our pre-production device did not come with any other accessories.
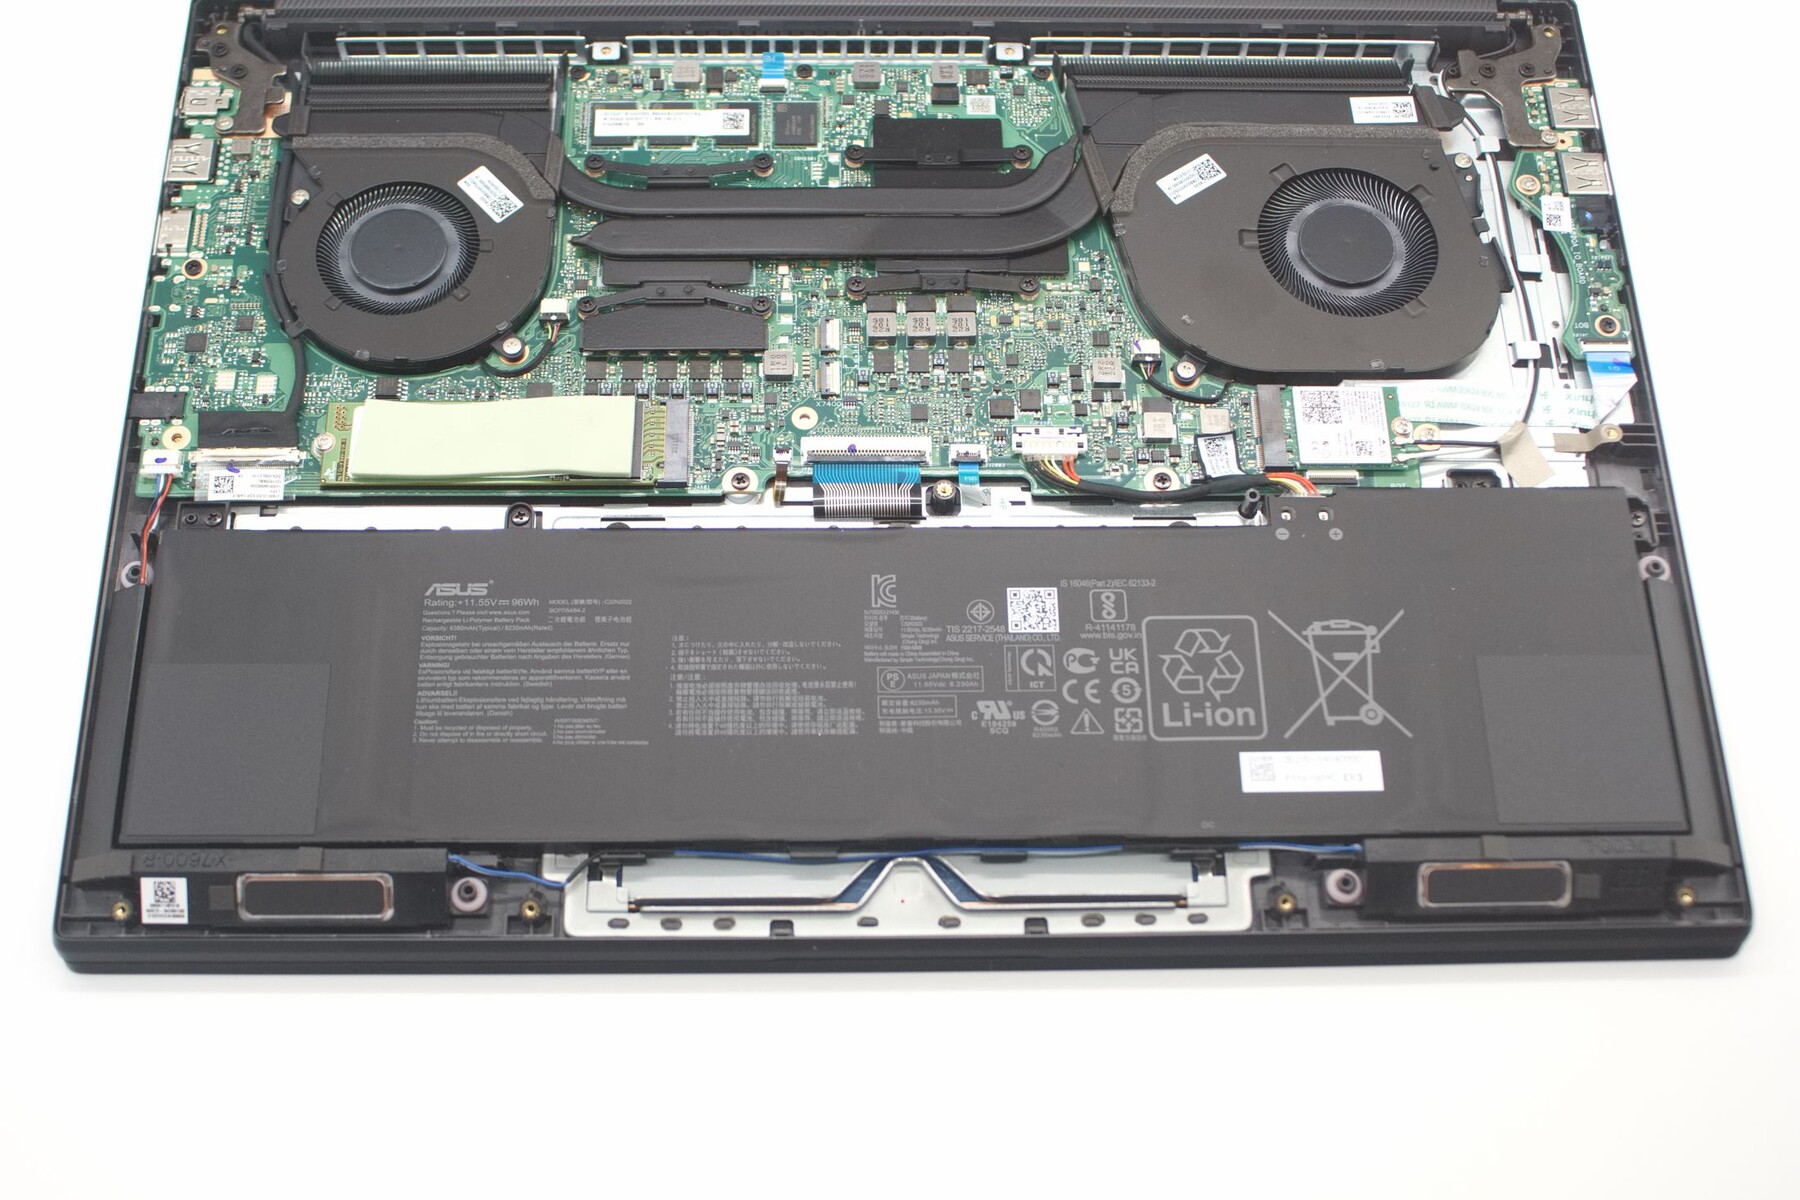
Maintenance
After removing the 11 TX5 screws, the lower casing cover can be removed with a suction cup. The WLAN module and the M.2-2280 SSD can be replaced. The two fans can also be easily cleaned in the process. The working memory, on the other hand, is soldered.
Warranty
Our pre-production device is excluded from any warranty. Normally, Asus offers devices with a warranty of 24 months.

Input devices - The Asus Dial delivers features for creatives
Keyboard
The full keyboard of the Asus Vivobook has a normal size with its 16 mm keys. It is easy to work with a pleasantly high typing resistance and a noticeable haptic feedback. The keyboard is quiet and easy to use even in the dark thanks to the backlight. Function keys for turning the microphone and camera on and off as well as for the screenshot menu and the MyAsus app round out the keyboard's functionality.

Touchpad
The 13 × 8.5 cm (5.1 x 3.4 in) ClickPad convinces with its responsiveness and smooth surface. An additional control element can be accessed with a swipe from the upper right corner. The Asus Dial allows controlling screen brightness, volume and other settings as well as launching applications. The Asus Dial can also be used in some Adobe programs. Alternatively, the Asus Dial can also be configured like the Microsoft Surface Dial.

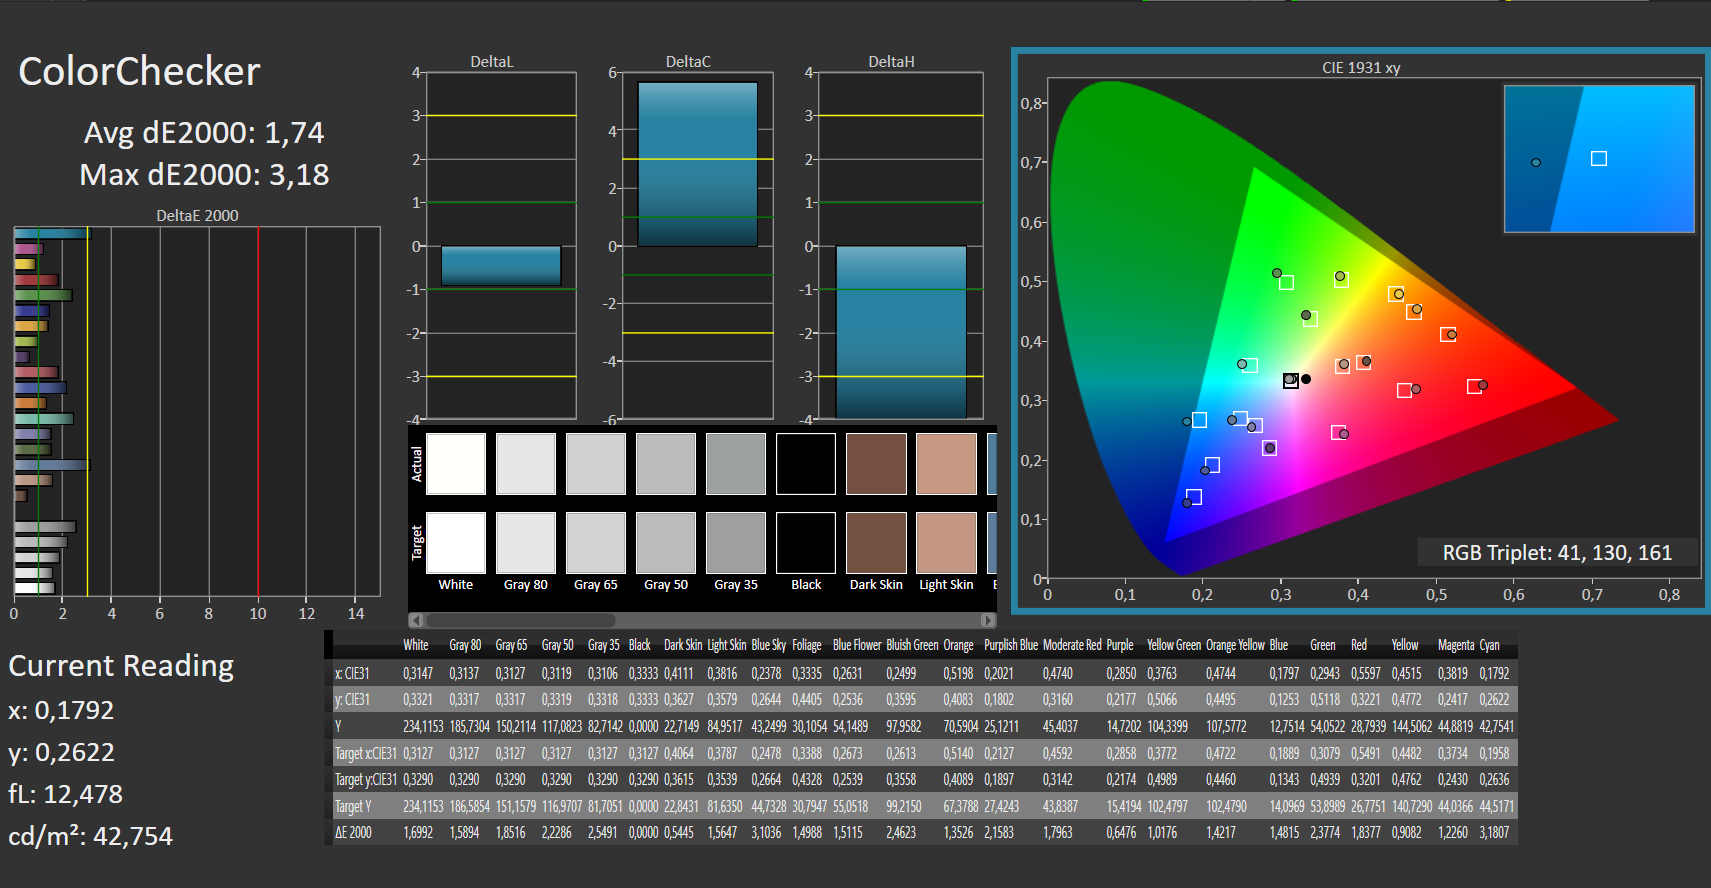
Display - WQUXGA and OLED at 60 Hz result in a very good picture

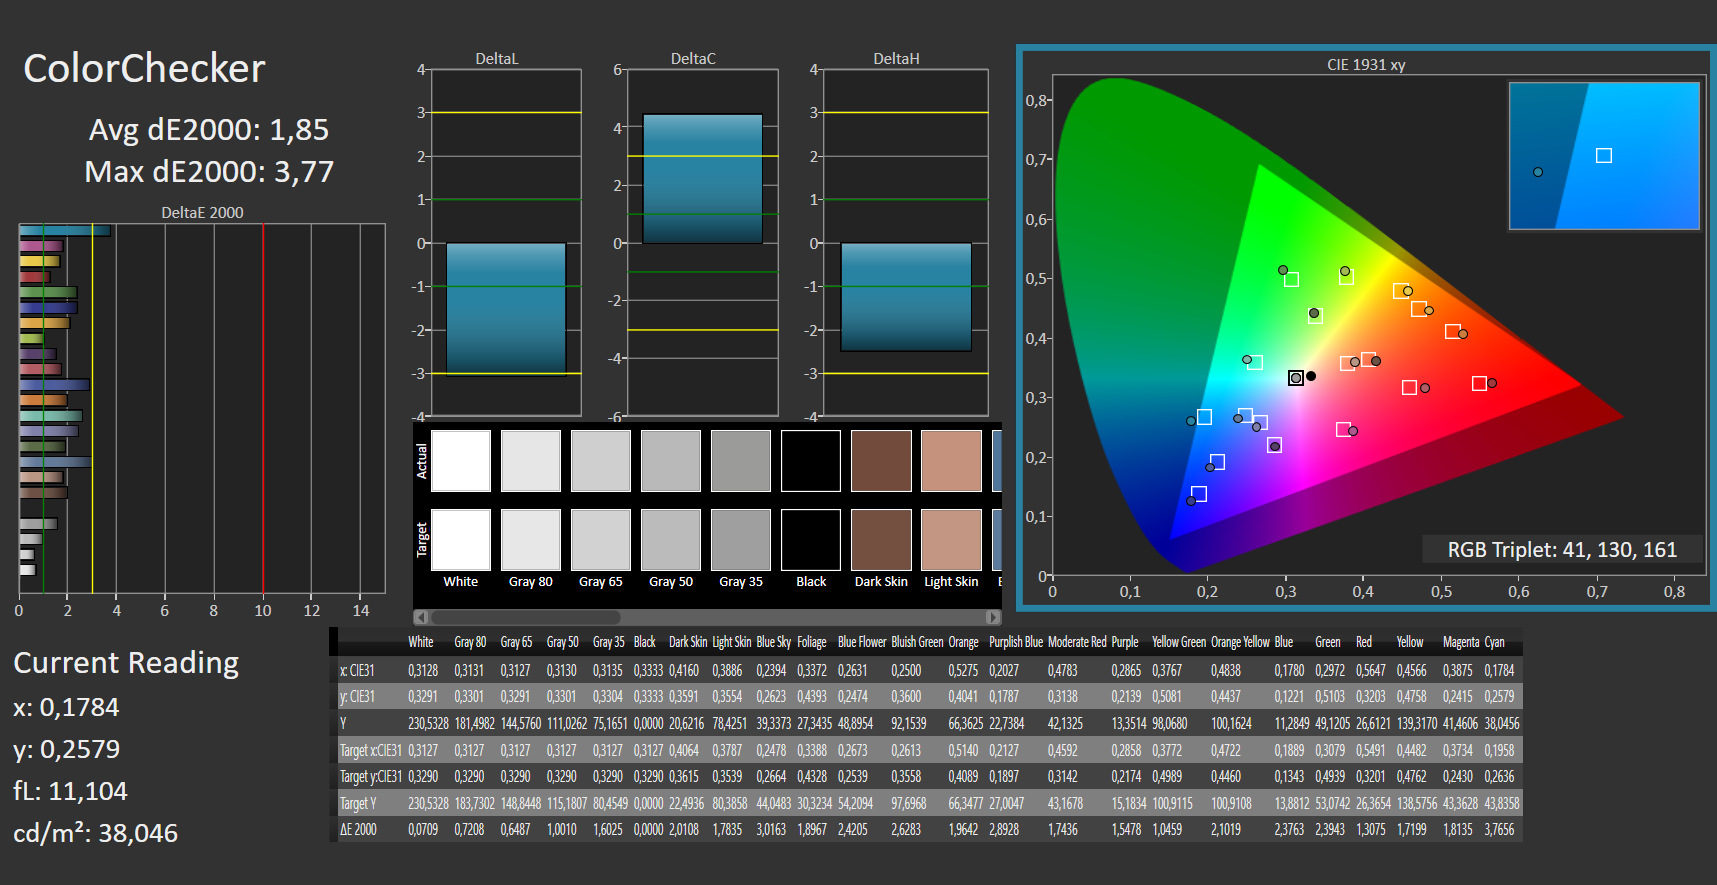
With 400 cd/m², the OLED display in Asus' Vivobook delivers a very bright and colorful picture with 3840 × 2400 pixels in a 16:10 format. Calculated to the 16.1-inch size, this results in a pixel density of 281 ppi. Individual pixels are thus difficult to recognize. The maximum frame rate of 60 FPS might be too low for the intended use as a laptop for media designers. There are no halos or poorly illuminated areas on the OLED screen. The measurements also reveal a very good illumination.
| |||||||||||||||||||||||||
Brightness Distribution: 98 %
Center on Battery: 392 cd/m²
Contrast: ∞:1 (Black: 0 cd/m²)
ΔE ColorChecker Calman: 1.74 | ∀{0.5-29.43 Ø4.73}
calibrated: 1.85
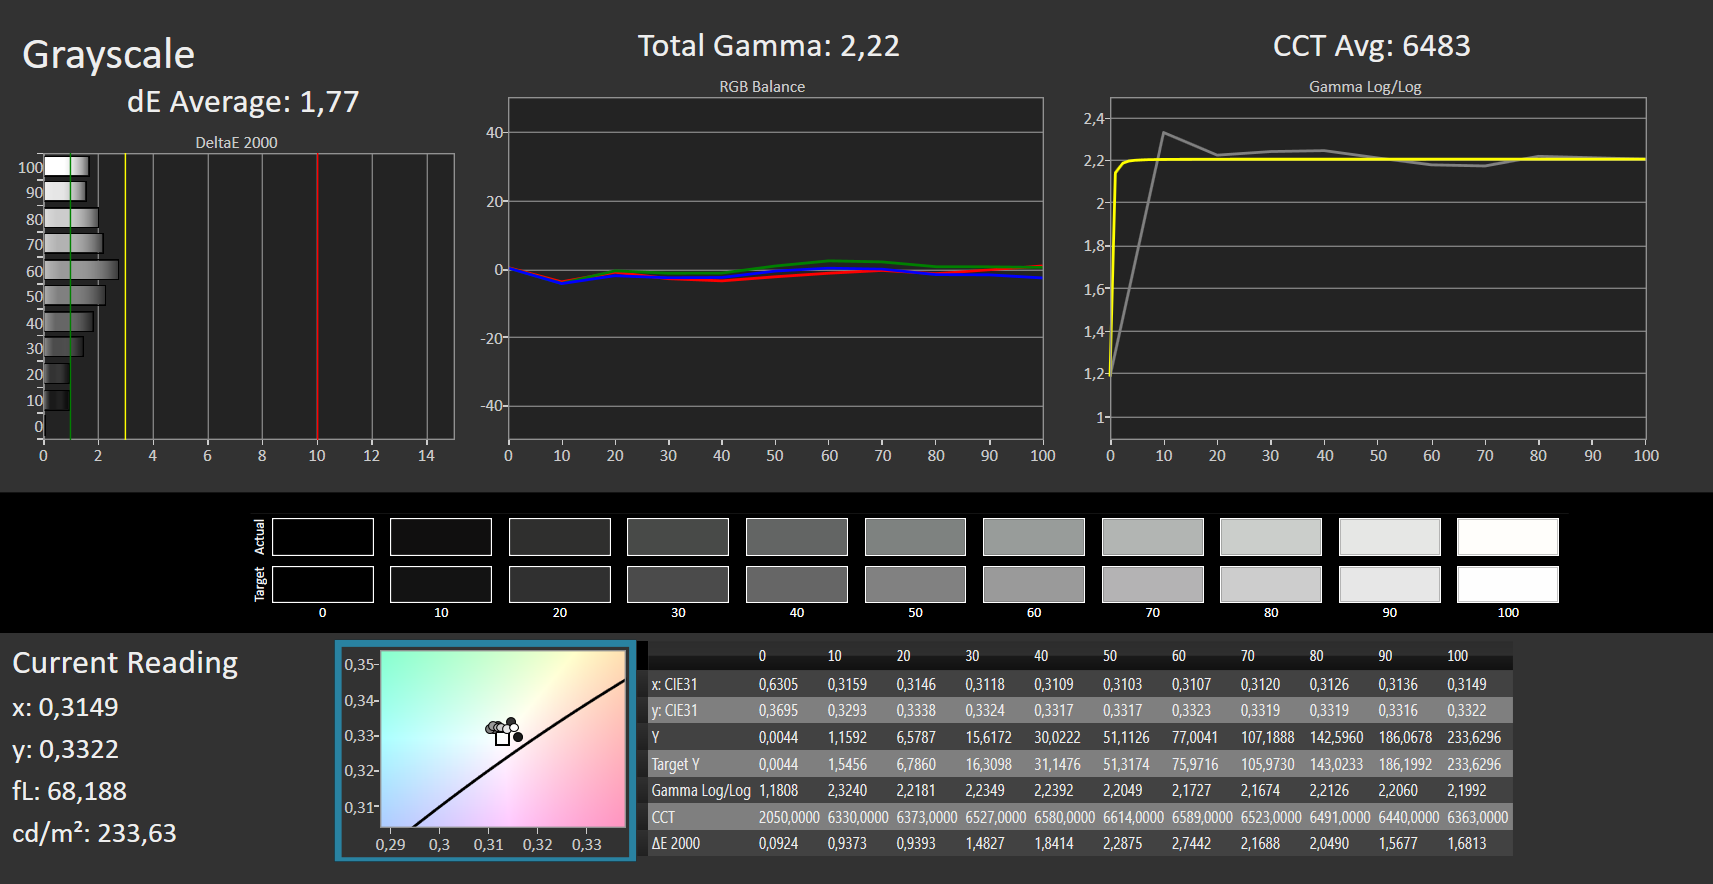
ΔE Greyscale Calman: 1.77 | ∀{0.09-98 Ø4.97}
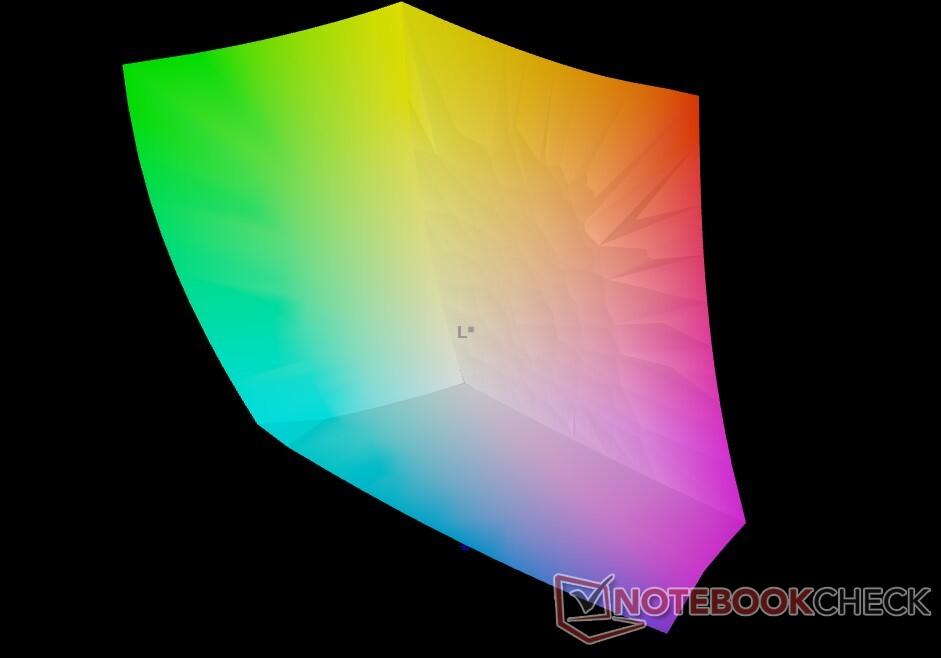
96.9% AdobeRGB 1998 (Argyll 3D)
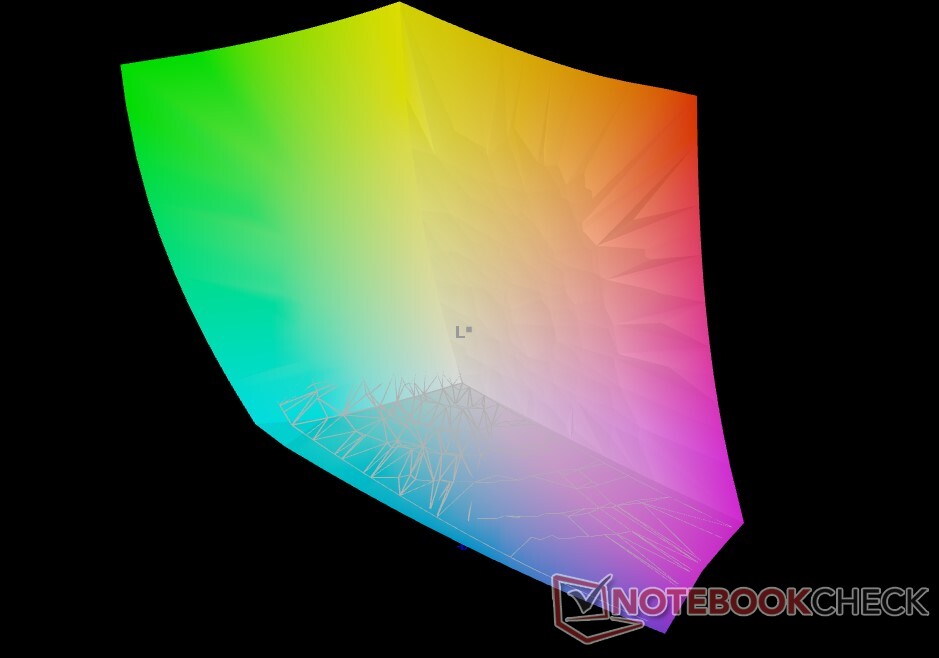
100% sRGB (Argyll 3D)
99.8% Display P3 (Argyll 3D)
Gamma: 2.22
CCT: 6483 K
| Asus Vivobook Pro 16X-M7600QE Samsung ATNA60YV02-0, OLED, 3840x2400, 16.1" | HP ZBook Studio 15 G8 SDC4145, OLED, 3840x2160, 15.6" | Huawei MateBook 16 R7 5800H BOE TV160DKT-NH0, , 2520x1680, 16" | Gigabyte Aero 15 OLED XC SDCA029, OLED, 3840x2160, 15.6" | Lenovo IdeaPad 5 Pro 16IHU6 Lenovo LEN160WQXGA, IPS, 2560x1600, 16" | Dell XPS 15 9510 11800H RTX 3050 Ti OLED SDC414D, OLED, 3456x2160, 15.6" | |
|---|---|---|---|---|---|---|
| Display | -1% | -25% | 1% | -17% | 0% | |
| Display P3 Coverage (%) | 99.8 | 99.9 0% | 63.1 -37% | 99.9 0% | 74 -26% | 99.9 0% |
| sRGB Coverage (%) | 100 | 100 0% | 94.9 -5% | 100 0% | 98.7 -1% | 100 0% |
| AdobeRGB 1998 Coverage (%) | 96.9 | 95.3 -2% | 65.1 -33% | 98.5 2% | 74.5 -23% | 98.1 1% |
| Response Times | -20% | -1590% | -5% | -425% | -60% | |
| Response Time Grey 50% / Grey 80% * (ms) | 2 ? | 2.4 ? -20% | 41.2 ? -1960% | 2.4 ? -20% | 13 ? -550% | 3.6 ? -80% |
| Response Time Black / White * (ms) | 2 ? | 2.4 ? -20% | 26.4 ? -1220% | 1.8 ? 10% | 8 ? -300% | 2.8 ? -40% |
| PWM Frequency (Hz) | 60 ? | 240.4 ? | 240 ? | 59.5 ? | ||
| Screen | -67% | -1% | -26% | -30% | -11% | |
| Brightness middle (cd/m²) | 392 | 379.6 -3% | 357 -9% | 442 13% | 356 -9% | 362 -8% |
| Brightness (cd/m²) | 396 | 380 -4% | 349 -12% | 452 14% | 322 -19% | 367 -7% |
| Brightness Distribution (%) | 98 | 95 -3% | 93 -5% | 95 -3% | 80 -18% | 97 -1% |
| Black Level * (cd/m²) | 0.21 | 0.05 | 0.27 | 0.06 | ||
| Colorchecker dE 2000 * | 1.74 | 5.15 -196% | 1.6 8% | 2.69 -55% | 2.4 -38% | 2.1 -21% |
| Colorchecker dE 2000 max. * | 3.18 | 7.79 -145% | 3.9 -23% | 8.27 -160% | 4.42 -39% | 4.1 -29% |
| Colorchecker dE 2000 calibrated * | 1.85 | 3.1 -68% | 0.6 68% | 2.59 -40% | 2.5 -35% | |
| Greyscale dE 2000 * | 1.77 | 2.6 -47% | 2.4 -36% | 0.9 49% | 2.81 -59% | 1.4 21% |
| Gamma | 2.22 99% | 1.99 111% | 2.14 103% | 2.172 101% | 2.4 92% | 2.18 101% |
| CCT | 6483 100% | 6166 105% | 6728 97% | 6434 101% | 6294 103% | 6608 98% |
| Contrast (:1) | 1700 | 8840 | 1319 | 6033 | ||
| Color Space (Percent of AdobeRGB 1998) (%) | 99 | |||||
| Color Space (Percent of sRGB) (%) | 100 | |||||
| Total Average (Program / Settings) | -29% /
-42% | -539% /
-272% | -10% /
-16% | -157% /
-98% | -24% /
-17% |
* ... smaller is better
The infinite contrast ratio of OLED displays never fails to impress. At the same time, Adobe, P3 and sRGB color spaces are covered by almost 100%. With an average color deviation of only ΔΕ1.74 ex-factory, the display is very well calibrated. The color profile we created can only improve the representation of the grayscale, but the color reproduction deteriorates slightly in the process.


Display Response Times
| ↔ Response Time Black to White | ||
|---|---|---|
| 2 ms ... rise ↗ and fall ↘ combined | ↗ 1 ms rise |  |
| ↘ 1 ms fall | ||
| The screen shows very fast response rates in our tests and should be very well suited for fast-paced gaming. In comparison, all tested devices range from 0.1 (minimum) to 240 (maximum) ms. » 11 % of all devices are better. This means that the measured response time is better than the average of all tested devices (19.9 ms). | ||
| ↔ Response Time 50% Grey to 80% Grey | ||
| 2 ms ... rise ↗ and fall ↘ combined | ↗ 1 ms rise |  |
| ↘ 1 ms fall | ||
| The screen shows very fast response rates in our tests and should be very well suited for fast-paced gaming. In comparison, all tested devices range from 0.165 (minimum) to 636 (maximum) ms. » 9 % of all devices are better. This means that the measured response time is better than the average of all tested devices (31.1 ms). | ||
The flickering found in the test is due to the display technology used. In OLED displays, the image is typically updated line by line. In the process, a narrow area of the image is briefly turned off. Depending on the brightness setting, more or wider stripes also go dark. However, flickering is somewhat easier on the eyes than PWM-controlled backlighting because the entire display does not go dark in the process.
Screen Flickering / PWM (Pulse-Width Modulation)
| Screen flickering / PWM detected | 60 Hz | ≤ 80 % brightness setting |  |
The display backlight flickers at 60 Hz (worst case, e.g., utilizing PWM) Flickering detected at a brightness setting of 80 % and below. There should be no flickering or PWM above this brightness setting. The frequency of 60 Hz is very low, so the flickering may cause eyestrain and headaches after extended use. In comparison: 52 % of all tested devices do not use PWM to dim the display. If PWM was detected, an average of 7810 (minimum: 5 - maximum: 343500) Hz was measured. | |||
Typical for OLED displays, the screen of the Asus Vivobook is easy to read from all directions. However, slight rainbow effects occur at acute viewing angles. The glossy display surface makes outdoor use with the notebook difficult despite the high display brightness. Reflections and refractions make reading the display impossible at the wrong viewing angle.


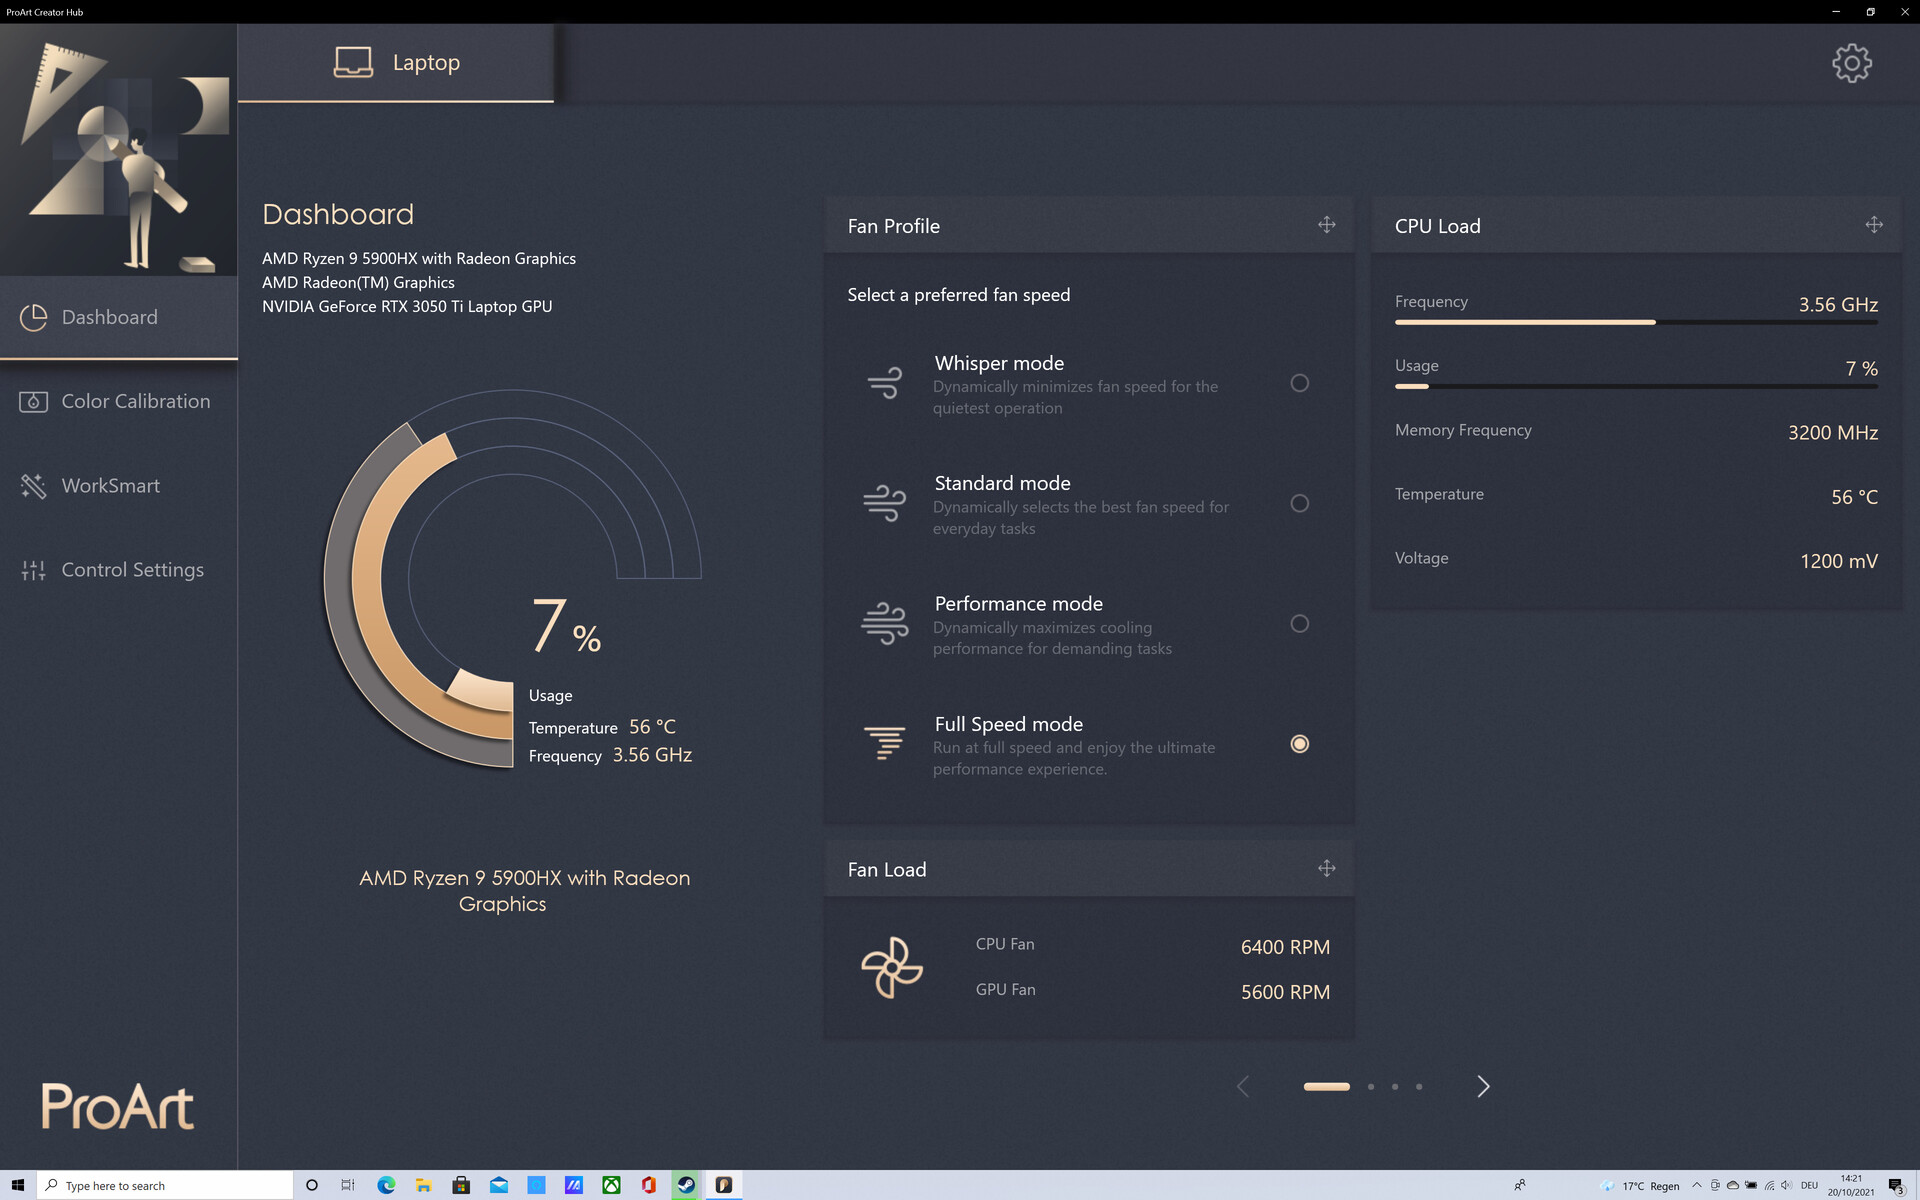
Software - MyAsus keeps asking for registration
Two programs are preinstalled on the Asus Vivobook, which can be used to set settings for various hardware components. In the ProArt Creator Hub, you can primarily adjust the color reproduction, the function of the Asus Dial and the performance control.
The MyAsus app, which can also be accessed via one of the function keys, offers a lot of settings. There, settings for the screen, the speakers, battery, the power control and much more can be set. However, the app always requires a log-in with an Asus account or a link via Facebook or Google. Therefore, we did not use the MyAsus app in the rest of the test.
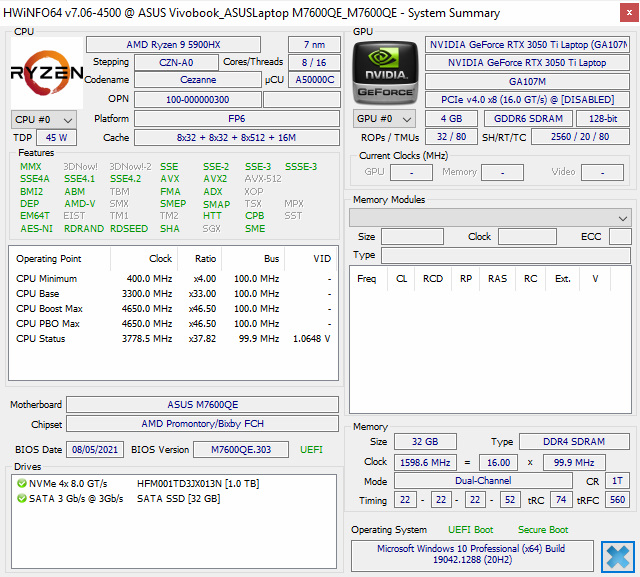
Performance - The Ryzen R9 on 54 watts is convincing
With AMD Ryzen R9-5900HX, 32 GB DDR5 RAM and the Nvidia GeForce RTX 3050 Ti, the motherboard of our test device is well equipped. A 1 TB NVMe SSD is available as main storage. Other configurations with Ryzen R5 and R7 as well as with 8 and 16 GB of working memory are also known, but not yet confirmed.
Test conditions
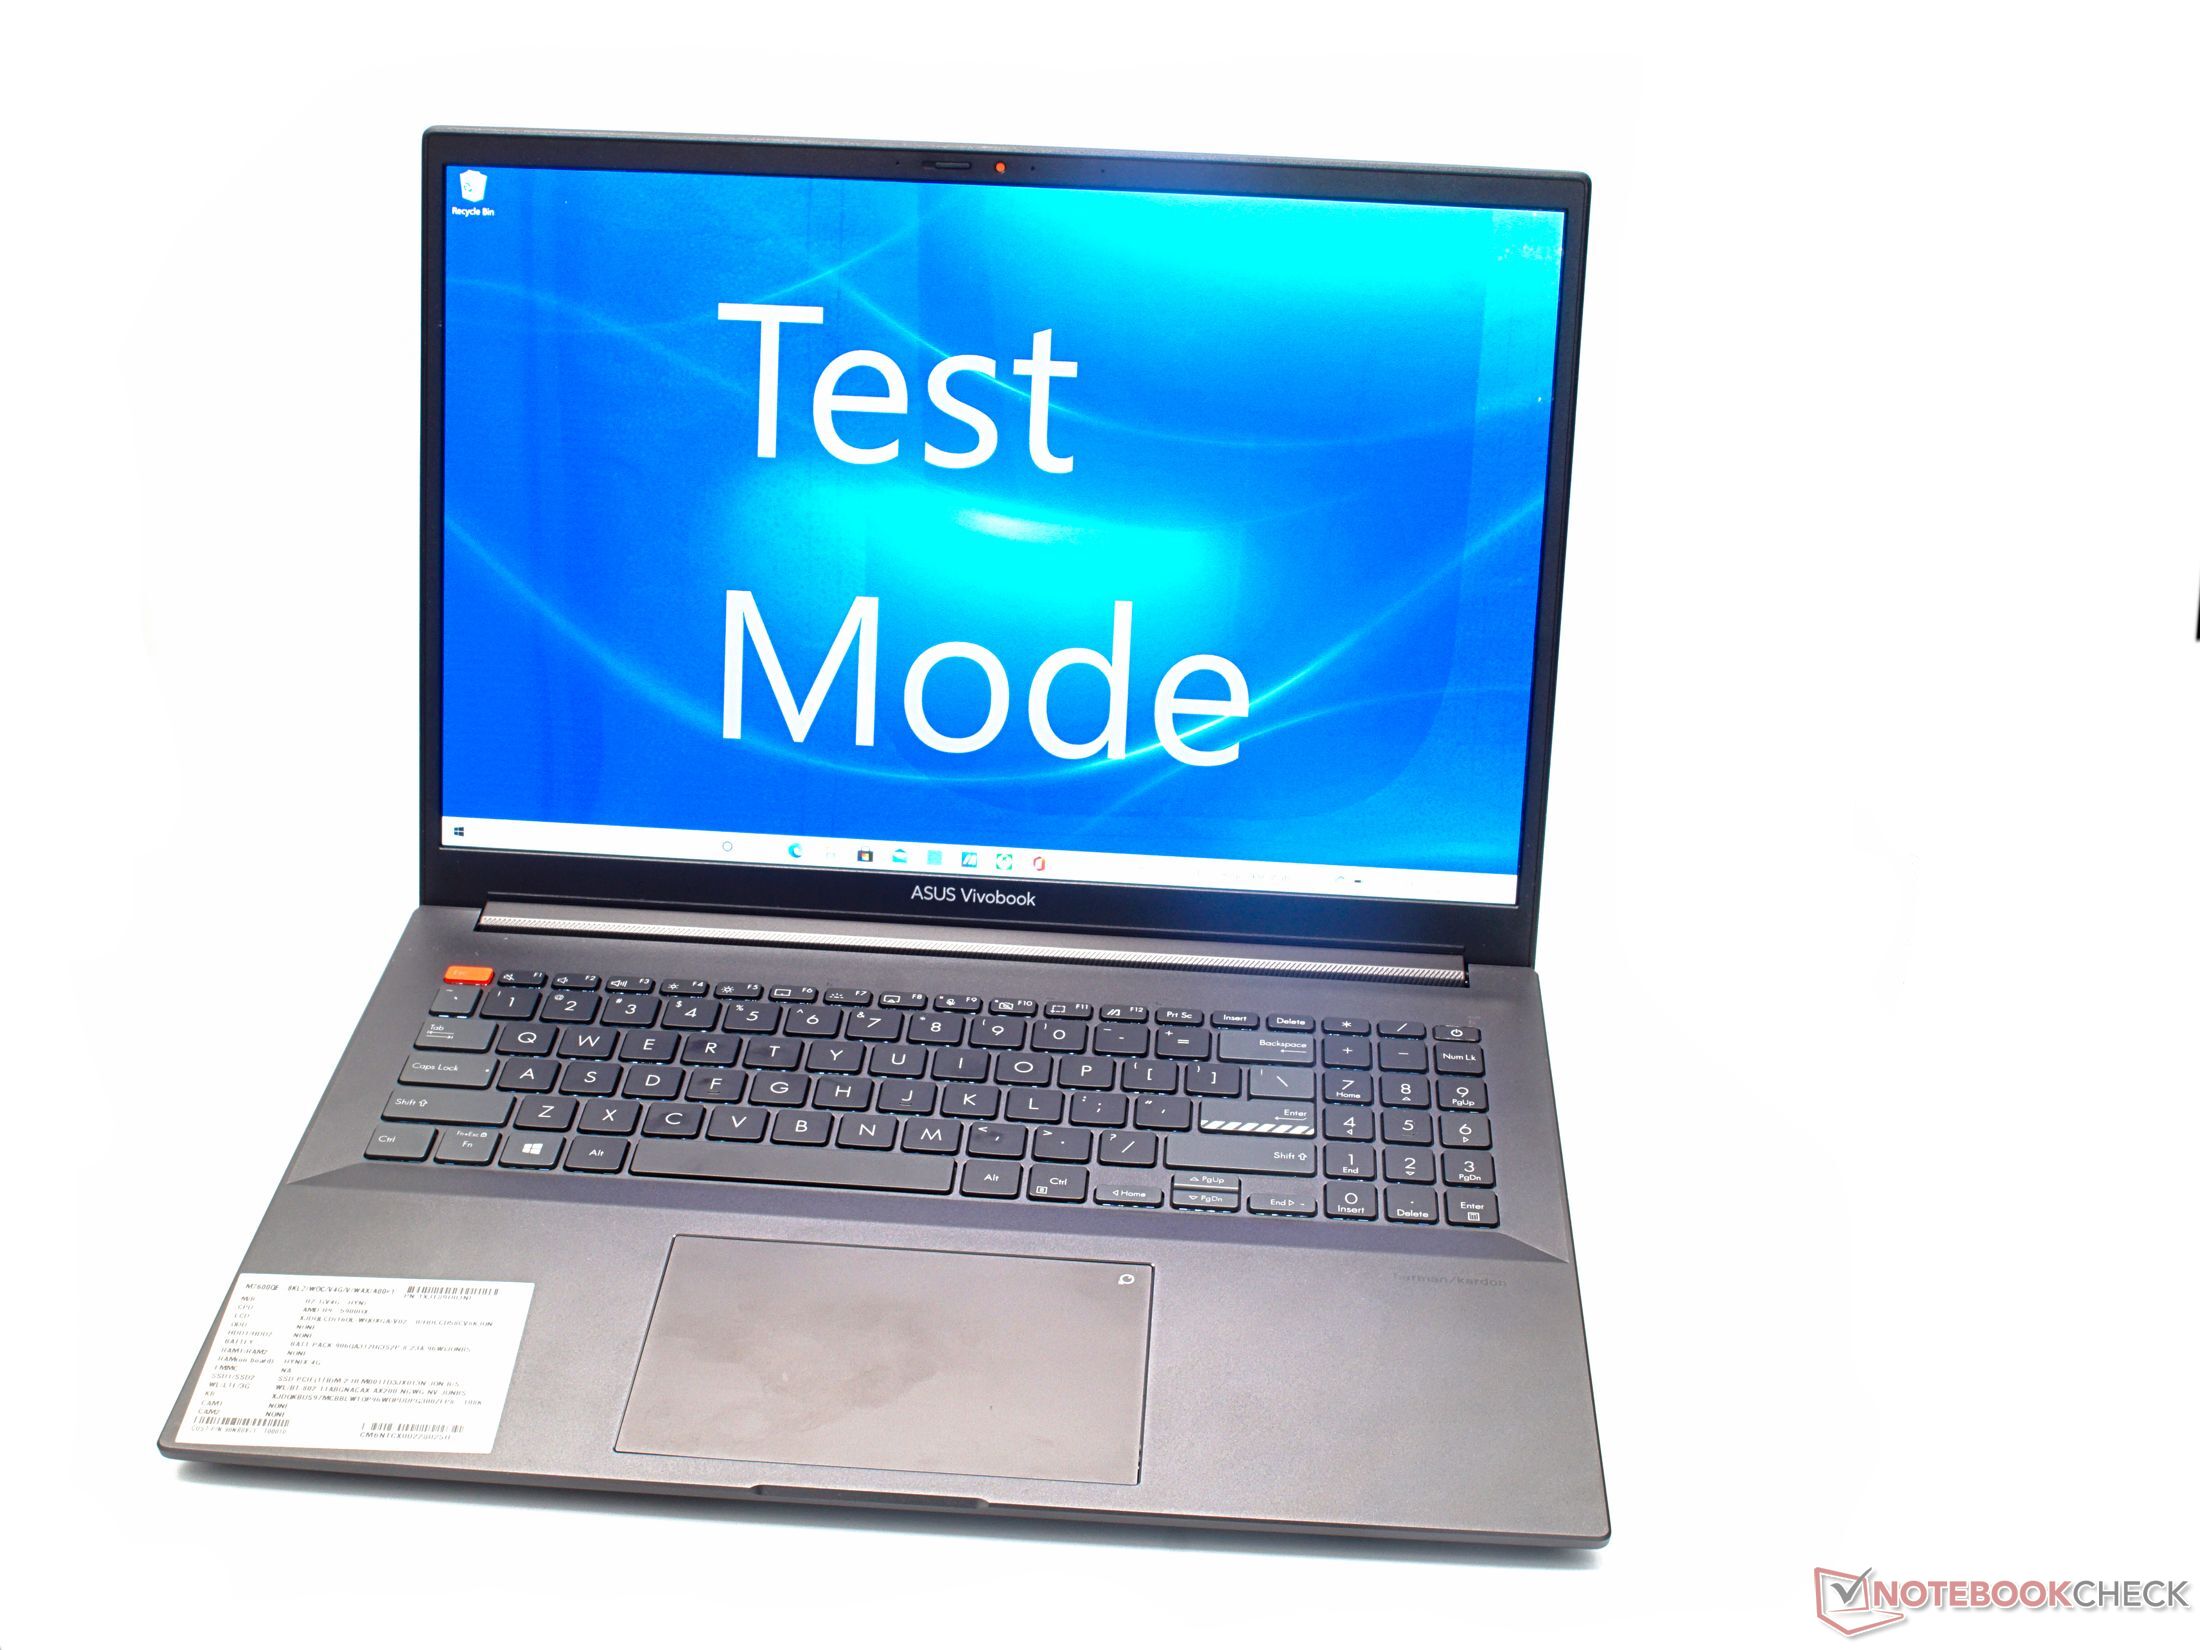
The tested Asus Vivobook Pro is a pre-production model. Not all drivers are fully developed yet. During the test period, individual drivers were updated again and again. Asus only provided a functioning performance control for our test device shortly before the end of the test period via an update of the ProArt Creator Hub. The benchmarks were thus all repeated with the Full Speed Mode
setting.
Thus, 4 different options are available for the performance control. In the selected mode, the fans permanently rotate at full speed. This setting is particularly suitable for stable performance during longer load phases.
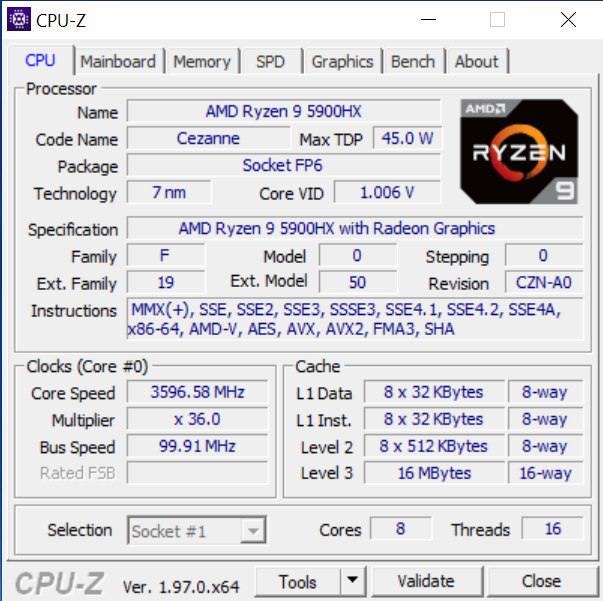


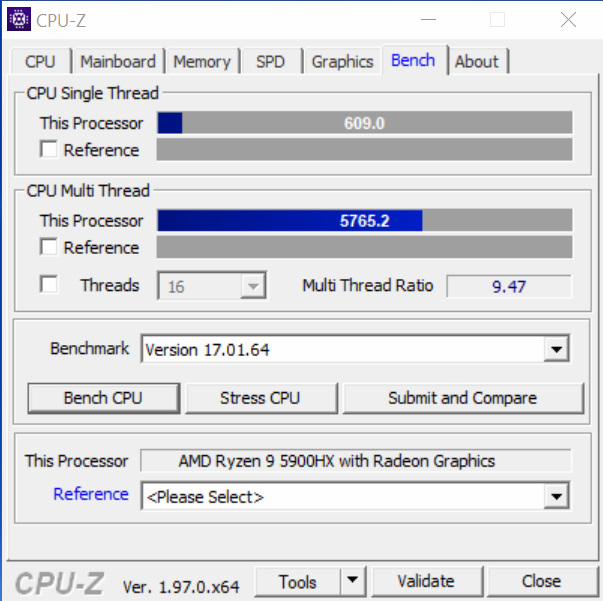
Processor
As one of the most powerful mobile processors currently available, the AMD Ryzen R9-5900HX is especially used in larger laptops. The SoC also features an AMD Radeon on-board graphics chip. Thanks to the sufficiently dimensioned cooling, the eight-core processor can permanently operate with a bit more than 54 watts of power (PL1). Thus, the CineBench loop shows very constant high performances. During short-term loads, the processor clock increases up to 4.3 GHz at 65 watts. The strong R9 clearly passes the rivals in most multi-core processor benchmarks. Only the Huawei MateBook 16 AMD can keep up well despite the weaker AMD Ryzen R7.
However, Intel's Core processors are still clearly ahead of AMD's top cores in the single-core benchmarks.
Cinebench R15 Multi Endurance test
Cinebench R20: CPU (Multi Core) | CPU (Single Core)
Cinebench R15: CPU Multi 64Bit | CPU Single 64Bit
Blender: v2.79 BMW27 CPU
7-Zip 18.03: 7z b 4 | 7z b 4 -mmt1
Geekbench 5.5: Multi-Core | Single-Core
HWBOT x265 Benchmark v2.2: 4k Preset
LibreOffice : 20 Documents To PDF
R Benchmark 2.5: Overall mean
| Cinebench R23 / Multi Core | |
| Average of class Multimedia (4861 - 33362, n=83, last 2 years) | |
| Average AMD Ryzen 9 5900HX (6622 - 14363, n=30) | |
| Asus Vivobook Pro 16X-M7600QE | |
| Asus Vivobook Pro 16X-M7600QE | |
| HP ZBook Studio 15 G8 | |
| Dell XPS 15 9510 11800H RTX 3050 Ti OLED | |
| Huawei MateBook 16 R7 5800H | |
| Gigabyte Aero 15 OLED XC | |
| Lenovo IdeaPad 5 Pro 16IHU6 | |
| Cinebench R23 / Single Core | |
| Average of class Multimedia (1128 - 2459, n=75, last 2 years) | |
| HP ZBook Studio 15 G8 | |
| Dell XPS 15 9510 11800H RTX 3050 Ti OLED | |
| Asus Vivobook Pro 16X-M7600QE | |
| Asus Vivobook Pro 16X-M7600QE | |
| Average AMD Ryzen 9 5900HX (1218 - 1499, n=29) | |
| Lenovo IdeaPad 5 Pro 16IHU6 | |
| Huawei MateBook 16 R7 5800H | |
| Gigabyte Aero 15 OLED XC | |
| Cinebench R20 / CPU (Multi Core) | |
| Average of class Multimedia (1887 - 12912, n=66, last 2 years) | |
| Average AMD Ryzen 9 5900HX (2242 - 5476, n=30) | |
| Asus Vivobook Pro 16X-M7600QE | |
| Asus Vivobook Pro 16X-M7600QE | |
| HP ZBook Studio 15 G8 | |
| Huawei MateBook 16 R7 5800H | |
| Dell XPS 15 9510 11800H RTX 3050 Ti OLED | |
| Gigabyte Aero 15 OLED XC | |
| Lenovo IdeaPad 5 Pro 16IHU6 | |
| Cinebench R20 / CPU (Single Core) | |
| Average of class Multimedia (420 - 853, n=66, last 2 years) | |
| HP ZBook Studio 15 G8 | |
| Dell XPS 15 9510 11800H RTX 3050 Ti OLED | |
| Asus Vivobook Pro 16X-M7600QE | |
| Asus Vivobook Pro 16X-M7600QE | |
| Average AMD Ryzen 9 5900HX (471 - 584, n=29) | |
| Lenovo IdeaPad 5 Pro 16IHU6 | |
| Huawei MateBook 16 R7 5800H | |
| Gigabyte Aero 15 OLED XC | |
| Cinebench R15 / CPU Multi 64Bit | |
| Average of class Multimedia (856 - 5224, n=70, last 2 years) | |
| Asus Vivobook Pro 16X-M7600QE | |
| Asus Vivobook Pro 16X-M7600QE | |
| Average AMD Ryzen 9 5900HX (1076 - 2267, n=29) | |
| Dell XPS 15 9510 11800H RTX 3050 Ti OLED | |
| Dell XPS 15 9510 11800H RTX 3050 Ti OLED | |
| Huawei MateBook 16 R7 5800H | |
| HP ZBook Studio 15 G8 | |
| Gigabyte Aero 15 OLED XC | |
| Lenovo IdeaPad 5 Pro 16IHU6 | |
| Cinebench R15 / CPU Single 64Bit | |
| Average of class Multimedia (184.8 - 326, n=68, last 2 years) | |
| Asus Vivobook Pro 16X-M7600QE | |
| Asus Vivobook Pro 16X-M7600QE | |
| Average AMD Ryzen 9 5900HX (197 - 243, n=25) | |
| HP ZBook Studio 15 G8 | |
| Huawei MateBook 16 R7 5800H | |
| Dell XPS 15 9510 11800H RTX 3050 Ti OLED | |
| Gigabyte Aero 15 OLED XC | |
| Lenovo IdeaPad 5 Pro 16IHU6 | |
| Blender / v2.79 BMW27 CPU | |
| Lenovo IdeaPad 5 Pro 16IHU6 | |
| Gigabyte Aero 15 OLED XC | |
| Dell XPS 15 9510 11800H RTX 3050 Ti OLED | |
| Asus Vivobook Pro 16X-M7600QE | |
| Asus Vivobook Pro 16X-M7600QE | |
| HP ZBook Studio 15 G8 | |
| Huawei MateBook 16 R7 5800H | |
| Average AMD Ryzen 9 5900HX (219 - 442, n=29) | |
| Average of class Multimedia (100 - 557, n=67, last 2 years) | |
| 7-Zip 18.03 / 7z b 4 | |
| Average of class Multimedia (29095 - 130368, n=64, last 2 years) | |
| Asus Vivobook Pro 16X-M7600QE | |
| Asus Vivobook Pro 16X-M7600QE | |
| Average AMD Ryzen 9 5900HX (36011 - 62503, n=29) | |
| Huawei MateBook 16 R7 5800H | |
| HP ZBook Studio 15 G8 | |
| Gigabyte Aero 15 OLED XC | |
| Dell XPS 15 9510 11800H RTX 3050 Ti OLED | |
| Lenovo IdeaPad 5 Pro 16IHU6 | |
| 7-Zip 18.03 / 7z b 4 -mmt1 | |
| Asus Vivobook Pro 16X-M7600QE | |
| Asus Vivobook Pro 16X-M7600QE | |
| Average of class Multimedia (3666 - 7545, n=65, last 2 years) | |
| HP ZBook Studio 15 G8 | |
| Average AMD Ryzen 9 5900HX (4791 - 5905, n=29) | |
| Huawei MateBook 16 R7 5800H | |
| Dell XPS 15 9510 11800H RTX 3050 Ti OLED | |
| Gigabyte Aero 15 OLED XC | |
| Lenovo IdeaPad 5 Pro 16IHU6 | |
| Geekbench 5.5 / Multi-Core | |
| Average of class Multimedia (4652 - 20422, n=64, last 2 years) | |
| Asus Vivobook Pro 16X-M7600QE | |
| Asus Vivobook Pro 16X-M7600QE | |
| Average AMD Ryzen 9 5900HX (5057 - 9294, n=27) | |
| Dell XPS 15 9510 11800H RTX 3050 Ti OLED | |
| Gigabyte Aero 15 OLED XC | |
| Huawei MateBook 16 R7 5800H | |
| HP ZBook Studio 15 G8 | |
| Lenovo IdeaPad 5 Pro 16IHU6 | |
| Geekbench 5.5 / Single-Core | |
| Average of class Multimedia (805 - 2974, n=64, last 2 years) | |
| HP ZBook Studio 15 G8 | |
| Asus Vivobook Pro 16X-M7600QE | |
| Asus Vivobook Pro 16X-M7600QE | |
| Dell XPS 15 9510 11800H RTX 3050 Ti OLED | |
| Average AMD Ryzen 9 5900HX (1271 - 1574, n=27) | |
| Huawei MateBook 16 R7 5800H | |
| Lenovo IdeaPad 5 Pro 16IHU6 | |
| Gigabyte Aero 15 OLED XC | |
| HWBOT x265 Benchmark v2.2 / 4k Preset | |
| Average of class Multimedia (5.26 - 36.1, n=65, last 2 years) | |
| Asus Vivobook Pro 16X-M7600QE | |
| Asus Vivobook Pro 16X-M7600QE | |
| Average AMD Ryzen 9 5900HX (8.26 - 17.1, n=29) | |
| HP ZBook Studio 15 G8 | |
| Huawei MateBook 16 R7 5800H | |
| Dell XPS 15 9510 11800H RTX 3050 Ti OLED | |
| Gigabyte Aero 15 OLED XC | |
| Lenovo IdeaPad 5 Pro 16IHU6 | |
| LibreOffice / 20 Documents To PDF | |
| Gigabyte Aero 15 OLED XC | |
| Average AMD Ryzen 9 5900HX (44.1 - 87.4, n=29) | |
| Asus Vivobook Pro 16X-M7600QE | |
| Asus Vivobook Pro 16X-M7600QE | |
| Lenovo IdeaPad 5 Pro 16IHU6 | |
| Average of class Multimedia (23.9 - 146.7, n=66, last 2 years) | |
| Huawei MateBook 16 R7 5800H | |
| HP ZBook Studio 15 G8 | |
| Dell XPS 15 9510 11800H RTX 3050 Ti OLED | |
| R Benchmark 2.5 / Overall mean | |
| Lenovo IdeaPad 5 Pro 16IHU6 | |
| Gigabyte Aero 15 OLED XC | |
| Dell XPS 15 9510 11800H RTX 3050 Ti OLED | |
| HP ZBook Studio 15 G8 | |
| Huawei MateBook 16 R7 5800H | |
| Average AMD Ryzen 9 5900HX (0.48 - 0.599, n=29) | |
| Asus Vivobook Pro 16X-M7600QE | |
| Asus Vivobook Pro 16X-M7600QE | |
| Average of class Multimedia (0.3604 - 0.947, n=65, last 2 years) | |
* ... smaller is better
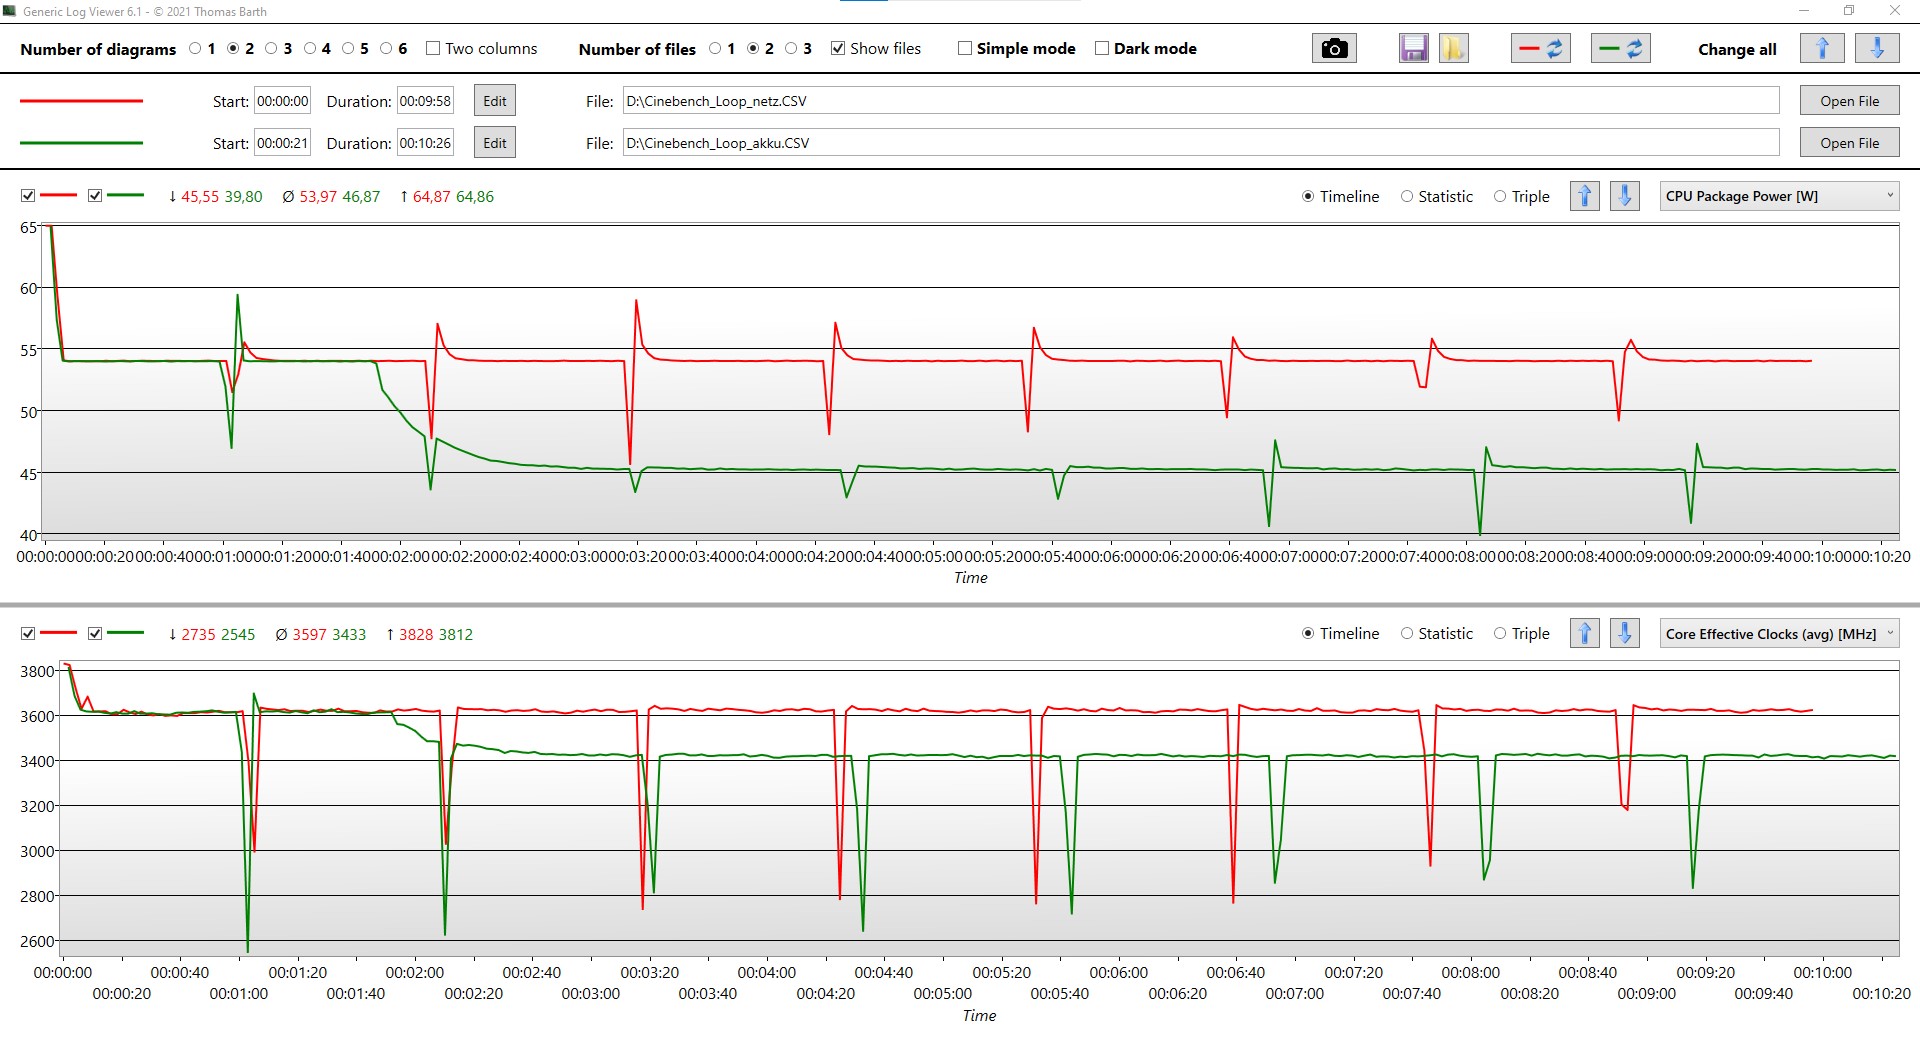
When the laptop is supplied with power from battery, the processor is still allowed to work with about 45 watts. Thus, the processor clock drops from about 3.6 to 3.4 GHz in the 10-minute Cinebench R23 loop.
System performance
The Vivobook Pro is a very fast laptop. In the PCMark 10 benchmark, the computer delivers very high scores. As the second in the comparison field with overall very powerful contenders, Asus' laptop can deliver more than satisfactory results. Our pre-production unit initially had problems with the performance management and some drivers, which made the system seem sluggish, but Asus has meanwhile made considerable improvements with some updates. The laptop runs smoothly and largely without dropouts on the latest version.
| PCMark 10 / Score | |
| Average of class Multimedia (4325 - 10386, n=59, last 2 years) | |
| HP ZBook Studio 15 G8 | |
| Average AMD Ryzen 9 5900HX, NVIDIA GeForce RTX 3050 Ti Laptop GPU (6592 - 6687, n=2) | |
| Asus Vivobook Pro 16X-M7600QE | |
| Gigabyte Aero 15 OLED XC | |
| Huawei MateBook 16 R7 5800H | |
| Dell XPS 15 9510 11800H RTX 3050 Ti OLED | |
| Lenovo IdeaPad 5 Pro 16IHU6 | |
| PCMark 10 / Essentials | |
| Huawei MateBook 16 R7 5800H | |
| Asus Vivobook Pro 16X-M7600QE | |
| Average of class Multimedia (8025 - 11664, n=58, last 2 years) | |
| Average AMD Ryzen 9 5900HX, NVIDIA GeForce RTX 3050 Ti Laptop GPU (10348 - 10491, n=2) | |
| HP ZBook Studio 15 G8 | |
| Dell XPS 15 9510 11800H RTX 3050 Ti OLED | |
| Gigabyte Aero 15 OLED XC | |
| Lenovo IdeaPad 5 Pro 16IHU6 | |
| PCMark 10 / Productivity | |
| Average of class Multimedia (7323 - 18233, n=58, last 2 years) | |
| Huawei MateBook 16 R7 5800H | |
| Asus Vivobook Pro 16X-M7600QE | |
| Average AMD Ryzen 9 5900HX, NVIDIA GeForce RTX 3050 Ti Laptop GPU (9614 - 9665, n=2) | |
| Lenovo IdeaPad 5 Pro 16IHU6 | |
| HP ZBook Studio 15 G8 | |
| Dell XPS 15 9510 11800H RTX 3050 Ti OLED | |
| Gigabyte Aero 15 OLED XC | |
| PCMark 10 / Digital Content Creation | |
| Average of class Multimedia (3651 - 16240, n=58, last 2 years) | |
| HP ZBook Studio 15 G8 | |
| Gigabyte Aero 15 OLED XC | |
| Average AMD Ryzen 9 5900HX, NVIDIA GeForce RTX 3050 Ti Laptop GPU (7667 - 8158, n=2) | |
| Asus Vivobook Pro 16X-M7600QE | |
| Dell XPS 15 9510 11800H RTX 3050 Ti OLED | |
| Huawei MateBook 16 R7 5800H | |
| Lenovo IdeaPad 5 Pro 16IHU6 | |
| PCMark 10 Score | 6592 points | |
Help | ||
DPC latencies
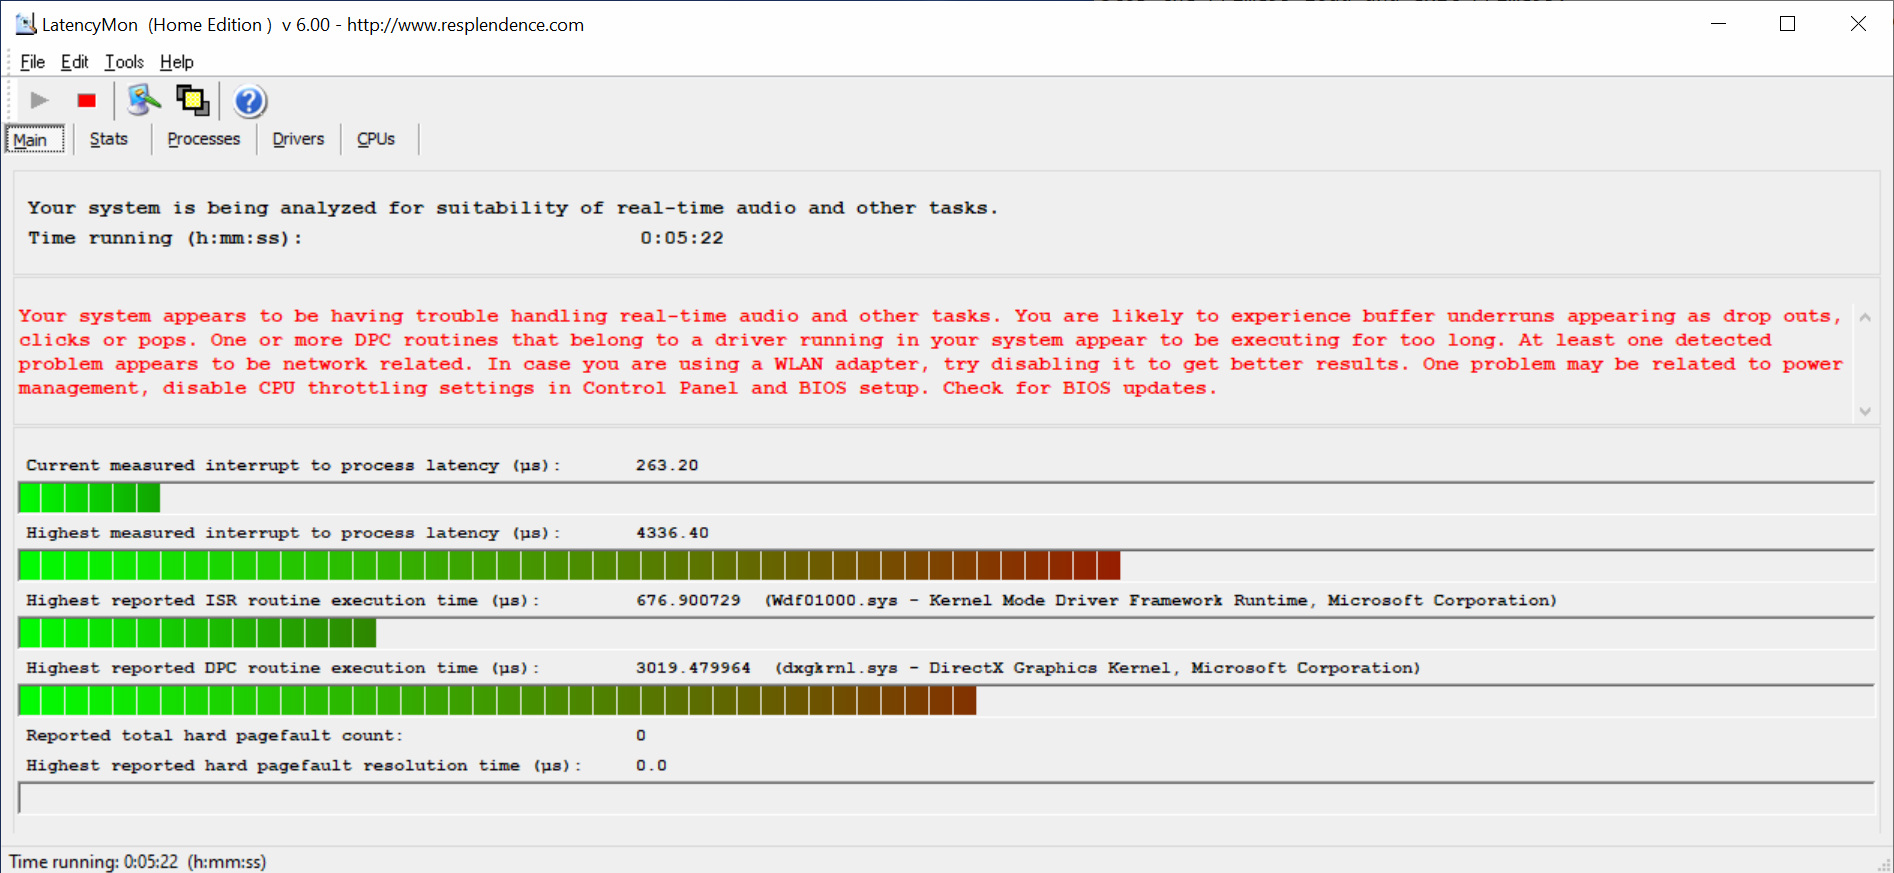
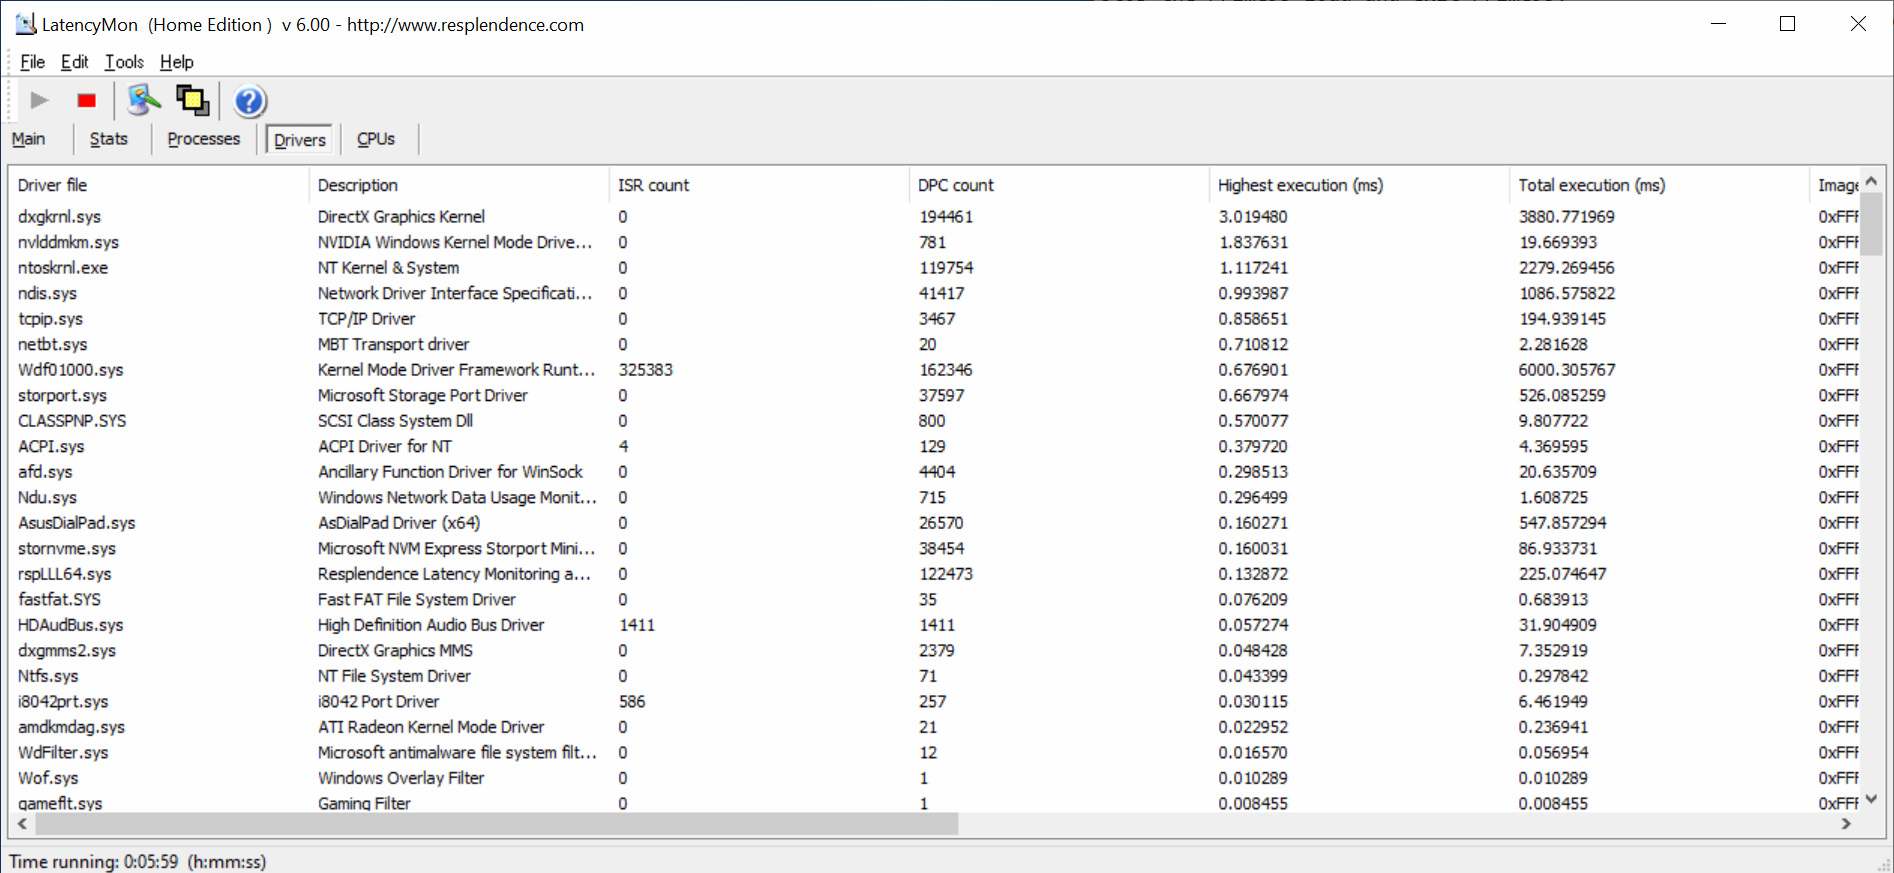
In the test with LatencyMon, there were brief problems with the interaction of different drivers. Even with the latest updates from Asus, not all problems have been solved yet. Very high short-term fluctuations in the observed latencies are the result.
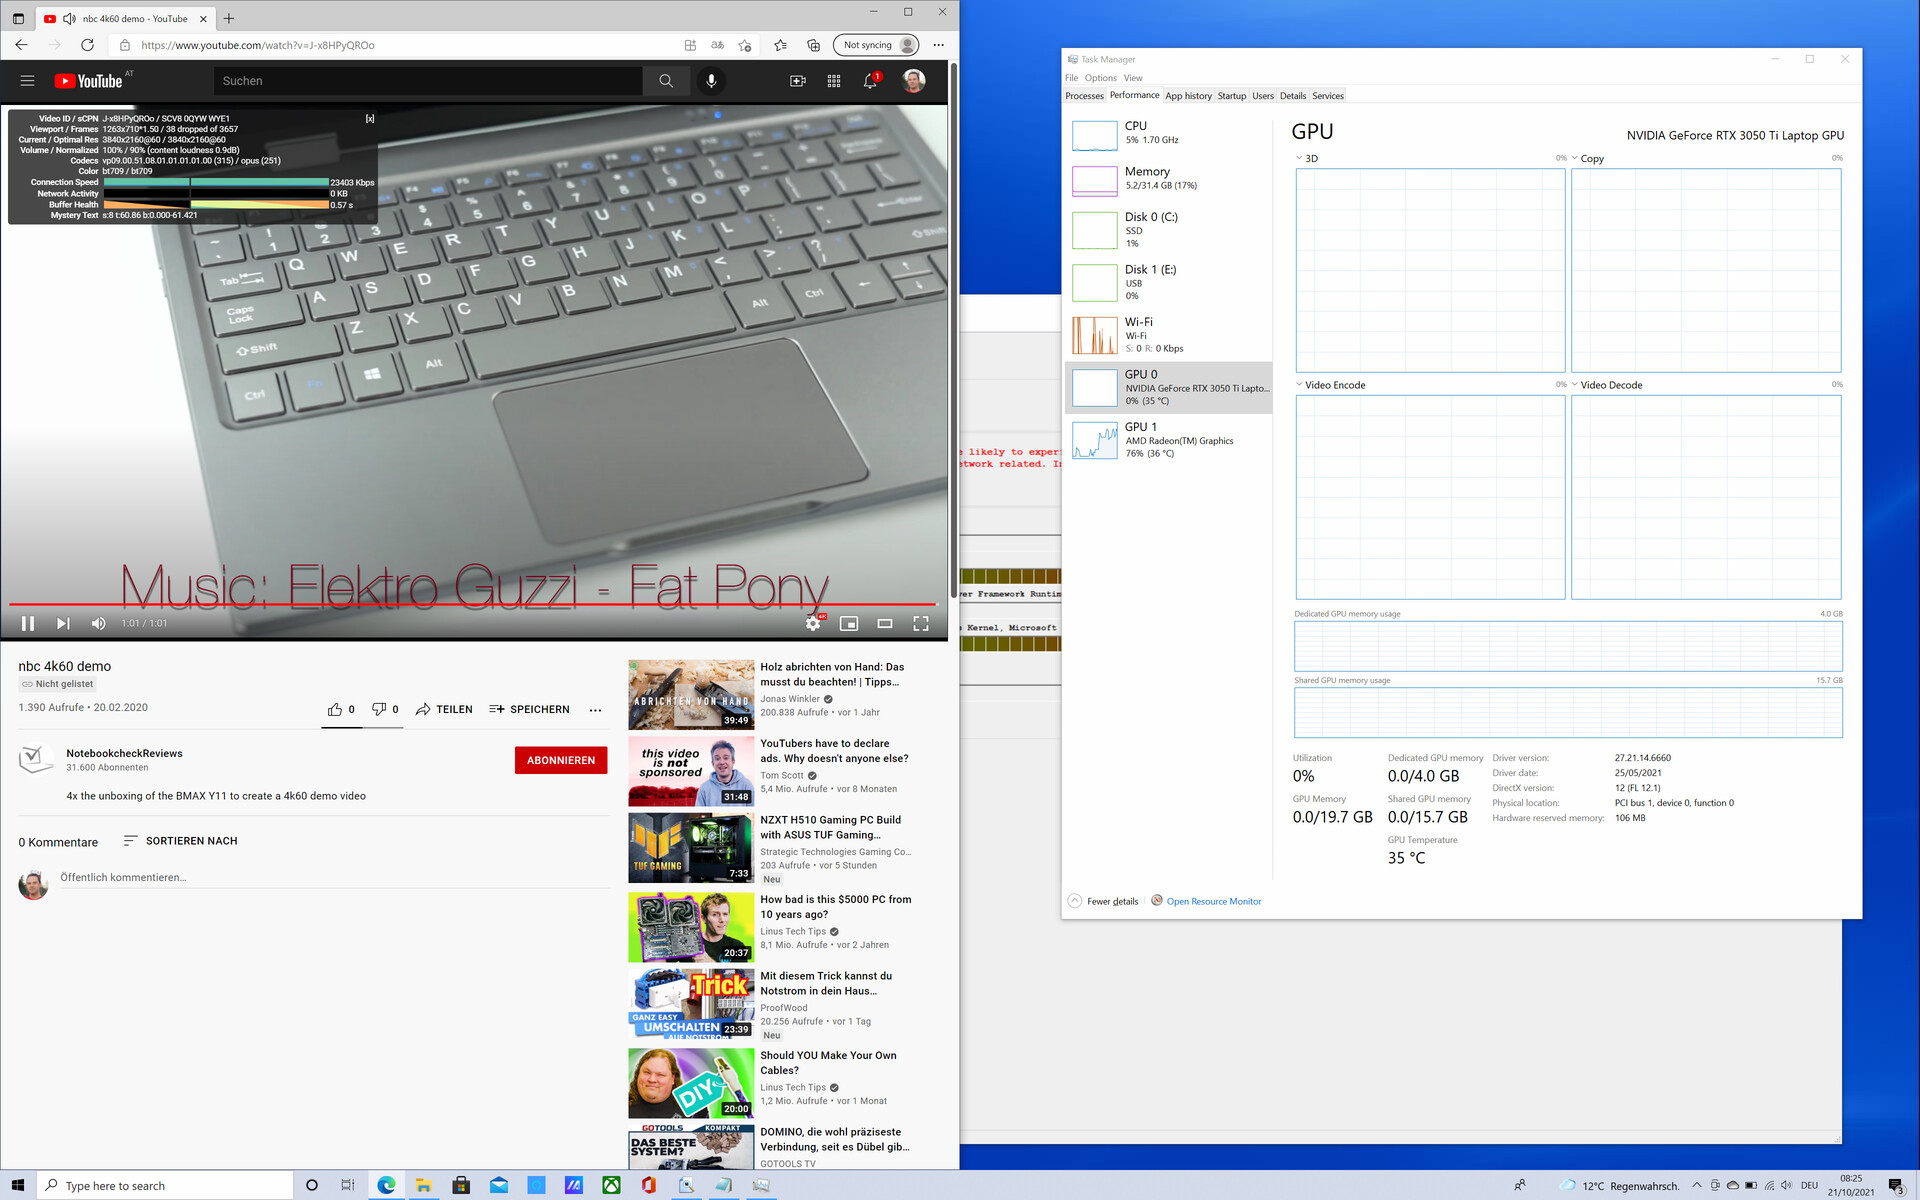
Such a jerk occurred during the playback of the 4k60 YouTube test video. The result was 35 skipped frames in one piece. A picture that stands still for a bit more than half a second is clearly noticeable.
| DPC Latencies / LatencyMon - interrupt to process latency (max), Web, Youtube, Prime95 | |
| Asus Vivobook Pro 16X-M7600QE | |
| Gigabyte Aero 15 OLED XC | |
| Dell XPS 15 9510 11800H RTX 3050 Ti OLED | |
| HP ZBook Studio 15 G8 | |
| Lenovo IdeaPad 5 Pro 16IHU6 | |
| Huawei MateBook 16 R7 5800H | |
* ... smaller is better
Mass storage
Even though the measurement results of AS SSD and CrystalDiskMark 6.0 are a bit apart, SK Hynix's M.2 NVMe SSD is very fast when transferring larger files. The rest of the scores in access times and transfer of smaller files are in the mediocre of the laptops in the comparison. With one TB of storage, there is enough space for smaller video projects.
| Asus Vivobook Pro 16X-M7600QE SK Hynix HFM001TD3JX013N | HP ZBook Studio 15 G8 Samsung PM981a MZVLB2T0HALB | Huawei MateBook 16 R7 5800H Lite-On CA5-8D512 | Gigabyte Aero 15 OLED XC WDC PC SN730 SDBPNTY-1T00 | Lenovo IdeaPad 5 Pro 16IHU6 Samsung SSD PM981a MZVLB512HBJQ | Dell XPS 15 9510 11800H RTX 3050 Ti OLED Micron 2300 512GB MTFDHBA512TDV | Average SK Hynix HFM001TD3JX013N | |
|---|---|---|---|---|---|---|---|
| CrystalDiskMark 5.2 / 6 | -3% | 15% | 1% | 26% | -2% | 9% | |
| Write 4K (MB/s) | 129.9 | 110.5 -15% | 129.3 0% | 126 -3% | 203 56% | 109.3 -16% | 155.8 ? 20% |
| Read 4K (MB/s) | 47.02 | 51.8 10% | 54.3 15% | 44.94 -4% | 52.3 11% | 53.9 15% | 57 ? 21% |
| Write Seq (MB/s) | 2071 | 2763 | 2138 | 1991 | 3943 ? | ||
| Read Seq (MB/s) | 2505 | 1671 | 1974 | 1759 | 2180 ? | ||
| Write 4K Q32T1 (MB/s) | 510 | 429.8 -16% | 446.6 -12% | 451.6 -11% | 640 25% | 499.8 -2% | 452 ? -11% |
| Read 4K Q32T1 (MB/s) | 442 | 418.3 -5% | 564 28% | 552 25% | 707 60% | 438.8 -1% | 447 ? 1% |
| Write Seq Q32T1 (MB/s) | 2784 | 3060 10% | 2210 -21% | 3060 10% | 2973 7% | 2835 2% | 2859 ? 3% |
| Read Seq Q32T1 (MB/s) | 3601 | 3539 -2% | 3418 -5% | 3192 -11% | 3559 -1% | 3235 -10% | 3515 ? -2% |
| Write 4K Q8T8 (MB/s) | 527 | 1254 138% | 791 ? 50% | ||||
| Read 4K Q8T8 (MB/s) | 1776 | 1388 -22% | 1649 ? -7% | ||||
| AS SSD | 13% | -2% | 7% | 17% | -21% | 9% | |
| Seq Read (MB/s) | 2913 | 2953 1% | 2955 1% | 2331 -20% | 2541 -13% | 1362 -53% | 2839 ? -3% |
| Seq Write (MB/s) | 1806 | 1691 -6% | 2080 15% | 2312 28% | 2555 41% | 1440 -20% | 1917 ? 6% |
| 4K Read (MB/s) | 47.67 | 43.98 -8% | 51.1 7% | 39.13 -18% | 56 17% | 38.43 -19% | 53 ? 11% |
| 4K Write (MB/s) | 101.5 | 105.4 4% | 127.5 26% | 98.1 -3% | 129.6 28% | 121.4 20% | 127.3 ? 25% |
| 4K-64 Read (MB/s) | 1382 | 1065 -23% | 1321 -4% | 1663 20% | 1633 18% | 370.5 -73% | 1369 ? -1% |
| 4K-64 Write (MB/s) | 2164 | 1957 -10% | 1103 -49% | 2138 -1% | 1863 -14% | 1054 -51% | 1939 ? -10% |
| Access Time Read * (ms) | 0.044 | 0.04 9% | 0.034 23% | 0.099 -125% | 0.077 -75% | 0.042 5% | 0.0468 ? -6% |
| Access Time Write * (ms) | 0.109 | 0.105 4% | 0.031 72% | 0.038 65% | 0.029 73% | 0.135 -24% | 0.0532 ? 51% |
| Score Read (Points) | 1720 | 1404 -18% | 1668 -3% | 1935 13% | 1944 13% | 545 -68% | 1706 ? -1% |
| Score Write (Points) | 2446 | 2232 -9% | 1439 -41% | 2468 1% | 2248 -8% | 1319 -46% | 2258 ? -8% |
| Score Total (Points) | 4995 | 4297 -14% | 3922 -21% | 5388 8% | 5192 4% | 2160 -57% | 4797 ? -4% |
| Copy ISO MB/s (MB/s) | 2649 | 2474 -7% | 1480 -44% | 2903 10% | 2246 -15% | 1406 -47% | 1908 ? -28% |
| Copy Program MB/s (MB/s) | 372.8 | 1074 188% | 377.6 1% | 686 84% | 861 131% | 844 126% | 665 ? 78% |
| Copy Game MB/s (MB/s) | 1126 | 1929 71% | 1045 -7% | 1594 42% | 1552 38% | 1353 20% | 1349 ? 20% |
| Total Average (Program / Settings) | 5% /
8% | 7% /
4% | 4% /
6% | 22% /
20% | -12% /
-15% | 9% /
9% |
* ... smaller is better

Continuous load read: DiskSpd Read Loop, Queue Depth 8
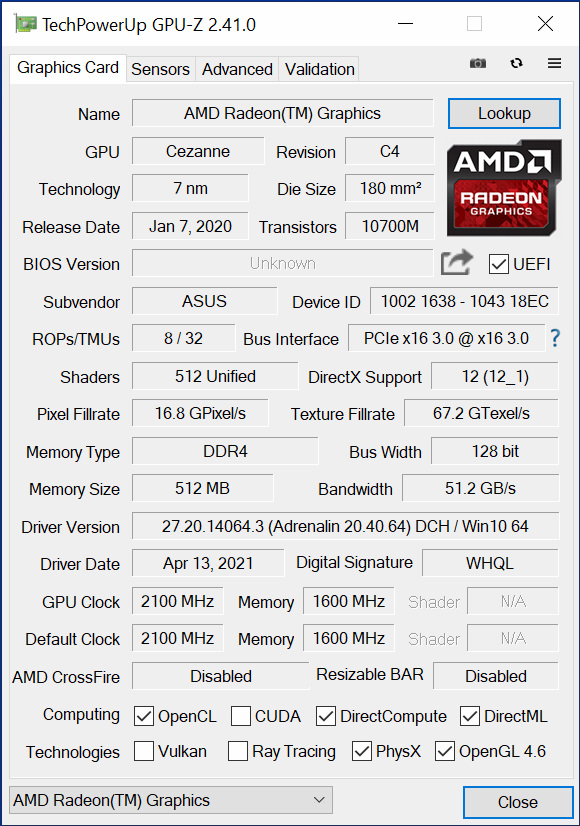
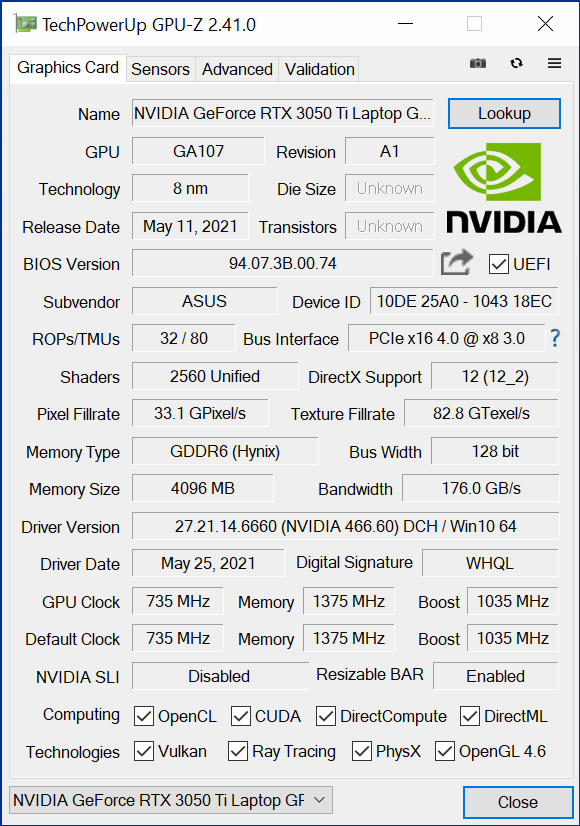
Graphics card
The Asus Vivobook Pro is equipped with an Nvidia GeForce RTX 3050 Ti as the dGPU. The 3050 Ti is powerful enough to play current games at high detail levels in Full HD resolution. However, the second smallest graphics card from Nvidia's RTX 3000 series reaches its limits at higher resolutions. Nvidia allows configuring the maximum power consumption between 35 and 80 watts for the 3050 Ti. In the Asus Vivobook Pro, the graphics card operates with a maximum of 50 watts.
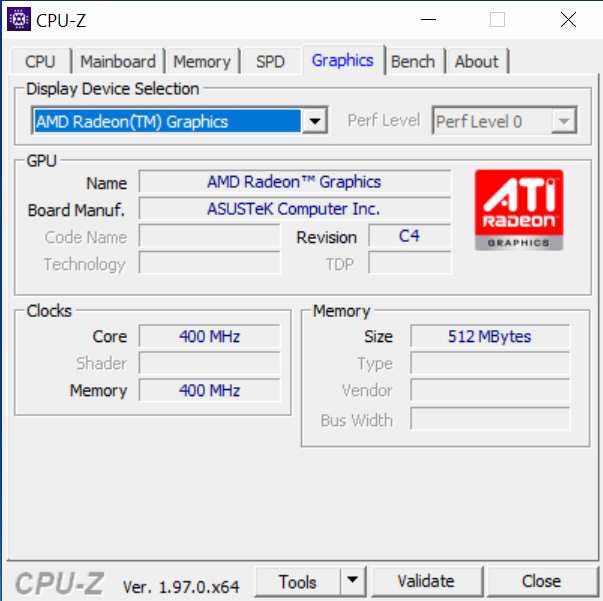
To improve energy efficiency, a smaller AMD Radeon graphics supports on the R9 APU. It reliably processes smaller tasks. Only when higher demands are placed on the graphics in games or applications does the Nvidia graphics chip seamlessly switch on.
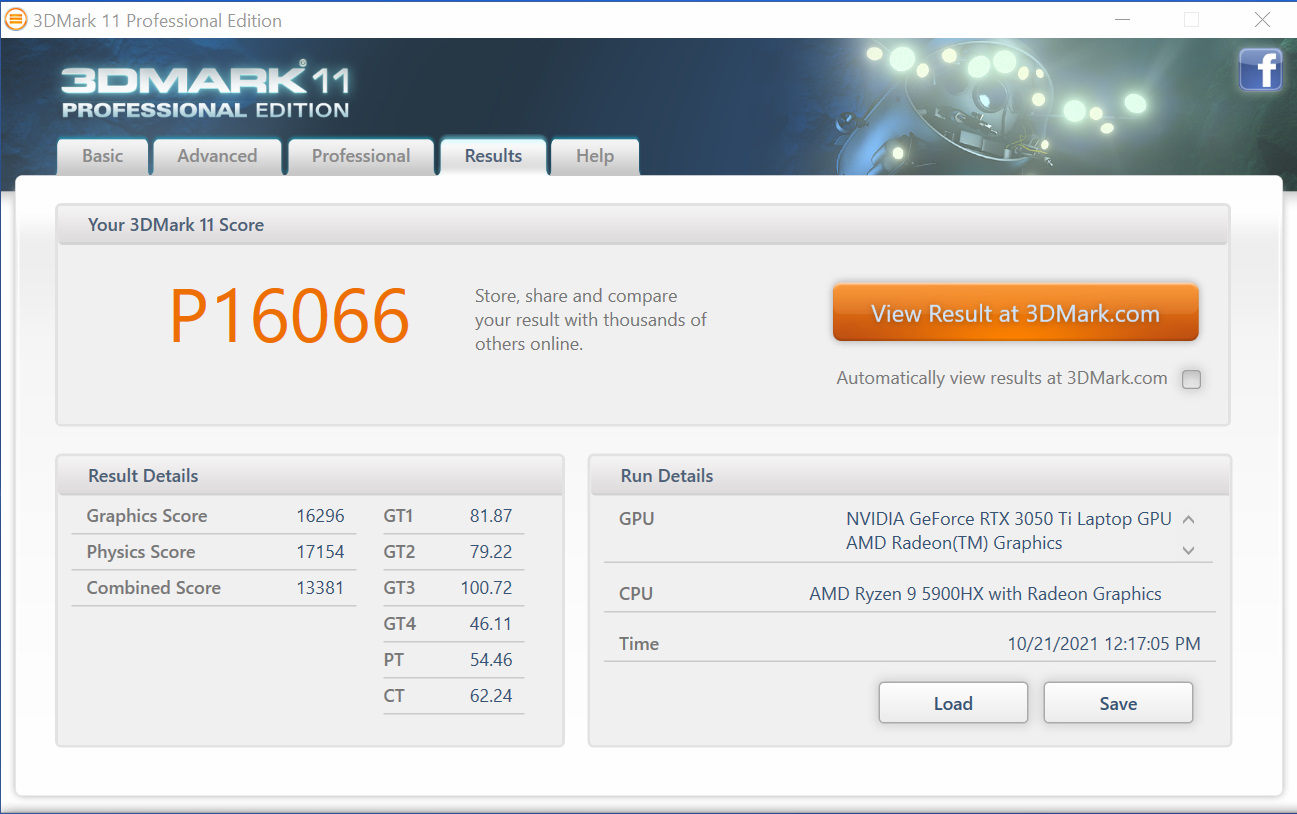
The results of the benchmarks with 3DMark and 3DMark11 show the maximum performance chosen by Asus very well. The graphics card in the Asus computer operates slightly faster than the 3050 Ti in the Dell XPS 15 but is below the average of the 3050's in our Benchmark table.
| 3DMark 11 Performance | 16066 points | |
| 3DMark Ice Storm Standard Score | 41830 points | |
| 3DMark Cloud Gate Standard Score | 30802 points | |
| 3DMark Fire Strike Score | 9720 points | |
| 3DMark Fire Strike Extreme Score | 5016 points | |
| 3DMark Time Spy Score | 5126 points | |
Help | ||
The graphics performance also drops on battery power, but not as significantly as in some other laptops. With almost eleven thousand points in 3DMark 11, the laptop retains more than 60% of the performance with an external power source.

Gaming performance
The Asus Vivobook Pro shows the performance readiness of an entry-level gaming laptop in the gaming benchmarks. Games in Full HD are no obstacle for the notebook even with current titles and high detail levels. However, as soon as you want to use the full resolution of the OLED panel, the multimedia notebook reaches its limits in current titles.
| F1 2021 | |
| 1920x1080 Medium Preset AA:T AF:16x | |
| Asus Vivobook Pro 16X-M7600QE | |
| Average NVIDIA GeForce RTX 3050 Ti Laptop GPU (72 - 150, n=11) | |
| Dell XPS 15 9510 11800H RTX 3050 Ti OLED | |
| Lenovo IdeaPad 5 Pro 16IHU6 | |
| Huawei MateBook 16 R7 5800H | |
| 1920x1080 High Preset AA:T AF:16x | |
| Dell XPS 15 9510 11800H RTX 3050 Ti OLED | |
| Asus Vivobook Pro 16X-M7600QE | |
| Average NVIDIA GeForce RTX 3050 Ti Laptop GPU (68 - 131, n=11) | |
| Lenovo IdeaPad 5 Pro 16IHU6 | |
| Huawei MateBook 16 R7 5800H | |
| 1920x1080 Ultra High Preset + Raytracing AA:T AF:16x | |
| Average NVIDIA GeForce RTX 3050 Ti Laptop GPU (44.4 - 69, n=11) | |
| Dell XPS 15 9510 11800H RTX 3050 Ti OLED | |
| Asus Vivobook Pro 16X-M7600QE | |
| Huawei MateBook 16 R7 5800H | |
| 2560x1440 Ultra High Preset + Raytracing AA:T AF:16x | |
| Average NVIDIA GeForce RTX 3050 Ti Laptop GPU (30.9 - 43.1, n=5) | |
| Dell XPS 15 9510 11800H RTX 3050 Ti OLED | |
| Asus Vivobook Pro 16X-M7600QE | |
| low | med. | high | ultra | QHD | 4K | |
|---|---|---|---|---|---|---|
| GTA V (2015) | 179 | 63.9 | ||||
| The Witcher 3 (2015) | 191 | 151 | 70 | 48 | ||
| Dota 2 Reborn (2015) | 158 | 146 | 131 | 126 | 54.4 | |
| Final Fantasy XV Benchmark (2018) | 106 | 58.8 | 43 | 30.9 | 16.6 | |
| X-Plane 11.11 (2018) | 107 | 91.5 | 75.5 | 53.6 | ||
| Far Cry 5 (2018) | 105 | 71 | 65 | 62 | 50 | 21 |
| Strange Brigade (2018) | 213 | 118 | 95.2 | 81.9 | 57.7 | 33.5 |
| Dirt 5 (2020) | 121 | 62.6 | 51.2 | 40.5 | 33.8 | |
| F1 2021 (2021) | 225 | 131 | 105 | 52.3 | 37 | 14.4 |
Emissions - Unfortunately smart fan
Noise emissions
Although the fans are not particularly loud with a maximum of 45 dB(A), they are annoying due to their frequency distribution. The high tones at 6.3 kHz and upwards are unusually loud in the laptop. In the long run, the Asus Vivobook Pro can be perceived as unpleasantly loud when a lot of performance is demanded. Disturbingly, at almost every fan level, the mid and upper trebles make up the majority of audible noise.
However, the fans can be effectively controlled via the ProArt Creator Hub. The laptop is quieter in Whisper mode
. However, the system performance is limited considerably.
Noise level
| Idle |
| 27 / 27 / 27.5 dB(A) |
| Load |
| 41.7 / 45.3 dB(A) |
 | ||
30 dB silent 40 dB(A) audible 50 dB(A) loud |
||
min: | ||
Temperature
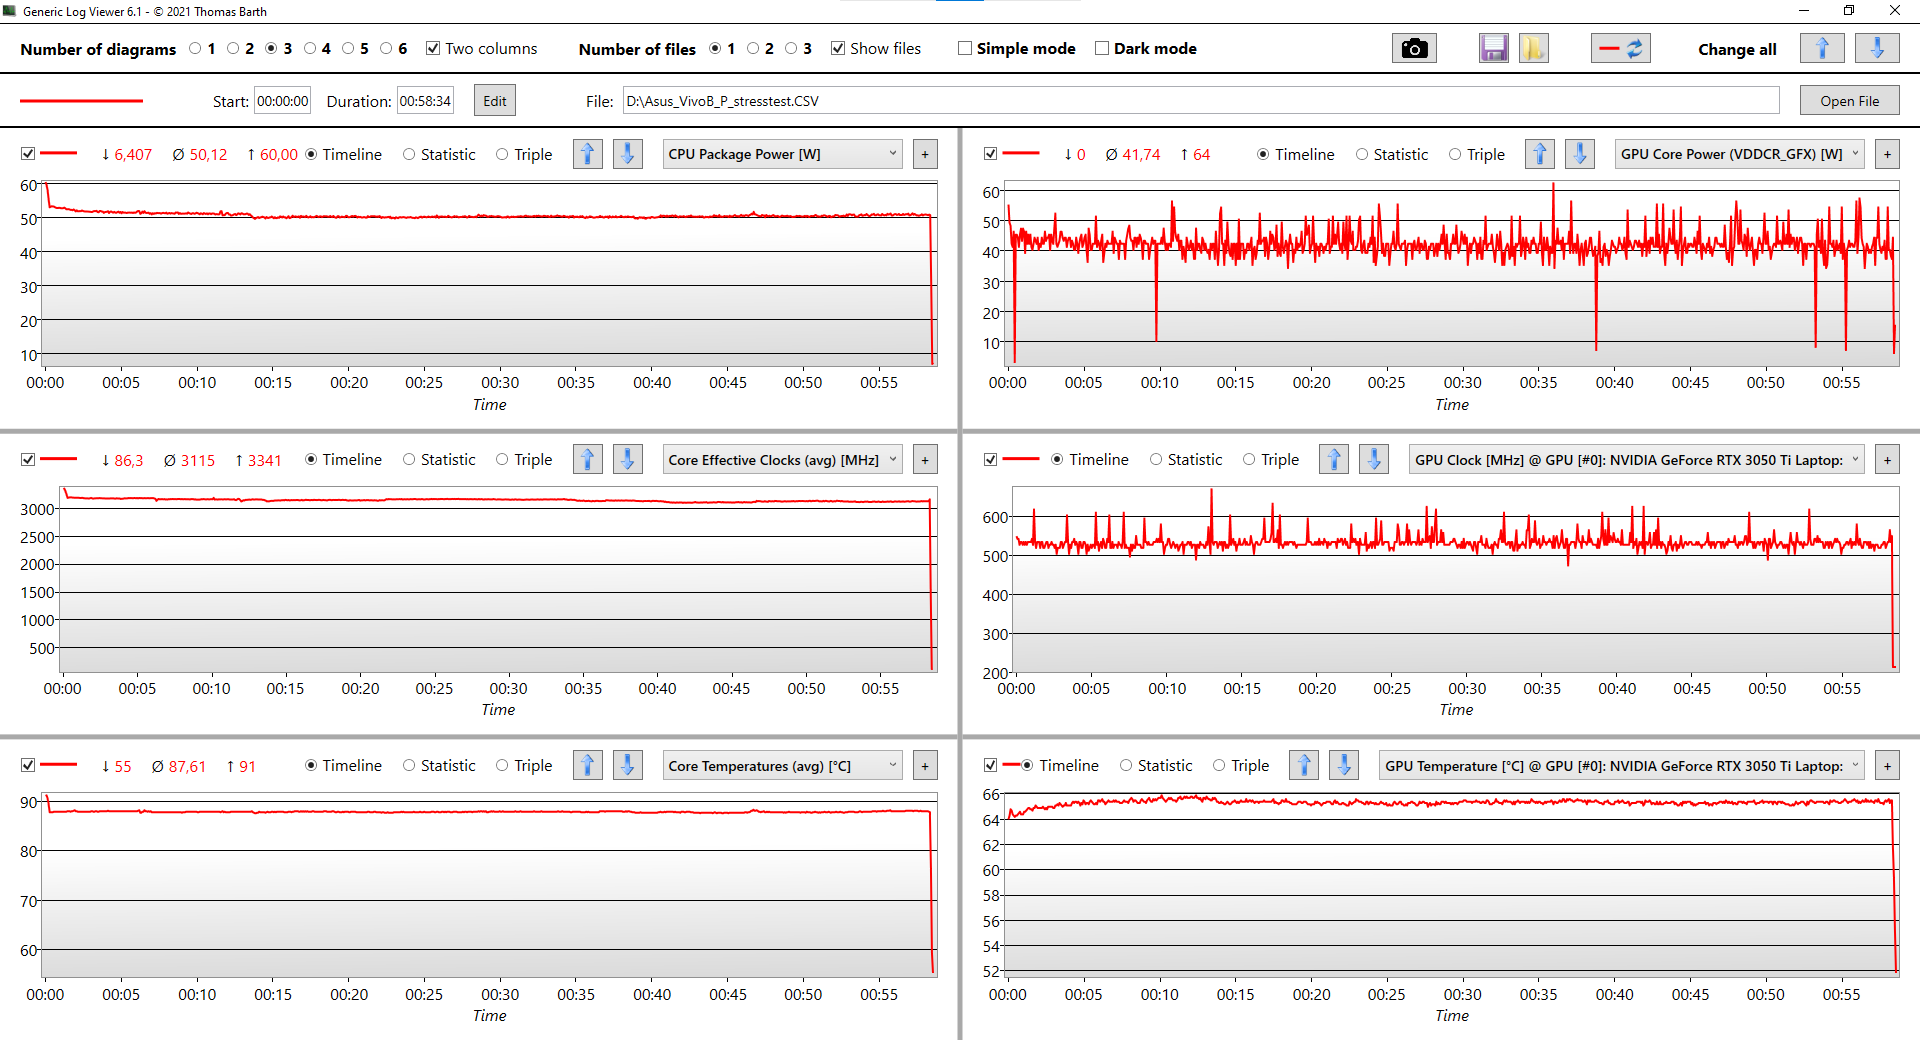
The surface temperatures of the Asus Vivobook Pro normally stay pleasantly cool to tolerably warm. The palm rests in particular always stay within a comfortable temperature range. In the stress test with FurMark and Prime95, the multimedia laptop consistently delivered high performance. With an average of 87 °C (~189 °F), the R9 processor was still a good distance away from the danger of thermal throttling.
(+) The maximum temperature on the upper side is 39.4 °C / 103 F, compared to the average of 36.8 °C / 98 F, ranging from 21 to 71 °C for the class Multimedia.
(±) The bottom heats up to a maximum of 43.6 °C / 110 F, compared to the average of 39.1 °C / 102 F
(+) In idle usage, the average temperature for the upper side is 25.6 °C / 78 F, compared to the device average of 31.3 °C / 88 F.
(+) The palmrests and touchpad are cooler than skin temperature with a maximum of 27.7 °C / 81.9 F and are therefore cool to the touch.
(±) The average temperature of the palmrest area of similar devices was 28.7 °C / 83.7 F (+1 °C / 1.8 F).
Speaker
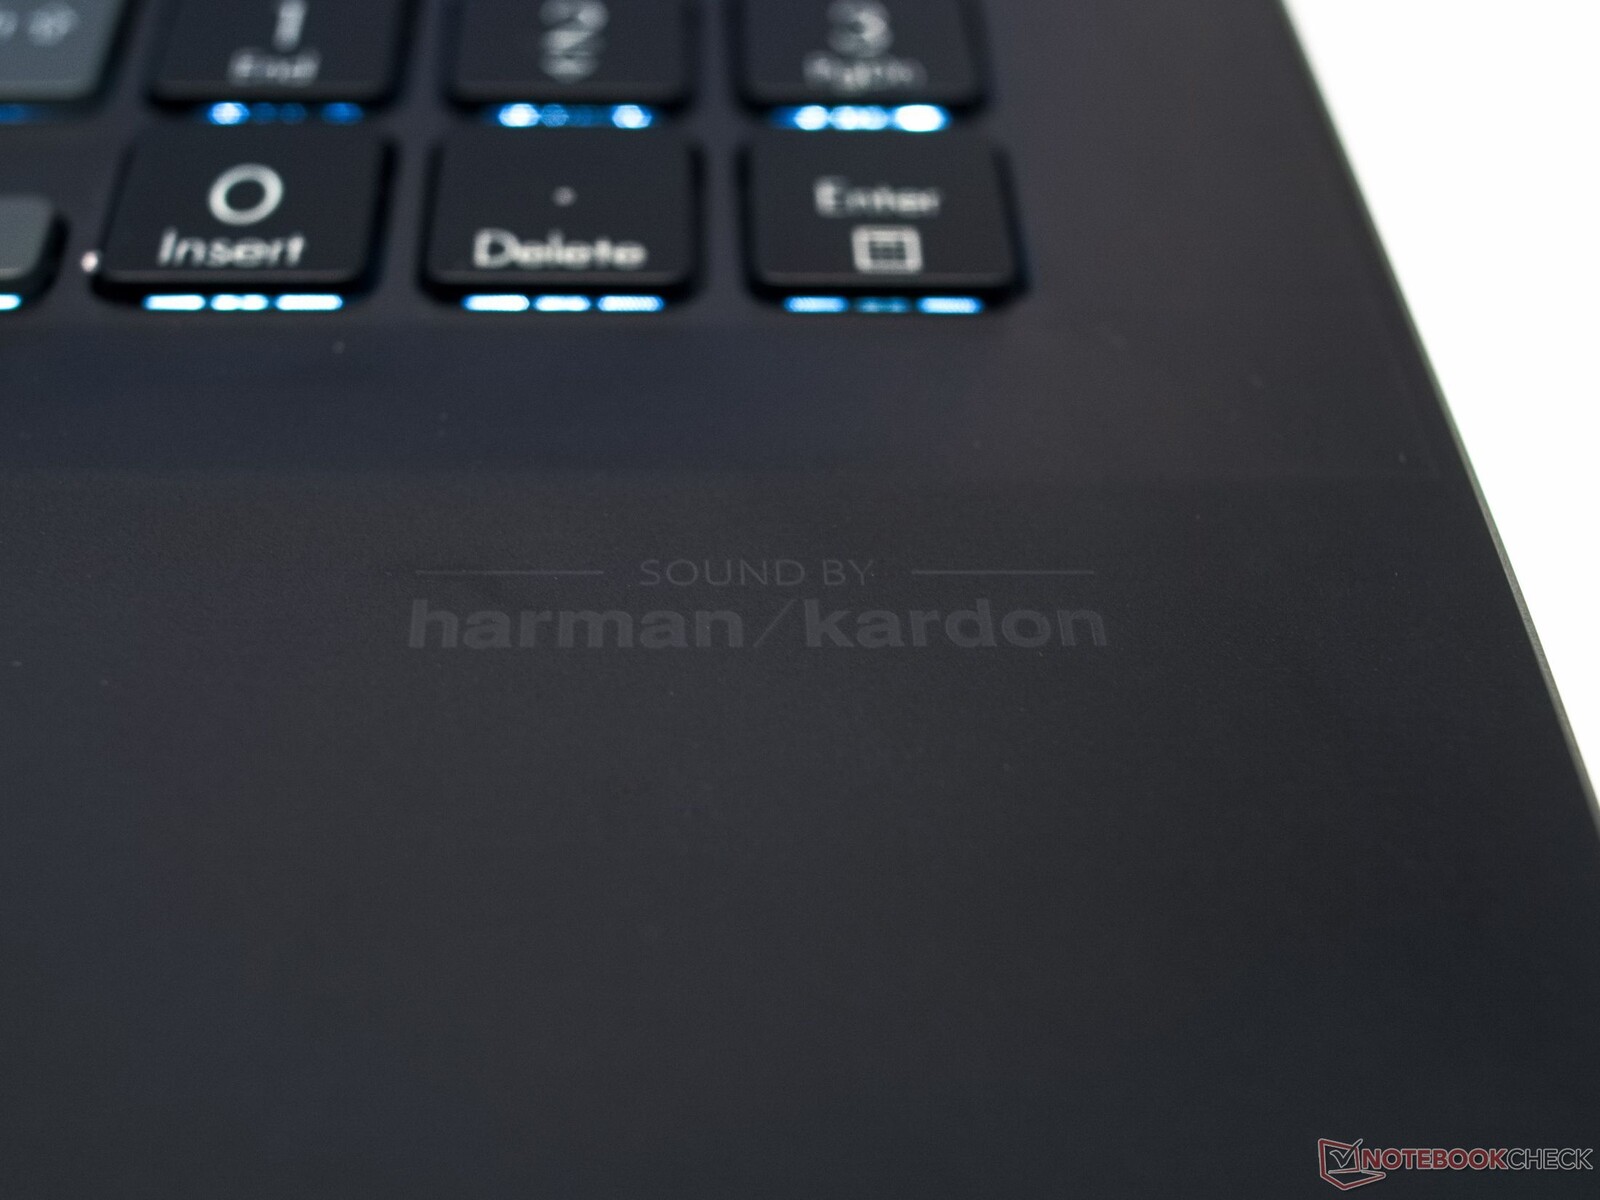
The "Sound by Harman Kardon" is good. The speakers of the Asus laptop are not particularly loud at around 80 dB(A), but they play in a high sound quality. Apart from a slight weakness in the basses, the Vivobook delivers a good and balanced sound. The laptop's two speakers are located on the underside, but they are directed towards the user.
However, external speakers and headphones can also be connected via Bluetooth 5.1 and the 3.5 mm headset port.
Asus Vivobook Pro 16X-M7600QE audio analysis
(±) | speaker loudness is average but good (80.8 dB)
Bass 100 - 315 Hz
(-) | nearly no bass - on average 17% lower than median
(±) | linearity of bass is average (10.4% delta to prev. frequency)
Mids 400 - 2000 Hz
(+) | balanced mids - only 1.2% away from median
(+) | mids are linear (5.1% delta to prev. frequency)
Highs 2 - 16 kHz
(±) | higher highs - on average 5.1% higher than median
(+) | highs are linear (4.9% delta to prev. frequency)
Overall 100 - 16.000 Hz
(±) | linearity of overall sound is average (16.5% difference to median)
Compared to same class
» 43% of all tested devices in this class were better, 7% similar, 50% worse
» The best had a delta of 5%, average was 17%, worst was 45%
Compared to all devices tested
» 28% of all tested devices were better, 6% similar, 66% worse
» The best had a delta of 4%, average was 24%, worst was 134%
Apple MacBook 12 (Early 2016) 1.1 GHz audio analysis
(+) | speakers can play relatively loud (83.6 dB)
Bass 100 - 315 Hz
(±) | reduced bass - on average 11.3% lower than median
(±) | linearity of bass is average (14.2% delta to prev. frequency)
Mids 400 - 2000 Hz
(+) | balanced mids - only 2.4% away from median
(+) | mids are linear (5.5% delta to prev. frequency)
Highs 2 - 16 kHz
(+) | balanced highs - only 2% away from median
(+) | highs are linear (4.5% delta to prev. frequency)
Overall 100 - 16.000 Hz
(+) | overall sound is linear (10.2% difference to median)
Compared to same class
» 7% of all tested devices in this class were better, 2% similar, 91% worse
» The best had a delta of 5%, average was 18%, worst was 53%
Compared to all devices tested
» 5% of all tested devices were better, 1% similar, 94% worse
» The best had a delta of 4%, average was 24%, worst was 134%
Power management - With 96 Wh, the battery is at the limit of legality
Energy consumption
The measurements for energy consumption certify the laptop's good energy efficiency in idle, even though the comparison devices without OLED display consume even less. In the energy consumption measurements, OLED displays often have a higher consumption than screens with liquid crystals. In the measurements under load, the high energy consumption shows the powerful hardware.
In the stress test, the included 120-watt power supply got relatively warm at 50 °C (122 °F) and started to hum slightly. This indicates that the adapter was operated at its performance limit. Whether the included power supply will also be included in the production model is currently open.
| Off / Standby | |
| Idle | |
| Load |
|
Key:
min: | |
| Asus Vivobook Pro 16X-M7600QE R9 5900HX, GeForce RTX 3050 Ti Laptop GPU, SK Hynix HFM001TD3JX013N, OLED, 3840x2400, 16.1" | HP ZBook Studio 15 G8 i9-11950H, GeForce RTX 3070 Laptop GPU, Samsung PM981a MZVLB2T0HALB, OLED, 3840x2160, 15.6" | Huawei MateBook 16 R7 5800H R7 5800H, Vega 8, Lite-On CA5-8D512, , 2520x1680, 16" | Gigabyte Aero 15 OLED XC i7-10870H, GeForce RTX 3070 Laptop GPU, WDC PC SN730 SDBPNTY-1T00, OLED, 3840x2160, 15.6" | Lenovo IdeaPad 5 Pro 16IHU6 i5-11300H, GeForce MX450, Samsung SSD PM981a MZVLB512HBJQ, IPS, 2560x1600, 16" | Dell XPS 15 9510 11800H RTX 3050 Ti OLED i7-11800H, GeForce RTX 3050 Ti Laptop GPU, Micron 2300 512GB MTFDHBA512TDV, OLED, 3456x2160, 15.6" | Average NVIDIA GeForce RTX 3050 Ti Laptop GPU | Average of class Multimedia | |
|---|---|---|---|---|---|---|---|---|
| Power Consumption | -60% | 25% | -63% | 20% | 4% | -8% | 20% | |
| Idle Minimum * (Watt) | 8.2 | 11 -34% | 4.6 44% | 11 -34% | 5 39% | 7.6 7% | 8.2 ? -0% | 5.67 ? 31% |
| Idle Average * (Watt) | 16.2 | 18.8 -16% | 10.5 35% | 14 14% | 9 44% | 9.9 39% | 12.6 ? 22% | 9.99 ? 38% |
| Idle Maximum * (Watt) | 19.7 | 31.7 -61% | 11.2 43% | 34 -73% | 9.4 52% | 10.8 45% | 17.2 ? 13% | 12.4 ? 37% |
| Load Average * (Watt) | 65.8 | 105.2 -60% | 59.1 10% | 95 -44% | 71 -8% | 81 -23% | 92 ? -40% | 64.7 ? 2% |
| Witcher 3 ultra * (Watt) | 65.6 | 148 -126% | 58.6 11% | 152 -132% | 72.4 -10% | 76.2 -16% | ||
| Load Maximum * (Watt) | 104 | 171.8 -65% | 98.3 5% | 216 -108% | 99 5% | 131 -26% | 139.1 ? -34% | 112 ? -8% |
* ... smaller is better
Energy consumption Witcher 3 / Stress test
Battery life
Fixed batteries in laptops or similar mobile devices are allowed to have a maximum of 100 Wh. The Vivobook Pro is equipped with a 96 Wh battery, which provides the multimedia laptop with a long battery life. However, the Vivobook Pro's battery life is not only limited by the required computing power, but also by the screen. The OLED display draws correspondingly more power when many bright areas are to be displayed. Dark areas, on the other hand, require less energy. As a first energy-saving measure, it is therefore worth choosing the screen background as dark as possible and using the dark mode wherever possible.
Thus, it is not surprising that there are 12 hours between the WiFi web surfing test (where many websites are accessed with a white background) and the idle-battery test. In the idle-battery test, the screen brightness was set to the lowest level and a dark screen background was also selected.
During the test period, using the described savings measures, the laptop showed several times that it can easily get through the day with one battery charge in daily use. At the end of the day, more than 30% of the battery was still available.
However, if you demand high brightness and a lot of performance from the laptop in battery mode, the runtimes shrink to just over an hour.
| Asus Vivobook Pro 16X-M7600QE R9 5900HX, GeForce RTX 3050 Ti Laptop GPU, 96 Wh | HP ZBook Studio 15 G8 i9-11950H, GeForce RTX 3070 Laptop GPU, 83 Wh | Huawei MateBook 16 R7 5800H R7 5800H, Vega 8, 84 Wh | Gigabyte Aero 15 OLED XC i7-10870H, GeForce RTX 3070 Laptop GPU, 99 Wh | Lenovo IdeaPad 5 Pro 16IHU6 i5-11300H, GeForce MX450, 75 Wh | Dell XPS 15 9510 11800H RTX 3050 Ti OLED i7-11800H, GeForce RTX 3050 Ti Laptop GPU, 86 Wh | Average of class Multimedia | |
|---|---|---|---|---|---|---|---|
| Battery runtime | -6% | 20% | 84% | 1% | 13% | 27% | |
| Reader / Idle (h) | 20.3 | 12.9 -36% | 19.4 -4% | 25.2 ? 24% | |||
| WiFi v1.3 (h) | 11.3 | 6.2 -45% | 12.8 13% | 6.7 -41% | 9.1 -19% | 7 -38% | 12 ? 6% |
| Load (h) | 1.1 | 1.8 64% | 1.4 27% | 3.4 209% | 1.4 27% | 1.8 64% | 1.672 ? 52% |
| H.264 (h) | 10.9 | 7.1 | 10.4 | 10.4 | 16.3 ? |
Pros
Cons
Verdict
As a pre-production device, the Asus Vivobook Pro 16X had to undergo the same tests as any other laptop. The Vivobook presented itself very positively except for a few minor problem areas. However, there can be considerable differences to the final product in the last development steps. Therefore, we do not include the usual rating chart at the end of the article.
The visually appealing Asus Vivobook Pro shows a high willingness to perform in the test. The laptop can also score with the bright, colorful and high-resolution OLED display. Despite the powerful combination of AMD Ryzen R9 and Nvidia GeForce RTX 3050 Ti, long battery runtimes are possible if you limit the display brightness accordingly. Open points of criticism aside from the noise characteristics of the fans and the MyAsus app are hard to find. The preview device proves to be a well-thought-out laptop.
For gamers, the Nvidia GeForce RTX 3050 Ti might not be very future-proof, but apart from the latest games on highest settings, the graphics card delivers very good performance that is far above the level of a multimedia laptop. The Asus Vivobook Pro could also be categorized as a workstation, even though it lacks certified drivers for professional programs. The particularly good screen and the option to call up the Asus Dial on the touchpad at least emphasize the focus on media designers.
The Asus Vivobook Pro combines good design with a high system performance.
At the beginning of the test phase, Asus' laptop still had considerably more software problems than at the end. It is difficult to estimate how much performance will be available to the final production model. However, the Asus laptop could fix initial weaknesses with consistent driver and software updates. The low number of connectivity options is a matter of taste, but could have a significant negative impact on the workflow.
Price and availability
Official prices for the Asus Vivobook 16X are not yet available. The pre-production device is not yet listed in Europe. However, the competing devices give a good overview of the possible price range. The inexpensive Huawei Matebook 16 AMD is currently available from about 1,600 Euros (~$1,831), but it has a lower-resolution display and less working memory, but a slightly better graphics card.
The HP ZBook Studio in 16:9 format has a similarly high configuration with a better graphics card for around €2,800 (~$3,204).
The Asus laptop will also be in this range, even though Asus is currently attracting attention with low prices for higher-end devices.
Price comparison

