 Deutsch
 English
 Español
 Français
 Italiano
 Nederlands
 Polski
 Português
 Русский
 Türkçe
 Svenska
 Chinese
 Magyar
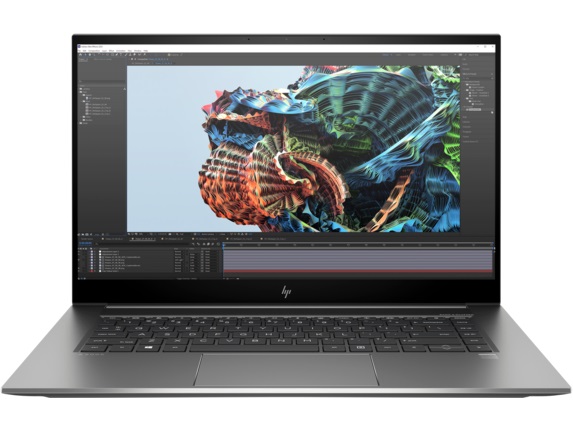
HP ZBook Studio 15 G8 Laptop Review: More Options Than Ever Before
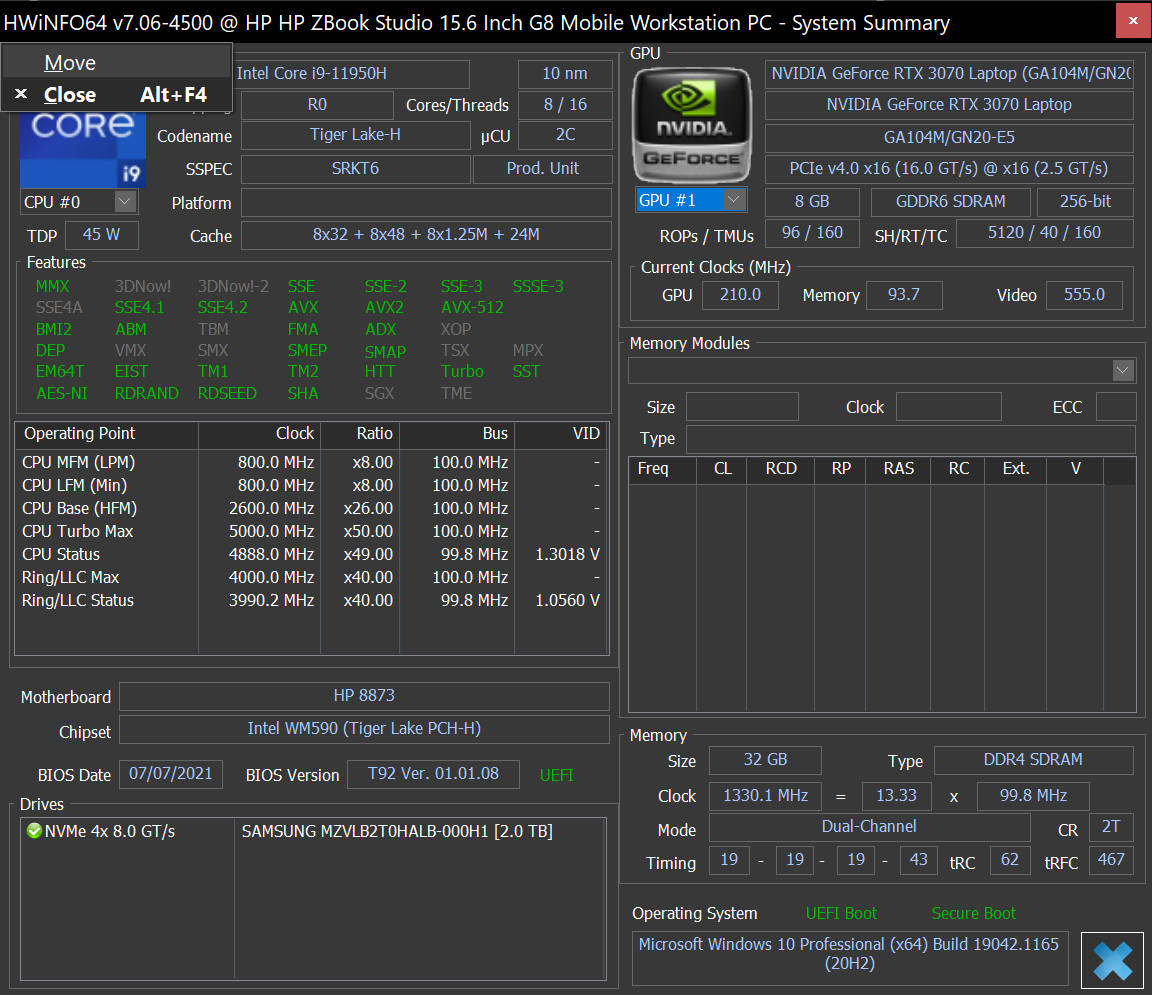
As its name suggests, the HP ZBook Studio 15 G8 is the successor to the ZBook Studio 15 G7 with updated processors and new features not available on previous models. The new model also replaces the ZBook Create G7 which was essentially the same laptop as the ZBook Studio G7 albeit with GeForce instead of Quadro graphics. Thus, the ZBook Studio G8 has consolidated and inherited all the configurations of the two older G7 models for a long list of configurable options ranging from vPro to non-vPro Tiger Lake-H CPUs and both Quadro and GeForce GPUs.
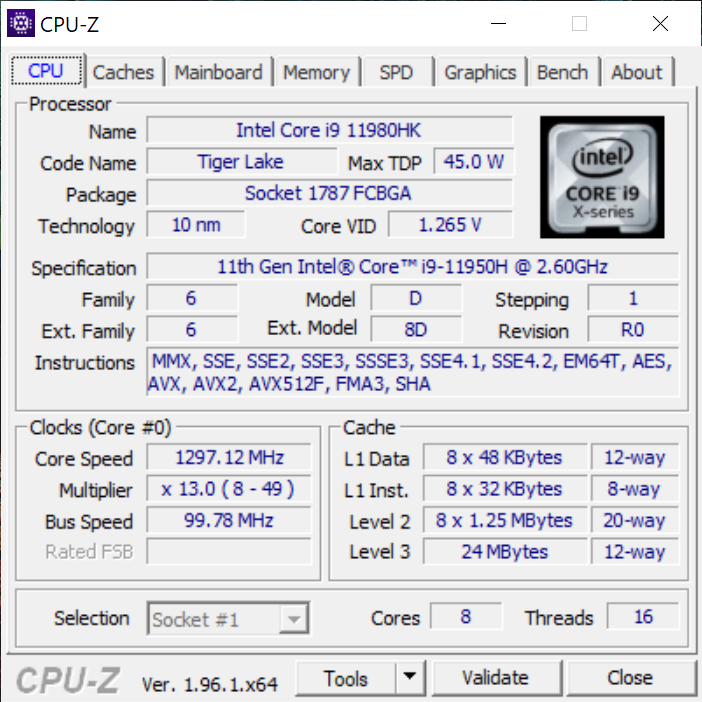
Our test unit is a higher-end configuration equipped with the vPro-enabled Core i9-11950H CPU, RTX 3070 GPU, and 4K OLED touchscreen for approximately $4200 USD retail. Lesser SKUs with the Core i7-11800H, integrated Iris Xe graphics only, FHD display, or Quadro T1200 graphics are available for significantly less. There are no Xeon options, however.
Direct competitors include other ultrathin Core-H-powered mobile workstations like the MSI WS66, Razer Blade 15 Studio, Asus ProArt, or the Lenovo ThinkPad P15s.
More HP reviews:
potential competitors in comparison
Rating | Date | Model | Weight | Height | Size | Resolution | Best Price |
|---|---|---|---|---|---|---|---|
| 87.8 % | 08/2021 | HP ZBook Studio 15 G8 i9-11950H, GeForce RTX 3070 Laptop GPU | 1.9 kg | 18 mm | 15.60" | 3840x2160 | |
| 83.8 % | 04/2021 | HP ZBook Firefly 15 G8 2C9R7EA i7-1165G7, T500 Laptop GPU | 1.8 kg | 19.2 mm | 15.60" | 1920x1080 | |
| 90.6 % | 03/2021 | HP ZBook Studio G7 i9-10885H, Quadro RTX 3000 Max-Q | 2 kg | 18 mm | 15.60" | 3840x2160 | |
| 87.8 % | 08/2020 | Dell Precision 7550 W-10885M, Quadro RTX 5000 Max-Q | 2.8 kg | 27.36 mm | 15.60" | 3840x2160 | |
| 85.3 % | 06/2021 | Lenovo ThinkPad P15s Gen2-20W6000GGE i7-1165G7, T500 Laptop GPU | 1.9 kg | 19.1 mm | 15.60" | 3840x2160 | |
| 83.1 % | 11/2020 | Asus ProArt StudioBook Pro 15 W500G5T i7-9750H, Quadro RTX 5000 Max-Q | 2 kg | 18.9 mm | 15.60" | 3840x2160 |
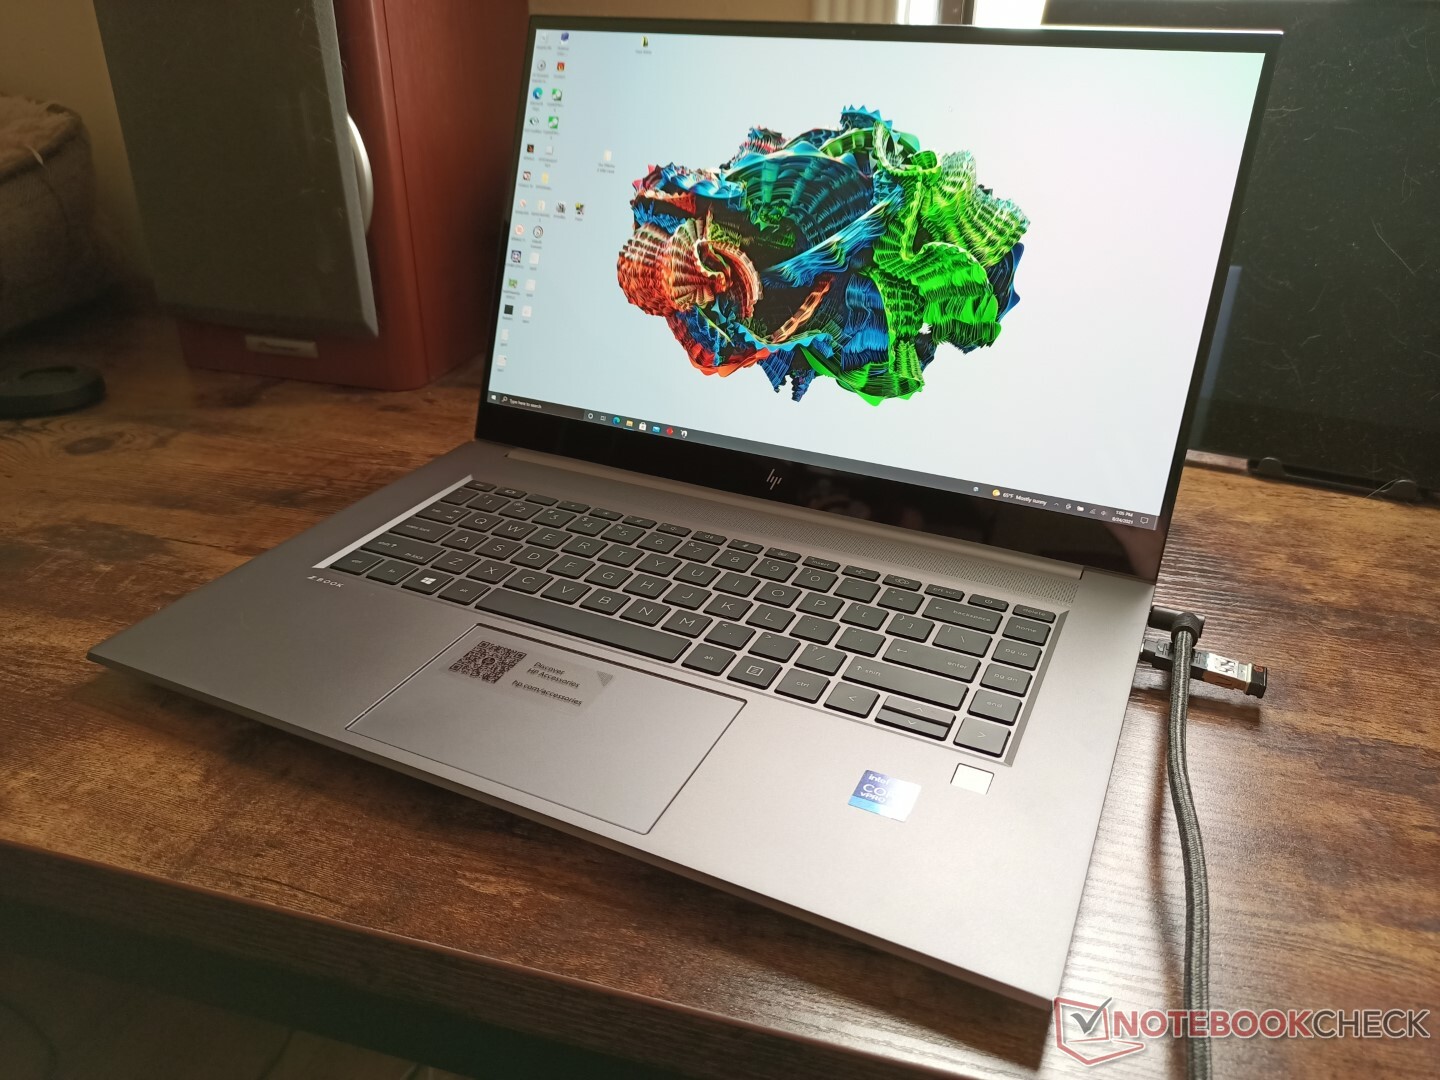
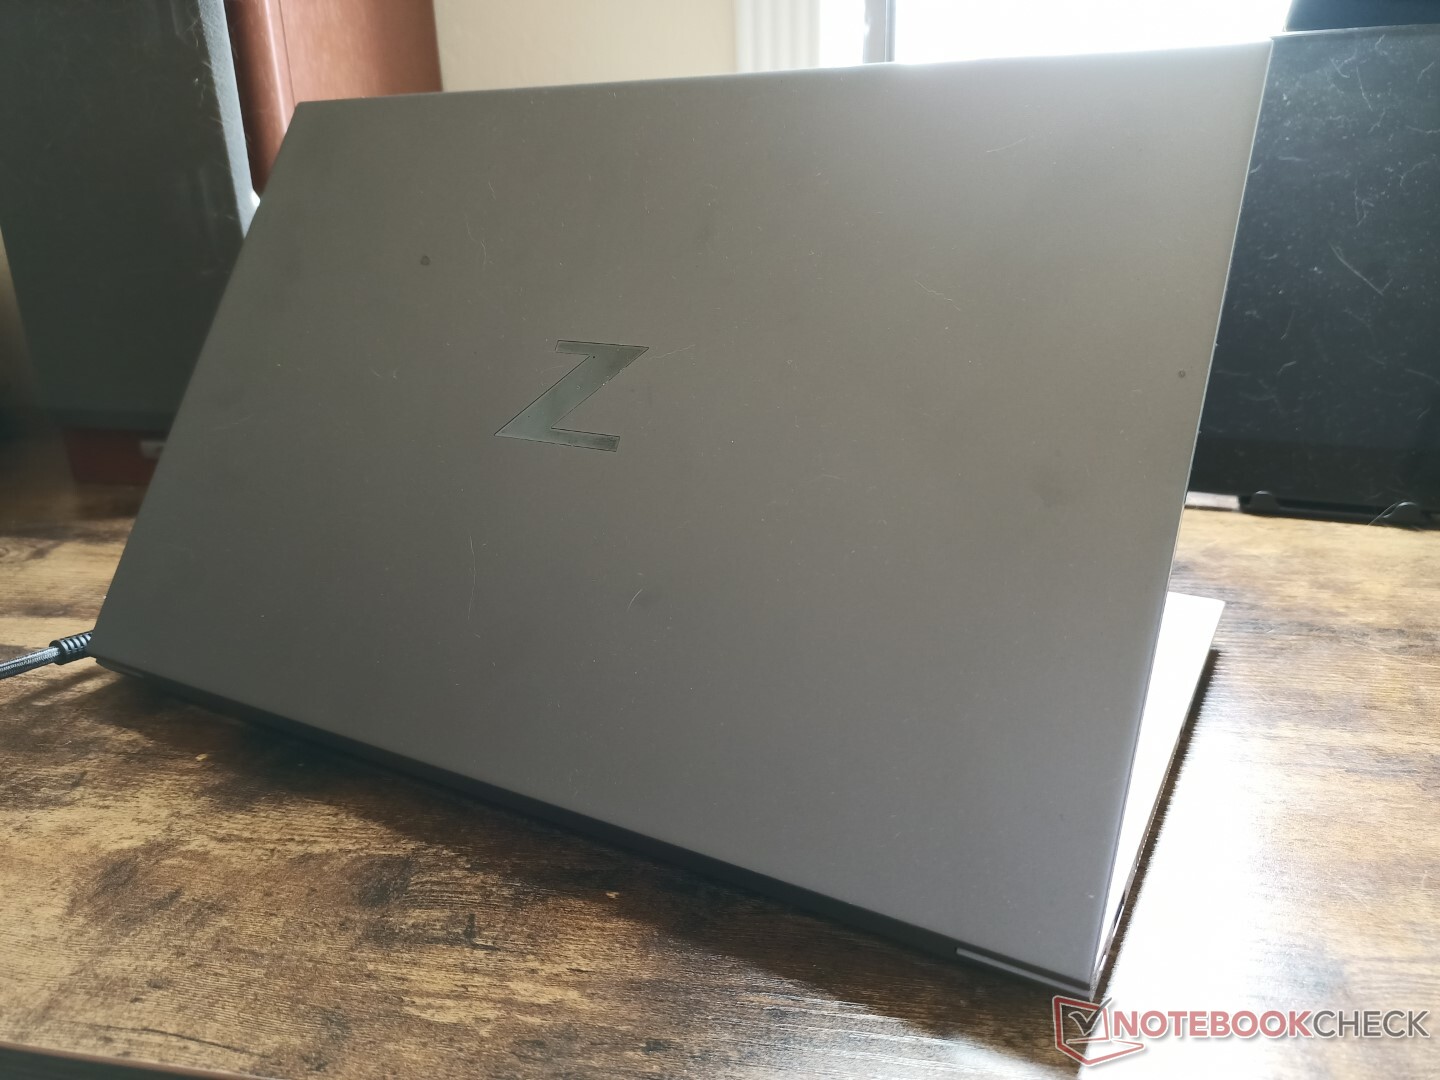
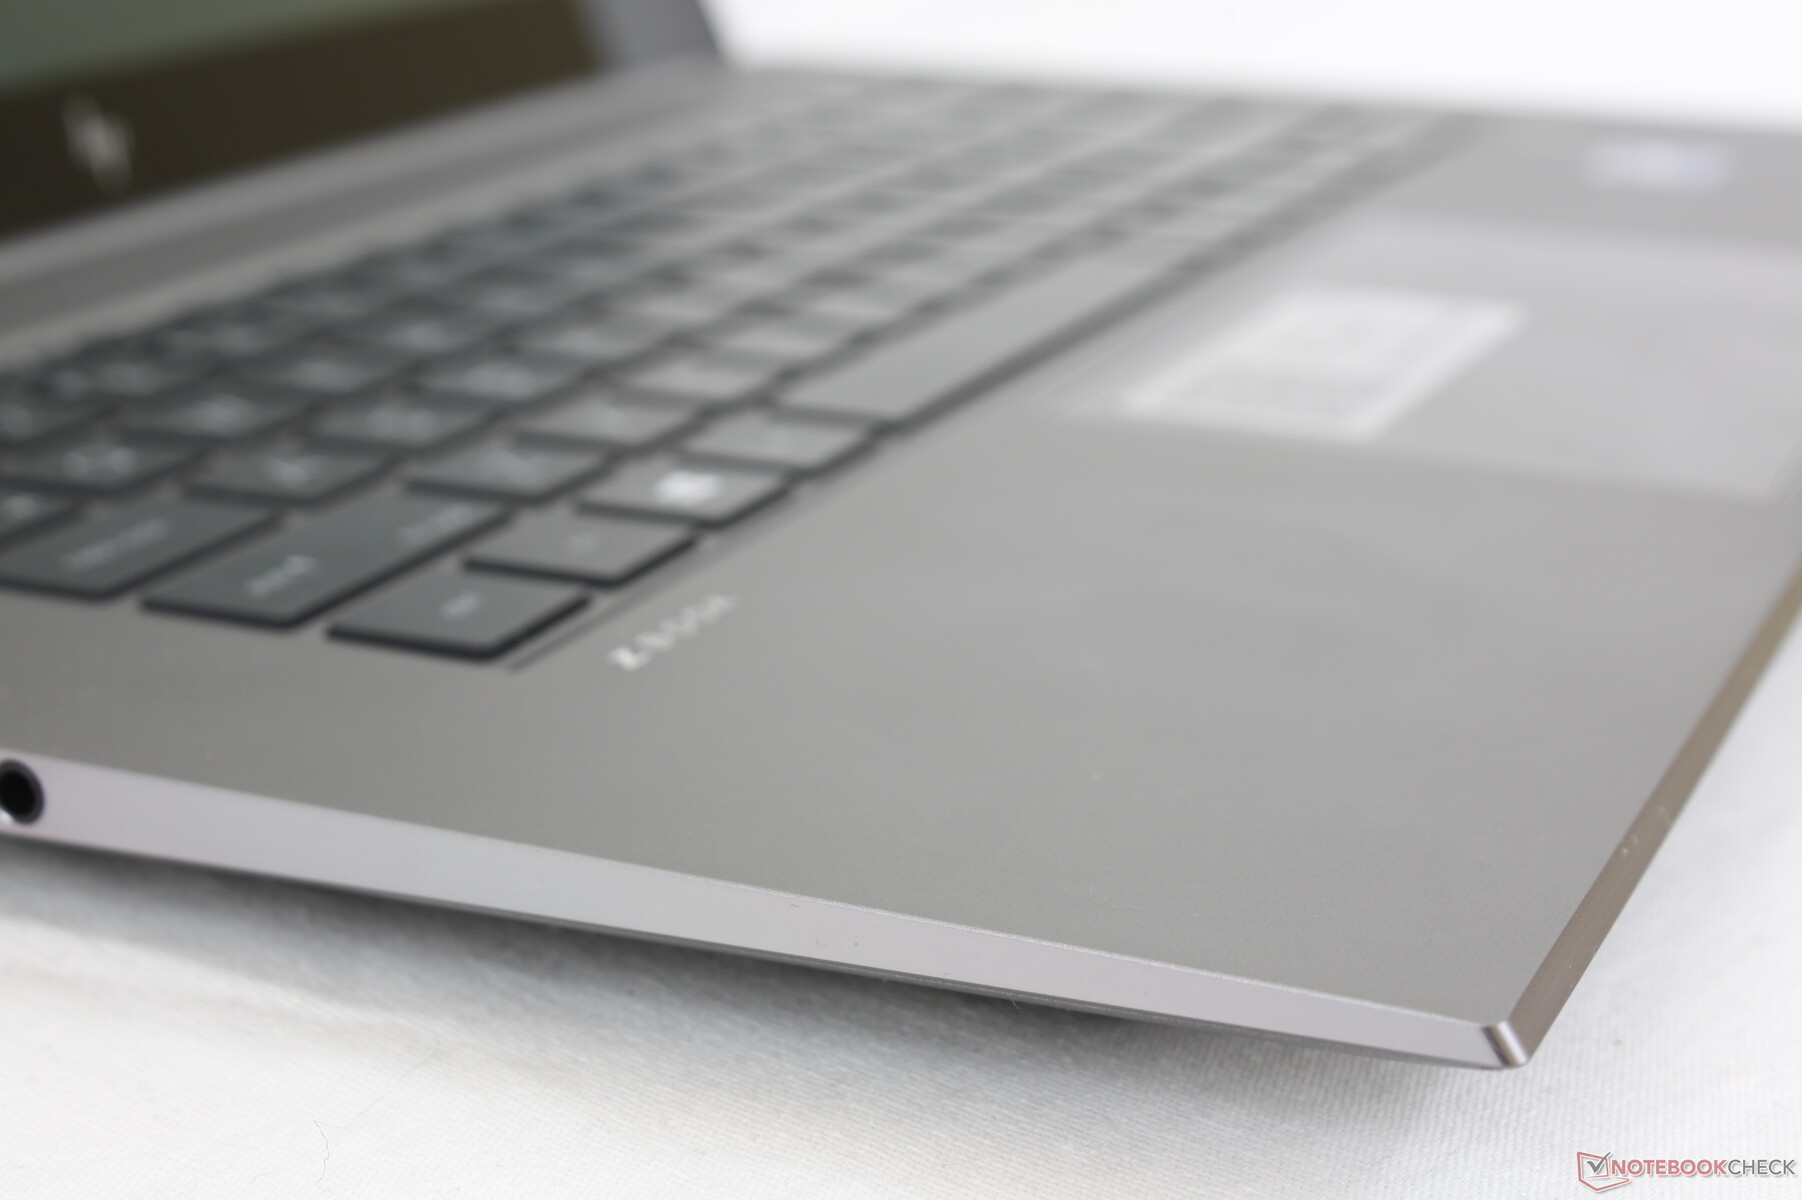
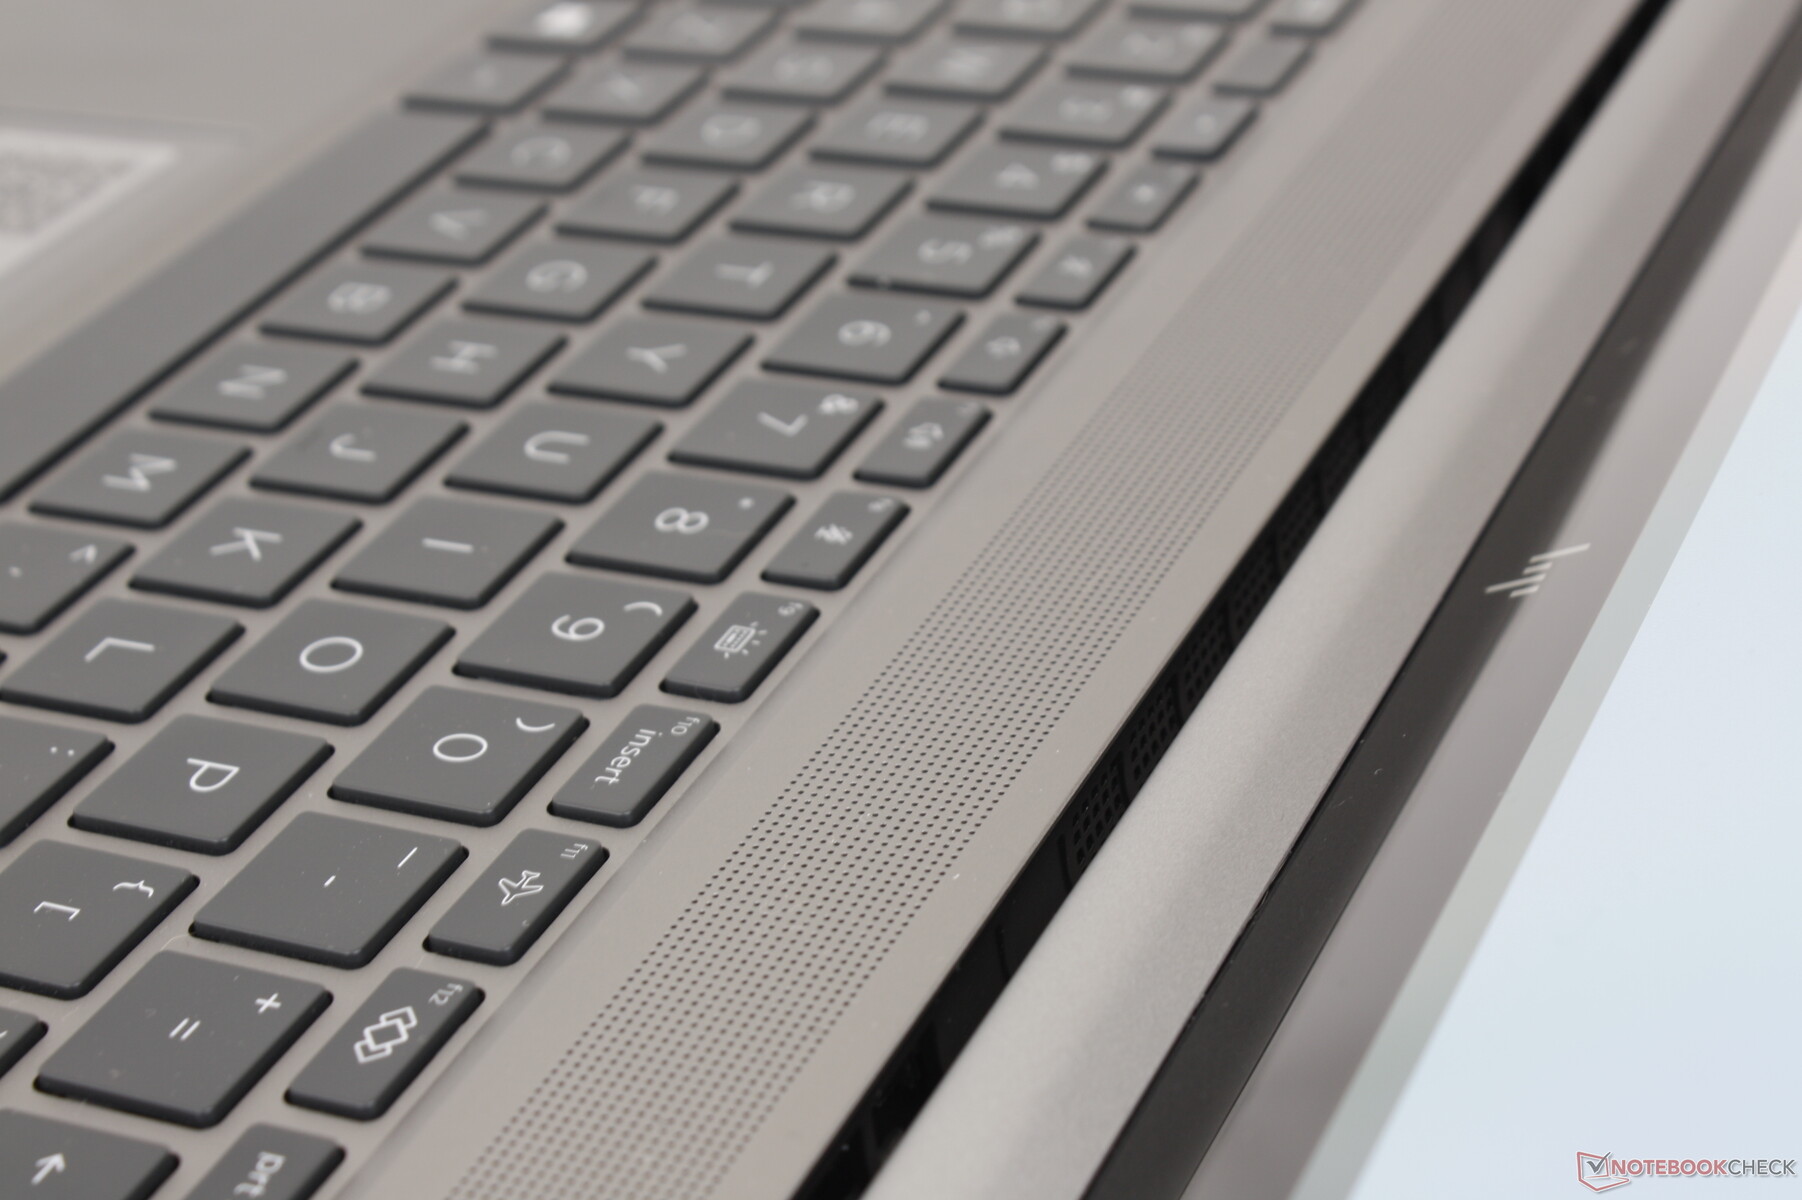
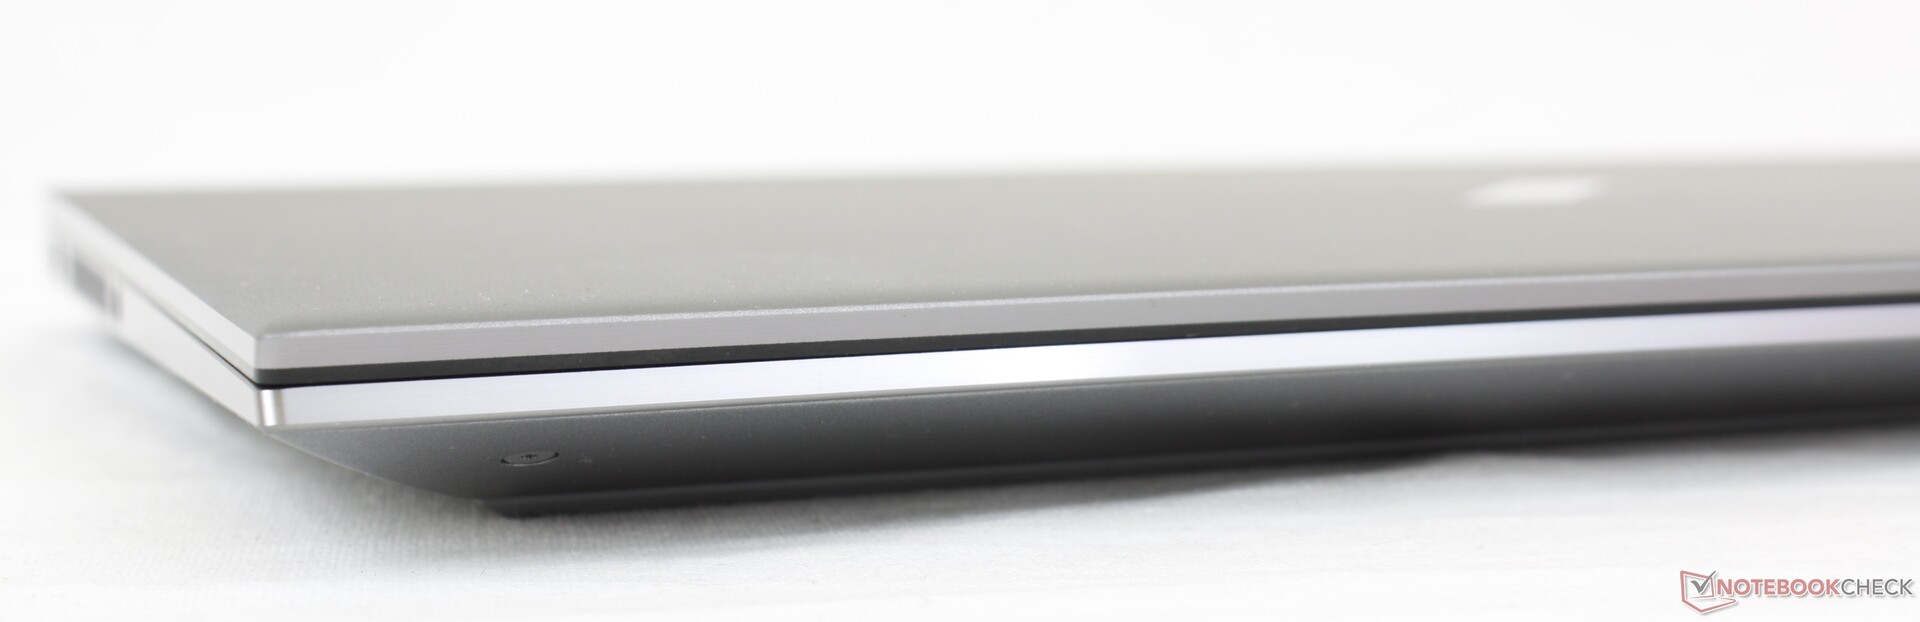
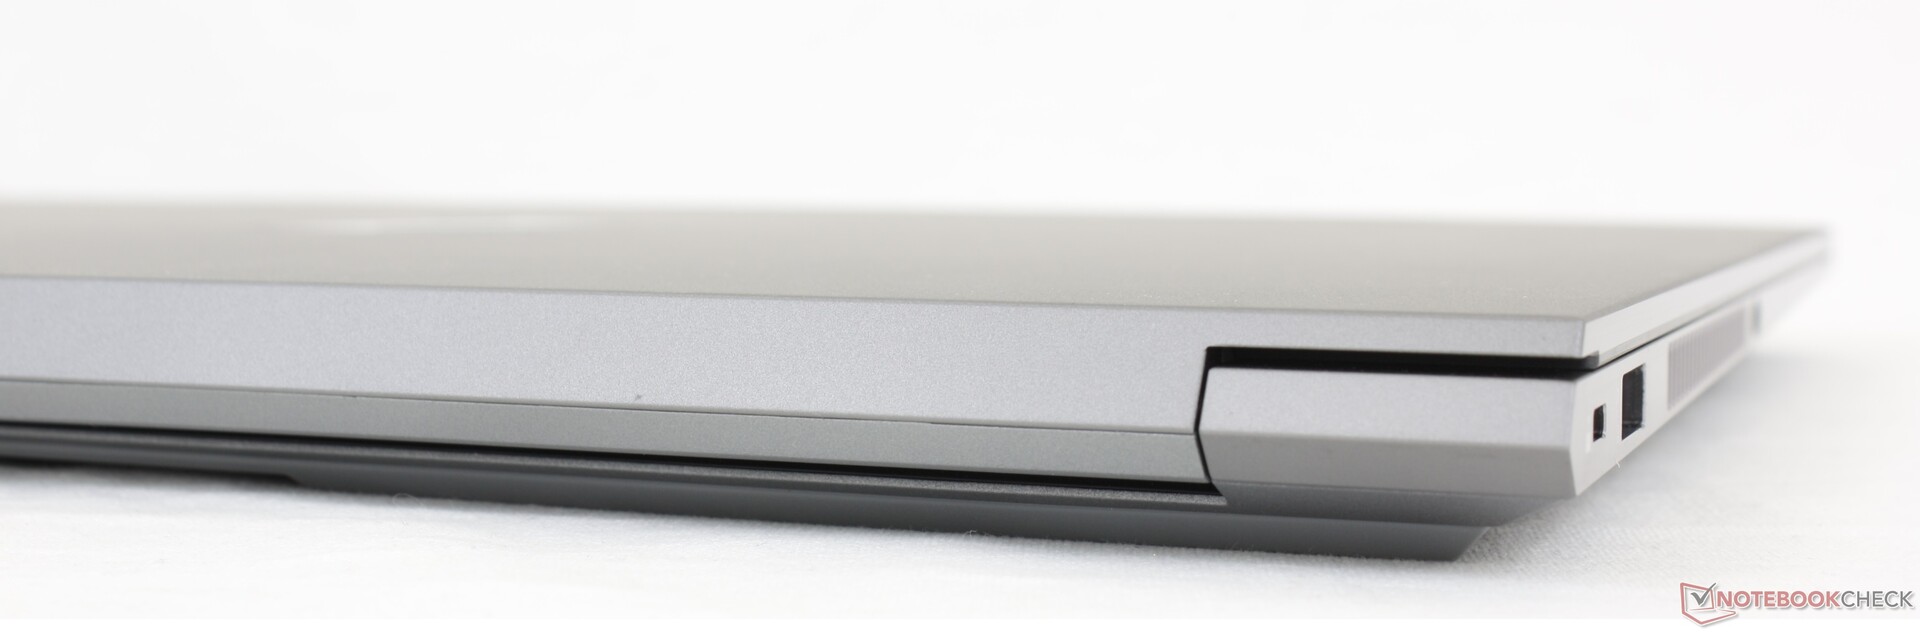
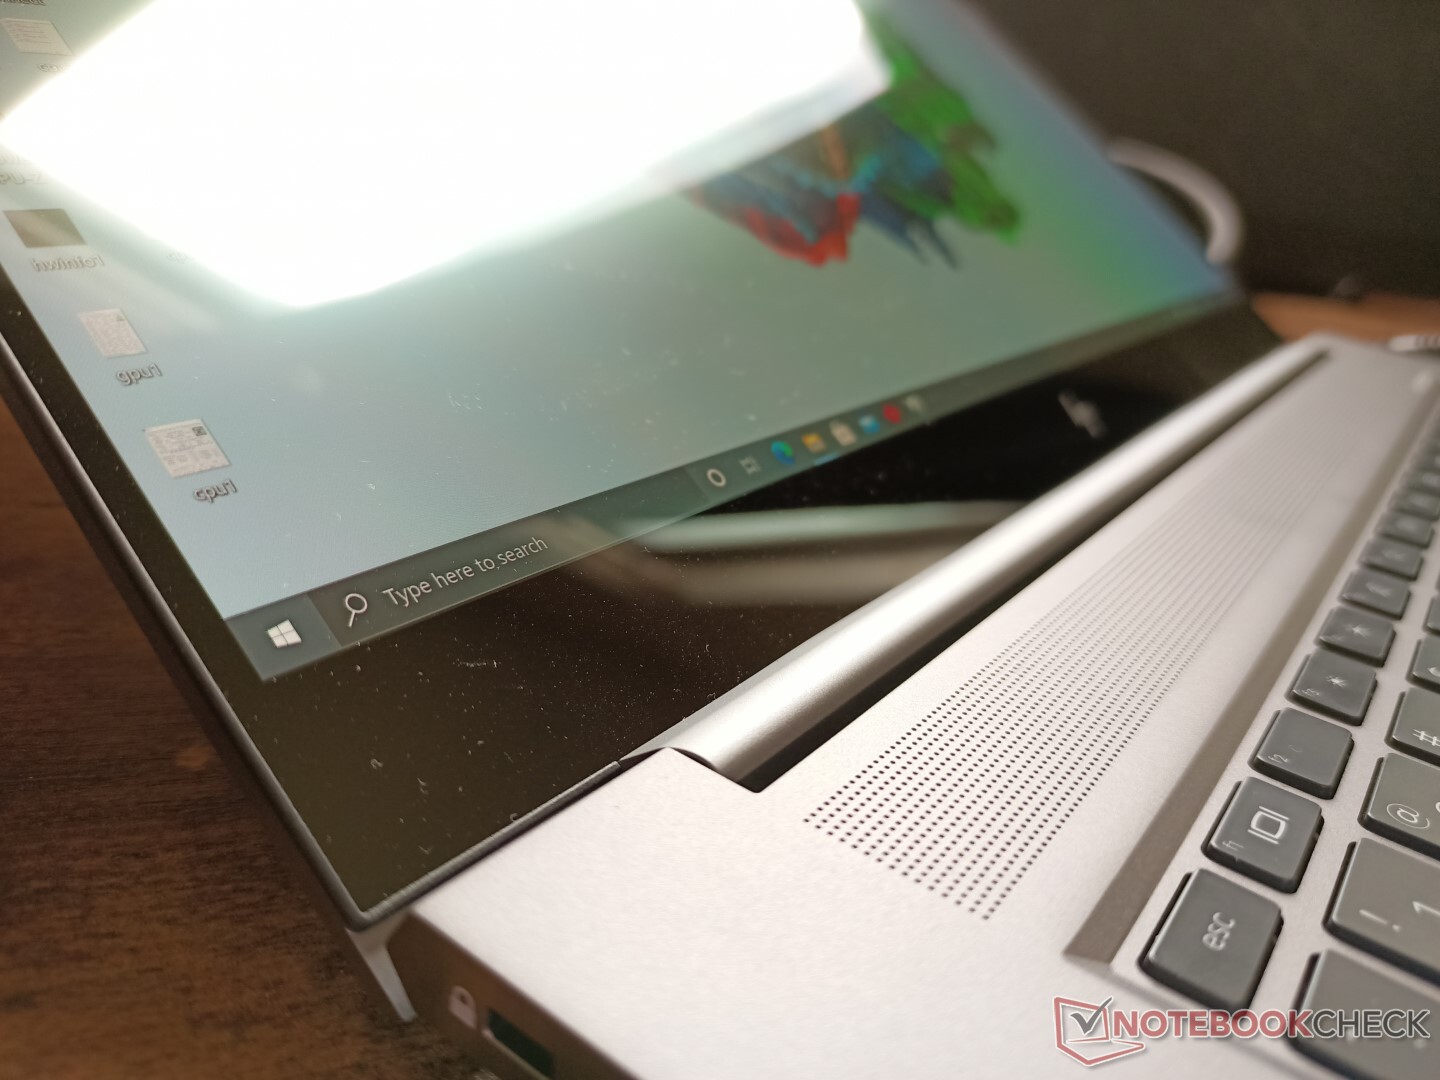
Case — Visually Identical to the ZBook 15 G7
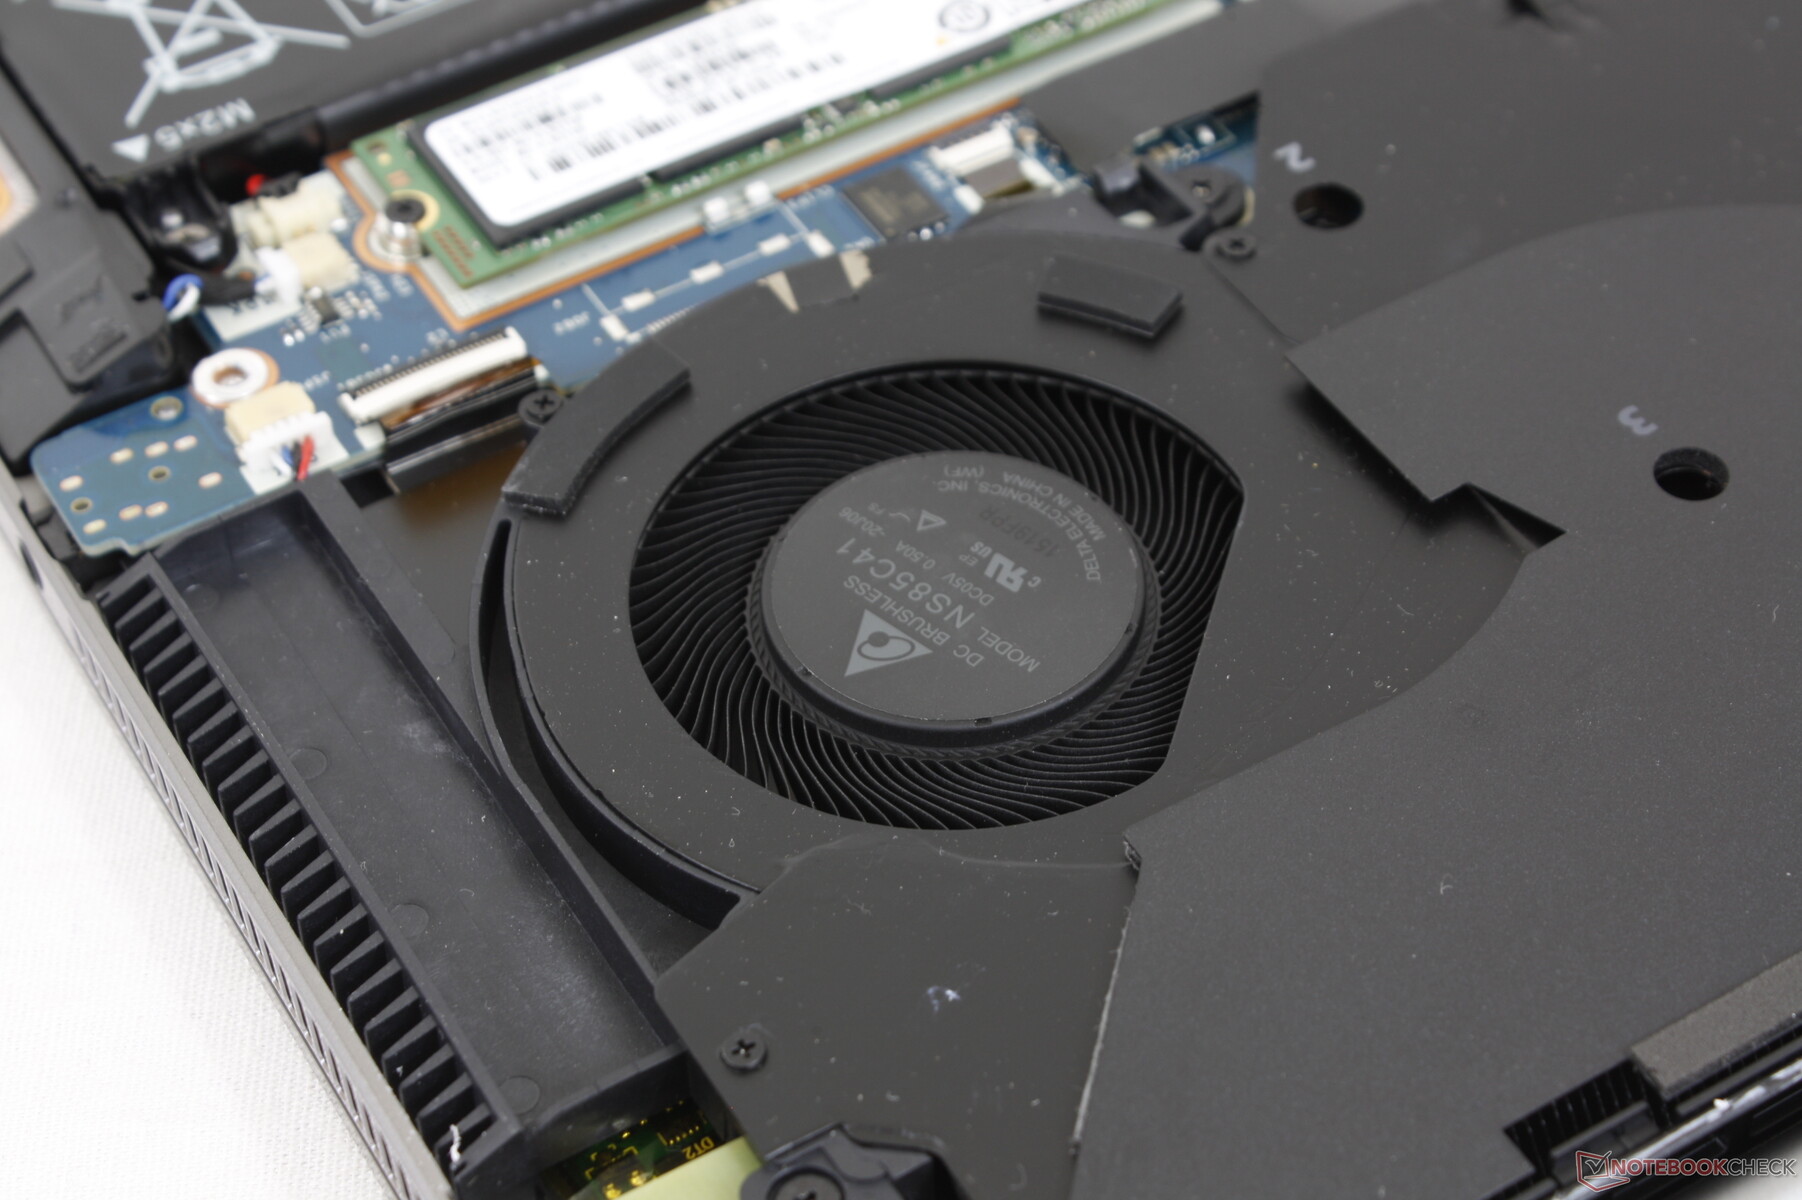
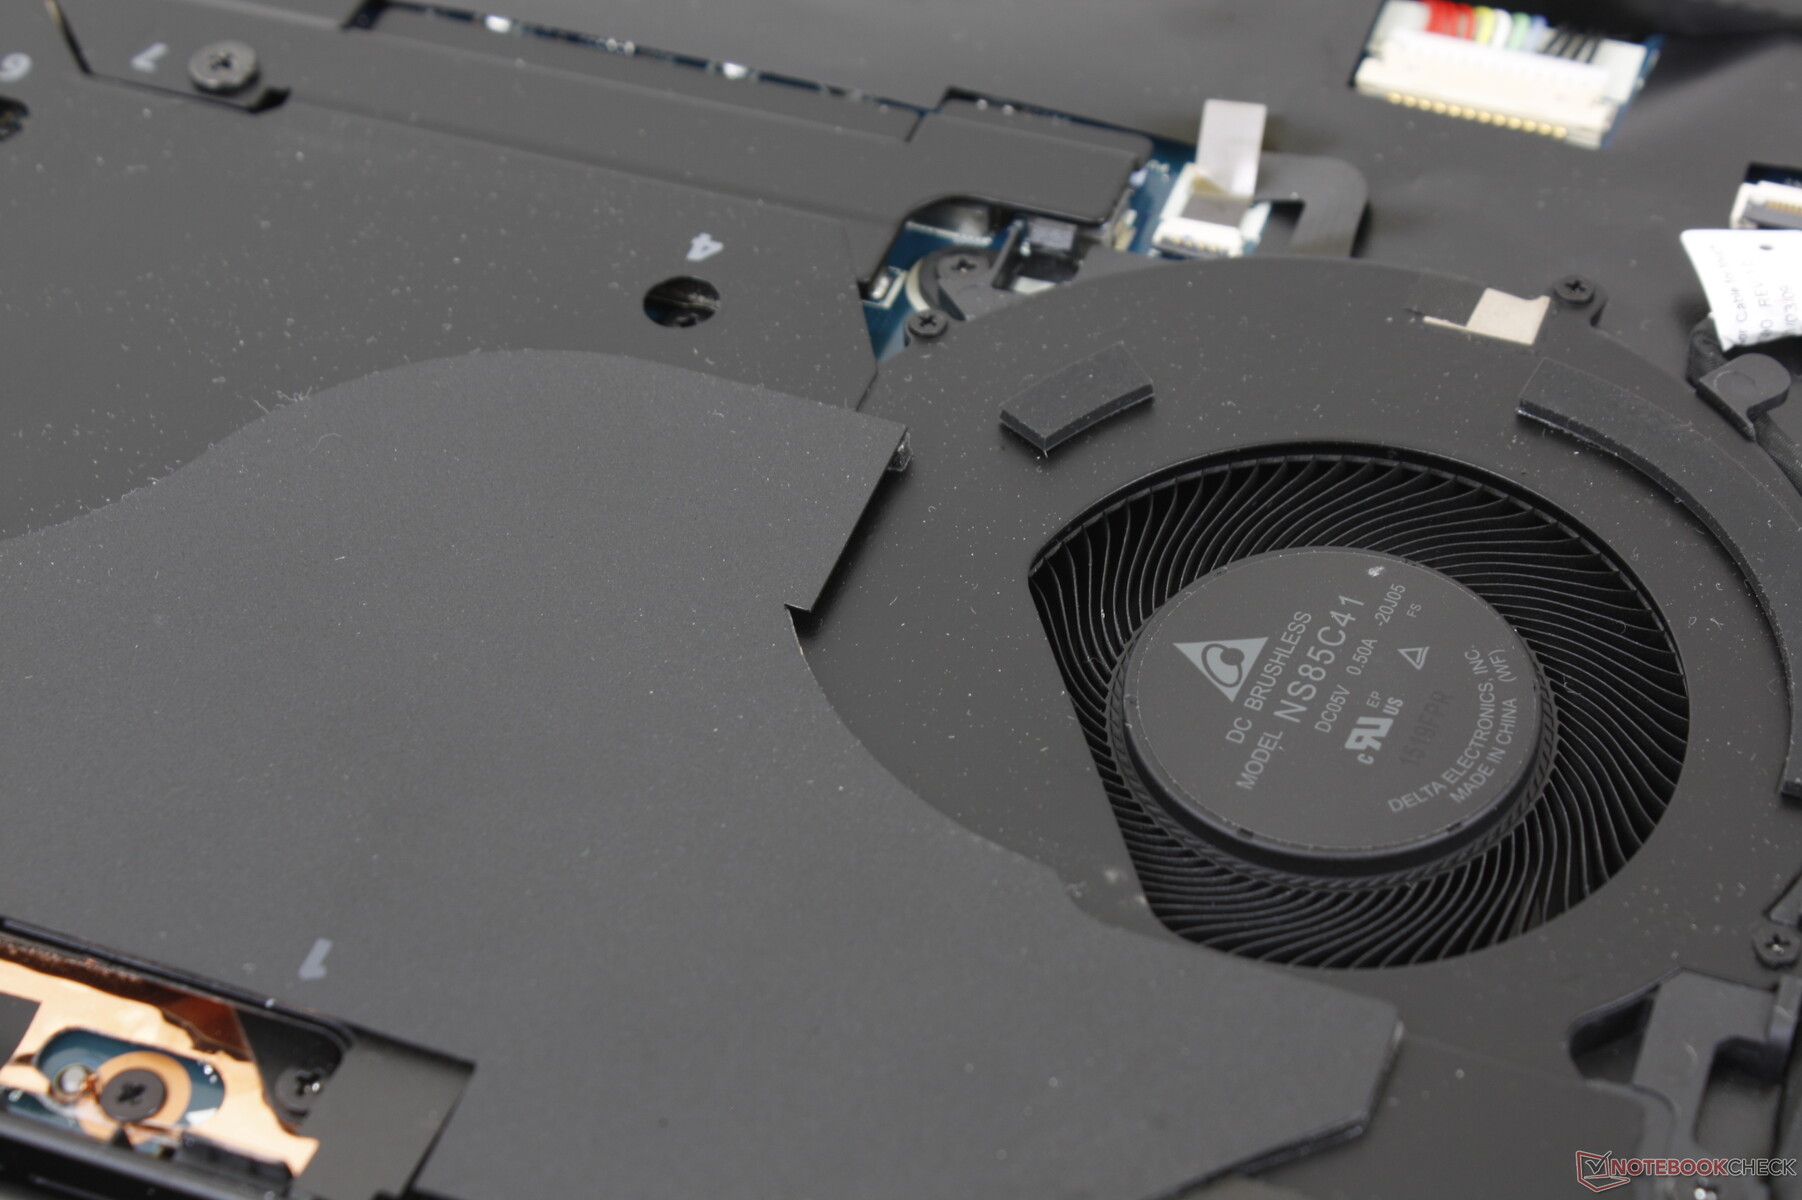
HP hasn't changed the external chassis design and so our original comments on the ZBook Studio 15 G7 also apply here. Instead, the changes are internal including optional per-key RGB lighting and a revised cooling solution to pull in more air than on last year's model.
The model continues to be one of the smallest 15.6-inch workstations available with Core-H series CPUs and GeForce/Quadro-level graphics despite its "old" chassis design. It's even smaller than the ZBook Firefly G8 which comes with slower internals than our ZBook Studio G8.
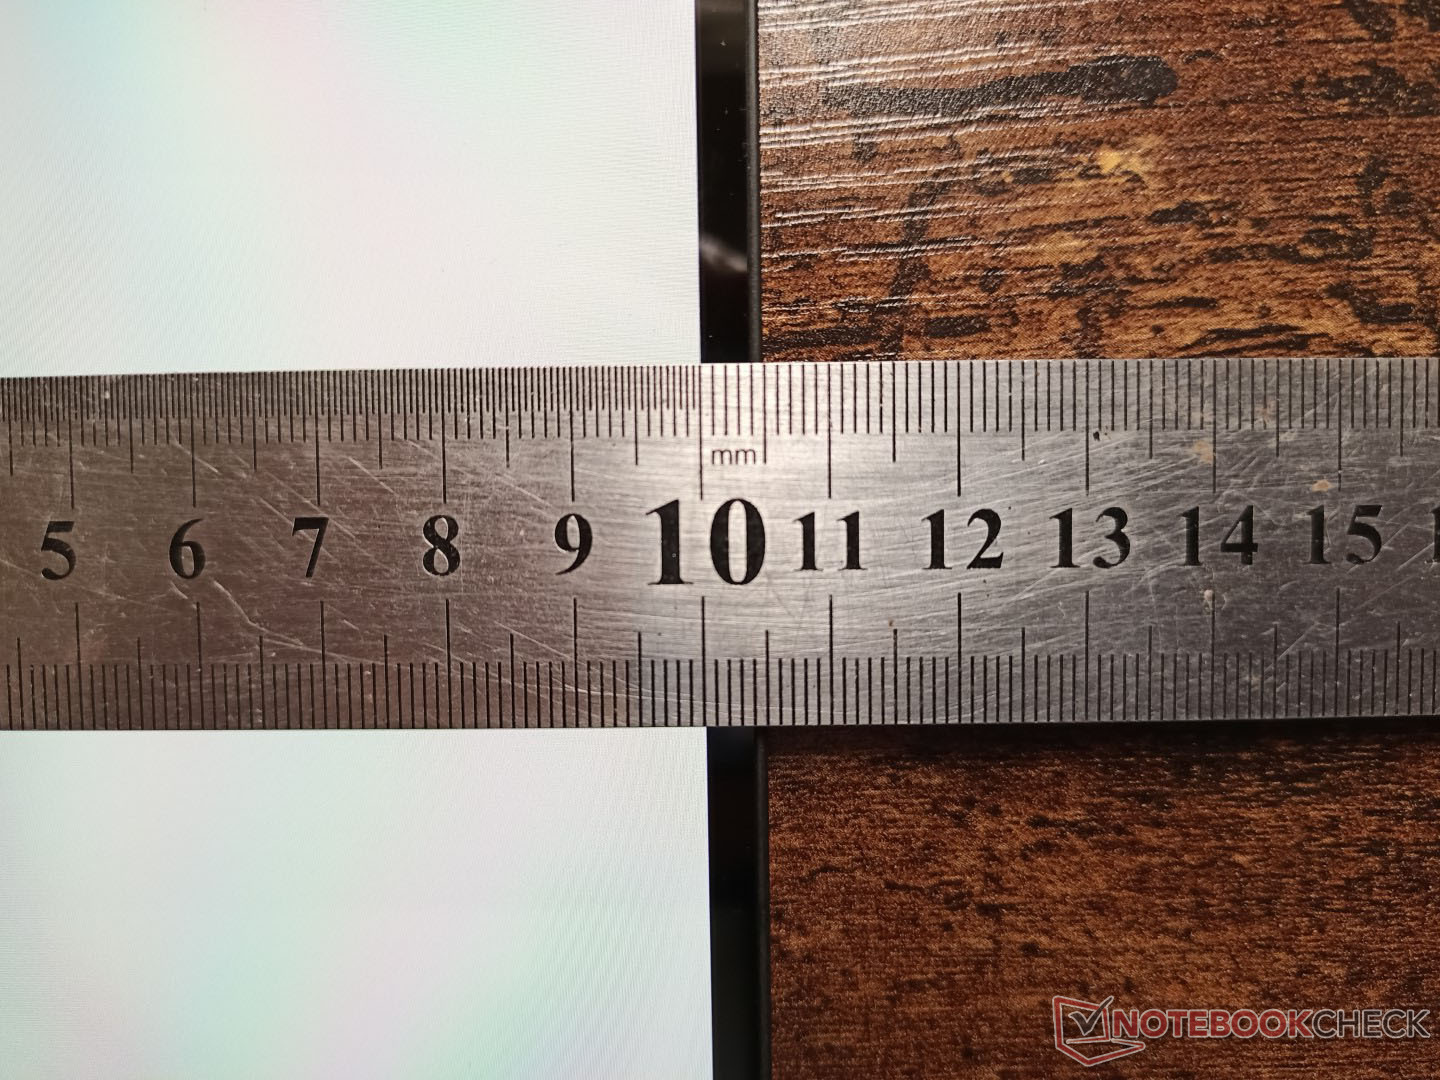
It's worth noting that touchscreen SKUs are ever-so-slightly thicker than the non-touch SKUs by one one-hundredth of an inch (0.70" vs. 0.69").
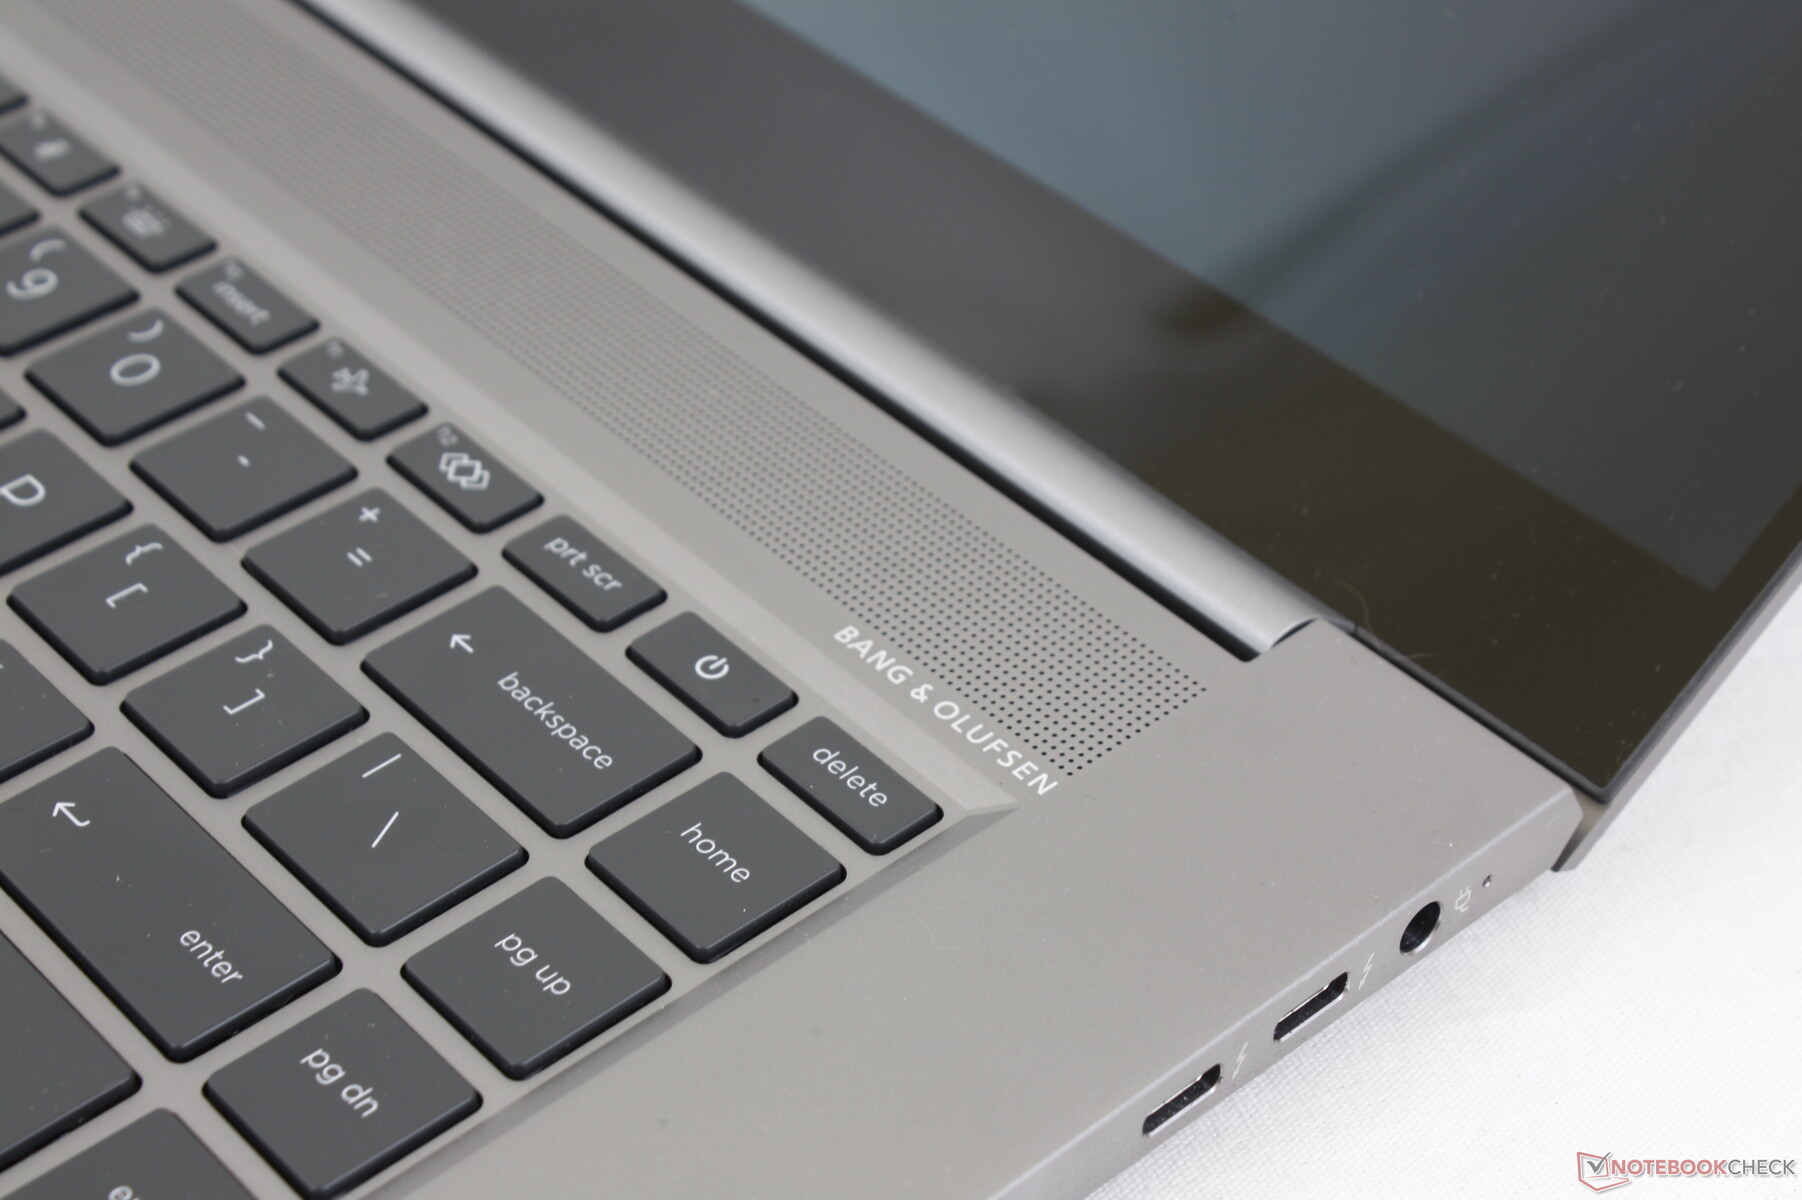
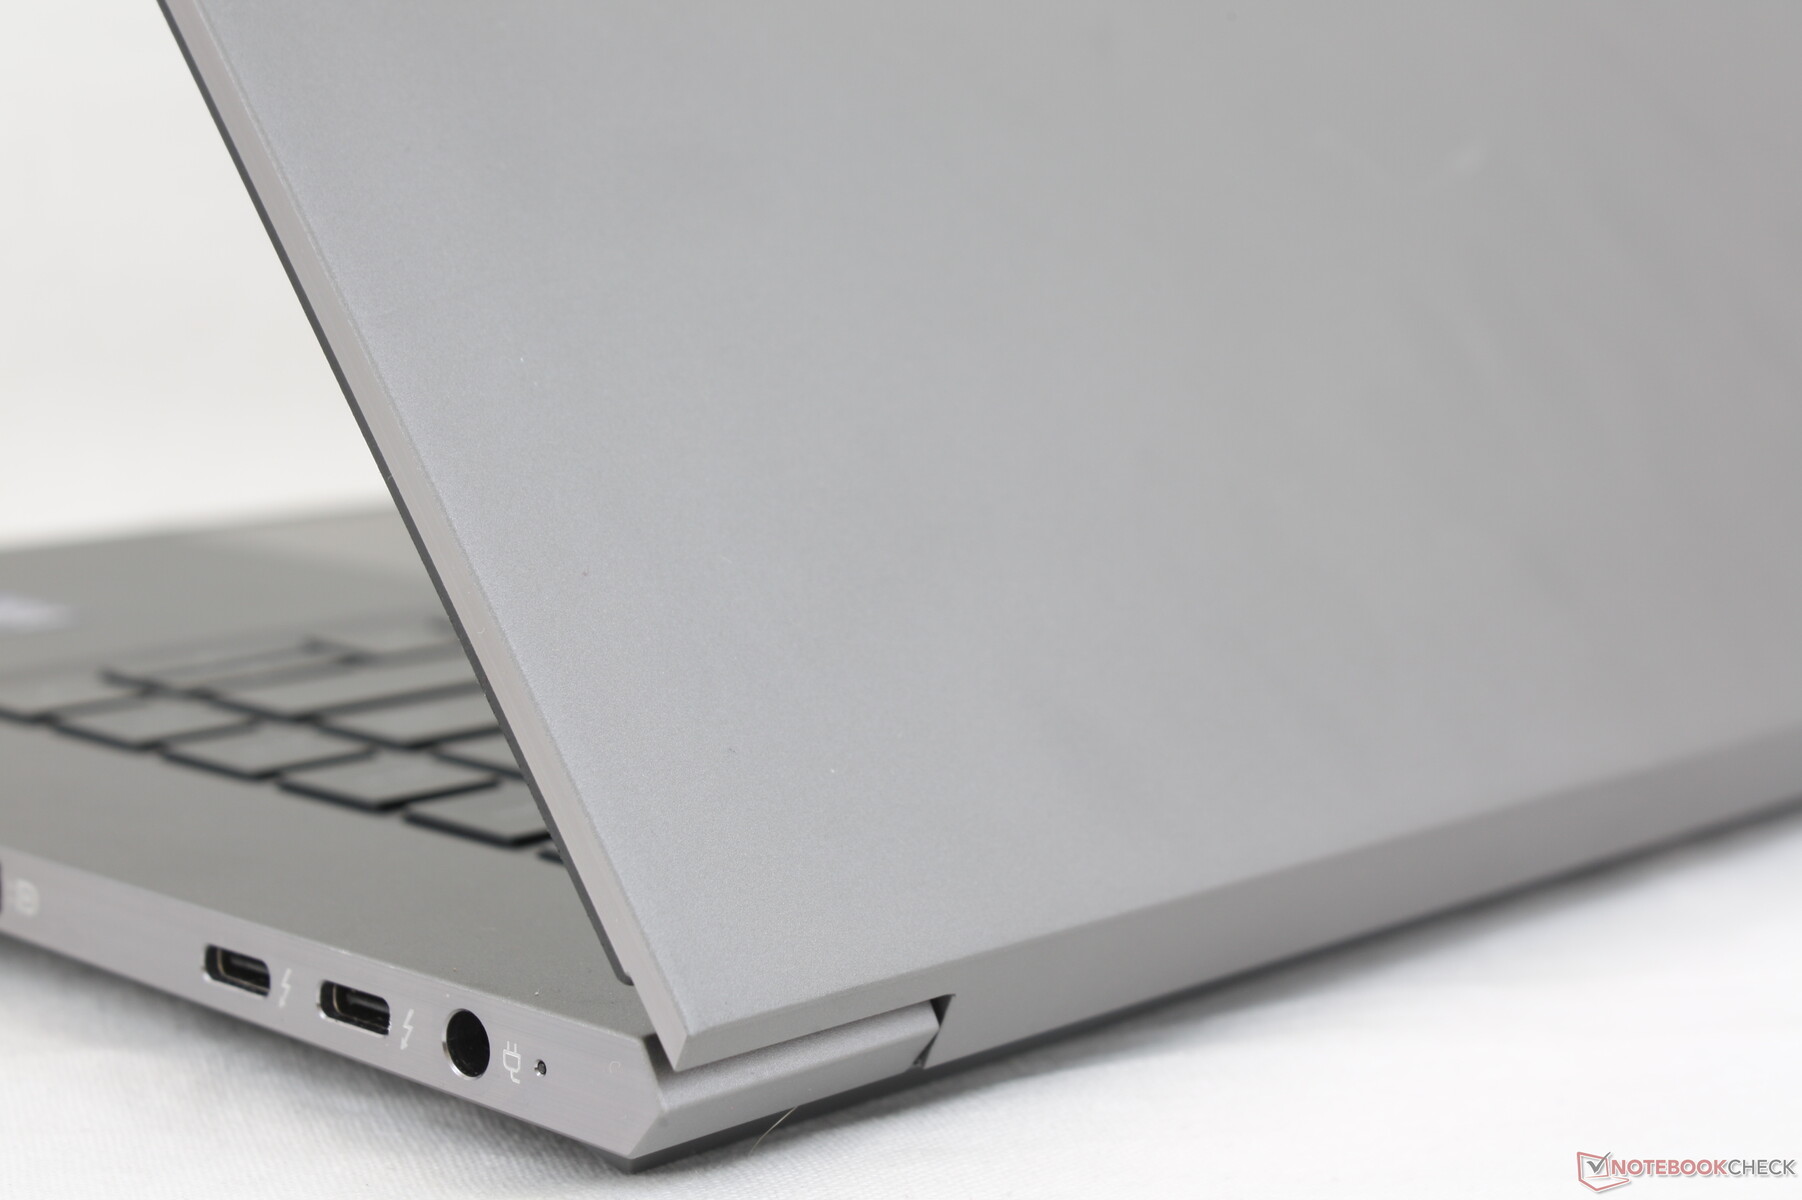
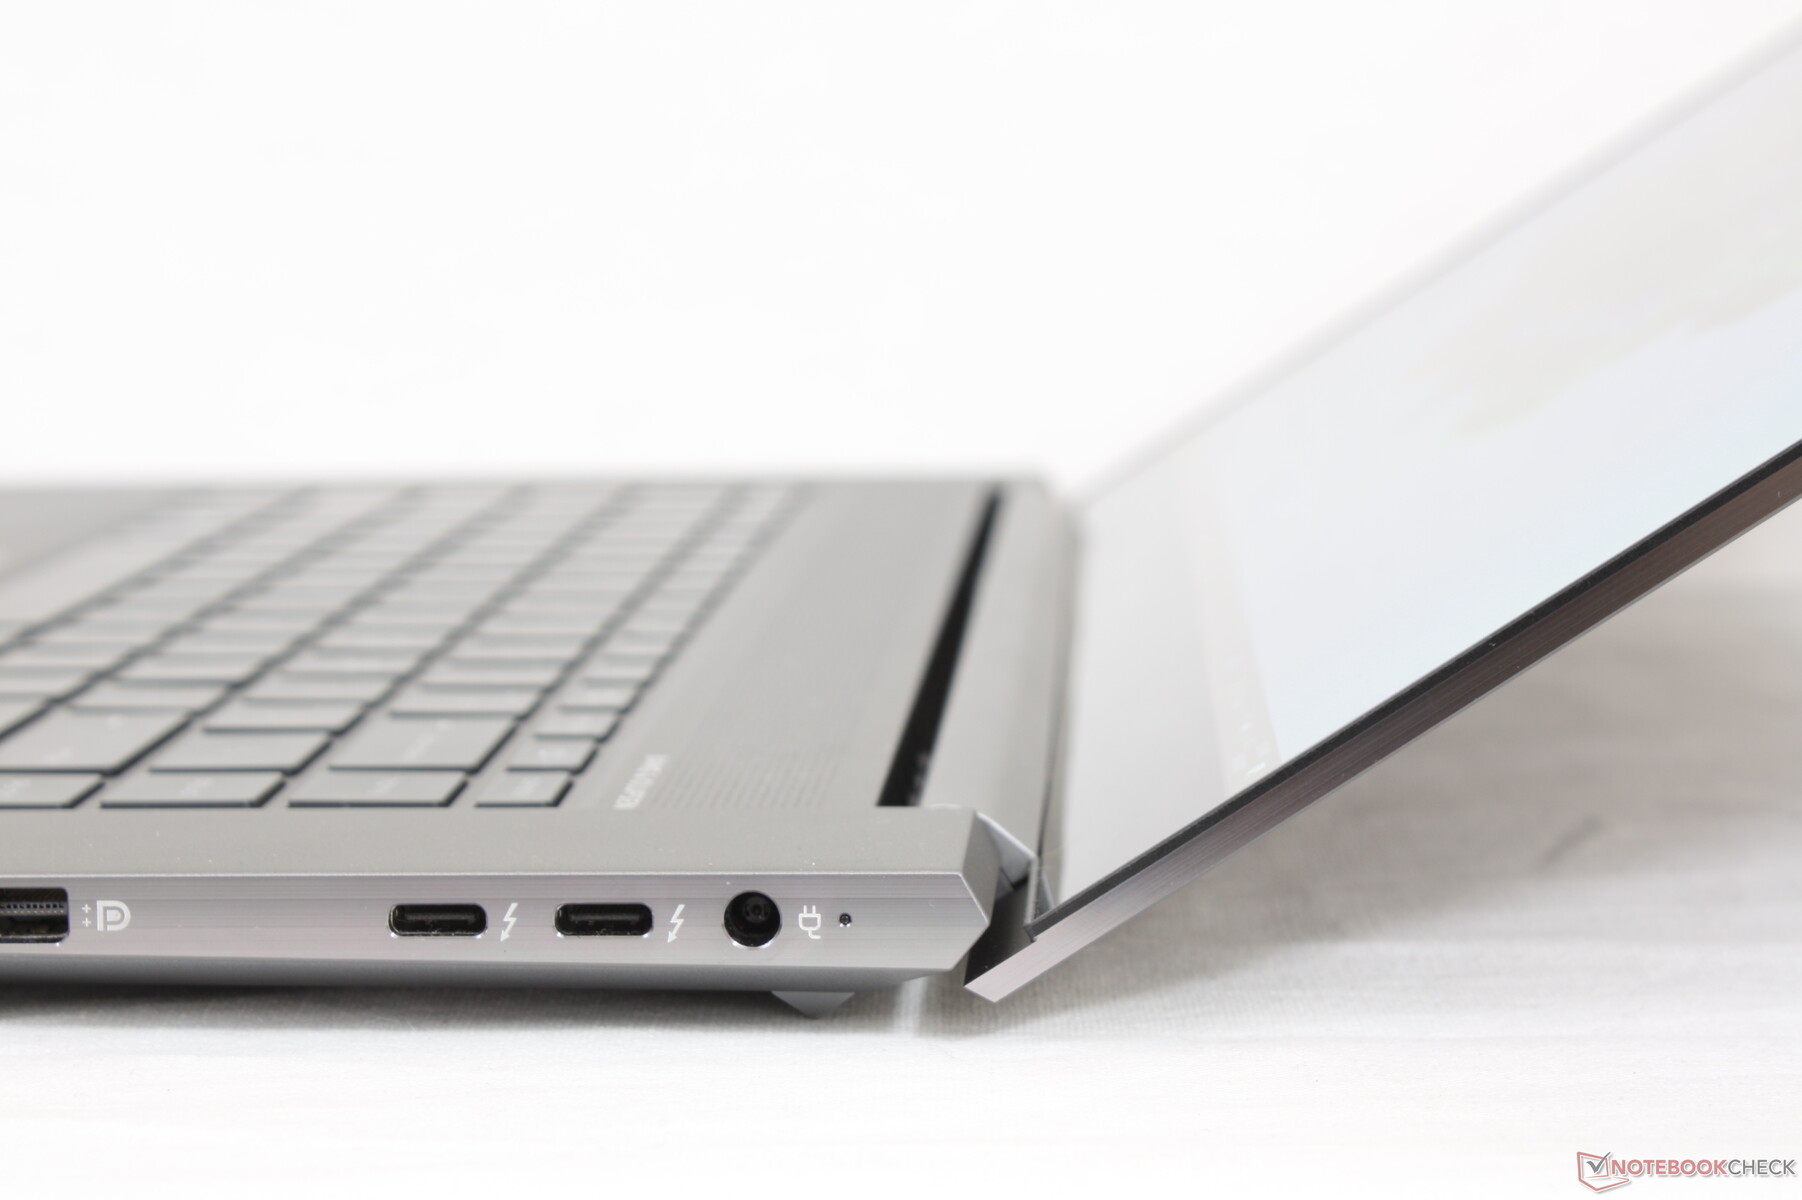
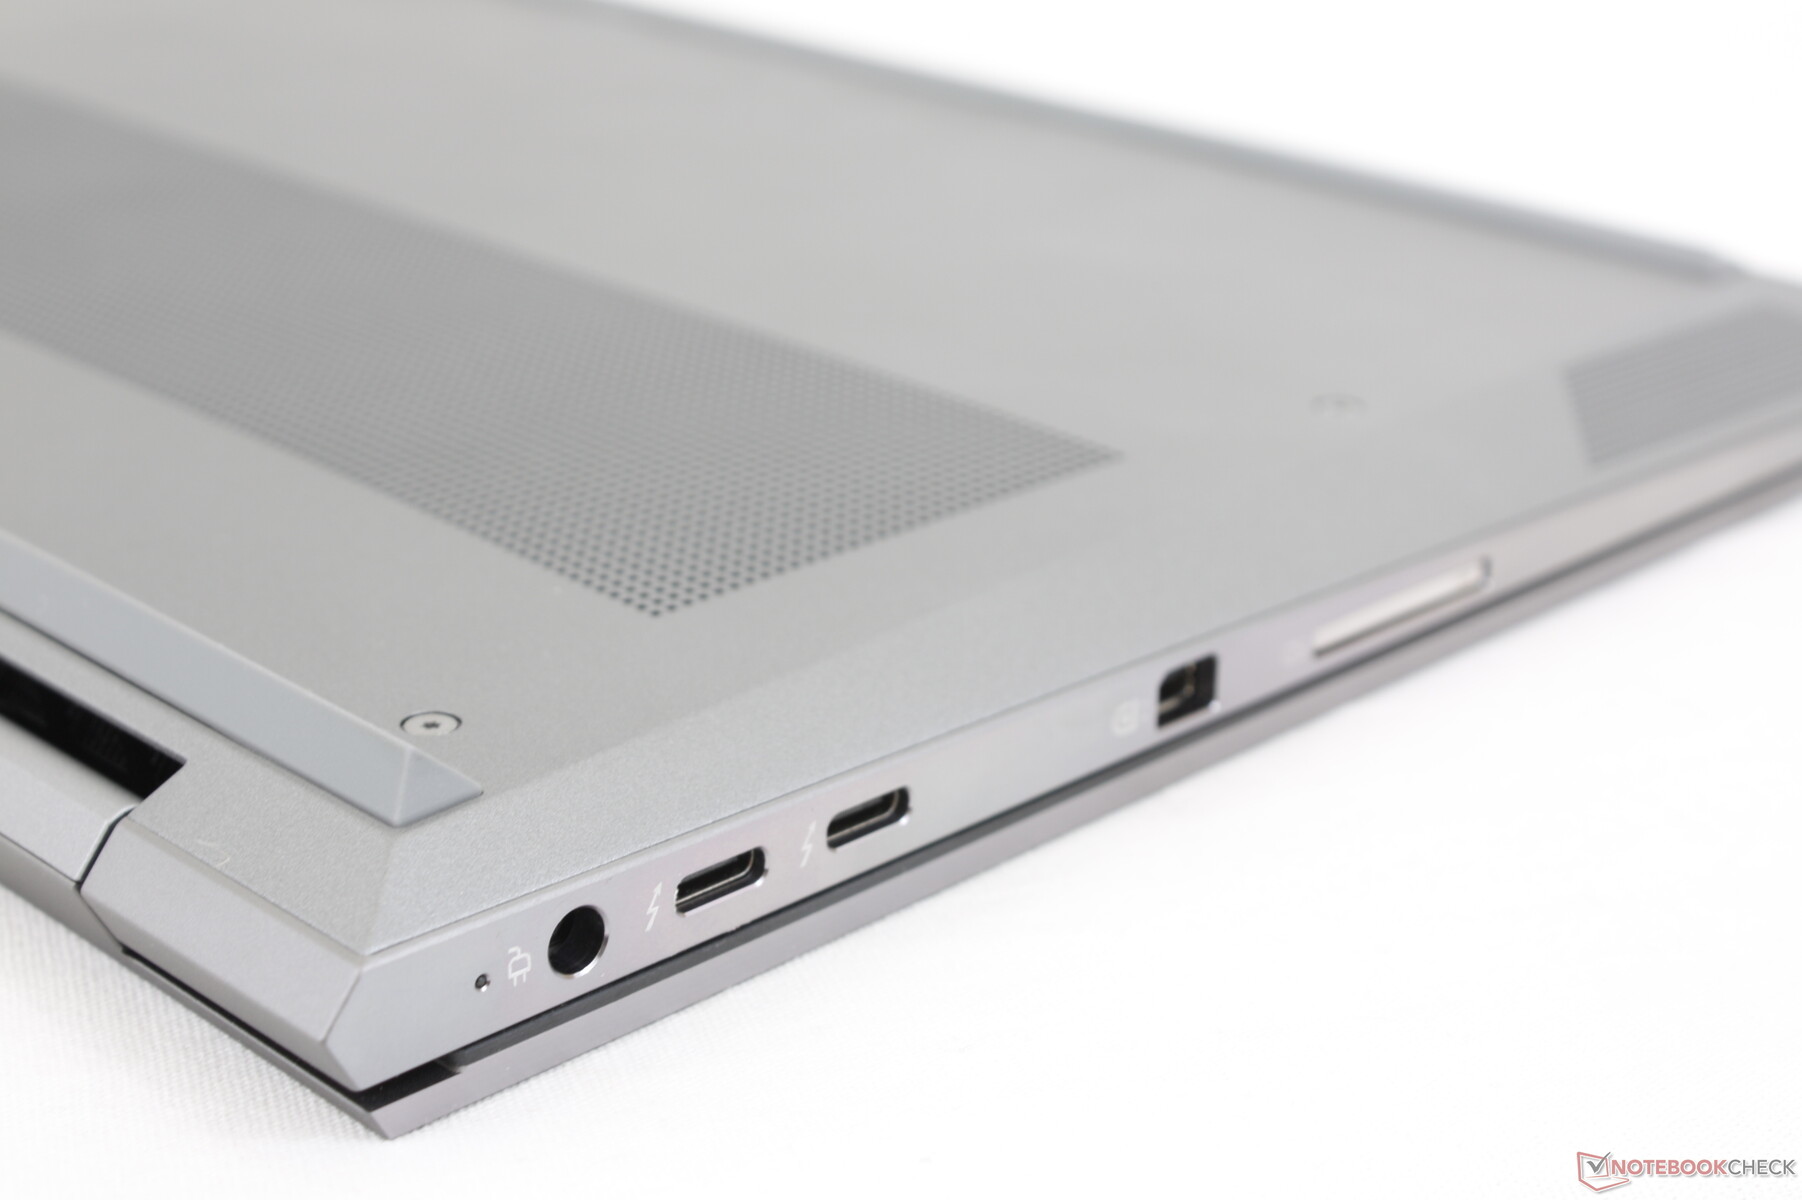
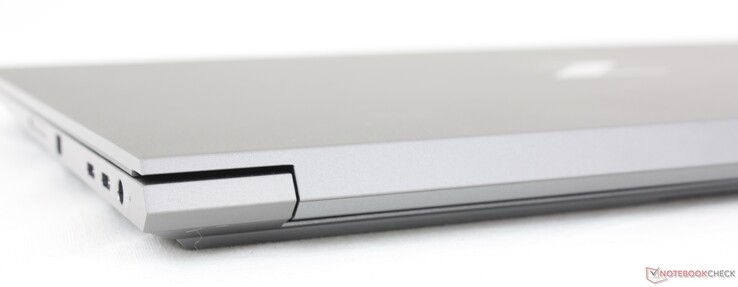
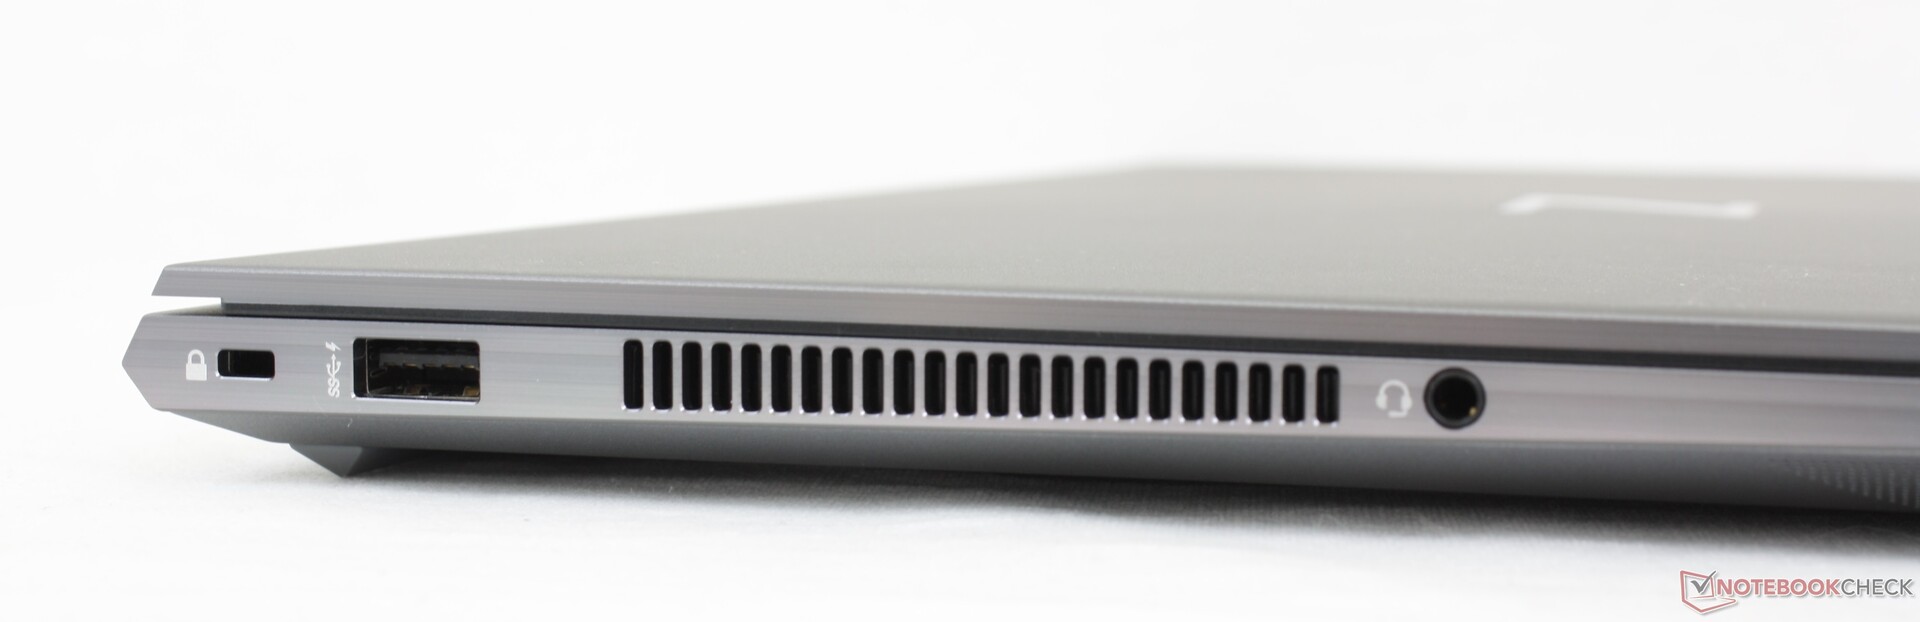
Connectivity — Now With Thunderbolt 4
Port options are fewer than on the Dell Precision 7550 as the latter integrates everything on the ZBook Studio G8 plus gigabit RJ-45, HDMI, and an extra USB-A port. Users will have to take advantage of the two integrated Thunderbolt 4 ports to fully exploit the docking capabilities of the HP system.
Port positioning is a bit tight between the proprietary AC adapter barrel port and the two USB-C ports along the right edge. Thicker cables or USB-C devices may block access to the adjacent ports.
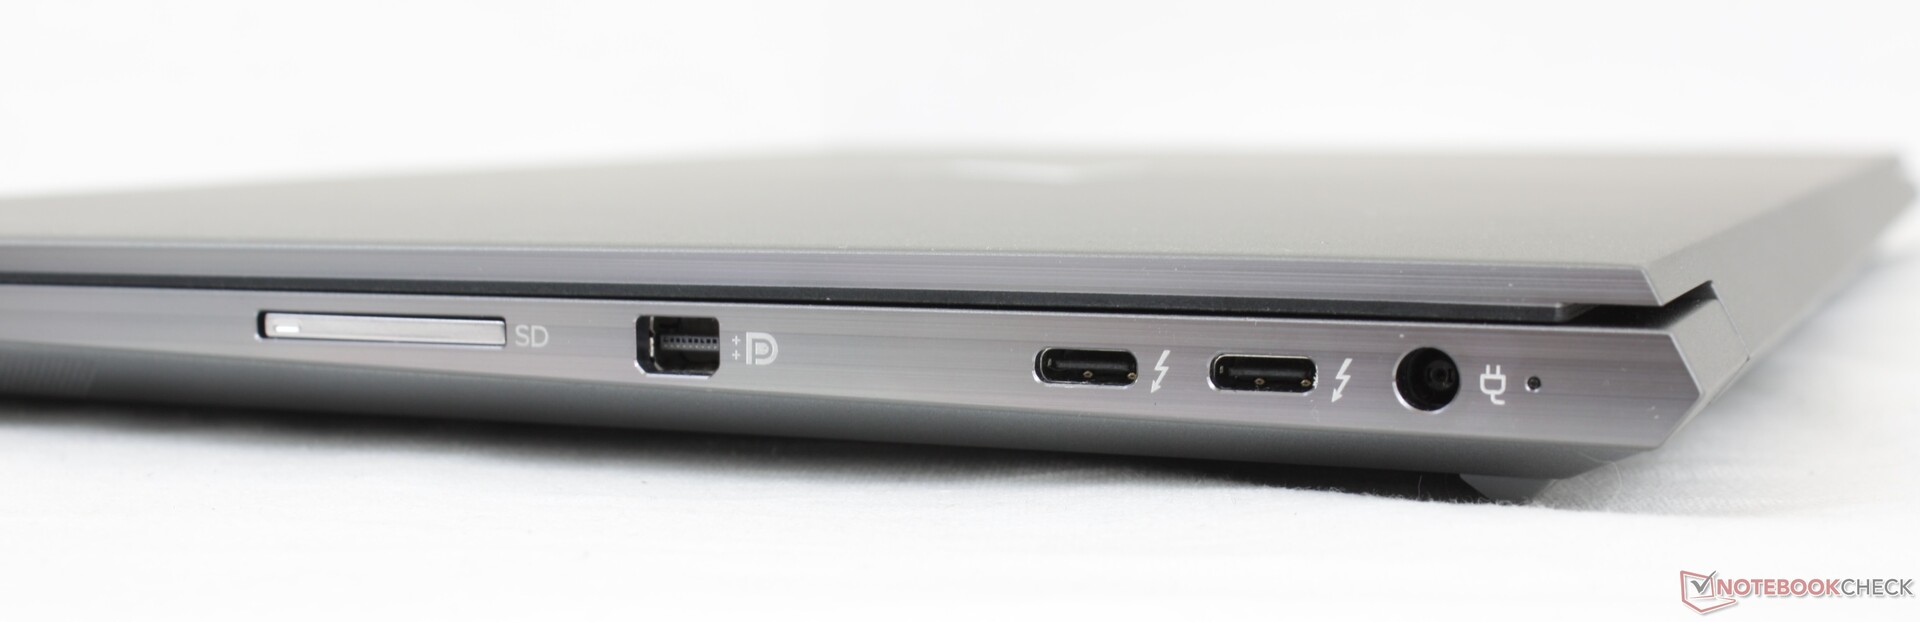
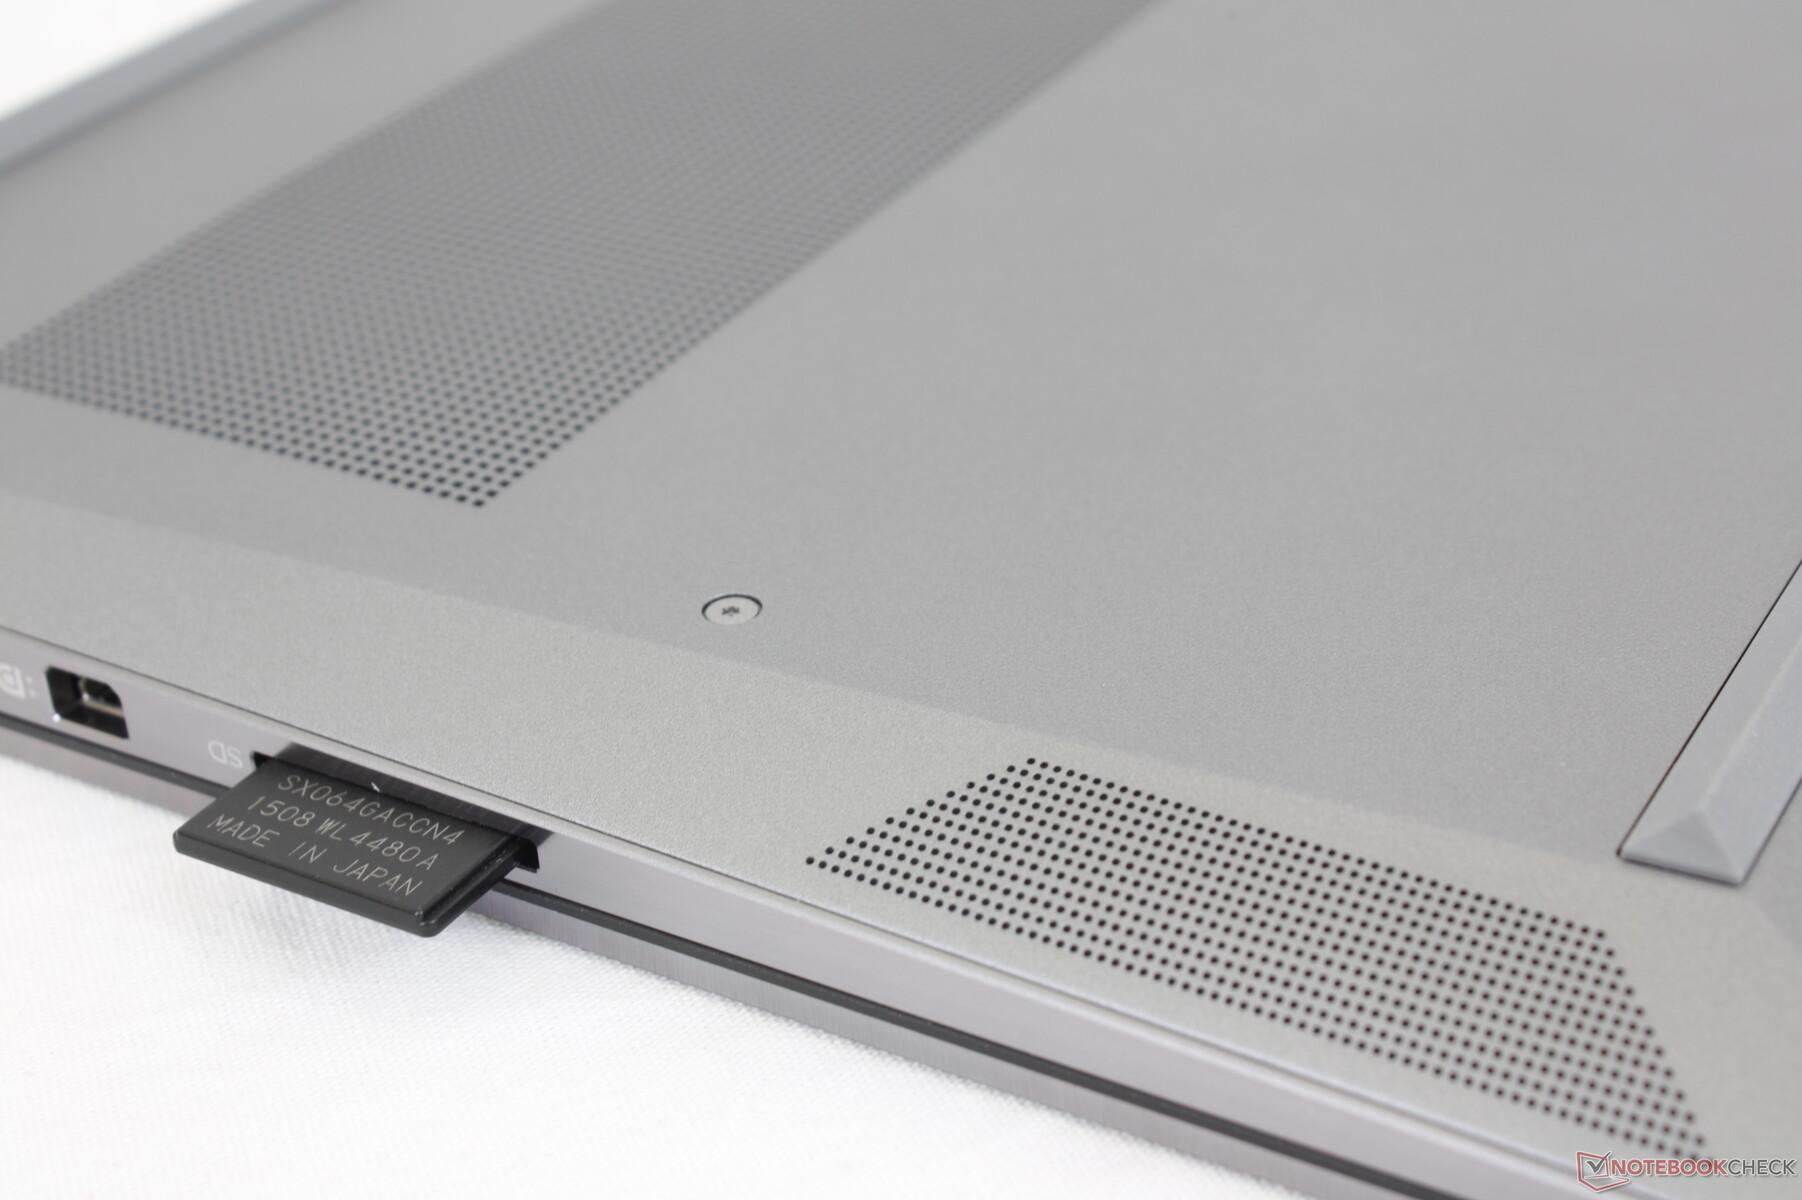
SD Card Reader
HP has actually downgraded the SD card reader this year. Moving 1 GB of images from our UHS-II test card to desktop takes around 14 seconds compared to less than half that on the ZBook Studio G7. We're not sure why HP would do this, but it's disappointing nonetheless especially for content creators who rely on the card reader.
| SD Card Reader | |
| average JPG Copy Test (av. of 3 runs) | |
| Dell Precision 7550 (Toshiba Exceria Pro SDXC 64 GB UHS-II) | |
| HP ZBook Studio G7 (AV Pro V60) | |
| HP ZBook Studio 15 G8 (AV Pro V60) | |
| Lenovo ThinkPad P15s Gen2-20W6000GGE (AV Pro V60) | |
| maximum AS SSD Seq Read Test (1GB) | |
| Dell Precision 7550 (Toshiba Exceria Pro SDXC 64 GB UHS-II) | |
| HP ZBook Studio G7 (AV Pro V60) | |
| Lenovo ThinkPad P15s Gen2-20W6000GGE (AV Pro V60) | |
| HP ZBook Studio 15 G8 (AV Pro V60) | |
Communication
The Intel AX201 comes standard for Wi-Fi 6 and Bluetooth 5.2 connectivity. Transfer rates are stable at around 1400 Mbps in both directions when paired to our Netgear RAX200 test router.
Webcam


Security
HP has a entire suite of software and low-level protective measures including Sure Click, Secure Erase, BIOSphere, Sure Start, Sure Run, Tamper Lock, optional Sure View, and many more on top of the usual fingerprint reader and TPM. A simple webcam shutter is blatantly missing, however, which we feel is a massive oversight on HP's part.
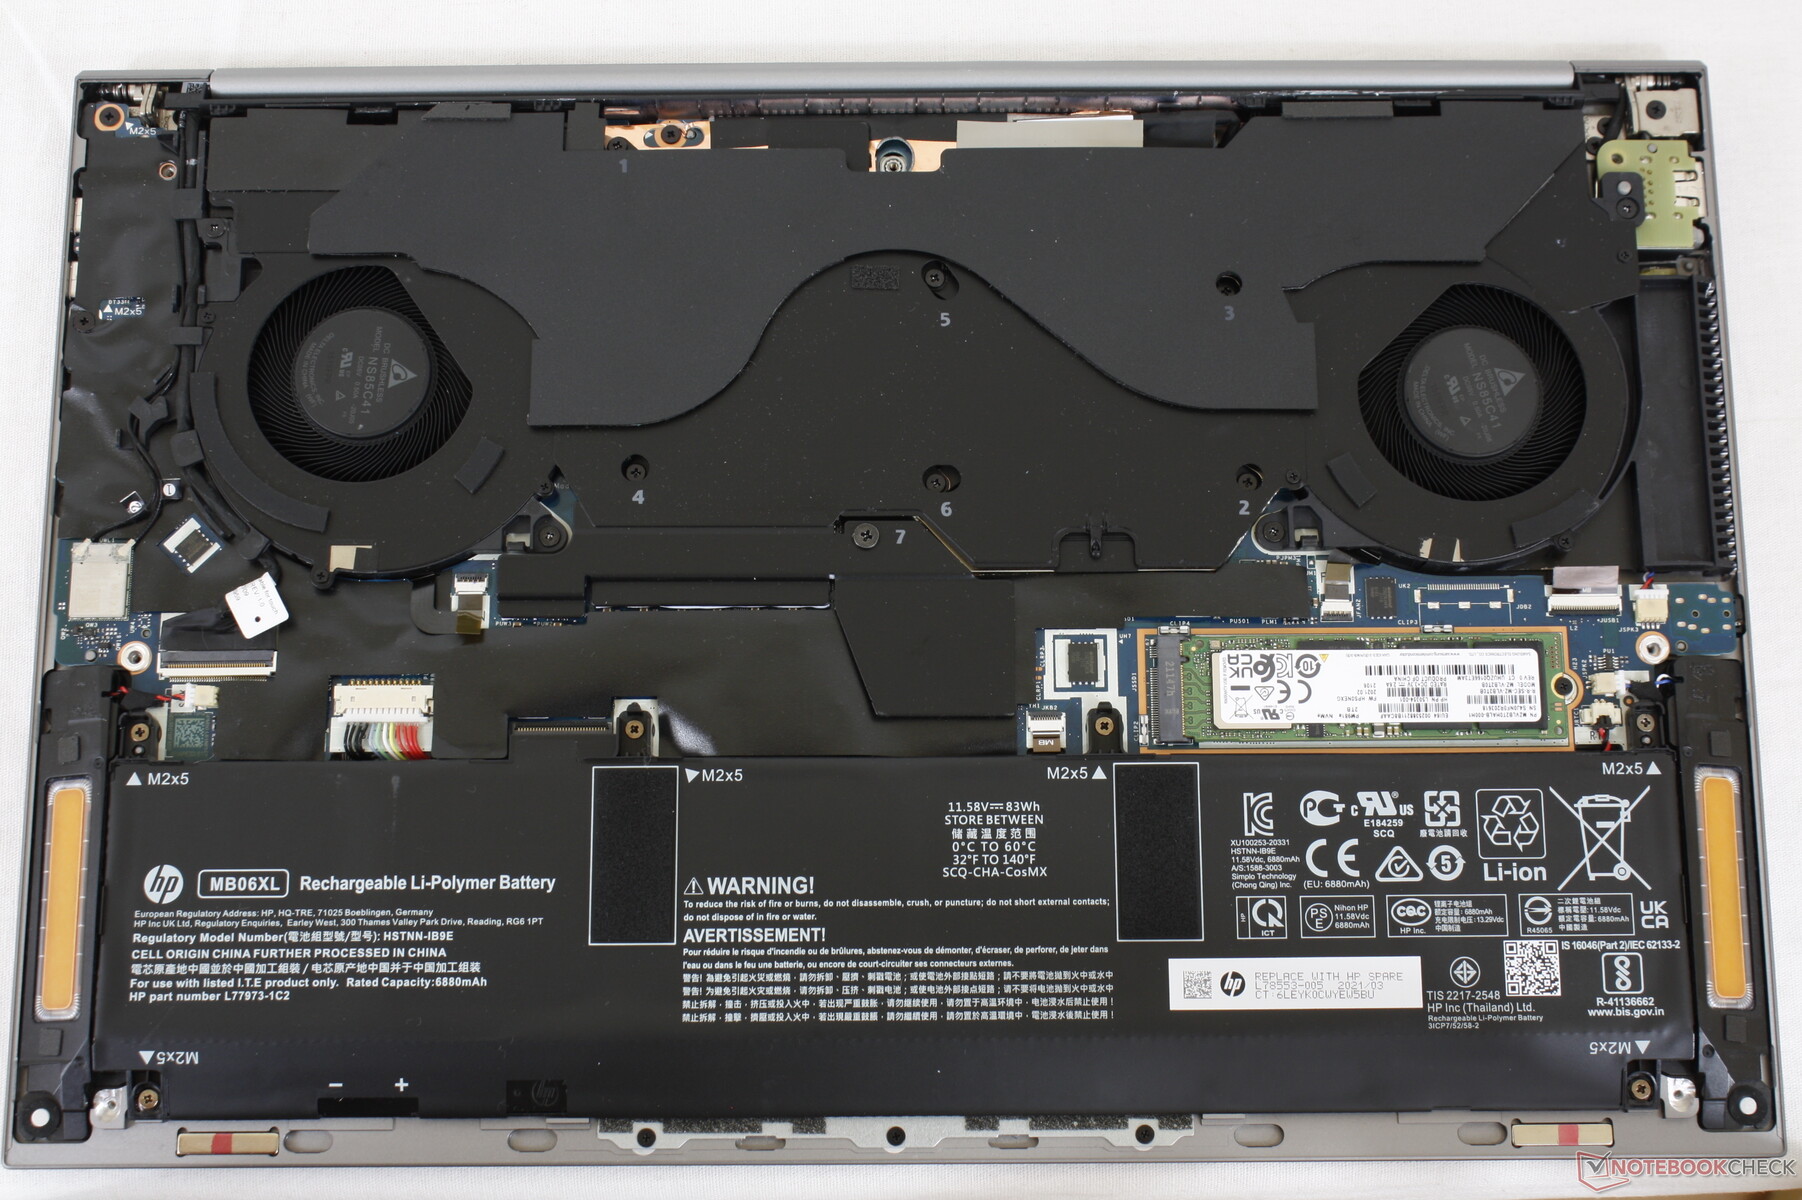
Maintenance
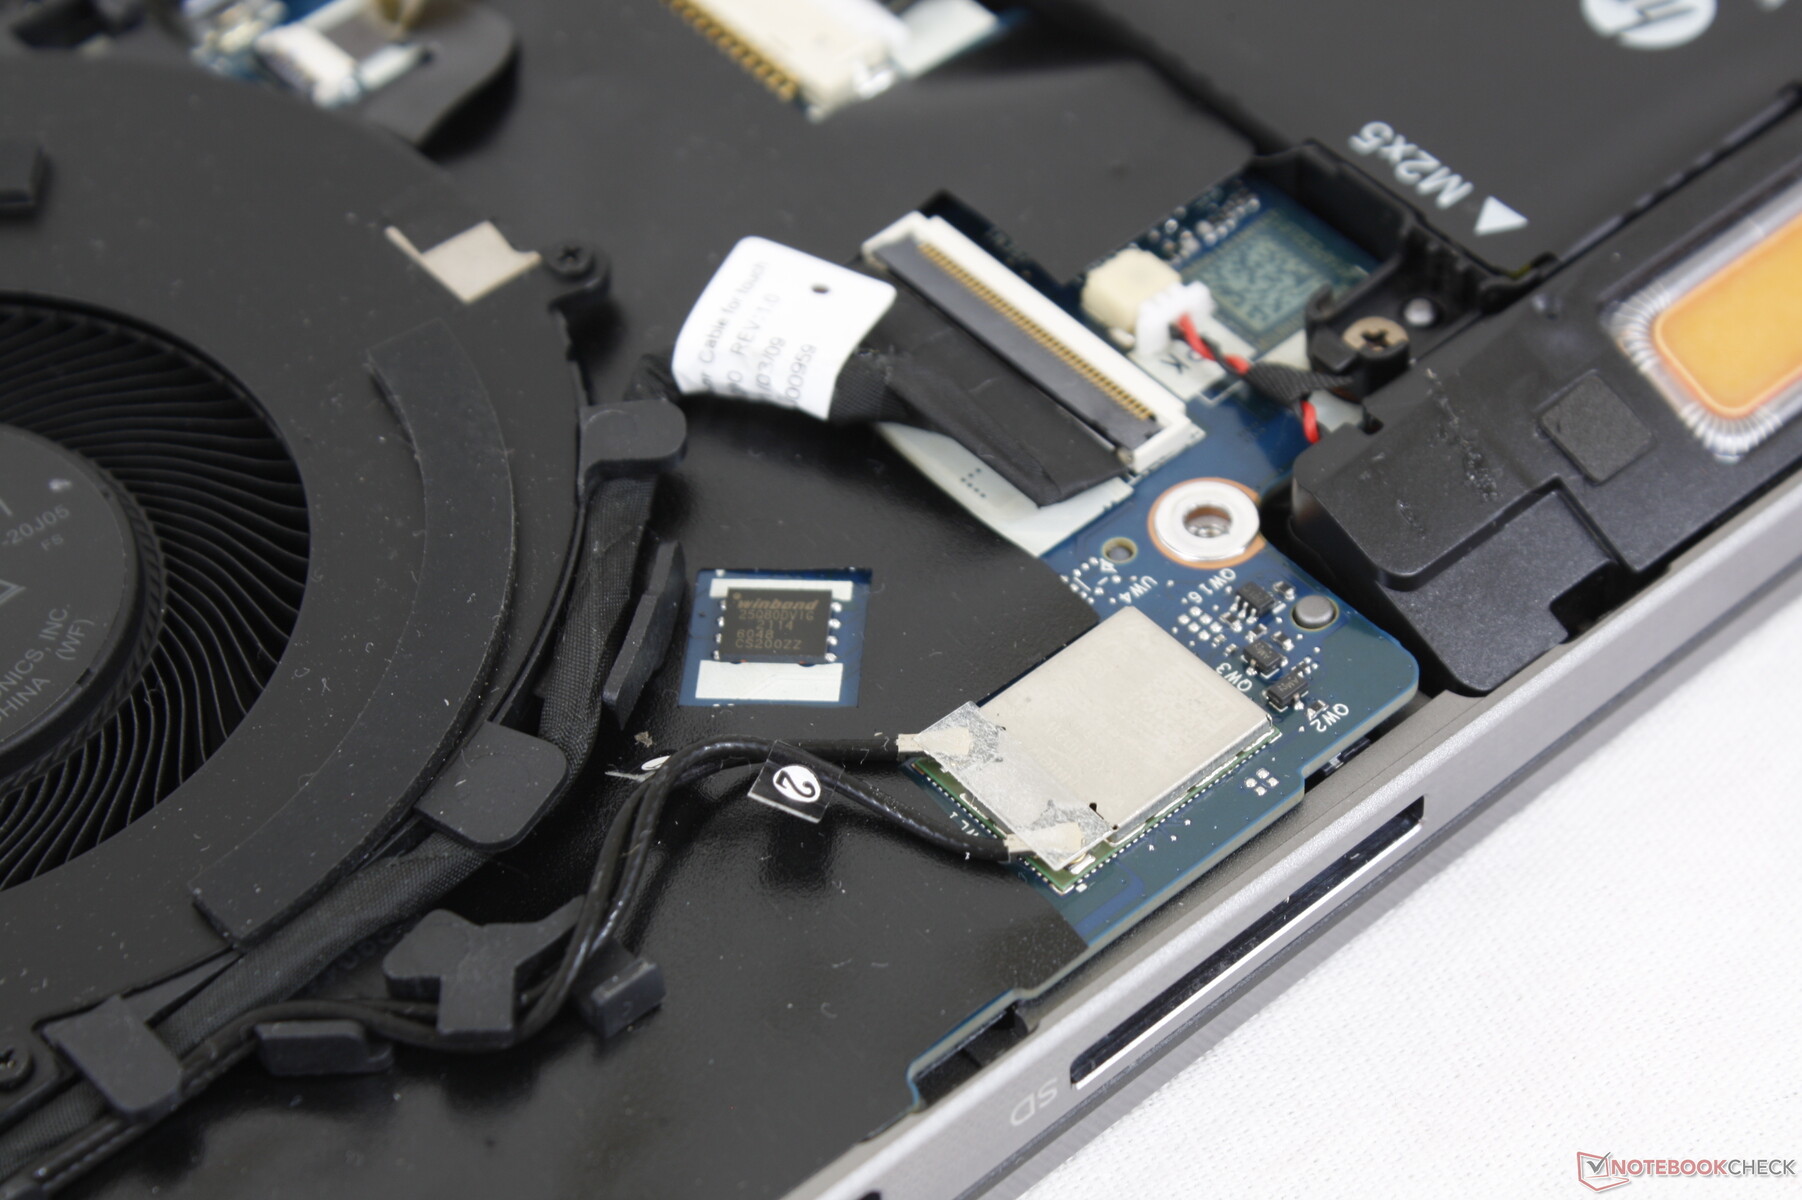
The bottom panel requires a Philips screwdriver and sharp edge to pry open. There's not much to upgrade once inside, however, as the RAM and WLAN modules are soldered.
Accessories and Warranty
The retail box includes no extras outside of the AC adapter and paperwork. A base one-year warranty comes standard instead of the two-year or three-year warranty that high-end workstations tend to offer at no additional cost.
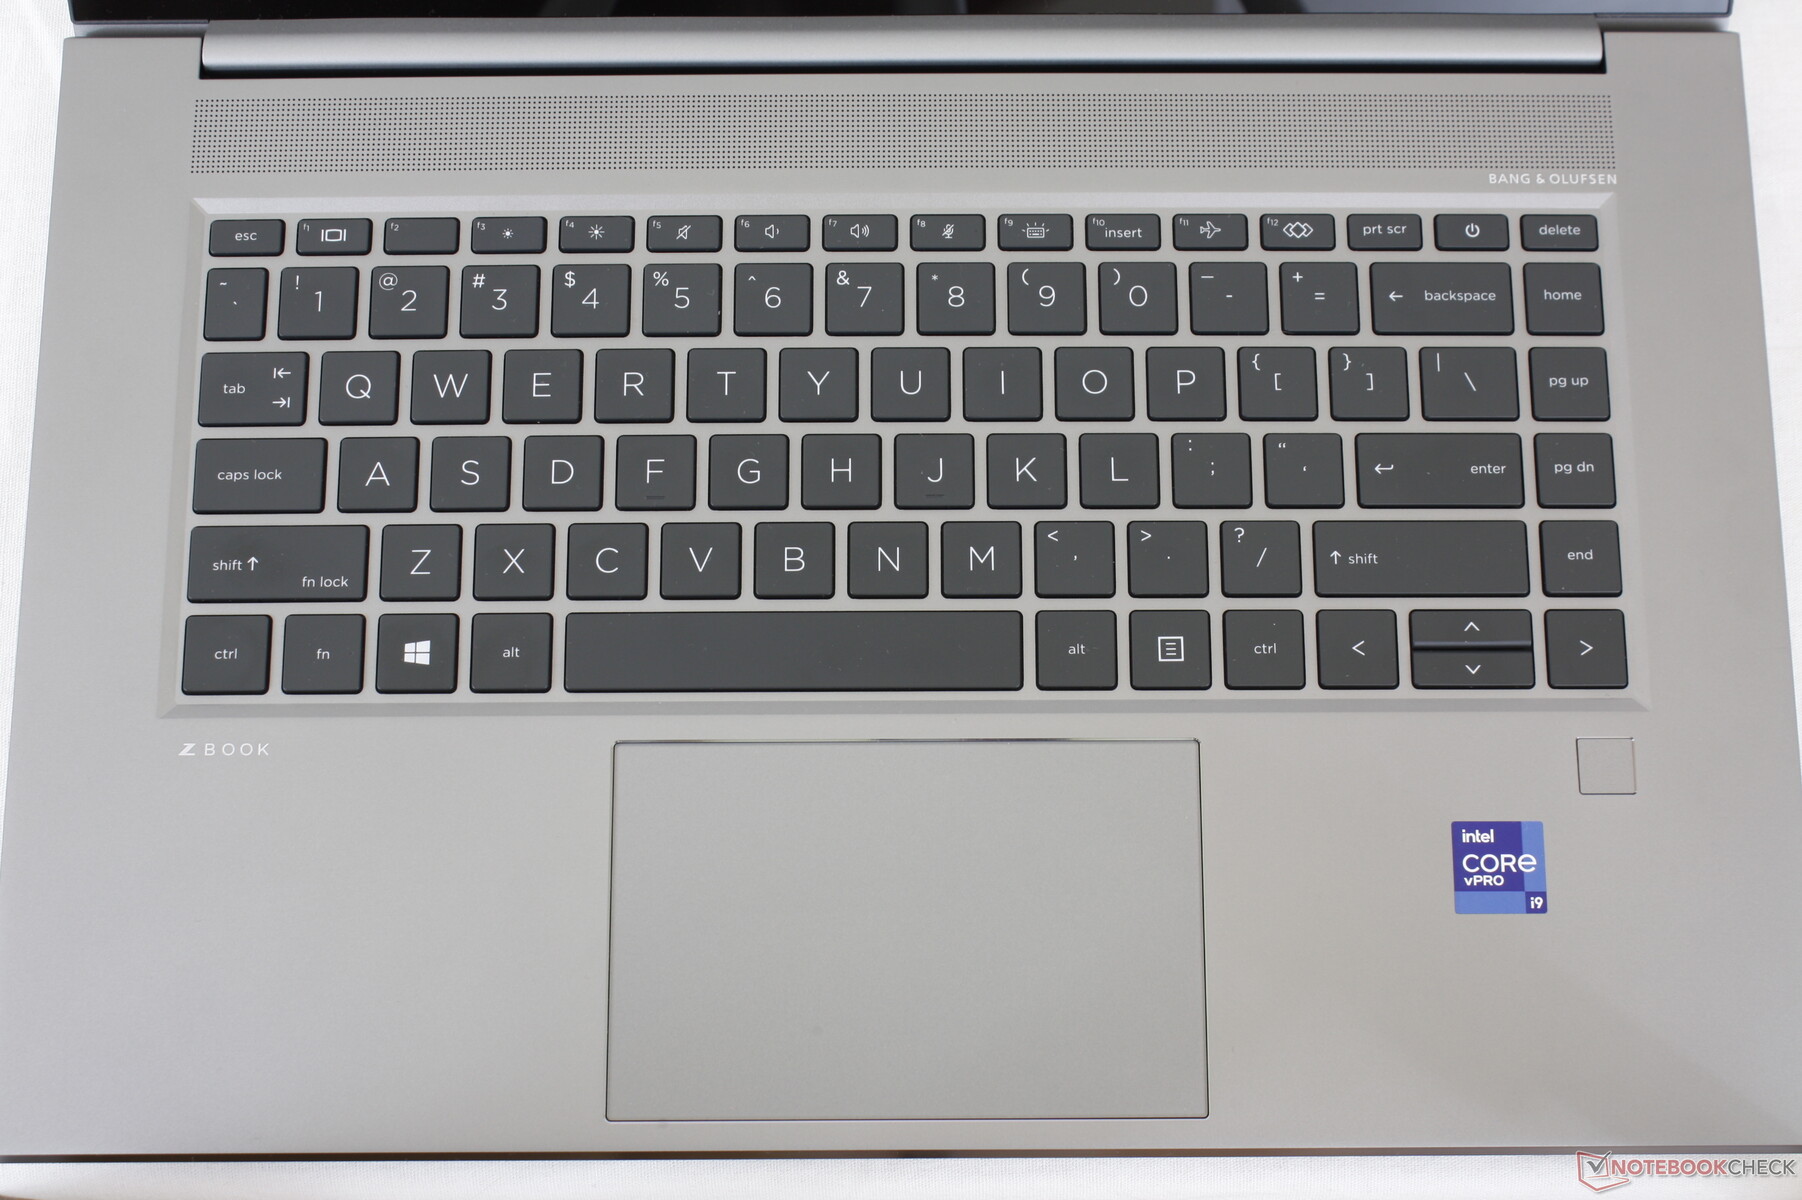
Input Devices — We Miss The Dedicated Mouse Keys and TrackPoint
Keyboard
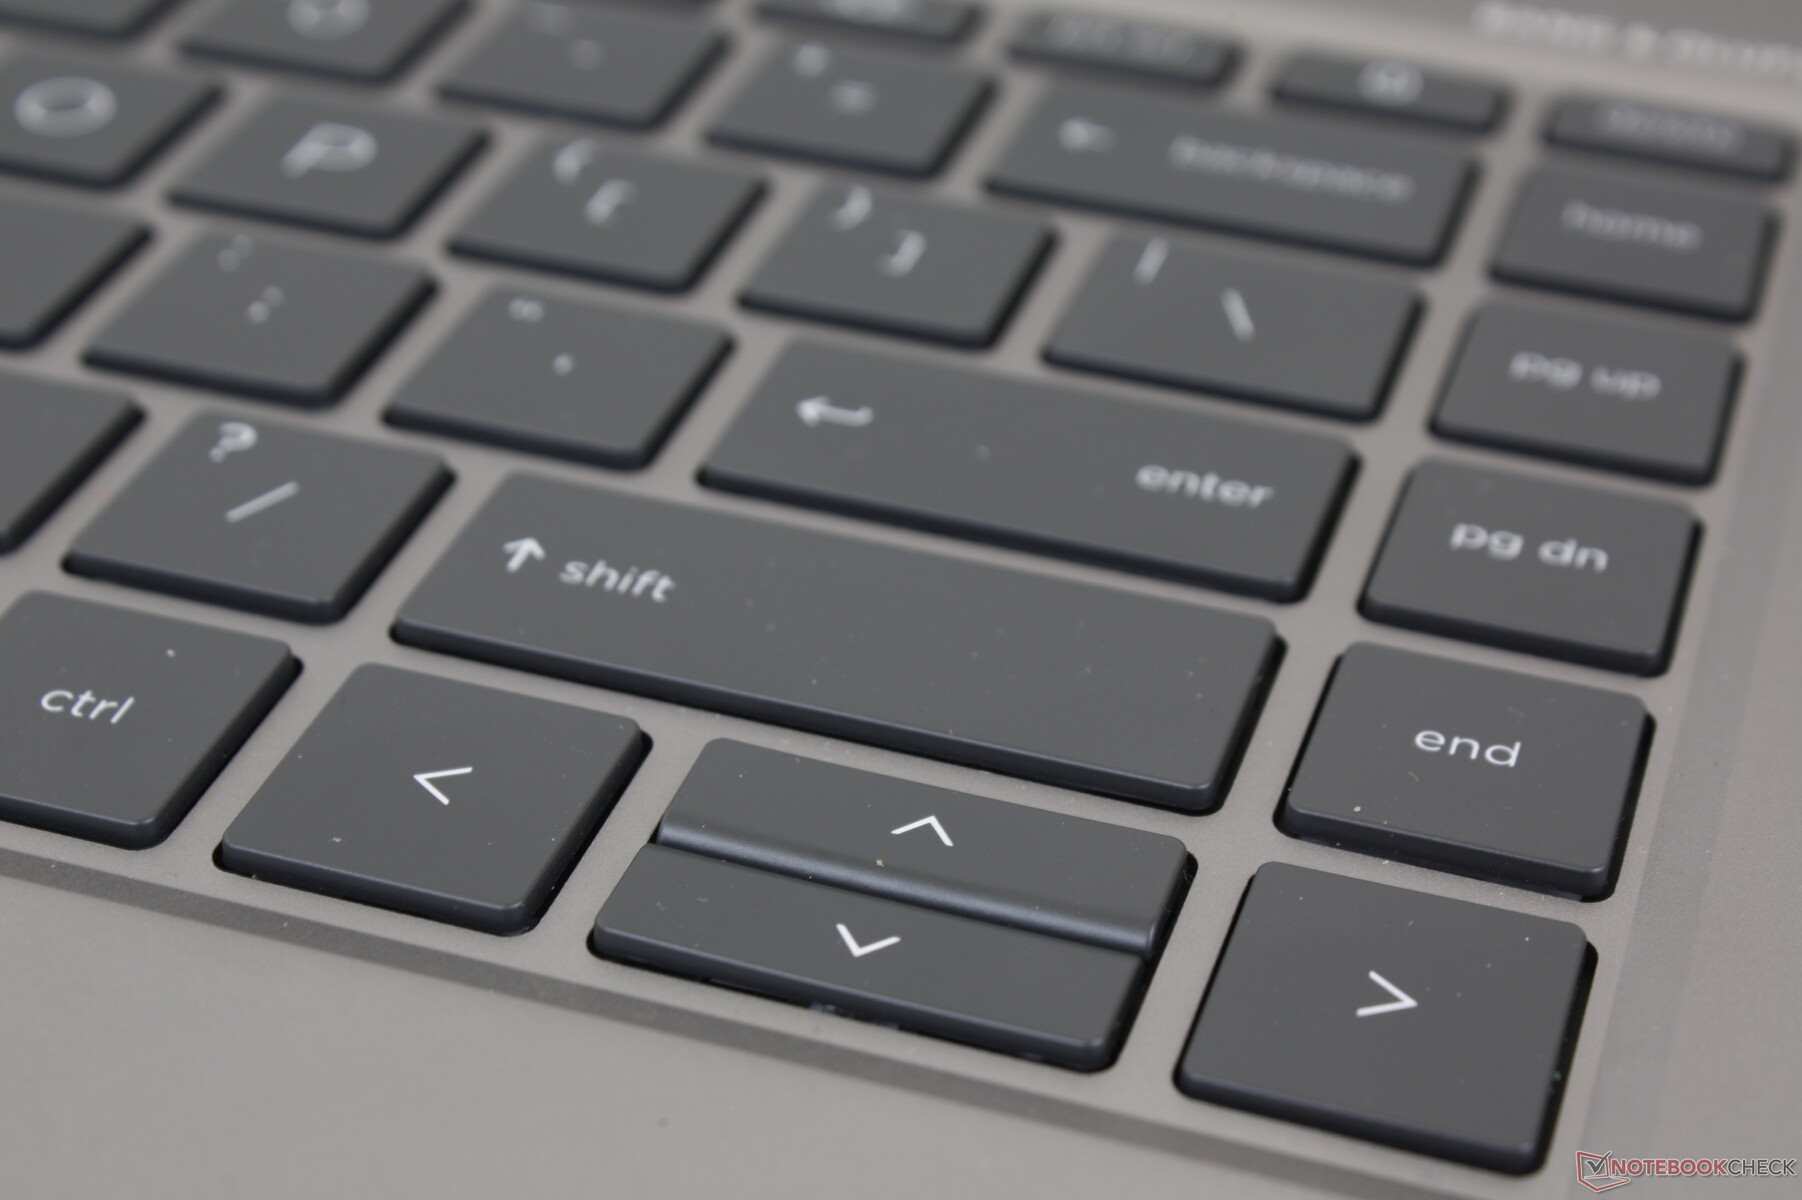
Higher-end HP models like the Envy, Spectre, EliteBook, or ZBook have some of the best keyboards in the laptop market. Their keys tend to be crisper and deeper for stronger feedback and a more satisfying typing experience. The main drawback is the louder key clatter when compared to the softer and quieter keys of the MSI WS66 or Razer Blade Studio.
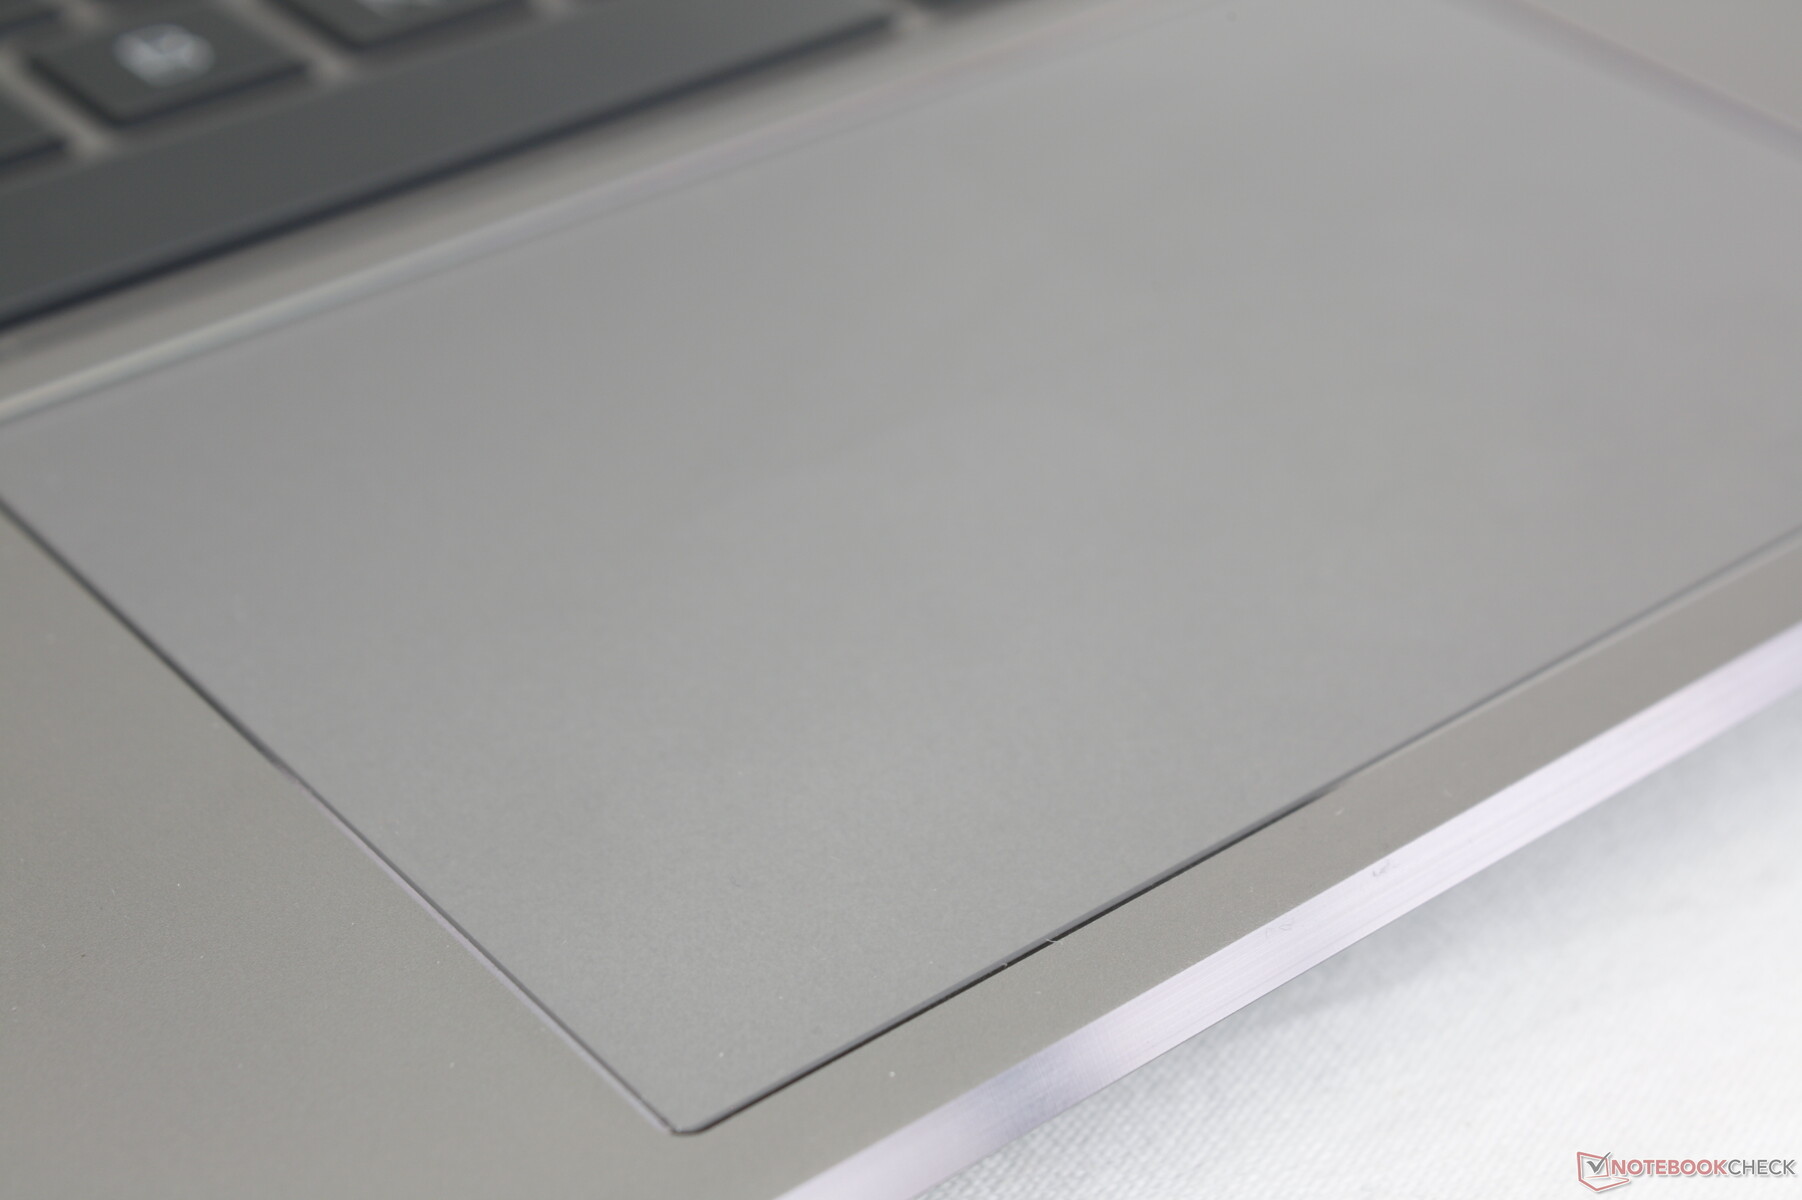
Touchpad
The smooth clickpad (11.5 x 7.3 cm) lacks dedicated buttons unlike on the ZBook Firefly, ZBook Fury, and most other traditional mobile workstations for that matter. Nonetheless, the clickpad isn't nearly as spongy as on the Razer Blade Studio for more reliable clicking and multi-touch inputs.

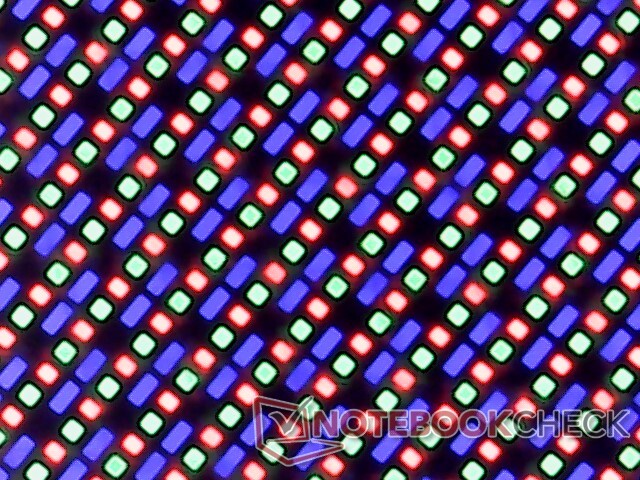
Display — OLED Has Some Drawbacks
Whereas HP uses LG for its 4K IPS option, this 4K OLED option comes from Samsung instead. The biggest advantages of OLED are its perfect black levels, wider gamut, and extremely fast black-white and gray-gray response times for livelier colors and essentially zero ghosting.
On the other hand, the main drawbacks to this OLED panel are its 400-nit brightness, 60 Hz refresh rate, presence of pulse-width modulation, and higher power consumption than IPS. While 400 nits is not dim by any means, it is the dimmest option available for this model. Similarly, the 60 Hz refresh rate isn't necessarily slow, but HP offers 120 Hz only for IPS. Pulse-width modulation or screen flickering is present at frequencies of 240 Hz and 59 Hz at brightness levels of 0 to 52 percent and 53 percent and 99 percent, respectively, which may cause eyestrain to some users. And finally, the higher power consumption is a known fact as detailed here on other laptops that use similar OLED technology.

| |||||||||||||||||||||||||
Brightness Distribution: 95 %
Center on Battery: 379.6 cd/m²
Contrast: ∞:1 (Black: 0 cd/m²)
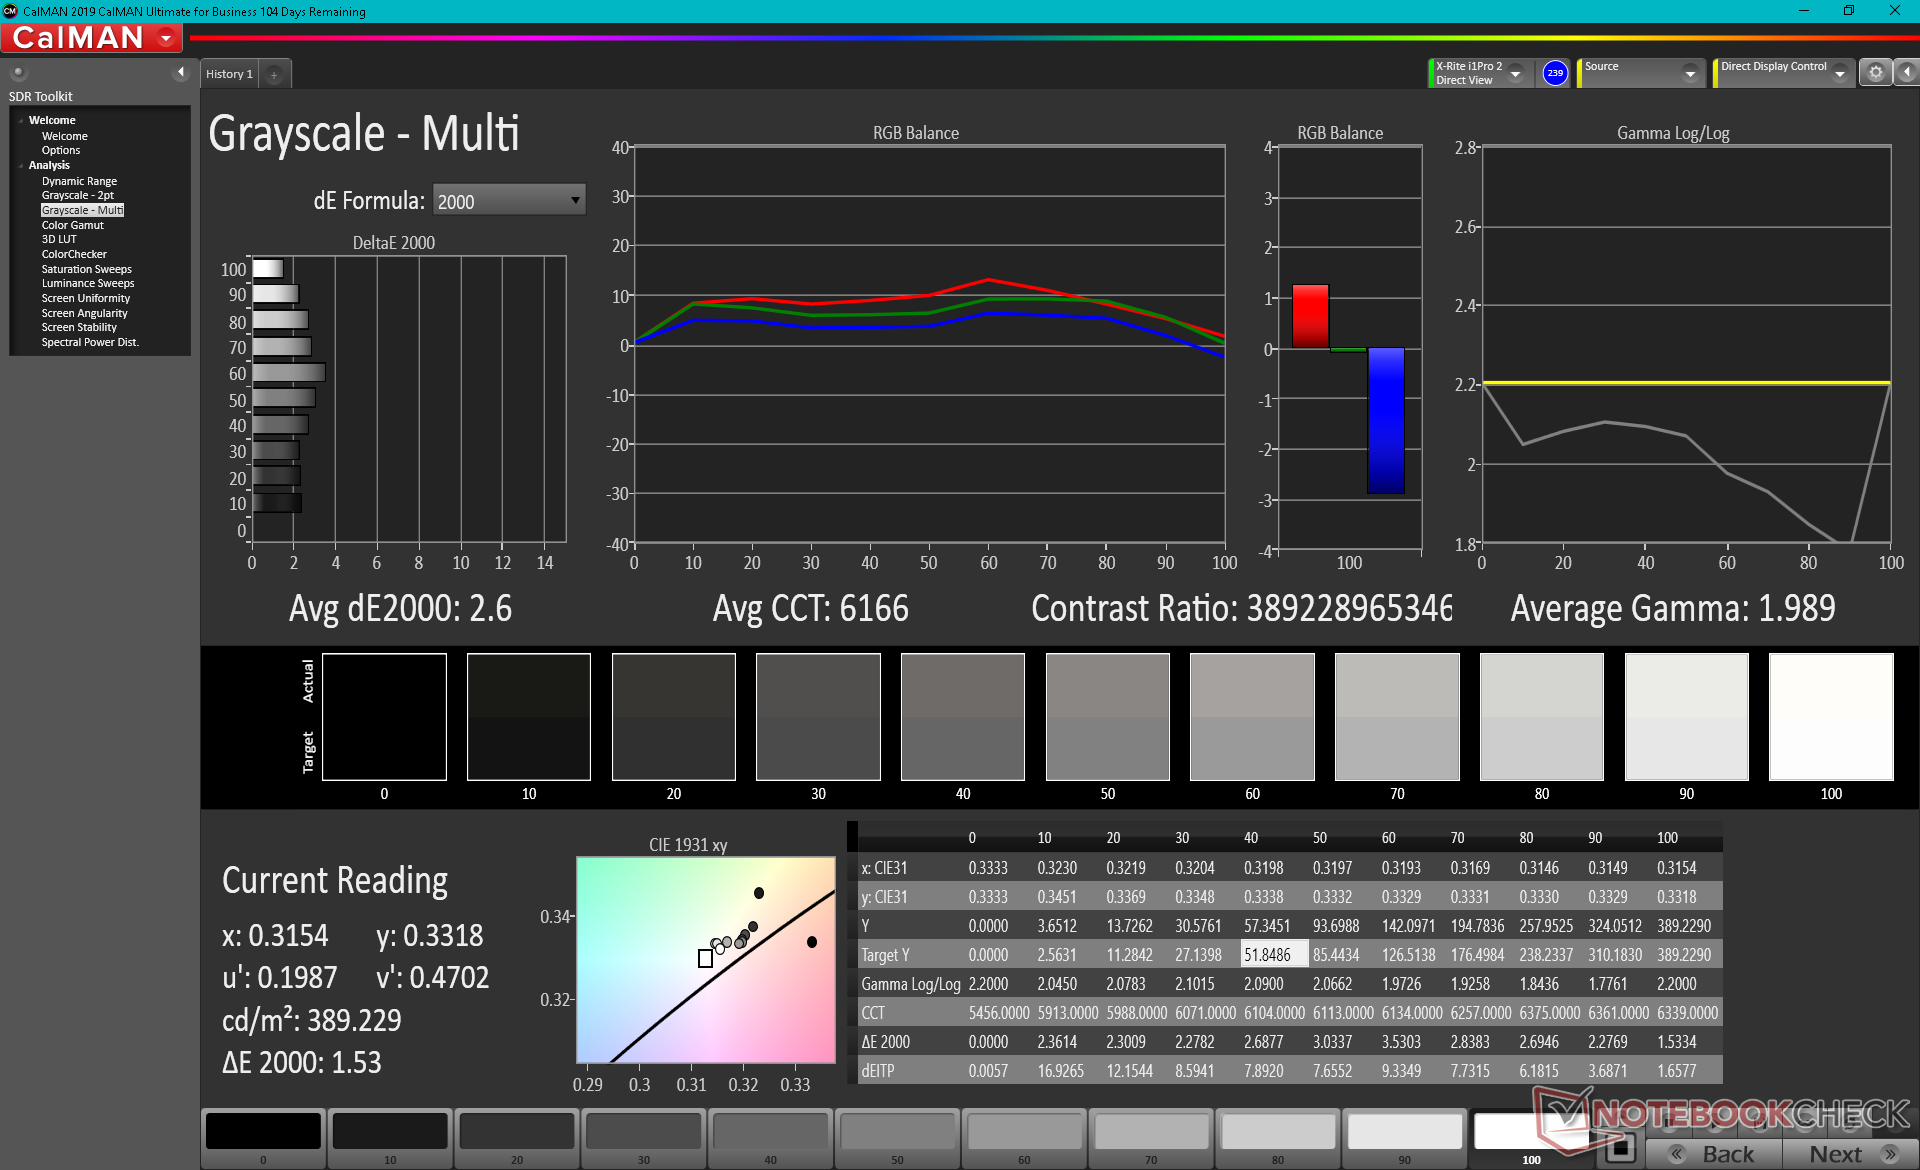
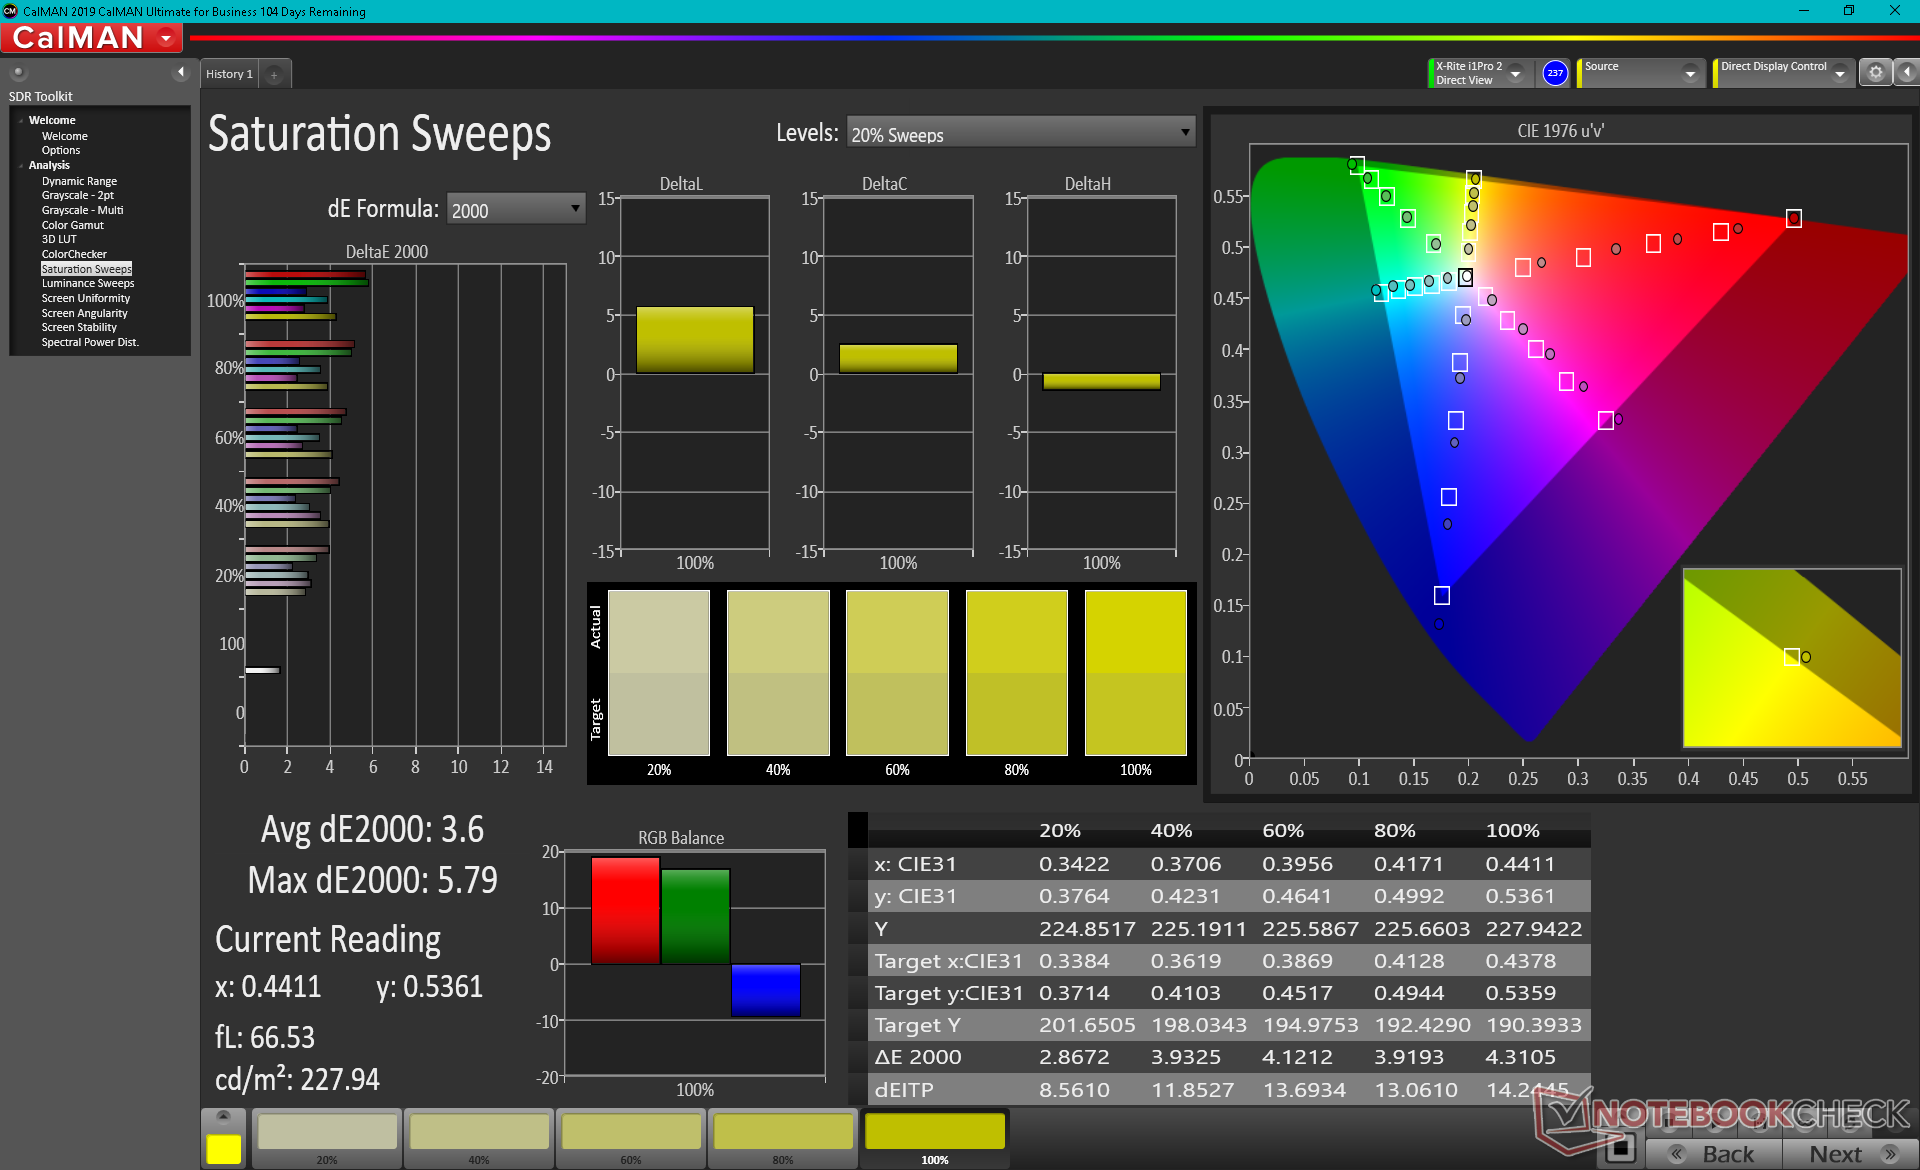
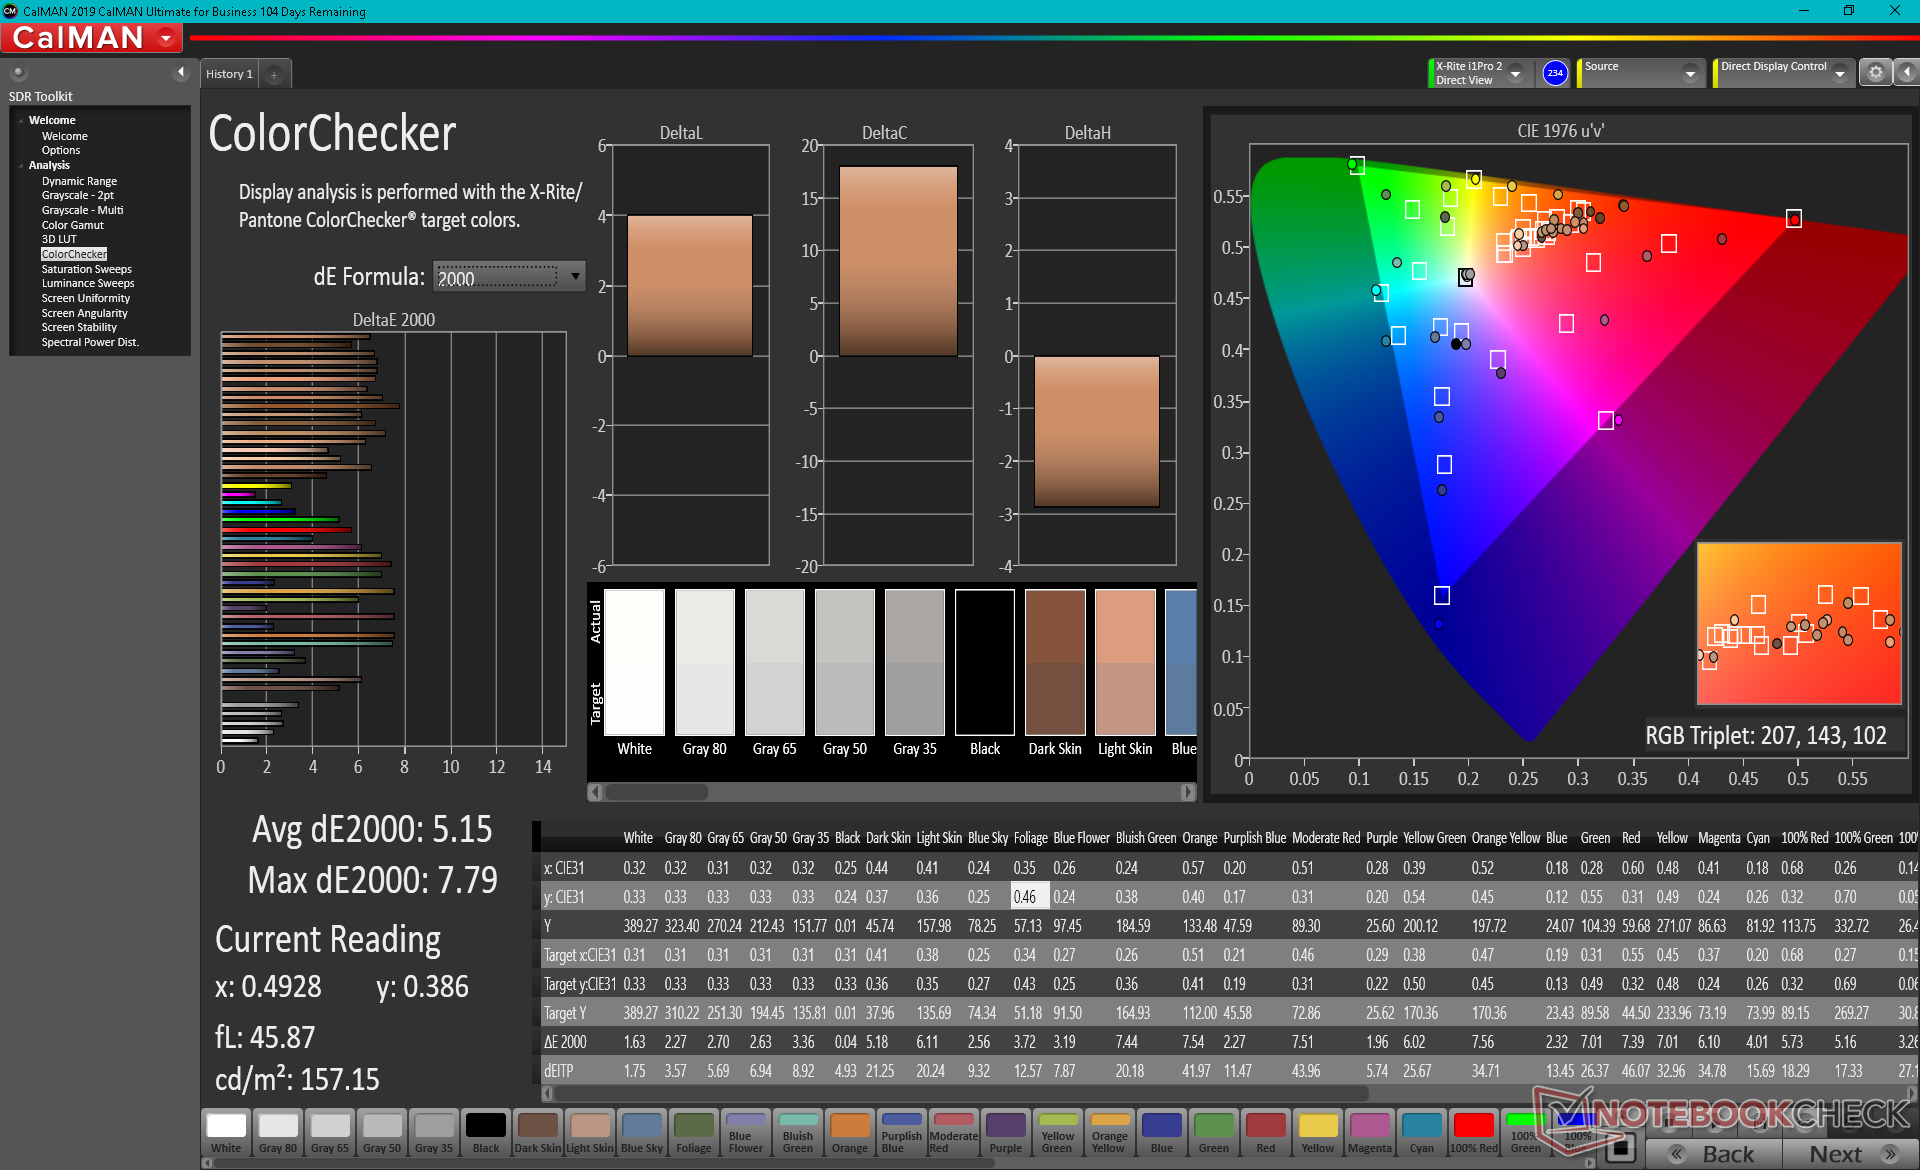
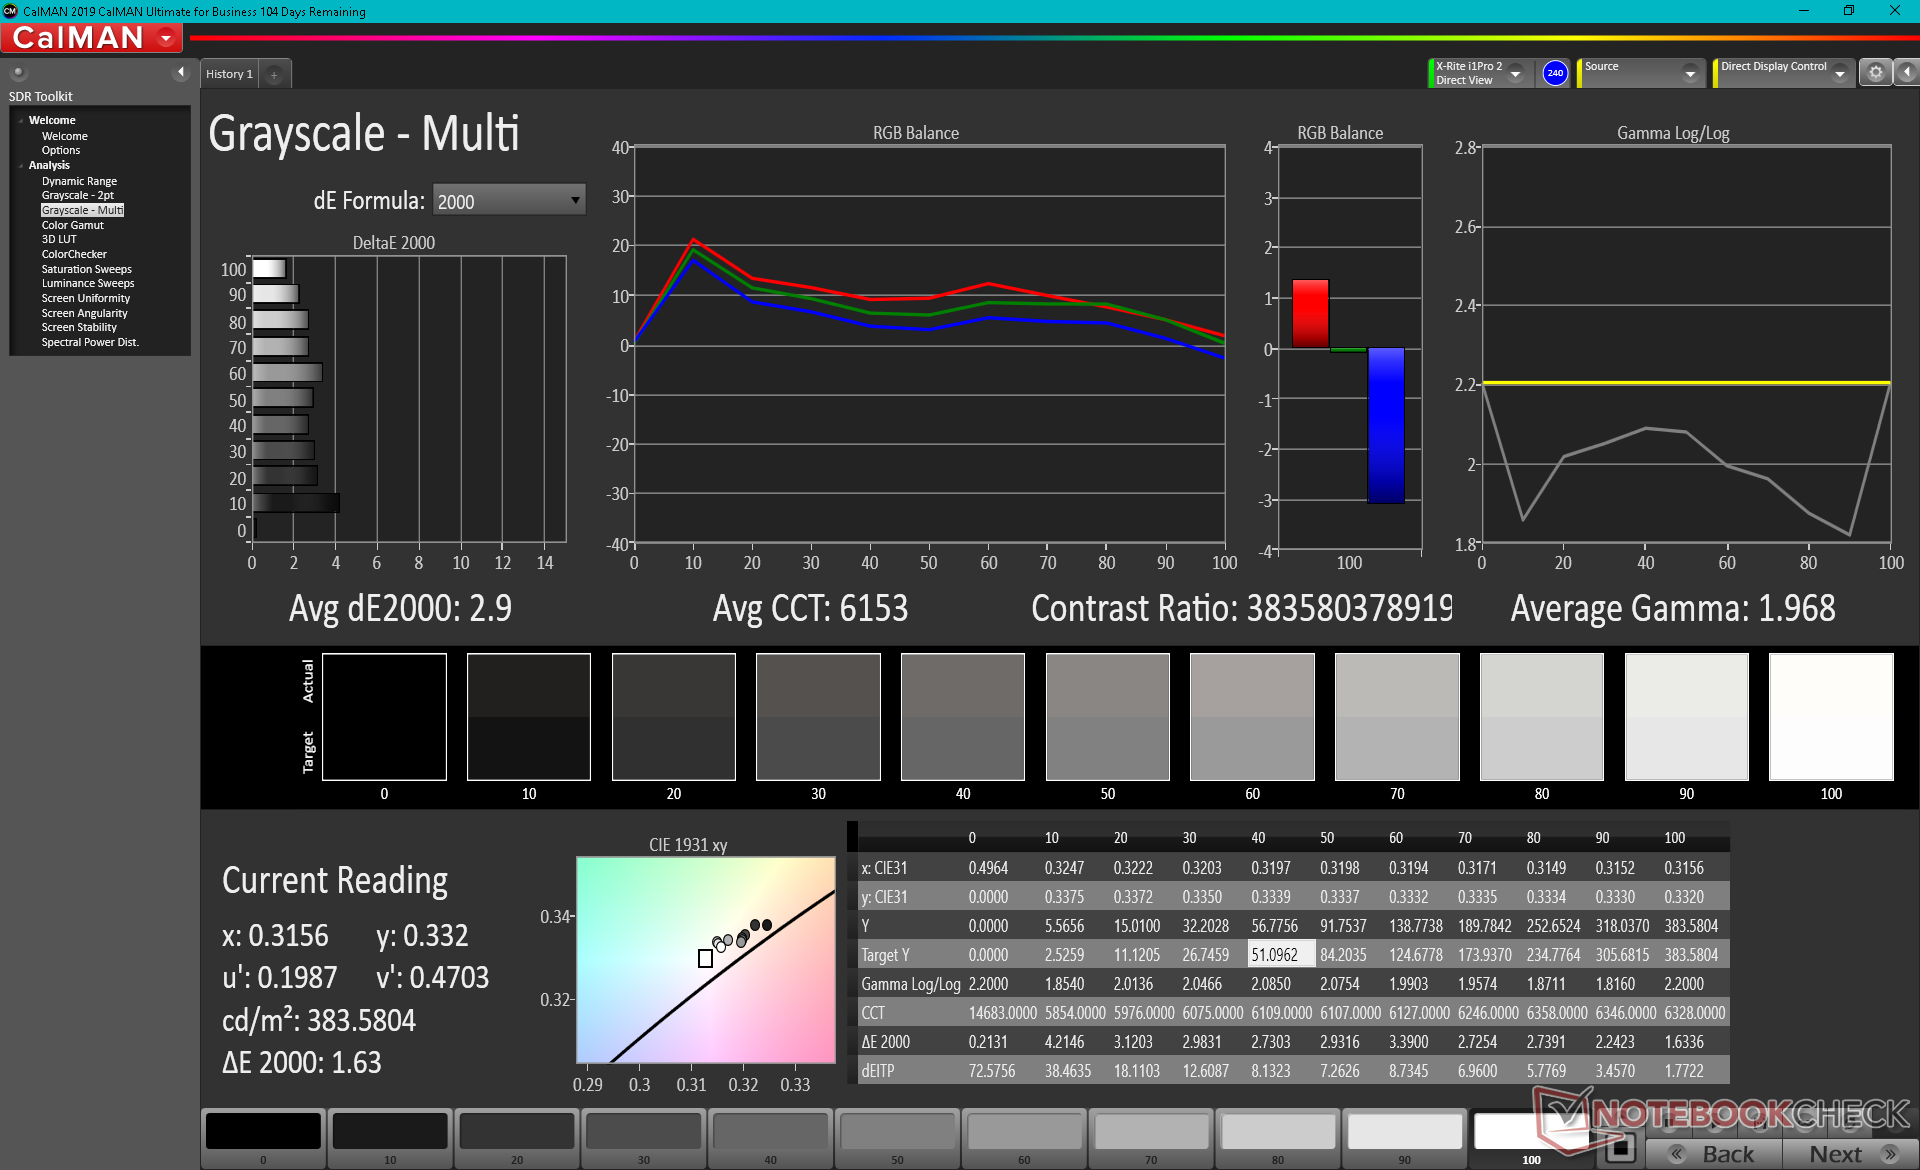
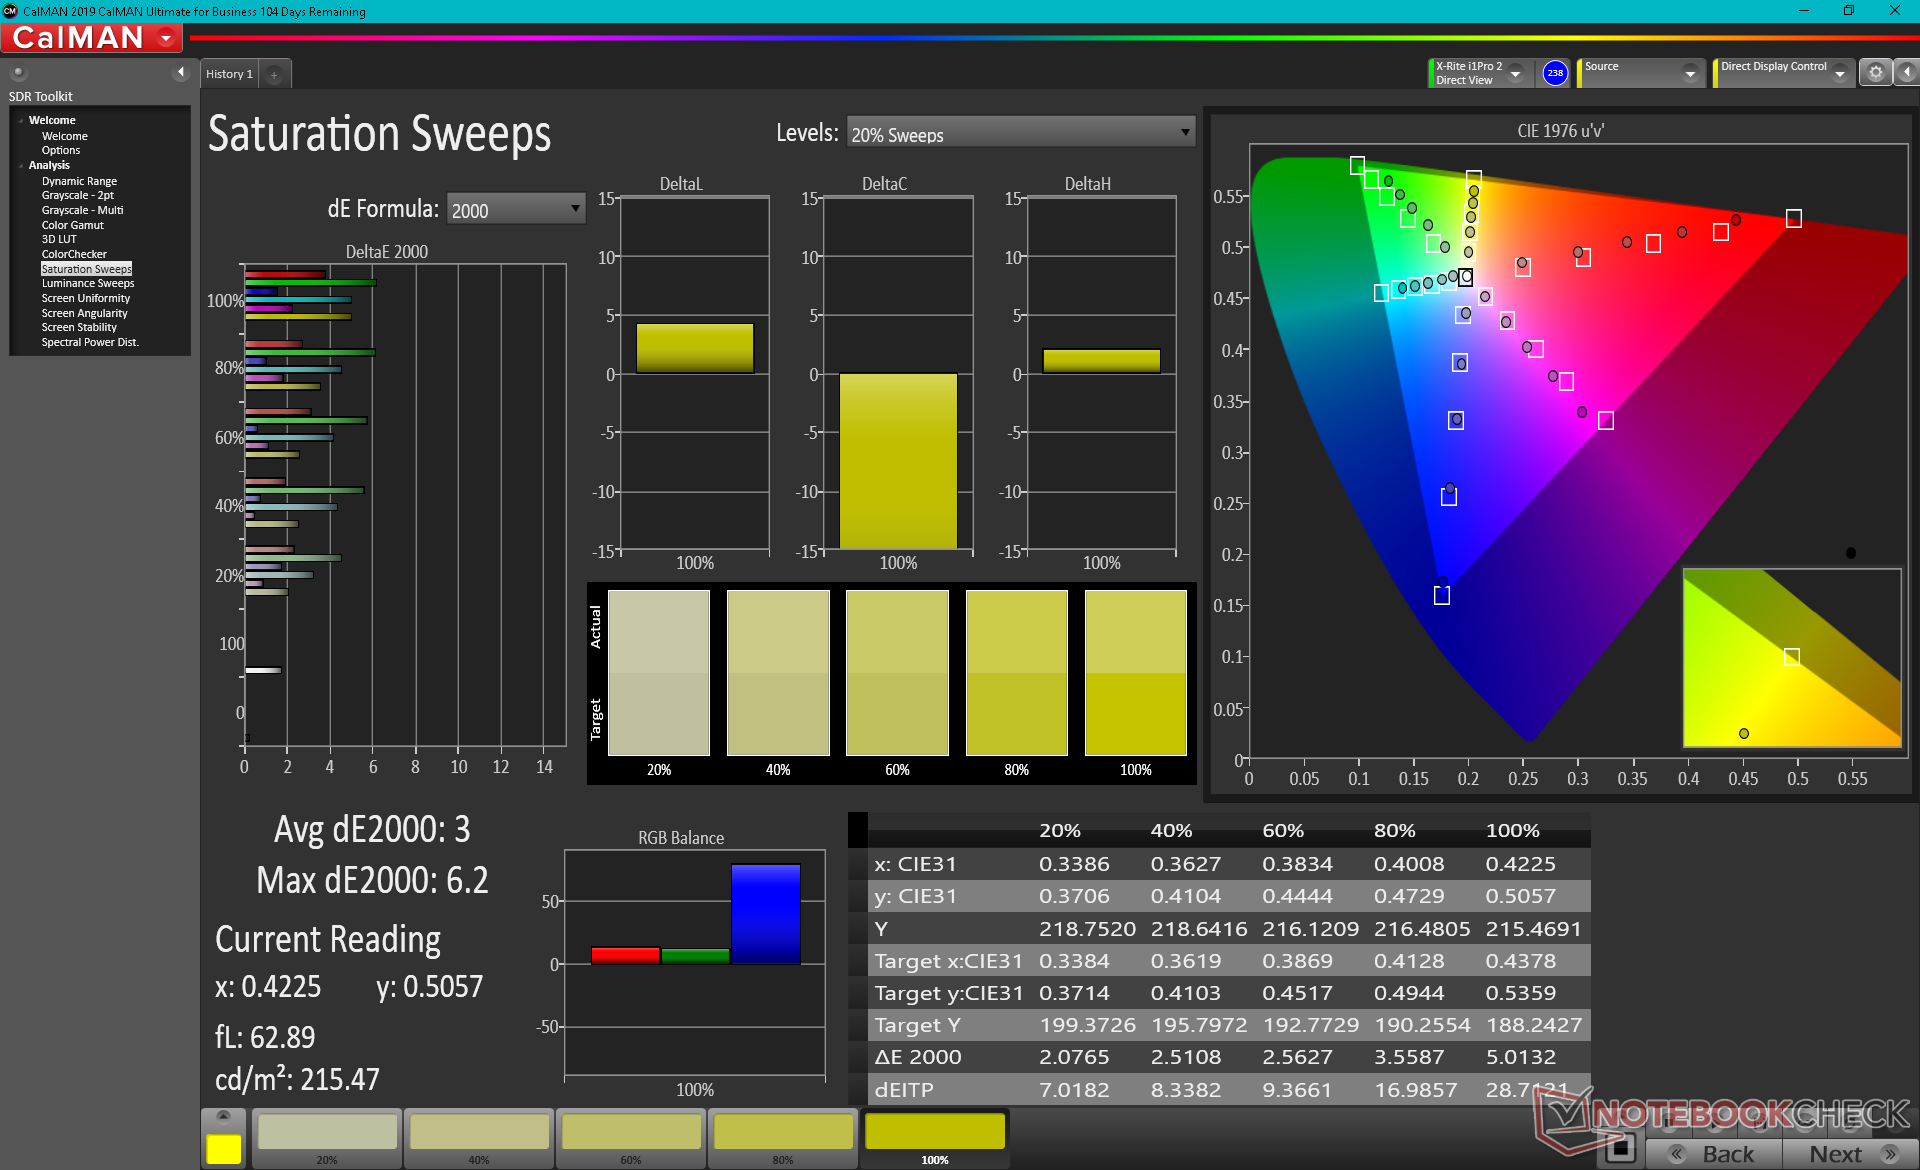
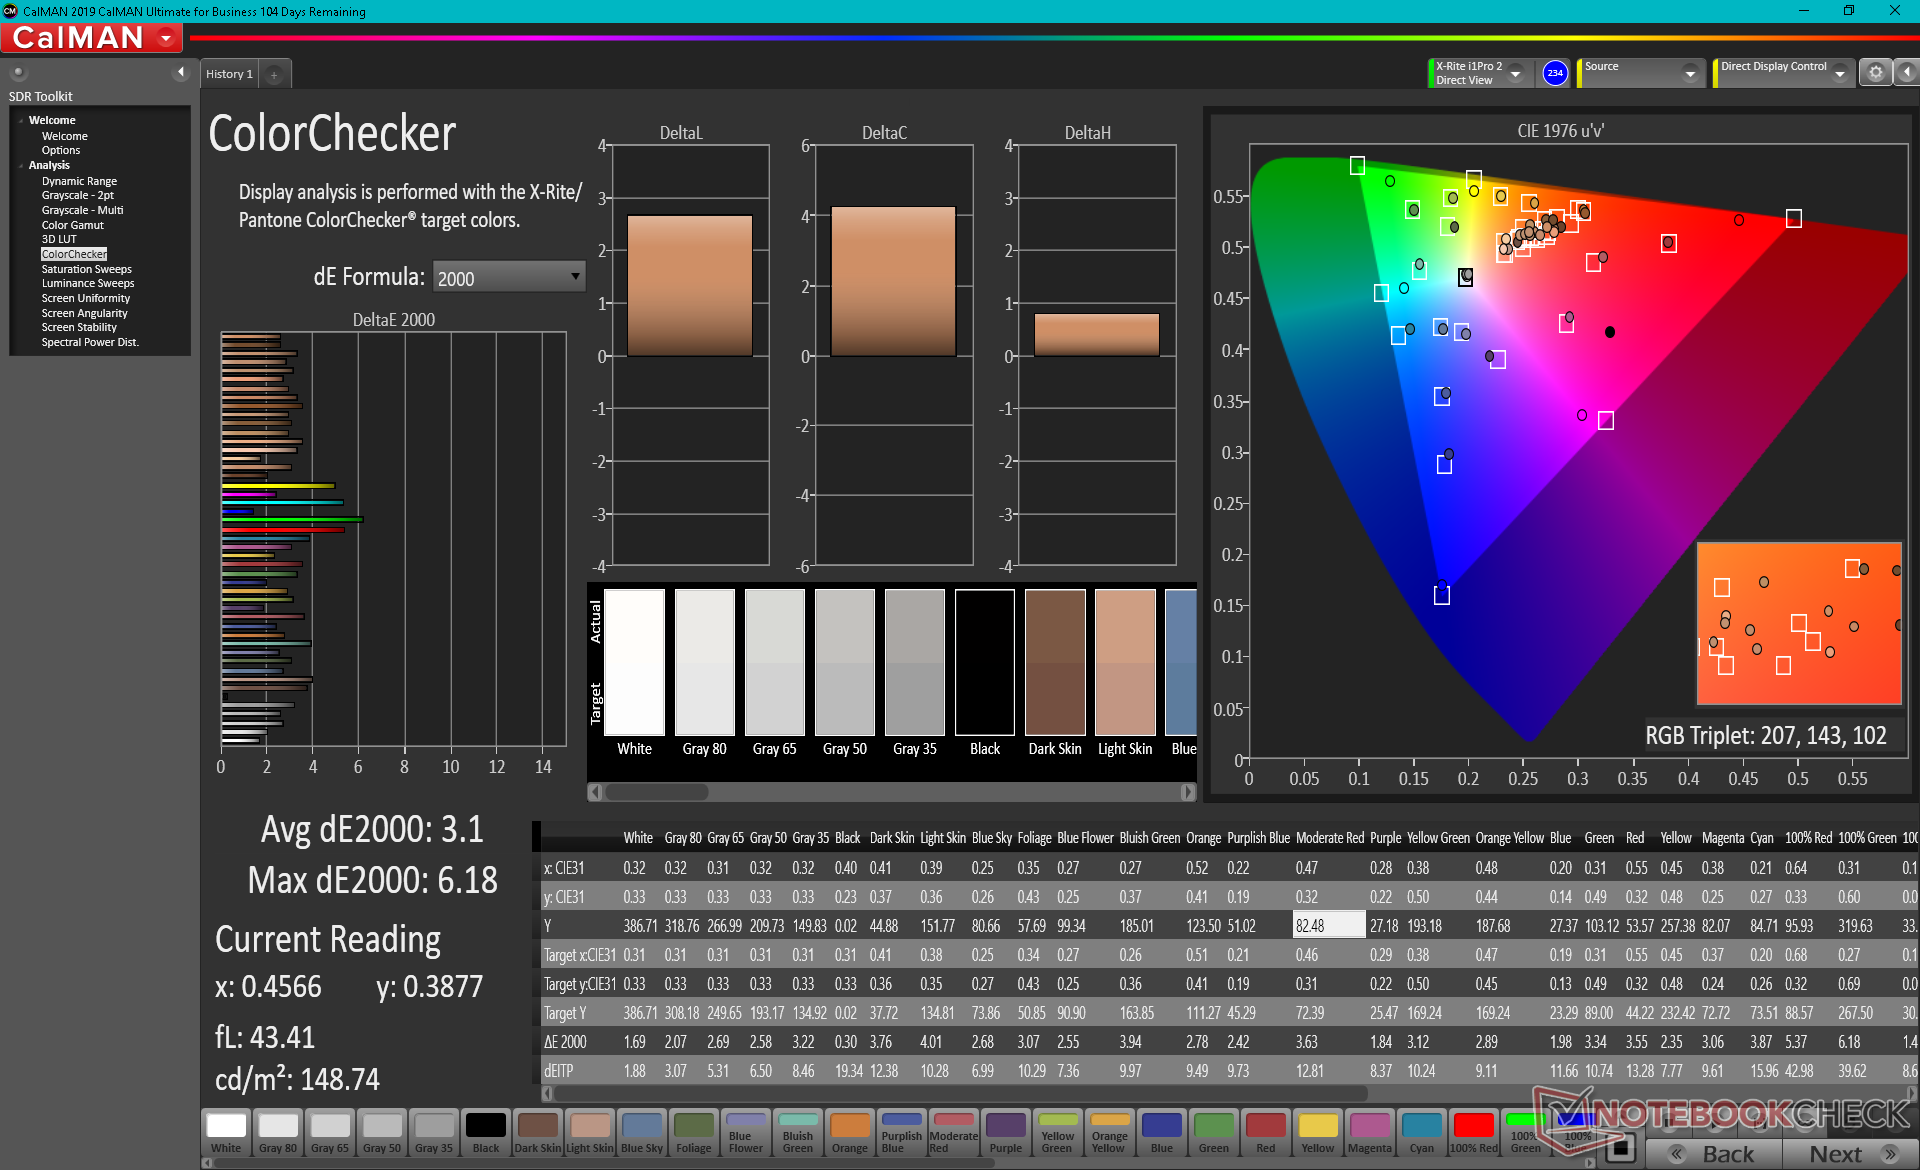
ΔE Color 5.15 | 0.5-29.43 Ø5, calibrated: 3.1
ΔE Greyscale 2.6 | 0.57-98 Ø5.3
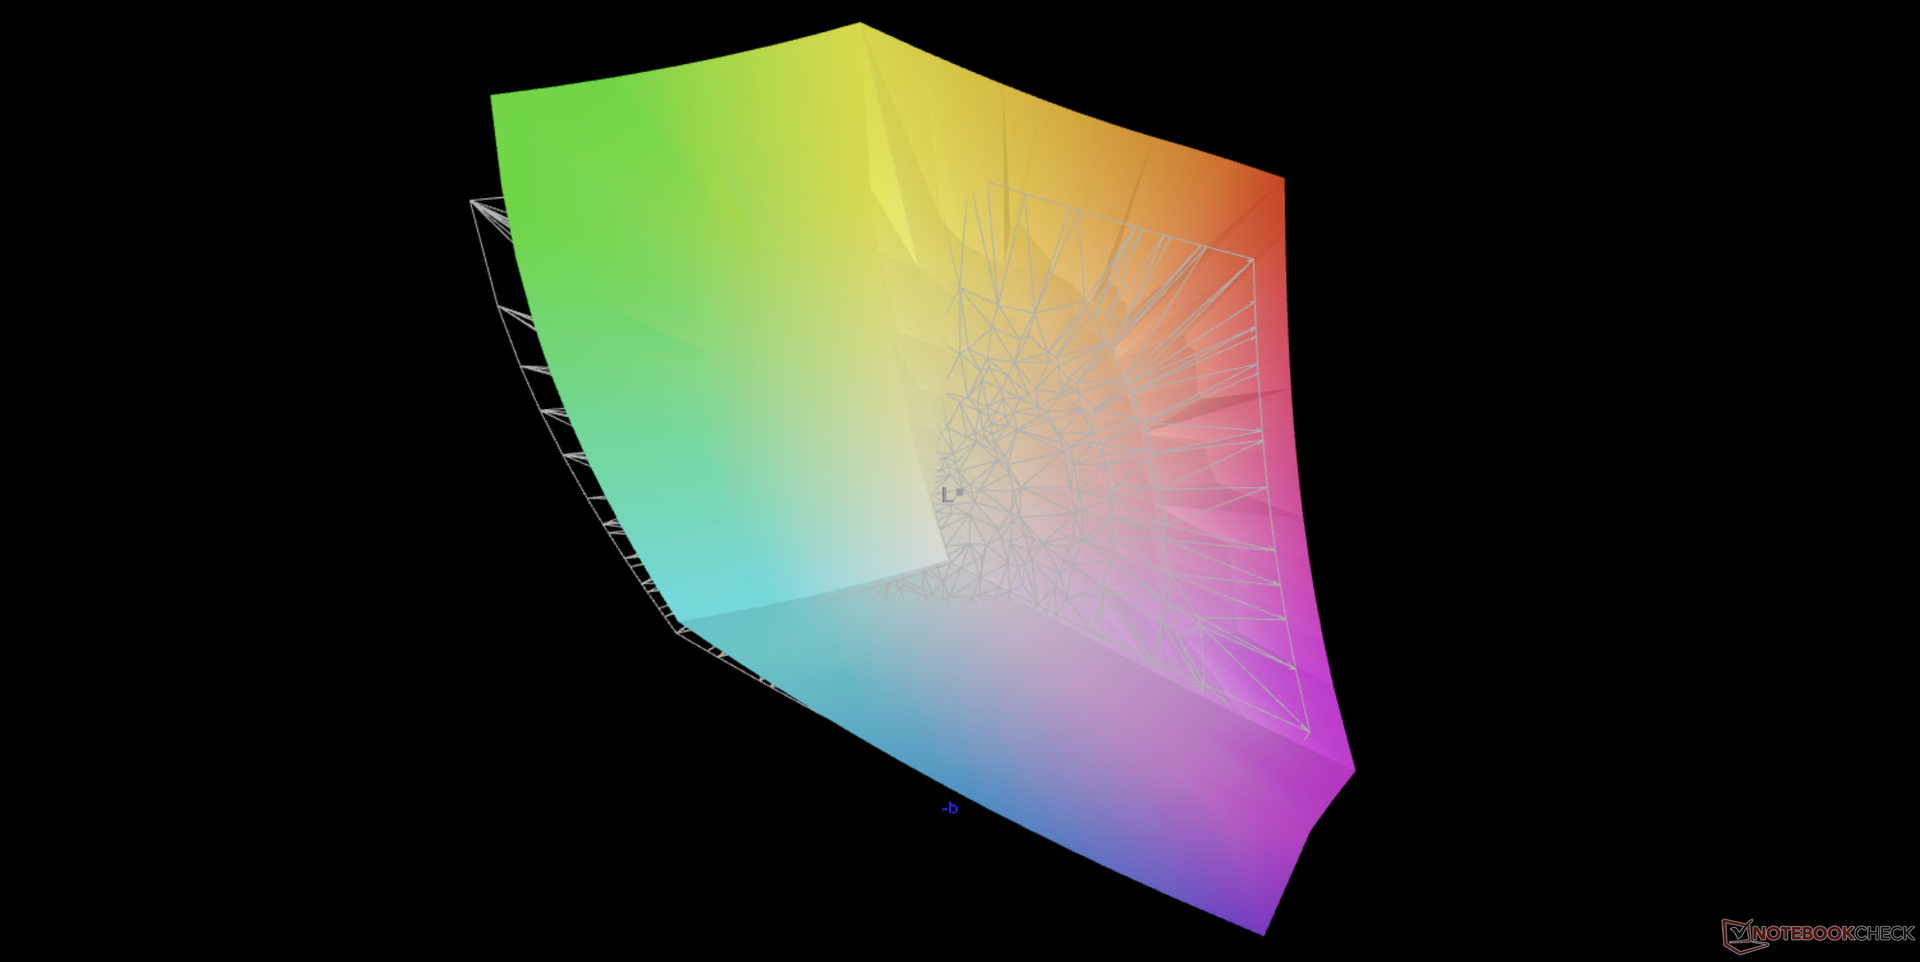
95.3% AdobeRGB 1998 (Argyll 2.2.0 3D)
100% sRGB (Argyll 2.2.0 3D)
99.9% Display P3 (Argyll 2.2.0 3D)
Gamma: 1.99
| HP ZBook Studio 15 G8 SDC4145, OLED, 15.60, 3840x2160 | HP ZBook Firefly 15 G8 2C9R7EA LGD069B, IPS, 15.60, 1920x1080 | HP ZBook Studio G7 LGD0661, IPS, 15.60, 3840x2160 | Dell Precision 7550 AU Optronics B156ZAN, IPS, 15.60, 3840x2160 | Lenovo ThinkPad P15s Gen2-20W6000GGE MNF601EA1-1, IPS LED, 15.60, 3840x2160 | |
|---|---|---|---|---|---|
| Display | -20% | -4% | -5% | -4% | |
| Display P3 Coverage | 99.9 | 68.6 -31% | 98.2 -2% | 82.1 -18% | 84.5 -15% |
| sRGB Coverage | 100 | 98.5 -1% | 99.9 0% | 99.6 0% | 98.7 -1% |
| AdobeRGB 1998 Coverage | 95.3 | 70 -27% | 86.5 -9% | 96.8 2% | 97.8 3% |
| Response Times | -1733% | -1859% | -1675% | -1217% | |
| Response Time Grey 50% / Grey 80% * | 2.4 ? | 56 ? -2233% | 56.4 ? -2250% | 51.2 ? -2033% | 40 ? -1567% |
| Response Time Black / White * | 2.4 ? | 32 ? -1233% | 37.6 ? -1467% | 34 ? -1317% | 23.2 ? -867% |
| PWM Frequency | 240.4 ? | ||||
| Screen | -30% | 59% | -11% | 57% | |
| Brightness middle | 379.6 | 397 5% | 723 90% | 473.5 25% | 604 59% |
| Brightness | 380 | 402 6% | 707 86% | 461 21% | 609 60% |
| Brightness Distribution | 95 | 84 -12% | 92 -3% | 90 -5% | 91 -4% |
| Black Level * | 0.13 | 0.35 | 0.55 | 0.34 | |
| Colorchecker dE 2000 * | 5.15 | 5.9 -15% | 1.4 73% | 4.8 7% | 0.9 83% |
| Colorchecker dE 2000 max. * | 7.79 | 9.4 -21% | 2.9 63% | 8.73 -12% | 2.6 67% |
| Colorchecker dE 2000 calibrated * | 3.1 | 1.1 65% | 0.5 84% | 3.08 1% | 0.8 74% |
| Greyscale dE 2000 * | 2.6 | 8.8 -238% | 2 23% | 5.6 -115% | 1.1 58% |
| Gamma | 1.99 111% | 2.47 89% | 2.14 103% | 2.34 94% | 2.15 102% |
| CCT | 6166 105% | 6416 101% | 6484 100% | 7549 86% | 6656 98% |
| Contrast | 3054 | 2066 | 861 | 1776 | |
| Color Space (Percent of AdobeRGB 1998) | 63.7 | 77.3 | 86.4 | 84.5 | |
| Color Space (Percent of sRGB) | 98.5 | 99.9 | 99.7 | 98.6 | |
| Total Average (Program / Settings) | -594% /
-311% | -601% /
-276% | -564% /
-287% | -388% /
-171% |
* ... smaller is better
OLED typically offers deeper colors than IPS and our ZBook Studio G8 is no exception. Users will be getting full DCI-P3 coverage as opposed to only sRGB on most lower resolution 1080p panels.

X-Rite colorimeter measurements show color temperature to be slightly on the warm side at around 6200K instead of the usual 6500K on most other calibrated displays that target sRGB. Unlike on most Dell Precision models, HP has no pre-installed software here designed specifically for adjusting colors.
Display Response Times
| ↔ Response Time Black to White | ||
|---|---|---|
| 2.4 ms ... rise ↗ and fall ↘ combined | ↗ 1.1 ms rise | 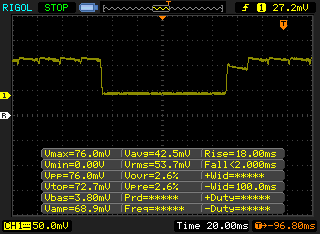 |
| ↘ 1.3 ms fall | ||
| The screen shows very fast response rates in our tests and should be very well suited for fast-paced gaming. In comparison, all tested devices range from 0.1 (minimum) to 240 (maximum) ms. » 7 % of all devices are better. This means that the measured response time is better than the average of all tested devices (21.5 ms). | ||
| ↔ Response Time 50% Grey to 80% Grey | ||
| 2.4 ms ... rise ↗ and fall ↘ combined | ↗ 1 ms rise | 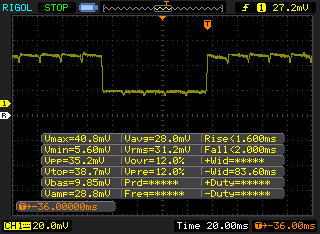 |
| ↘ 1.4 ms fall | ||
| The screen shows very fast response rates in our tests and should be very well suited for fast-paced gaming. In comparison, all tested devices range from 0.2 (minimum) to 636 (maximum) ms. » 7 % of all devices are better. This means that the measured response time is better than the average of all tested devices (33.7 ms). | ||
Screen Flickering / PWM (Pulse-Width Modulation)
| Screen flickering / PWM detected | 240.4 Hz | ≤ 52 % brightness setting | 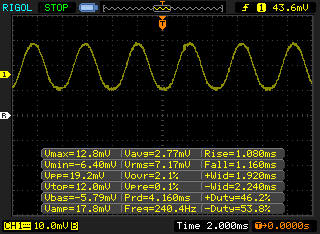 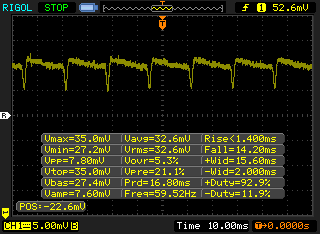 |
The display backlight flickers at 240.4 Hz (worst case, e.g., utilizing PWM) Flickering detected at a brightness setting of 52 % and below. There should be no flickering or PWM above this brightness setting. The frequency of 240.4 Hz is relatively low, so sensitive users will likely notice flickering and experience eyestrain at the stated brightness setting and below. In comparison: 53 % of all tested devices do not use PWM to dim the display. If PWM was detected, an average of 17900 (minimum: 5 - maximum: 3846000) Hz was measured. | |||
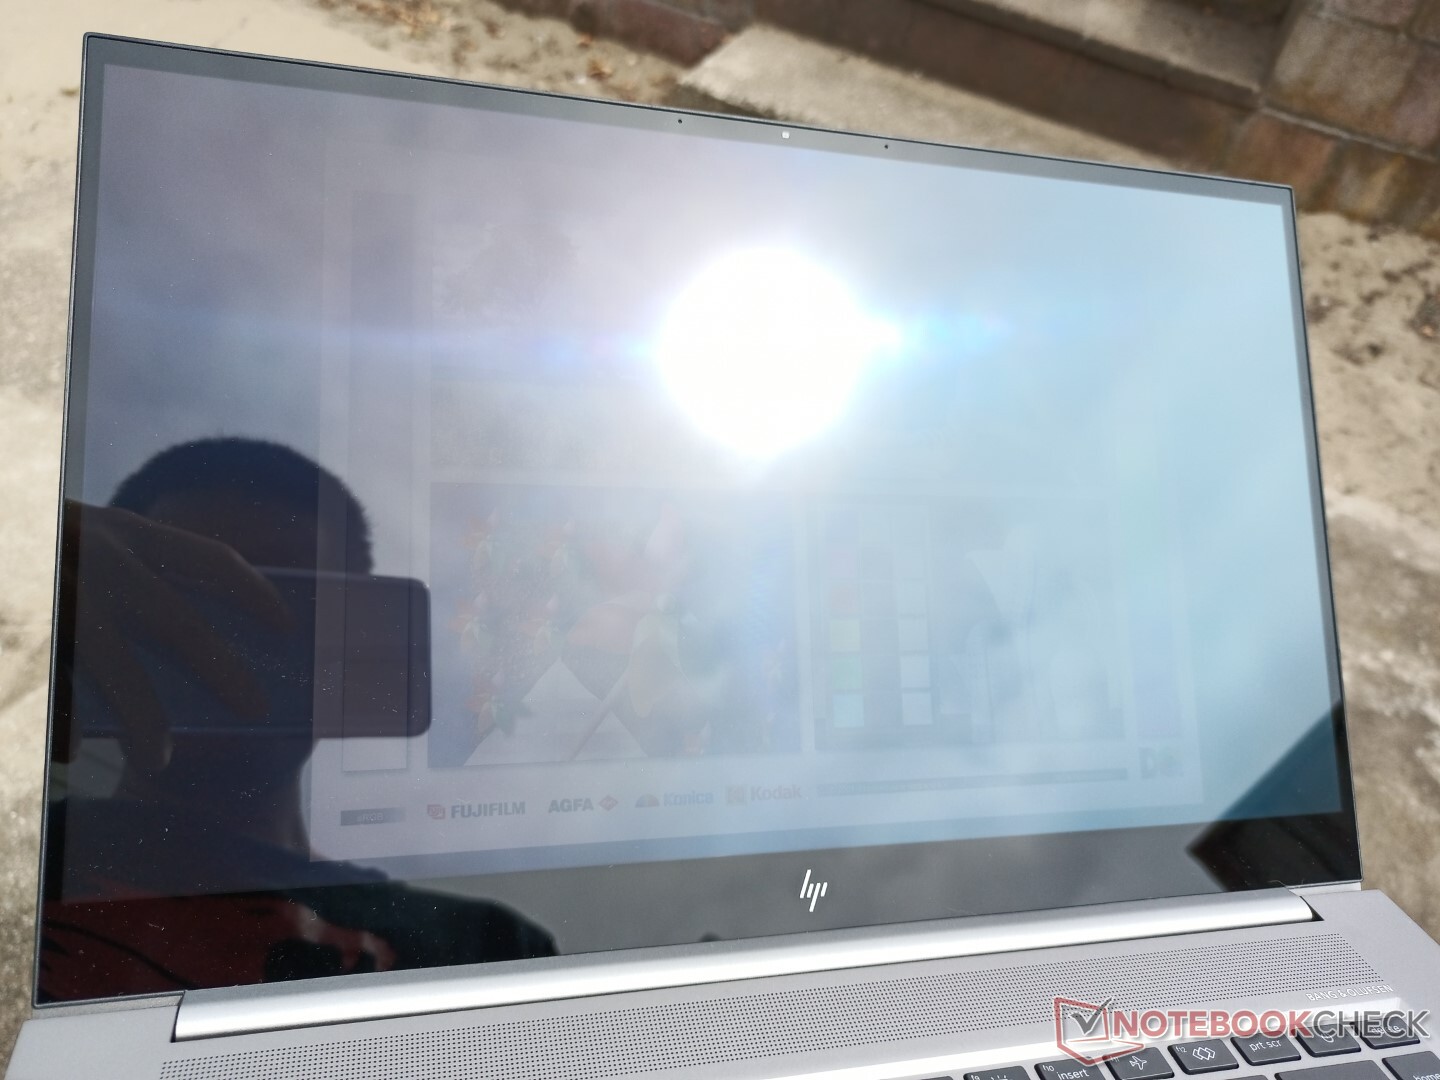
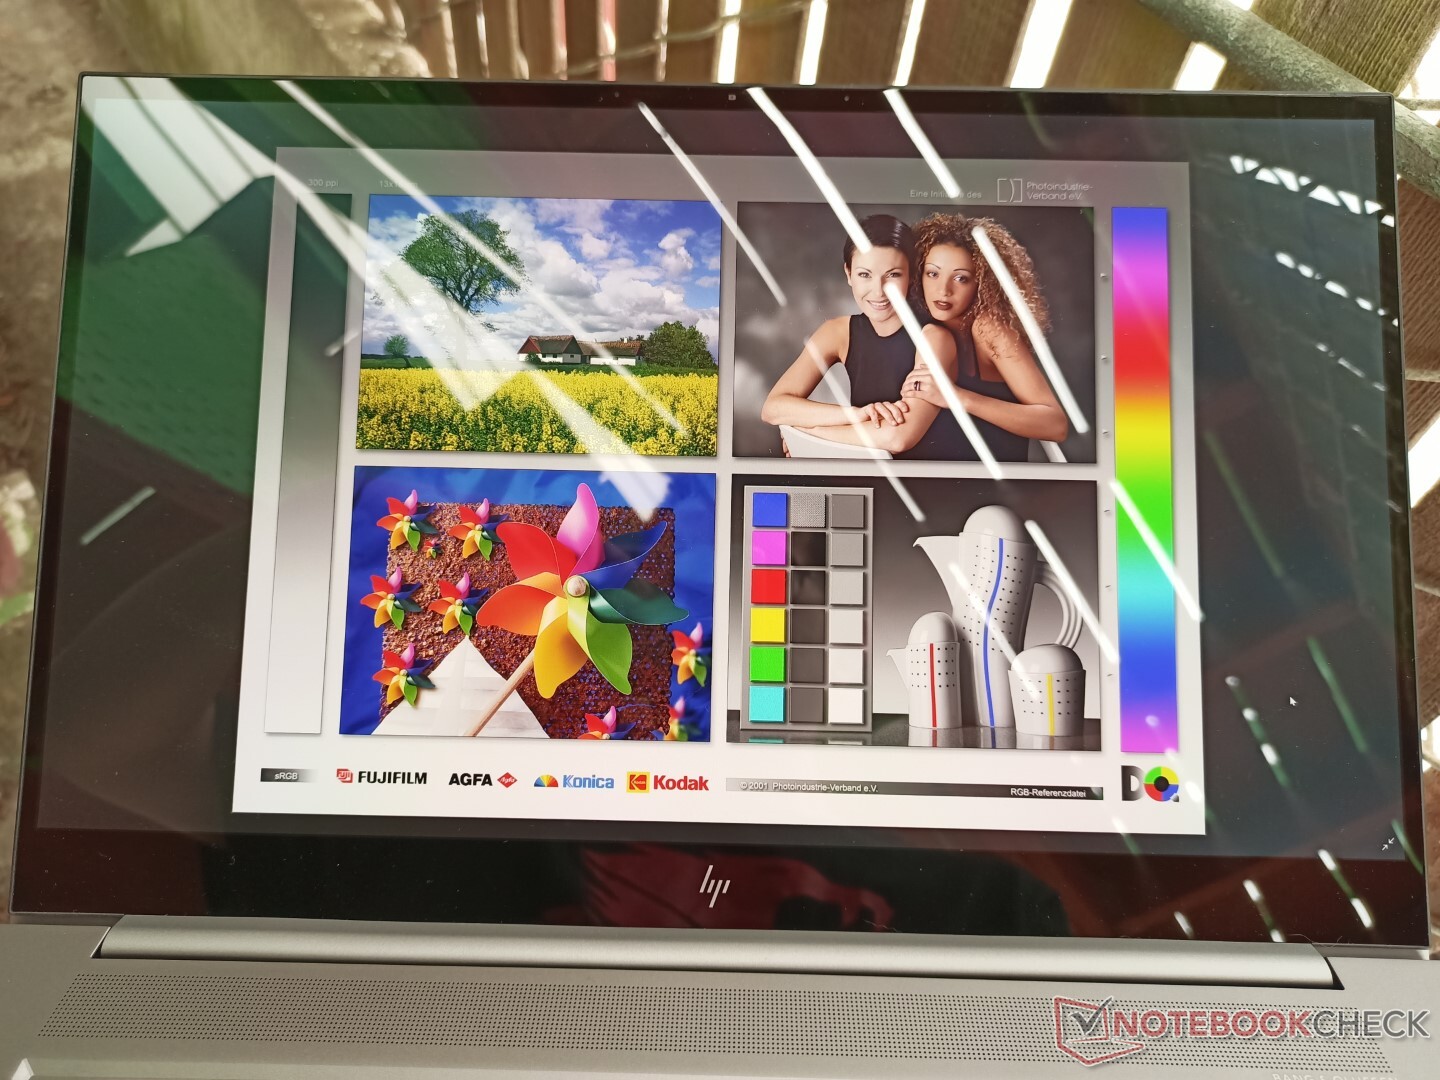
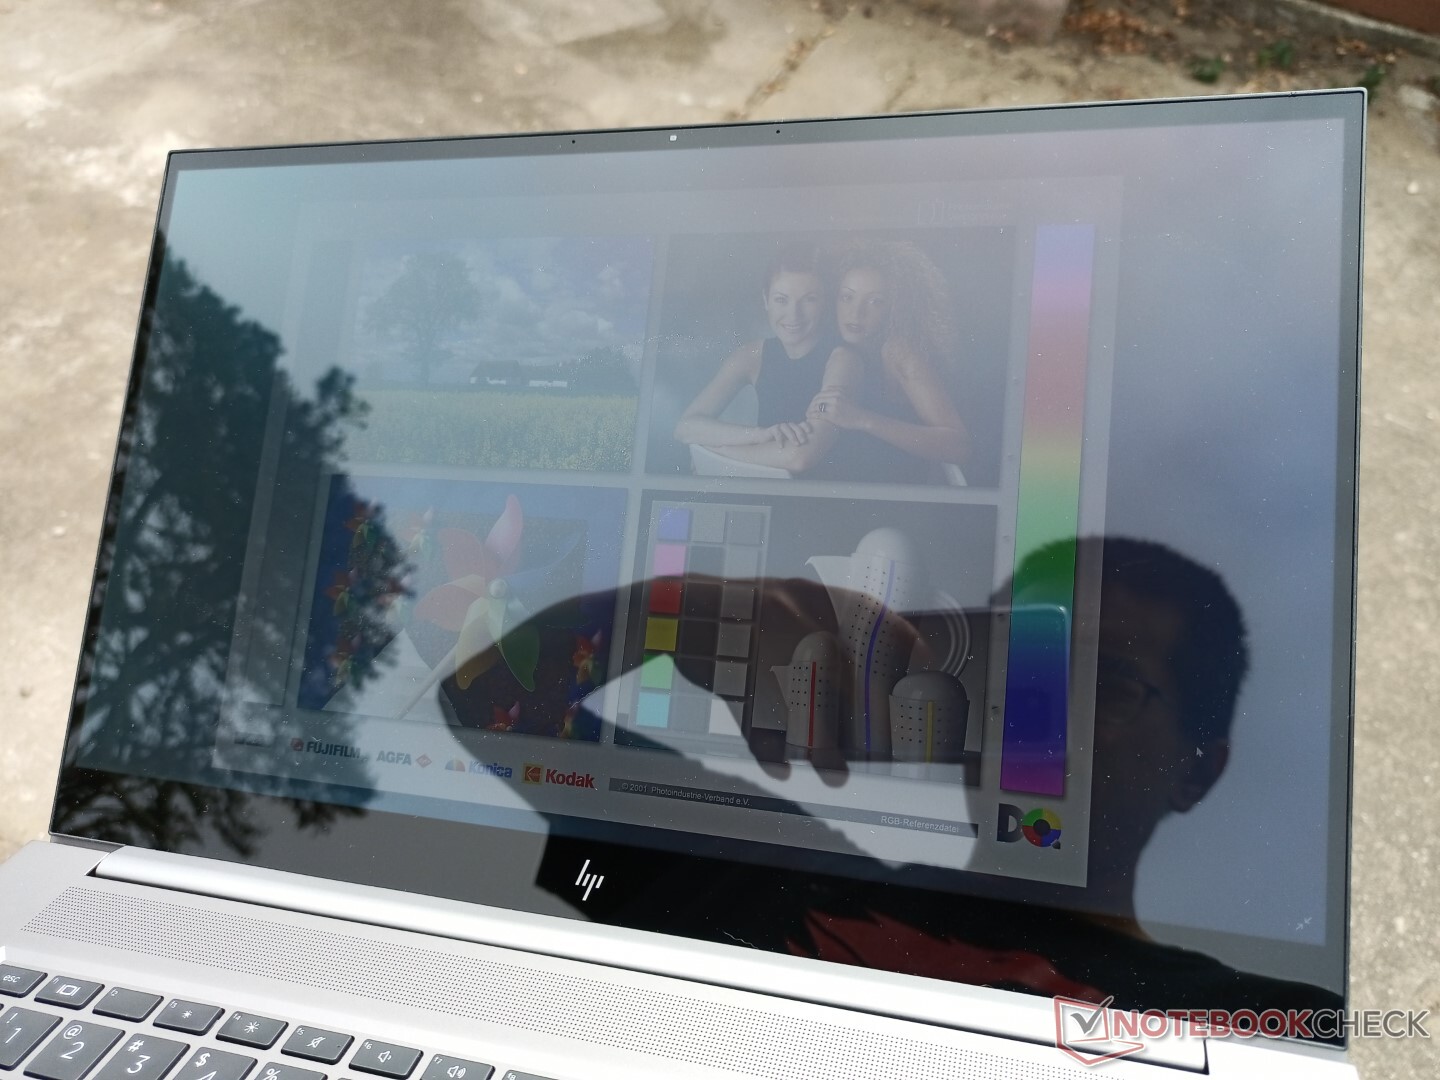
The glossy overlay contributes to noticeable glare when outdoors as shown by the pictures below. Users who plan on using the laptop outdoors on a frequent basis should consider upgrading to the 1000-nit panel option. Based on our experience with 1000-nit panels from HP, the real-world maximum brightness will be closer to 700 nits instead of 1000 nits which would still be nearly two times brighter than our base 400-nit panel. Only the FHD IPS panel is available with the 1000-nit configuration, however.
Performance — Lots to Choose From
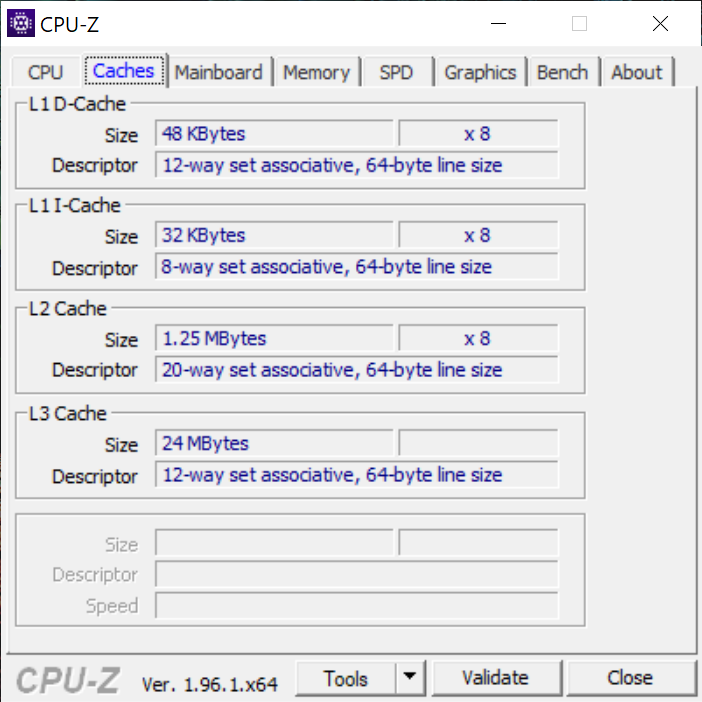
CPU options include the 11th gen Intel Core i7-11800H or i9-11900H alongside their respective i7-11850H or i9-11950H vPro equivalents. These are some of the fastest octa-core Core H-series CPUs from Intel at the moment rivaling the AMD Ryzen 9 series like the 5900HX.
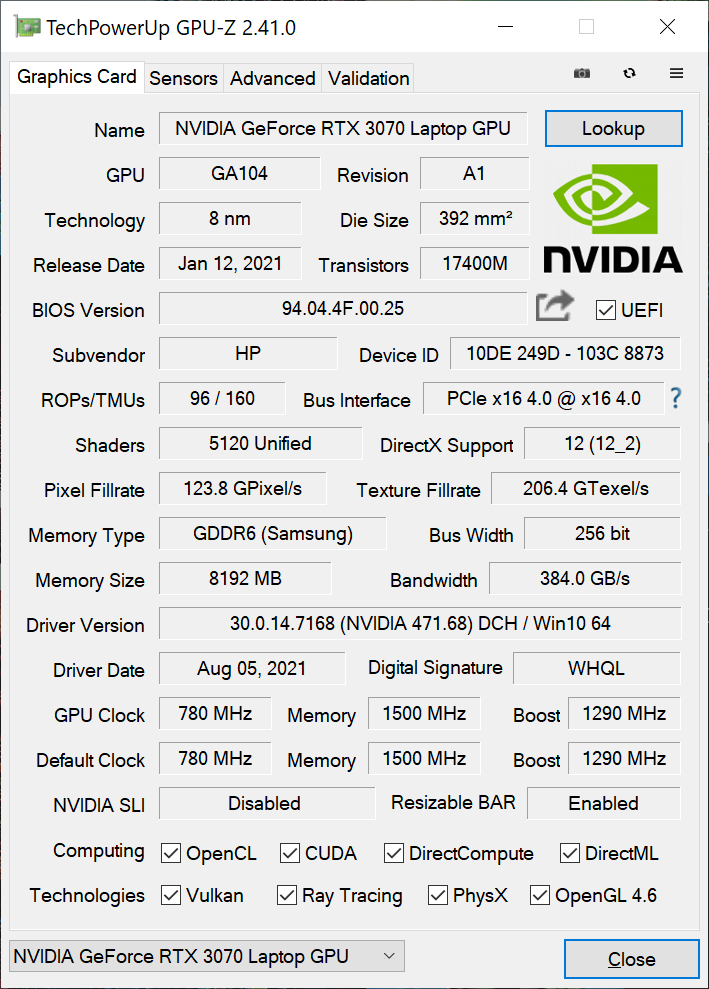
The GeForce RTX 3070 in our system is an 85 W TGP variant compared to the more common 100 W or higher version on most other laptops. Performance will therefore be slightly slower which our GPU benchmarks below will show. In fact, it is technically a "Max-Q" part according to the Nvidia Control Panel. Both Optimus 1.0 and Resizable Bar are supported.
Processor
As expected, CPU performance is ever-so-slightly below that of the Core i9-11900H due to the performance overhead required for vPro support. Gen-to-gen, raw multi-thread performance is about 20 to 25 percent faster than the older Core i9-10885H in the ZBook Studio G7.
Performance sustainability is stable with no major dips over time when running CineBench R15 xT in a continuous loop.
Cinebench R15 Multi Loop
Cinebench R23: Multi Core | Single Core
Cinebench R15: CPU Multi 64Bit | CPU Single 64Bit
Blender: v2.79 BMW27 CPU
7-Zip 18.03: 7z b 4 -mmt1 | 7z b 4
Geekbench 5.5: Single-Core | Multi-Core
HWBOT x265 Benchmark v2.2: 4k Preset
LibreOffice : 20 Documents To PDF
R Benchmark 2.5: Overall mean
| Cinebench R23 / Multi Core | |
| Asus ROG Strix Scar 15 G533QS | |
| Asus ROG Zephyrus S17 GX703HSD | |
| Average Intel Core i9-11950H (12048 - 13113, n=4) | |
| HP ZBook Studio 15 G8 | |
| SCHENKER XMG Core 15 Ampere | |
| Dell XPS 15 9510 11800H RTX 3050 Ti OLED | |
| HP ZBook Studio G7 | |
| Cinebench R23 / Single Core | |
| Average Intel Core i9-11950H (1569 - 1633, n=4) | |
| Asus ROG Zephyrus S17 GX703HSD | |
| HP ZBook Studio 15 G8 | |
| Dell XPS 15 9510 11800H RTX 3050 Ti OLED | |
| Asus ROG Strix Scar 15 G533QS | |
| HP ZBook Studio G7 | |
| SCHENKER XMG Core 15 Ampere | |
| Geekbench 5.5 / Single-Core | |
| HP ZBook Studio 15 G8 | |
| Average Intel Core i9-11950H (1623 - 1702, n=3) | |
| Asus ROG Zephyrus S17 GX703HSD | |
| Dell XPS 15 9510 11800H RTX 3050 Ti OLED | |
| Asus TUF Gaming A15 FA506QR-AZ061T | |
| HP ZBook Studio G7 | |
| MSI WS66 10TMT-207US | |
| Dell Precision 5550 P91F | |
| SCHENKER XMG Core 15 Ampere | |
| HWBOT x265 Benchmark v2.2 / 4k Preset | |
| Asus ROG Zephyrus S17 GX703HSD | |
| Asus ROG Strix Scar 15 G533QS | |
| HP ZBook Studio 15 G8 | |
| Average Intel Core i9-11950H (13.8 - 14.5, n=4) | |
| SCHENKER XMG Core 15 Ampere | |
| Asus TUF Gaming A15 FA506QR-AZ061T | |
| MSI WS66 10TMT-207US | |
| HP ZBook Studio G7 | |
| Dell XPS 15 9510 11800H RTX 3050 Ti OLED | |
| Dell Precision 5550 P91F | |
* ... smaller is better
System Performance
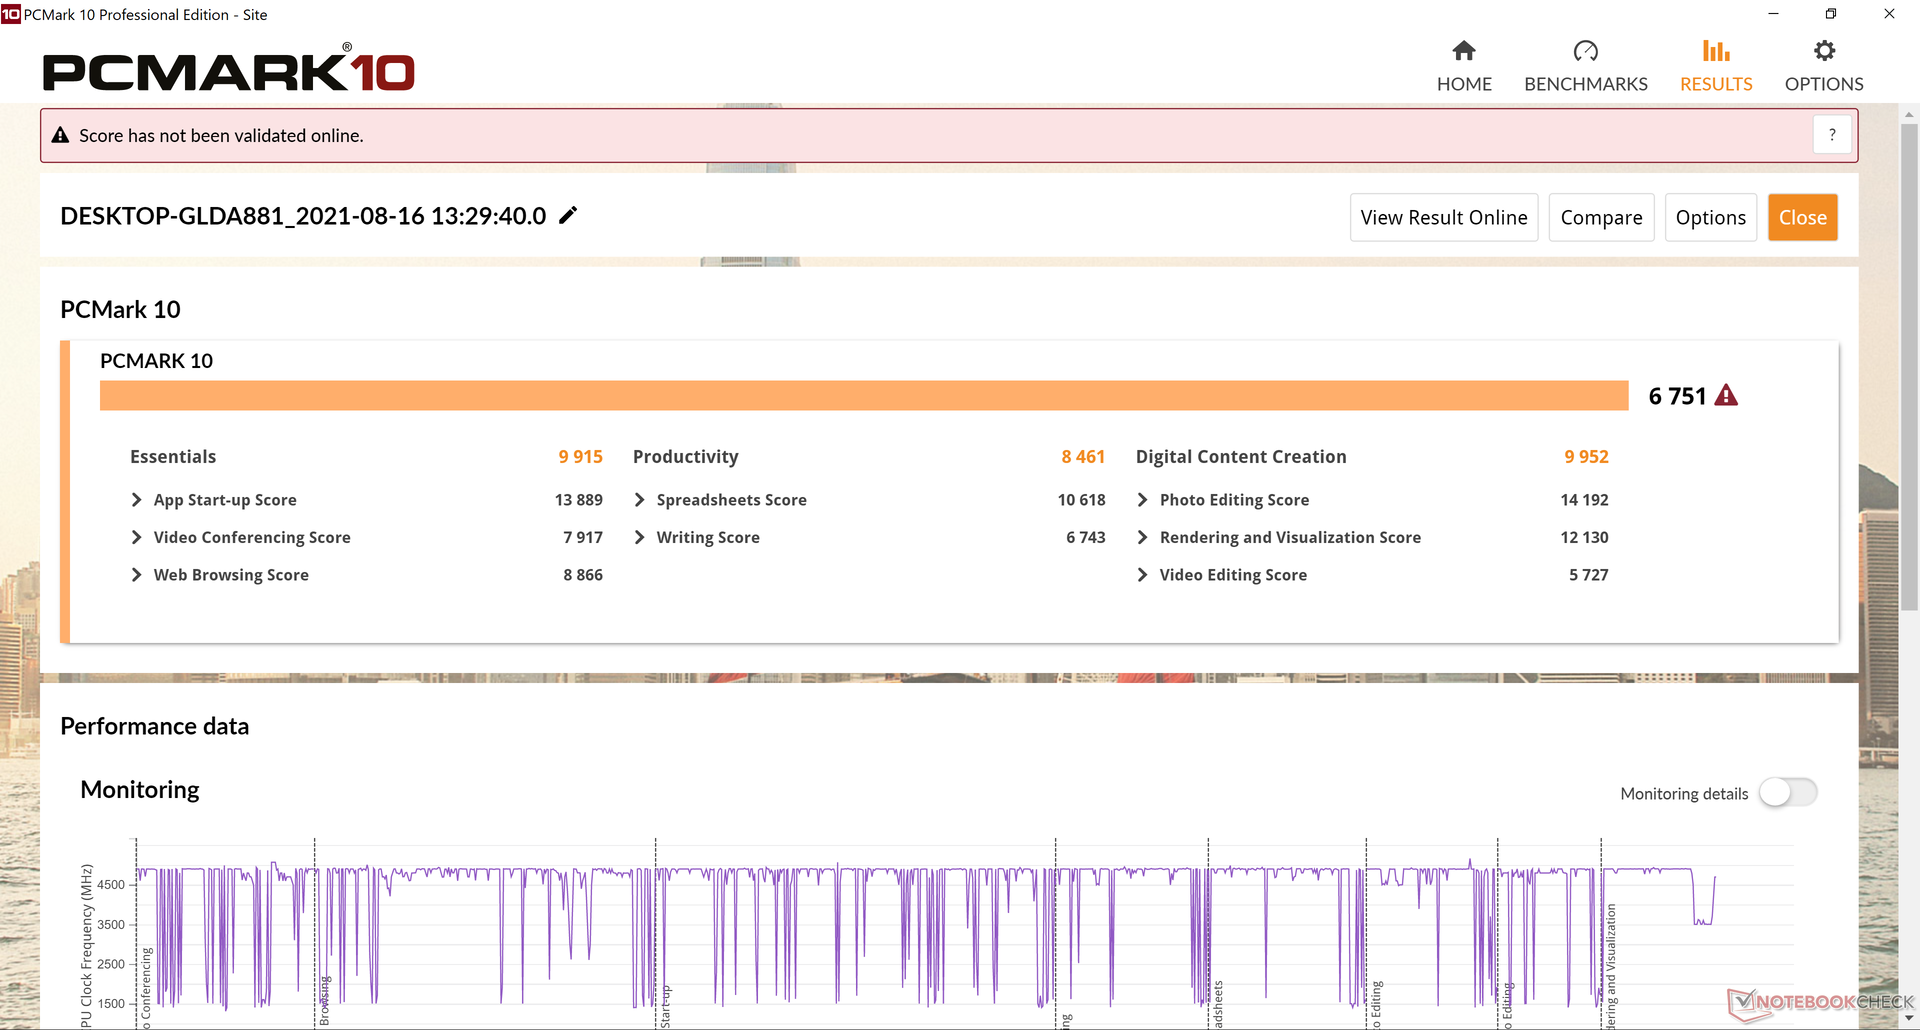
| PCMark 10 / Score | |
| HP ZBook Studio 15 G8 | |
| Dell Precision 7550 | |
| HP ZBook Firefly 15 G8 2C9R7EA | |
| HP ZBook Studio G7 | |
| Lenovo ThinkPad P15s Gen2-20W6000GGE | |
| Asus ProArt StudioBook Pro 15 W500G5T | |
| PCMark 10 / Essentials | |
| HP ZBook Studio 15 G8 | |
| Dell Precision 7550 | |
| Lenovo ThinkPad P15s Gen2-20W6000GGE | |
| HP ZBook Firefly 15 G8 2C9R7EA | |
| Asus ProArt StudioBook Pro 15 W500G5T | |
| HP ZBook Studio G7 | |
| PCMark 10 / Productivity | |
| Lenovo ThinkPad P15s Gen2-20W6000GGE | |
| HP ZBook Firefly 15 G8 2C9R7EA | |
| HP ZBook Studio 15 G8 | |
| Dell Precision 7550 | |
| Asus ProArt StudioBook Pro 15 W500G5T | |
| HP ZBook Studio G7 | |
| PCMark 10 / Digital Content Creation | |
| HP ZBook Studio 15 G8 | |
| Dell Precision 7550 | |
| HP ZBook Studio G7 | |
| HP ZBook Firefly 15 G8 2C9R7EA | |
| Asus ProArt StudioBook Pro 15 W500G5T | |
| Lenovo ThinkPad P15s Gen2-20W6000GGE | |
| PCMark 10 Score | 6751 points | |
Help | ||
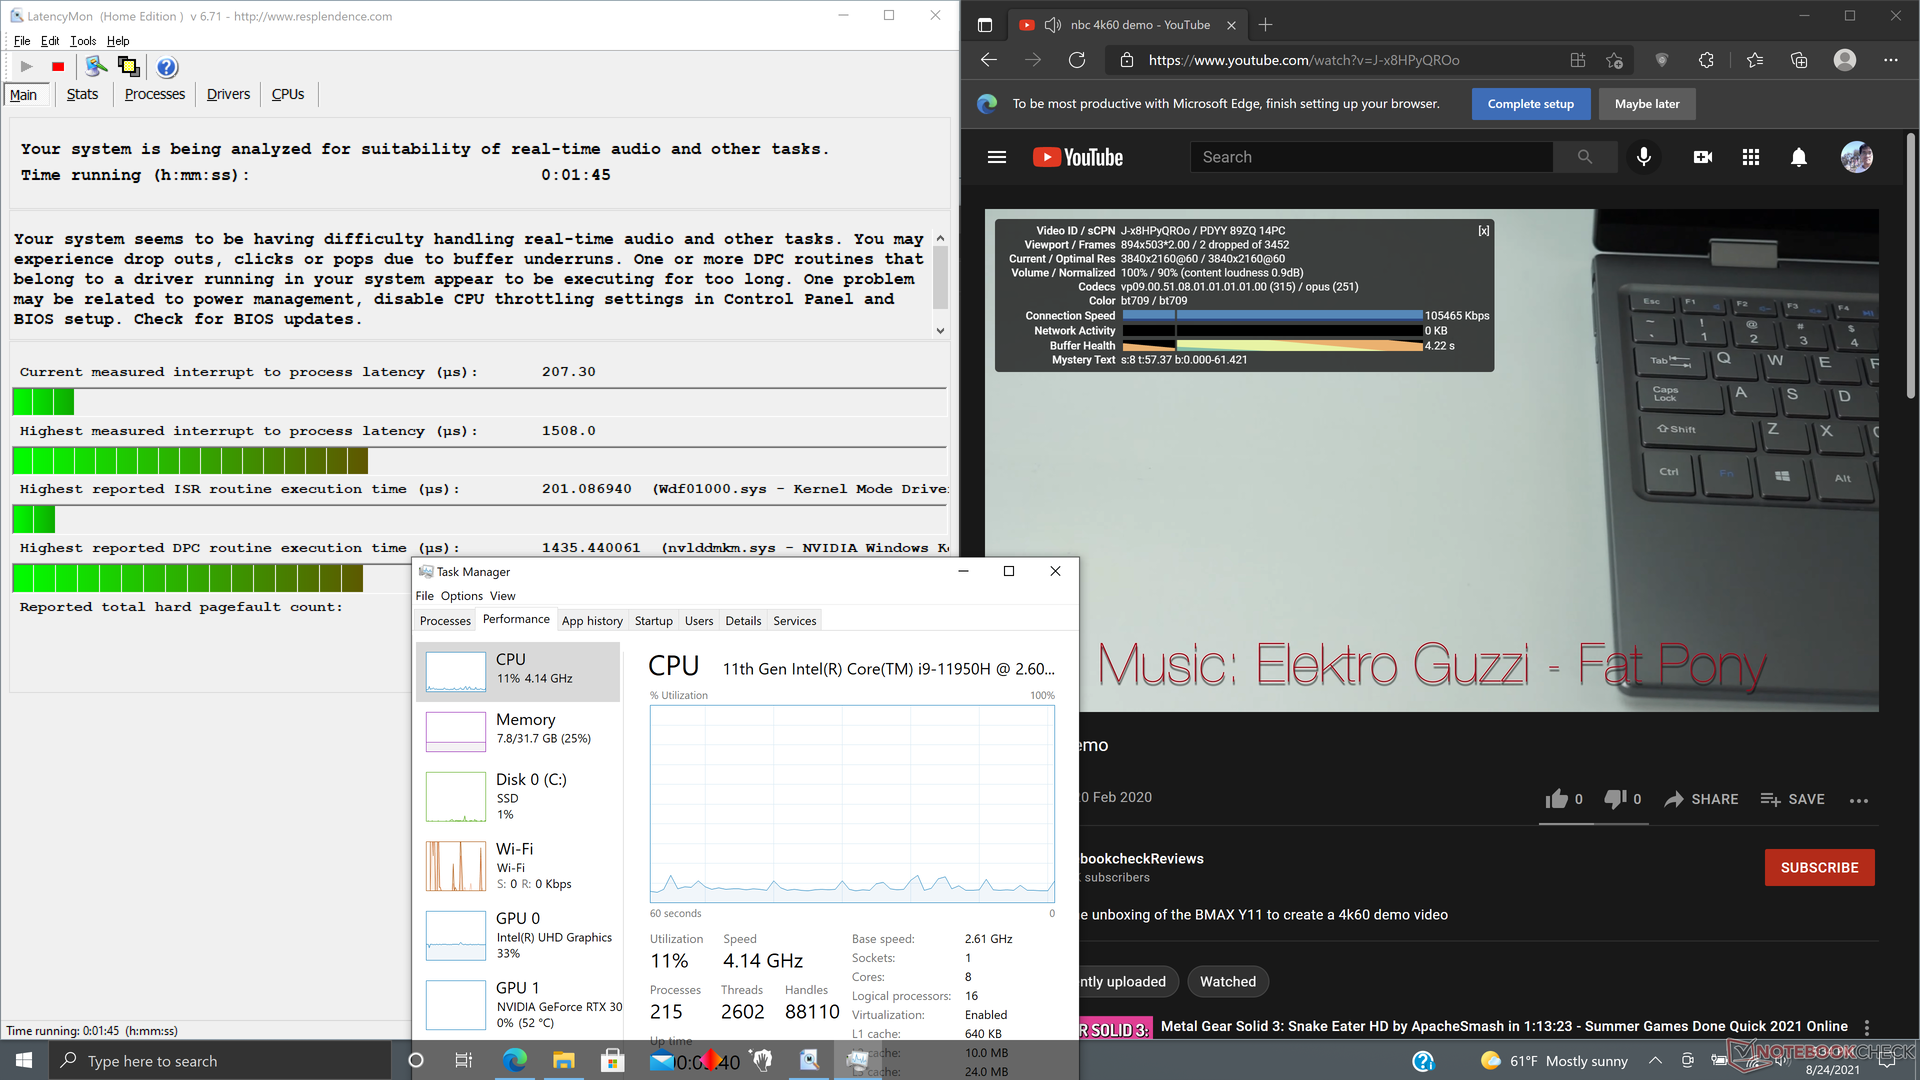
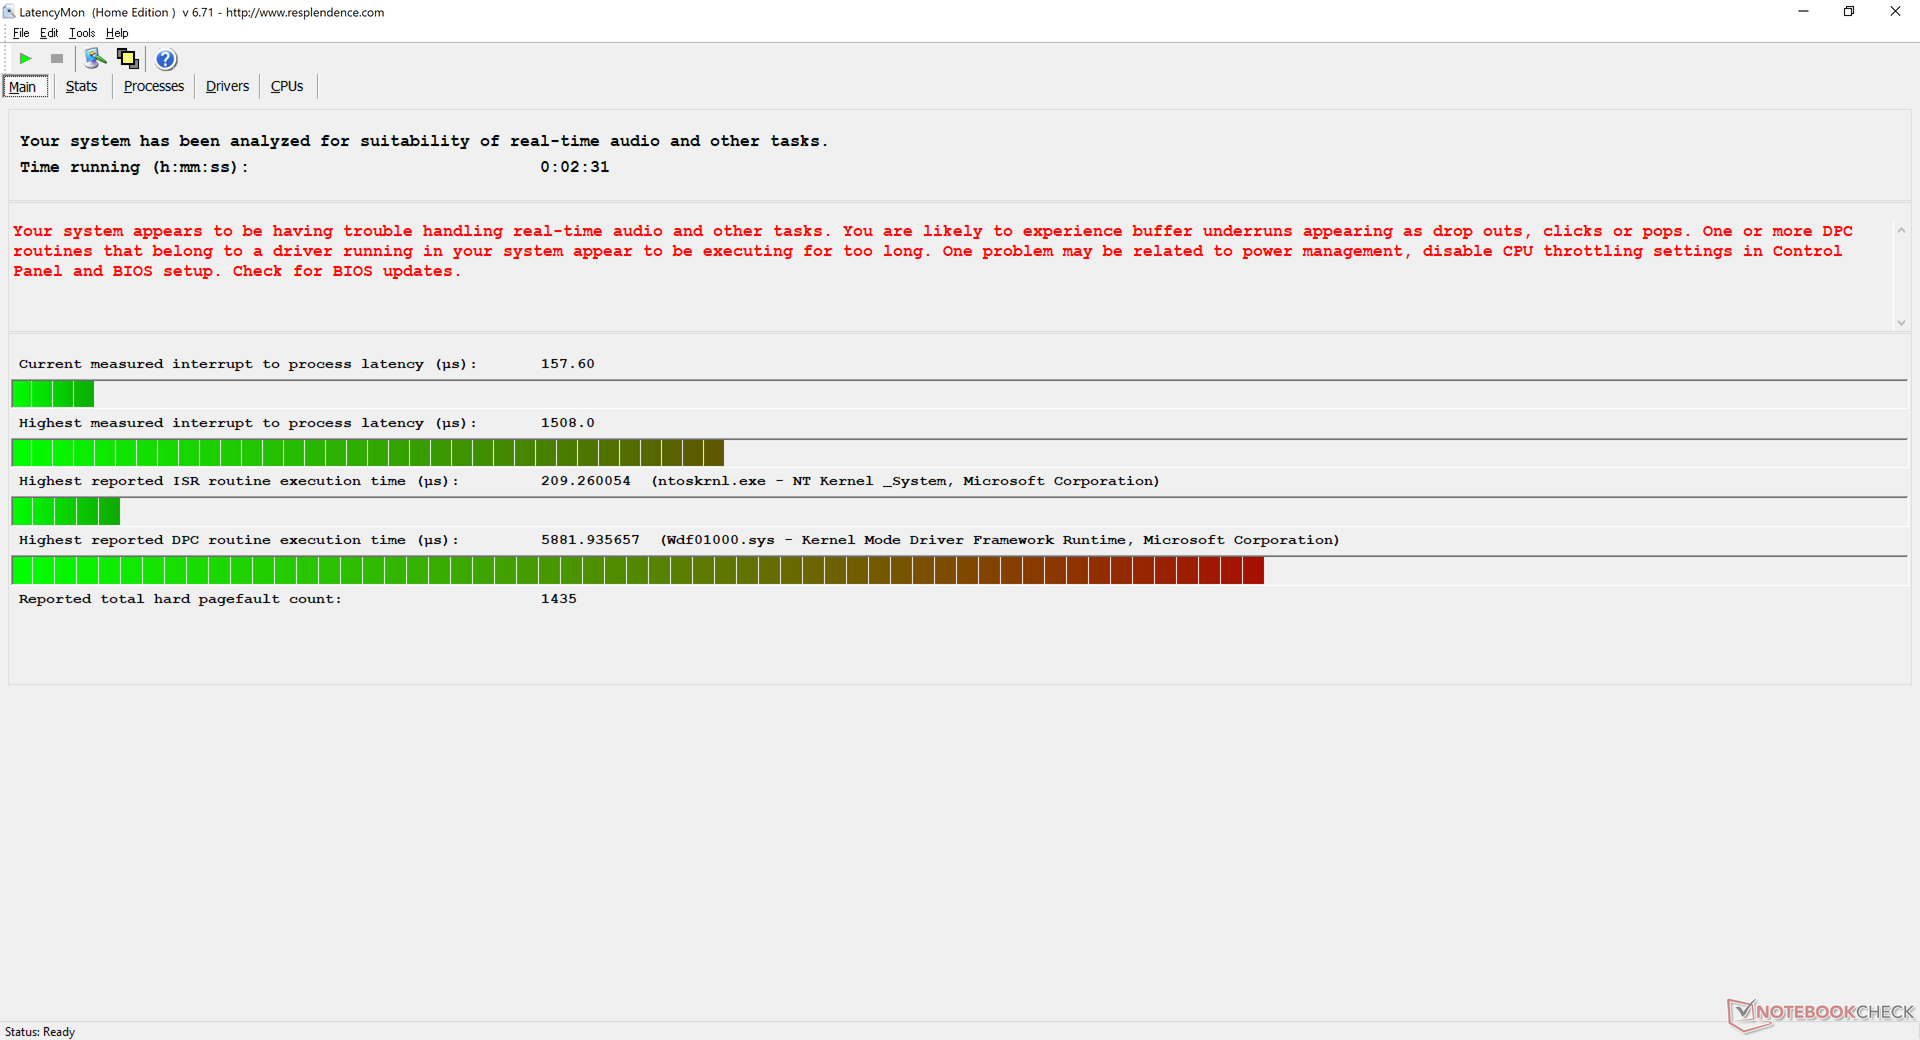
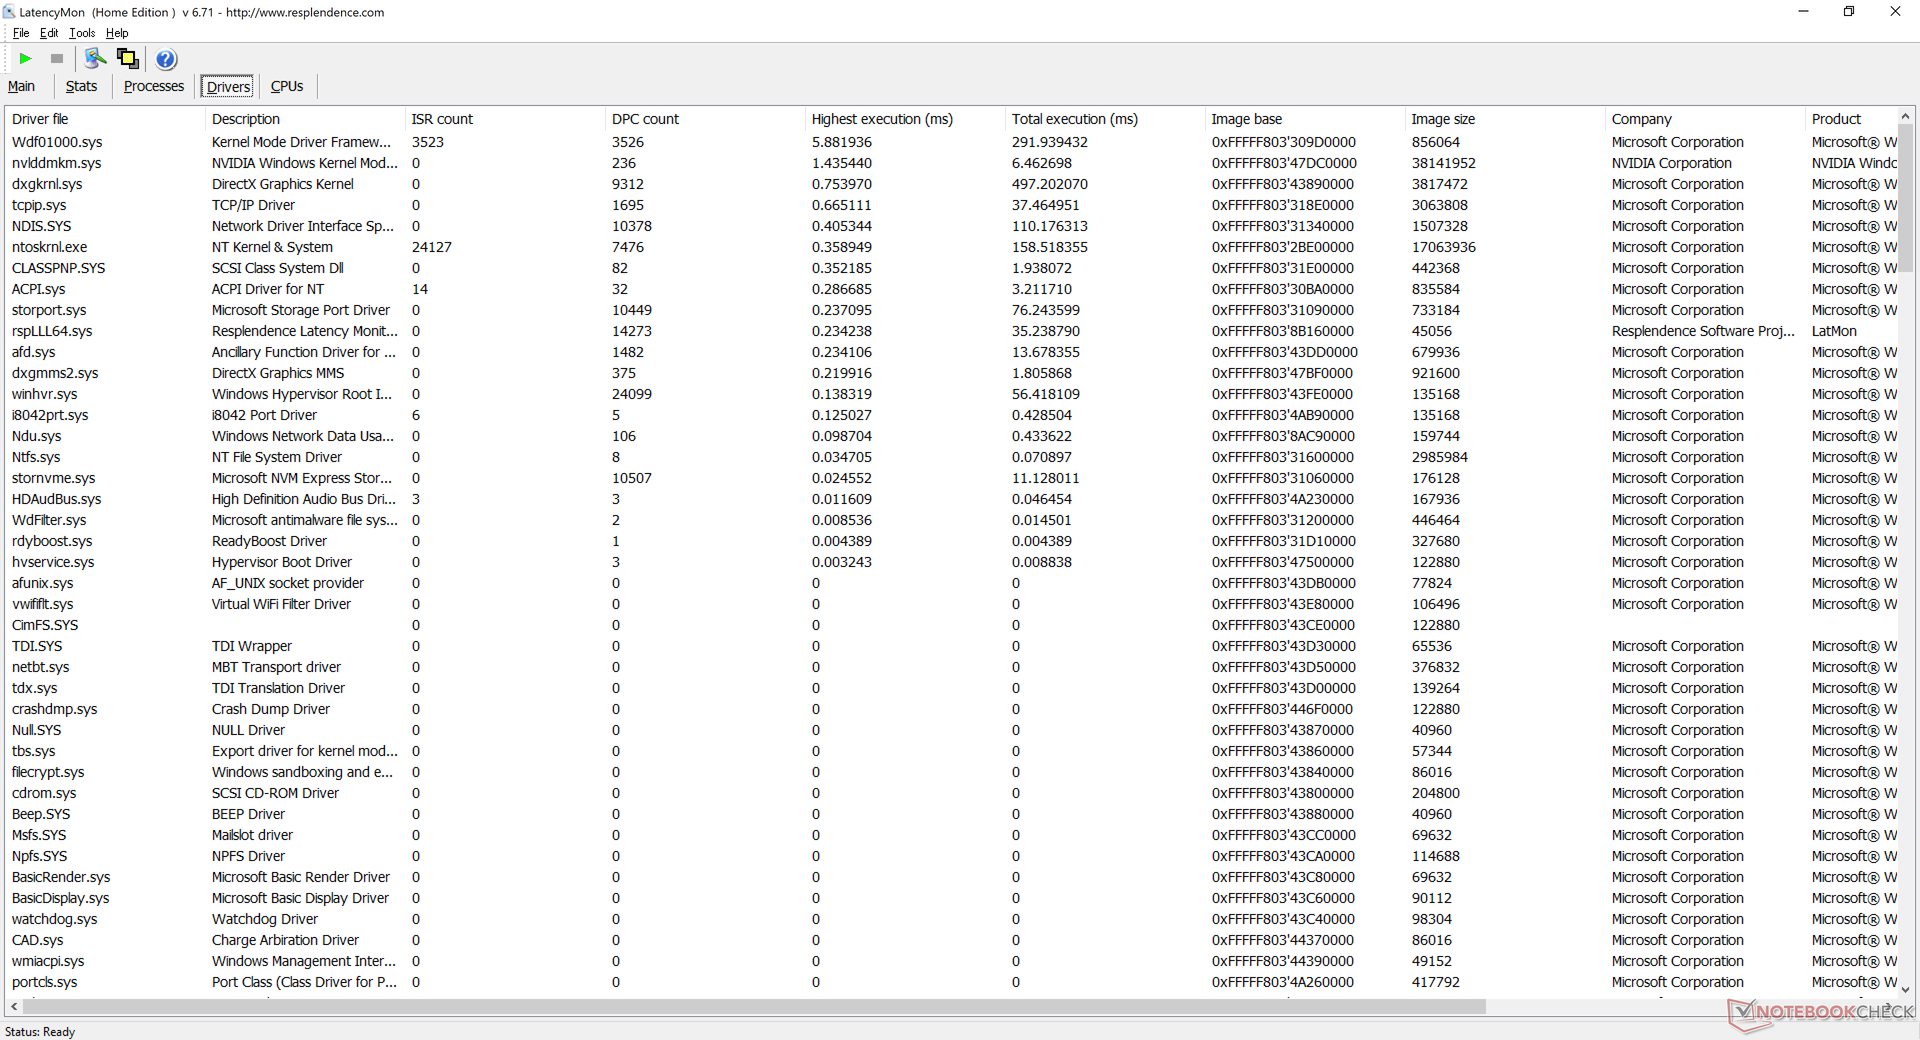
DPC Latency
LatencyMon reveals latency issues when opening multiple browser tabs on our homepage and also when running Prime95 stress. 4K video playback at 60 FPS is otherwise smooth with just 2 dropped frames during our minute-long test video.
| DPC Latencies / LatencyMon - interrupt to process latency (max), Web, Youtube, Prime95 | |
| Dell Precision 7550 | |
| HP ZBook Studio G7 | |
| Lenovo ThinkPad P15s Gen2-20W6000GGE | |
| Asus ProArt StudioBook Pro 15 W500G5T | |
| HP ZBook Studio 15 G8 | |
| HP ZBook Firefly 15 G8 2C9R7EA | |
* ... smaller is better
Storage Devices
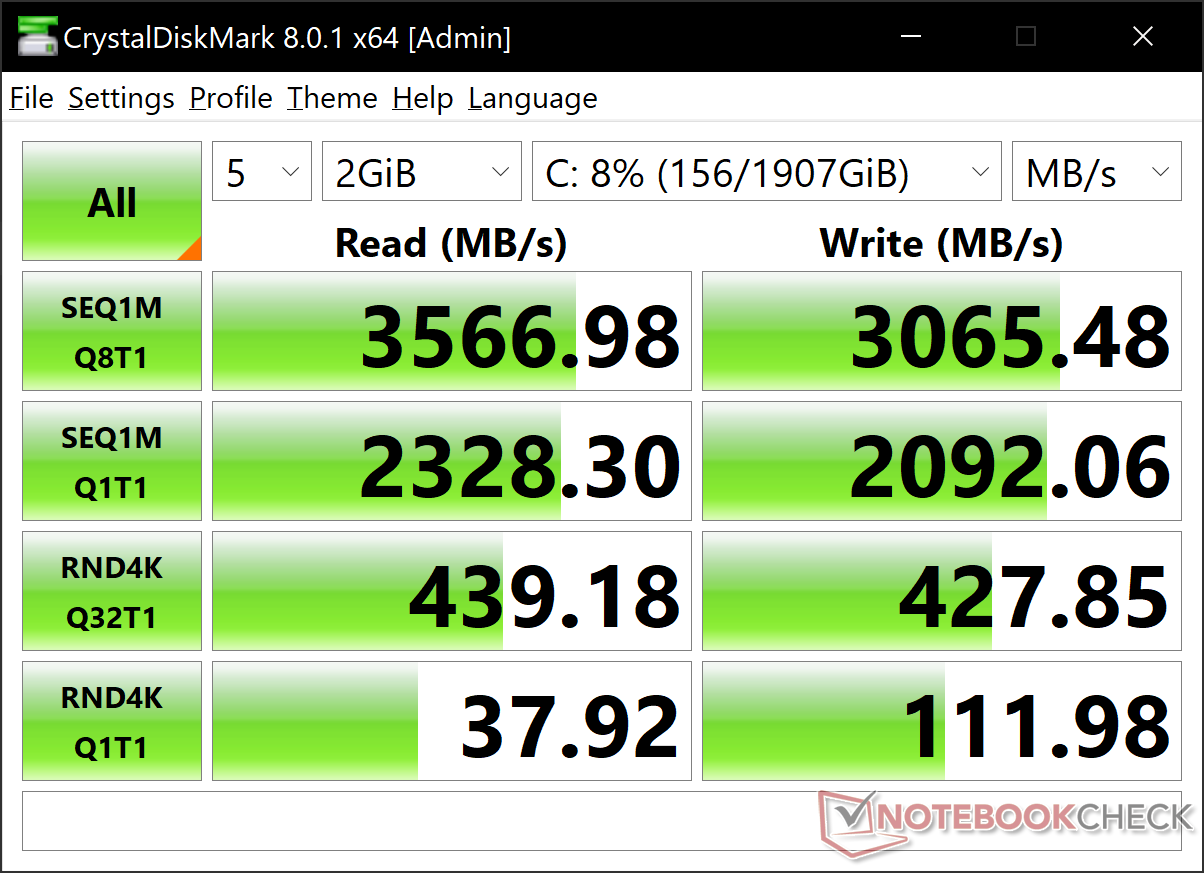
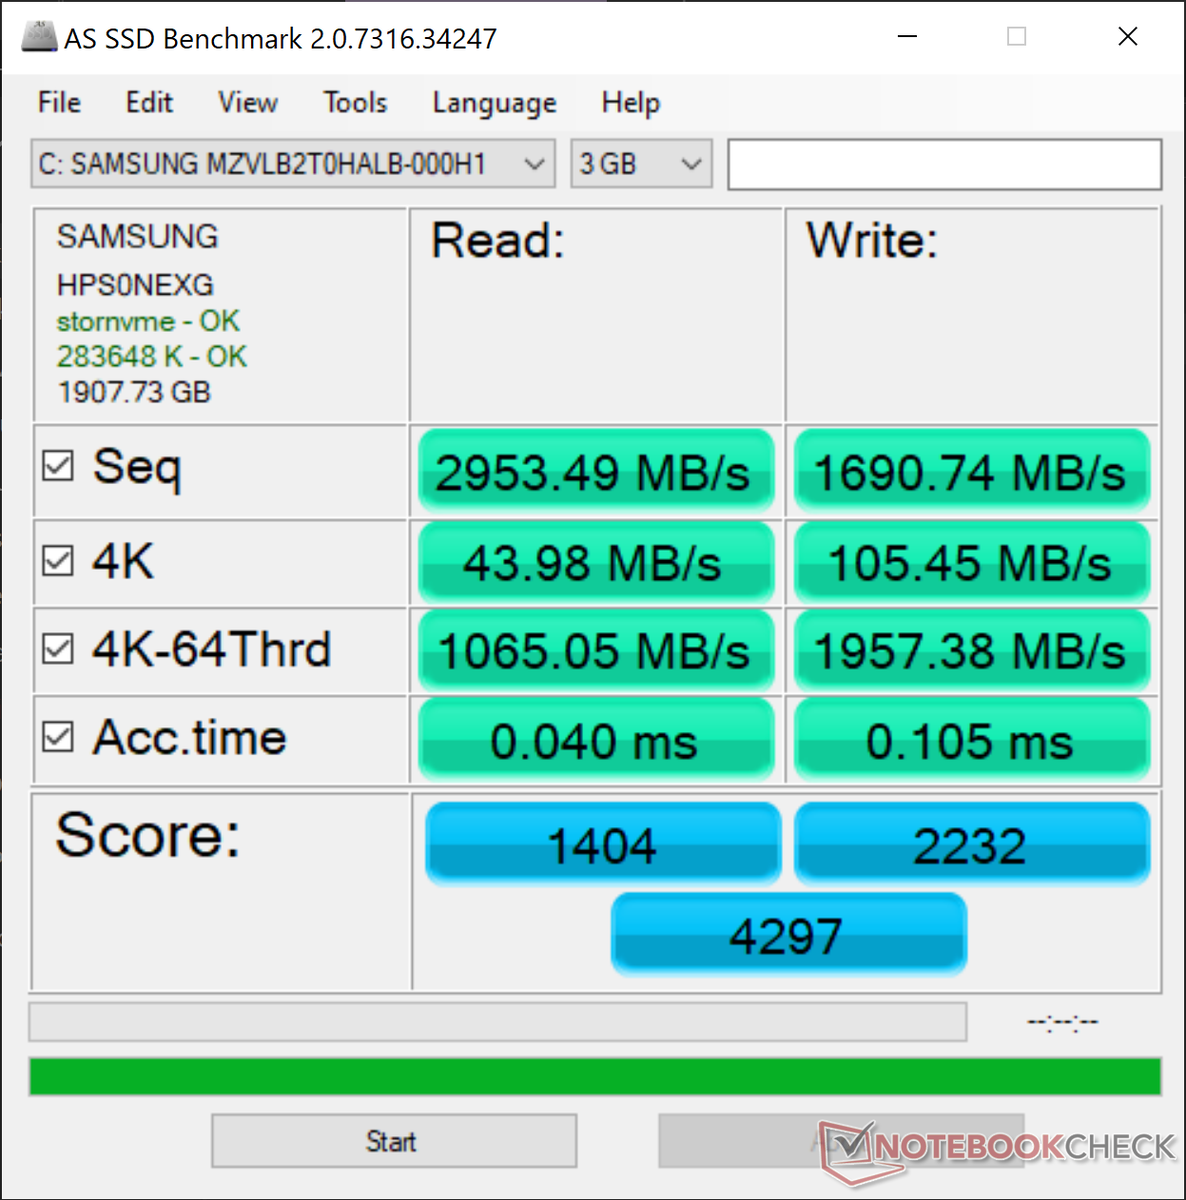
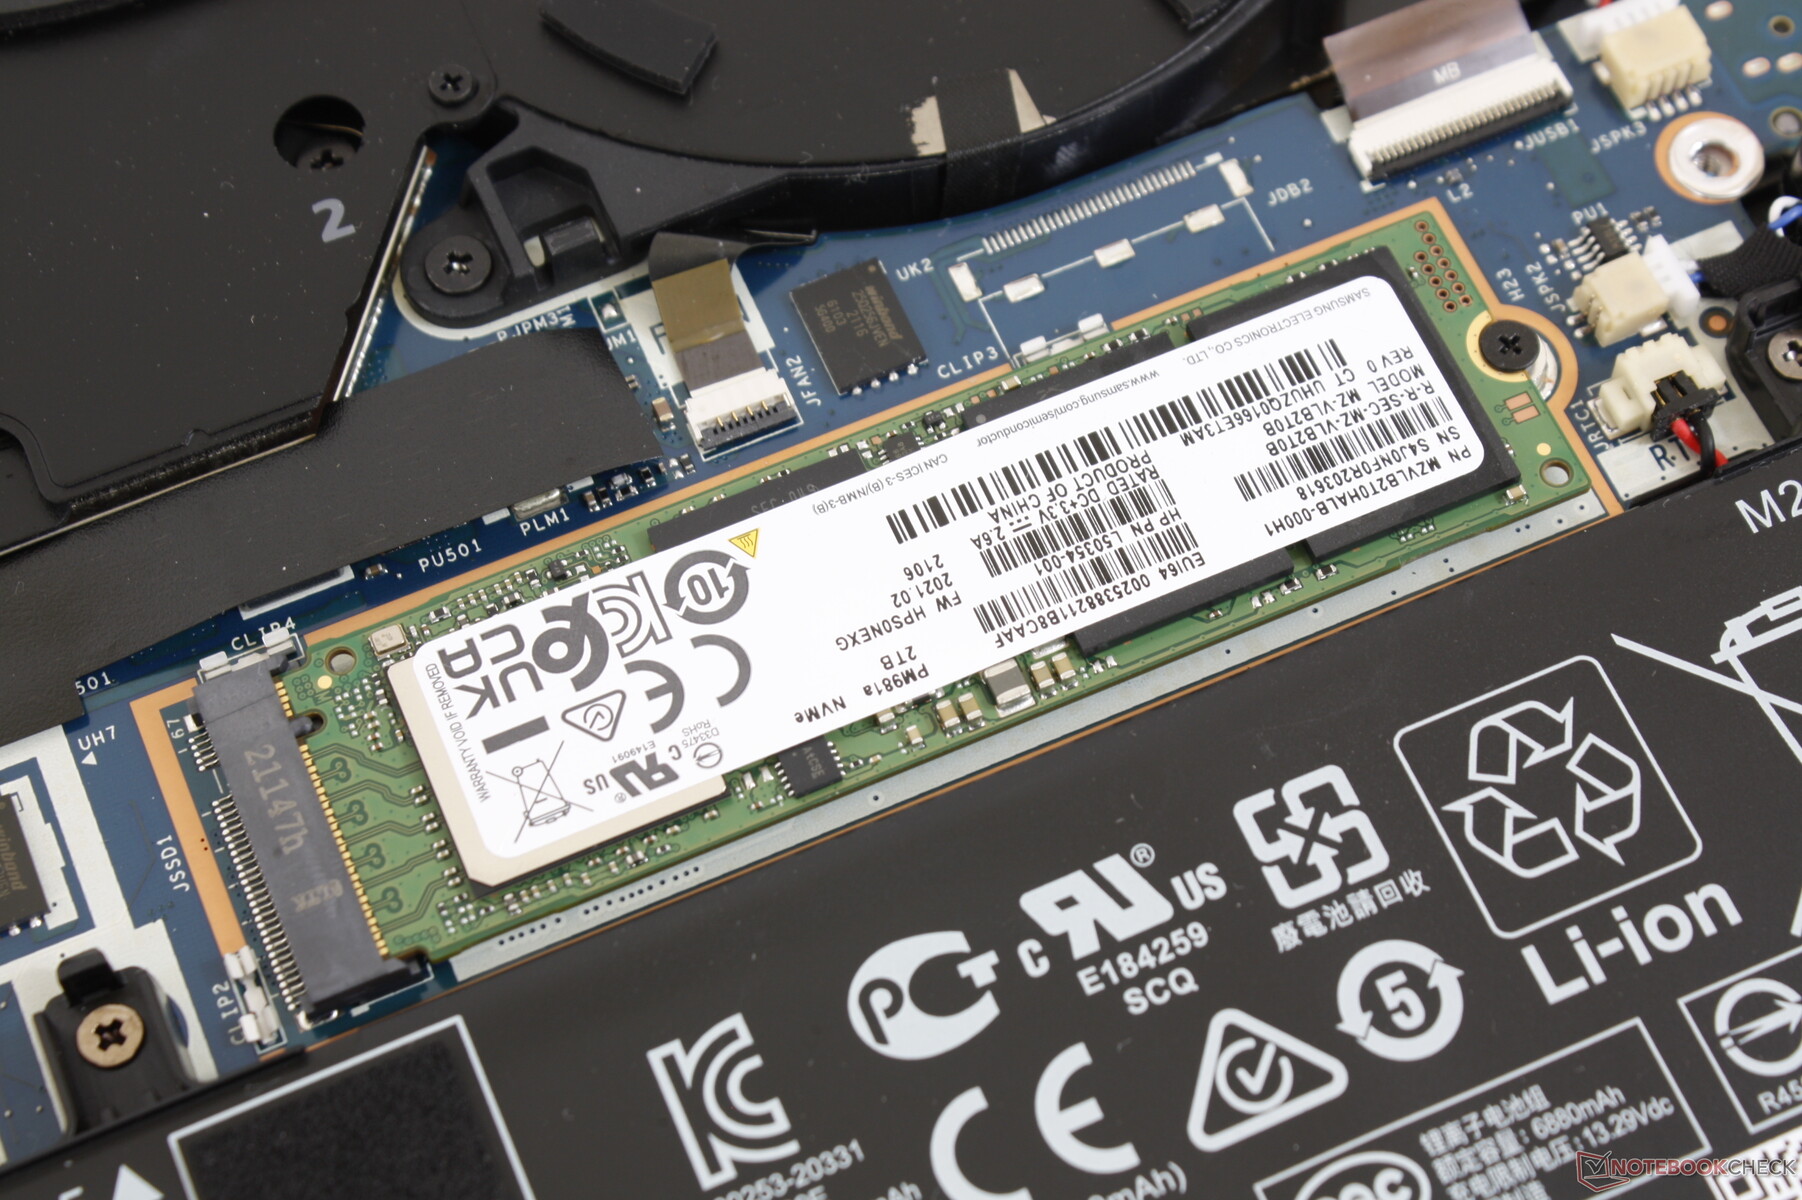
There is just a single internal M.2 2280 PCIe 3 x4 slot with no secondary options. Though we can understand the limited space available, it would've been great to at least see an upgrade to PCIe 4 especially for such a pricey system. Our specific test unit comes with the Samsung MZVLB2T0HALB for fast sequential read and write rates of 3500 MB/s and 3000 MB/s, respectively. HP offers optional SED SSDs as an added layer of security.
| HP ZBook Studio 15 G8 Samsung PM981a MZVLB2T0HALB | HP ZBook Firefly 15 G8 2C9R7EA Toshiba XG6 KXG60ZNV1T02 | HP ZBook Studio G7 Micron 2300 1TB MTFDHBA1T0TDV | Dell Precision 7550 SK Hynix PC601A NVMe 1TB | Lenovo ThinkPad P15s Gen2-20W6000GGE WDC PC SN720 SDAQNTW-1T00 | Asus ProArt StudioBook Pro 15 W500G5T Samsung SSD PM981 MZVLB1T0HALR | |
|---|---|---|---|---|---|---|
| AS SSD | -1% | -16% | -20% | 11% | 4% | |
| Seq Read | 2953 | 2599 -12% | 2548 -14% | 2028 -31% | 2796 -5% | 2702 -8% |
| Seq Write | 1691 | 1305 -23% | 1312 -22% | 1193 -29% | 2525 49% | 2348 39% |
| 4K Read | 43.98 | 49.65 13% | 45.38 3% | 42.31 -4% | 50.9 16% | 37.59 -15% |
| 4K Write | 105.4 | 128.1 22% | 83 -21% | 105.5 0% | 211.9 101% | 107.1 2% |
| 4K-64 Read | 1065 | 1157 9% | 935 -12% | 1128 6% | 1505 41% | 1491 40% |
| 4K-64 Write | 1957 | 1475 -25% | 2314 18% | 1537 -21% | 949 -52% | 1794 -8% |
| Access Time Read * | 0.04 | 0.057 -43% | 0.057 -43% | 0.069 -73% | 0.081 -103% | 0.046 -15% |
| Access Time Write * | 0.105 | 0.03 71% | 0.098 7% | 0.106 -1% | 0.019 82% | 0.034 68% |
| Score Read | 1404 | 1467 4% | 1235 -12% | 1373 -2% | 1835 31% | 1798 28% |
| Score Write | 2232 | 1734 -22% | 2528 13% | 1762 -21% | 1413 -37% | 2136 -4% |
| Score Total | 4297 | 3894 -9% | 4342 1% | 3801 -12% | 4177 -3% | 4835 13% |
| Copy ISO MB/s | 2474 | 3142 27% | 1768 -29% | 2302 -7% | ||
| Copy Program MB/s | 1074 | 126.1 -88% | 627 -42% | 564 -47% | ||
| Copy Game MB/s | 1929 | 477.4 -75% | 1477 -23% | 1336 -31% | ||
| CrystalDiskMark 5.2 / 6 | 1% | -9% | -8% | 22% | 106% | |
| Write 4K | 110.5 | 140.6 27% | 95.5 -14% | 121 10% | 237.6 115% | 1107 902% |
| Read 4K | 51.8 | 52.8 2% | 48.99 -5% | 42.16 -19% | 54.7 6% | 43.38 -16% |
| Write Seq | 2071 | 1844 -11% | 2001 -3% | 2150 4% | 2603 26% | 2387 15% |
| Read Seq | 2505 | 2108 -16% | 1600 -36% | 1755 -30% | 1889 -25% | 2431 -3% |
| Write 4K Q32T1 | 429.8 | 418 -3% | 410.2 -5% | 395.3 -8% | 505 17% | 340.7 -21% |
| Read 4K Q32T1 | 418.3 | 476.8 14% | 394.7 -6% | 381.8 -9% | 606 45% | 397.8 -5% |
| Write Seq Q32T1 | 3060 | 3064 0% | 3148 3% | 2730 -11% | 2795 -9% | 2390 -22% |
| Read Seq Q32T1 | 3539 | 3289 -7% | 3227 -9% | 3468 -2% | 3448 -3% | 3502 -1% |
| Total Average (Program / Settings) | 0% /
-0% | -13% /
-13% | -14% /
-16% | 17% /
15% | 55% /
41% |
* ... smaller is better

Disk Throttling: DiskSpd Read Loop, Queue Depth 8
GPU Performance — 85 W TGP
Graphics performance is 10 to 15 percent slower than the average RTX 3070 laptop in our database. The deficit is wide enough that even some older RTX 2070 or RTX 3060 laptops like the Schenker XMG Core 15 can sometimes outperform our pricier RTX 3070 system. It's not a slow laptop by any means, but it could have certainly been faster based on our experience with dozens of other systems with the same RTX 3070 GPU.
Users can swap out the GeForce GPU for the Quadro RTX A3000 or A4000 to maximize CAD, CGI, and other workstation-specific workloads.
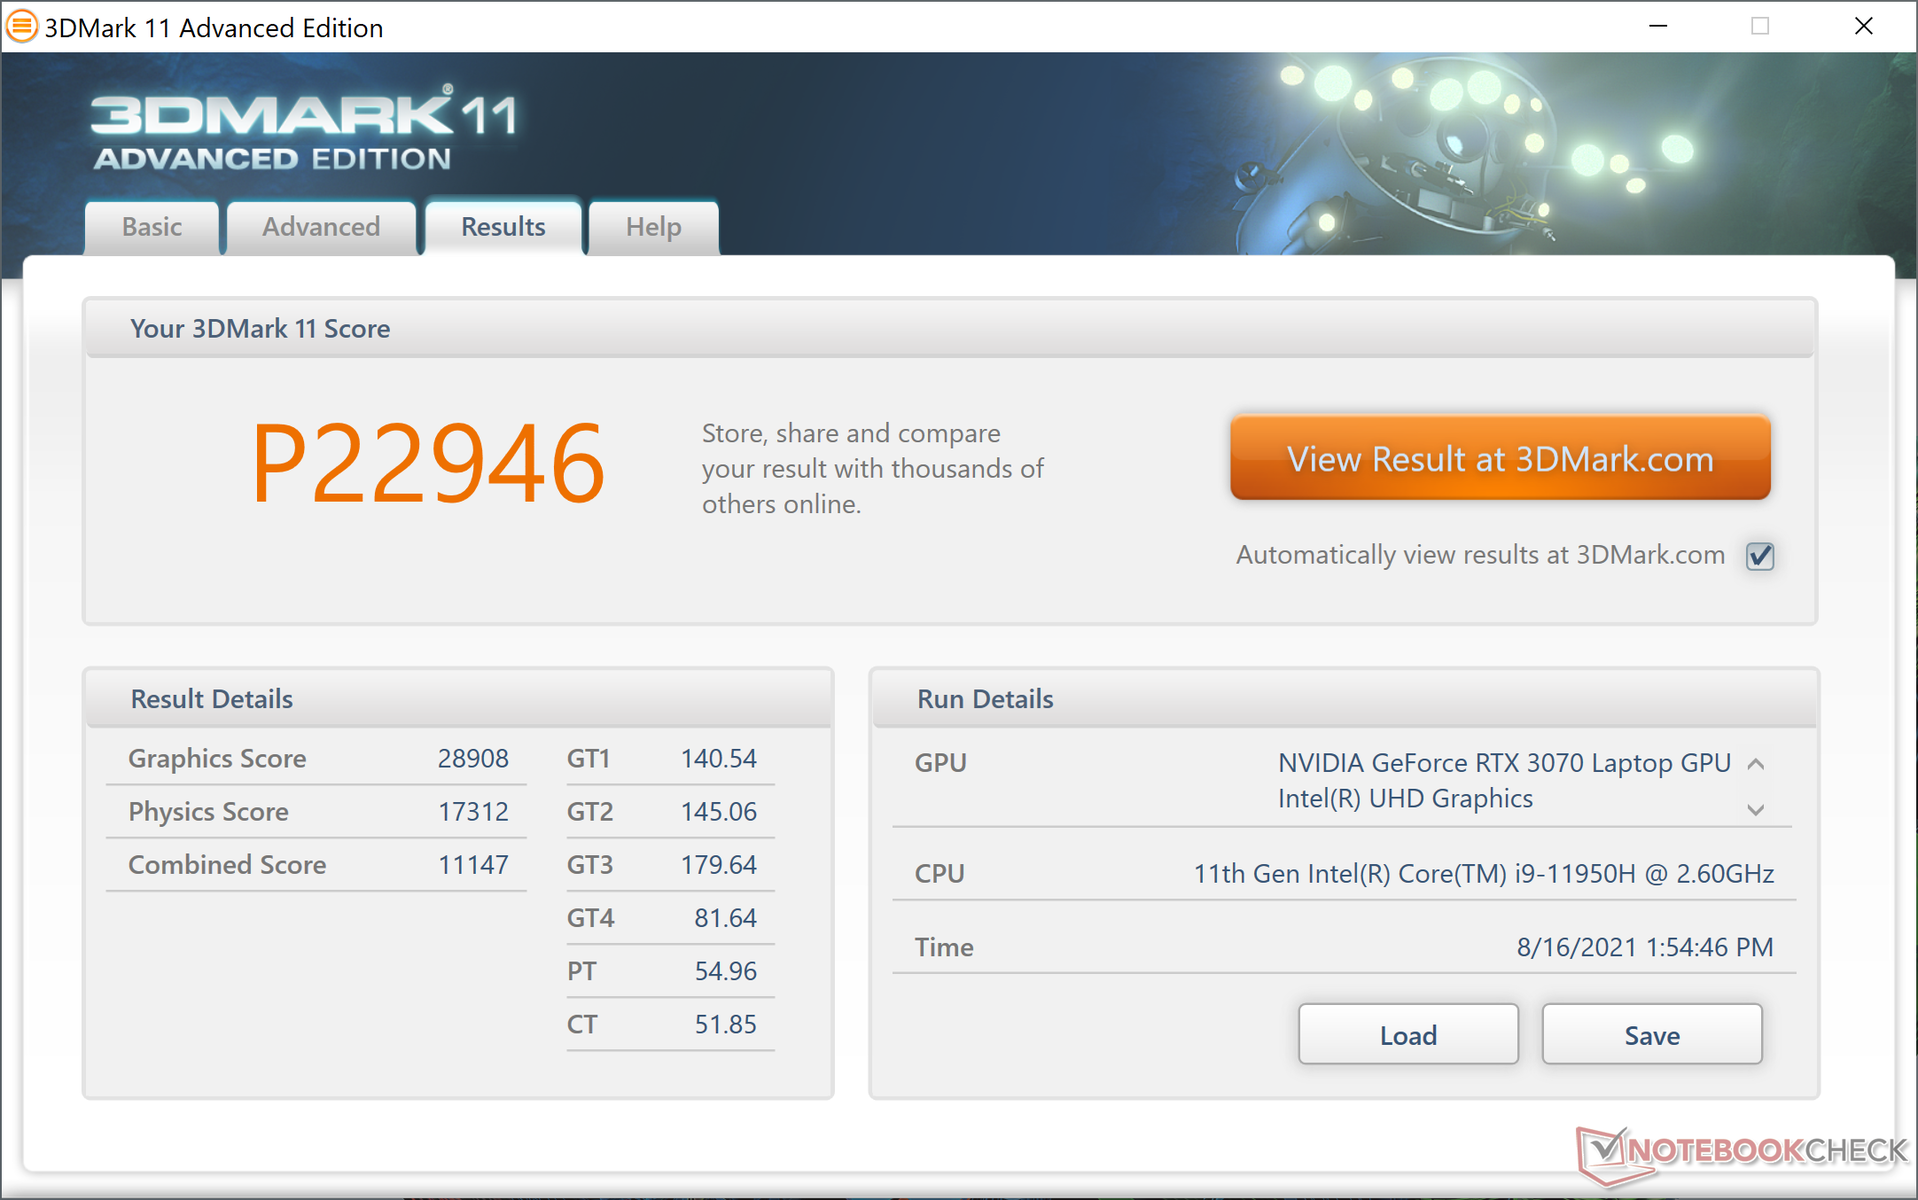
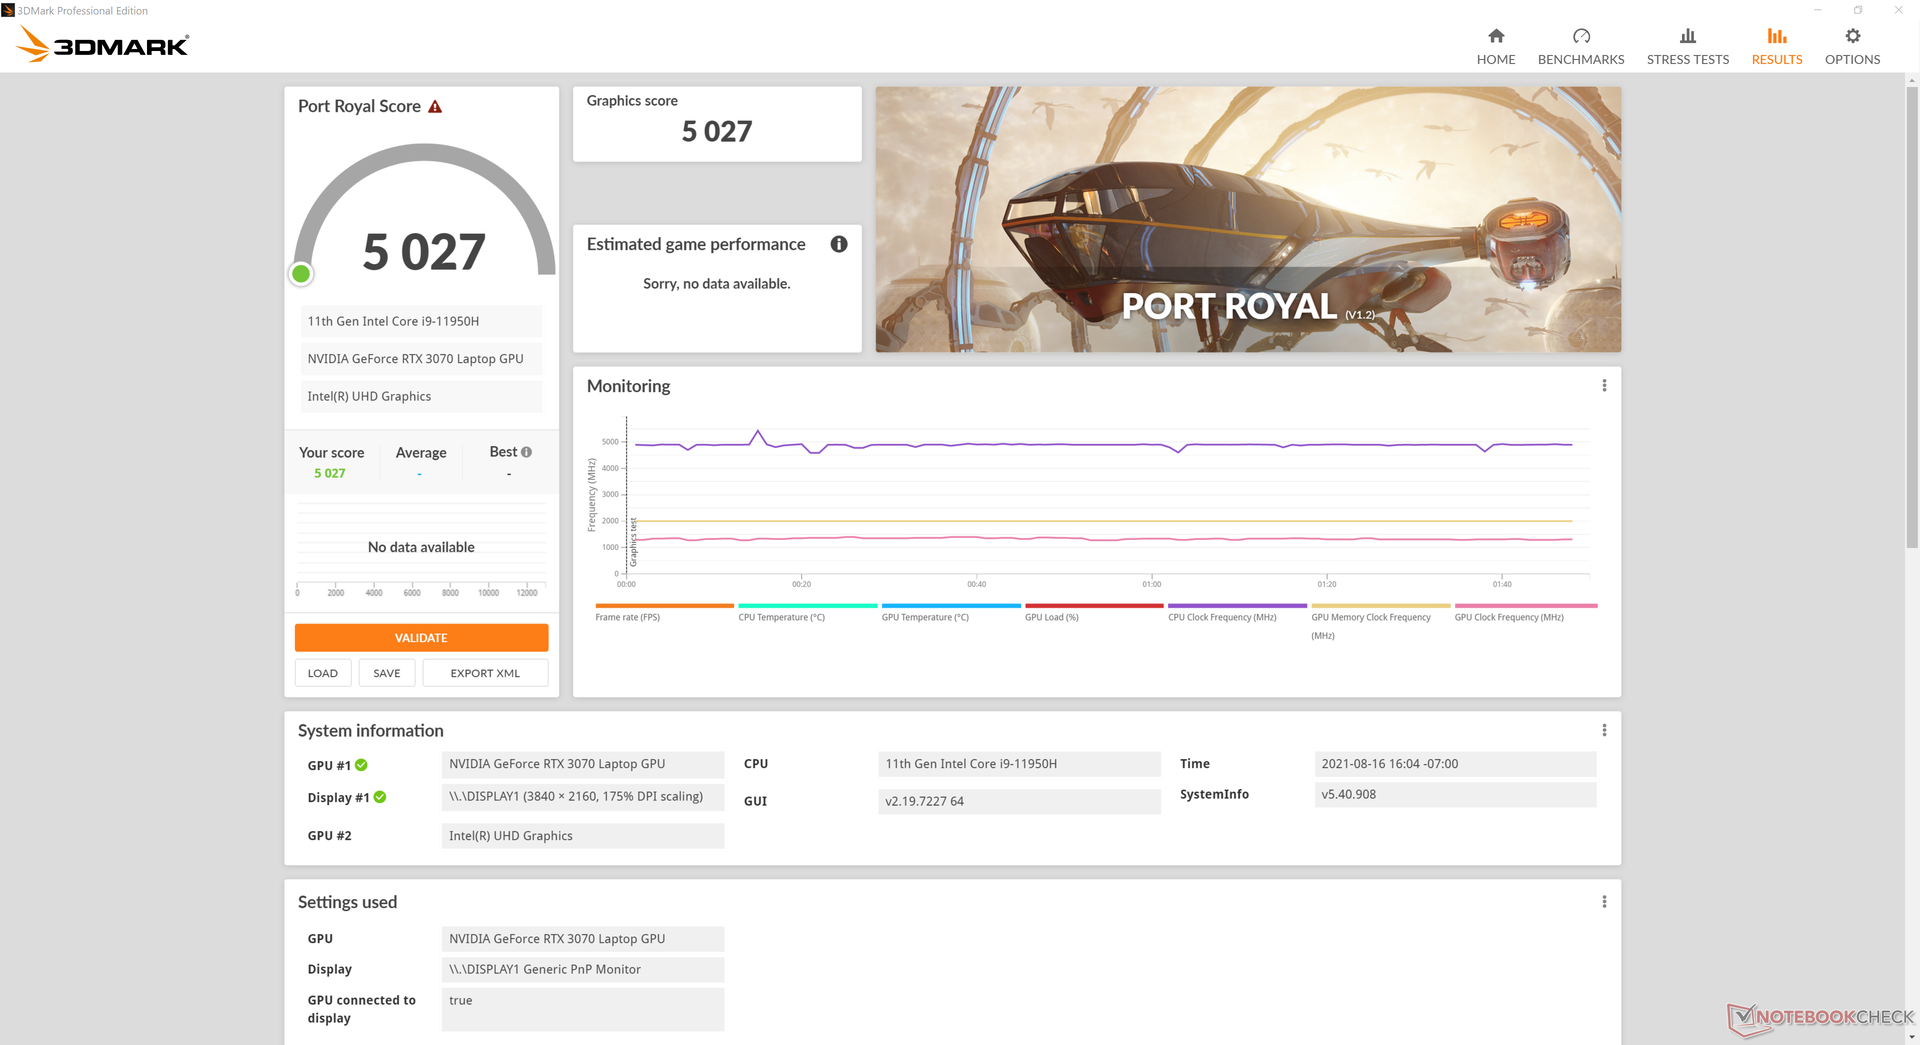
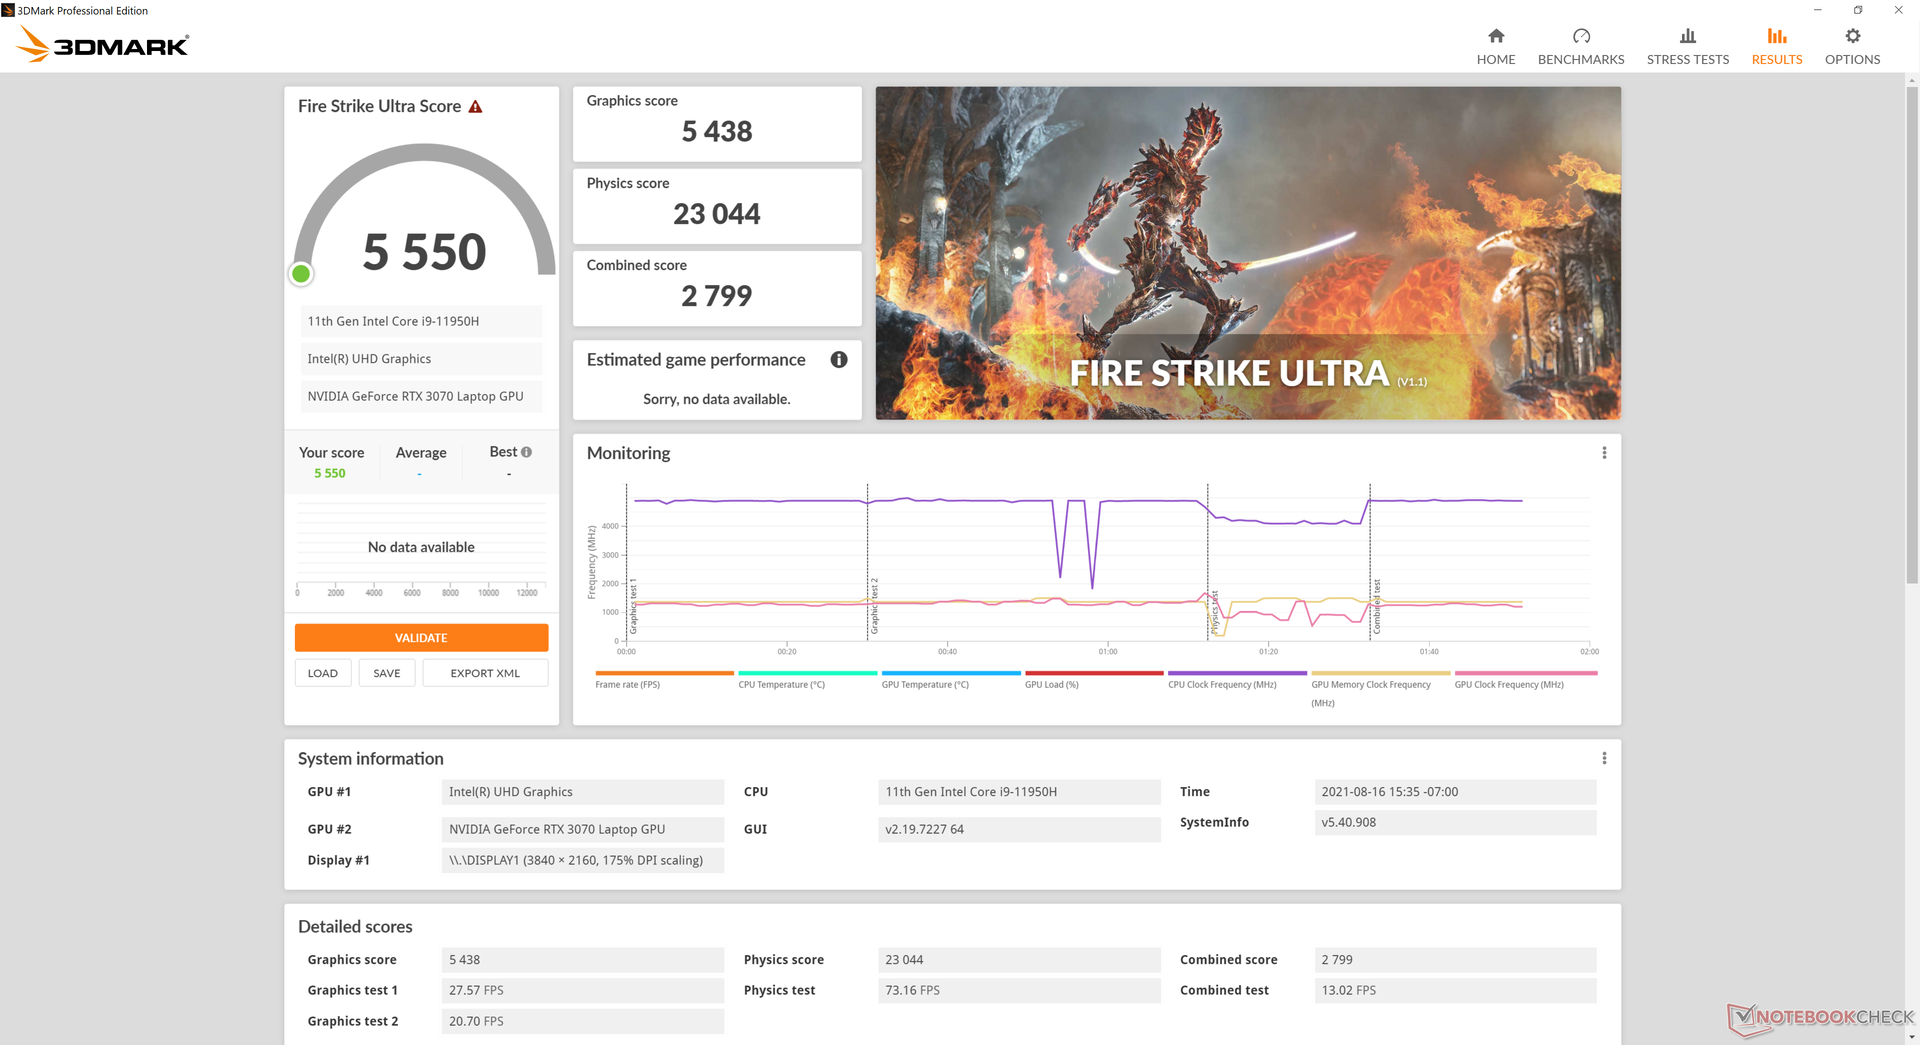
| 3DMark 11 Performance | 22946 points | |
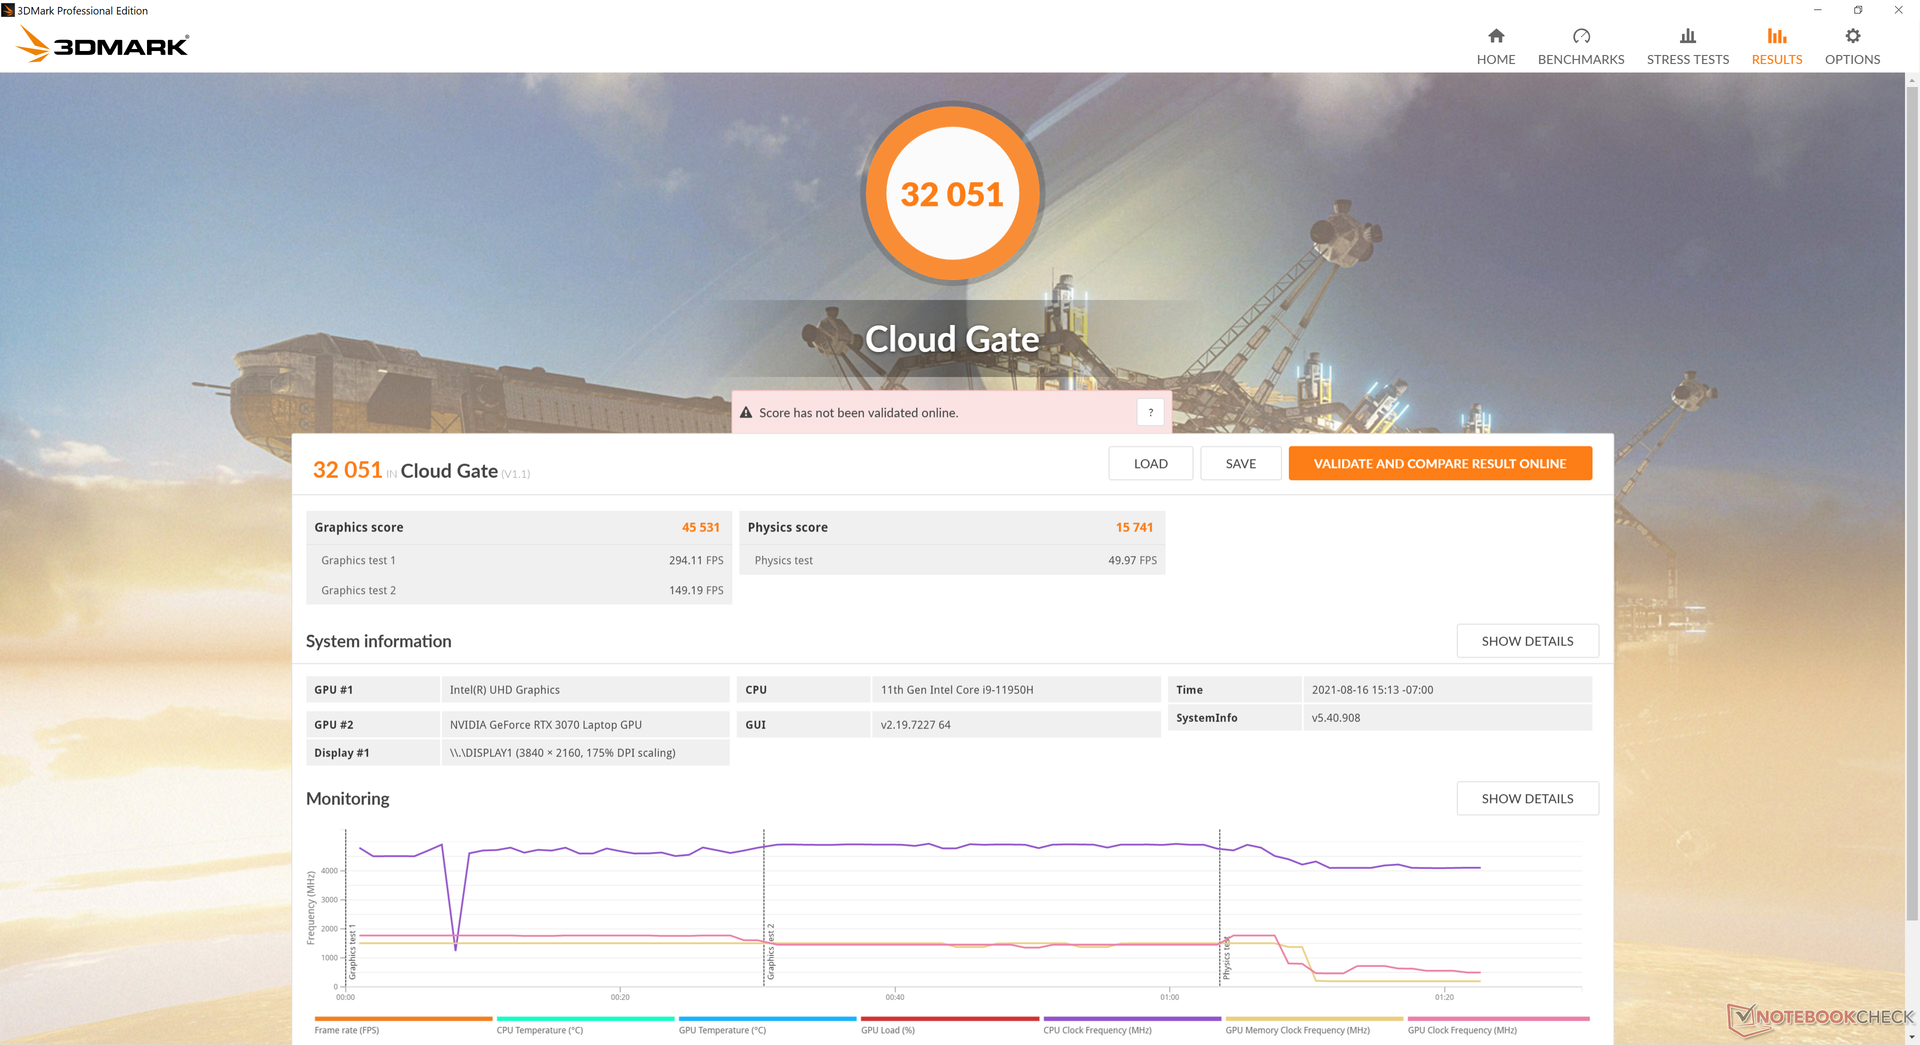
| 3DMark Cloud Gate Standard Score | 32051 points | |
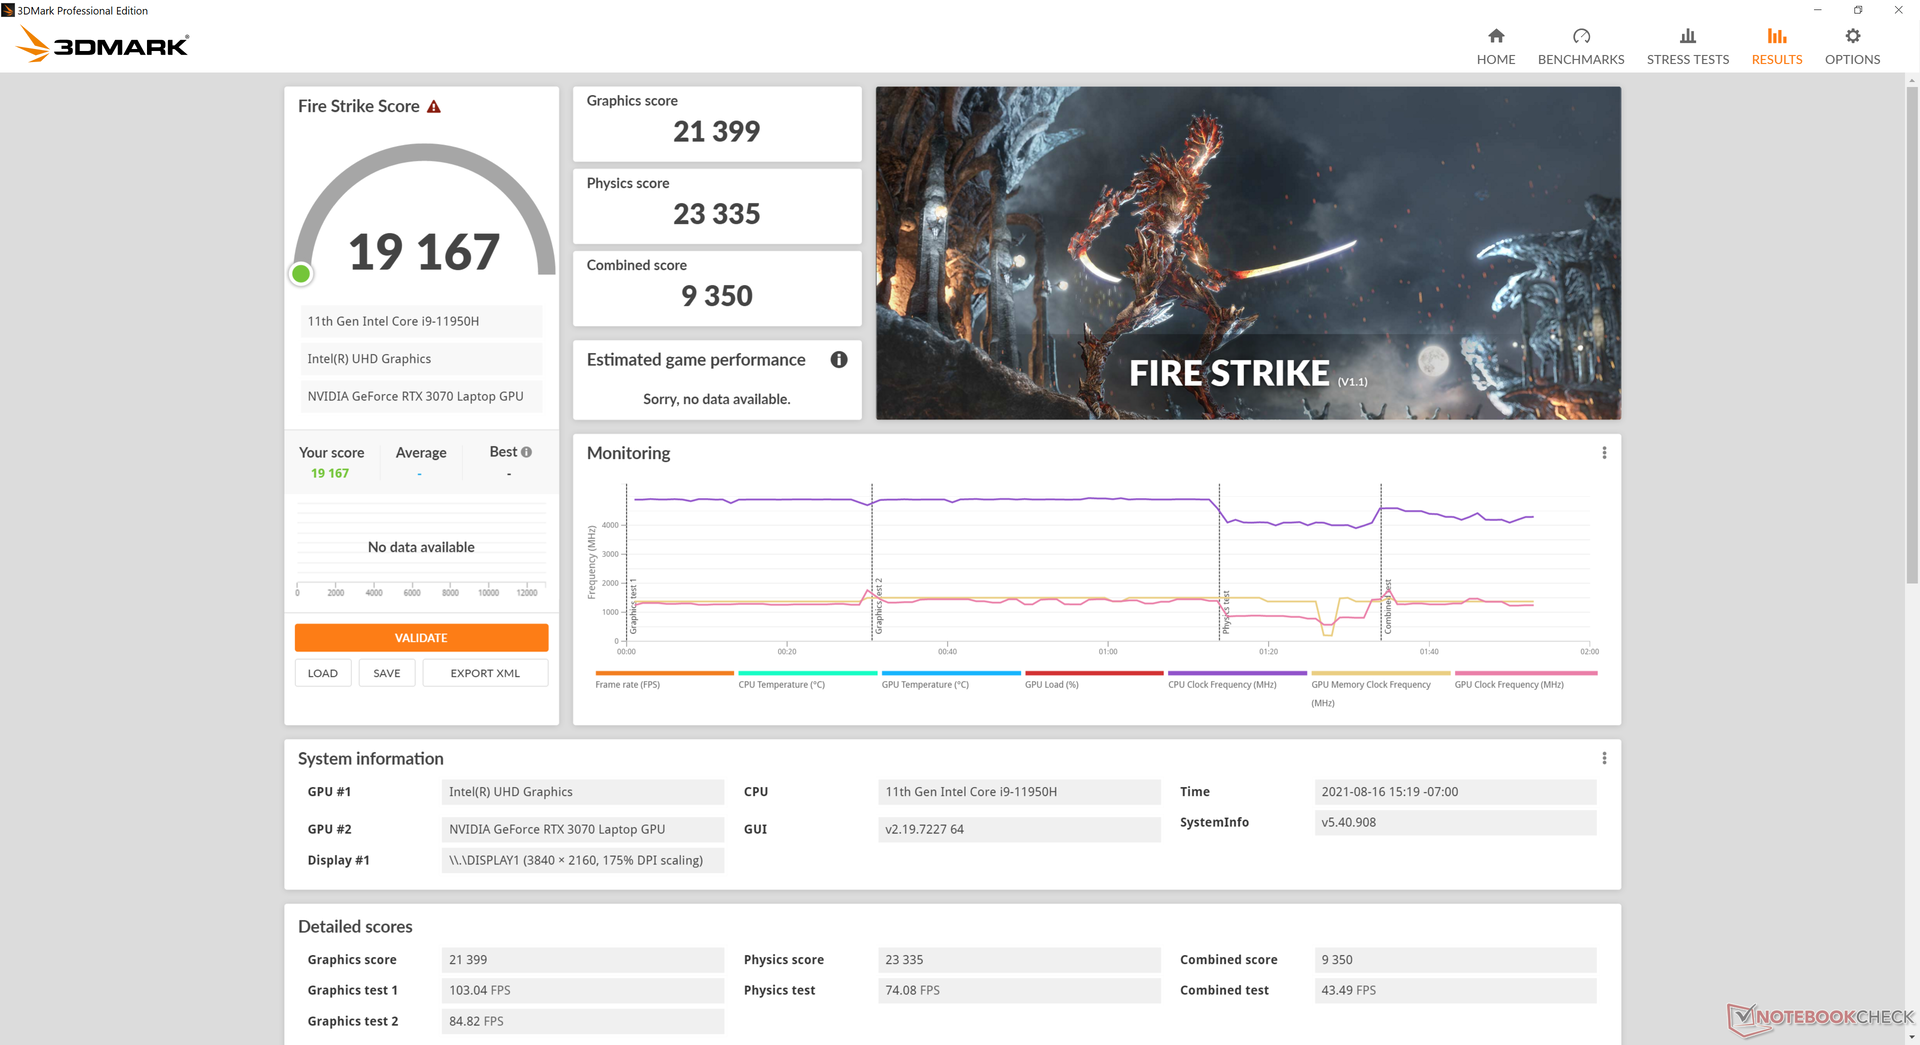
| 3DMark Fire Strike Score | 19167 points | |
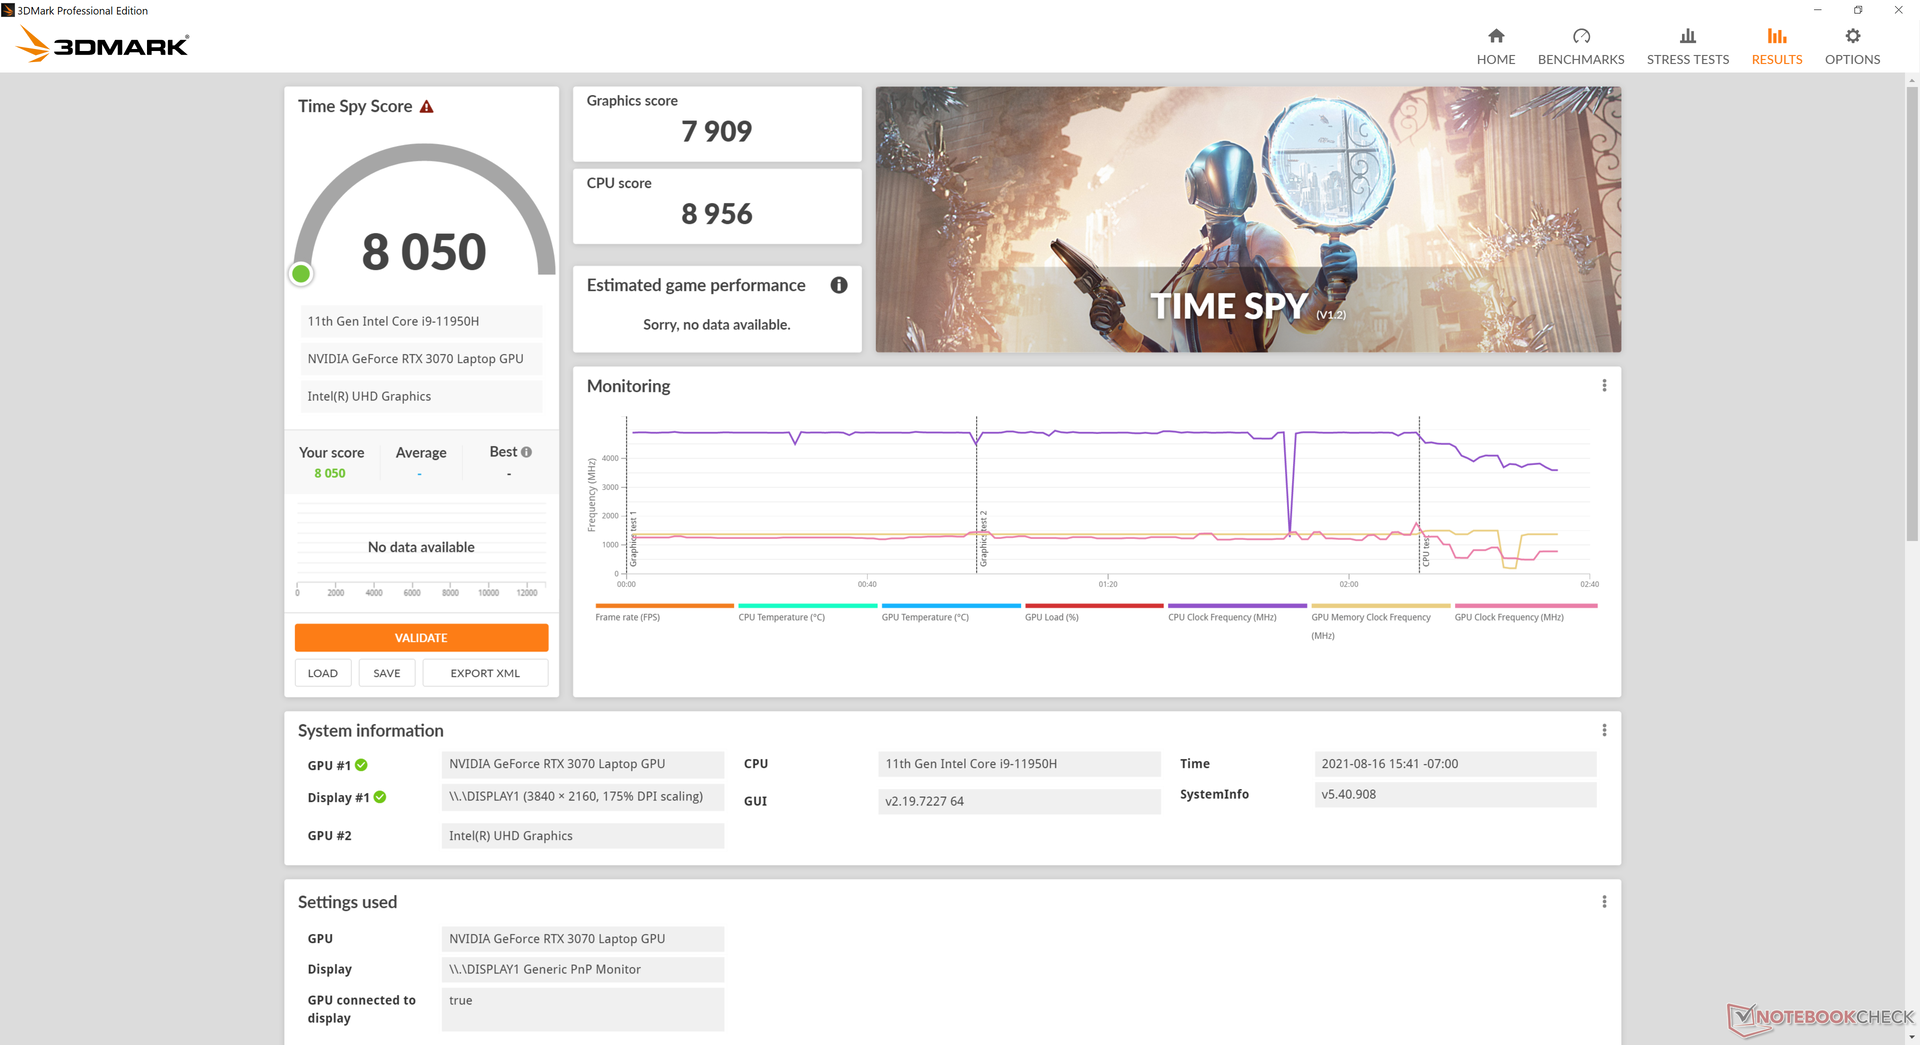
| 3DMark Time Spy Score | 8050 points | |
Help | ||
Witcher 3 FPS Chart
| low | med. | high | ultra | QHD | 4K | |
| The Witcher 3 (2015) | 365.9 | 252.2 | 154.2 | 81.5 | 40.3 | |
| Dota 2 Reborn (2015) | 162.5 | 144.1 | 135.8 | 116.3 | 93.1 | |
| Final Fantasy XV Benchmark (2018) | 144 | 104 | 78.5 | 61.3 | 36.2 | |
| X-Plane 11.11 (2018) | 120 | 104 | 83.5 | 54.4 | ||
| Far Cry 5 (2018) | 125 | 100 | 93 | 89 | 81 | 44 |
Emissions
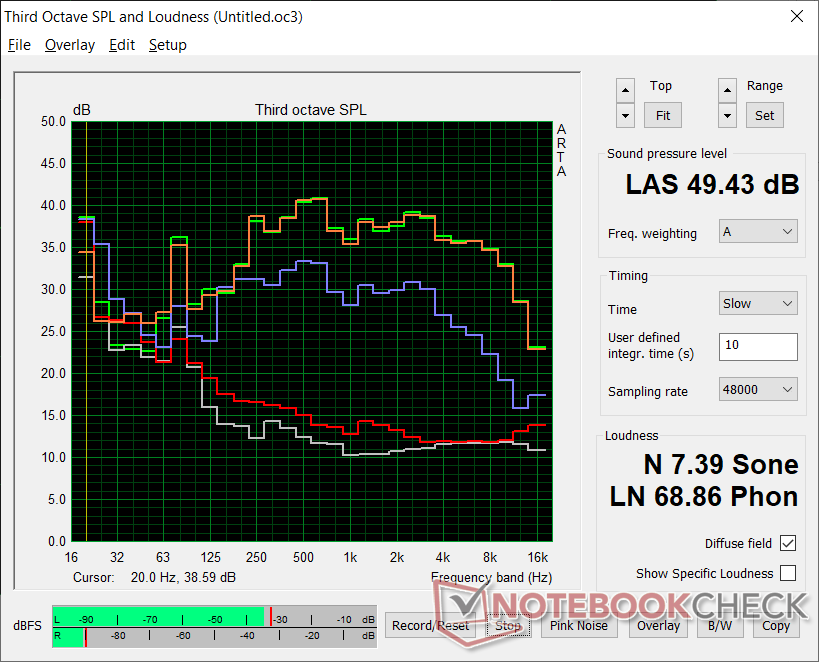
System Noise — Not Any Quieter
Cramming high-performance processors in a thin chassis will inevitably lead to loud fans. At almost 50 dB(A) when running games or other high loads, the ZBook G8 can get louder than the competition including the Razer Blade 15 Studio and last year's ZBook Studio G7. The fans are never truly idle meaning there will always be a bit of noise even when idling on desktop with no running applications. Expect a tolerable fan noise of up to 29.3 dB(A) against a background of 23.5 dB(A) during undemanding loads like word processing, video streaming, or browsing.
| HP ZBook Studio 15 G8 GeForce RTX 3070 Laptop GPU, i9-11950H, Samsung PM981a MZVLB2T0HALB | HP ZBook Firefly 15 G8 2C9R7EA T500 Laptop GPU, i7-1165G7, Toshiba XG6 KXG60ZNV1T02 | HP ZBook Studio G7 Quadro RTX 3000 Max-Q, i9-10885H, Micron 2300 1TB MTFDHBA1T0TDV | Dell Precision 7550 Quadro RTX 5000 Max-Q, W-10885M, SK Hynix PC601A NVMe 1TB | Lenovo ThinkPad P15s Gen2-20W6000GGE T500 Laptop GPU, i7-1165G7, WDC PC SN720 SDAQNTW-1T00 | Asus ProArt StudioBook Pro 15 W500G5T Quadro RTX 5000 Max-Q, i7-9750H, Samsung SSD PM981 MZVLB1T0HALR | |
|---|---|---|---|---|---|---|
| Noise | 11% | 2% | -7% | 6% | -8% | |
| off / environment * | 23.5 | 24.1 -3% | 24.4 -4% | 25.8 -10% | 24.3 -3% | 25.2 -7% |
| Idle Minimum * | 25.3 | 24.1 5% | 24.4 4% | 25.8 -2% | 25.5 -1% | 27.9 -10% |
| Idle Average * | 25.3 | 24.1 5% | 24.4 4% | 25.8 -2% | 25.5 -1% | 27.9 -10% |
| Idle Maximum * | 25.3 | 27.1 -7% | 27.9 -10% | 25.9 -2% | 25.5 -1% | 27.9 -10% |
| Load Average * | 41.2 | 32.8 20% | 38.8 6% | 51.2 -24% | 35.65 13% | 47 -14% |
| Witcher 3 ultra * | 49.4 | 36.1 27% | 46.3 6% | 51.9 -5% | ||
| Load Maximum * | 49.4 | 36.1 27% | 46.3 6% | 51.9 -5% | 35.65 28% | 46.9 5% |
* ... smaller is better
Noise Level
| Idle |
| 25.3 / 25.3 / 25.3 dB(A) |
| Load |
| 41.2 / 49.4 dB(A) |
 | ||
30 dB silent 40 dB(A) audible 50 dB(A) loud |
||
min: | ||
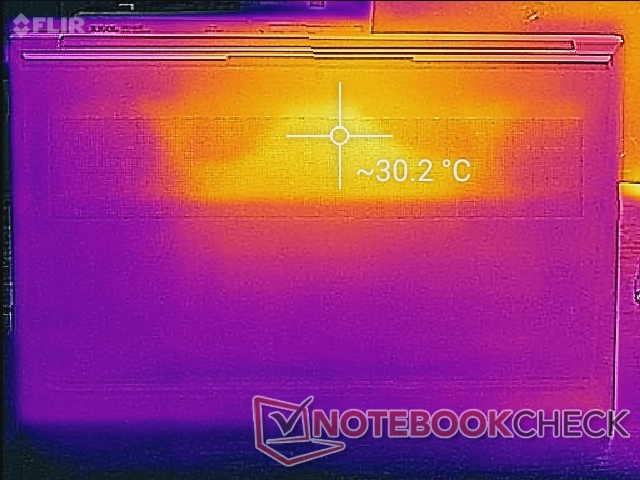
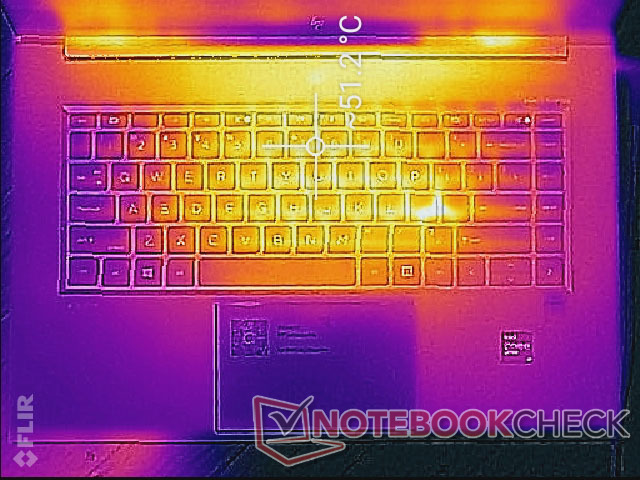
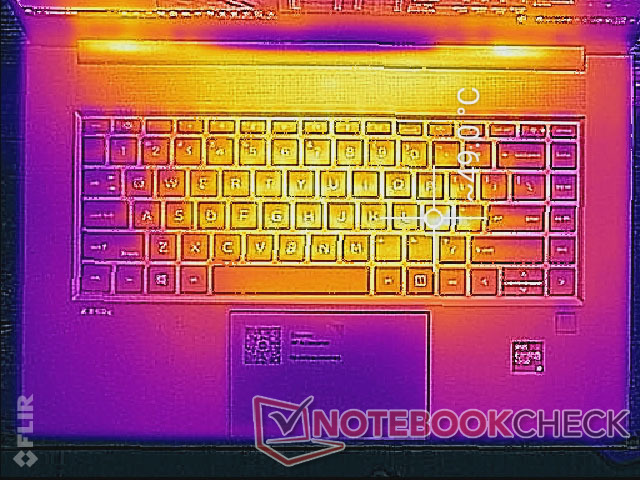
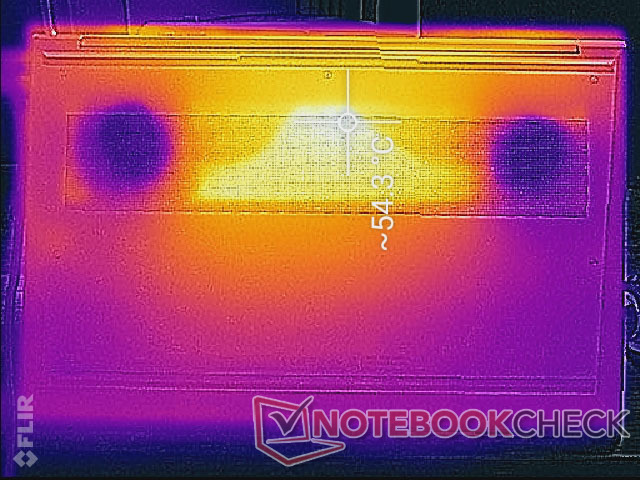
Temperature — Warm Palm Rests
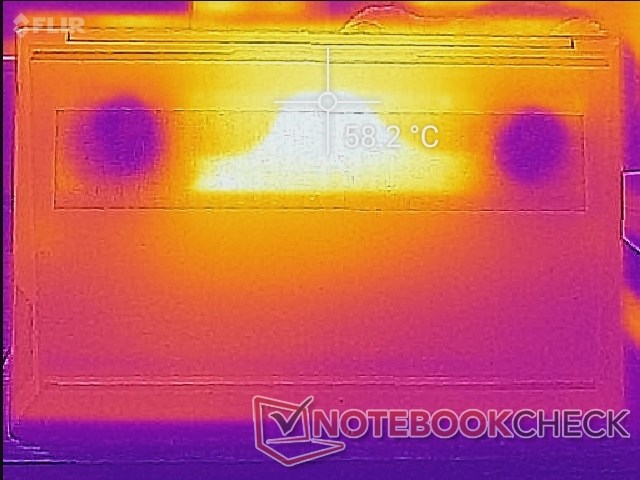
Surface temperatures are symmetrical due to the symmetric cooling solution within. The hot spot is near the center of the keyboard where it can reach over 51 C when running high loads compared to 49 C on the Dell Precision 7550. The palm rests can also get quite warm at about 38 C due to the dense design of the metal base. The warmer temperatures aren't uncomfortable to the hands, but they are certainly noticeable.
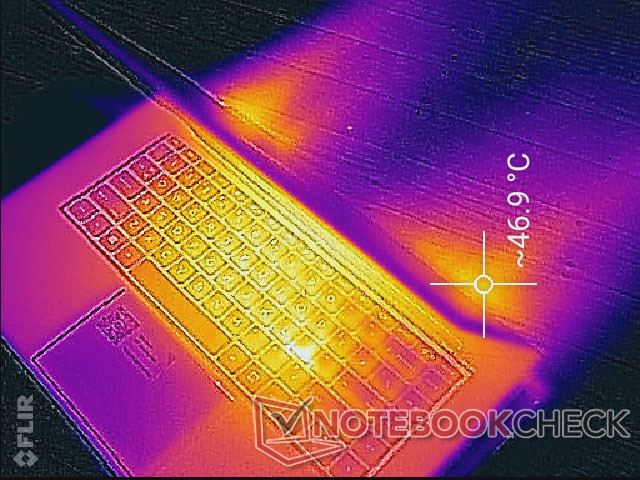
(-) The maximum temperature on the upper side is 49 °C / 120 F, compared to the average of 38.1 °C / 101 F, ranging from 22.2 to 69.8 °C for the class Workstation.
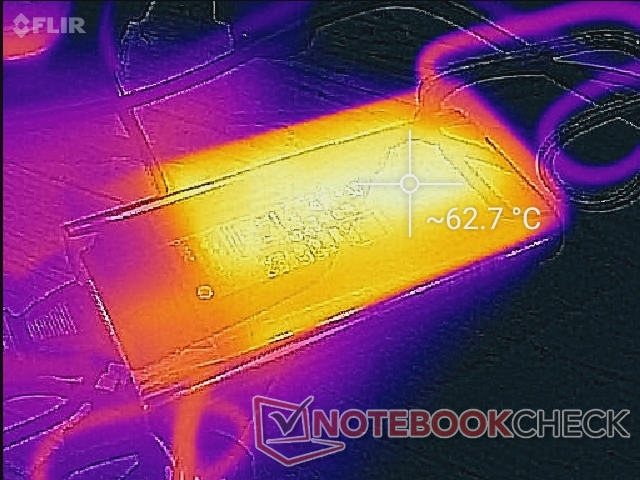
(-) The bottom heats up to a maximum of 54.2 °C / 130 F, compared to the average of 41.3 °C / 106 F
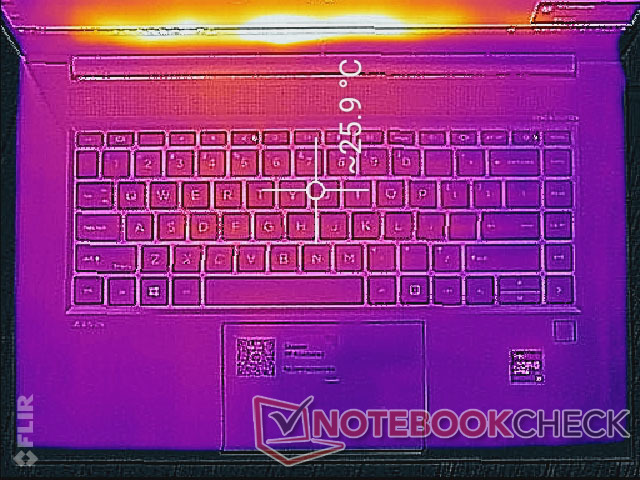
(+) In idle usage, the average temperature for the upper side is 25.4 °C / 78 F, compared to the device average of 32 °C / 90 F.
(-) Playing The Witcher 3, the average temperature for the upper side is 43.2 °C / 110 F, compared to the device average of 32 °C / 90 F.
(±) The palmrests and touchpad can get very hot to the touch with a maximum of 38.4 °C / 101.1 F.
(-) The average temperature of the palmrest area of similar devices was 27.8 °C / 82 F (-10.6 °C / -19.1 F).
Stress Test
When under Prime95 stress, the CPU would boost to 4 GHz for only the first second or two before hitting a core temperature of 97 C. Clock rates would then stabilize in the 2.8 to 3.3 GHz range in order to prevent core temperatures from rising even higher. Running this same test on the ZBook Fury 15 G7 would show similar core temperature results.
The CPU and GPU would stabilize at 77 C and 70 C, respectively, when running Witcher 3 which is just slightly cooler than what we observed on the Dell Precision 5750 or ZBook Fury 15 G7.
Running on battery power will severely limit performance. A 3DMark 11 test on batteries would return Physics and Graphics scores of 10388 and 9950, respectively, compared to 17312 and 28908 points when on mains.
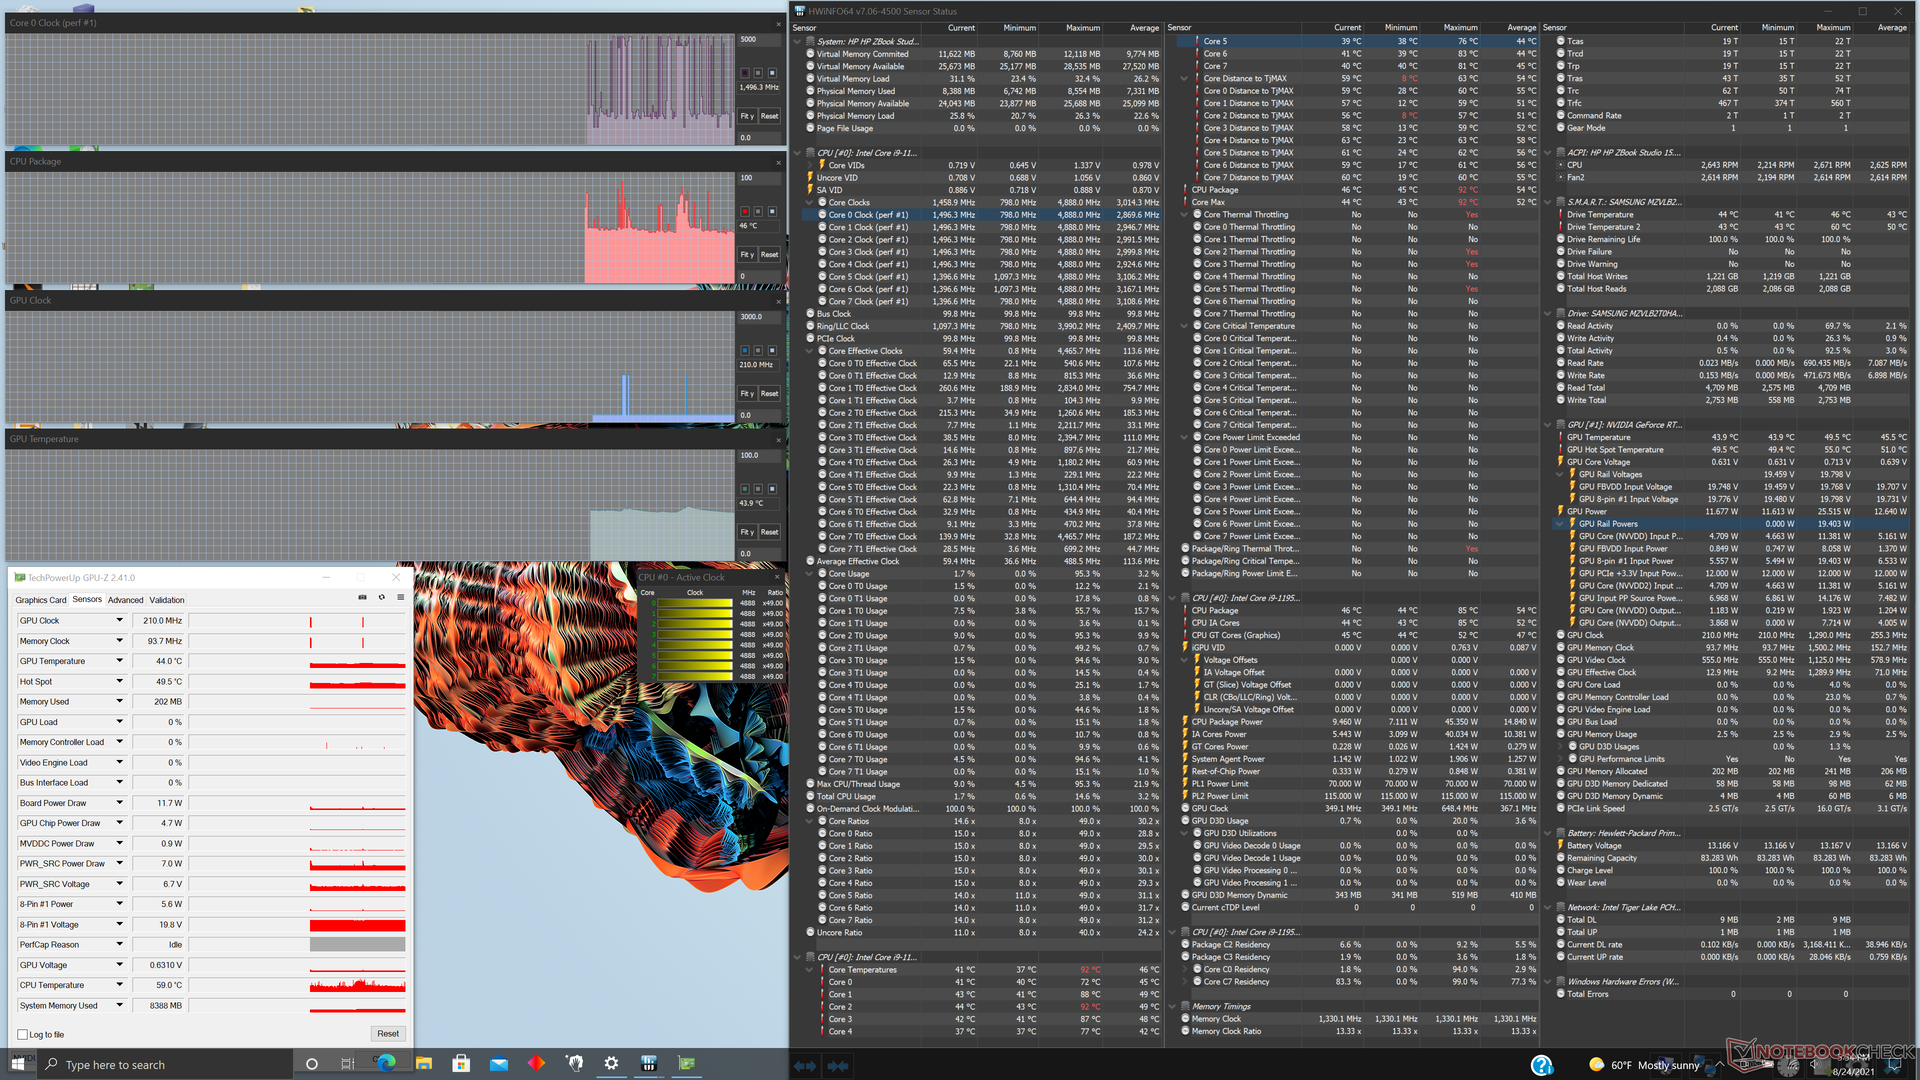
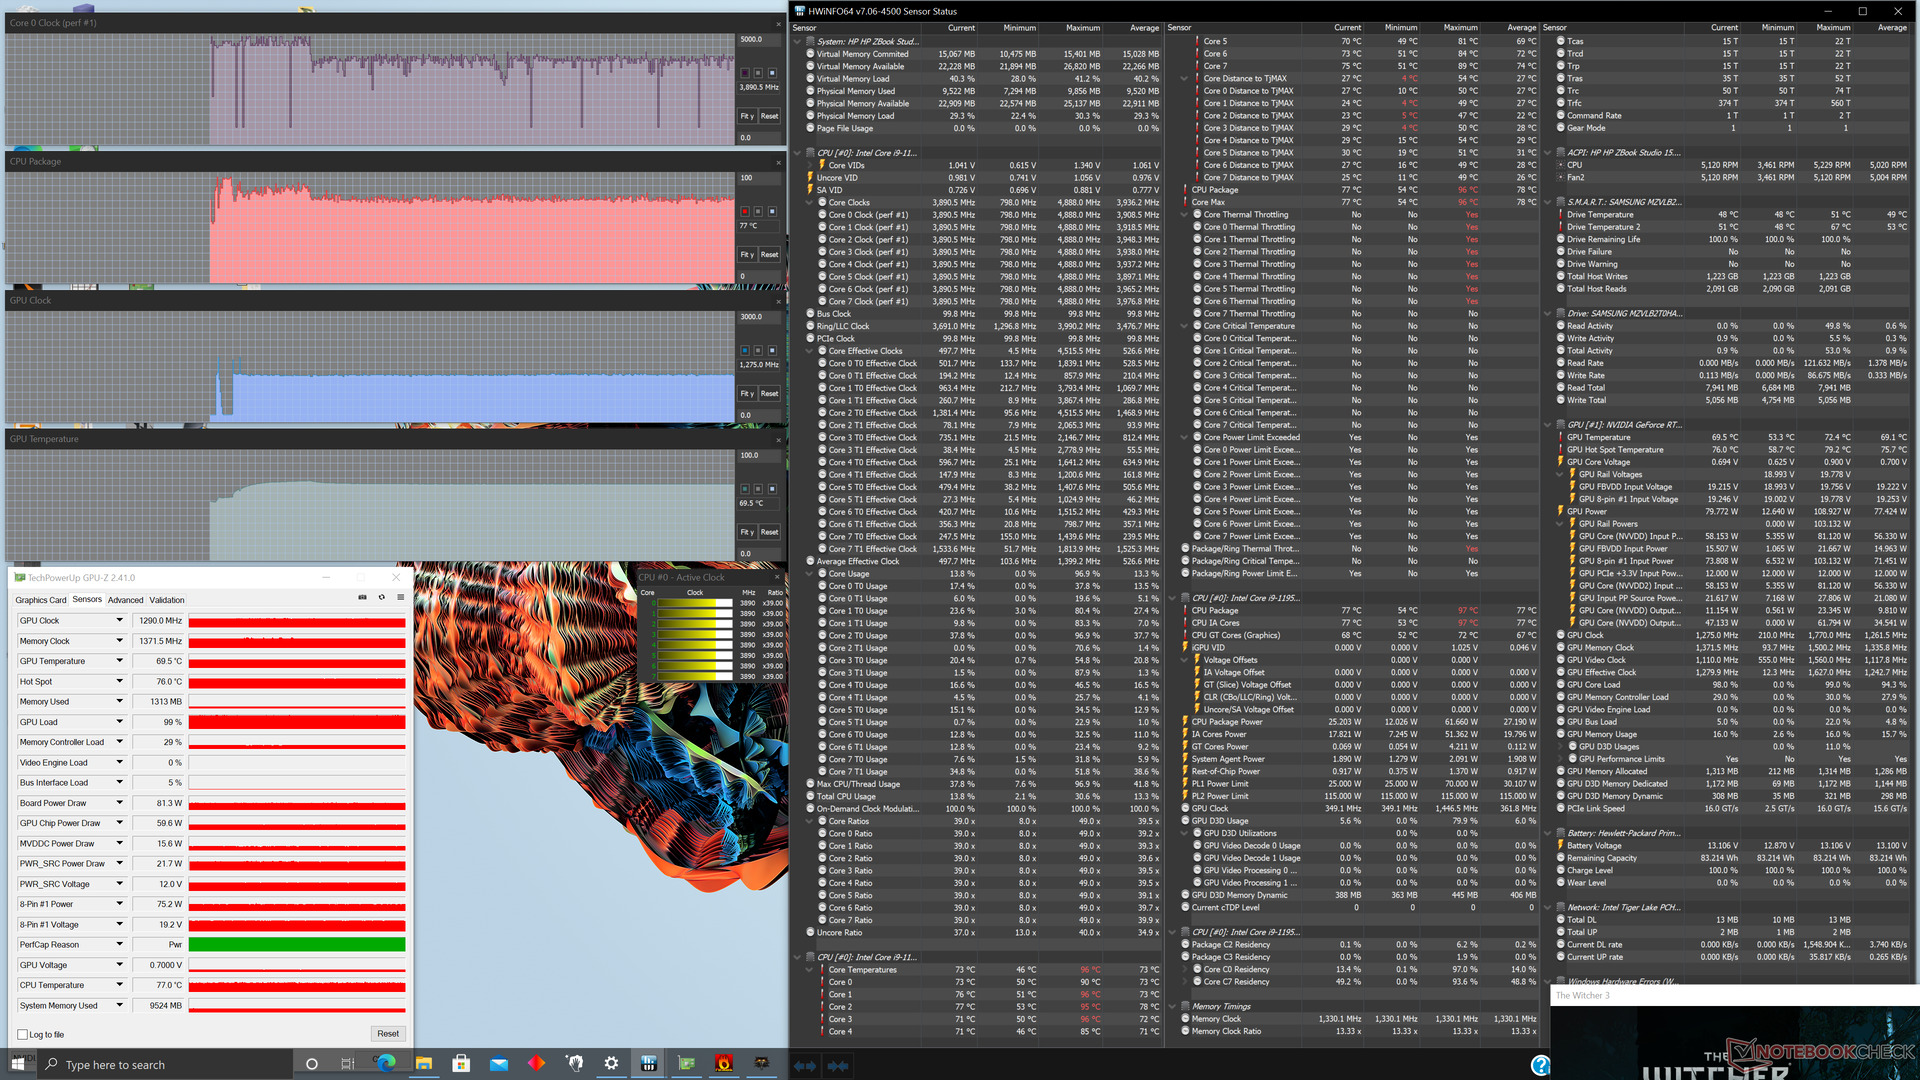
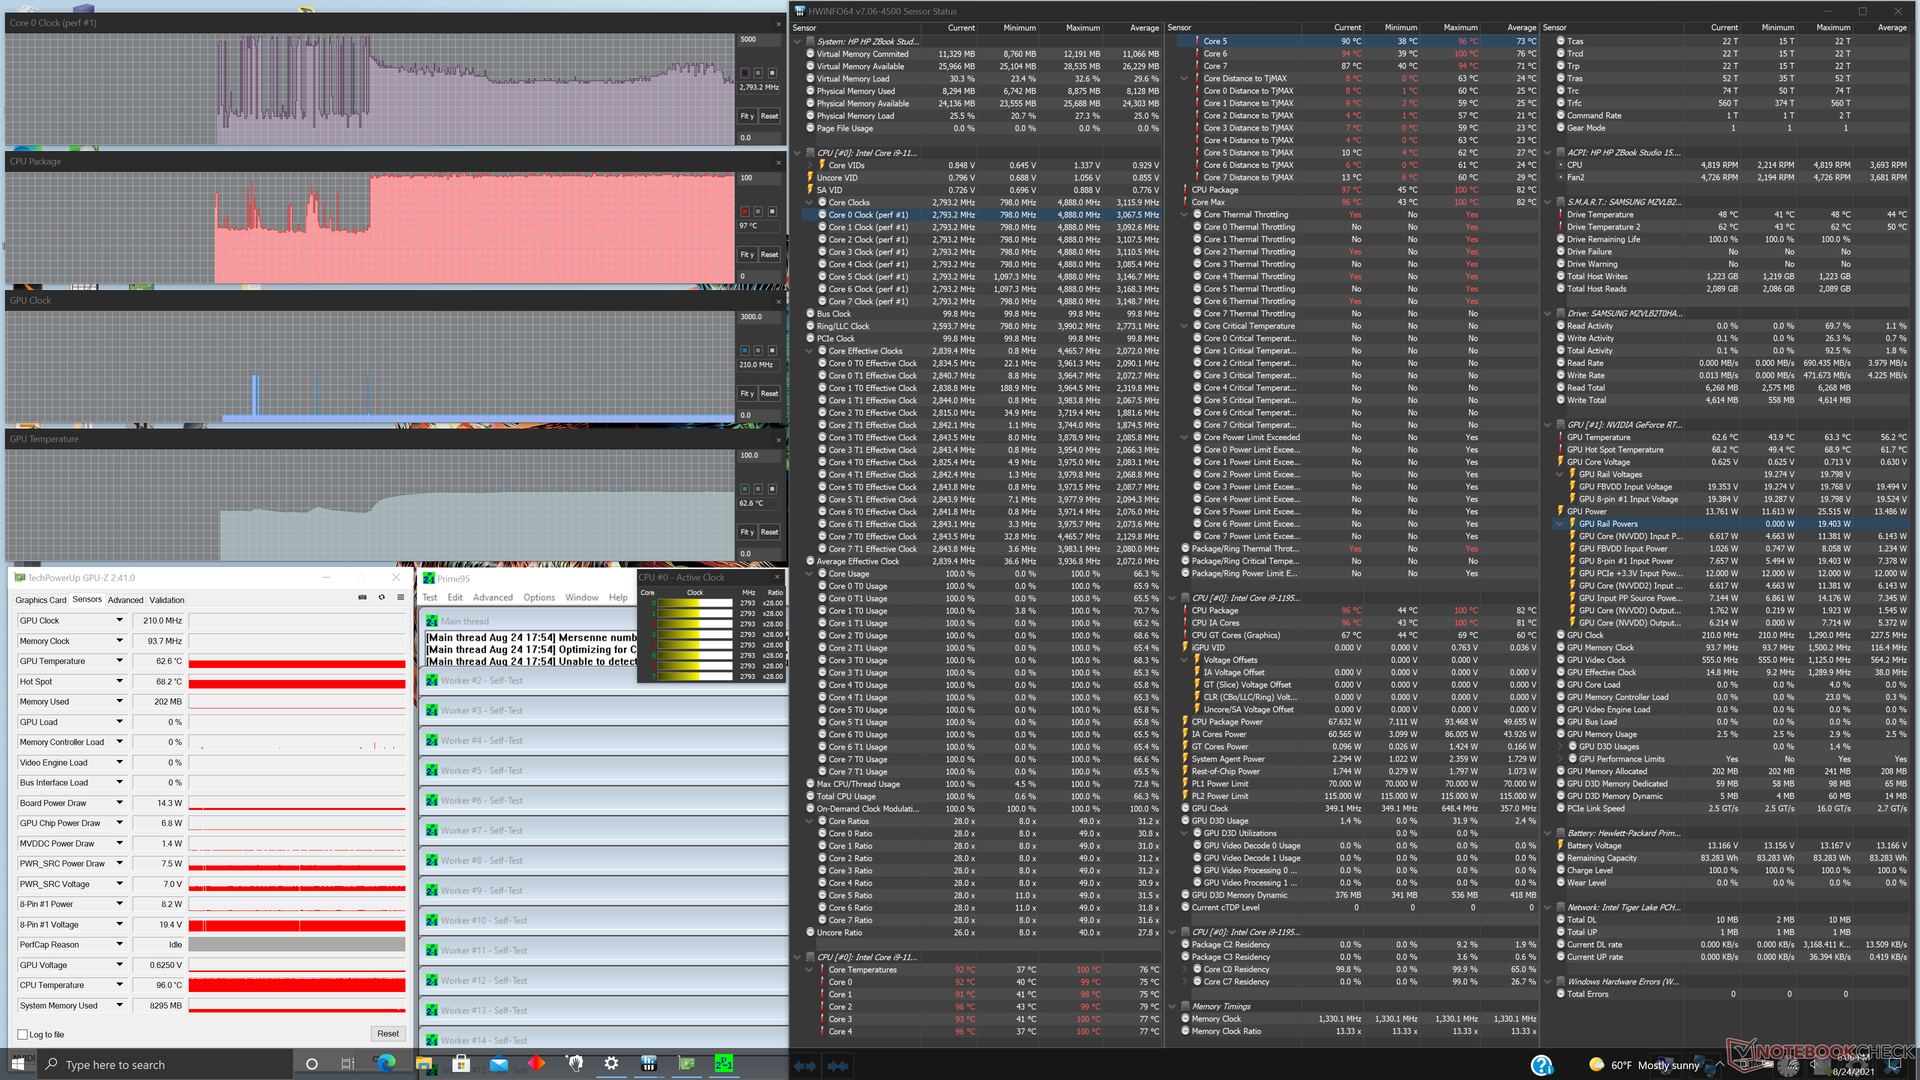
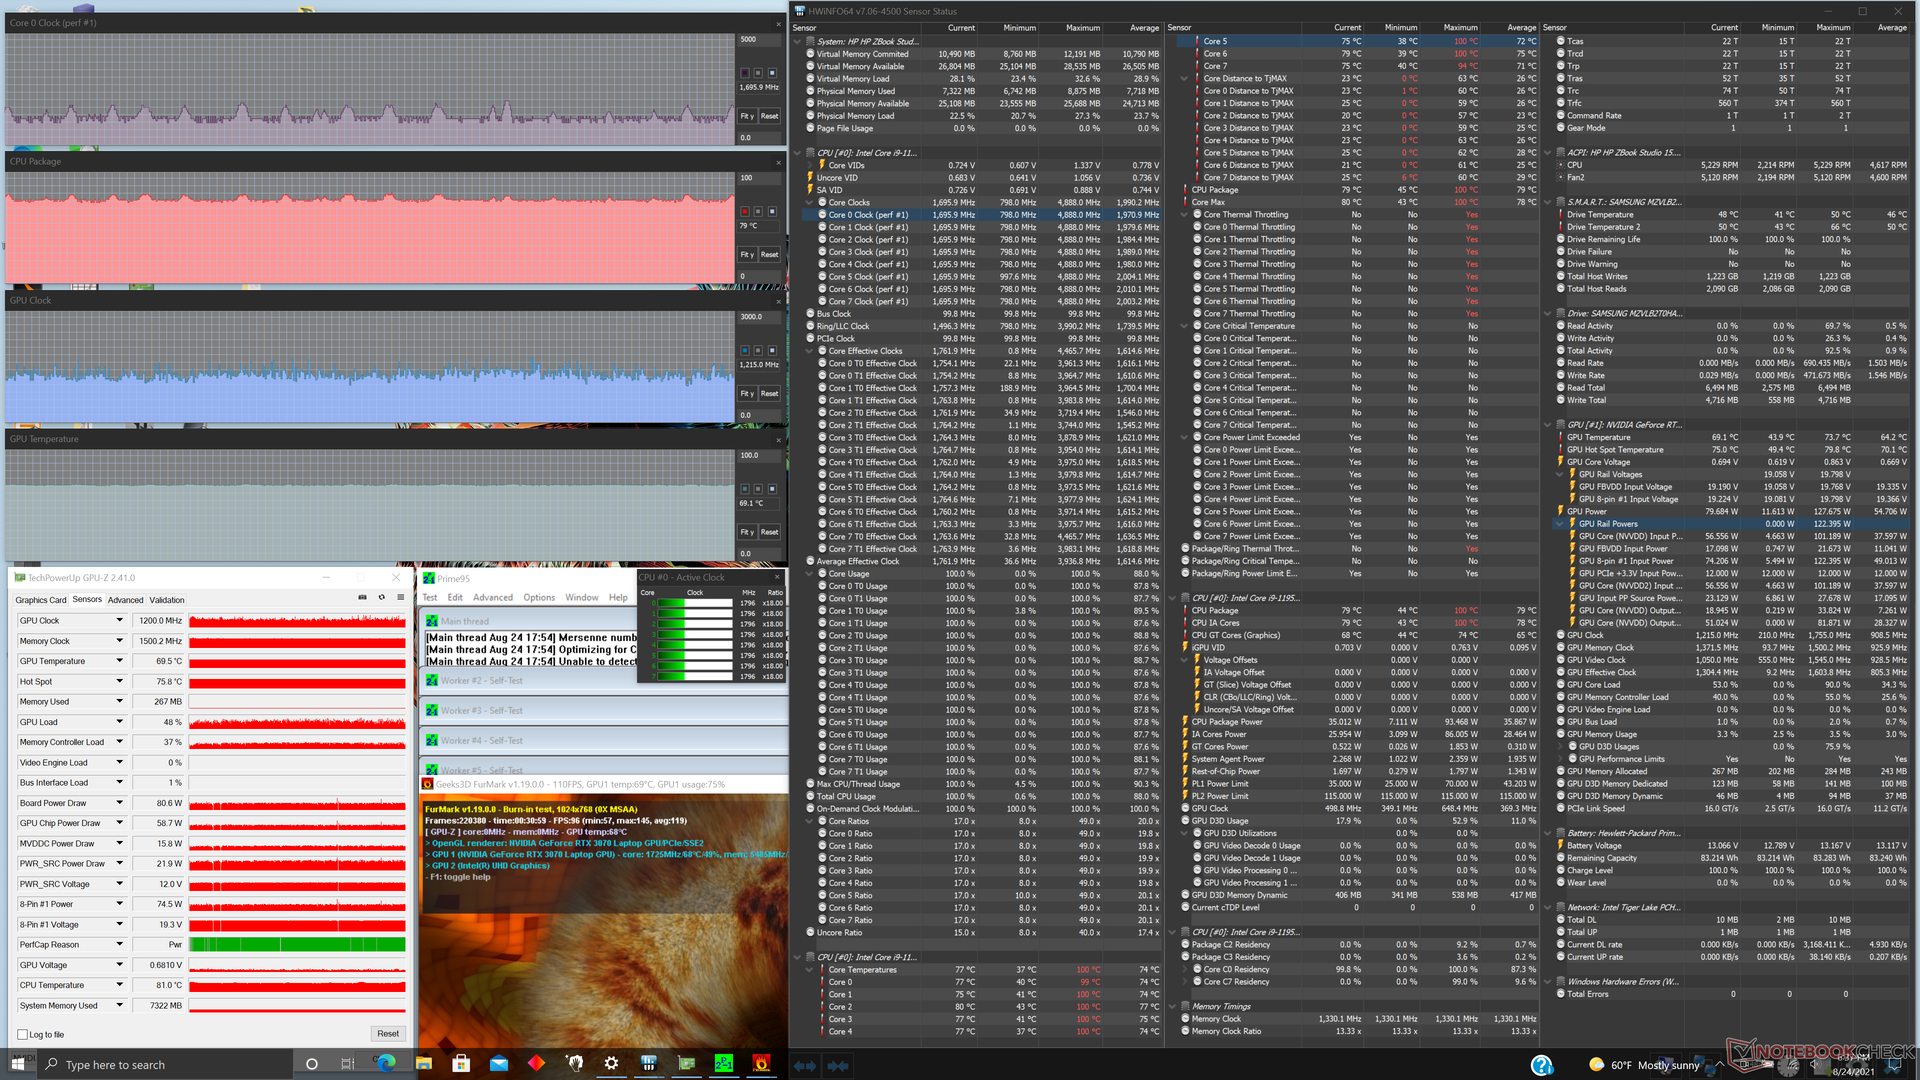
| CPU Clock (GHz) | GPU Clock (MHz) | Average CPU Temperature (°C) | Average GPU Temperature (°C) | |
| System Idle | -- | -- | 46 | 44 |
| Prime95 Stress | 2.8 - 3.3 | -- | 98 | 63 |
| Prime95 + FurMark Stress | 1.0 - 1.8 | 990 - 1695 | 73 - 81 | 69 |
| Witcher 3 Stress | ~3.8 | 1275 | 77 | 70 |
Speakers
The integrated quad speakers (2x tweeters + 2x woofers) provide excellent sound with good balance and decent bass reproduction. The quality could easily pass on a gaming or multimedia laptop like an HP Omen or MSI GT series model.


HP ZBook Studio 15 G8 audio analysis
(+) | speakers can play relatively loud (85.1 dB)
Bass 100 - 315 Hz
(±) | reduced bass - on average 6% lower than median
(±) | linearity of bass is average (8.2% delta to prev. frequency)
Mids 400 - 2000 Hz
(+) | balanced mids - only 3.8% away from median
(+) | mids are linear (3.9% delta to prev. frequency)
Highs 2 - 16 kHz
(+) | balanced highs - only 3.4% away from median
(+) | highs are linear (6.5% delta to prev. frequency)
Overall 100 - 16.000 Hz
(+) | overall sound is linear (8% difference to median)
Compared to same class
» 1% of all tested devices in this class were better, 1% similar, 98% worse
» The best had a delta of 7%, average was 18%, worst was 35%
Compared to all devices tested
» 1% of all tested devices were better, 0% similar, 99% worse
» The best had a delta of 4%, average was 25%, worst was 134%
Apple MacBook 12 (Early 2016) 1.1 GHz audio analysis
(+) | speakers can play relatively loud (83.6 dB)
Bass 100 - 315 Hz
(±) | reduced bass - on average 11.3% lower than median
(±) | linearity of bass is average (14.2% delta to prev. frequency)
Mids 400 - 2000 Hz
(+) | balanced mids - only 2.4% away from median
(+) | mids are linear (5.5% delta to prev. frequency)
Highs 2 - 16 kHz
(+) | balanced highs - only 2% away from median
(+) | highs are linear (4.5% delta to prev. frequency)
Overall 100 - 16.000 Hz
(+) | overall sound is linear (10.2% difference to median)
Compared to same class
» 5% of all tested devices in this class were better, 2% similar, 93% worse
» The best had a delta of 5%, average was 19%, worst was 53%
Compared to all devices tested
» 3% of all tested devices were better, 1% similar, 96% worse
» The best had a delta of 4%, average was 25%, worst was 134%
Energy Management
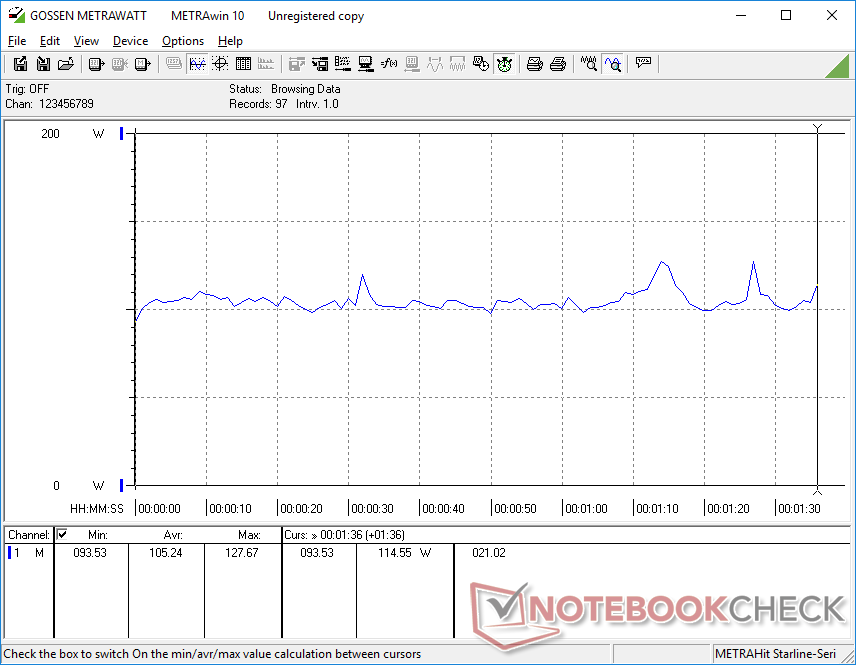
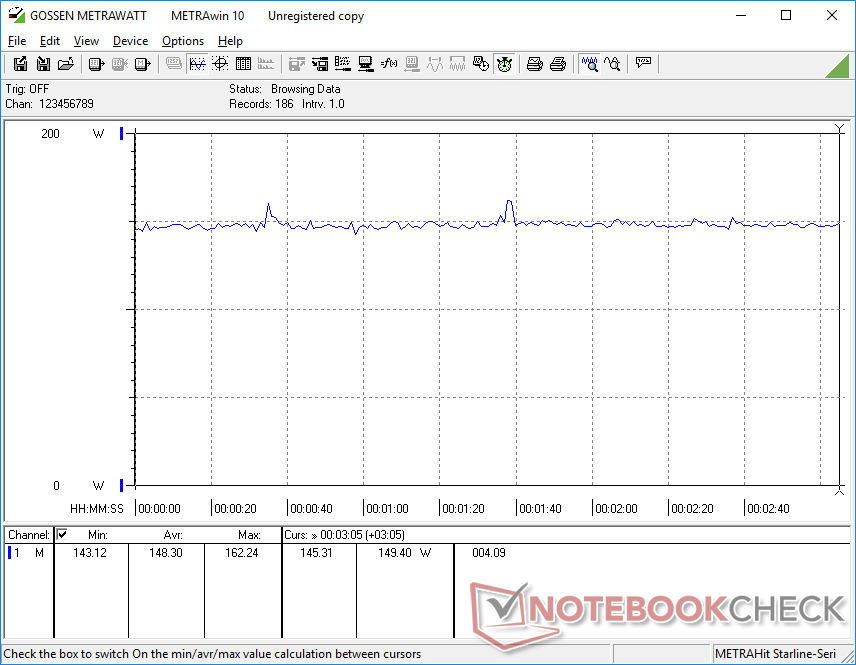
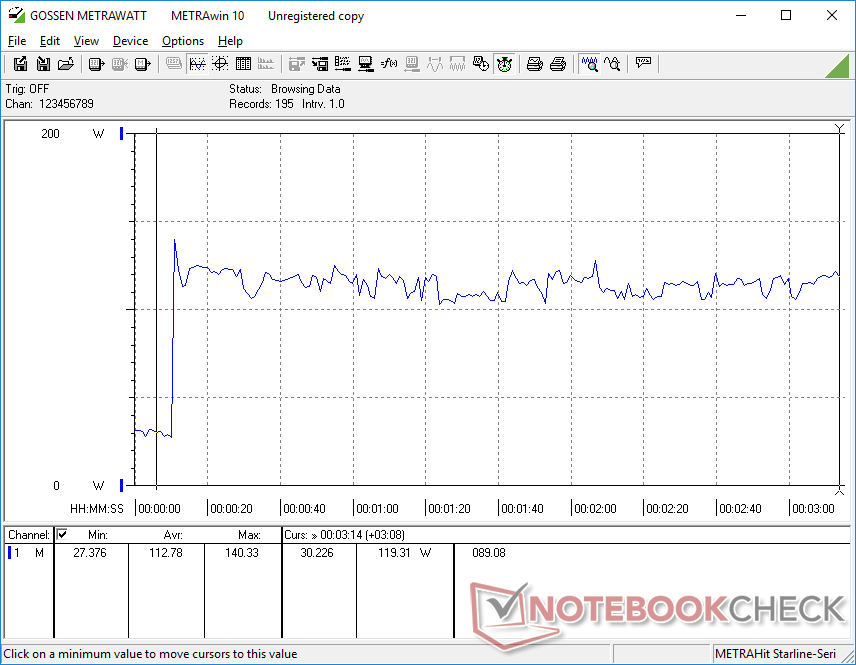
Power Consumption
Our configuration draws more power than most other 15.6-inch workstations even when idling on desktop due to its OLED panel. We've proven that OLED can be significantly more power-hungry than typical IPS especially when displaying bright white colors. Since most online content have white backgrounds, our OLED unit can consume up to 2x or 3x more power just by idling on the maximum brightness setting.
Running higher loads like games will consume about 23 percent more power than on the Quadro RTX 3000 Max-Q-powered ZBook G7. Performance-per-watt is still superior on our newer G8 model since raw CPU performance and graphics performance are about 25 percent and 50 percent higher gen-to-gen, respectively.
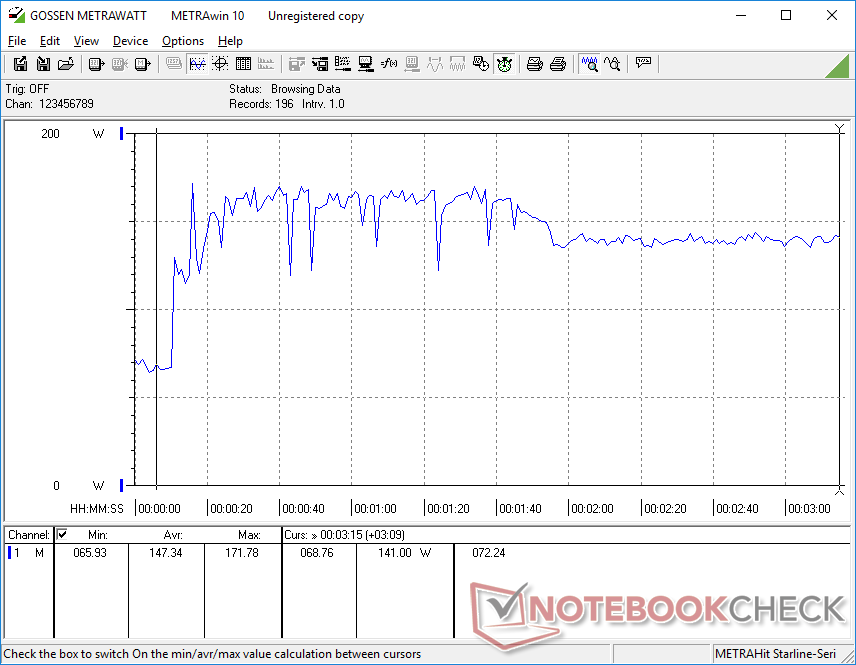
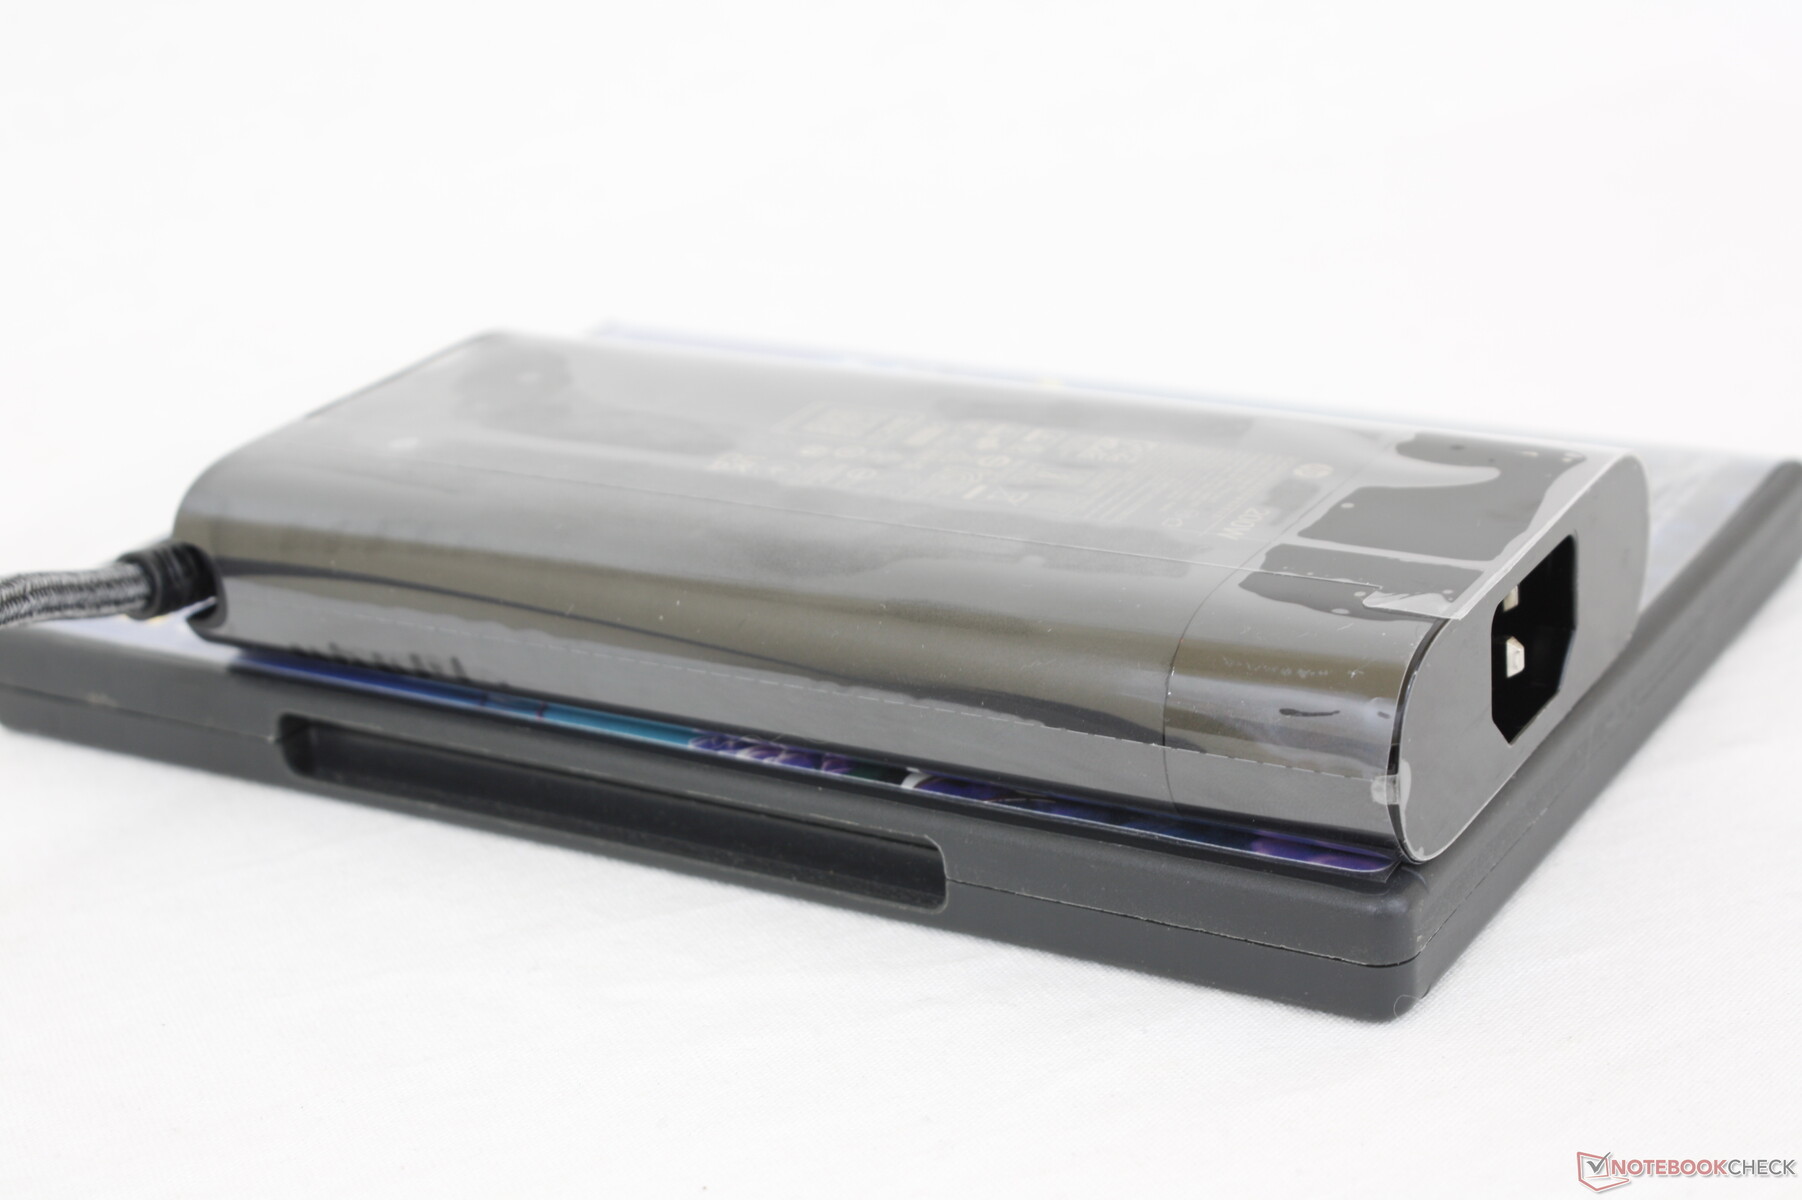
We're able to record a maximum draw of 172 W from the medium-sized (~15.3 x 7.5 x 2.4 cm) 200 W AC adapter. The system can run high loads and still recharge at a decent rate simultaneously unlike on earlier version of the Dell Precision 5750. , then The ZBook G8 will ship with a smaller 150 W AC adapter If configured with only Iris Xe graphics.
| Off / Standby | |
| Idle | |
| Load |
|
| HP ZBook Studio 15 G8 i9-11950H, GeForce RTX 3070 Laptop GPU, Samsung PM981a MZVLB2T0HALB, OLED, 3840x2160, 15.60 | HP ZBook Firefly 15 G8 2C9R7EA i7-1165G7, T500 Laptop GPU, Toshiba XG6 KXG60ZNV1T02, IPS, 1920x1080, 15.60 | HP ZBook Studio G7 i9-10885H, Quadro RTX 3000 Max-Q, Micron 2300 1TB MTFDHBA1T0TDV, IPS, 3840x2160, 15.60 | Dell Precision 7550 W-10885M, Quadro RTX 5000 Max-Q, SK Hynix PC601A NVMe 1TB, IPS, 3840x2160, 15.60 | Lenovo ThinkPad P15s Gen2-20W6000GGE i7-1165G7, T500 Laptop GPU, WDC PC SN720 SDAQNTW-1T00, IPS LED, 3840x2160, 15.60 | Asus ProArt StudioBook Pro 15 W500G5T i7-9750H, Quadro RTX 5000 Max-Q, Samsung SSD PM981 MZVLB1T0HALR, IPS, 3840x2160, 15.60 | |
|---|---|---|---|---|---|---|
| Power Consumption | 63% | 19% | 2% | 54% | 6% | |
| Idle Minimum * | 11 | 3.3 70% | 5.5 50% | 8.2 25% | 5.8 47% | 11.6 -5% |
| Idle Average * | 18.8 | 5.6 70% | 13.7 27% | 16.8 11% | 13.3 29% | 19 -1% |
| Idle Maximum * | 31.7 | 8.7 73% | 16.6 48% | 24.4 23% | 15.6 51% | 20.6 35% |
| Load Average * | 105.2 | 64.4 39% | 118.4 -13% | 131 -25% | 43.2 59% | 102 3% |
| Witcher 3 ultra * | 148 | 53 64% | 120 19% | 156.6 -6% | 37.1 75% | |
| Load Maximum * | 171.8 | 69 60% | 203.3 -18% | 201.8 -17% | 67.3 61% | 178 -4% |
* ... smaller is better
Power Consumption Witcher 3 / Stresstest
Battery Life — Shorter Because of OLED
Runtimes appear to be shorter than on last year's ZBook Studio G7 by several hours. We were only able to get just over 6 hours of real-world WLAN use compared to almost 8 hours on the G7 even when set to the integrated GPU. The more power-hungry OLED panel on our G8 is a likely culprit for the truncated battery life.
Charging is thankfully fast at roughly 90 minutes from empty to full capacity. Users can also recharge the system via USB-C.
| HP ZBook Studio 15 G8 i9-11950H, GeForce RTX 3070 Laptop GPU, 83 Wh | HP ZBook Firefly 15 G8 2C9R7EA i7-1165G7, T500 Laptop GPU, 56 Wh | HP ZBook Studio G7 i9-10885H, Quadro RTX 3000 Max-Q, 83 Wh | Dell Precision 7550 W-10885M, Quadro RTX 5000 Max-Q, 95 Wh | Lenovo ThinkPad P15s Gen2-20W6000GGE i7-1165G7, T500 Laptop GPU, 57 Wh | Asus ProArt StudioBook Pro 15 W500G5T i7-9750H, Quadro RTX 5000 Max-Q, 76 Wh | |
|---|---|---|---|---|---|---|
| Battery Runtime | 51% | 9% | -4% | 17% | -24% | |
| Reader / Idle | 774 | 666 -14% | ||||
| WiFi v1.3 | 369 | 631 71% | 468 27% | 534 45% | 464 26% | 281 -24% |
| Load | 106 | 139 31% | 96 -9% | 62 -42% | 115 8% |
Pros
Cons
Verdict — Good CPU Gains, Uninspiring GPU Gains
HP has three ZBook G8 models to choose from at the moment: the ZBook Studio G8, ZBook Fury G8, and the ZBook Firefly G8. The thick Fury G8 fulfils the traditional workstation space while the thin-and-light Firefly G8 uses ULV software for higher portability. Our ZBook Studio G8 is the middle-ground solution for users who want Core H-series performance without the bulkiness of the Firefly.
This middle-ground solution means giving up some features found on the Fury. The quick-release bottom panel, numpad, mouse buttons, TrackPoint, Xeon CPUs, upgradeable ECC RAM, webcam shutter, and more are all missing on the ZBook Studio G8. Users may want to consider the thicker Fury model if such features are desirable.
The reliable ZBook Studio G8 runs great and looks even better despite its one-year-old design. However, the GeForce RTX 3070 is underwhelming while the OLED panel carries a few notable drawbacks when compared to cheaper IPS options.
When compared to more immediate competitors like the MSI WS66 or Razer Blade 15 Studio, the MSI system offers Xeon options while both can hold up to two M.2 SSDs instead of just one. CPU temperatures when running high loads could also be much cooler on the HP. Even the ZBook Studio G8 has the better build quality than the MSI and a more comfortable keyboard than either alternative.
Price and availability
The ZBook Studio G8 is not yet widely available across third-party retail channels as of this writing. Interested users should instead order directly from HP where configurable options are plentiful. Our specific configuration retails for around $4200 USD.
HP ZBook Studio 15 G8
-
08/31/2022 v7
Allen Ngo


Pricecompare
