 Deutsch
 English
 Español
 Français
 Italiano
 Nederlands
 Polski
 Português
 Русский
 Türkçe
 Svenska
 Chinese
 Magyar
HP ZBook 15u G6 Laptop Review: High-contrast 4K screen shortens battery life

HP's workstation ZBook 15u G5 presented itself with a high-quality case and good input devices, which have remained the same in the sixth generation. As HP has not made any changes to the exterior, users will again have to make do without an SD card reader and the average maintenance options.
The test unit we are reviewing today is equipped with an Intel Core i7-8565U and 16 GB of RAM. This is complemented by an AMD Radeon Pro WX 3200 and a 512-GB SSD. There are various configuration options to choose from for this model. Our version is available for around $2200.
Apart from the predecessor we will be comparing the ZBook 15u G6 with some other devices, which are listed in the table below. You can also easily add any other device from our database to the comparison at the bottom of each table.
#compare_competitor
Rating | Date | Model | Weight | Height | Size | Resolution | Best Price |
|---|---|---|---|---|---|---|---|
| 80.8 % | 10/2019 | HP ZBook 15u G6 6TP54EA i7-8565U, Radeon Pro WX 3200 | 1.6 kg | 19 mm | 15.60" | 3840x2160 | |
| 87.8 % | 08/2019 | Lenovo ThinkPad P1 2019-20QT000RGE i7-9850H, Quadro T1000 (Laptop) | 1.7 kg | 18.4 mm | 15.60" | 1920x1080 | |
| 85.6 % | 04/2019 | Fujitsu Celsius H780 i7-8850H, Quadro P2000 | 2.8 kg | 31.9 mm | 15.60" | 1920x1080 | |
| 89.2 % | 03/2019 | Dell Latitude 5420 Rugged-P85G i7-8650U, Radeon RX 540 | 2.8 kg | 32.9 mm | 14.00" | 1920x1080 | |
| 80.2 % | 06/2018 | HP ZBook 15u G5 2ZC05EA i5-8550U, Radeon Pro WX 3100 | 1.9 kg | 19 mm | 15.60" | 1920x1080 |
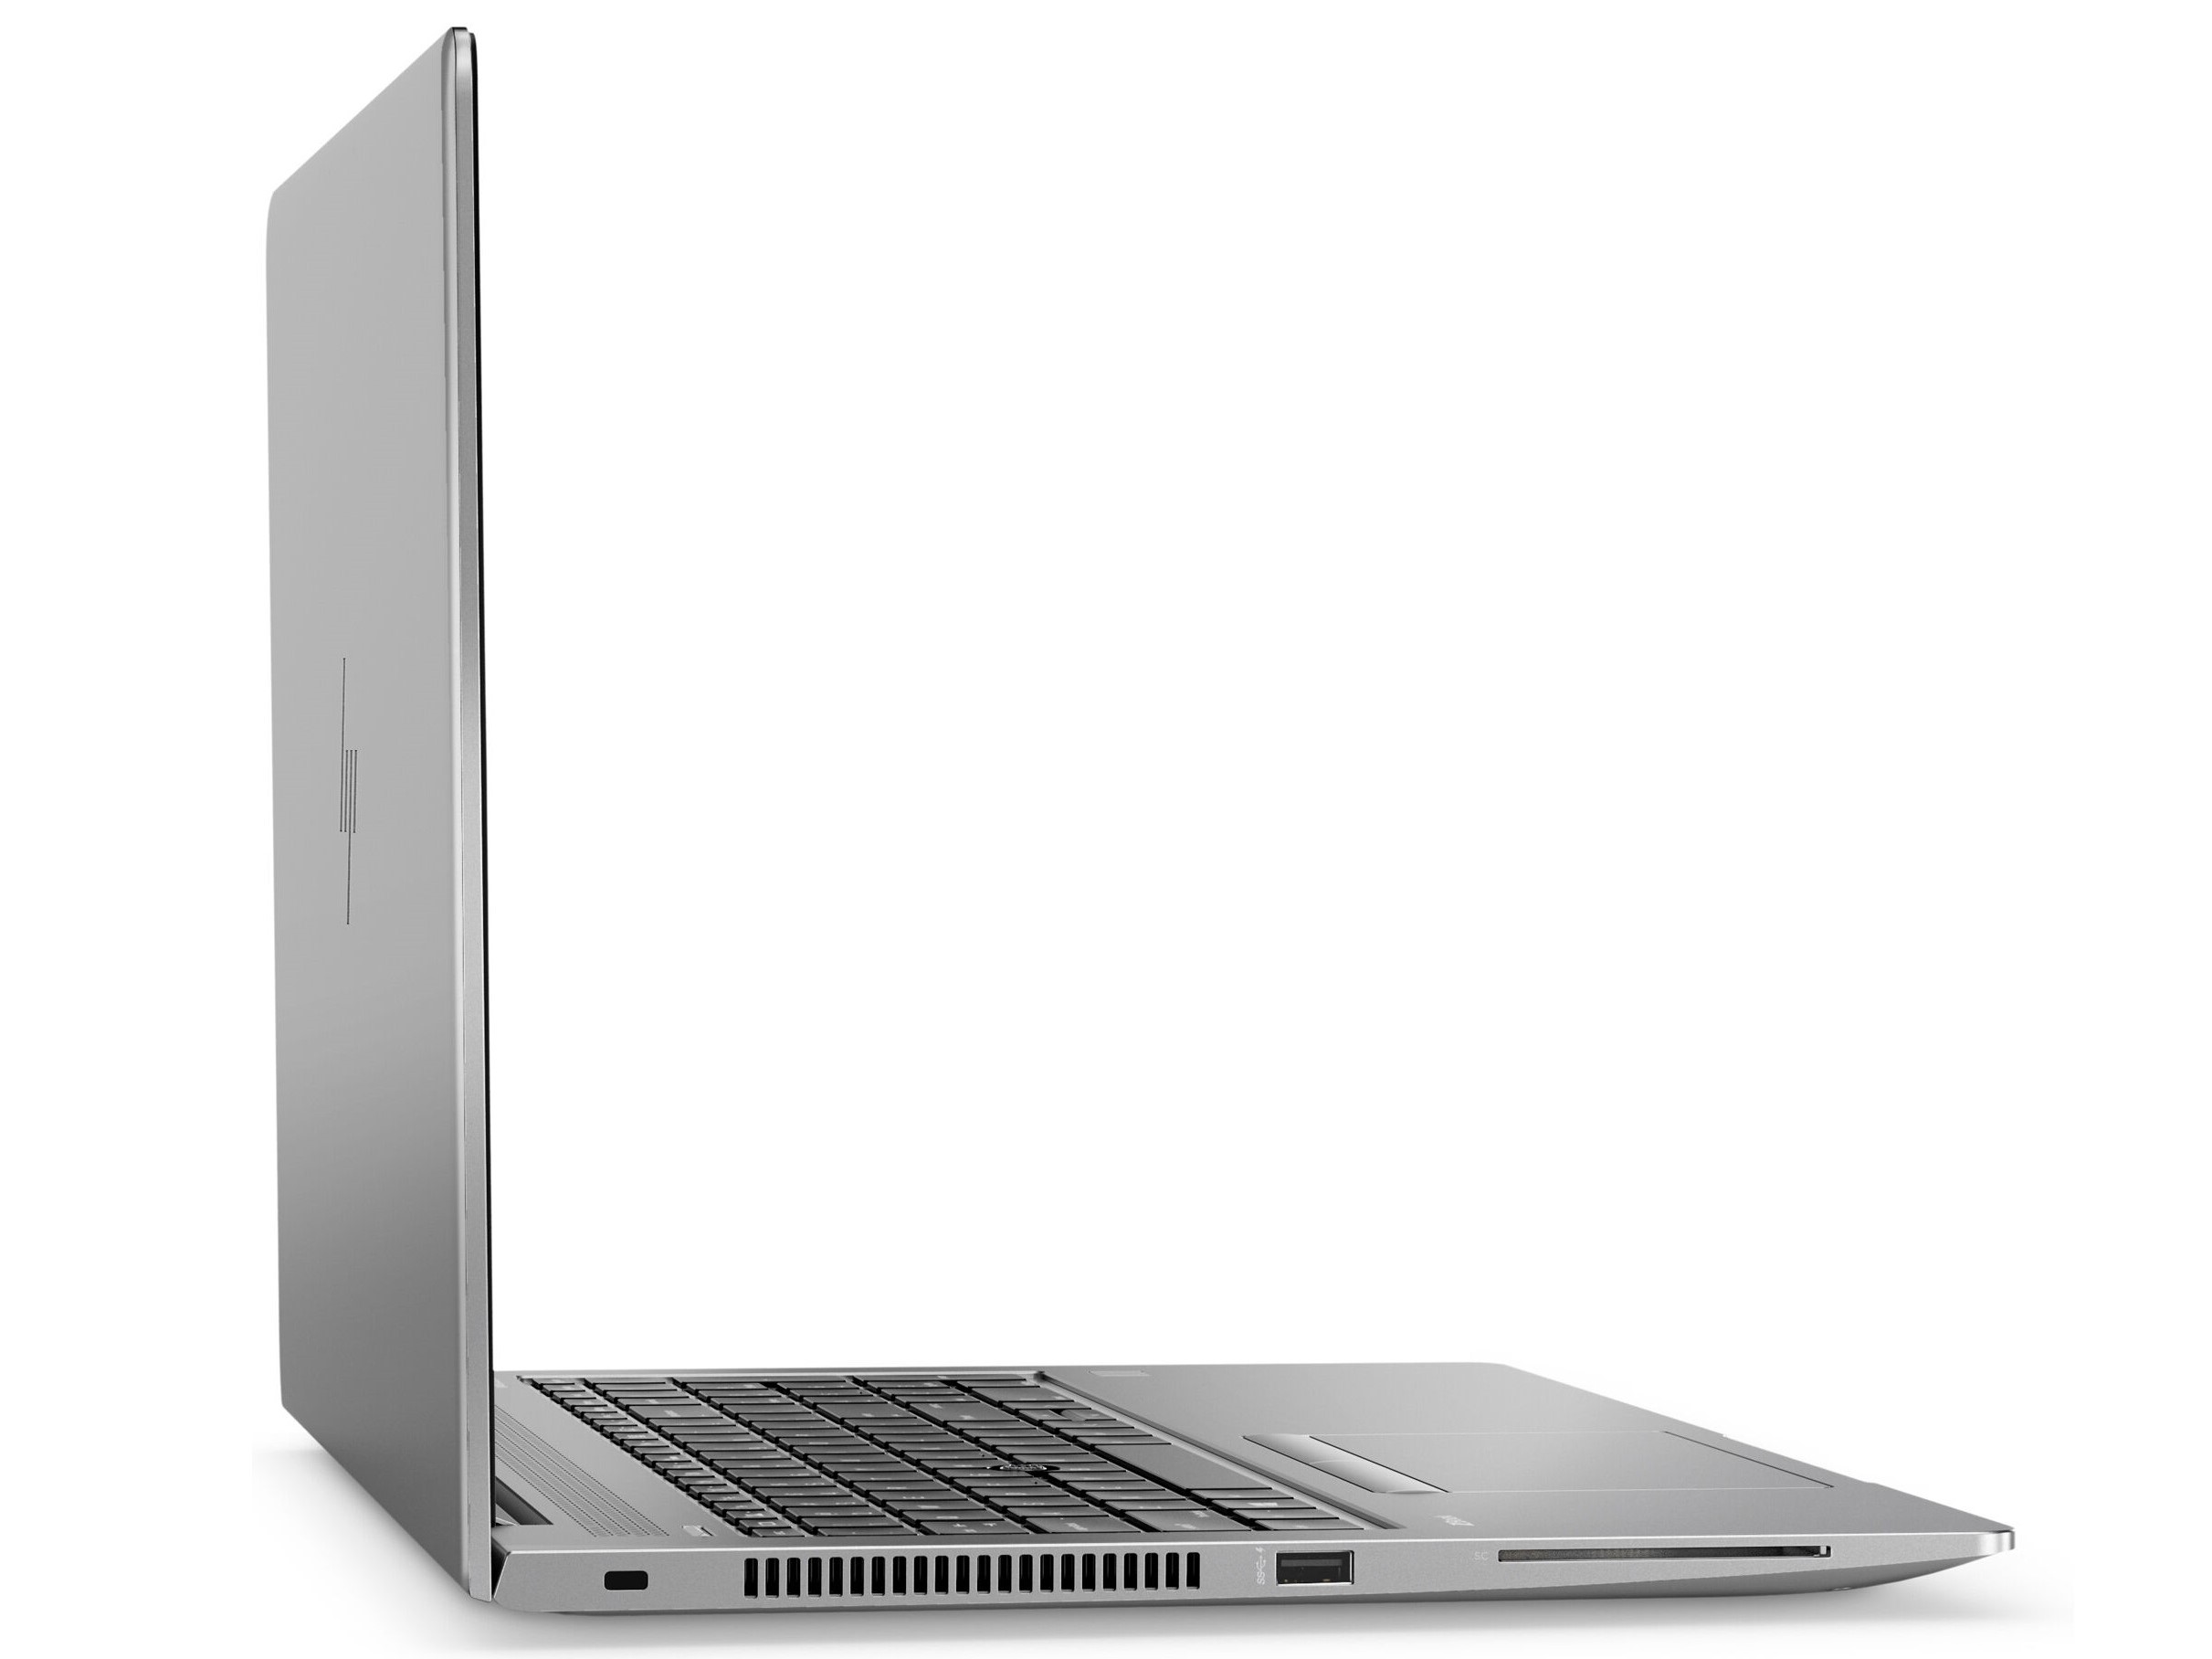
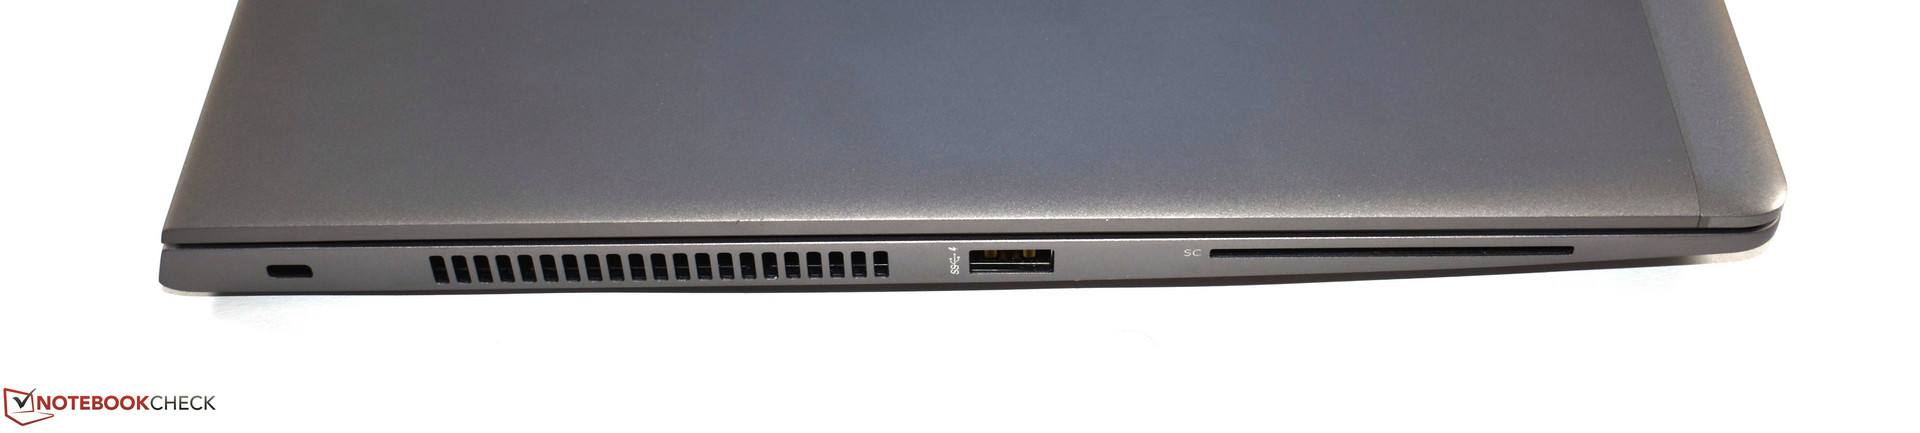
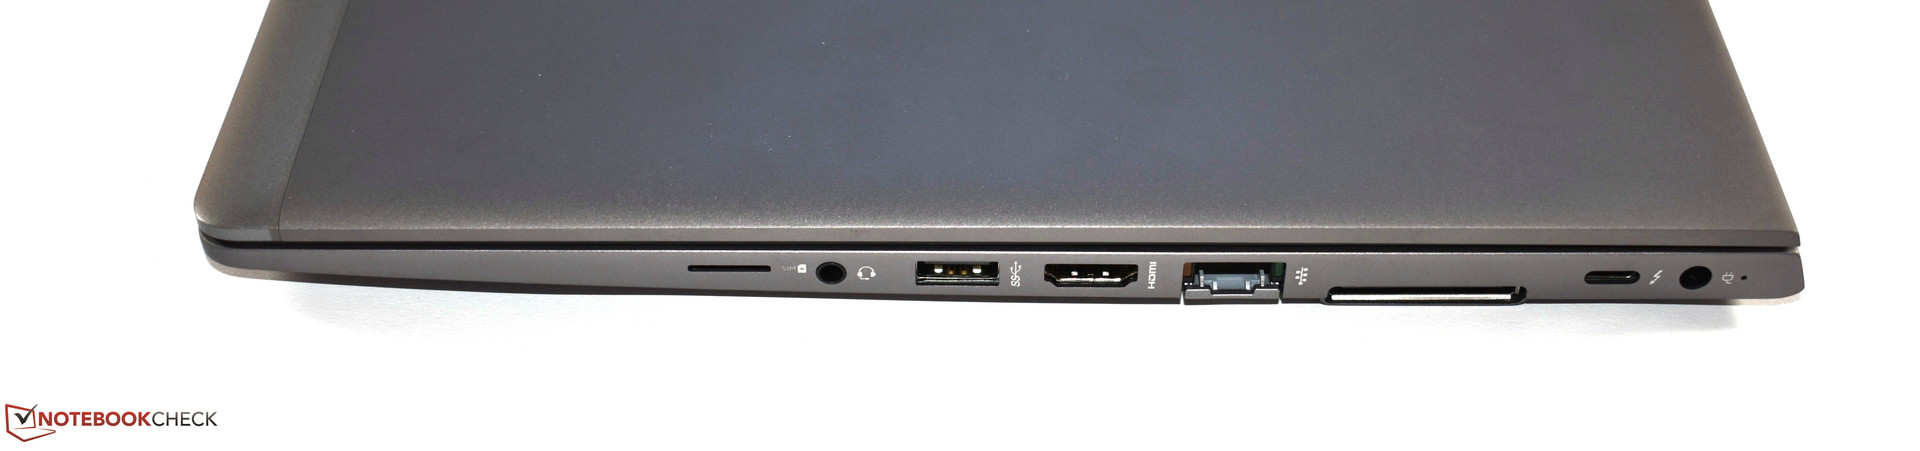
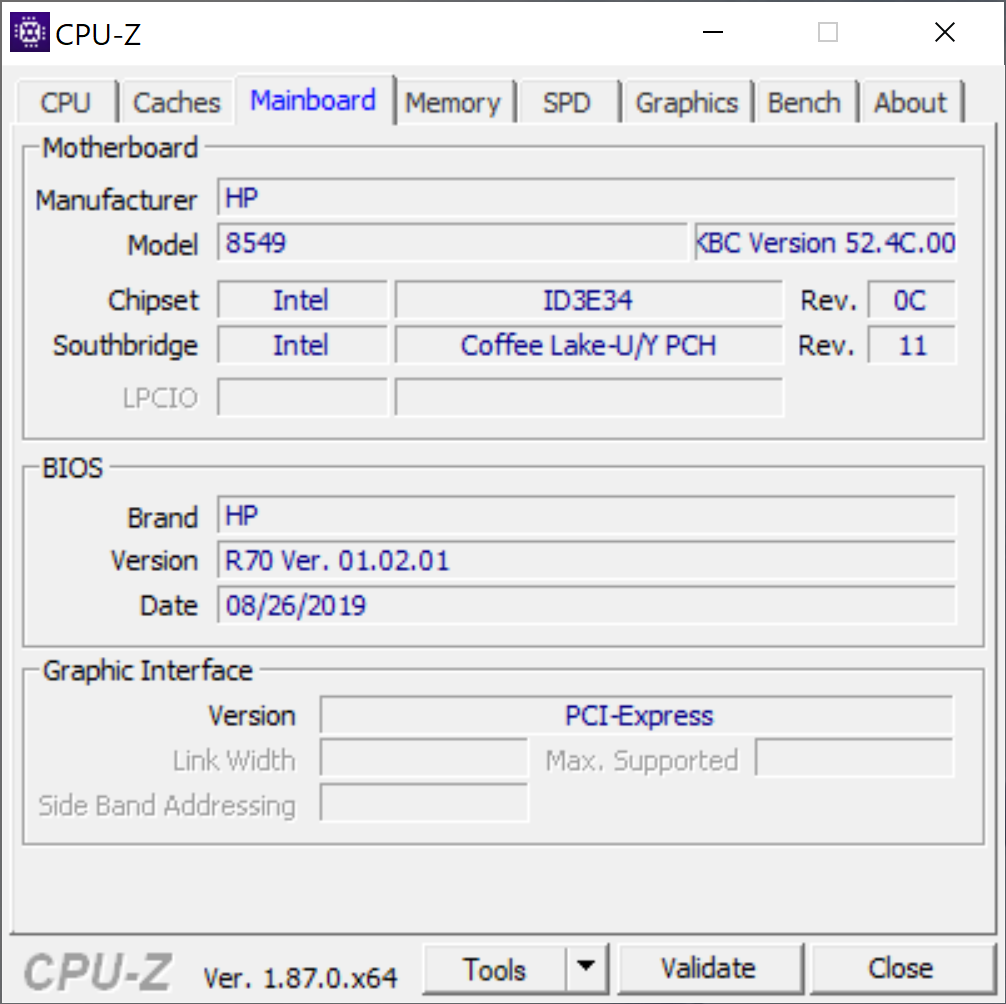
Case & Connectivity - HP workstation with Thunderbolt 3
As HP has not made any changes to the case and connectivity of the ZBook 15u, which is based on the EliteBook 850 G5, please refer to the corresponding sections in our review of the HP EliteBook 850 G5 from 2018 for more information on these aspects.
Input Devices - very good touchpad
The input devices have remained the same as well. Again, please refer to our review of the HP EliteBook 850 G5 for a detailed evaluation of the keyboard and touchpad.
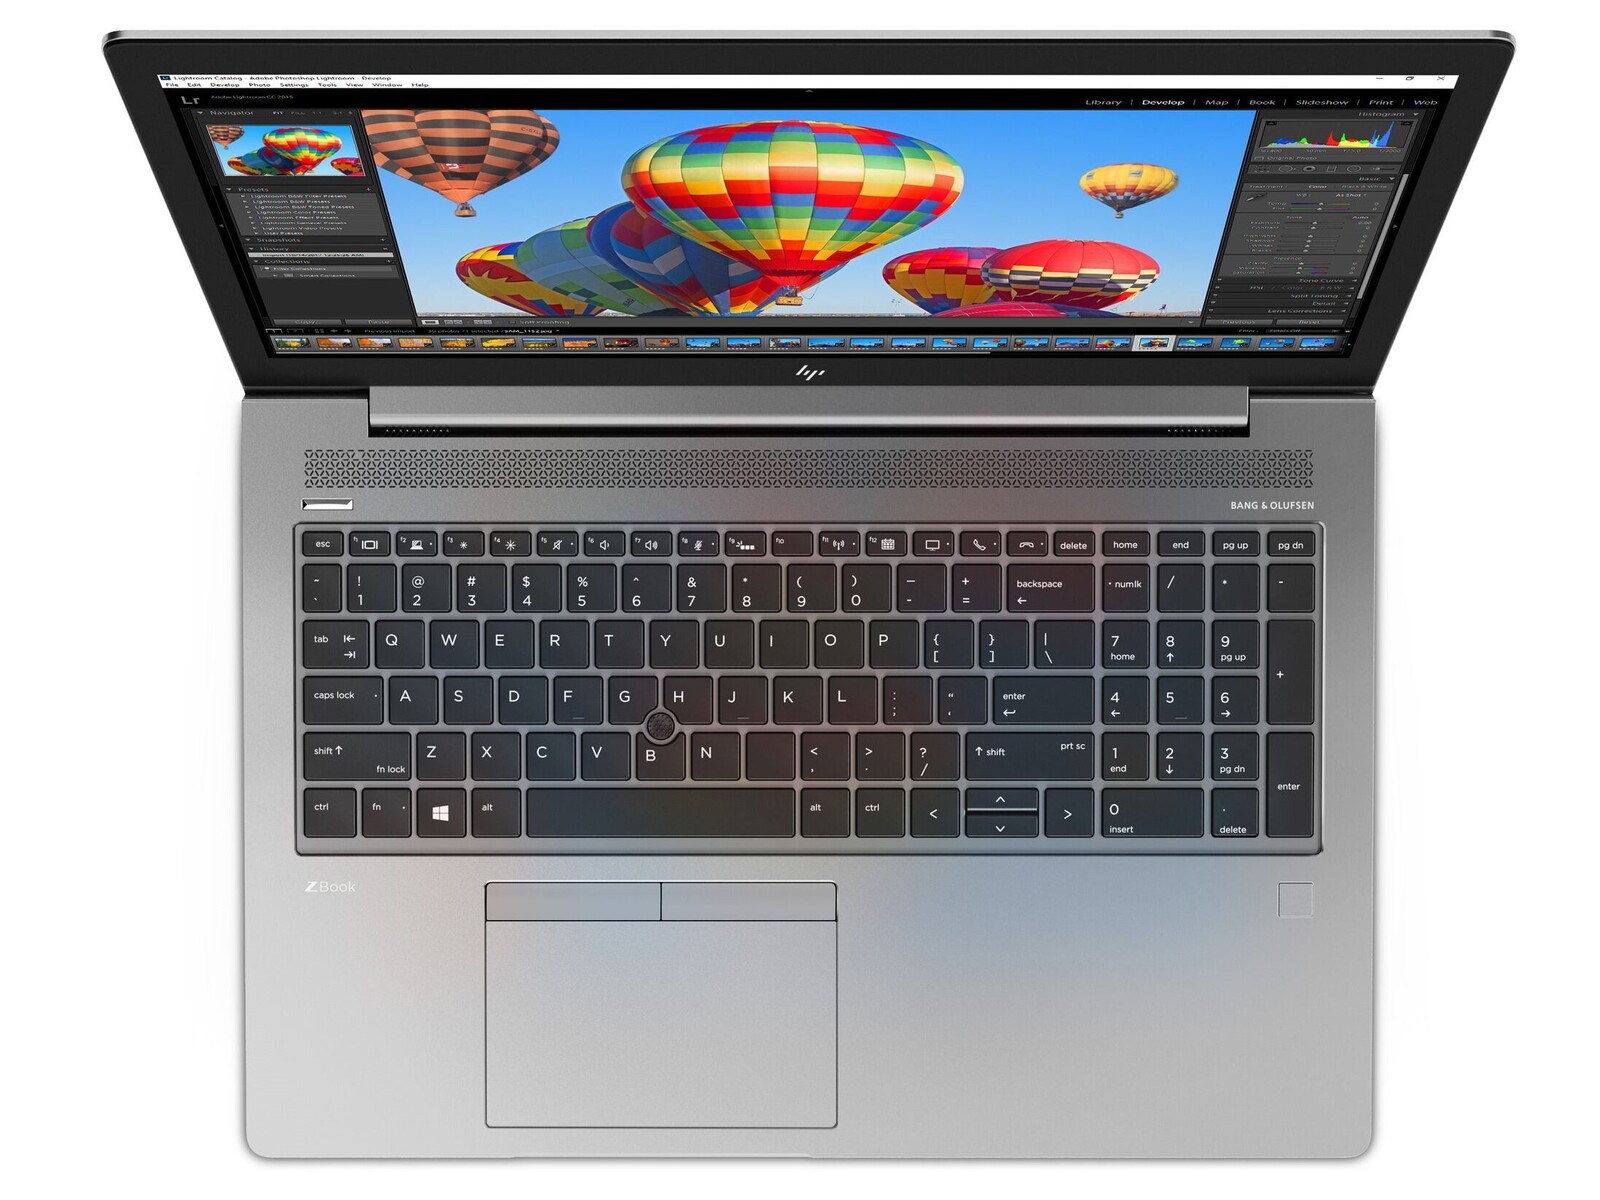
Display - HP ZBook 15u G6 with 4K display

The display in our test unit of the HP ZBook 15u G6 is a matte 15.6-inch IPS panel with a resolution of 3840x2160 pixels. The brightness is 400 cd/m² according to the spec sheet. Our measurements show an even higher average brightness of 434 cd/m². This makes this screen one of the brightest in our comparison field. As the device does not use PWM for brightness regulation, users with sensitive eyes should not encounter any issues while using the ZBook 15 G6.
According to the technical specifications, the HP ZBook 15u G6 is available with the following display options:
- IPS, 100% color space coverage (sRGB), 700 cd/m², HP SureView, 1920x1080
- IPS, 100% color space coverage (sRGB), 400 cd/m², ambient light sensor, 3840x2160
- IPS, 100% color space coverage (sRGB), 400 cd/m², ambient light sensor, 1920x1080
- IPS, 67% color space coverage (sRGB), 250 cd/m², ambient light sensor, 1920x1080
- IPS, 67% color space coverage (sRGB), 250 cd/m², Touchscreen, 1920x1080
| |||||||||||||||||||||||||
Brightness Distribution: 89 %
Center on Battery: 450 cd/m²
Contrast: 1804:1 (Black: 0.25 cd/m²)
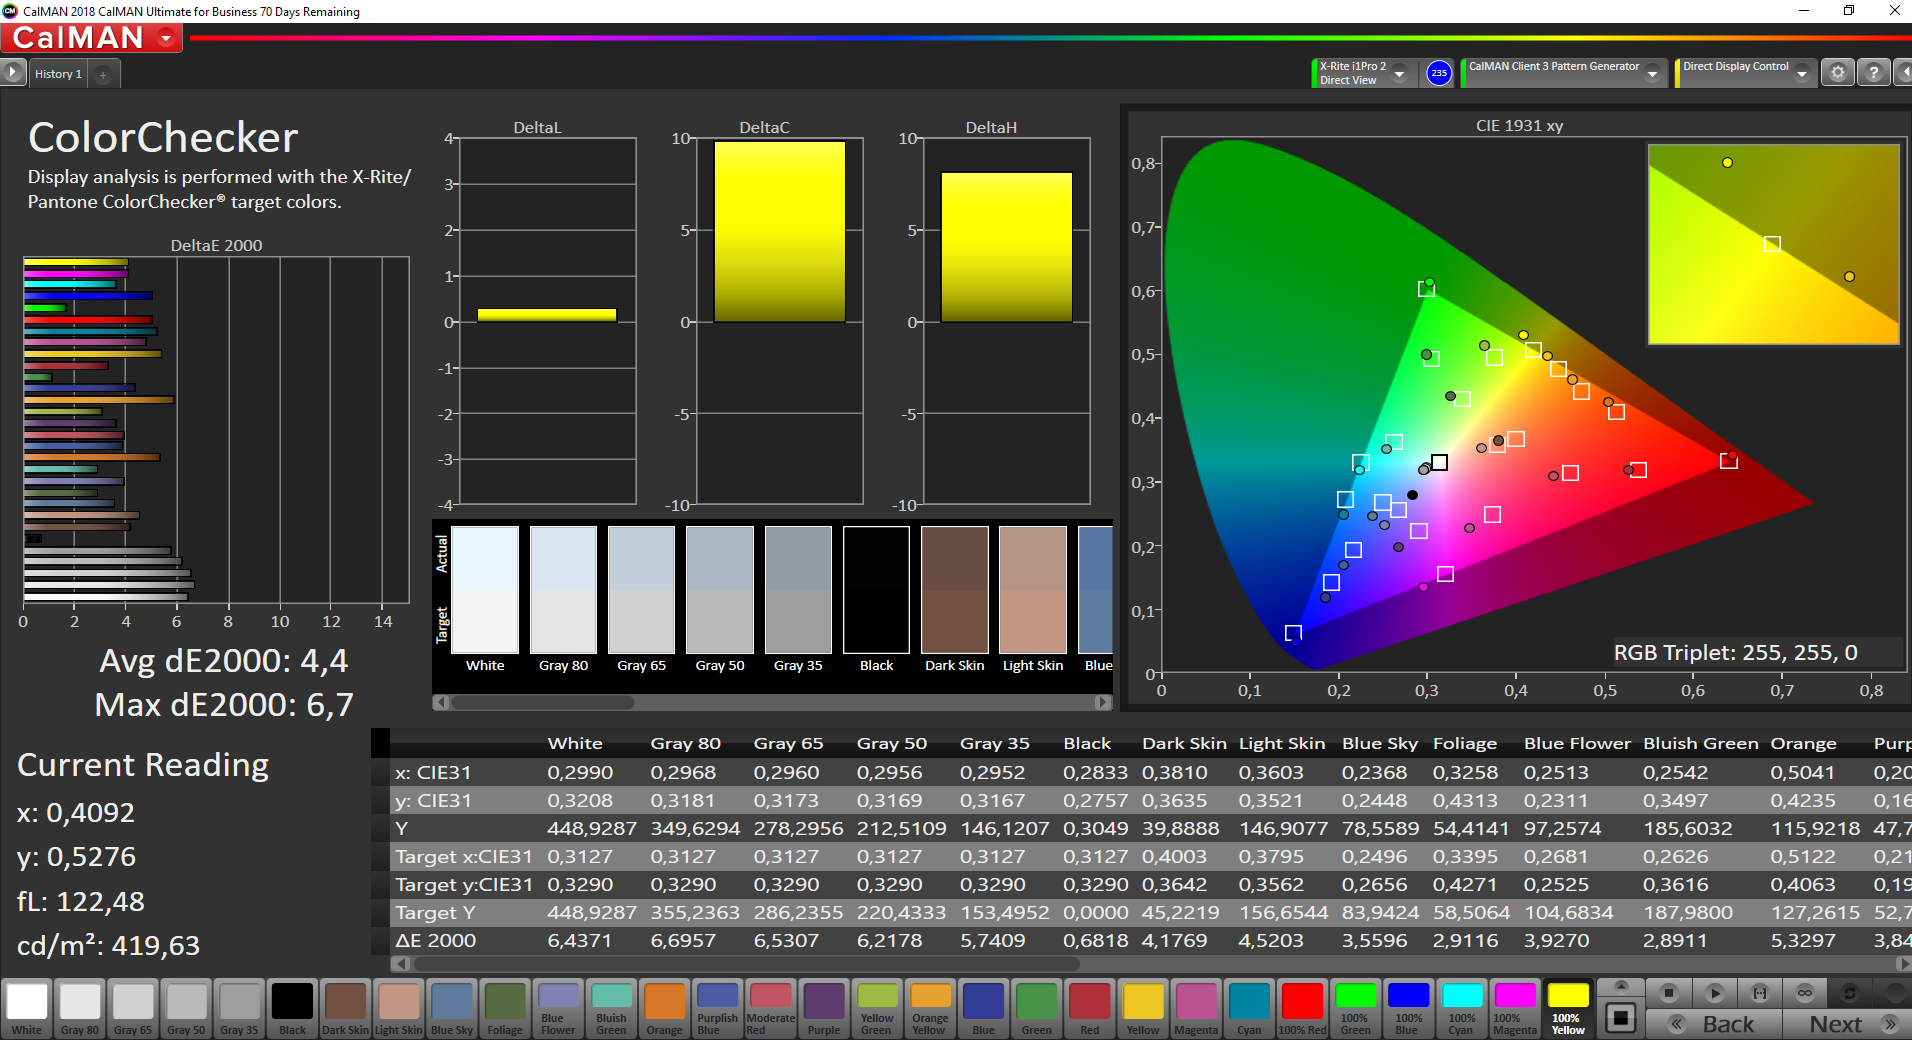
ΔE Color 4.4 | 0.5-29.43 Ø5, calibrated: 1.8
ΔE Greyscale 5 | 0.57-98 Ø5.3
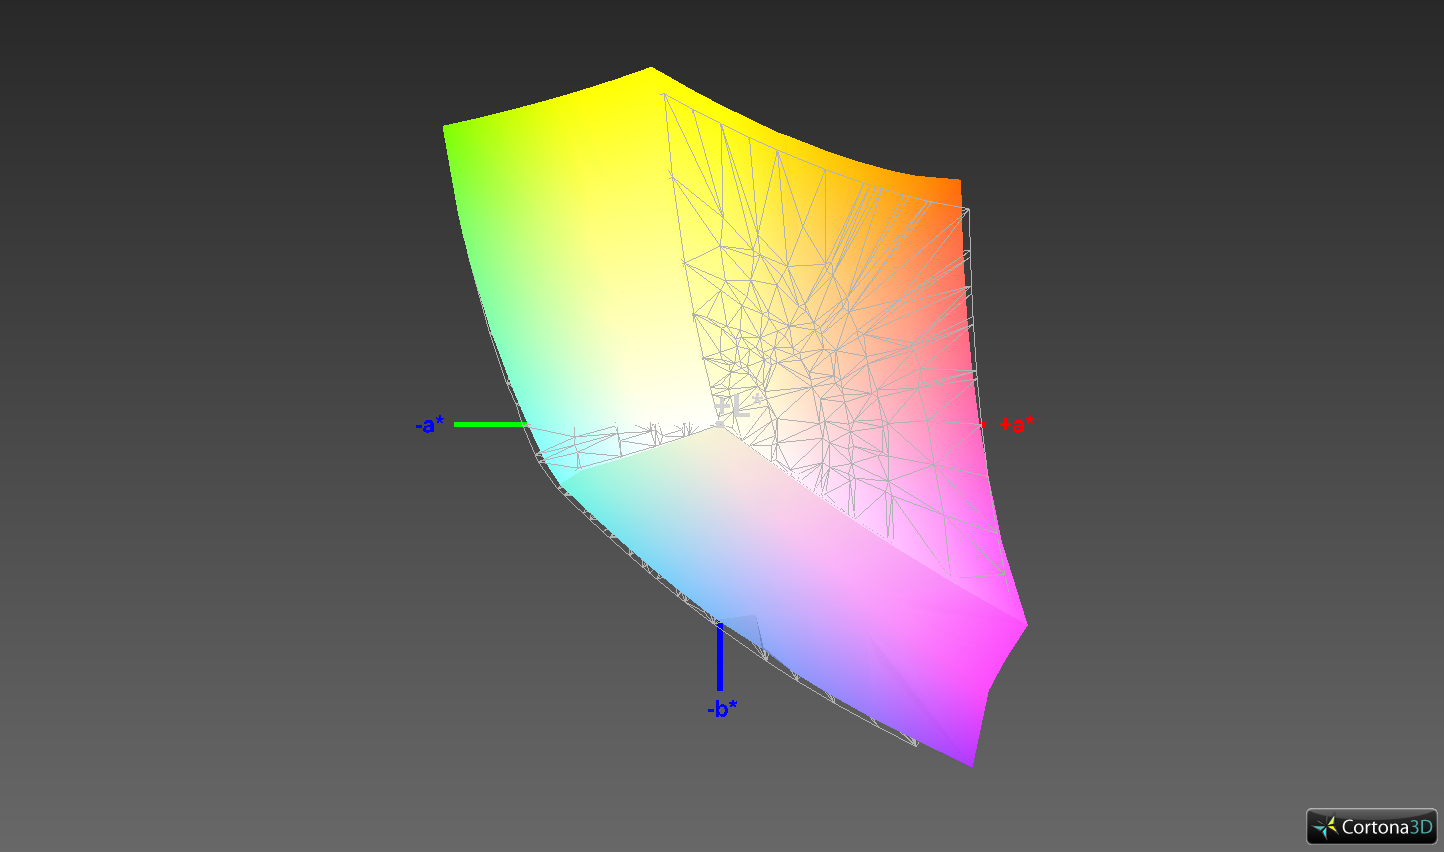
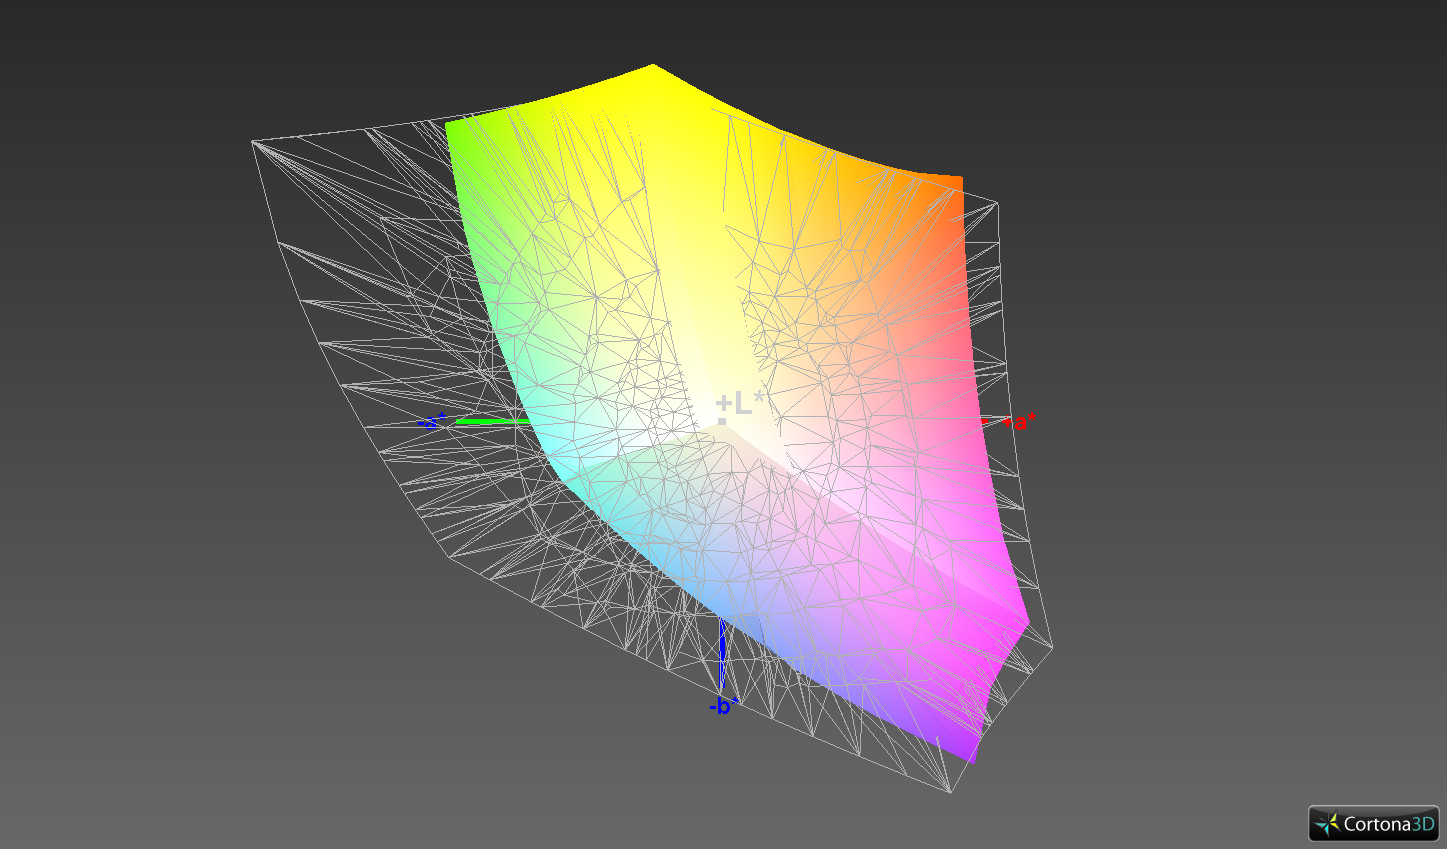
97% sRGB (Argyll 1.6.3 3D)
63% AdobeRGB 1998 (Argyll 1.6.3 3D)
69.7% AdobeRGB 1998 (Argyll 2.2.0 3D)
97.1% sRGB (Argyll 2.2.0 3D)
69.2% Display P3 (Argyll 2.2.0 3D)
Gamma: 2.31
| HP ZBook 15u G6 6TP54EA AU Optronics AUO30EB, , 3840x2160, 15.60 | HP ZBook 15u G5 2ZC05EA CMN15E7, , 1920x1080, 15.60 | Lenovo ThinkPad P1 2019-20QT000RGE N156HCE-GN1, , 1920x1080, 15.60 | Fujitsu Celsius H780 LP156WF6-SPP1, , 1920x1080, 15.60 | Dell Latitude 5420 Rugged-P85G AU Optronics AUO523D, , 1920x1080, 14.00 | |
|---|---|---|---|---|---|
| Display | -36% | -8% | -9% | -8% | |
| Display P3 Coverage | 69.2 | 43.05 -38% | 62.4 -10% | 66.3 -4% | 62.5 -10% |
| sRGB Coverage | 97.1 | 64.7 -33% | 91.5 -6% | 85.9 -12% | 92.4 -5% |
| AdobeRGB 1998 Coverage | 69.7 | 44.5 -36% | 63.4 -9% | 62.8 -10% | 64.2 -8% |
| Response Times | 22% | 52% | 27% | -7% | |
| Response Time Grey 50% / Grey 80% * | 68.8 ? | 41.6 ? 40% | 34.4 ? 50% | 38 ? 45% | 68 ? 1% |
| Response Time Black / White * | 29.6 | 28.8 ? 3% | 14 ? 53% | 26.8 ? 9% | 33.6 ? -14% |
| PWM Frequency | 25770 ? | 26040 ? | 20830 ? | 735 ? | |
| Screen | -40% | -3% | -20% | -6% | |
| Brightness middle | 451 | 229 -49% | 542 20% | 271 -40% | 1111.7 146% |
| Brightness | 434 | 212 -51% | 528 22% | 260 -40% | 1026 136% |
| Brightness Distribution | 89 | 88 -1% | 84 -6% | 86 -3% | 80 -10% |
| Black Level * | 0.25 | 0.23 8% | 0.41 -64% | 0.29 -16% | 0.81 -224% |
| Contrast | 1804 | 996 -45% | 1322 -27% | 934 -48% | 1372 -24% |
| Colorchecker dE 2000 * | 4.4 | 4.2 5% | 3.5 20% | 3.9 11% | 3.83 13% |
| Colorchecker dE 2000 max. * | 6.7 | 18 -169% | 7.8 -16% | 10.2 -52% | 7.85 -17% |
| Colorchecker dE 2000 calibrated * | 1.8 | 4.2 -133% | 1.3 28% | 2.9 -61% | 2.98 -66% |
| Greyscale dE 2000 * | 5 | 2 60% | 4.8 4% | 2.6 48% | 5.6 -12% |
| Gamma | 2.31 95% | 2.23 99% | 2.33 94% | 2.29 96% | 2.306 95% |
| CCT | 7717 84% | 6292 103% | 7690 85% | 6517 100% | 7676 85% |
| Color Space (Percent of AdobeRGB 1998) | 63 | 41 -35% | 58.8 -7% | 56.1 -11% | 59 -6% |
| Color Space (Percent of sRGB) | 97 | 64.5 -34% | 91.1 -6% | 85.8 -12% | 93 -4% |
| Total Average (Program / Settings) | -18% /
-32% | 14% /
3% | -1% /
-12% | -7% /
-7% |
* ... smaller is better
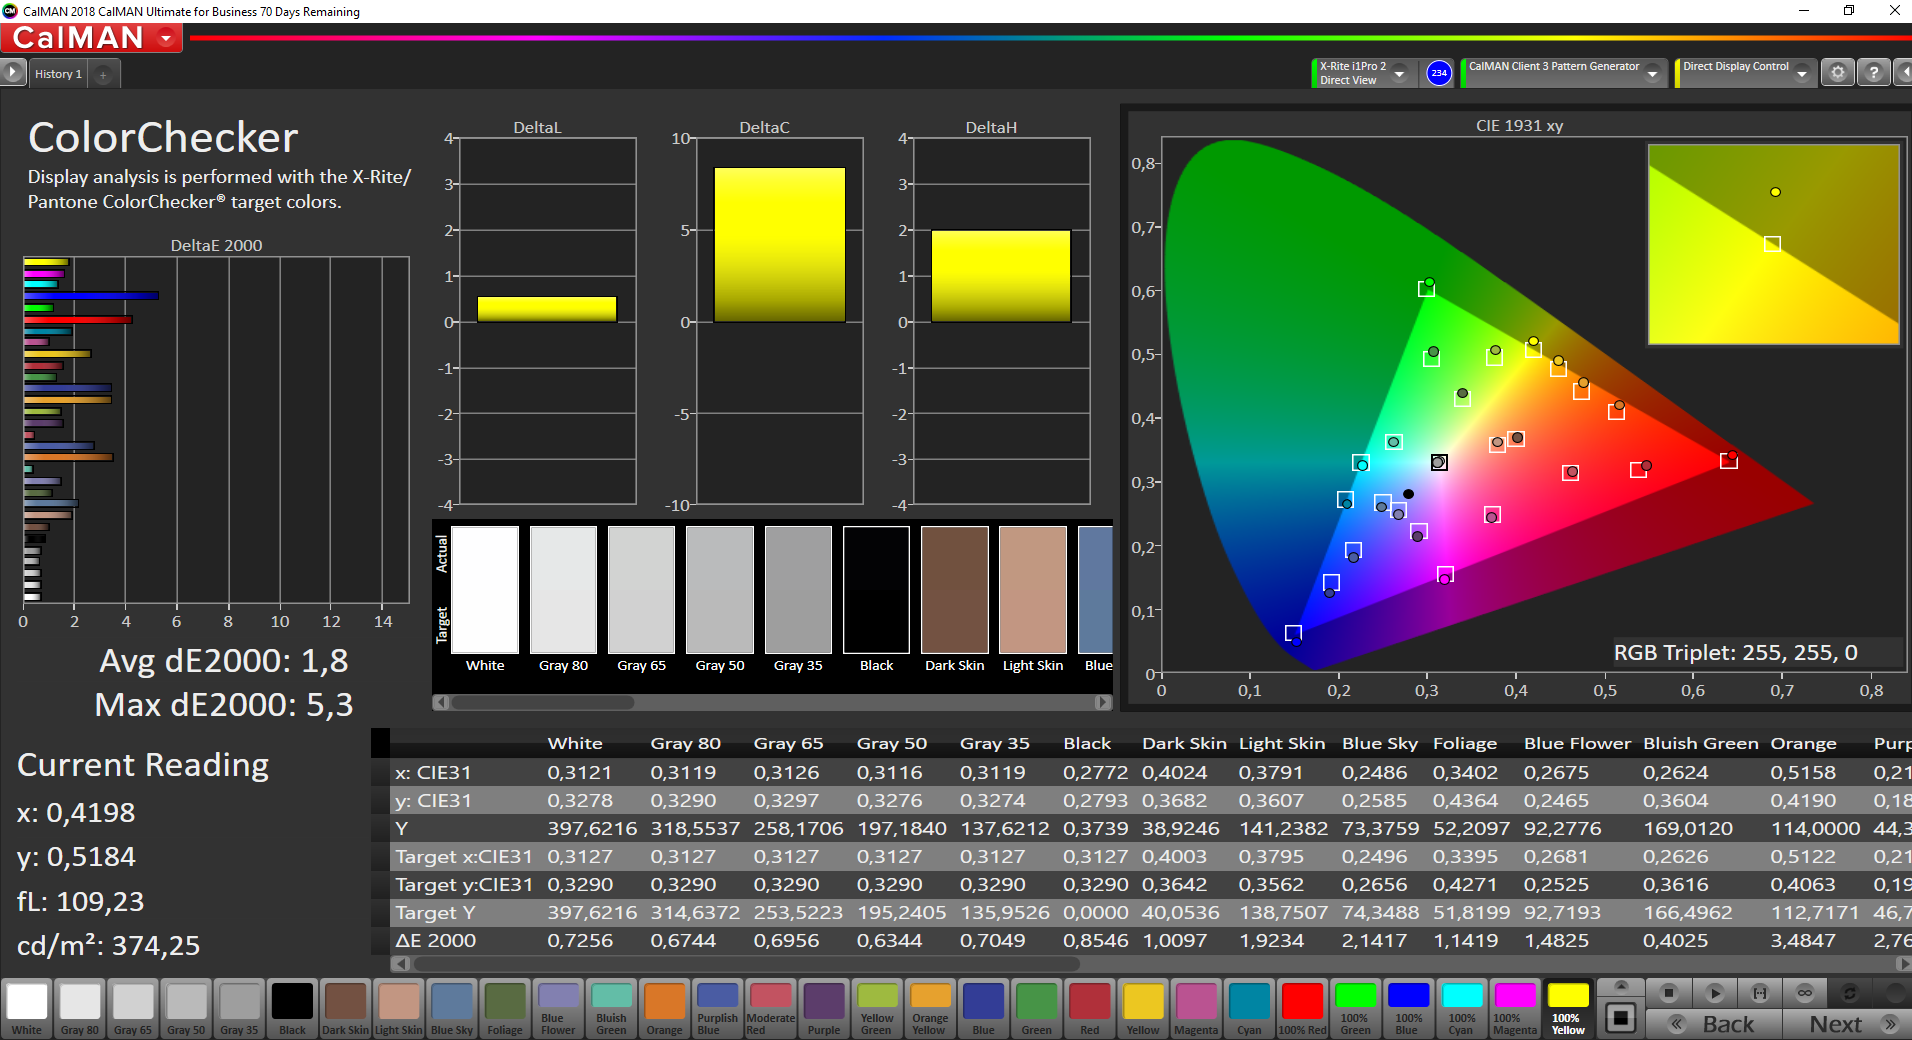
According to our measurements, this HP workstation has a very good contrast ratio of 1804:1 and a low black value of 0.25 cd/m². This means that colors are well defined and blacks appear deep.
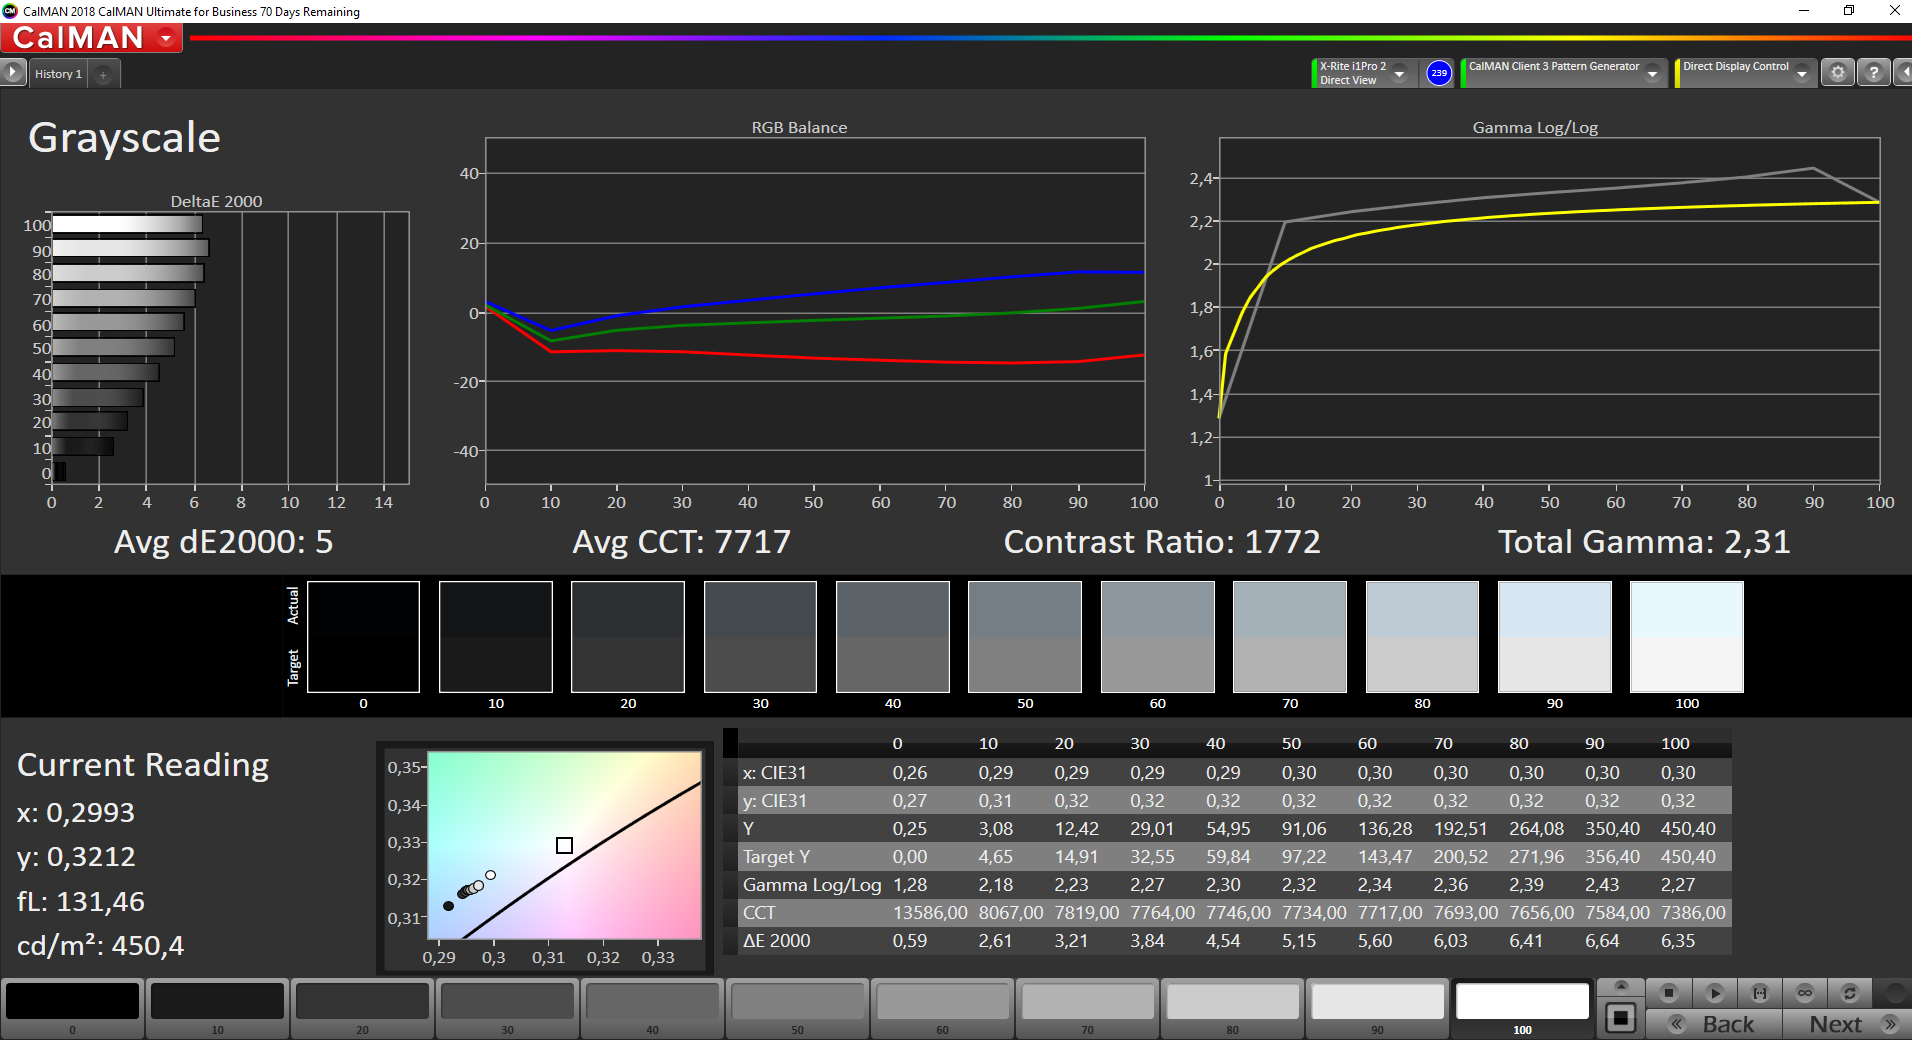
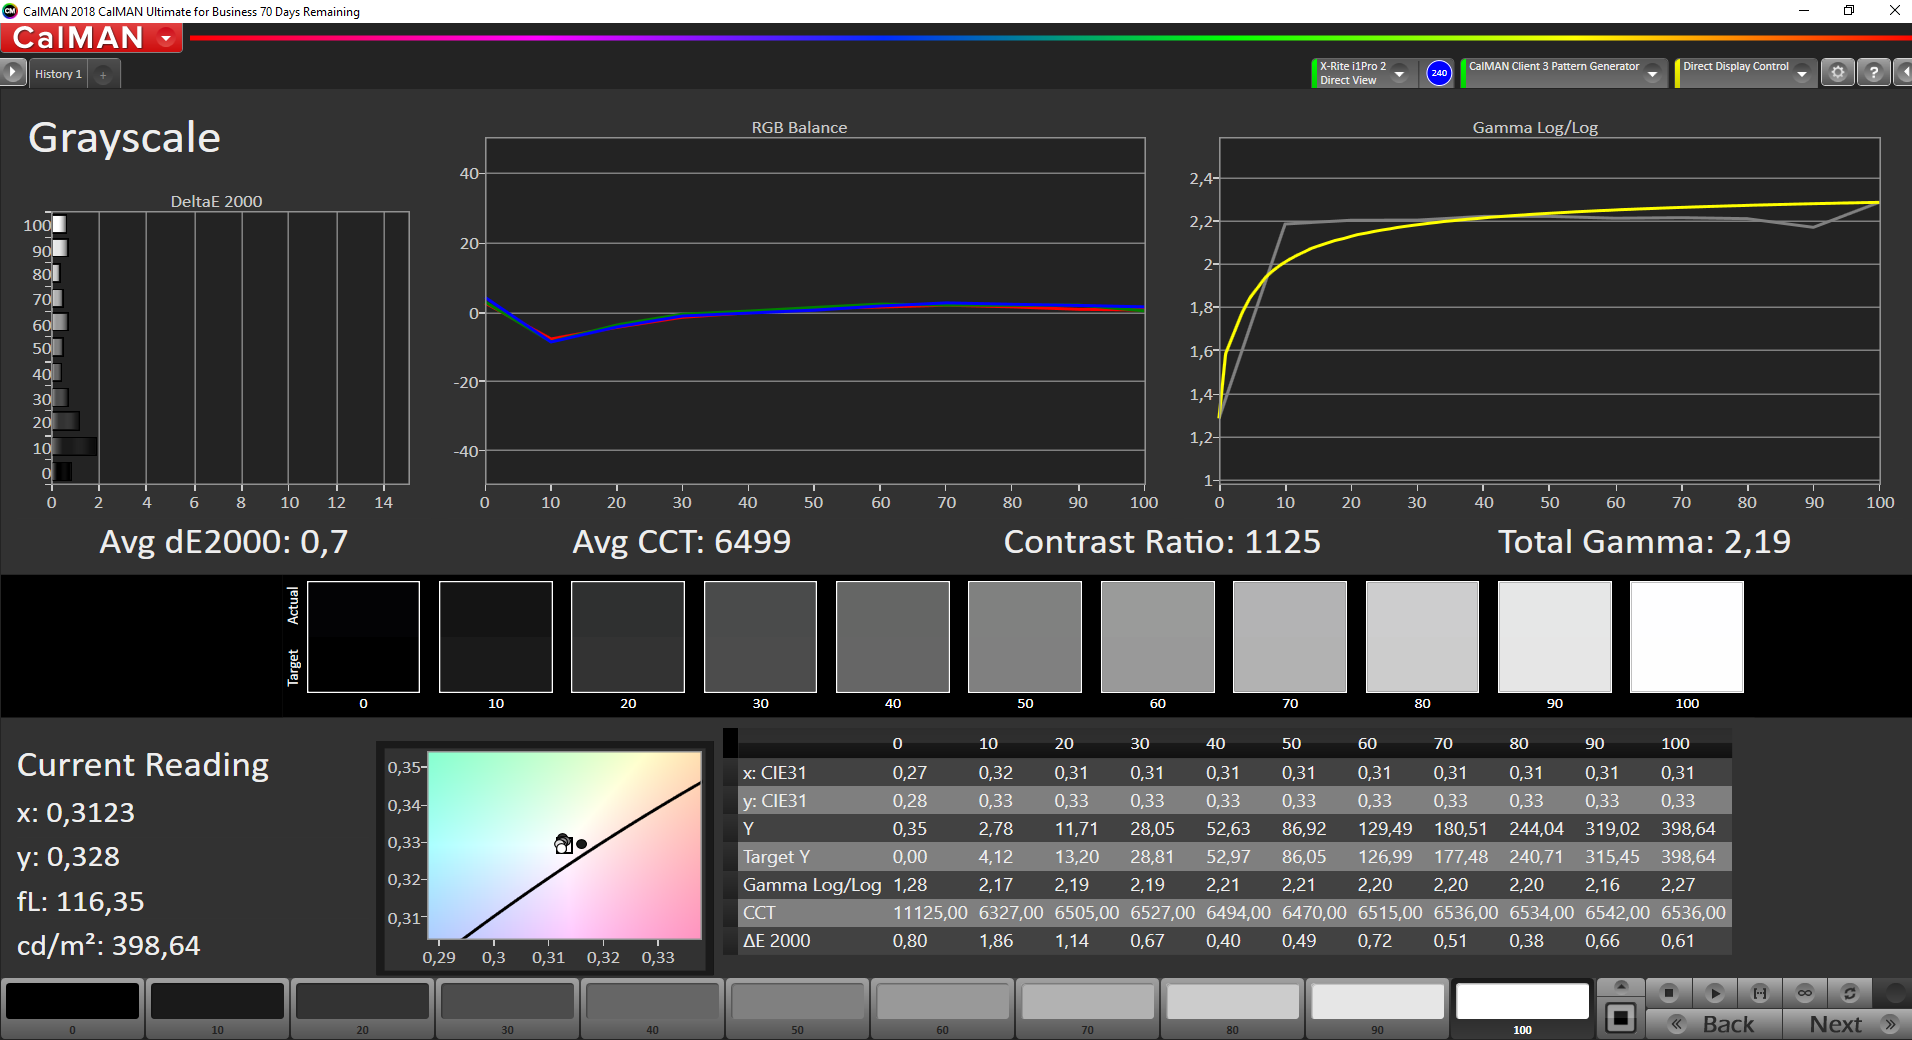
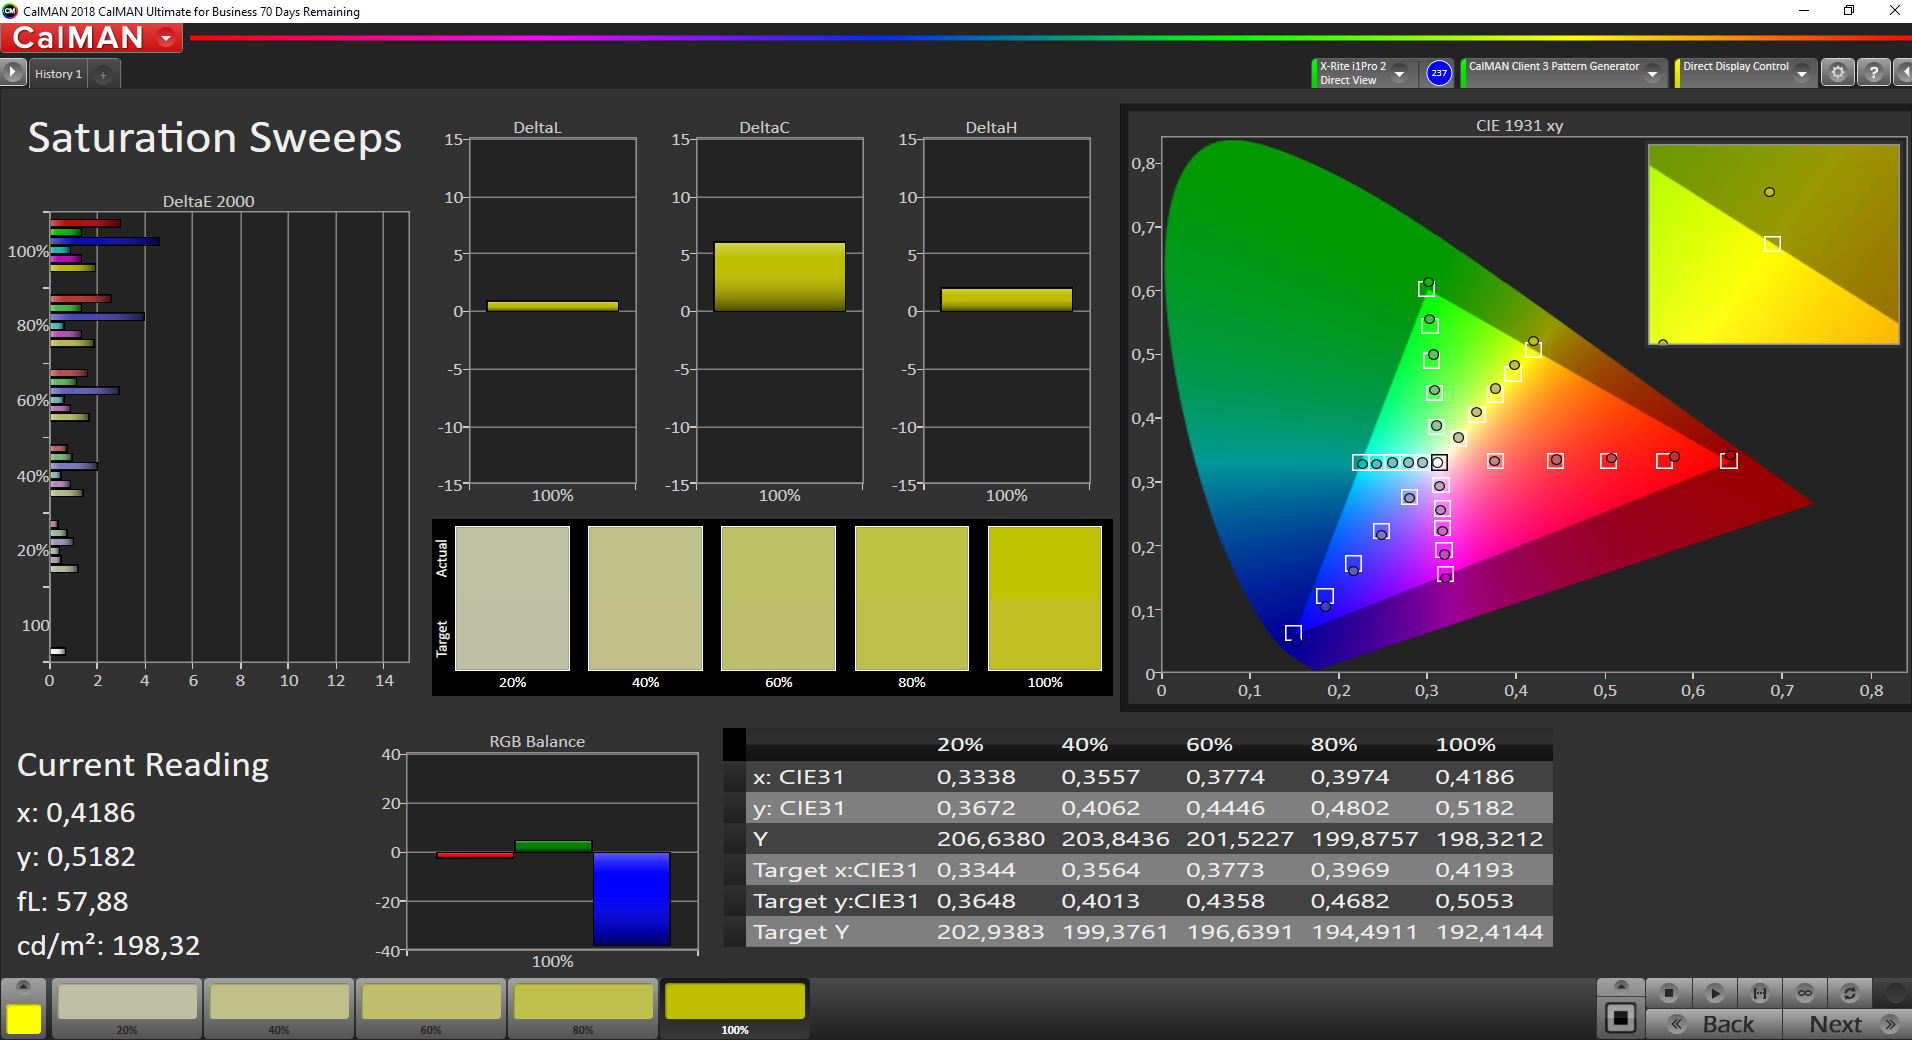
The CalMAN analysis shows that colors are displayed with a low proportion of red tones and a slightly elevated proportion of blues. Calibrating the display completely eradicates this issue and only the color deviation remains relatively high. You can download the ICC file of our calibration above, beside the graphic describing the brightness distribution of the screen.
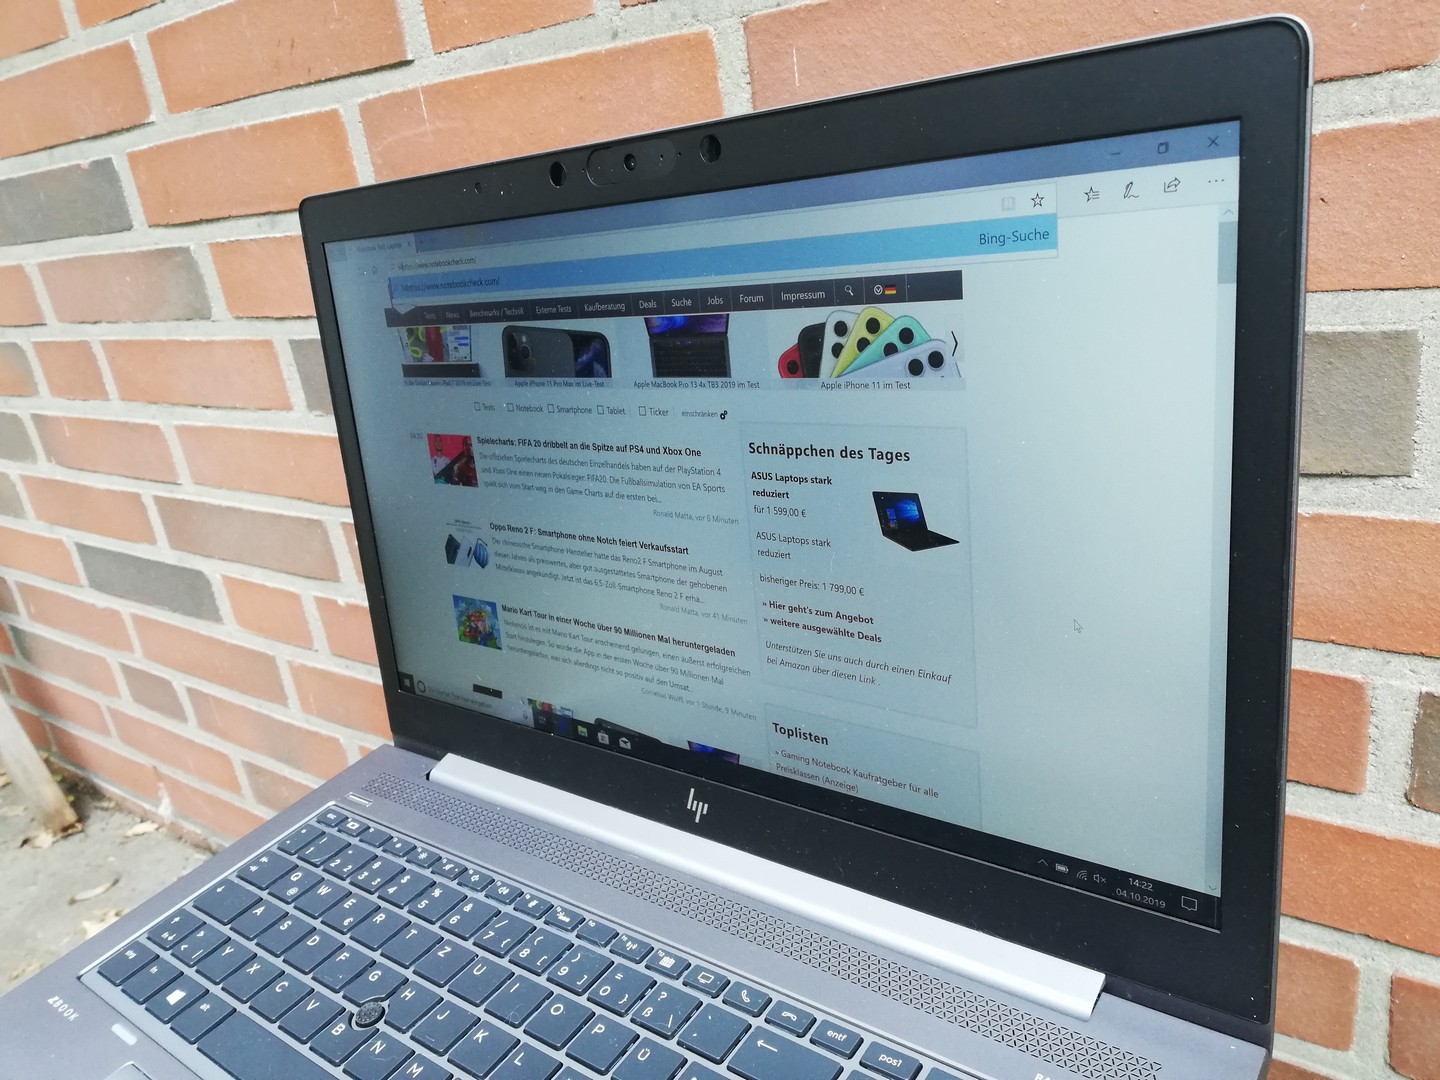
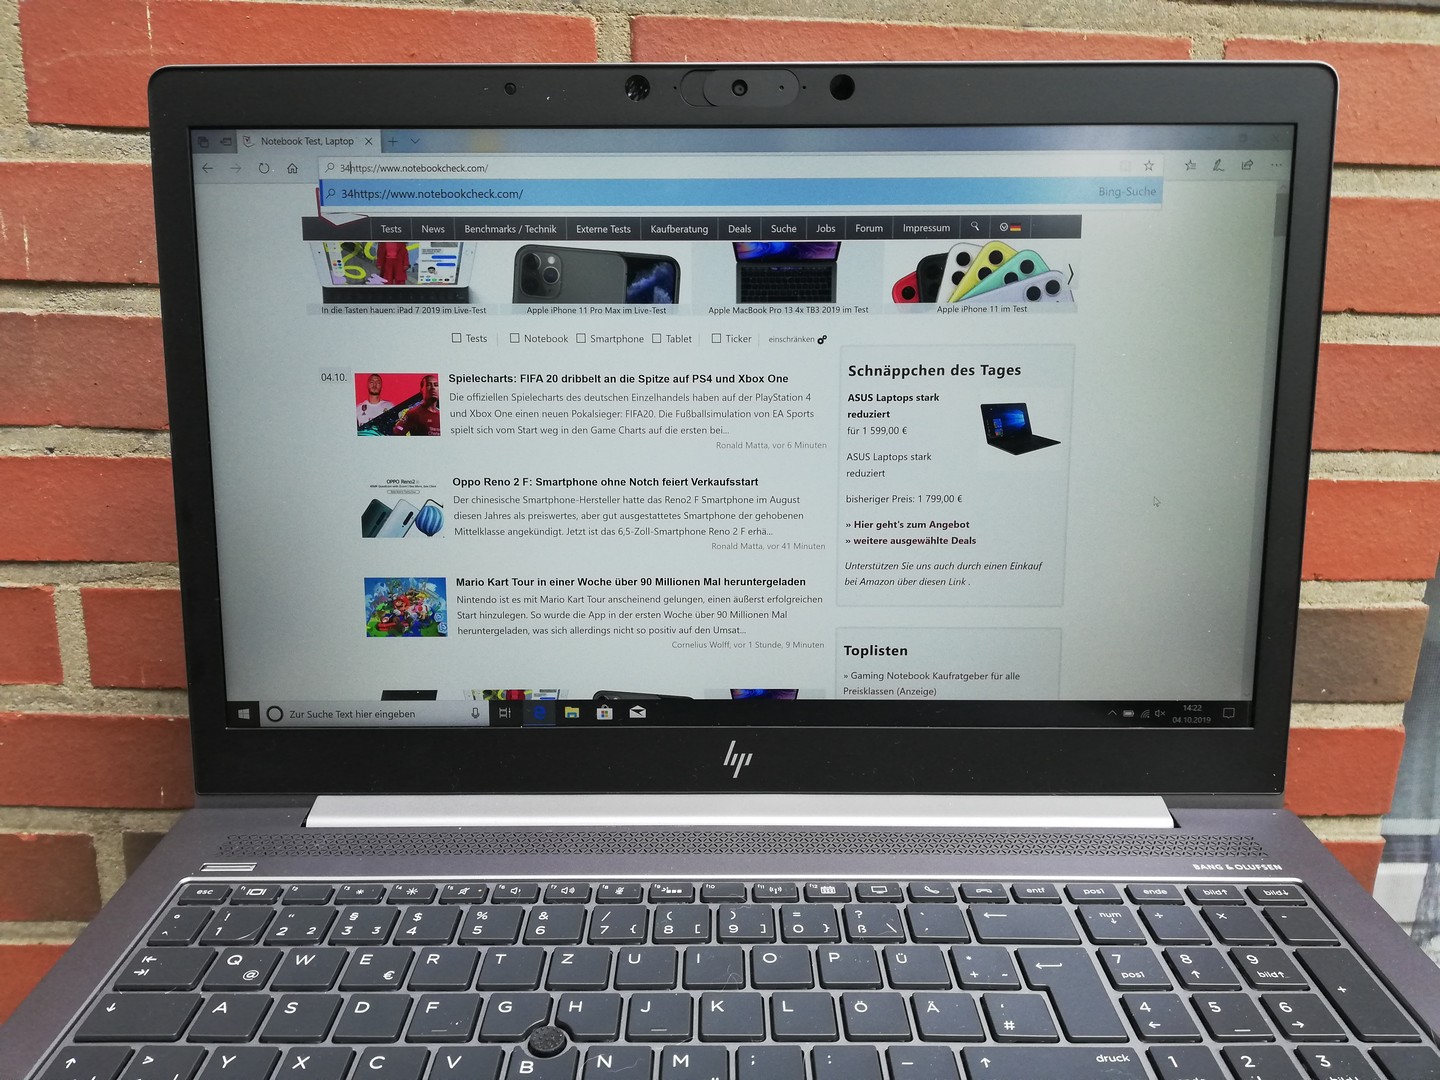
Thanks to its great luminosity, the HP ZBook 15u G6 can be used outdoors. However, there are some reflections in direct sunlight despite the matte screen, which is why we would recommend users to find a spot in the shade when working outdoors.
Display Response Times
| ↔ Response Time Black to White | ||
|---|---|---|
| 29.6 ms ... rise ↗ and fall ↘ combined | ↗ ms rise | 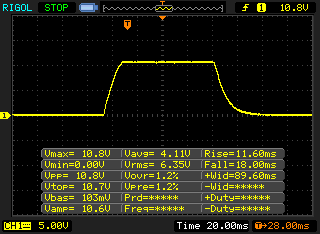 |
| ↘ ms fall | ||
| The screen shows relatively slow response rates in our tests and may be too slow for gamers. In comparison, all tested devices range from 0.1 (minimum) to 240 (maximum) ms. » 76 % of all devices are better. This means that the measured response time is worse than the average of all tested devices (21.5 ms). | ||
| ↔ Response Time 50% Grey to 80% Grey | ||
| 68.8 ms ... rise ↗ and fall ↘ combined | ↗ 33.2 ms rise | 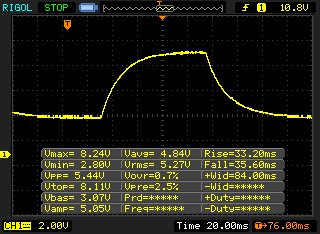 |
| ↘ 35.6 ms fall | ||
| The screen shows slow response rates in our tests and will be unsatisfactory for gamers. In comparison, all tested devices range from 0.2 (minimum) to 636 (maximum) ms. » 98 % of all devices are better. This means that the measured response time is worse than the average of all tested devices (33.7 ms). | ||
Screen Flickering / PWM (Pulse-Width Modulation)
| Screen flickering / PWM not detected | 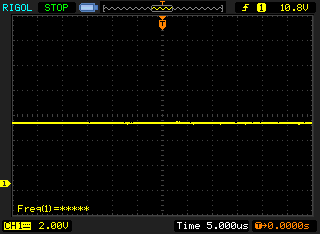 | ||
In comparison: 53 % of all tested devices do not use PWM to dim the display. If PWM was detected, an average of 17900 (minimum: 5 - maximum: 3846000) Hz was measured. | |||
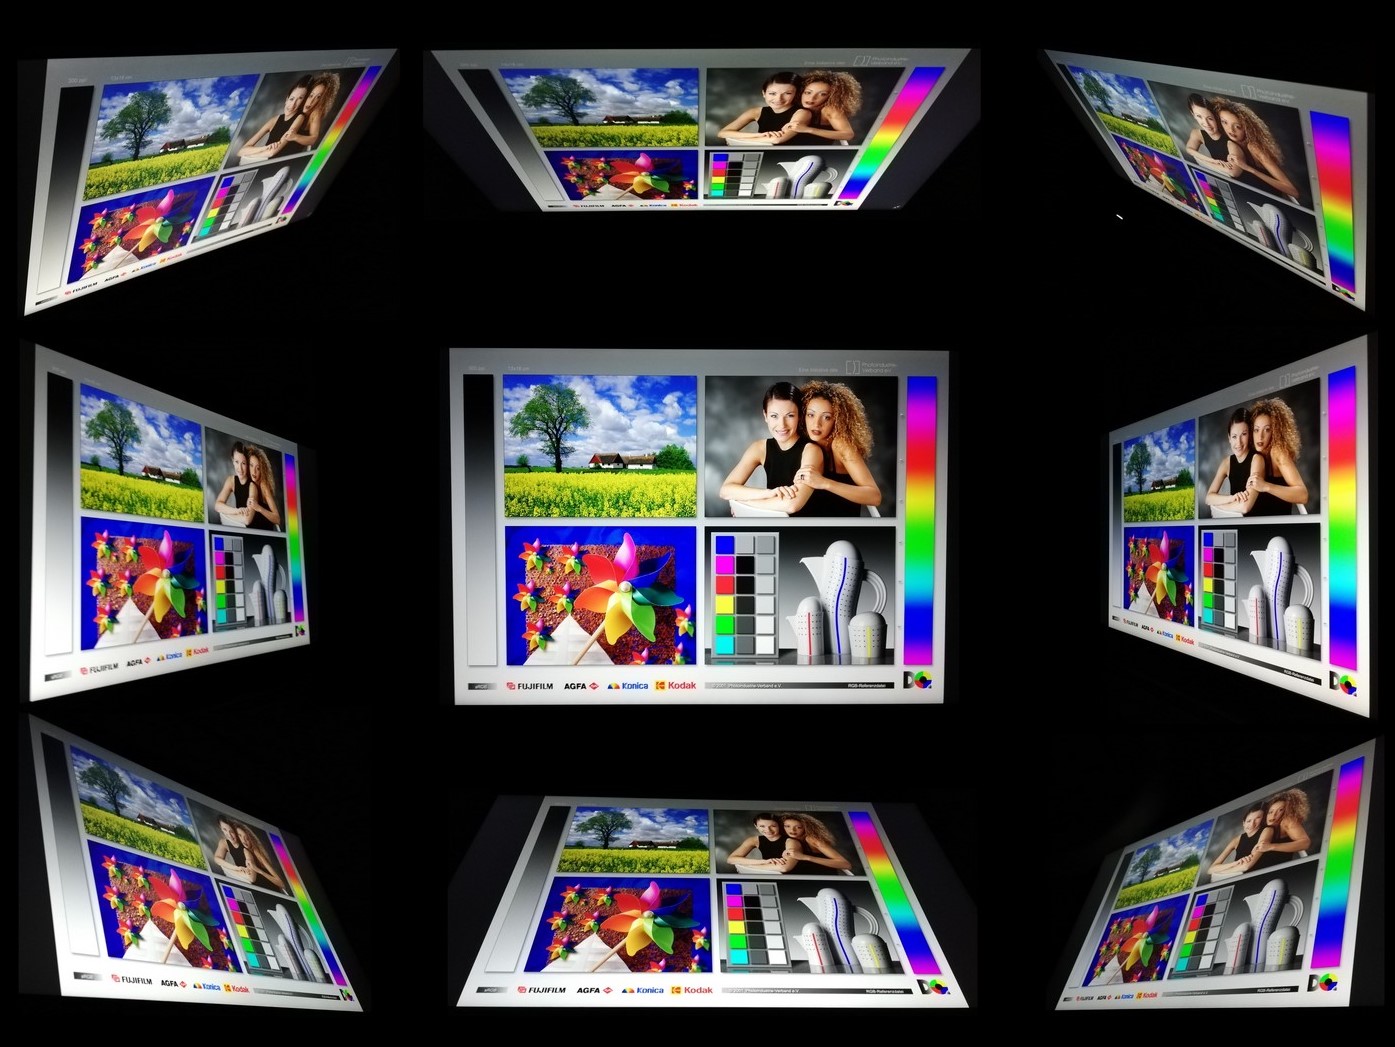
The IPS panel of the HP workstation has very stable viewing angles. Screen content can be read from almost any angle without any noticeable distortion or color inversion.
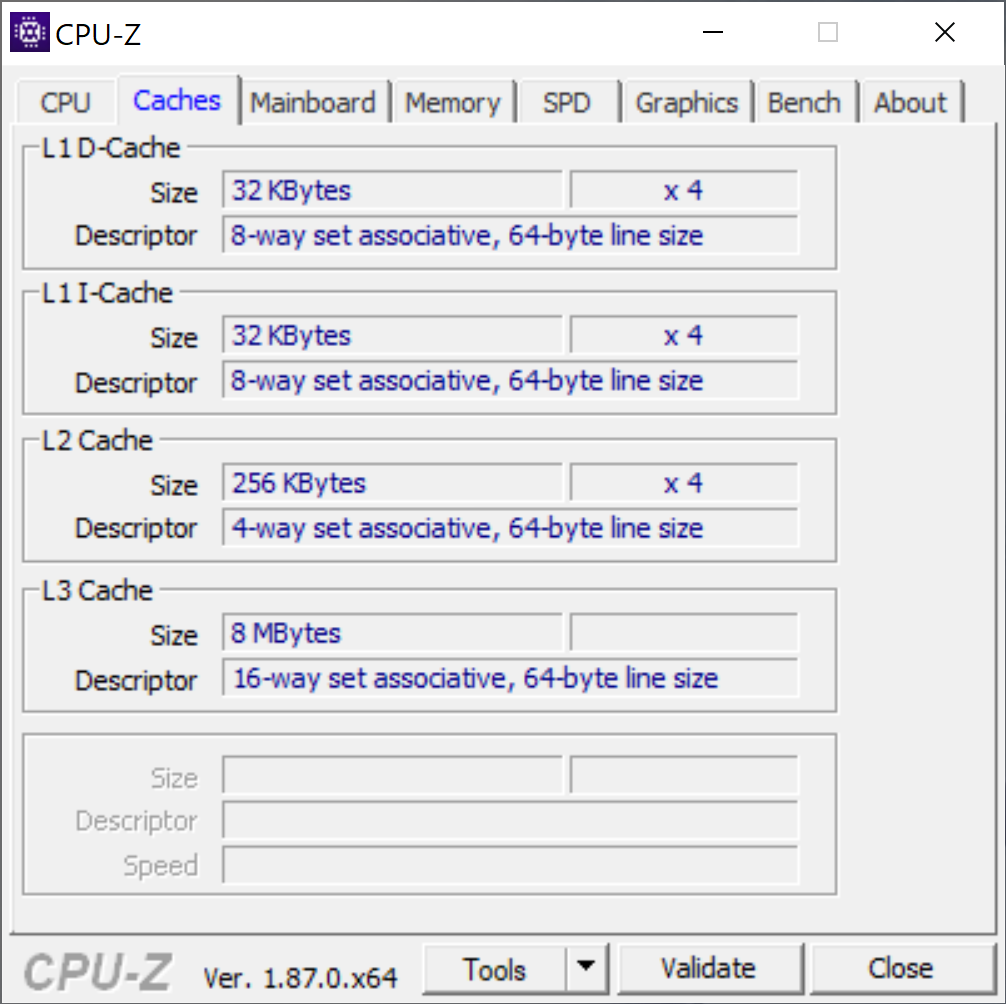
Performance - Whiskey Lake update hardly improves performance
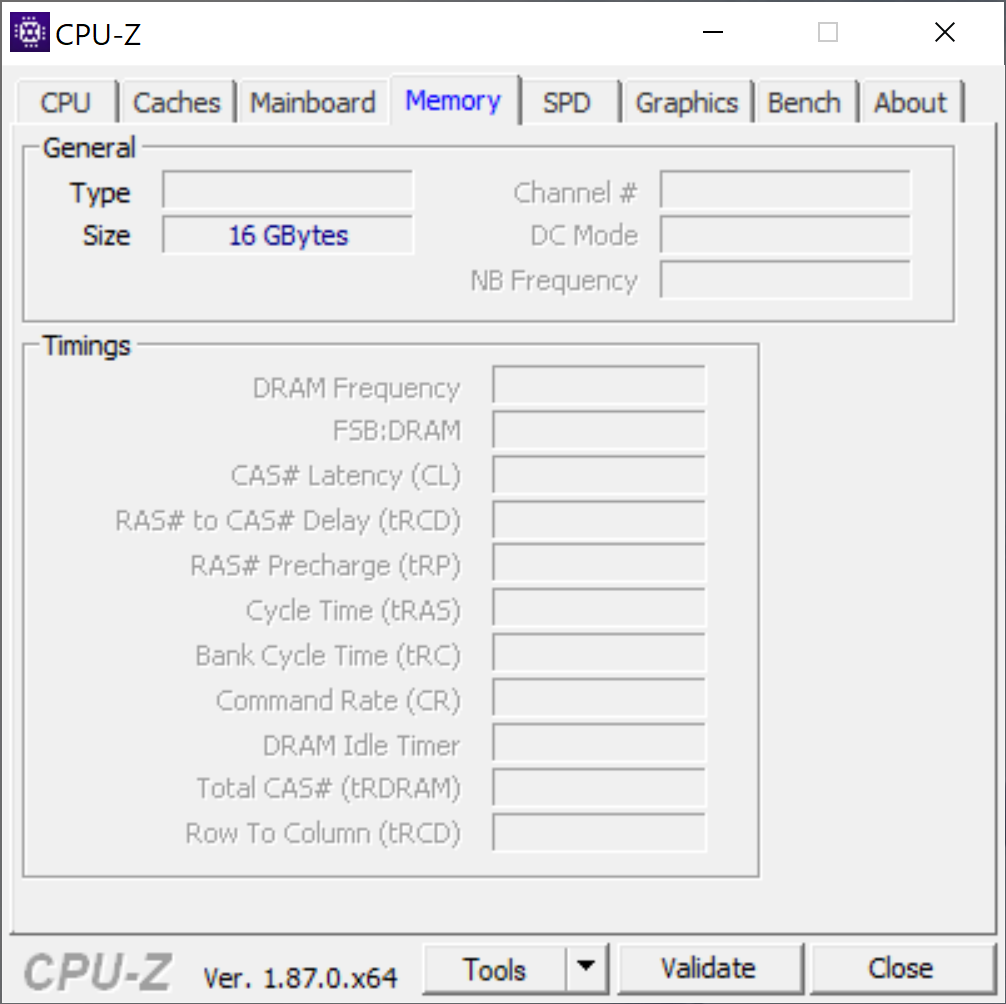
Our configuration of the HP ZBook 5u with a 512-GB SSD, 16 GB of RAM and an Intel Core i7-8565U is strongly reminiscent of comparable office notebooks. The big difference is the Radeon Pro WX 3200 from AMD, which is optimized for professional 3D applications. It is the successor of the AMD Radeon Pro WX 3100 that was used in the HP ZBook 15u G5.
While the storage capacity is flexible and the dedicated GPU is always included, HP has made the ZBook 15u G6 available with several CPU options:
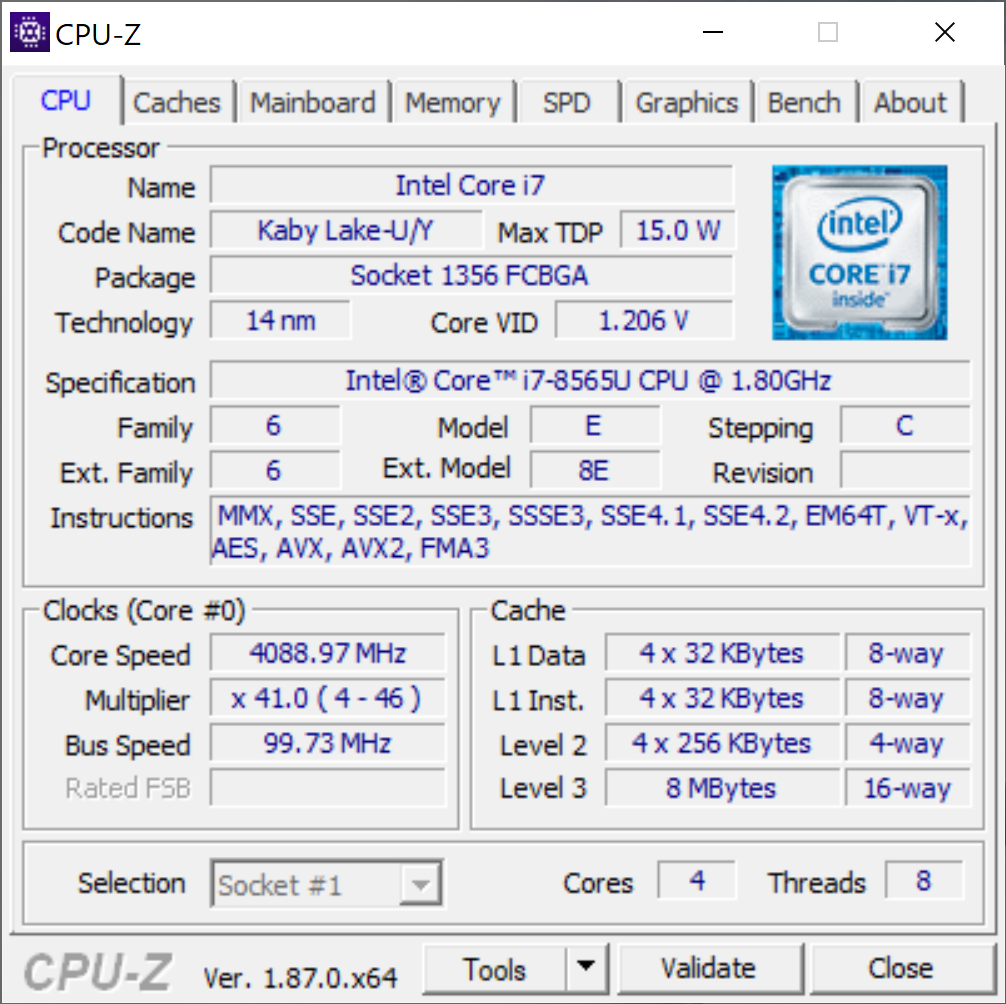
Processor
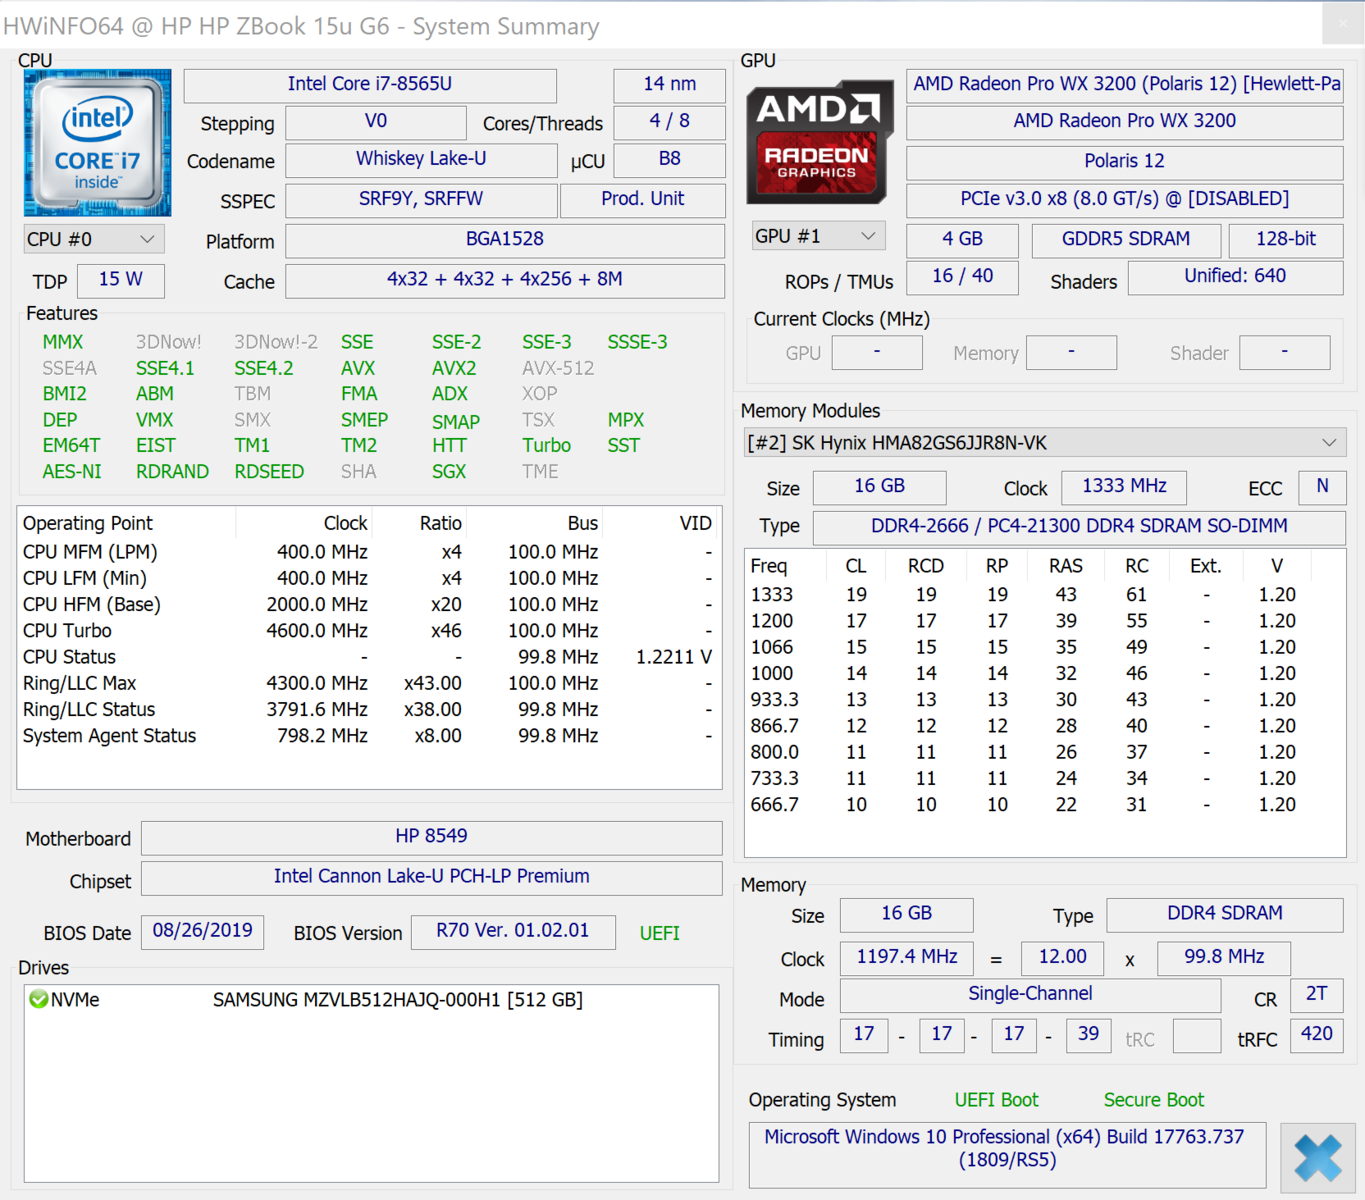
The Intel Core i7-8565U in today's test unit is an energy-efficient quad-core processor based on Whiskey Lake architecture. Compared to the Intel Core i7-8550U in the HP ZBook 15u G5, this processor has the same base clock rate of 1.8 GHz but an increased Turbo Boost clock rate of 4.6 GHz (single core) and 4.1 GHz (four cores), which is significantly higher. The cooling system will decide how long the device can keep up this increased clock rate.
The performance of the Core i7-8565U only drops by around 4 percent during our Cinebench R15 loop, although this happens quite quickly. However, the performance is lower than that of the ZBook 15u G5 with an i7-8550U, which indicates that the device cannot make full use of the CPU. This overall result reflects the individual test results. The performance of the 15u G5 is about 10 percent better than that of the HP ZBook 15u G6. The performance of the latter drops by around 13 percent when running on battery.
System Performance
The HP ZBook G6 cannot outpace its predecessor in the system performance benchmarks either. Both PCMark results are below our expectations and position our test unit on last place in our comparison field. The HP workstation offers a smooth system performance in everyday use, however, and we did not encounter any micro judders or long loading times when accessing data.
Find out how other workstations perform in comparison to the HP ZBook 15u G6 in our CPU benchmark list.
| PCMark 8 Home Score Accelerated v2 | 3257 points | |
| PCMark 8 Work Score Accelerated v2 | 4022 points | |
| PCMark 10 Score | 2817 points | |
Help | ||
Storage Devices
While the HP ZBook 15u G5 was equipped with a 256-GB SSD from Toshiba, our current test unit has a 512-GB Samsung PM981 SSD. This offers significantly faster read and write rates and positions our test unit on second place just behind the Lenovo ThinkPad P1 2019.
You can find more information on the performance of other storage devices in our list of HDD and SSD storage benchmarks.
| HP ZBook 15u G6 6TP54EA Samsung SSD PM981 MZVLB512HAJQ | HP ZBook 15u G5 2ZC05EA Toshiba XG5 KXG50ZNV256G | Lenovo ThinkPad P1 2019-20QT000RGE WDC PC SN720 SDAQNTW-512G | Fujitsu Celsius H780 Samsung SSD PM981 MZVLB512HAJQ | Dell Latitude 5420 Rugged-P85G SK hynix PC401 NVMe 500 GB | Average Samsung SSD PM981 MZVLB512HAJQ | |
|---|---|---|---|---|---|---|
| CrystalDiskMark 5.2 / 6 | -25% | 25% | -7% | -26% | 7% | |
| Write 4K | 156 | 98.8 -37% | 162.2 4% | 98.3 -37% | 98.8 -37% | 126.7 ? -19% |
| Read 4K | 45.73 | 33.98 -26% | 43.71 -4% | 40.18 -12% | 38.51 -16% | 44 ? -4% |
| Write Seq | 1158 | 395.7 -66% | 2441 111% | 1777 53% | 843 -27% | 1617 ? 40% |
| Read Seq | 1132 | 2063 82% | 1753 55% | 1247 10% | 1282 13% | 1716 ? 52% |
| Write 4K Q32T1 | 369.2 | 352.3 -5% | 397.6 8% | 344.7 -7% | 355.5 -4% | 413 ? 12% |
| Read 4K Q32T1 | 573 | 281.8 -51% | 520 -9% | 383.1 -33% | 241.4 -58% | 420 ? -27% |
| Write Seq Q32T1 | 1969 | 355 -82% | 2519 28% | 2019 3% | 893 -55% | 2076 ? 5% |
| Read Seq Q32T1 | 3138 | 2775 -12% | 3448 10% | 2076 -34% | 2478 -21% | 3130 ? 0% |
| Write 4K Q8T8 | 361 | 1381 | 1751 | 1264 ? | ||
| Read 4K Q8T8 | 447.3 | 1371 | 1568 | 1193 ? | ||
| AS SSD | -65% | 4% | -10% | -38% | -26% | |
| Seq Read | 2083 | 1696 -19% | 2980 43% | 1049 -50% | 2054 -1% | 1976 ? -5% |
| Seq Write | 1715 | 441 -74% | 2094 22% | 1882 10% | 653 -62% | 1637 ? -5% |
| 4K Read | 55.3 | 31.28 -43% | 45.05 -19% | 48.35 -13% | 39.34 -29% | 50.5 ? -9% |
| 4K Write | 137.6 | 101.5 -26% | 155.4 13% | 102.5 -26% | 96.4 -30% | 112 ? -19% |
| 4K-64 Read | 1211 | 488.4 -60% | 1291 7% | 1395 15% | 677 -44% | 1203 ? -1% |
| 4K-64 Write | 1446 | 564 -61% | 1506 4% | 1789 24% | 982 -32% | 1504 ? 4% |
| Access Time Read * | 0.039 | 0.103 -164% | 0.064 -64% | 0.066 -69% | 0.044 -13% | 0.05092 ? -31% |
| Access Time Write * | 0.026 | 0.051 -96% | 0.024 8% | 0.037 -42% | 0.051 -96% | 0.08337 ? -221% |
| Score Read | 1474 | 689 -53% | 1634 11% | 1549 5% | 921 -38% | 1451 ? -2% |
| Score Write | 1755 | 710 -60% | 1871 7% | 2080 19% | 1143 -35% | 1780 ? 1% |
| Score Total | 3976 | 1697 -57% | 4300 8% | 4469 12% | 2475 -38% | 3966 ? 0% |
| Copy ISO MB/s | 1146 | 2015 | 1547 | 1622 | 1755 ? | |
| Copy Program MB/s | 324.8 | 597 | 405.9 | 378.1 | 454 ? | |
| Copy Game MB/s | 742 | 1449 | 1170 | 793 | 1057 ? | |
| Total Average (Program / Settings) | -45% /
-48% | 15% /
13% | -9% /
-9% | -32% /
-33% | -10% /
-12% |
* ... smaller is better

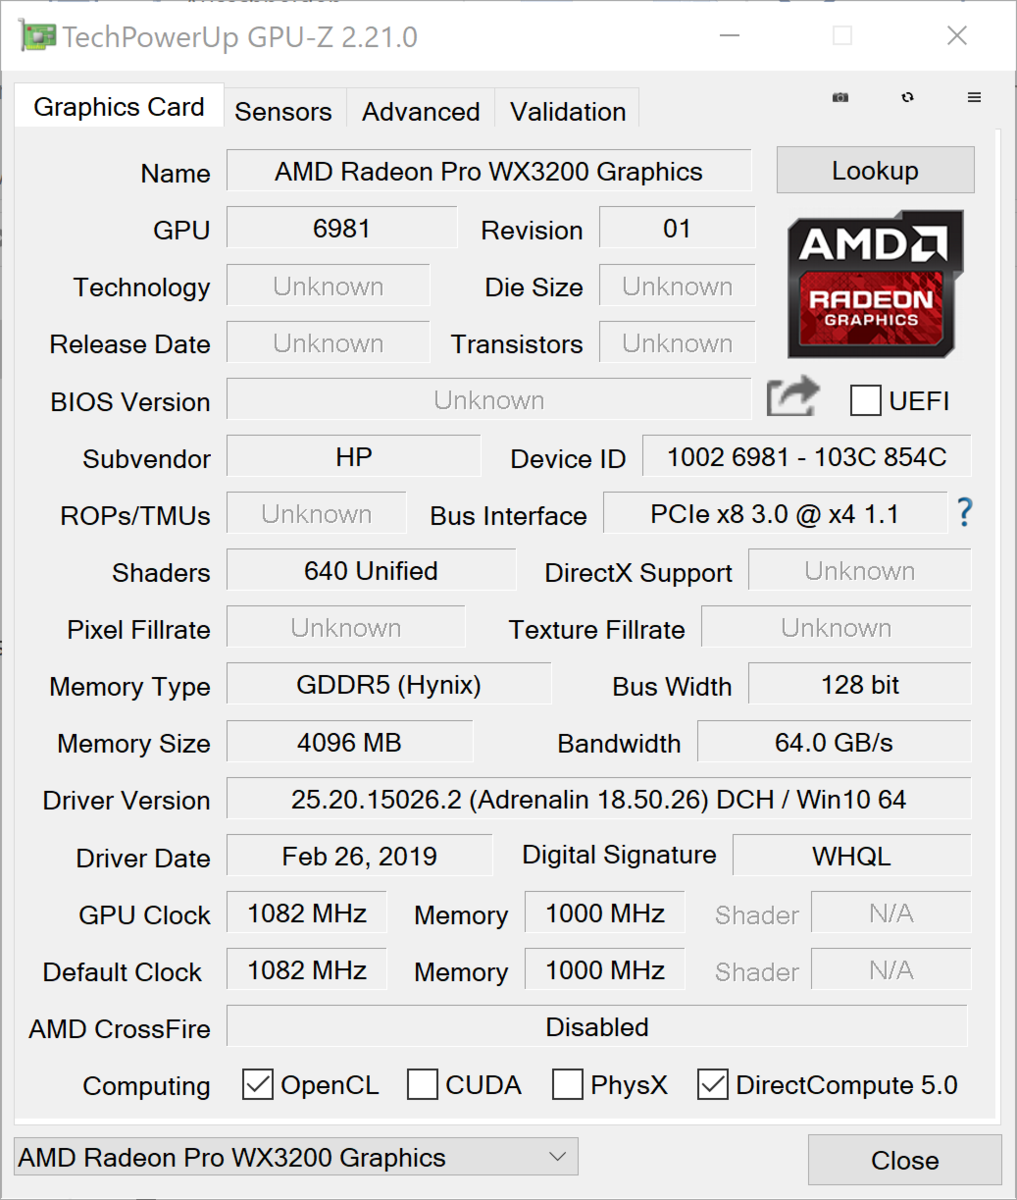
GPU Performance
The AMD Radeon Pro WX 3200 in our HP ZBook 15u G6 is the successor of the WX 3100, which was used in the ZBook 15u G5. It is the equivalent of the Radeon RX 550 but has been optimized for professional 3D and CAD applications and has 4 GB of VRAM. The WX 3200 is the counterpart to Nvidia's Quadro series and its performance lies somewhere in between the Quadro P600 and the Quadro P620.
The Radeon Pro WX 3200 manages to outpace its predecessor in our benchmarks. Depending on the test, the difference in performance is between 5 and 50 percent. Users will have to accept a loss in performance of 25 percent on battery. The WX 3200 can be compared with other GPUs in our GPU benchmark list.
| Unigine Valley 1.0 | |
| 1920x1080 Extreme HD DirectX AA:x8 | |
| Lenovo ThinkPad P1 2019-20QT000RGE | |
| Fujitsu Celsius H780 | |
| Average of class Workstation (last 2 years) | |
| HP ZBook 15u G6 6TP54EA | |
| Average AMD Radeon Pro WX 3200 () | |
| HP ZBook 15u G5 2ZC05EA | |
| 1920x1080 Extreme HD Preset OpenGL AA:x8 | |
| Lenovo ThinkPad P1 2019-20QT000RGE | |
| Fujitsu Celsius H780 | |
| Average of class Workstation (last 2 years) | |
| HP ZBook 15u G6 6TP54EA | |
| Average AMD Radeon Pro WX 3200 () | |
| HP ZBook 15u G5 2ZC05EA | |
| 3DMark 06 Standard Score | 16604 points | |
| 3DMark Vantage P Result | 12538 points | |
| 3DMark 11 Performance | 4592 points | |
| 3DMark Cloud Gate Standard Score | 11979 points | |
| 3DMark Fire Strike Score | 2822 points | |
| 3DMark Time Spy Score | 1039 points | |
Help | ||
Gaming Performance
The HP ZBook 15u G6 only offers limited gaming suitability. The AMD Radeon Pro WX 3200 is made for professional 3D applications and therefore does not fare very well in the games we tested. While it was impossible to change the resolution of Anno 1800, for example, the performance was below our expectations in other games as well.
Users wishing to play simple or older games should not have any issues. You can find out what kind of performance to expect from our GPU gaming list.
| The Witcher 3 | |
| 1366x768 Medium Graphics & Postprocessing | |
| Average of class Workstation (73 - 430, n=27, last 2 years) | |
| Lenovo ThinkPad P1 2019-20QT000RGE | |
| Fujitsu Celsius H780 | |
| Dell Latitude 5420 Rugged-P85G | |
| Average AMD Radeon Pro WX 3200 (26.5 - 35.6, n=2) | |
| HP ZBook 15u G5 2ZC05EA | |
| HP ZBook 15u G6 6TP54EA | |
| 1920x1080 High Graphics & Postprocessing (Nvidia HairWorks Off) | |
| Average of class Workstation (34.9 - 298, n=28, last 2 years) | |
| Lenovo ThinkPad P1 2019-20QT000RGE | |
| Fujitsu Celsius H780 | |
| HP ZBook 15u G5 2ZC05EA | |
| Average AMD Radeon Pro WX 3200 (12.3 - 18, n=2) | |
| HP ZBook 15u G6 6TP54EA | |
| Dell Latitude 5420 Rugged-P85G | |
| 1920x1080 Ultra Graphics & Postprocessing (HBAO+) | |
| Average of class Workstation (19.6 - 156.5, n=29, last 2 years) | |
| Lenovo ThinkPad P1 2019-20QT000RGE | |
| Fujitsu Celsius H780 | |
| Average AMD Radeon Pro WX 3200 (9.4 - 11.2, n=2) | |
| HP ZBook 15u G6 6TP54EA | |
| HP ZBook 15u G5 2ZC05EA | |
| Dell Latitude 5420 Rugged-P85G | |
| BioShock Infinite | |
| 1280x720 Very Low Preset | |
| Lenovo ThinkPad P1 2019-20QT000RGE | |
| Average AMD Radeon Pro WX 3200 () | |
| HP ZBook 15u G5 2ZC05EA | |
| Dell Latitude 5420 Rugged-P85G | |
| 1366x768 Medium Preset | |
| Lenovo ThinkPad P1 2019-20QT000RGE | |
| Average AMD Radeon Pro WX 3200 () | |
| Dell Latitude 5420 Rugged-P85G | |
| HP ZBook 15u G5 2ZC05EA | |
| Thief | |
| 1024x768 Very Low Preset | |
| Dell Latitude 5420 Rugged-P85G | |
| 1366x768 Normal Preset AA:FX | |
| Dell Latitude 5420 Rugged-P85G | |
| HP ZBook 15u G6 6TP54EA | |
| Average AMD Radeon Pro WX 3200 () | |
| 1366x768 High Preset AA:FXAA & Low SS AF:4x | |
| Dell Latitude 5420 Rugged-P85G | |
| HP ZBook 15u G6 6TP54EA | |
| Average AMD Radeon Pro WX 3200 () | |
| Rise of the Tomb Raider | |
| 1024x768 Lowest Preset | |
| Lenovo ThinkPad P1 2019-20QT000RGE | |
| Dell Latitude 5420 Rugged-P85G | |
| HP ZBook 15u G6 6TP54EA | |
| Average AMD Radeon Pro WX 3200 () | |
| HP ZBook 15u G5 2ZC05EA | |
| 1366x768 Medium Preset AF:2x | |
| Lenovo ThinkPad P1 2019-20QT000RGE | |
| Dell Latitude 5420 Rugged-P85G | |
| HP ZBook 15u G6 6TP54EA | |
| Average AMD Radeon Pro WX 3200 () | |
| HP ZBook 15u G5 2ZC05EA | |
| 1920x1080 High Preset AA:FX AF:4x | |
| Lenovo ThinkPad P1 2019-20QT000RGE | |
| Dell Latitude 5420 Rugged-P85G | |
| HP ZBook 15u G6 6TP54EA | |
| Average AMD Radeon Pro WX 3200 () | |
| HP ZBook 15u G5 2ZC05EA | |
| low | med. | high | ultra | 4K | |
| BioShock Infinite (2013) | 81.6 | 29.16 | |||
| Thief (2014) | 36.4 | 34.9 | 19.9 | ||
| The Witcher 3 (2015) | 26.5 | 12.3 | 9.4 | 5.2 | |
| Dota 2 Reborn (2015) | 98 | 87 | 48 | 45 | 9.4 |
| Rise of the Tomb Raider (2016) | 50.6 | 36.22 | 18.54 | ||
| X-Plane 11.11 (2018) | 25.4 | 16.7 | 15.2 | ||
| Far Cry 5 (2018) | 43 | 20 | 18 | 17 |
Emissions - HP workstation with good speakers
System Noise
The HP ZBook 15u G6 operates very quietly during office tasks, which makes it suitable for calm environments. The fans turn up pretty quickly once you start using more demanding applications, however, and this is accompanied by a steady fan noise. The noise is not bothersome in any way and can easily be ignored together with other ambient noise.
We did not notice any other noise such as coil whine on our test unit.
Noise Level
| Idle |
| 29.7 / 29.7 / 30.3 dB(A) |
| Load |
| 32.6 / 36.1 dB(A) |
 | ||
30 dB silent 40 dB(A) audible 50 dB(A) loud |
||
min: | ||
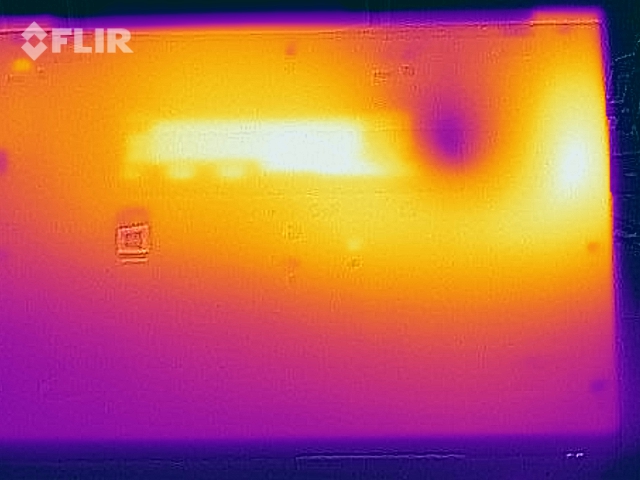
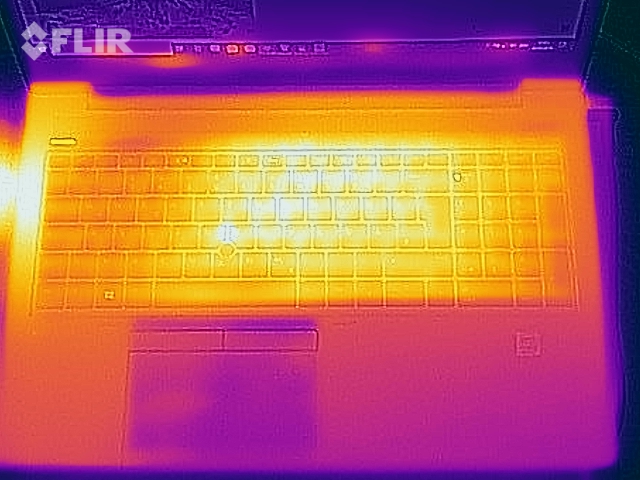
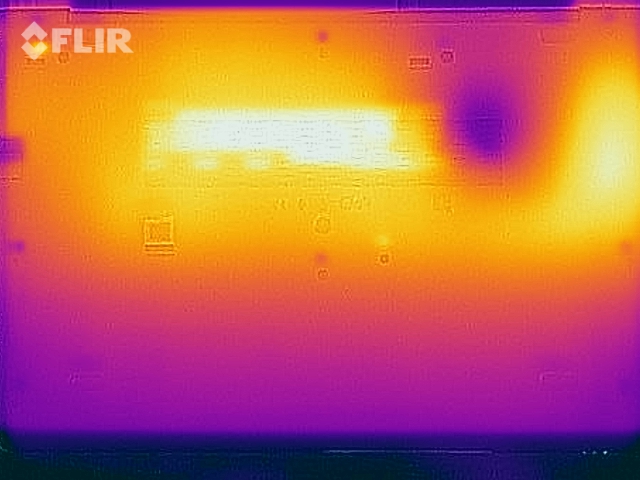
Temperature
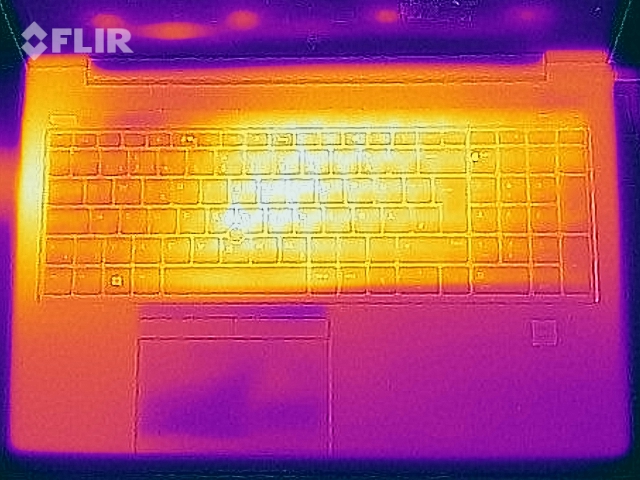
According to our measurements, the HP ZBook 15u G6 reaches maximum surface temperatures of 25.4 °C (~78 °F) while idling and up to 44.9 °C (~113 °F) under load. Thankfully, the area around the wrist rest remains comparatively cool throughout. The back of the bottom of the base unit is one large hot spot, which can make using the device on your lap rather uncomfortable.
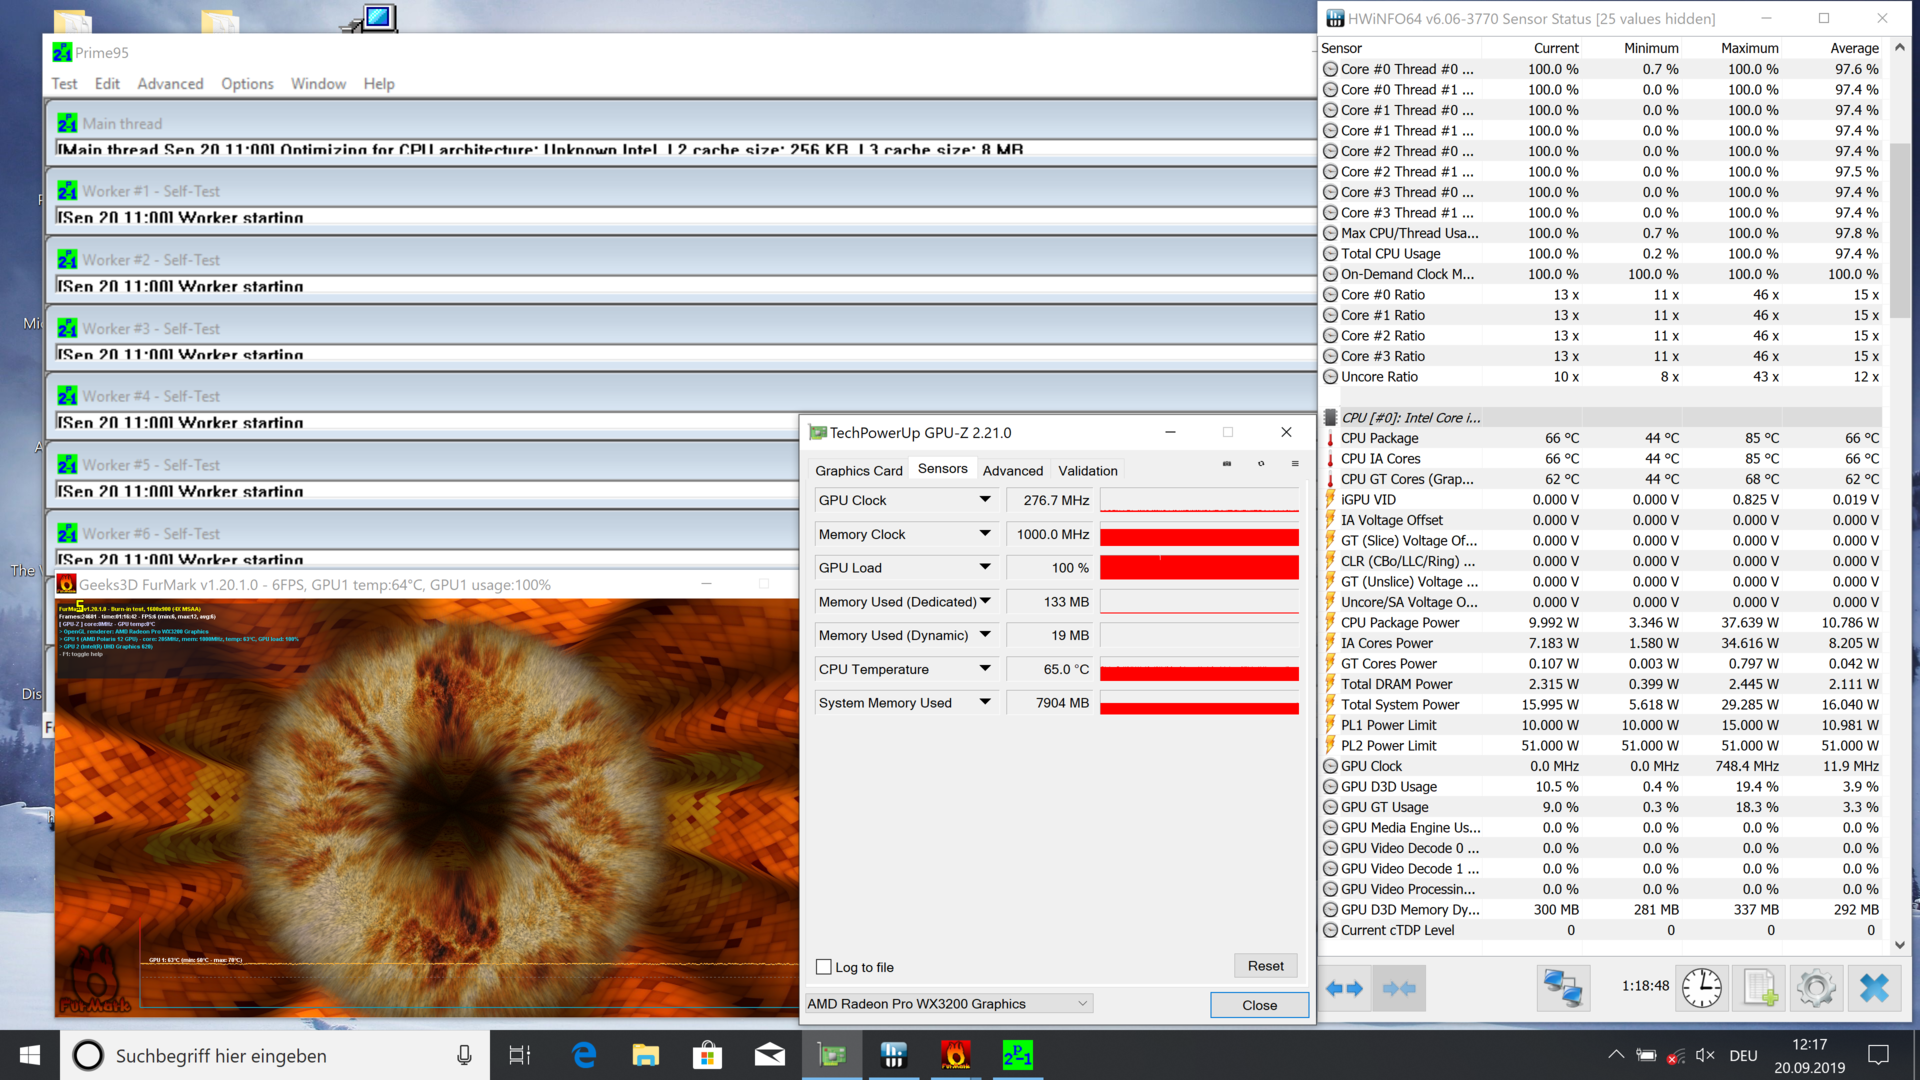
During our stress test the temperatures on the inside of the ZBook 15u G6 rose up to 85 °C (~185 °F). The cooling system managed to reduce these to an average of 66 °C (~151 °F) by the end of the test. The CPU power consumption settles down to an average of 10.79 W after having reached a relatively high 37.64 W. As the load of our stress test is unlikely to occur during everyday use, users need not worry about performance limitations due to high temperatures.
(±) The maximum temperature on the upper side is 40.5 °C / 105 F, compared to the average of 38.1 °C / 101 F, ranging from 22.2 to 69.8 °C for the class Workstation.
(±) The bottom heats up to a maximum of 44.9 °C / 113 F, compared to the average of 41.3 °C / 106 F
(+) In idle usage, the average temperature for the upper side is 24 °C / 75 F, compared to the device average of 32 °C / 90 F.
(±) Playing The Witcher 3, the average temperature for the upper side is 35.5 °C / 96 F, compared to the device average of 32 °C / 90 F.
(+) The palmrests and touchpad are cooler than skin temperature with a maximum of 31.6 °C / 88.9 F and are therefore cool to the touch.
(-) The average temperature of the palmrest area of similar devices was 27.8 °C / 82 F (-3.8 °C / -6.9 F).
Speakers
The speakers of the HP ZBook 15u G6 have an average volume and are relatively well balanced. While users will have to make do without strong bass frequencies, the HP workstation is good enough for the occasional multimedia use. We would still recommend using headphones or external speakers in the long run, which can easily be connected to the ZBook 15u G6 via its 3.5 mm audio jack.
HP ZBook 15u G6 6TP54EA audio analysis
(±) | speaker loudness is average but good (76.9 dB)
Bass 100 - 315 Hz
(-) | nearly no bass - on average 17.7% lower than median
(±) | linearity of bass is average (12.6% delta to prev. frequency)
Mids 400 - 2000 Hz
(+) | balanced mids - only 3.2% away from median
(+) | mids are linear (5.9% delta to prev. frequency)
Highs 2 - 16 kHz
(+) | balanced highs - only 2.6% away from median
(+) | highs are linear (6.3% delta to prev. frequency)
Overall 100 - 16.000 Hz
(±) | linearity of overall sound is average (18.7% difference to median)
Compared to same class
» 56% of all tested devices in this class were better, 10% similar, 35% worse
» The best had a delta of 7%, average was 18%, worst was 35%
Compared to all devices tested
» 37% of all tested devices were better, 8% similar, 55% worse
» The best had a delta of 4%, average was 25%, worst was 134%
Apple MacBook 12 (Early 2016) 1.1 GHz audio analysis
(+) | speakers can play relatively loud (83.6 dB)
Bass 100 - 315 Hz
(±) | reduced bass - on average 11.3% lower than median
(±) | linearity of bass is average (14.2% delta to prev. frequency)
Mids 400 - 2000 Hz
(+) | balanced mids - only 2.4% away from median
(+) | mids are linear (5.5% delta to prev. frequency)
Highs 2 - 16 kHz
(+) | balanced highs - only 2% away from median
(+) | highs are linear (4.5% delta to prev. frequency)
Overall 100 - 16.000 Hz
(+) | overall sound is linear (10.2% difference to median)
Compared to same class
» 5% of all tested devices in this class were better, 2% similar, 93% worse
» The best had a delta of 5%, average was 19%, worst was 53%
Compared to all devices tested
» 3% of all tested devices were better, 1% similar, 96% worse
» The best had a delta of 4%, average was 25%, worst was 134%
Energy Management - ZBook 15u G6 has higher power consumption
Power Consumption
Our measurements confirm that the ZBook 15u G6 has a minimum power consumption of 5.5 W while idling and a maximum consumption of 70 W under load. This means that our test unit's energy needs are higher than those of the HP ZBook 15u G5 while idling, but a little lower under load. The maximum consumption of 70 W is only very short-lived and then stabilizes at around 61 W.
HP has included a 65-Watt power supply.
| Off / Standby | |
| Idle | |
| Load |
|
| HP ZBook 15u G6 6TP54EA i7-8565U, Radeon Pro WX 3200, Samsung SSD PM981 MZVLB512HAJQ, IPS, 3840x2160, 15.60 | HP ZBook 15u G5 2ZC05EA i5-8550U, Radeon Pro WX 3100, Toshiba XG5 KXG50ZNV256G, IPS LED, 1920x1080, 15.60 | Dell Latitude 5420 Rugged-P85G i7-8650U, Radeon RX 540, SK hynix PC401 NVMe 500 GB, IPS, 1920x1080, 14.00 | Acer Swift 3 SF314-55G-768V i7-8565U, GeForce MX250, WDC PC SN520 SDAPNUW-512G, IPS, 1920x1080, 14.00 | Lenovo ThinkPad P1 2019-20QT000RGE i7-9850H, Quadro T1000 (Laptop), WDC PC SN720 SDAQNTW-512G, IPS LED, 1920x1080, 15.60 | Fujitsu Celsius H780 i7-8850H, Quadro P2000, Samsung SSD PM981 MZVLB512HAJQ, IPS LED, 1920x1080, 15.60 | Average AMD Radeon Pro WX 3200 | Average of class Workstation | |
|---|---|---|---|---|---|---|---|---|
| Power Consumption | 17% | -21% | 9% | -82% | -59% | 5% | -64% | |
| Idle Minimum * | 5.5 | 3.2 42% | 4.8 13% | 7.4 -35% | 13.7 -149% | 9.1 -65% | 4.85 ? 12% | 7.82 ? -42% |
| Idle Average * | 9.8 | 6.1 38% | 13.6 -39% | 9.9 -1% | 17.5 -79% | 13.2 -35% | 8.87 ? 9% | 12.7 ? -30% |
| Idle Maximum * | 12 | 9.7 19% | 13.8 -15% | 11.7 2% | 20.9 -74% | 14.04 -17% | 11.5 ? 4% | 18.7 ? -56% |
| Load Average * | 59 | 62 -5% | 67.8 -15% | 29 51% | 77.2 -31% | 78.8 -34% | 59.1 ? -0% | 96.5 ? -64% |
| Witcher 3 ultra * | 51 | 48 6% | 69.1 -35% | |||||
| Load Maximum * | 70 | 71 -1% | 93.5 -34% | 52 26% | 123.7 -77% | 172.5 -146% | 70.3 ? -0% | 158.9 ? -127% |
* ... smaller is better
Battery Life
HP has equipped the ZBook 15u G6 with the same size battery as its predecessor ZBook 15u G6. The battery life is lower mainly due to the 4K screen, which causes the workstation to need to be reconnected to an external power supply after only seven hours of our realistic Wi-Fi test. Running the device at maximum brightness takes another hour off the battery life. Users should expect about half the battery life of the ZBook 15u G5 with a Full HD panel.
| HP ZBook 15u G6 6TP54EA i7-8565U, Radeon Pro WX 3200, 56 Wh | HP ZBook 15u G5 2ZC05EA i5-8550U, Radeon Pro WX 3100, 56 Wh | Dell Latitude 5420 Rugged-P85G i7-8650U, Radeon RX 540, 102 Wh | Acer Swift 3 SF314-55G-768V i7-8565U, GeForce MX250, 50.7 Wh | Lenovo ThinkPad P1 2019-20QT000RGE i7-9850H, Quadro T1000 (Laptop), 80 Wh | Fujitsu Celsius H780 i7-8850H, Quadro P2000, 96 Wh | Average of class Workstation | |
|---|---|---|---|---|---|---|---|
| Battery Runtime | 47% | 108% | 7% | -8% | 8% | -6% | |
| Reader / Idle | 745 | 1301 75% | 1882 153% | 968 30% | 700 ? -6% | ||
| WiFi v1.3 | 415 | 514 24% | 972 134% | 484 17% | 532 28% | 450 8% | 541 ? 30% |
| Load | 140 | 200 43% | 190 36% | 104 -26% | 79 -44% | 81.3 ? -42% |
Pros
Cons
Verdict - only in some circumstances may this hardware upgrade warrant a switch

The HP ZBook 15u G6 only offers a slight increase in performance compared to its predecessor. We were particularly disappointed by the CPU performance compared to the ZBook 15u G5. The AMD Radeon Pro WX 3200 GPU, on the other hand, has a better performance and the included storage device also does well in benchmarks. We were particularly impressed by the 4K display, which offers high luminosity, vivid colors and a very good contrast ratio. The matte surface makes it possible for users to use the device outdoors without having to deal with bothersome reflections.
HP has not made a lot of changes to the ZBook 15u G6. While we are a little disappointed by the hardware upgrade, the 4K screen is great.
As the innovations are limited to the insides of the ZBook 15u G6, buyers will receive the usual high-quality case and very good input devices. The middling port selection can easily be expanded thanks to a Thunderbolt 3 port and the Wi-Fi speeds are fast on this HP workstation. This even makes the lack of maintenance options more easily acceptable. Users who are already using the ZBook 15u G5 will only benefit from switching to its successor if the better graphics performance impacts their everyday use.
HP ZBook 15u G6 6TP54EA
-
10/08/2019 v7
Mike Wobker


Pricecompare

