

Schenker XMG Core 15 (Tongfang GM5NG0O) in review: A lot of performance for the fast WQHD panel

The Schenker XMG Core 15 is a lower high-end gaming laptop. It's powered by a Ryzen 7 4800H APU and a GeForce RTX 3060 laptop GPU. Competitors include devices like the Asus TUF Dash F15 FX516PR, the Aorus 15G XC, the HP Omen 15, and the Acer Predator Triton 300 PT315-52.
Possible contenders in comparison
Rating | Date | Model | Weight | Height | Size | Resolution | Price |
|---|---|---|---|---|---|---|---|
| 84.9 % v7 (old) | 03 / 2021 | SCHENKER XMG Core 15 Ampere R7 4800H, GeForce RTX 3060 Laptop GPU | 2 kg | 22.9 mm | 15.60" | 2560x1440 | |
| 82.4 % v7 (old) | 02 / 2021 | Asus TUF Dash F15 FX516PR i7-11370H, GeForce RTX 3070 Laptop GPU | 2 kg | 20 mm | 15.60" | 1920x1080 | |
| 86.4 % v7 (old) | 02 / 2021 | Aorus 15G XC i7-10870H, GeForce RTX 3070 Laptop GPU | 2.1 kg | 23 mm | 15.60" | 1920x1080 | |
| 82.8 % v7 (old) | 01 / 2021 | HP Omen 15-en0375ng R7 4800H, GeForce RTX 2060 Mobile | 2.2 kg | 23 mm | 15.60" | 1920x1080 | |
| 82.1 % v7 (old) | 12 / 2020 | Acer Predator Triton 300 PT315-52-79LP i7-10750H, GeForce RTX 2060 Mobile | 2.1 kg | 19.9 mm | 15.60" | 1920x1080 |
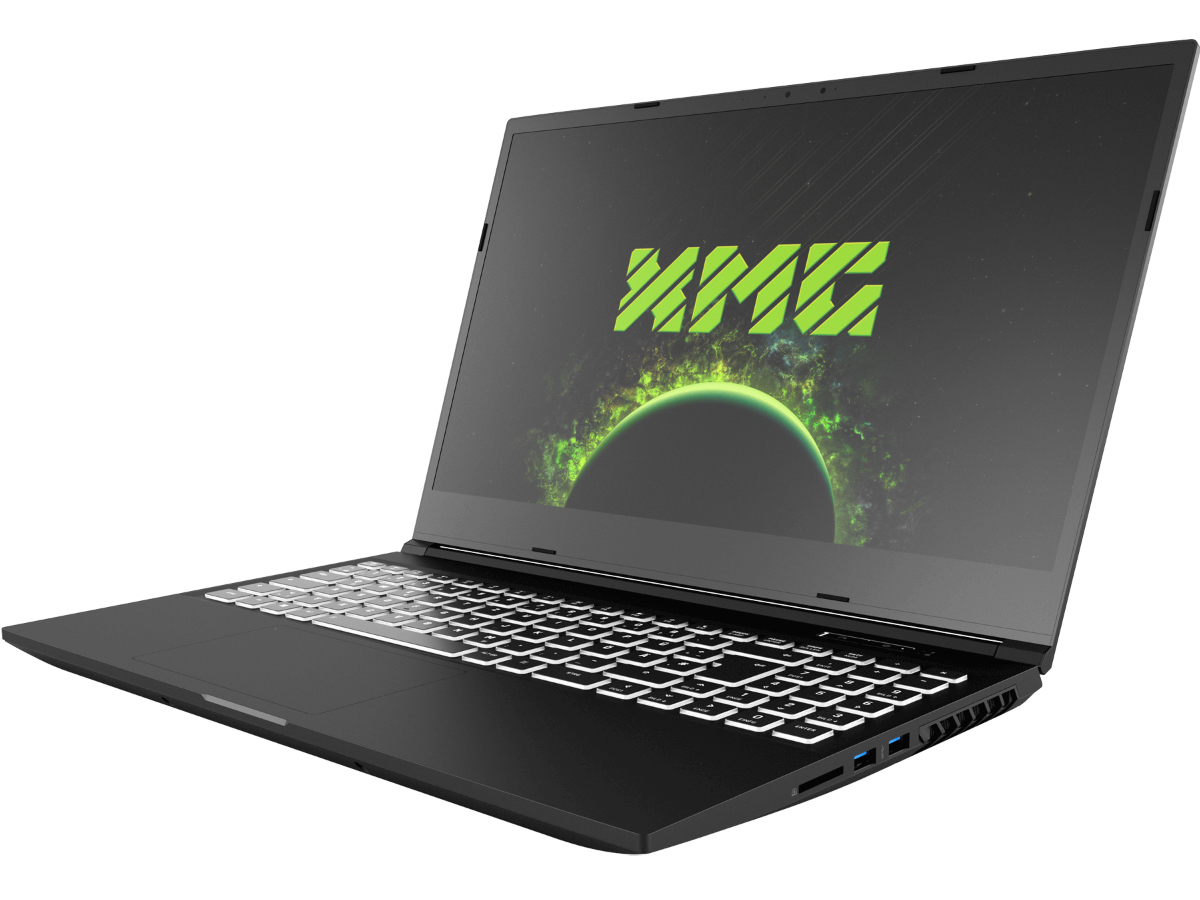
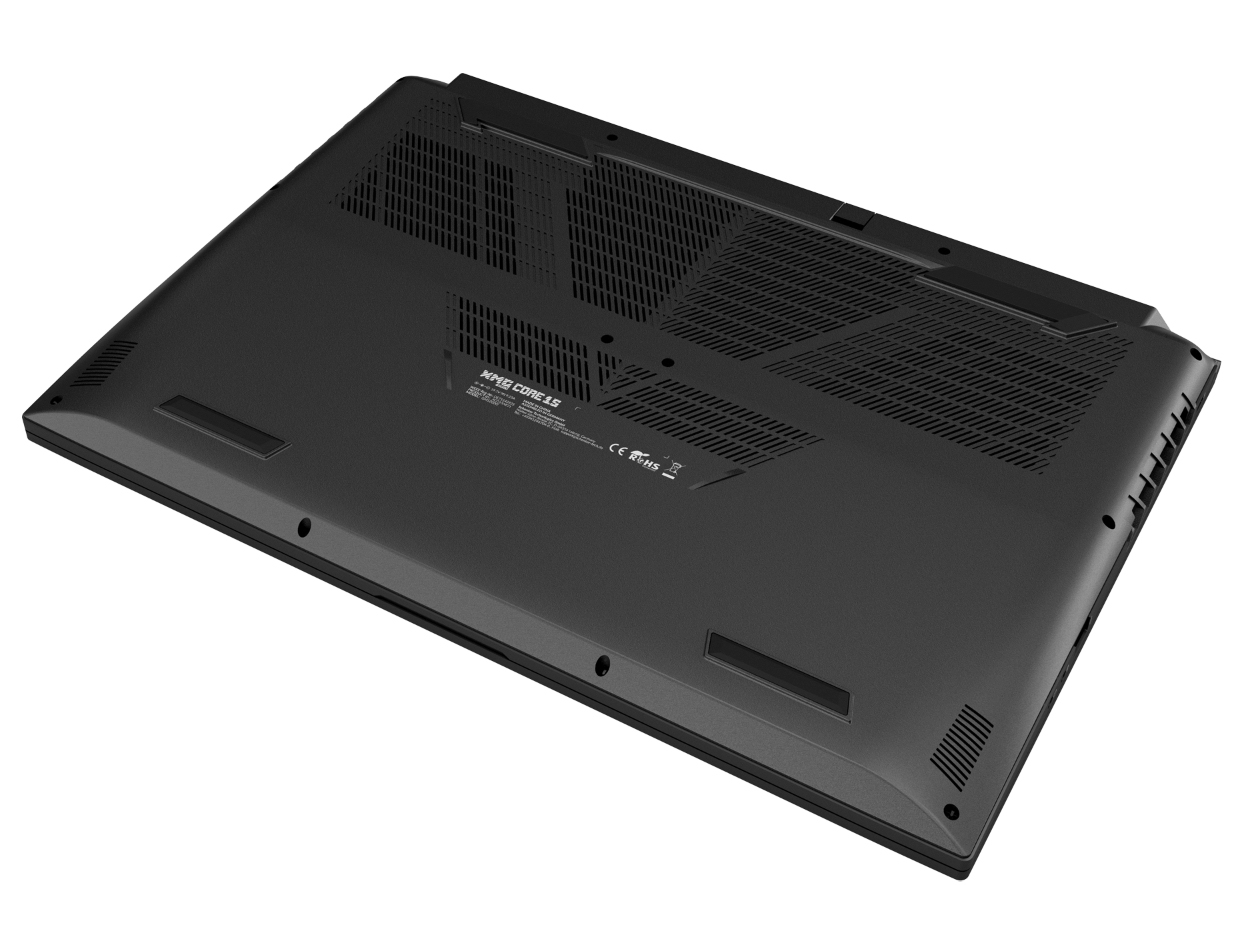
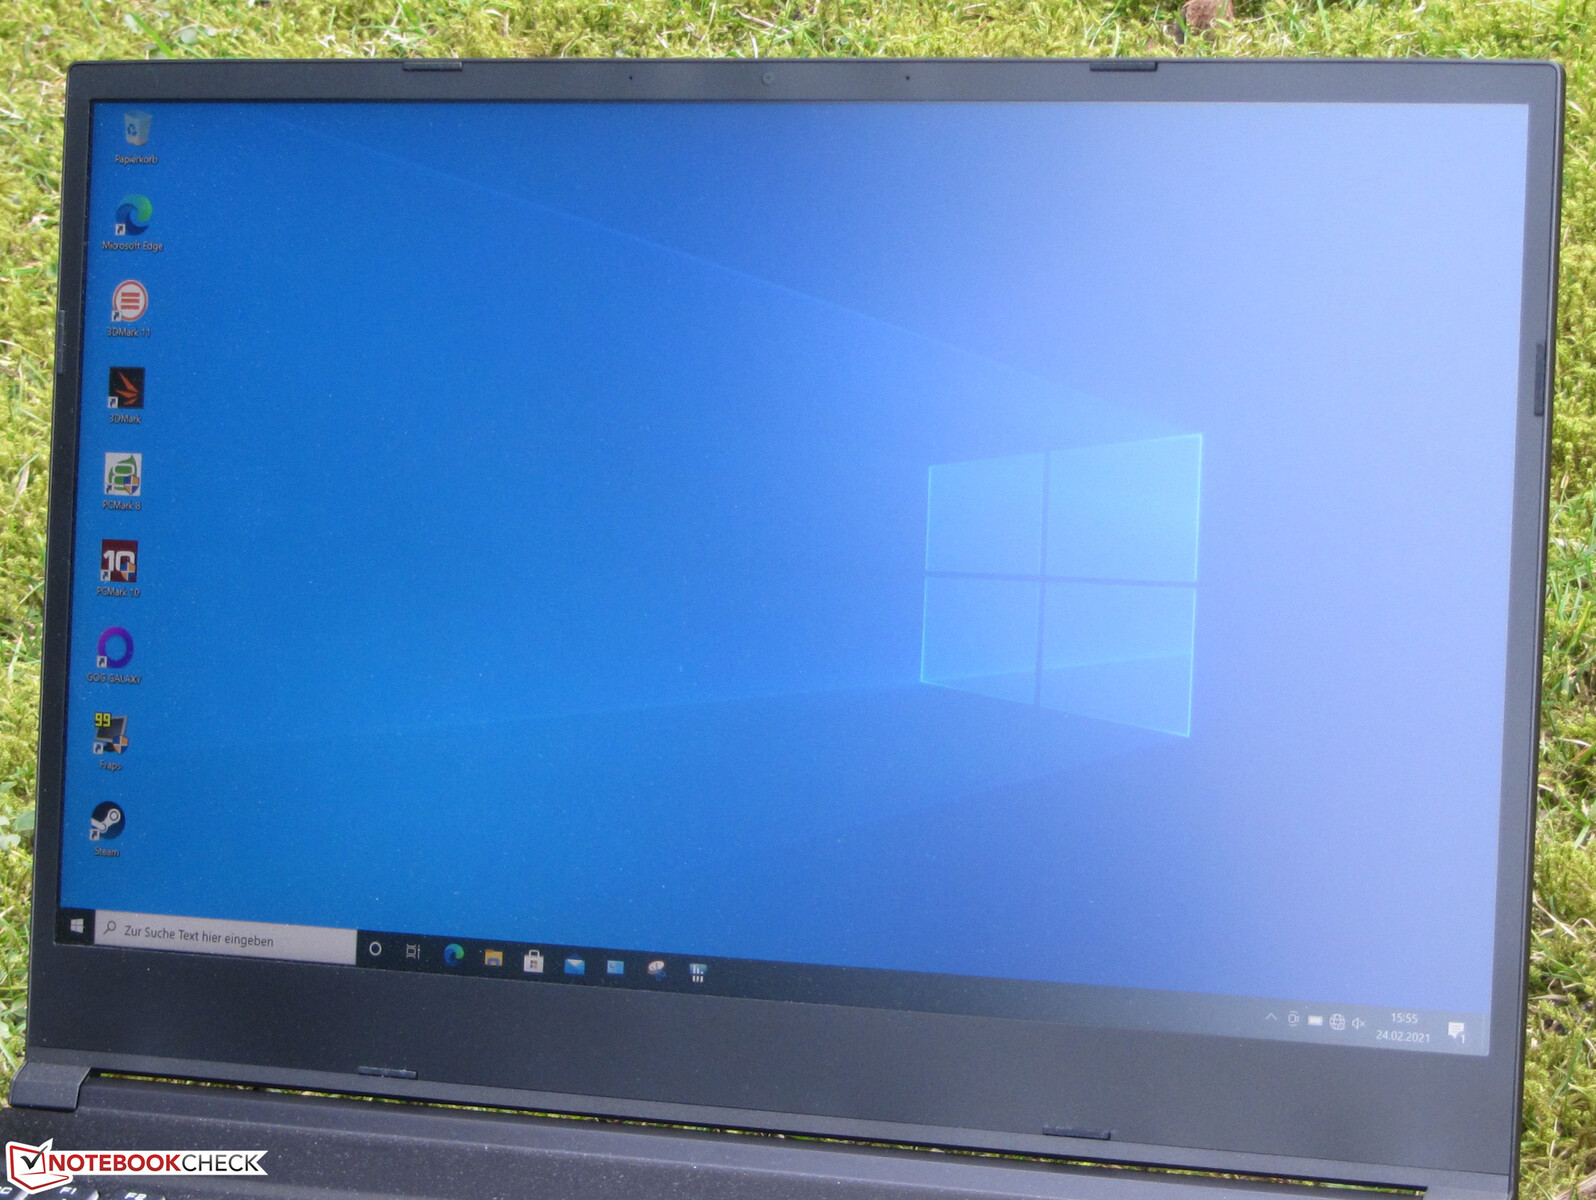
Case - Core 15 chassis made of aluminum and plastic
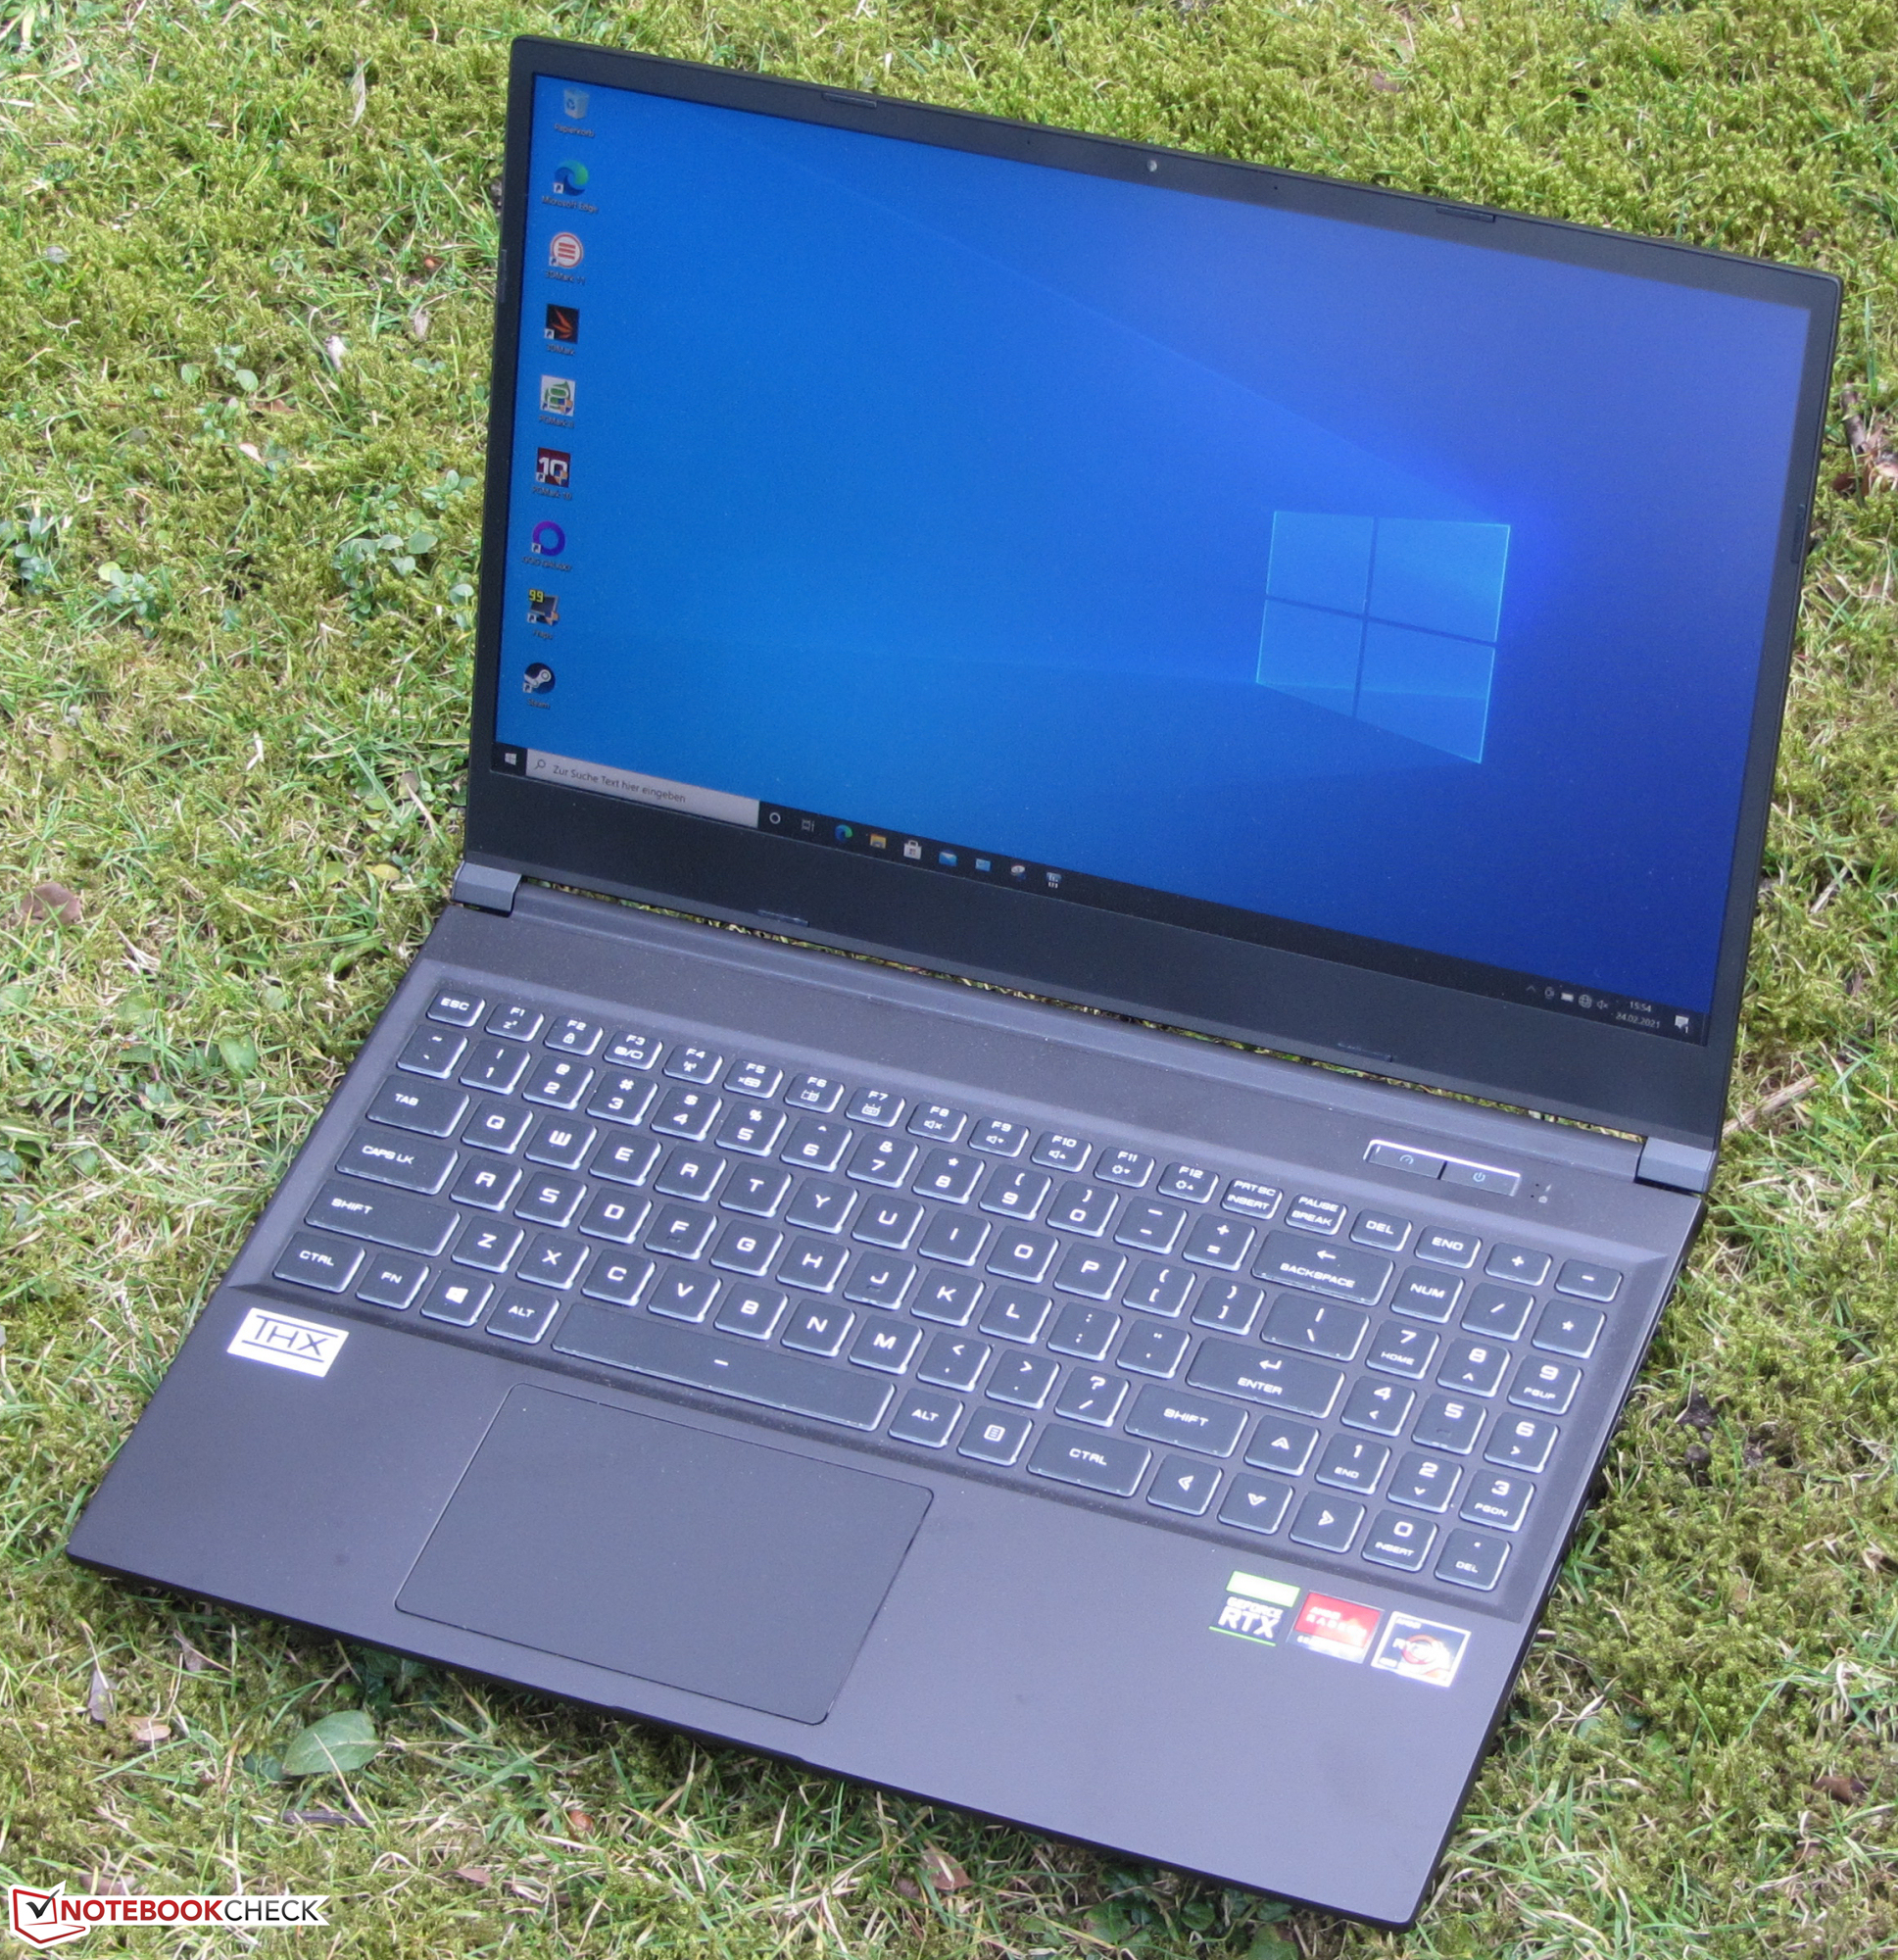
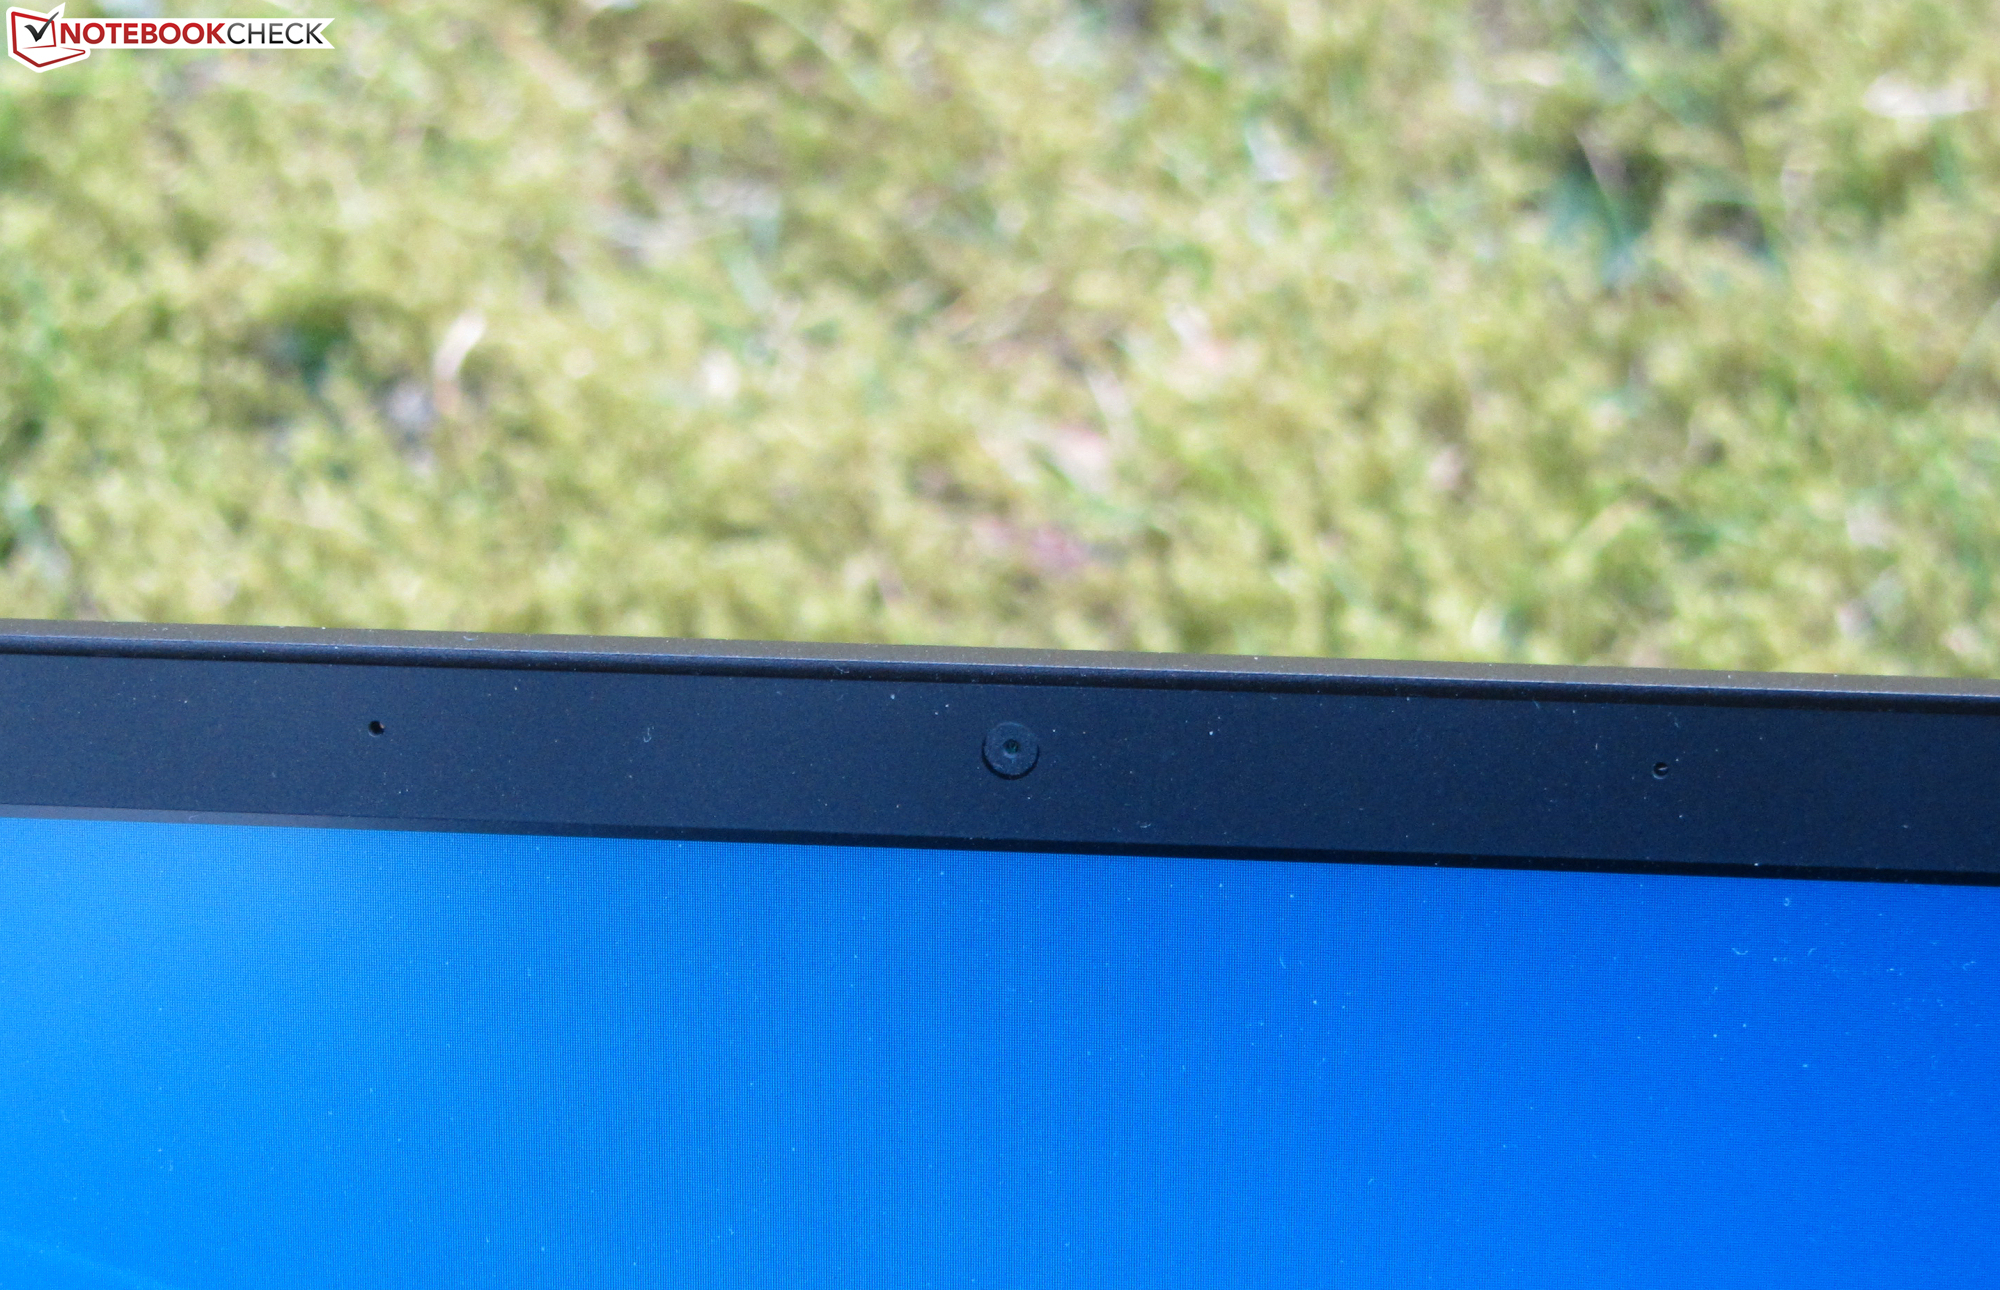
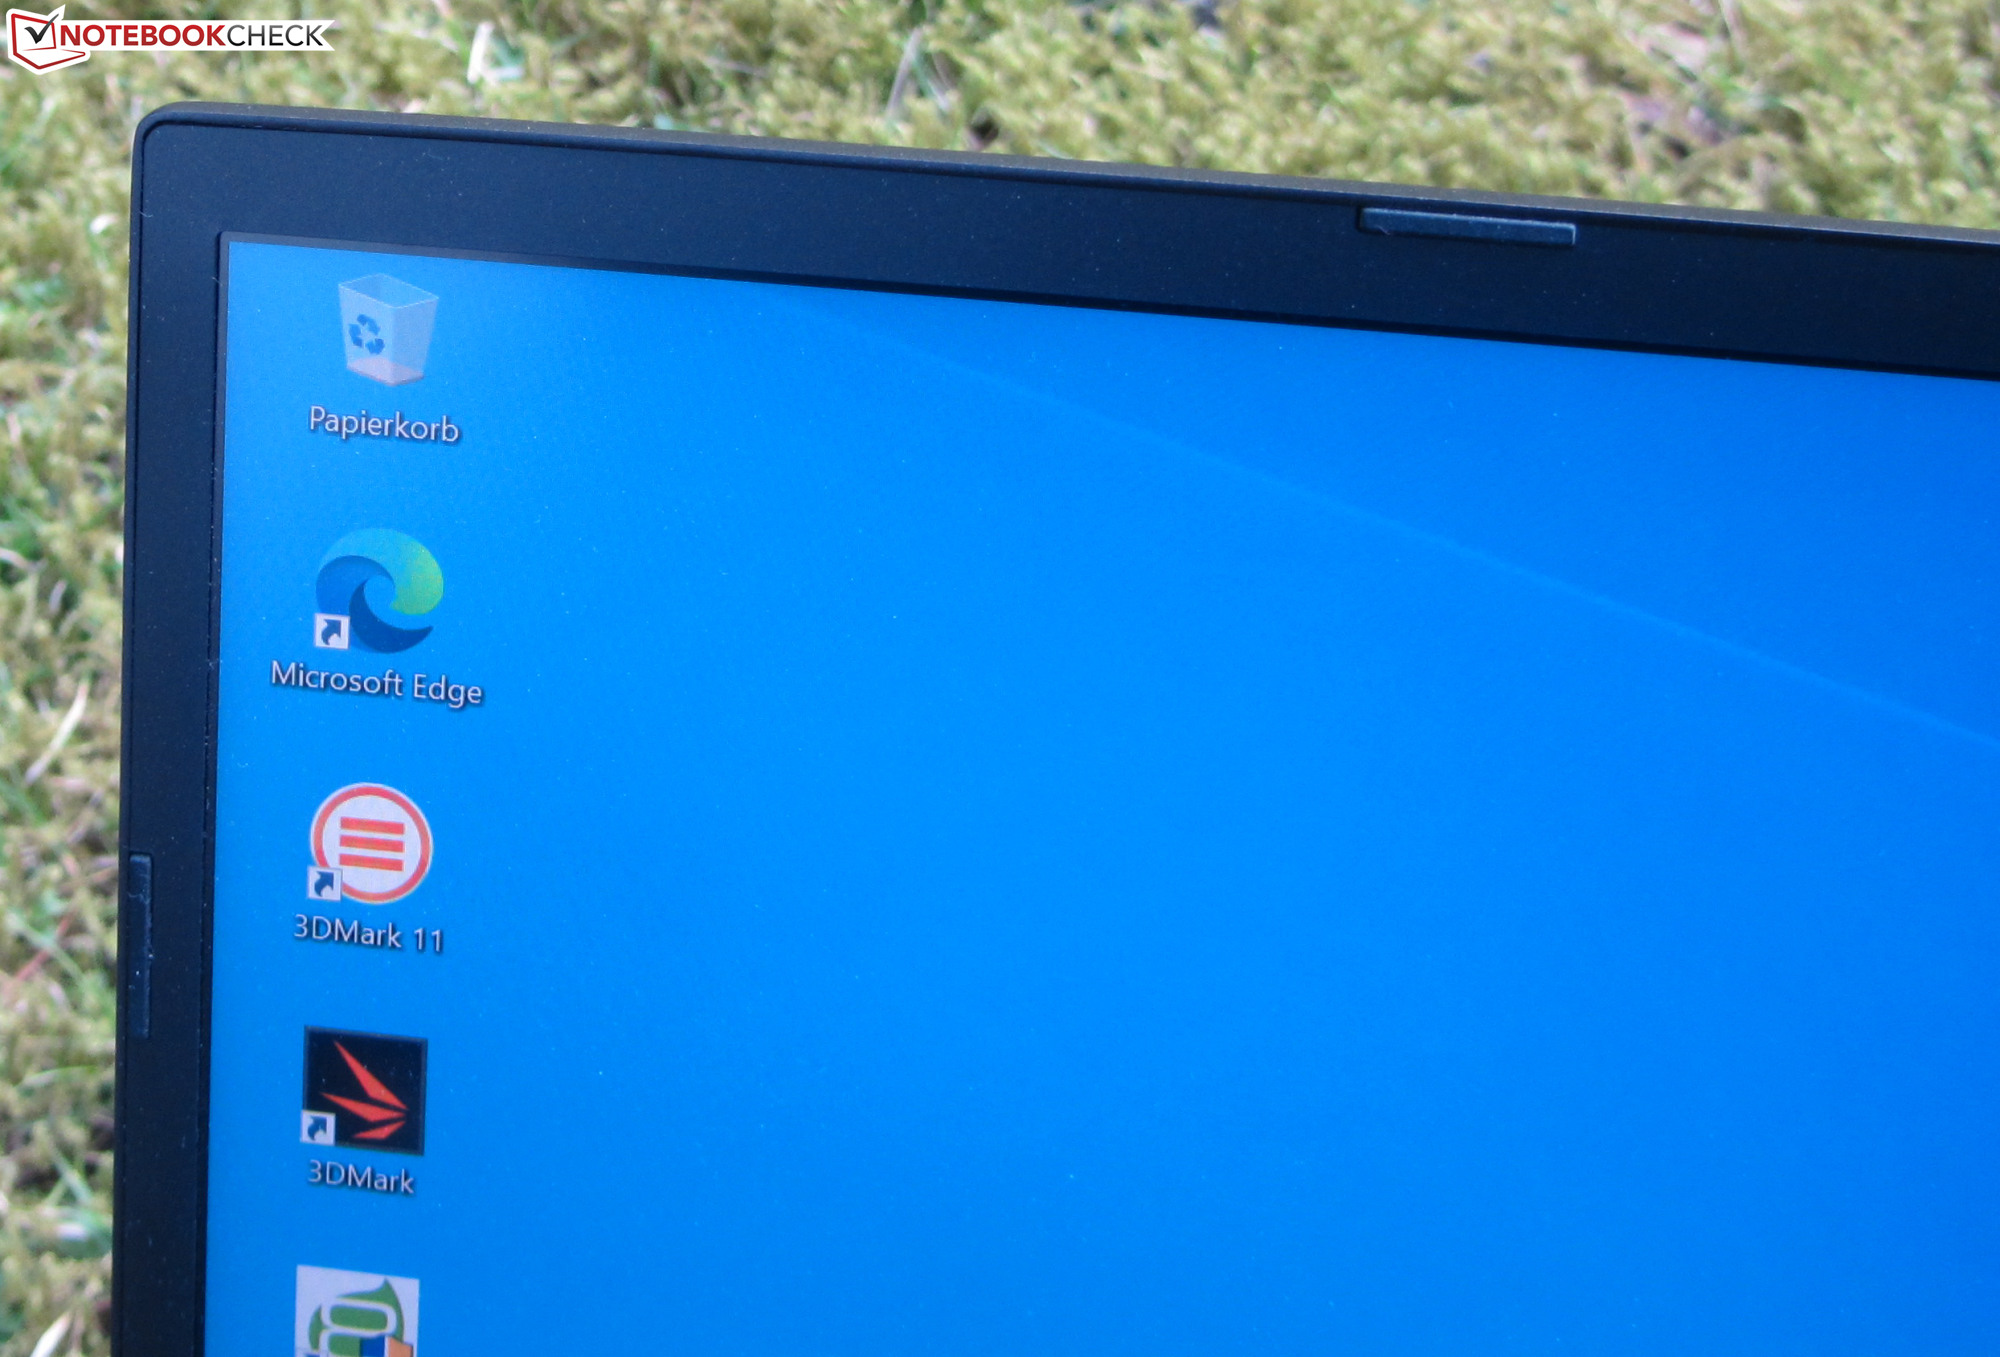
Schenker has opted for a discreet exterior in the 2021 model - just like in the predecessors. This allows the laptop to be used in business environments as well. The differences to the 2020 model are marginal. Most noticeable: The webcam of the 2021 model has moved back to its usual position above the display (2020 model: below the display). The top of the base unit and the back of the lid of the all-black chassis are made of aluminum, while the rest of the components are made of plastic. The laptop doesn't have a maintenance hatch, and the battery is permanently is firmly built into the device.
The laptop doesn't reveal any manufacturing flaws. The gap dimensions are in order, and there are no material protrusions. There's nothing to criticize in terms of stability, either. The rigid base unit can be twisted minimally at best, and the whole situation is completely within limits when it comes to the lid. The hinges keep the lid firmly in position, but they let it wobble a bit. Moreover, the maximum aperture angle is 135 degrees, and opening the lid with one hand is possible.

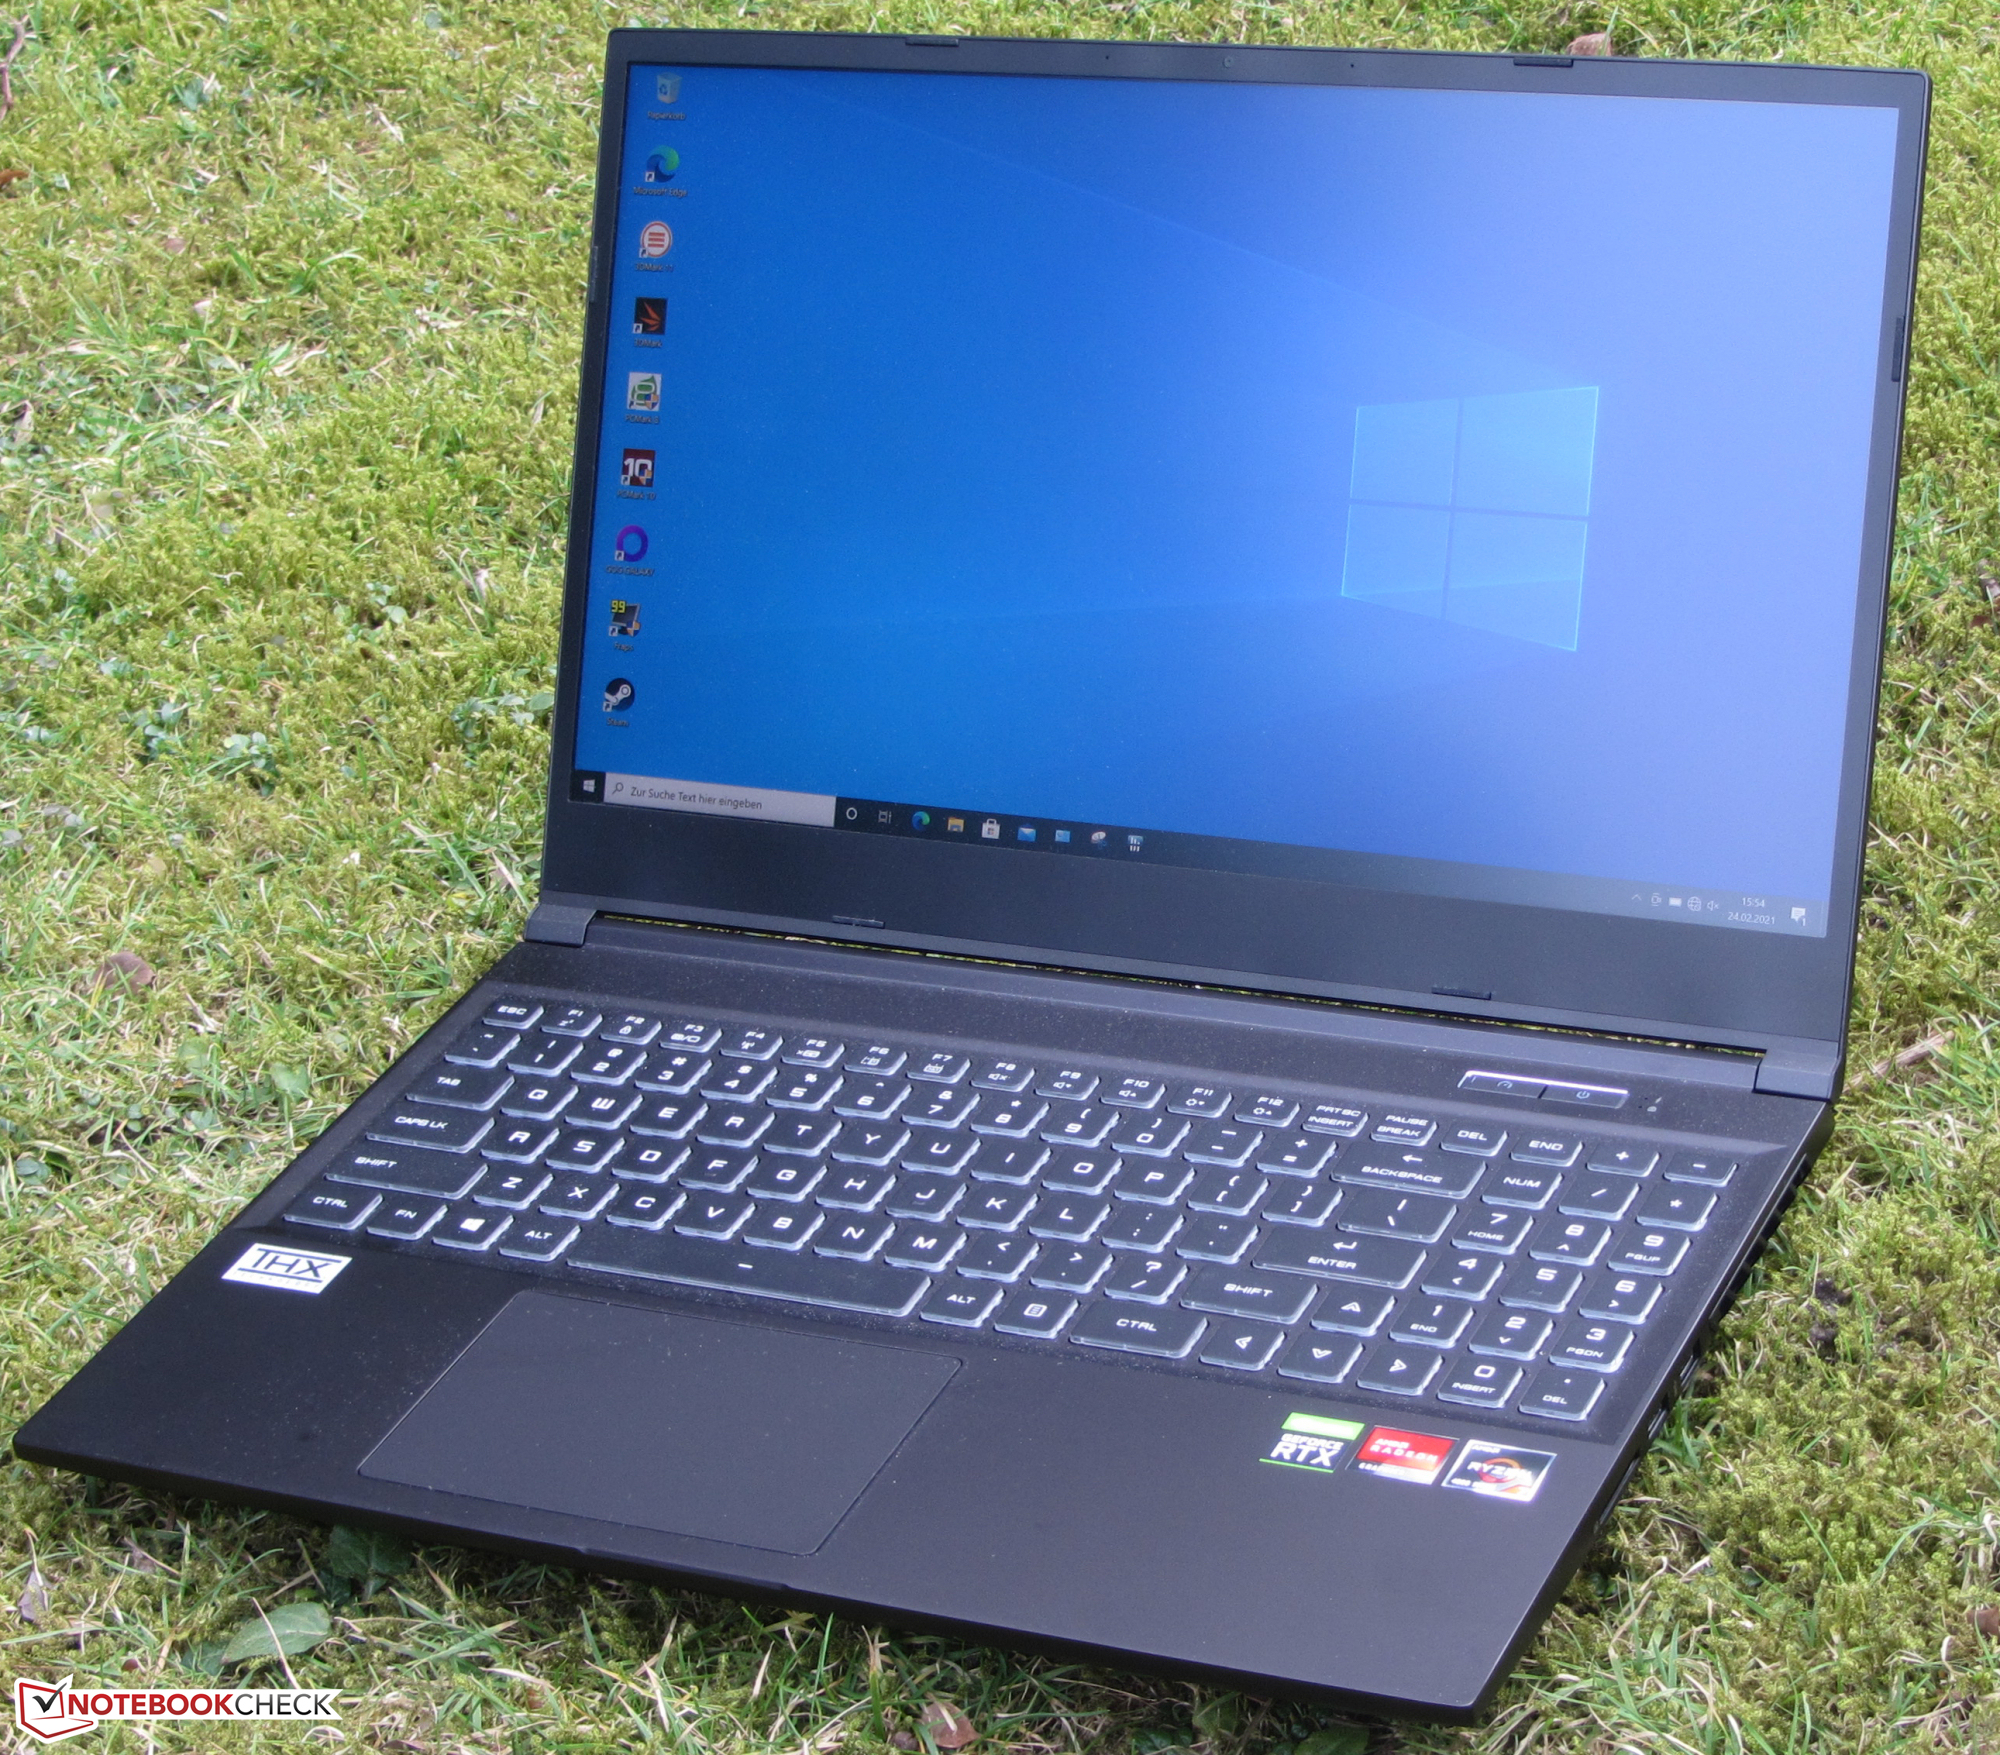
Within our comparison field, the Core 15 is one of the lightest and most compact devices.
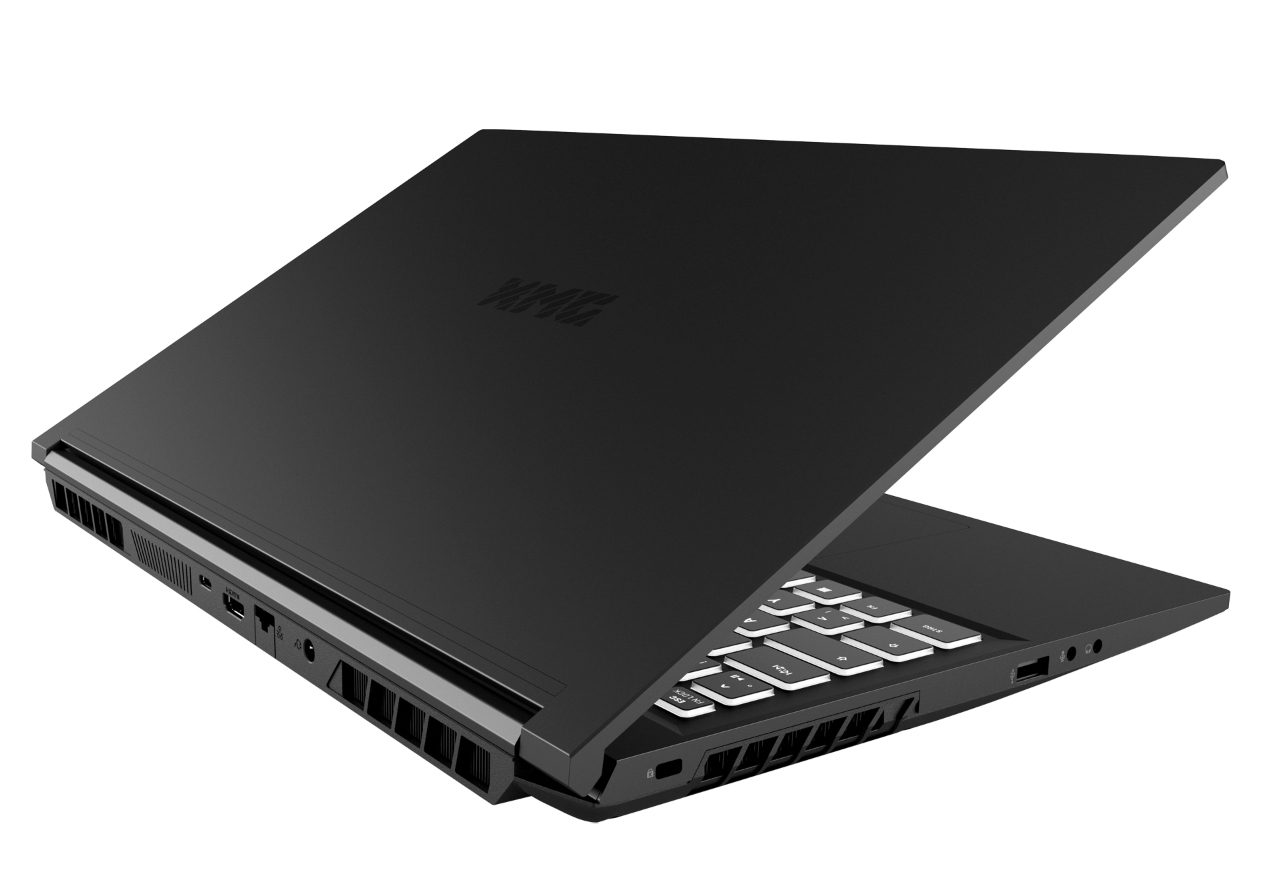
Connectivity - Schenker laptop without Thunderbolt
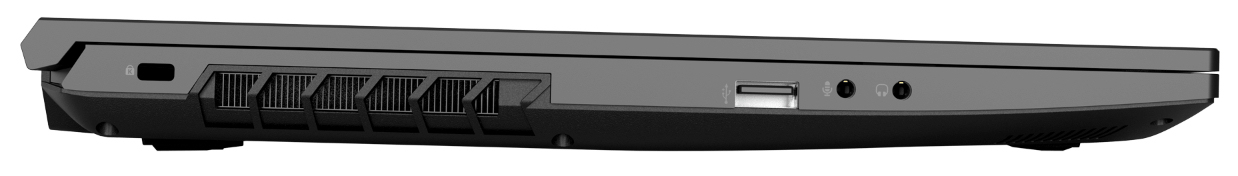
The Core 15 comes with a total of three USB Type-A ports (2x USB 3.2 Gen 1, 1x USB 2.0). In addition, there's a USB Type-C port (USB 3.2 Gen 2) that supports DisplayPort via USB-C (version 1.4, G-Sync compatible). Together with the HDMI connection (version 2.1), the laptop has, therefore, two video outputs. Connectivity is rounded off by a Gigabit Ethernet port and two audio connections.
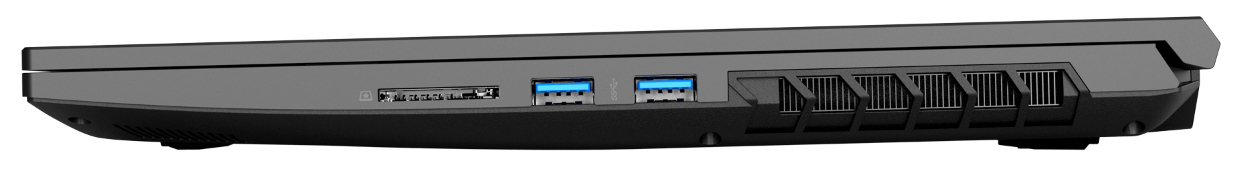

SD card reader
With transfer rates of 82 MB/s (copying of 250 jpg image files of 5 MB each) and 89 MB/s (copying large data blocks), the SD memory card reader (reference card: 64 GB Toshiba Exceria Pro UHS-II SDXC) is a moderately fast model. Furthermore, SD cards protrude a good 17 mm from the card reader.
| SD Card Reader | |
| average JPG Copy Test (av. of 3 runs) | |
| Aorus 15G XC (Toshiba Exceria Pro SDXC 64 GB UHS-II) | |
| Average of class Gaming (20 - 207, n=72, last 2 years) | |
| SCHENKER XMG Core 15 Ampere (Toshiba Exceria Pro SDXC 64 GB UHS-II) | |
| HP Omen 15-en0375ng (Toshiba Exceria Pro SDXC 64 GB UHS-II) | |
| maximum AS SSD Seq Read Test (1GB) | |
| Aorus 15G XC (Toshiba Exceria Pro SDXC 64 GB UHS-II) | |
| Average of class Gaming (25.8 - 261, n=71, last 2 years) | |
| SCHENKER XMG Core 15 Ampere (Toshiba Exceria Pro SDXC 64 GB UHS-II) | |
| HP Omen 15-en0375ng (Toshiba Exceria Pro SDXC 64 GB UHS-II) | |
Communication
The WLAN chip (Intel AX200) supports the 802.11a/b/g/n/ac/ax standard and offers Bluetooth 5 functionality. The data rates determined under optimal conditions (no other WLAN devices nearby, short distance between laptop and server PC) turn out to be excellent. Wired network connections are handled by the Realtek RTL8125 Gigabit Ethernet controller. It performs its tasks smoothly.
Webcam
The webcam (0.9 MP) produces images in a maximum resolution of 1280x720 pixels. There are problems with color accuracy. With a color deviation of almost 14, the target (Delta E less than 3) is missed.


Accessories
Besides warranty information, the laptop comes with a recovery DVD and a mousepad.
Maintenance
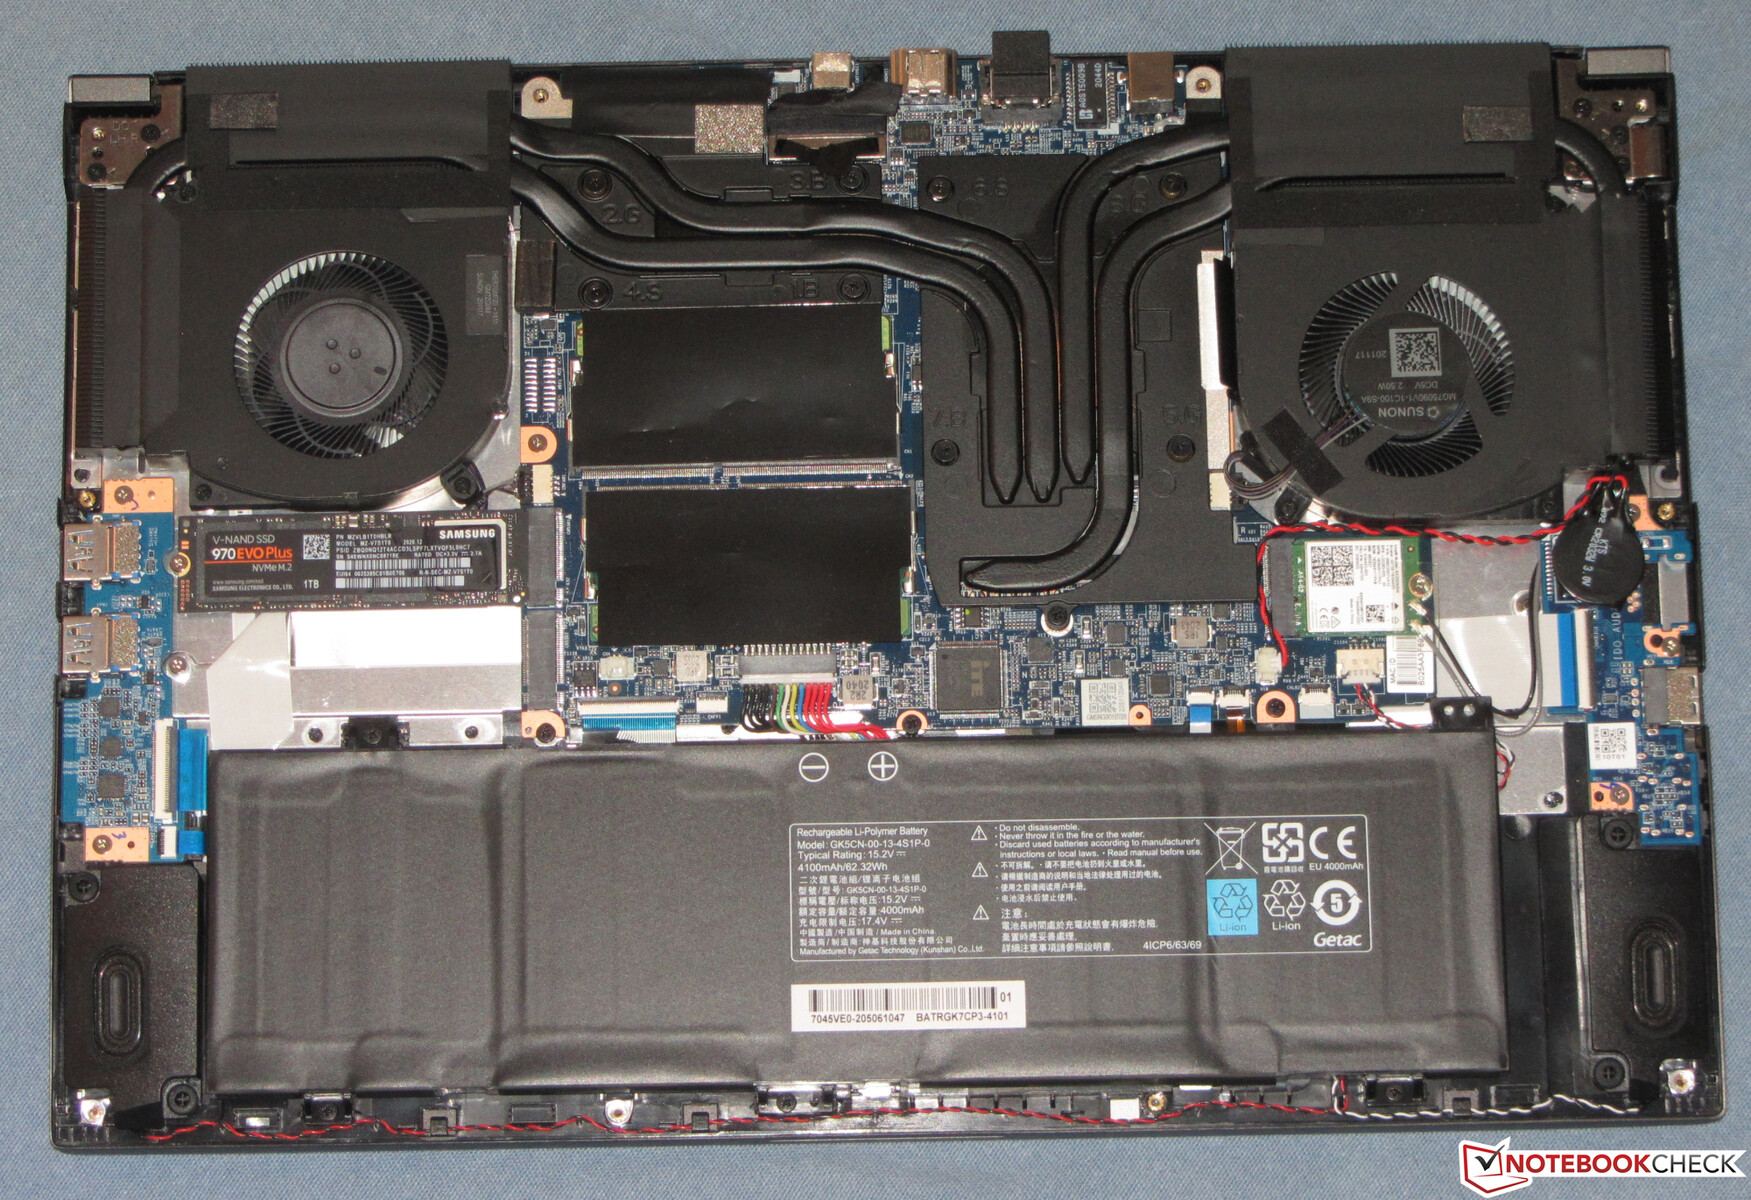
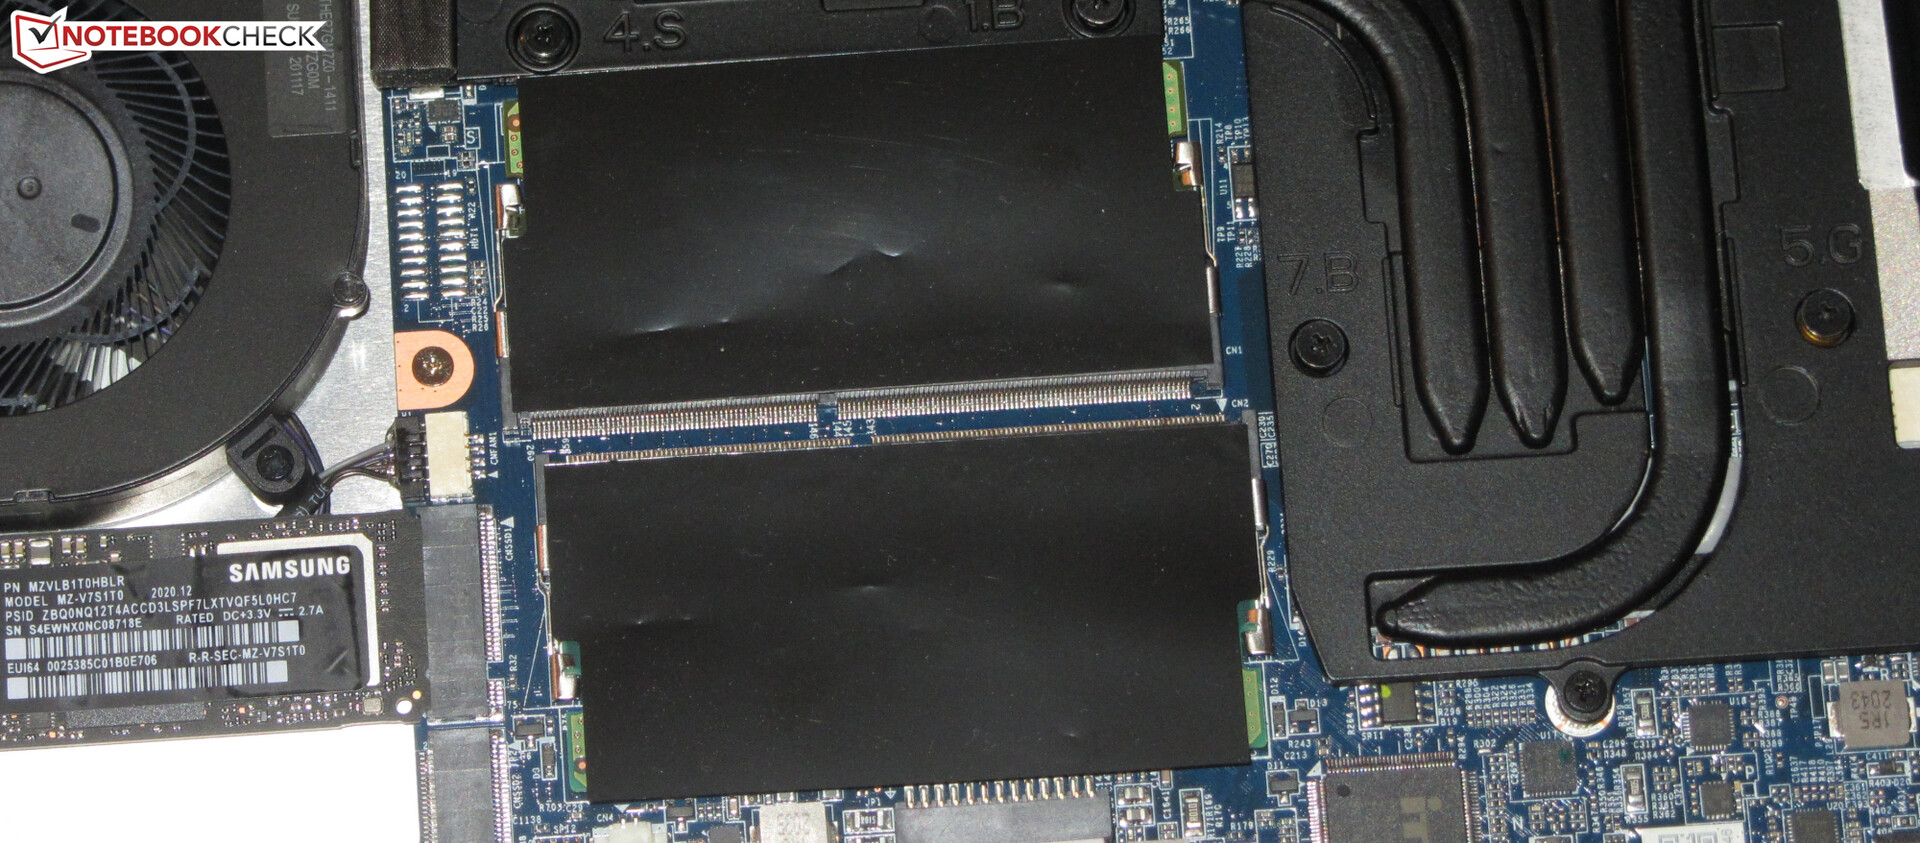
Maintenance and upgrade procedures can be carried out without issues. After removing all screws on the underside of the device, the bottom cover can be lifted off. In the case of our test device, no additional tools were needed for this. Otherwise, a grout finishing tool or a flat spatula can help.
Warranty
The base warranty is two years - including pick-up service and a six-month quick repair program (repairs within 48 hours). A 36-month warranty costs 80 to 119 Euros (~$95 to ~$141) - depending on the selected quick-repair period.
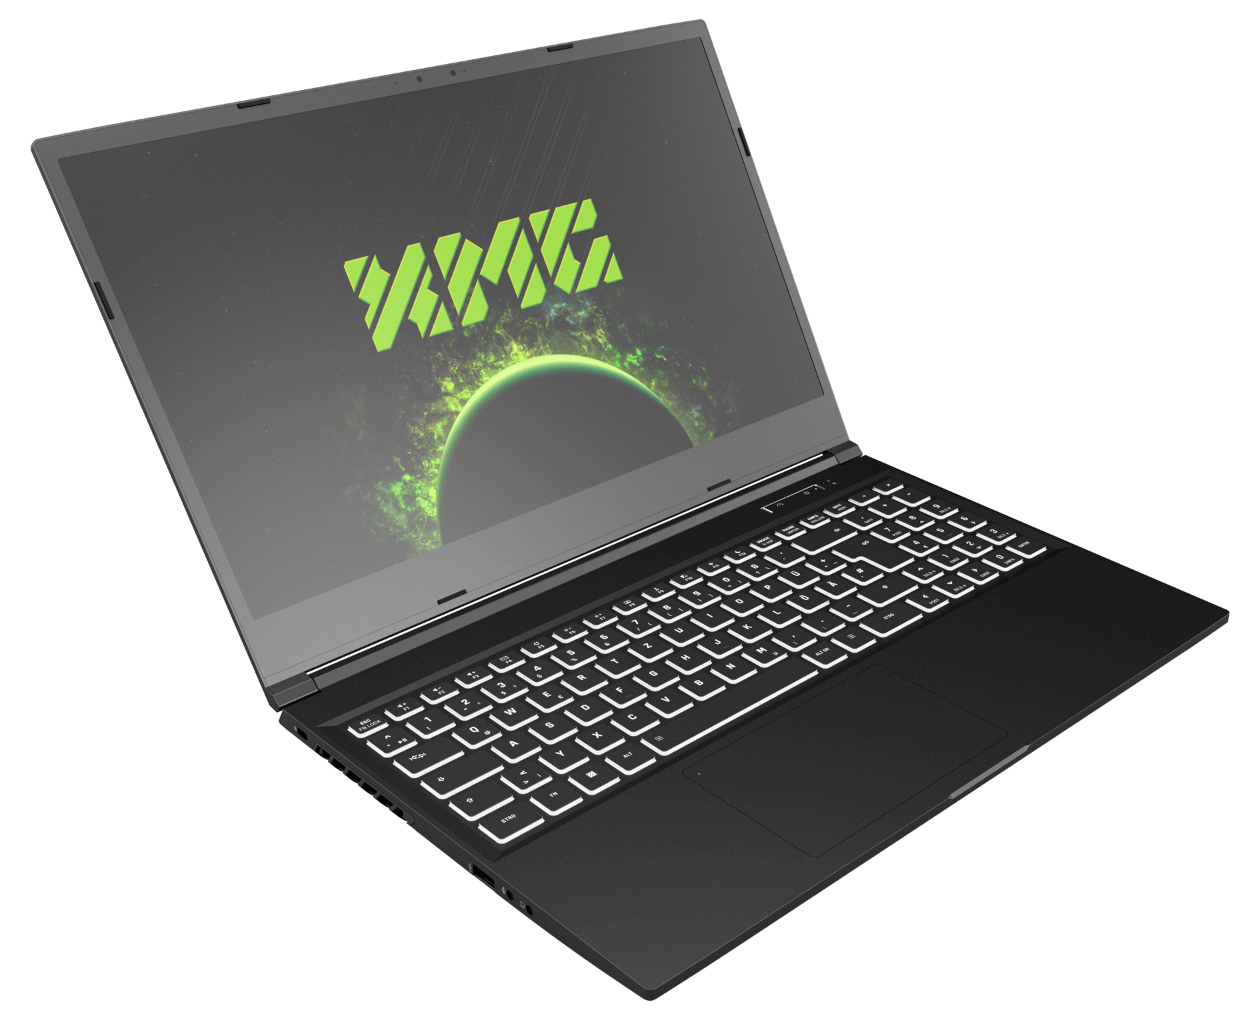
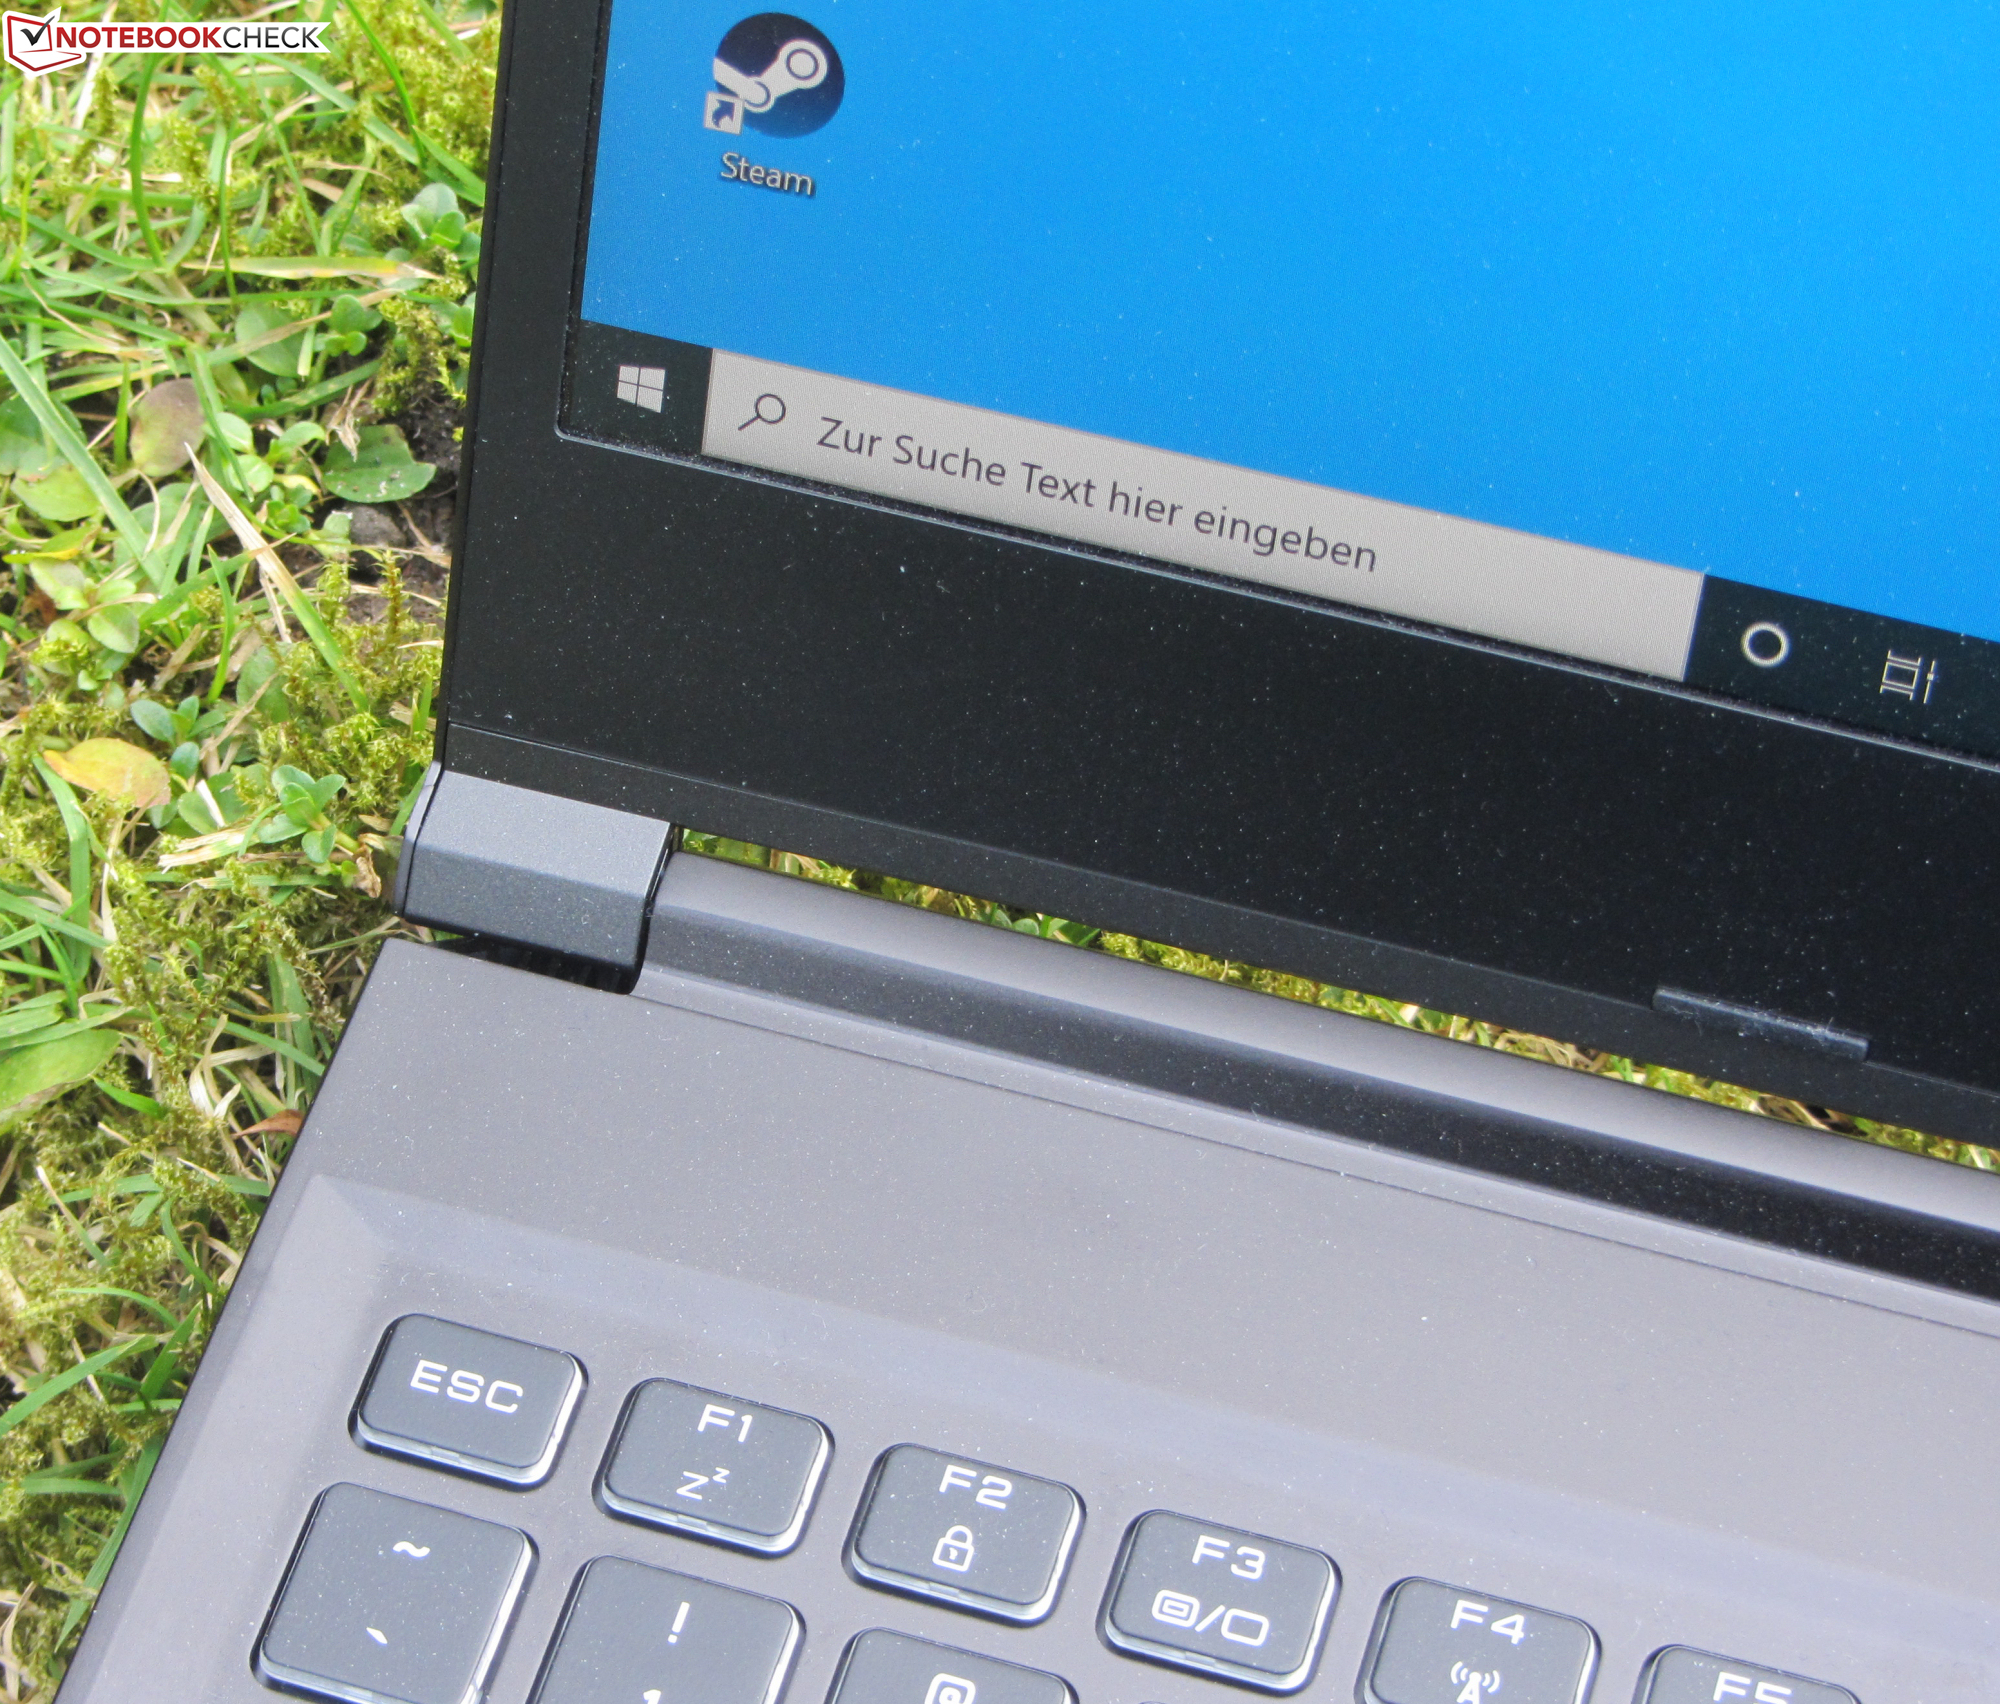
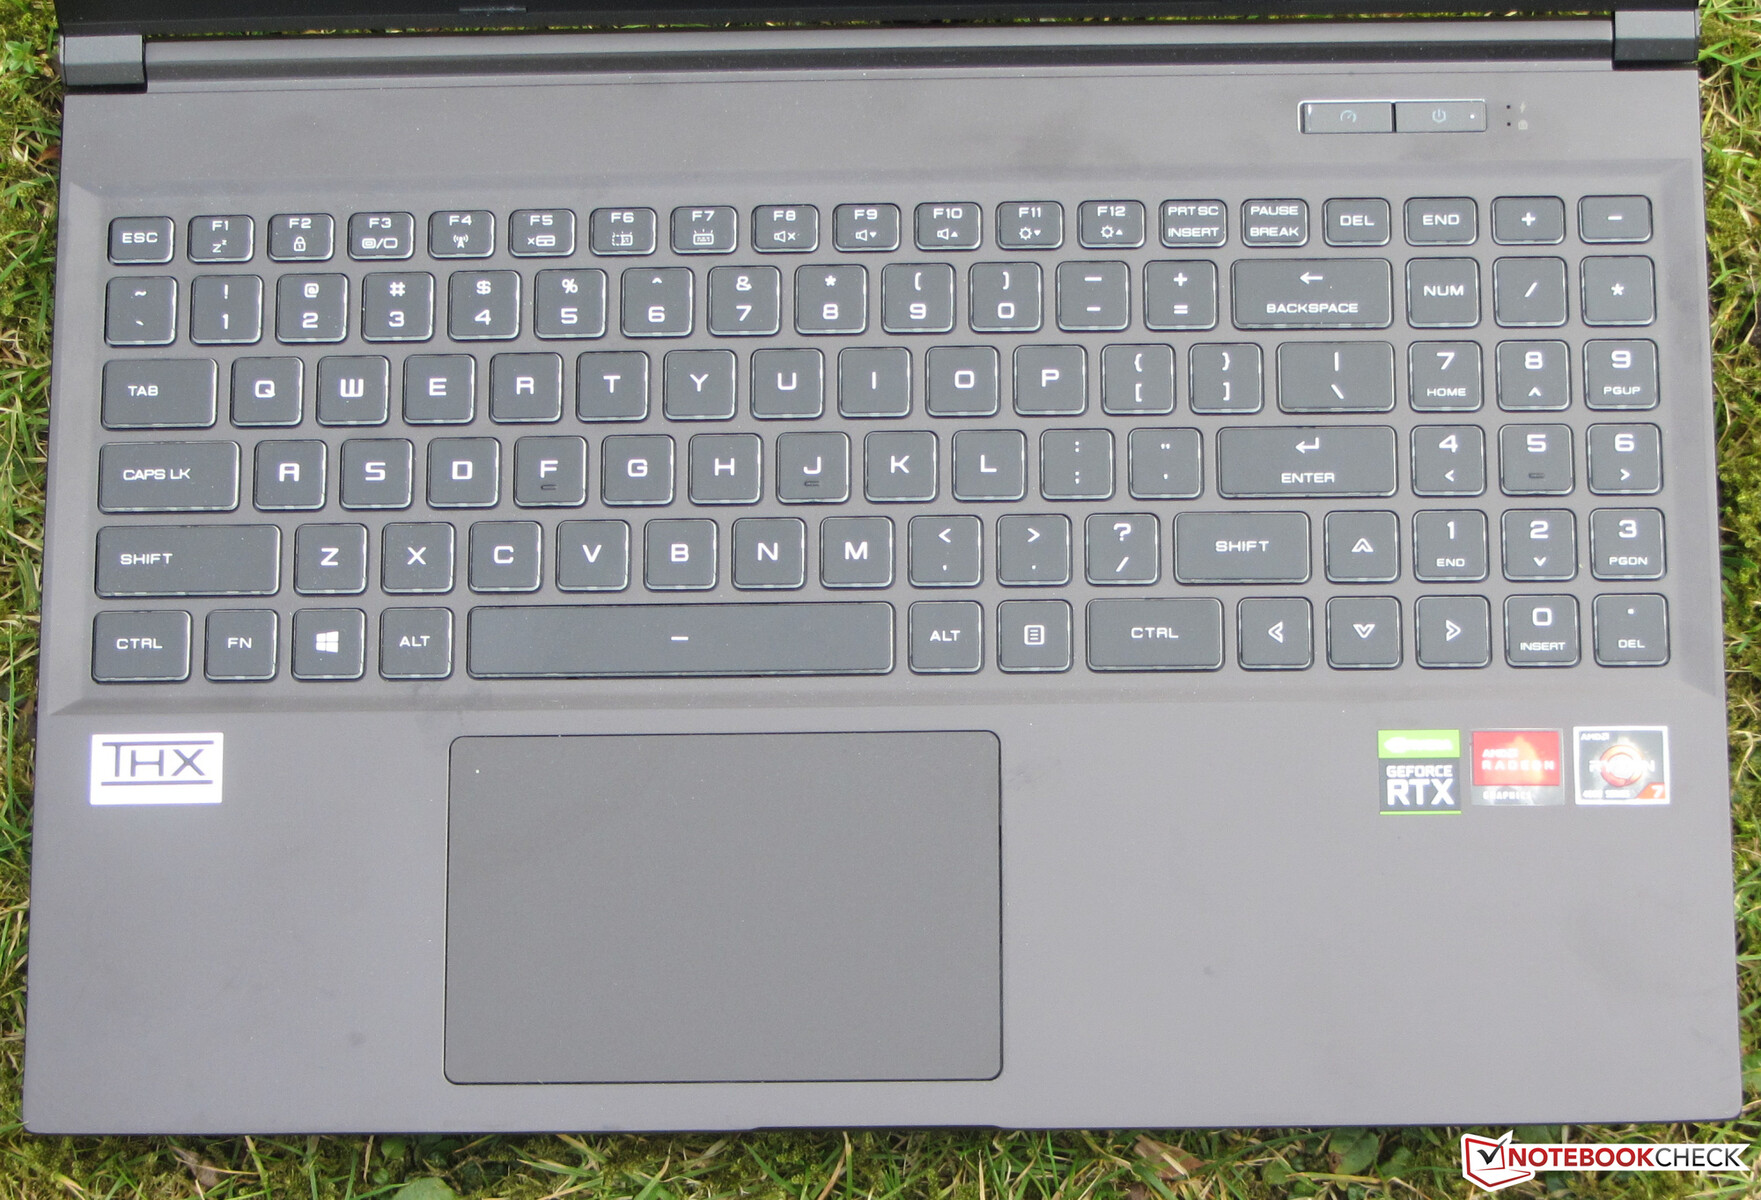
Input devices - Schenker installs a backlit keyboard
Keyboard
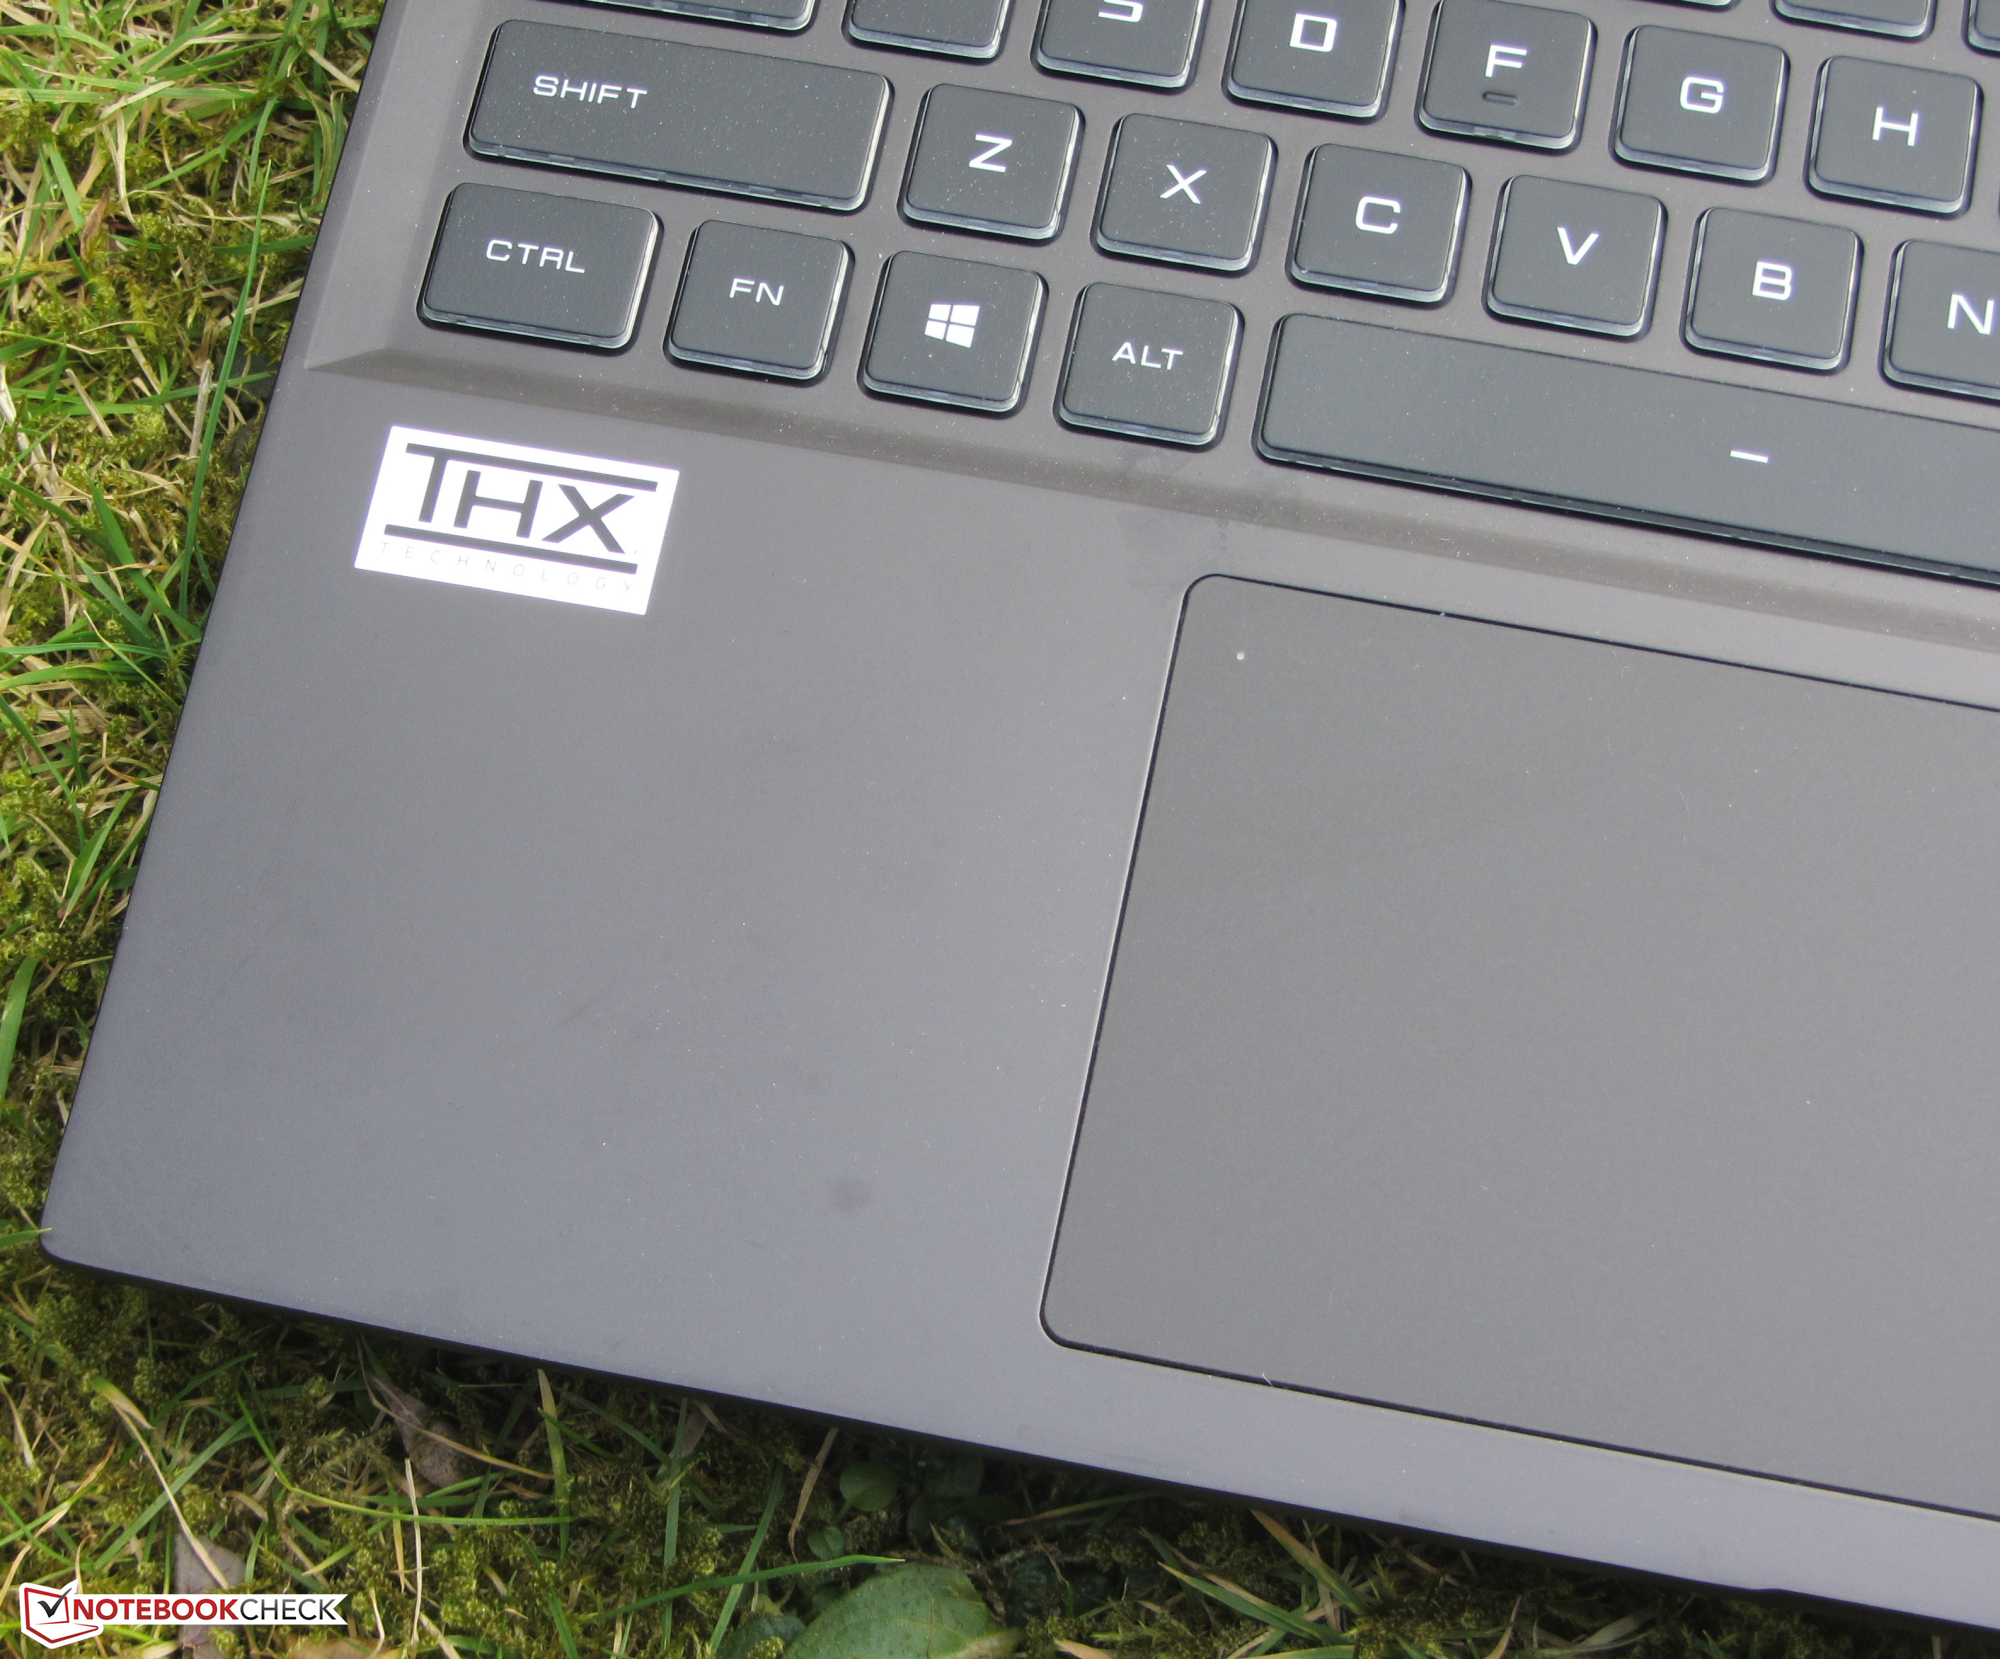
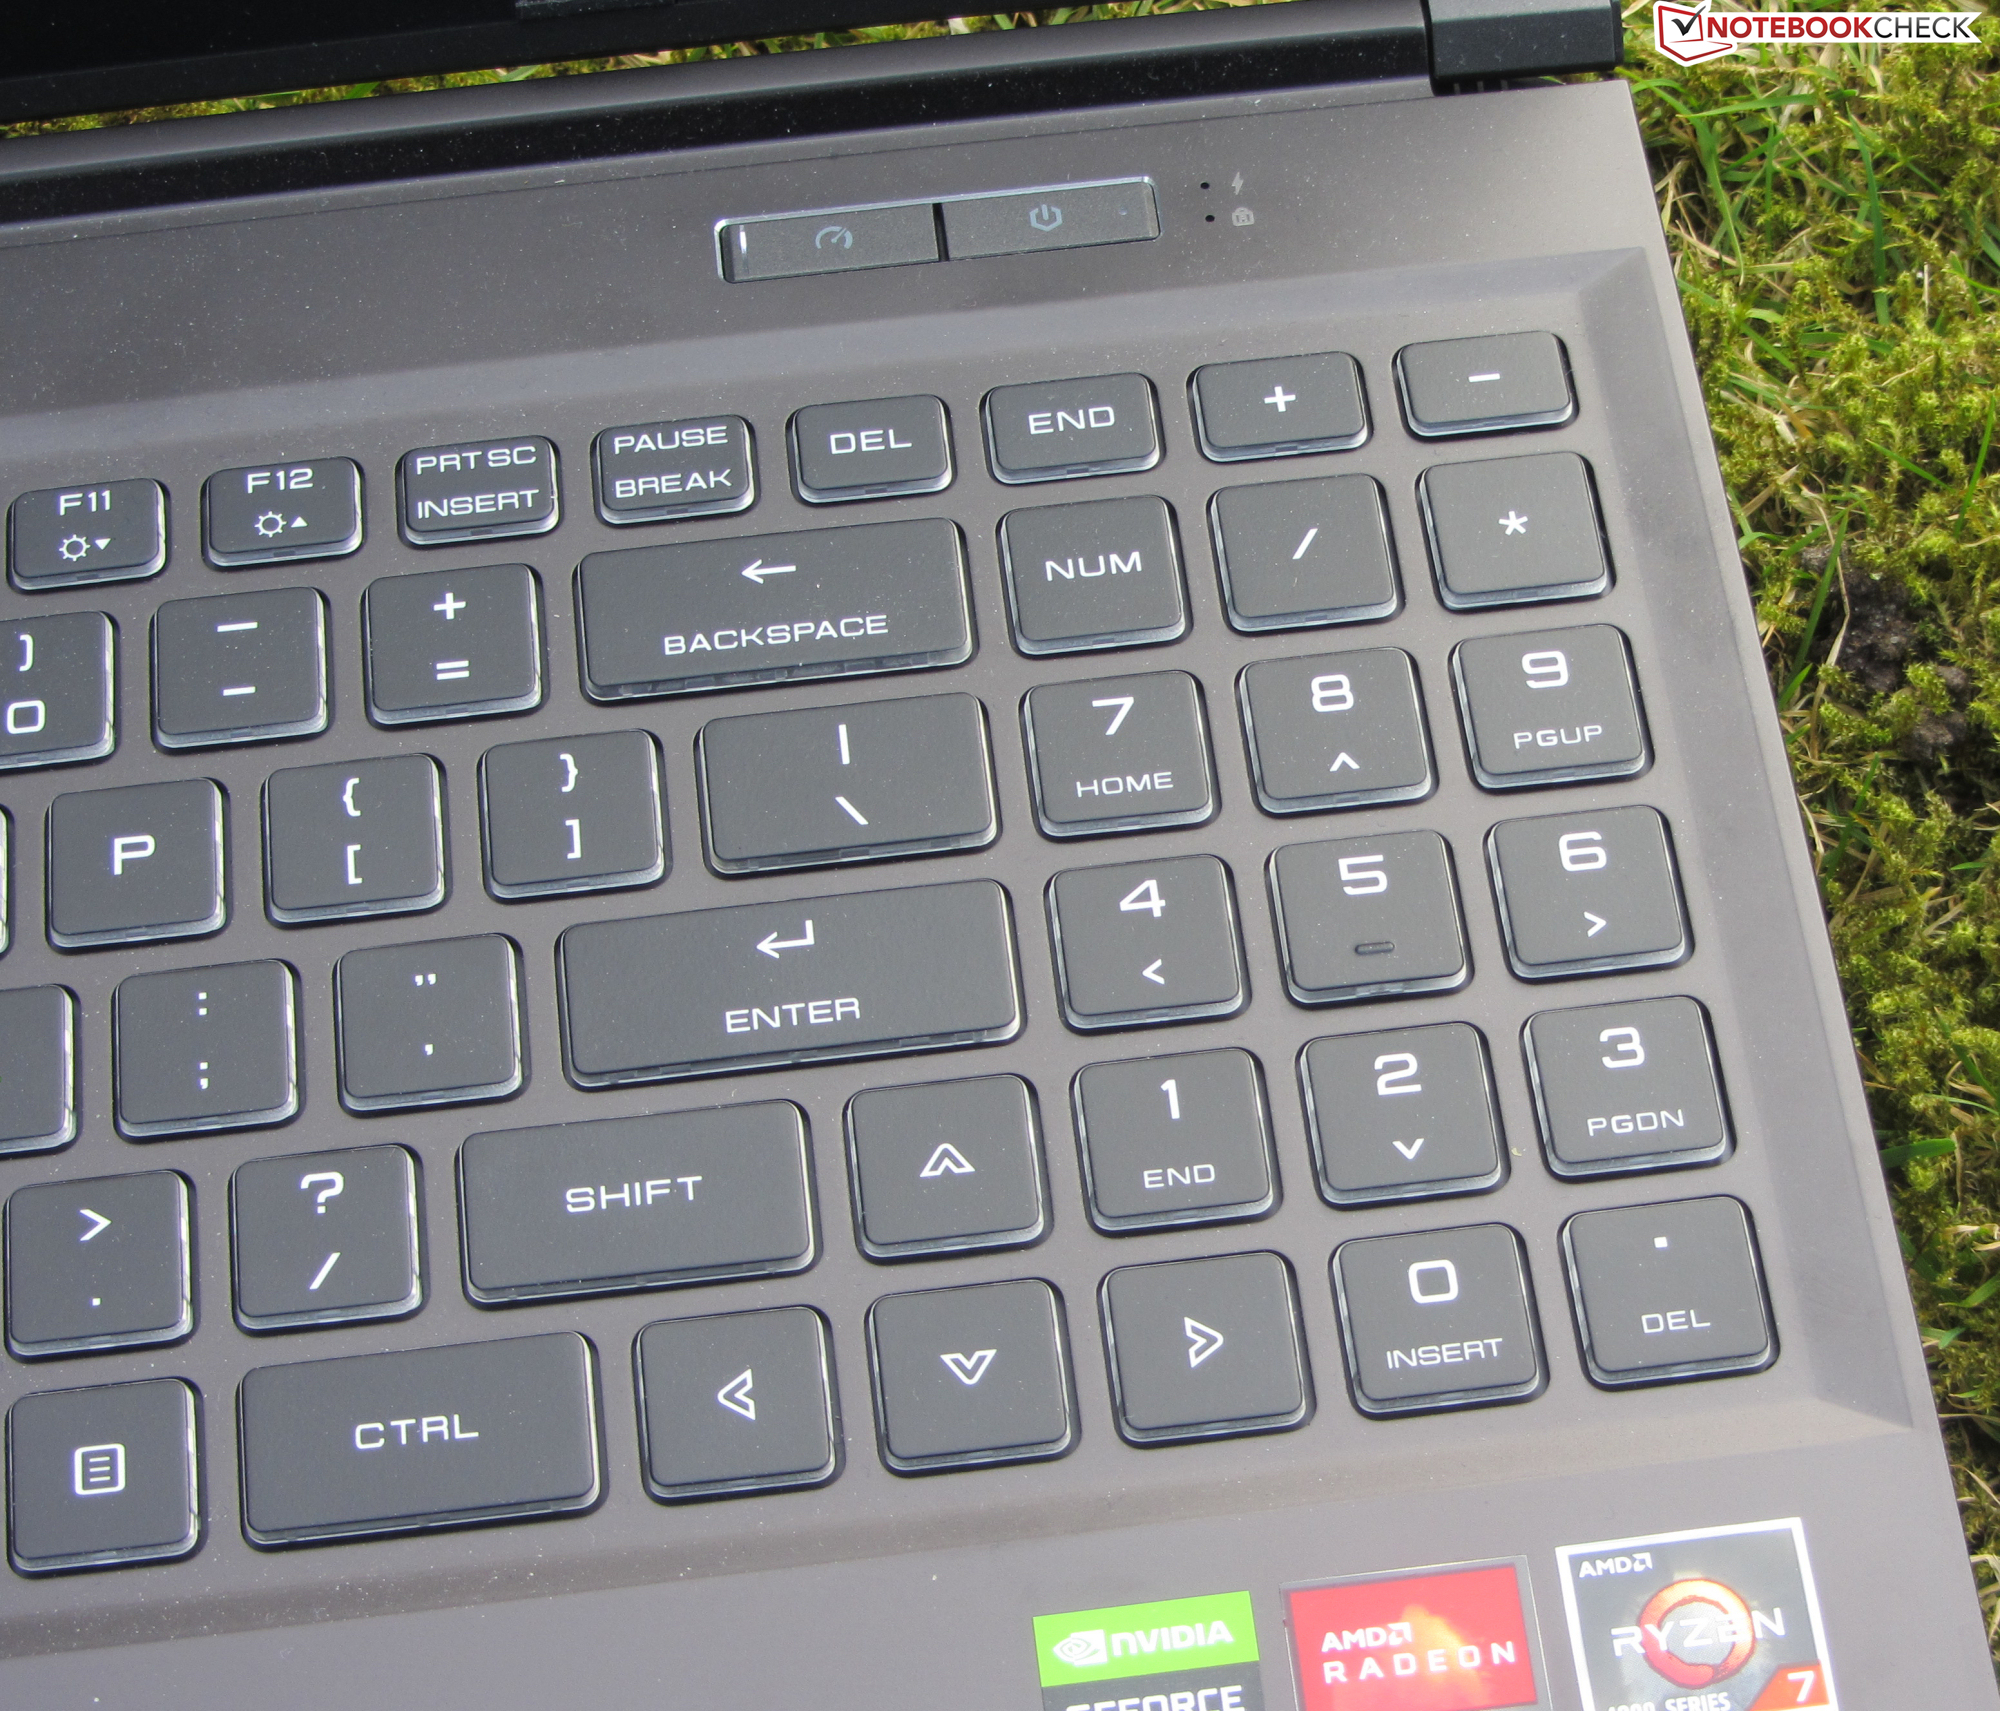
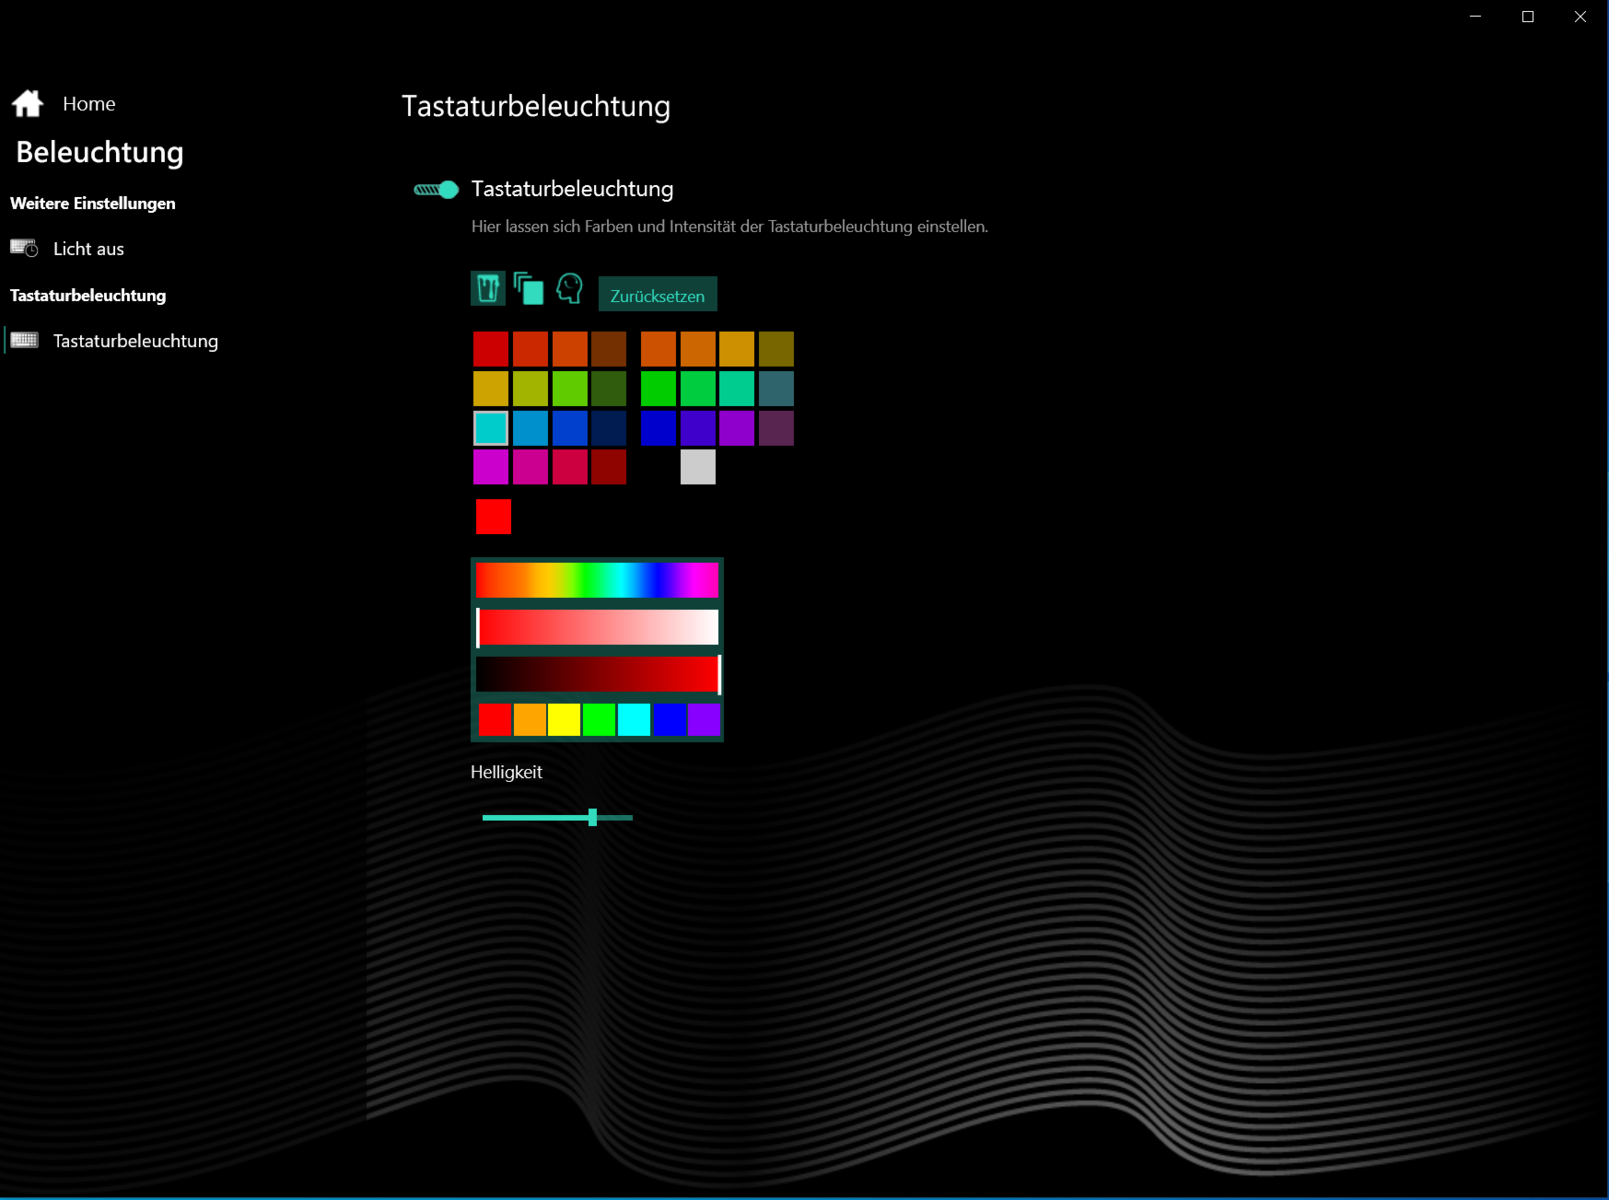
The Schenker laptop has a backlit chiclet keyboard (RGB lighting) that includes a numeric keypad. However, the latter lacks the fourth column and consequently the second "Enter" key. The flat, smooth keys have a medium travel and a clear pressure point. We like the key resistance, and the keyboard doesn't yield during typing. Moreover, the four-stage backlight is controlled with two function keys. All in all, you get a keyboard that is suitable for everyday use here.
Touchpad
The smooth surface of the multitouch-capable ClickPad (about 11.6 x 7.4 cm) makes it easy for fingers to glide on it. The pad responds to inputs in the corners as well. It has a short travel and a clear pressure point.
Display - 165 Hz IPS
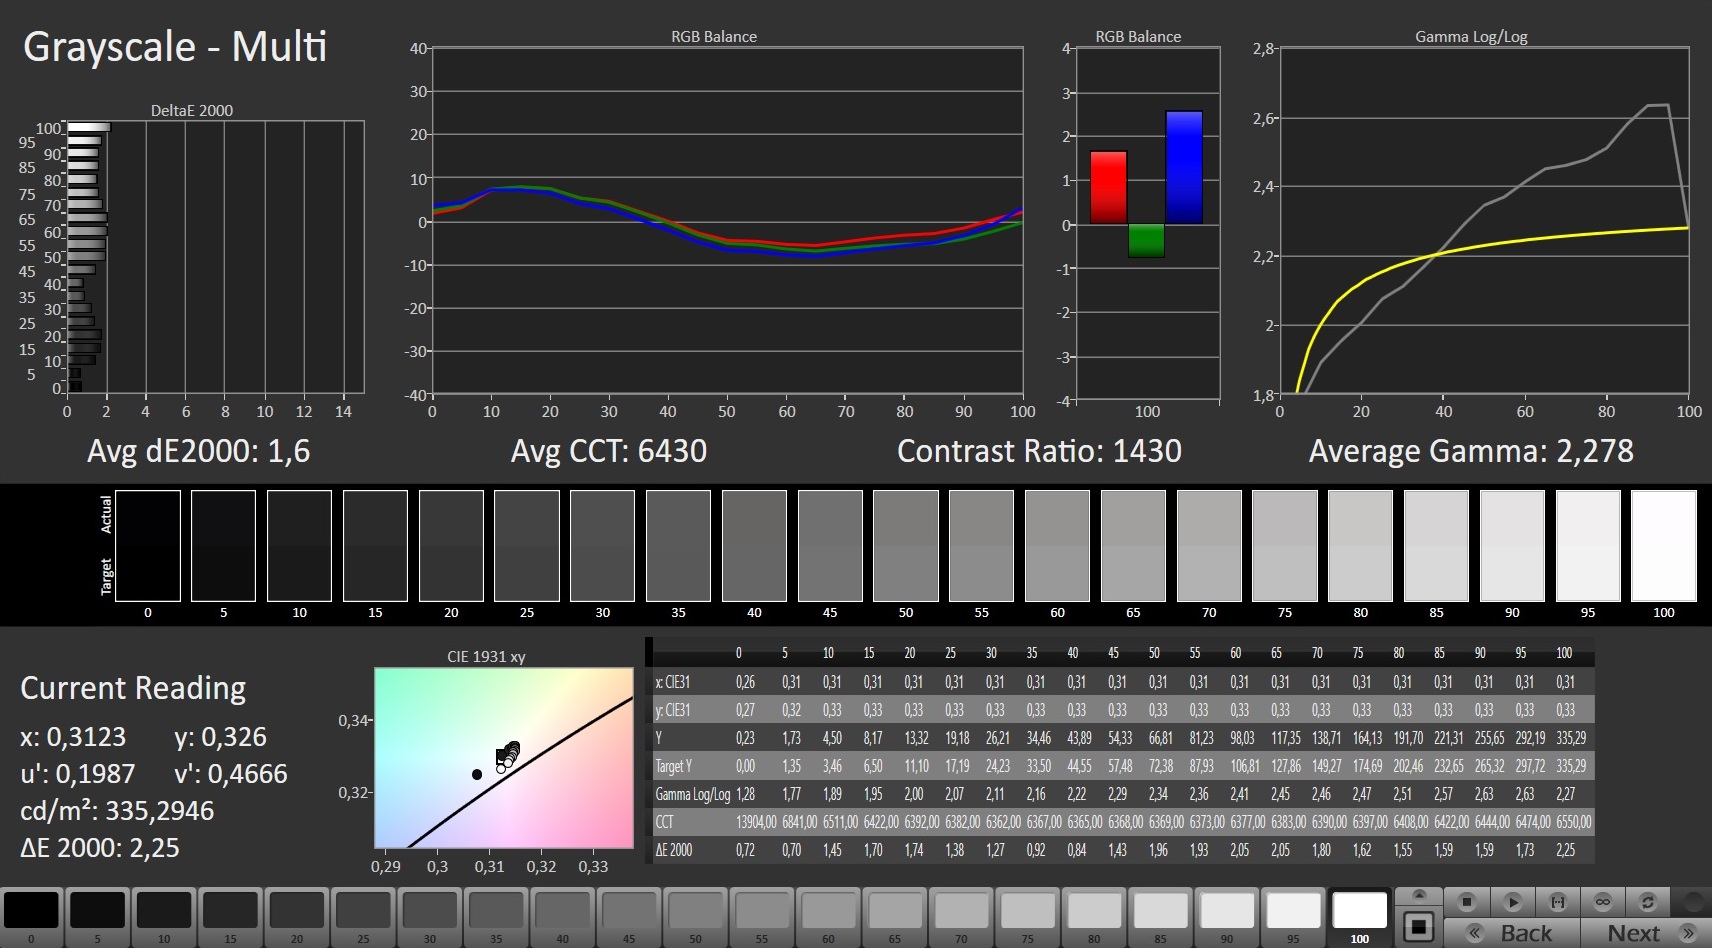
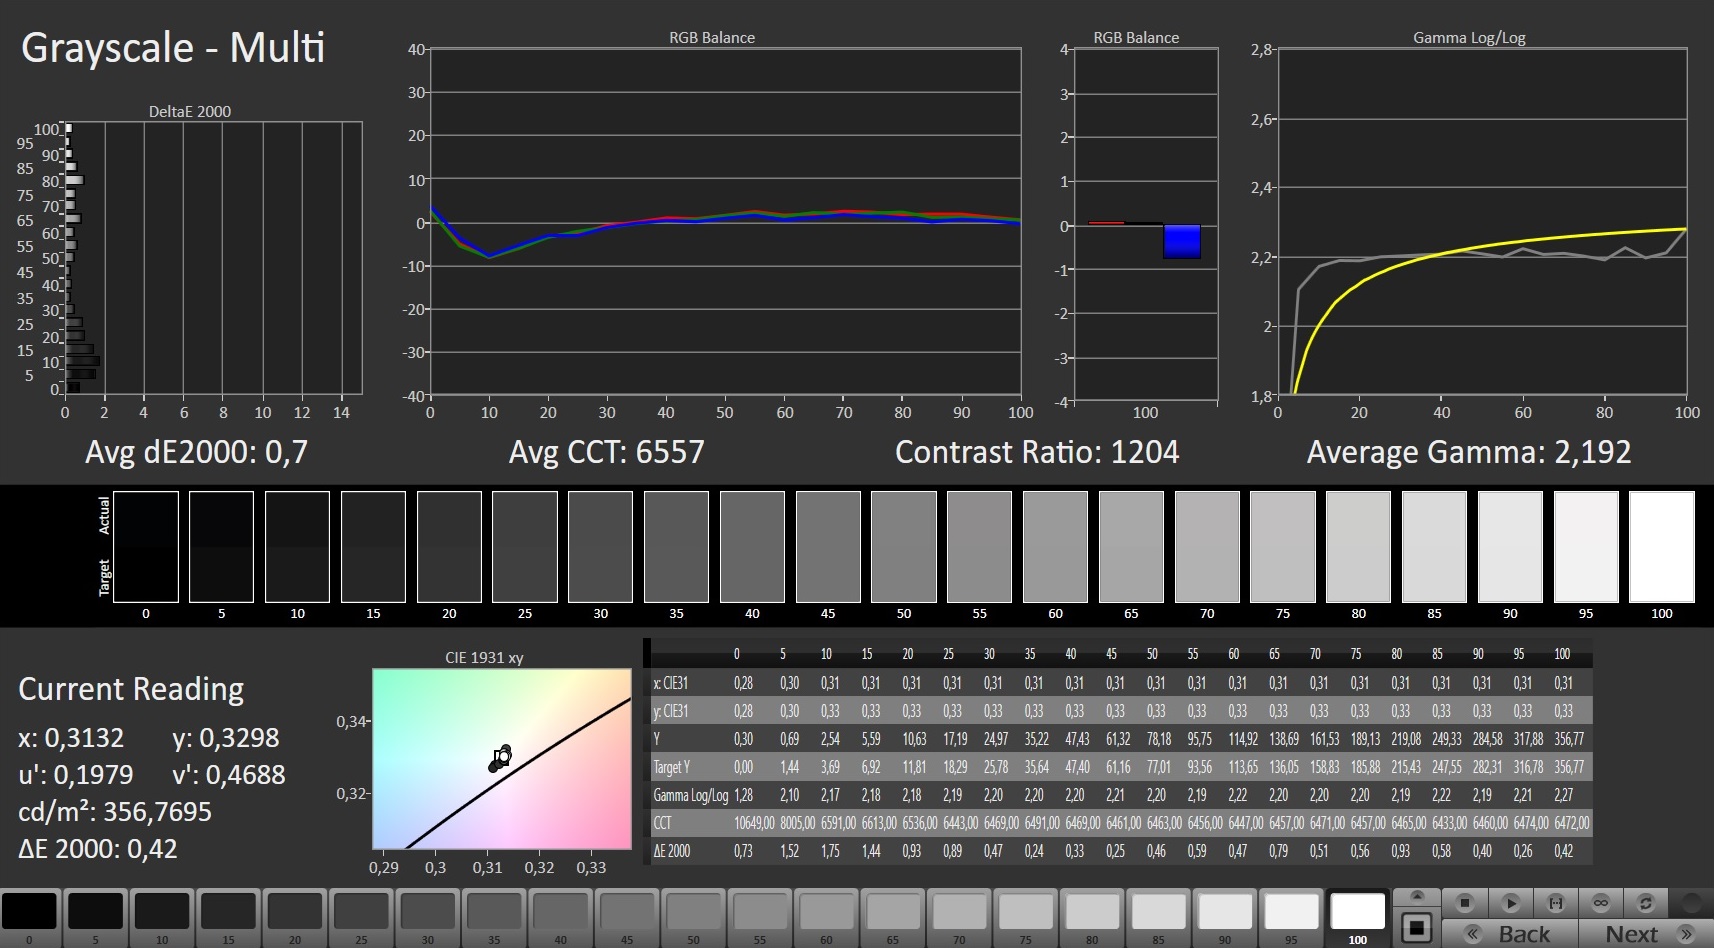
The brightness (327.6 cd/m²) and contrast (1,285:1) of the matte 15.6-inch display (WQHD, 2560x1440 pixels) are good. In addition, the 165 Hz panel used here offers fast response times. Positive: The display doesn't show PWM flickering. Schenker also offers a Full HD display (IPS, 240 Hz) as an alternative.
| |||||||||||||||||||||||||
Brightness Distribution: 89 %
Contrast: 1285:1 (Black: 0.27 cd/m²)
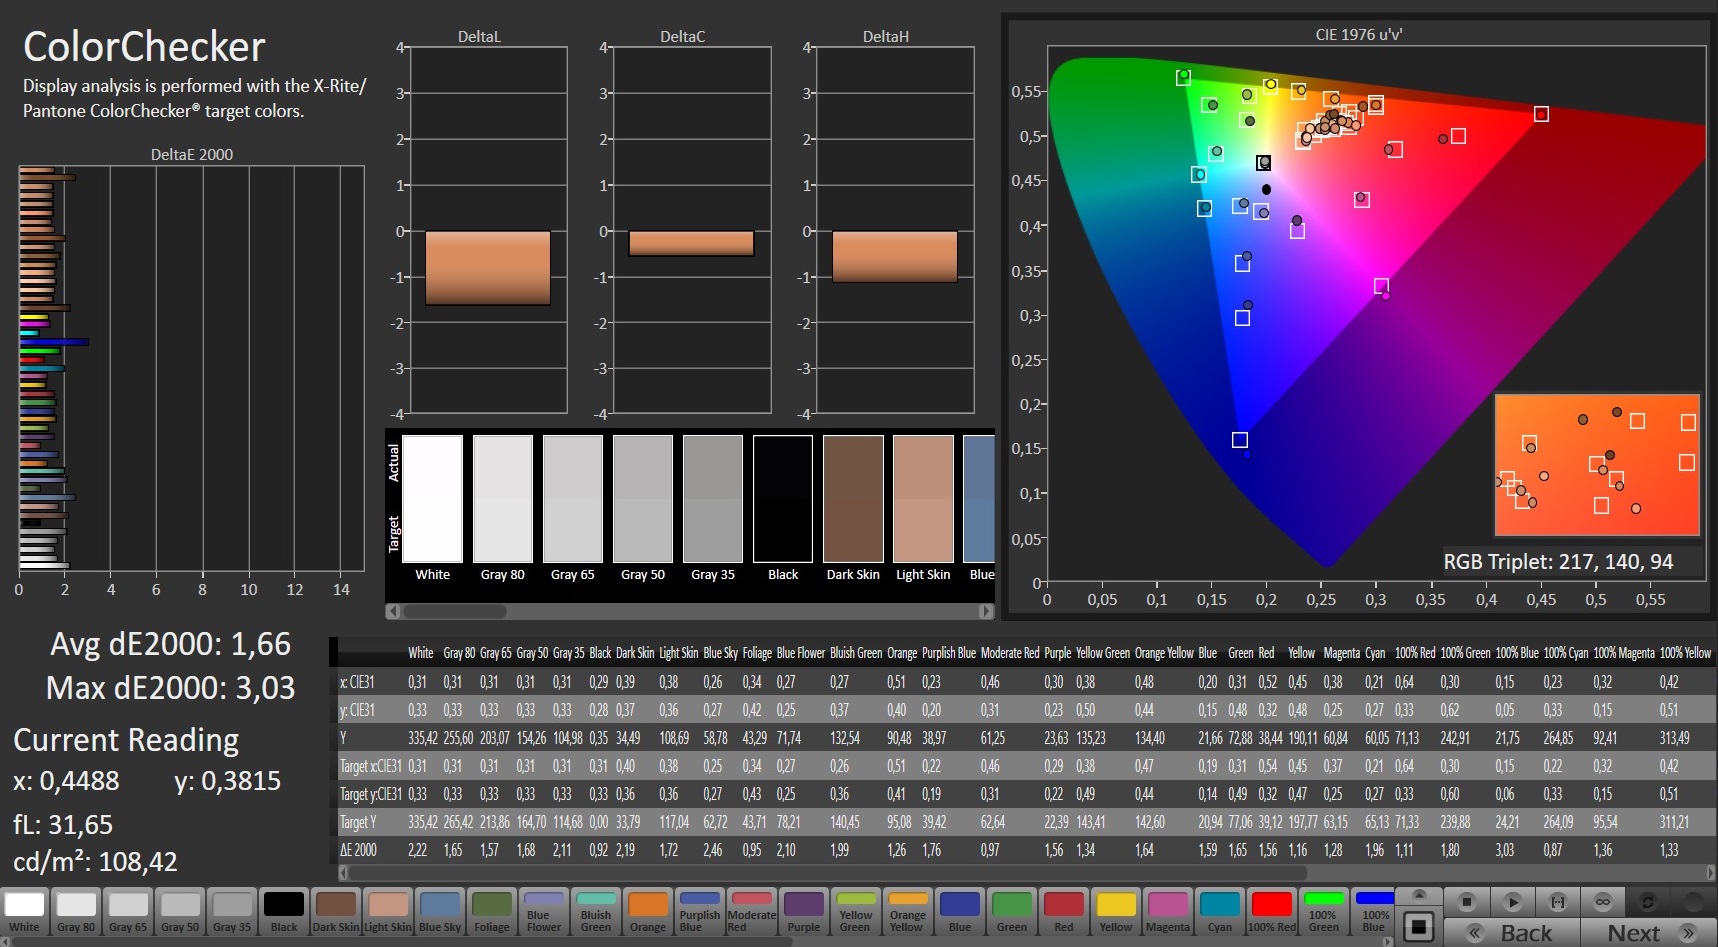
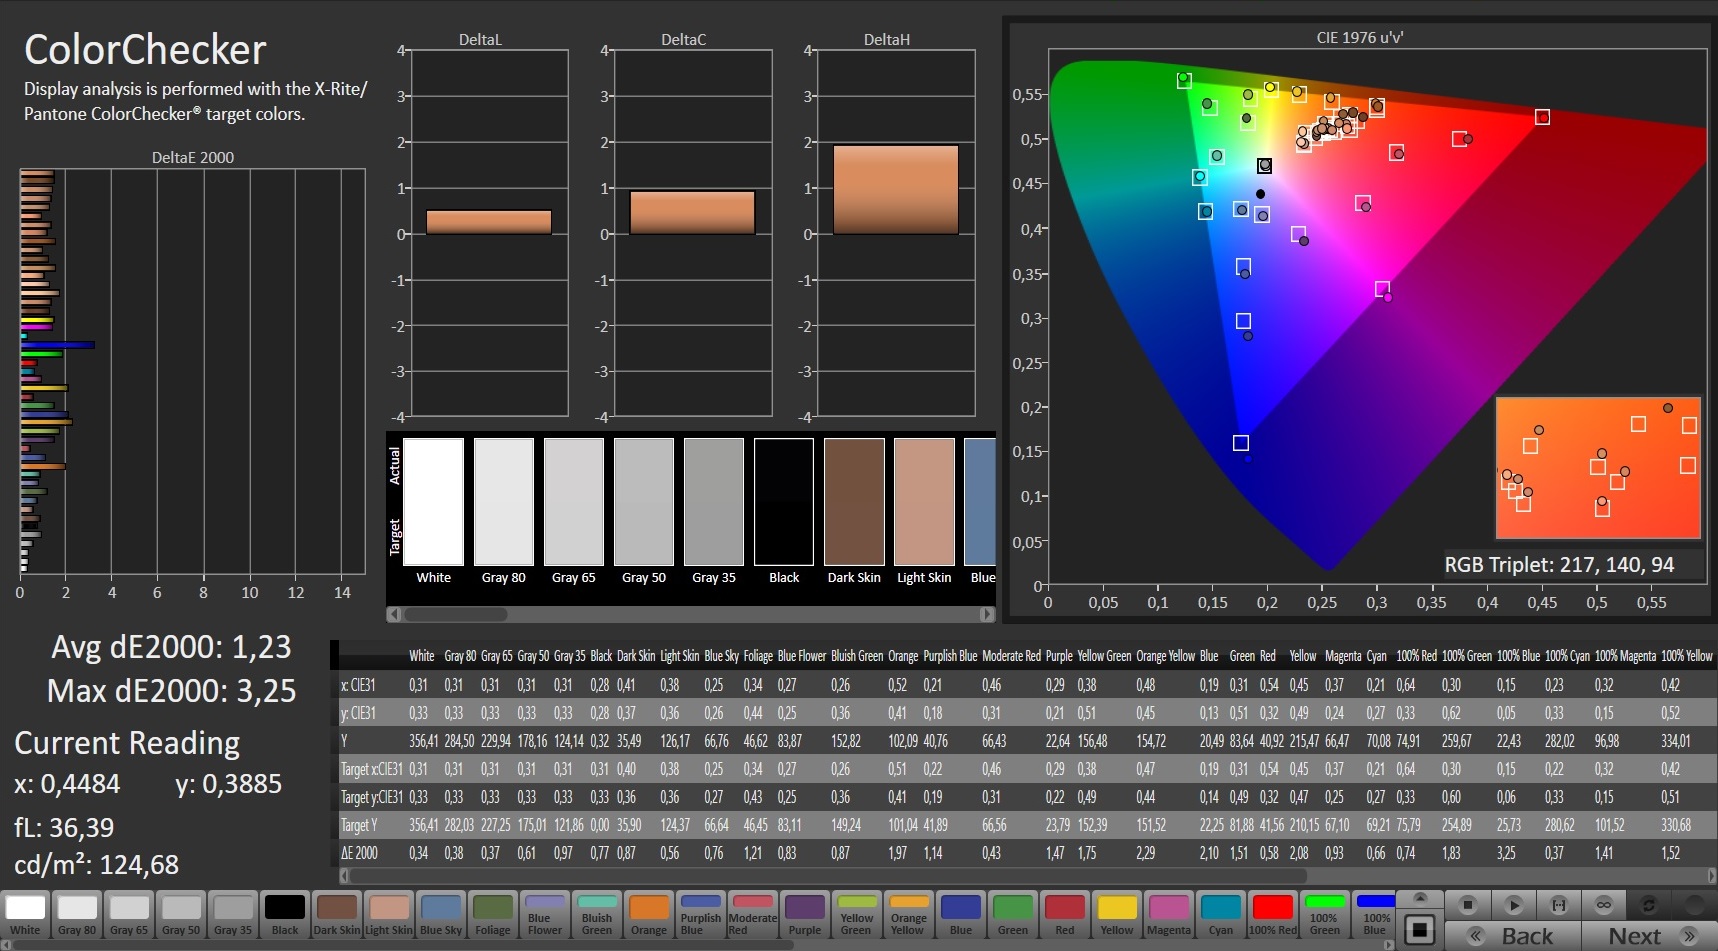
ΔE ColorChecker Calman: 1.66 | ∀{0.5-29.43 Ø4.82}
calibrated: 1.23
ΔE Greyscale Calman: 1.6 | ∀{0.09-98 Ø5.1}
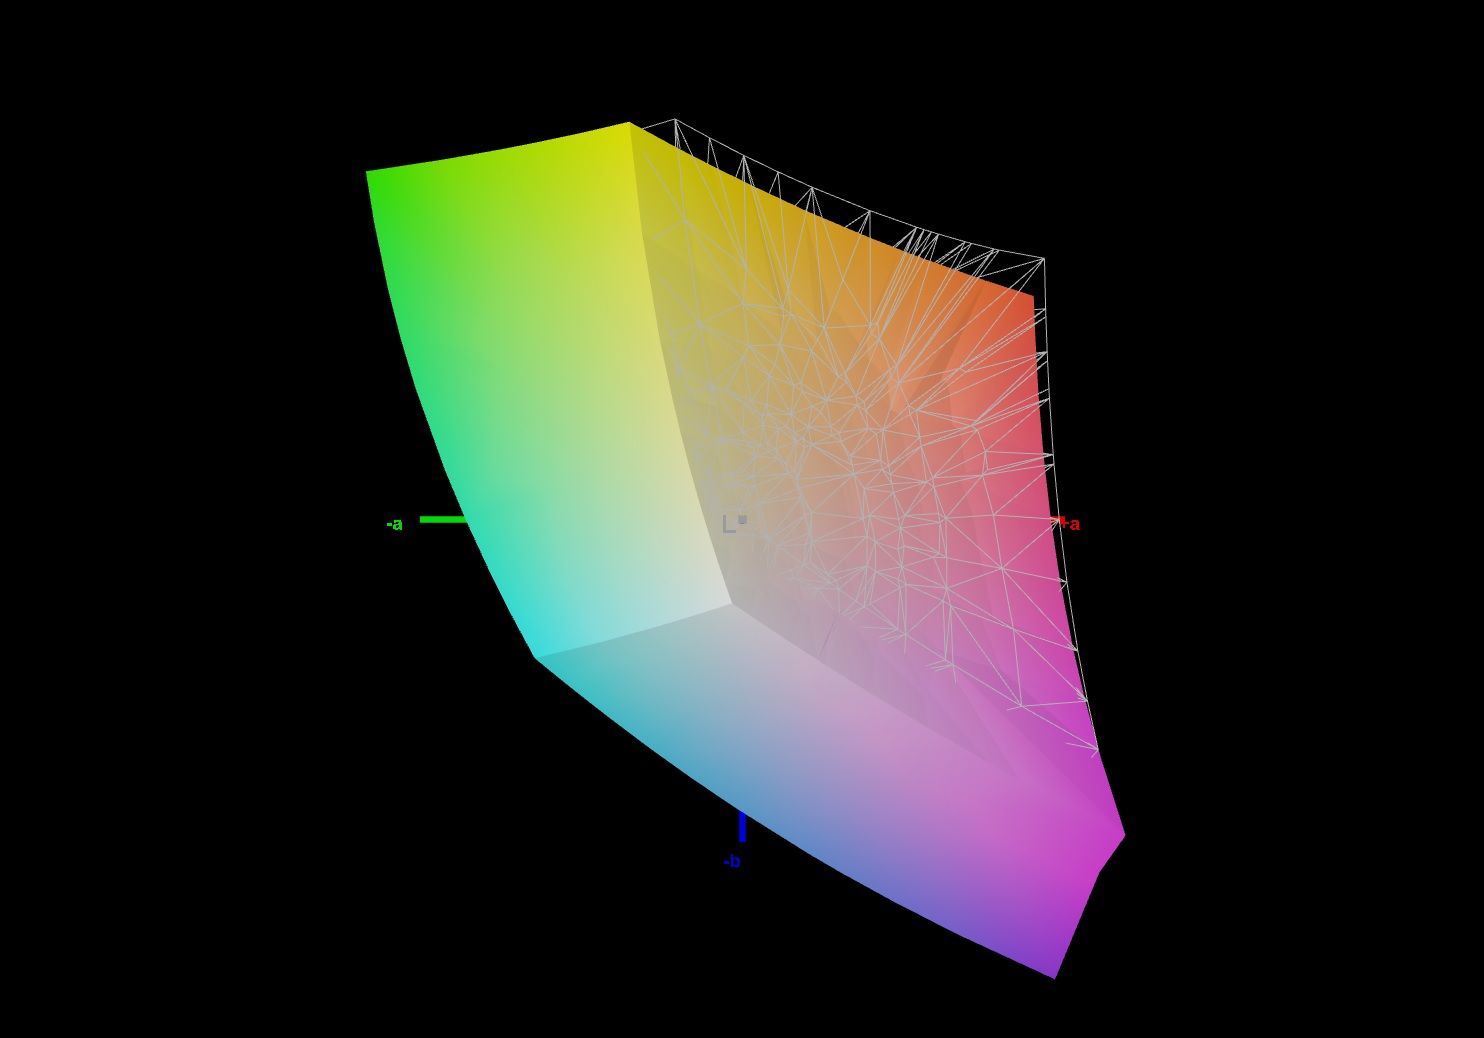
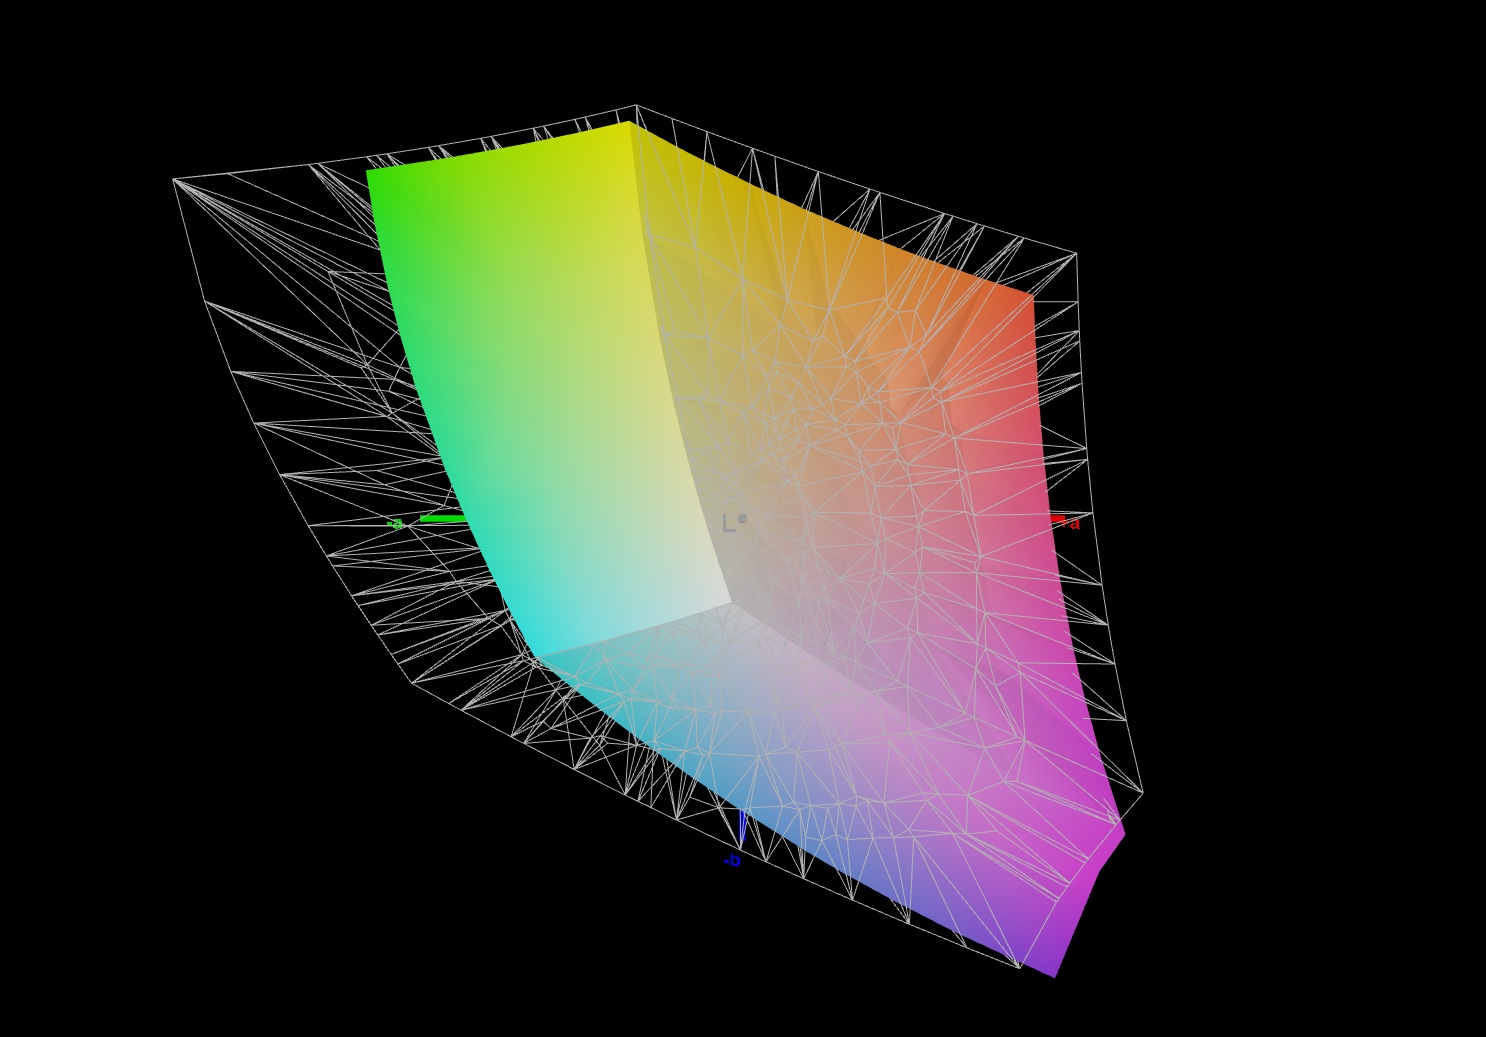
94% sRGB (Argyll 1.6.3 3D)
71% AdobeRGB 1998 (Argyll 1.6.3 3D)
70.7% AdobeRGB 1998 (Argyll 3D)
98.8% sRGB (Argyll 3D)
69.8% Display P3 (Argyll 3D)
Gamma: 2.278
CCT: 6430 K
| SCHENKER XMG Core 15 Ampere BOE CQ NE156QHM-NY2, IPS, 2560x1440, 15.6" | Asus TUF Dash F15 FX516PR LQ156M1JW26 (SHP1532), IPS, 1920x1080, 15.6" | Aorus 15G XC Sharp LQ156M1JW03, IPS, 1920x1080, 15.6" | HP Omen 15-en0375ng BOE0852, IPS, 1920x1080, 15.6" | Acer Predator Triton 300 PT315-52-79LP BOE08FB, IPS, 1920x1080, 15.6" | |
|---|---|---|---|---|---|
| Display | -3% | -4% | -43% | -42% | |
| Display P3 Coverage | 69.8 | 66.9 -4% | 65.6 -6% | 39.12 -44% | 39.51 -43% |
| sRGB Coverage | 98.8 | 98.1 -1% | 97.5 -1% | 57.6 -42% | 58.1 -41% |
| AdobeRGB 1998 Coverage | 70.7 | 67.9 -4% | 67.1 -5% | 40.42 -43% | 40.81 -42% |
| Response Times | 12% | 22% | -103% | -95% | |
| Response Time Grey 50% / Grey 80% * | 14.8 ? | 12 ? 19% | 9.6 ? 35% | 30.4 ? -105% | 29.2 ? -97% |
| Response Time Black / White * | 10.4 ? | 10 ? 4% | 9.6 ? 8% | 20.8 ? -100% | 20 ? -92% |
| PWM Frequency | 23580 ? | 24040 ? | 200 ? | ||
| Screen | -26% | -0% | -107% | -127% | |
| Brightness middle | 347 | 286 -18% | 288 -17% | 297 -14% | 279 -20% |
| Brightness | 328 | 275 -16% | 270 -18% | 275 -16% | 257 -22% |
| Brightness Distribution | 89 | 91 2% | 89 0% | 88 -1% | 89 0% |
| Black Level * | 0.27 | 0.25 7% | 0.25 7% | 0.33 -22% | 0.31 -15% |
| Contrast | 1285 | 1144 -11% | 1152 -10% | 900 -30% | 900 -30% |
| Colorchecker dE 2000 * | 1.66 | 2.43 -46% | 1.19 28% | 4.54 -173% | 5.84 -252% |
| Colorchecker dE 2000 max. * | 3.03 | 6.33 -109% | 3.79 -25% | 18.92 -524% | 21.8 -619% |
| Colorchecker dE 2000 calibrated * | 1.23 | 0.83 33% | 0.71 42% | 4.66 -279% | 4.54 -269% |
| Greyscale dE 2000 * | 1.6 | 3.5 -119% | 1.6 -0% | 2.1 -31% | 3.1 -94% |
| Gamma | 2.278 97% | 2.32 95% | 2.229 99% | 2.066 106% | 2.116 104% |
| CCT | 6430 101% | 7145 91% | 6539 99% | 6291 103% | 6577 99% |
| Color Space (Percent of AdobeRGB 1998) | 71 | 68 -4% | 67 -6% | 40 -44% | 41 -42% |
| Color Space (Percent of sRGB) | 94 | 91 -3% | 90 -4% | 58 -38% | 59 -37% |
| Total Average (Program / Settings) | -6% /
-17% | 6% /
2% | -84% /
-94% | -88% /
-107% |
* ... smaller is better
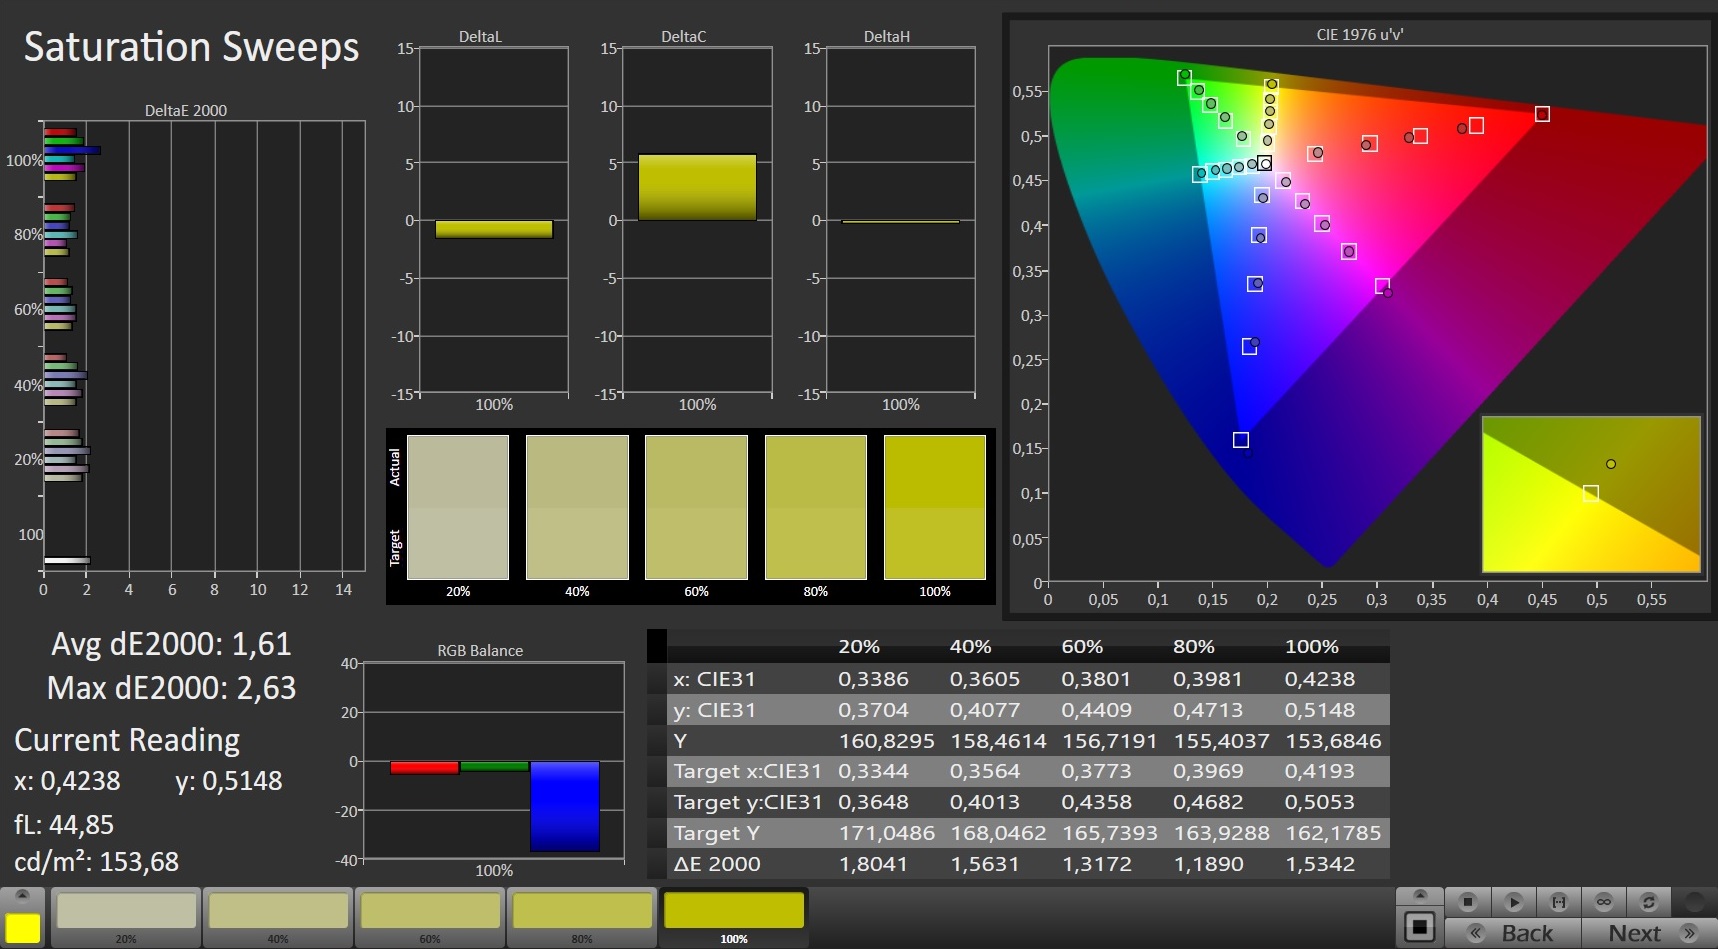
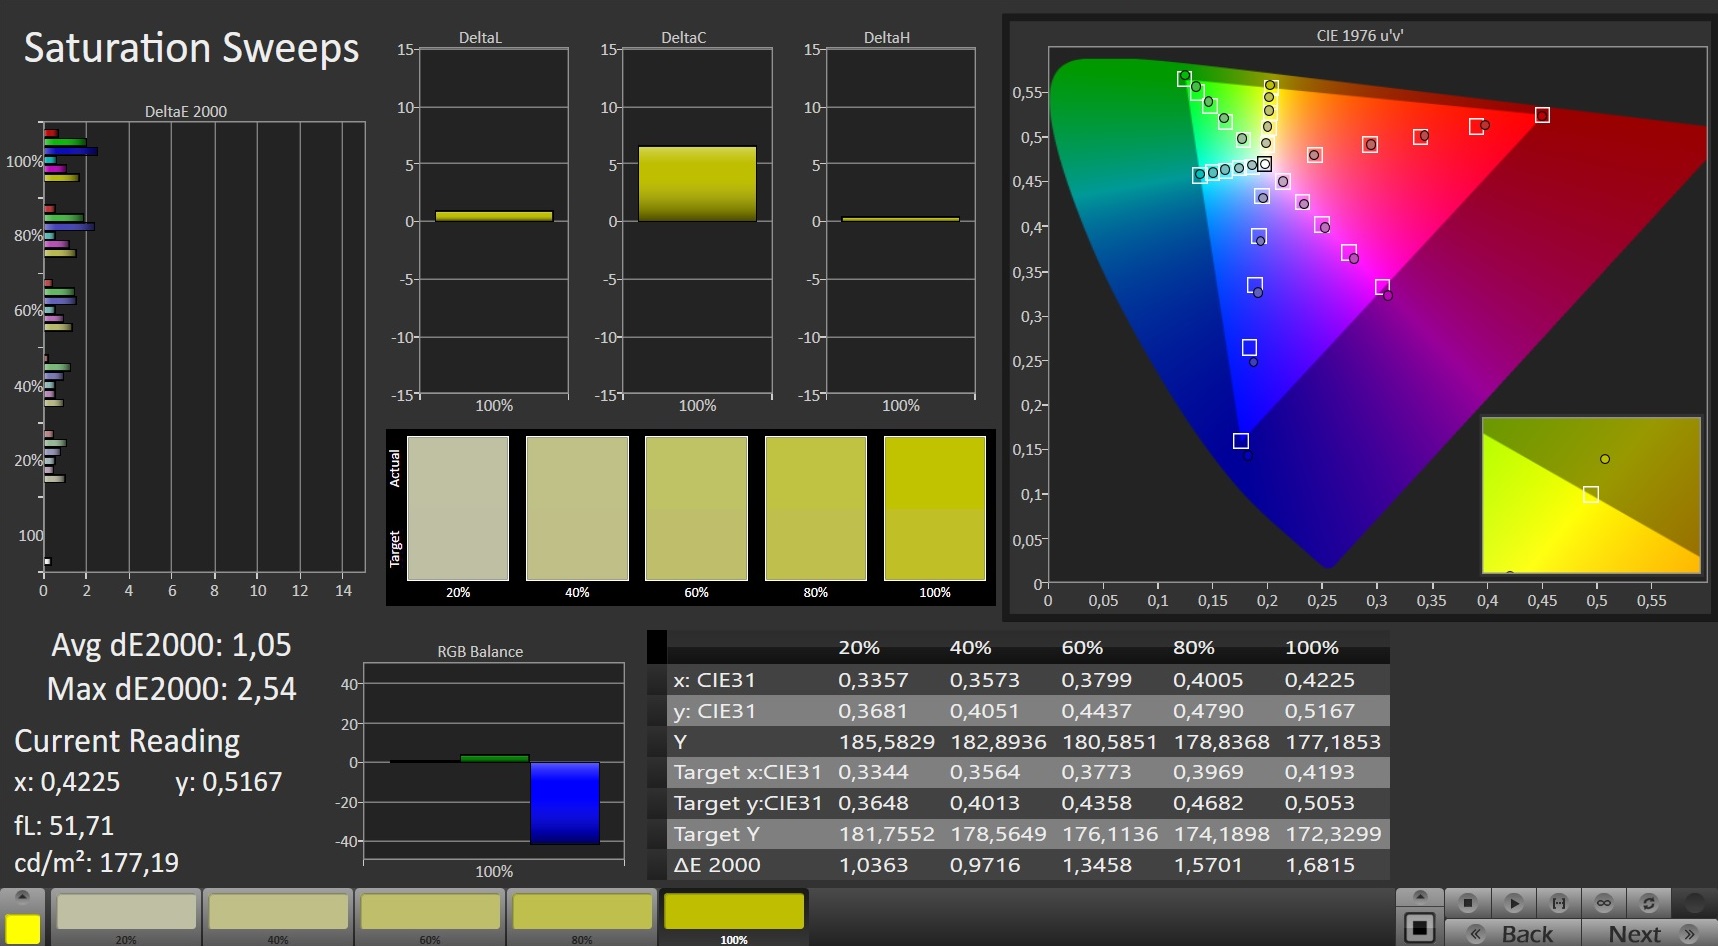
Already out of the box, the display shows good color reproduction. With a color deviation of just under 1.7, the target (Delta E less than 3) is met. Moreover, the display doesn't suffer from a blue tint. Slight improvements are achieved through calibration: Color deviation drops to 1.23, and grayscales are displayed in a more balanced way. The AdobeRGB (71%) and sRGB (94%) color spaces aren't completely reproduced.
Display Response Times
| ↔ Response Time Black to White | ||
|---|---|---|
| 10.4 ms ... rise ↗ and fall ↘ combined | ↗ 5.2 ms rise | 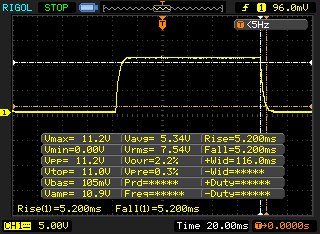 |
| ↘ 5.2 ms fall | ||
| The screen shows good response rates in our tests, but may be too slow for competitive gamers. In comparison, all tested devices range from 0.1 (minimum) to 240 (maximum) ms. » 26 % of all devices are better. This means that the measured response time is better than the average of all tested devices (20.4 ms). | ||
| ↔ Response Time 50% Grey to 80% Grey | ||
| 14.8 ms ... rise ↗ and fall ↘ combined | ↗ 7.6 ms rise | 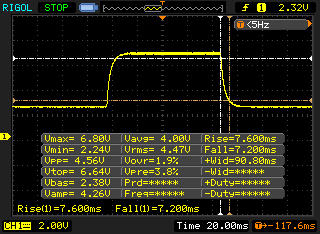 |
| ↘ 7.2 ms fall | ||
| The screen shows good response rates in our tests, but may be too slow for competitive gamers. In comparison, all tested devices range from 0.165 (minimum) to 636 (maximum) ms. » 27 % of all devices are better. This means that the measured response time is better than the average of all tested devices (31.9 ms). | ||
Screen Flickering / PWM (Pulse-Width Modulation)
| Screen flickering / PWM not detected | 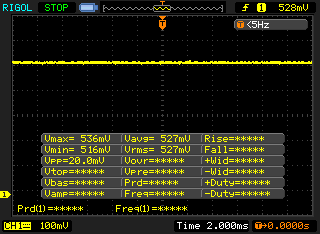 | ||
In comparison: 53 % of all tested devices do not use PWM to dim the display. If PWM was detected, an average of 8287 (minimum: 5 - maximum: 343500) Hz was measured. | |||
The viewing-angle stable IPS panel can be read from any position. Reading the display outdoors is possible when the sun doesn't shine too brightly.

Performance - RTX 3060 can develop its full potential
Schenker's 15.6-inch gaming laptop brings every modern game smoothly onto the screen and also cuts a fine figure in all other application areas. The device can be individually customized in Schenker's online store.
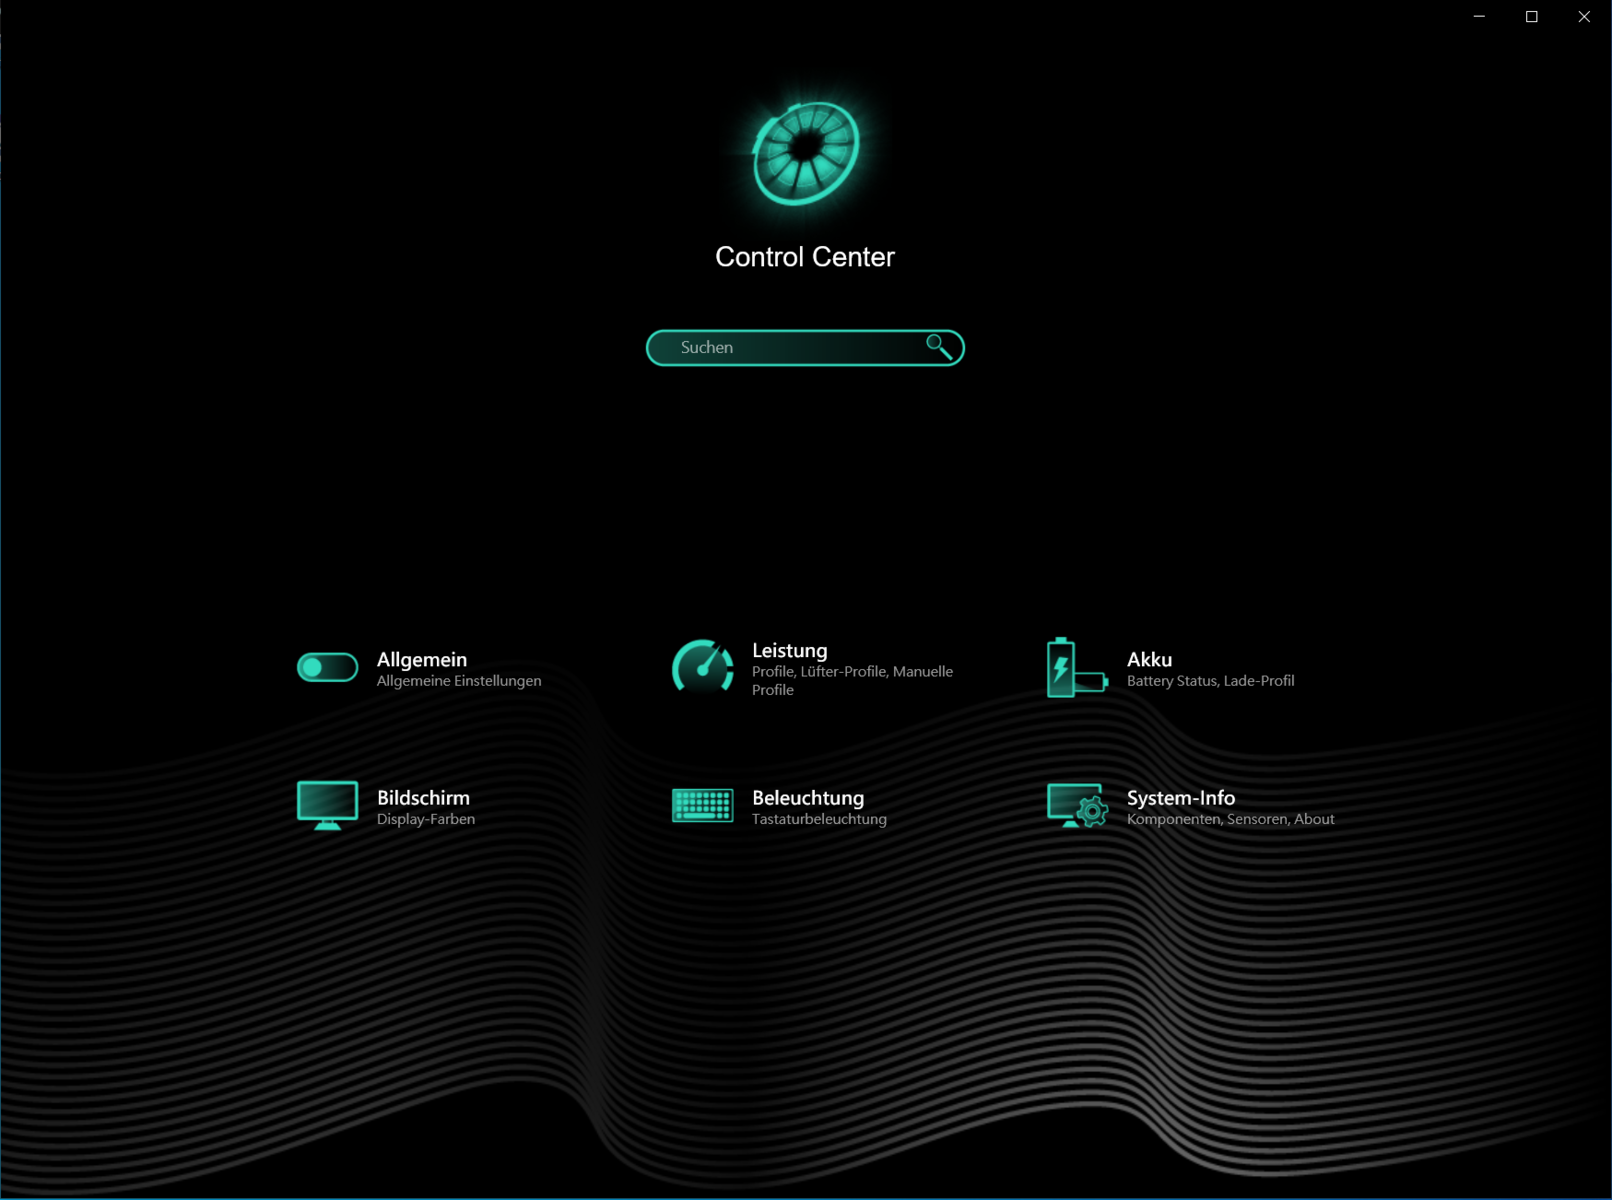
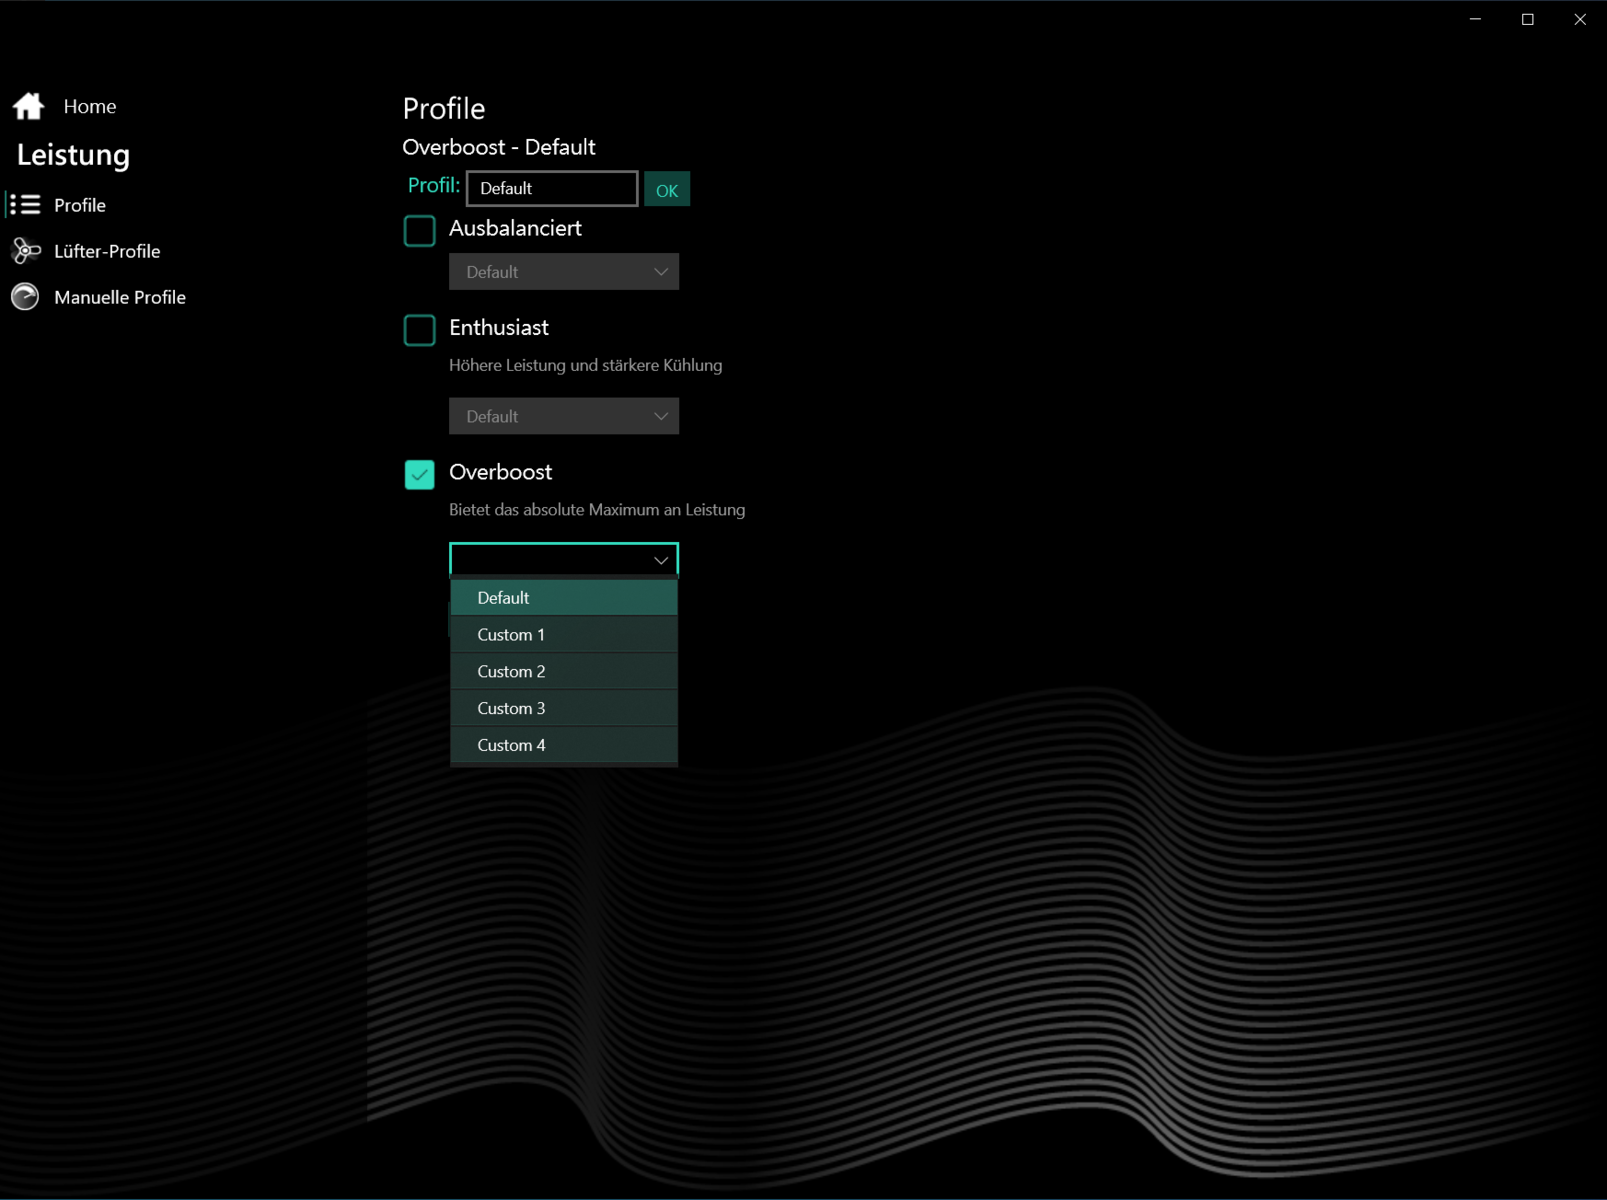
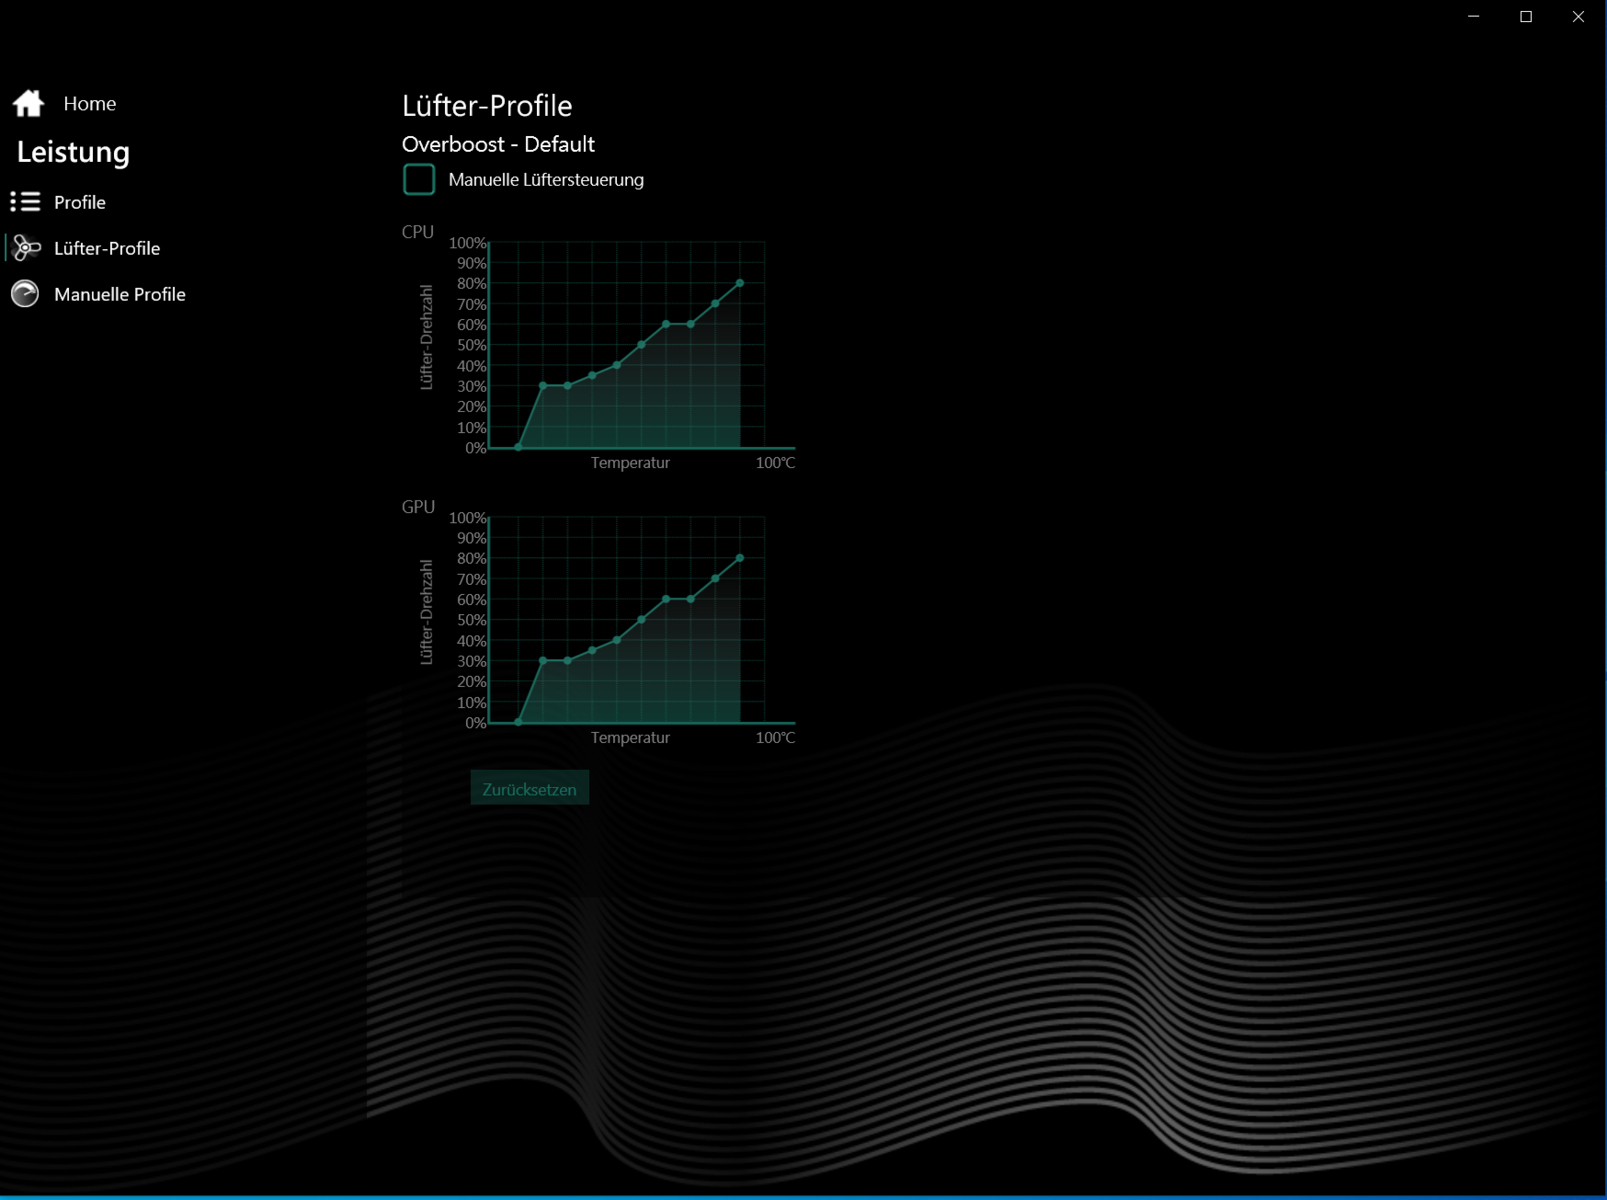
Test conditions - The new Control Center
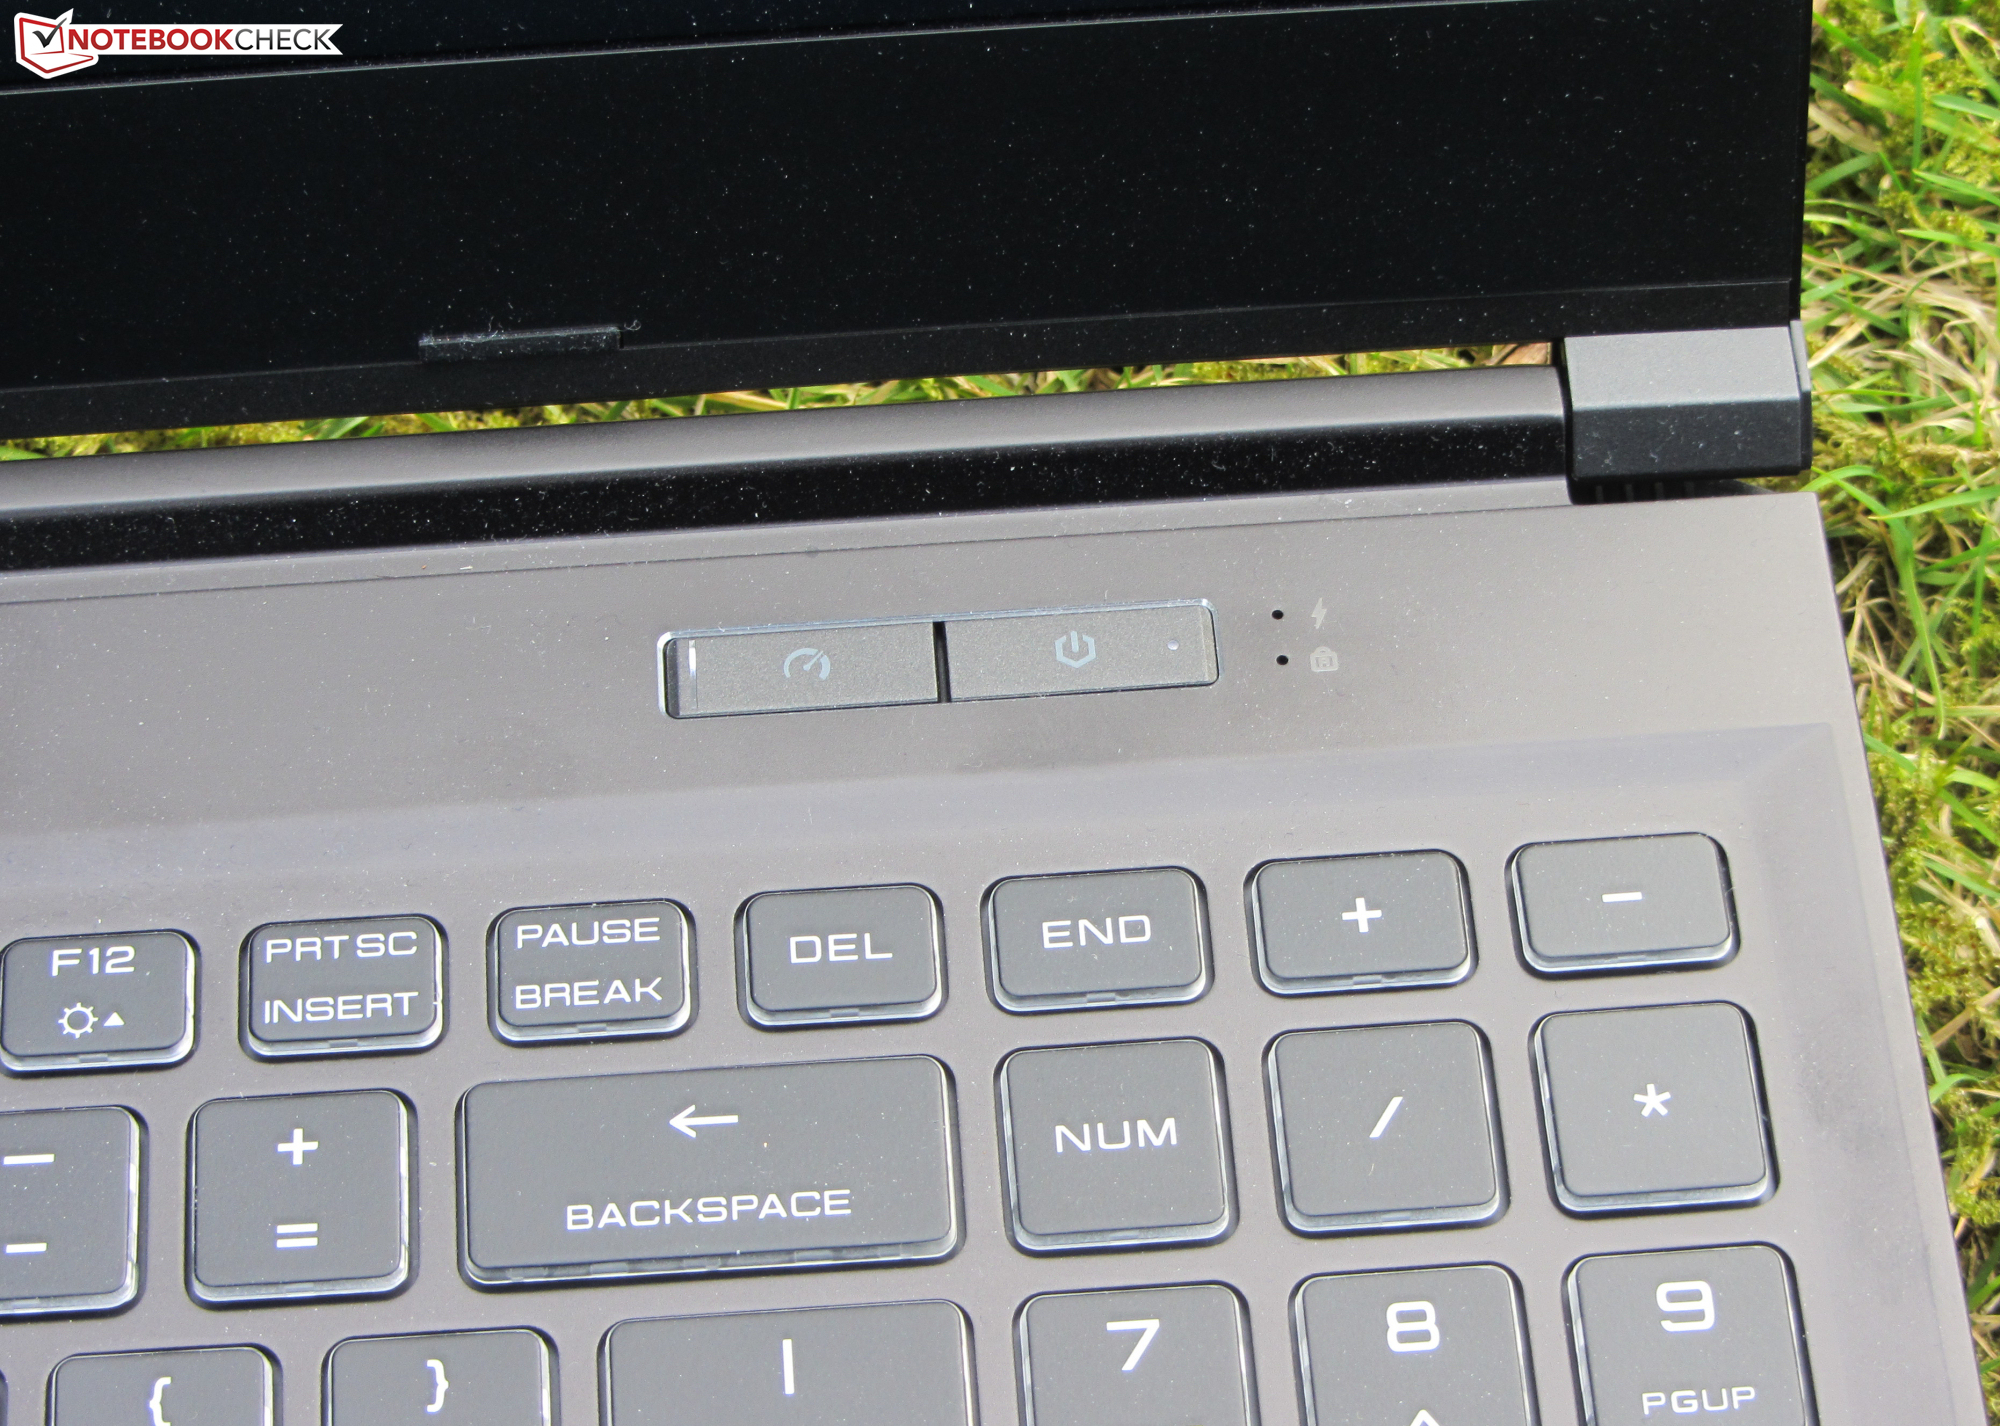
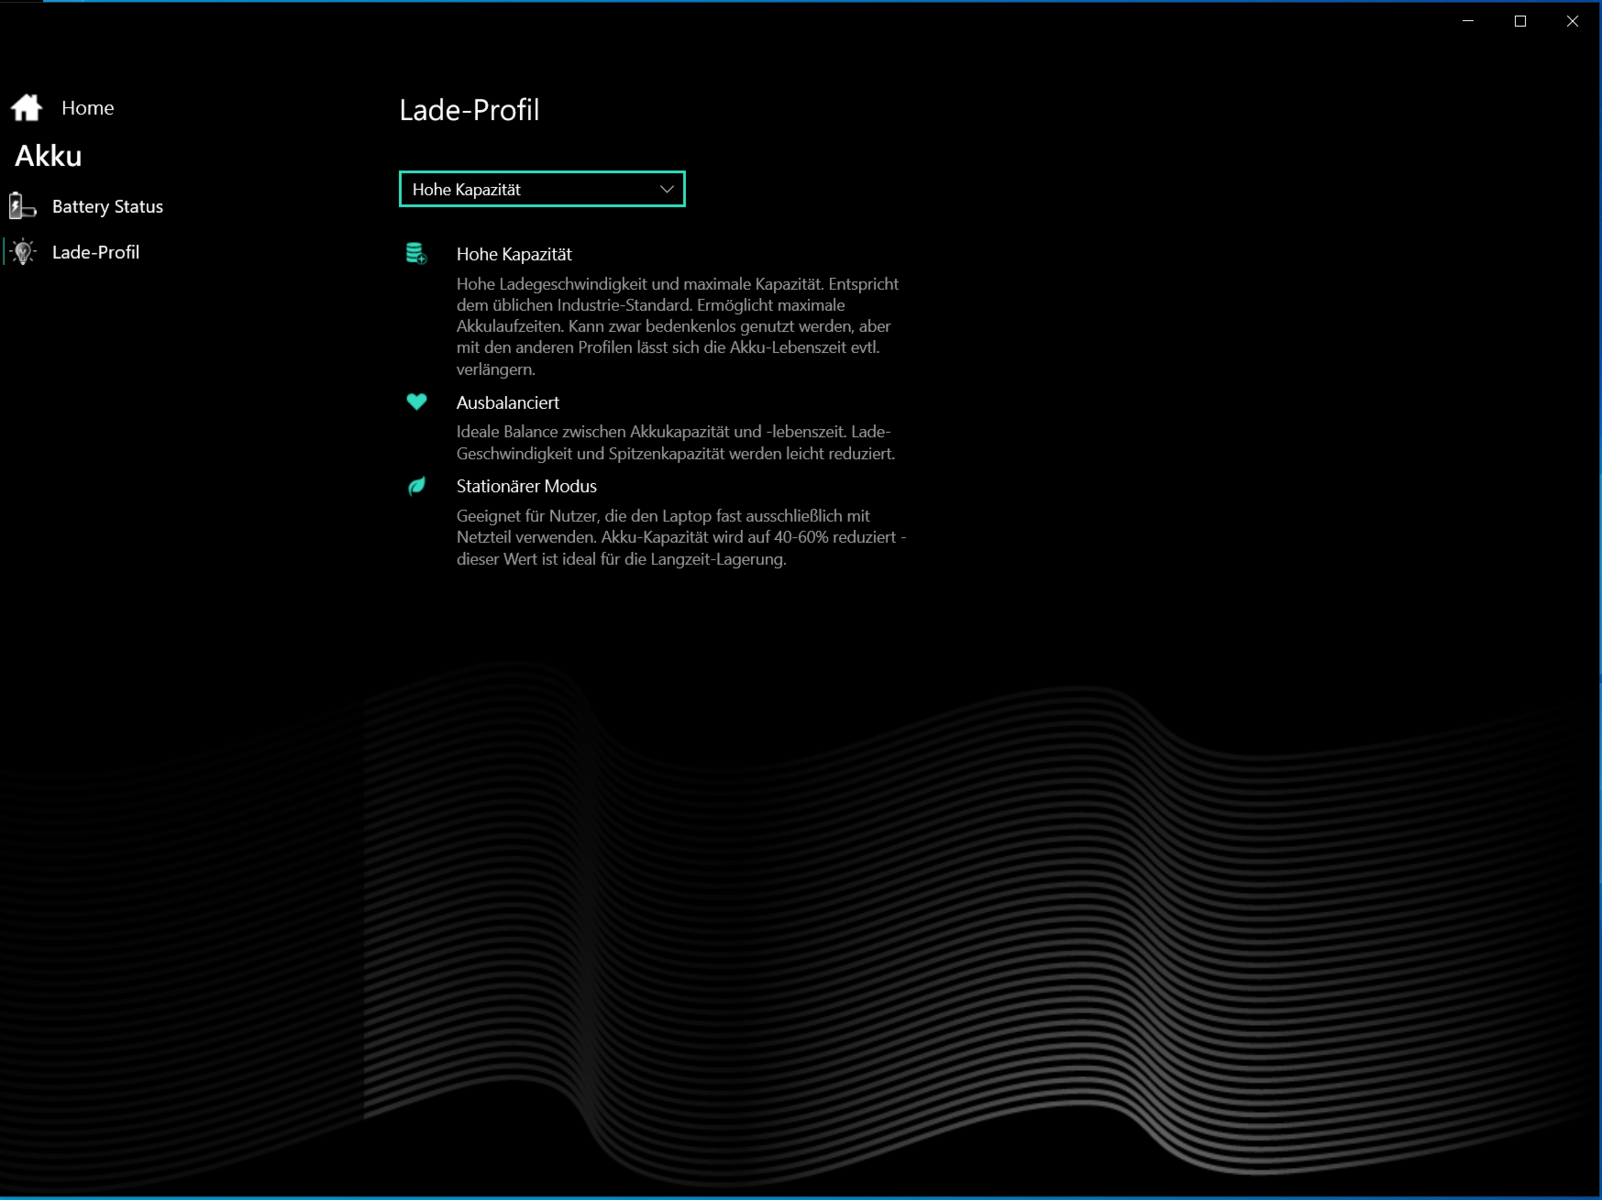
The preinstalled Control Center allows the selection of a performance profile ("Balanced", "Enthusiast", "Overboost"), among other things. We performed our test with the "Overboost" profile active and automatic fan control. We used the "Enthusiast" profile for the battery tests. A button next to the power button allows the user to quickly switch between performance profiles.
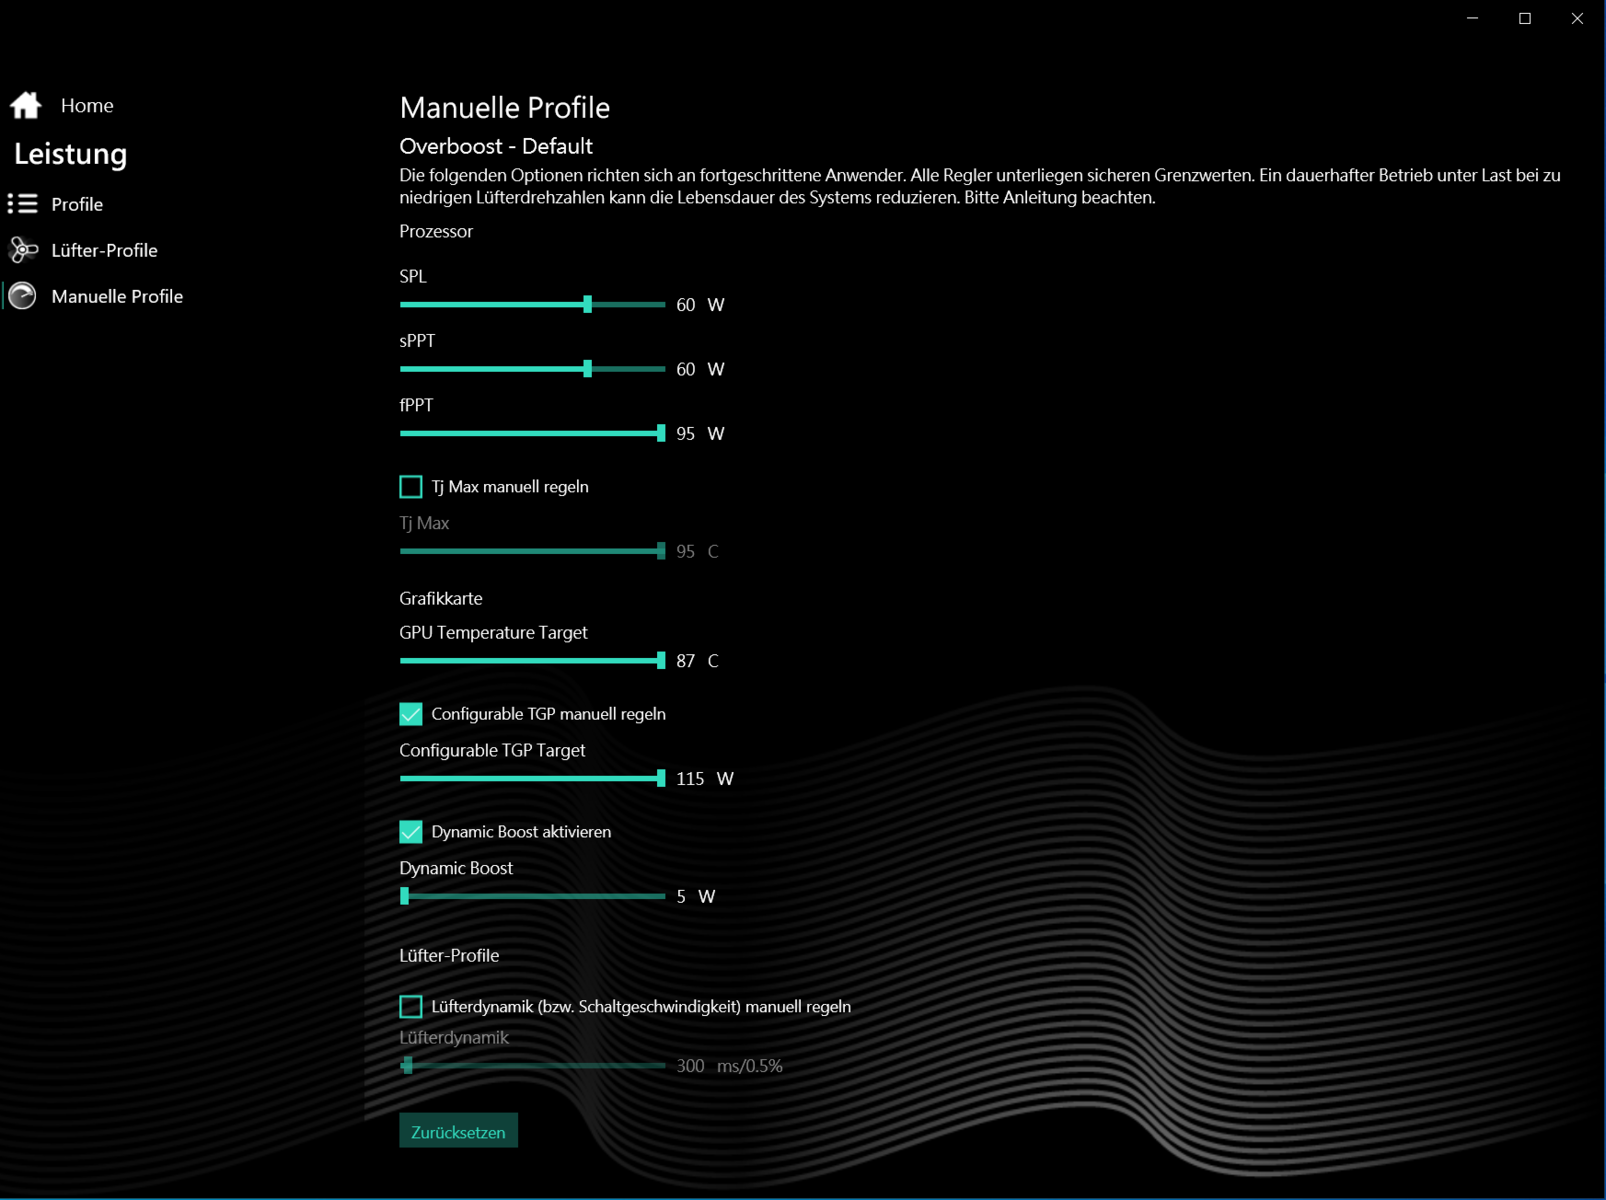
The completely redesigned Control Center offers significantly more ways to influence performance compared to the predecessor version. For instance, the CPU's power limits, the GPU's TGP, and the CPU's and GPU's upper temperature limits can be adjusted. Five subprofiles can - but don't have to - be defined for each of the three performance profiles, so that, for example, individual usage scenarios can be addressed.
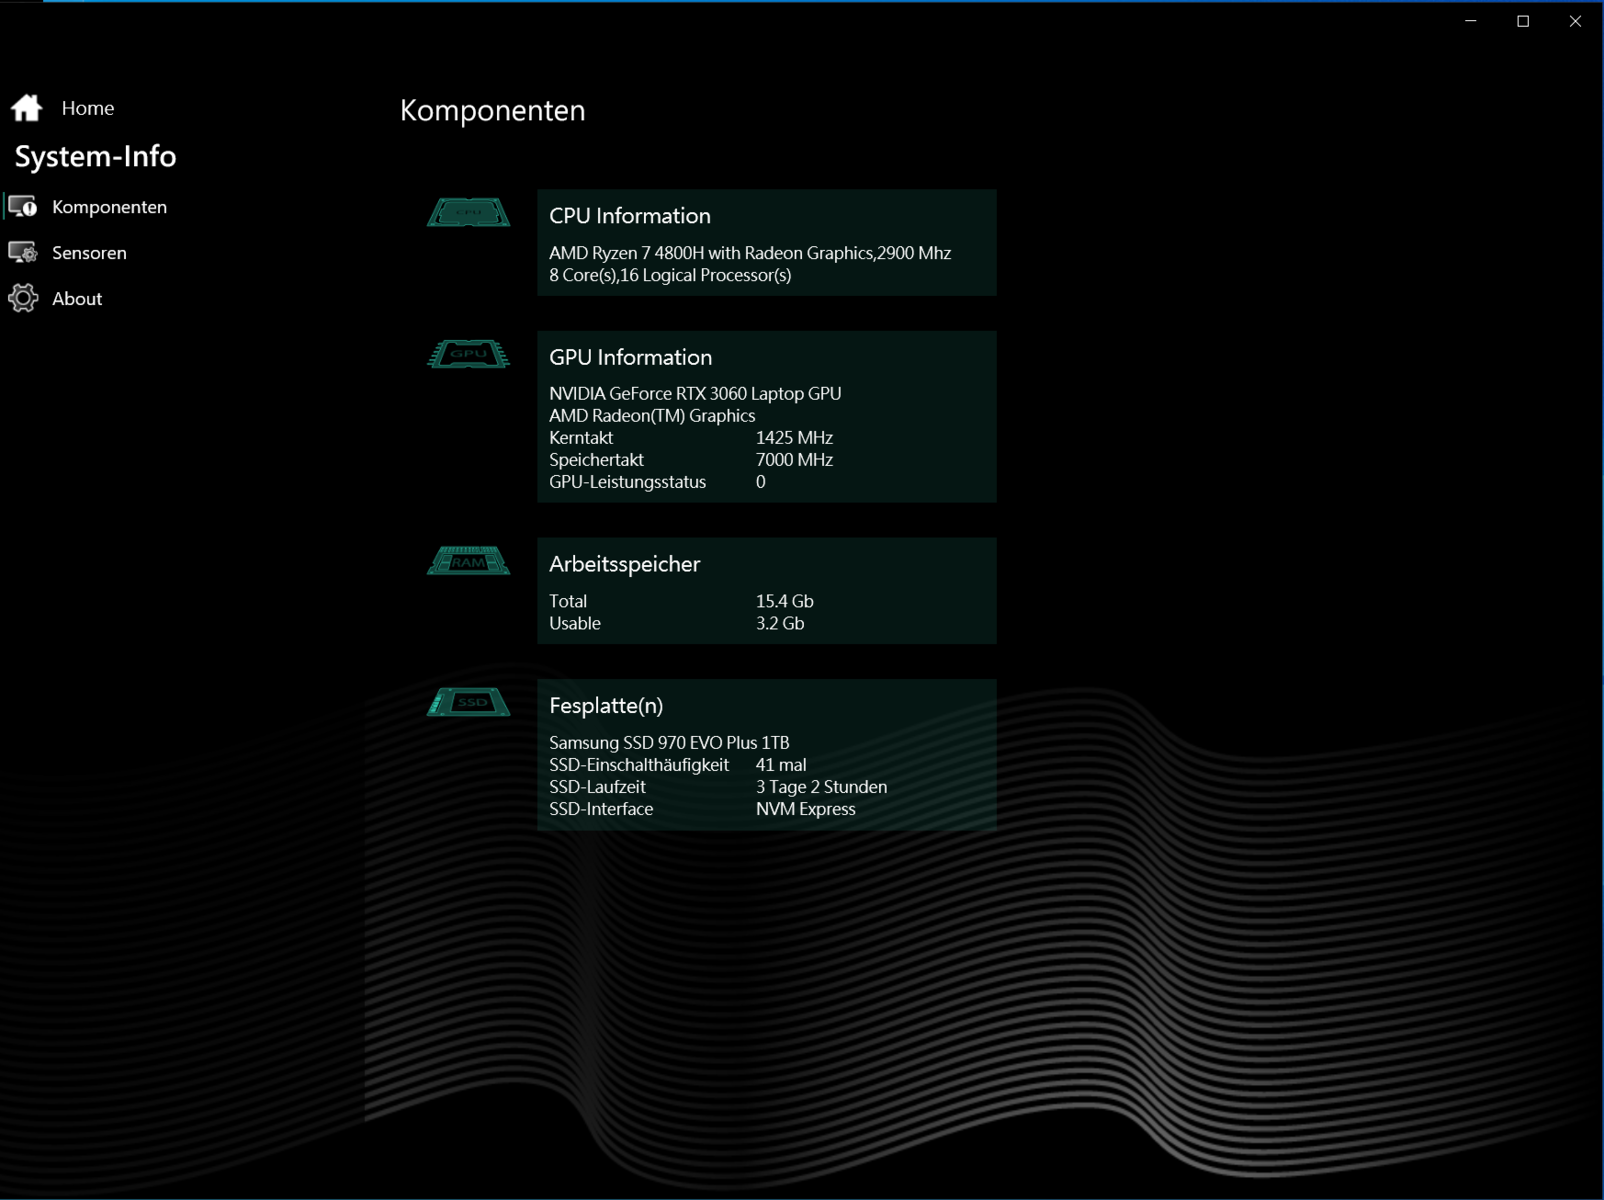
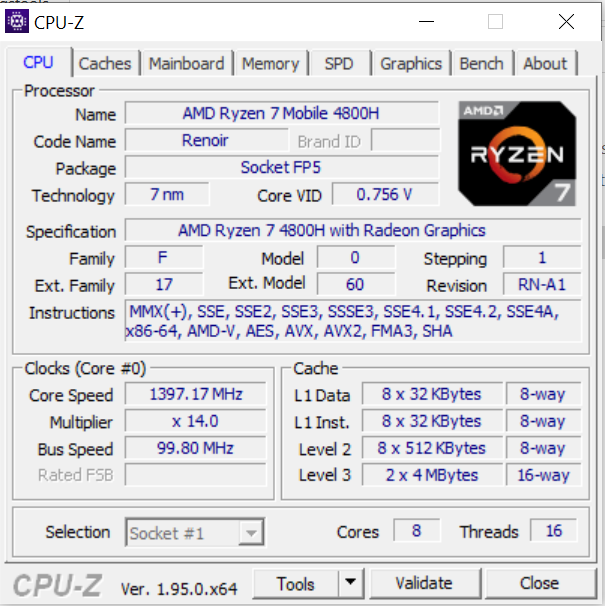
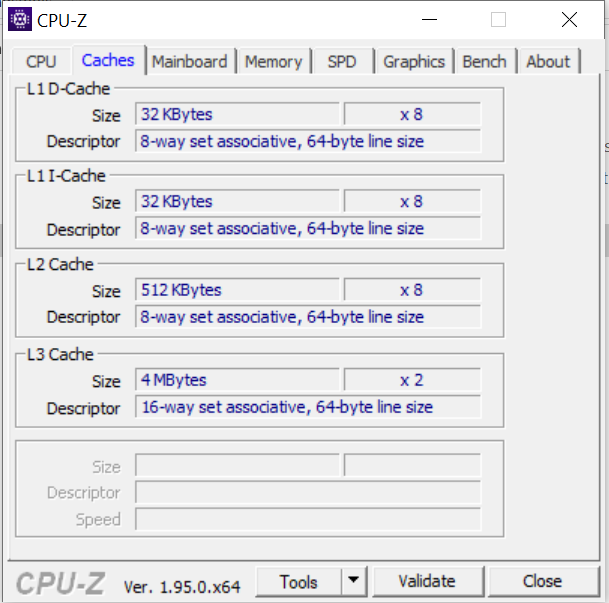
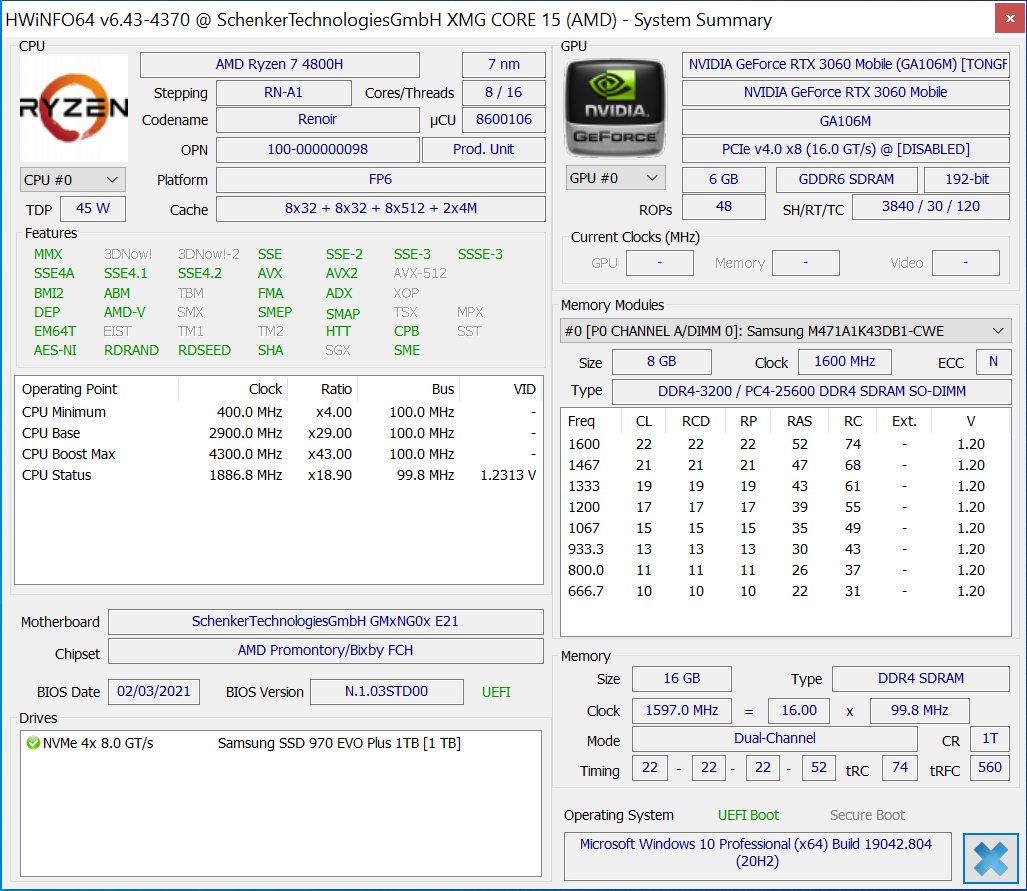
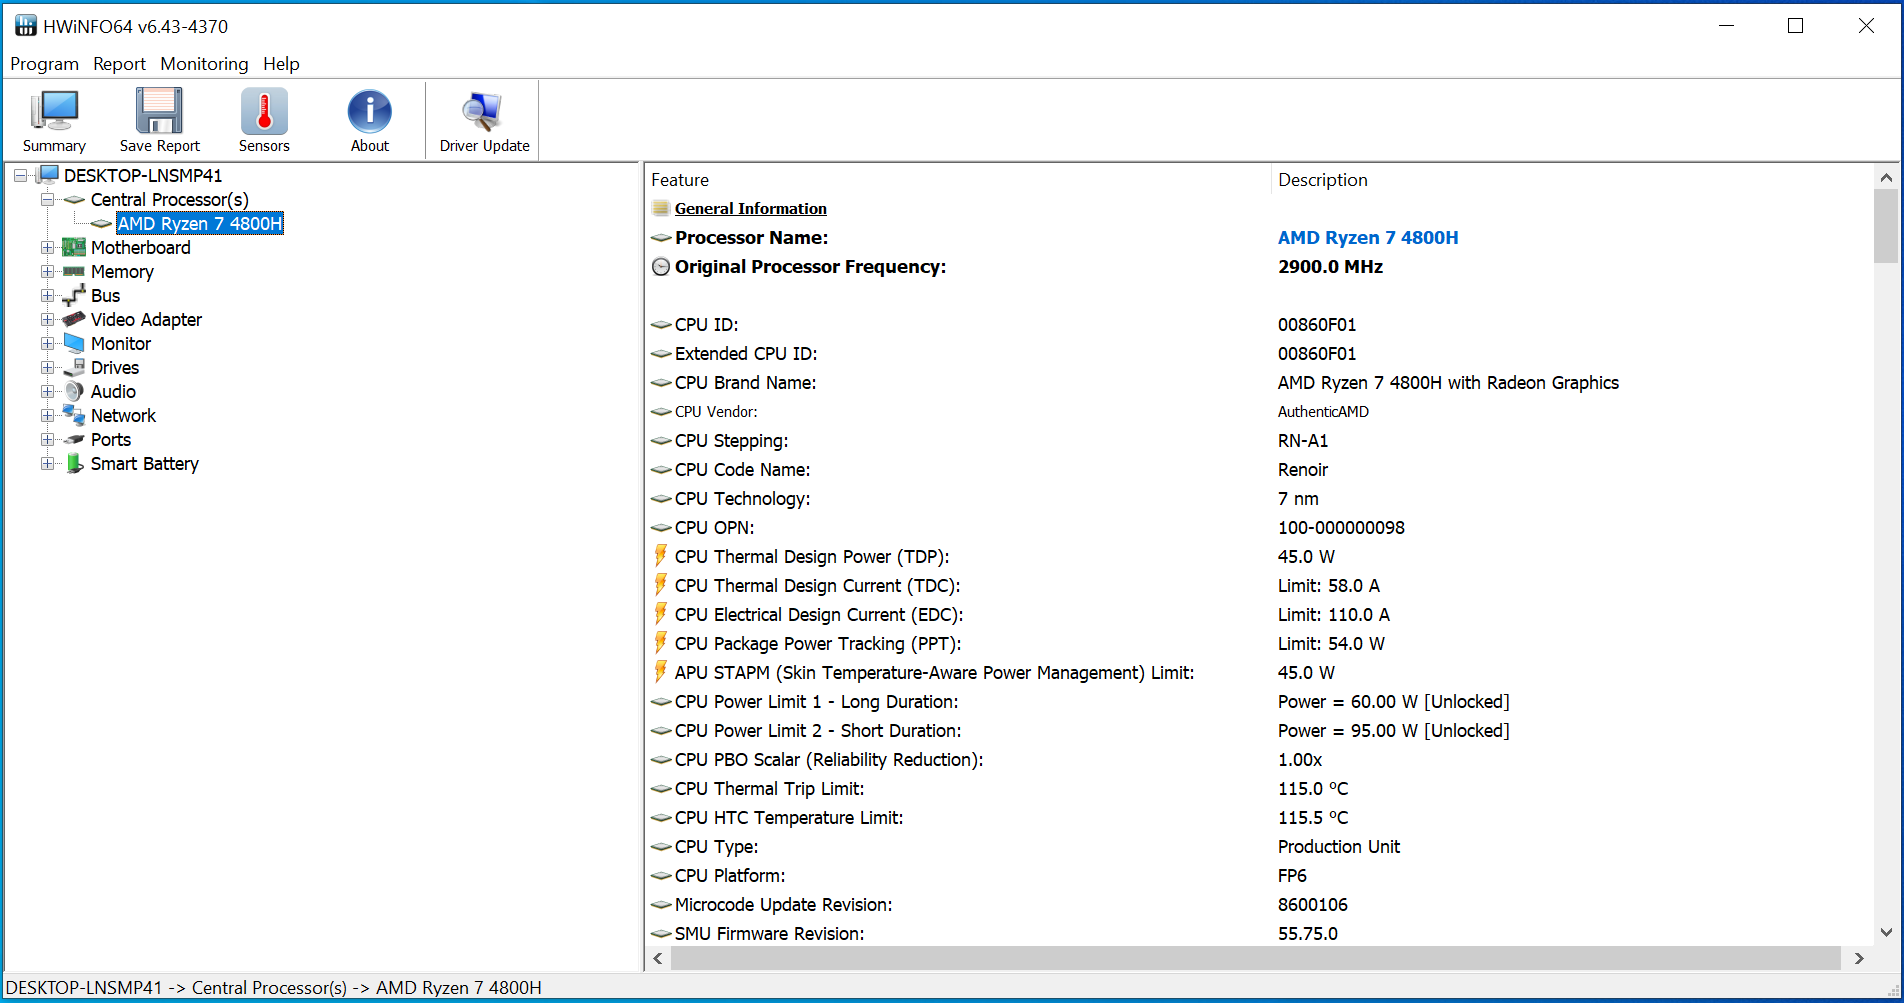
Processor
The Core 15 is powered by a Ryzen 7 4800H (Renoir). The CPU part of the APU consists of an octa-core processor that operates at a base speed of 2.9 GHz. An increase to up to 4.3 GHz is possible via Turbo. Simultaneous multithreading (two threads can be processed per core) is supported.
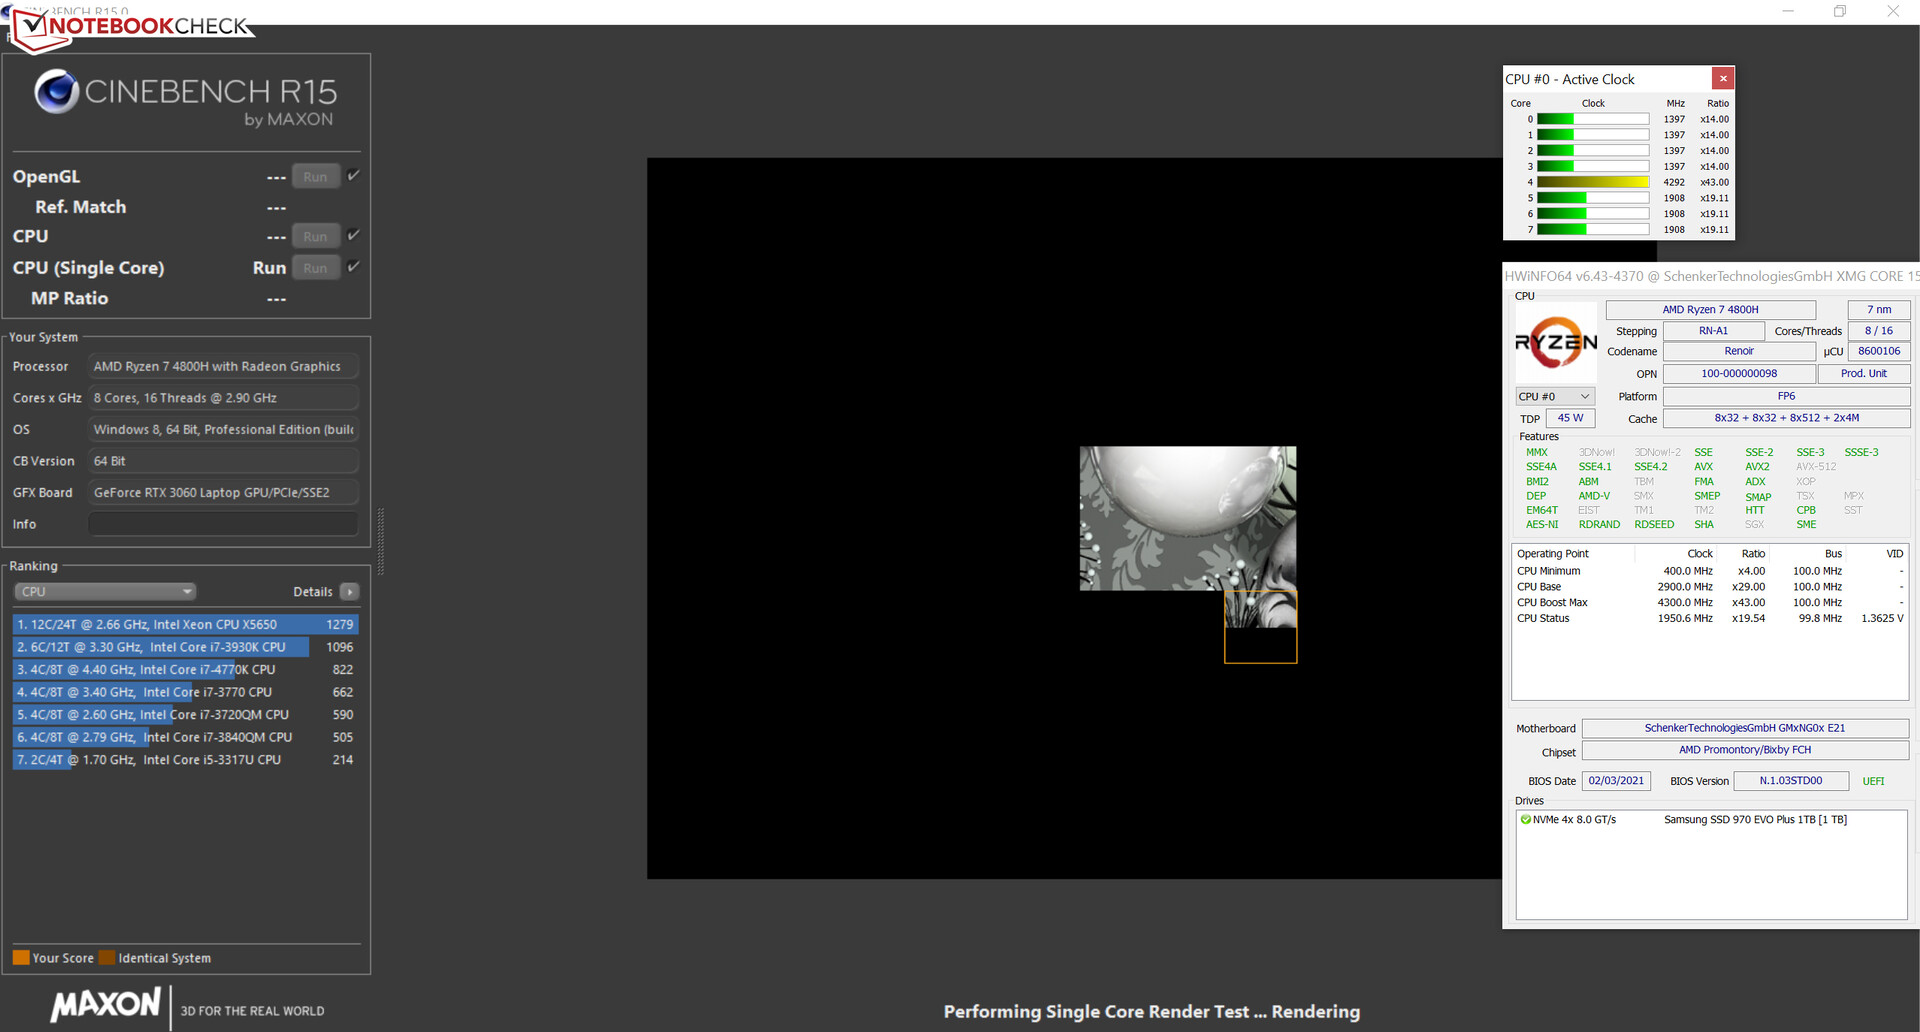
The multithread tests of the Cinebench benchmarks are run at 4 to 4.2 GHz (plugged in) and 2.9 to 3 GHz (battery power). The single-thread tests are processed at 1.4 to 4.3 GHz (when plugged in and on batter power).
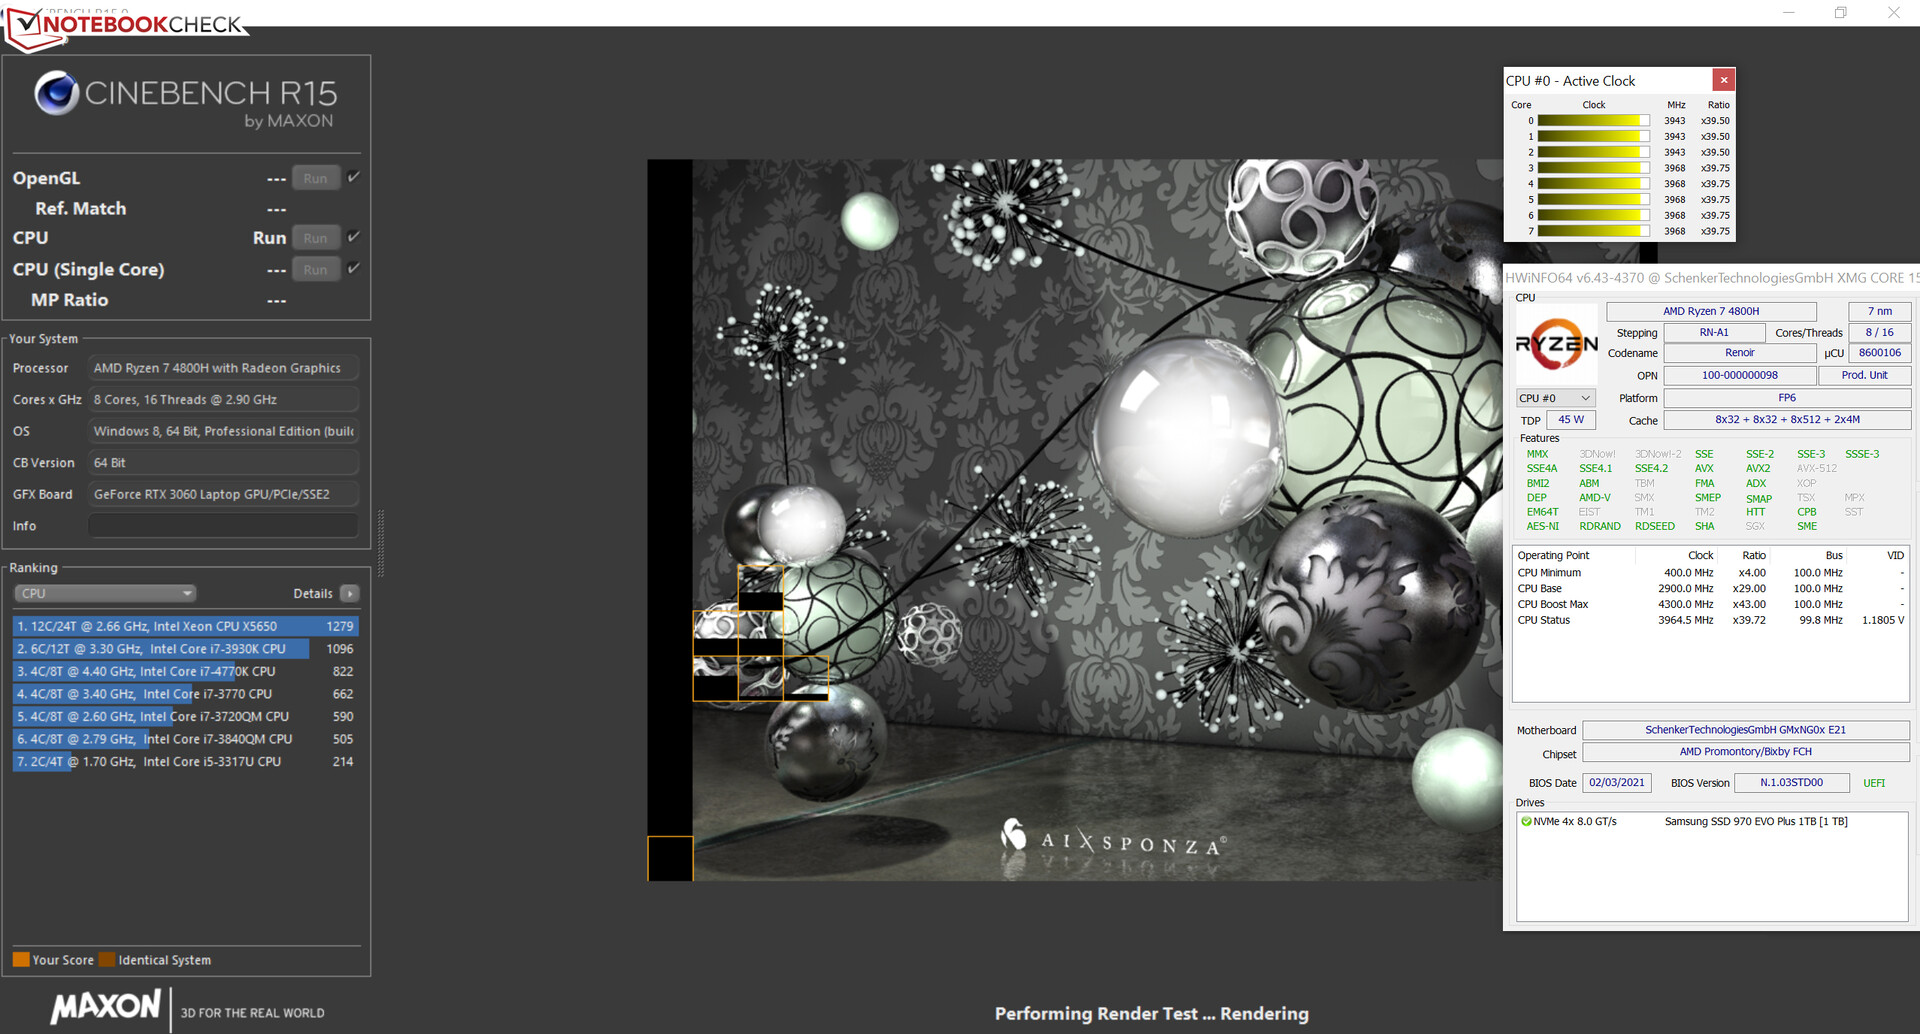
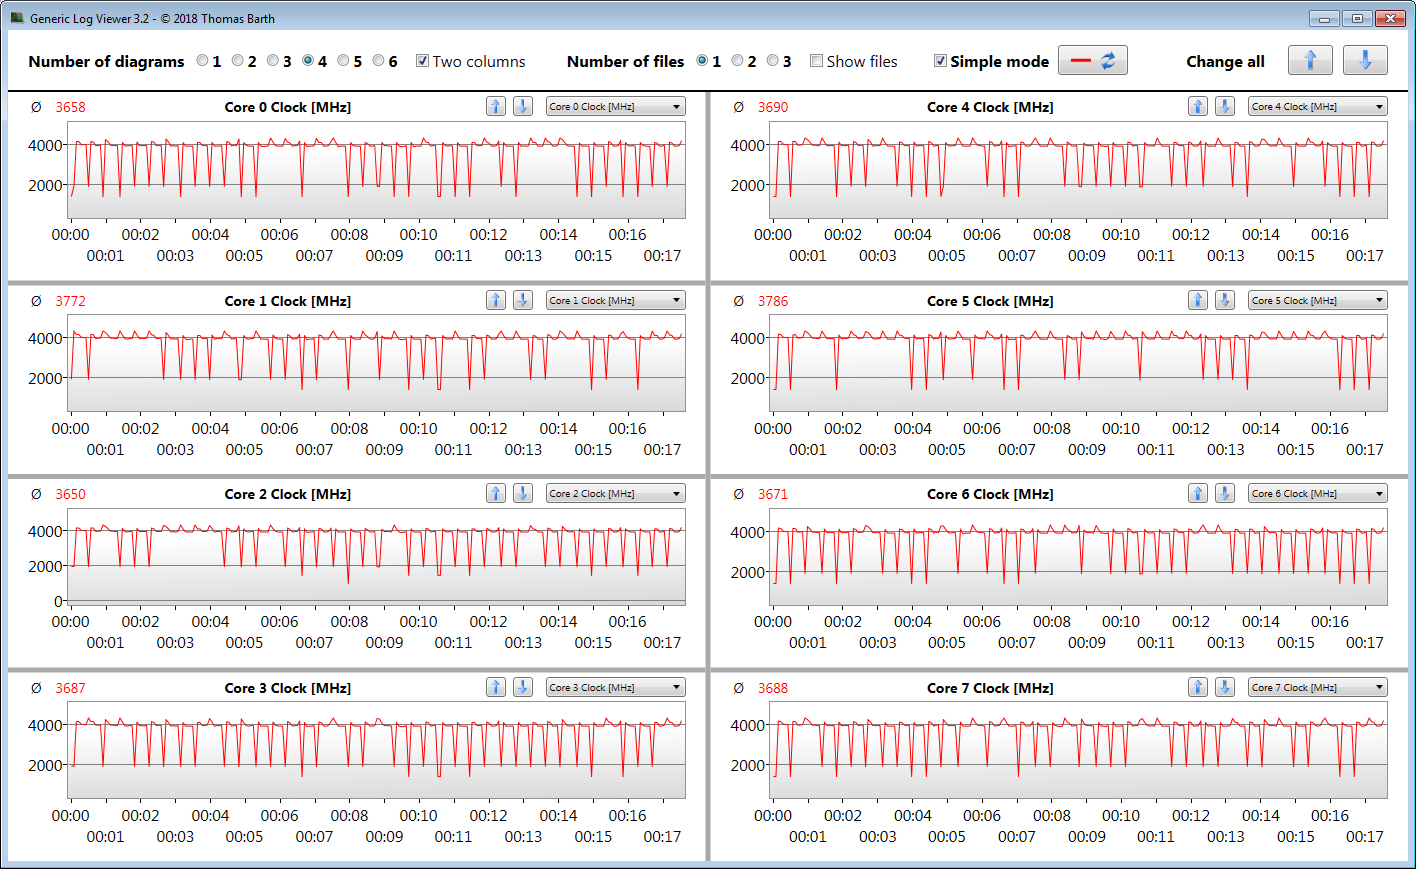
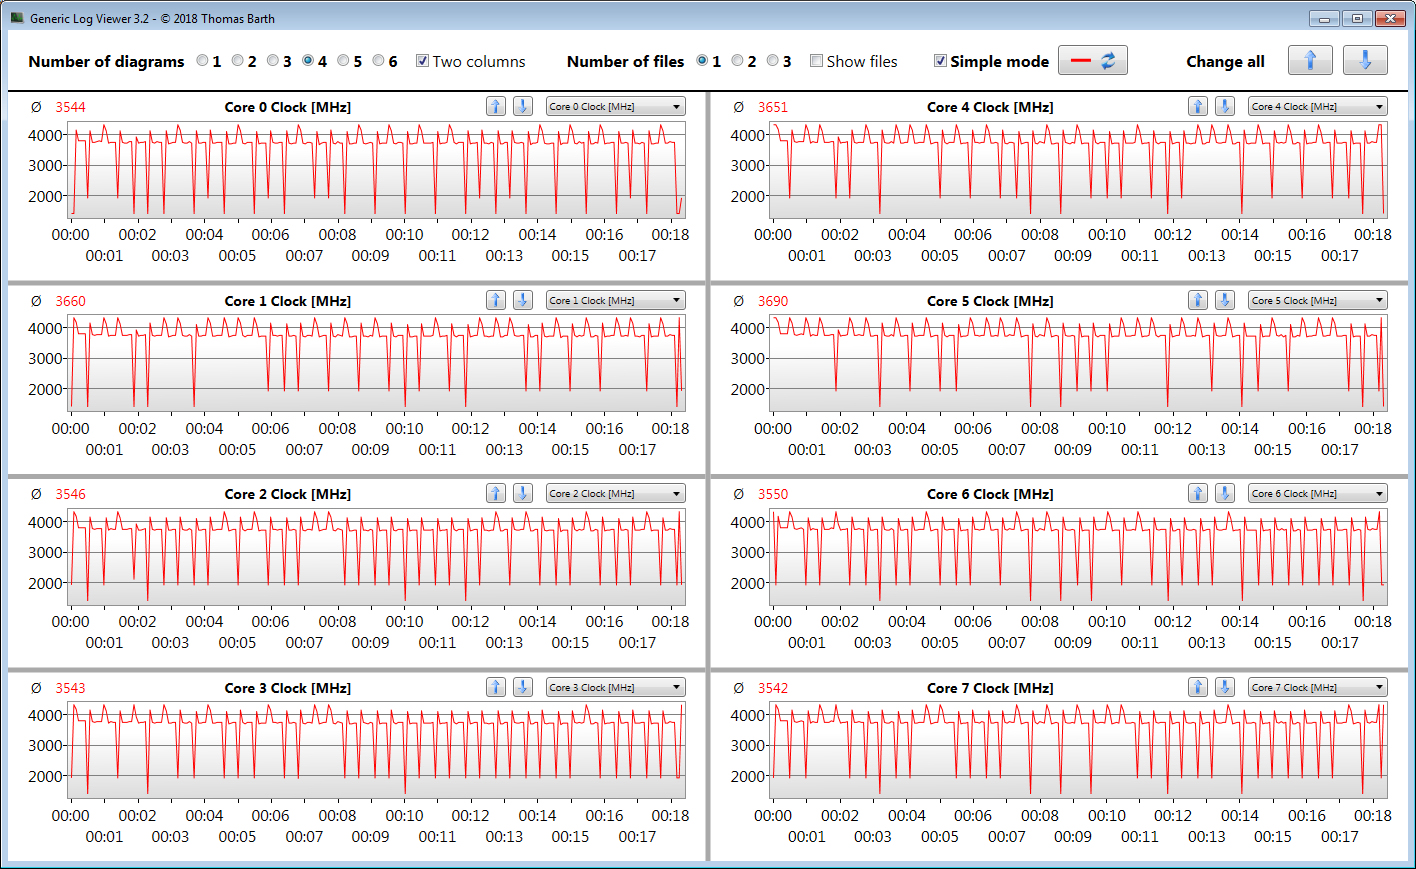
We check whether the CPU Turbo is used consistently when plugged in by running the Cinebench R15 benchmark's multithread test in a loop for a minimum of 30 minutes. Turbo is used to a great extent.
| Cinebench R15 | |
| CPU Single 64Bit | |
| Average of class Gaming (191.9 - 343, n=147, last 2 years) | |
| Asus TUF Dash F15 FX516PR | |
| Aorus 15G XC | |
| Acer Predator Triton 300 PT315-52-79LP | |
| SCHENKER XMG Core 15 Ampere | |
| HP Omen 15-en0375ng | |
| Average AMD Ryzen 7 4800H (186 - 191, n=15) | |
| SCHENKER XMG Core 15 GK5NR0O | |
| CPU Multi 64Bit | |
| Average of class Gaming (1537 - 6271, n=148, last 2 years) | |
| SCHENKER XMG Core 15 Ampere | |
| SCHENKER XMG Core 15 GK5NR0O | |
| HP Omen 15-en0375ng | |
| Average AMD Ryzen 7 4800H (1652 - 1995, n=21) | |
| SCHENKER XMG Core 15 Ampere (Enthusiast) | |
| Aorus 15G XC | |
| SCHENKER XMG Core 15 Ampere (Balanced) | |
| Acer Predator Triton 300 PT315-52-79LP | |
| Asus TUF Dash F15 FX516PR | |
| Blender - v2.79 BMW27 CPU | |
| Asus TUF Dash F15 FX516PR | |
| Acer Predator Triton 300 PT315-52-79LP | |
| SCHENKER XMG Core 15 Ampere (Balanced) | |
| Aorus 15G XC | |
| Average AMD Ryzen 7 4800H (248 - 299, n=15) | |
| SCHENKER XMG Core 15 Ampere (Enthusiast) | |
| HP Omen 15-en0375ng | |
| SCHENKER XMG Core 15 GK5NR0O | |
| SCHENKER XMG Core 15 Ampere | |
| Average of class Gaming (80 - 517, n=144, last 2 years) | |
| 7-Zip 18.03 | |
| 7z b 4 -mmt1 | |
| Average of class Gaming (4199 - 7508, n=146, last 2 years) | |
| Aorus 15G XC | |
| Asus TUF Dash F15 FX516PR | |
| Acer Predator Triton 300 PT315-52-79LP | |
| SCHENKER XMG Core 15 Ampere | |
| SCHENKER XMG Core 15 Ampere (Balanced) | |
| SCHENKER XMG Core 15 Ampere (Enthusiast) | |
| Average AMD Ryzen 7 4800H (4575 - 4743, n=15) | |
| SCHENKER XMG Core 15 GK5NR0O | |
| HP Omen 15-en0375ng | |
| 7z b 4 | |
| Average of class Gaming (23795 - 148086, n=146, last 2 years) | |
| SCHENKER XMG Core 15 Ampere | |
| SCHENKER XMG Core 15 Ampere (Enthusiast) | |
| HP Omen 15-en0375ng | |
| Average AMD Ryzen 7 4800H (44827 - 53883, n=15) | |
| SCHENKER XMG Core 15 GK5NR0O | |
| SCHENKER XMG Core 15 Ampere (Balanced) | |
| Aorus 15G XC | |
| Acer Predator Triton 300 PT315-52-79LP | |
| Asus TUF Dash F15 FX516PR | |
| Cinebench R20 | |
| CPU (Single Core) | |
| Average of class Gaming (439 - 870, n=148, last 2 years) | |
| Asus TUF Dash F15 FX516PR | |
| SCHENKER XMG Core 15 Ampere | |
| SCHENKER XMG Core 15 Ampere (Enthusiast) | |
| SCHENKER XMG Core 15 Ampere (Balanced) | |
| HP Omen 15-en0375ng | |
| Average AMD Ryzen 7 4800H (462 - 491, n=17) | |
| SCHENKER XMG Core 15 GK5NR0O | |
| Acer Predator Triton 300 PT315-52-79LP | |
| Aorus 15G XC | |
| CPU (Multi Core) | |
| Average of class Gaming (2179 - 16108, n=148, last 2 years) | |
| SCHENKER XMG Core 15 Ampere | |
| SCHENKER XMG Core 15 GK5NR0O | |
| HP Omen 15-en0375ng | |
| Average AMD Ryzen 7 4800H (3692 - 4663, n=18) | |
| SCHENKER XMG Core 15 Ampere (Enthusiast) | |
| SCHENKER XMG Core 15 Ampere (Balanced) | |
| Aorus 15G XC | |
| Acer Predator Triton 300 PT315-52-79LP | |
| Asus TUF Dash F15 FX516PR | |
| Geekbench 5.5 | |
| Single-Core | |
| Average of class Gaming (986 - 2423, n=145, last 2 years) | |
| Asus TUF Dash F15 FX516PR | |
| Aorus 15G XC | |
| Acer Predator Triton 300 PT315-52-79LP | |
| SCHENKER XMG Core 15 Ampere | |
| HP Omen 15-en0375ng | |
| SCHENKER XMG Core 15 Ampere (Enthusiast) | |
| SCHENKER XMG Core 15 Ampere (Balanced) | |
| SCHENKER XMG Core 15 GK5NR0O | |
| Average AMD Ryzen 7 4800H (1154 - 1207, n=17) | |
| Multi-Core | |
| Average of class Gaming (4557 - 27010, n=145, last 2 years) | |
| SCHENKER XMG Core 15 Ampere | |
| SCHENKER XMG Core 15 Ampere (Enthusiast) | |
| HP Omen 15-en0375ng | |
| SCHENKER XMG Core 15 Ampere (Balanced) | |
| Average AMD Ryzen 7 4800H (5920 - 8672, n=17) | |
| Aorus 15G XC | |
| SCHENKER XMG Core 15 GK5NR0O | |
| Acer Predator Triton 300 PT315-52-79LP | |
| Asus TUF Dash F15 FX516PR | |
| HWBOT x265 Benchmark v2.2 - 4k Preset | |
| Average of class Gaming (7.7 - 44.3, n=146, last 2 years) | |
| SCHENKER XMG Core 15 Ampere | |
| SCHENKER XMG Core 15 Ampere (Enthusiast) | |
| HP Omen 15-en0375ng | |
| Average AMD Ryzen 7 4800H (10.8 - 14.1, n=16) | |
| Aorus 15G XC | |
| SCHENKER XMG Core 15 GK5NR0O | |
| SCHENKER XMG Core 15 Ampere (Balanced) | |
| Acer Predator Triton 300 PT315-52-79LP | |
| Asus TUF Dash F15 FX516PR | |
| LibreOffice - 20 Documents To PDF | |
| HP Omen 15-en0375ng | |
| Average AMD Ryzen 7 4800H (28.6 - 95.8, n=14) | |
| SCHENKER XMG Core 15 GK5NR0O | |
| SCHENKER XMG Core 15 Ampere | |
| Asus TUF Dash F15 FX516PR | |
| SCHENKER XMG Core 15 Ampere (Enthusiast) | |
| Aorus 15G XC | |
| Average of class Gaming (19 - 96.6, n=144, last 2 years) | |
| Acer Predator Triton 300 PT315-52-79LP | |
| R Benchmark 2.5 - Overall mean | |
| Acer Predator Triton 300 PT315-52-79LP | |
| Aorus 15G XC | |
| SCHENKER XMG Core 15 GK5NR0O | |
| Average AMD Ryzen 7 4800H (0.562 - 0.603, n=15) | |
| HP Omen 15-en0375ng | |
| SCHENKER XMG Core 15 Ampere | |
| SCHENKER XMG Core 15 Ampere (Enthusiast) | |
| Asus TUF Dash F15 FX516PR | |
| SCHENKER XMG Core 15 Ampere (Balanced) | |
| Average of class Gaming (0.3551 - 0.759, n=147, last 2 years) | |
* ... smaller is better
System performance
The laptop offers enough computing power for performance-demanding application areas like gaming, video editing, and image processing for years to come. The system also works well and smoothly. In addition, the PCMark results are very good.
| PCMark 8 Home Score Accelerated v2 | 4644 points | |
| PCMark 8 Creative Score Accelerated v2 | 6339 points | |
| PCMark 8 Work Score Accelerated v2 | 5453 points | |
| PCMark 10 Score | 6110 points | |
Help | ||
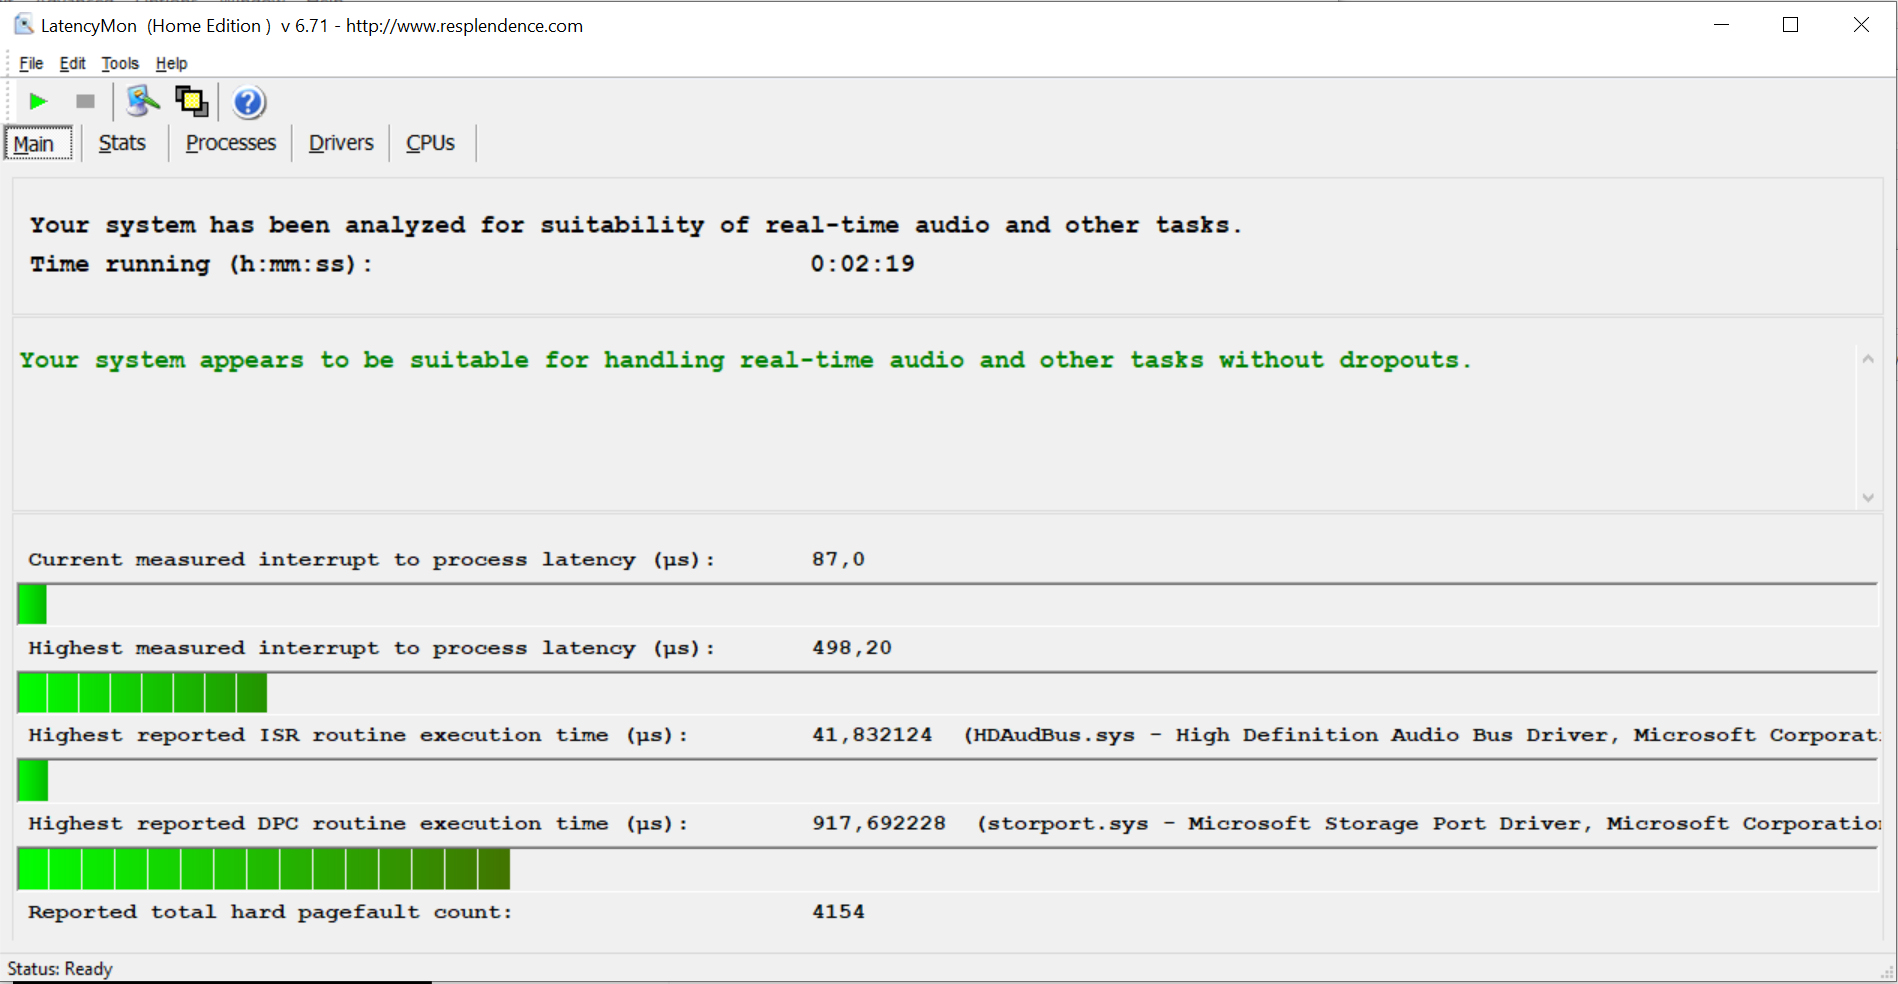
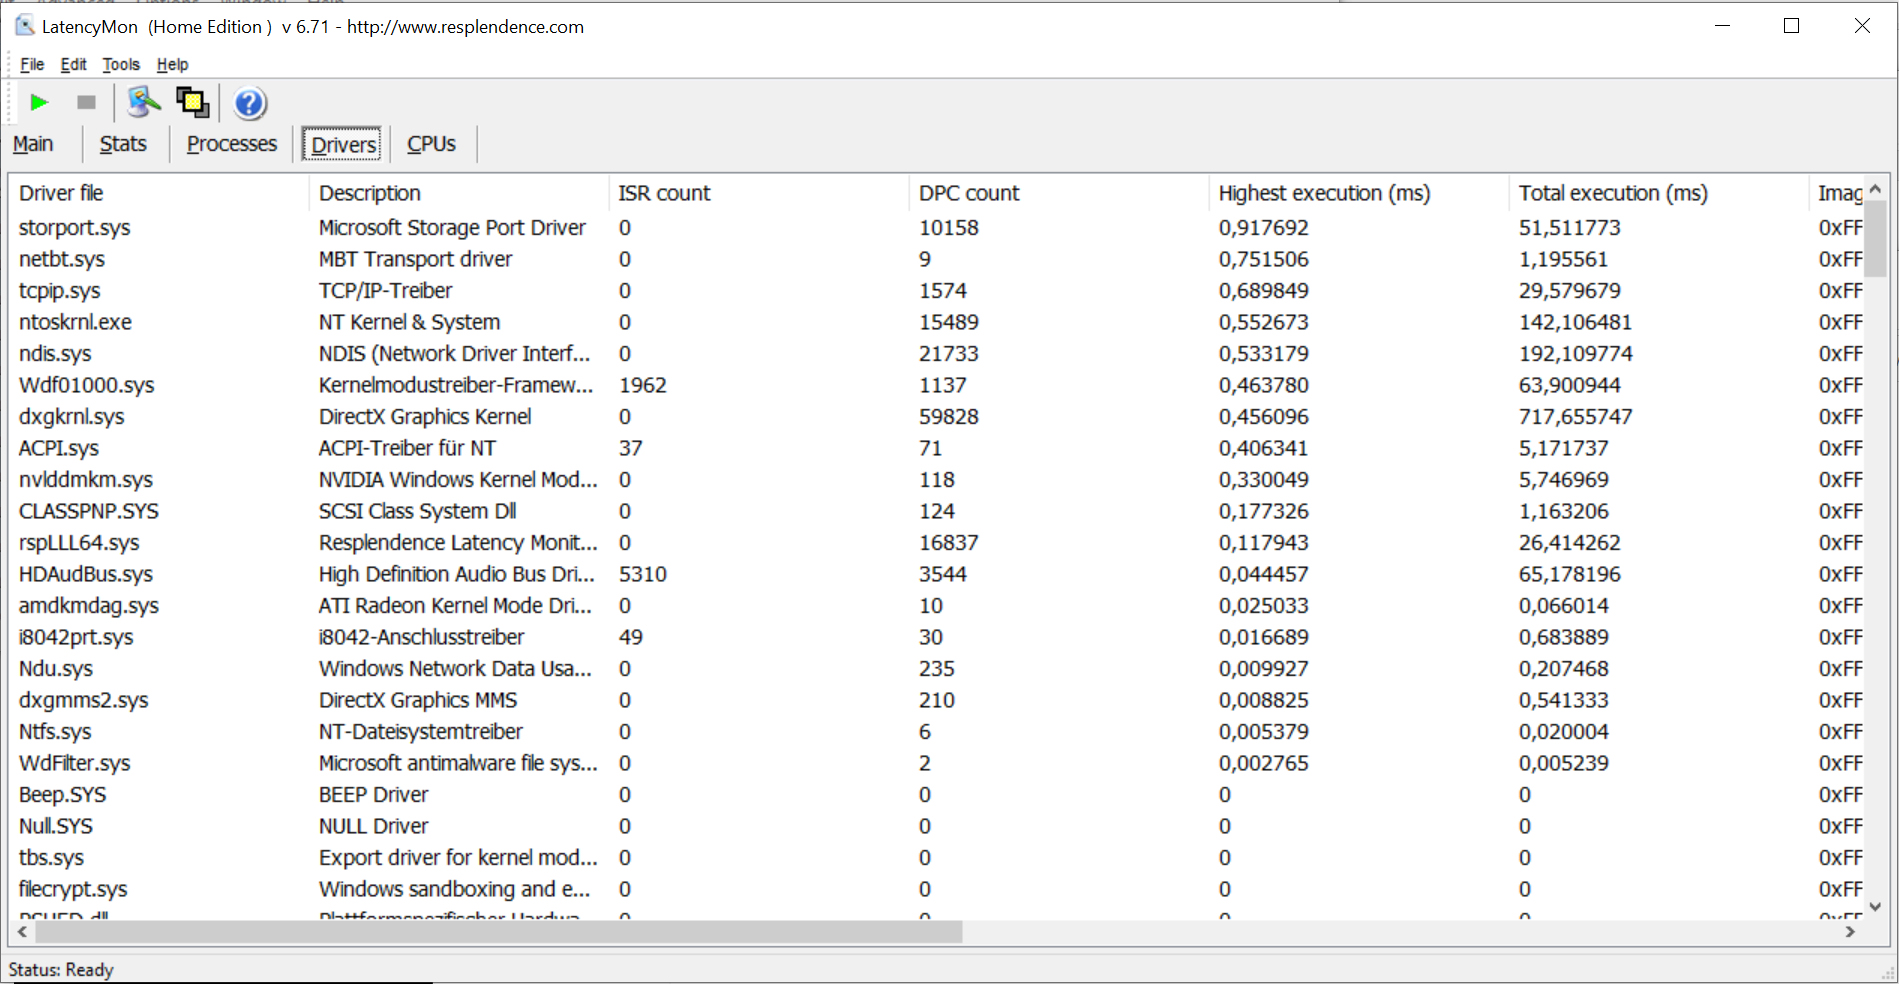
DPC latencies
In our standardized latency monitor test (web surfing, 4K video playback, high-load Prime95), we didn't observe any irregularities regarding DPC latencies. The system seems to be suitable for real-time video and audio editing.
| DPC Latencies / LatencyMon - interrupt to process latency (max), Web, Youtube, Prime95 | |
| Aorus 15G XC | |
| SCHENKER XMG Core 15 GK5NR0O | |
| Acer Predator Triton 300 PT315-52-79LP | |
| Asus TUF Dash F15 FX516PR | |
| HP Omen 15-en0375ng | |
| SCHENKER XMG Core 15 Ampere | |
* ... smaller is better
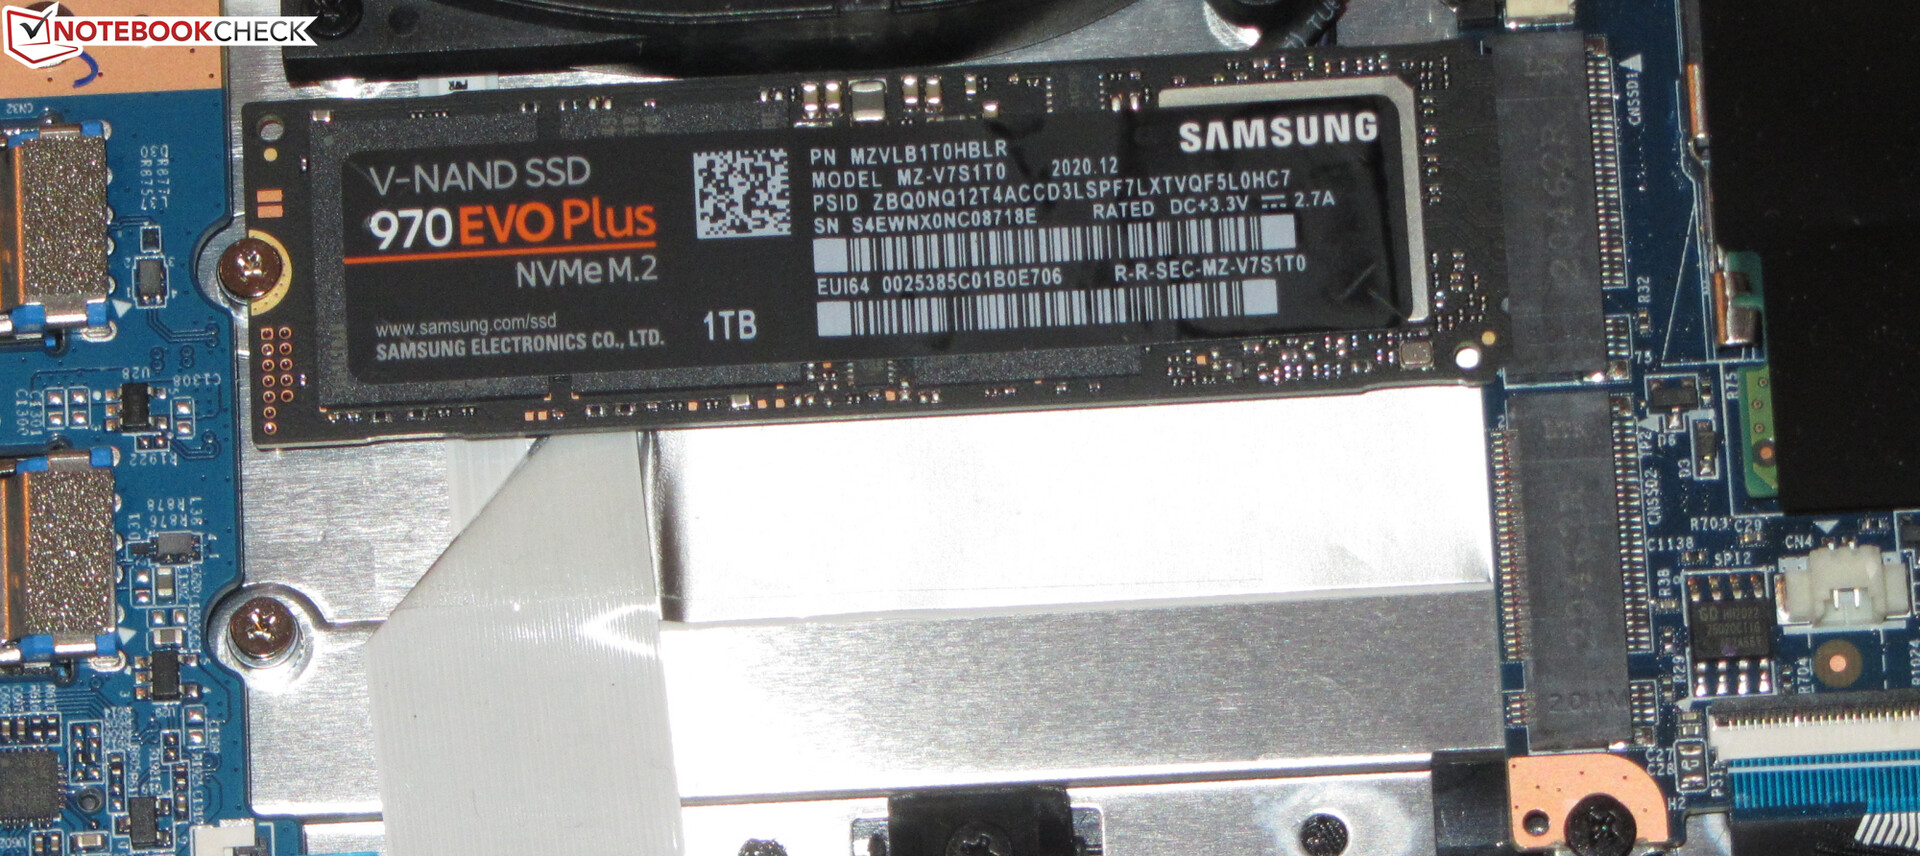
Storage
An NVMe SSD (M.2-2280) from Samsung serves as system drive. It provides 1 TB of storage space and delivers very good transfer rates. The laptop can accommodate a total of two NVMe SSDs. In addition, RAID 0 is supported.

| SCHENKER XMG Core 15 Ampere Samsung SSD 970 EVO Plus 1TB | Asus TUF Dash F15 FX516PR SK Hynix HFM001TD3JX013N | Aorus 15G XC ESR512GTLCG-EAC-4 | HP Omen 15-en0375ng WDC PC SN730 SDBPNTY-512G | Acer Predator Triton 300 PT315-52-79LP WDC PC SN730 SDBQNTY-1T00 | SCHENKER XMG Core 15 GK5NR0O Samsung SSD 970 EVO Plus 500GB | |
|---|---|---|---|---|---|---|
| CrystalDiskMark 5.2 / 6 | -21% | -9% | -12% | -12% | 13% | |
| Write 4K | 139.1 | 129.6 -7% | 137.6 -1% | 119.6 -14% | 117.5 -16% | 233 68% |
| Read 4K | 47.59 | 44.71 -6% | 45.87 -4% | 47.4 0% | 47.36 0% | 54.5 15% |
| Write Seq | 2917 | 1929 -34% | 2304 -21% | 2677 -8% | 2748 -6% | 3050 5% |
| Read Seq | 2586 | 2035 -21% | 1052 -59% | 2220 -14% | 2084 -19% | 3042 18% |
| Write 4K Q32T1 | 511 | 425.9 -17% | 601 18% | 427.4 -16% | 407.3 -20% | 520 2% |
| Read 4K Q32T1 | 571 | 433.4 -24% | 677 19% | 549 -4% | 474.6 -17% | 546 -4% |
| Write Seq Q32T1 | 3263 | 1390 -57% | 2536 -22% | 2706 -17% | 3069 -6% | 3241 -1% |
| Read Seq Q32T1 | 3567 | 3505 -2% | 3372 -5% | 2869 -20% | 3154 -12% | 3538 -1% |
| AS SSD | -58% | -53% | -41% | -28% | -5% | |
| Seq Read | 2829 | 2671 -6% | 2048 -28% | 2255 -20% | 2369 -16% | 2836 0% |
| Seq Write | 2646 | 1501 -43% | 2403 -9% | 2129 -20% | 2446 -8% | 2452 -7% |
| 4K Read | 54.8 | 39.65 -28% | 48.27 -12% | 49.5 -10% | 40.61 -26% | 60.4 10% |
| 4K Write | 179.1 | 69 -61% | 101.6 -43% | 175.1 -2% | 103.2 -42% | 190.5 6% |
| 4K-64 Read | 1734 | 1209 -30% | 1606 -7% | 1463 -16% | 1637 -6% | 1283 -26% |
| 4K-64 Write | 2396 | 1650 -31% | 1473 -39% | 2061 -14% | 1961 -18% | 2298 -4% |
| Access Time Read * | 0.033 | 0.093 -182% | 0.131 -297% | 0.138 -318% | 0.06 -82% | 0.034 -3% |
| Access Time Write * | 0.021 | 0.055 -162% | 0.038 -81% | 0.022 -5% | 0.036 -71% | 0.02 5% |
| Score Read | 2072 | 1516 -27% | 1859 -10% | 1738 -16% | 1915 -8% | 1627 -21% |
| Score Write | 2839 | 1869 -34% | 1815 -36% | 2449 -14% | 2309 -19% | 2734 -4% |
| Score Total | 5965 | 4105 -31% | 4645 -22% | 5075 -15% | 5205 -13% | 5184 -13% |
| Total Average (Program / Settings) | -40% /
-42% | -31% /
-35% | -27% /
-29% | -20% /
-21% | 4% /
2% |
* ... smaller is better
Continuous load read: DiskSpd Read Loop, Queue Depth 8
Graphics card
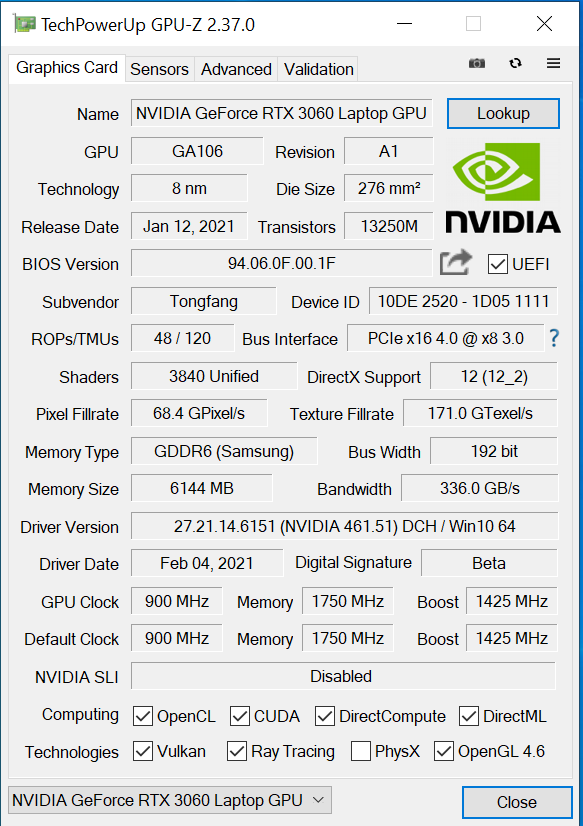
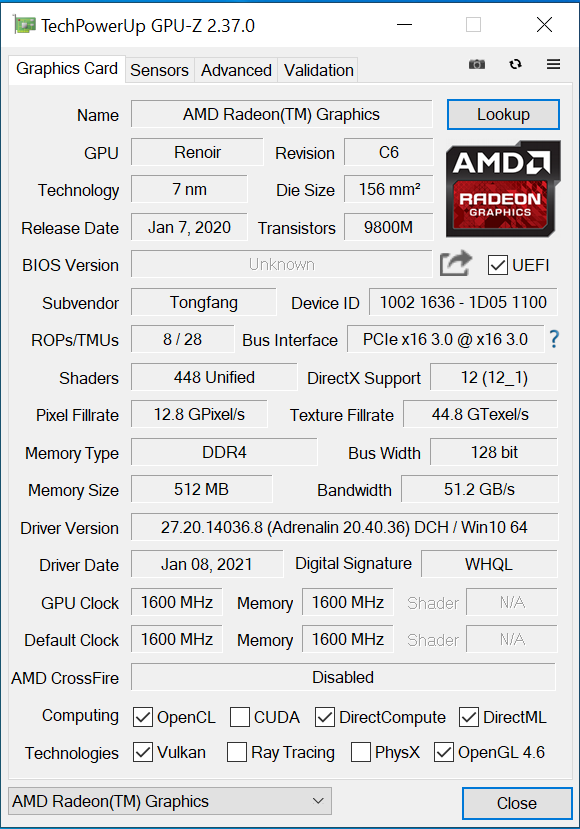
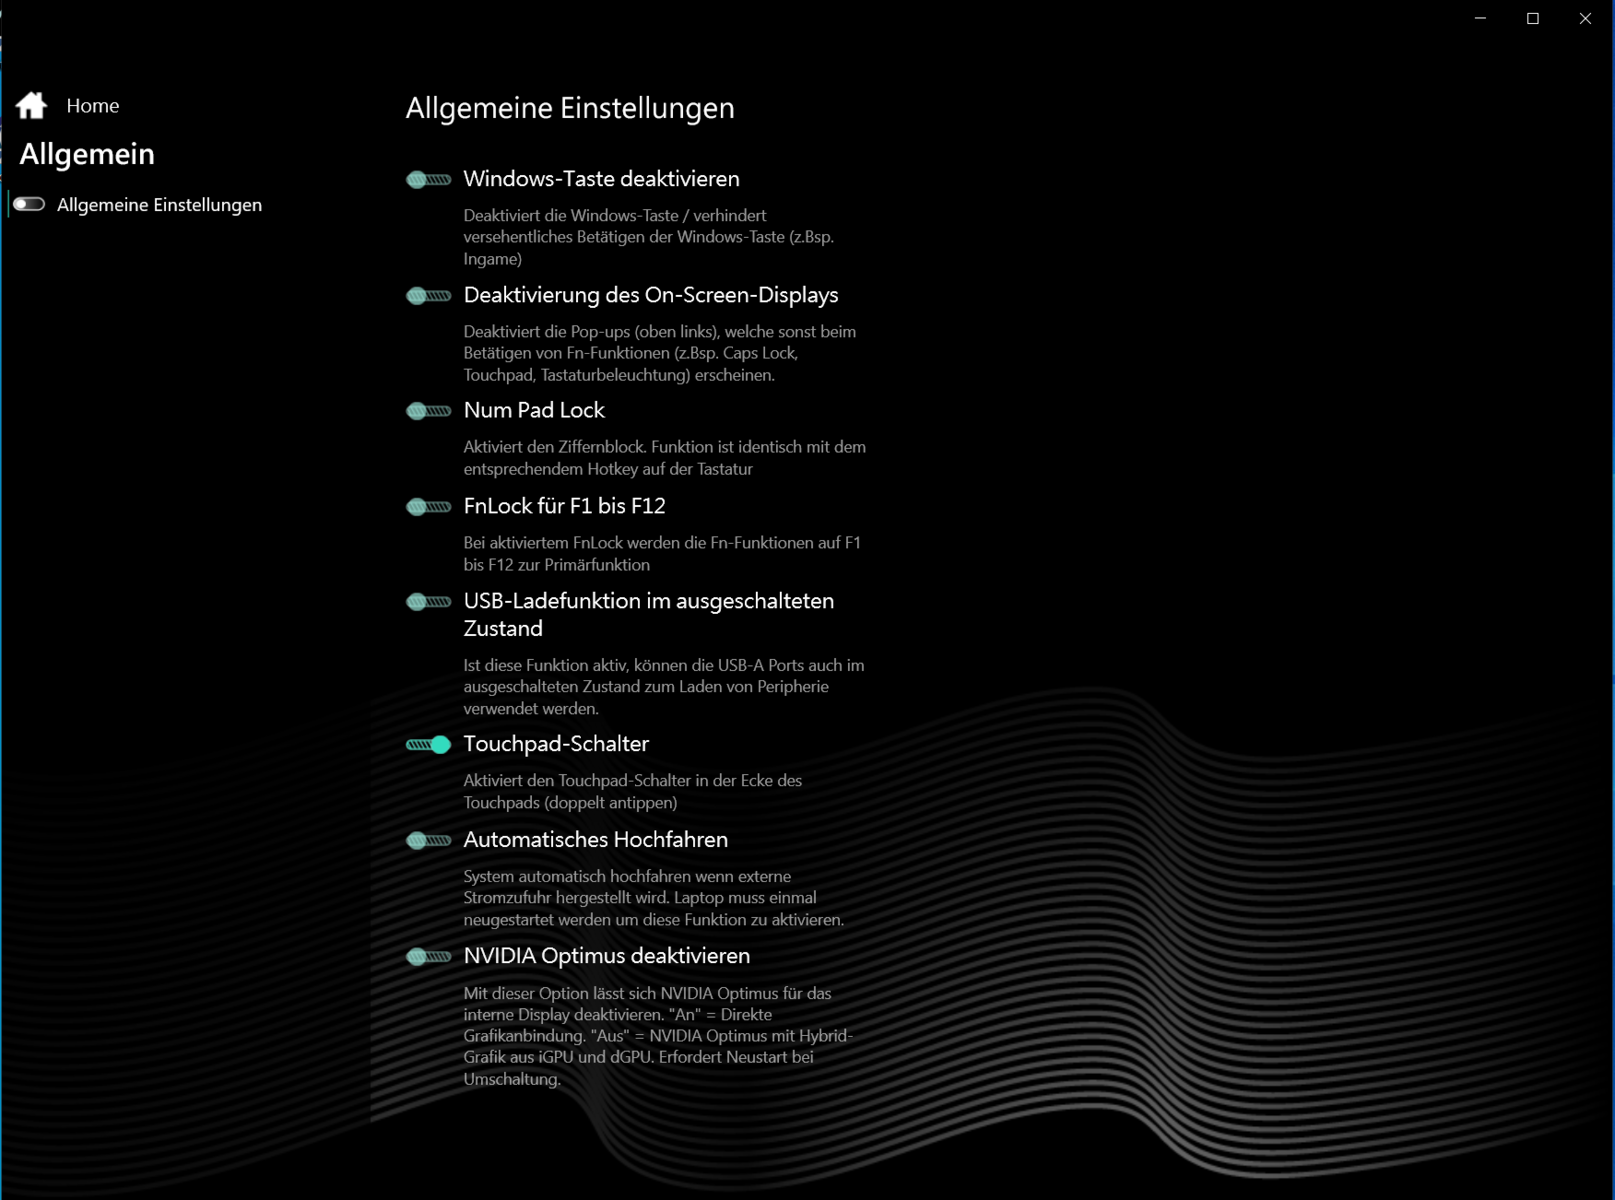
The GeForce RTX 3060 laptop graphics core is Nvidia's current entry-level high-end GPU model. The GPU can access fast GDDR6 graphics memory (6,144 MB). The Vega 7 graphics core integrated into the processor is active, and the laptop works with Nvidia's Optimus graphics-switching solution. The Vega 7 iGPU can be disabled within the BIOS or via the Control Center.
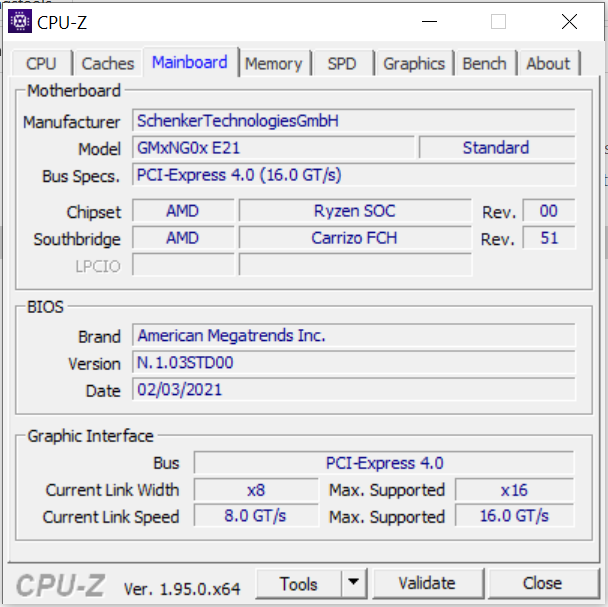
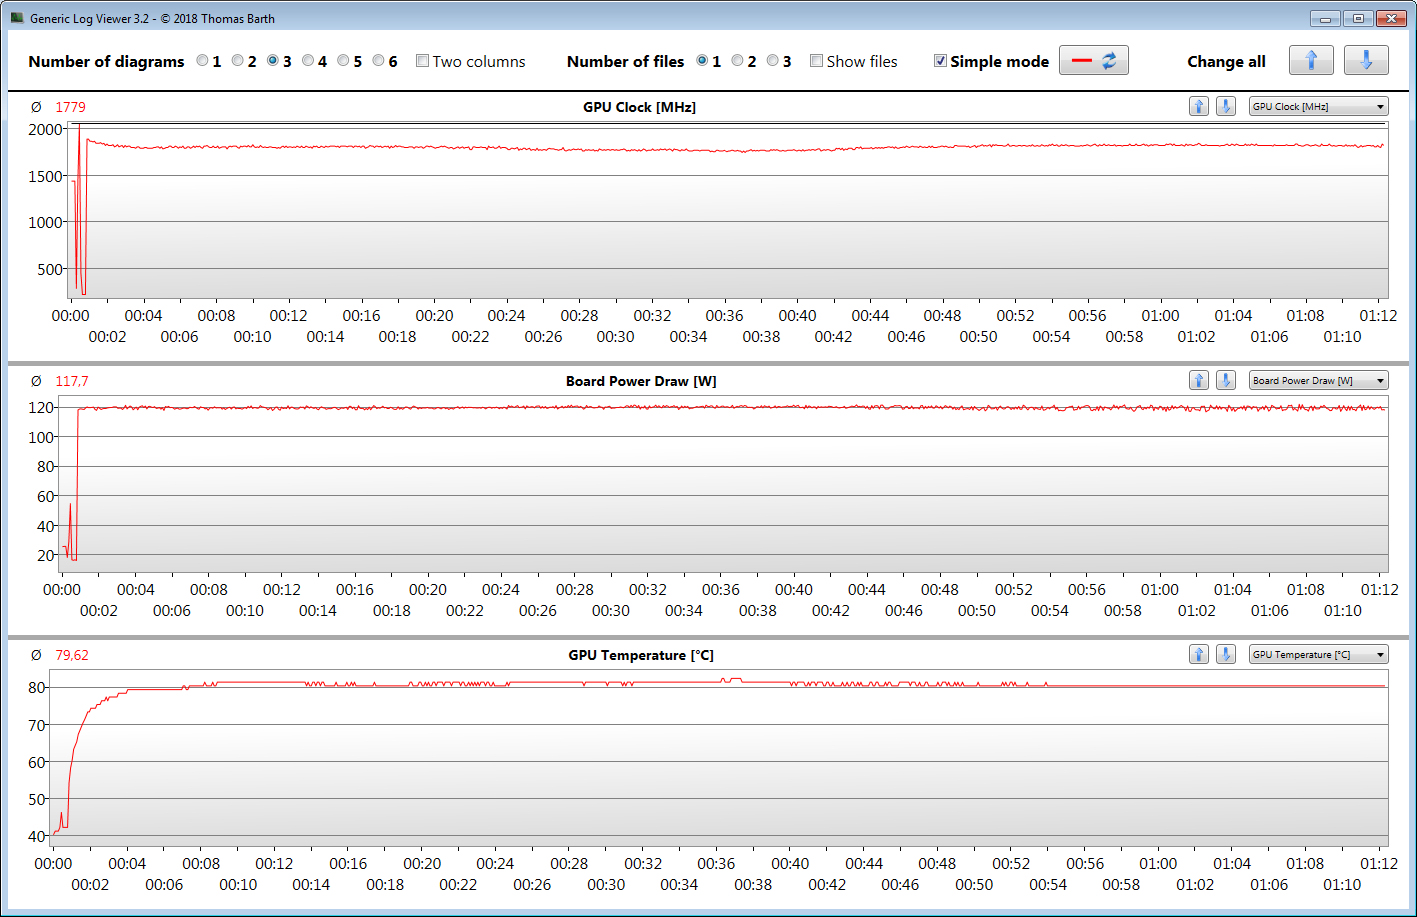
Laptop manufacturers can freely select the TGP and, therefore, the maximum available computing power of an RTX 3000 graphics core within the limits defined by Nvidia (overview of all RTX 3060 laptops including their TGPs). Schenker has set the TGP of the RTX 3060 to 120 watts (115 watts + 5 watts Dynamic Boost) in its default state. The Dynamic Boost has to be increased to 15 watts via the Control Center in order to use the potential maximum of 130 watts.
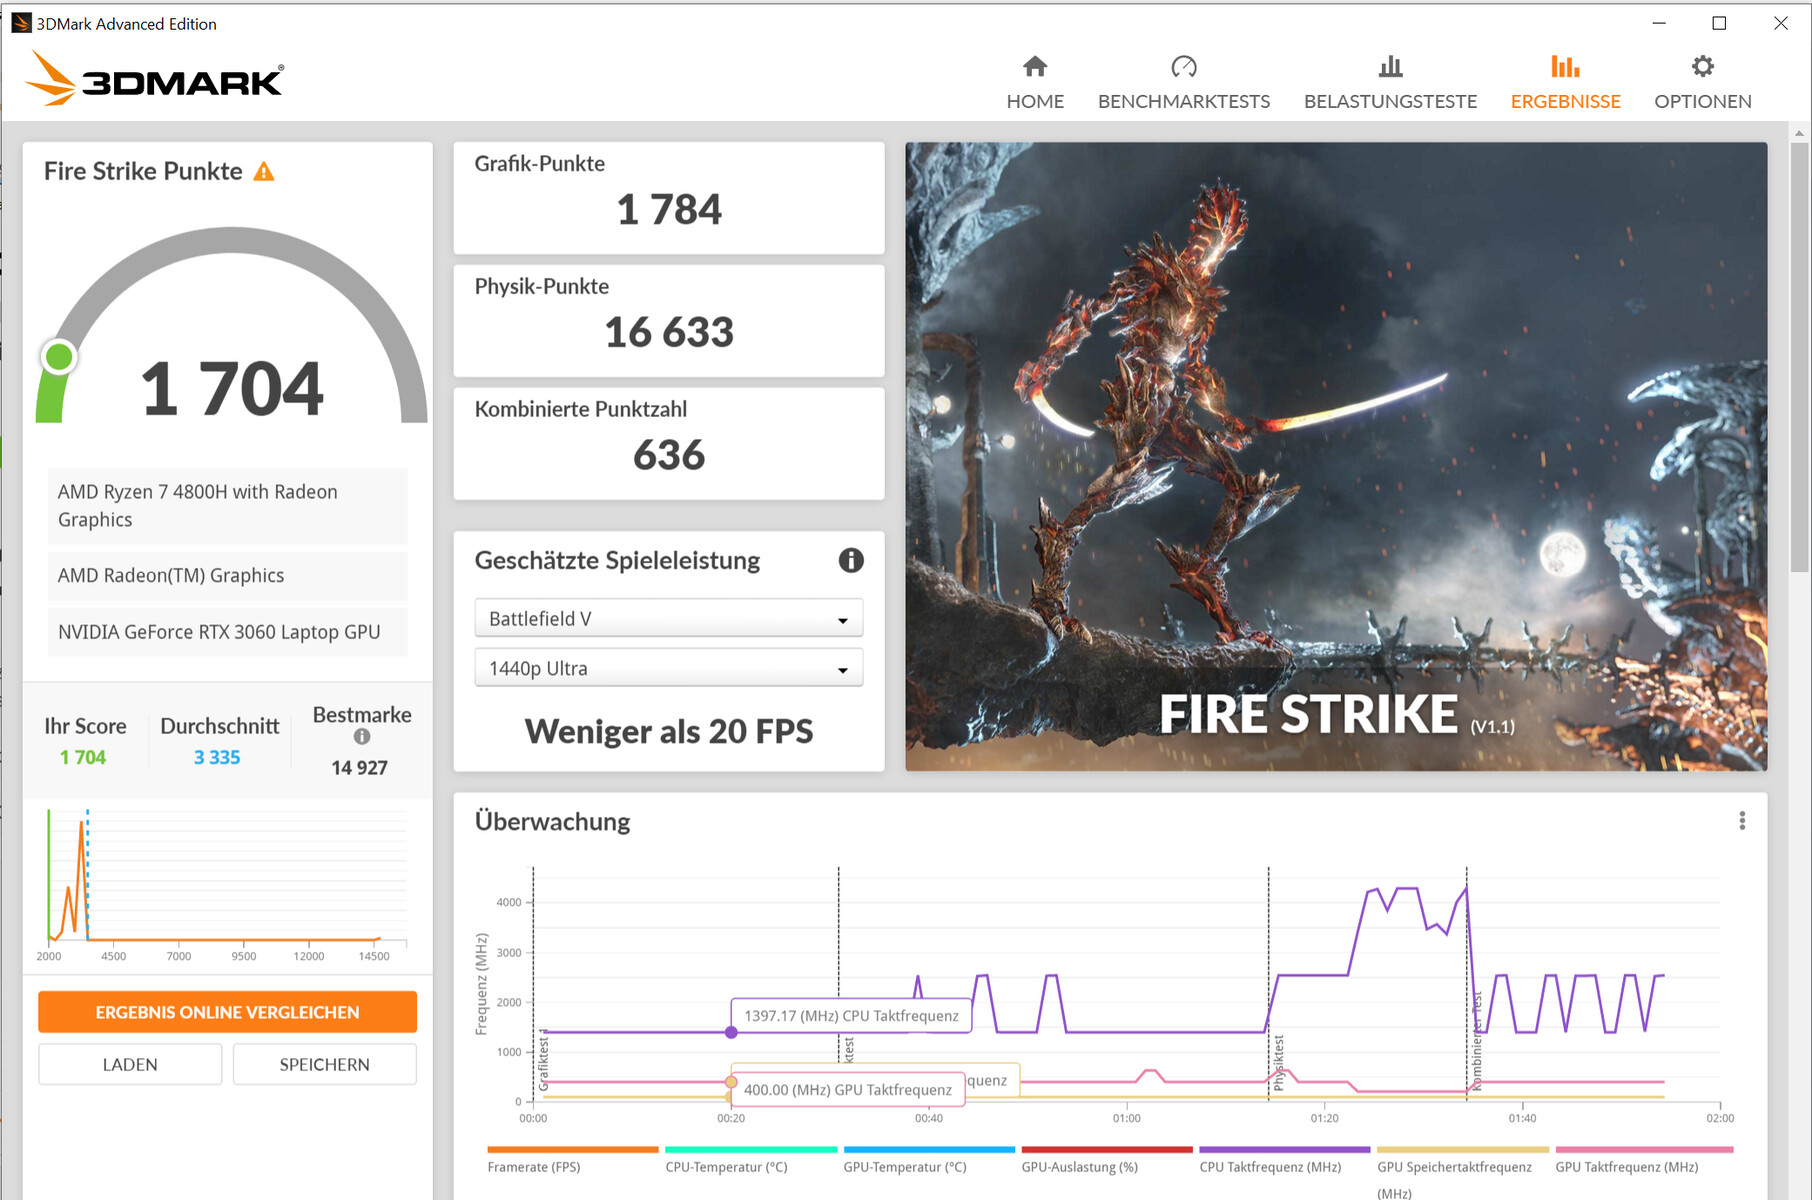
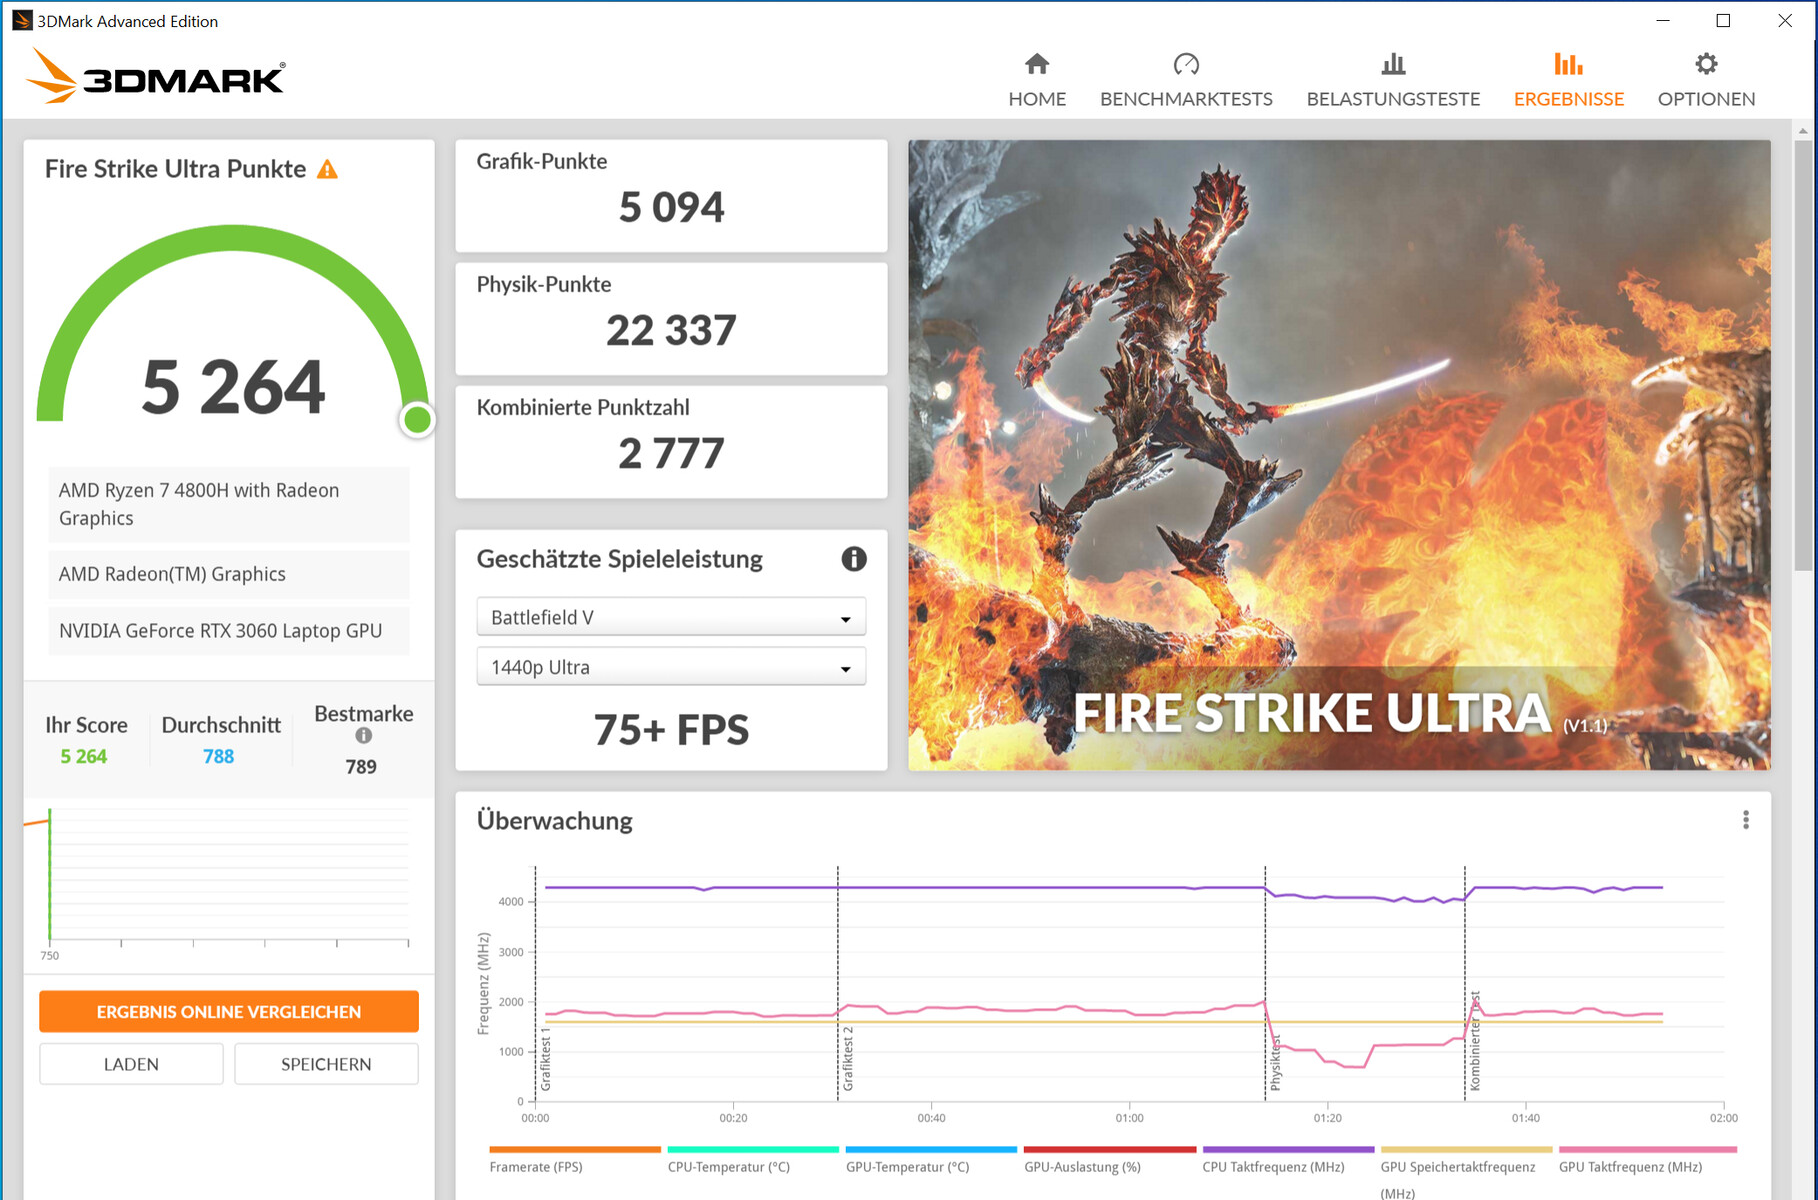
Since Schenker almost completely utilizes the TGP, the Core 15 scores very well in the GPU and gaming tests. The Asus TUF Dash F15 FX516PR, which is equipped with the nominally more powerful GeForce RTX 3070 laptop GPU, is clearly outperformed in some cases. The reason: Asus has set the TGP of the RTX 3070 at 85 watts, which is very low.
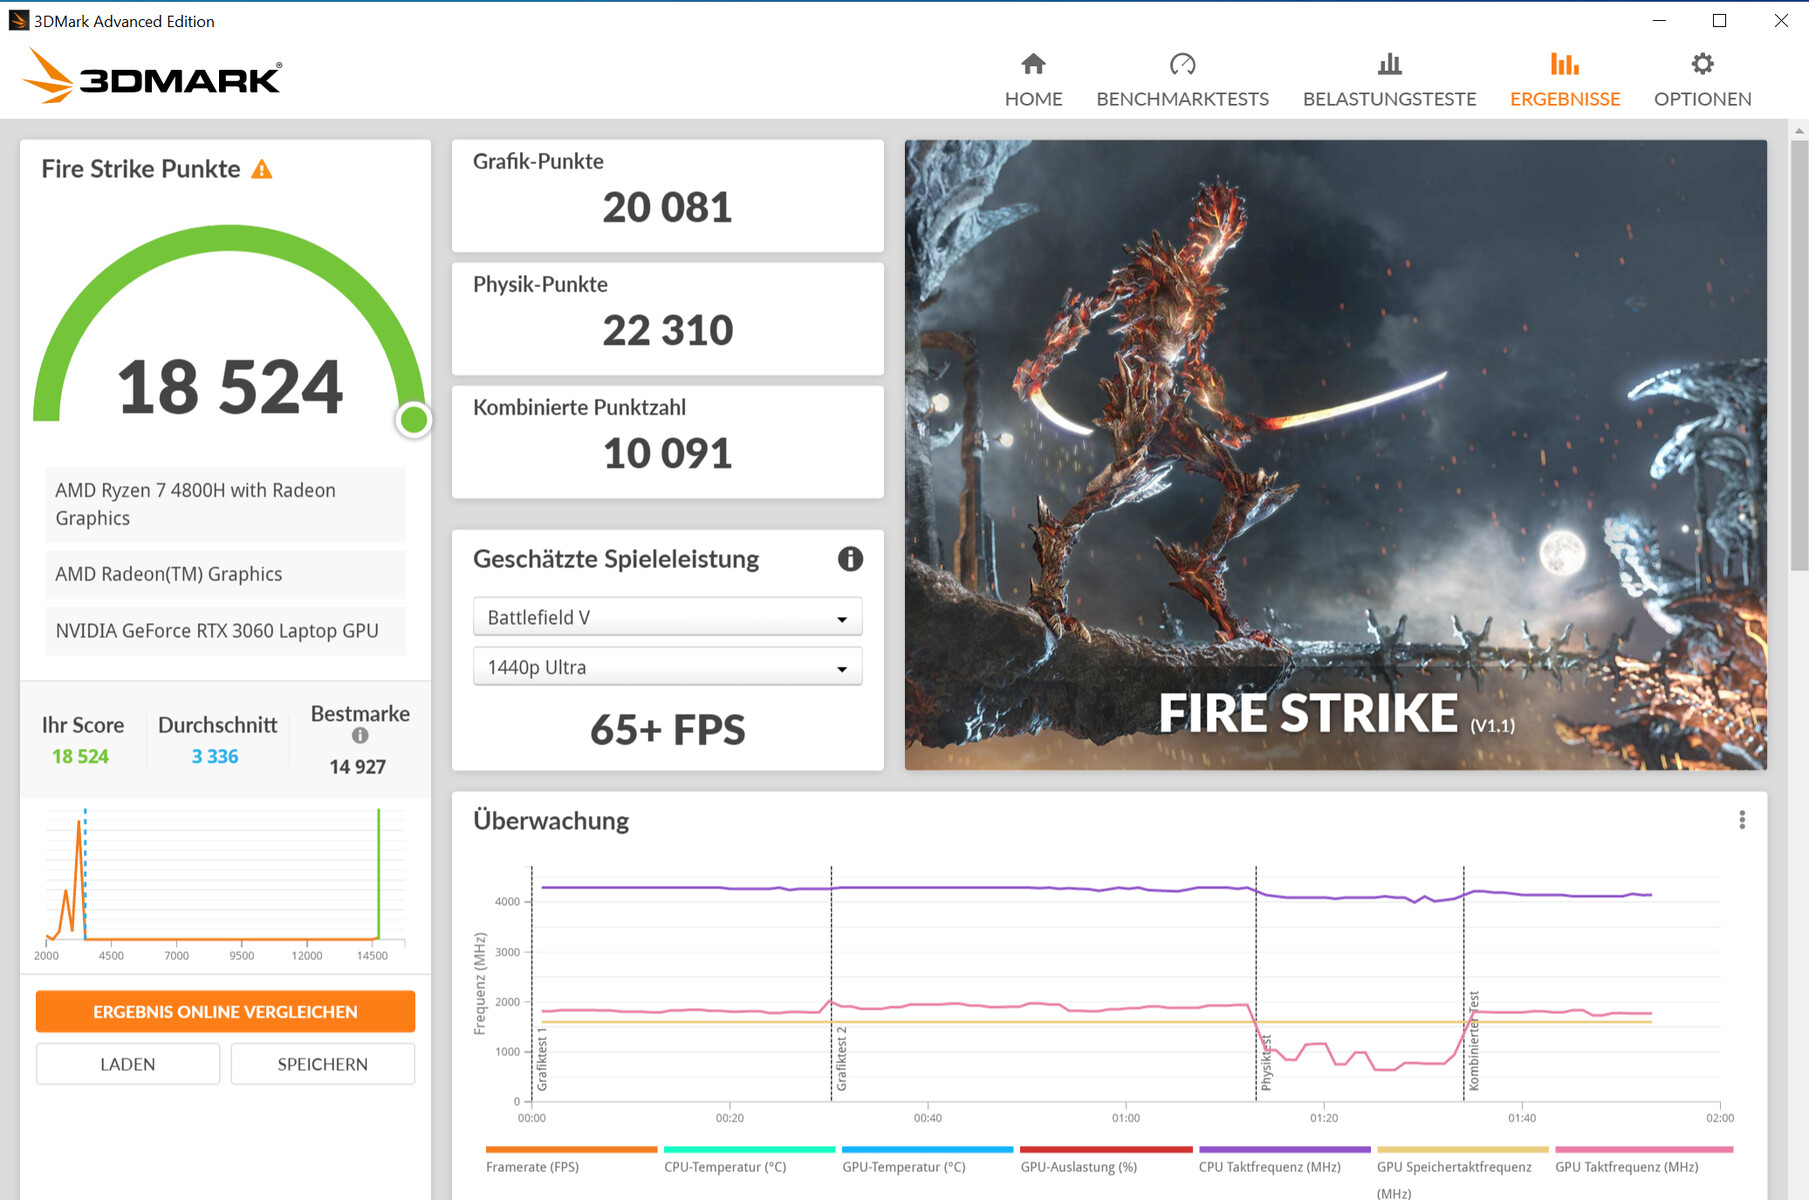


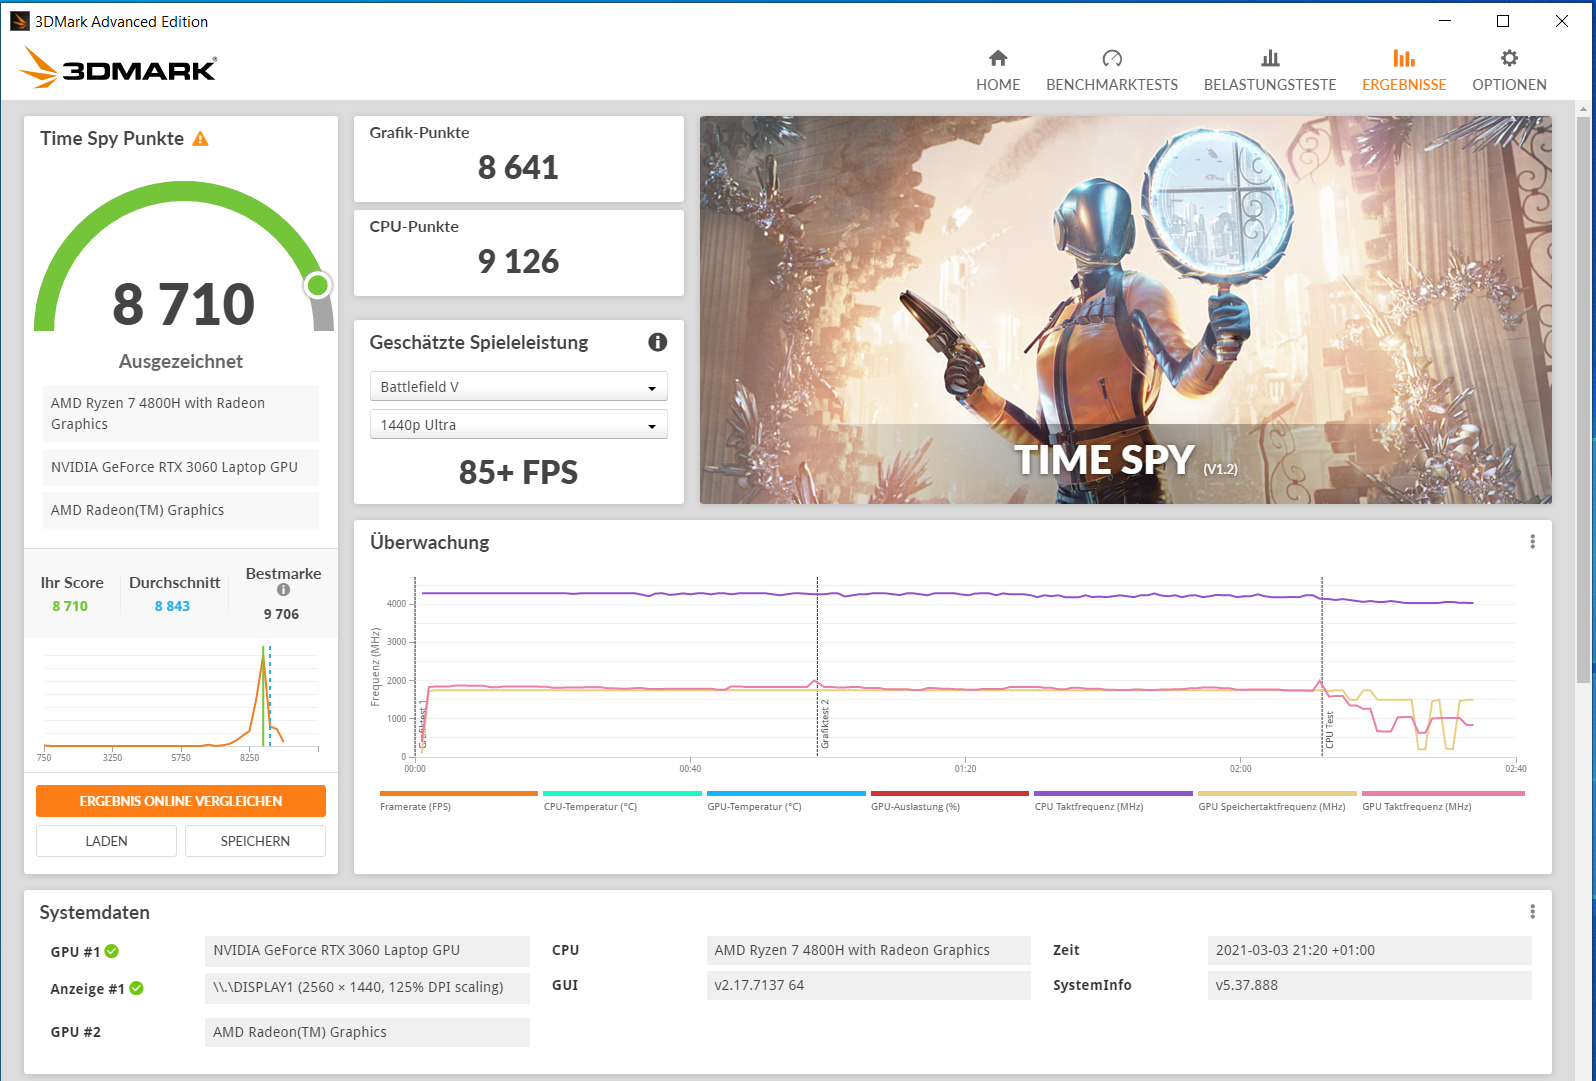
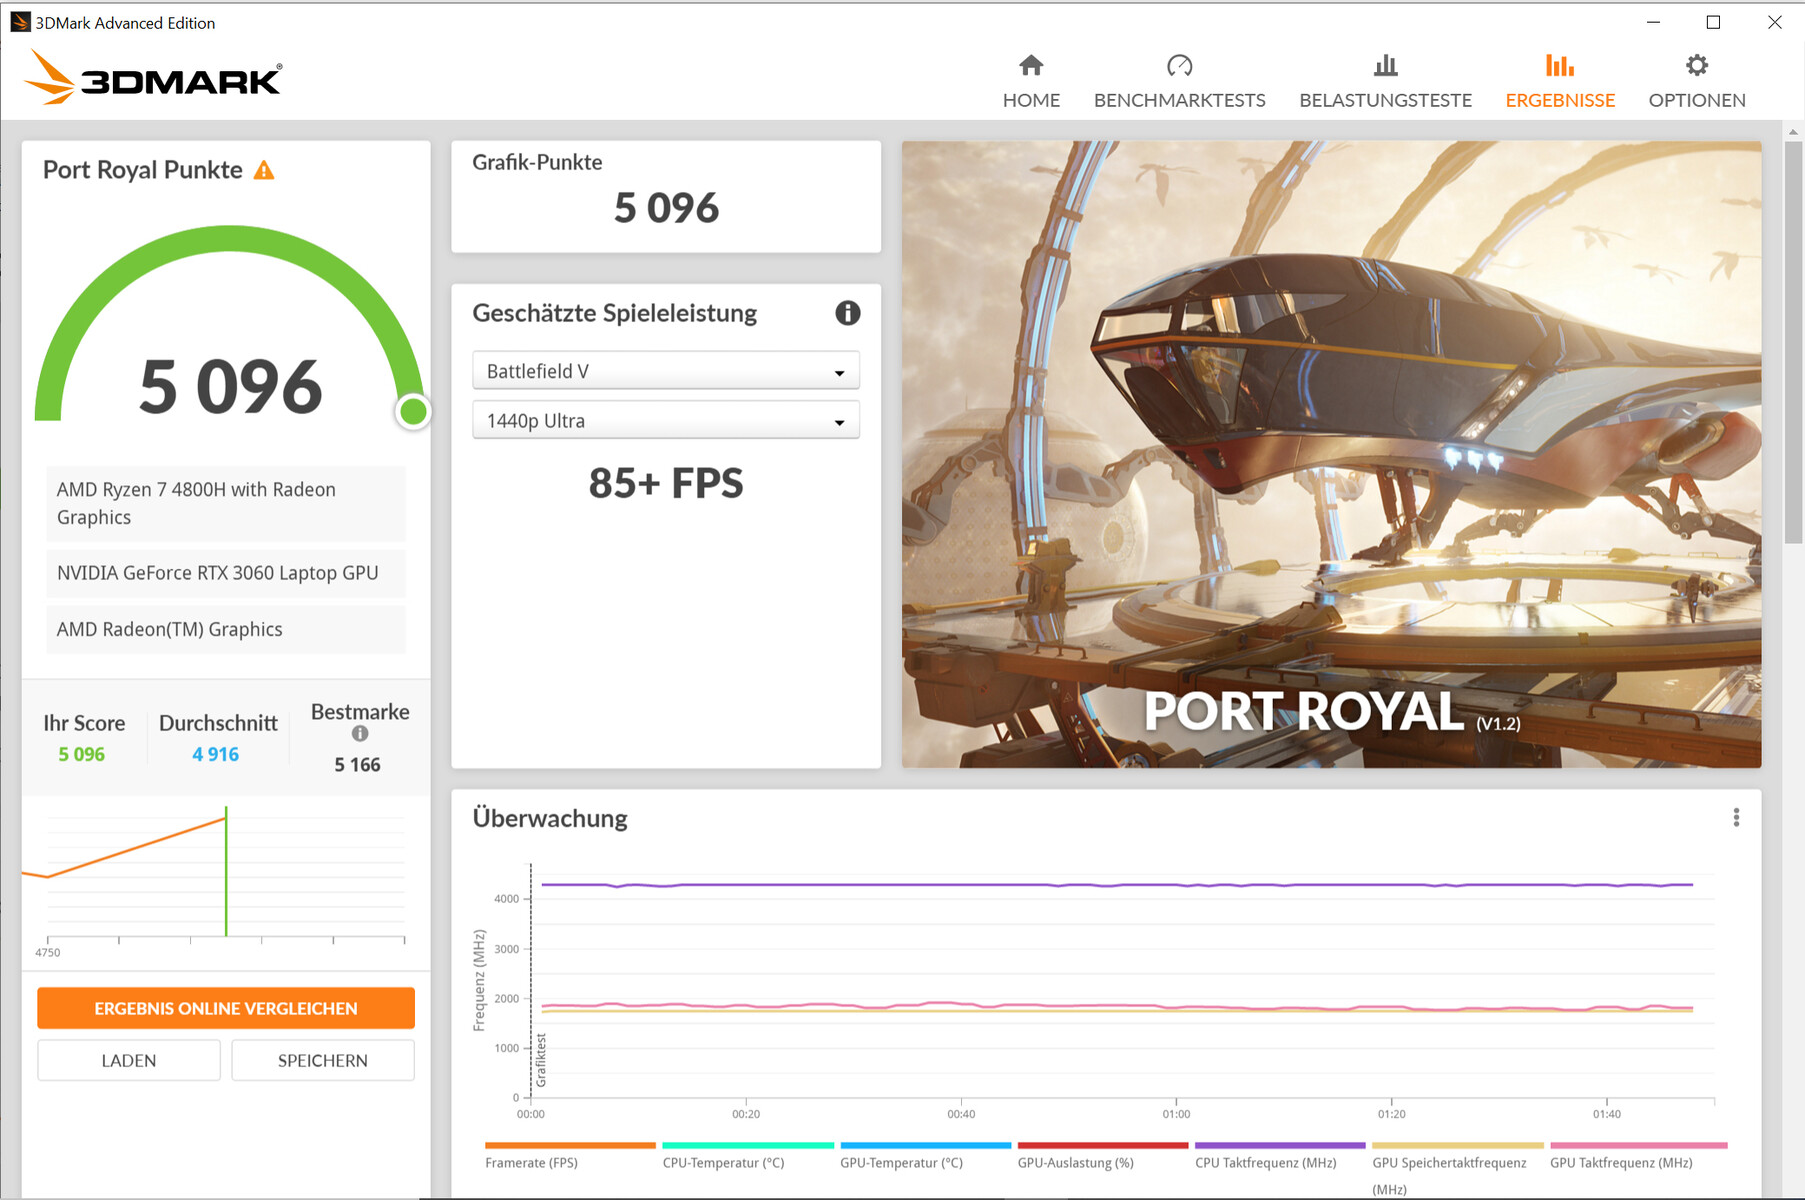
| 3DMark 11 Performance | 22955 points | |
| 3DMark Cloud Gate Standard Score | 52213 points | |
| 3DMark Fire Strike Score | 18524 points | |
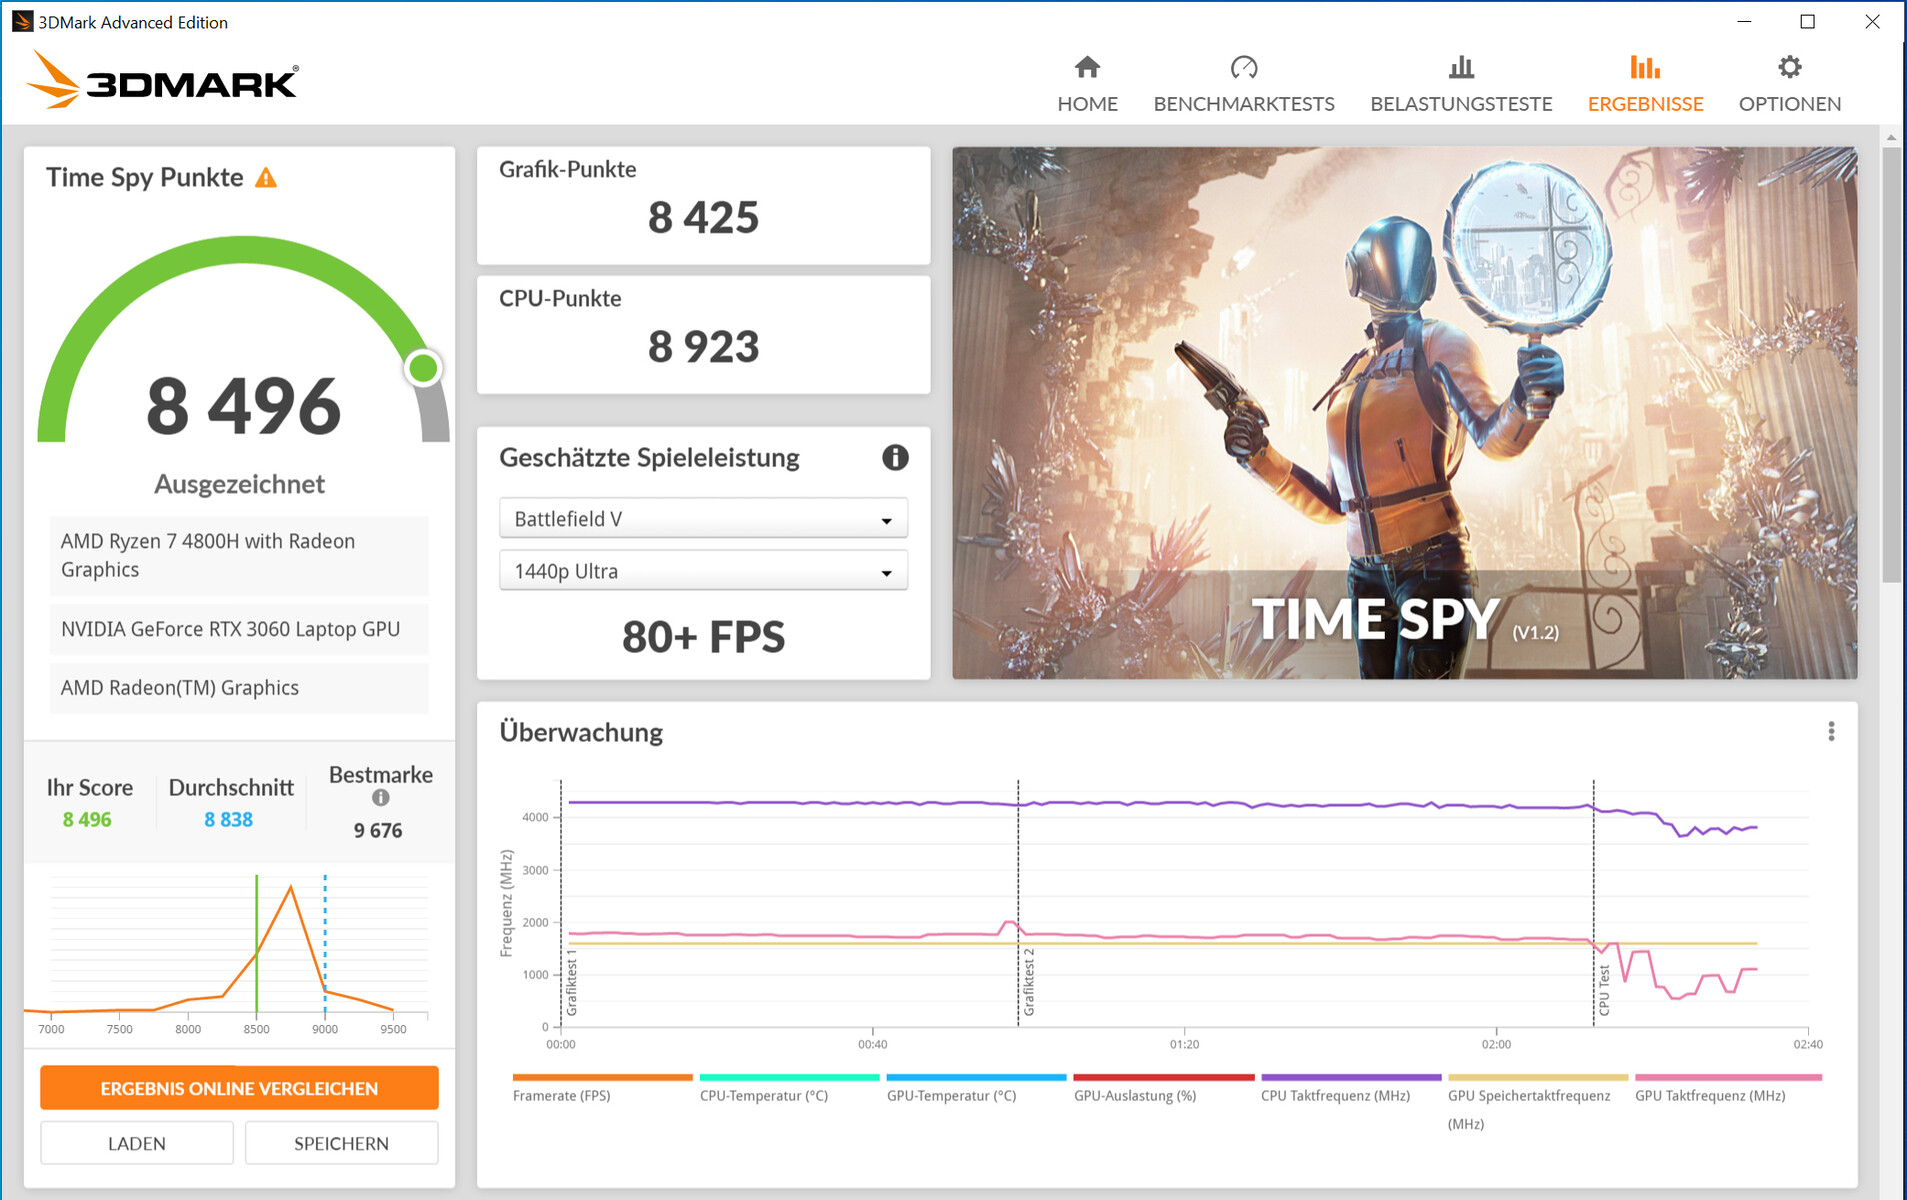
| 3DMark Time Spy Score | 8496 points | |
Help | ||
Gaming performance
The hardware can bring all the latest games smoothly onto the screen. The display's full resolution (2560x1440 pixels, WQHD) and high to maximum quality settings can usually be used. Maximum quality settings can be applied consistently when playing in Full HD resolution.
Our technical article on the RTX 3060 GPU provides an overview of the frame rates achieved in the games in our database at different resolutions and quality settings.
| The Witcher 3 - 1920x1080 Ultra Graphics & Postprocessing (HBAO+) | |
| Average of class Gaming (18.4 - 224, n=78, last 2 years) | |
| Aorus 15G XC | |
| SCHENKER XMG Core 15 Ampere | |
| Average NVIDIA GeForce RTX 3060 Laptop GPU (58.2 - 91.5, n=48) | |
| Asus TUF Dash F15 FX516PR | |
| Acer Predator Triton 300 PT315-52-79LP | |
| SCHENKER XMG Core 15 GK5NR0O | |
| HP Omen 15-en0375ng | |
| Shadow of the Tomb Raider - 1920x1080 Highest Preset AA:T | |
| Average of class Gaming (131 - 212, n=5, last 2 years) | |
| Aorus 15G XC | |
| Average NVIDIA GeForce RTX 3060 Laptop GPU (84 - 95, n=4) | |
| Asus TUF Dash F15 FX516PR | |
| SCHENKER XMG Core 15 Ampere | |
| HP Omen 15-en0375ng | |
| Horizon Zero Dawn - 1920x1080 Ultimate Quality | |
| Average of class Gaming (n=1last 2 years) | |
| SCHENKER XMG Core 15 Ampere | |
| Average NVIDIA GeForce RTX 3060 Laptop GPU (70 - 81, n=3) | |
| Asus TUF Dash F15 FX516PR | |
| Serious Sam 4 - 1920x1080 Ultra (DX12) AA:2xMS | |
| Average NVIDIA GeForce RTX 3060 Laptop GPU (67.1 - 78.3, n=2) | |
| SCHENKER XMG Core 15 Ampere | |
| Asus TUF Dash F15 FX516PR | |
| Immortals Fenyx Rising - 1920x1080 Very High Preset | |
| SCHENKER XMG Core 15 Ampere | |
| Average NVIDIA GeForce RTX 3060 Laptop GPU (54 - 83, n=3) | |
| Asus TUF Dash F15 FX516PR | |
| HP Omen 15-en0375ng | |
In order to verify whether the frame rates remain largely constant over a prolonged period of time, we let the game The Witcher 3 run for about 60 minutes at Full HD resolution and maximum quality settings. The character is not moved. A drop in frame rates wasn't found.
| low | med. | high | ultra | QHD | |
|---|---|---|---|---|---|
| The Witcher 3 (2015) | 270.1 | 237.3 | 153.5 | 88.5 | |
| Dota 2 Reborn (2015) | 123 | 117 | 111 | 105 | |
| X-Plane 11.11 (2018) | 85.5 | 78.5 | 64.4 | ||
| Far Cry 5 (2018) | 128 | 108 | 103 | 98 | 84 |
| Shadow of the Tomb Raider (2018) | 100 | 92 | 90 | 84 | 71 |
| Horizon Zero Dawn (2020) | 117 | 97 | 88 | 81 | 67 |
| Serious Sam 4 (2020) | 108 | 79.5 | 74.8 | 67.1 | 54.8 |
| Dirt 5 (2020) | 165 | 98.5 | 88.3 | 74.8 | 59.3 |
| Assassin´s Creed Valhalla (2020) | 90 | 73 | 63 | 56 | 47 |
| Immortals Fenyx Rising (2020) | 113 | 88 | 82 | 77 | 64 |
| Cyberpunk 2077 1.0 (2020) | 93.8 | 76.3 | 63.2 | 54.6 | 35.2 |
| Hitman 3 (2021) | 147.1 | 119.9 | 116.2 | 112.2 | 79.1 |
Emissions - The Schenker laptop doesn't heat up excessively
Noise emissions
The Core 15 is extremely quiet in idle usage. When the two fans are running, they operate at very low speeds. This changes under load, though. With a maximum sound pressure level of 50 dB(A) (stress test, The Witcher 3 test), the use of a headset is recommended.
Noise Level
| Idle |
| 26 / 28 / 30 dB(A) |
| Load |
| 42 / 52 dB(A) |
 | ||
30 dB silent 40 dB(A) audible 50 dB(A) loud |
||
min: | ||
| SCHENKER XMG Core 15 Ampere R7 4800H, GeForce RTX 3060 Laptop GPU | Asus TUF Dash F15 FX516PR i7-11370H, GeForce RTX 3070 Laptop GPU | Aorus 15G XC i7-10870H, GeForce RTX 3070 Laptop GPU | HP Omen 15-en0375ng R7 4800H, GeForce RTX 2060 Mobile | Acer Predator Triton 300 PT315-52-79LP i7-10750H, GeForce RTX 2060 Mobile | SCHENKER XMG Core 15 GK5NR0O R7 4800H, GeForce RTX 2060 Mobile | Average of class Gaming | |
|---|---|---|---|---|---|---|---|
| Noise | -7% | -2% | -1% | -2% | -2% | -1% | |
| off / environment * | 24 | 24 -0% | 25 -4% | 24 -0% | 25 -4% | 25 -4% | 24 ? -0% |
| Idle Minimum * | 26 | 25 4% | 29 -12% | 24 8% | 25 4% | 26 -0% | 25.9 ? -0% |
| Idle Average * | 28 | 30 -7% | 30 -7% | 25 11% | 29 -4% | 30 -7% | 27.6 ? 1% |
| Idle Maximum * | 30 | 35 -17% | 31 -3% | 37 -23% | 34 -13% | 32 -7% | 30.3 ? -1% |
| Load Average * | 42 | 53 -26% | 41 2% | 45 -7% | 44 -5% | 46 -10% | 42.6 ? -1% |
| Witcher 3 ultra * | 50 | 48 4% | 47 6% | 48 4% | 49 2% | 48 4% | |
| Load Maximum * | 52 | 54 -4% | 51 2% | 51 2% | 49 6% | 48 8% | 53.6 ? -3% |
* ... smaller is better
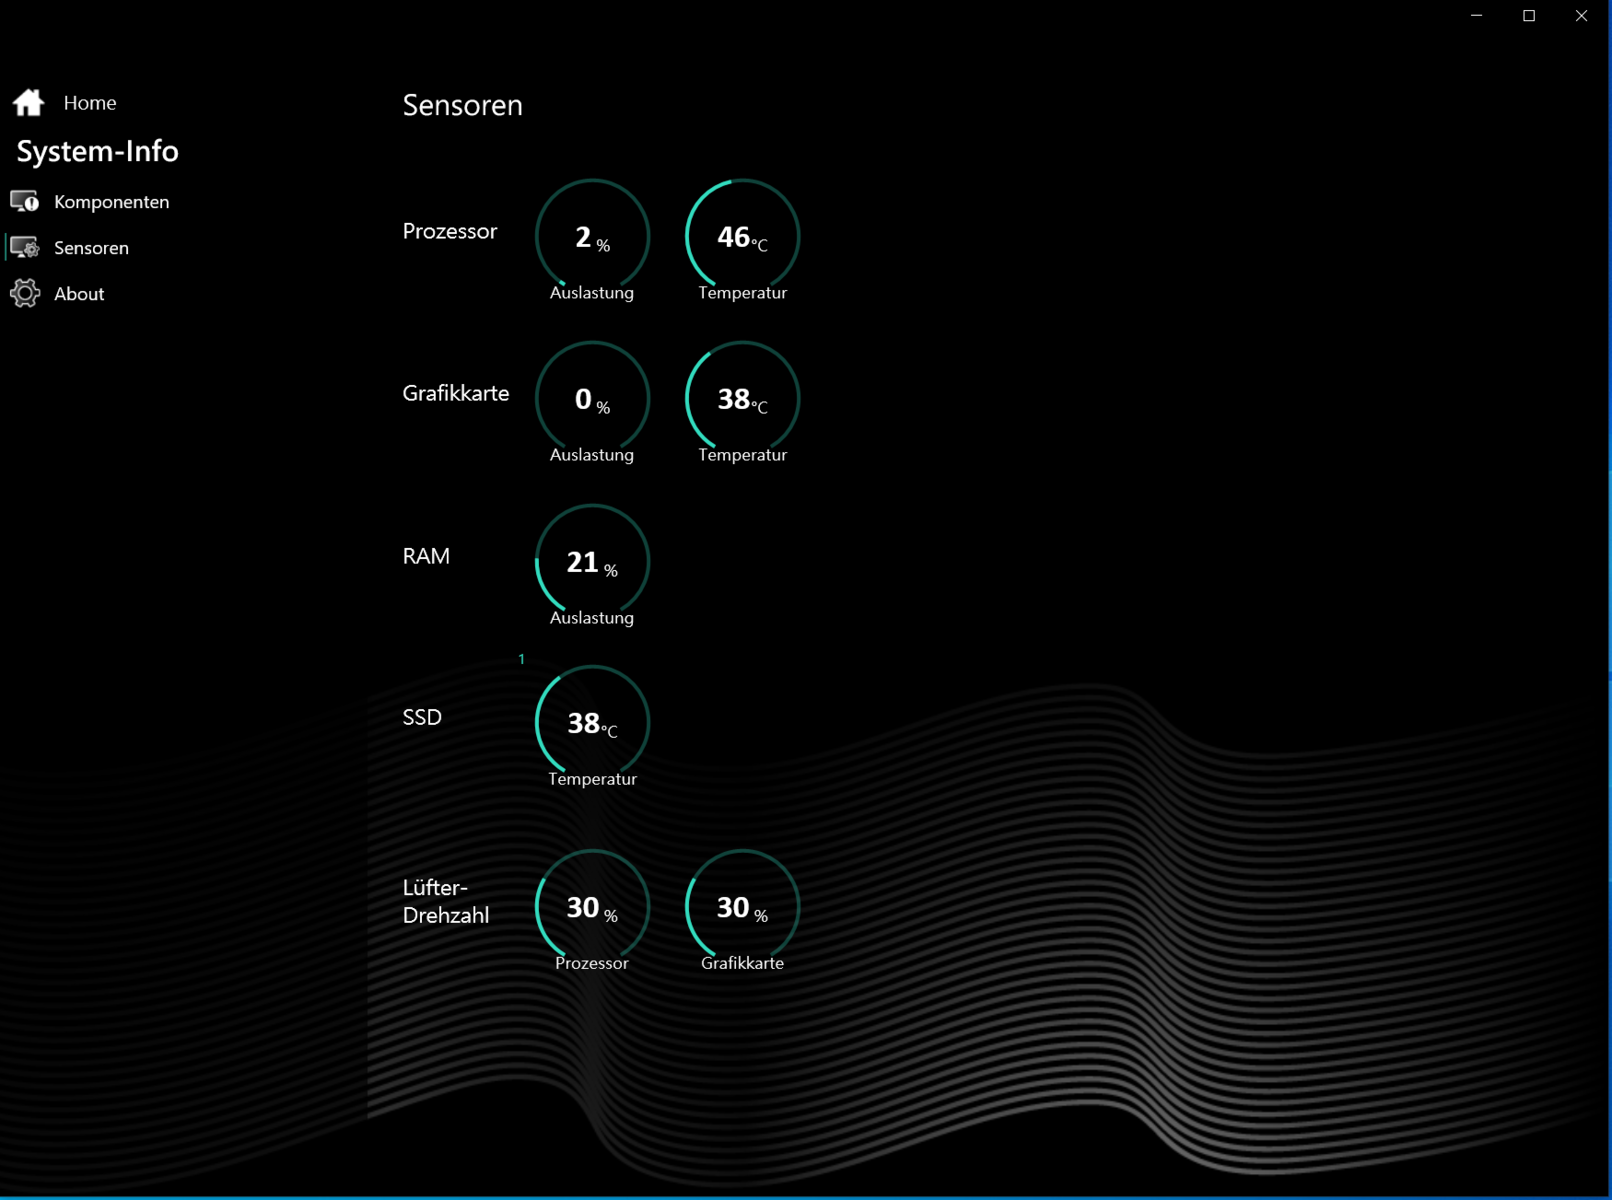
Temperature
Our stress test (Prime95 and FurMark run for at least an hour) is run by the CPU and GPU at 2.4 to 2.5 GHz and 1,732 MHz, respectively. The stress test represents an extreme scenario that doesn't occur in everyday use. We use this test to check whether the system also remains stable under full load.
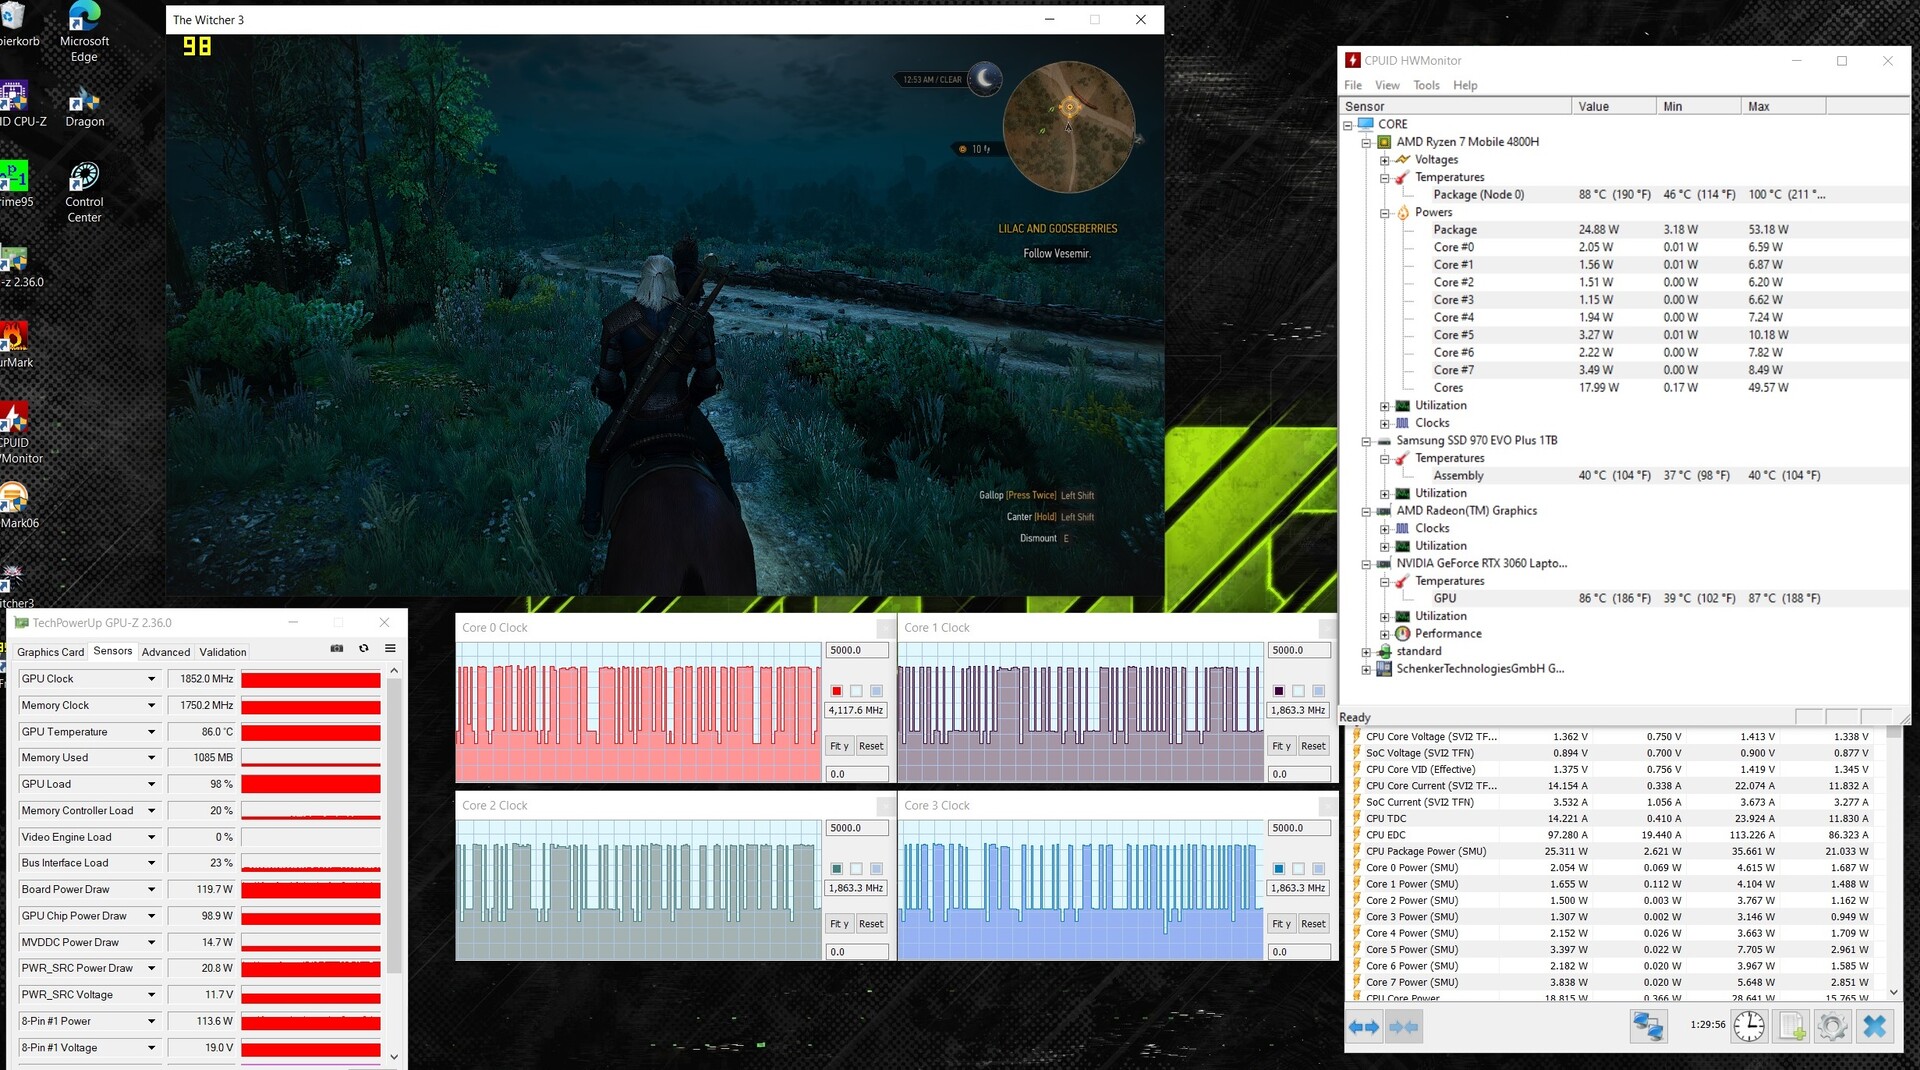
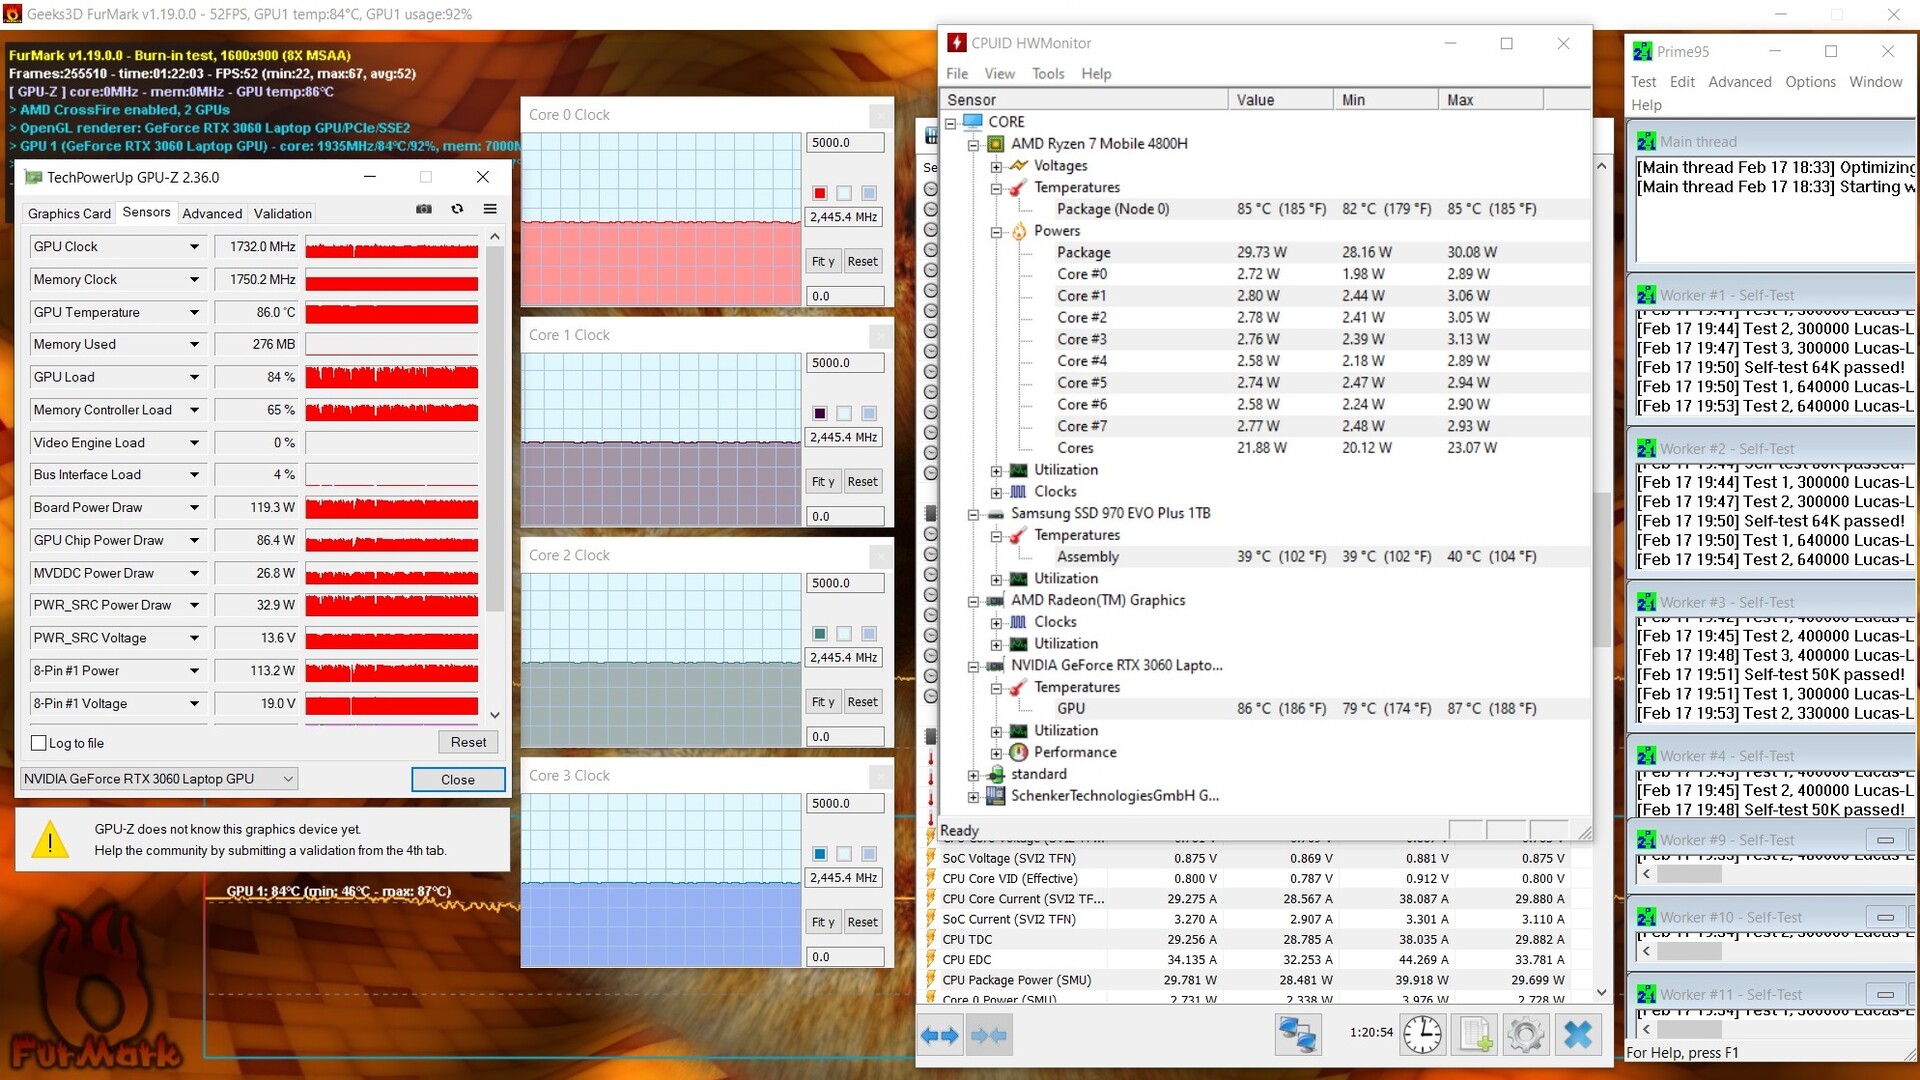
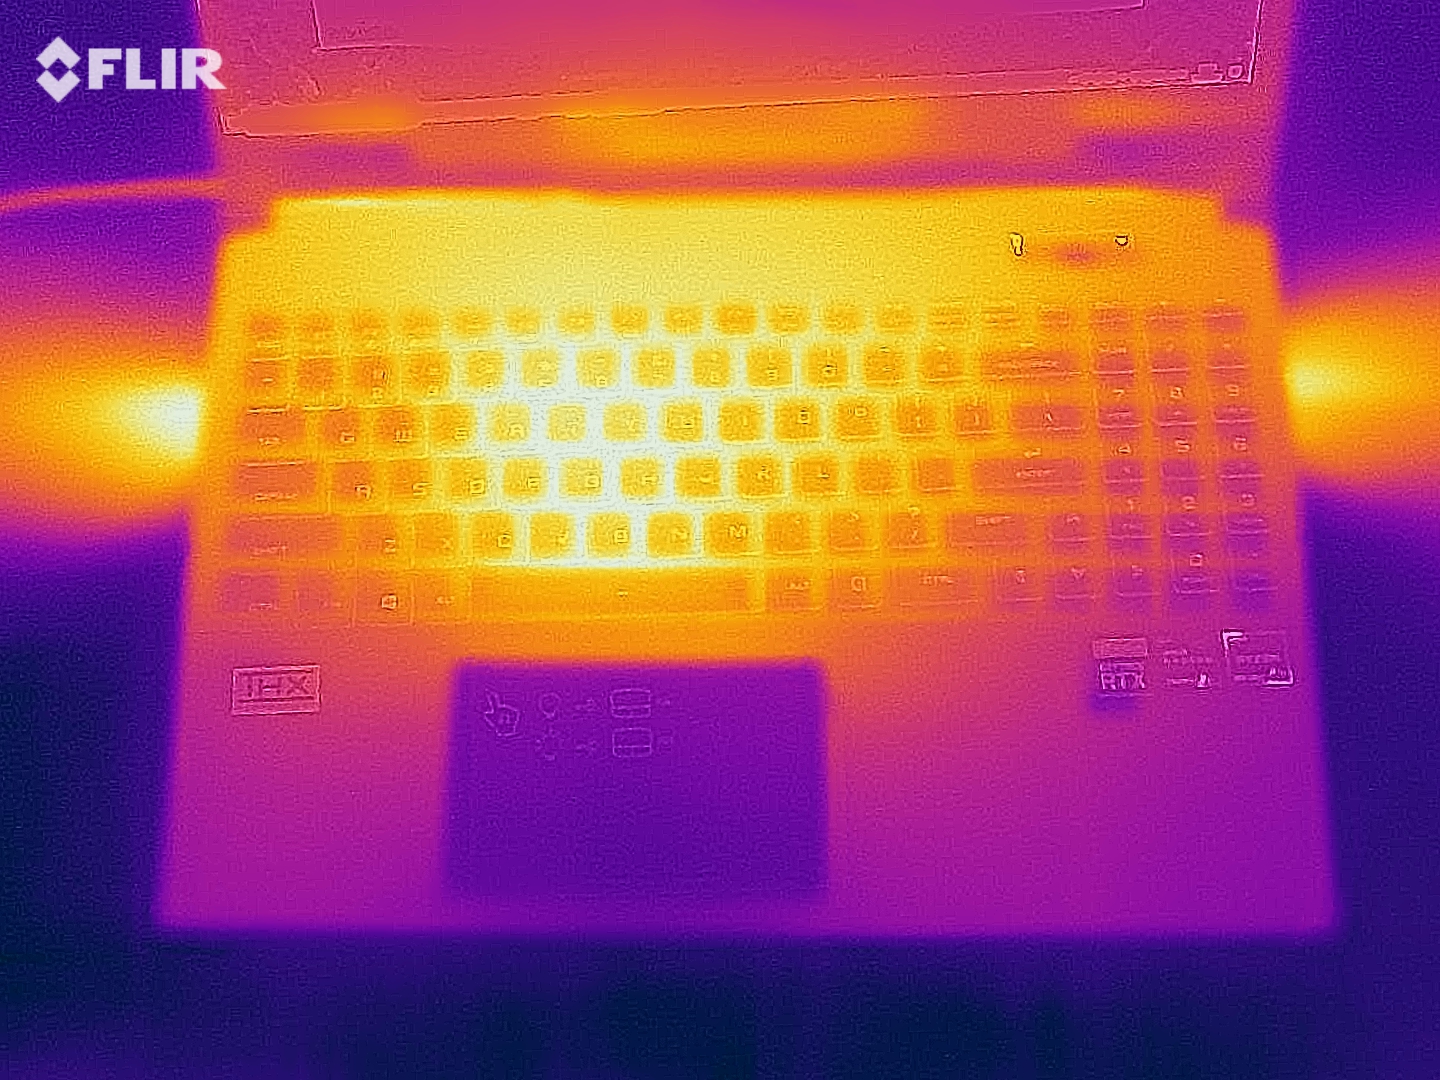
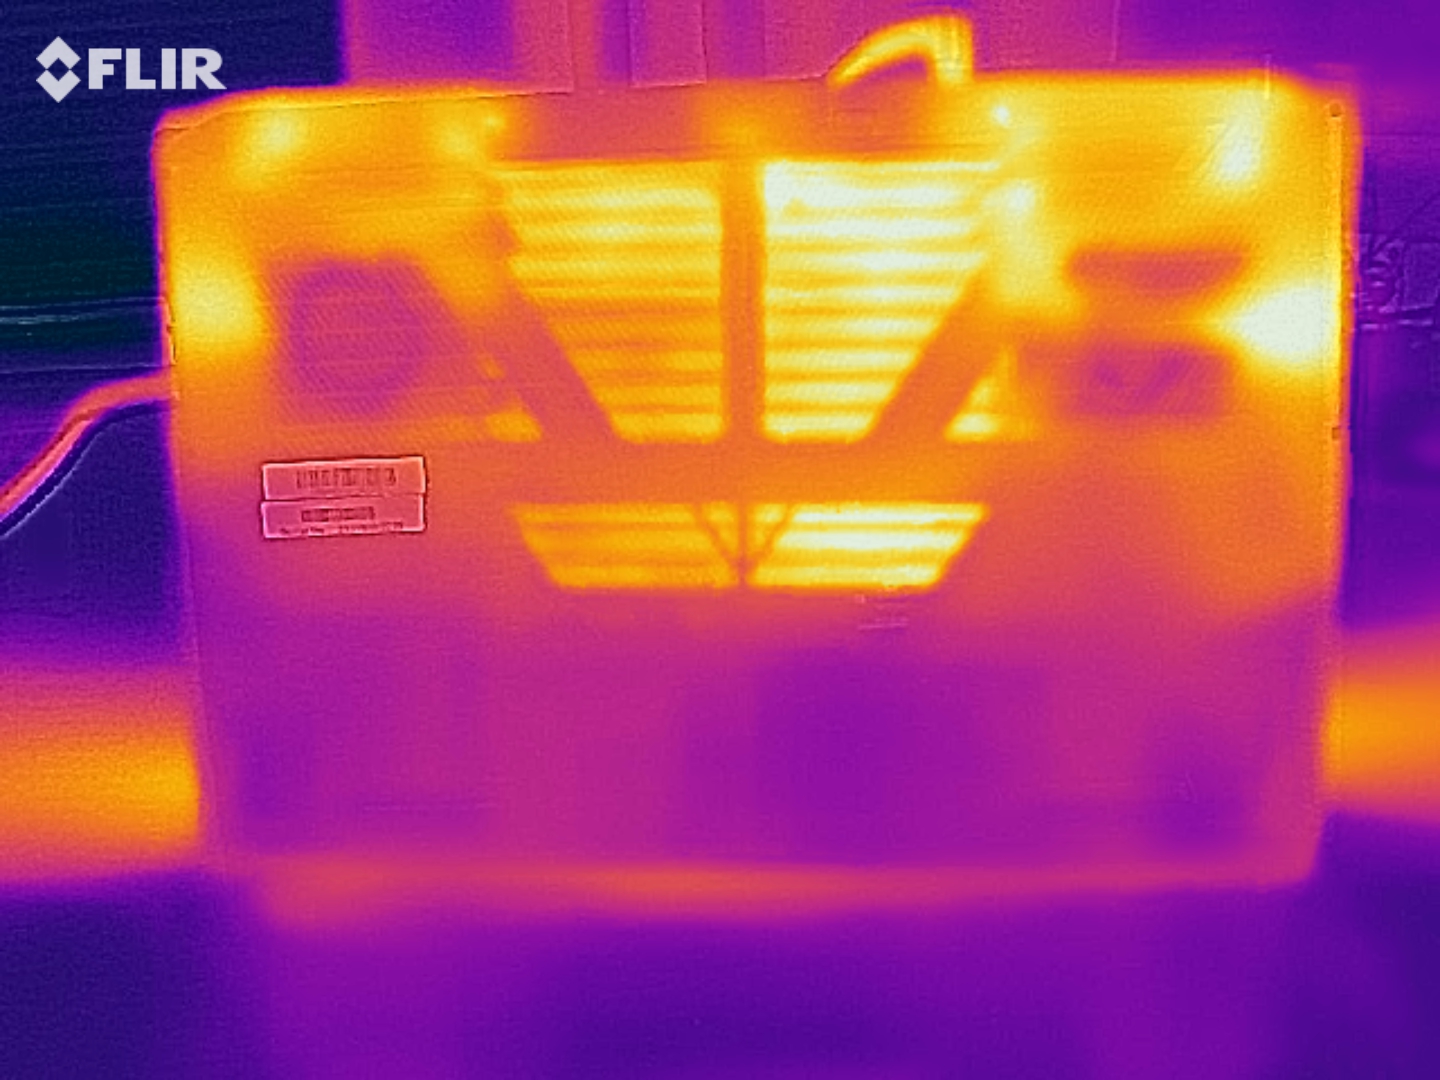
The Schenker laptop heats up noticeably under load but not excessively. During the stress test and our The Witcher 3 test, we registered temperatures in the upper 40 °C (~104 °F) range at several measuring points. Only at one measuring point is a value of 50 °C (~140 °F) reached. The device shouldn't be placed on the lap. In everyday use, however, the values are within the green range.
(-) The maximum temperature on the upper side is 48 °C / 118 F, compared to the average of 40.5 °C / 105 F, ranging from 21.2 to 68.8 °C for the class Gaming.
(-) The bottom heats up to a maximum of 50 °C / 122 F, compared to the average of 43.3 °C / 110 F
(+) In idle usage, the average temperature for the upper side is 27 °C / 81 F, compared to the device average of 33.9 °C / 93 F.
(-) Playing The Witcher 3, the average temperature for the upper side is 41.8 °C / 107 F, compared to the device average of 33.9 °C / 93 F.
(±) The palmrests and touchpad can get very hot to the touch with a maximum of 37 °C / 98.6 F.
(-) The average temperature of the palmrest area of similar devices was 28.9 °C / 84 F (-8.1 °C / -14.6 F).
| SCHENKER XMG Core 15 Ampere R7 4800H, GeForce RTX 3060 Laptop GPU | Asus TUF Dash F15 FX516PR i7-11370H, GeForce RTX 3070 Laptop GPU | Aorus 15G XC i7-10870H, GeForce RTX 3070 Laptop GPU | HP Omen 15-en0375ng R7 4800H, GeForce RTX 2060 Mobile | Acer Predator Triton 300 PT315-52-79LP i7-10750H, GeForce RTX 2060 Mobile | SCHENKER XMG Core 15 GK5NR0O R7 4800H, GeForce RTX 2060 Mobile | Average of class Gaming | |
|---|---|---|---|---|---|---|---|
| Heat | -9% | -1% | 3% | -17% | -10% | -4% | |
| Maximum Upper Side * | 48 | 55 -15% | 45 6% | 42 12% | 55 -15% | 51 -6% | 46 ? 4% |
| Maximum Bottom * | 50 | 56 -12% | 61 -22% | 54 -8% | 65 -30% | 64 -28% | 48.7 ? 3% |
| Idle Upper Side * | 28 | 29 -4% | 27 4% | 28 -0% | 32 -14% | 29 -4% | 31.4 ? -12% |
| Idle Bottom * | 31 | 32 -3% | 28 10% | 29 6% | 34 -10% | 32 -3% | 34.3 ? -11% |
* ... smaller is better
Speakers
The stereo speakers produce a decent sound that lacks bass. Headphones or external speakers are recommended for a better sound experience.
SCHENKER XMG Core 15 Ampere audio analysis
(+) | speakers can play relatively loud (88 dB)
Bass 100 - 315 Hz
(-) | nearly no bass - on average 23.4% lower than median
(±) | linearity of bass is average (9.4% delta to prev. frequency)
Mids 400 - 2000 Hz
(+) | balanced mids - only 2.3% away from median
(+) | mids are linear (4.6% delta to prev. frequency)
Highs 2 - 16 kHz
(±) | higher highs - on average 7.7% higher than median
(±) | linearity of highs is average (10.4% delta to prev. frequency)
Overall 100 - 16.000 Hz
(±) | linearity of overall sound is average (17.4% difference to median)
Compared to same class
» 47% of all tested devices in this class were better, 12% similar, 41% worse
» The best had a delta of 6%, average was 18%, worst was 132%
Compared to all devices tested
» 31% of all tested devices were better, 8% similar, 61% worse
» The best had a delta of 4%, average was 24%, worst was 134%
Energy management - Gaming laptop with decent battery life
Energy consumption
The Schenker laptop doesn't show any problems with its energy consumption in idle mode. We registered a maximum power consumption of 20 watts. The stress test and our The Witcher 3 test increase the demand up to 251 watts and 167 watts on average, respectively. Additionally, the power adapter's output is rated at 180 watts.
| Off / Standby | |
| Idle | |
| Load |
|
Key:
min: | |
| SCHENKER XMG Core 15 Ampere R7 4800H, GeForce RTX 3060 Laptop GPU | Asus TUF Dash F15 FX516PR i7-11370H, GeForce RTX 3070 Laptop GPU | Aorus 15G XC i7-10870H, GeForce RTX 3070 Laptop GPU | HP Omen 15-en0375ng R7 4800H, GeForce RTX 2060 Mobile | Acer Predator Triton 300 PT315-52-79LP i7-10750H, GeForce RTX 2060 Mobile | SCHENKER XMG Core 15 GK5NR0O R7 4800H, GeForce RTX 2060 Mobile | Average of class Gaming | |
|---|---|---|---|---|---|---|---|
| Power Consumption | 18% | -10% | 23% | 22% | 5% | -24% | |
| Idle Minimum * | 11 | 9 18% | 13 -18% | 4 64% | 4 64% | 12 -9% | 14 ? -27% |
| Idle Average * | 14 | 11 21% | 16 -14% | 9 36% | 10 29% | 14 -0% | 20.1 ? -44% |
| Idle Maximum * | 20 | 16 20% | 30 -50% | 22 -10% | 19 5% | 20 -0% | 26.6 ? -33% |
| Load Average * | 94 | 107 -14% | 92 2% | 102 -9% | 96 -2% | 103 -10% | 108 ? -15% |
| Witcher 3 ultra * | 167 | 121 28% | 154 8% | 119 29% | 136 19% | 125 25% | |
| Load Maximum * | 251 | 162 35% | 223 11% | 182 27% | 214 15% | 193 23% | 259 ? -3% |
* ... smaller is better
Battery life
The Core 15 achieves runtimes of 5:48 hours and 6:00 hours in the WLAN test (accessing websites via a script) and video test (the short film Big Buck Bunny (H.264 encoding, Full HD) running in a loop), respectively. The laptop's power-saving features are disabled during both tests, and the display brightness is set to about 150 cd/m². In addition, the wireless modules are disabled for the video test.
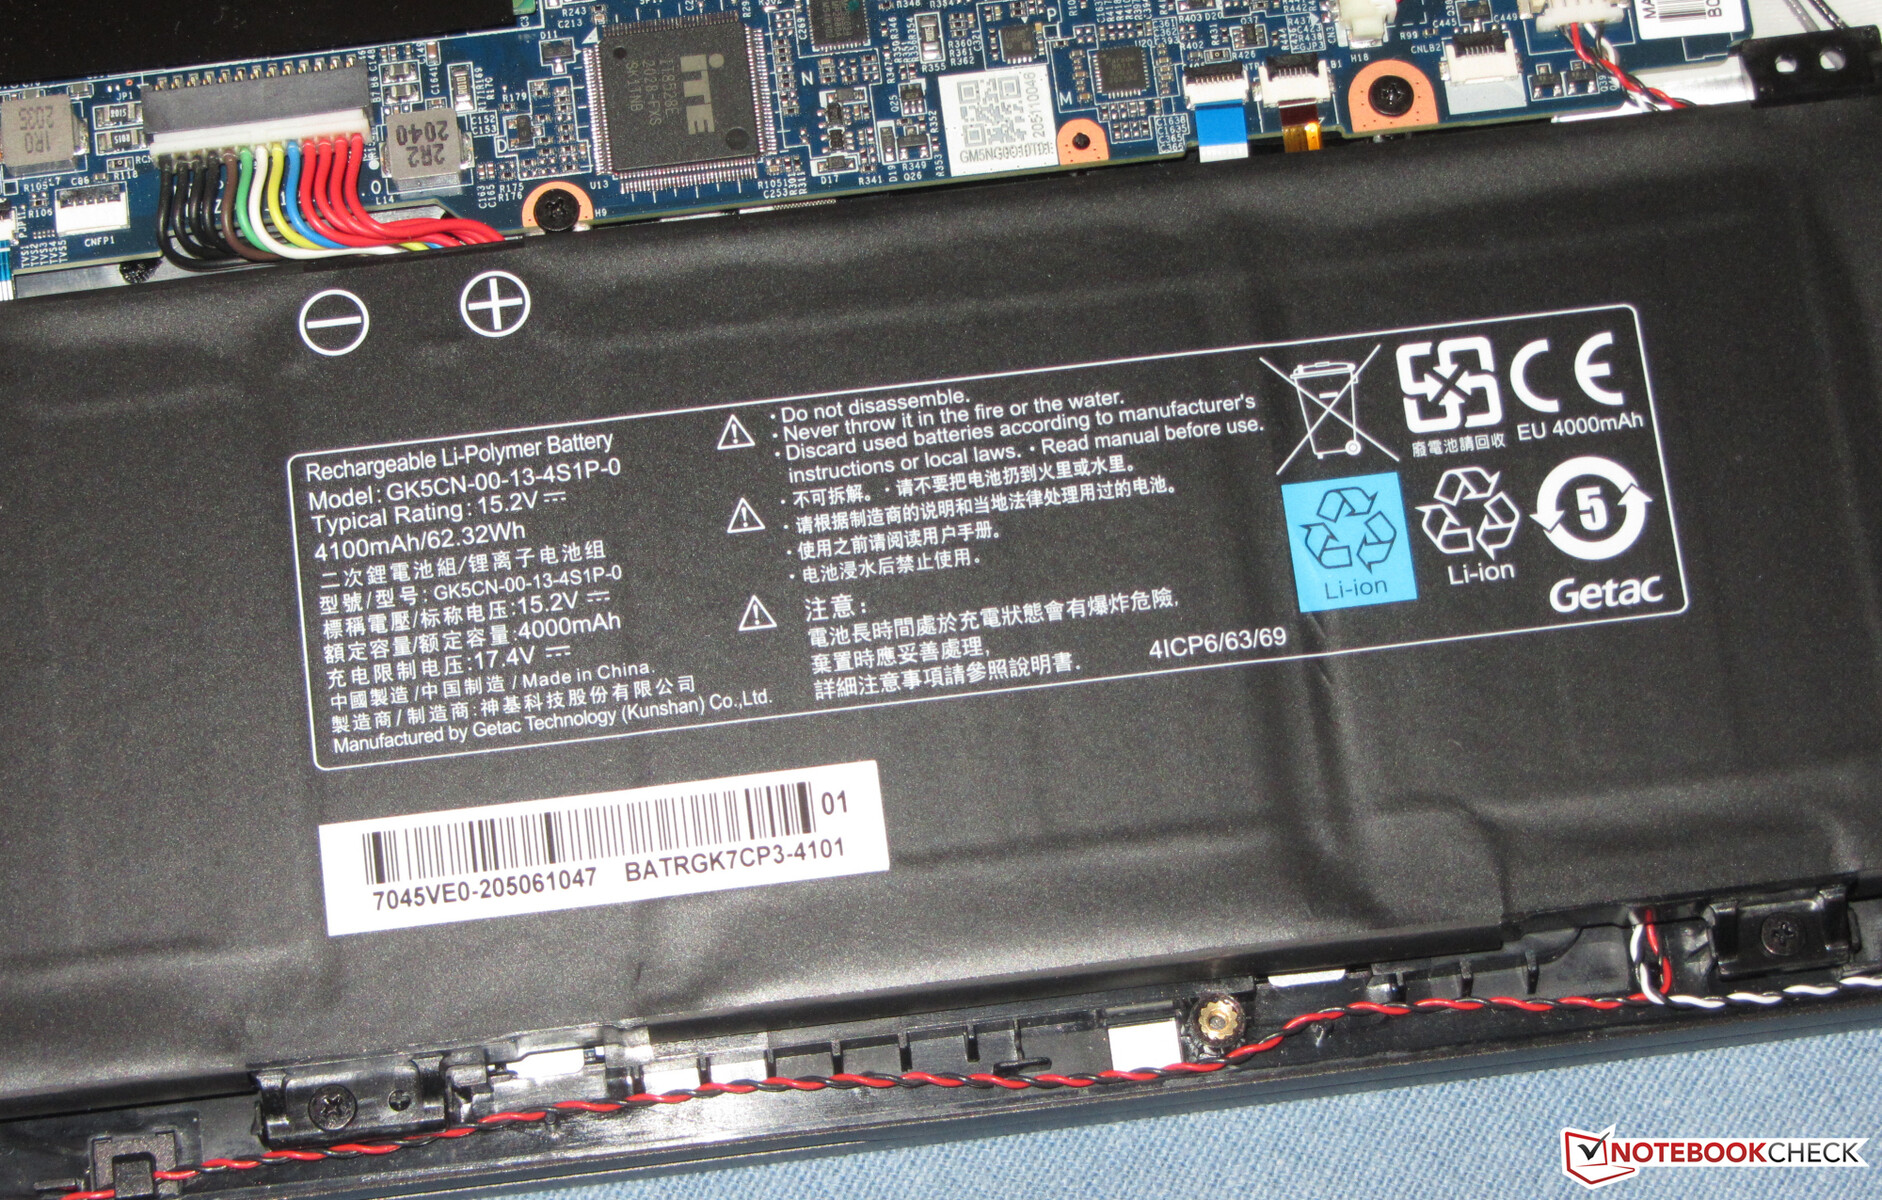
| SCHENKER XMG Core 15 Ampere R7 4800H, GeForce RTX 3060 Laptop GPU, 62 Wh | Asus TUF Dash F15 FX516PR i7-11370H, GeForce RTX 3070 Laptop GPU, 76 Wh | Aorus 15G XC i7-10870H, GeForce RTX 3070 Laptop GPU, 99 Wh | HP Omen 15-en0375ng R7 4800H, GeForce RTX 2060 Mobile, 70.9 Wh | Acer Predator Triton 300 PT315-52-79LP i7-10750H, GeForce RTX 2060 Mobile, 58.7 Wh | SCHENKER XMG Core 15 GK5NR0O R7 4800H, GeForce RTX 2060 Mobile, 62 Wh | Average of class Gaming | |
|---|---|---|---|---|---|---|---|
| Battery Runtime | 80% | 35% | 98% | 17% | 8% | 22% | |
| Reader / Idle | 468 | 957 104% | 573 22% | 1200 156% | 575 23% | 469 0% | 577 ? 23% |
| H.264 | 360 | 388 8% | 371 3% | 461 ? 28% | |||
| WiFi v1.3 | 348 | 544 56% | 380 9% | 628 80% | 329 -5% | 354 2% | 388 ? 11% |
| Load | 69 | 137 99% | 108 57% | 92 33% | 87 26% | 87.2 ? 26% |
Pros
Cons
Verdict
The 2021 model of the Core 15 also has a discreet exterior that makes it possible to use the laptop in every office in the world. With the combination of the Ryzen 7 4800H APU and the GeForce RTX 3060 laptop GPU, the interior houses powerful technology that brings all the latest games smoothly onto the screen.
The graphics core can be used with the maximum possible TGP of 130 watts. This requires the Dynamic Boost to be increased to 15 watts in the Control Center. Schenker sets the TGP to 120 watts (115 watts + 5 watts Dynamic Boost) by default.
Schenker delivers a coherent gaming laptop with the XMG Core 15 (early 2021).
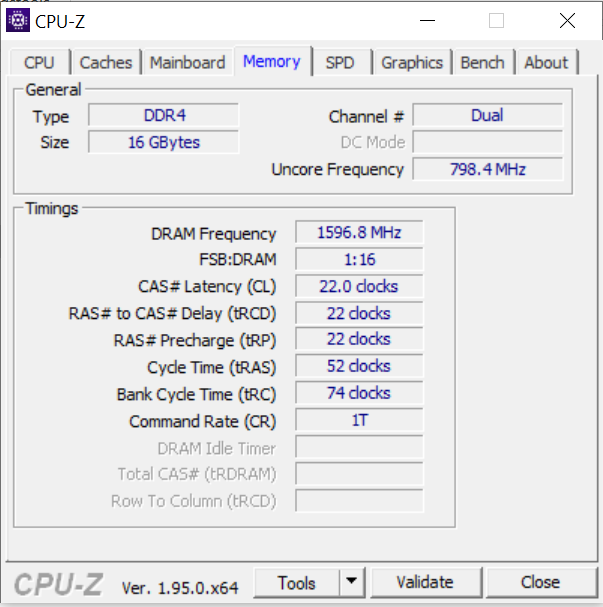
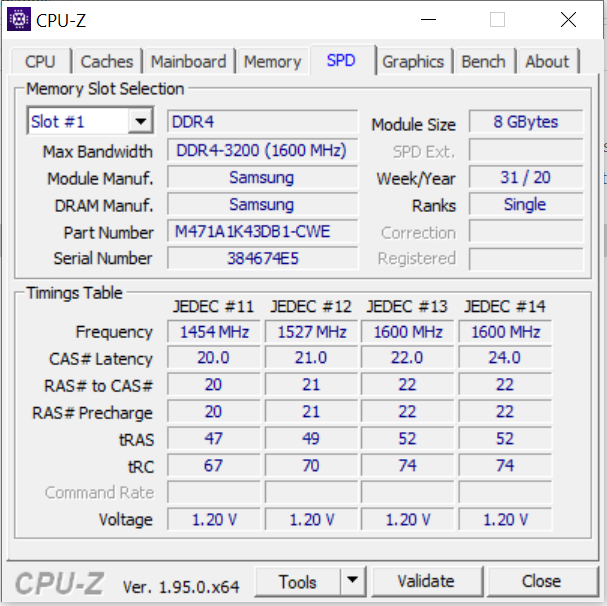
The hardware is supported by 16 GB of RAM (2x 8 GB, dual-channel mode, 64 GB max.) and a 1 TB NVMe SSD. A second NVMe SSD can be added if required. Moreover, RAID 0 is supported. Thanks to the easily removable bottom cover, upgrades should be easy to perform.
The display (WQHD, IPS, 165 Hz) left a good impression and didn't reveal flaws in any discipline. In addition, brightness and contrast are within the target range. This is complemented by a matte surface, short response times, good color reproduction, and decent color-space coverage. Battery life is alright on the whole.
Price and availability
The Schenker XMG Core 15 (early 2021) is already listed in the Schenker online store starting at 1,399 Euros (~$1,658). It will probably be ready to purchase at the end of April 2021. However, at the time of writing, the device isn't available yet.
SCHENKER XMG Core 15 Ampere
- 03/08/2021 v7 (old)
Sascha Mölck
Price comparison

