 Deutsch
 English
 Español
 Français
 Italiano
 Nederlands
 Polski
 Português
 Русский
 Türkçe
 Svenska
 Chinese
 Magyar
Acer Predator Triton 300 PT315 Laptop Review: A 120 Hz Panel Could Be Better

Acer is known for an extensive notebook line-up that includes various gaming notebooks as well. Therefore, we have had numerous models in review in the past, such as for example the AMD-powered Acer Nitro 5. Intel’s Comet Lake is also not unknown to Acer, see for example the Acer Predator Triton 500 and Predator Helios 300.
Now, Acer has also upgraded its Predator Triton 300, which now features an Intel Core i7-10750H, Nvidia GeForce RTX 2060, 16 GB of RAM, and a 1 TB SSD. Specs can be found in the table below, and you can always add additional devices from our database underneath each category.
Rating | Date | Model | Weight | Height | Size | Resolution | Best Price |
|---|---|---|---|---|---|---|---|
| 82.1 % | 12/2020 | Acer Predator Triton 300 PT315-52-79LP i7-10750H, GeForce RTX 2060 Mobile | 2.1 kg | 19.9 mm | 15.60" | 1920x1080 | |
| 82.9 % | 11/2020 | Acer Predator Helios 300 PH315-53-77N5 i7-10750H, GeForce RTX 2060 Mobile | 2.5 kg | 22.9 mm | 15.60" | 1920x1080 | |
| 81.6 % | 09/2020 | Dell G3 15 3500-G4DG2 i7-10750H, GeForce RTX 2060 Mobile | 2.3 kg | 22 mm | 15.60" | 1920x1080 | |
| 83.7 % | 10/2020 | Aorus 5 KB i7-10750H, GeForce RTX 2060 Mobile | 2.1 kg | 28 mm | 15.60" | 1920x1080 | |
| 82.1 % | 09/2020 | SCHENKER XMG Core 15 GK5NR0O R7 4800H, GeForce RTX 2060 Mobile | 2 kg | 19.9 mm | 15.60" | 1920x1080 |
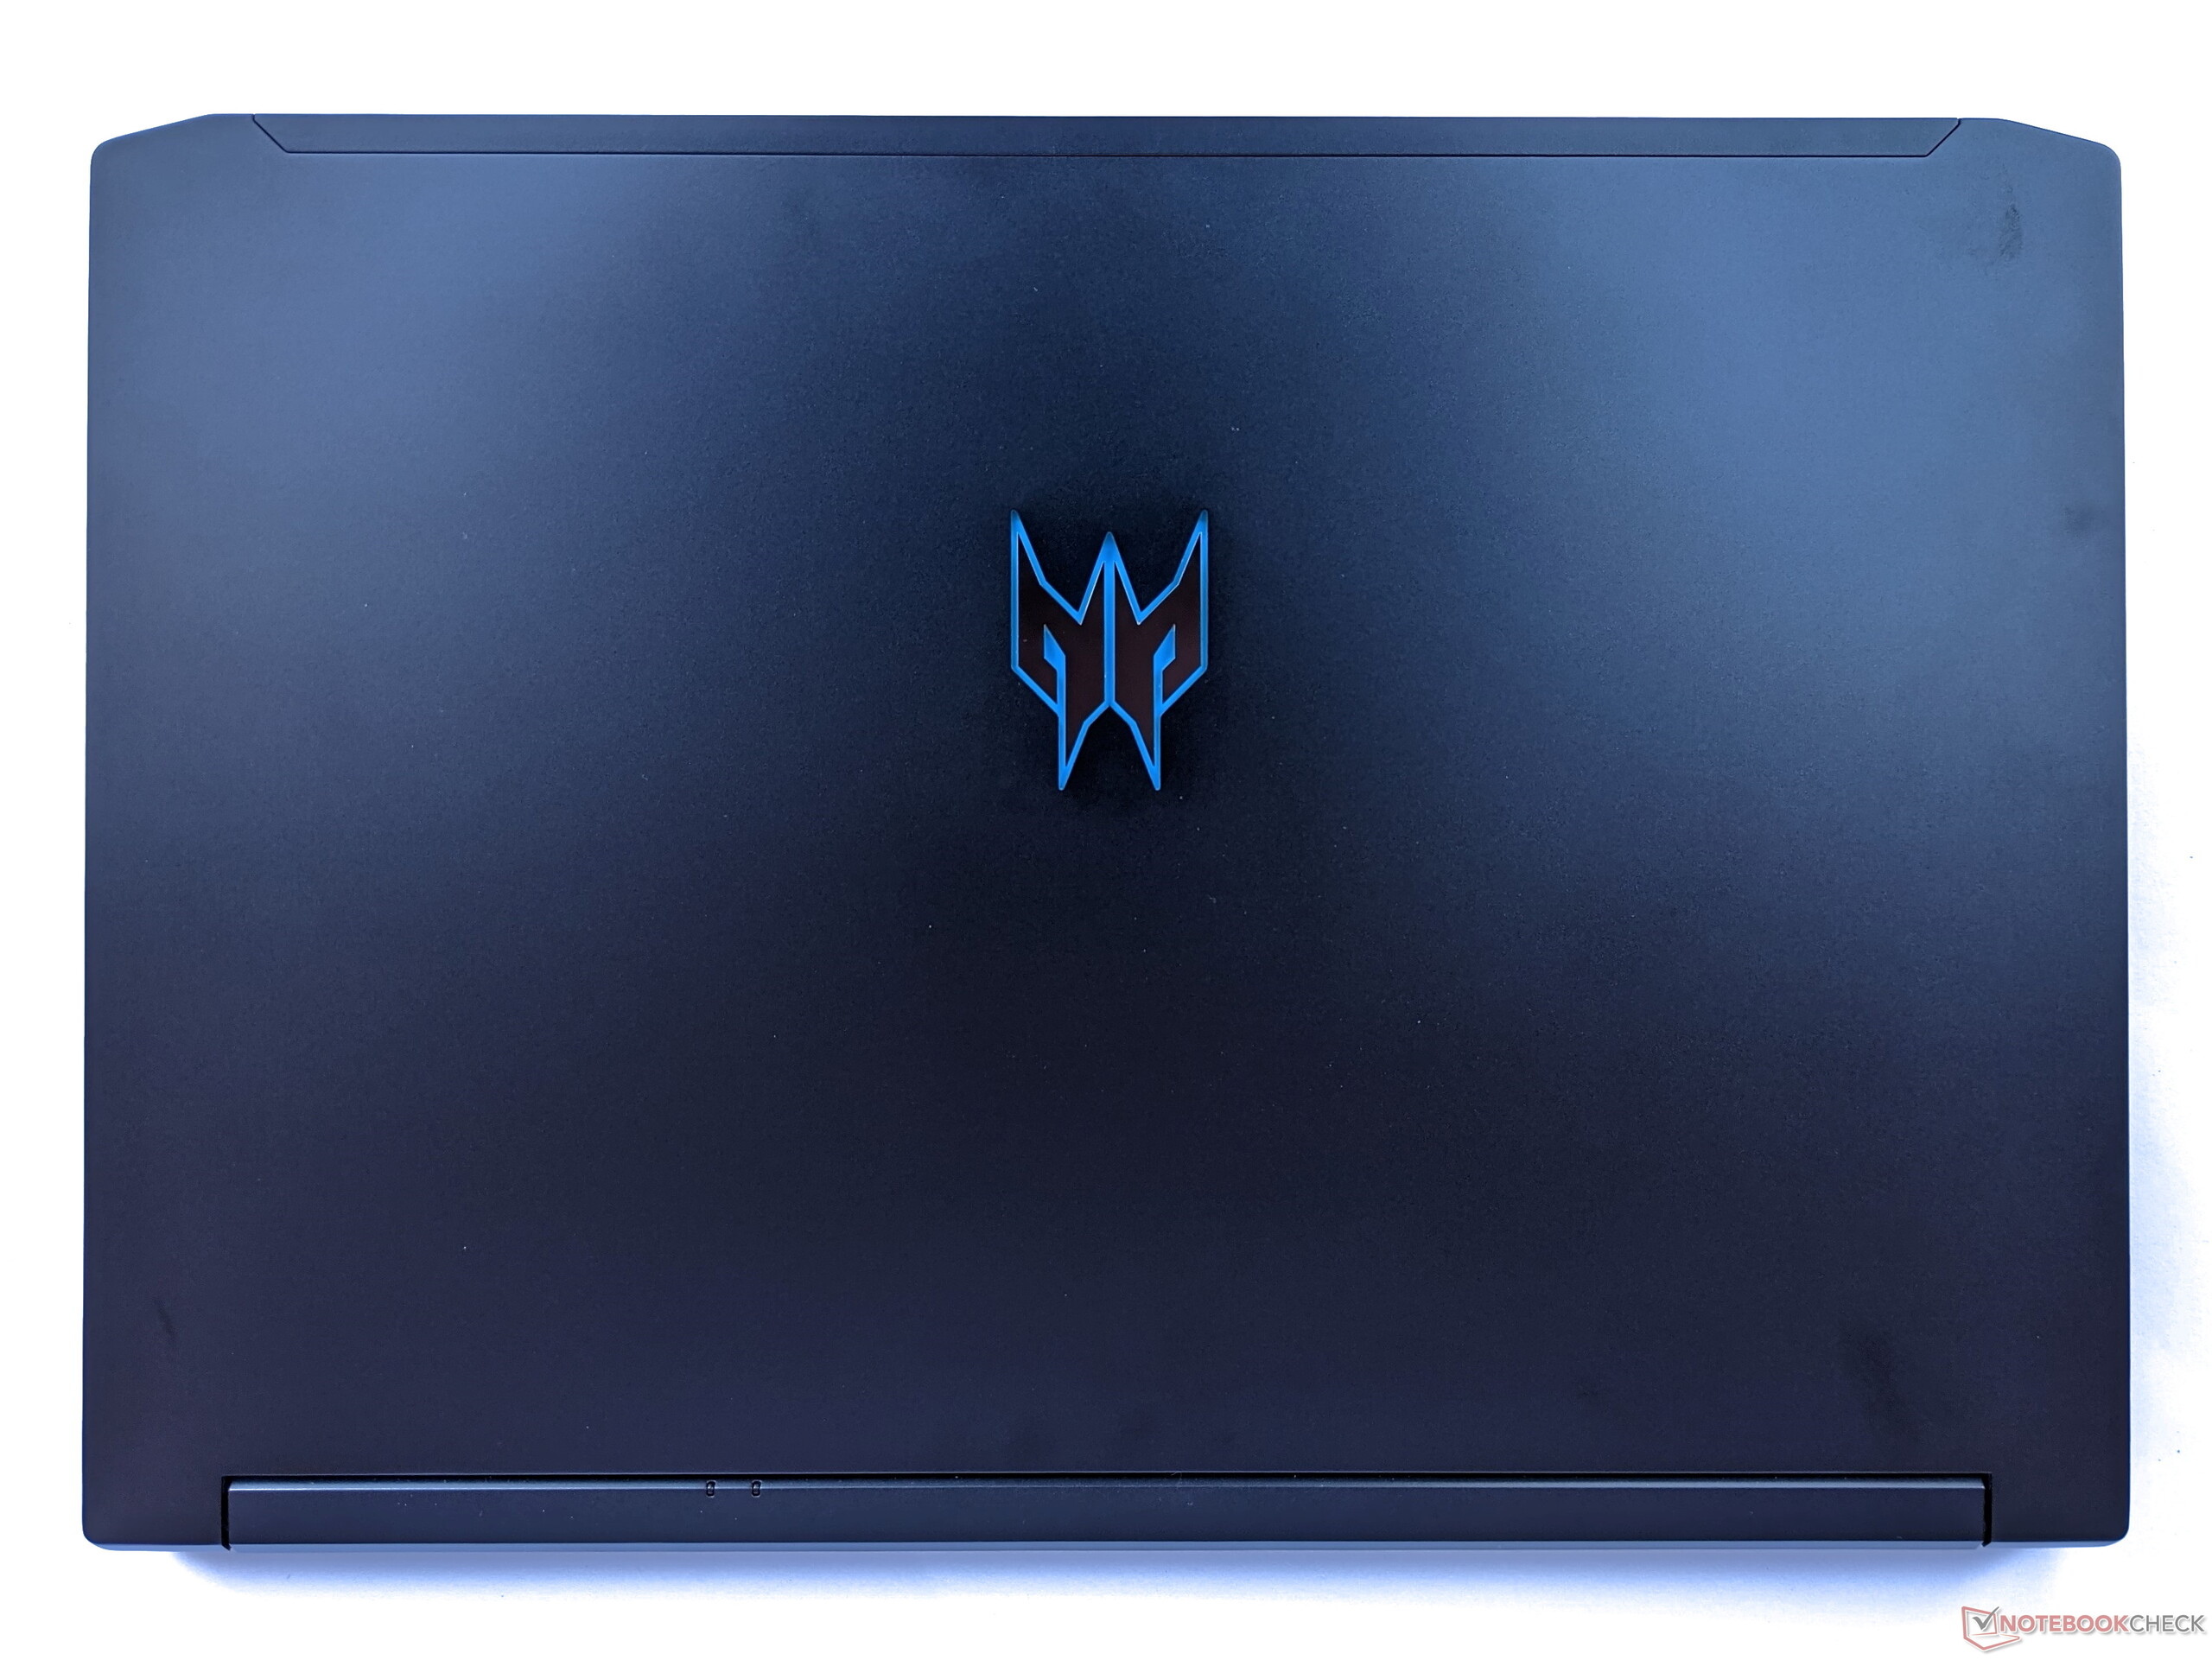
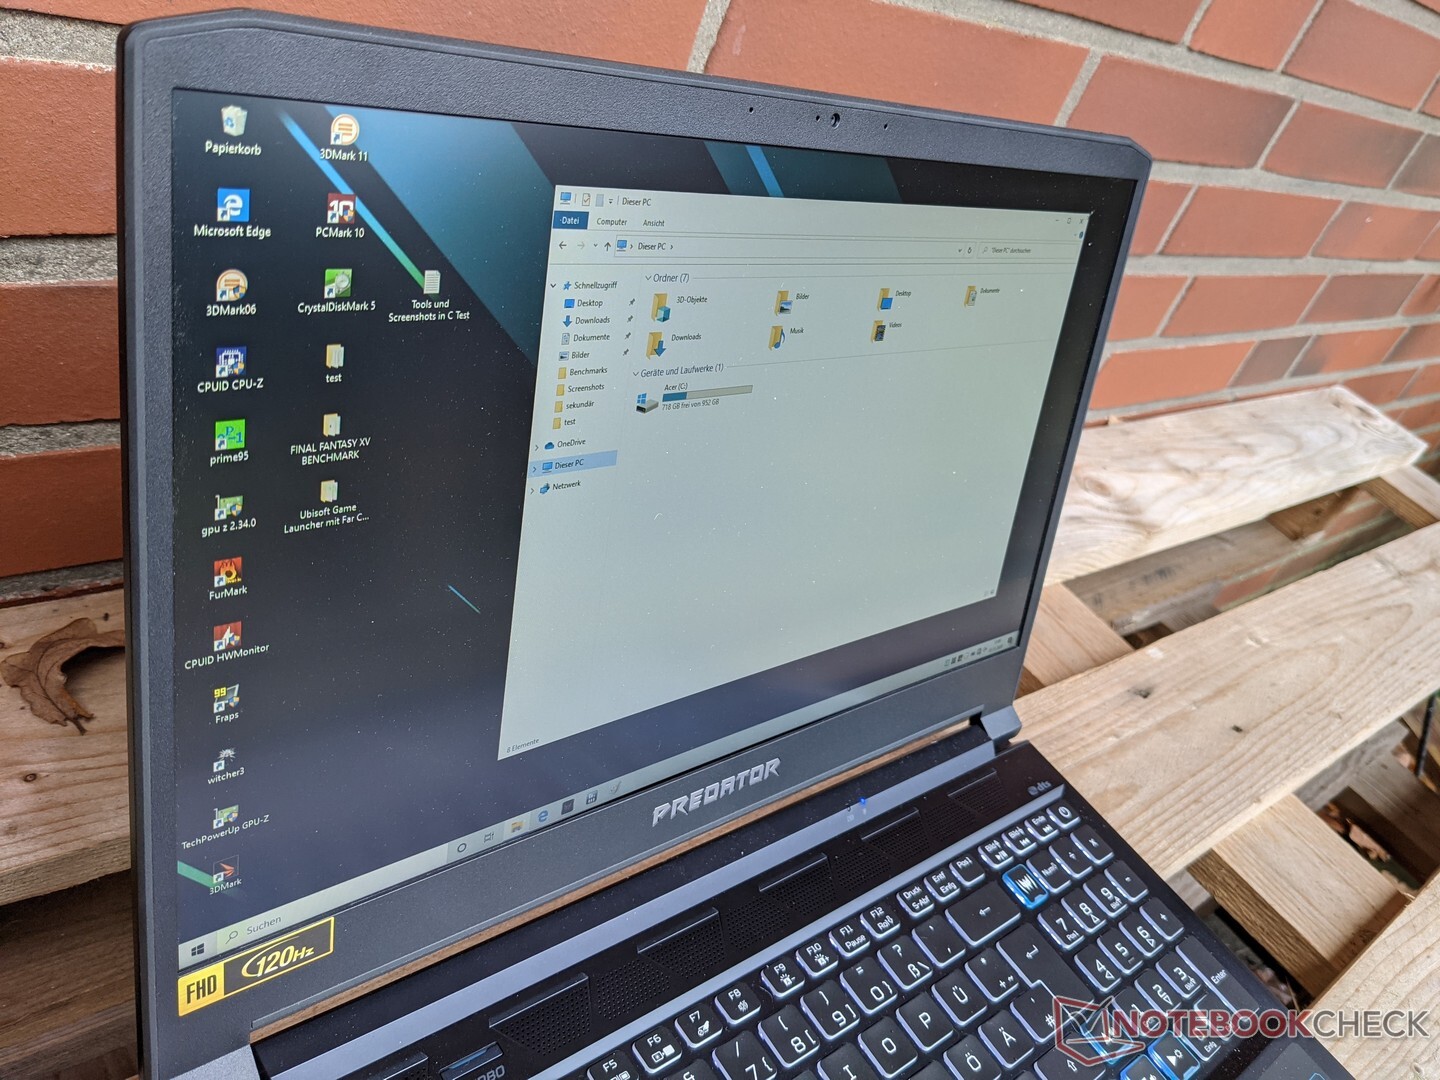
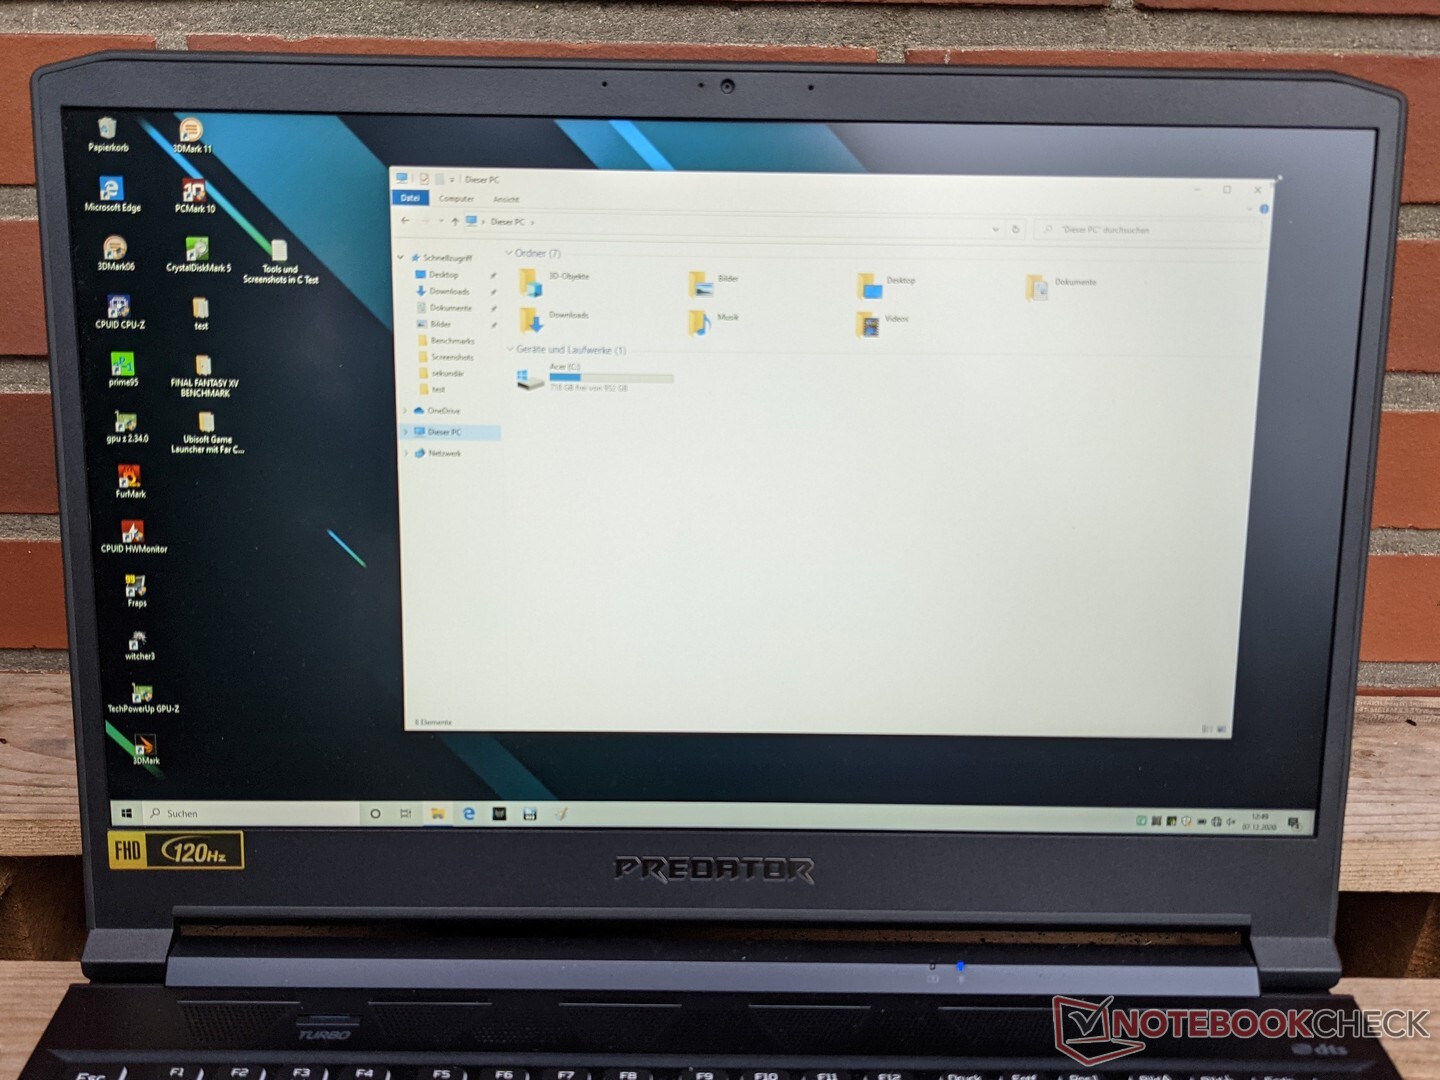
Case – Aluminum Gaming Notebook
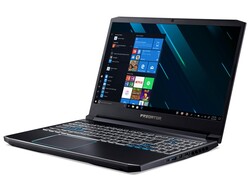
The Acer Predator Triton 300 is made of aluminum. Accordingly, the device is very robust and premium, and we found no quality issues. Its beveled edges help to differentiate the Triton 300 from the square-edged designs of its competitors. Its display bezels are fairly narrow, which helps to reduce the overall width. The lid warped slightly when opened one-handed, and it opens to a maximum opening angle of around 135 degrees.
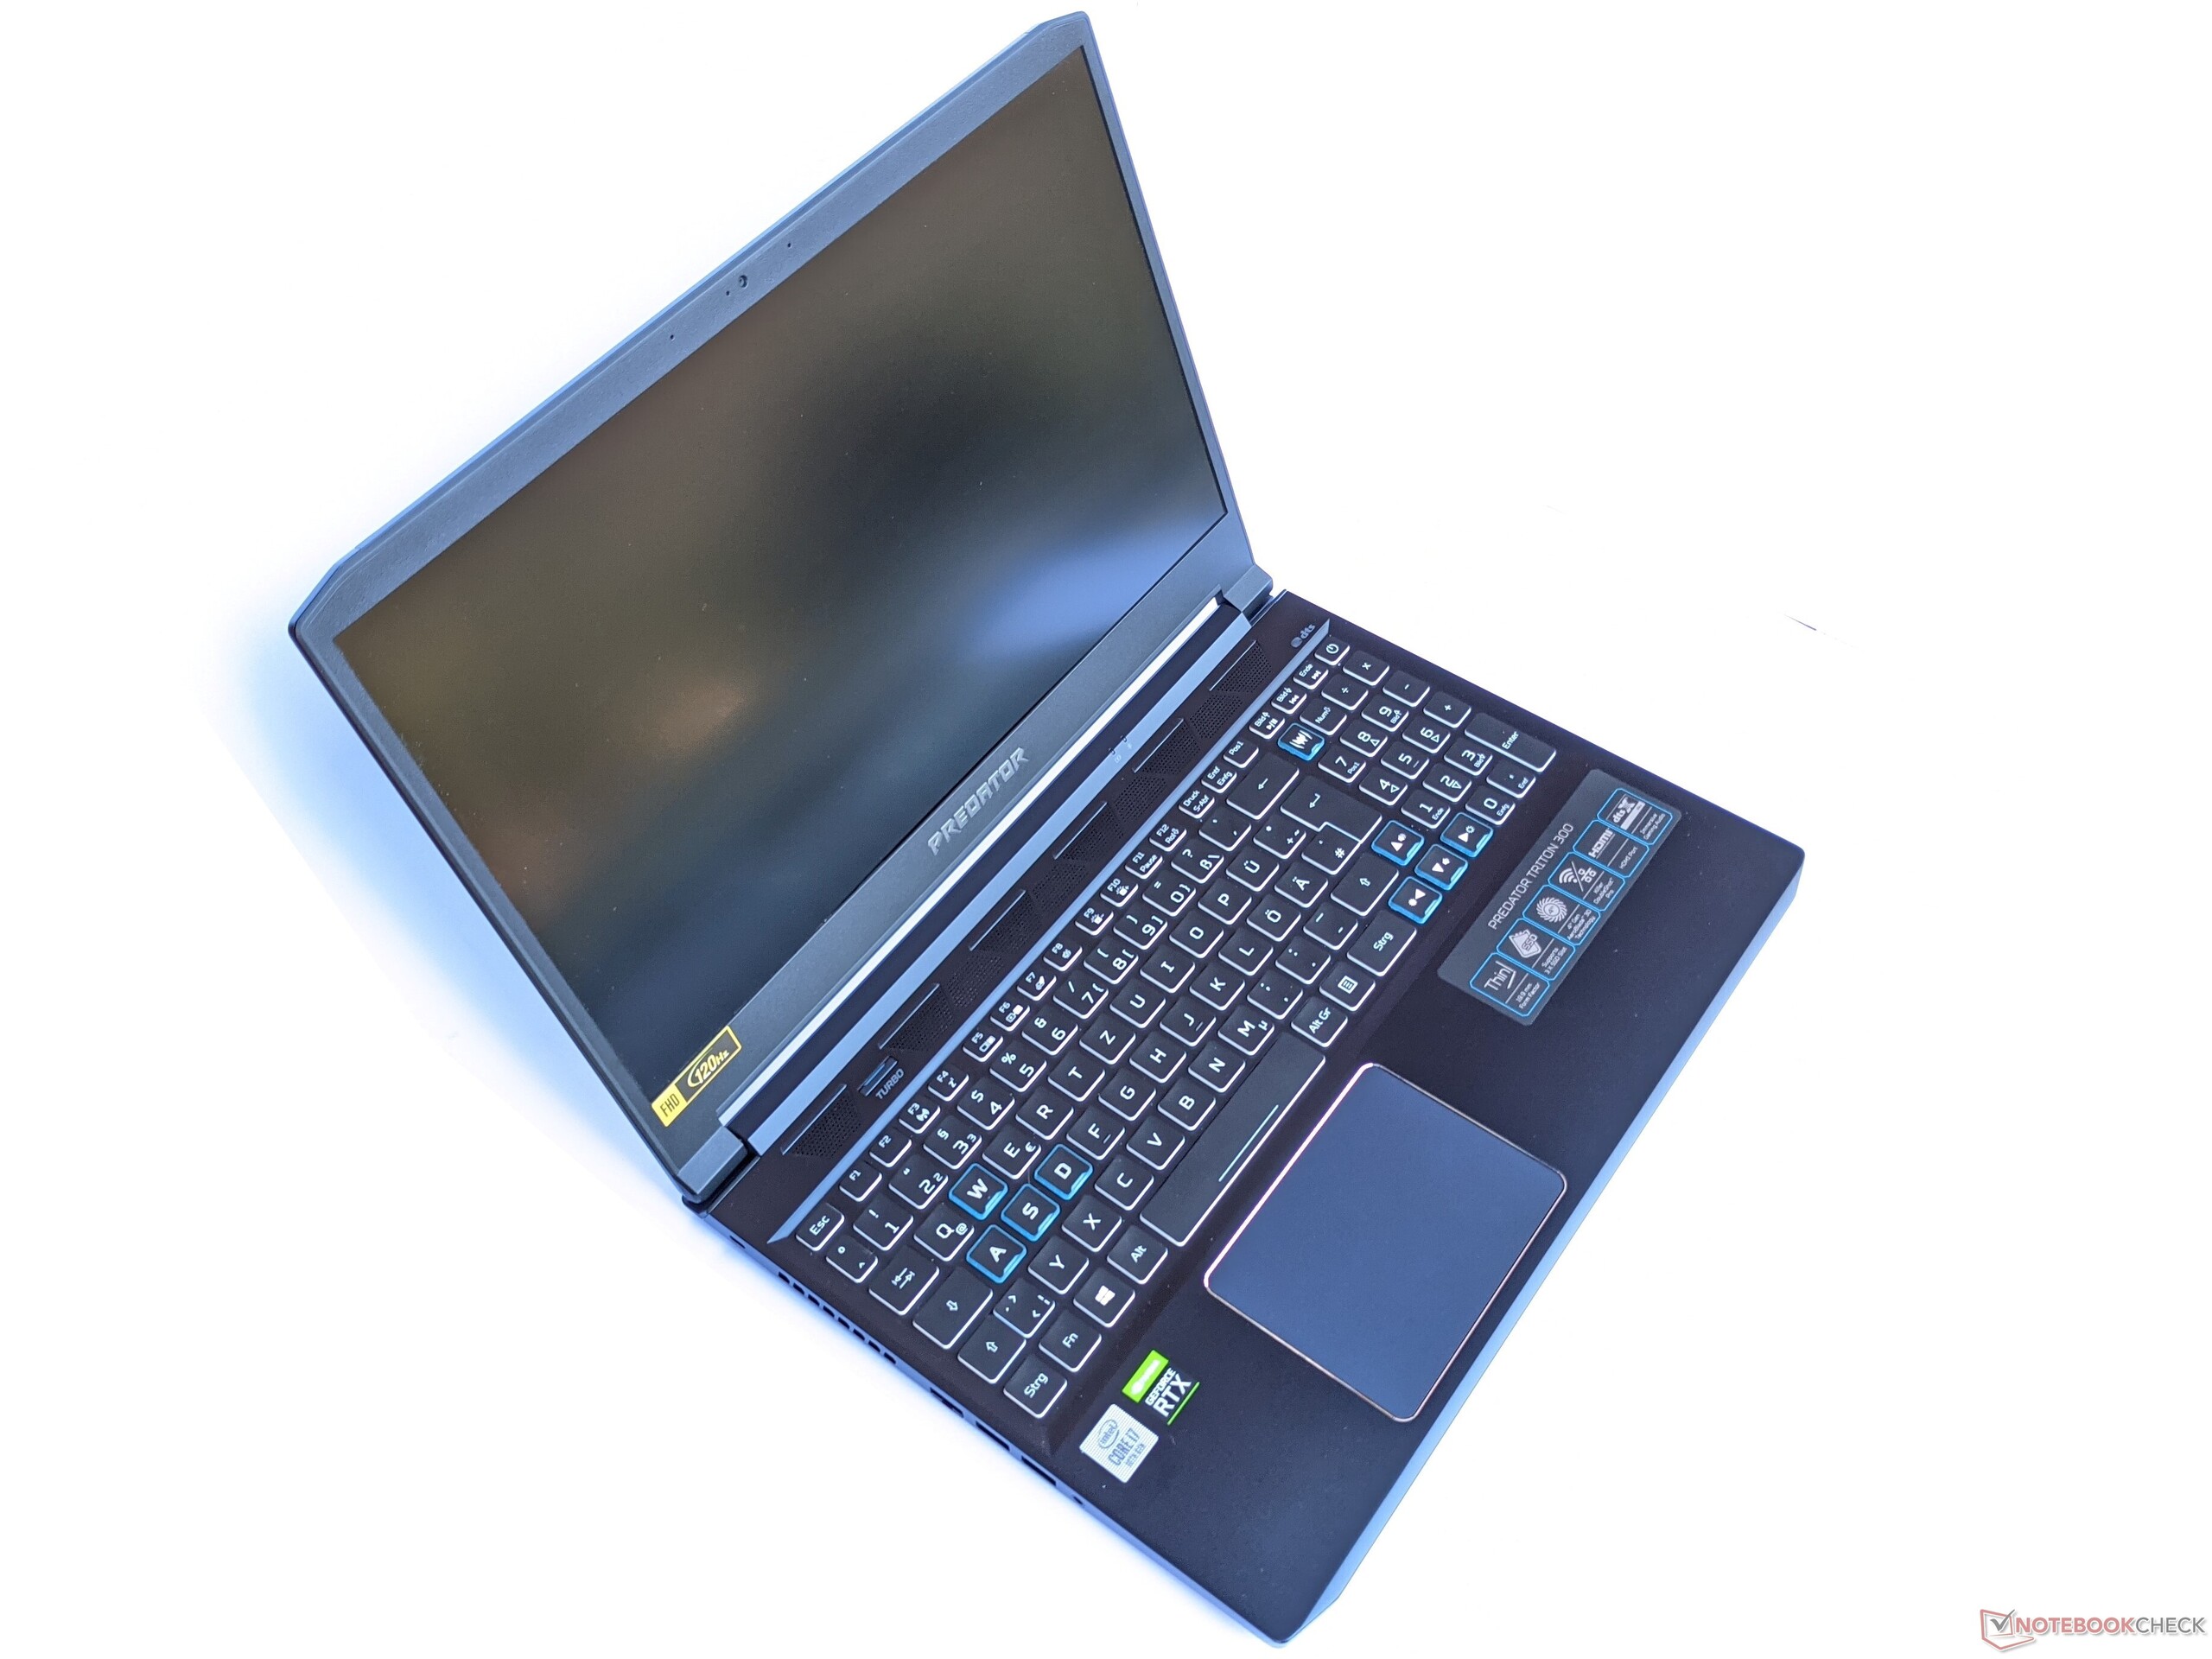
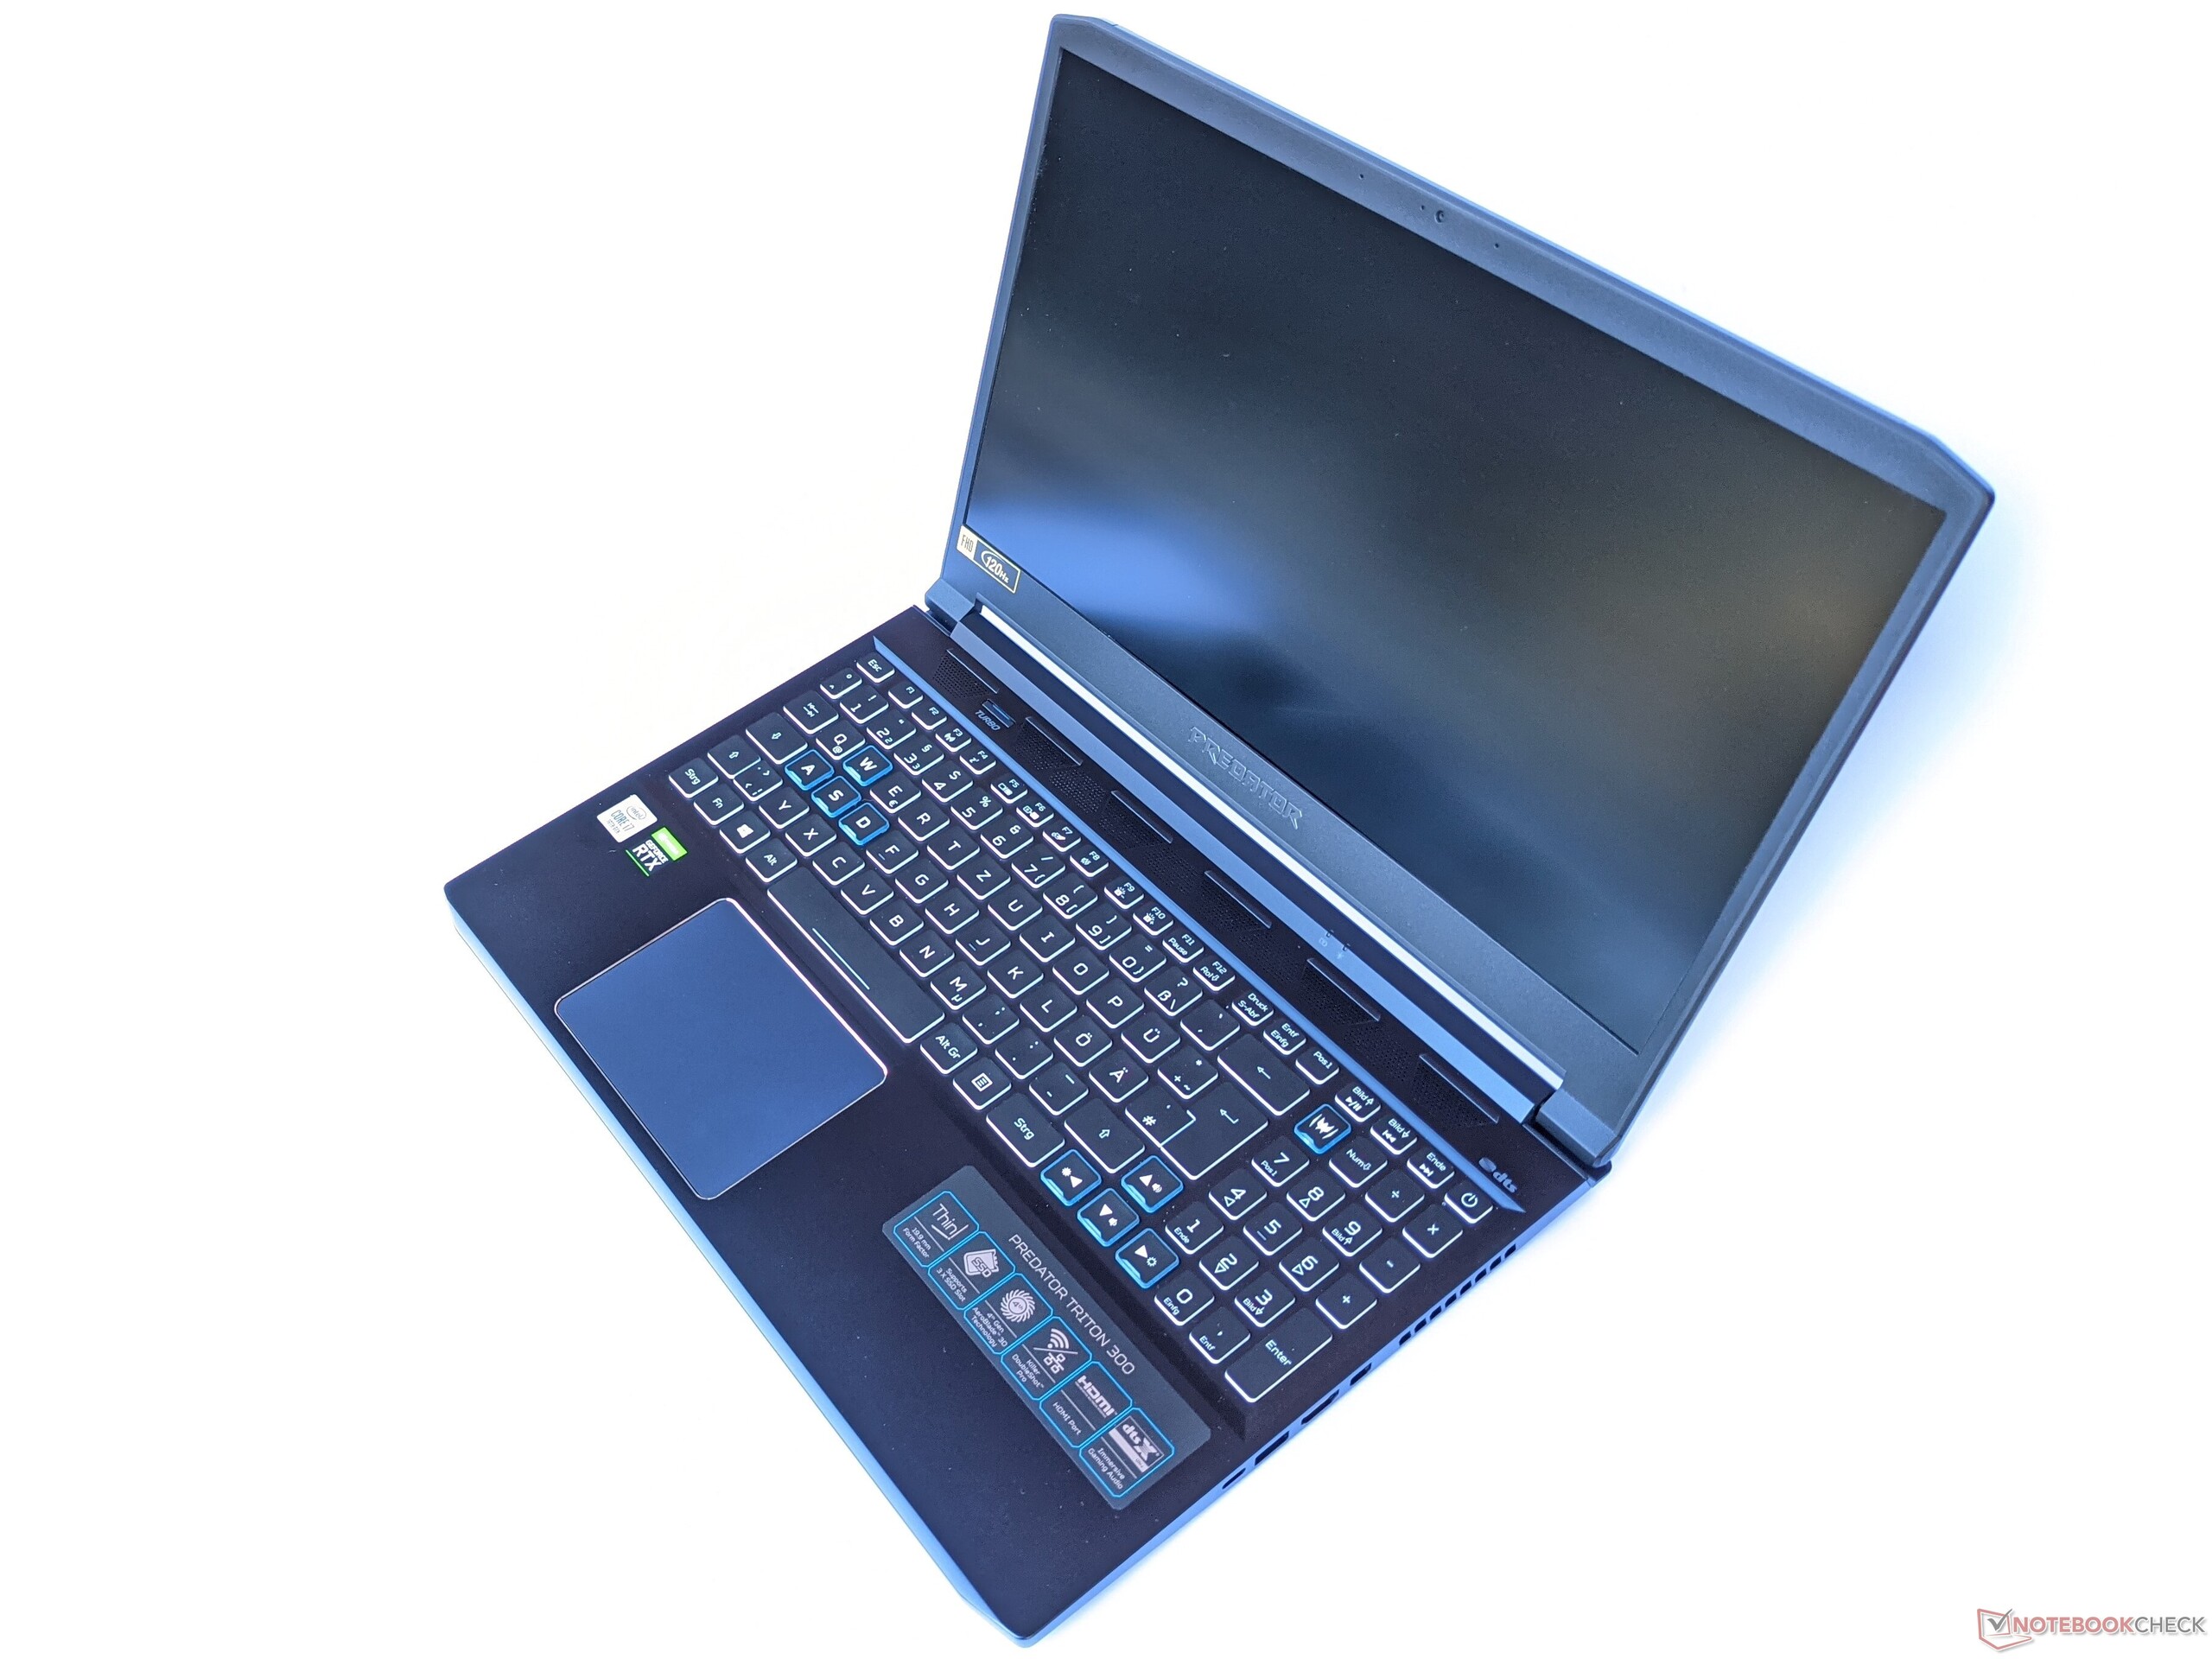
With its weight of 2.1 kg (4.6 lb) the Predator Triton 300 is on the lighter side for its class. In addition, it is slightly thinner than most of its competitors.
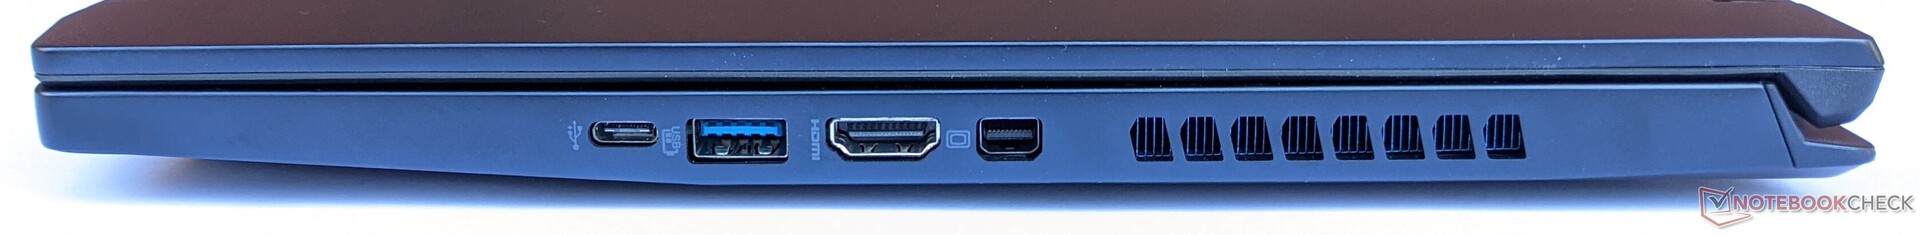
Connectivity – Triton 300 with Gigabit Ethernet and USB-C
The Predator Triton 300 features a variety of modern connectivity options, including a power supply port at the rear as well as a USB 3.1 Gen 2 Type-C port. Unfortunately, it lacks a card reader.


Communication
Acer’s gaming notebook supports network connectivity via Gigabit Ethernet as well as Wi-Fi 6. When connected to our Netgear Nighthawk AX201 reference router the latter managed transfer rates of up to 1,380 Mbps (RX) and 1,220 Mbps (TX). This may sound plenty fast but keep in mind that some of its competitors managed higher Wi-Fi transfer speeds.
Webcam
The Triton 300’s webcam’s resolution is limited to the still fairly common yet very low 0.9 MP. Accordingly, its overall image quality is rather poor. Our test chart photo was blurry with washed out colors.


Accessories
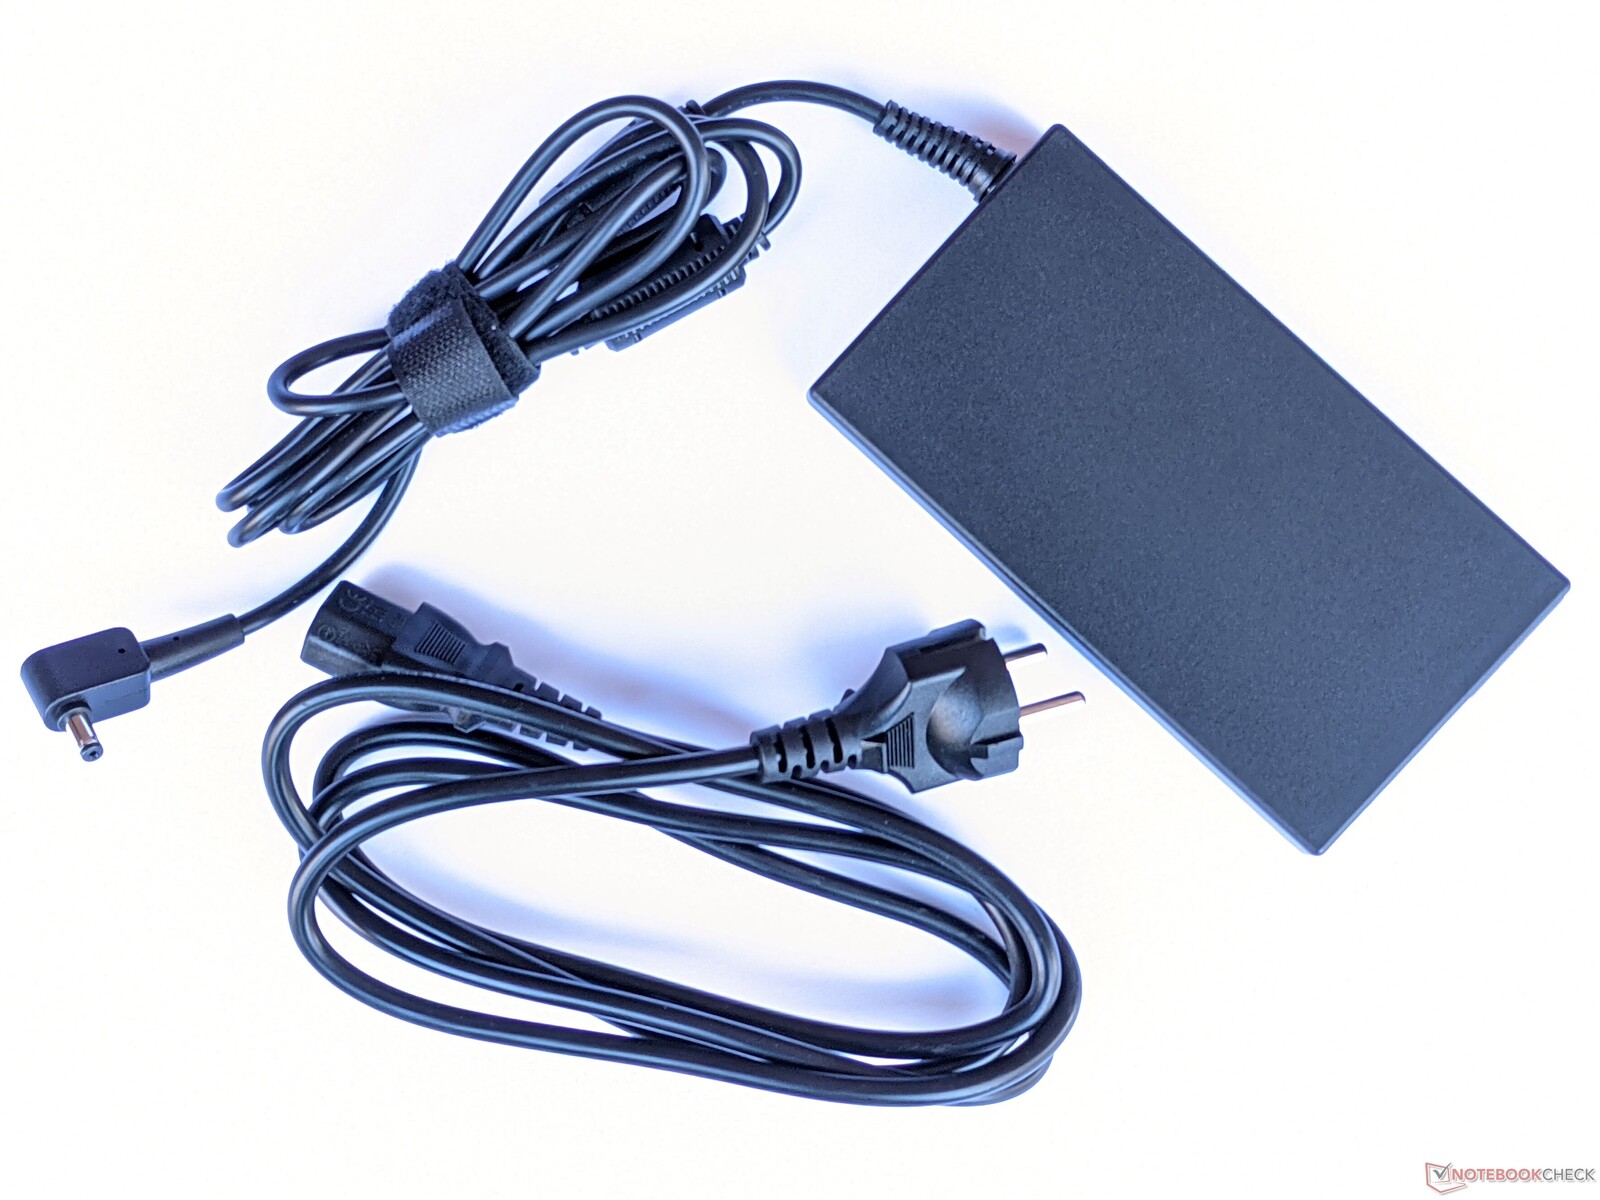
Included in the box are the laptop itself and a power supply. In addition, Acer offers a wide selection of gaming accessories on its website.
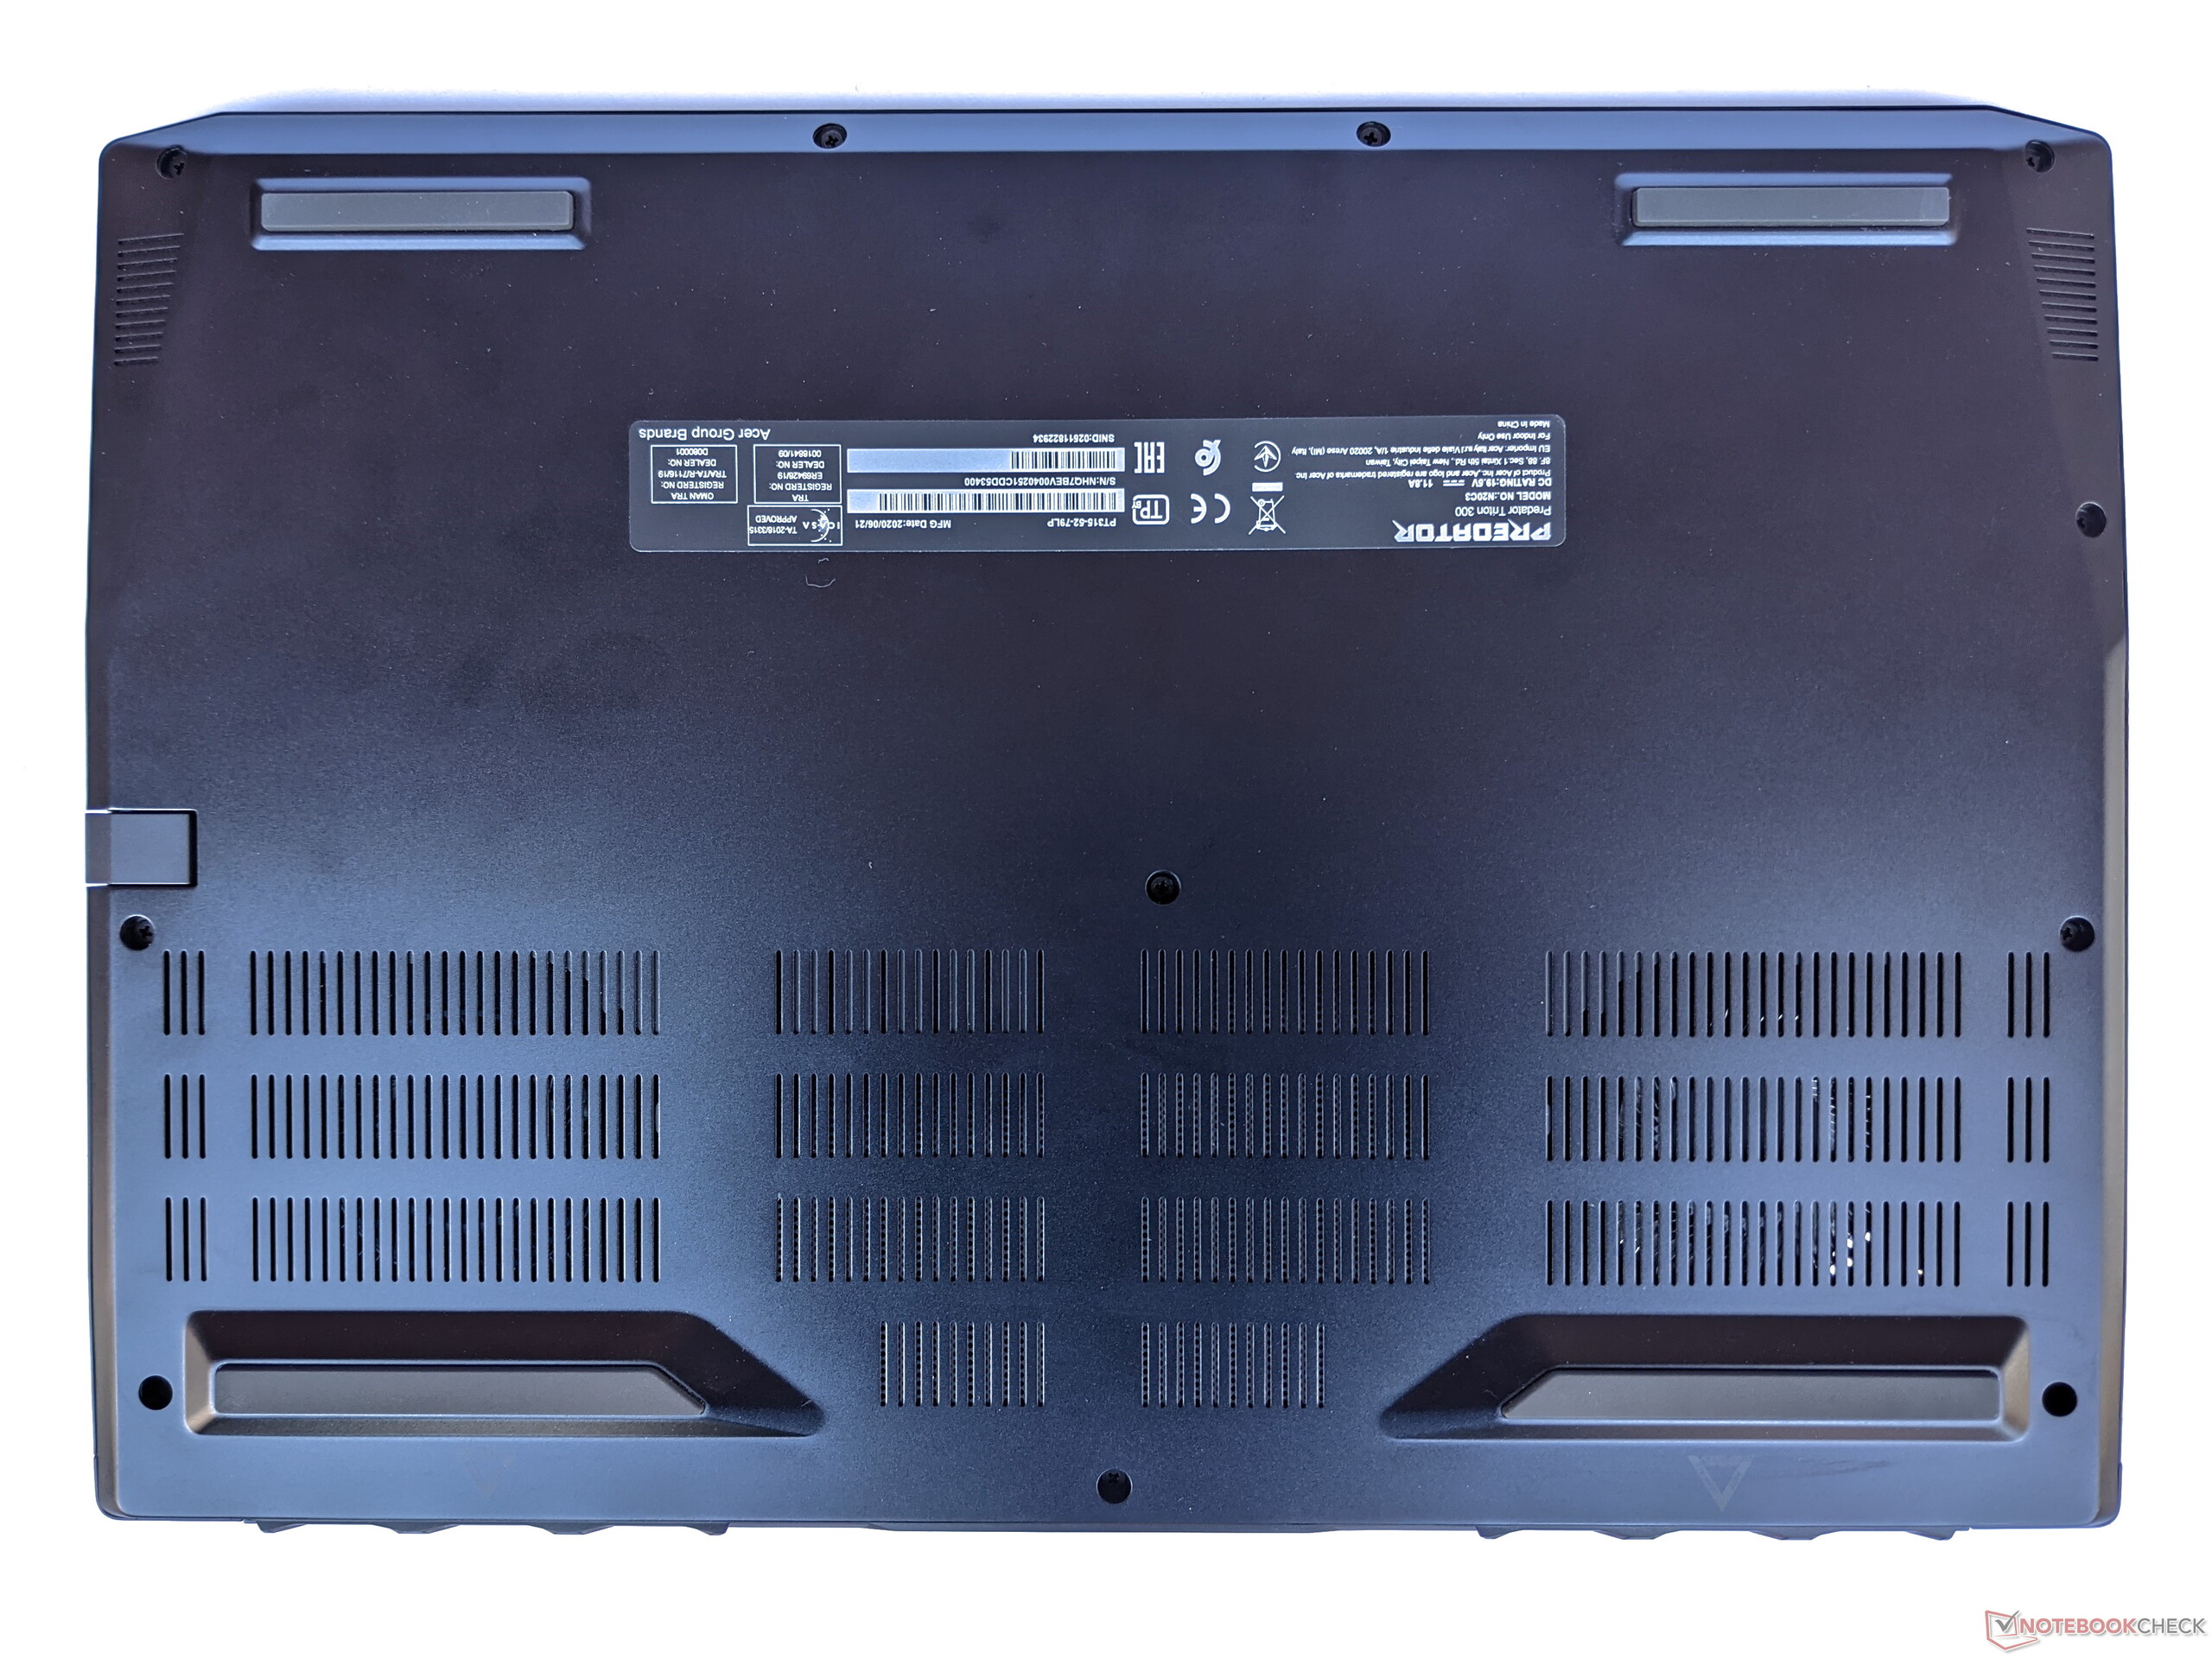
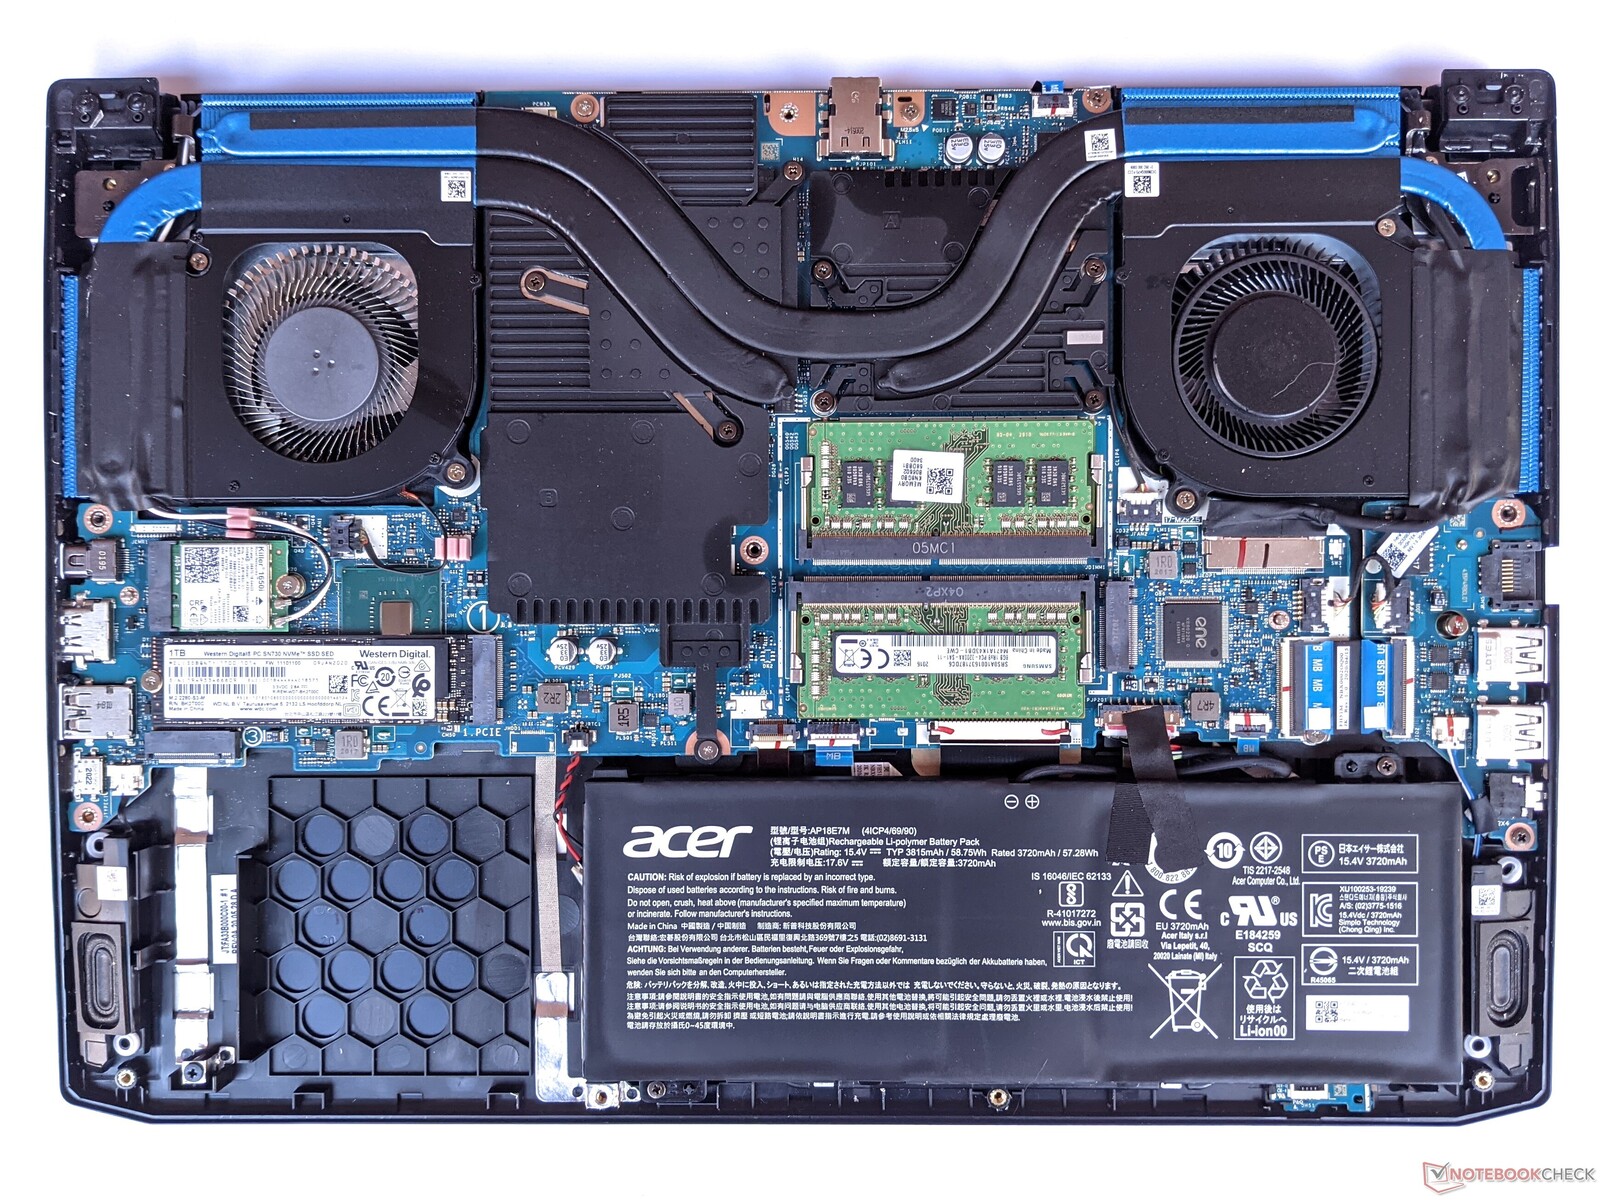
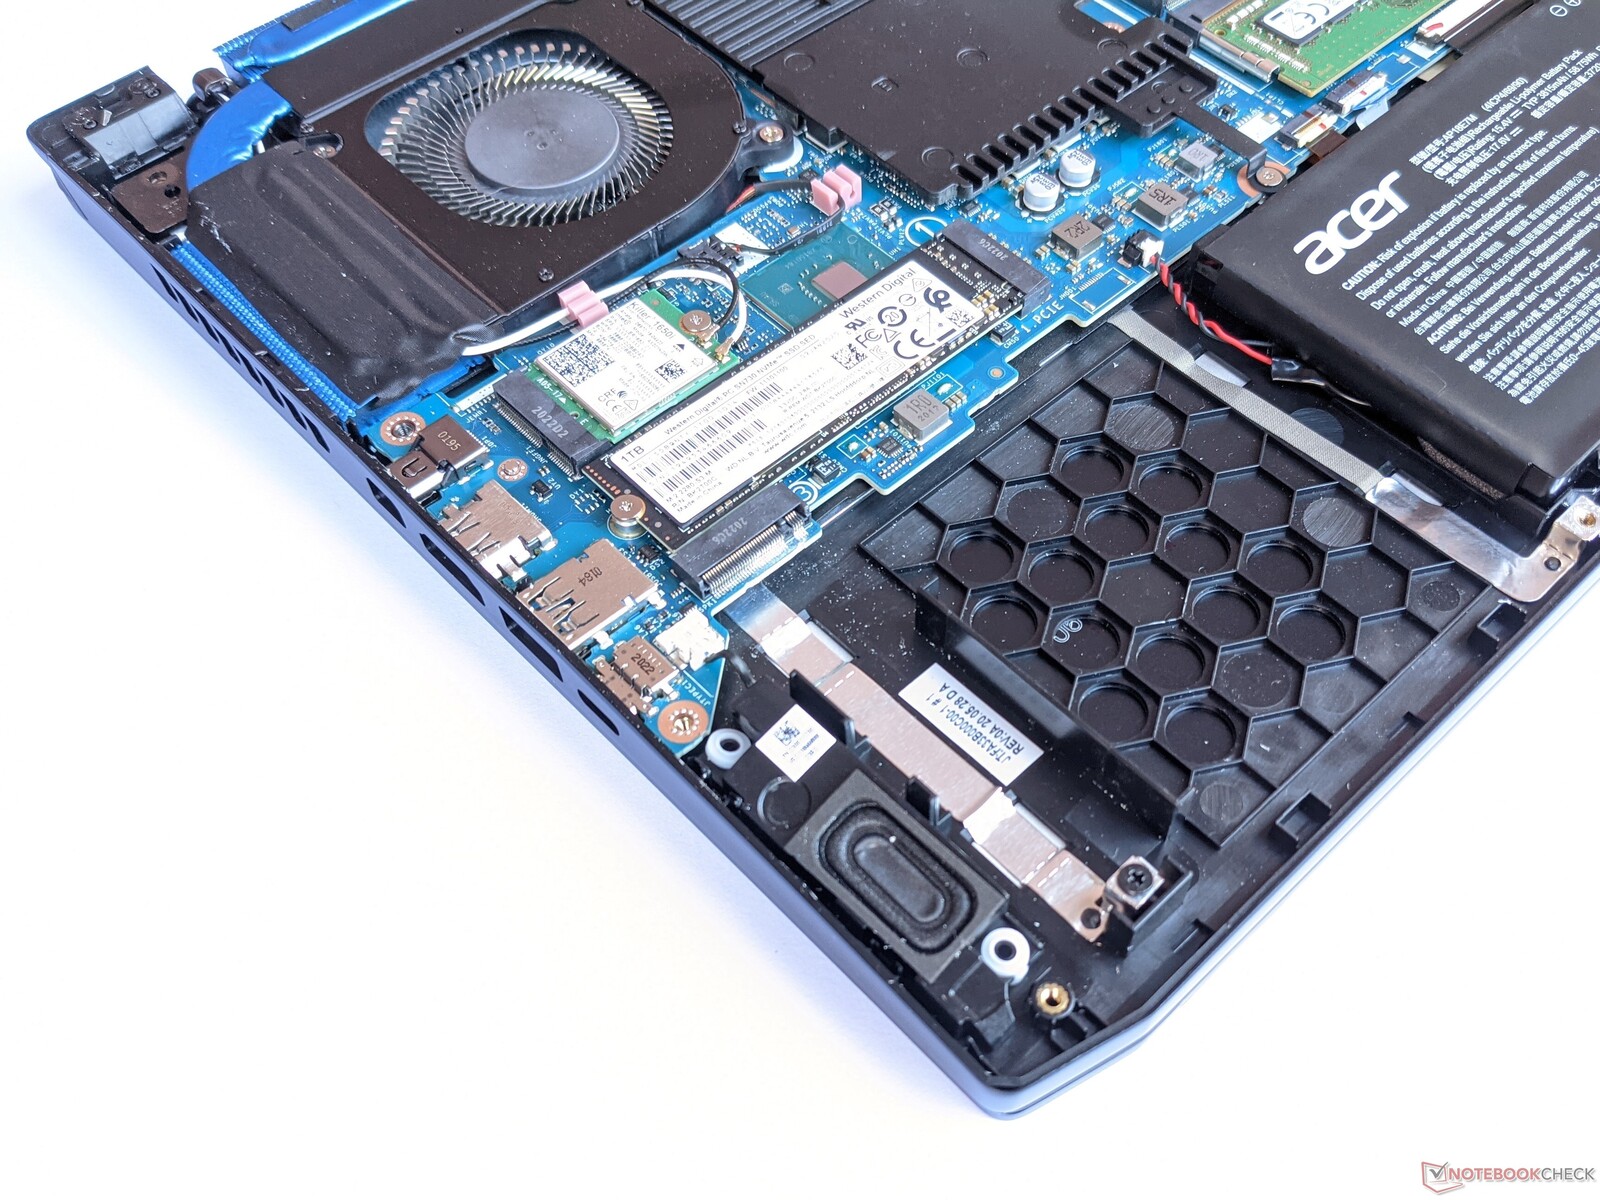
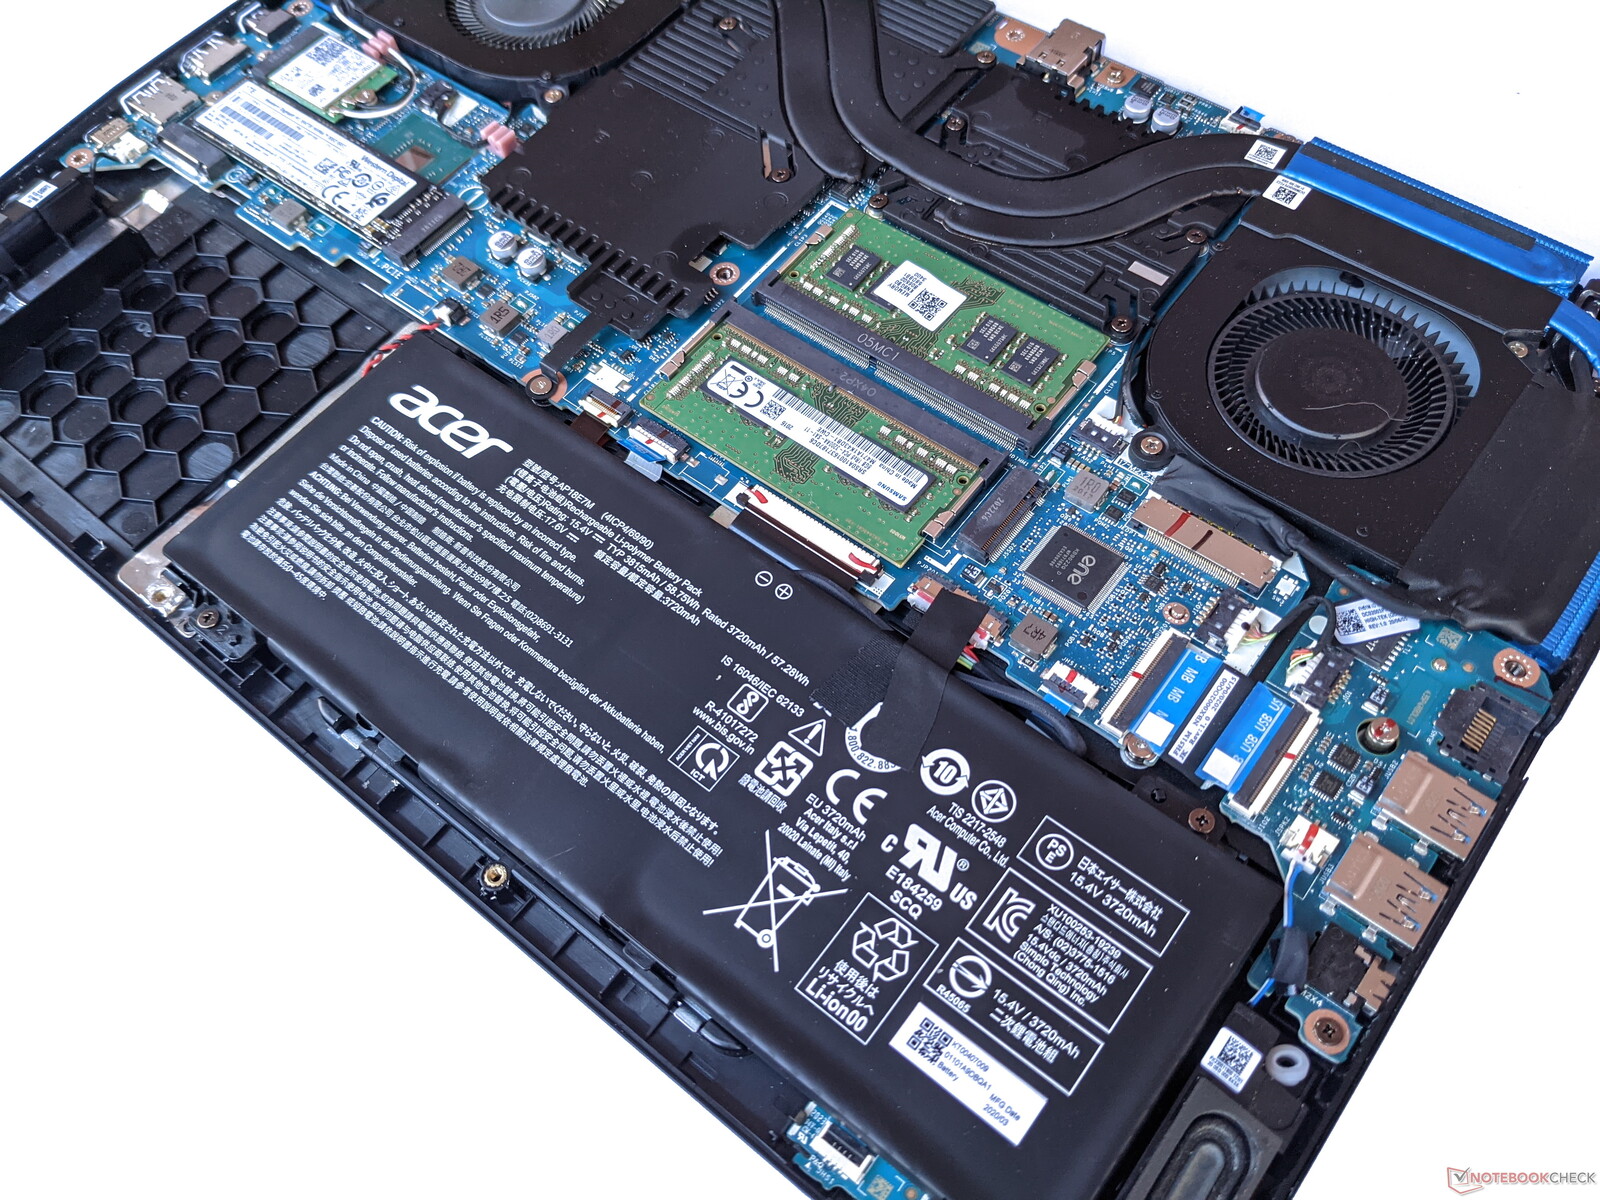
Maintenance
In order to open the Predator Triton 300 all visible screws have to be undone. With the bottom cover removed you have access to the secondary SSD slot, the RAM slots, and the Wi-Fi modem.
Warranty
European customers get a full 24 months of warranty while US customers are once again limited to just 12 months.
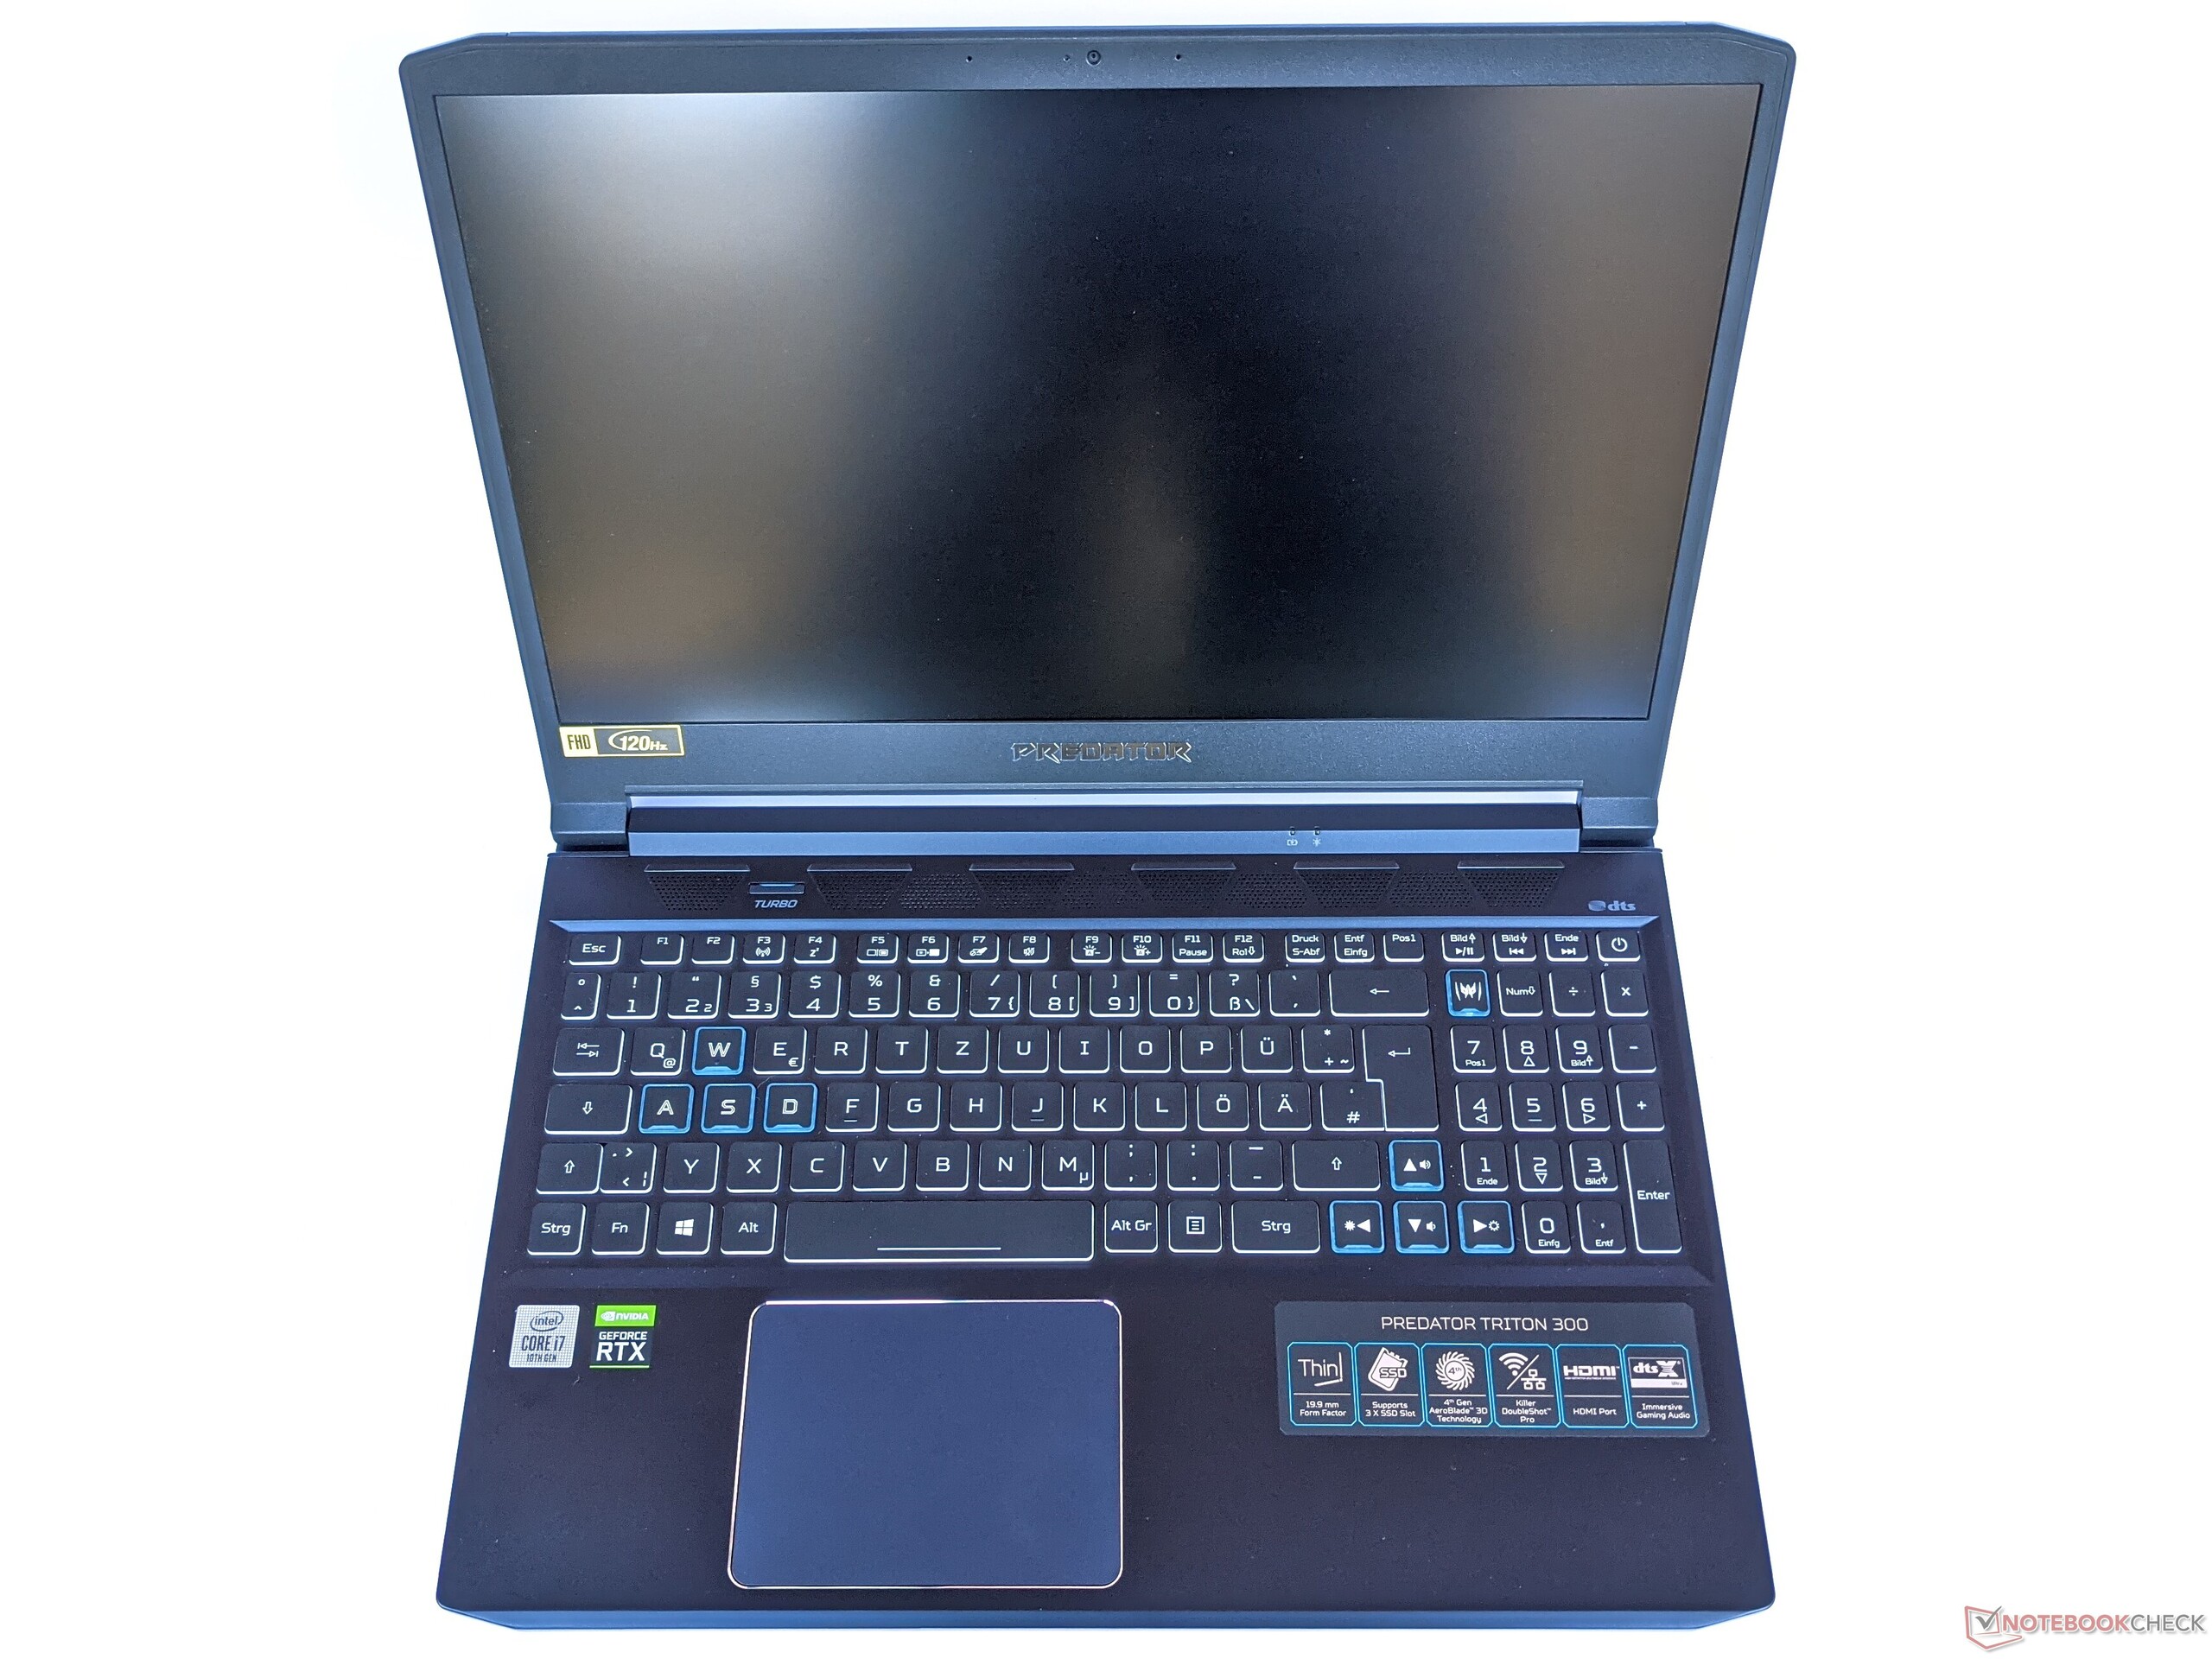
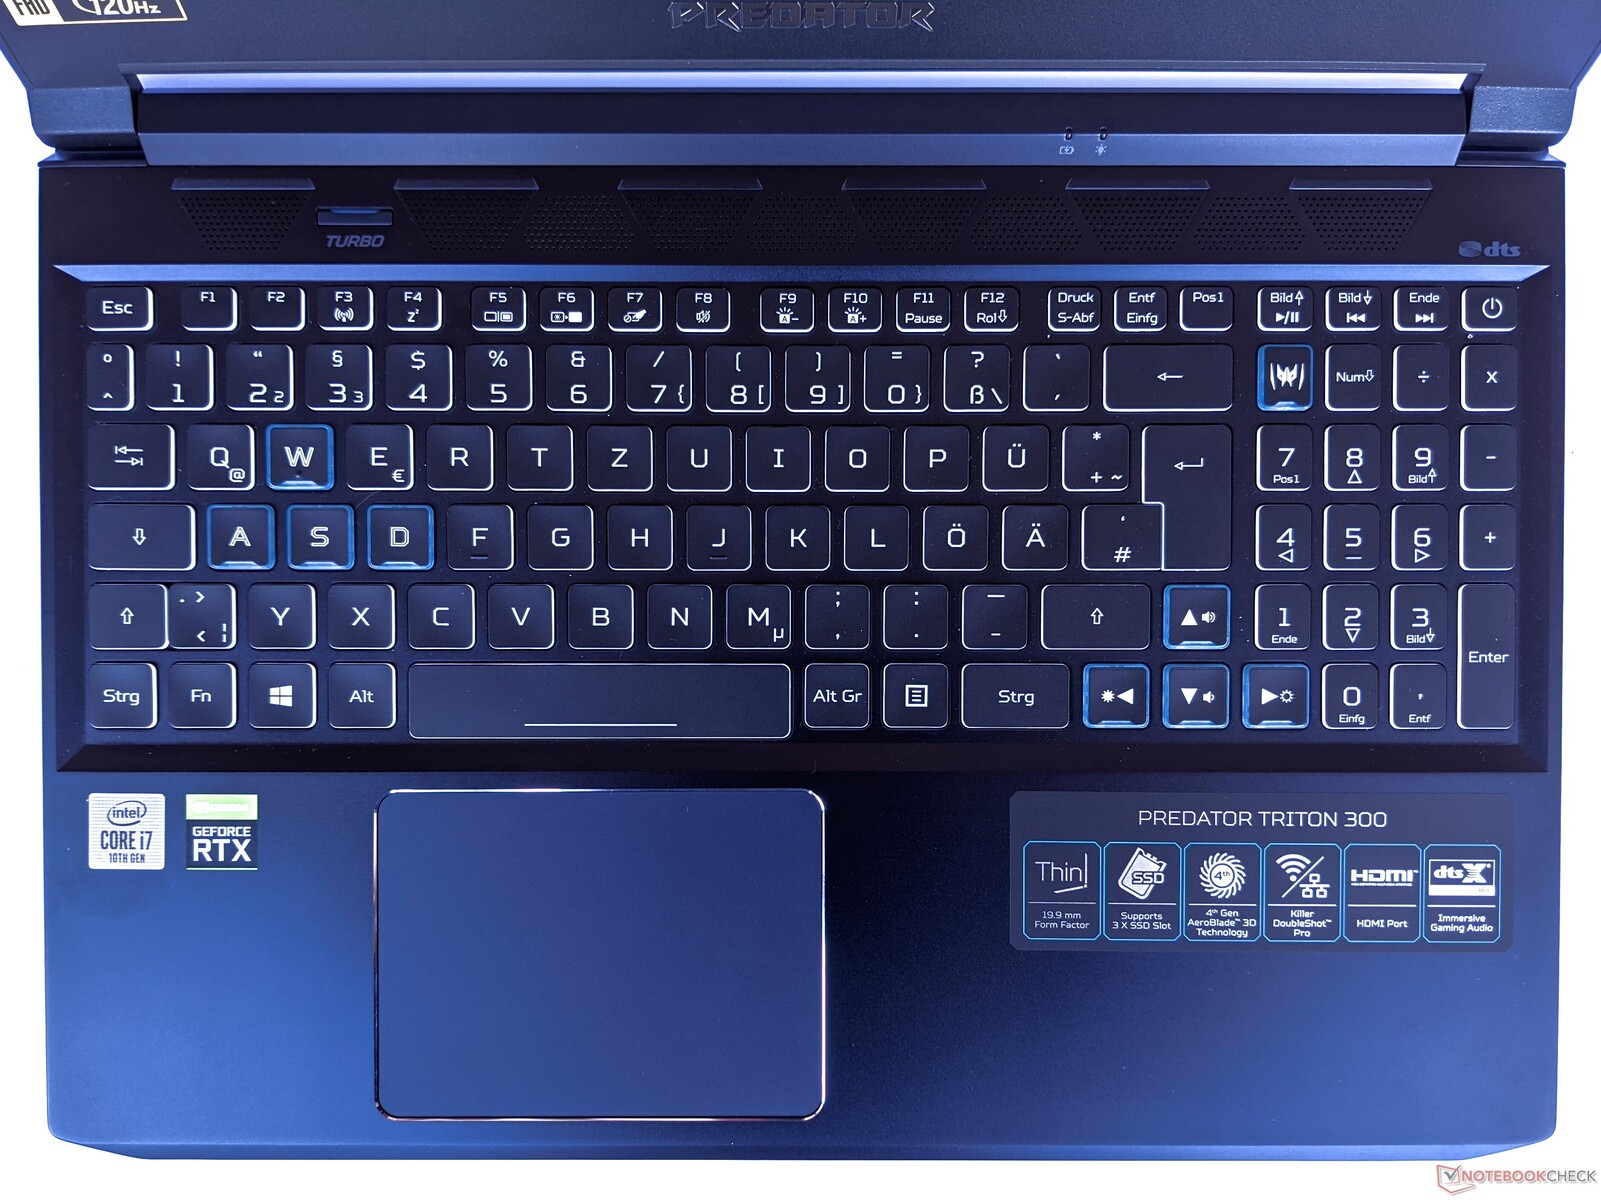
Input Devices – Gaming Notebook with RGB Backlight
Keyboard
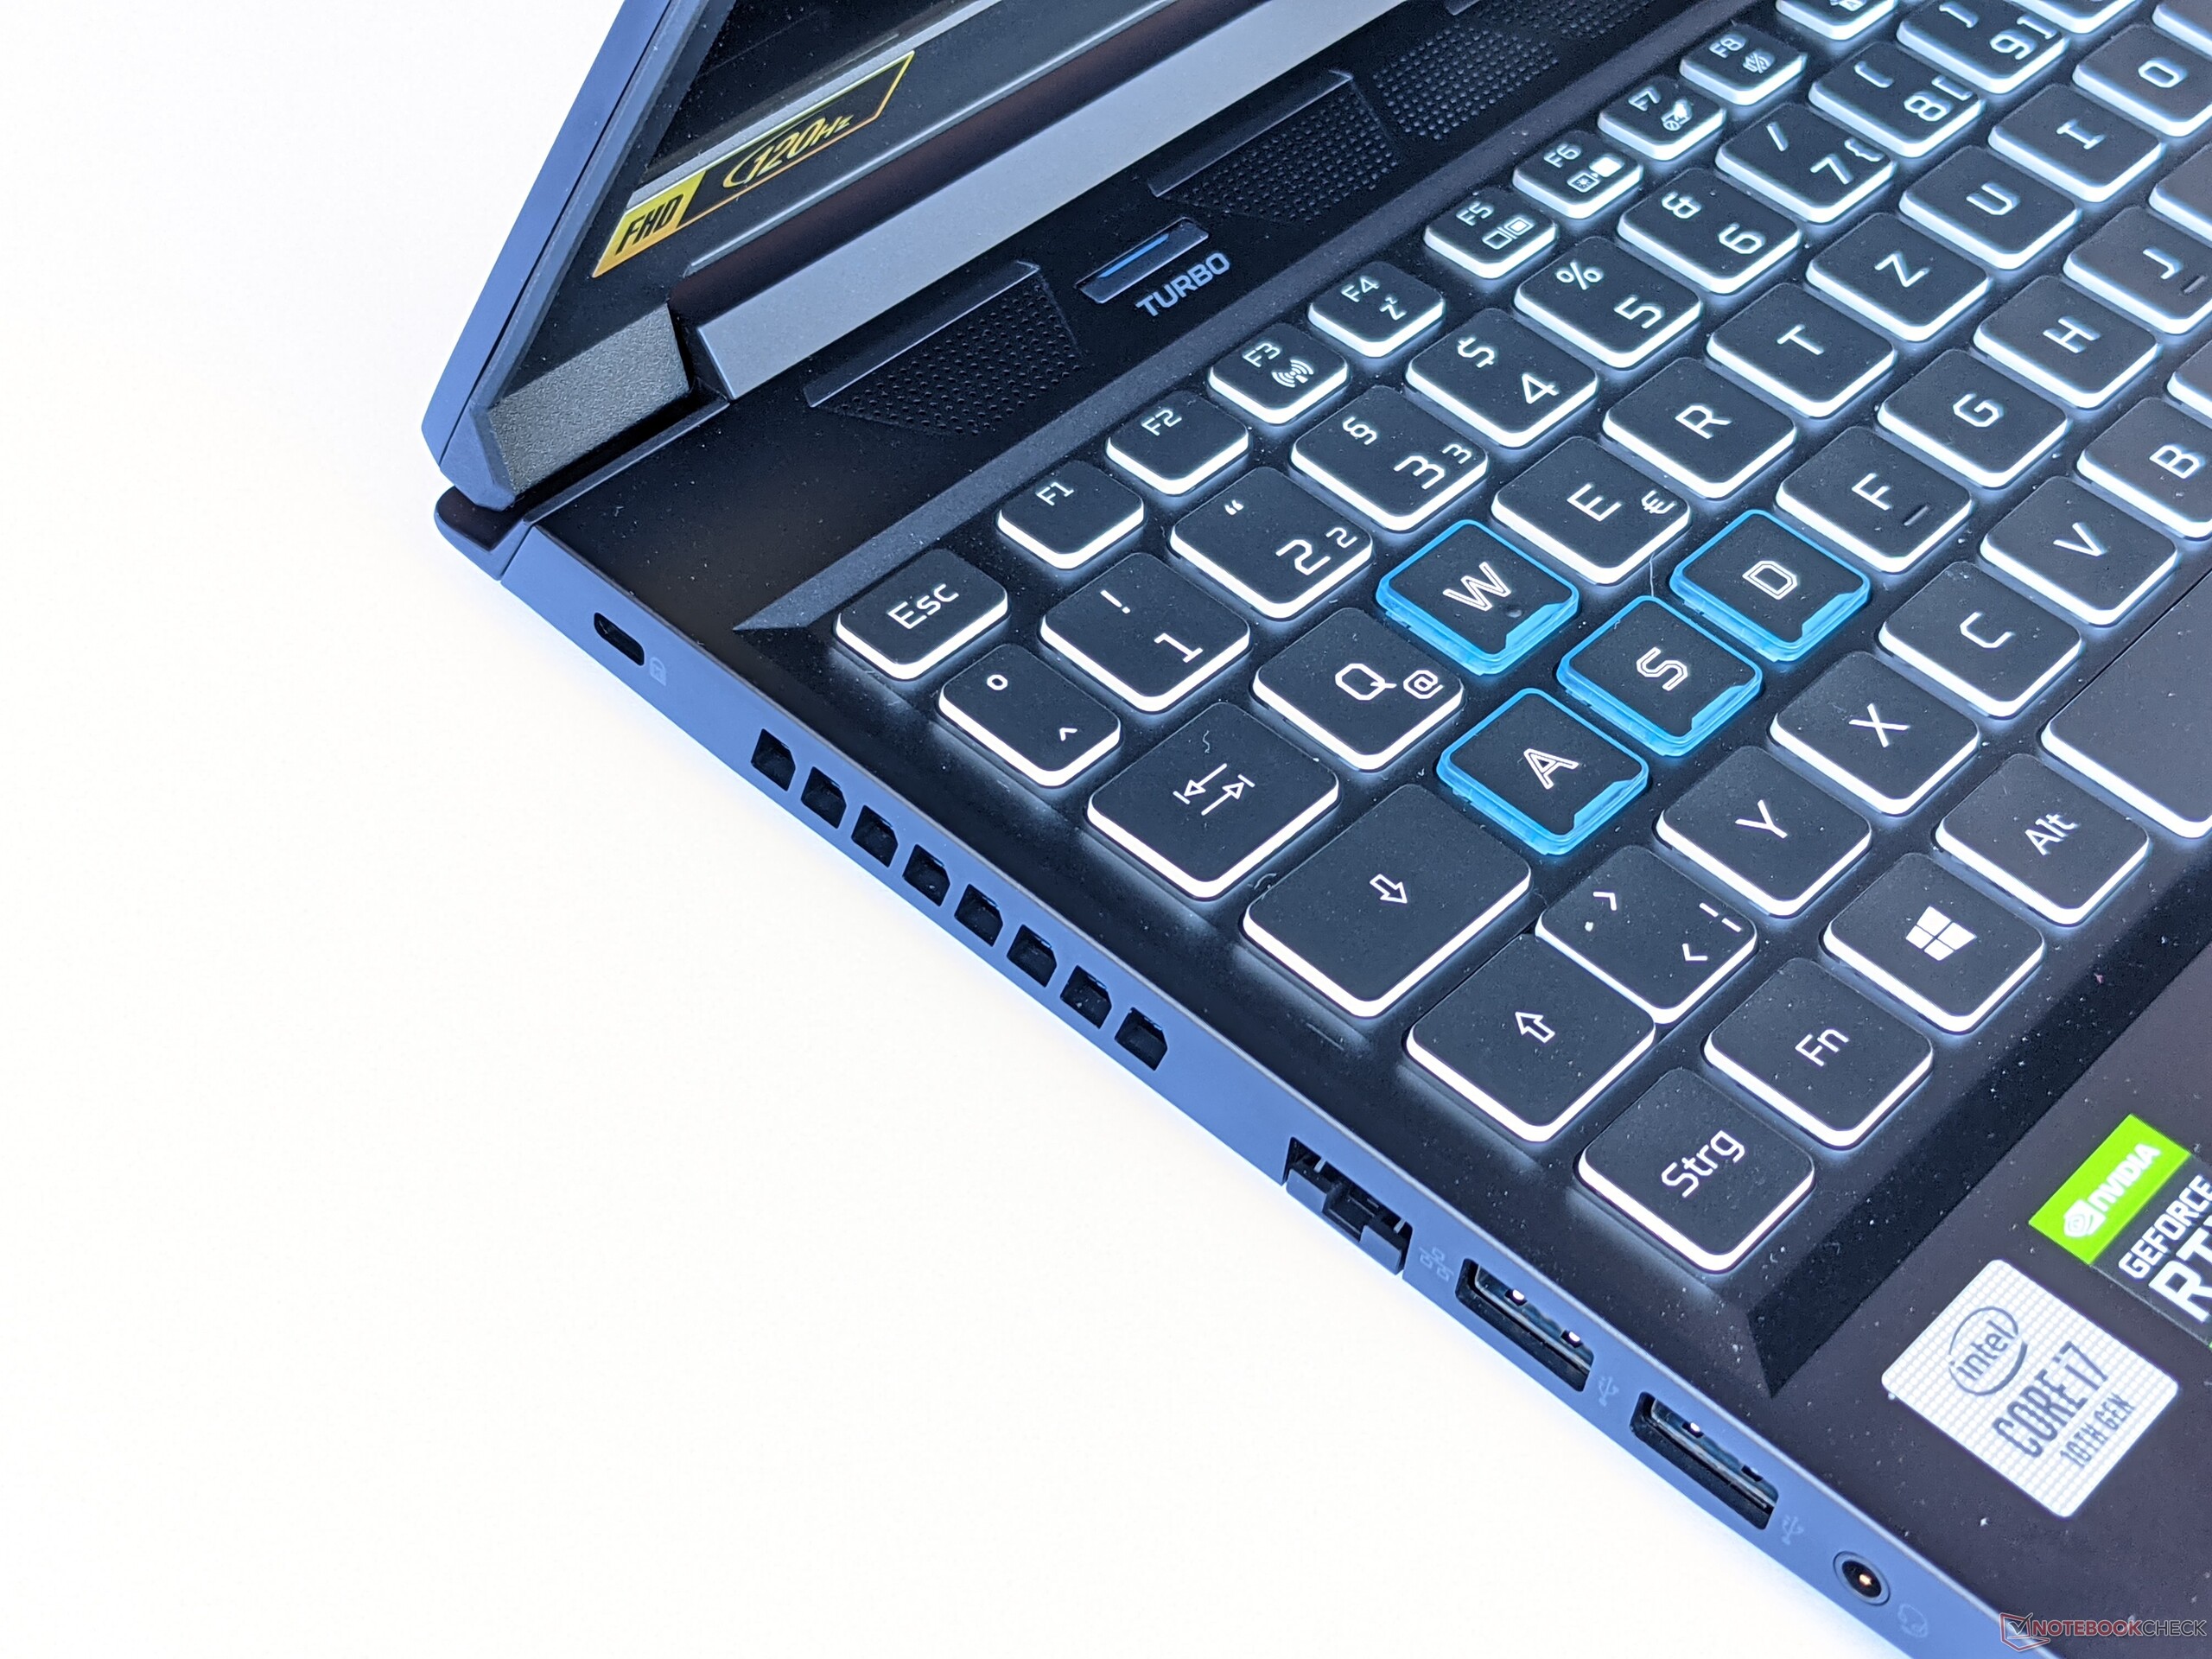
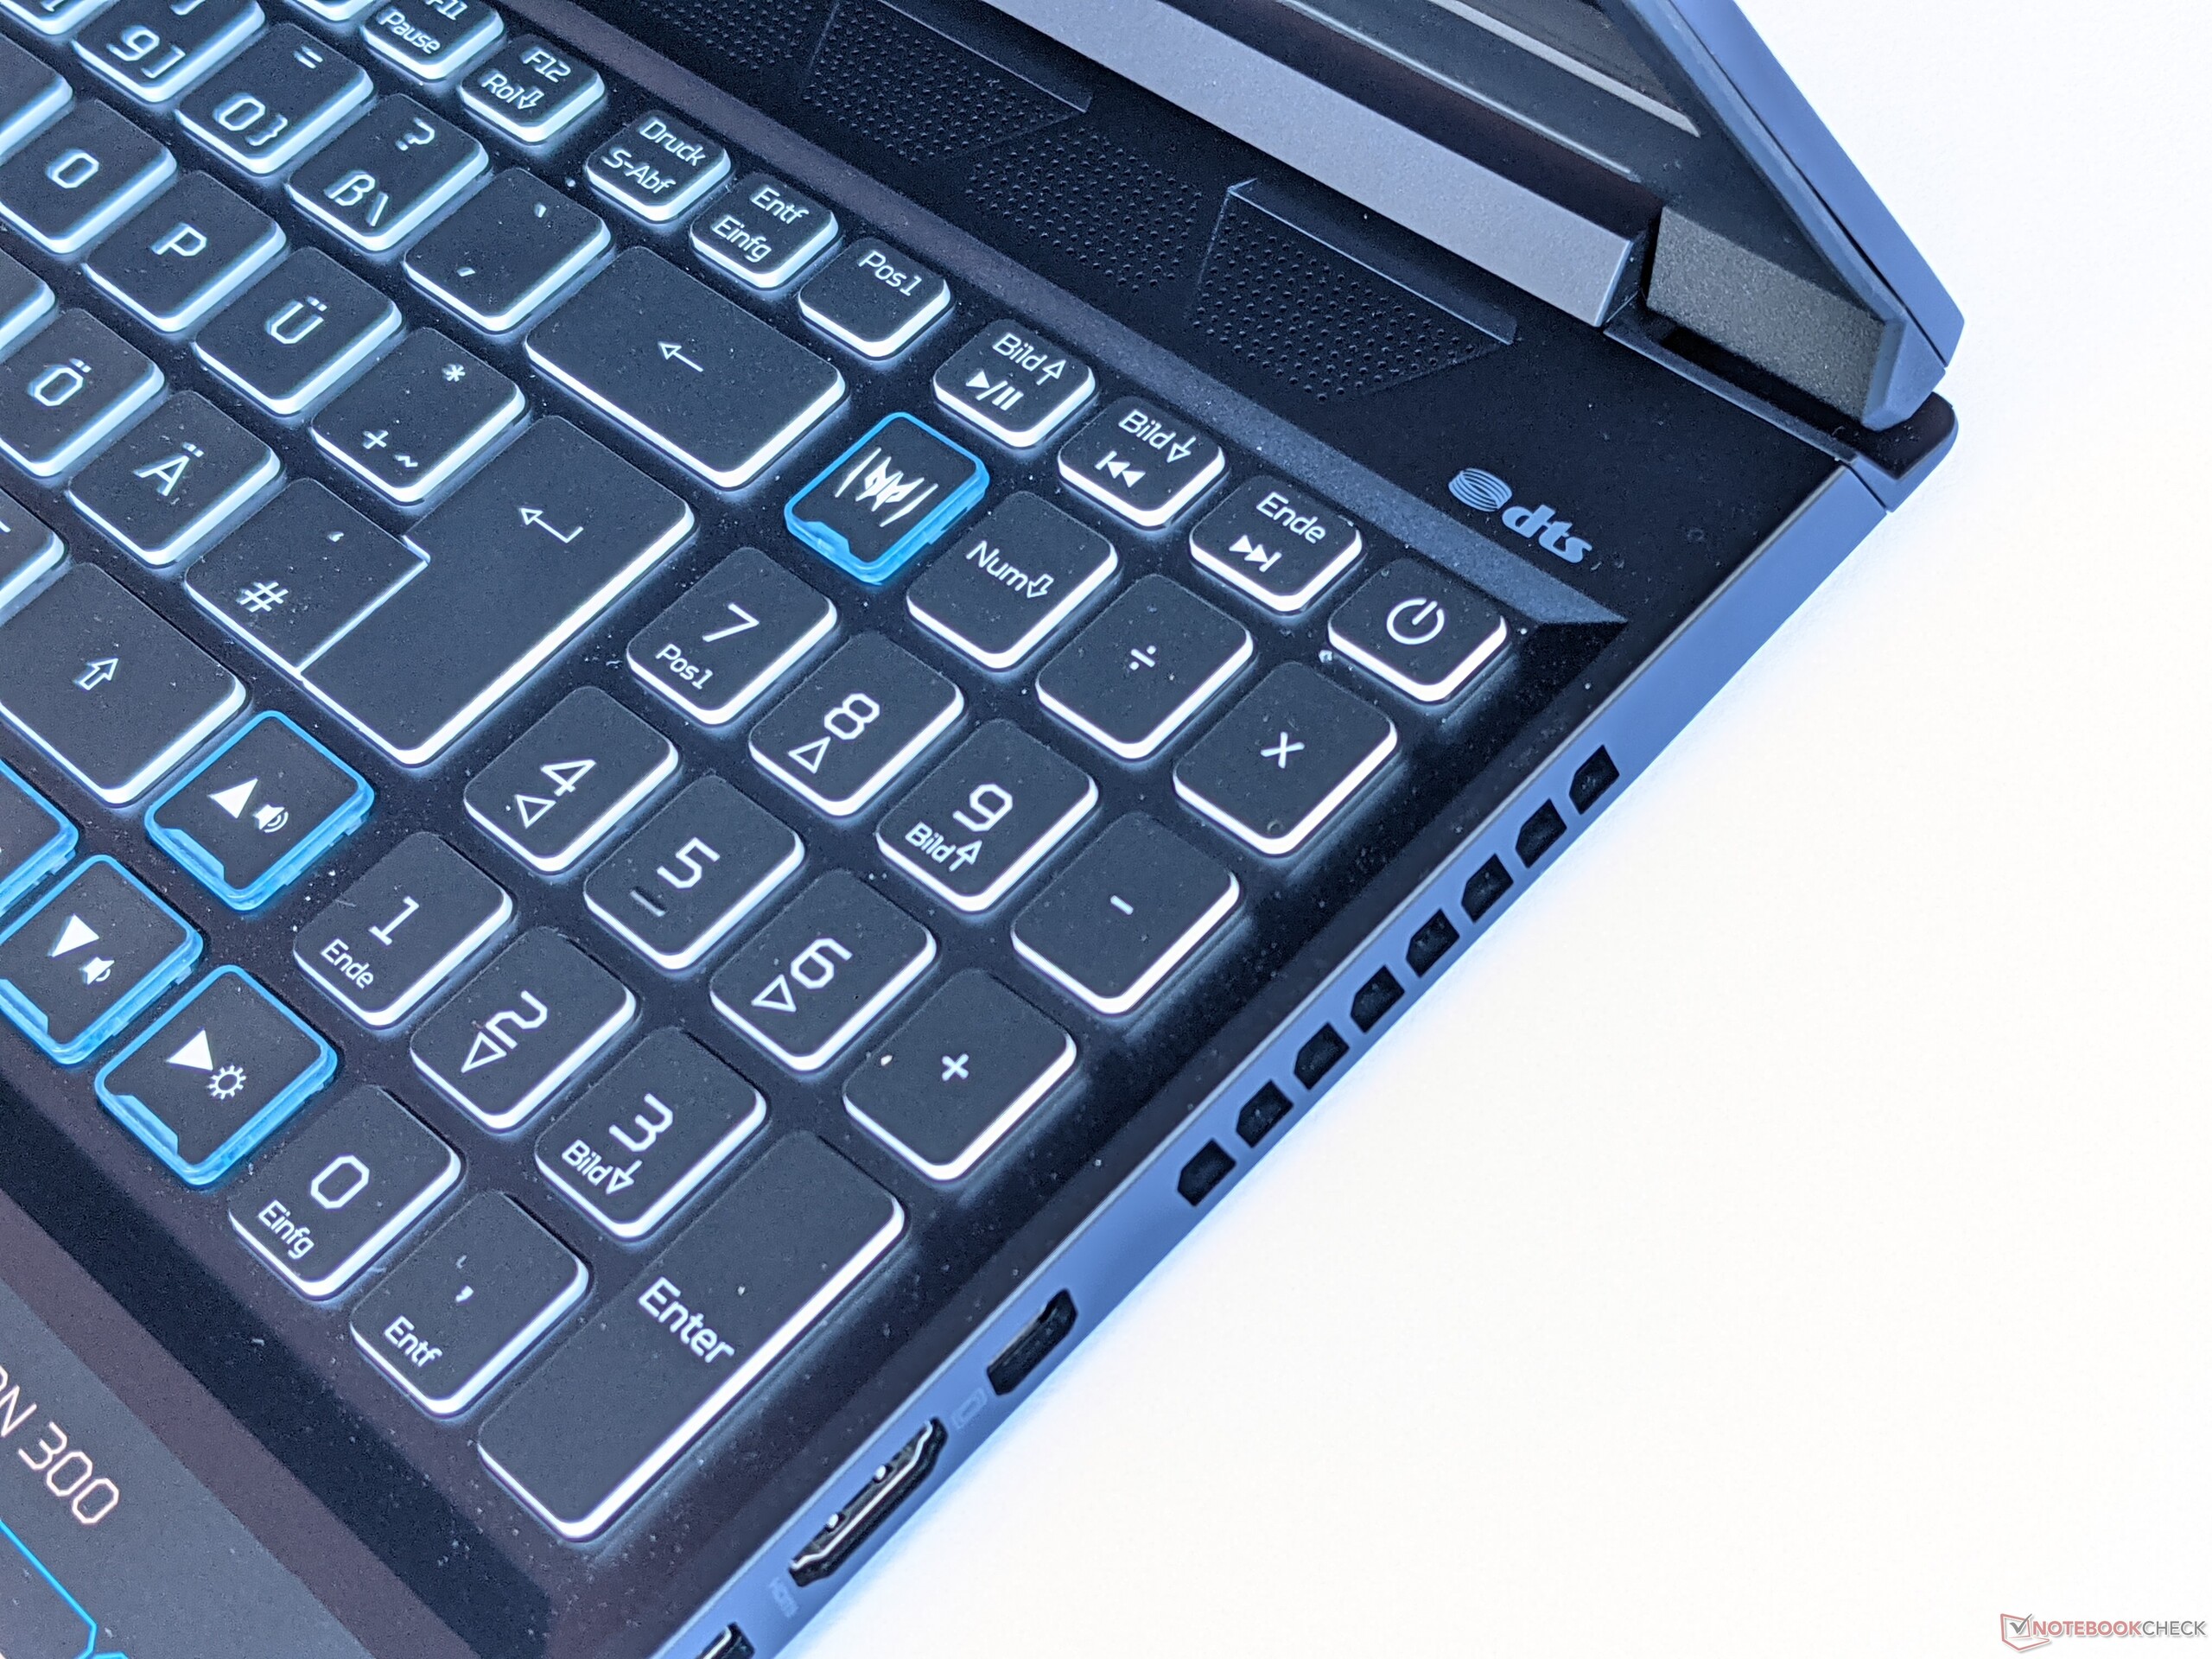
Acer’s notebook keyboard offered a decent amount of support for our hands and fingers. Feedback is rather soft but still good enough to get a feeling for the keyboard’s accentuation point. Various clusters of keys, such as WASD, are highlighted with extra tactile feedback for easier recognizability. Additional individualization and customization can be achieved with the configurable four-zone RGB backlight. The colorful lightshow does not create any glare and its brightness can be adjusted in three stages.
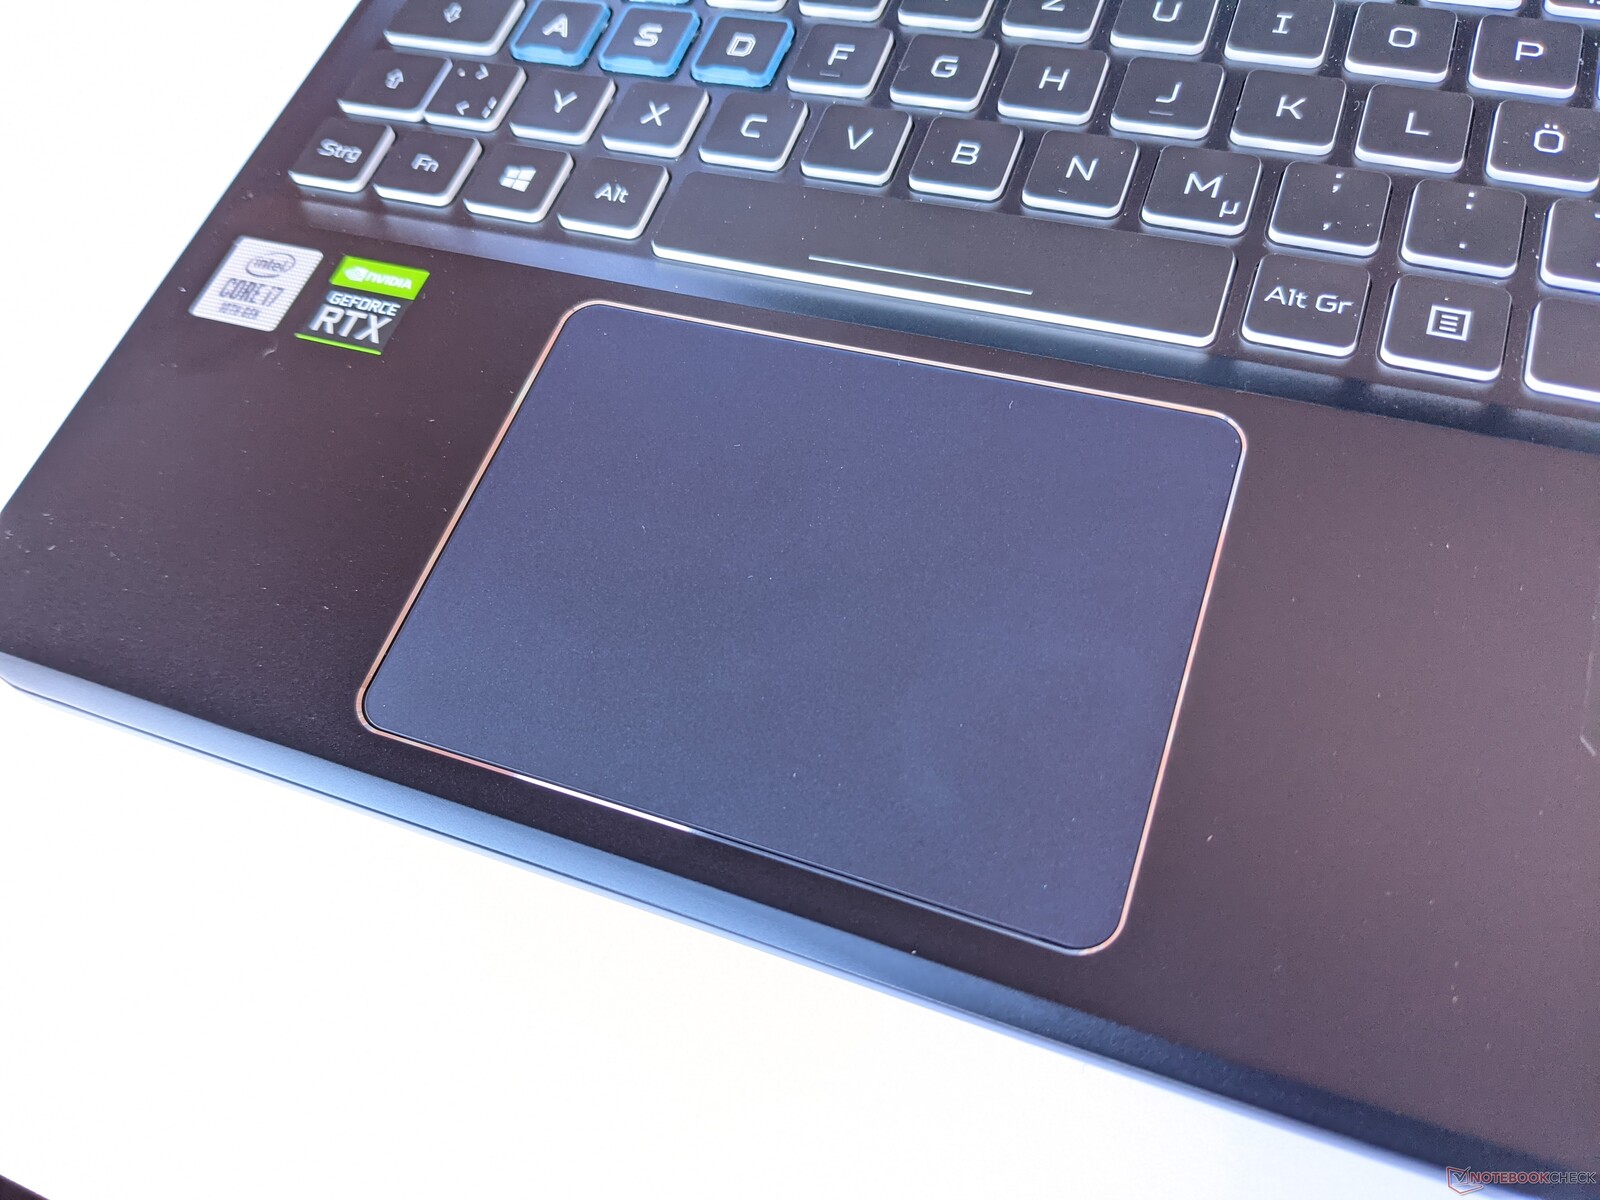
Touchpad
Acer’s pointing device of choice for the Predator Triton 300 is a clickpad. It offered our fingertips a slightly elevated resistance rendering mouse pointer navigation somewhat arduous overall. Touch input was recognized well enough, and left mouse clicks were registered reliably with a nice and satisfying mechanical clunk. Right clicks, on the other hand, were answered with a very soft and spongy feedback.
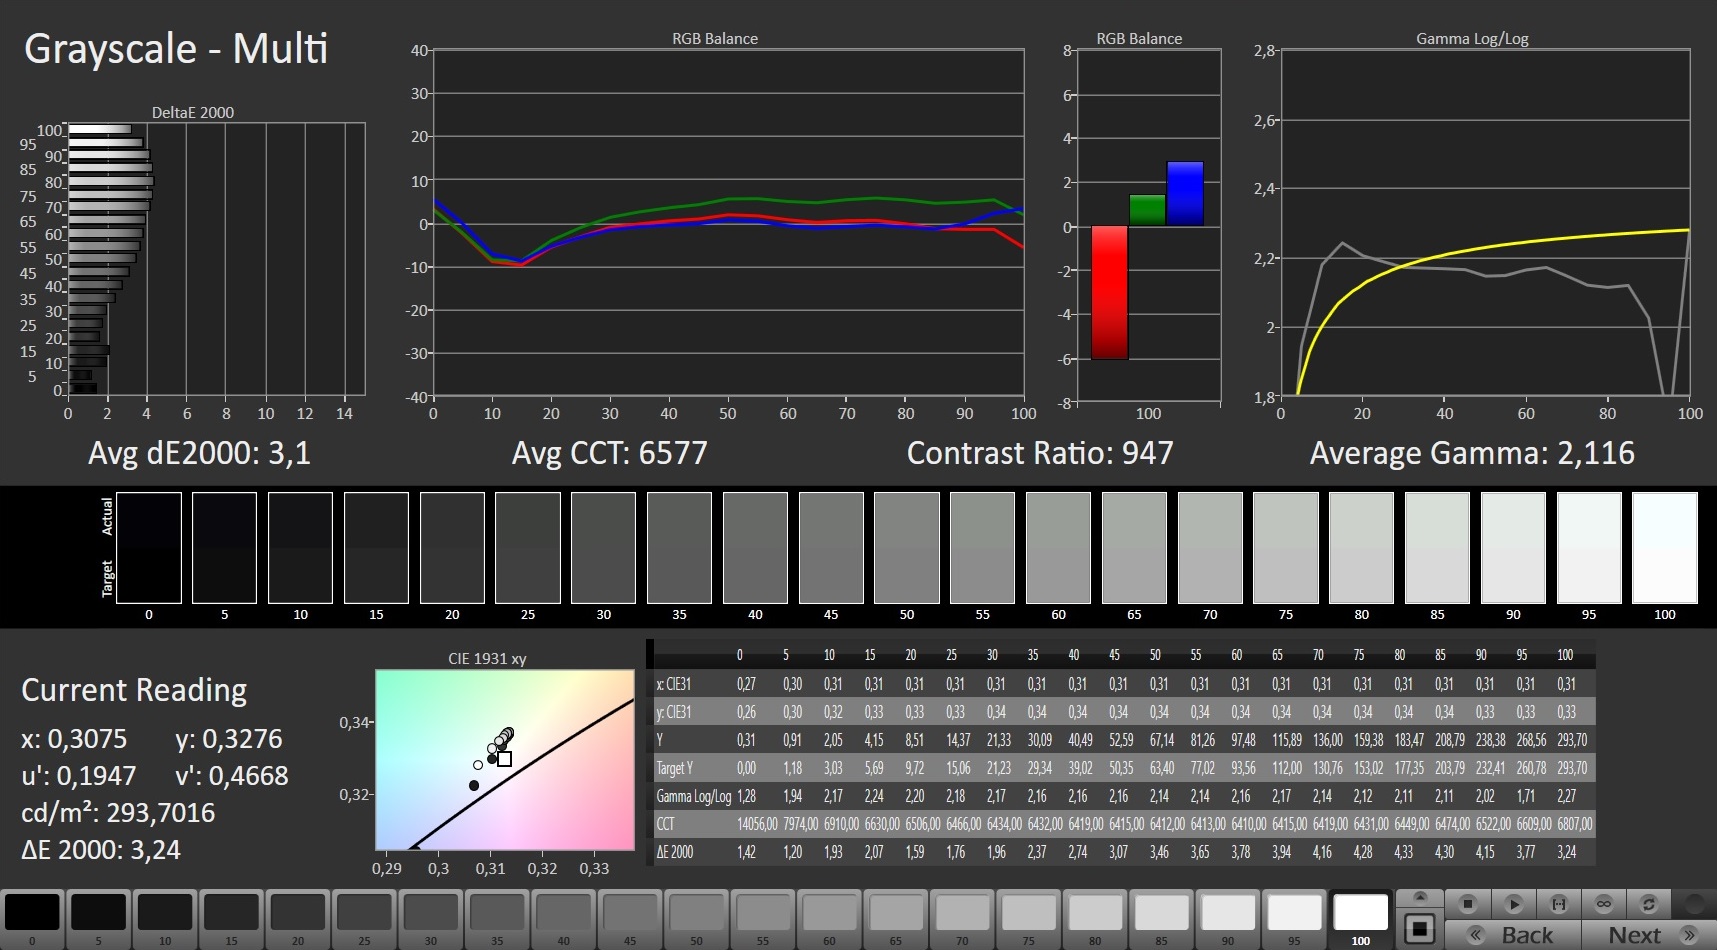
Display – Poor Contrast Ratio and too Dim
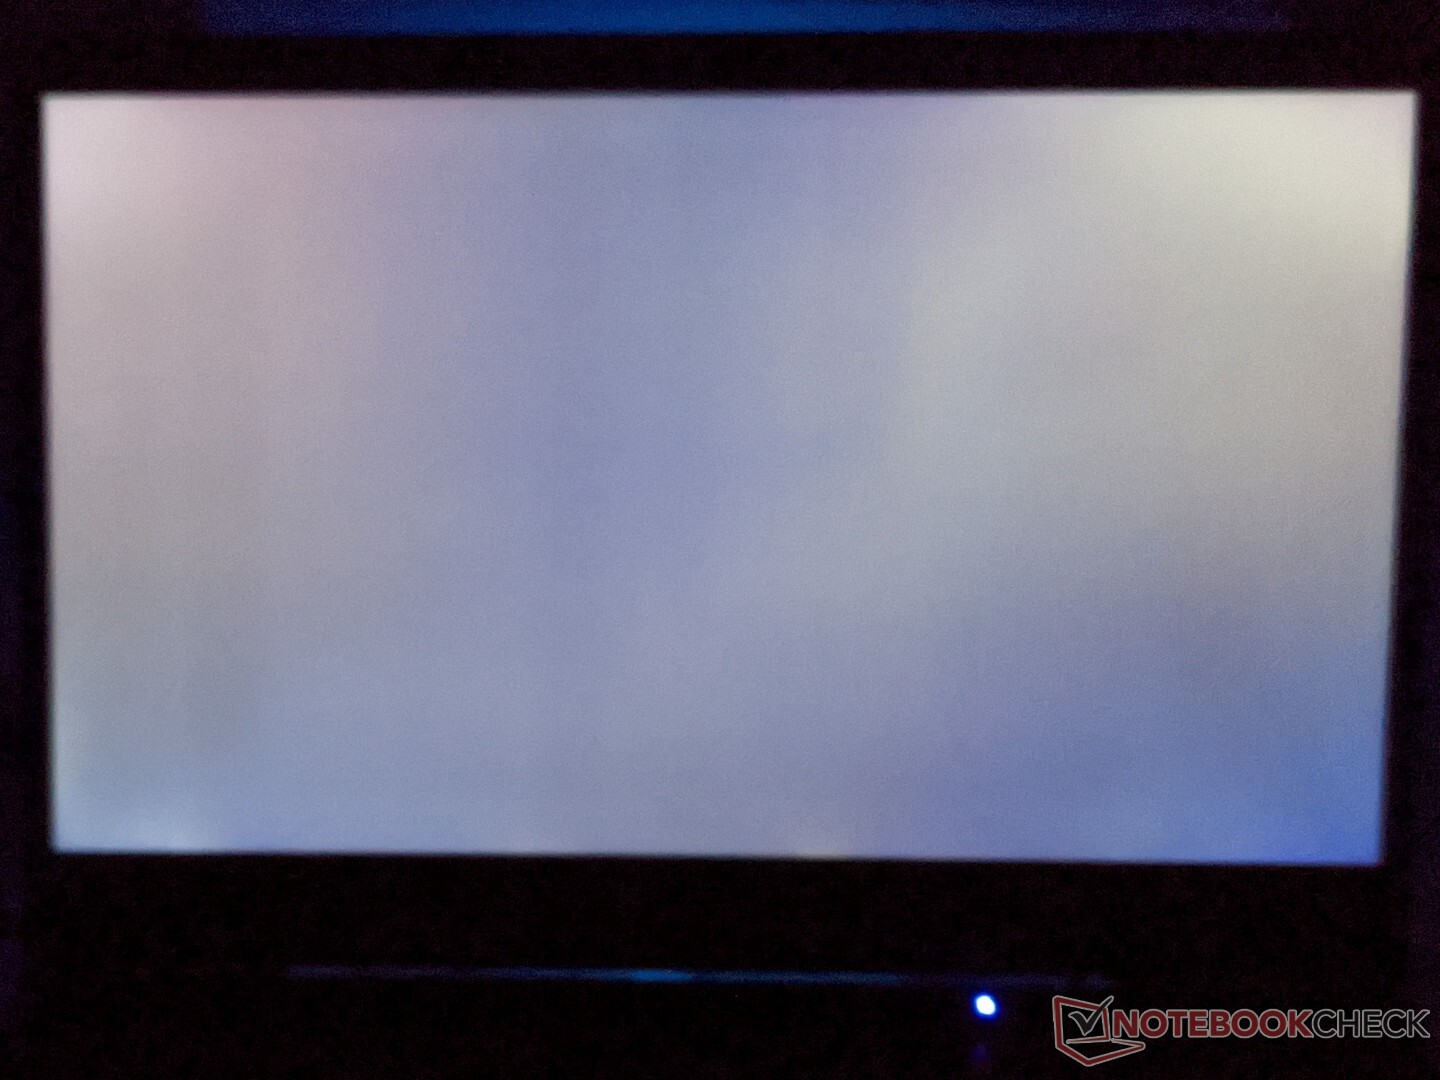
The Predator Triton 300’s 15.6-inch IPS panel runs at a native resolution of 1920 x 1080 at a refresh rate of 120 Hz. Average brightness peaked at just 257 nits and thus lower than on its competitors. In return, its brightness distribution was a decent 89 % and therefore slightly better.
We found no evidence of PWM, which should benefit users with sensitive eyes.
| |||||||||||||||||||||||||
Brightness Distribution: 89 %
Center on Battery: 279 cd/m²
Contrast: 900:1 (Black: 0.31 cd/m²)
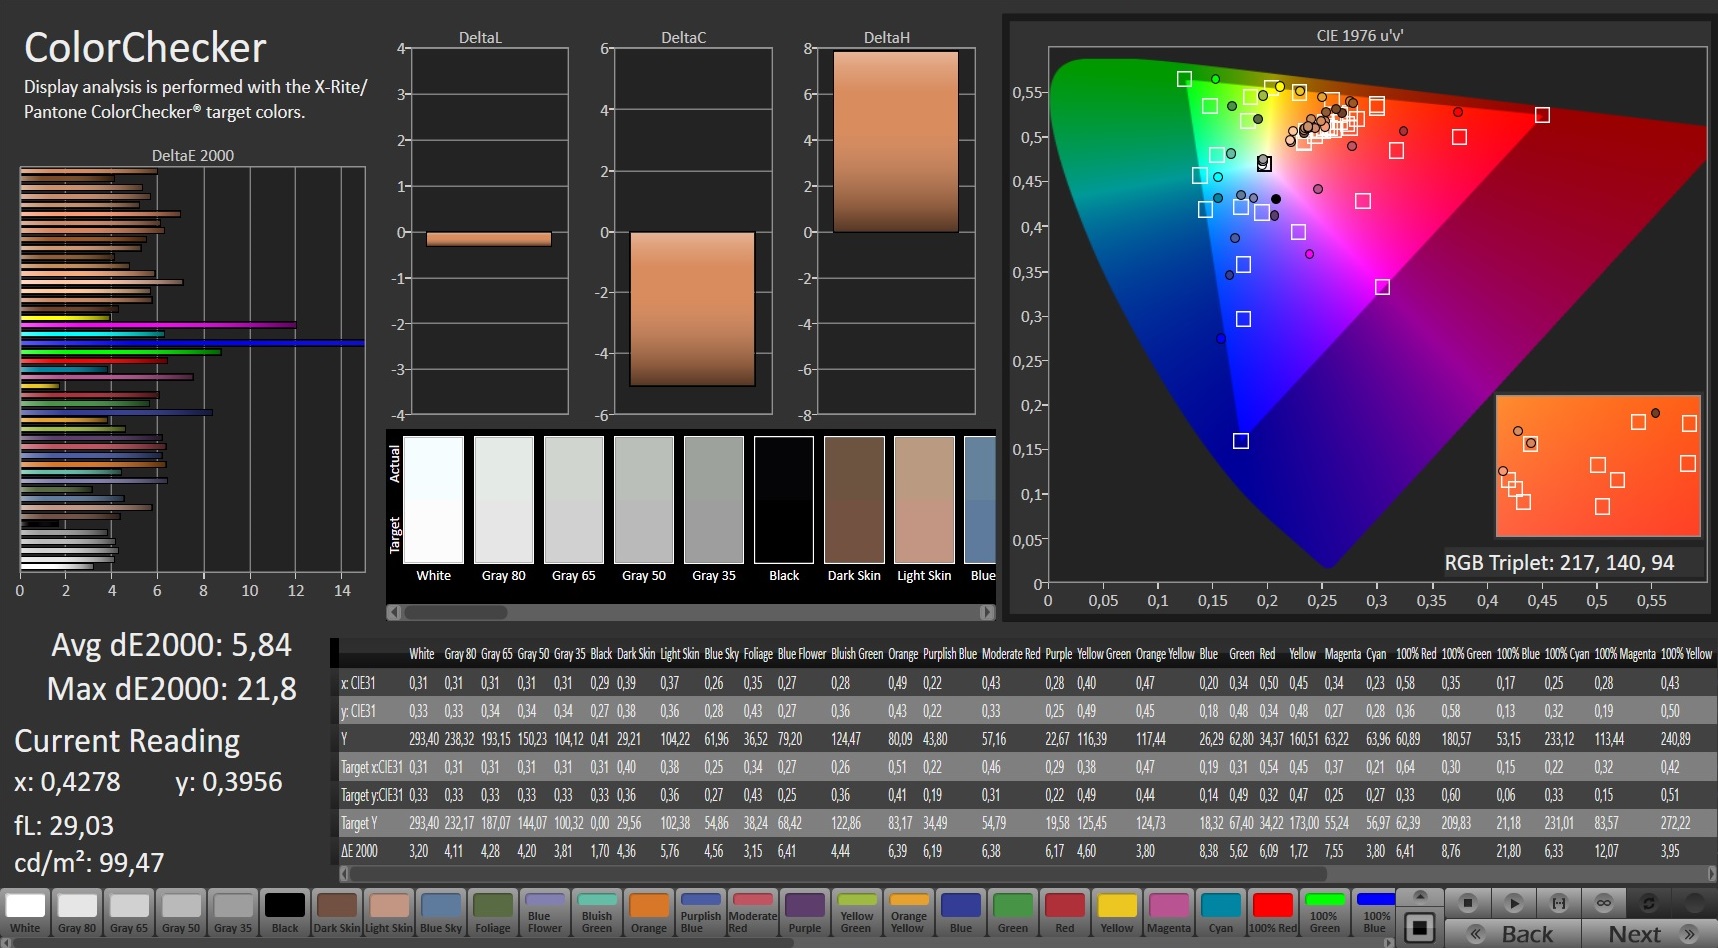
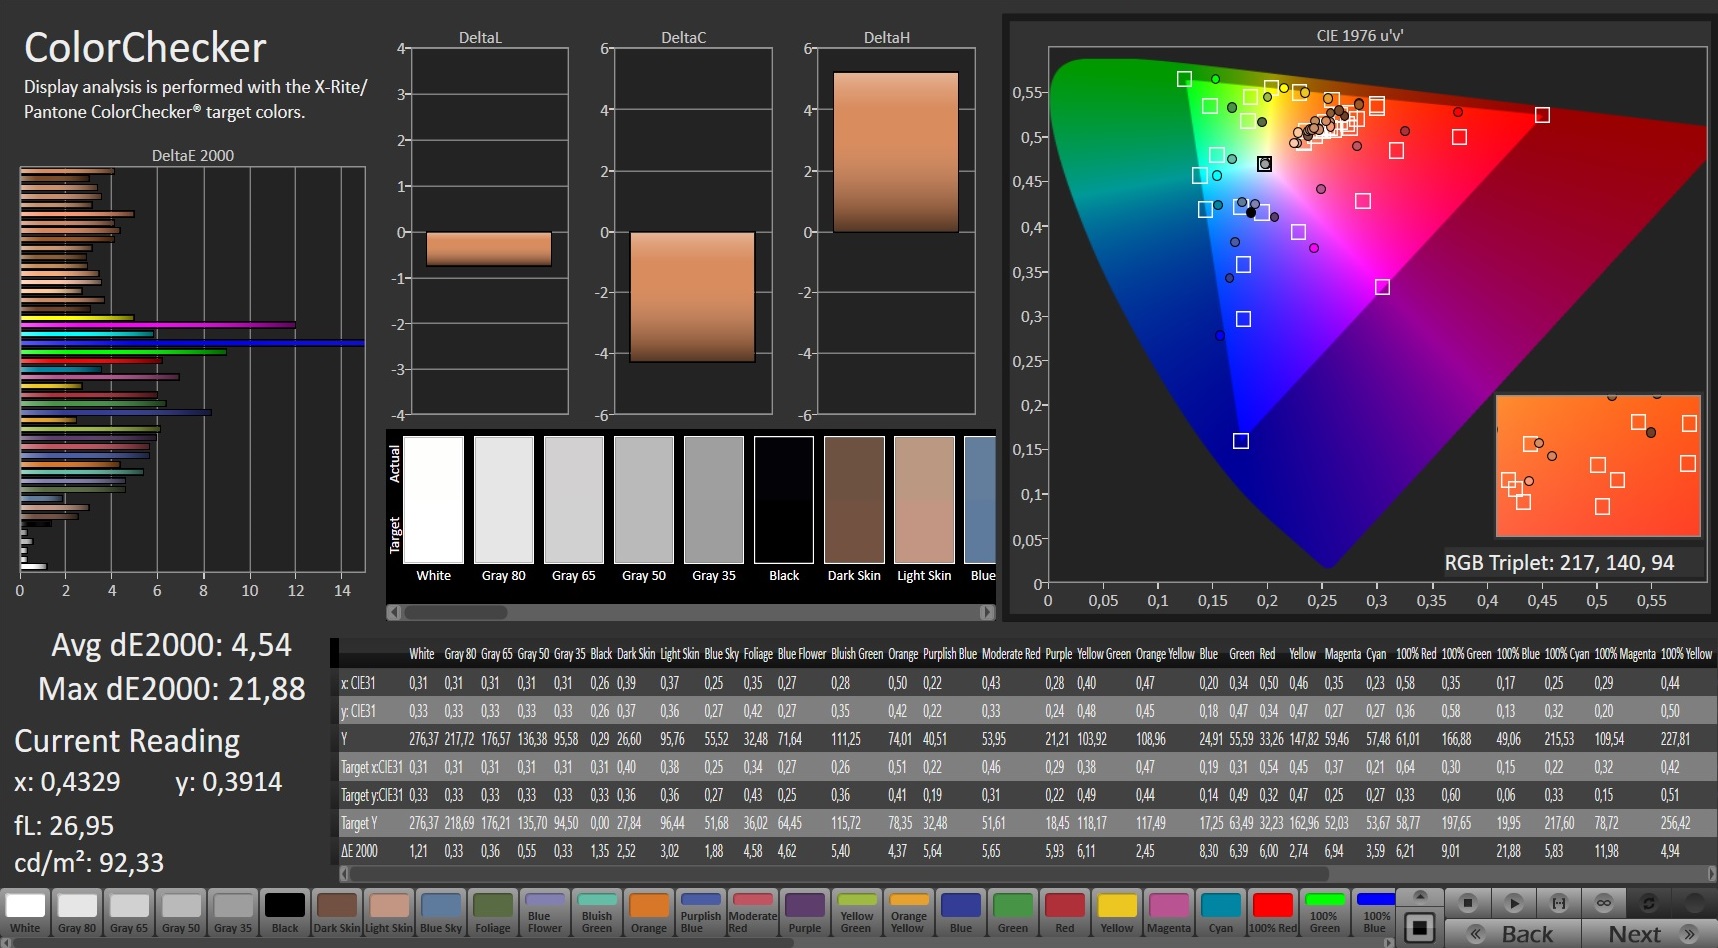
ΔE Color 5.84 | 0.5-29.43 Ø5, calibrated: 4.54
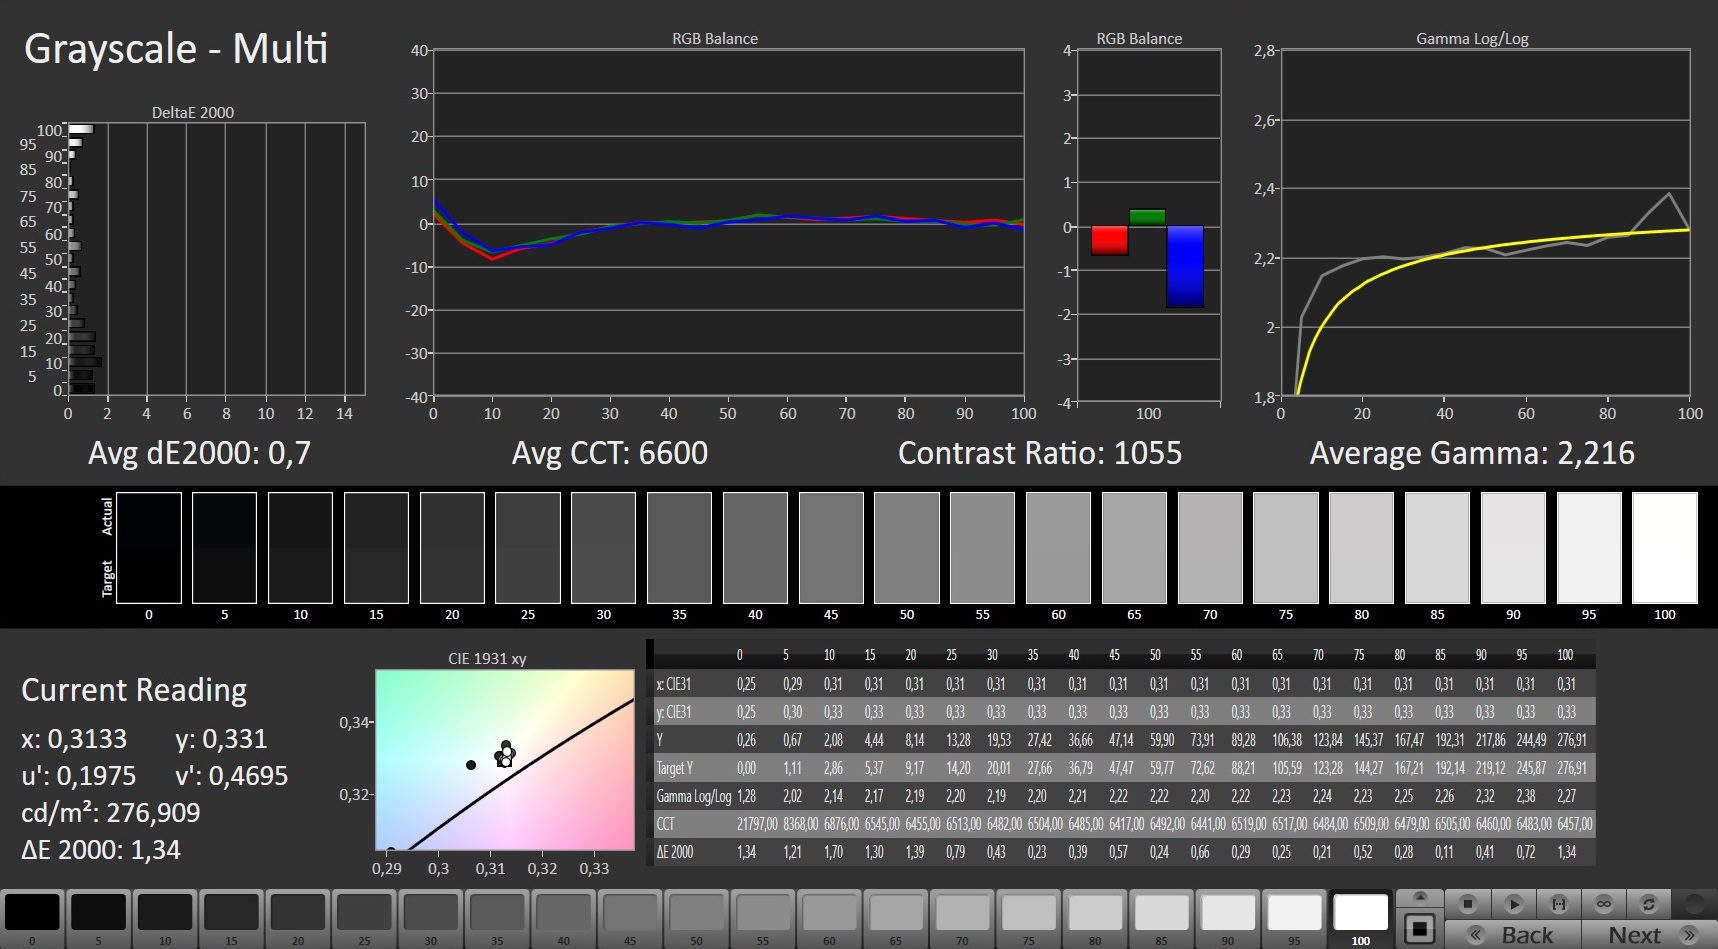
ΔE Greyscale 3.1 | 0.57-98 Ø5.3
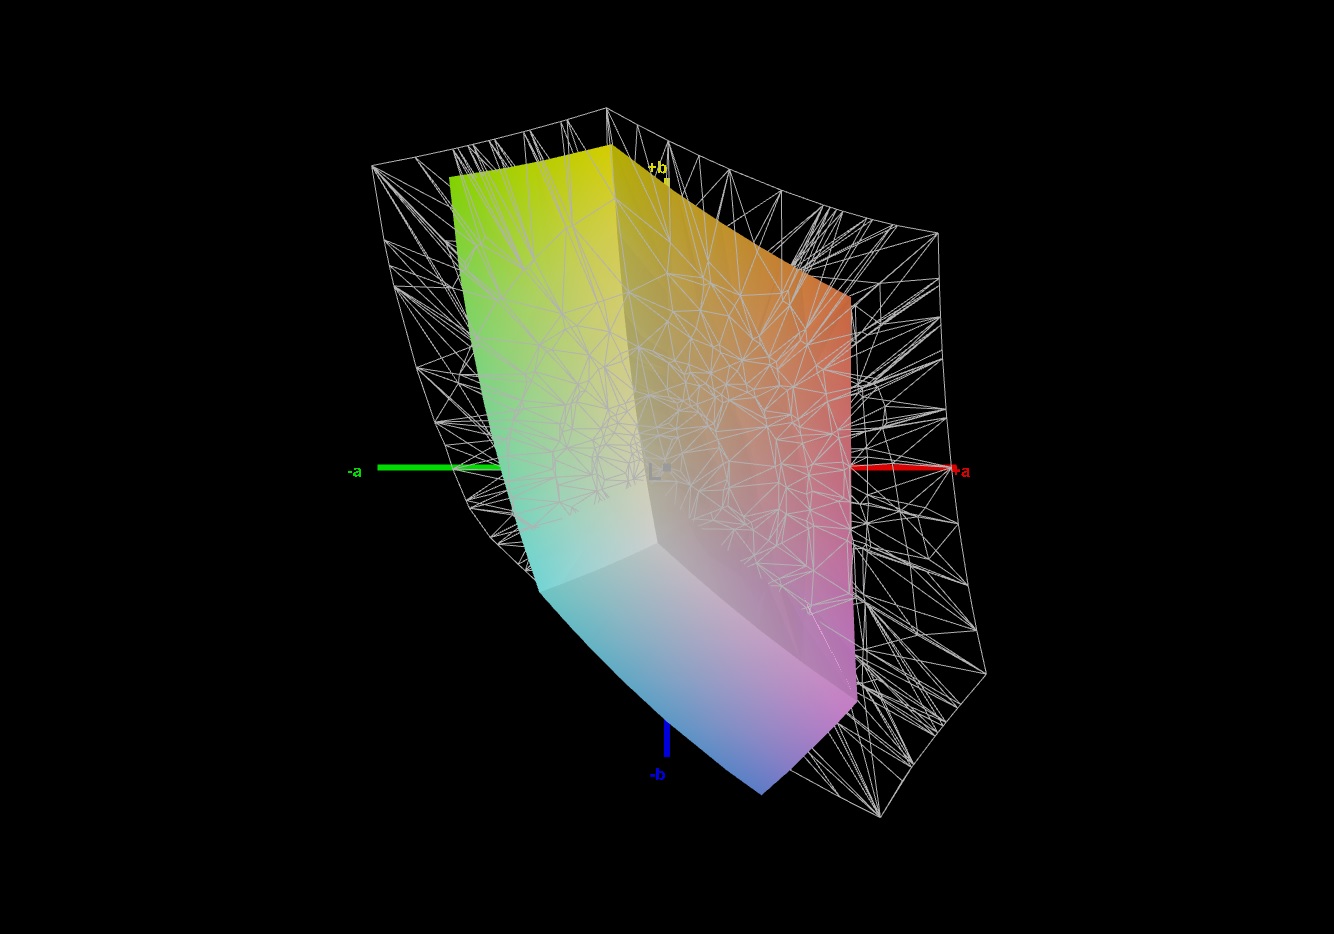
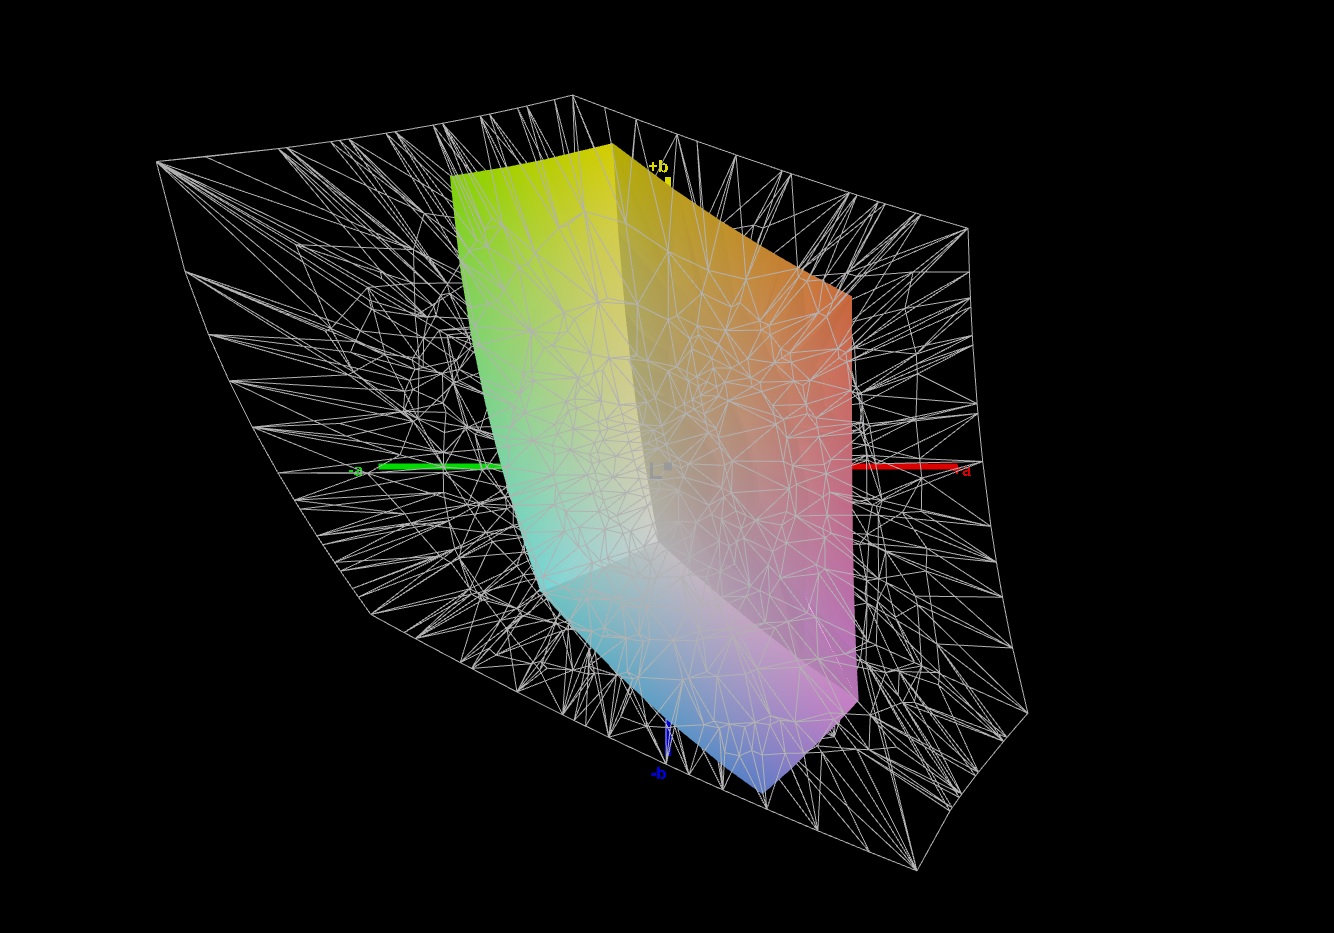
59% sRGB (Argyll 1.6.3 3D)
41% AdobeRGB 1998 (Argyll 1.6.3 3D)
40.81% AdobeRGB 1998 (Argyll 2.2.0 3D)
58.1% sRGB (Argyll 2.2.0 3D)
39.51% Display P3 (Argyll 2.2.0 3D)
Gamma: 2.116
| Acer Predator Triton 300 PT315-52-79LP BOE08FB, IPS, 1920x1080, 15.60 | Acer Predator Helios 300 PH315-53-77N5 AU Optronics B156HAN08.2, IPS, 1920x1080, 15.60 | Dell G3 15 3500-G4DG2 AU Optronics AUO80ED, IPS, 1920x1080, 15.60 | Aorus 5 KB LG Philips LP156WFG-SPB2 (LGD05E8), IPS, 1920x1080, 15.60 | SCHENKER XMG Core 15 GK5NR0O LM156LF-1F02, IPS, 1920x1080, 15.60 | |
|---|---|---|---|---|---|
| Display | 62% | 63% | 60% | 68% | |
| Display P3 Coverage | 39.51 | 65.2 65% | 64.6 64% | 63.4 60% | 67.2 70% |
| sRGB Coverage | 58.1 | 92.3 59% | 93.9 62% | 92.8 60% | 95.9 65% |
| AdobeRGB 1998 Coverage | 40.81 | 66.3 62% | 66.4 63% | 64.8 59% | 68.5 68% |
| Response Times | 44% | 56% | 48% | 60% | |
| Response Time Grey 50% / Grey 80% * | 29.2 ? | 17 ? 42% | 14 ? 52% | 14.4 ? 51% | 9.6 ? 67% |
| Response Time Black / White * | 20 ? | 11 ? 45% | 8 ? 60% | 11.2 ? 44% | 9.6 ? 52% |
| PWM Frequency | |||||
| Screen | 24% | 19% | 37% | 16% | |
| Brightness middle | 279 | 319 14% | 301 8% | 318 14% | 312 12% |
| Brightness | 257 | 294 14% | 298 16% | 298 16% | 290 13% |
| Brightness Distribution | 89 | 83 -7% | 81 -9% | 87 -2% | 87 -2% |
| Black Level * | 0.31 | 0.22 29% | 0.23 26% | 0.3 3% | 0.2 35% |
| Contrast | 900 | 1450 61% | 1309 45% | 1060 18% | 1560 73% |
| Colorchecker dE 2000 * | 5.84 | 4.42 24% | 4.68 20% | 2.49 57% | 4.84 17% |
| Colorchecker dE 2000 max. * | 21.8 | 8.54 61% | 5.06 77% | 13.85 36% | |
| Colorchecker dE 2000 calibrated * | 4.54 | 1.87 59% | 1.53 66% | 1.77 61% | |
| Greyscale dE 2000 * | 3.1 | 4.84 -56% | 5.79 -87% | 1.6 48% | 9 -190% |
| Gamma | 2.116 104% | 2.39 92% | 2.46 89% | 2.211 100% | 2.105 105% |
| CCT | 6577 99% | 6850 95% | 7706 84% | 6714 97% | 8099 80% |
| Color Space (Percent of AdobeRGB 1998) | 41 | 60 46% | 61 49% | 65 59% | 68 66% |
| Color Space (Percent of sRGB) | 59 | 92 56% | 94 59% | 89 51% | 92 56% |
| Total Average (Program / Settings) | 43% /
34% | 46% /
32% | 48% /
43% | 48% /
31% |
* ... smaller is better
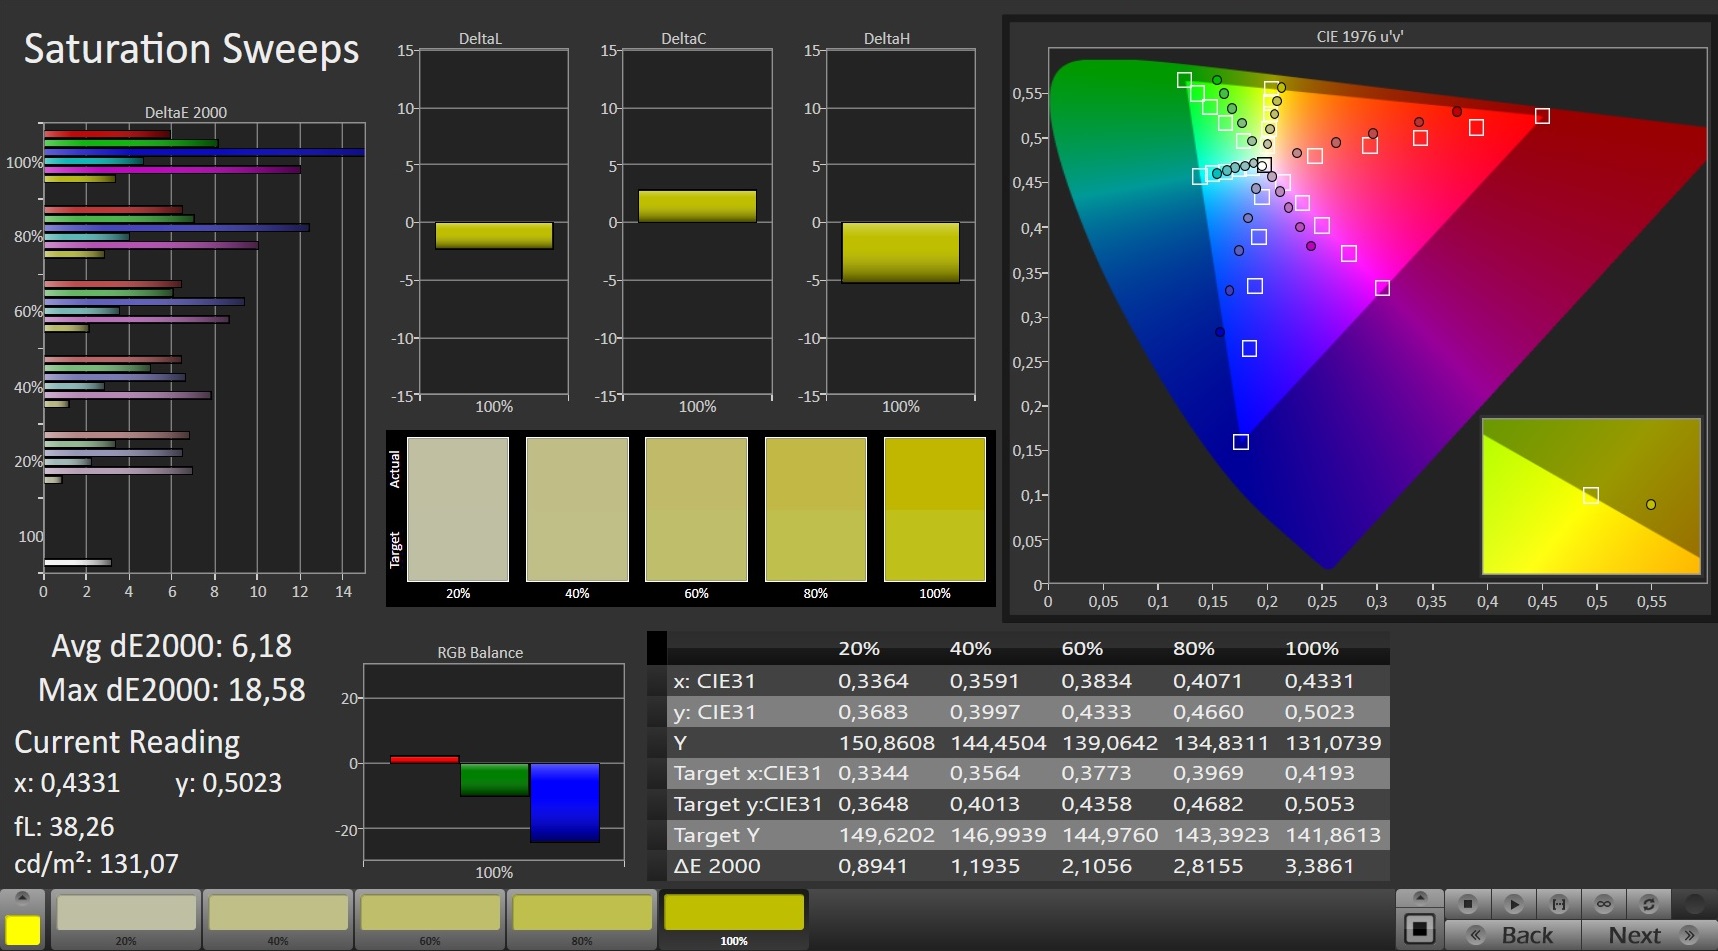
According to our tests the Triton 300’s IPS panel’s maximum contrast ratio was just 900:1 with a slightly raised black level of 0.31 nits. Accordingly, colors are not very clearly differentiated from one another and dark screen contents suffer from a gray haze. At just 59 % sRGB and 41 % AdobeRGB color space coverage was fairly low as well.
Out of the box we found a slightly elevated DeltaE 2000 deviation of 3.1, which we were able to lower to just 0.7 via calibration. As always, the resulting ICC profile can be found for download in the box above next to the screen brightness diagram.

The Acer Predator Triton 300 was only usable in shady places outdoors, courtesy of its comparatively low display brightness. At least its matte display prevented reflections reasonably well.
Display Response Times
| ↔ Response Time Black to White | ||
|---|---|---|
| 20 ms ... rise ↗ and fall ↘ combined | ↗ 9.6 ms rise | 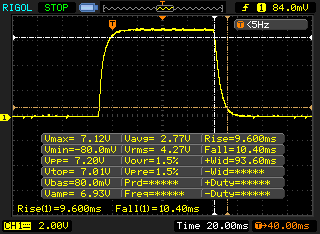 |
| ↘ 10.4 ms fall | ||
| The screen shows good response rates in our tests, but may be too slow for competitive gamers. In comparison, all tested devices range from 0.1 (minimum) to 240 (maximum) ms. » 37 % of all devices are better. This means that the measured response time is similar to the average of all tested devices (21.5 ms). | ||
| ↔ Response Time 50% Grey to 80% Grey | ||
| 29.2 ms ... rise ↗ and fall ↘ combined | ↗ 14.4 ms rise | 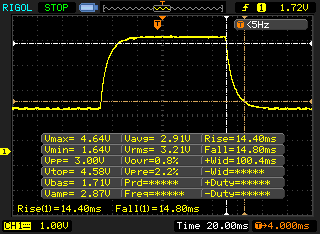 |
| ↘ 14.8 ms fall | ||
| The screen shows relatively slow response rates in our tests and may be too slow for gamers. In comparison, all tested devices range from 0.2 (minimum) to 636 (maximum) ms. » 33 % of all devices are better. This means that the measured response time is better than the average of all tested devices (33.7 ms). | ||
Screen Flickering / PWM (Pulse-Width Modulation)
| Screen flickering / PWM not detected | 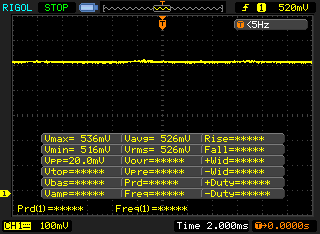 | ||
In comparison: 53 % of all tested devices do not use PWM to dim the display. If PWM was detected, an average of 17900 (minimum: 5 - maximum: 3846000) Hz was measured. | |||
Overall viewing angles were decent. The on-screen content remained well readable without visible distortions or shifts in color regardless of angle.

Performance – Comet Lake on a par with its Competitors
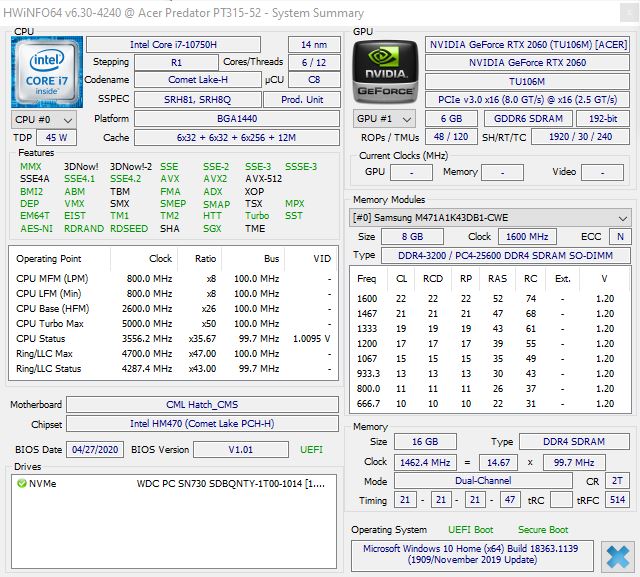
Acer upgraded the Predator Triton 300 to Intel’s current generation of Comet Lake CPUs. Paired with 16 GB of RAM and an Nvidia GeForce RTX 2060 this makes for a decent gaming device for running current games. Other SKUs with differing RAM and storage levels as well as more powerful GPUs are available.
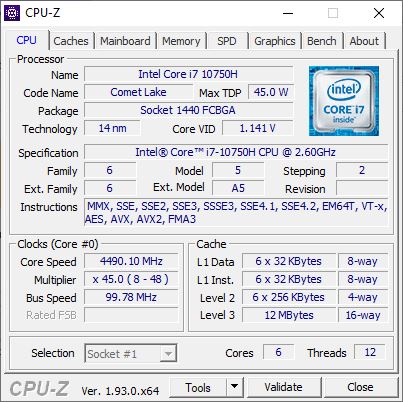
Processor
Our review unit was equipped with an Intel Core i7-10750H with six cores and clock speeds of between 2.6 and 5 GHz. How long a notebook can maintain these high clock speeds depends primarily on the device’s cooling system. With the fans set to “Auto” the Triton 300’s benchmark scores were slightly higher than on other notebooks reviewed by us with the exact same processor.
* ... smaller is better
System Performance
In PCMark 10, a benchmark to assess overall system performance, the Triton 300 scored comparatively poorly overall, with the exception of the Essentials and Productivity segments of the benchmark in which it did very well. Subjectively, the Acer notebook felt very snappy and smooth. Applications launched quickly and file access was very fast.
Additional benchmarks for other notebooks can be found on our CPU benchmark list.
| PCMark 10 Score | 5193 points | |
Help | ||
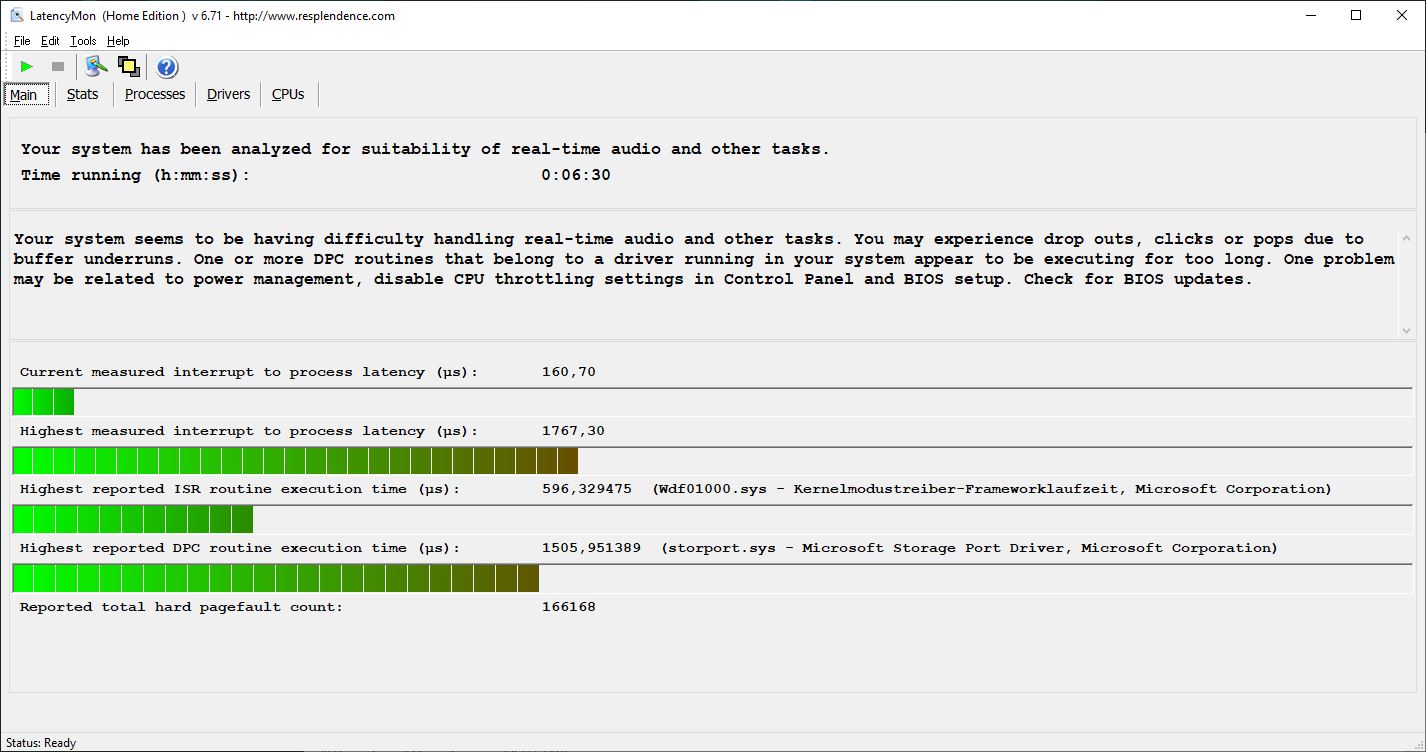
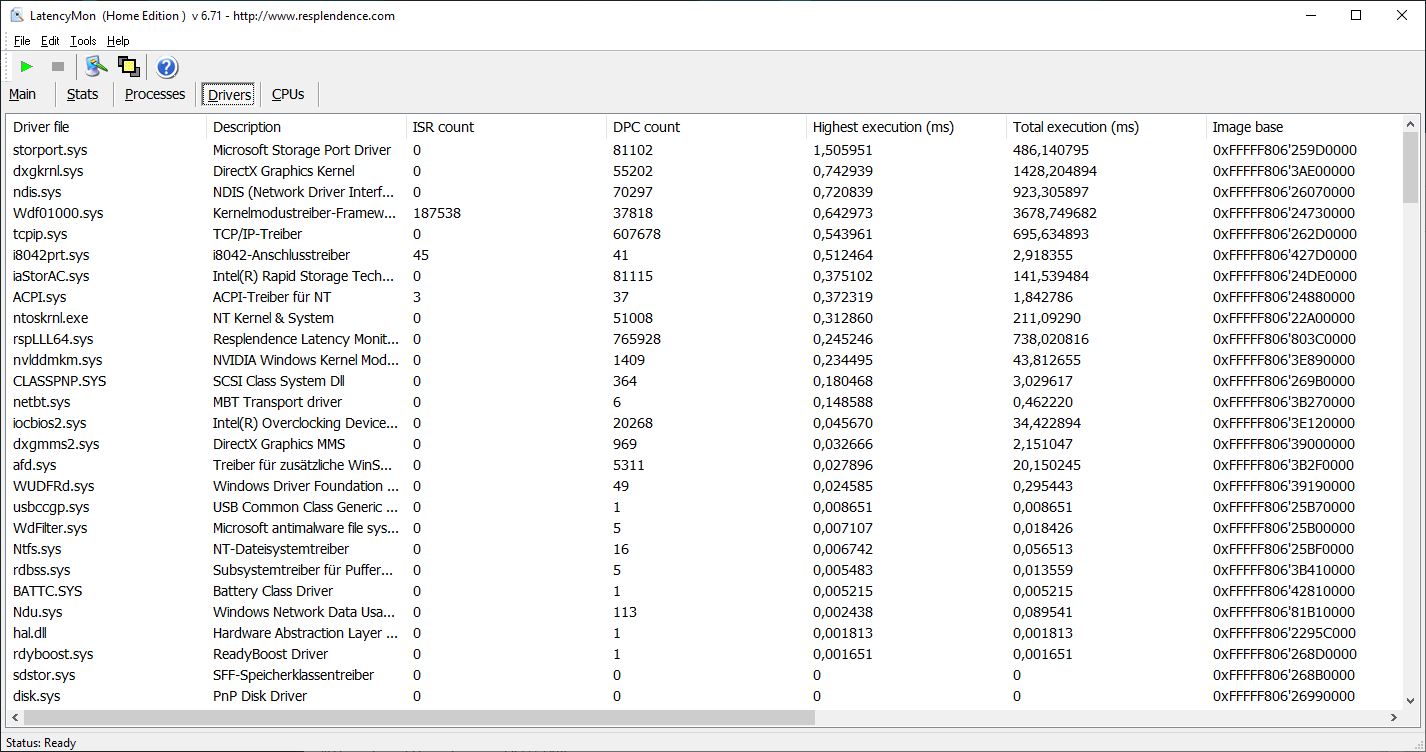
DPC Latencies
The Triton 300 suffered from increased latencies in our tests. Accordingly, it is not suited for real-time applications.
| DPC Latencies / LatencyMon - interrupt to process latency (max), Web, Youtube, Prime95 | |
| Dell G3 15 3500-G4DG2 | |
| SCHENKER XMG Core 15 GK5NR0O | |
| Acer Predator Triton 300 PT315-52-79LP | |
| Aorus 5 KB | |
| Acer Predator Helios 300 PH315-53-77N5 | |
* ... smaller is better
Storage Devices
Our review unit feature a 1 TB large Western Digital SSD with a decent read and write performance. Overall, this drive is one of the faster ones in our test group.
Additional benchmarks of and more information on other storage devices can be found on our SSD/HDD benchmark list.
| Acer Predator Triton 300 PT315-52-79LP WDC PC SN730 SDBQNTY-1T00 | Acer Predator Helios 300 PH315-53-77N5 WDC PC SN730 SDBQNTY-512GB | Dell G3 15 3500-G4DG2 SK Hynix BC511 HFM512GDJTNI | Aorus 5 KB ADATA XPG SX8200 Pro (ASX8200PNP-512GT) | SCHENKER XMG Core 15 GK5NR0O Samsung SSD 970 EVO Plus 500GB | |
|---|---|---|---|---|---|
| CrystalDiskMark 5.2 / 6 | 0% | -32% | 11% | 29% | |
| Write 4K | 117.5 | 137.5 17% | 99.6 -15% | 162.1 38% | 233 98% |
| Read 4K | 47.36 | 48.24 2% | 38.8 -18% | 60.7 28% | 54.5 15% |
| Write Seq | 2748 | 2644 -4% | 1117 -59% | 2366 -14% | 3050 11% |
| Read Seq | 2084 | 1718 -18% | 1030 -51% | 2633 26% | 3042 46% |
| Write 4K Q32T1 | 407.3 | 416.6 2% | 445.2 9% | 428.2 5% | 520 28% |
| Read 4K Q32T1 | 474.6 | 525 11% | 331.8 -30% | 582 23% | 546 15% |
| Write Seq Q32T1 | 3069 | 2705 -12% | 1102 -64% | 2480 -19% | 3241 6% |
| Read Seq Q32T1 | 3154 | 3213 2% | 2227 -29% | 3121 -1% | 3538 12% |
| AS SSD | -16% | -43% | -11% | 22% | |
| Seq Read | 2369 | 2753 16% | 1305 -45% | 2795 18% | 2836 20% |
| Seq Write | 2446 | 2495 2% | 767 -69% | 2172 -11% | 2452 0% |
| 4K Read | 40.61 | 38.64 -5% | 41.84 3% | 53.3 31% | 60.4 49% |
| 4K Write | 103.2 | 88.8 -14% | 90.1 -13% | 121.3 18% | 190.5 85% |
| 4K-64 Read | 1637 | 952 -42% | 773 -53% | 714 -56% | 1283 -22% |
| 4K-64 Write | 1961 | 1568 -20% | 711 -64% | 1376 -30% | 2298 17% |
| Access Time Read * | 0.06 | 0.09 -50% | 0.049 18% | 0.034 43% | |
| Access Time Write * | 0.036 | 0.044 -22% | 0.04 -11% | 0.036 -0% | 0.02 44% |
| Score Read | 1915 | 1266 -34% | 945 -51% | 1046 -45% | 1627 -15% |
| Score Write | 2309 | 1906 -17% | 878 -62% | 1714 -26% | 2734 18% |
| Score Total | 5205 | 3811 -27% | 2290 -56% | 3279 -37% | 5184 0% |
| Total Average (Program / Settings) | -8% /
-9% | -38% /
-38% | 0% /
-2% | 26% /
25% |
* ... smaller is better

Sustained Read: DiskSpd Read Loop, Queue Depth 8
GPU Performance
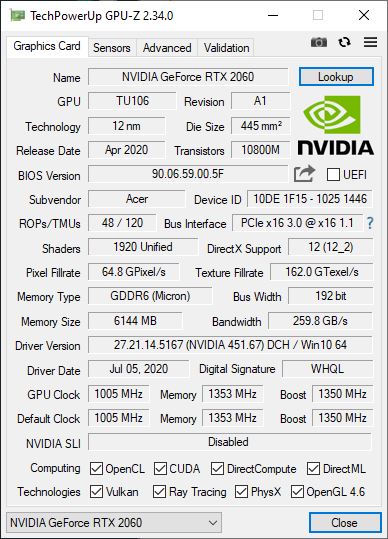
Our review unit featured an Nvidia GeForce RTX 2060, a GPU well suited for demanding graphics applications and support for modern technologies such as GLSS and Raytracing. In our Triton 300, this particular GPU scored very well in our benchmarks and managed to land in the top third of our test group.
More information on and benchmarks for the GeForce RTX 2060 can be found on our GPU gaming list.
| 3DMark 11 Performance | 18519 points | |
| 3DMark Fire Strike Score | 14886 points | |
| 3DMark Time Spy Score | 6124 points | |
Help | ||
Gaming Performance
Thanks to its Nvidia GeForce RTX 2060, the Triton 300 can run modern games smoothly in FHD and high details. Depending on game we even managed frame rates north of 60 FPS. Its performance should be fast enough for future games as well, although those might eventually require lowered details or resolutions in order to run smoothly and consistently.
Additional performance data for other games can be found on our GPU gaming list.
| The Witcher 3 - 1920x1080 Ultra Graphics & Postprocessing (HBAO+) | |
| Average of class Gaming (8.61 - 216, n=226, last 2 years) | |
| Acer Predator Helios 300 PH315-53-77N5 | |
| Average NVIDIA GeForce RTX 2060 Mobile (50.6 - 74, n=40) | |
| Acer Predator Triton 300 PT315-52-79LP | |
| SCHENKER XMG Core 15 GK5NR0O | |
| Aorus 5 KB | |
| Dell G3 15 3500-G4DG2 | |
| Final Fantasy XV Benchmark - 1920x1080 High Quality | |
| Average of class Gaming (9.13 - 194.9, n=228, last 2 years) | |
| Aorus 5 KB | |
| Average NVIDIA GeForce RTX 2060 Mobile (52 - 67.5, n=7) | |
| Acer Predator Triton 300 PT315-52-79LP | |
| Far Cry 5 - 1920x1080 High Preset AA:T | |
| Average of class Gaming (16 - 232, n=115, last 2 years) | |
| Average NVIDIA GeForce RTX 2060 Mobile (81 - 96, n=6) | |
| SCHENKER XMG Core 15 GK5NR0O | |
When running our Witcher 3 loop we were able to determine that GPU performance does indeed drop a bit over long periods of sustained load. Considering that the selected fan profile “Auto” does leave some additional cooling potential go to waste we would not expect any limitations when gaming for long periods of time.
| low | med. | high | ultra | |
| The Witcher 3 (2015) | 59.1 | |||
| Dota 2 Reborn (2015) | 141 | 129 | 121 | 116 |
| Final Fantasy XV Benchmark (2018) | 52 | |||
| X-Plane 11.11 (2018) | 103 | 89.9 | 77.6 | |
| Far Cry 5 (2018) | 83 |
Emissions – It can get loud, but it does not have to
Noise Emissions
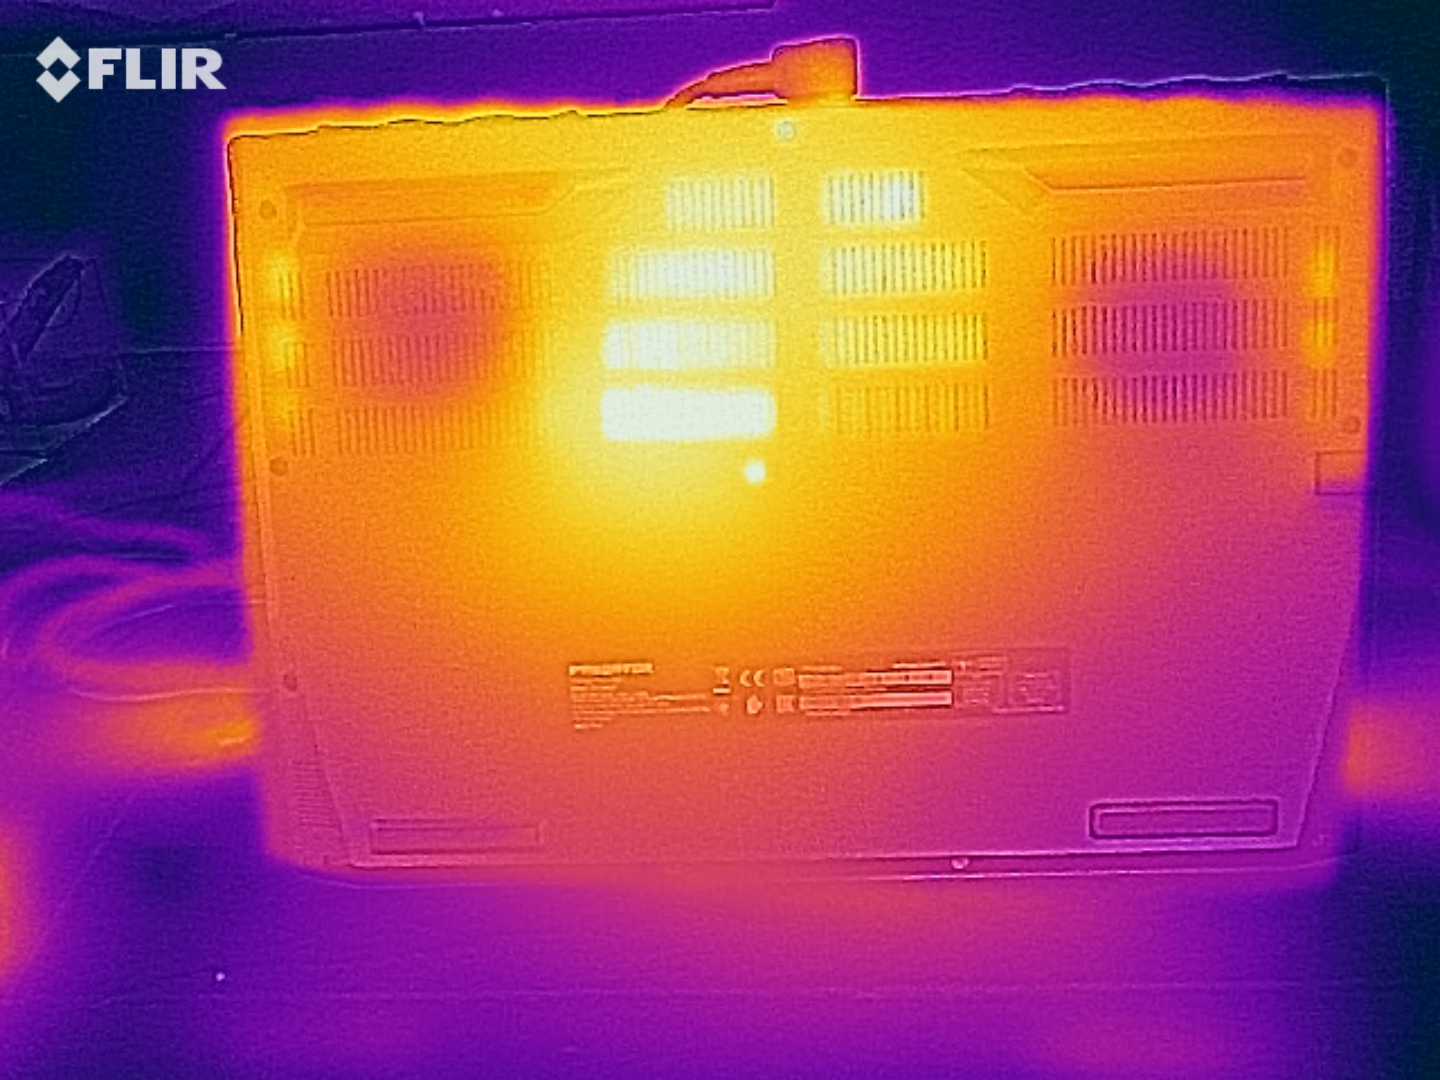
According to our data, our review unit peaked at 65 °C under load. This singular hot spot was located at the bottom in the mid rear section of the device. The palm rests warmed up as well but remained moderately warm overall.
Noise Level
| Idle |
| 25 / 29 / 34 dB(A) |
| Load |
| 44 / 49 dB(A) |
 | ||
30 dB silent 40 dB(A) audible 50 dB(A) loud |
||
min: | ||
Temperature
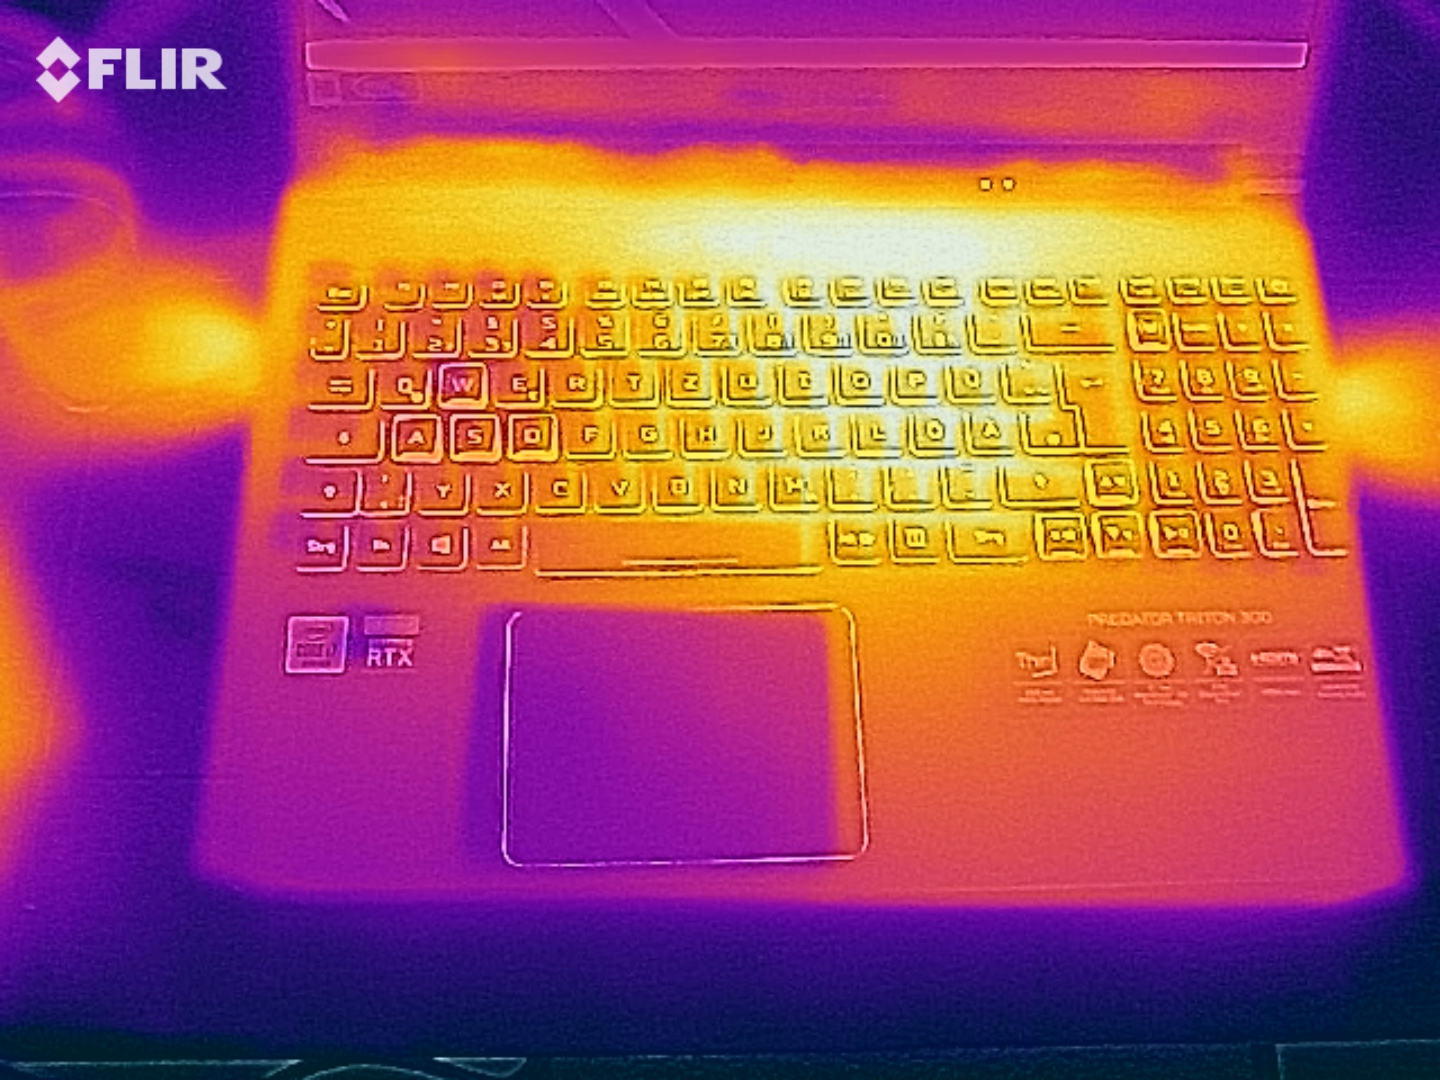
According to our data, our review unit peaked at 65 °C under load. This singular hot spot was located at the bottom in the mid rear section of the device. The palm rests warmed up as well but remained moderately warm overall.
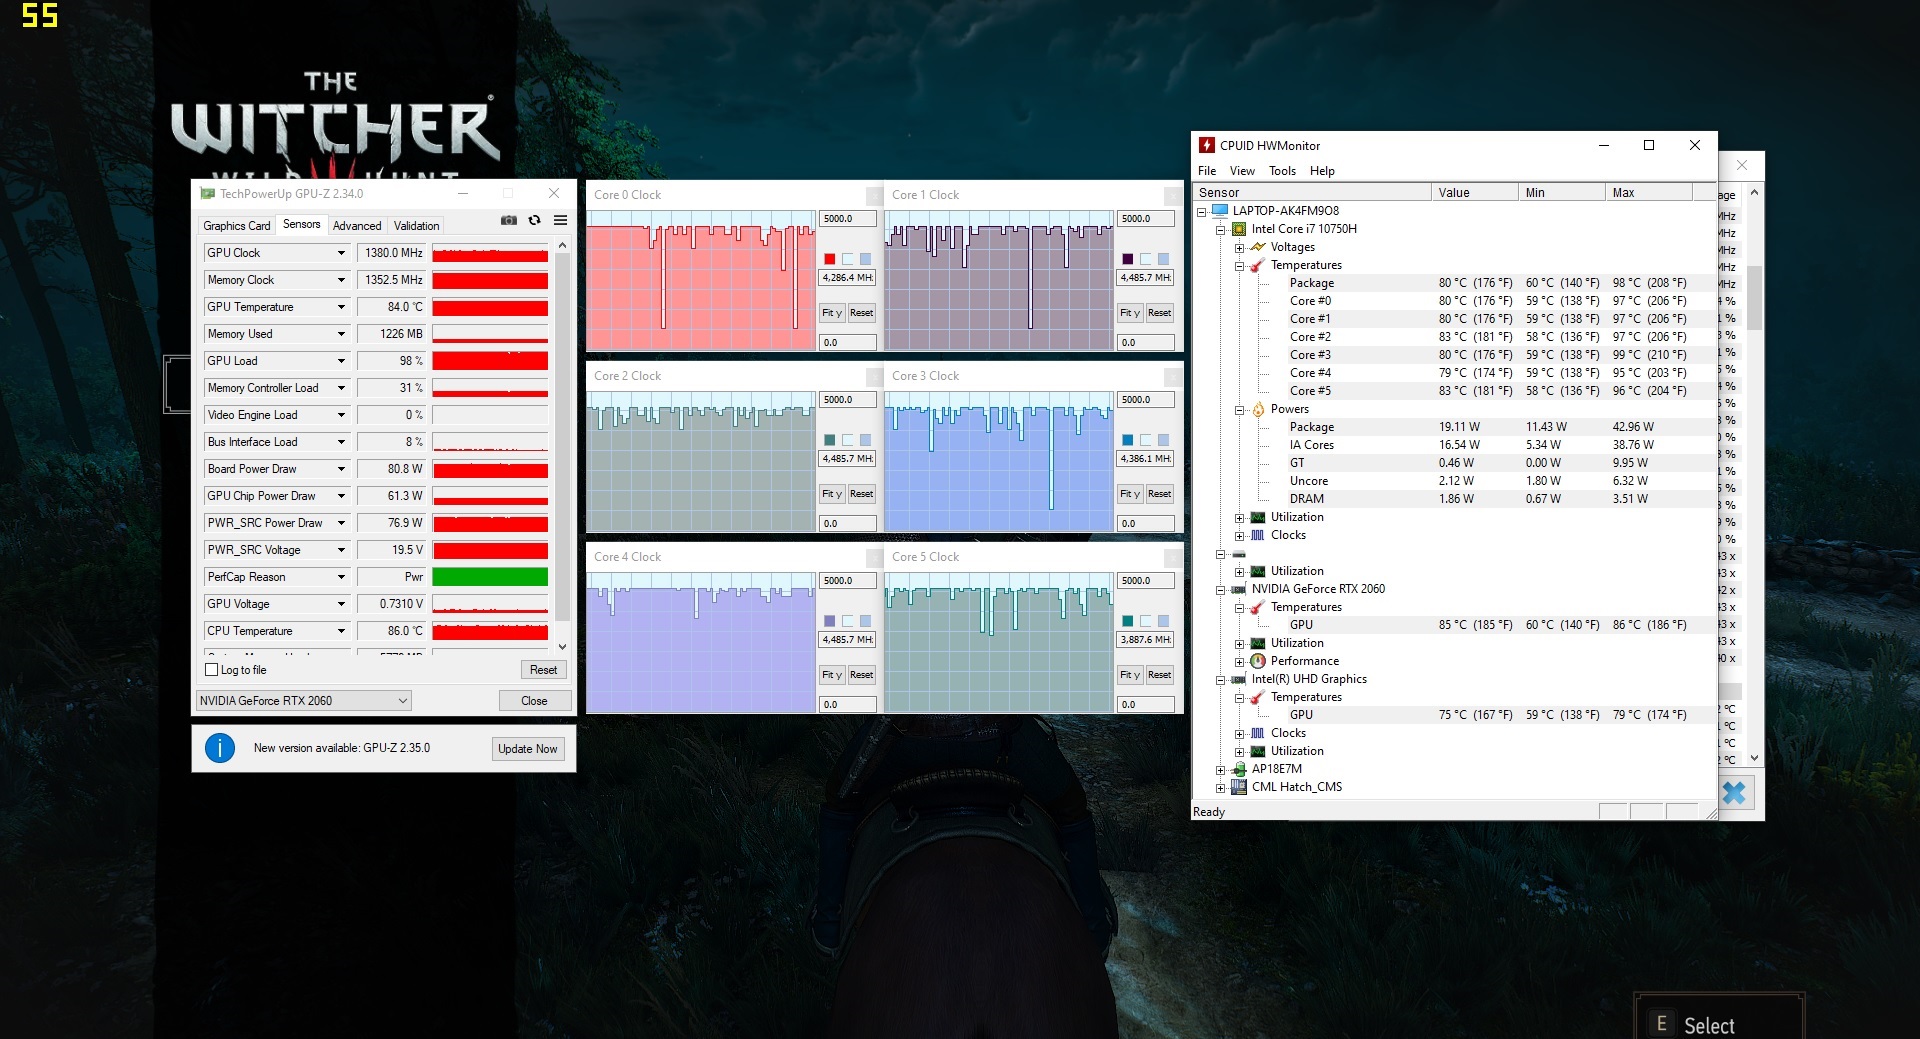
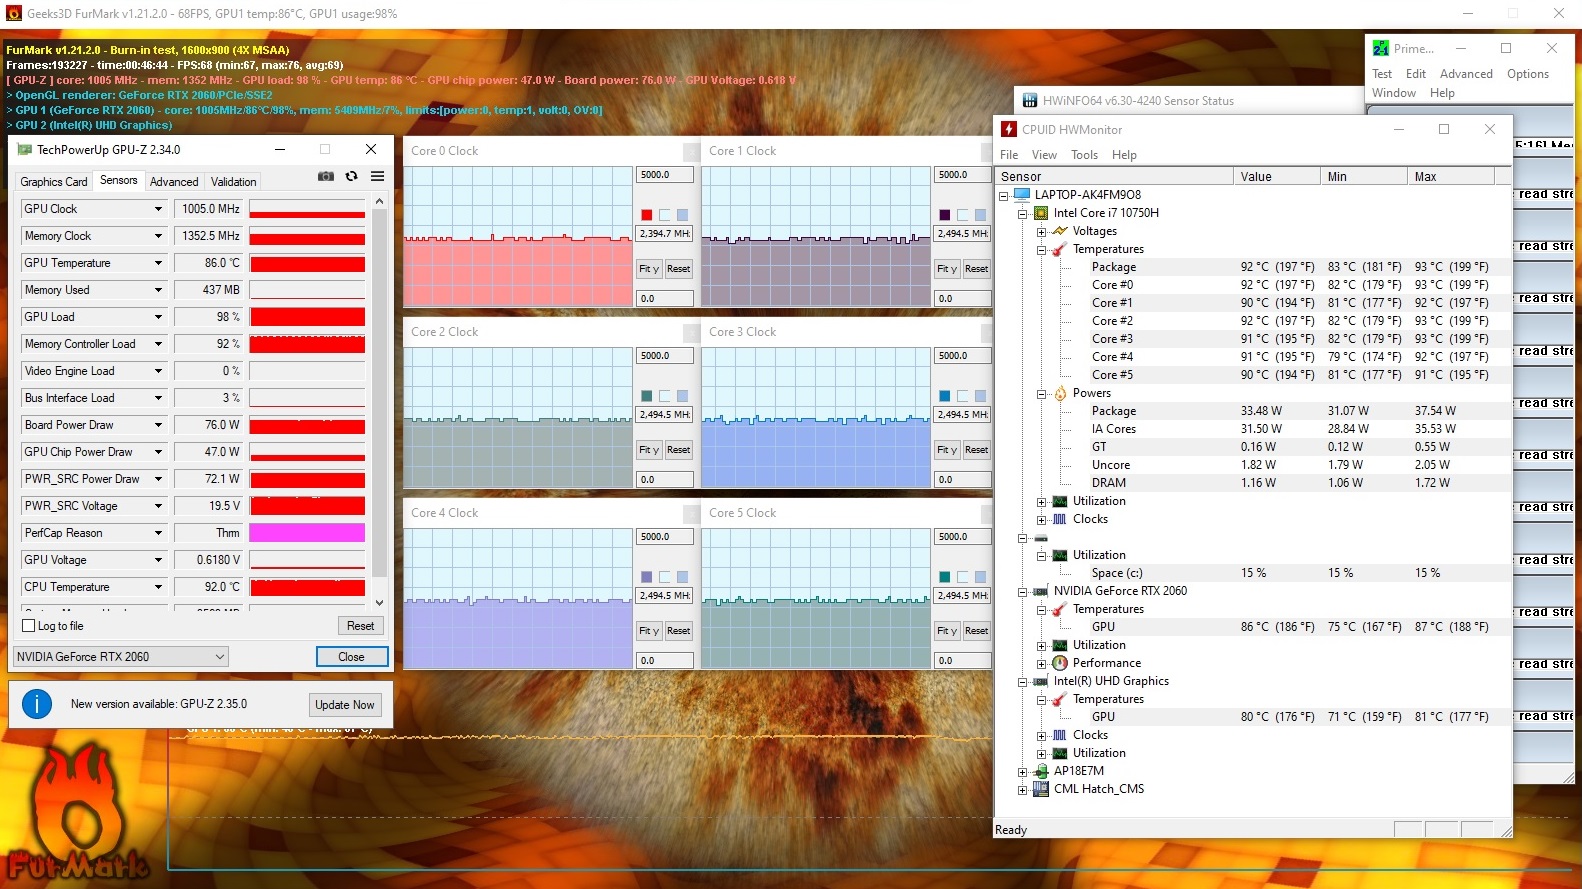
During our one-hour long stress test temperatures inside the gaming notebook rose to 92 °C, with clock speeds lowered to just 2.5 GHz and thus slightly below the CPU’s base clock speed. Considering that the CPU ran at a relatively consistent 4.4 GHz during our Witcher 3 on Ultra sustained gaming load test we don’t expect any issues for users caused by high temperatures.
(-) The maximum temperature on the upper side is 55 °C / 131 F, compared to the average of 40.4 °C / 105 F, ranging from 21.2 to 68.8 °C for the class Gaming.
(-) The bottom heats up to a maximum of 65 °C / 149 F, compared to the average of 43.2 °C / 110 F
(+) In idle usage, the average temperature for the upper side is 29 °C / 84 F, compared to the device average of 33.8 °C / 93 F.
(-) Playing The Witcher 3, the average temperature for the upper side is 45.9 °C / 115 F, compared to the device average of 33.8 °C / 93 F.
(-) The palmrests and touchpad can get very hot to the touch with a maximum of 42 °C / 107.6 F.
(-) The average temperature of the palmrest area of similar devices was 28.9 °C / 84 F (-13.1 °C / -23.6 F).
Speakers
The Triton 300’s speakers offer an average maximum volume with a fairly wide soundscape. Accordingly, they are well usable for media consumption in quiet environments. Nevertheless, we do suggest opting for external speakers or headphones in the long run if only to be able to compensate for the immense amount of fan noise.
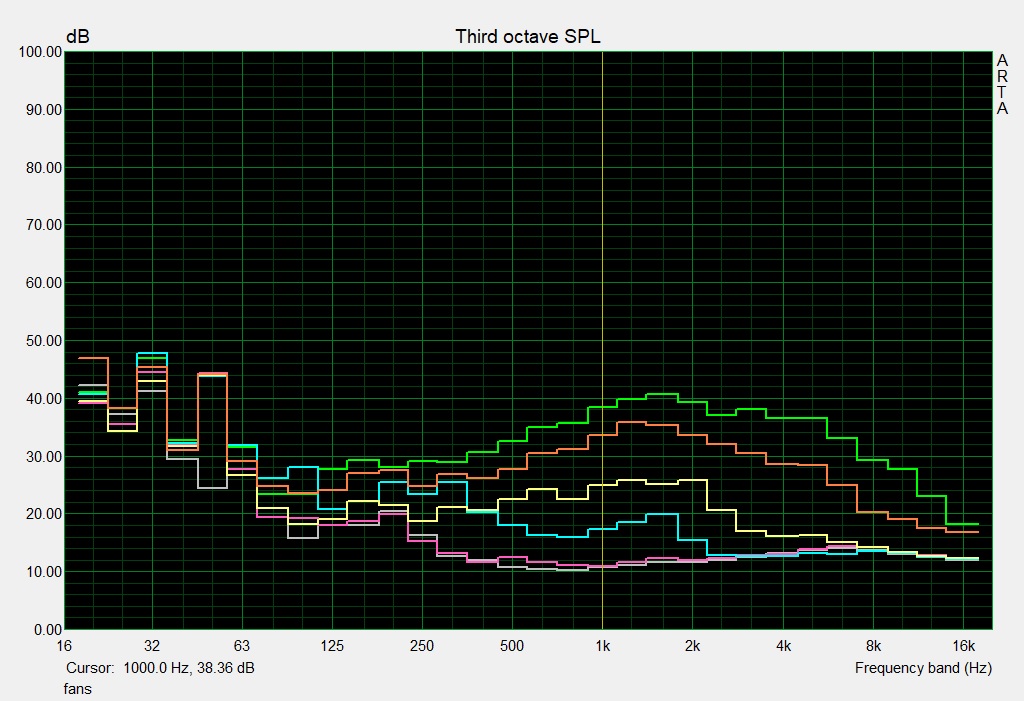
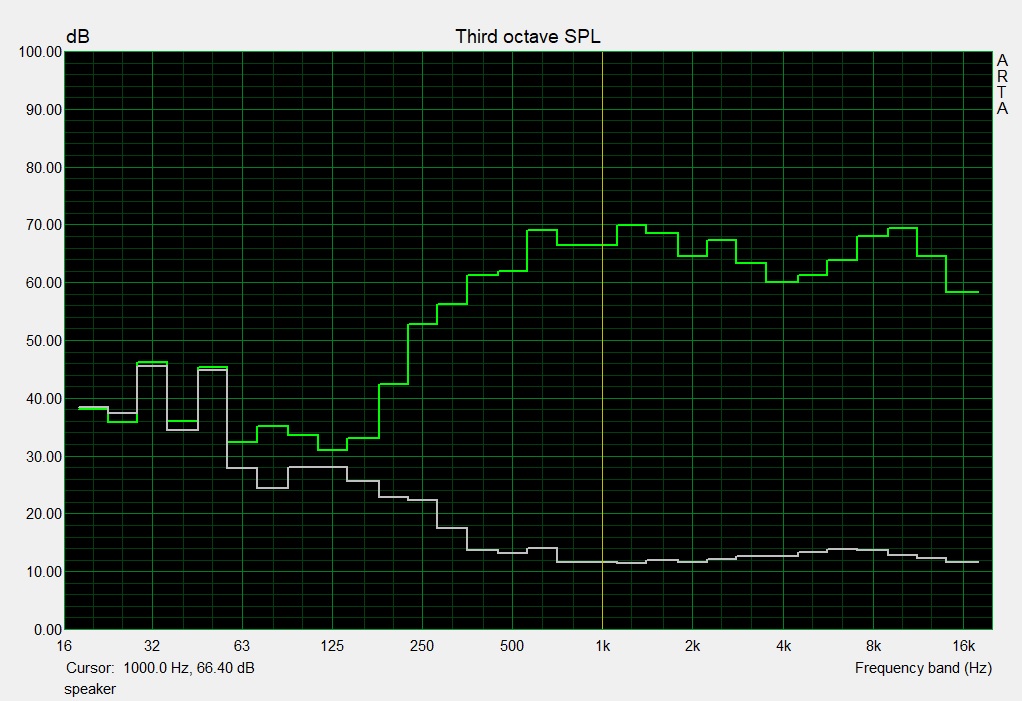
Acer Predator Triton 300 PT315-52-79LP audio analysis
(±) | speaker loudness is average but good (78 dB)
Bass 100 - 315 Hz
(-) | nearly no bass - on average 21.8% lower than median
(±) | linearity of bass is average (9.8% delta to prev. frequency)
Mids 400 - 2000 Hz
(+) | balanced mids - only 3.6% away from median
(+) | mids are linear (6.1% delta to prev. frequency)
Highs 2 - 16 kHz
(+) | balanced highs - only 3% away from median
(+) | highs are linear (5.5% delta to prev. frequency)
Overall 100 - 16.000 Hz
(±) | linearity of overall sound is average (17.6% difference to median)
Compared to same class
» 47% of all tested devices in this class were better, 12% similar, 41% worse
» The best had a delta of 6%, average was 18%, worst was 132%
Compared to all devices tested
» 29% of all tested devices were better, 8% similar, 63% worse
» The best had a delta of 4%, average was 25%, worst was 134%
Apple MacBook 12 (Early 2016) 1.1 GHz audio analysis
(+) | speakers can play relatively loud (83.6 dB)
Bass 100 - 315 Hz
(±) | reduced bass - on average 11.3% lower than median
(±) | linearity of bass is average (14.2% delta to prev. frequency)
Mids 400 - 2000 Hz
(+) | balanced mids - only 2.4% away from median
(+) | mids are linear (5.5% delta to prev. frequency)
Highs 2 - 16 kHz
(+) | balanced highs - only 2% away from median
(+) | highs are linear (4.5% delta to prev. frequency)
Overall 100 - 16.000 Hz
(+) | overall sound is linear (10.2% difference to median)
Compared to same class
» 5% of all tested devices in this class were better, 2% similar, 93% worse
» The best had a delta of 5%, average was 19%, worst was 53%
Compared to all devices tested
» 3% of all tested devices were better, 1% similar, 96% worse
» The best had a delta of 4%, average was 25%, worst was 134%
Energy Management – More Than 5 Hours of Battery Life
Power Consumption
With a maximum power consumption of 214 W the Predator Triton 300 consumed slightly more power than similarly equipped notebooks. In return, when running The Witcher 3 it landed in the middle of the pack with an average and inconspicuous power consumption. Overall, its power consumption was thus not too high.
The included power supply is rated at 230 W and thus amply dimensioned.
| Off / Standby | |
| Idle | |
| Load |
|
| Acer Predator Triton 300 PT315-52-79LP i7-10750H, GeForce RTX 2060 Mobile | Acer Predator Helios 300 PH315-53-77N5 i7-10750H, GeForce RTX 2060 Mobile | Dell G3 15 3500-G4DG2 i7-10750H, GeForce RTX 2060 Mobile | Aorus 5 KB i7-10750H, GeForce RTX 2060 Mobile | SCHENKER XMG Core 15 GK5NR0O R7 4800H, GeForce RTX 2060 Mobile | Average of class Gaming | |
|---|---|---|---|---|---|---|
| Power Consumption | 1% | -16% | -28% | -39% | -82% | |
| Idle Minimum * | 4 | 2.9 27% | 7 -75% | 8 -100% | 12 -200% | 13.8 ? -245% |
| Idle Average * | 10 | 13.2 -32% | 10.2 -2% | 12 -20% | 14 -40% | 19.2 ? -92% |
| Idle Maximum * | 19 | 19.8 -4% | 15 21% | 21 -11% | 20 -5% | 27 ? -42% |
| Load Average * | 96 | 105 -9% | 147 -53% | 128 -33% | 103 -7% | 111.3 ? -16% |
| Witcher 3 ultra * | 136 | 127 7% | 131 4% | 138 -1% | 125 8% | |
| Load Maximum * | 214 | 177 17% | 197 8% | 217 -1% | 193 10% | 251 ? -17% |
* ... smaller is better
Battery Life
In our real-life Wi-Fi test Acer’s gaming notebook managed a runtime of around 5.5 hours. It made good use of its 58.7 Wh battery and secured second place in its comparison group.
| Acer Predator Triton 300 PT315-52-79LP i7-10750H, GeForce RTX 2060 Mobile, 58.7 Wh | Acer Predator Helios 300 PH315-53-77N5 i7-10750H, GeForce RTX 2060 Mobile, 58.7 Wh | Dell G3 15 3500-G4DG2 i7-10750H, GeForce RTX 2060 Mobile, 68 Wh | Aorus 5 KB i7-10750H, GeForce RTX 2060 Mobile, 48.96 Wh | SCHENKER XMG Core 15 GK5NR0O R7 4800H, GeForce RTX 2060 Mobile, 62 Wh | Average of class Gaming | |
|---|---|---|---|---|---|---|
| Battery Runtime | 4% | -9% | -19% | -5% | -0% | |
| Reader / Idle | 575 | 624 9% | 449 -22% | 538 -6% | 469 -18% | 544 ? -5% |
| WiFi v1.3 | 329 | 280 -15% | 314 -5% | 285 -13% | 354 8% | 368 ? 12% |
| Load | 92 | 108 17% | 93 1% | 58 -37% | 87 -5% | 84.2 ? -8% |
Pros
Cons
Verdict – Manual Adjustments Required
In our particular review configuration, the Acer Predator Triton 300 turned out to be a fairly powerful gaming notebook. Both CPU and GPU performance were at a high level, and the aluminum case turned out to be fairly robust. Only the display lid could have been a bit more robust.
For customers on a budget that do not mind tinkering with the device’s fan management the Acer Predator Triton 300 can be worth a closer look.
In everyday use users will have to deal with the fan management profiles and the resulting performance levels. If you leave everything on “Auto” you will suffer from decreasing performance and high temperatures sooner or later. This may not be a deal breaker for most but keep in mind that future games will most likely put a much higher strain on the system resulting in issues in the not-too-distant future.
Acer Predator Triton 300 PT315-52-79LP
-
12/10/2020 v7
Mike Wobker
More articles related to this device
Acer Predator Triton 300 PT315-52-79LP (Predator Triton 300 Series)Related Articles


Pricecompare

