

Aorus 15G XC Gaming-Laptop review: Features suffer setback in favor of an upgrade to RTX 3070
Last summer, our test unit's predecessor made a good impression with its good performance, attractive design and several special characteristics such as its mechanical keyboard. This year, the successor has been equipped with a chip from the new GPU generation and has undergone several other changes - although not all of them are going in the right direction. Other than the GPU, the technical specifications indicate a step backward rather than forward. For example, the mechanical keyboard has been removed, just as the fingerprint reader. The device no longer supports Thunderbolt and the processor has not been updated to Tiger Lake either. The device has become slightly cheaper as a result despite the new GPU.
We have compared the new model with its predecessor as well as with other gaming competitors (see table below).
possible competitors in comparison
Rating | Date | Model | Weight | Height | Size | Resolution | Price |
|---|---|---|---|---|---|---|---|
| 86.4 % v7 (old) | 02 / 2021 | Aorus 15G XC i7-10870H, GeForce RTX 3070 Laptop GPU | 2.1 kg | 23 mm | 15.60" | 1920x1080 | |
| 86.5 % v7 (old) | 08 / 2020 | Aorus 15G XB i7-10875H, GeForce RTX 2070 Super Max-Q | 2.3 kg | 25 mm | 15.60" | 1920x1080 | |
| 82.4 % v7 (old) | 02 / 2021 | Asus TUF Dash F15 FX516PR i7-11370H, GeForce RTX 3070 Laptop GPU | 2 kg | 20 mm | 15.60" | 1920x1080 | |
| 85.1 % v7 (old) | 01 / 2021 | SCHENKER XMG Neo 17 (Early 2021, RTX 3070, 5800H) R7 5800H, GeForce RTX 3070 Laptop GPU | 2.5 kg | 27 mm | 17.30" | 2560x1440 | |
| 85.9 % v7 (old) | 08 / 2020 | Razer Blade 15 RTX 2080 Super Max-Q i7-10875H, GeForce RTX 2080 Super Max-Q | 2.2 kg | 17.8 mm | 15.60" | 1920x1080 | |
| 84.5 % v7 (old) | 09 / 2020 | SCHENKER Key 15 Comet Lake i7-10875H, GeForce RTX 2080 Super Max-Q | 2 kg | 19.8 mm | 15.60" | 1920x1080 |
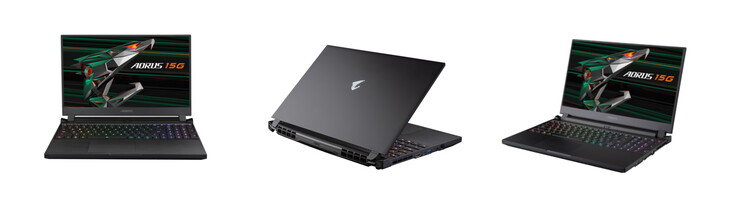
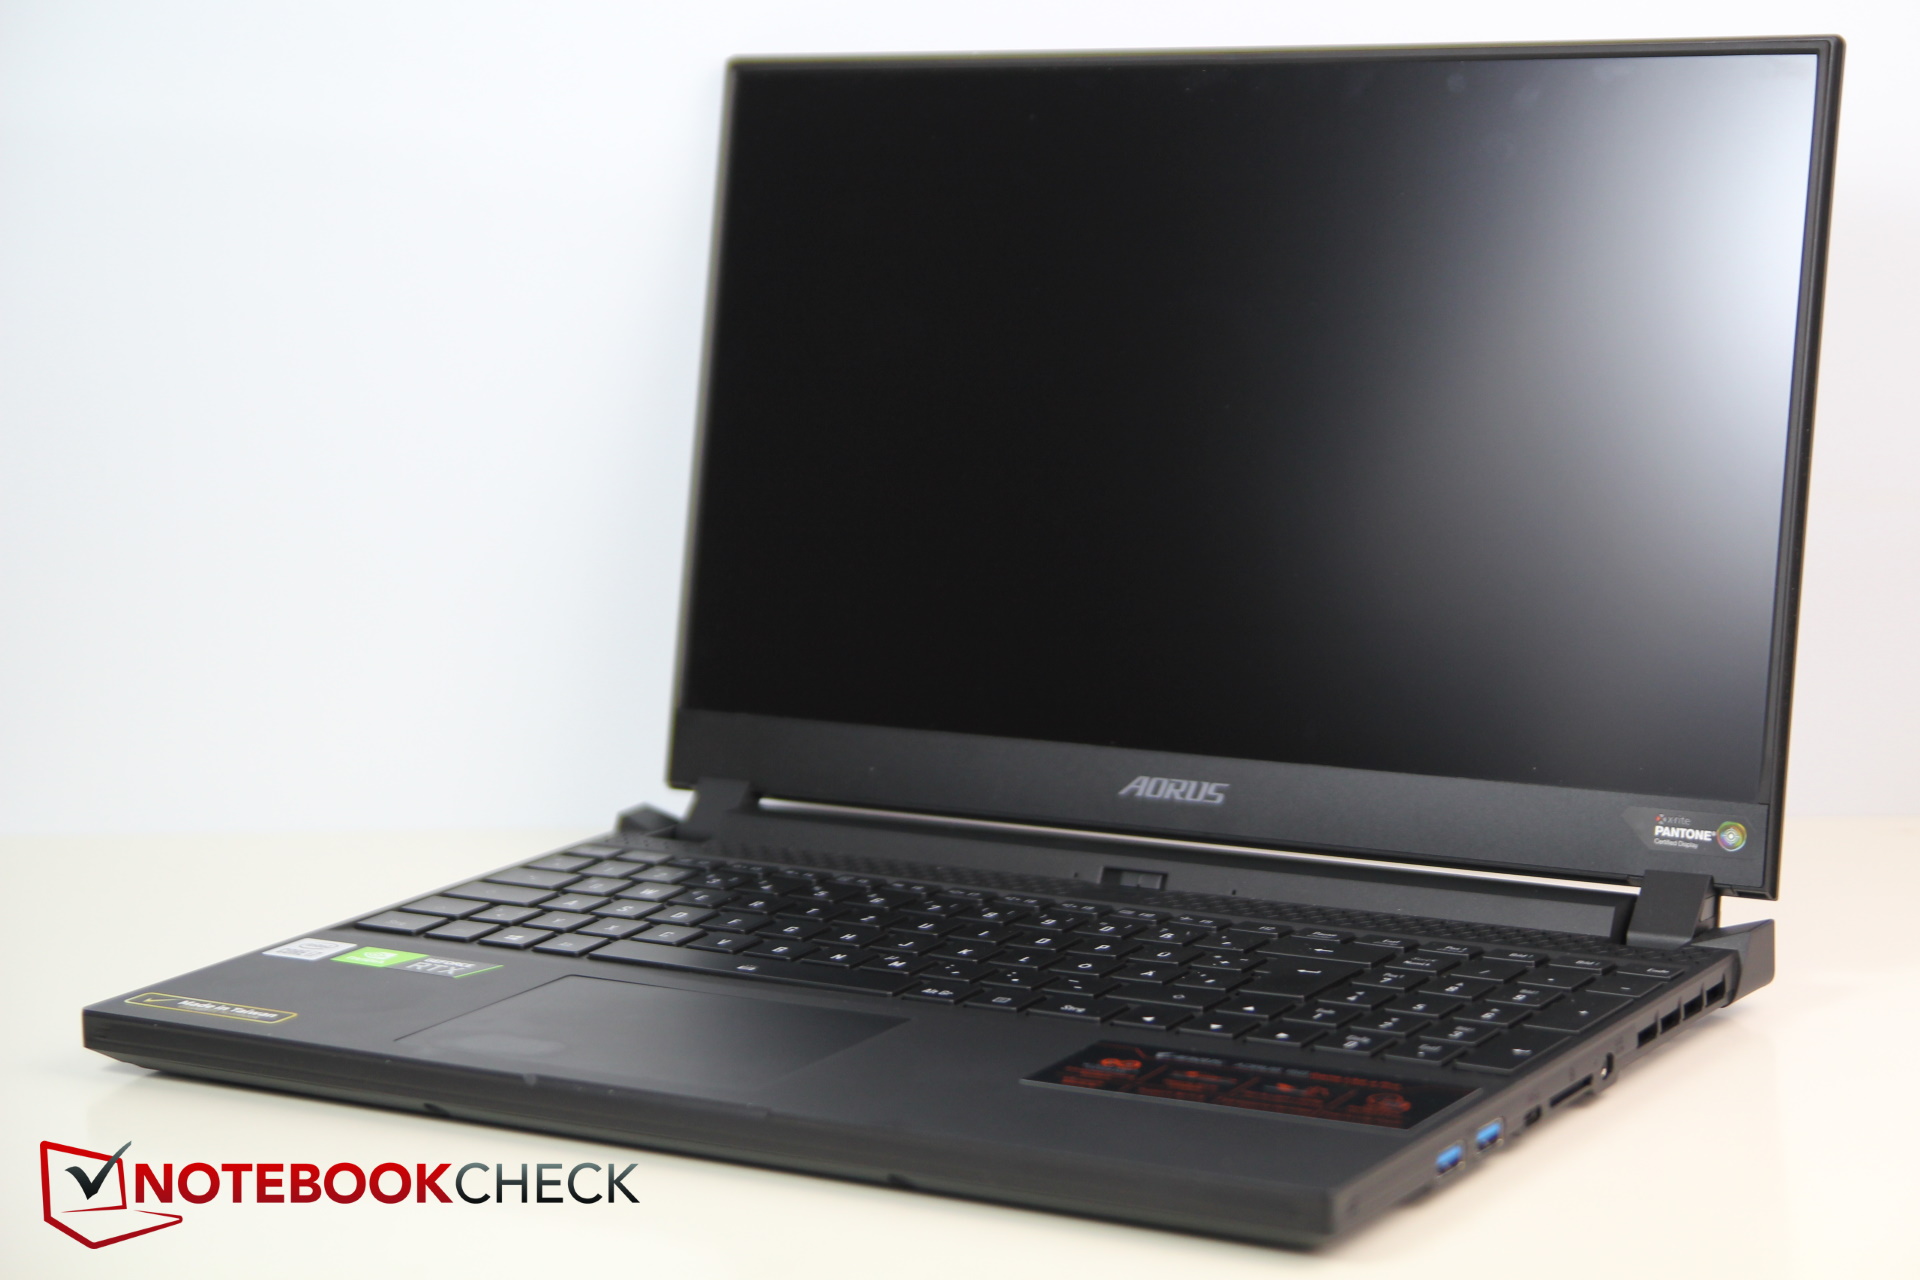
Case - plastic rather than metal
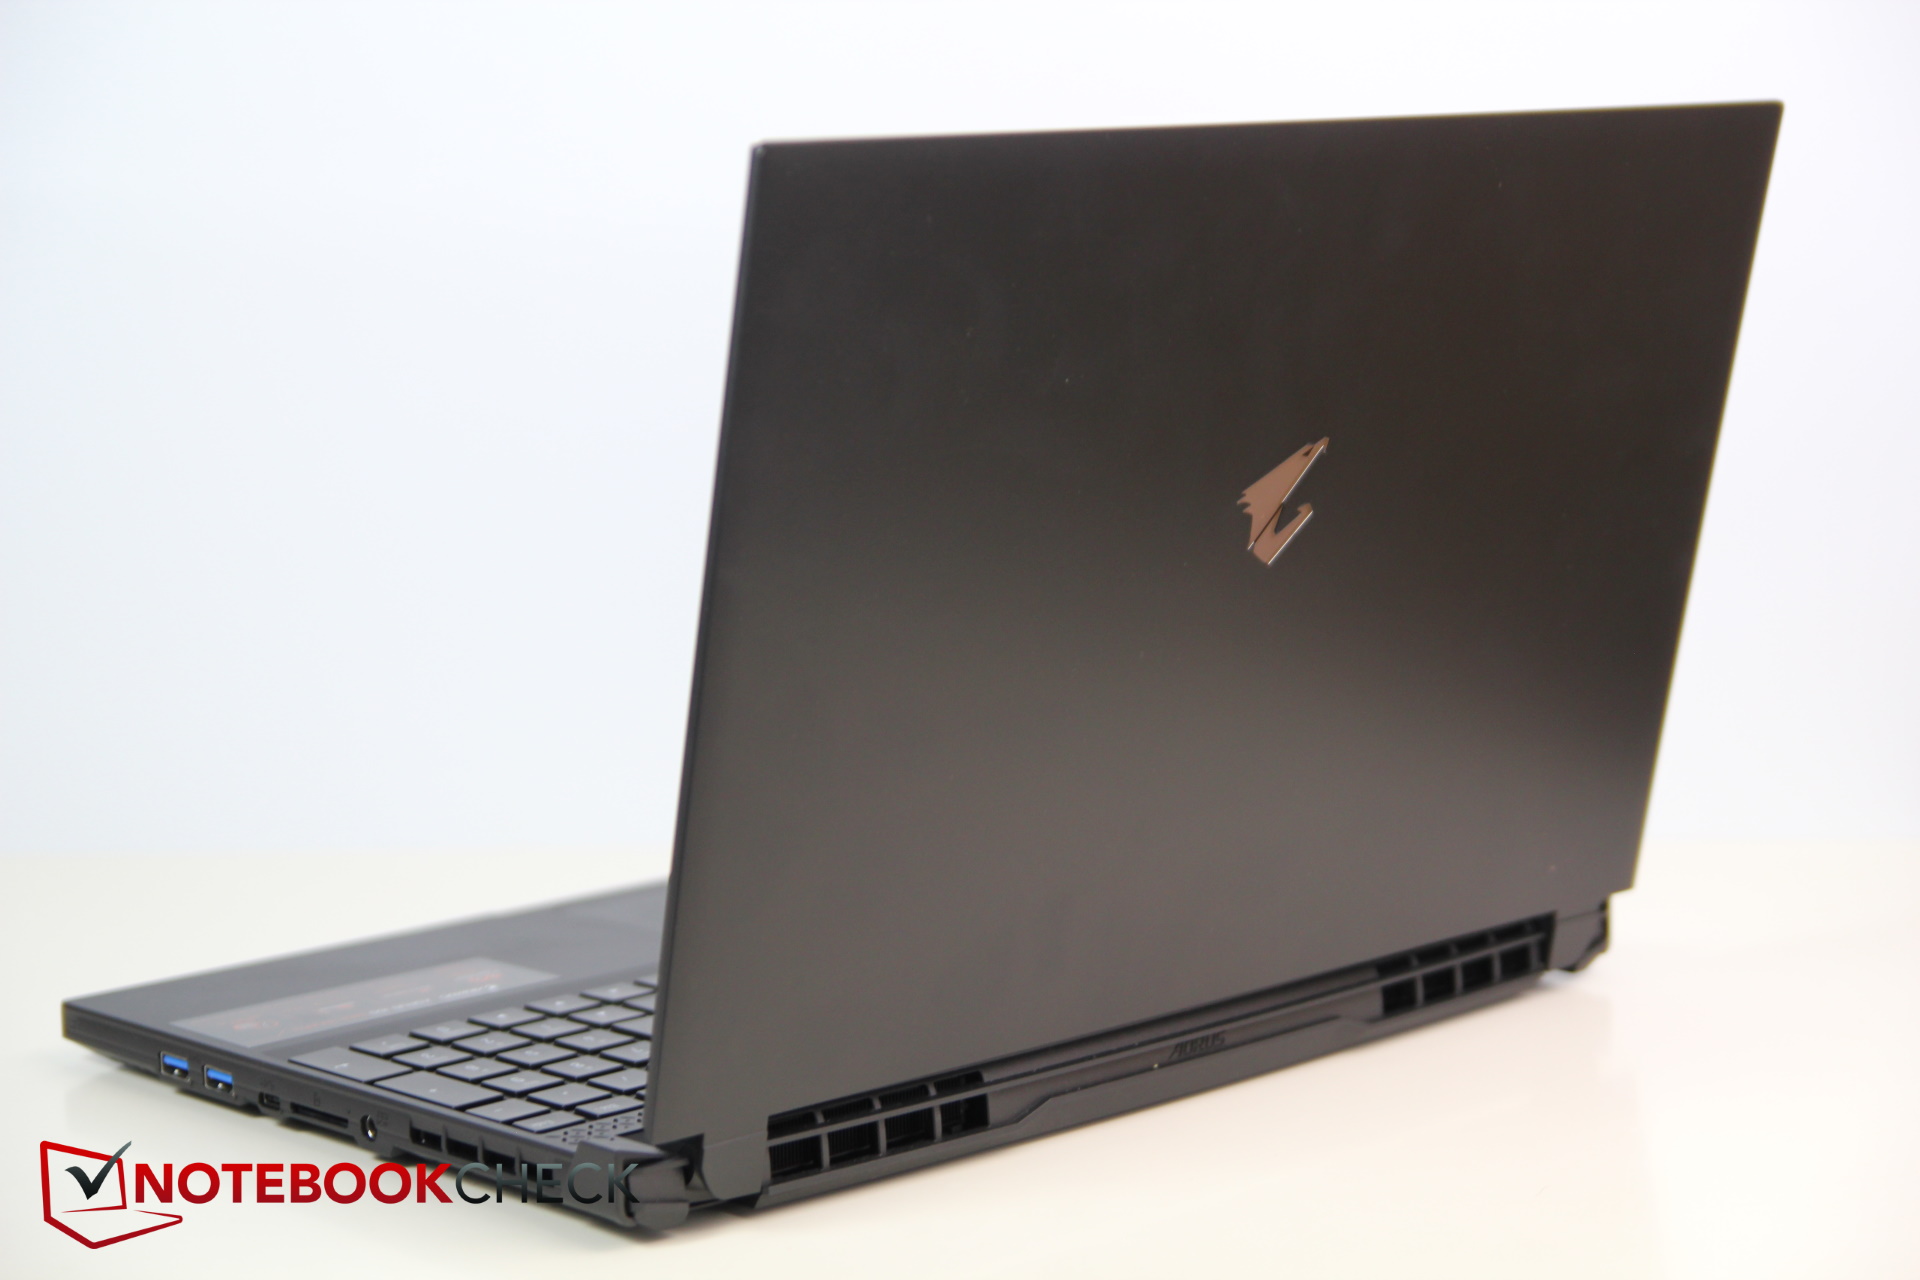
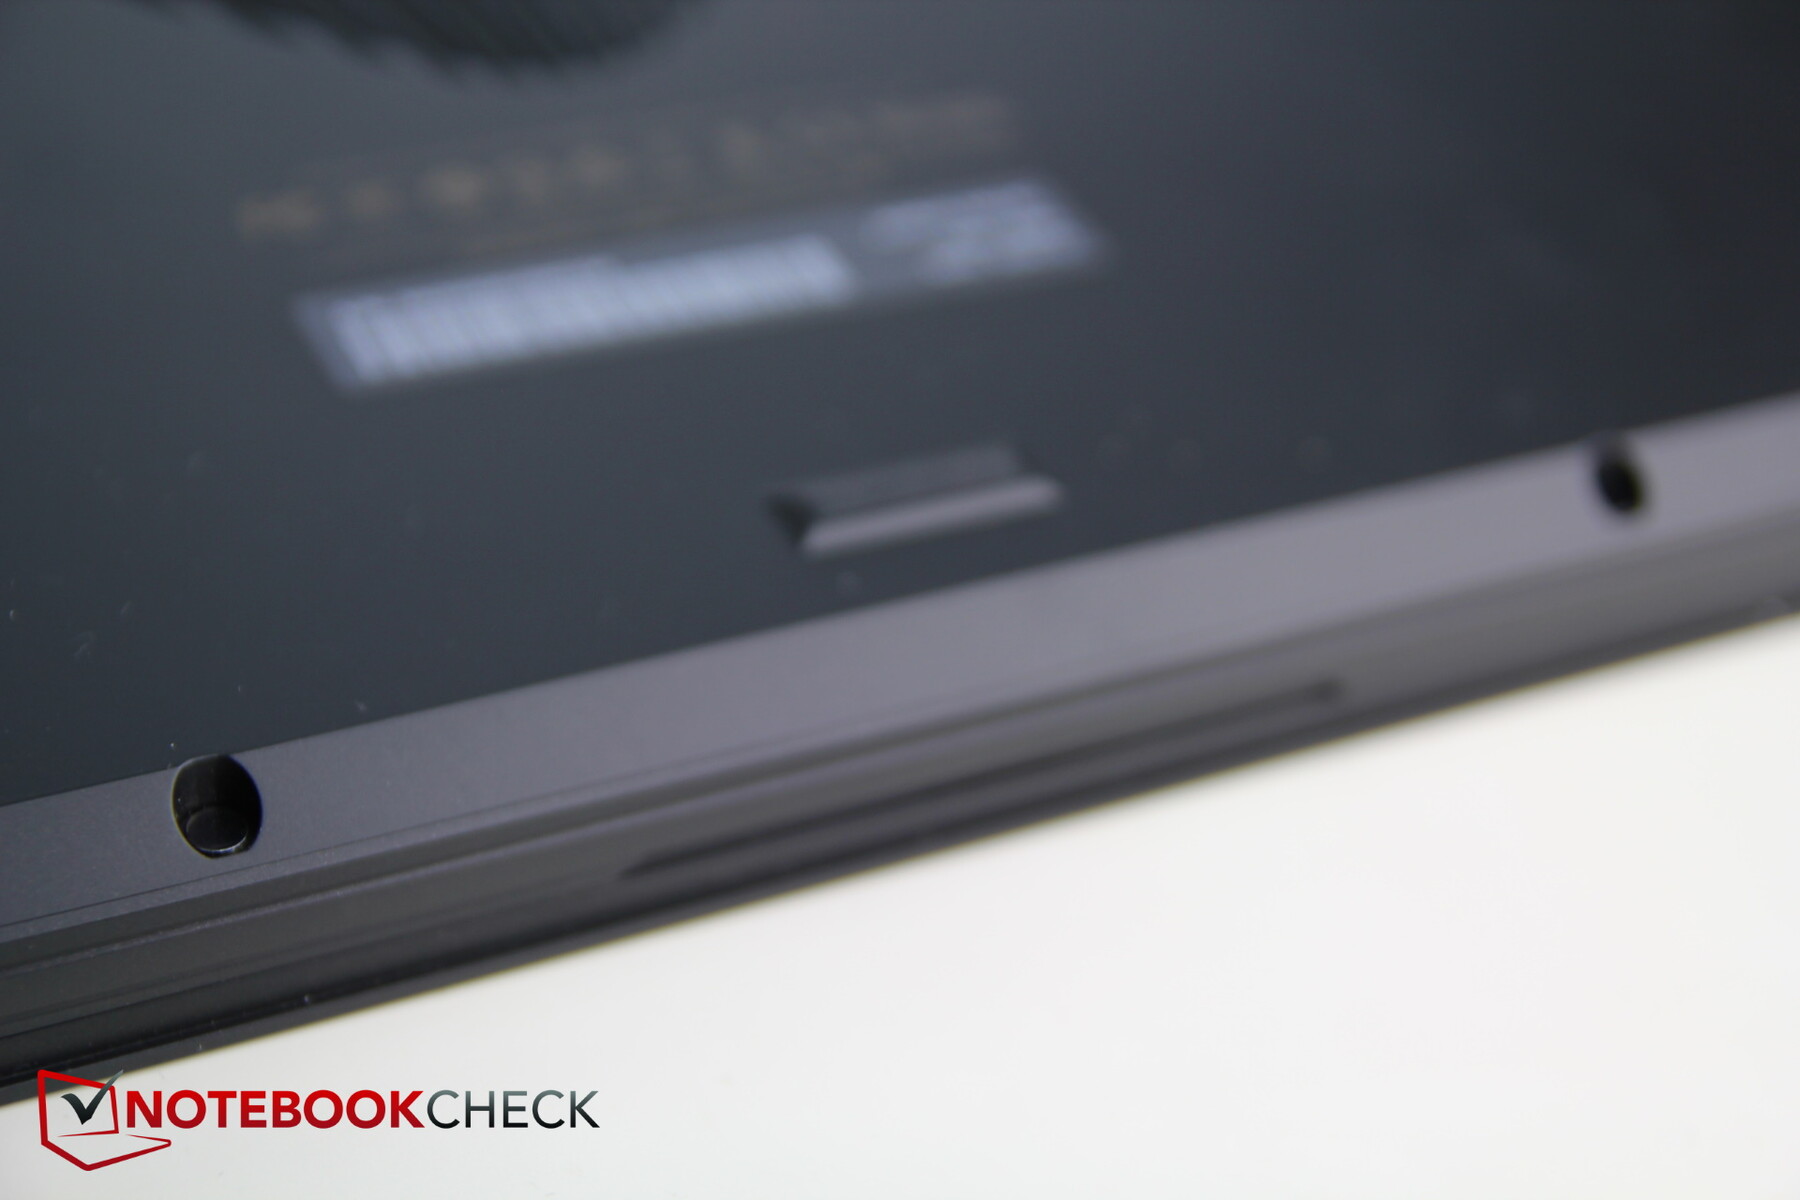
The case is reminiscent of its predecessor despite several aspects having received an update. Instead of the silvery gray metal case, our Aorus test unit is now wrapped in dark plastic. While this gives it a more elegant appearance, it also leads to a certain loss in stability. This means that the display lid is now a lot easier to warp; the hinges are not as tight as we would like either. The base unit is also less solid but still stable enough. One advantage of the plastic case is its reduced weight.
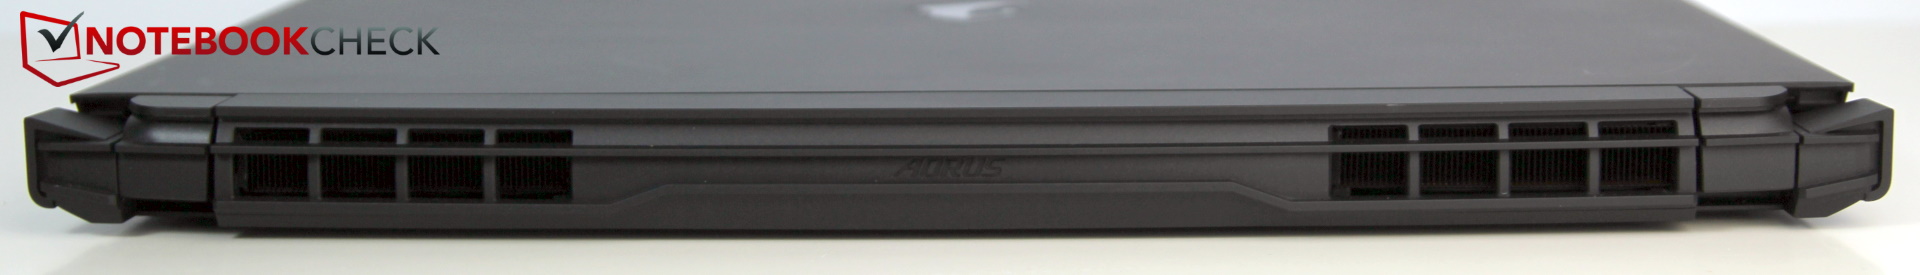
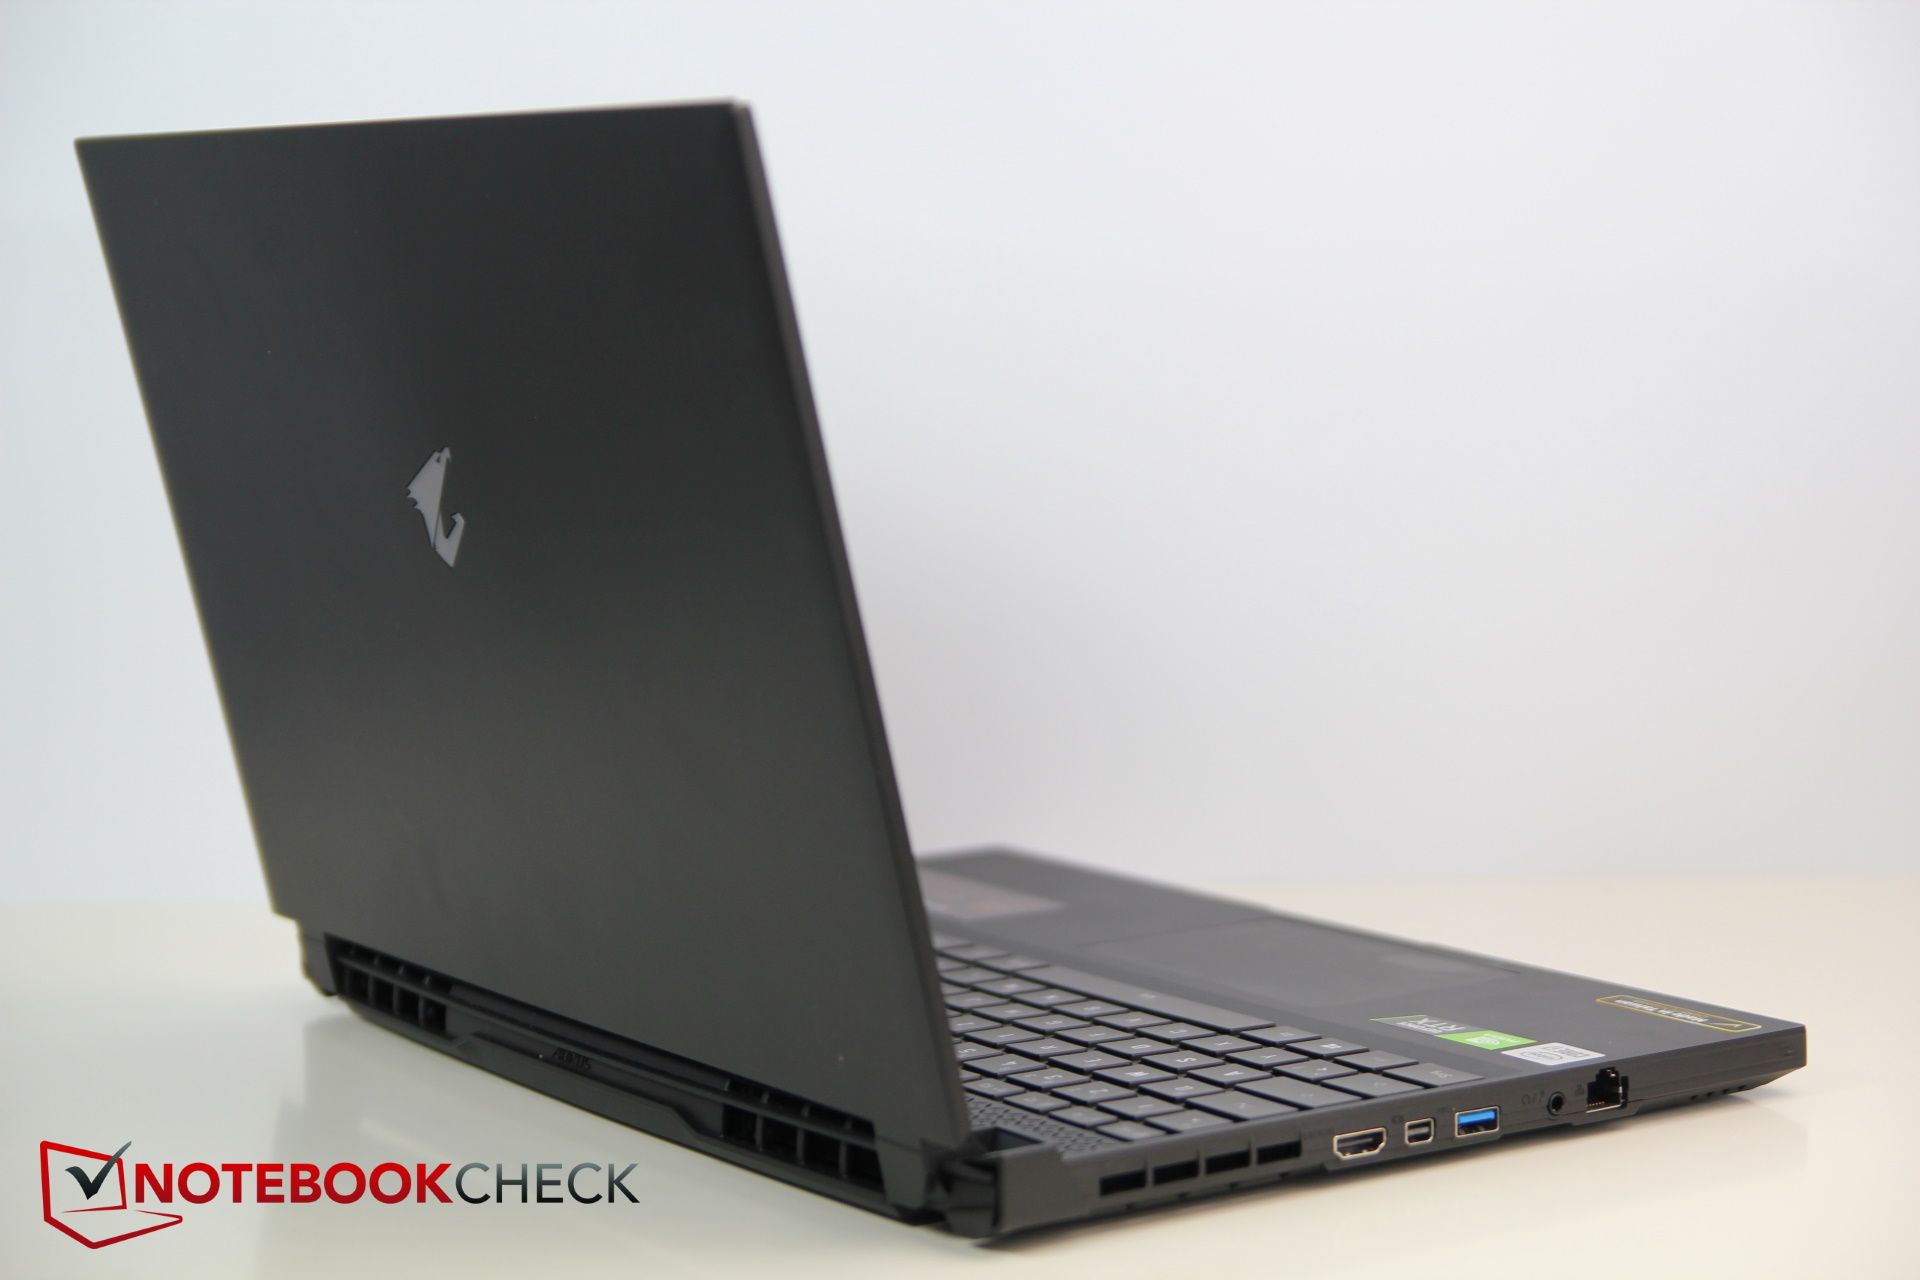
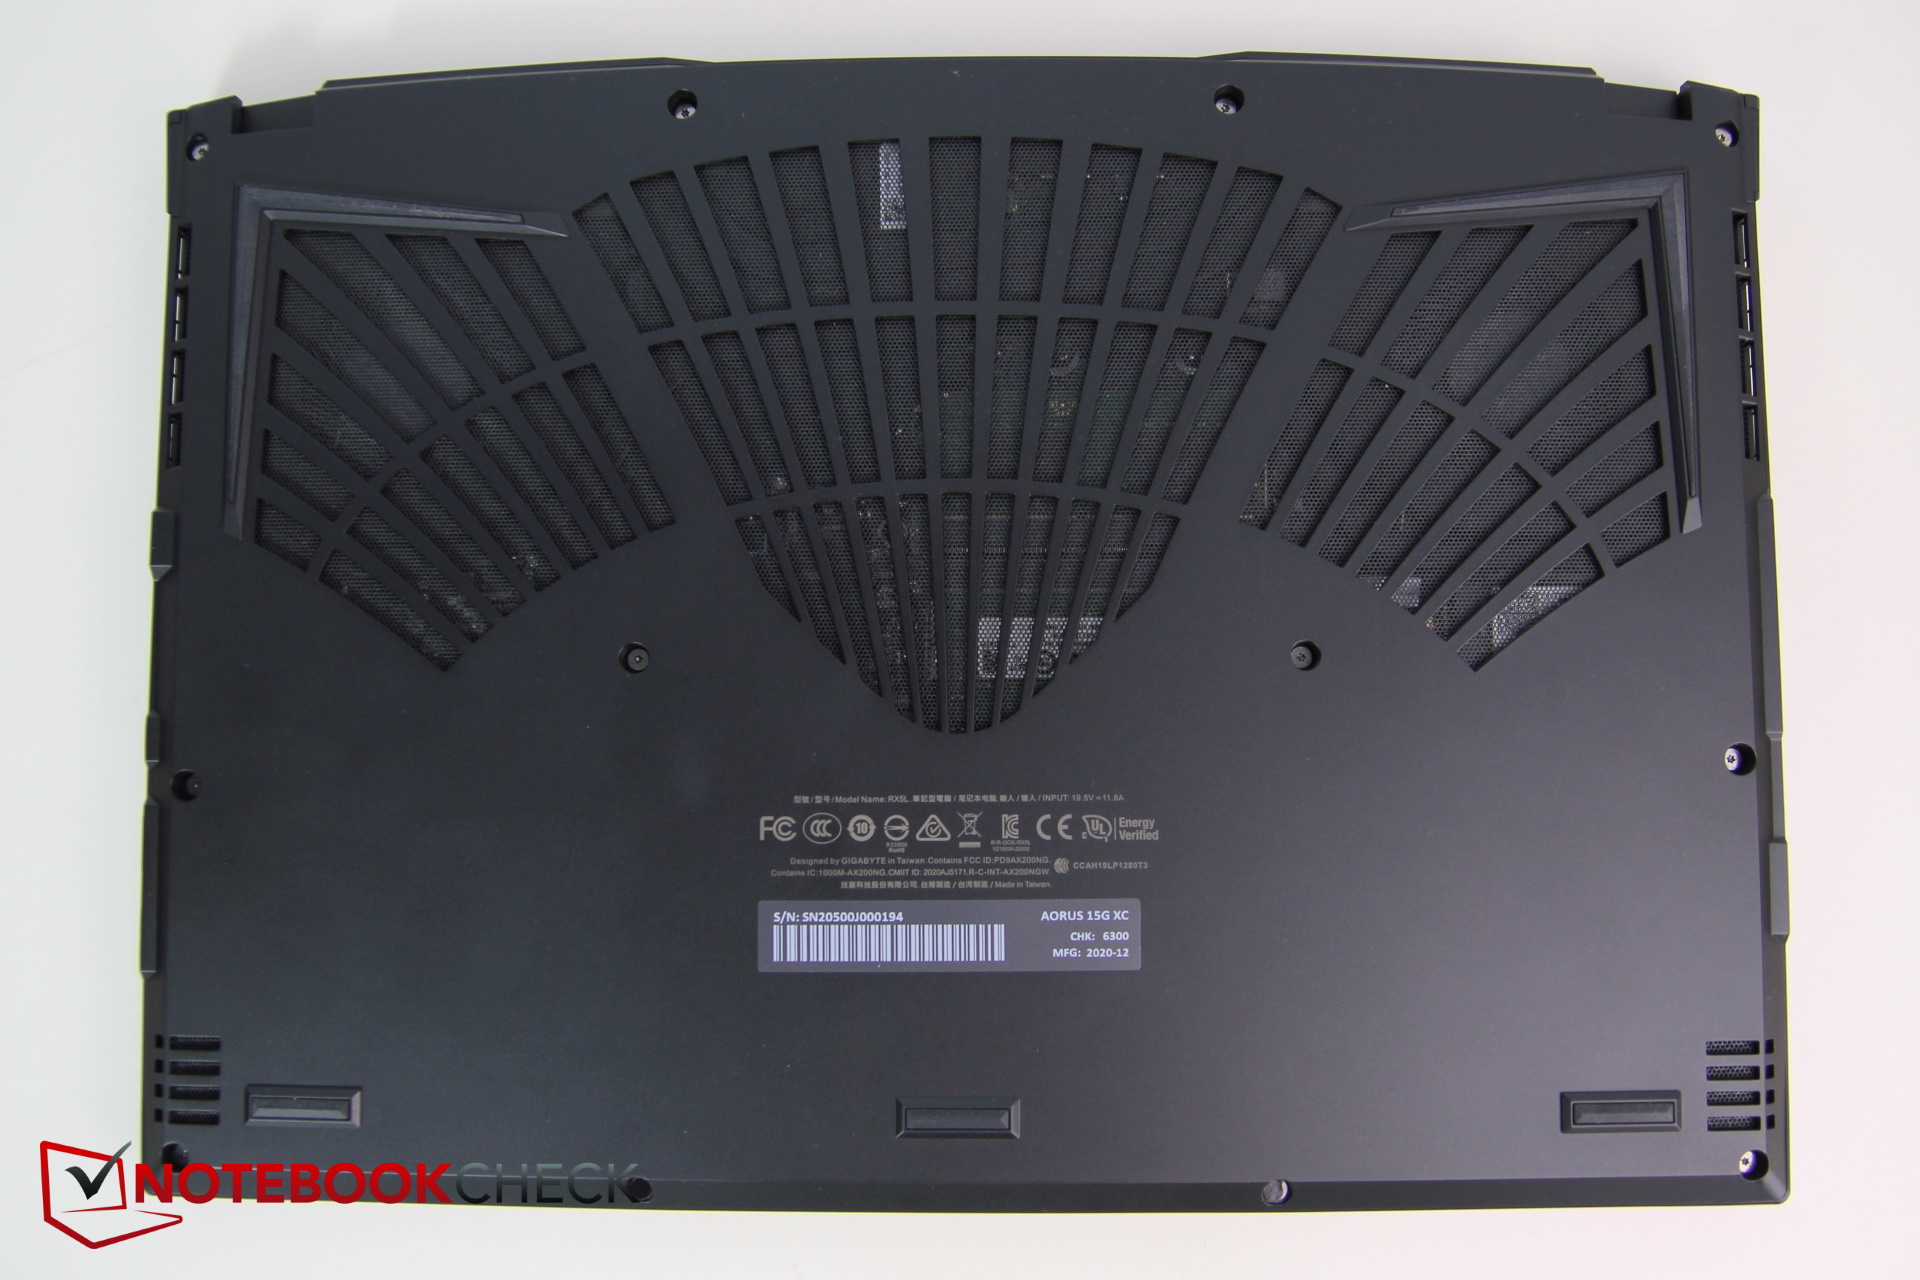
While the back of the predecessor was almost entirely made up of ventilation openings, the new model now only has these towards the corners, which reduces airflow. We have no complaints about workmanship and the gap dimensions are all normal.
The plastic case reduces the new Aorus' weight by about 200 g (~7.06 oz). The device has also shrunk 2 mm (~0.079 in) in height and 6 mm (~0.24 in) in depth. The Asus, Schenker Key, and Razer remain slightly slimmer, although the Asus is significantly larger. The Schenker Key weighs another 100 g (~3.53 oz) less.
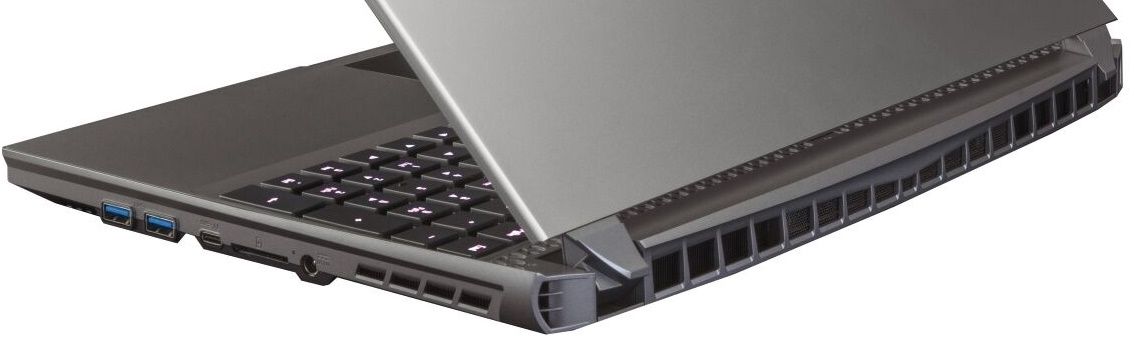
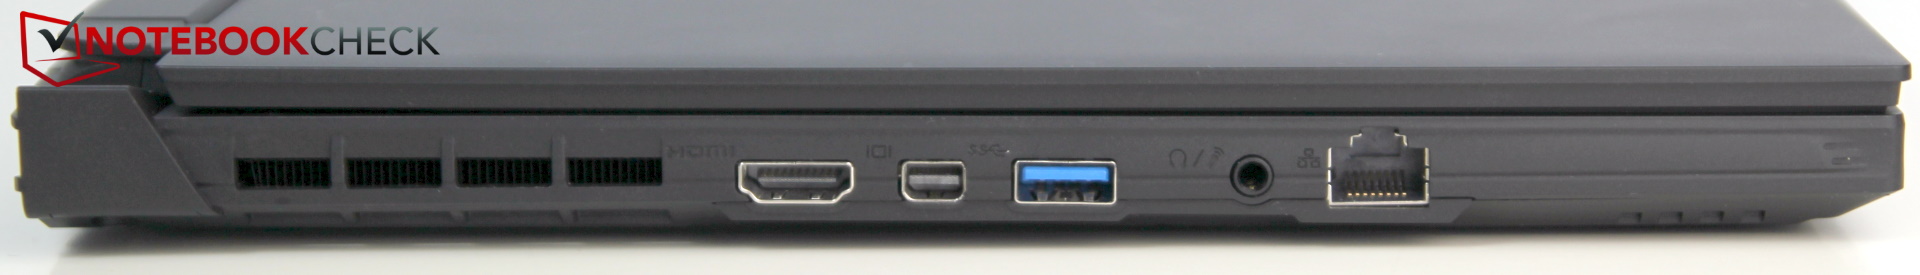
Connectivity - USB 3.0 instead of Thunderbolt
At a quick glance, it looks like nothing has changed in terms of port selection. What you cannot see is that the speed of the USB ports has indeed been altered. Gigabyte has removed Thunderbolt support, which means that the USB-C port now "only" offers USB 3.2 Gen 1 speeds, or to put it simply: USB 3.0. The port distribution has remained the same and the fat proprietary power supply on the right continues to be somewhat annoying.
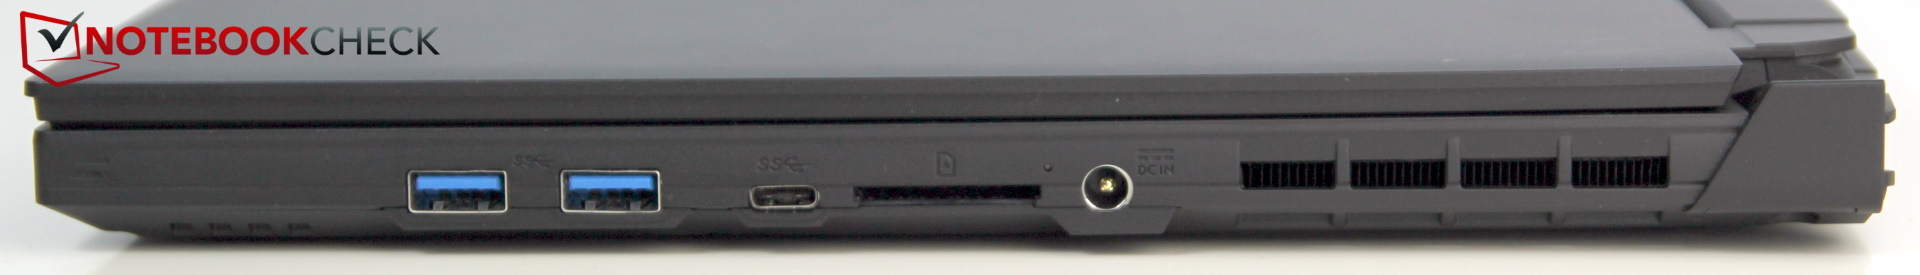
SD card reader
The SD card reader is fairly fast but nonetheless 10 to 15 percent slower than in the predecessor. It takes a little over 5 seconds to copy 1 GB of images from our Toshiba Exceria Pro SDXC 64 GB UHS-II reference card to the desktop.
| SD Card Reader | |
| average JPG Copy Test (av. of 3 runs) | |
| Aorus 15G XB (Toshiba Exceria Pro SDXC 64 GB UHS-II) | |
| Razer Blade 15 RTX 2080 Super Max-Q (Toshiba Exceria Pro SDXC 64 GB UHS-II) | |
| Aorus 15G XC (Toshiba Exceria Pro SDXC 64 GB UHS-II) | |
| Average of class Gaming (20 - 207, n=73, last 2 years) | |
| SCHENKER XMG Neo 17 (Early 2021, RTX 3070, 5800H) (Toshiba Exceria Pro SDXC 64 GB UHS-II) | |
| maximum AS SSD Seq Read Test (1GB) | |
| Aorus 15G XB (Toshiba Exceria Pro SDXC 64 GB UHS-II) | |
| Aorus 15G XC (Toshiba Exceria Pro SDXC 64 GB UHS-II) | |
| Razer Blade 15 RTX 2080 Super Max-Q (Toshiba Exceria Pro SDXC 64 GB UHS-II) | |
| Average of class Gaming (25.8 - 261, n=72, last 2 years) | |
| SCHENKER XMG Neo 17 (Early 2021, RTX 3070, 5800H) (Toshiba Exceria Pro SDXC 64 GB UHS-II) | |
Communication
While the download speed has improved, the upload speed has diminished by about the same degree (about 20 percent). These results are actually just above average for the Intel AX200 module. Overall, the competition has similar results.
Webcam
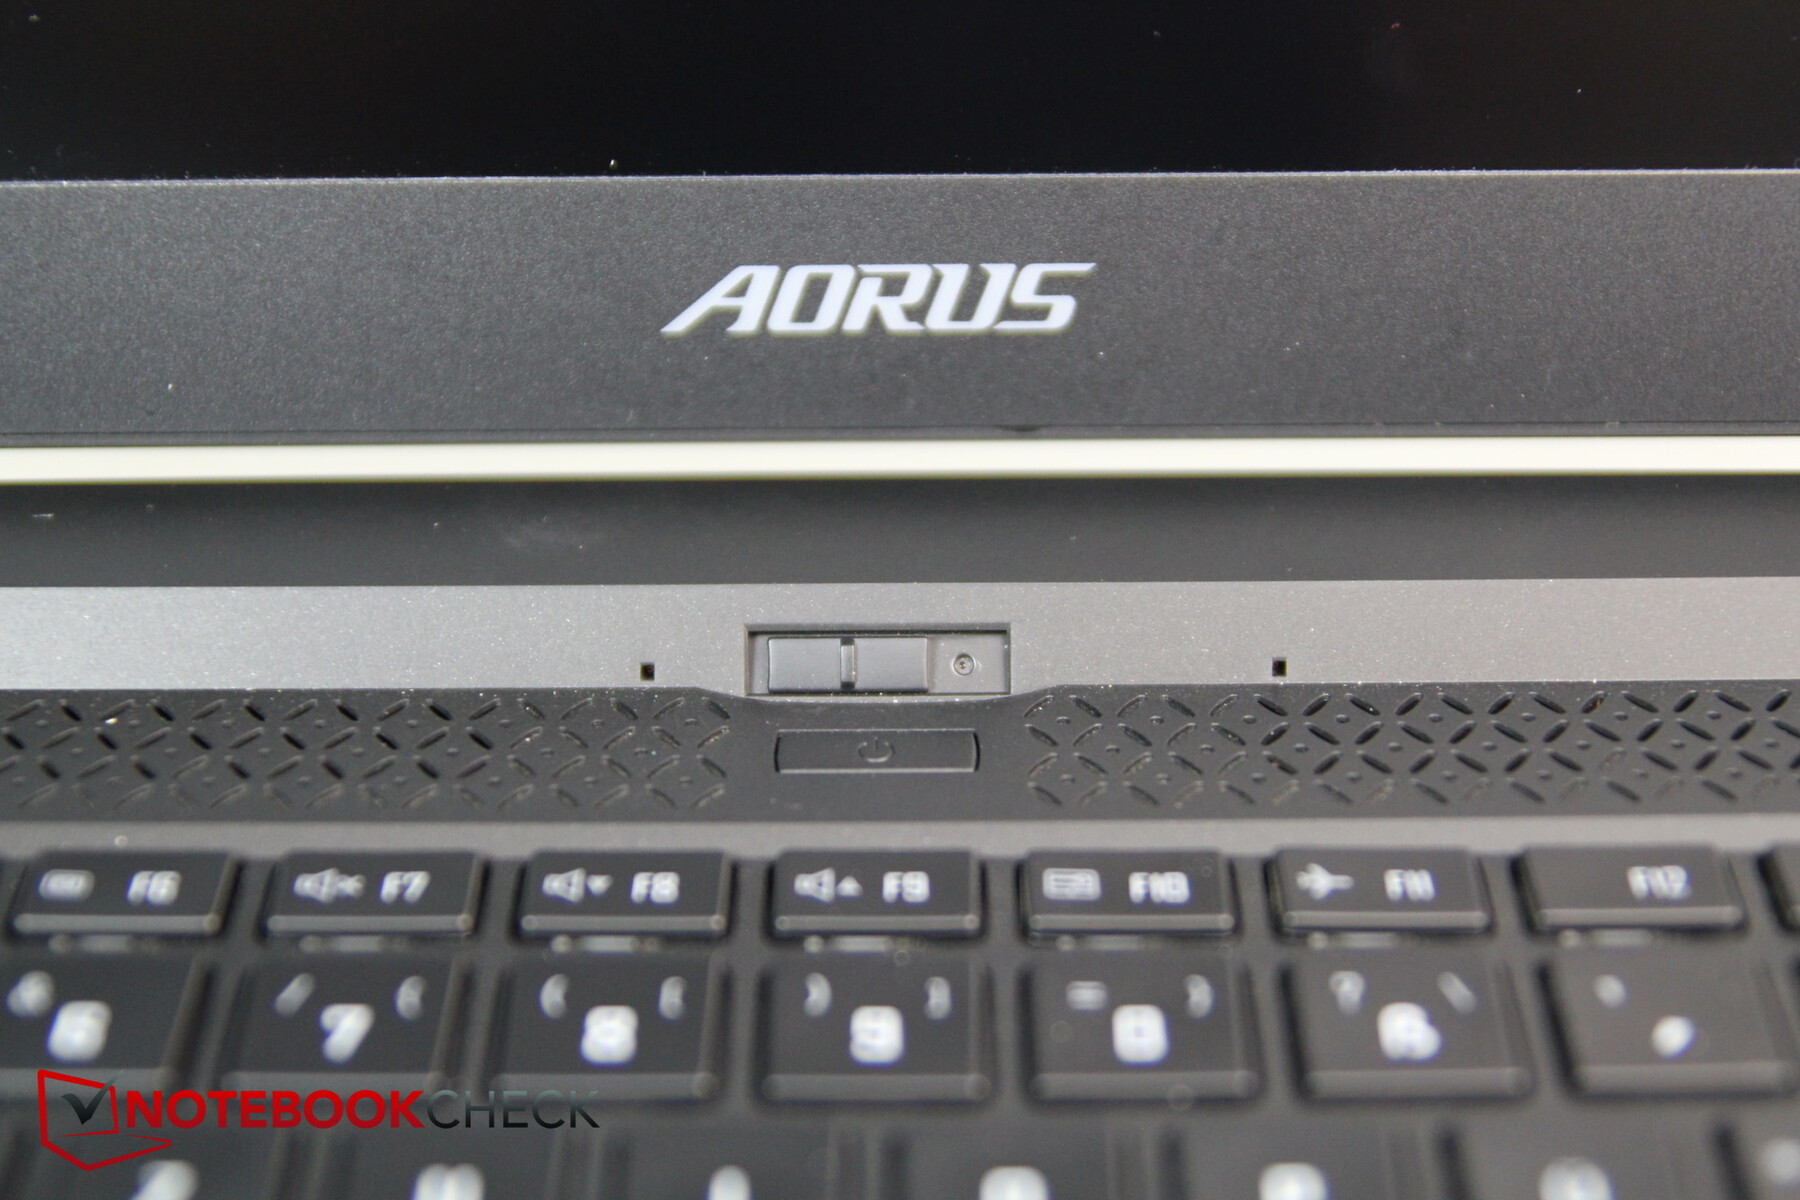
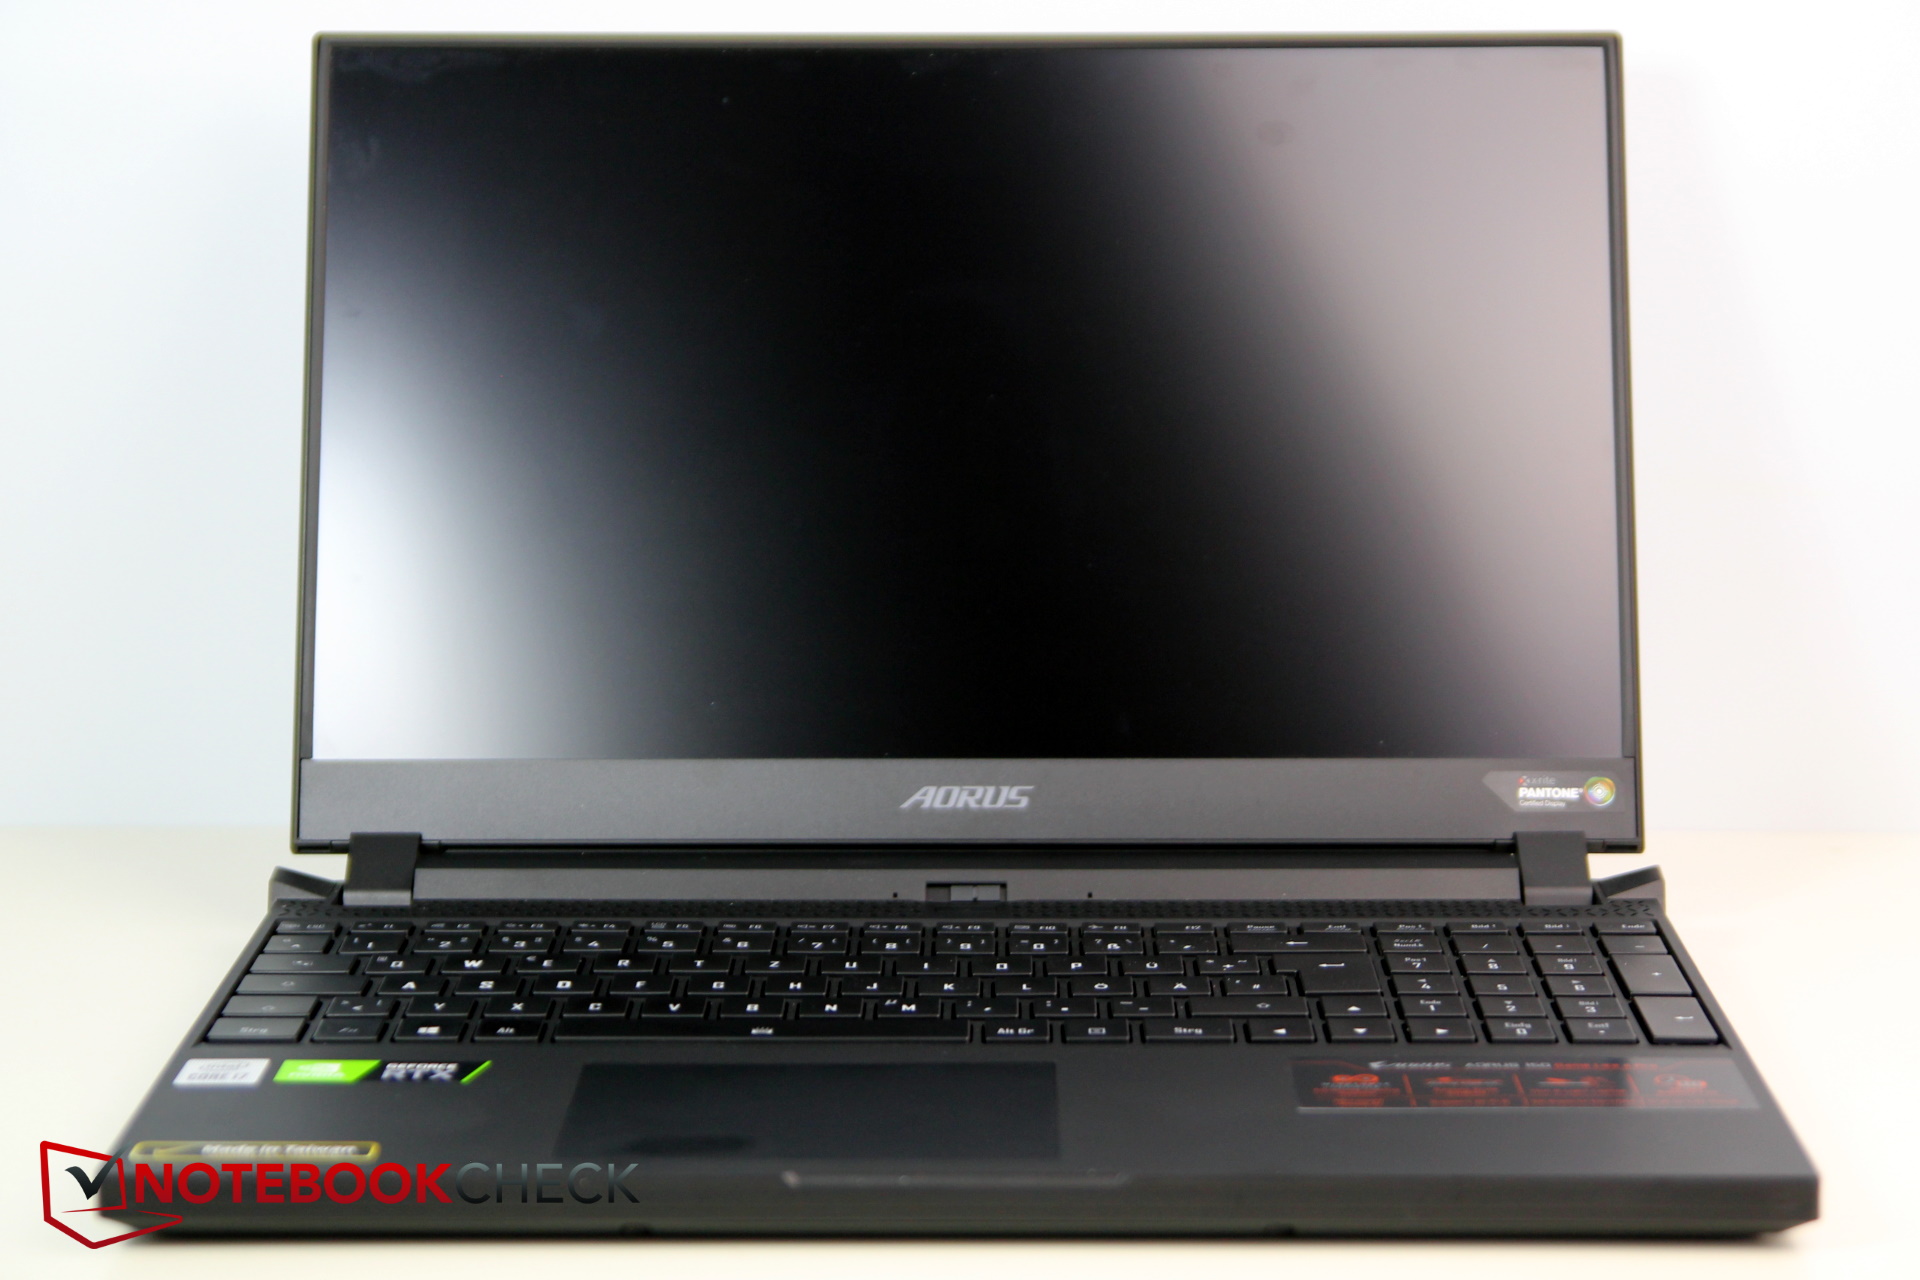
Like with the predecessor, the camera is positioned in an unusual place - above the keyboard. This means that it manages to capture the insides of your nostrils during video conferences - not necessarily the way we would like to be portrayed. Colors have improved slightly, but image sharpness seems to have suffered from this, making the image appear very washed out. We appreciate the manual shutter for the 720p camera.


Security
The CPU comes with TPM 2.0. The fingerprint reader that was included in the predecessor is missing, which we don't think is a particularly big issue. A Kensington lock port is not included either.
Accessories
The device did not come with any accessories - not even the usual paperwork.
Maintenance
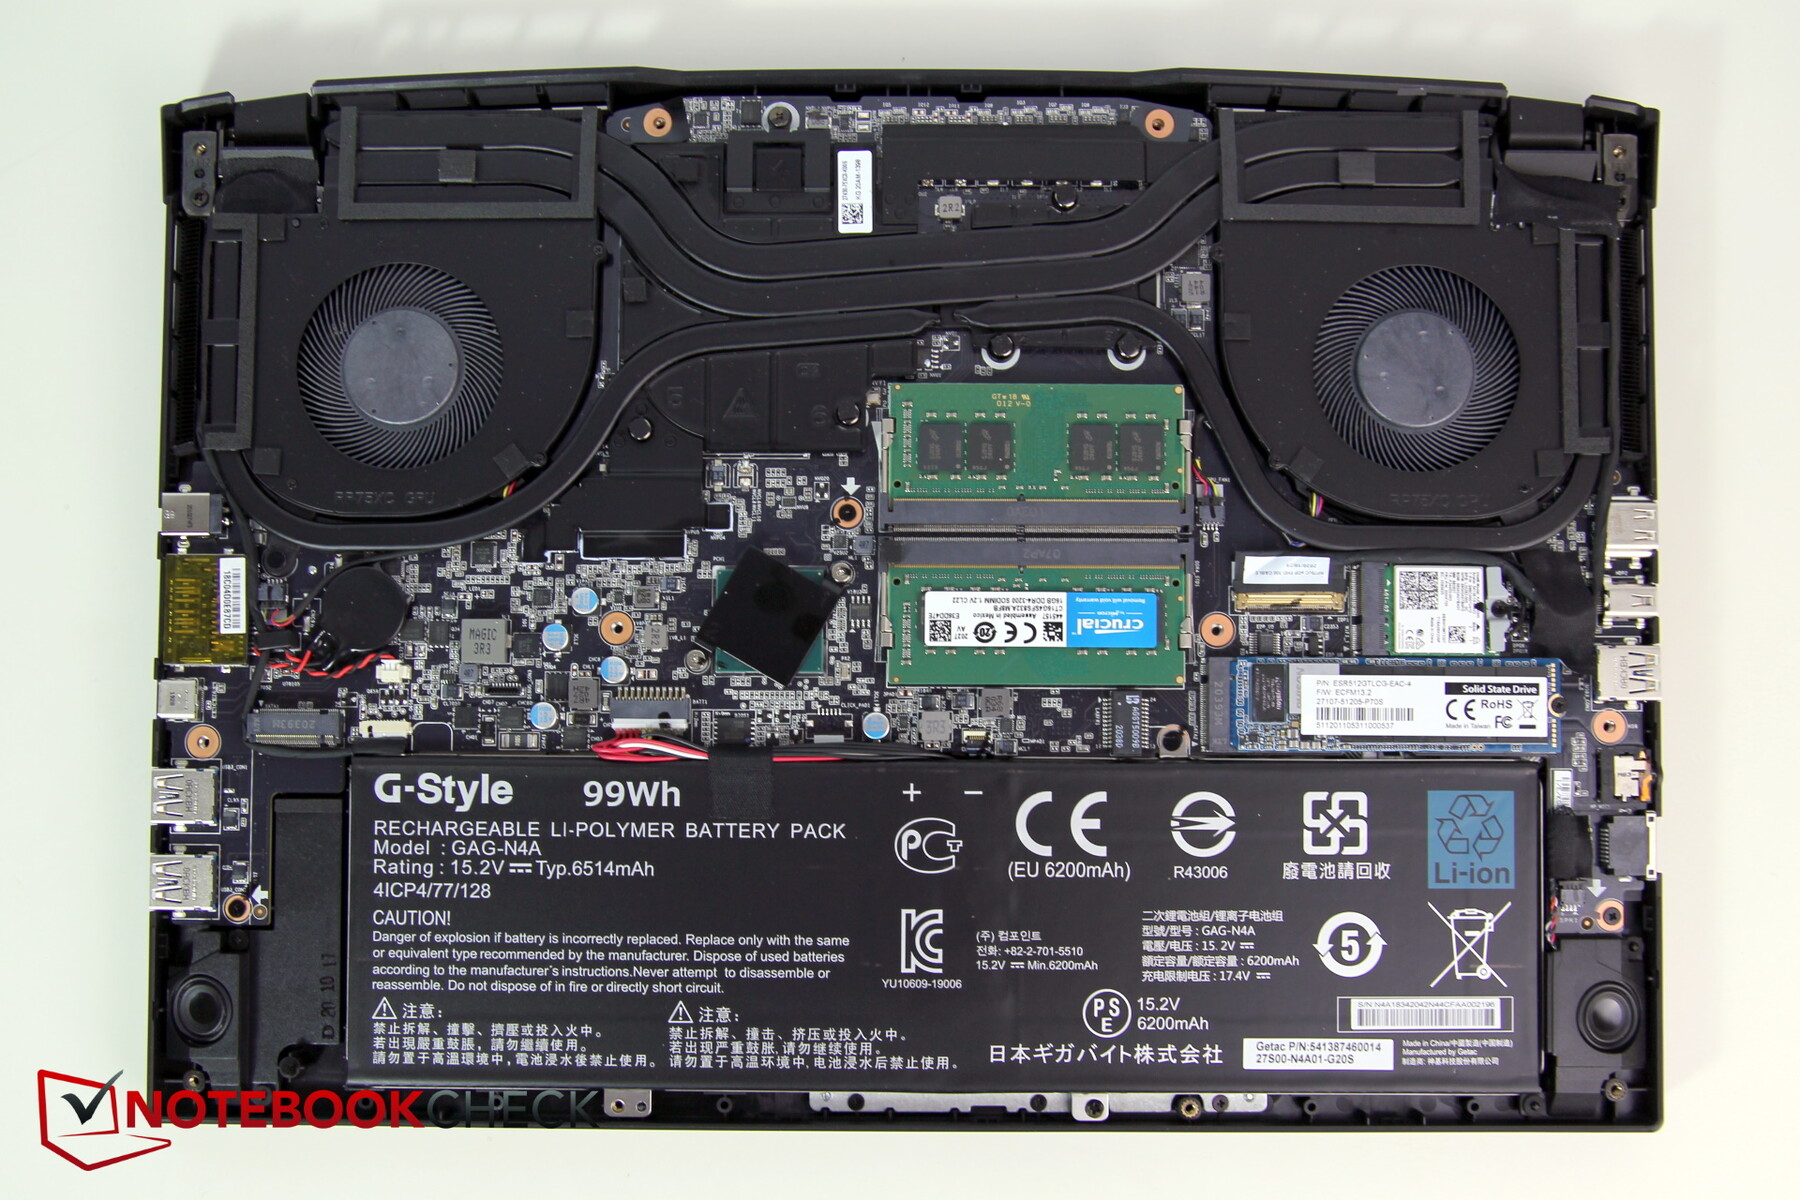
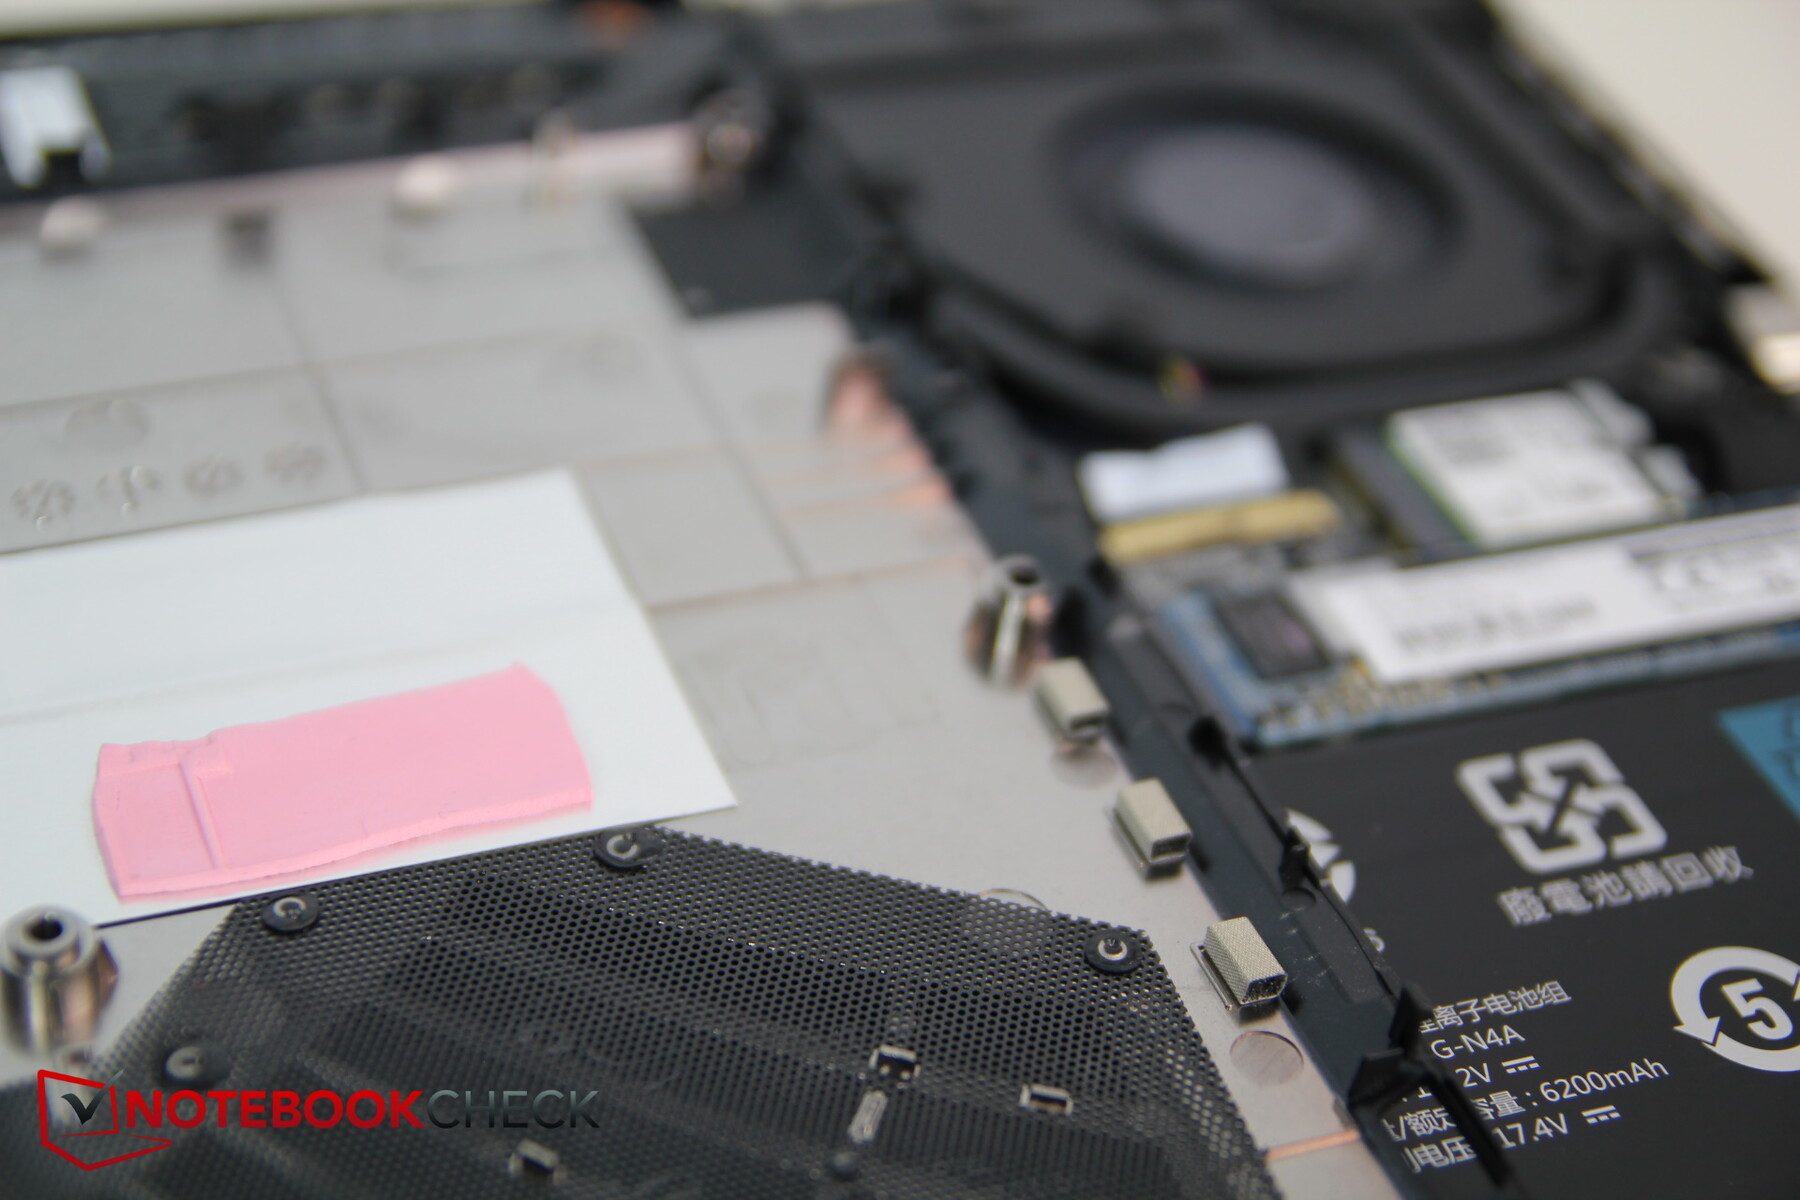
The cover of the base unit is held in place by 12 Torx T6 screws, two of which have been covered by a sticker. This means that the manufacturer can tell if somebody has opened the device by the broken stickers.
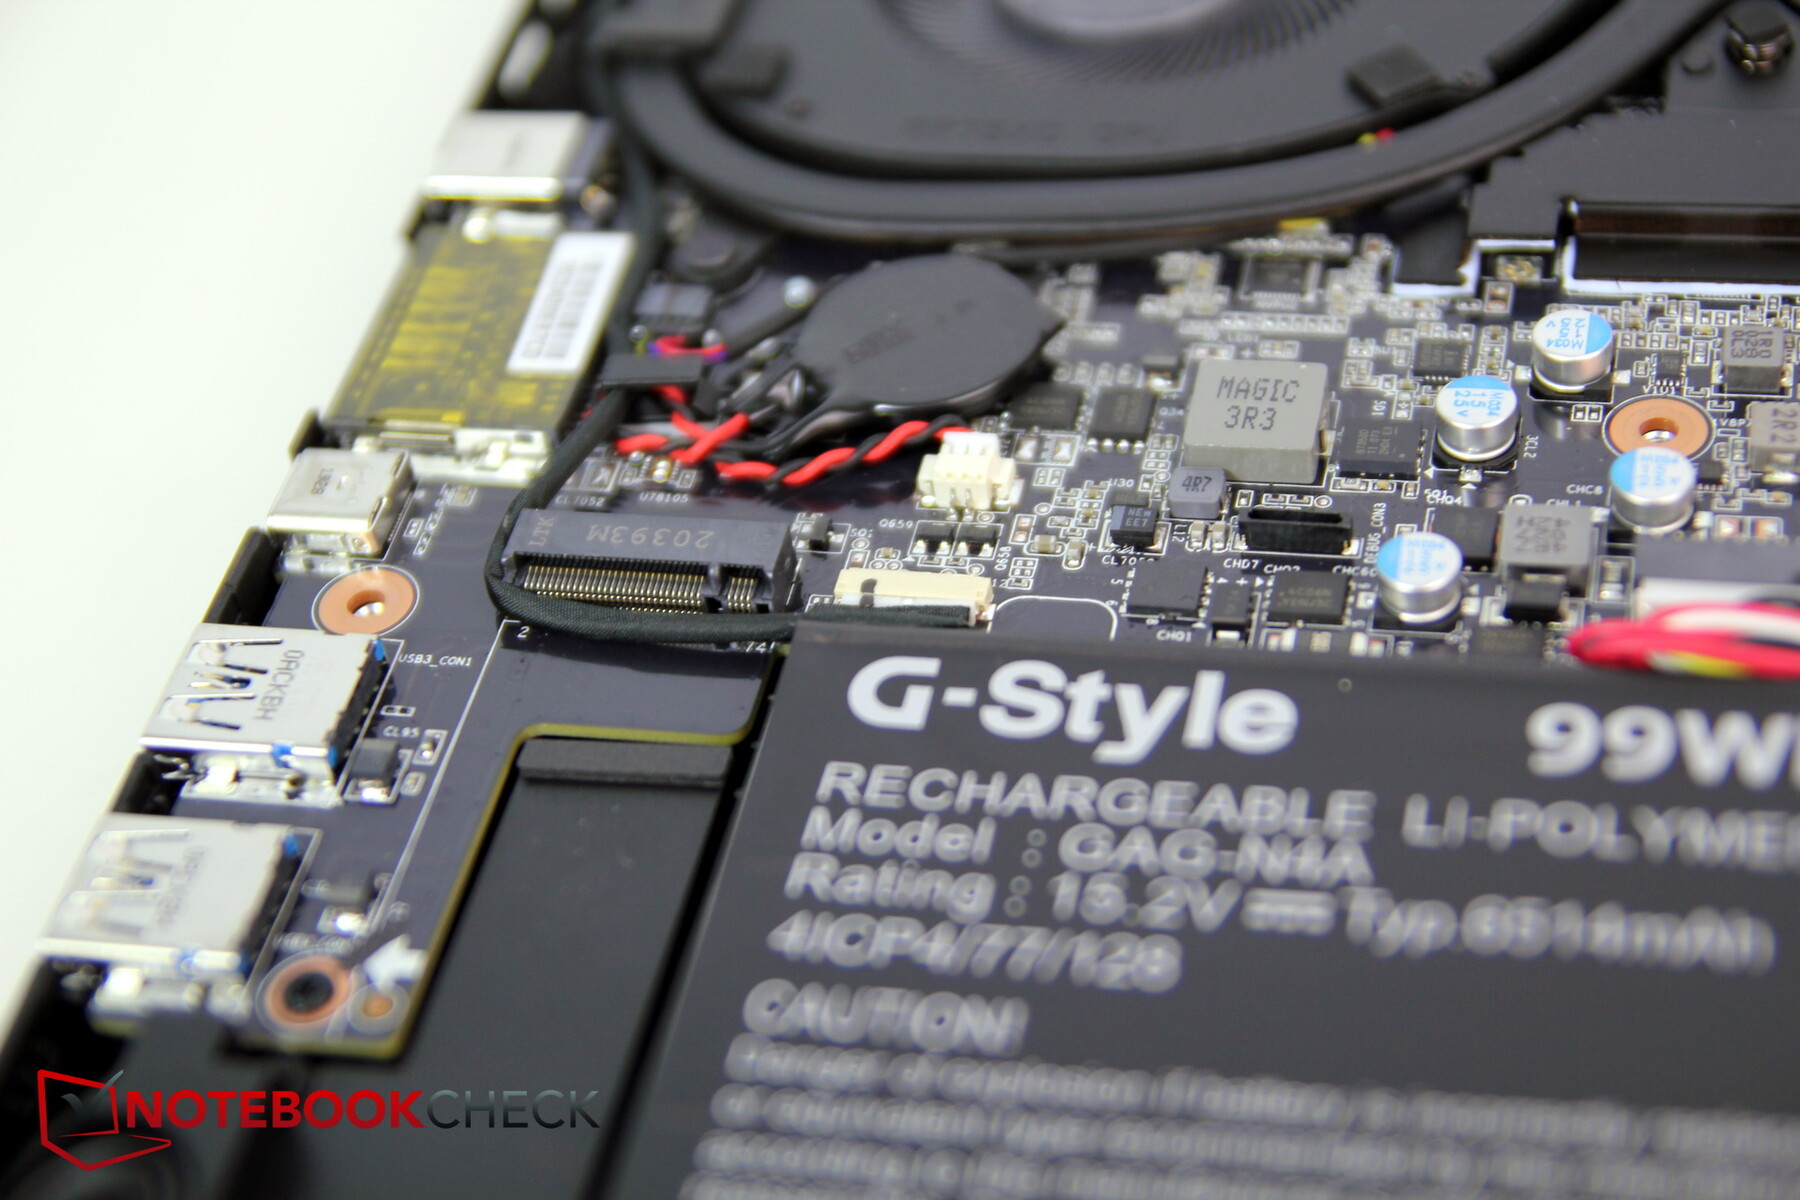
Lifting the cover off is very easy once the screws have been removed and does not require any tools - you can simply lift from the corners of the wrist rests. Users will then have access to the fans, the RAM module, the two SSD slots, the Wi-Fi module, the battery and other components. This makes the Aorus 15G very maintenance friendly.
Warranty
The manufacturer now grants 2 years warranty on all Aorus laptops.
Input Devices - Fusion instead of mechanical keyboard
Keyboard
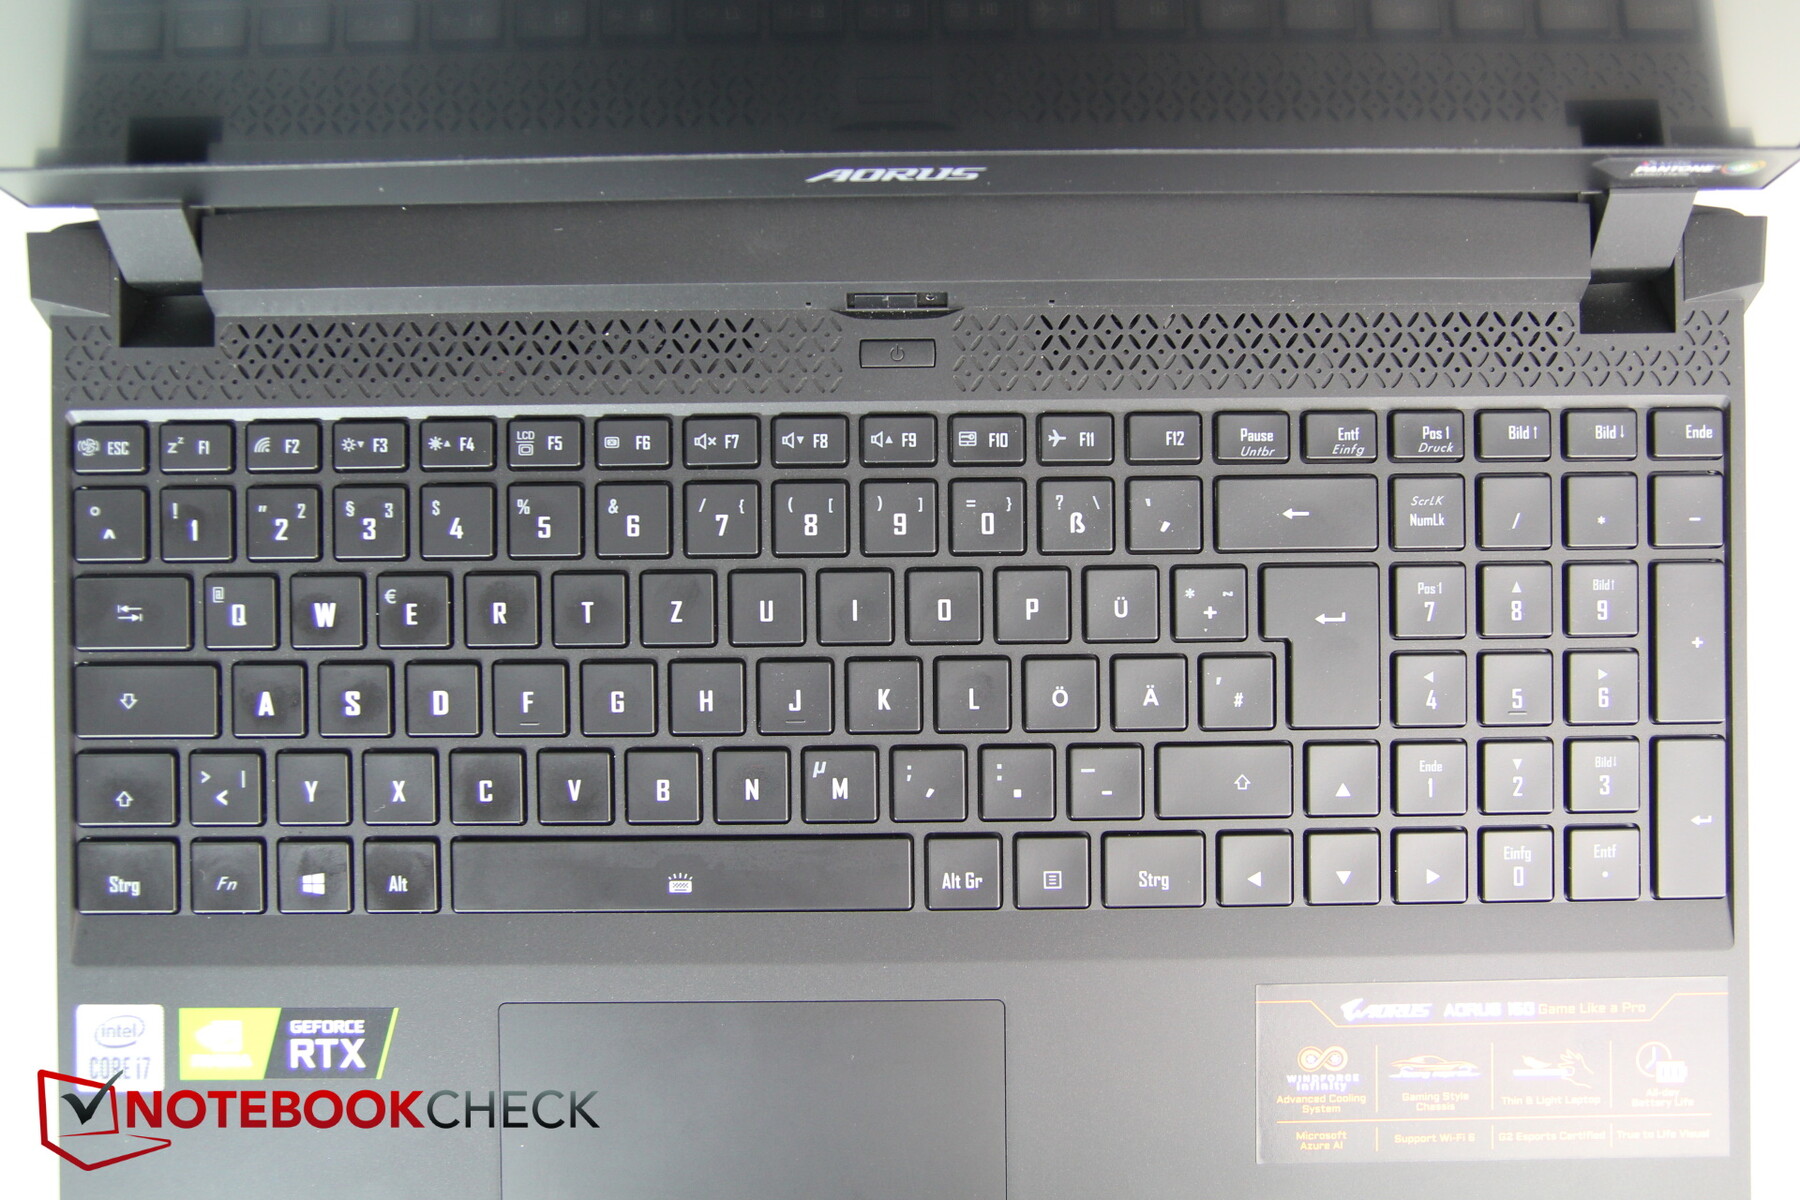
The great mechanical keyboard that the predecessor was equipped with is gone. Gigabyte has decided to equip this year's Aorus 15G with a fusion keyboard with per-key RGB backlighting, presumably for cost reasons. The latter can be very helpful as it can, for example, display all keys that can be used with the fn key when this key is pressed. The color of the backlighting can be customized for each individual key and offers two levels of brightness.
The keys themselves are on the small side at around 14.5 x 14.5 mm (~0.57 x 0.57 in), but at least provides enough space for a number pad on the side. Travel is not particularly long but acceptable. There is a gap of around 3 mm (~0.12 in) between all keys and typing is quick and comfortable. The keyboard clatter is very moderate and the layout is tidy. While the arrow keys are not separated from the rest of the keyboard, they are fully sized. The f keys are only half as high and don't sit tight so you can see the mechanics underneath.
Touchpad
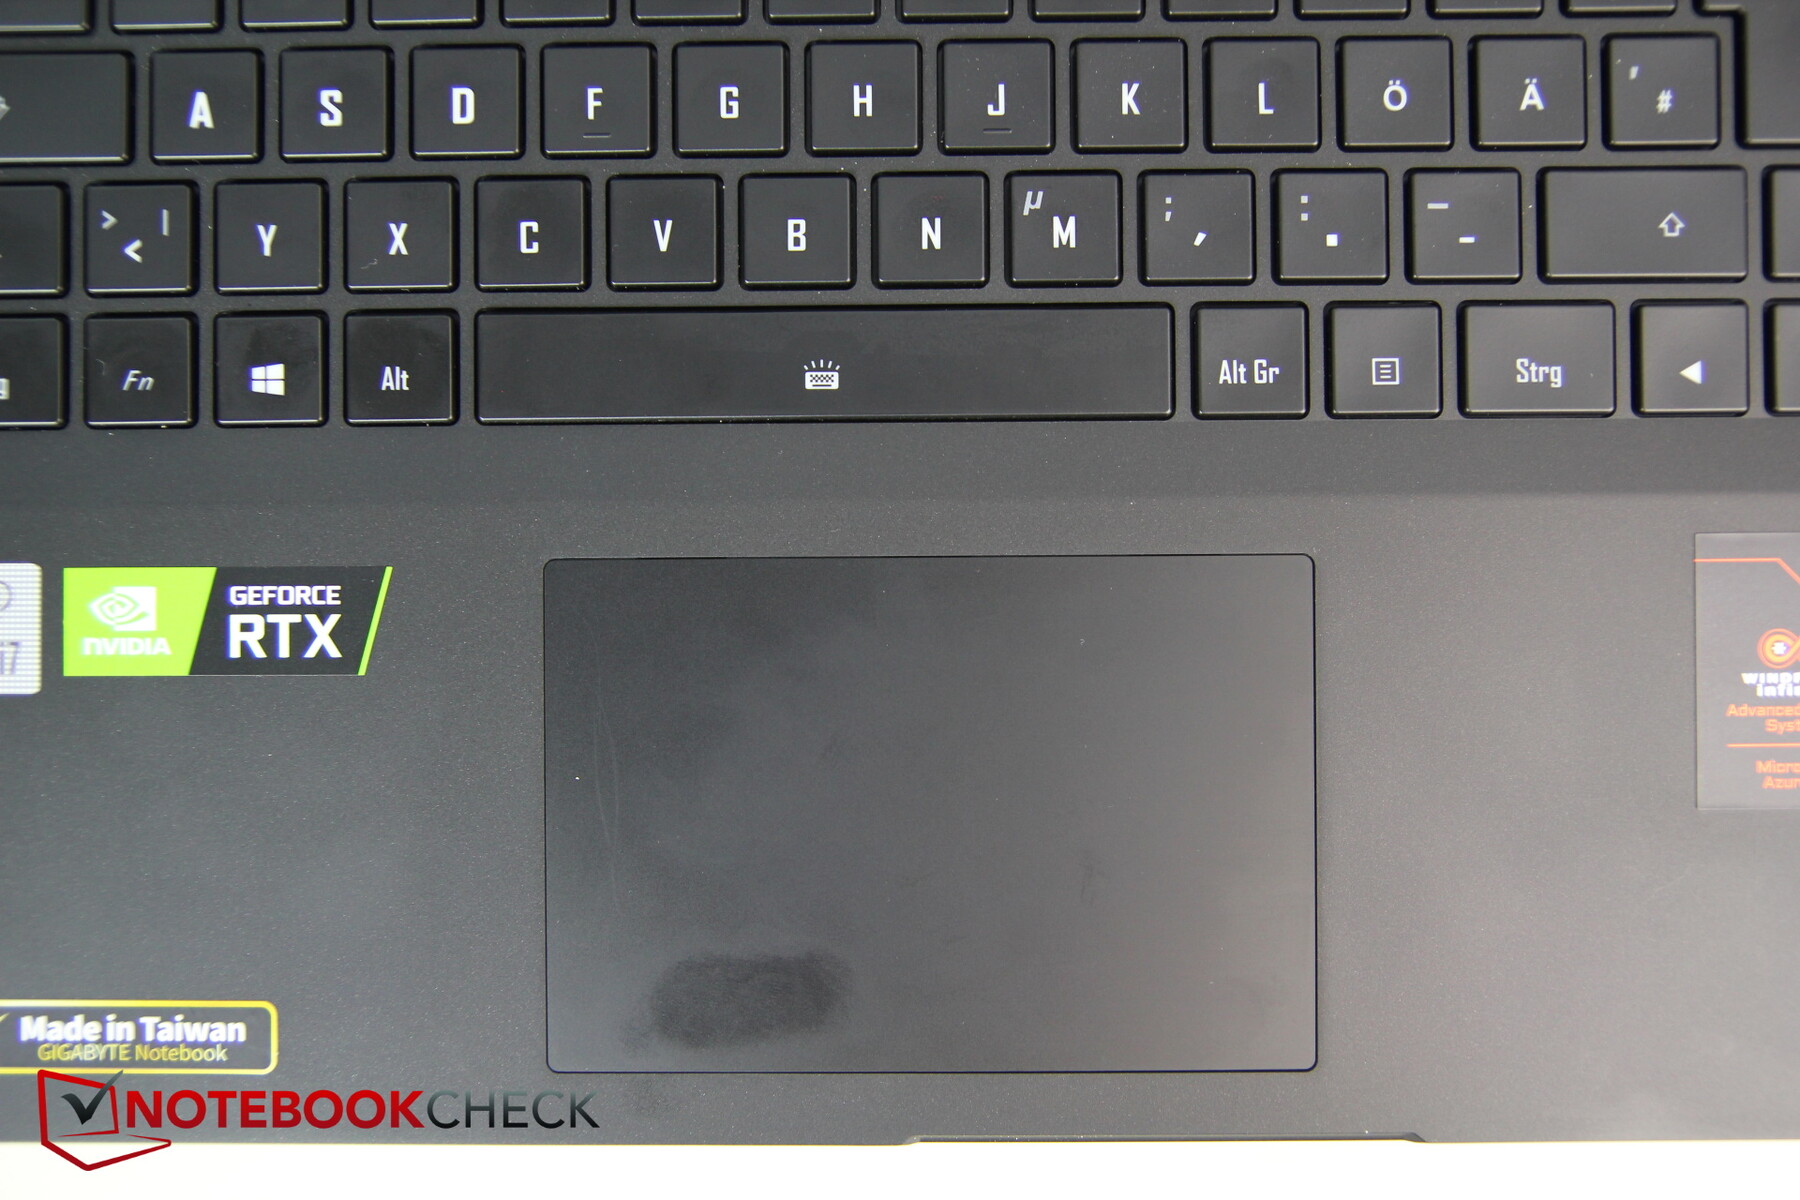
The touchpad (10.6 x 7.1 cm/~4.2 x 2.8 in) has been pushed towards the left due to the number pad and is positioned exactly below the keyboard. The surface offers good gliding capabilities, even when moving slowly. Extremely slow movements do not trigger cursor movements, however.
The integrated keys have a fairly short travel but significant feedback. They trigger cursor clicks reliably and aren't too loud. Overall, the quality is good but not outstanding.
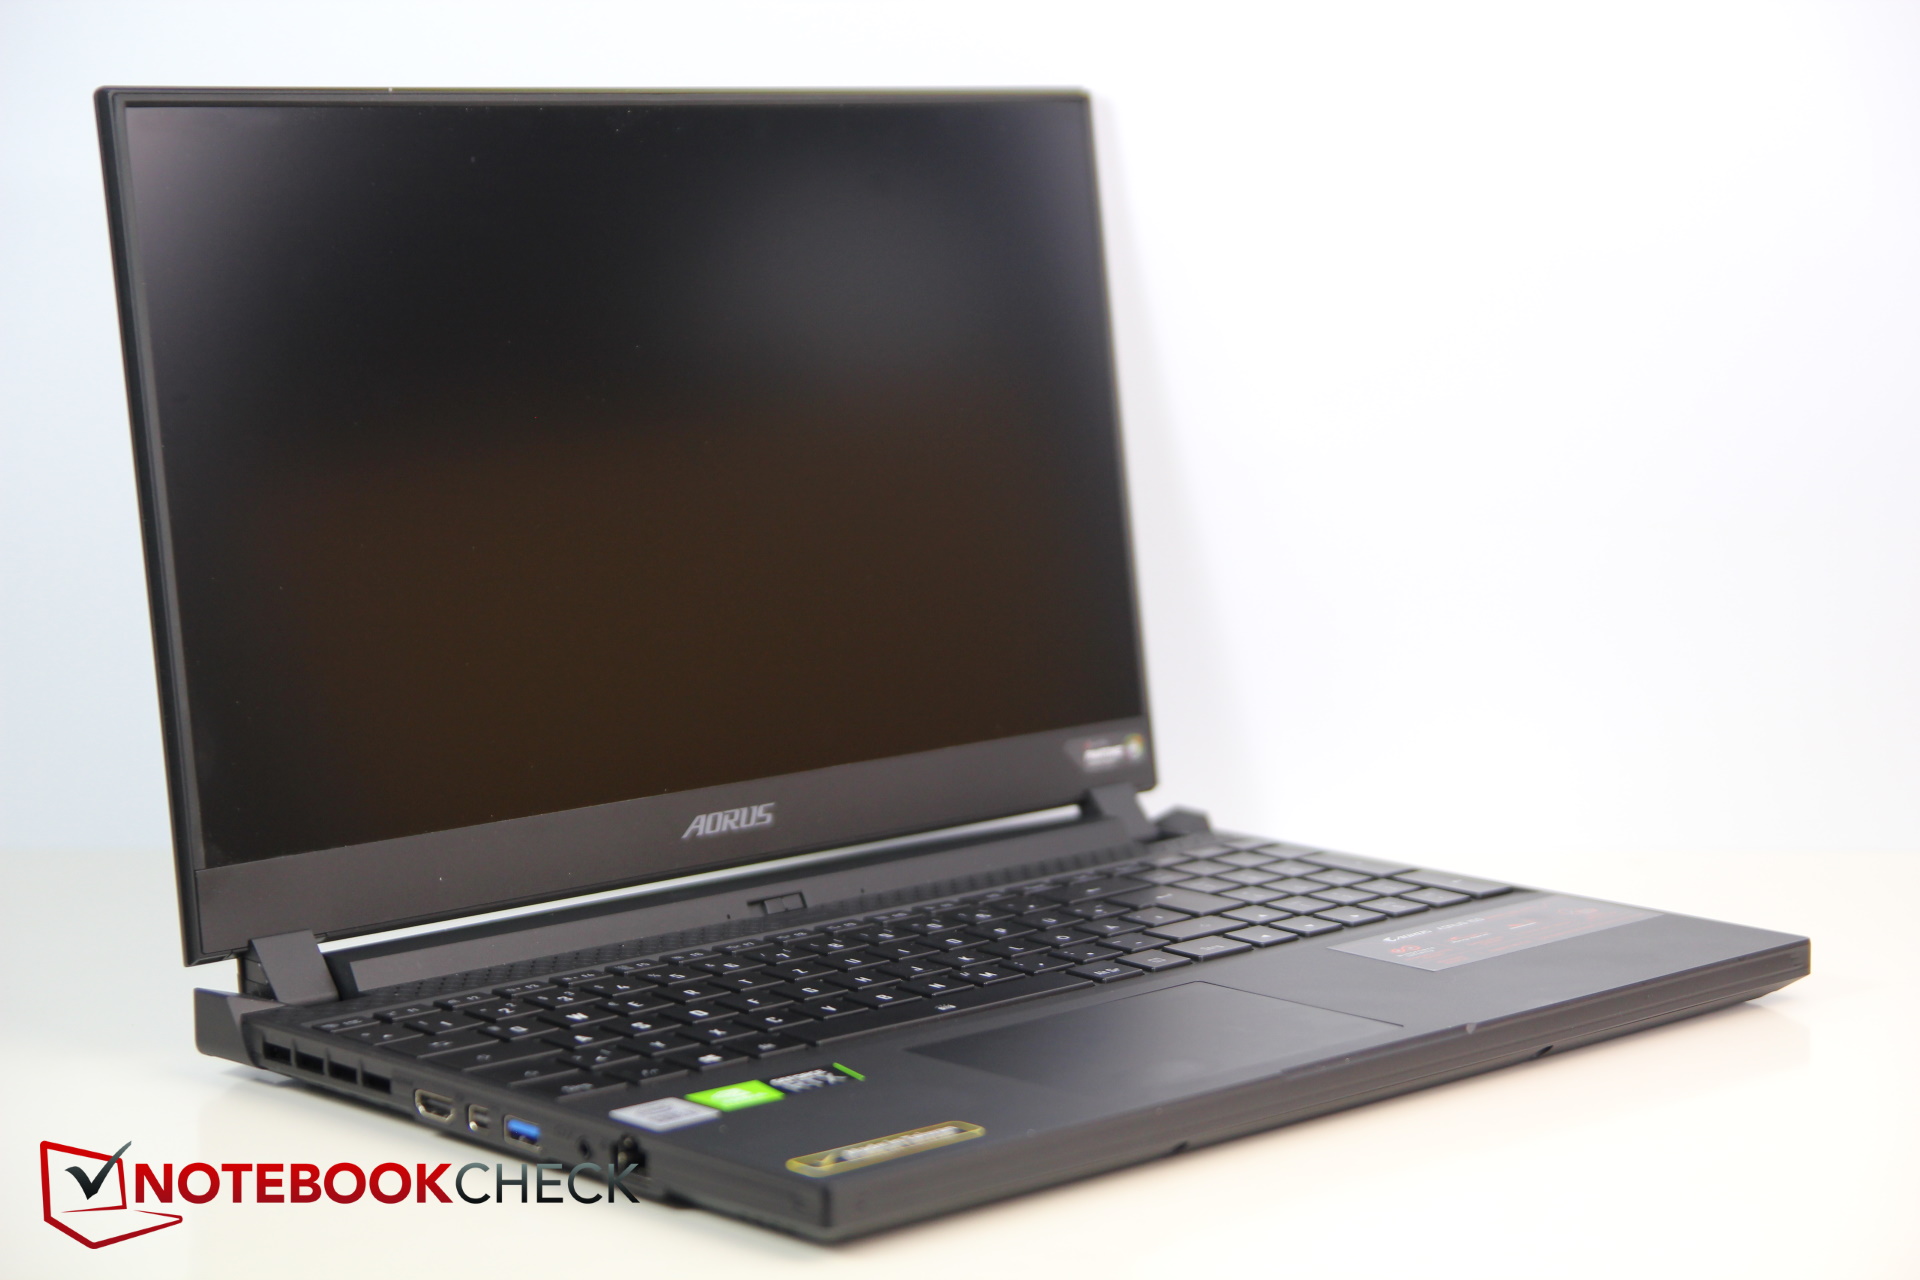
Display - slight improvements
The display is exactly the same 1080p model with 240 Hz from Sharp that was used in the predecessor. No other panels, for example 4K options, are available. Surprisingly, several values have nonetheless improved, although this does not have a significant impact on the overall performance of the display. The average brightness has increased by 9 percent to 270 nits and only just misses our magic threshold of a minimum of 300 nits. The brightness distribution continues to be good at 89 percent.
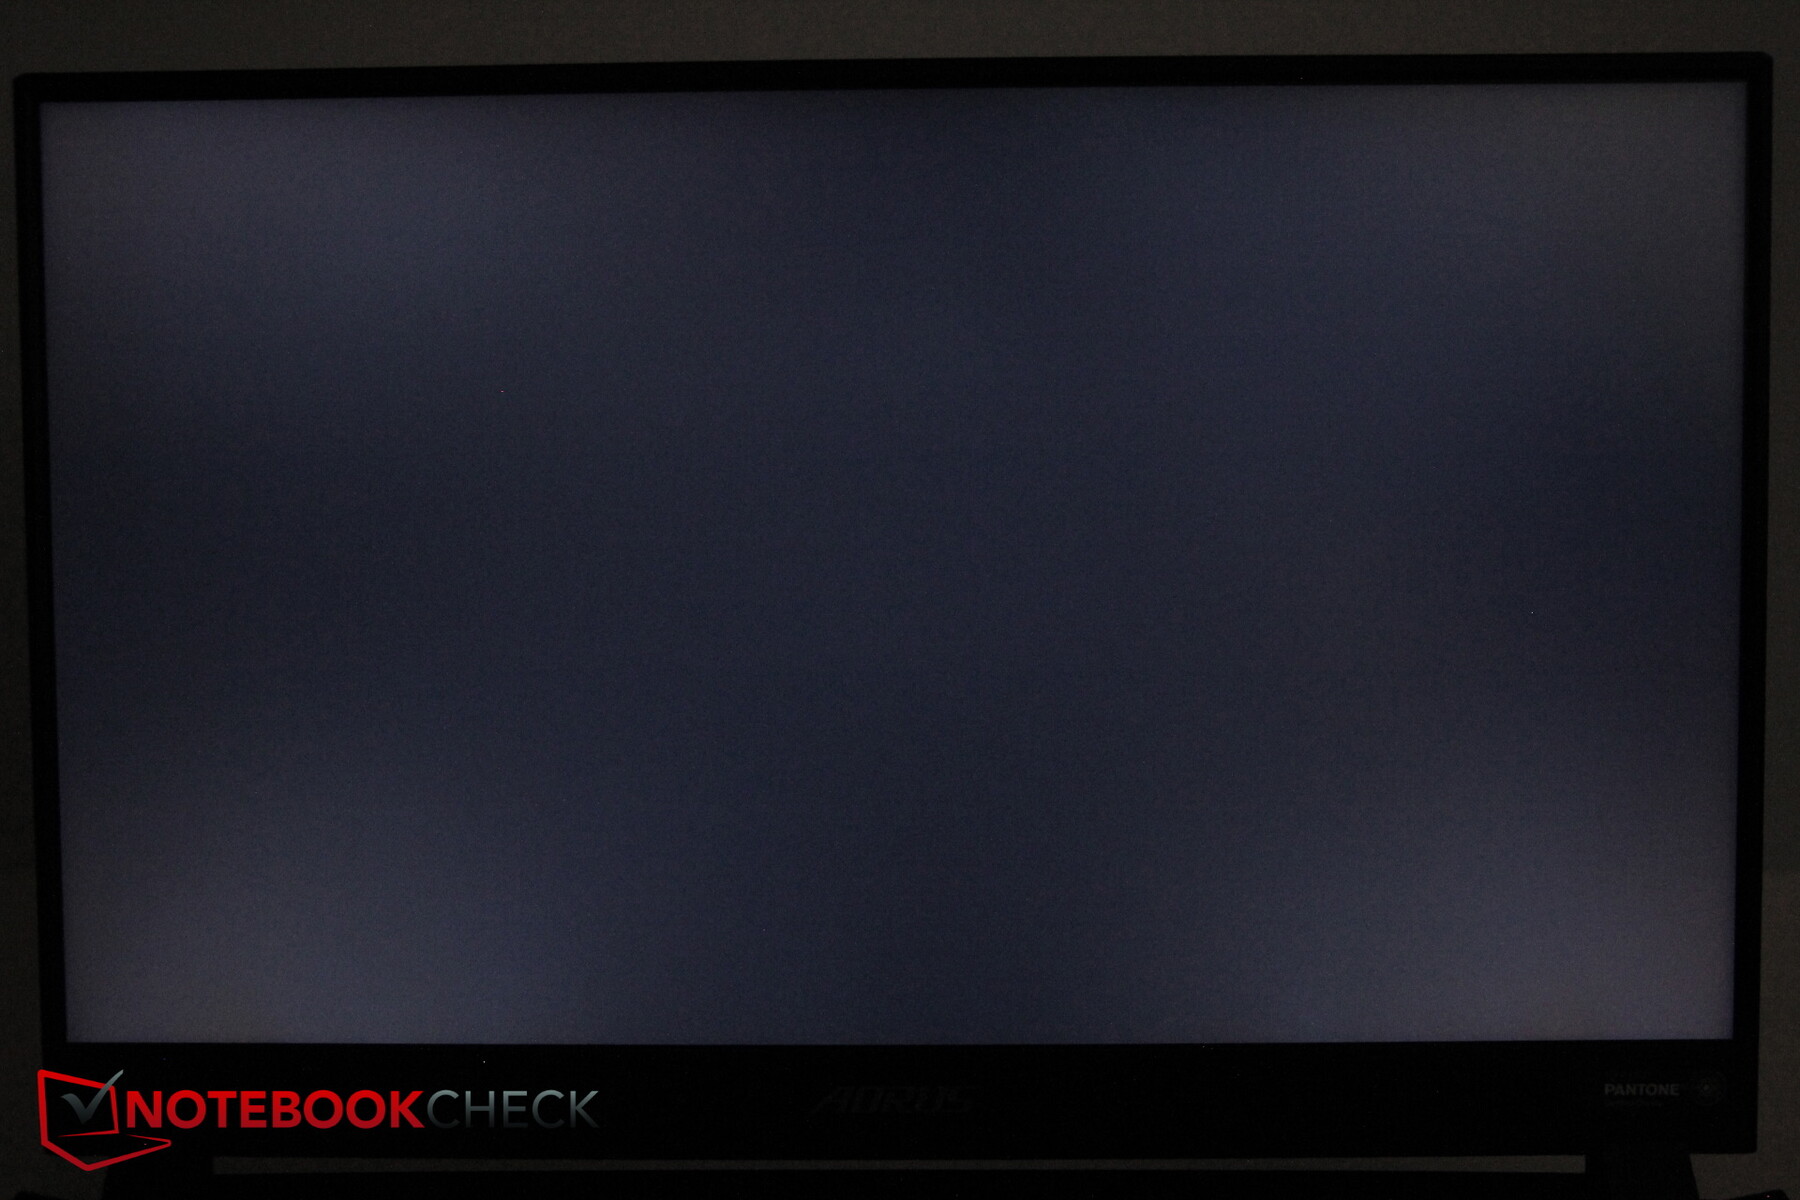
There is some backlight bleeding along the edges and corners, but this is so minimal that it should rarely be noticed.
| |||||||||||||||||||||||||
Brightness Distribution: 89 %
Center on Battery: 288 cd/m²
Contrast: 1152:1 (Black: 0.25 cd/m²)
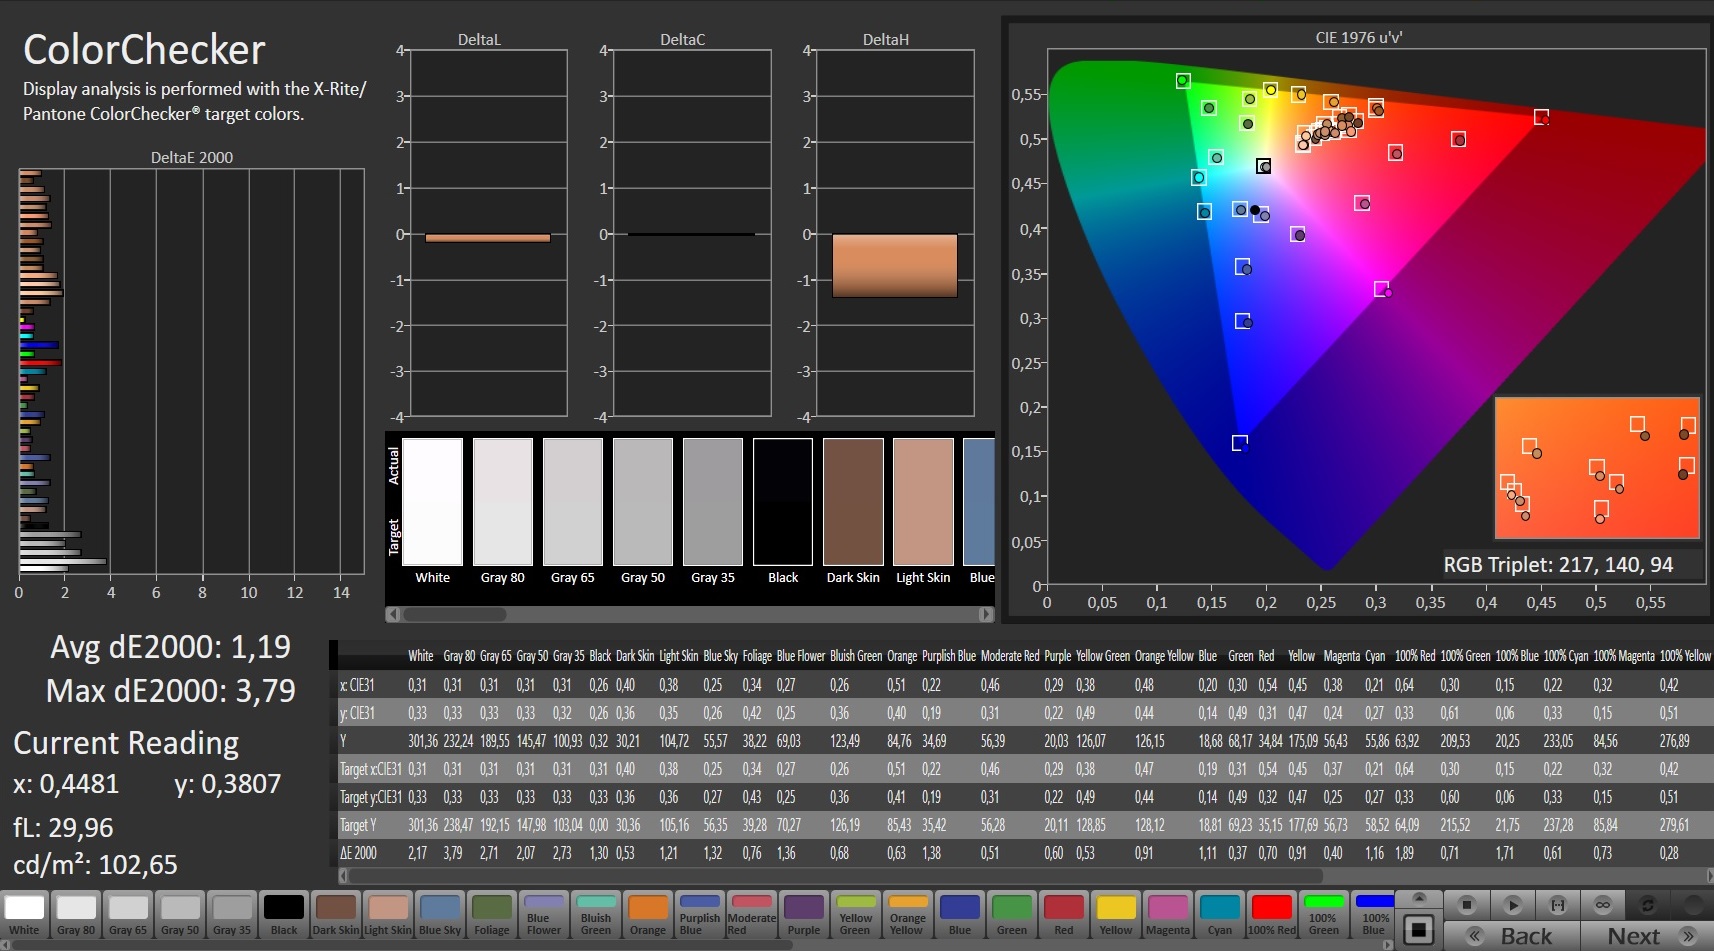
ΔE ColorChecker Calman: 1.19 | ∀{0.5-29.43 Ø4.83}
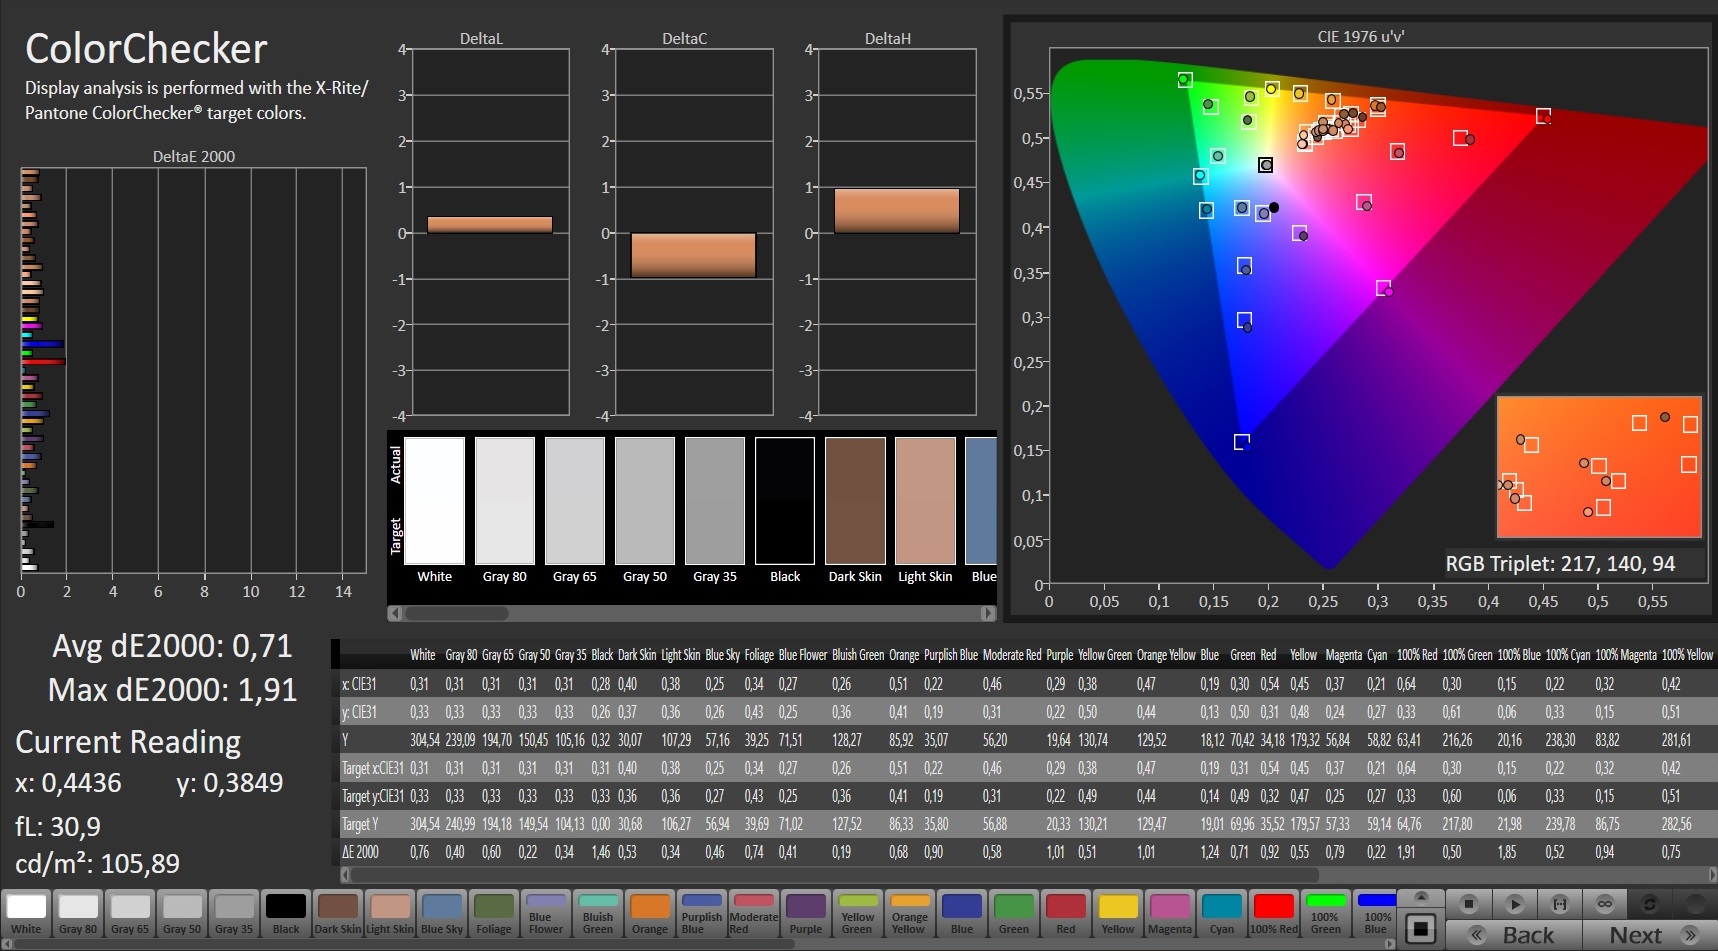
calibrated: 0.71
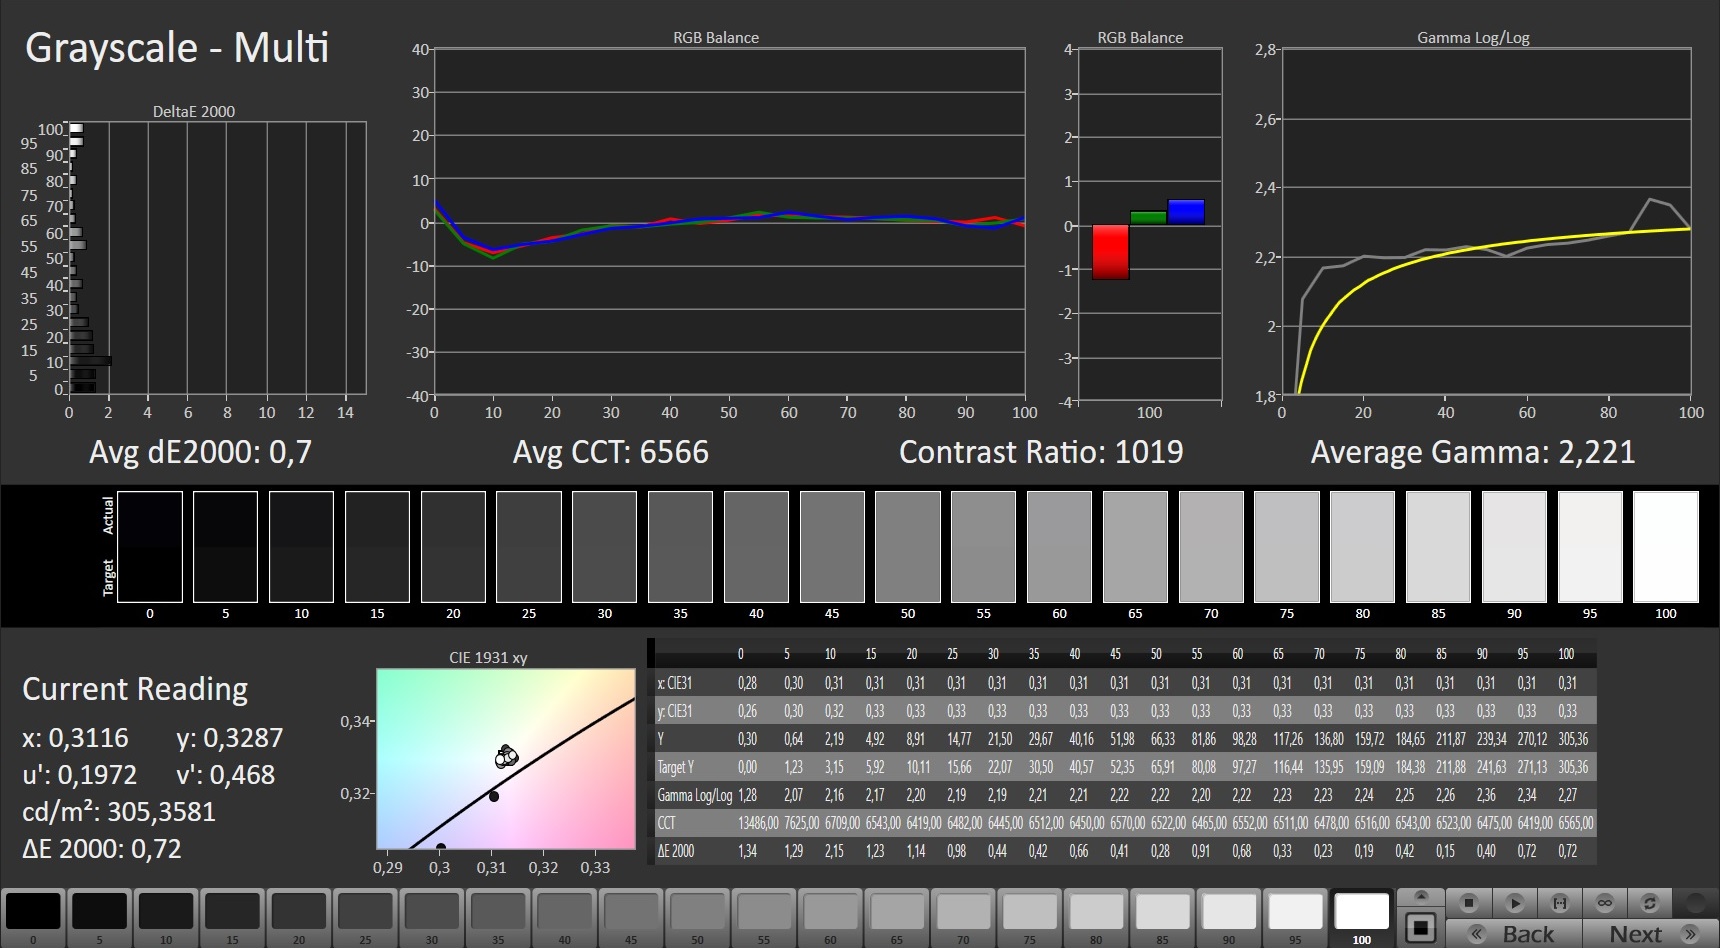
ΔE Greyscale Calman: 1.6 | ∀{0.09-98 Ø5.1}
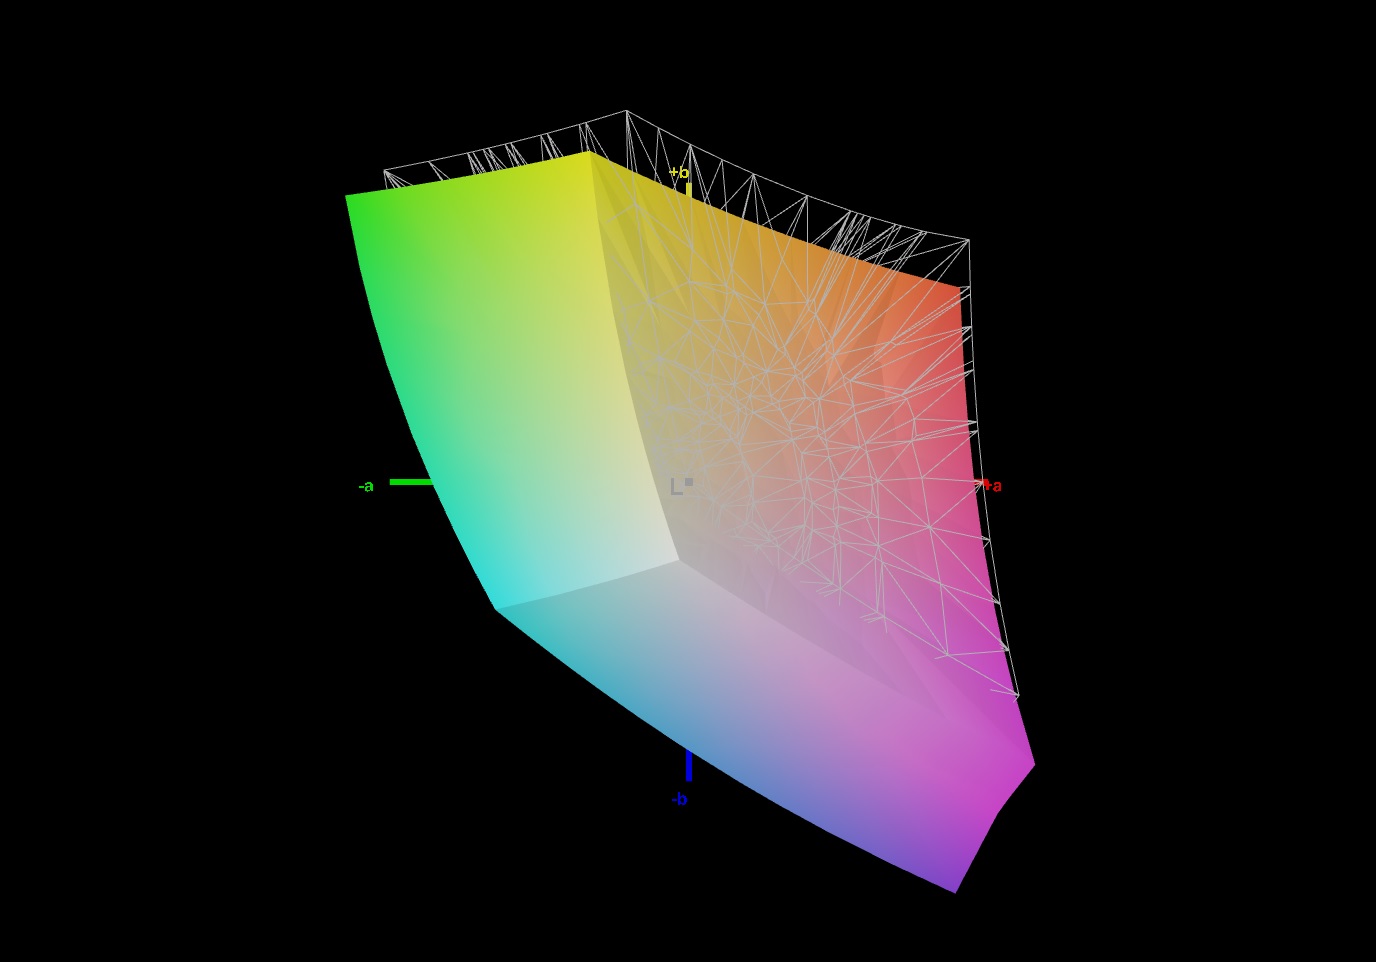
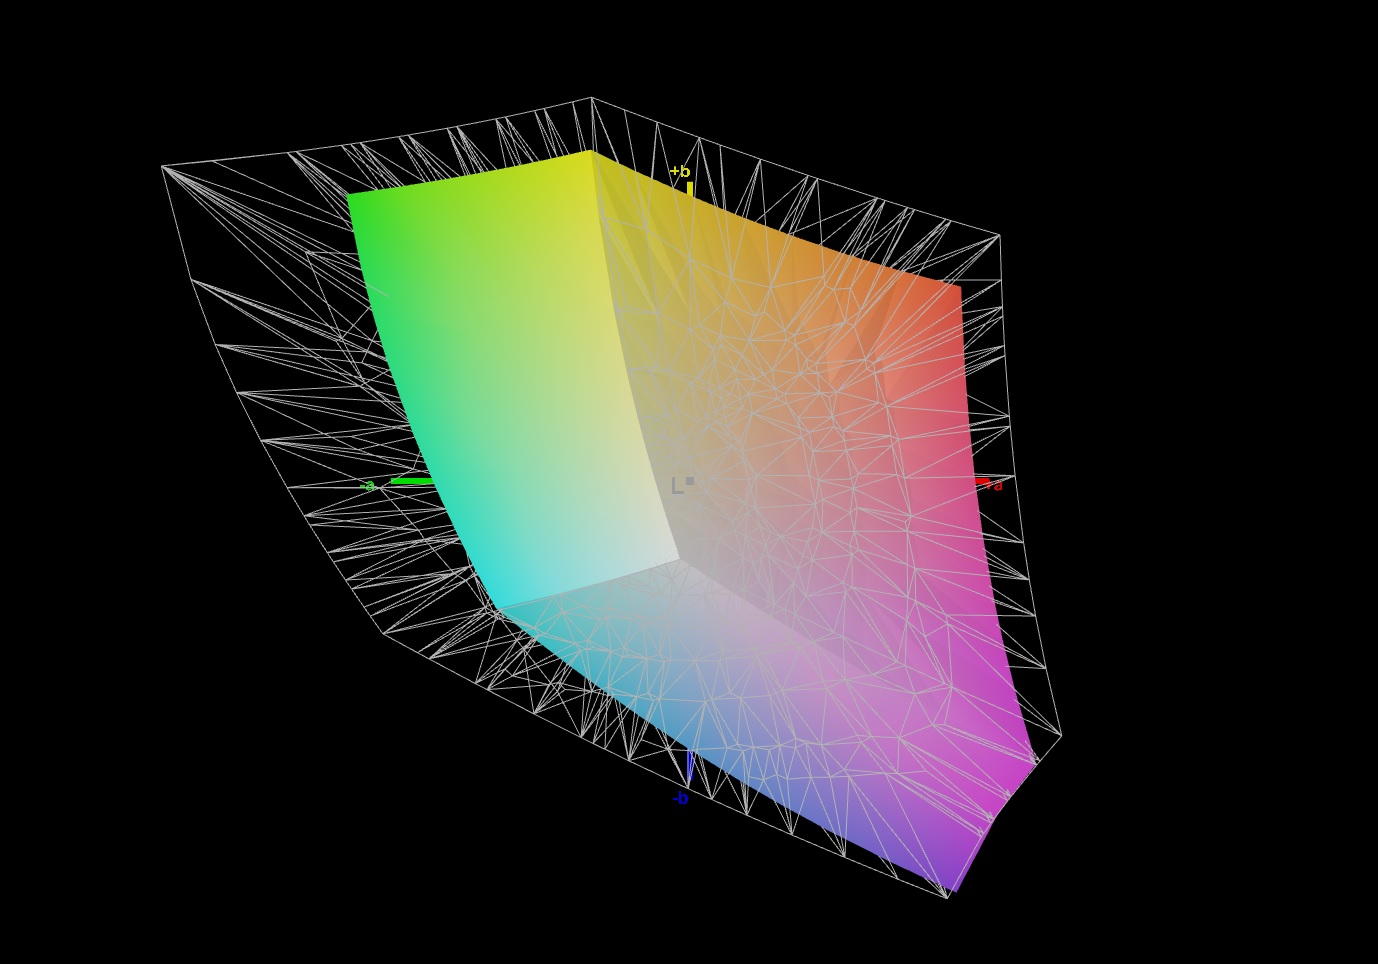
90% sRGB (Argyll 1.6.3 3D)
67% AdobeRGB 1998 (Argyll 1.6.3 3D)
67.1% AdobeRGB 1998 (Argyll 3D)
97.5% sRGB (Argyll 3D)
65.6% Display P3 (Argyll 3D)
Gamma: 2.229
CCT: 6539 K
| Aorus 15G XC Sharp LQ156M1JW03, IPS, 1920x1080, 15.6" | Aorus 15G XB Sharp LQ156M1JW03, IGZO, 1920x1080, 15.6" | Asus TUF Dash F15 FX516PR LQ156M1JW26 (SHP1532), IPS, 1920x1080, 15.6" | Razer Blade 15 RTX 2080 Super Max-Q AU Optronics B156HAN12.0, IPS, 1920x1080, 15.6" | SCHENKER XMG Neo 17 (Early 2021, RTX 3070, 5800H) BOE NE173QHM-NY2 (BOE0977), IPS, 2560x1440, 17.3" | SCHENKER Key 15 Comet Lake Panda LM156LF-1F02, IPS, 1920x1080, 15.6" | |
|---|---|---|---|---|---|---|
| Display | 1% | 1% | 5% | 5% | 1% | |
| Display P3 Coverage | 65.6 | 67.2 2% | 66.9 2% | 70.2 7% | 70.5 7% | 67.2 2% |
| sRGB Coverage | 97.5 | 97.8 0% | 98.1 1% | 99 2% | 99.5 2% | 96.2 -1% |
| AdobeRGB 1998 Coverage | 67.1 | 68 1% | 67.9 1% | 71.4 6% | 71.8 7% | 68.7 2% |
| Response Times | -42% | -15% | 22% | -40% | 0% | |
| Response Time Grey 50% / Grey 80% * | 9.6 ? | 16 ? -67% | 12 ? -25% | 6 ? 37% | 16.8 ? -75% | 10 ? -4% |
| Response Time Black / White * | 9.6 ? | 11.2 ? -17% | 10 ? -4% | 9 ? 6% | 10 ? -4% | 9.2 ? 4% |
| PWM Frequency | 24040 ? | 23580 ? | 23580 ? | |||
| Screen | -7% | -28% | -20% | -25% | -119% | |
| Brightness middle | 288 | 264 -8% | 286 -1% | 347 20% | 410 42% | 300 4% |
| Brightness | 270 | 248 -8% | 275 2% | 328 21% | 381 41% | 281 4% |
| Brightness Distribution | 89 | 89 0% | 91 2% | 89 0% | 88 -1% | 80 -10% |
| Black Level * | 0.25 | 0.3 -20% | 0.25 -0% | 0.285 -14% | 0.37 -48% | 0.29 -16% |
| Contrast | 1152 | 880 -24% | 1144 -1% | 1218 6% | 1108 -4% | 1034 -10% |
| Colorchecker dE 2000 * | 1.19 | 1.21 -2% | 2.43 -104% | 2.35 -97% | 2.55 -114% | 5.39 -353% |
| Colorchecker dE 2000 max. * | 3.79 | 3.07 19% | 6.33 -67% | 4.15 -9% | 4.33 -14% | 14.35 -279% |
| Colorchecker dE 2000 calibrated * | 0.71 | 0.92 -30% | 0.83 -17% | 1.16 -63% | 1.28 -80% | 1.73 -144% |
| Greyscale dE 2000 * | 1.6 | 1.6 -0% | 3.5 -119% | 3.04 -90% | 3.4 -113% | 9.8 -513% |
| Gamma | 2.229 99% | 2.192 100% | 2.32 95% | 2.35 94% | 2.275 97% | 2.019 109% |
| CCT | 6539 99% | 6340 103% | 7145 91% | 6658 98% | 6637 98% | 8174 80% |
| Color Space (Percent of AdobeRGB 1998) | 67 | 68 1% | 68 1% | 65 -3% | 72 7% | 69 3% |
| Color Space (Percent of sRGB) | 90 | 90 0% | 91 1% | 99 10% | 95 6% | 92 2% |
| Total Average (Program / Settings) | -16% /
-10% | -14% /
-21% | 2% /
-10% | -20% /
-21% | -39% /
-82% |
* ... smaller is better
The biggest improvements are in terms of black value and contrast. The latter is above the 1000 mark now (new: 1152:1, old: 880:1). The "old" black value is about 20 percent lower than the value measured on today's test unit. The screen is still well calibrated ex-works, although this can be improved significantly, lowering color deviations to a minimum.
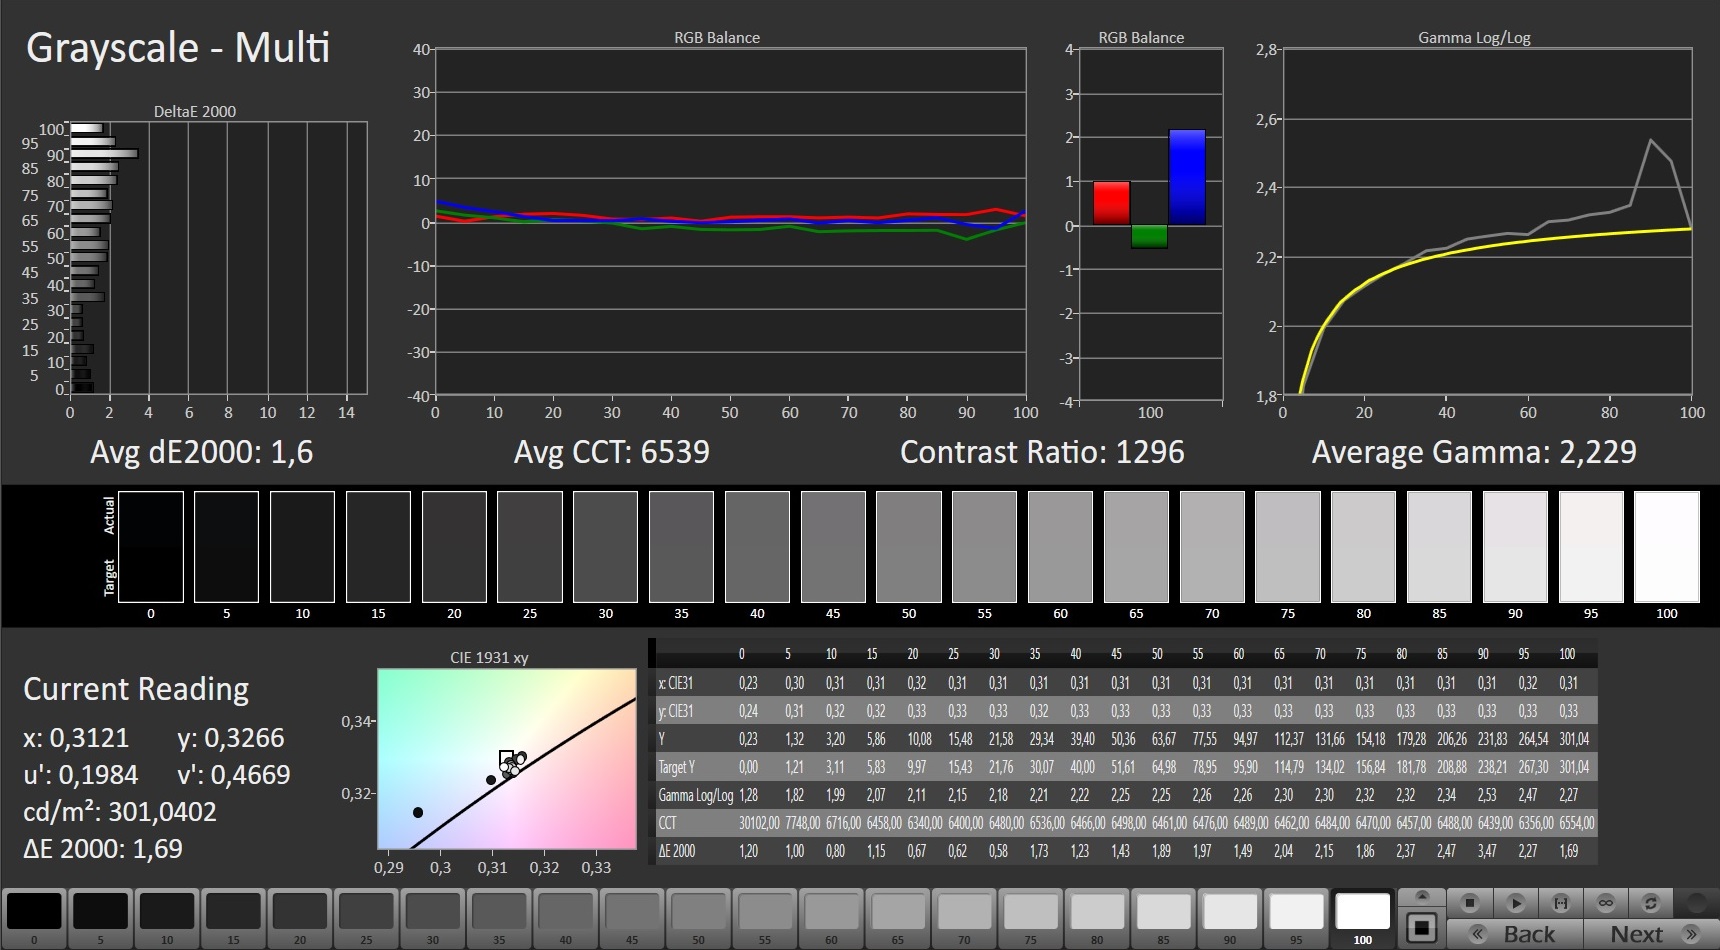
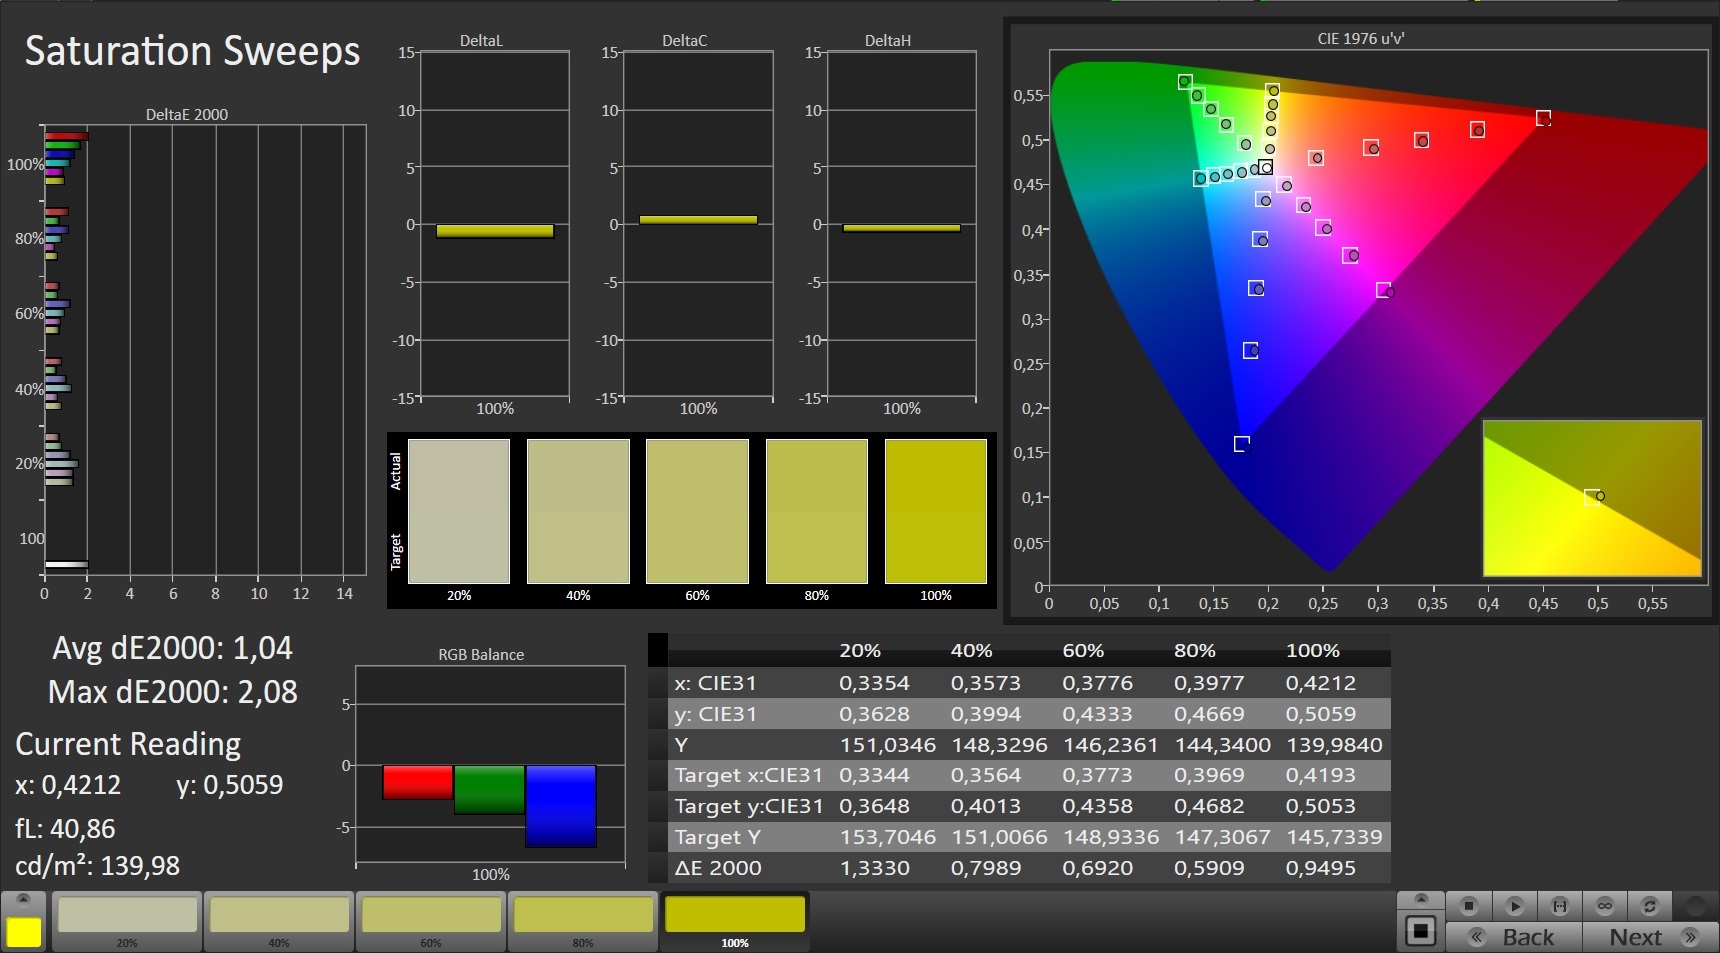
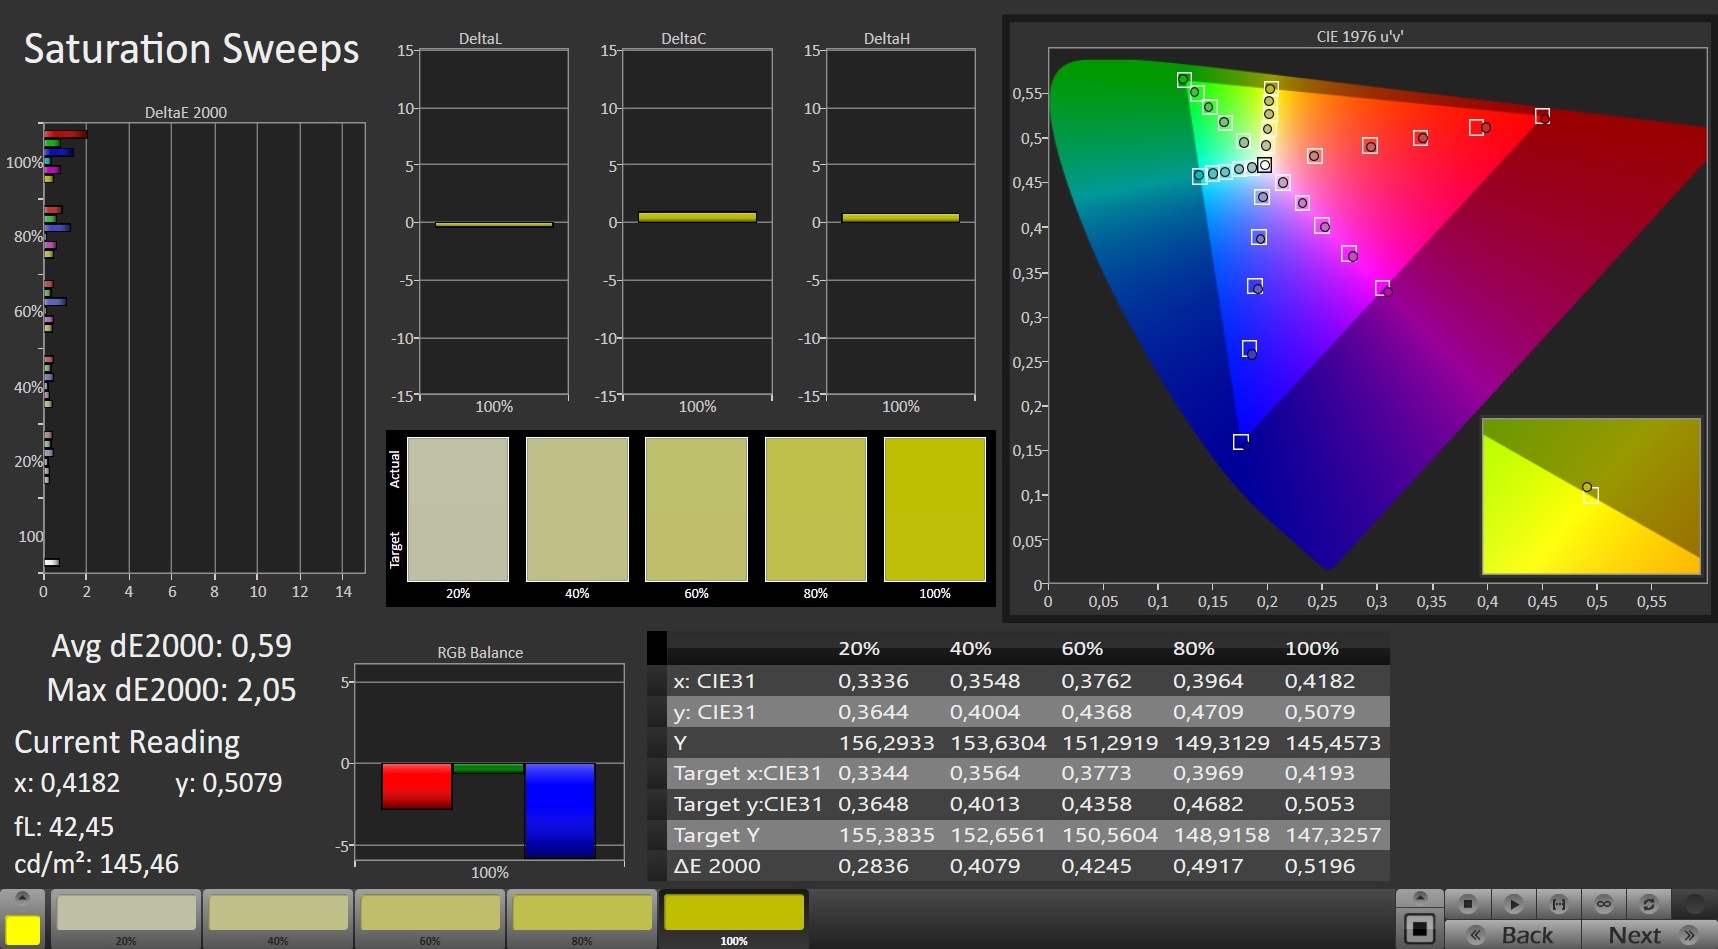
The panel covers 90 percent of the sRGB color space and 67 percent of AdobeRGB.
Interestingly enough, the response times have improved significantly, making the screen even better for fast games.
PWM causes flickering at brightness levels at and below 24 percent. Fortunately, the high frequency of around 24000 Hz means that this should not be an issue even for sensitive users. The screen will also seldomly be used at such low brightness levels.
Display Response Times
| ↔ Response Time Black to White | ||
|---|---|---|
| 9.6 ms ... rise ↗ and fall ↘ combined | ↗ 4.8 ms rise | 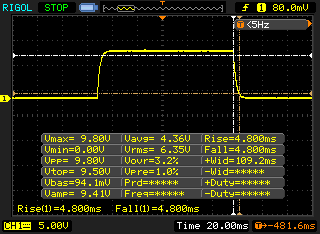 |
| ↘ 4.8 ms fall | ||
| The screen shows fast response rates in our tests and should be suited for gaming. In comparison, all tested devices range from 0.1 (minimum) to 240 (maximum) ms. » 24 % of all devices are better. This means that the measured response time is better than the average of all tested devices (20.5 ms). | ||
| ↔ Response Time 50% Grey to 80% Grey | ||
| 9.6 ms ... rise ↗ and fall ↘ combined | ↗ 5.2 ms rise | 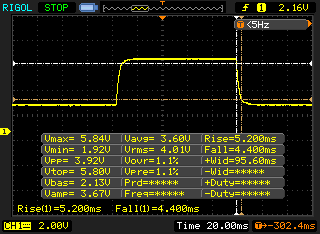 |
| ↘ 4.4 ms fall | ||
| The screen shows fast response rates in our tests and should be suited for gaming. In comparison, all tested devices range from 0.165 (minimum) to 636 (maximum) ms. » 21 % of all devices are better. This means that the measured response time is better than the average of all tested devices (32.1 ms). | ||
Screen Flickering / PWM (Pulse-Width Modulation)
| Screen flickering / PWM detected | 24040 Hz | ≤ 24 % brightness setting | 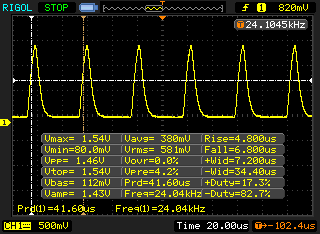 |
The display backlight flickers at 24040 Hz (worst case, e.g., utilizing PWM) Flickering detected at a brightness setting of 24 % and below. There should be no flickering or PWM above this brightness setting. The frequency of 24040 Hz is quite high, so most users sensitive to PWM should not notice any flickering. In comparison: 53 % of all tested devices do not use PWM to dim the display. If PWM was detected, an average of 8327 (minimum: 5 - maximum: 343500) Hz was measured. | |||
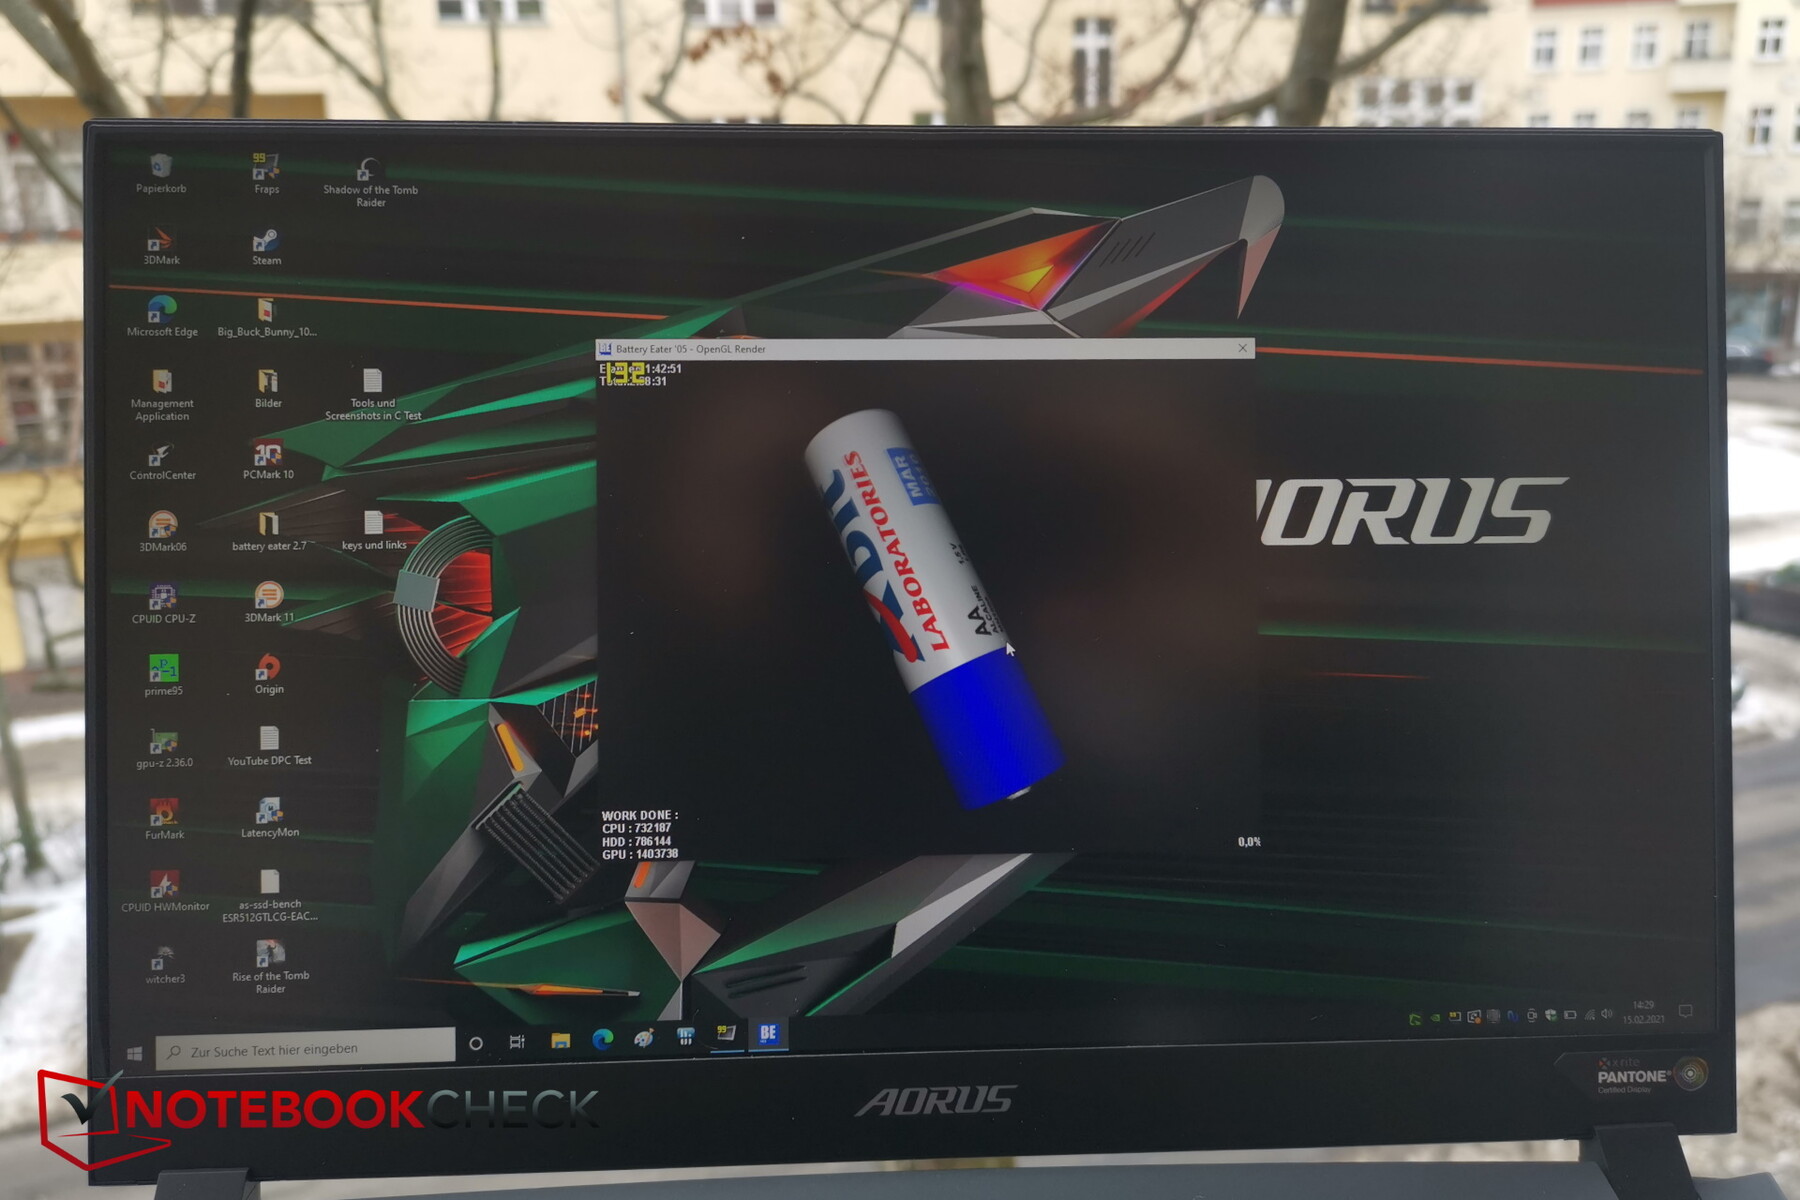
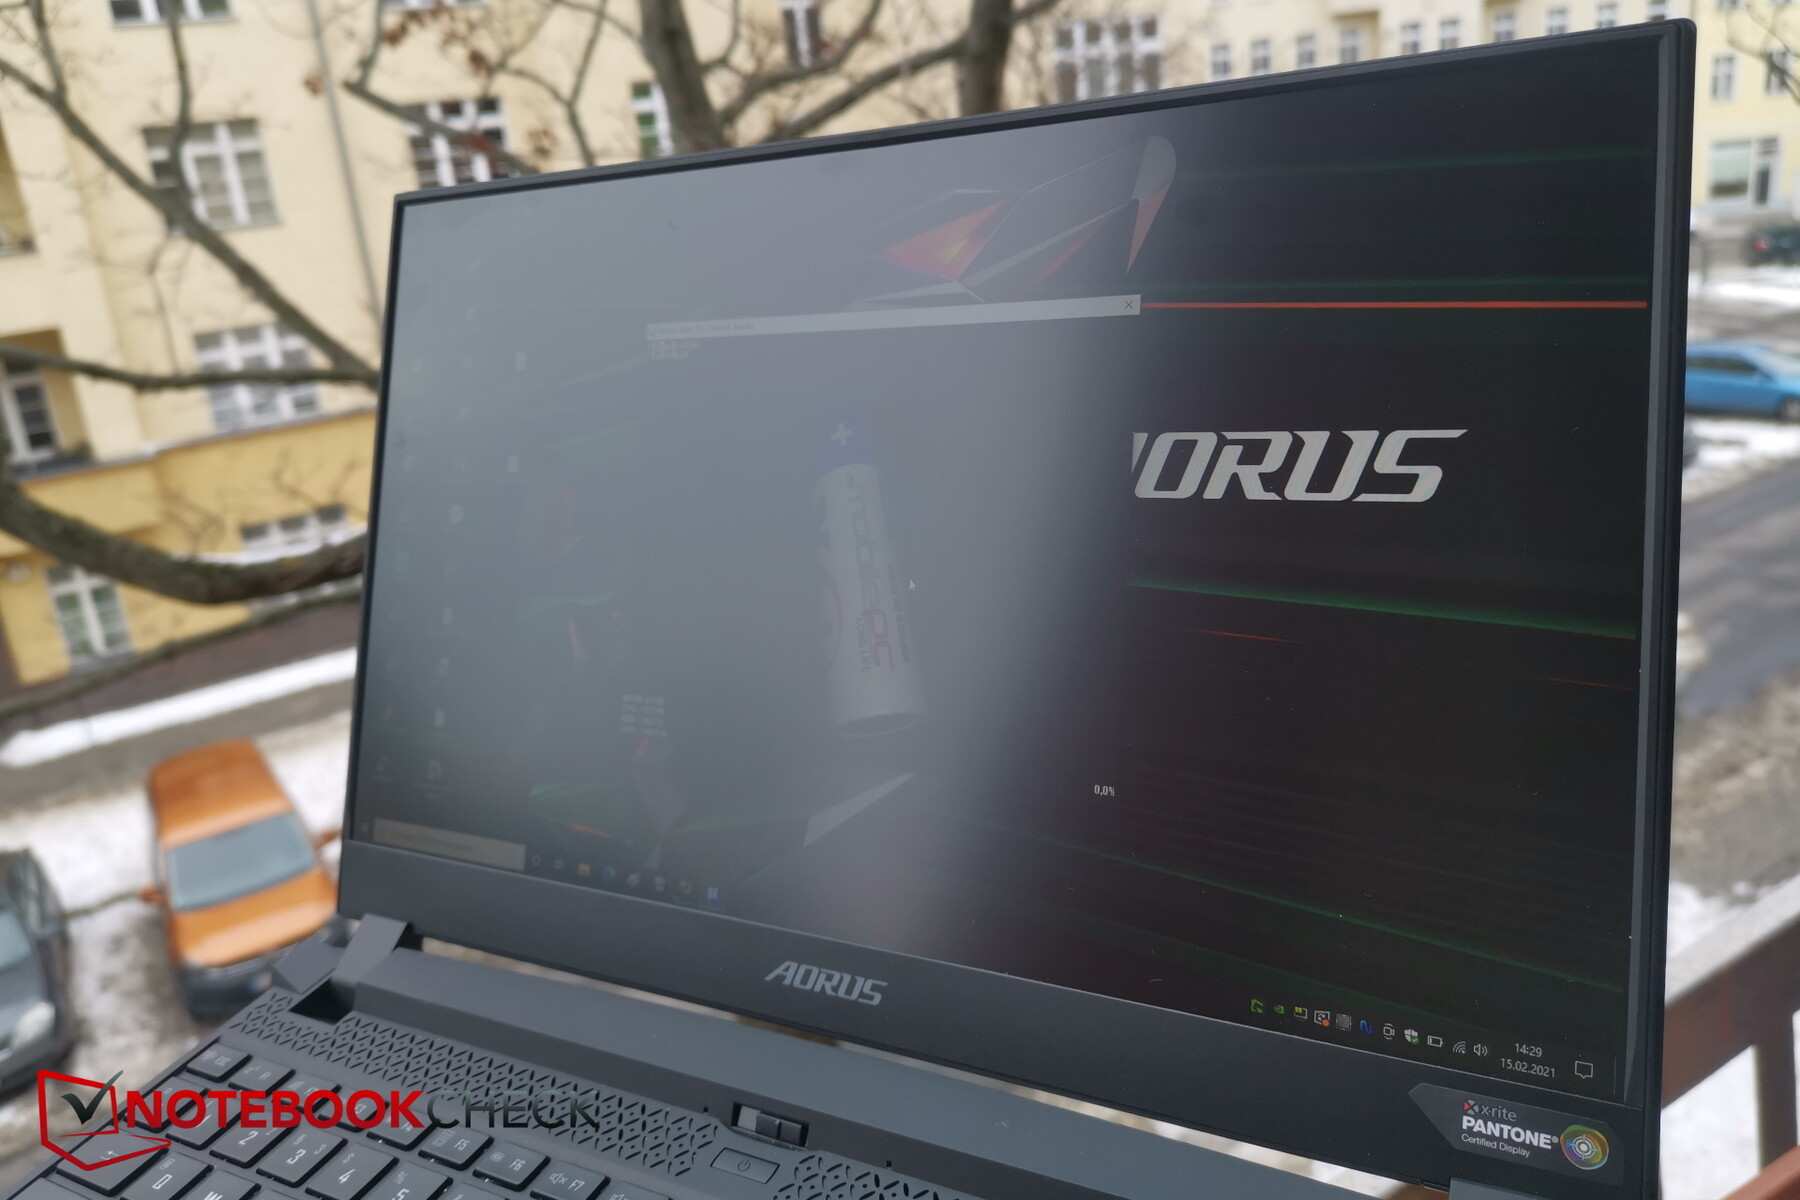
Unfortunately, the display is not brighter than 300 nits. The matte surface nonetheless ensures decent visibility of the screen outdoors (in the shade).
The display has sufficiently good viewing angles with the brightness only reducing visibly from very extreme angles.

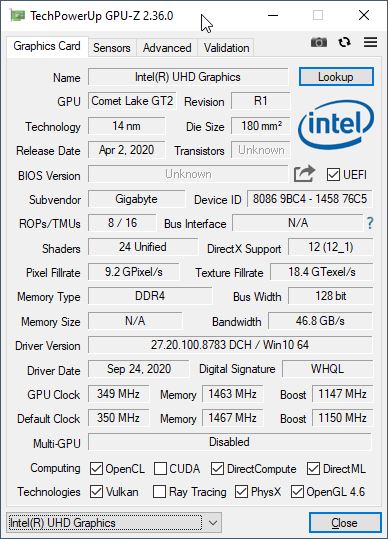
Performance - RTX 3070 gives a boost
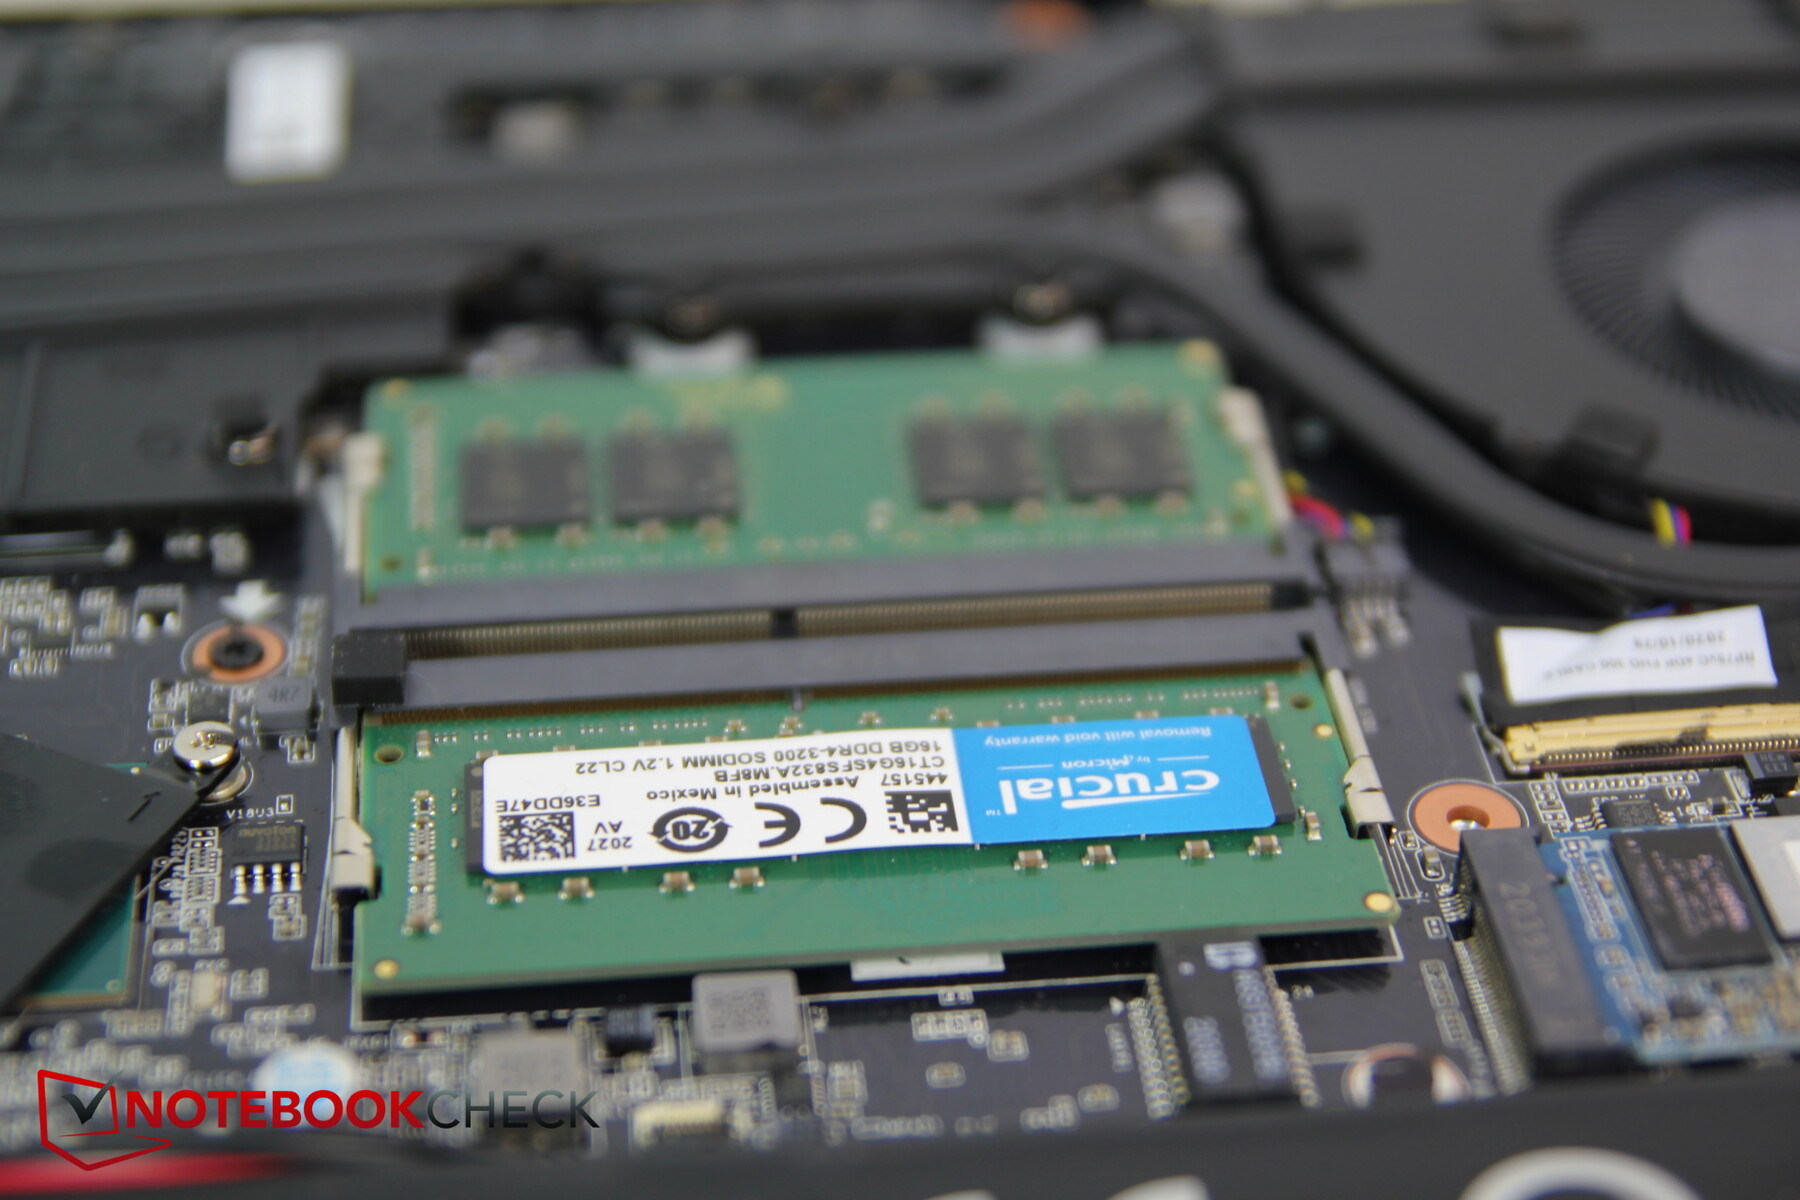
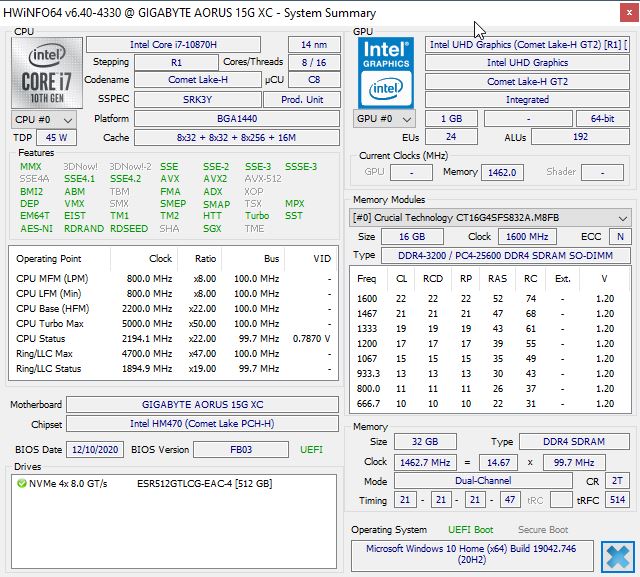
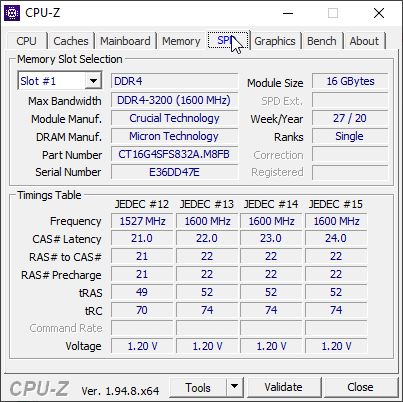
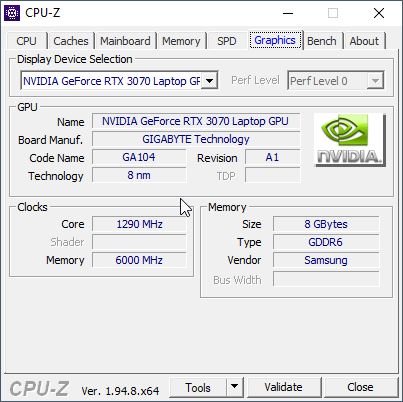
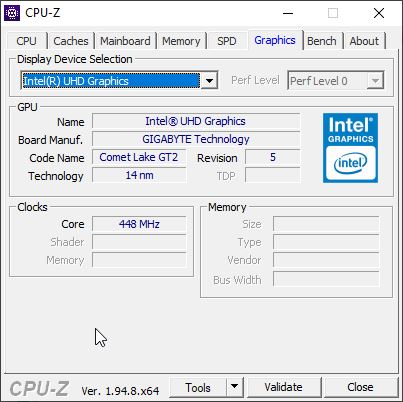
The Aorus 15G is clearly a gamer - the update to a Nvidia RTX 3070 alone makes this clear. Alternative configurations of the Aorus 15G include the RTX 3060 (Aorus 15 G KC) or even the RTX 3080 (Aorus 15G YC). The processor remains the same (Intel Core i7-10870H) across all configurations. The manufacturer has decided not to update the processor to Tiger Lake. RAM has a capacity of 32 GB and the storage device is a 512-GB SSD. With this setup, the device should be capable of playing all current titles in native resolution.
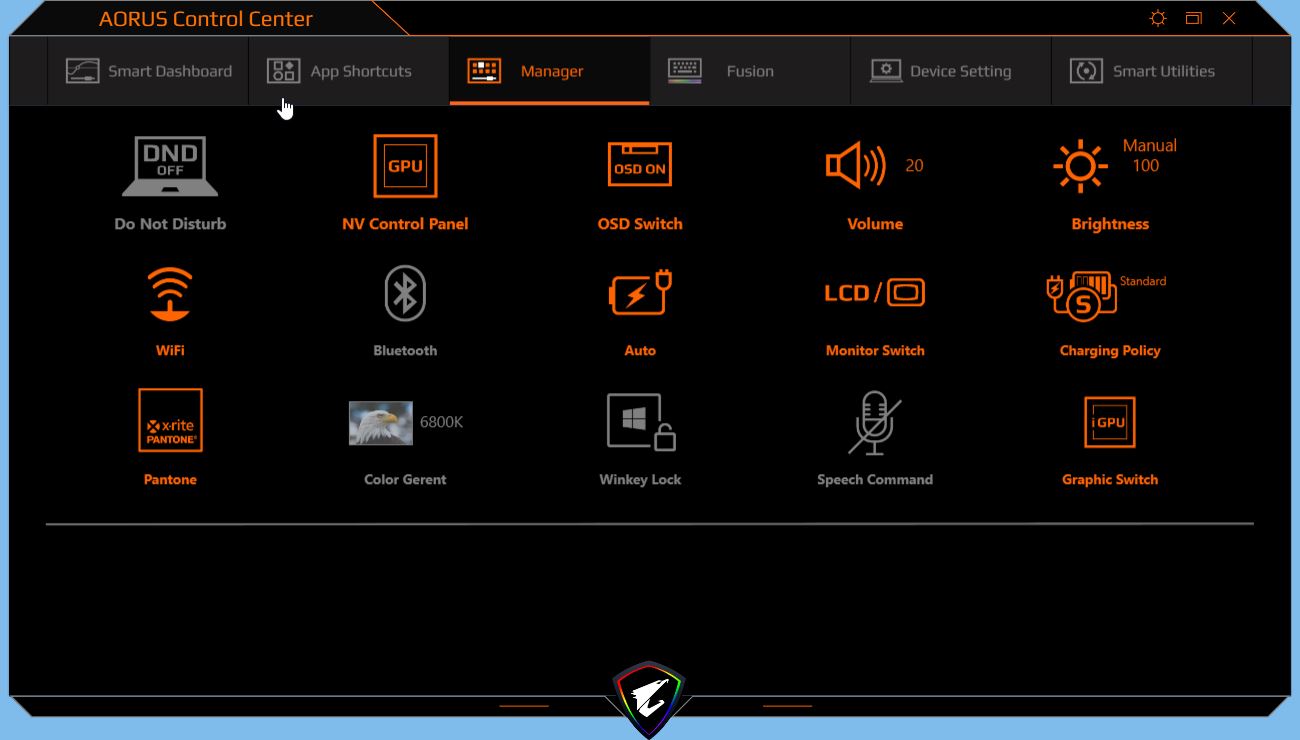
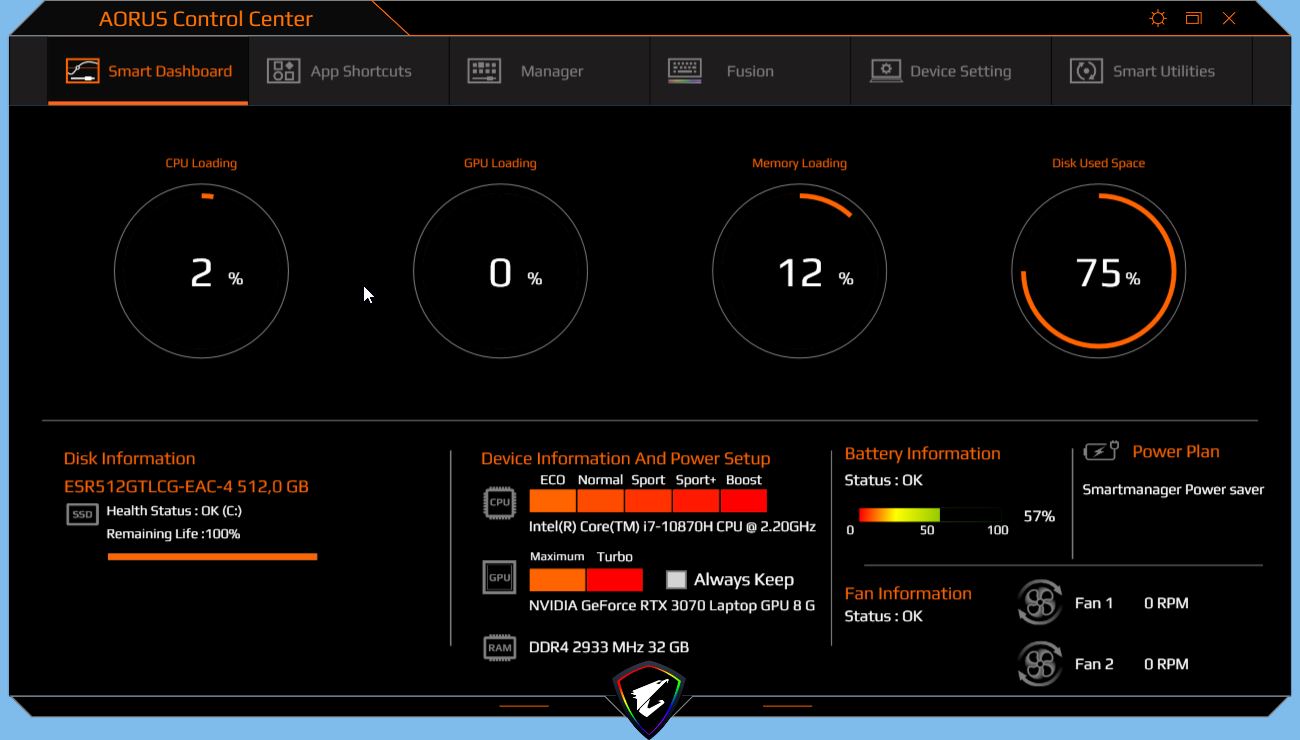
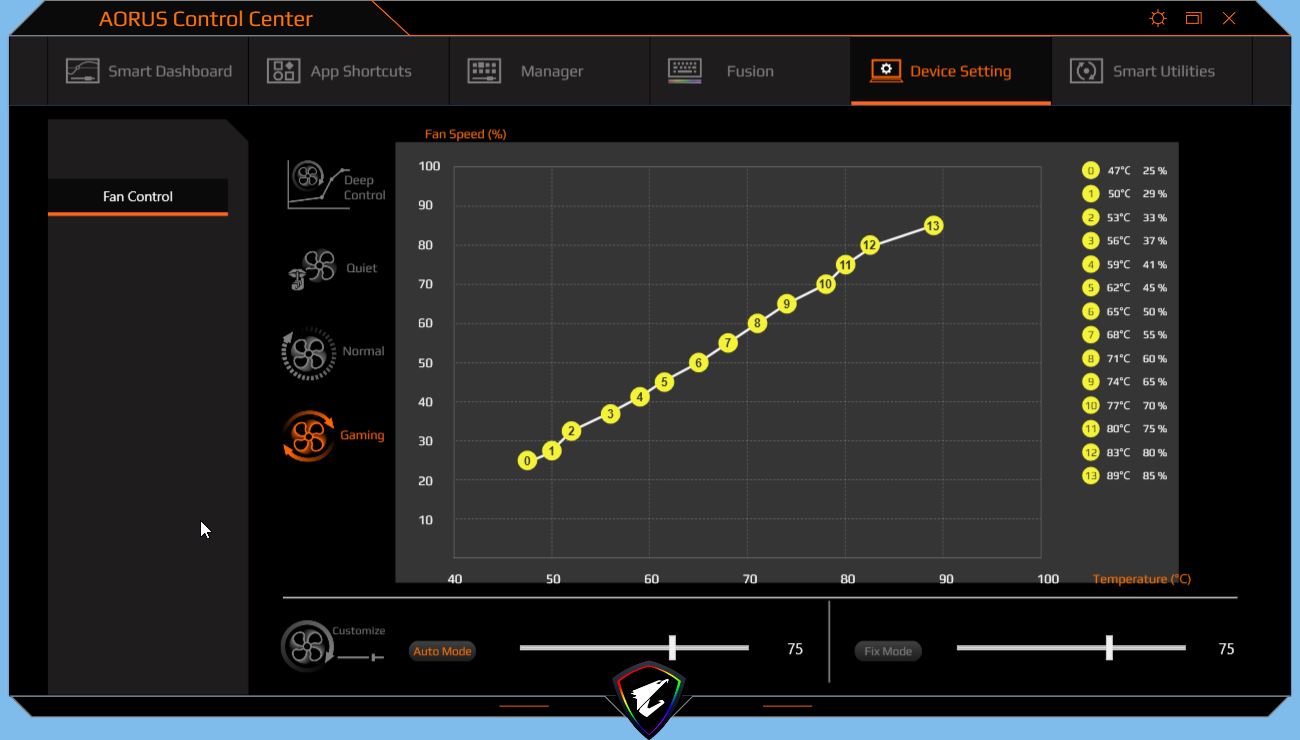
Gigabyte has disabled the Windows energy profiles in part, controlling all important parameters from their own Control Center. We set the cooling to "gaming" and the maximum values for CPU and GPU (not available when running on battery) in order to achieve the best possible results in our benchmarks. The energy mode is set to auto.
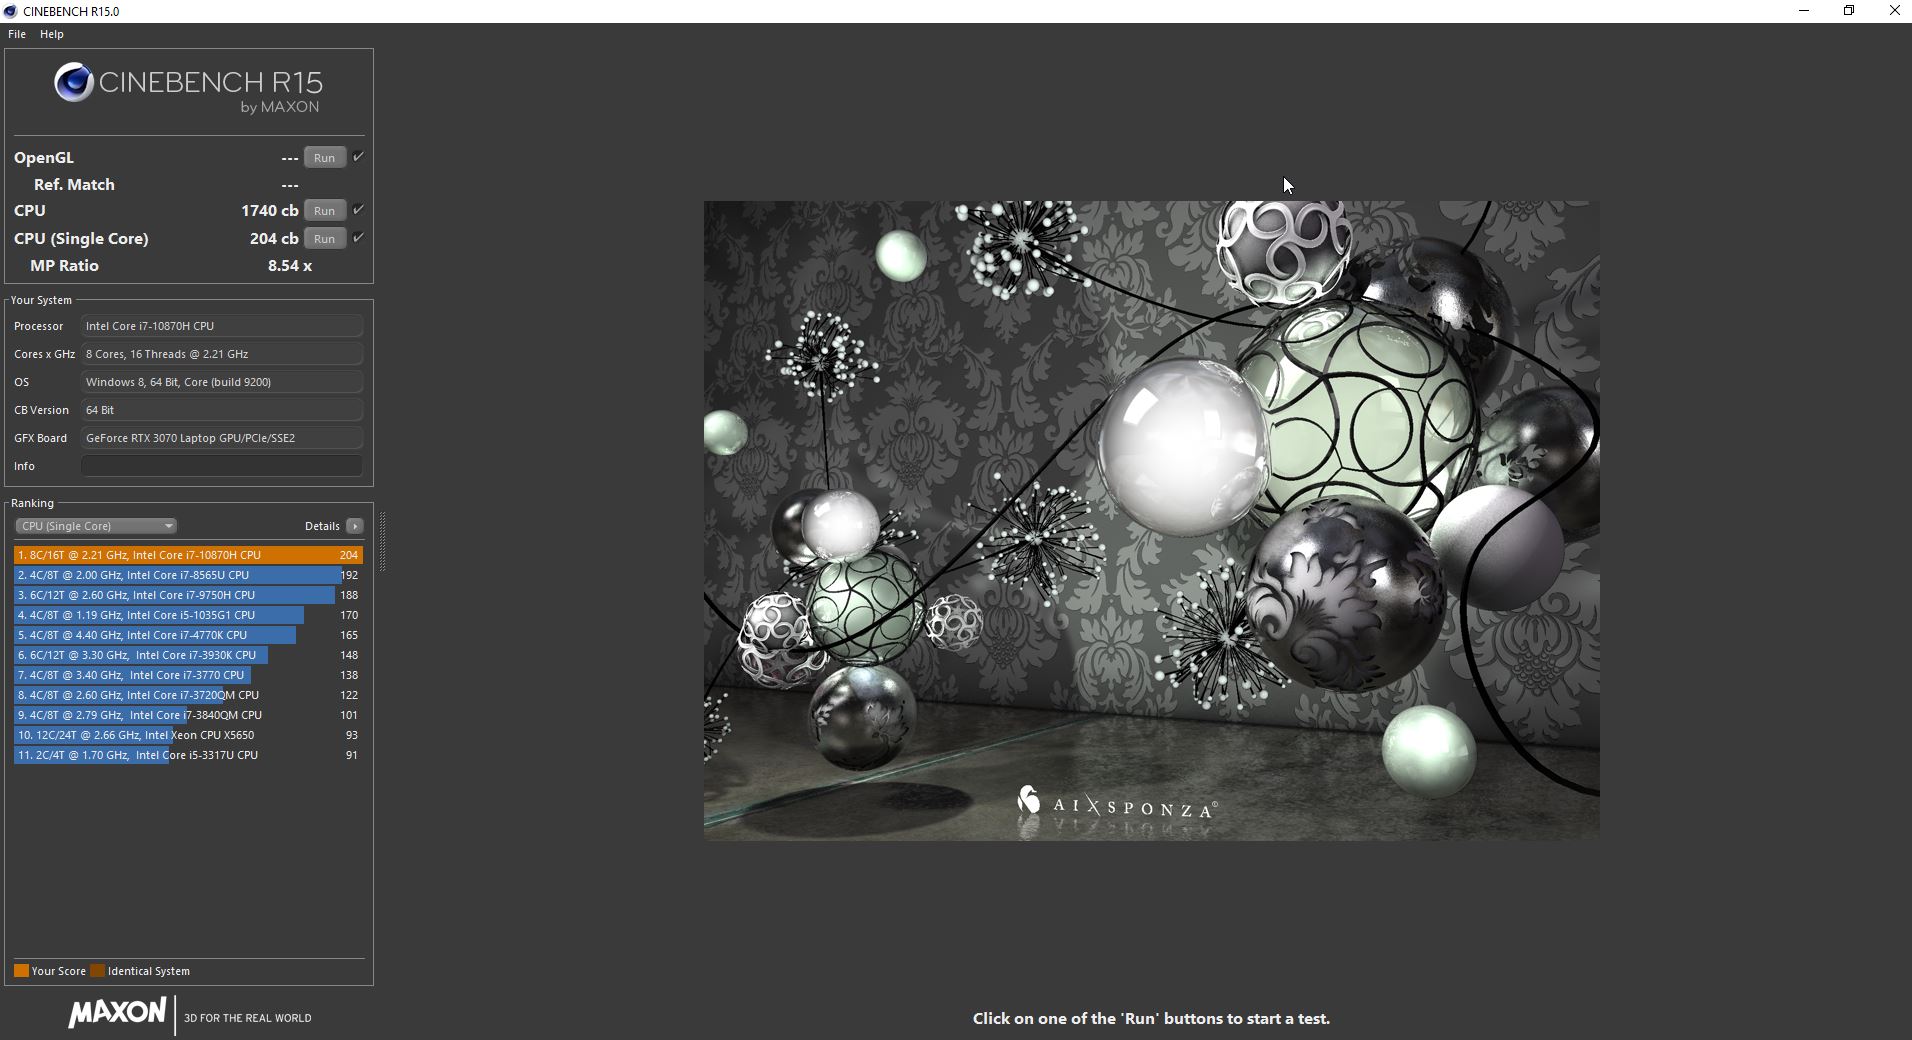
Processor
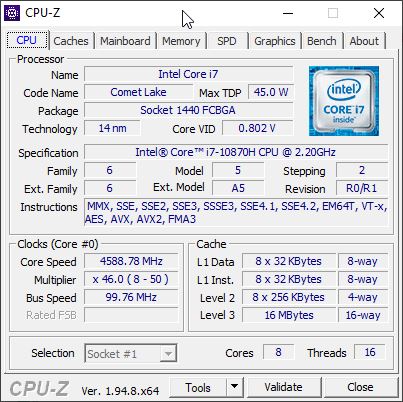
There is no update to Tiger Lake available at the time of writing. As the Intel Core i7-10875H used in the predecessor is currently difficult to obtain, a lot of manufacturers have switched to the Intel Core i7-10870H whose eight cores clock 100 MHz slower (2.2 - 5 GHz). This means that the new Aorus has actually received a slight downgrade in terms of the CPU.
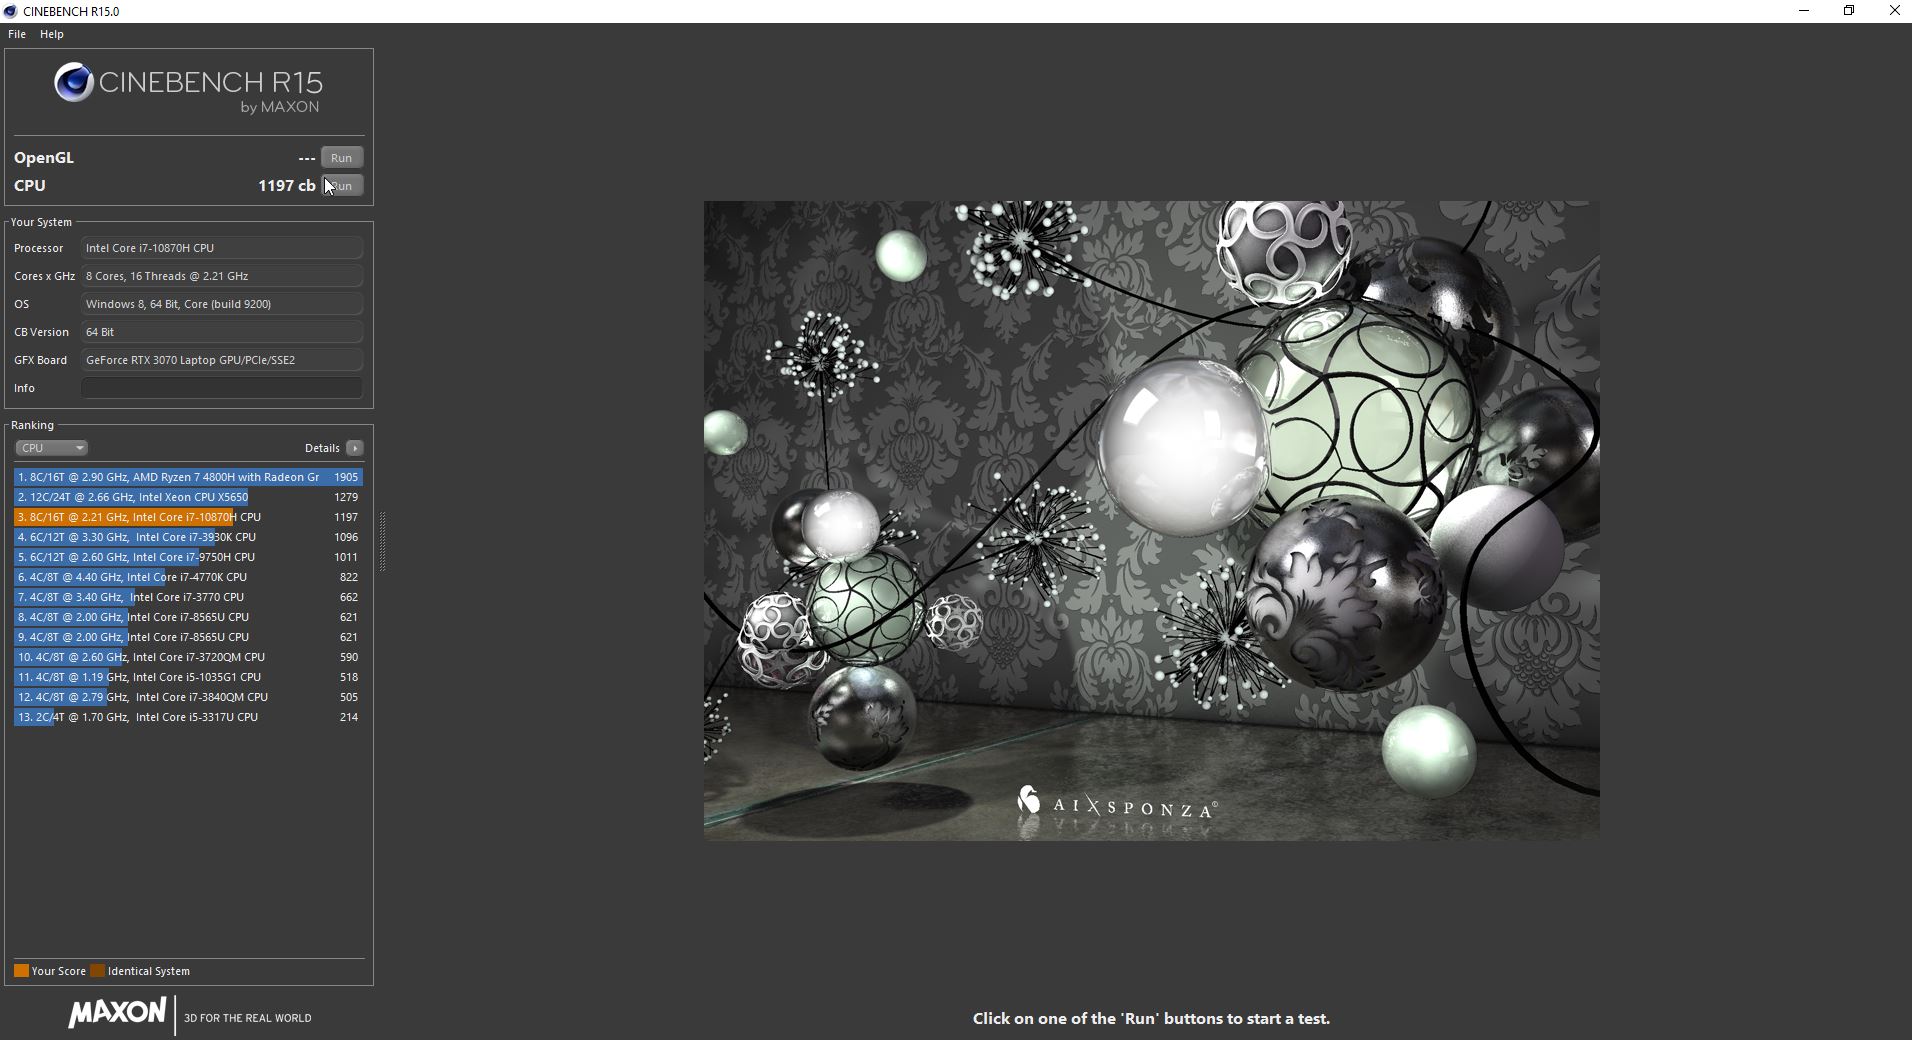
The initial and continued performance is slightly lower than that of the predecessor at all times but still significantly better than the slim Razer Blade that is equipped with the same CPU as the predecessor, for example. The AMD Ryzen 7 5800H in the XMG Neo is significantly faster. The Aorus starts the Cinebench R15 loop with a fairly high output but performance drops by around 8 percent compared to the initial performance by the third round and then stabilizes at this level. The CPU performance is on par with our expectations.
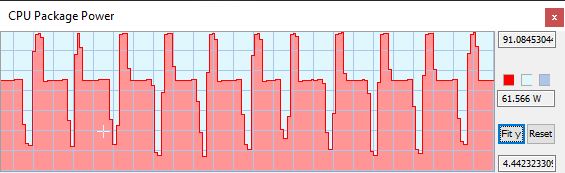
The TDP is 90 W at the beginning of the benchmark which results in temporary clock rates of around 4 GHz. One second later, the TDP drops to 60 W and clocks at 3.4 GHz.
The Aorus loses almost 30 percent of its CPU performance when running on battery, which is in part due to the missing maximum / overboost settings for CPU/GPU in the Control Center.
* ... smaller is better
System Performance
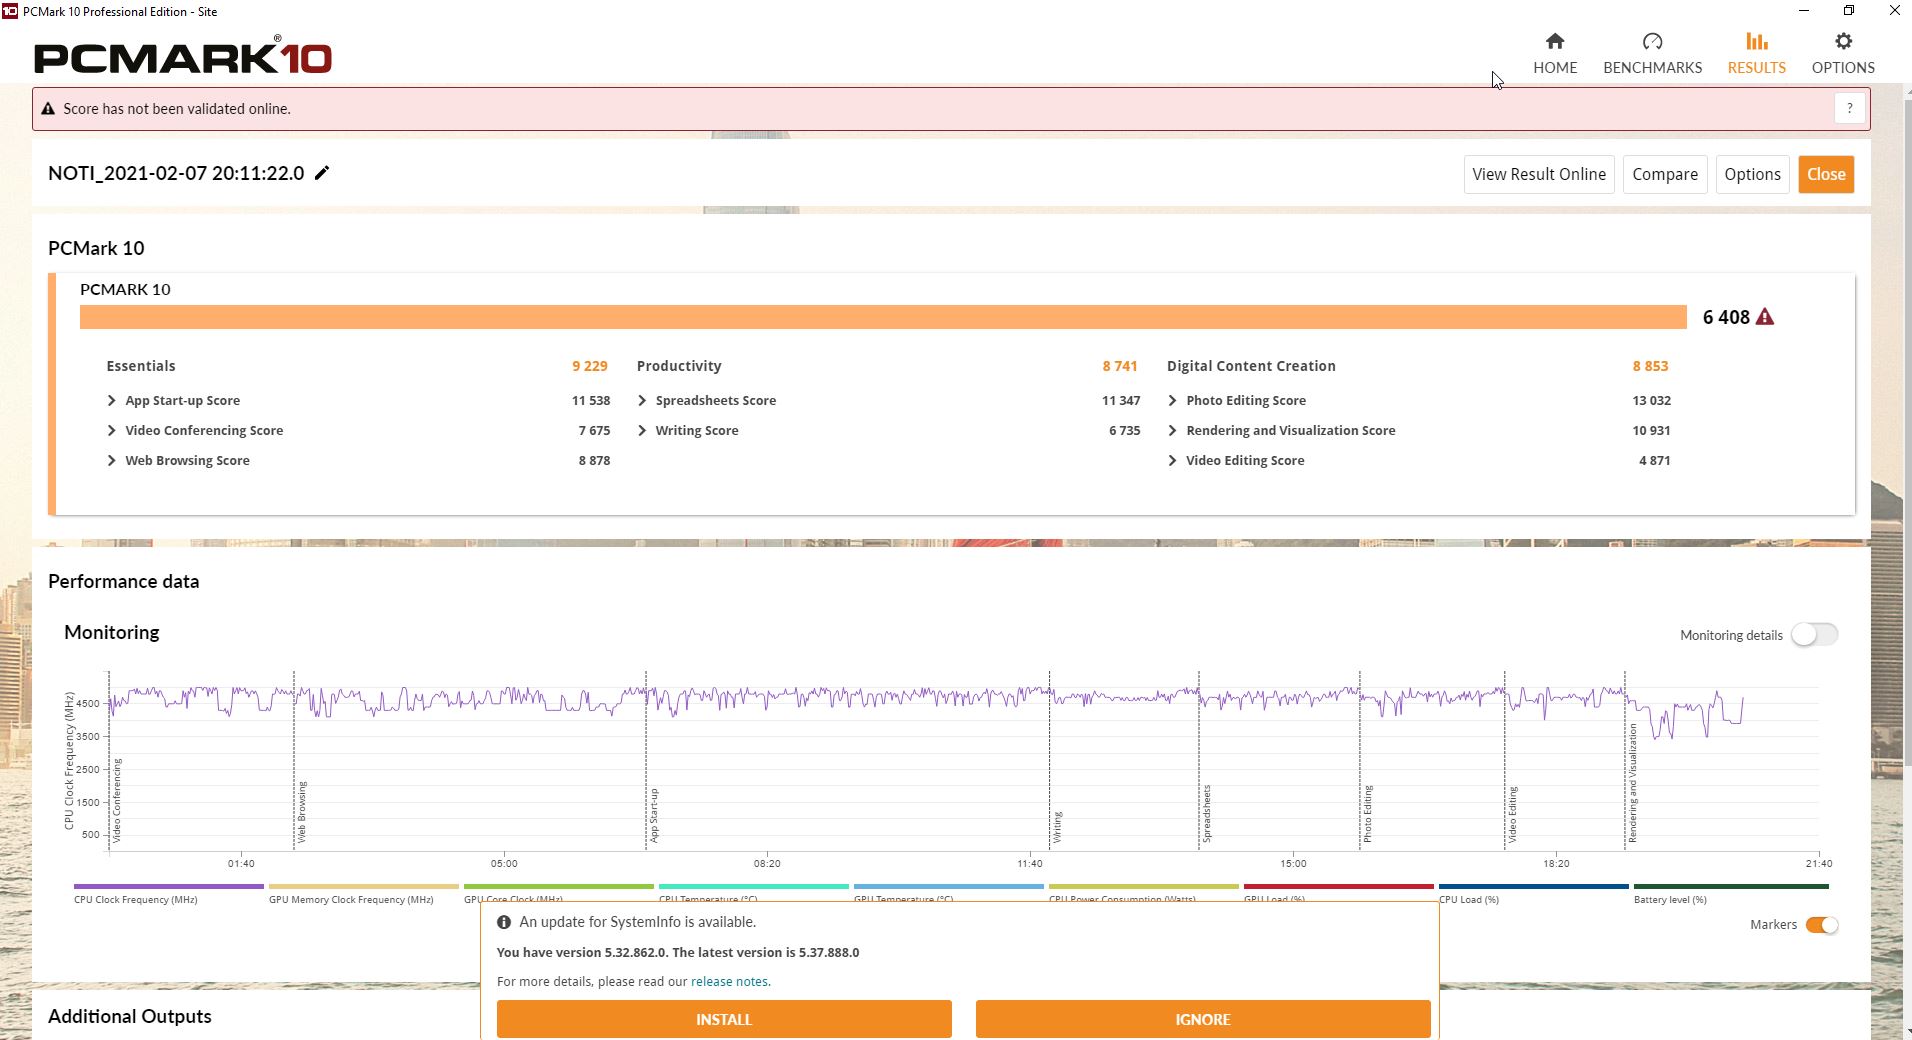
The results of the PCMark 10 confirm our expectations of the Aorus. The Schenker XMG Neo 17, equipped with an AMD processor, is a little faster in most cases. Other than that, there are no big differences among the competitors in this synthetic test. Everyday use is smooth.
| PCMark 10 Score | 6408 points | |
Help | ||
DPC Latencies
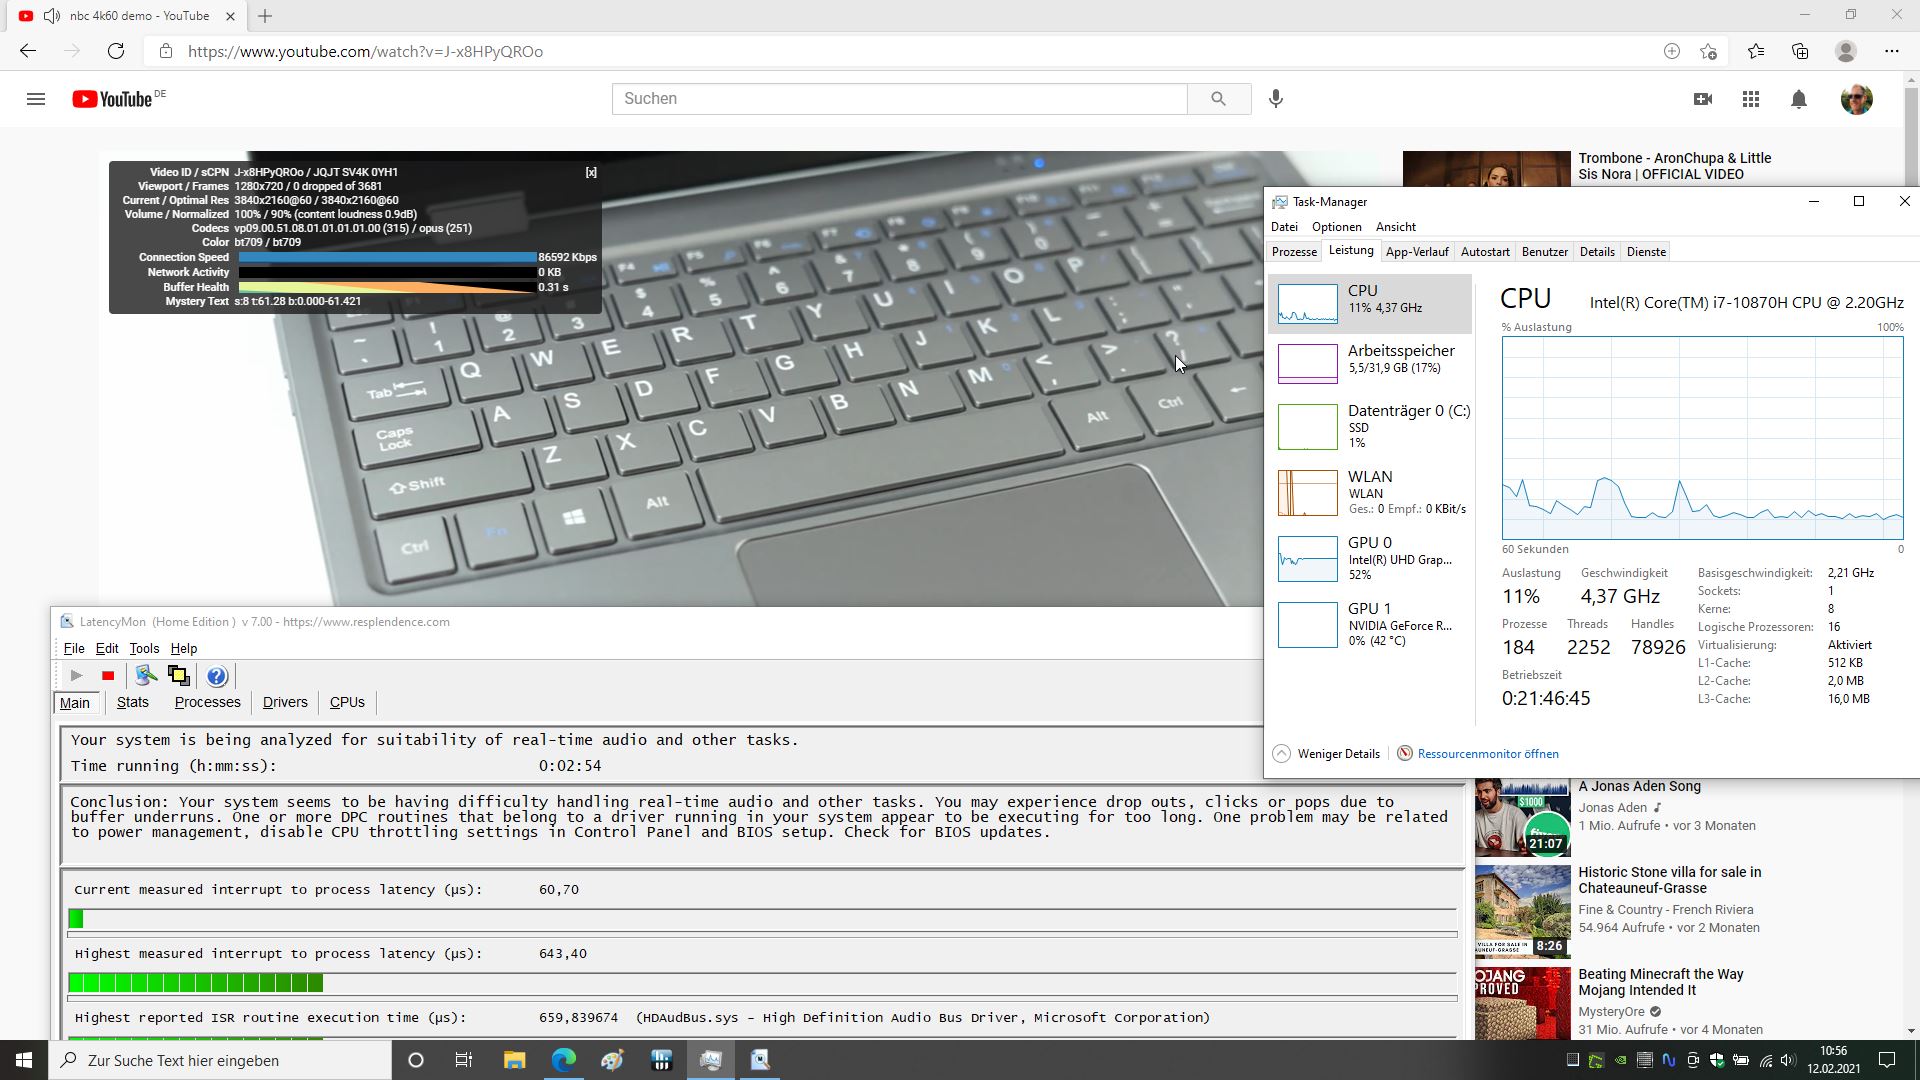
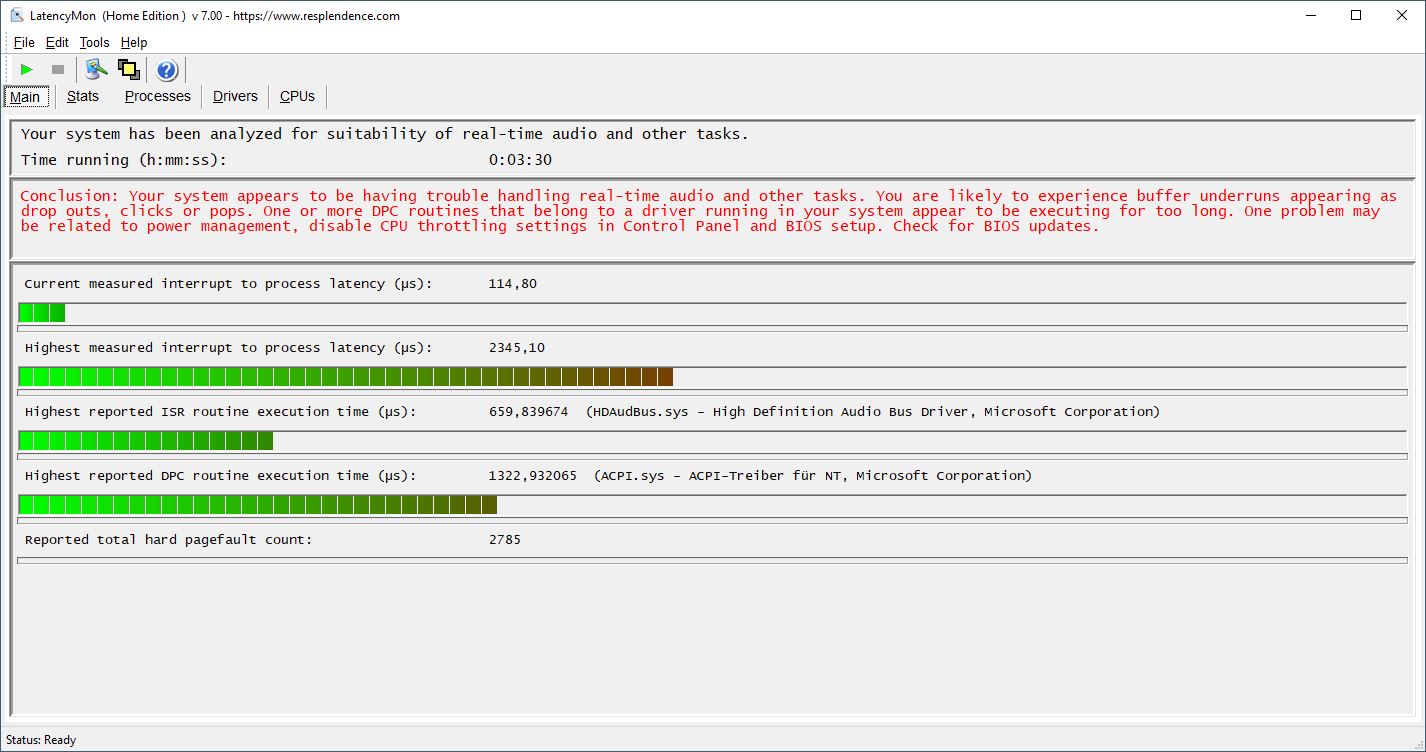
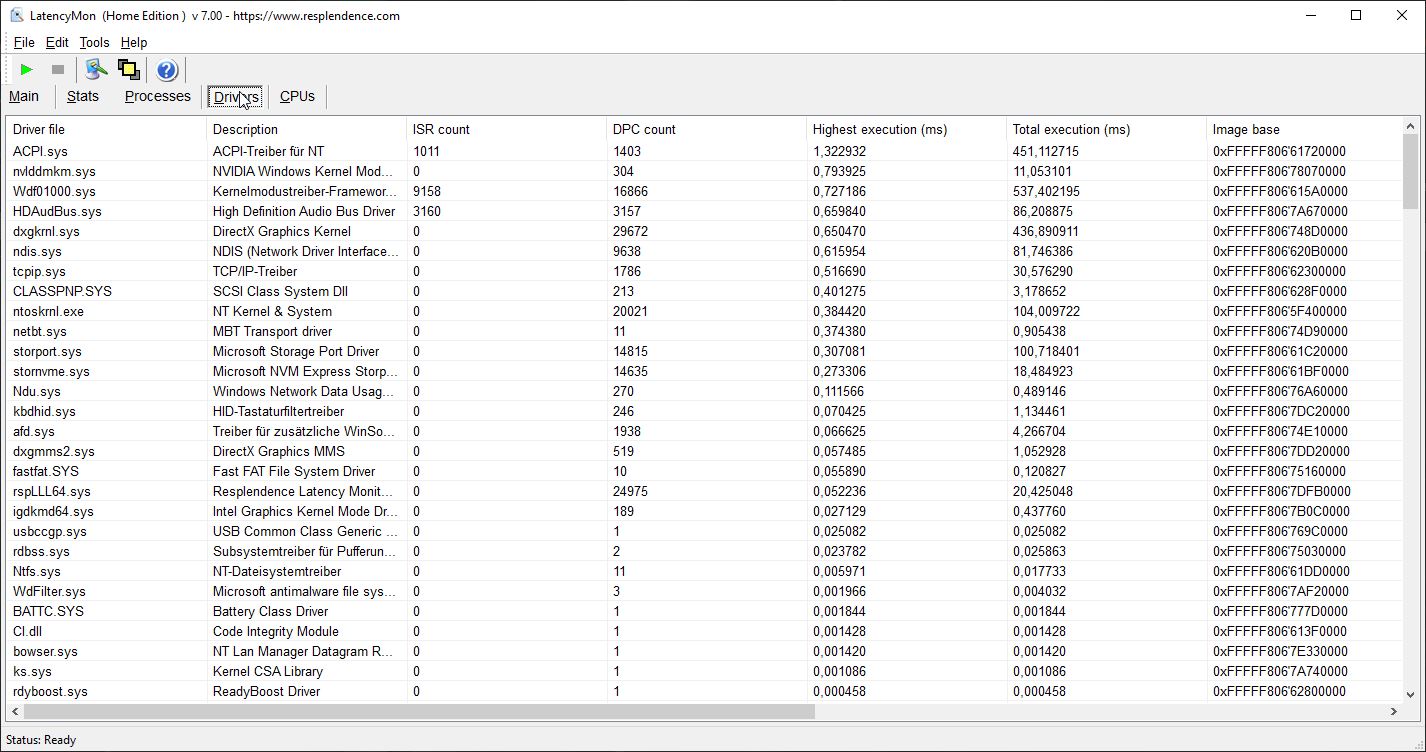
The Aorus does not have any latency issues when opening several browser tabs. However, they do occur while playing a 4K, 60 fps test video on YouTube, according to the tool LatencyMon. Fortunately there are no dropped frames. We have identified the usual culprits (ACPI, Kernel Mode Driver Framework Runtime) as well as a Nvidia driver. The Aorus generations have the highest latencies in our comparison field.
| DPC Latencies / LatencyMon - interrupt to process latency (max), Web, Youtube, Prime95 | |
| Aorus 15G XB | |
| Aorus 15G XC | |
| SCHENKER XMG Neo 17 (Early 2021, RTX 3070, 5800H) | |
| Asus TUF Dash F15 FX516PR | |
| Razer Blade 15 RTX 2080 Super Max-Q | |
| SCHENKER Key 15 Comet Lake | |
* ... smaller is better
Storage Devices
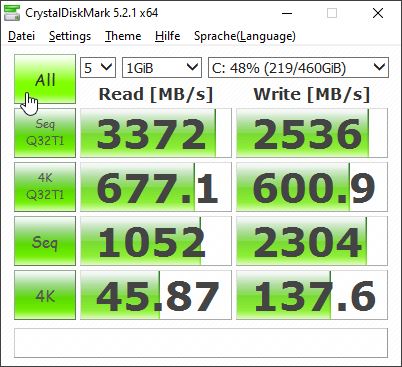
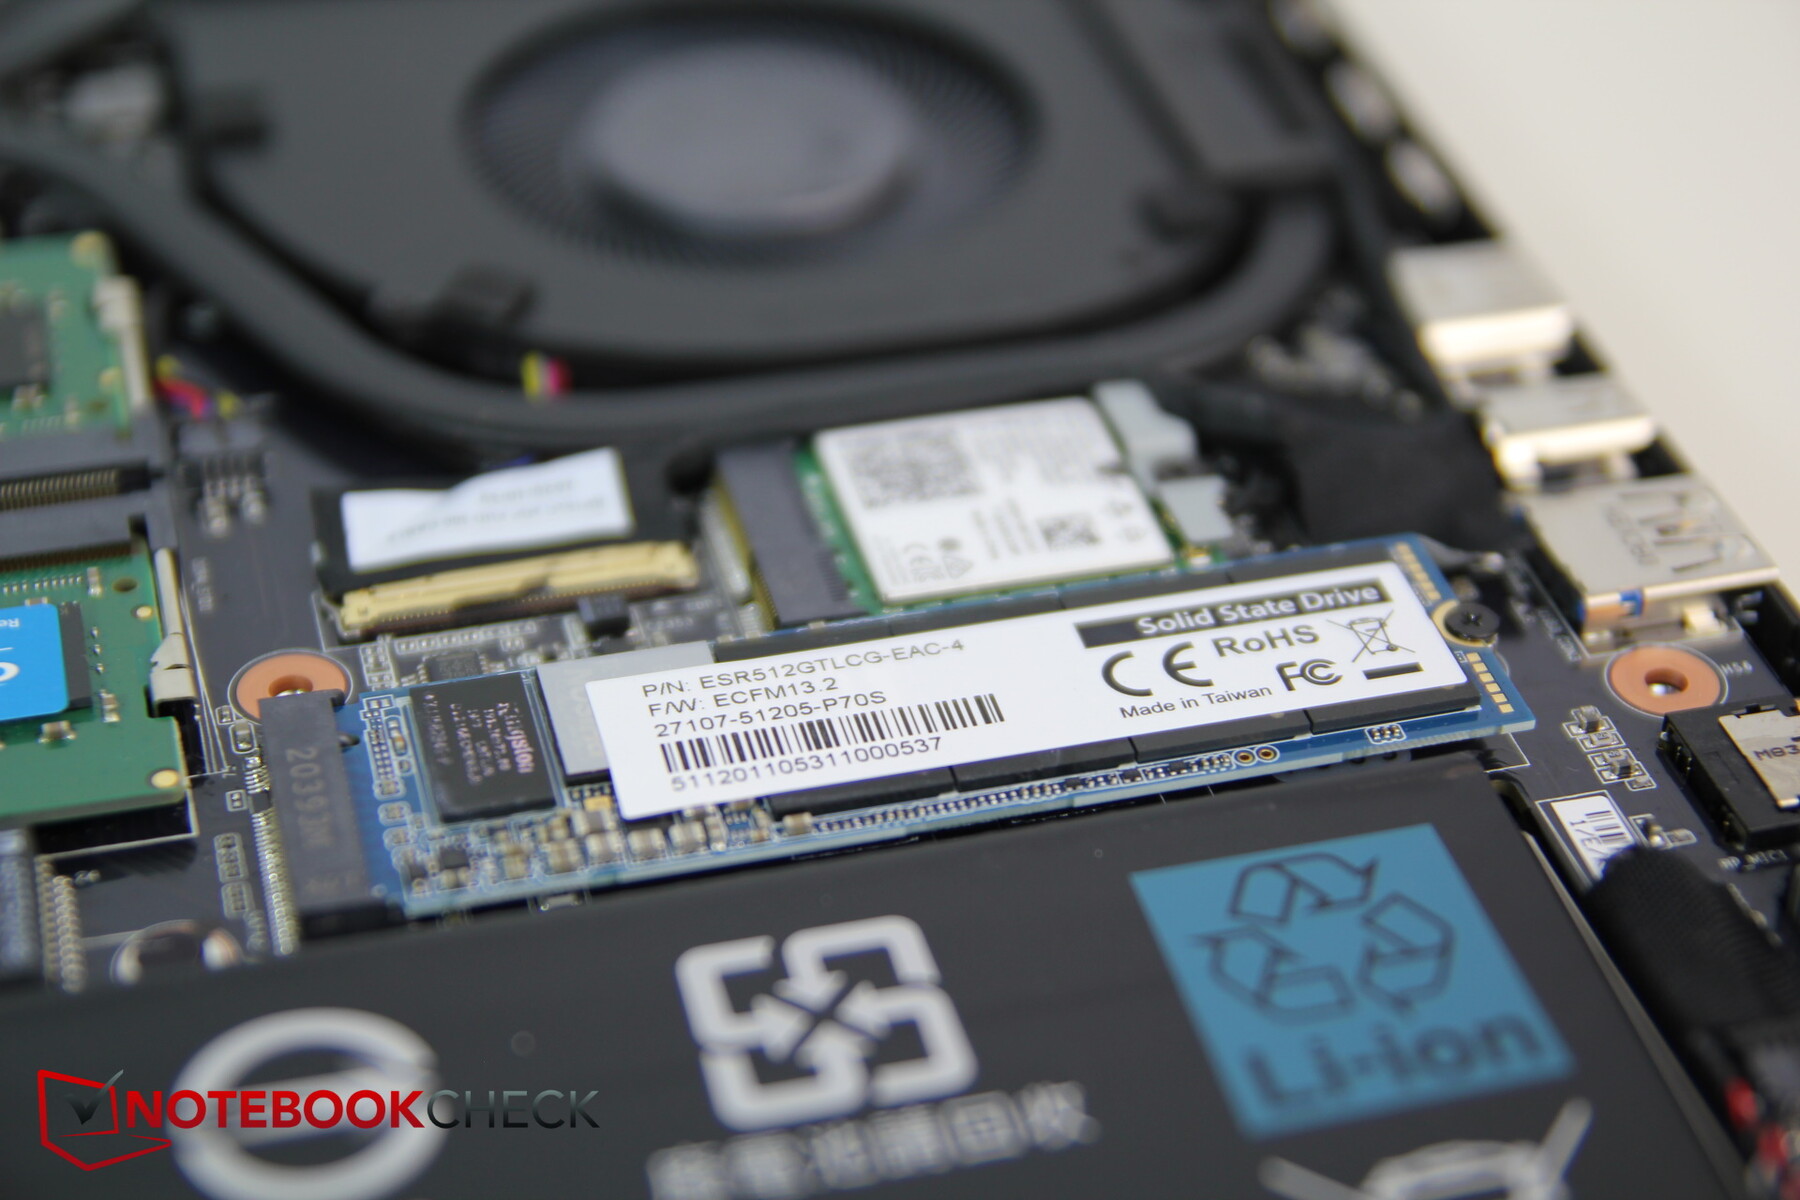
The NVMe SSD in our test unit has a capacity of 512 GB and is placed on rank 6 in our HDD/SSD benchmark table, which means it should be very fast. In practice, it remains below its potential by 6 (CrystalDiskMark) to 12 (AS SSD) percent. This difference is not noticeable in everyday use.
Thanks to the second M.2 PCIe slot in the device, users can retrofit a second SSD.
| Aorus 15G XC ESR512GTLCG-EAC-4 | Aorus 15G XB Samsung SSD PM981a MZVLB512HBJQ | Asus TUF Dash F15 FX516PR SK Hynix HFM001TD3JX013N | SCHENKER XMG Neo 17 (Early 2021, RTX 3070, 5800H) Samsung SSD 970 EVO Plus 500GB | Razer Blade 15 RTX 2080 Super Max-Q Samsung PM981a MZVLB1T0HBLR | SCHENKER Key 15 Comet Lake Samsung SSD 970 EVO Plus 1TB | |
|---|---|---|---|---|---|---|
| CrystalDiskMark 5.2 / 6 | 1% | -5% | 32% | 8% | 32% | |
| Write 4K | 137.6 | 121.6 -12% | 129.6 -6% | 206.1 50% | 135.7 -1% | 193 40% |
| Read 4K | 45.87 | 44.37 -3% | 44.71 -3% | 53 16% | 46.98 2% | 54.3 18% |
| Write Seq | 2304 | 2617 14% | 1929 -16% | 3018 31% | 2180 -5% | 2988 30% |
| Read Seq | 1052 | 1297 23% | 2035 93% | 2575 145% | 1949 85% | 2633 150% |
| Write 4K Q32T1 | 601 | 499 -17% | 425.9 -29% | 535 -11% | 510 -15% | 540 -10% |
| Read 4K Q32T1 | 677 | 557 -18% | 433.4 -36% | 608 -10% | 569 -16% | 620 -8% |
| Write Seq Q32T1 | 2536 | 2978 17% | 1390 -45% | 3242 28% | 2984 18% | 3284 29% |
| Read Seq Q32T1 | 3372 | 3360 0% | 3505 4% | 3617 7% | 3238 -4% | 3564 6% |
| AS SSD | 11% | -10% | 33% | 12% | 104% | |
| Seq Read | 2048 | 1795 -12% | 2671 30% | 3020 47% | 1950 -5% | 2928 43% |
| Seq Write | 2403 | 2724 13% | 1501 -38% | 2631 9% | 2322 -3% | 2733 14% |
| 4K Read | 48.27 | 49.67 3% | 39.65 -18% | 60.3 25% | 45.48 -6% | 51.6 7% |
| 4K Write | 101.6 | 109.3 8% | 69 -32% | 171.6 69% | 95.4 -6% | 129.8 28% |
| 4K-64 Read | 1606 | 1284 -20% | 1209 -25% | 1410 -12% | 1484 -8% | 1838 14% |
| 4K-64 Write | 1473 | 1962 33% | 1650 12% | 2324 58% | 1887 28% | 2291 56% |
| Access Time Read * | 0.131 | 0.063 52% | 0.093 29% | 0.045 66% | 0.051 61% | 0.062 53% |
| Access Time Write * | 0.038 | 0.034 11% | 0.055 -45% | 0.024 37% | 0.038 -0% | 0.029 24% |
| Score Read | 1859 | 1513 -19% | 1516 -18% | 1773 -5% | 1725 -7% | 2183 17% |
| Score Write | 1815 | 2344 29% | 1869 3% | 2759 52% | 2215 22% | 2694 48% |
| Score Total | 4645 | 4685 1% | 4105 -12% | 5429 17% | 4843 4% | 5984 29% |
| Copy ISO MB/s | 1188 | 1533 29% | 1903 60% | 2183 84% | ||
| Copy Program MB/s | 488.1 | 528 8% | 505 3% | 2694 452% | ||
| Copy Game MB/s | 878 | 1042 19% | 1113 27% | 5984 582% | ||
| Total Average (Program / Settings) | 6% /
7% | -8% /
-8% | 33% /
33% | 10% /
11% | 68% /
78% |
* ... smaller is better

Disk Throttling: DiskSpd Read Loop, Queue Depth 8
Graphics Performance
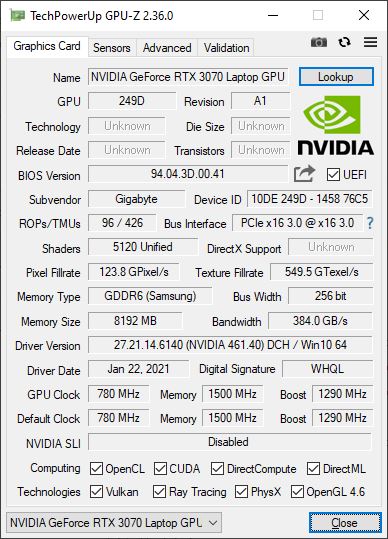
Let's get to the actual upgrade: Instead of an RTX 2070, the Aorus is now equipped with the new Ampere generation in the shape of the Nvidia Geforce RTX 3070. This model is also available in a configuration with the RTX 3060 or RTX 3080. The RTX 3070 Laptop can vary its TGP between 80 and 125 W (without Dynamic Boost), our Gigabyte test unit has a TGP of 105 W, which is right in the middle. The Schenker XMG Neo 17 is granted the full 140 W and is probably considerably faster. We have created a list of all laptops equipped with an RTX 370 and their TGPs.
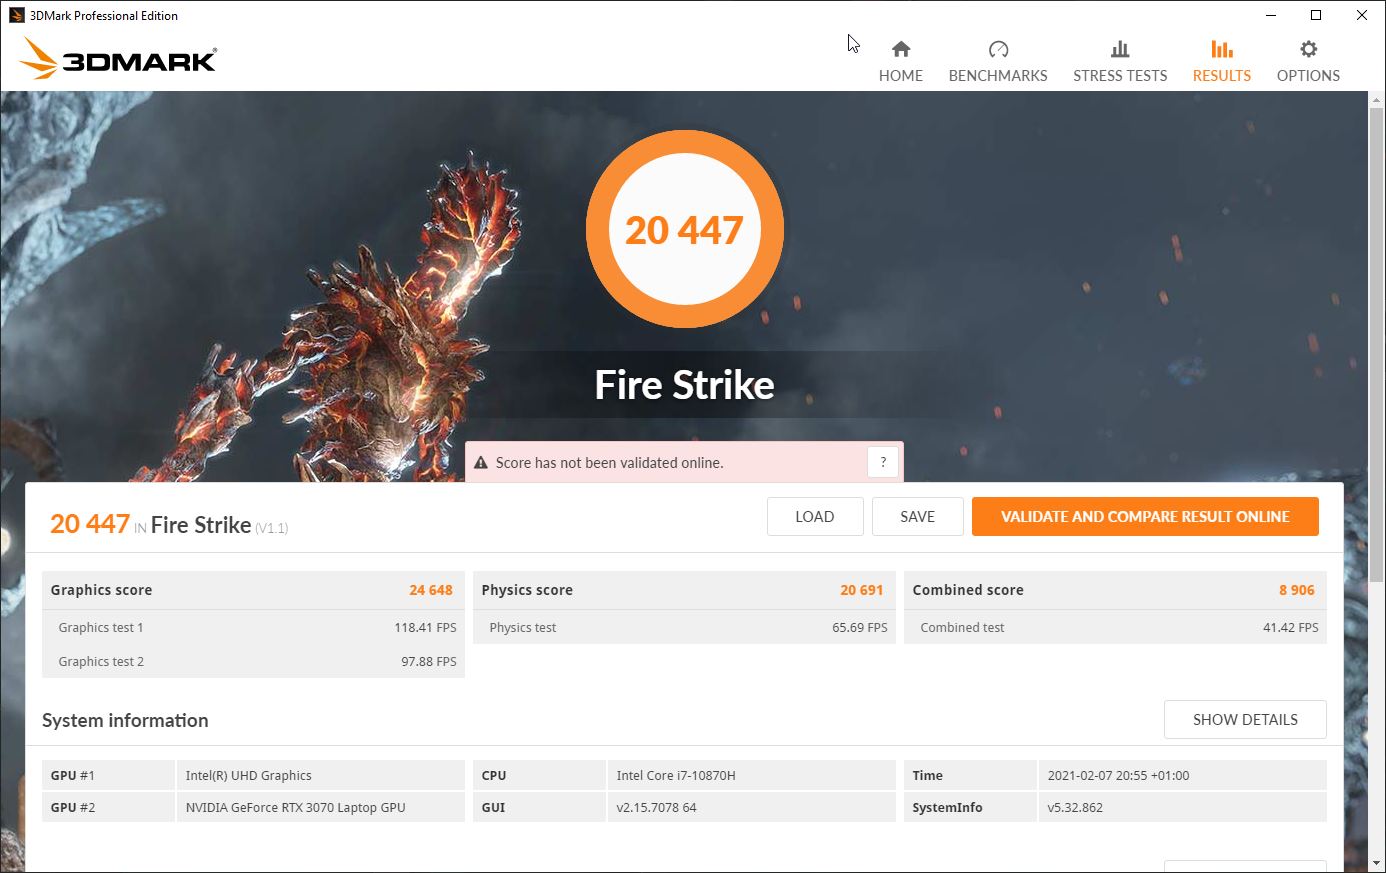
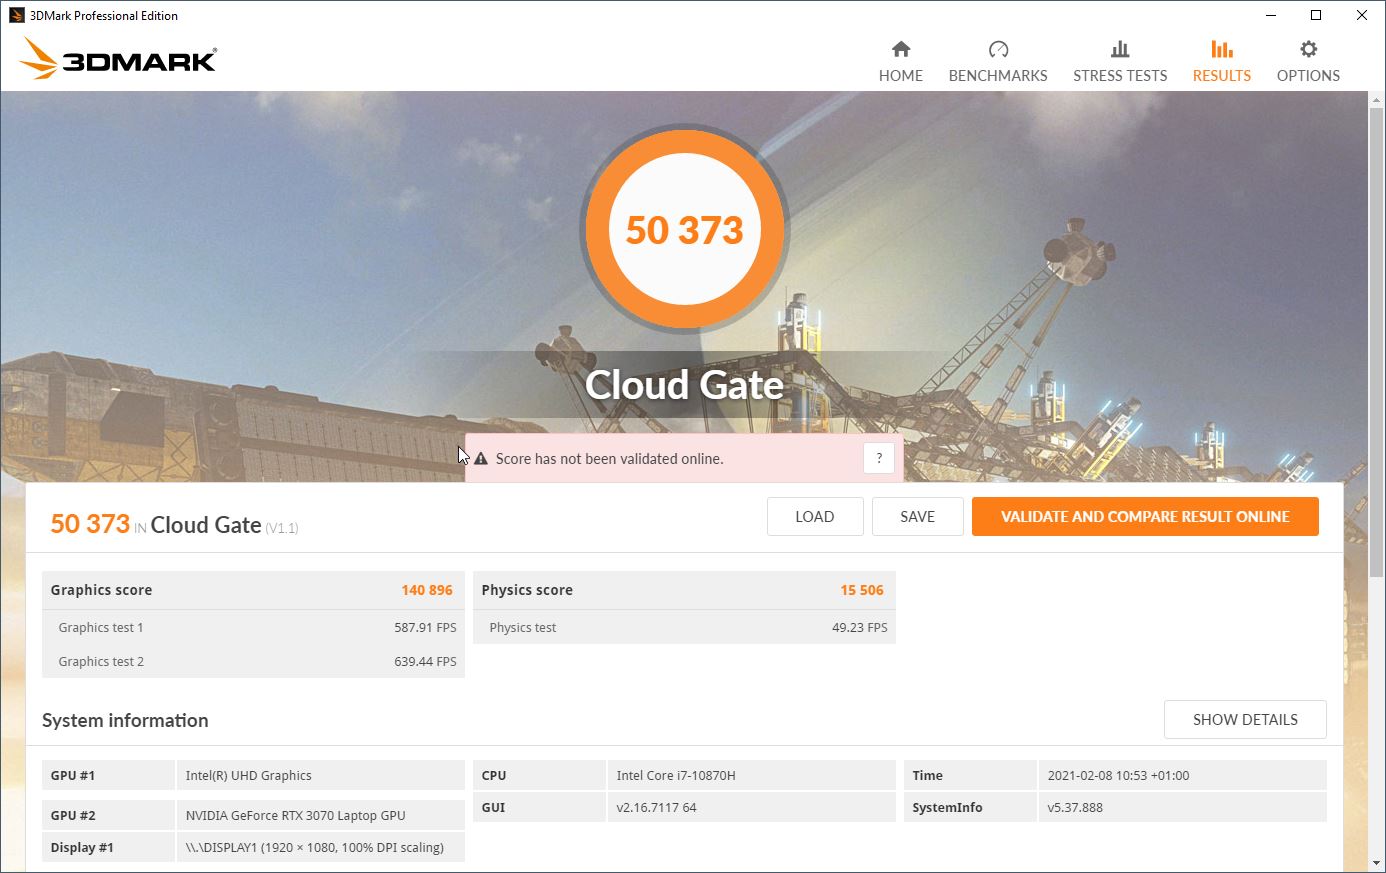
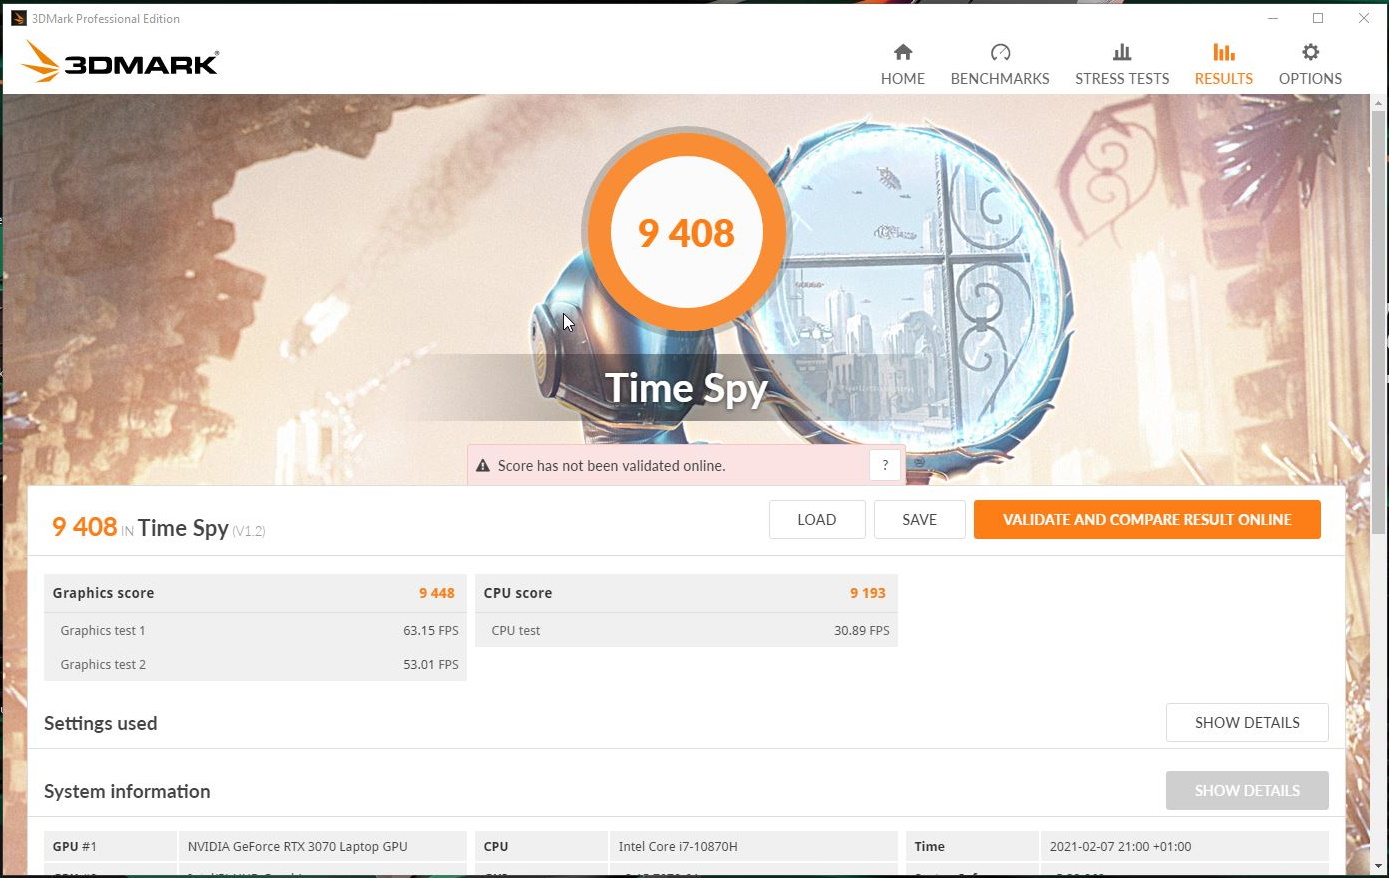
The 3DMark results are where we would expect them to be and position our test unit on second place in our direct comparison. It tops the predecessor by around 20 percent. Only the Schenker XMG Neo 17 equipped with the same GPU but with an AMD Ryzen 7 5800H CPU is above our Aorus (difference of 15 percent).
Running on battery results in a loss of performance of 28 percent according to the 3DMark 11 with the first try actually resulting in an error message.
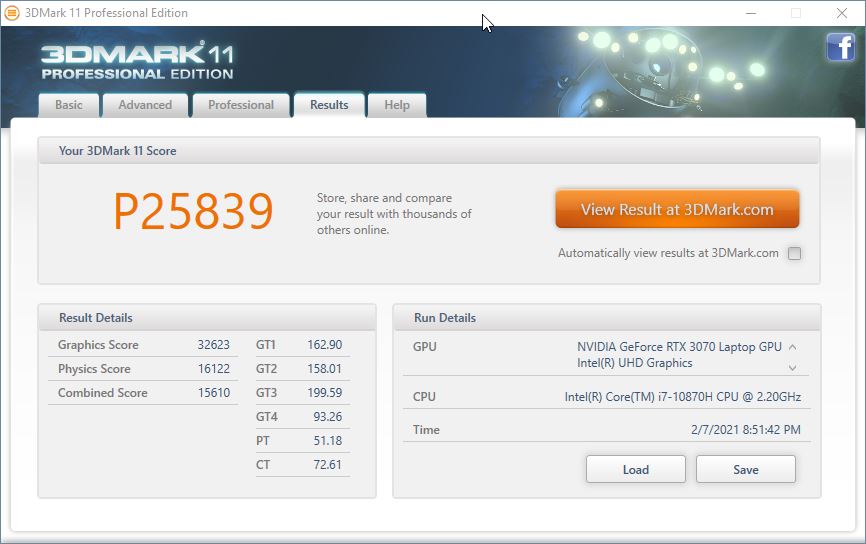

| 3DMark 11 Performance | 25839 points | |
| 3DMark Cloud Gate Standard Score | 50373 points | |
| 3DMark Fire Strike Score | 20447 points | |
| 3DMark Time Spy Score | 9408 points | |
Help | ||
Gaming Performance
The new GPU offers an improvement of around 15 to 20 percent compared to the RTX 2070 in the predecessor when gaming. The difference is particularly noticeable at high resolutions and details. Again, the Schenker XMG beats our test unit by about 10 percent. In FullHD and maximum details, Witcher 3 and Shadow of the Tomb Raider reach around 100 fps. The display supports 240 Hz, which the gaming experience clearly benefits from.
| The Witcher 3 | |
| 1920x1080 High Graphics & Postprocessing (Nvidia HairWorks Off) | |
| Average of class Gaming (40.1 - 424, n=56, last 2 years) | |
| SCHENKER XMG Neo 17 (Early 2021, RTX 3070, 5800H) | |
| Average NVIDIA GeForce RTX 3070 Laptop GPU (122.1 - 207, n=34) | |
| SCHENKER Key 15 Comet Lake | |
| Razer Blade 15 RTX 2080 Super Max-Q | |
| Aorus 15G XB | |
| Aorus 15G XC | |
| Asus TUF Dash F15 FX516PR | |
| 1920x1080 Ultra Graphics & Postprocessing (HBAO+) | |
| Average of class Gaming (18.4 - 224, n=82, last 2 years) | |
| SCHENKER XMG Neo 17 (Early 2021, RTX 3070, 5800H) | |
| Aorus 15G XC | |
| Average NVIDIA GeForce RTX 3070 Laptop GPU (34.9 - 109, n=52) | |
| SCHENKER Key 15 Comet Lake | |
| Razer Blade 15 RTX 2080 Super Max-Q | |
| Asus TUF Dash F15 FX516PR | |
| Aorus 15G XB | |
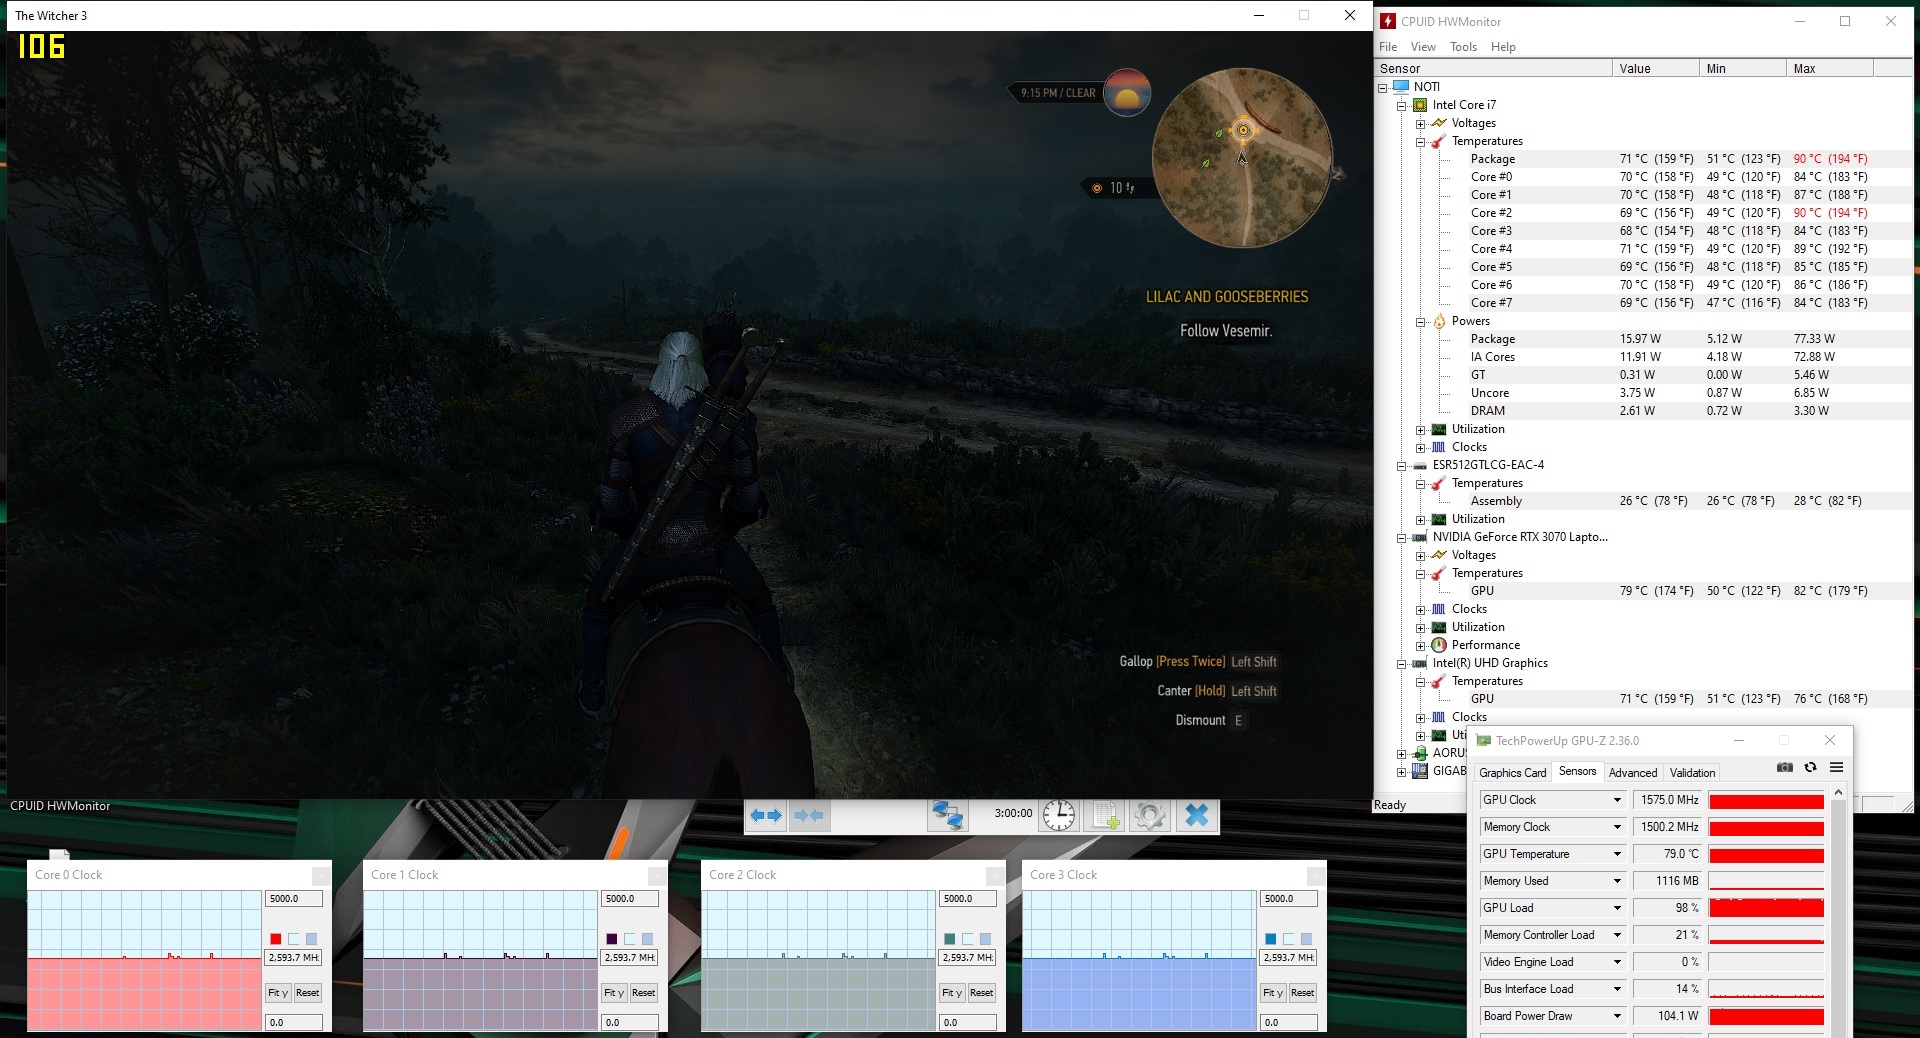
The frame rate in Witcher 3 (Ultra) remains fairly constant during our one-hour test and fluctuates between 85 and 95 fps.
| low | med. | high | ultra | |
|---|---|---|---|---|
| The Witcher 3 (2015) | 264.1 | 243 | 133.5 | 92.3 |
| Dota 2 Reborn (2015) | 150 | 134 | 122 | 118 |
| Rise of the Tomb Raider (2016) | 272 | 203.7 | 160 | 137 |
| X-Plane 11.11 (2018) | 108 | 94.7 | 79.3 | |
| Shadow of the Tomb Raider (2018) | 142 | 121 | 119 | 109 |
Emissions - minimally better than its predecessor
System Noise
The new Aorus manages to operate more quietly than the predecessor despite the GPU upgrade - at least in the "normal" fan mode. We measured a maximum of 47 dB(A) when gaming, which is a fairly good value in comparison. The competition usually becomes louder.
However, we ran the benchmarks in the "gaming" fan mode. In this scenario, the device seems anything but quiet and the fans work continuously at audible levels, with the rpm regularly fluctuating even within a scene.
Noise Level
| Idle |
| 29 / 30 / 31 dB(A) |
| Load |
| 41 / 51 dB(A) |
 | ||
30 dB silent 40 dB(A) audible 50 dB(A) loud |
||
min: | ||
| Aorus 15G XC i7-10870H, GeForce RTX 3070 Laptop GPU | Aorus 15G XB i7-10875H, GeForce RTX 2070 Super Max-Q | Asus TUF Dash F15 FX516PR i7-11370H, GeForce RTX 3070 Laptop GPU | SCHENKER XMG Neo 17 (Early 2021, RTX 3070, 5800H) R7 5800H, GeForce RTX 3070 Laptop GPU | Razer Blade 15 RTX 2080 Super Max-Q i7-10875H, GeForce RTX 2080 Super Max-Q | SCHENKER Key 15 Comet Lake i7-10875H, GeForce RTX 2080 Super Max-Q | |
|---|---|---|---|---|---|---|
| Noise | -11% | -5% | -10% | -4% | -9% | |
| off / environment * | 25 | 25 -0% | 24 4% | 24 4% | 30.1 -20% | 25 -0% |
| Idle Minimum * | 29 | 32 -10% | 25 14% | 29 -0% | 30.1 -4% | 26 10% |
| Idle Average * | 30 | 34 -13% | 30 -0% | 32 -7% | 30.1 -0% | 27 10% |
| Idle Maximum * | 31 | 38 -23% | 35 -13% | 38 -23% | 30.1 3% | 44 -42% |
| Load Average * | 41 | 48 -17% | 53 -29% | 49 -20% | 46.8 -14% | 53 -29% |
| Witcher 3 ultra * | 47 | 50 -6% | 48 -2% | 53 -13% | 48.4 -3% | 51 -9% |
| Load Maximum * | 51 | 54 -6% | 54 -6% | 55 -8% | 46 10% | 53 -4% |
* ... smaller is better
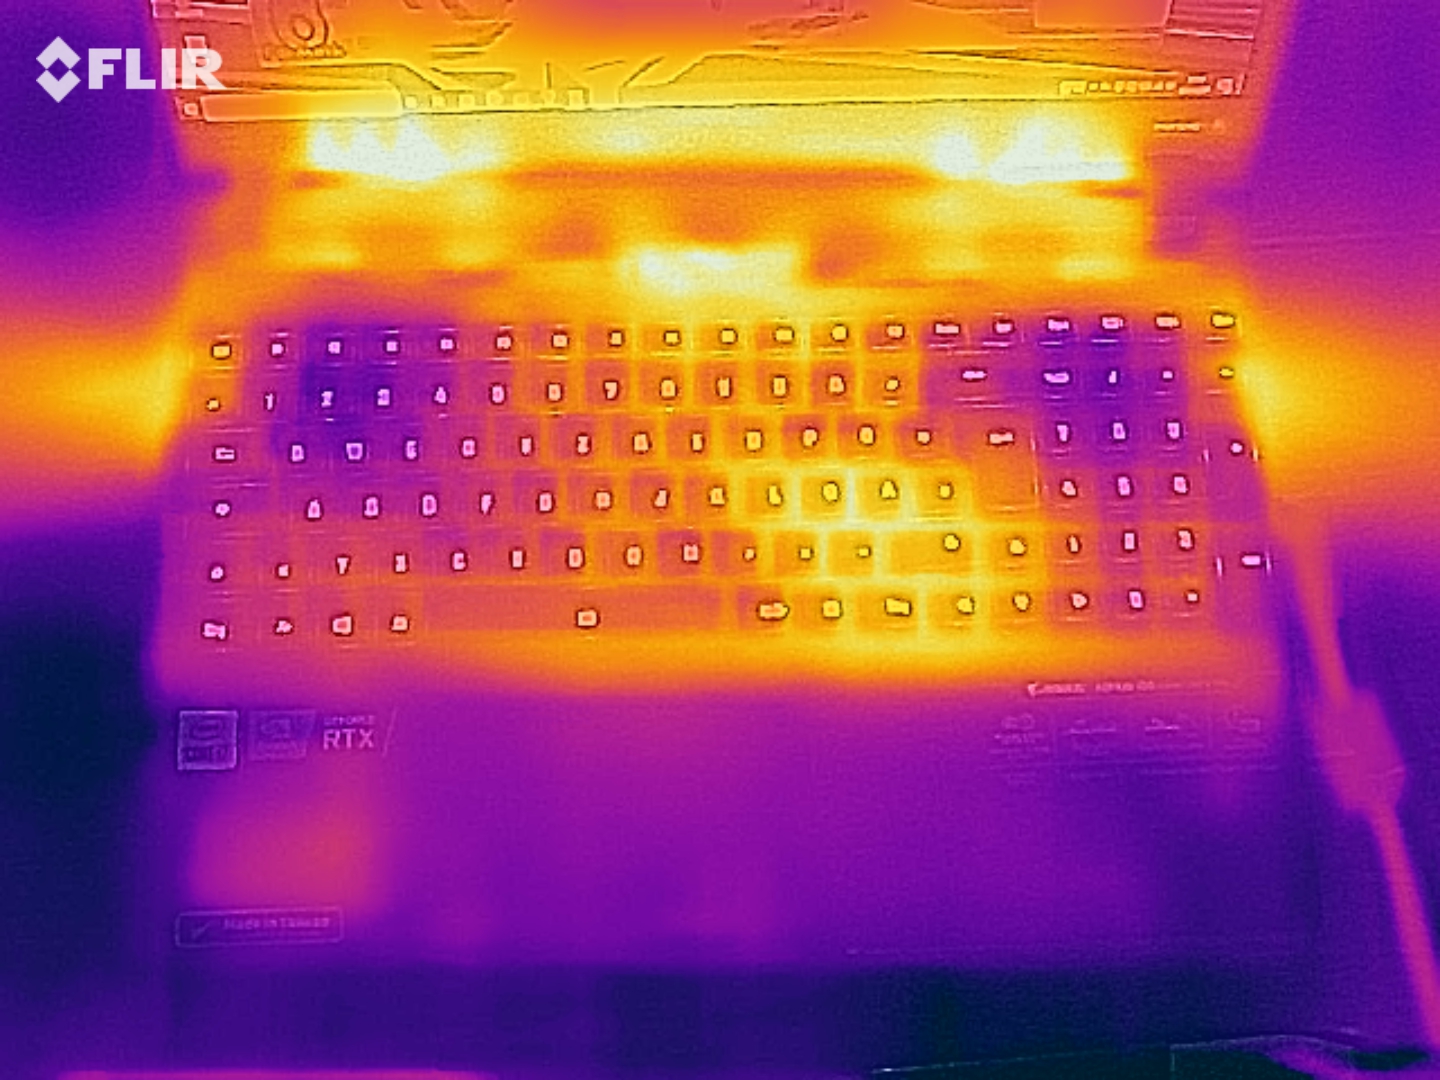
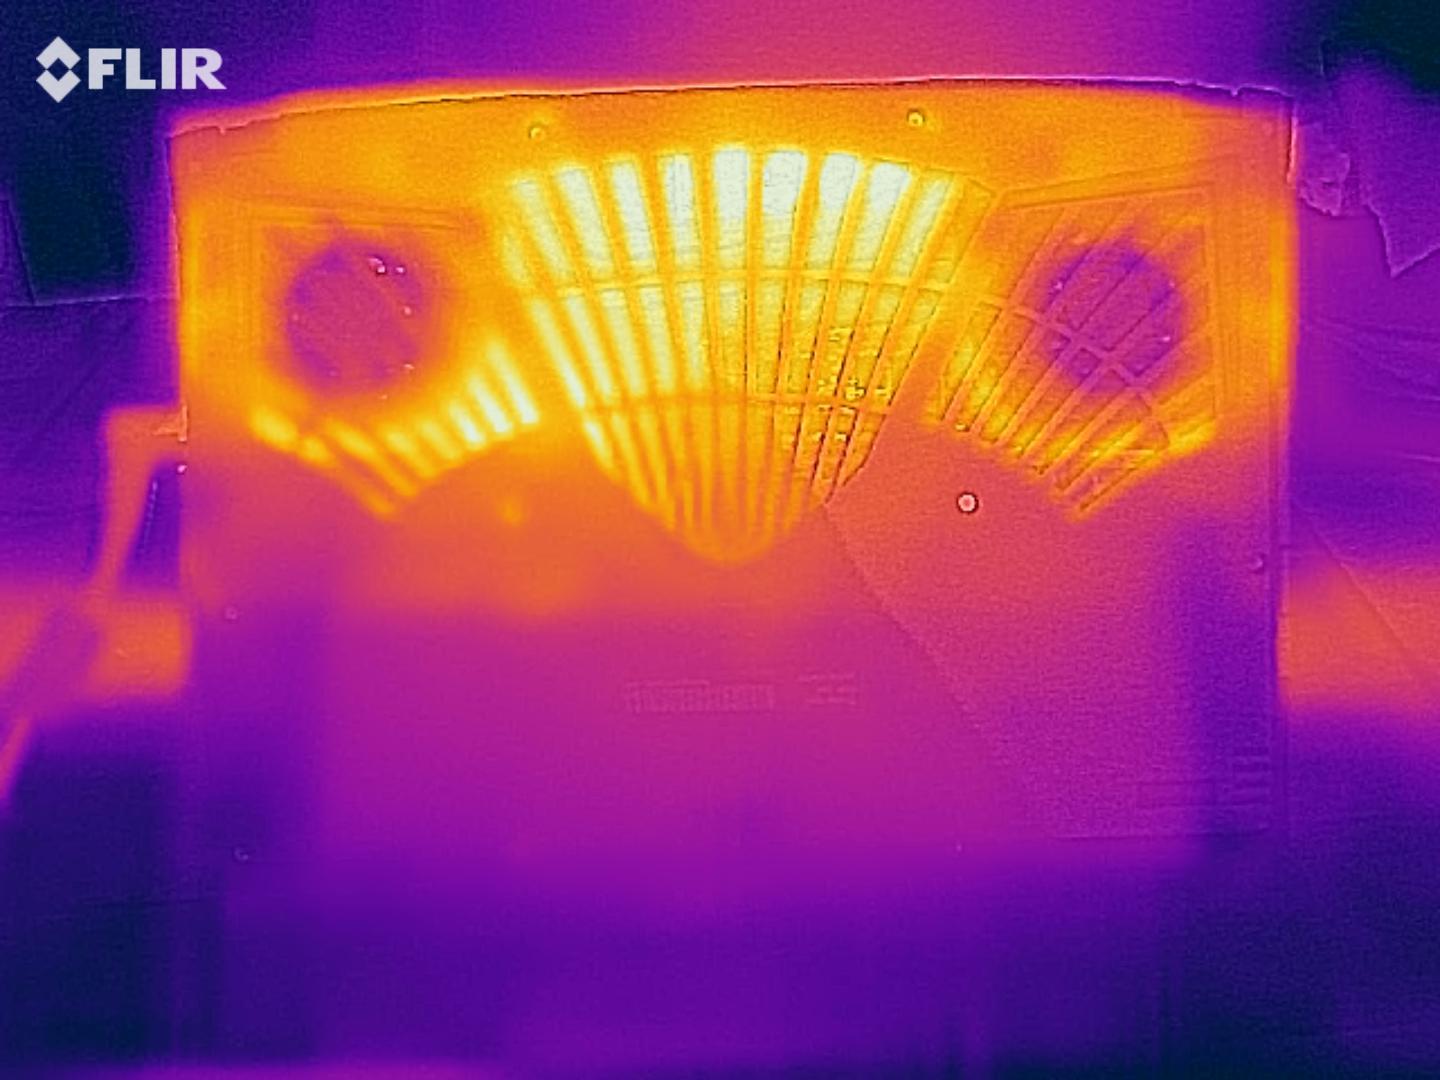
Temperature
The bottom of the base unit becomes particularly hot under strong stress with a surface temperature of up to 61 °C (141.8 °F). The hotspots are in the middle towards the display and the wrist rests and "WASD" keys remain comparably cool.
(±) The maximum temperature on the upper side is 45 °C / 113 F, compared to the average of 40.5 °C / 105 F, ranging from 21.2 to 68.8 °C for the class Gaming.
(-) The bottom heats up to a maximum of 61 °C / 142 F, compared to the average of 43.3 °C / 110 F
(+) In idle usage, the average temperature for the upper side is 25.7 °C / 78 F, compared to the device average of 33.9 °C / 93 F.
(±) Playing The Witcher 3, the average temperature for the upper side is 38 °C / 100 F, compared to the device average of 33.9 °C / 93 F.
(+) The palmrests and touchpad are reaching skin temperature as a maximum (33 °C / 91.4 F) and are therefore not hot.
(-) The average temperature of the palmrest area of similar devices was 28.9 °C / 84 F (-4.1 °C / -7.4 F).
The temperatures are similar to those of the predecessor and 61 °C (194 °F) on the bottom of the base unit are not unusual for a gaming computer.
| Aorus 15G XC i7-10870H, GeForce RTX 3070 Laptop GPU | Aorus 15G XB i7-10875H, GeForce RTX 2070 Super Max-Q | Asus TUF Dash F15 FX516PR i7-11370H, GeForce RTX 3070 Laptop GPU | SCHENKER XMG Neo 17 (Early 2021, RTX 3070, 5800H) R7 5800H, GeForce RTX 3070 Laptop GPU | Razer Blade 15 RTX 2080 Super Max-Q i7-10875H, GeForce RTX 2080 Super Max-Q | SCHENKER Key 15 Comet Lake i7-10875H, GeForce RTX 2080 Super Max-Q | |
|---|---|---|---|---|---|---|
| Heat | -1% | -9% | -10% | -5% | -13% | |
| Maximum Upper Side * | 45 | 44 2% | 55 -22% | 47 -4% | 52 -16% | 52 -16% |
| Maximum Bottom * | 61 | 63 -3% | 56 8% | 51 16% | 53 13% | 62 -2% |
| Idle Upper Side * | 27 | 27 -0% | 29 -7% | 32 -19% | 29.3 -9% | 31 -15% |
| Idle Bottom * | 28 | 29 -4% | 32 -14% | 37 -32% | 30.2 -8% | 33 -18% |
* ... smaller is better
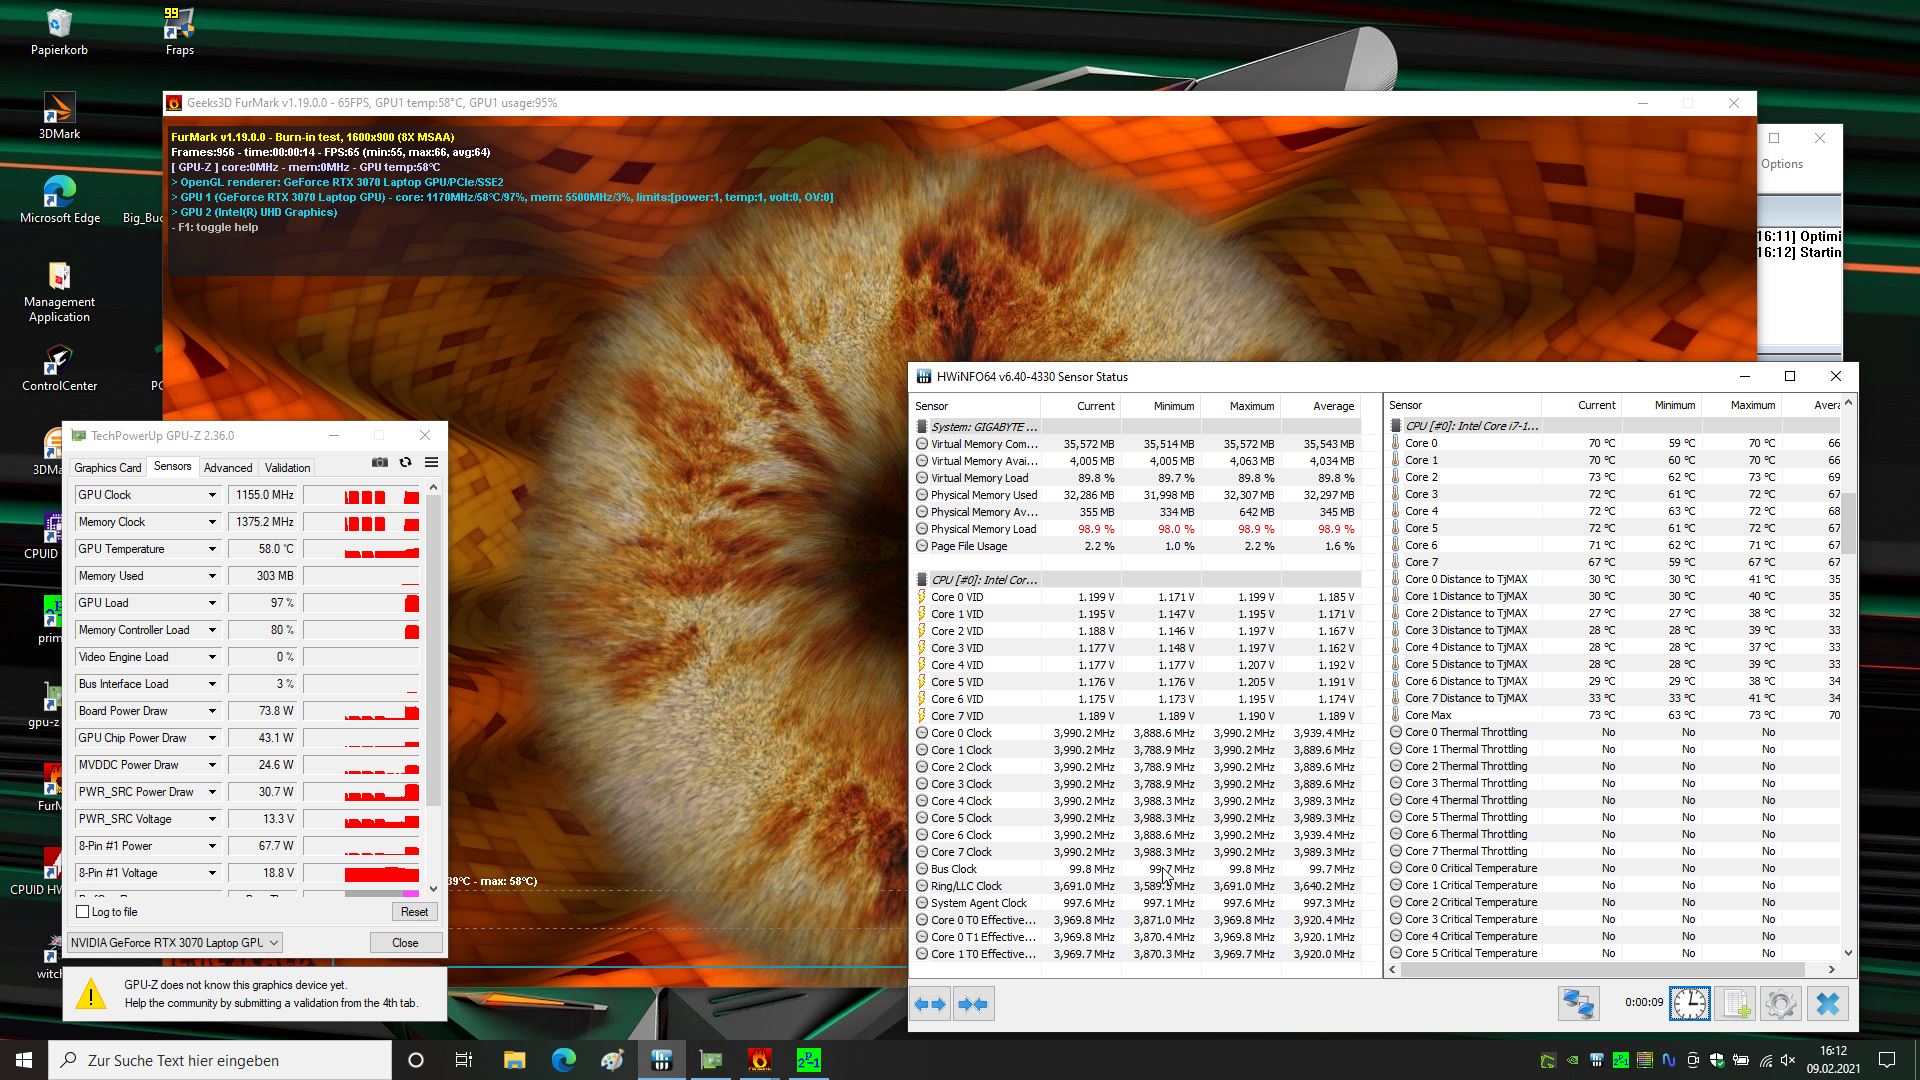
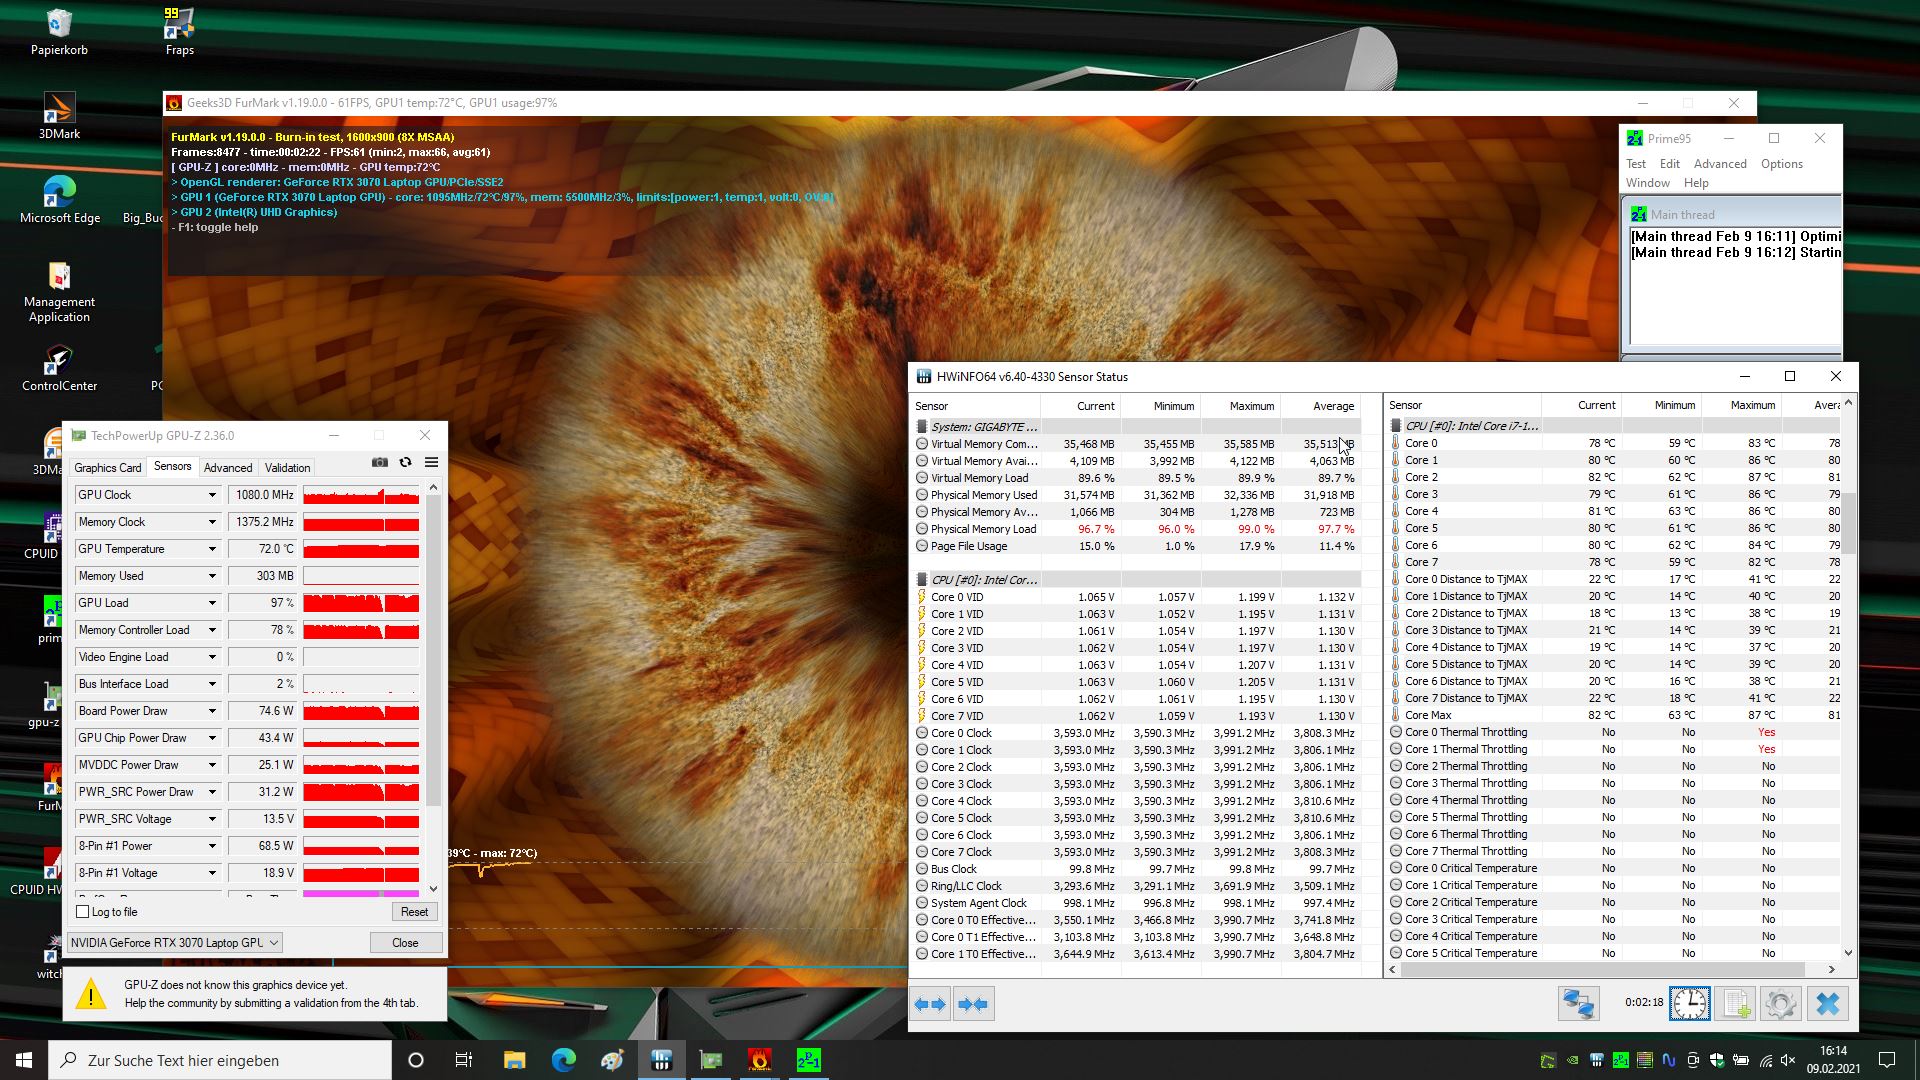
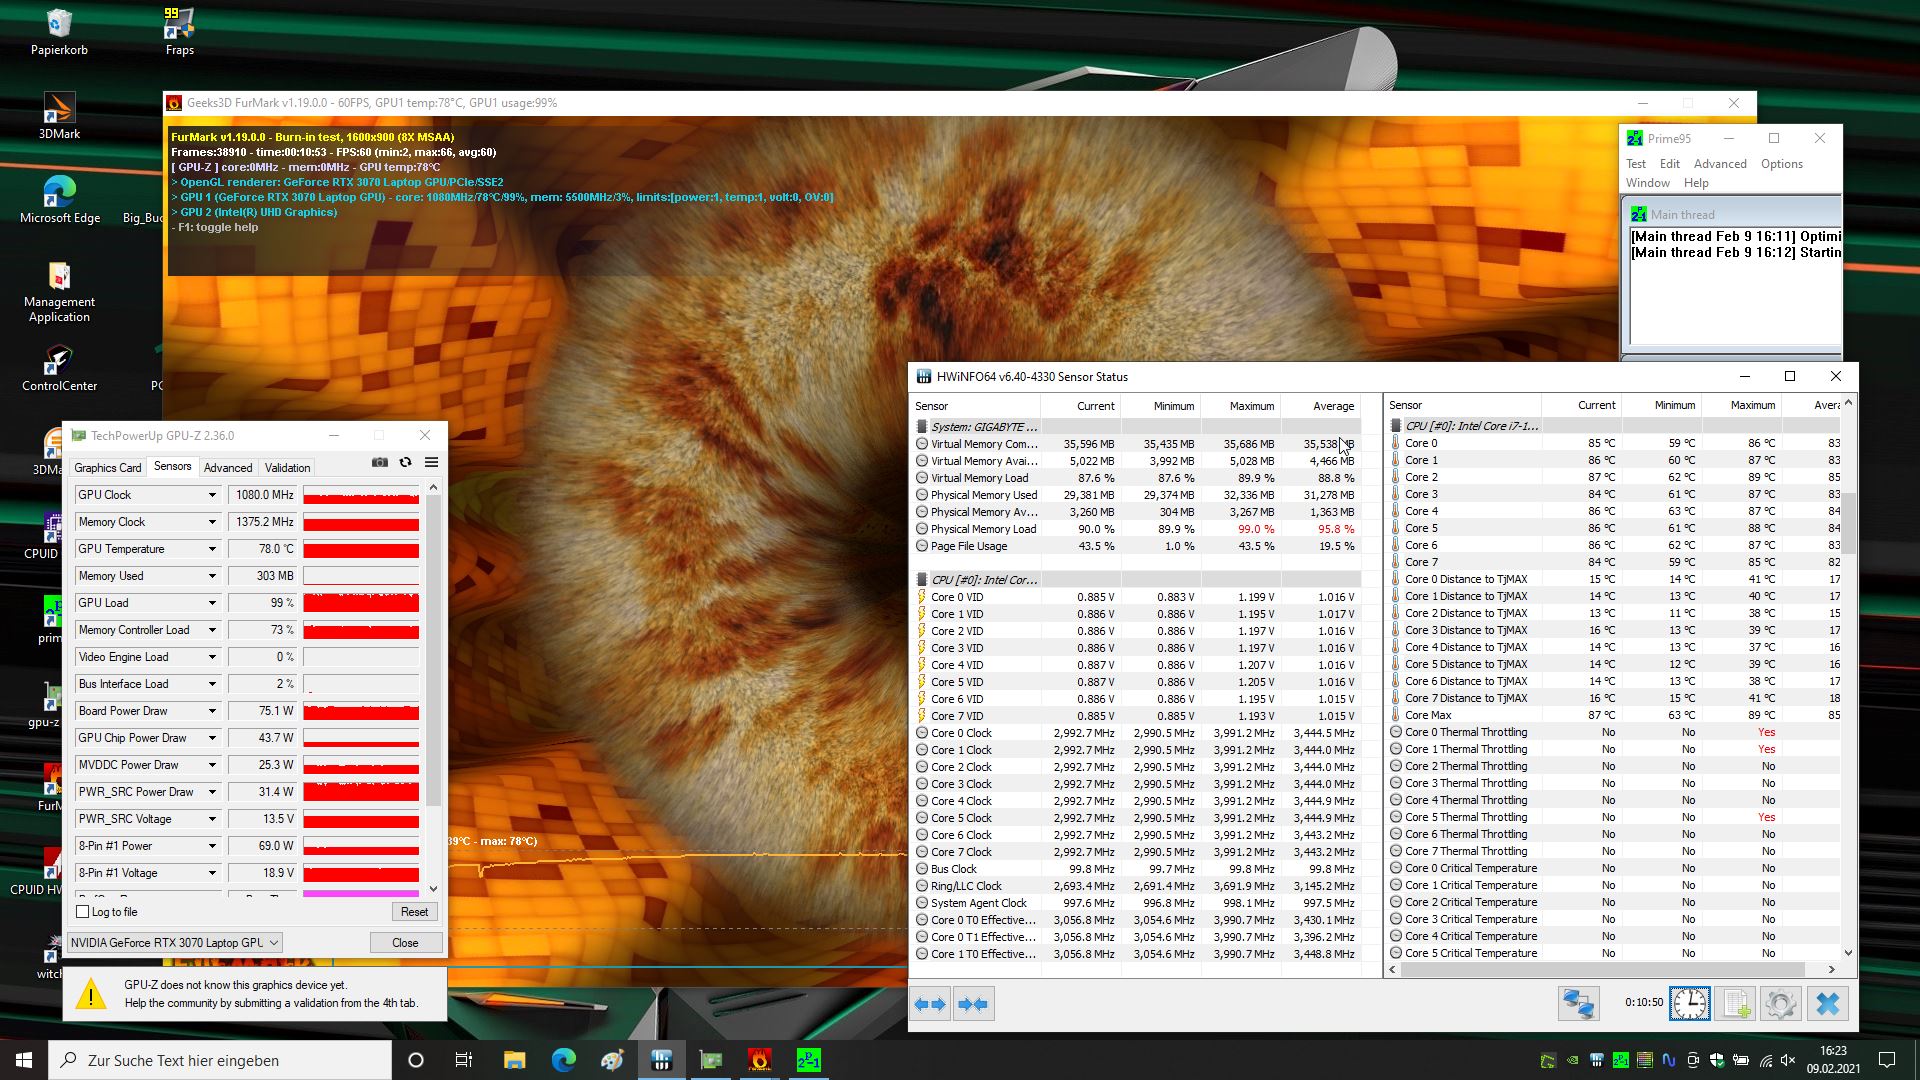
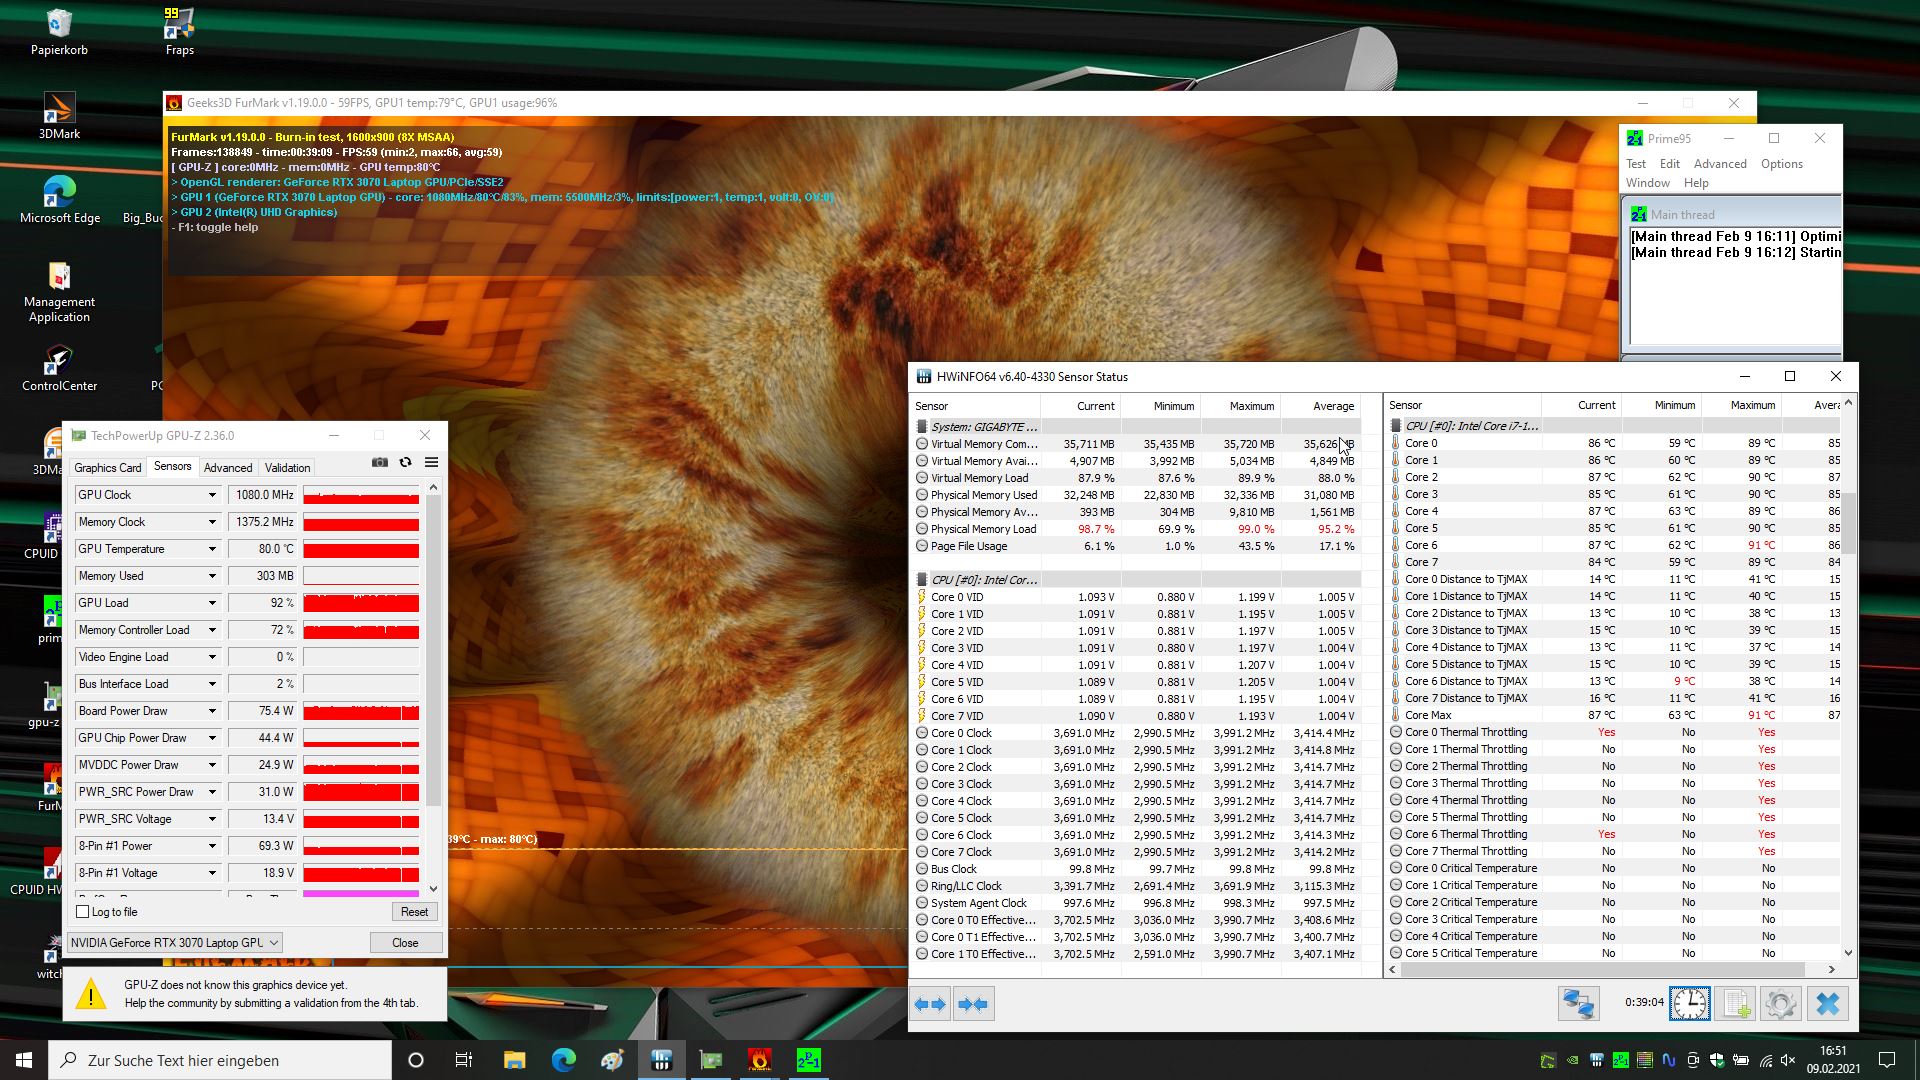
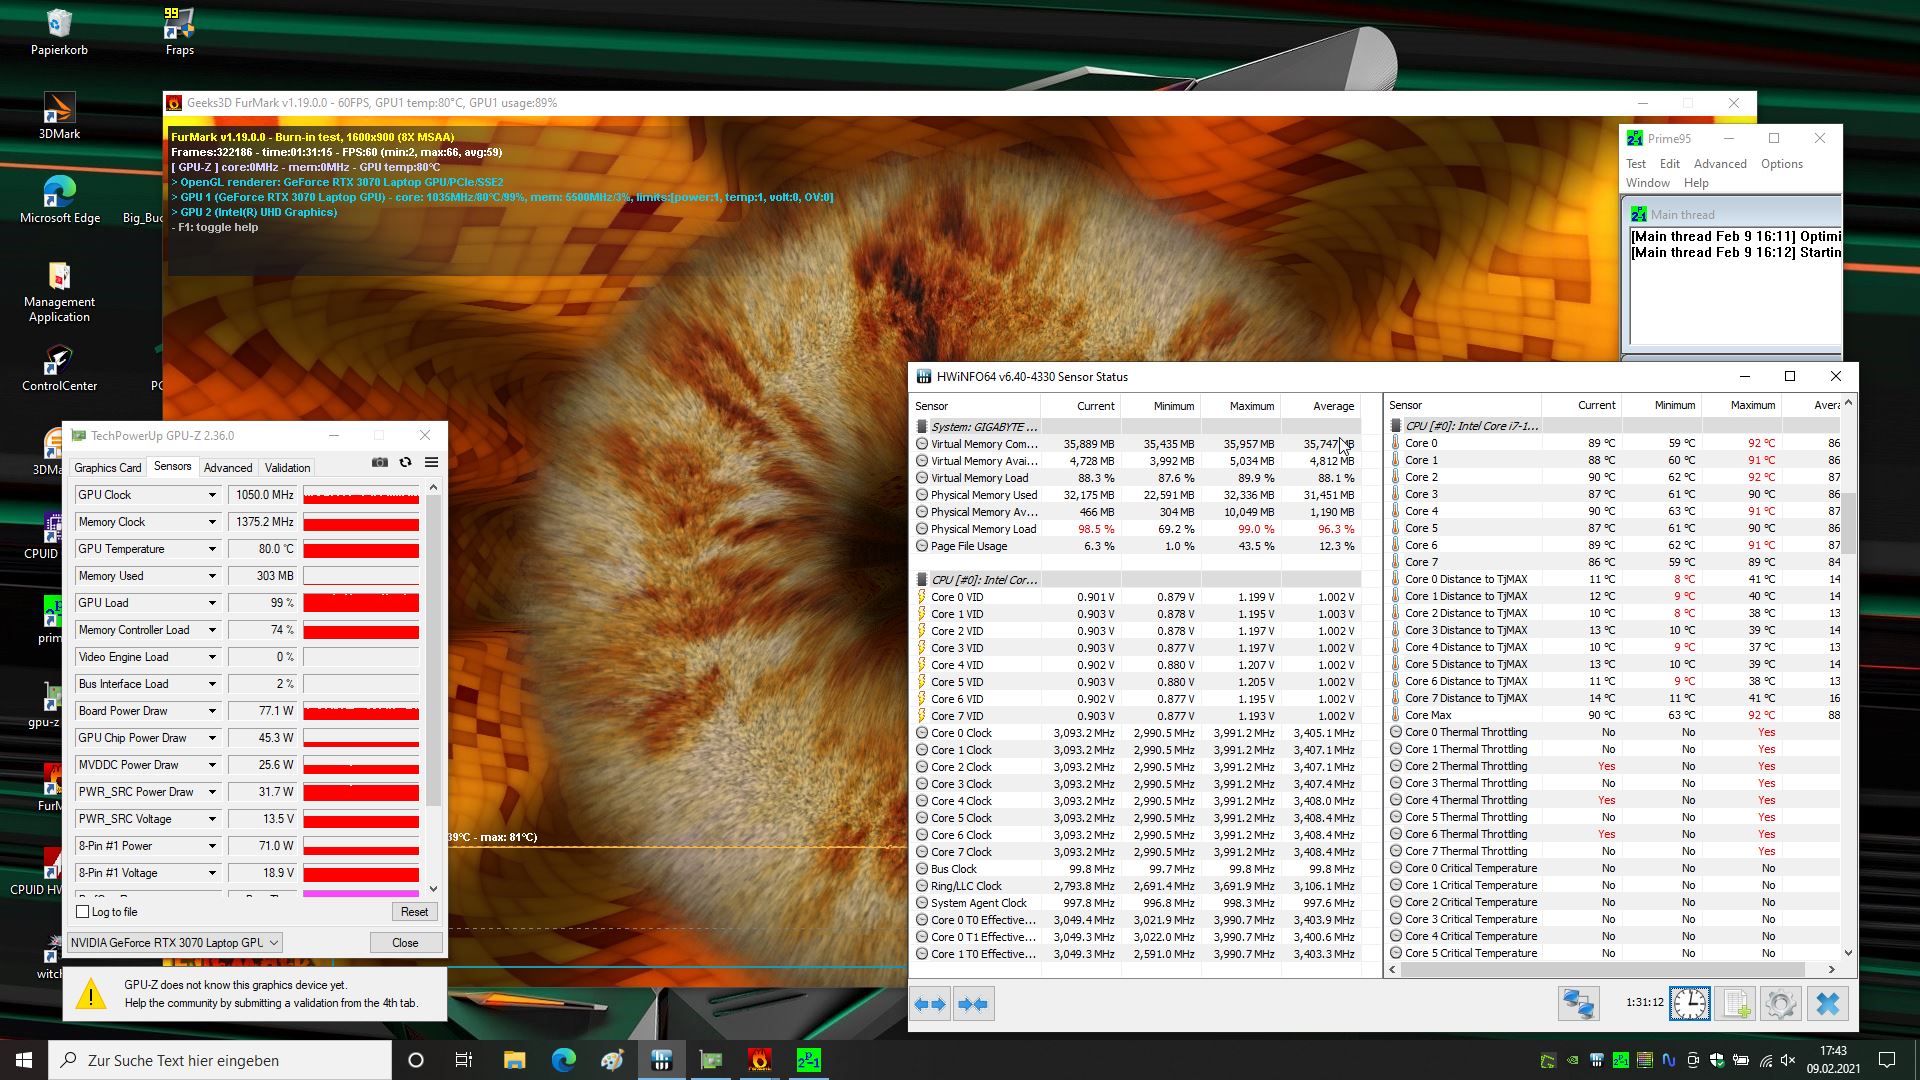
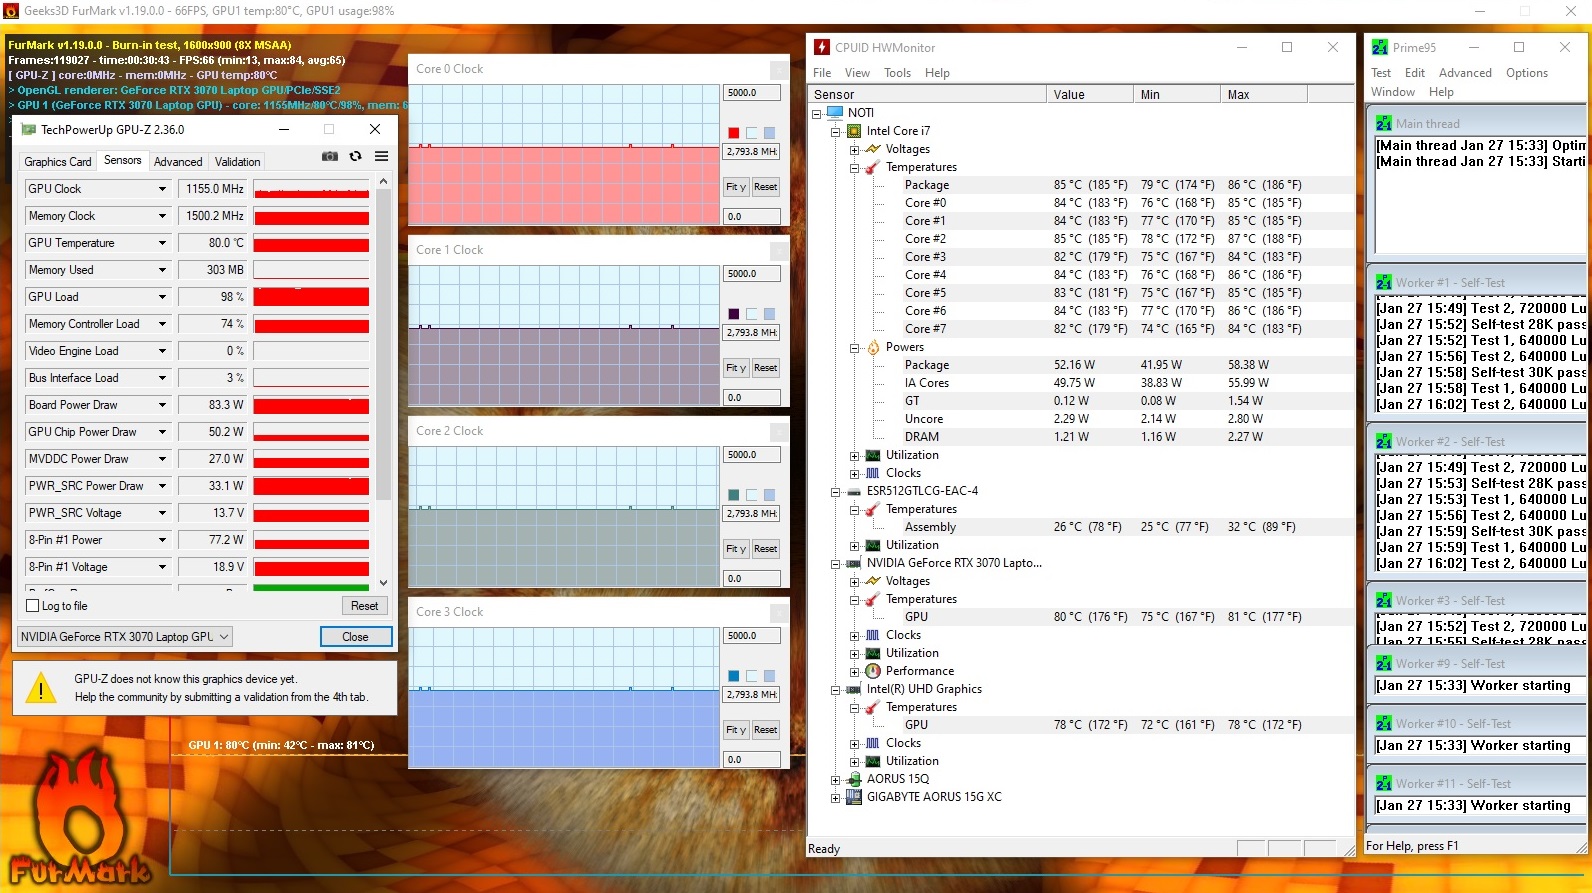
The stress test starts with the eight cores clocking at around 4 GHz. The clock rates start dropping after a few minutes due to thermal throttling and even fall below 3 GHz after 10 minutes. After that, they settle down to between 3 and 3.6 GHz depending on the core temperature. We measured 2.7 to 3 GHz after an hour with the core temperatures fluctuating between 85 and 90 °C (185 and 194 °F) .
The GPU clock rate drops by 100 MHz in total with the memory clock rate remaining constant.
Another 3DMark 11 started right after the stress test did not result in stress-related lack of performance.
Speakers
The speakers are relatively loud and offer balanced highs. Apart from that, they have the usual disadvantage of laptop speakers: bass tones are hardly audible and mids are not made for audio enthusiasts. We recommend connecting external audio devices, e.g. via the headset jack.
Aorus 15G XC audio analysis
(+) | speakers can play relatively loud (83 dB)
Bass 100 - 315 Hz
(-) | nearly no bass - on average 22% lower than median
(±) | linearity of bass is average (10.7% delta to prev. frequency)
Mids 400 - 2000 Hz
(±) | higher mids - on average 5.7% higher than median
(+) | mids are linear (5.5% delta to prev. frequency)
Highs 2 - 16 kHz
(+) | balanced highs - only 1.9% away from median
(+) | highs are linear (5.6% delta to prev. frequency)
Overall 100 - 16.000 Hz
(±) | linearity of overall sound is average (17.4% difference to median)
Compared to same class
» 47% of all tested devices in this class were better, 12% similar, 41% worse
» The best had a delta of 6%, average was 18%, worst was 132%
Compared to all devices tested
» 31% of all tested devices were better, 8% similar, 61% worse
» The best had a delta of 4%, average was 24%, worst was 134%
Apple MacBook 12 (Early 2016) 1.1 GHz audio analysis
(+) | speakers can play relatively loud (83.6 dB)
Bass 100 - 315 Hz
(±) | reduced bass - on average 11.3% lower than median
(±) | linearity of bass is average (14.2% delta to prev. frequency)
Mids 400 - 2000 Hz
(+) | balanced mids - only 2.4% away from median
(+) | mids are linear (5.5% delta to prev. frequency)
Highs 2 - 16 kHz
(+) | balanced highs - only 2% away from median
(+) | highs are linear (4.5% delta to prev. frequency)
Overall 100 - 16.000 Hz
(+) | overall sound is linear (10.2% difference to median)
Compared to same class
» 6% of all tested devices in this class were better, 2% similar, 91% worse
» The best had a delta of 5%, average was 19%, worst was 53%
Compared to all devices tested
» 4% of all tested devices were better, 1% similar, 95% worse
» The best had a delta of 4%, average was 24%, worst was 134%
Energy Management - more economical than its predecessor
Power Consumption
The consumption rates are similar to those of the predecessor and actually offer better results under certain loads despite the improved graphics performance. Consumption while idling in particular was optimized while the power consumption under maximum load dropped slightly as well. Overall, the Aorus positions itself between the energy-efficient Asus TUF Dash and the slightly more demanding Schenker XMG.
| Off / Standby | |
| Idle | |
| Load |
|
Key:
min: | |
| Aorus 15G XC i7-10870H, GeForce RTX 3070 Laptop GPU | Aorus 15G XB i7-10875H, GeForce RTX 2070 Super Max-Q | Asus TUF Dash F15 FX516PR i7-11370H, GeForce RTX 3070 Laptop GPU | SCHENKER XMG Neo 17 (Early 2021, RTX 3070, 5800H) R7 5800H, GeForce RTX 3070 Laptop GPU | Razer Blade 15 RTX 2080 Super Max-Q i7-10875H, GeForce RTX 2080 Super Max-Q | SCHENKER Key 15 Comet Lake i7-10875H, GeForce RTX 2080 Super Max-Q | Average of class Gaming | |
|---|---|---|---|---|---|---|---|
| Power Consumption | -13% | 24% | -10% | 12% | 12% | -12% | |
| Idle Minimum * | 13 | 16 -23% | 9 31% | 13 -0% | 10.6 18% | 10 23% | 14.2 ? -9% |
| Idle Average * | 16 | 20 -25% | 11 31% | 16 -0% | 13.1 18% | 14 12% | 20.2 ? -26% |
| Idle Maximum * | 30 | 30 -0% | 16 47% | 26 13% | 15.8 47% | 18 40% | 27.2 ? 9% |
| Load Average * | 92 | 102 -11% | 107 -16% | 125 -36% | 131 -42% | 106 -15% | 107.7 ? -17% |
| Witcher 3 ultra * | 154 | 156 -1% | 121 21% | 187 -21% | 146 5% | 142 8% | |
| Load Maximum * | 223 | 256 -15% | 162 27% | 259 -16% | 169 24% | 210 6% | 260 ? -17% |
* ... smaller is better
Battery Life
The battery capacity has increased slightly from 94 to 99 Wh. Despite this improvement, the battery life in our practical tests focusing on Wi-Fi use (-9 percent) and videos (-15 percent) has dropped, which is particularly surprising considering the lower power consumption rates. The battery life has increased under maximum load, which is mainly connected to the non-configurable energy saving settings on battery mode. Fortunately, the Aorus series is equipped with comparably large batteries. The competition features smaller batteries that make them a lot less portable.
| Aorus 15G XC i7-10870H, GeForce RTX 3070 Laptop GPU, 99 Wh | Aorus 15G XB i7-10875H, GeForce RTX 2070 Super Max-Q, 94 Wh | Asus TUF Dash F15 FX516PR i7-11370H, GeForce RTX 3070 Laptop GPU, 76 Wh | SCHENKER XMG Neo 17 (Early 2021, RTX 3070, 5800H) R7 5800H, GeForce RTX 3070 Laptop GPU, 62 Wh | Razer Blade 15 RTX 2080 Super Max-Q i7-10875H, GeForce RTX 2080 Super Max-Q, 80 Wh | SCHENKER Key 15 Comet Lake i7-10875H, GeForce RTX 2080 Super Max-Q, 73 Wh | Average of class Gaming | |
|---|---|---|---|---|---|---|---|
| Battery Runtime | 9% | 55% | -55% | -5% | -26% | -5% | |
| Reader / Idle | 573 | 579 1% | 957 67% | 281 -51% | 522 -9% | 418 -27% | 570 ? -1% |
| H.264 | 388 | 459 18% | 437 13% | 344 -11% | 457 ? 18% | ||
| WiFi v1.3 | 380 | 418 10% | 544 43% | 208 -45% | 366 -4% | 289 -24% | 387 ? 2% |
| Load | 137 | 147 7% | 44 -68% | 113 -18% | 80 -42% | 85.8 ? -37% |
Pros
Cons
Verdict - a pause on innovation or even a step back?
The Aorus 15G XC remains competitive thanks to its new and powerful RTX 3070 - despite the CPU not being updated. Gamers who don't know the predecessor will be very pleased with the new Aorus. It offers good performance and manages to deal with temperatures and volumes quite well. It's also fairly portable for a gaming laptop thanks to its large battery.
If you are familiar with the predecessor, however, you might be somewhat disappointed. Gigabyte has cut several popular features and decided not to include any innovations other than the new GPU. The predecessor's mechanical keyboard as well as Thunderbolt support, the fingerprint reader and the high-quality metal case were all let go in the name of progress. Not only has the processor not been upgraded - it has actually been downgraded slightly, although the small difference in performance is hardly noticeable in practice. If you can make do without a 15 to 20 percent increase in graphics performance, you should definitely take the previous model into consideration.
The Aorus 15G XC is a high-performance gaming laptop without any major issues. Nonetheless, the lack of innovation other than the new GPU and the many missing features compared to the predecessor are a little disappointing.
Price and Availability
Aorus 15G XC
- 02/15/2021 v7 (old)
Christian Hintze

Price comparison

