

MSI Katana 15 laptop review: Budget gamer with RTX 4050 and Alder Lake CPU
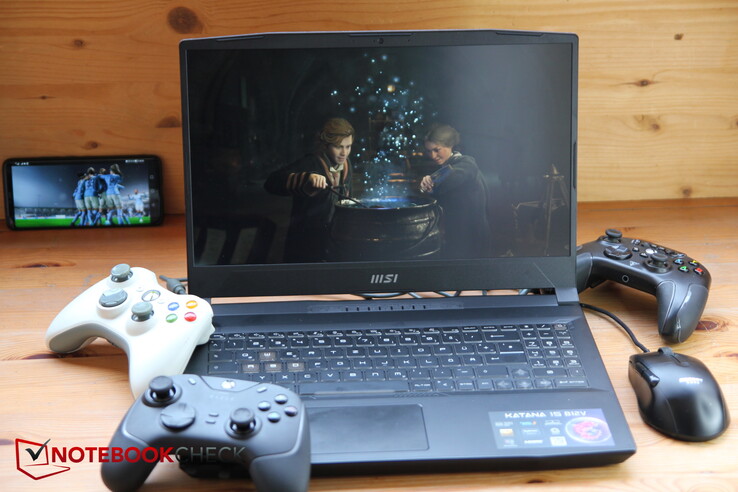
MSI has a line of laptops that visually appear very similar. Last year we reviewed the 15.6-inch quasi-predecessor, the MSI Katana GF66 12UGS, but the Pulse GL66 or MSI Sword also strike the same visual note. Our current review configuration is interesting because MSI has decided to combine an "old" Alder Lake processor with a new RTX 4050 in order to possibly be among the first to release a gaming laptop with an RTX 40xx card. The designation is Katana 15 B12, while the Katana 15 B13 already has an Intel Gen13 and an RTX 40xx. We'll take a look at how the two CPU/GPU generations compare in our B12 model.
Since the Katana 15 is one of the first laptops with an RTX 4050 to be reviewed, we largely fall back on the previous generation of entry-level to mid-range gamers with the RTX 3060 for comparison. These include the Lenovo Legion 5, the Schenker XMG Core 15, the MSI Pulse GL66 and the Asus TUF Gaming F15. The predecessor is also included for comparison, but readers should note that it was equipped with the stronger RTX 3070 Ti.
Possible Competitors in Comparison
Rating | Date | Model | Weight | Height | Size | Resolution | Price |
|---|---|---|---|---|---|---|---|
| 82.9 % v7 (old) | 03 / 2023 | MSI Katana 15 B12VEK i7-12650H, GeForce RTX 4050 Laptop GPU | 2.3 kg | 24.9 mm | 15.60" | 1920x1080 | |
| 80.3 % v7 (old) | 06 / 2022 | MSI Katana GF66 12UGS i7-12700H, GeForce RTX 3070 Ti Laptop GPU | 2.3 kg | 27.5 mm | 15.60" | 1920x1080 | |
| 80.7 % v7 (old) | 04 / 2022 | MSI Pulse GL66 12UEK i9-12900H, GeForce RTX 3060 Laptop GPU | 2.3 kg | 25 mm | 15.60" | 1920x1080 | |
| 87.5 % v7 (old) | 11 / 2022 | Lenovo Legion 5 15IAH7H 82RB i7-12700H, GeForce RTX 3060 Laptop GPU | 2.4 kg | 19.99 mm | 15.60" | 1920x1080 | |
| 87.2 % v7 (old) | 03 / 2022 | Asus TUF Gaming F15 FX507ZM i7-12700H, GeForce RTX 3060 Laptop GPU | 2.1 kg | 24.95 mm | 15.60" | 1920x1080 | |
| 87.9 % v7 (old) | 01 / 2023 | Schenker XMG Core 15 (M22) R7 6800H, GeForce RTX 3060 Laptop GPU | 2.1 kg | 23 mm | 15.60" | 2560x1440 |
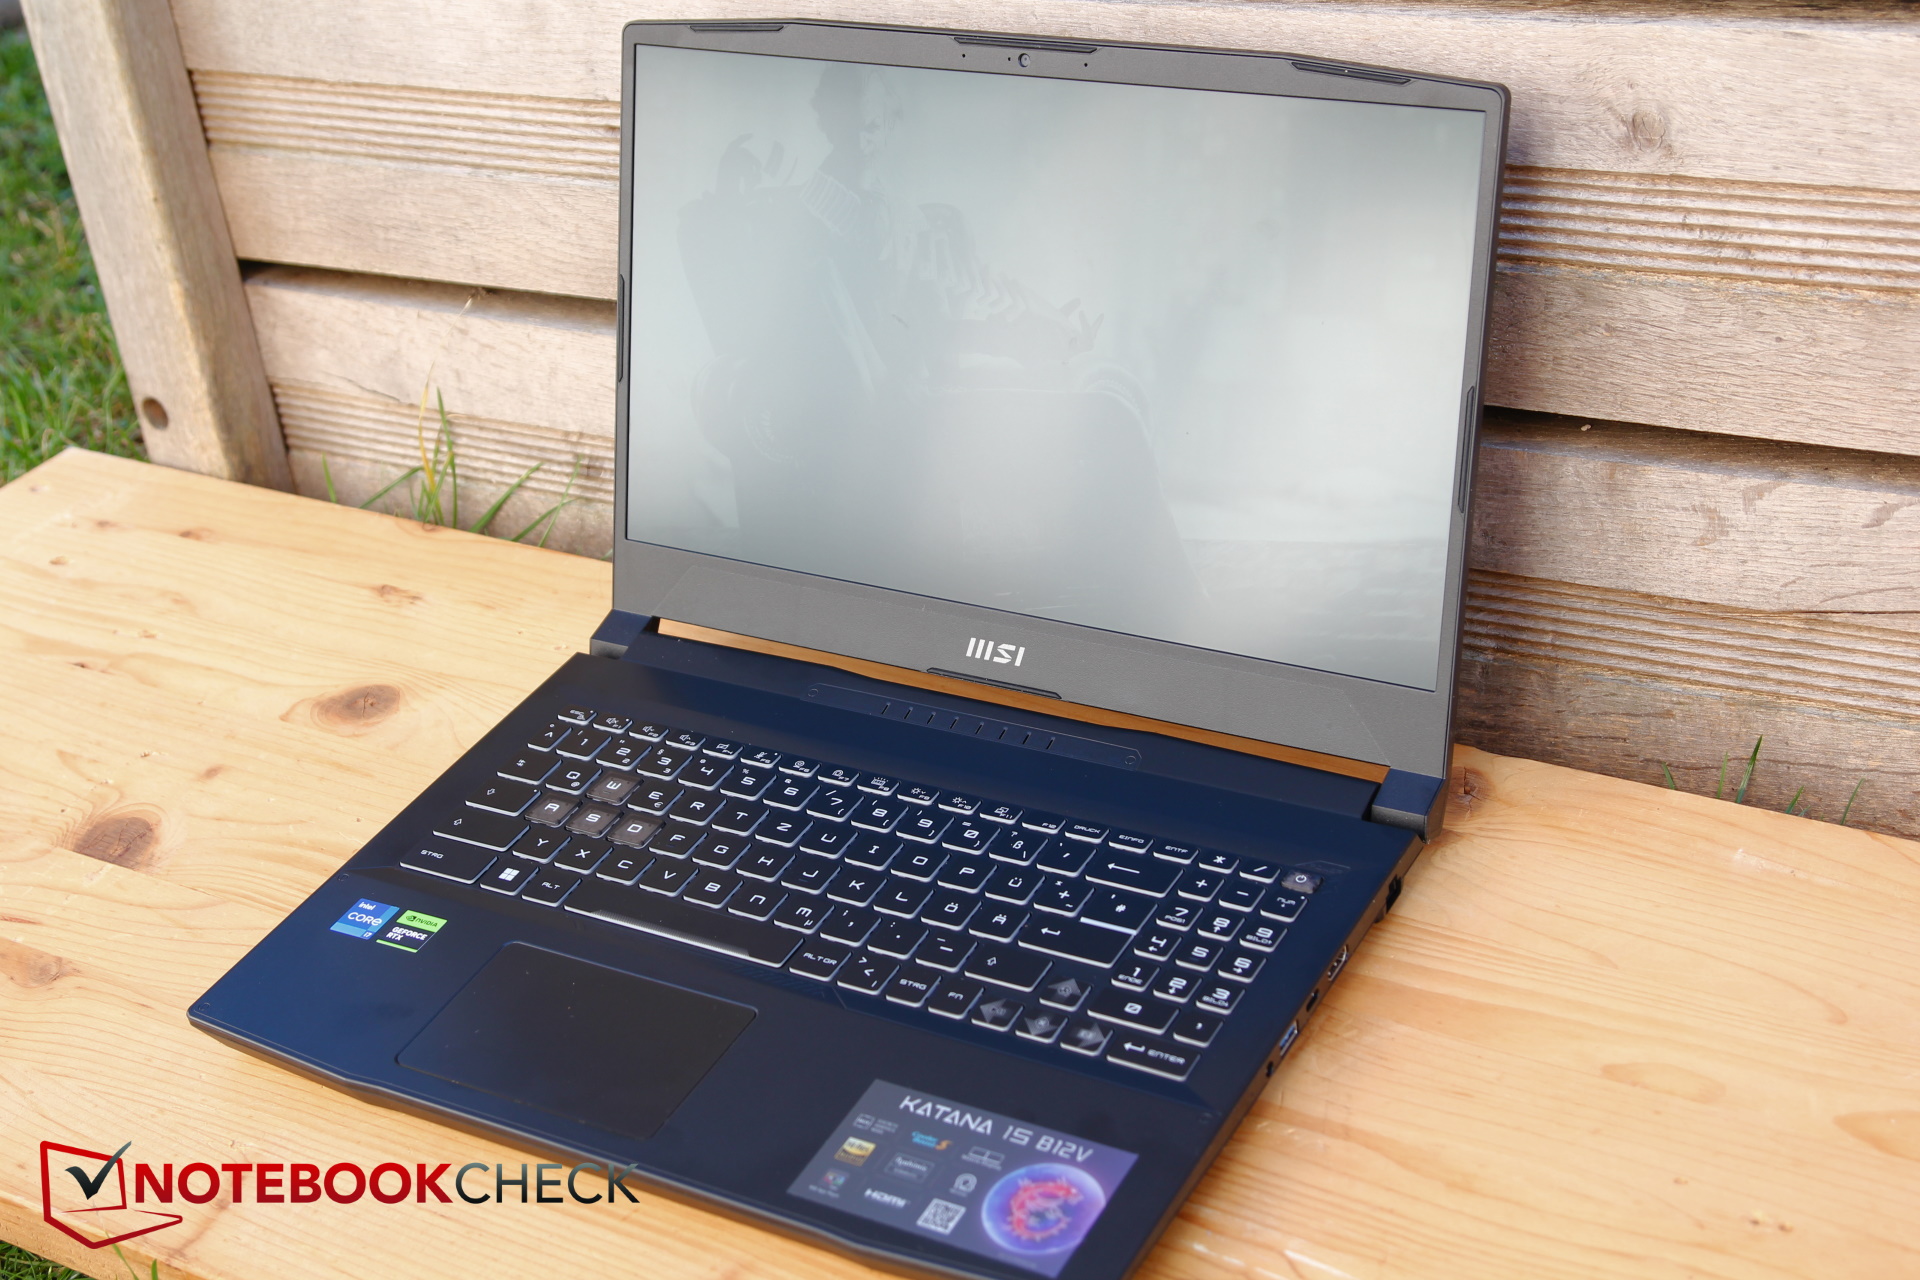
Case - Plastic Katana
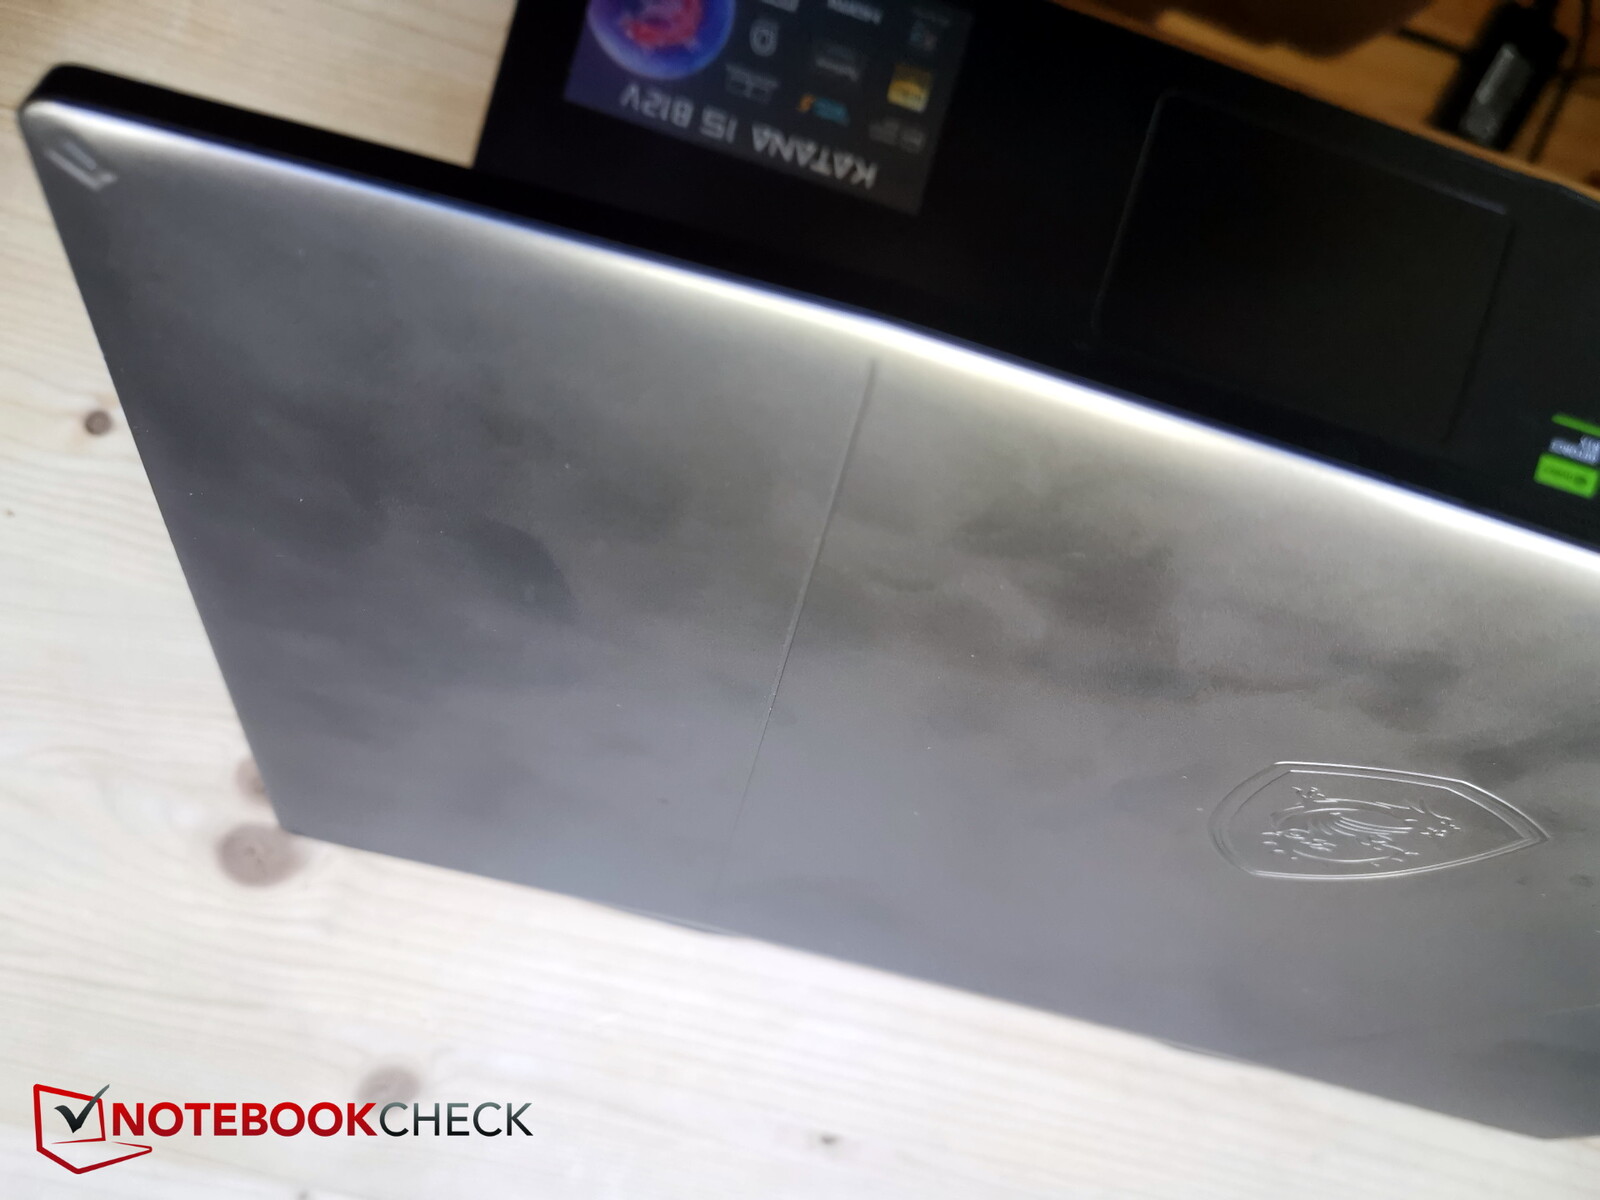
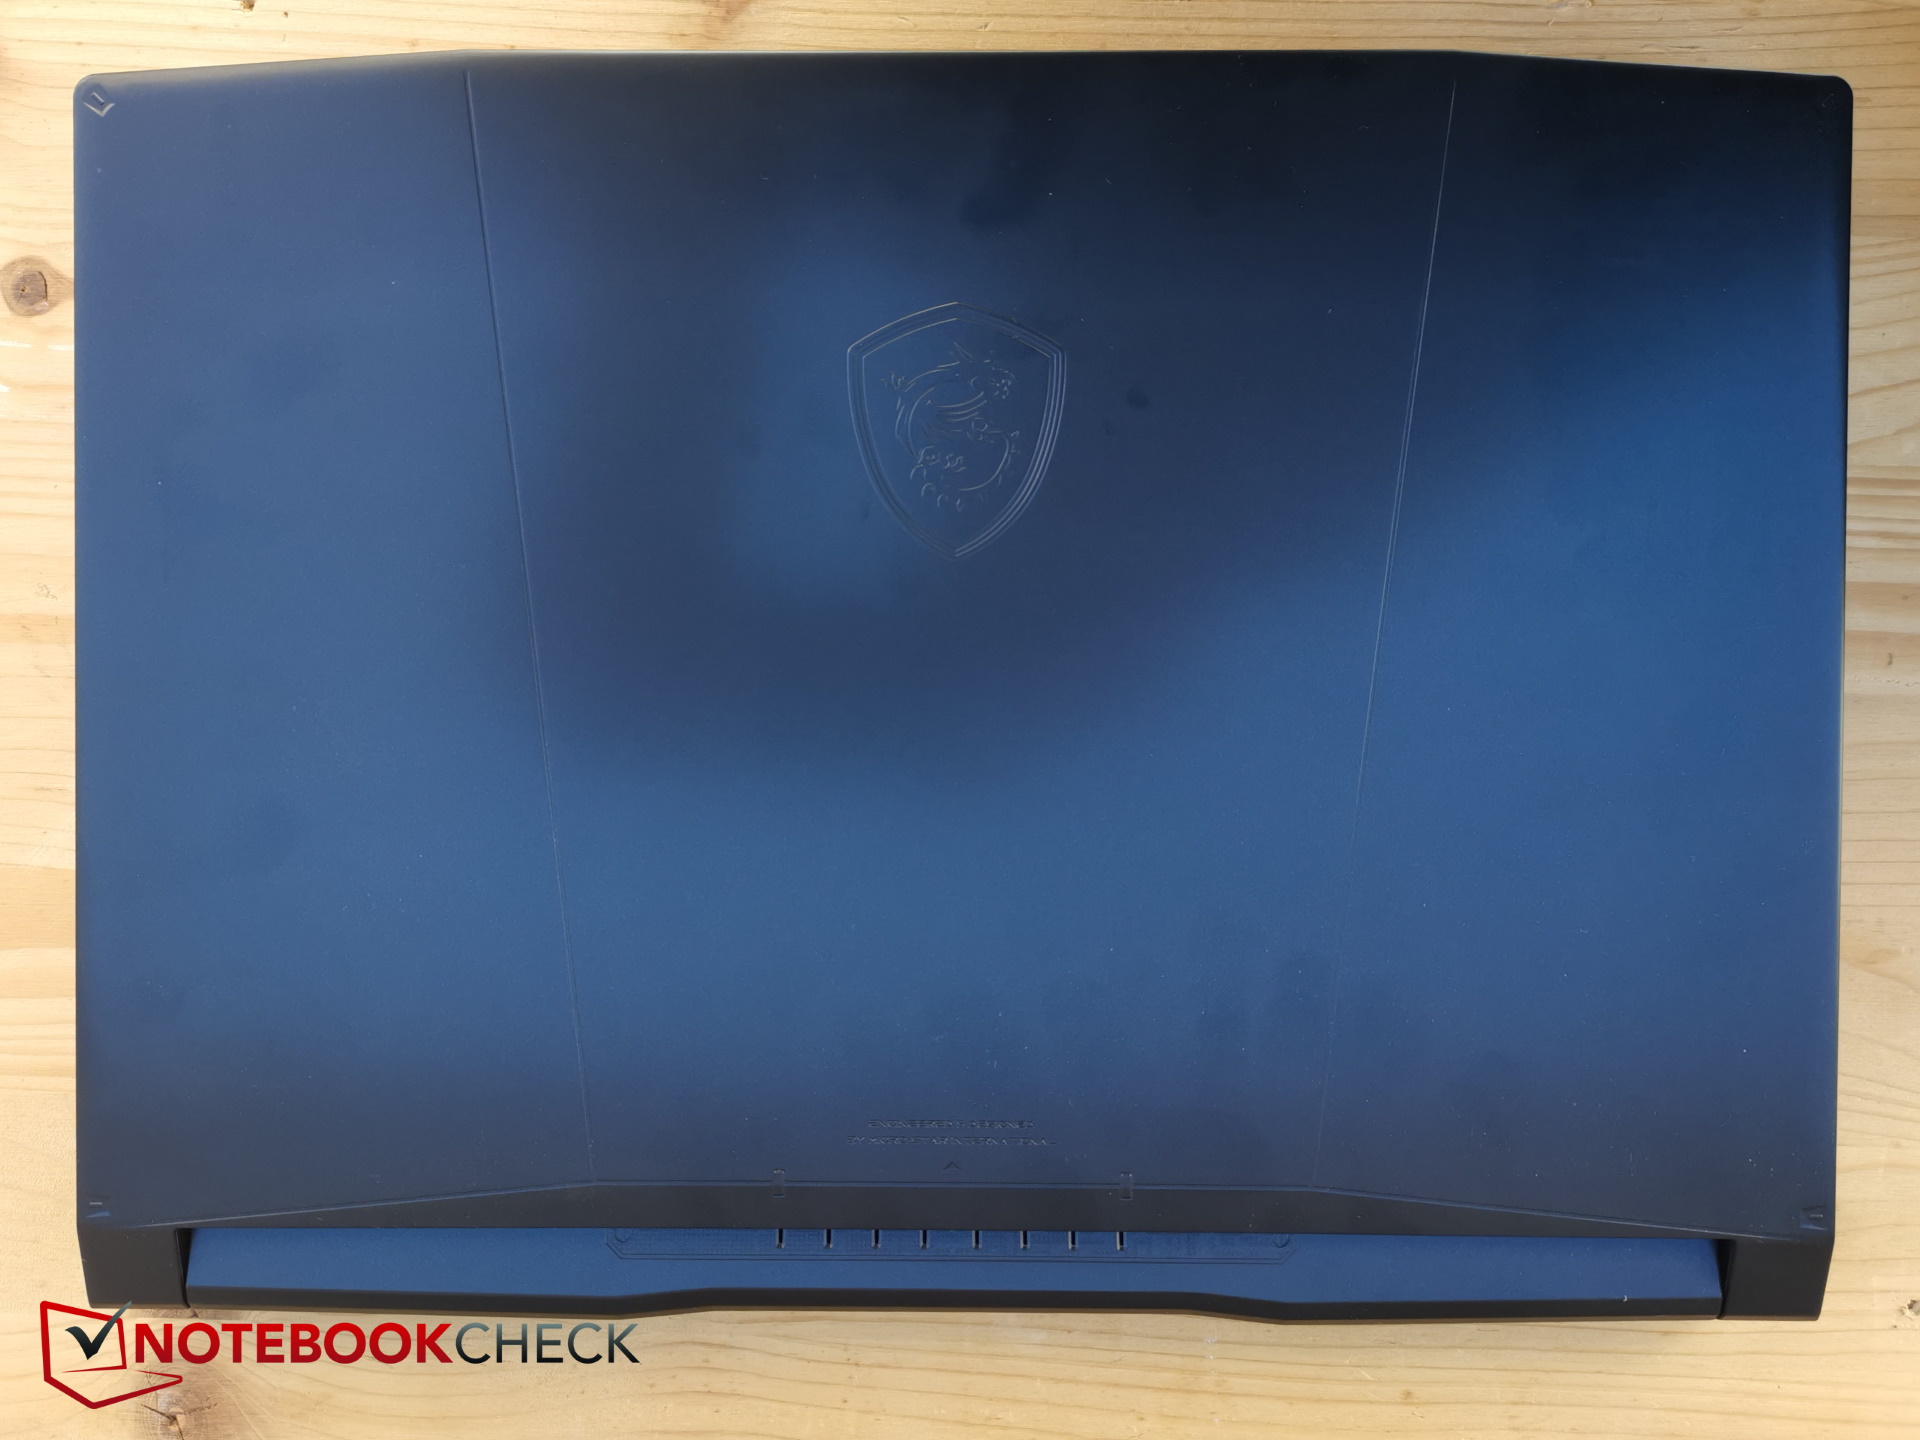
The case of the Katana 15 is made entirely of plastic, even if the smooth surface materials of the display lid and the base appear almost like metal. The sides now show a black and gray pattern. Unfortunately, the case also proves very susceptible to fingerprints.
The opening angle is 180 degrees. Next to the logo, a few lines and die-cuts decorate the shiny black surface of the lid. The display wobbles for longer than usual after opening or adjusting the angle.
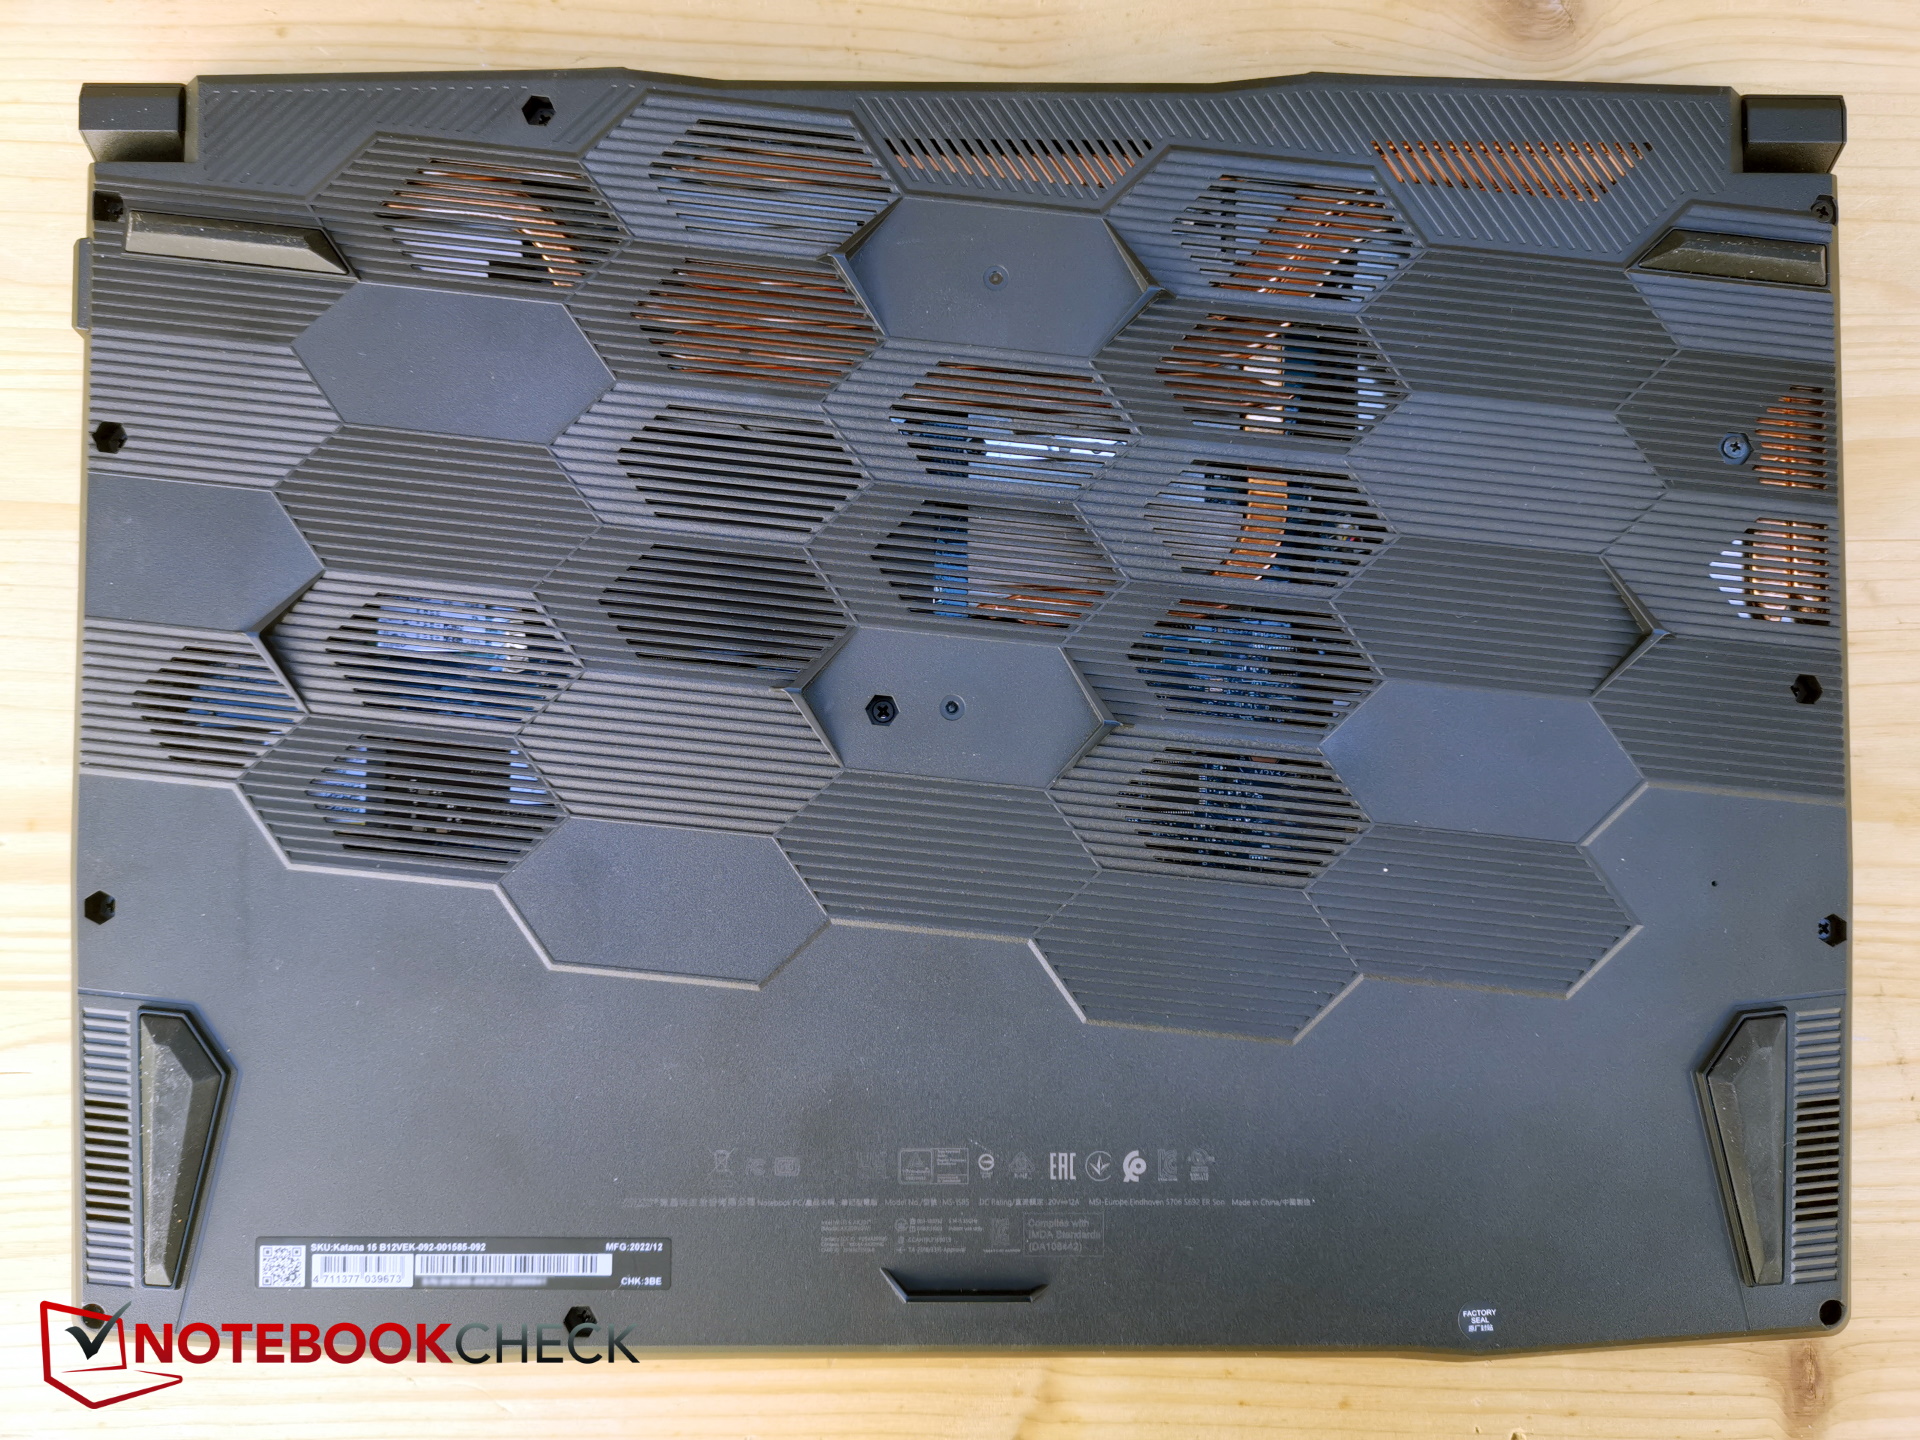
The underside is made of softer plastic. The base is relatively torsion-resistant, but emits some cracking sounds. Contrariwise, the lid is much easier to bend and emits a creaking sound. The display edges are narrow on the sides, but rather wide at the top and bottom by today's standards.
The 2023 Katana 15 is slightly thinner than last year's Katana GF66 and inherits the dimensions and weight of the Pulse GL66. The Legion 5 is again even thinner, but so is the Core 15, albeit minimally.
Equipment - Last last gen
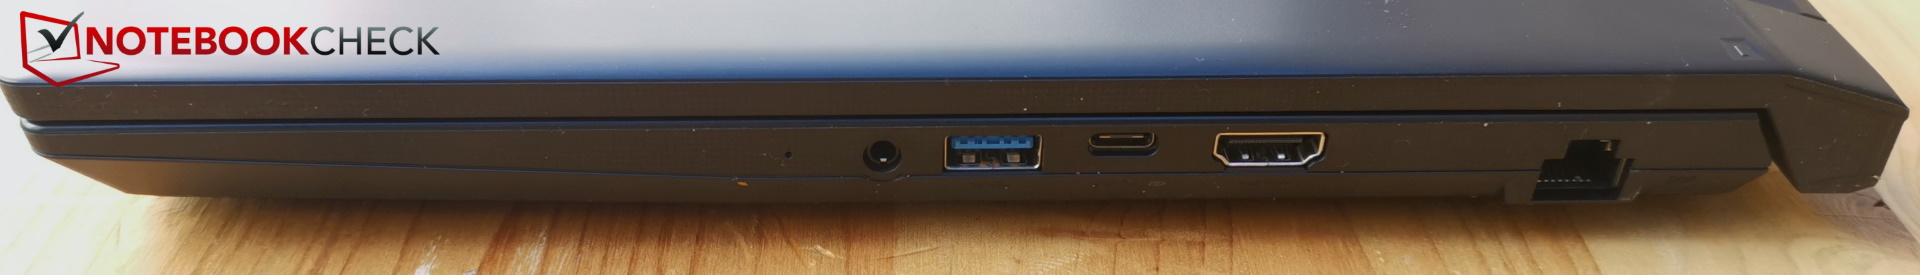
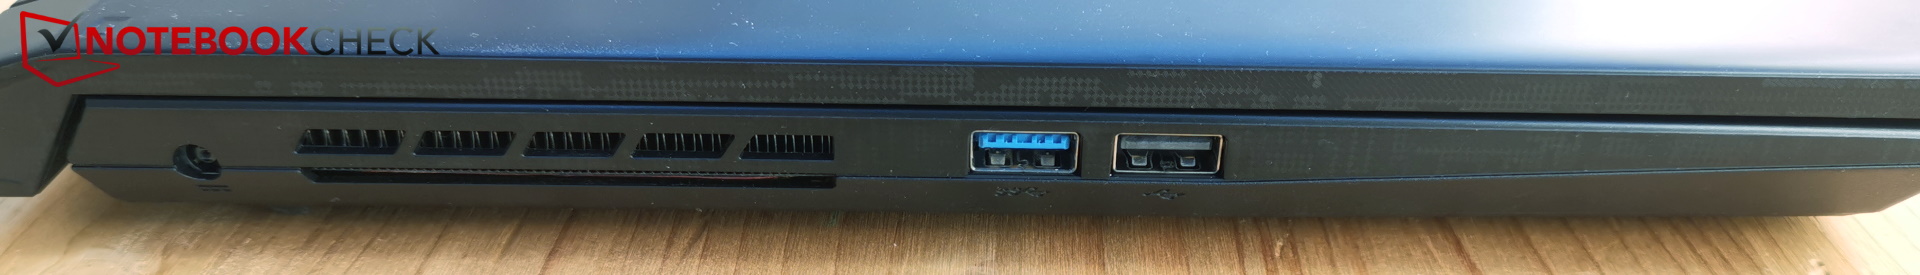
The port arrangement is the same for all three MSI models. In fact, one of the three USB-A ports is still type 2.0, which doesn't really belong in the current era. The same applies to the one USB-C slot, which does not support Thunderbolt and only offers 3.0 speed.
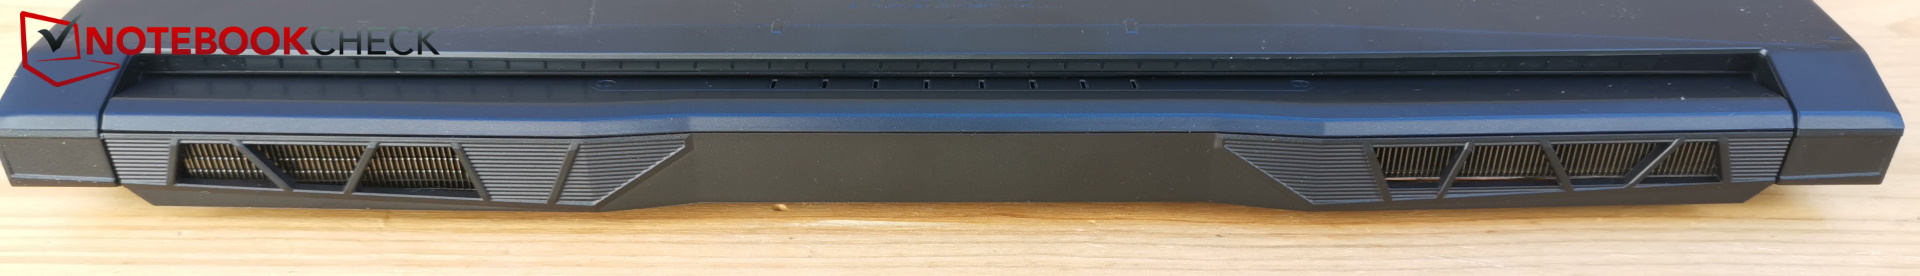
An SD reader is missing, but at least LAN and HDMI are on board. The headset jack is unusually located on the right side, just like the HDMI port, both of which may interfere with the mouse hand. Despite sufficient space, there are no ports at the back.
Communication
MSI has installed the Intel Wi-Fi 6 AX201 WLAN module, which does not yet support Wi-Fi 6E, so connection to the 6 GHz network is currently not possible. But it does operate in the 5 GHz range (and of course 2.4 GHz) and this is still quite fast.
Webcam
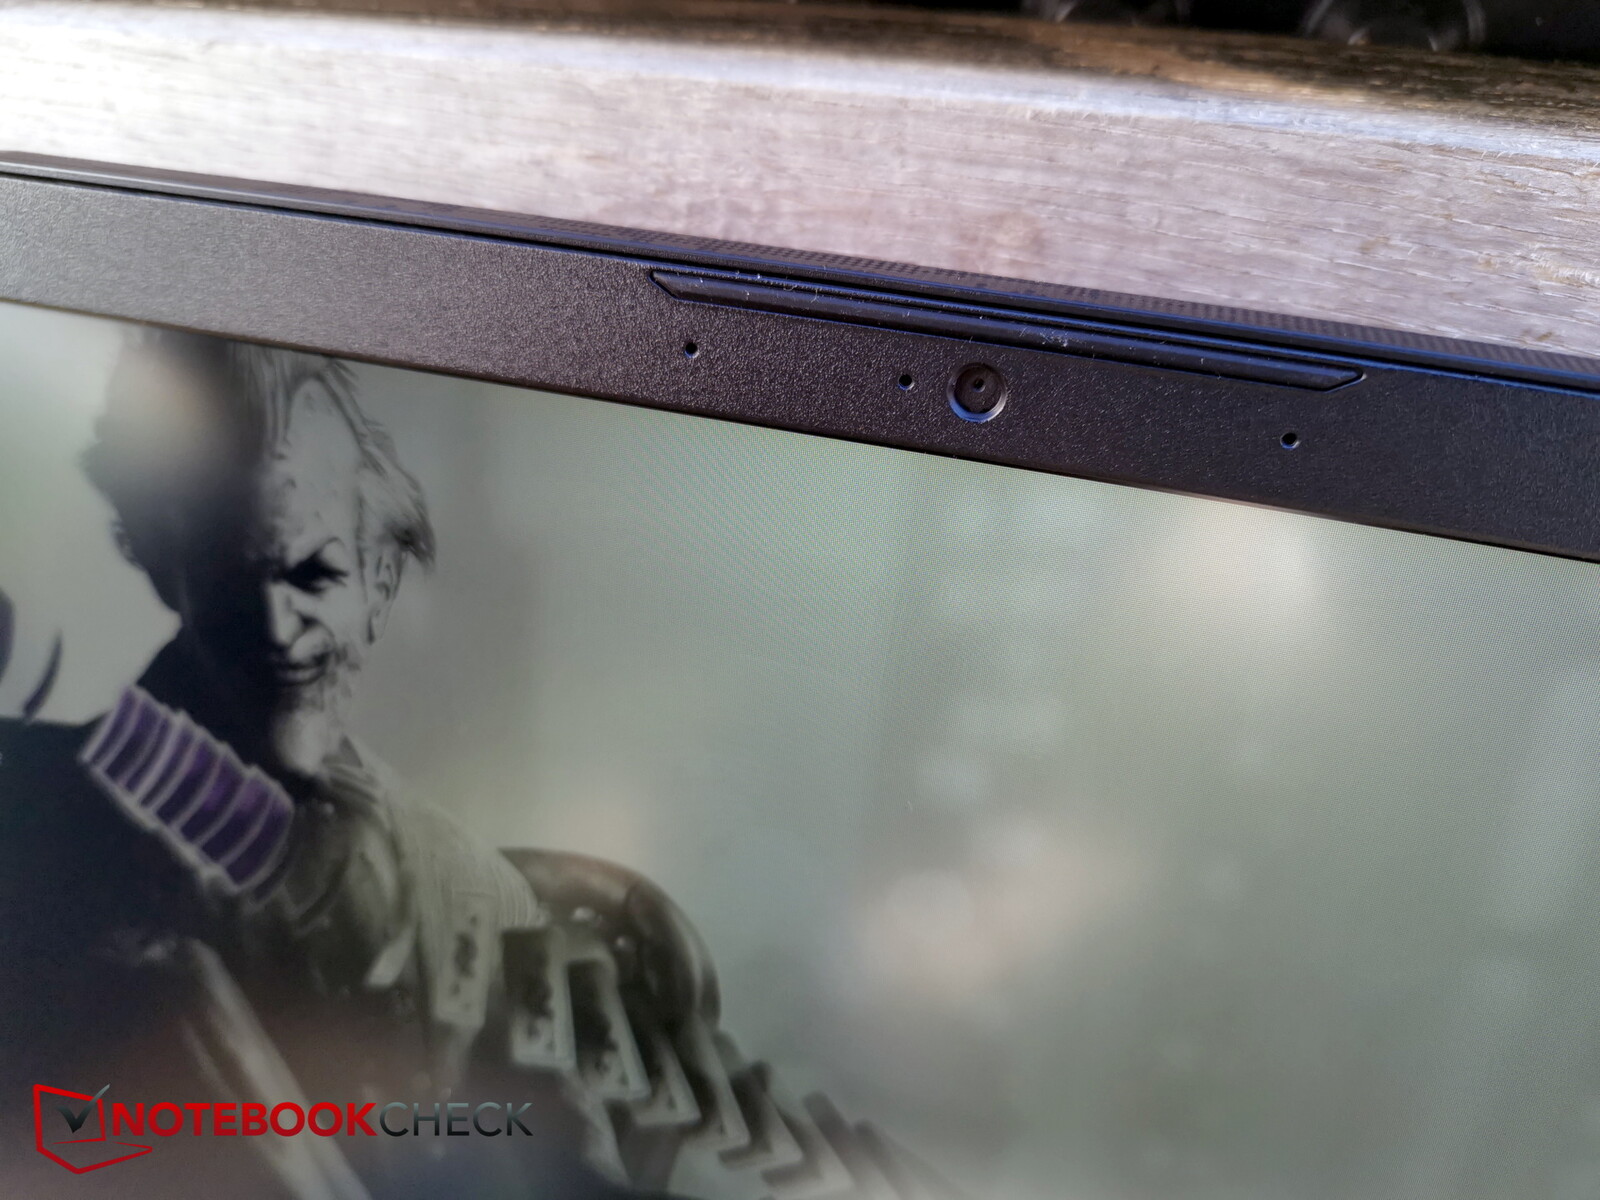
The webcam is also last gen with its resolution of 720p. Even the newer B13 still has a 720p camera. This can be switched on and off via fn+F6.
Color deviations are generally quite high and the image quality rather suboptimal.


Security
TPM is on board, otherwise a Kensington slot is missing. No fingerprint sensor is available either.
Accessories and Warranty
Inexpensive laptops usually don't come with any extras. This is also the case with the Katana 15.
MSI offers a 24-month warranty and a pick-up & return service is included.
Maintenance
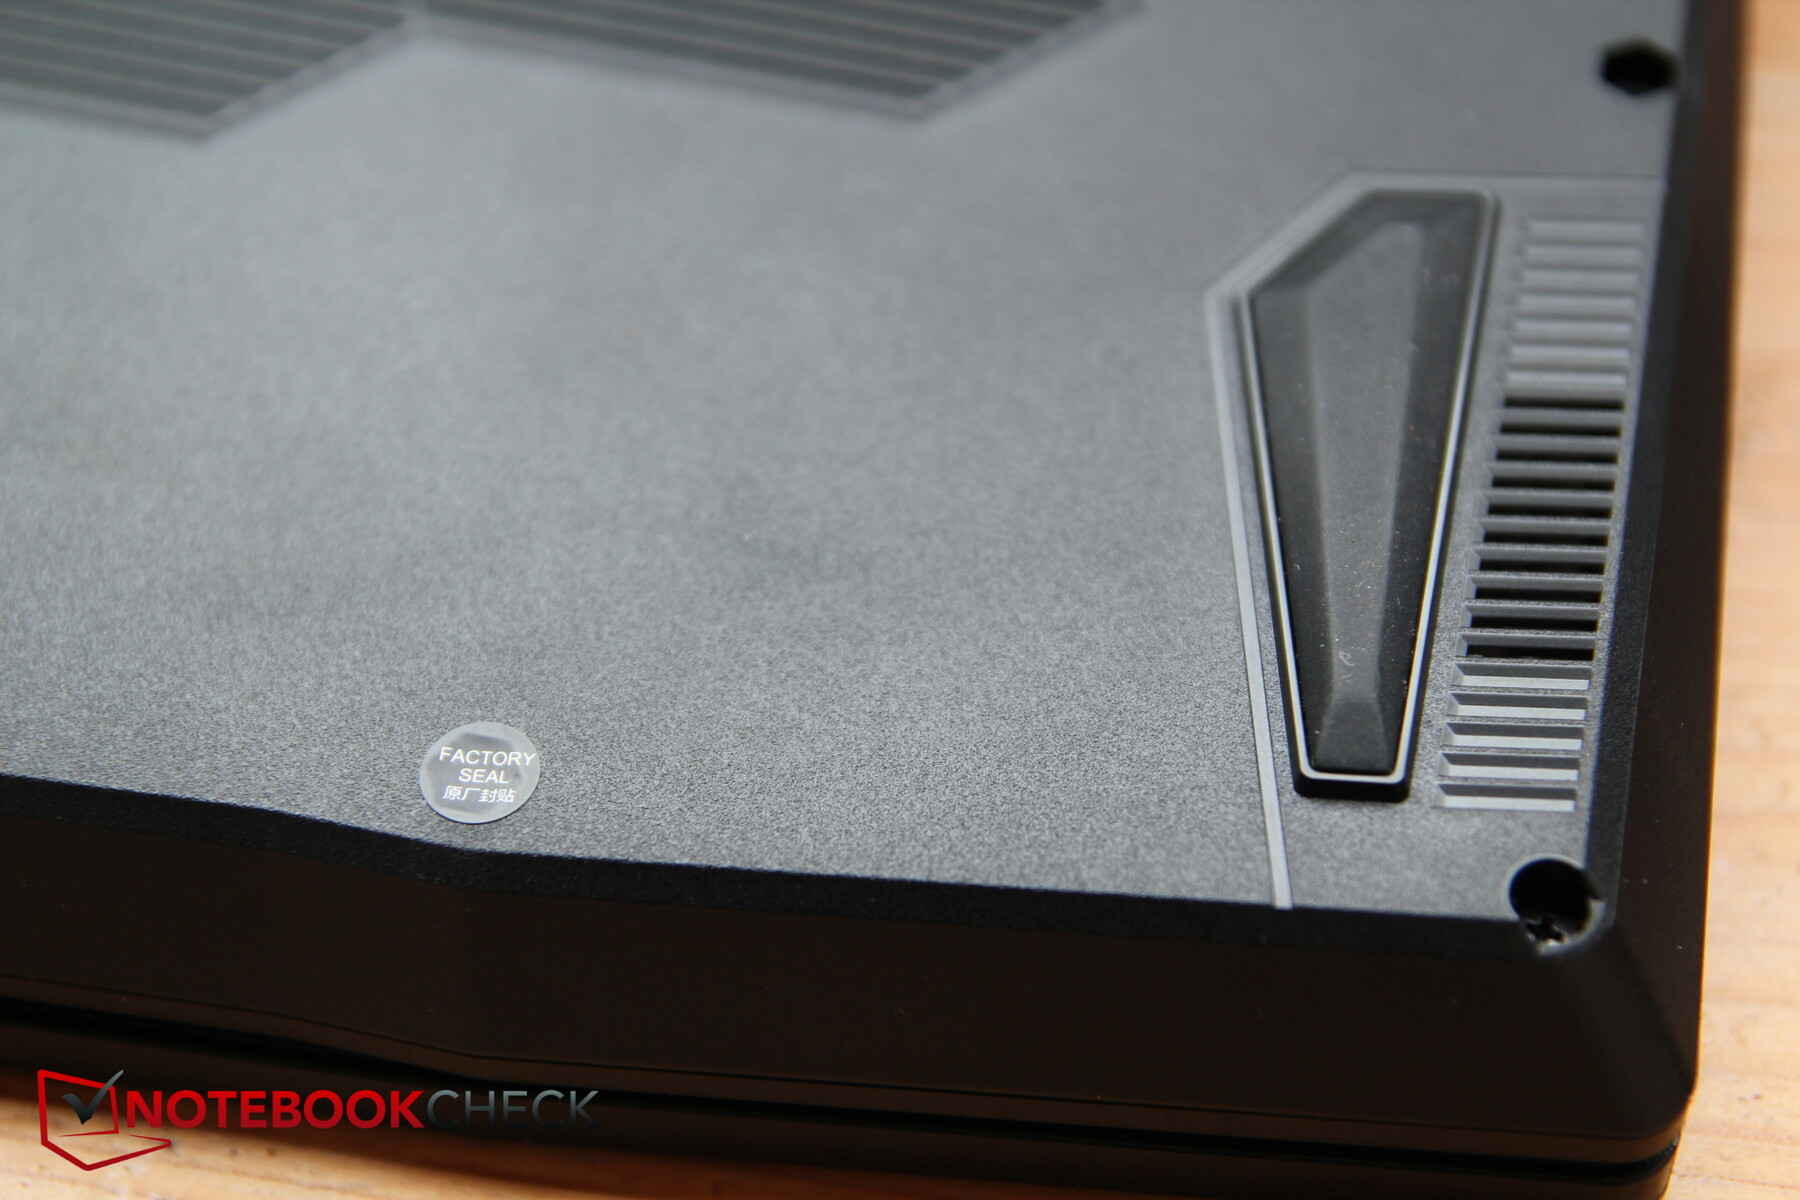
Unfortunately, MSI uses a seal sticker to determine whether users have already opened the device themselves. Since our test model comes from Cyberport, we refrained from opening it so as not to damage the device for our loaner.
According to MSI, the device may also be opened by the owner for maintenance purposes. As long as this is done "professionally", the device's warranty remains unaffected.
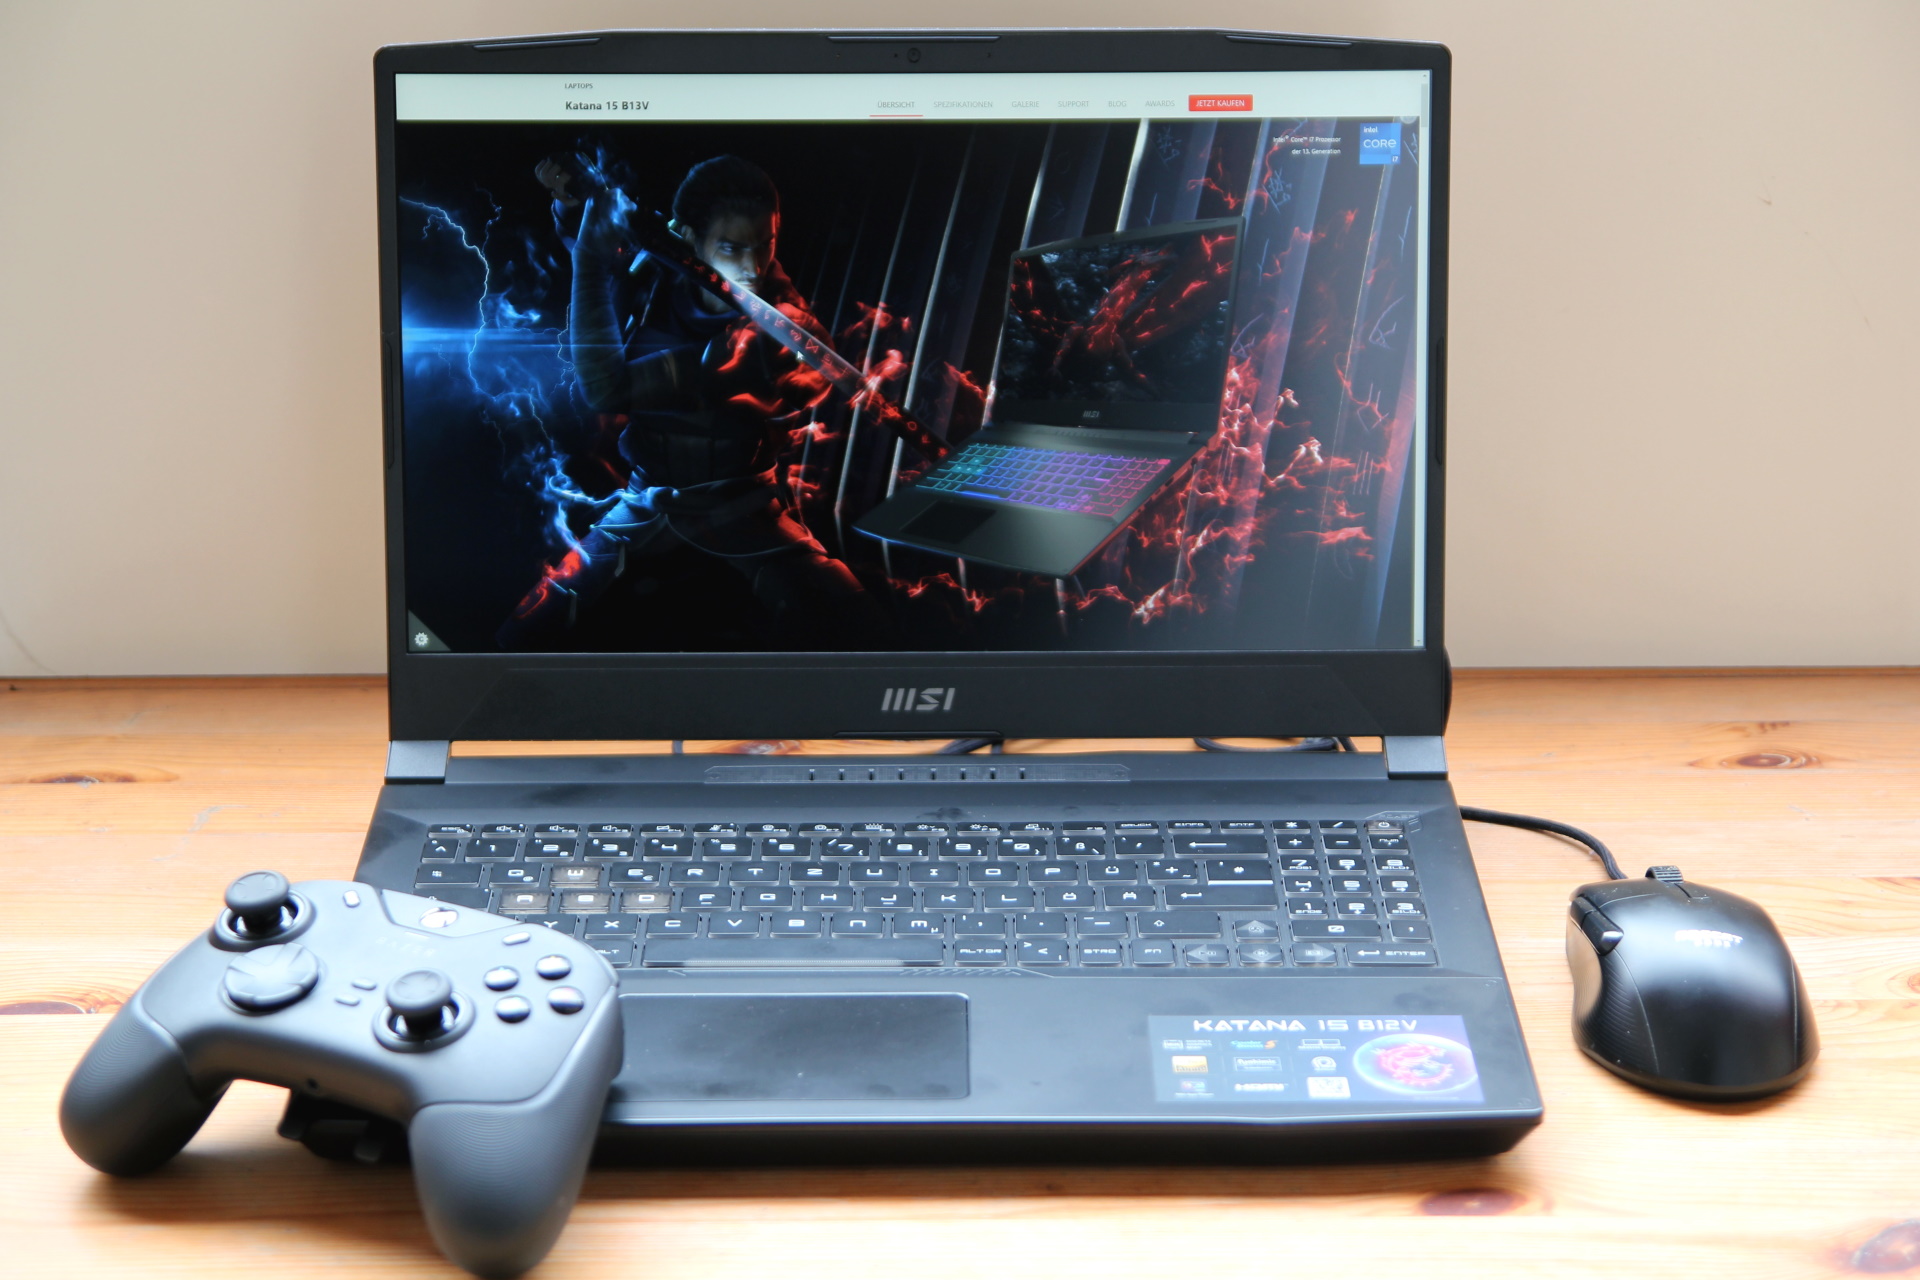
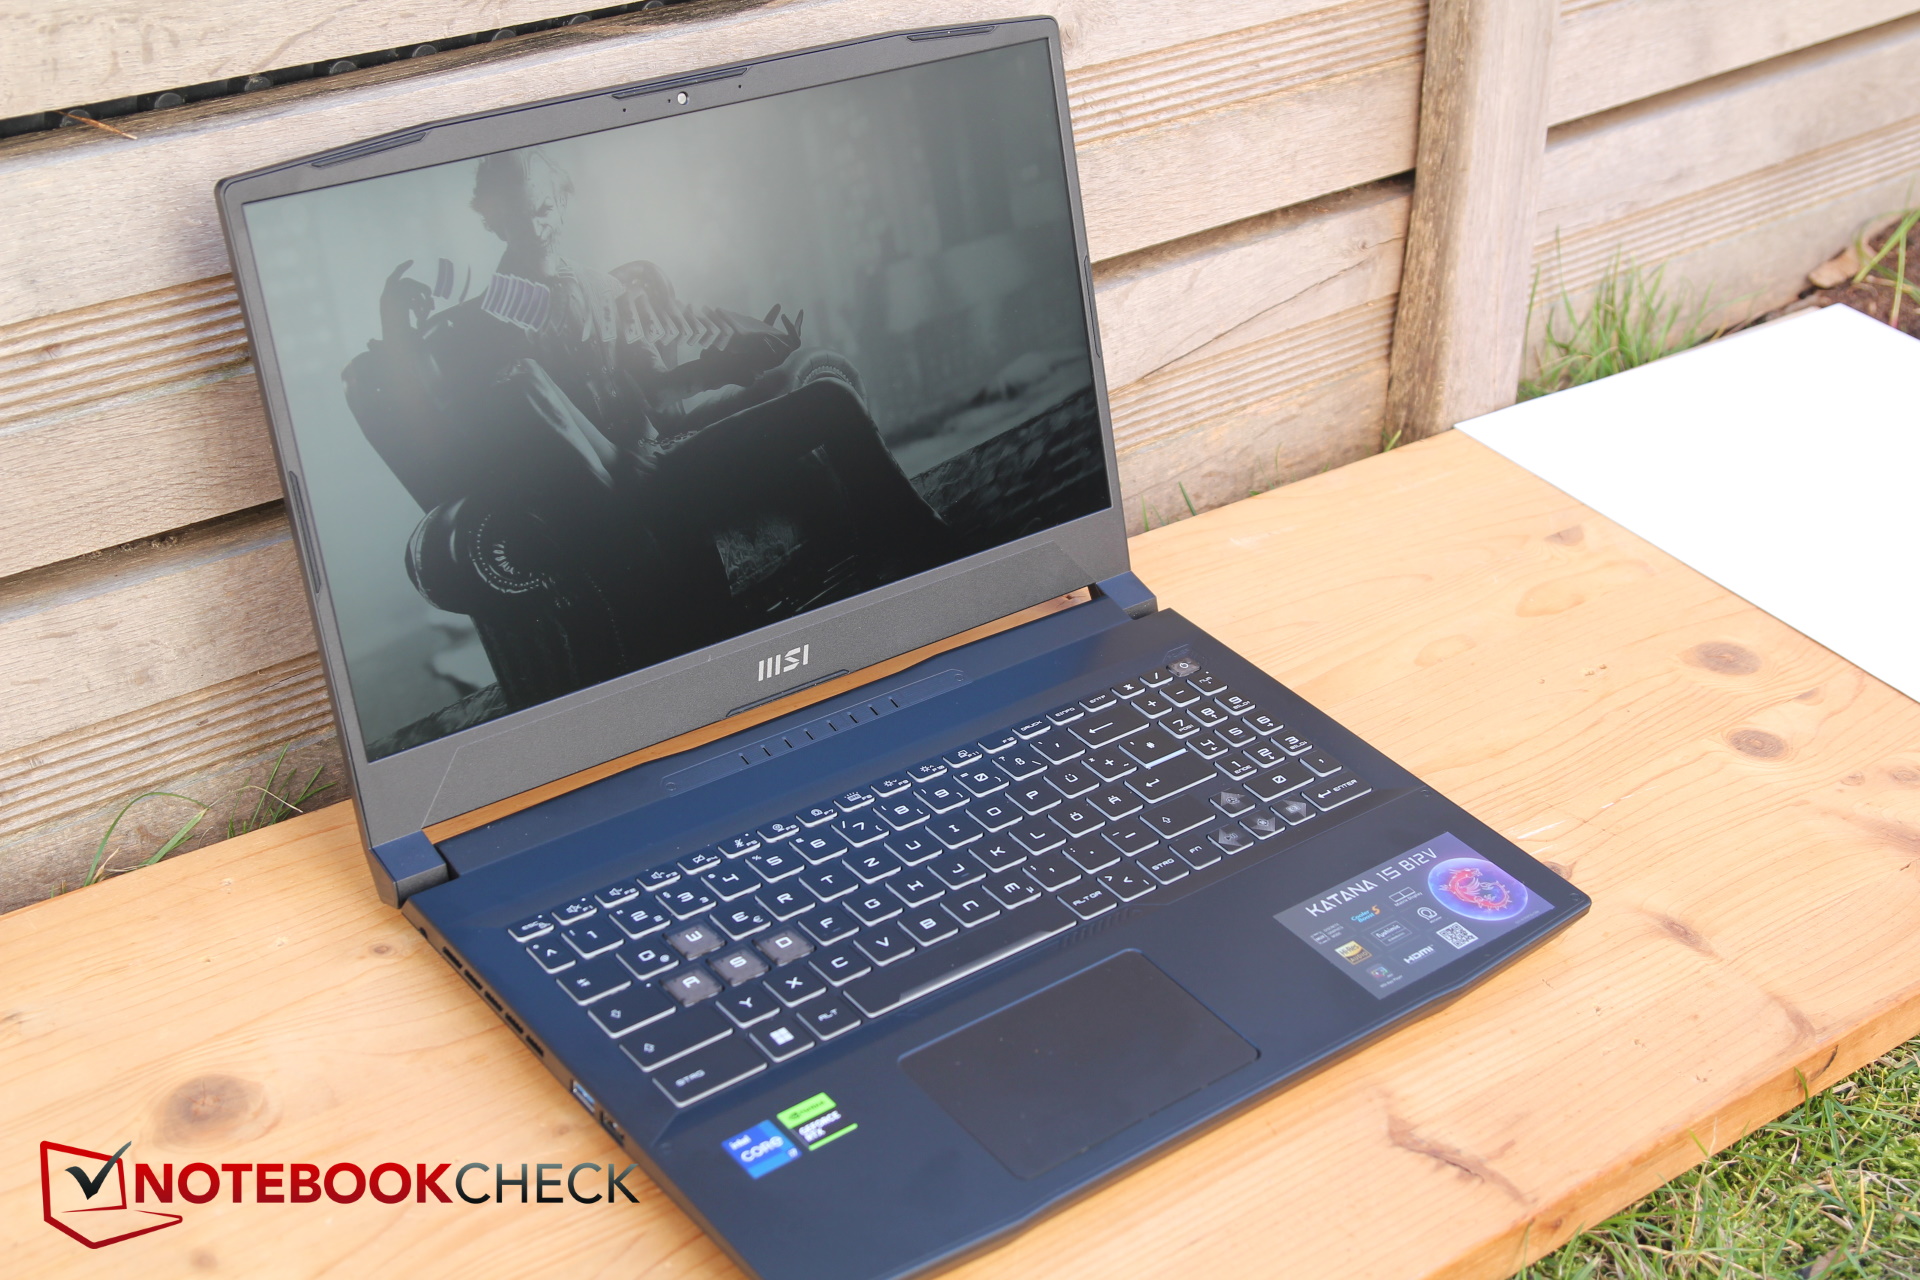
Input Devices - Decent keyboard, small touchpad
Keyboard
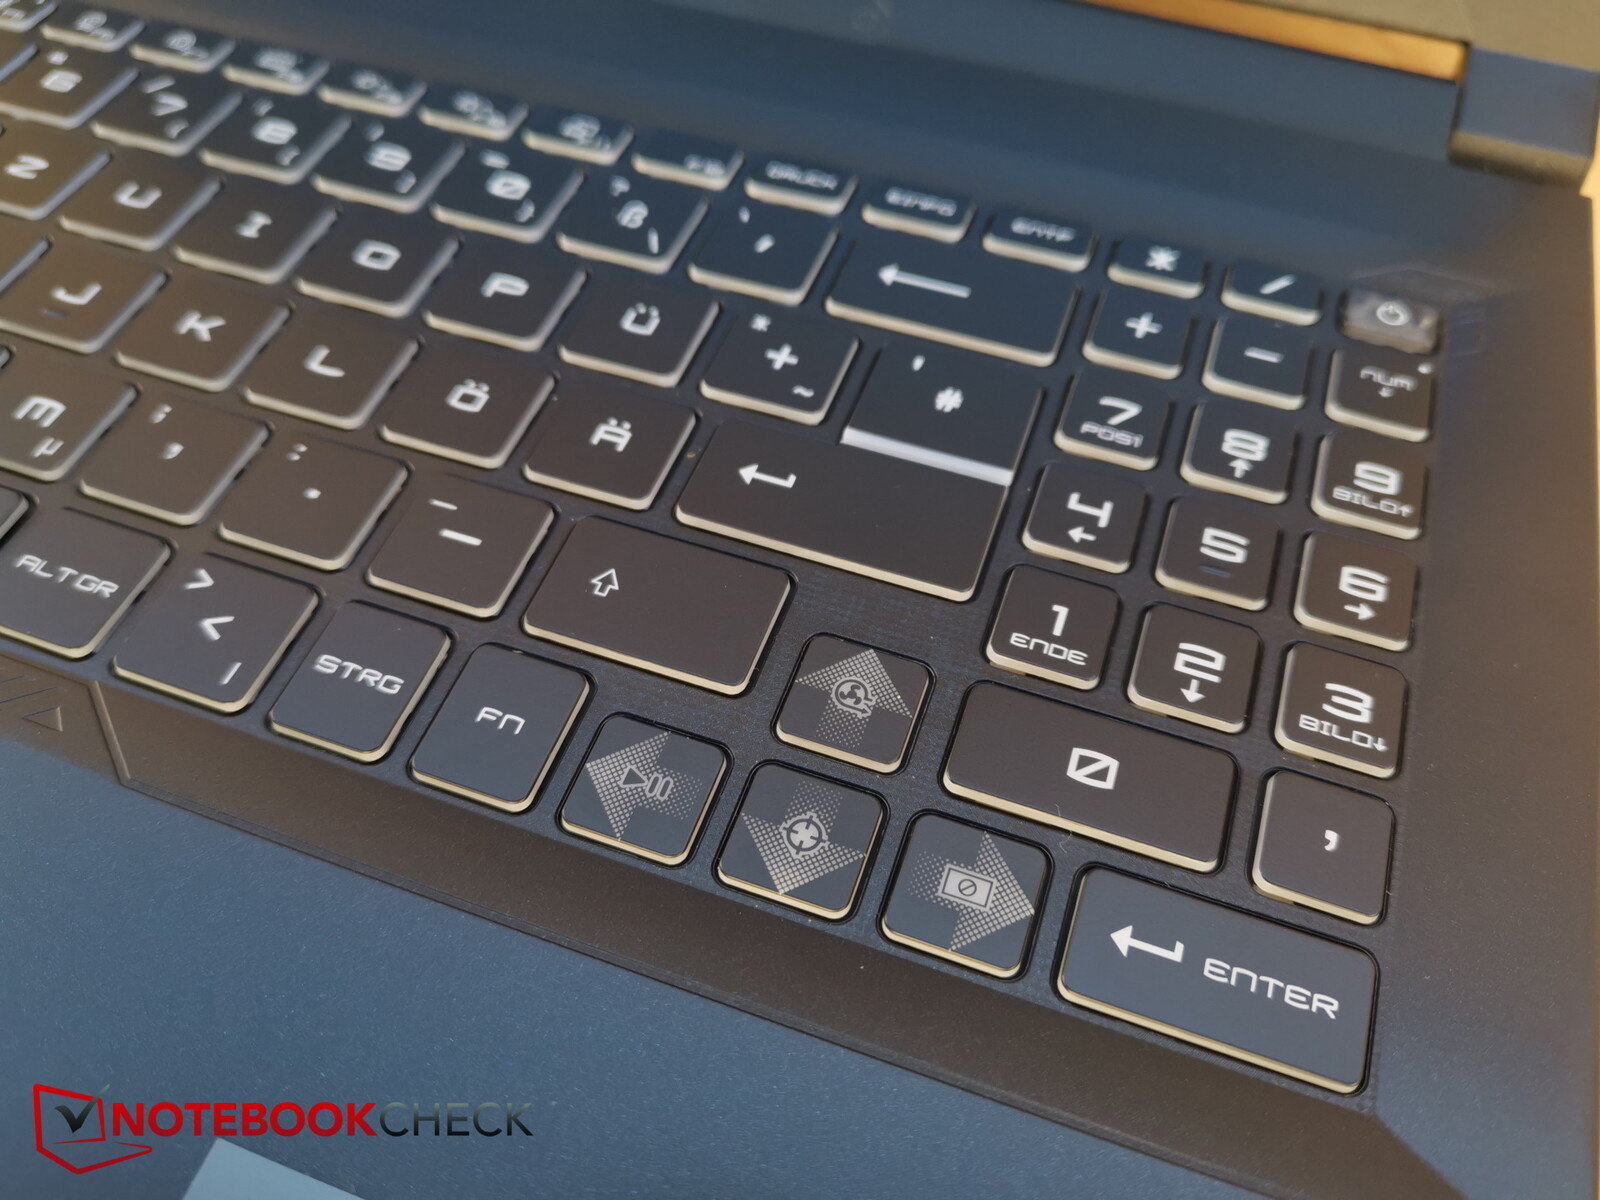
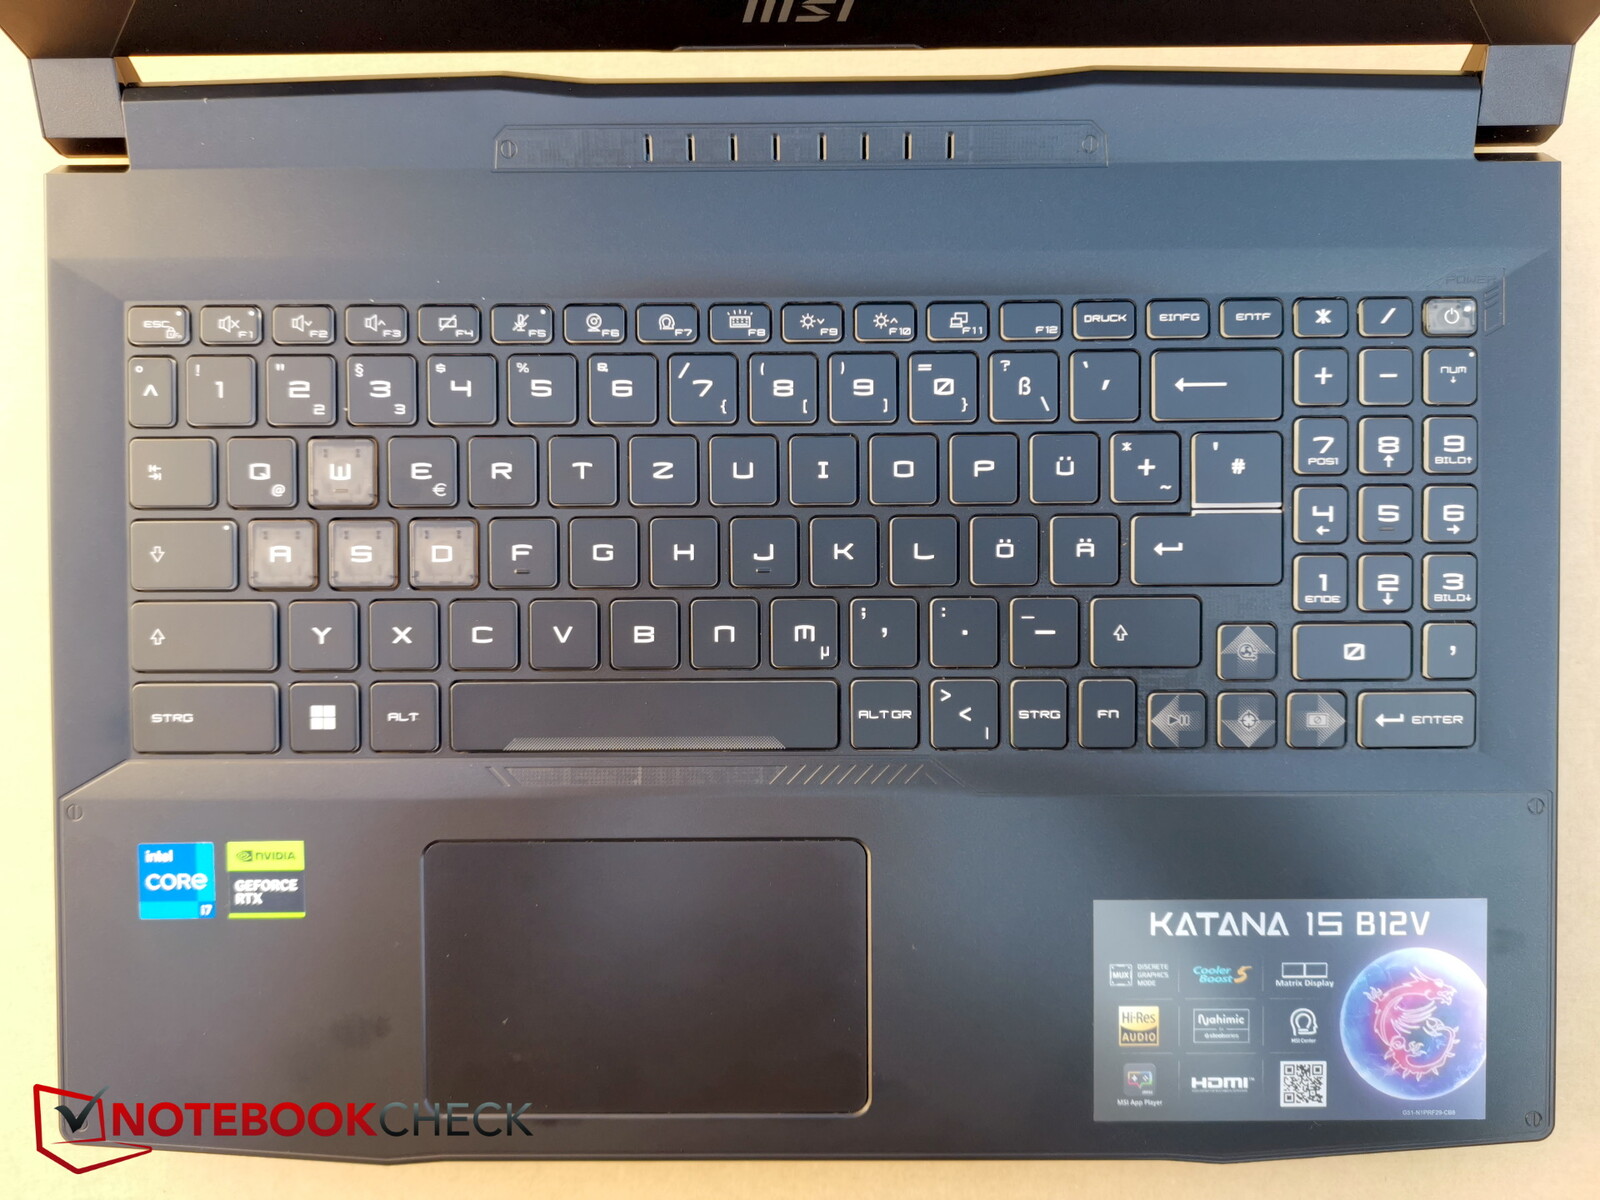
The layout is very similar for all Katana models: it looks very tidy, but the numpad on the right side looks badly squeezed in, but at least there is one.
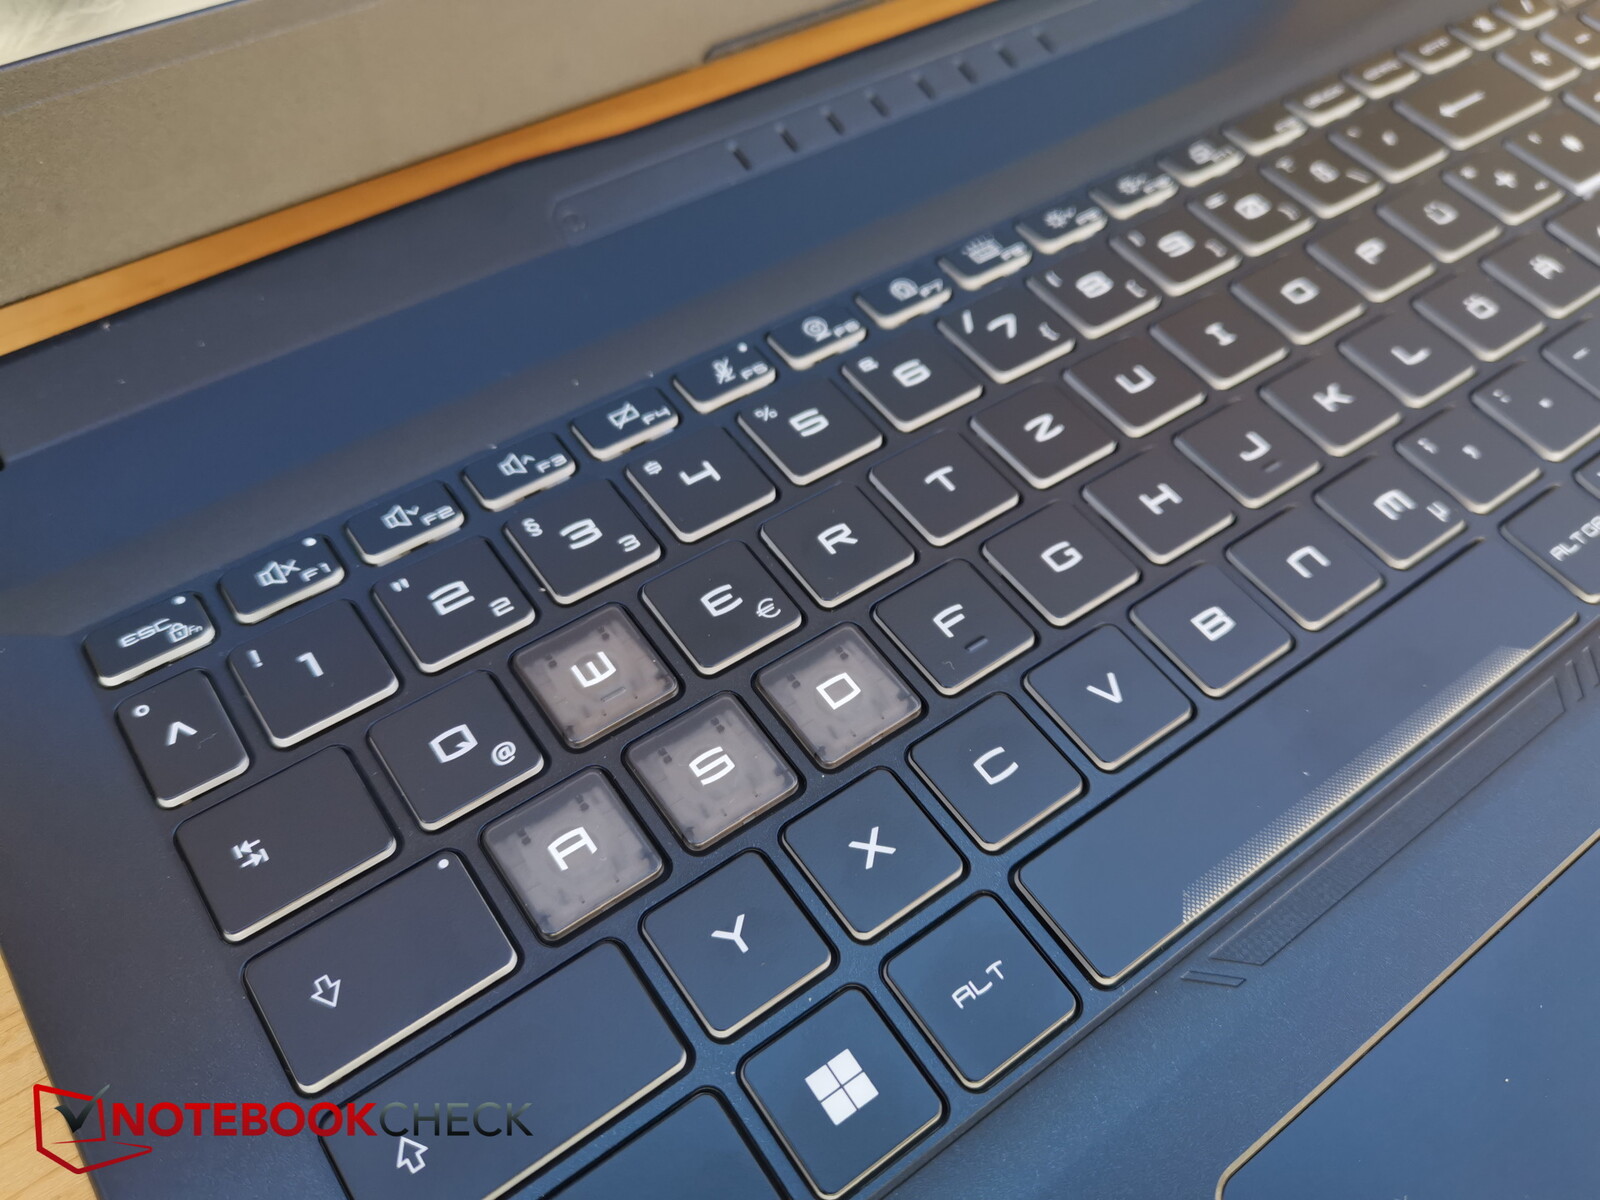
The arrow keys in between are not halved in height, as is often the case, but are somewhat smaller overall in length and height. The WASD keys are transparent and thus stand out in color. The F and special keys are also very small.
MSI has unfortunately shifted the fn key to the right side of the space bar again, which requires some getting used to. It's strange why MSI continues to go its own way. If necessary, you can swap the functions of fn and Windows keys, but then you have the same problem with the Windows key, which is on the right instead of the fn key.
Key travel is rather short, but the feedback is clearly noticeable, so that typing feels quite fast. The keystroke noise is moderate, and the base remains stable and does not bend when typing.
The keyboard backlight offers four zones, with each having four levels of adjustable brightness.
Touchpad
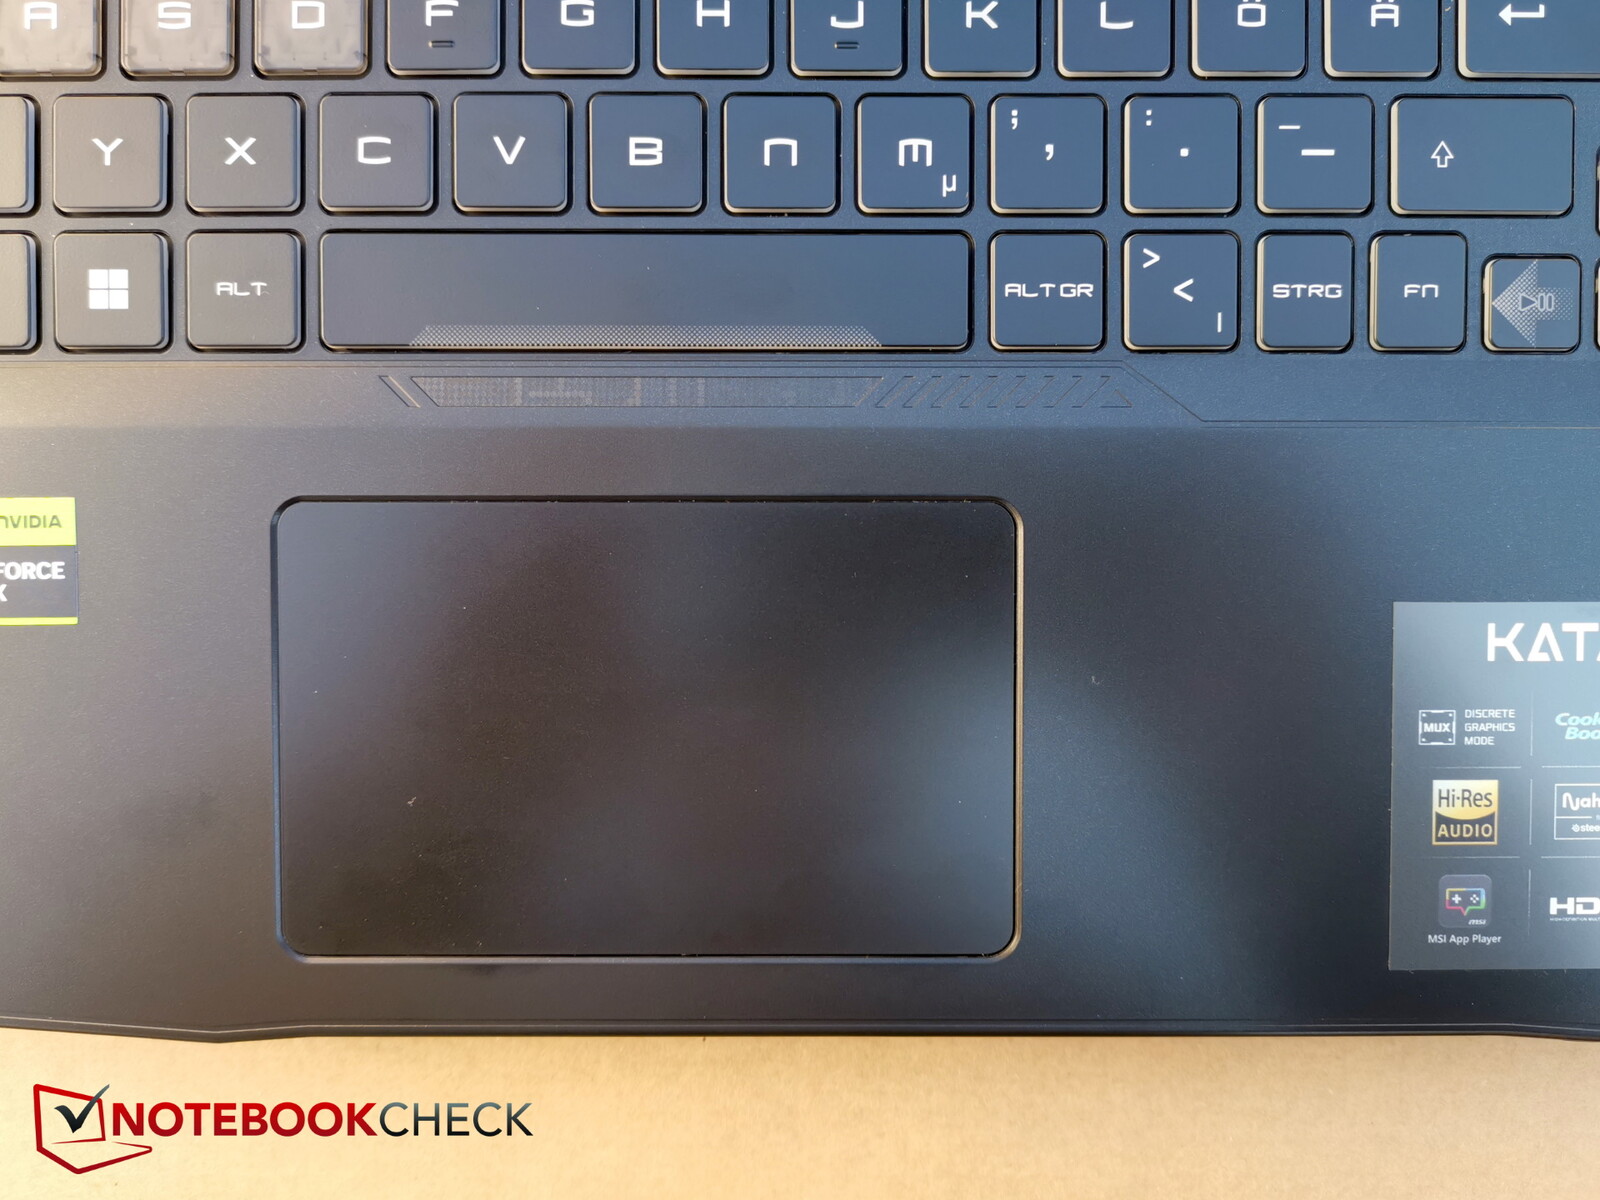
The Katana 15 has what feels like one of the smallest touchpads on the market. It looks kind of retro. Sure, gamers will usually connect a mouse anyway, but a larger touchpad is simply more comfortable for use on the go.
The touchpad is right under the space bar and thus very far to the left in the layout. A slightly more central placement would have been more advantageous.
The clicks of the integrated keys are somewhat louder and do not seem too high quality, but they react reliably and accurately.
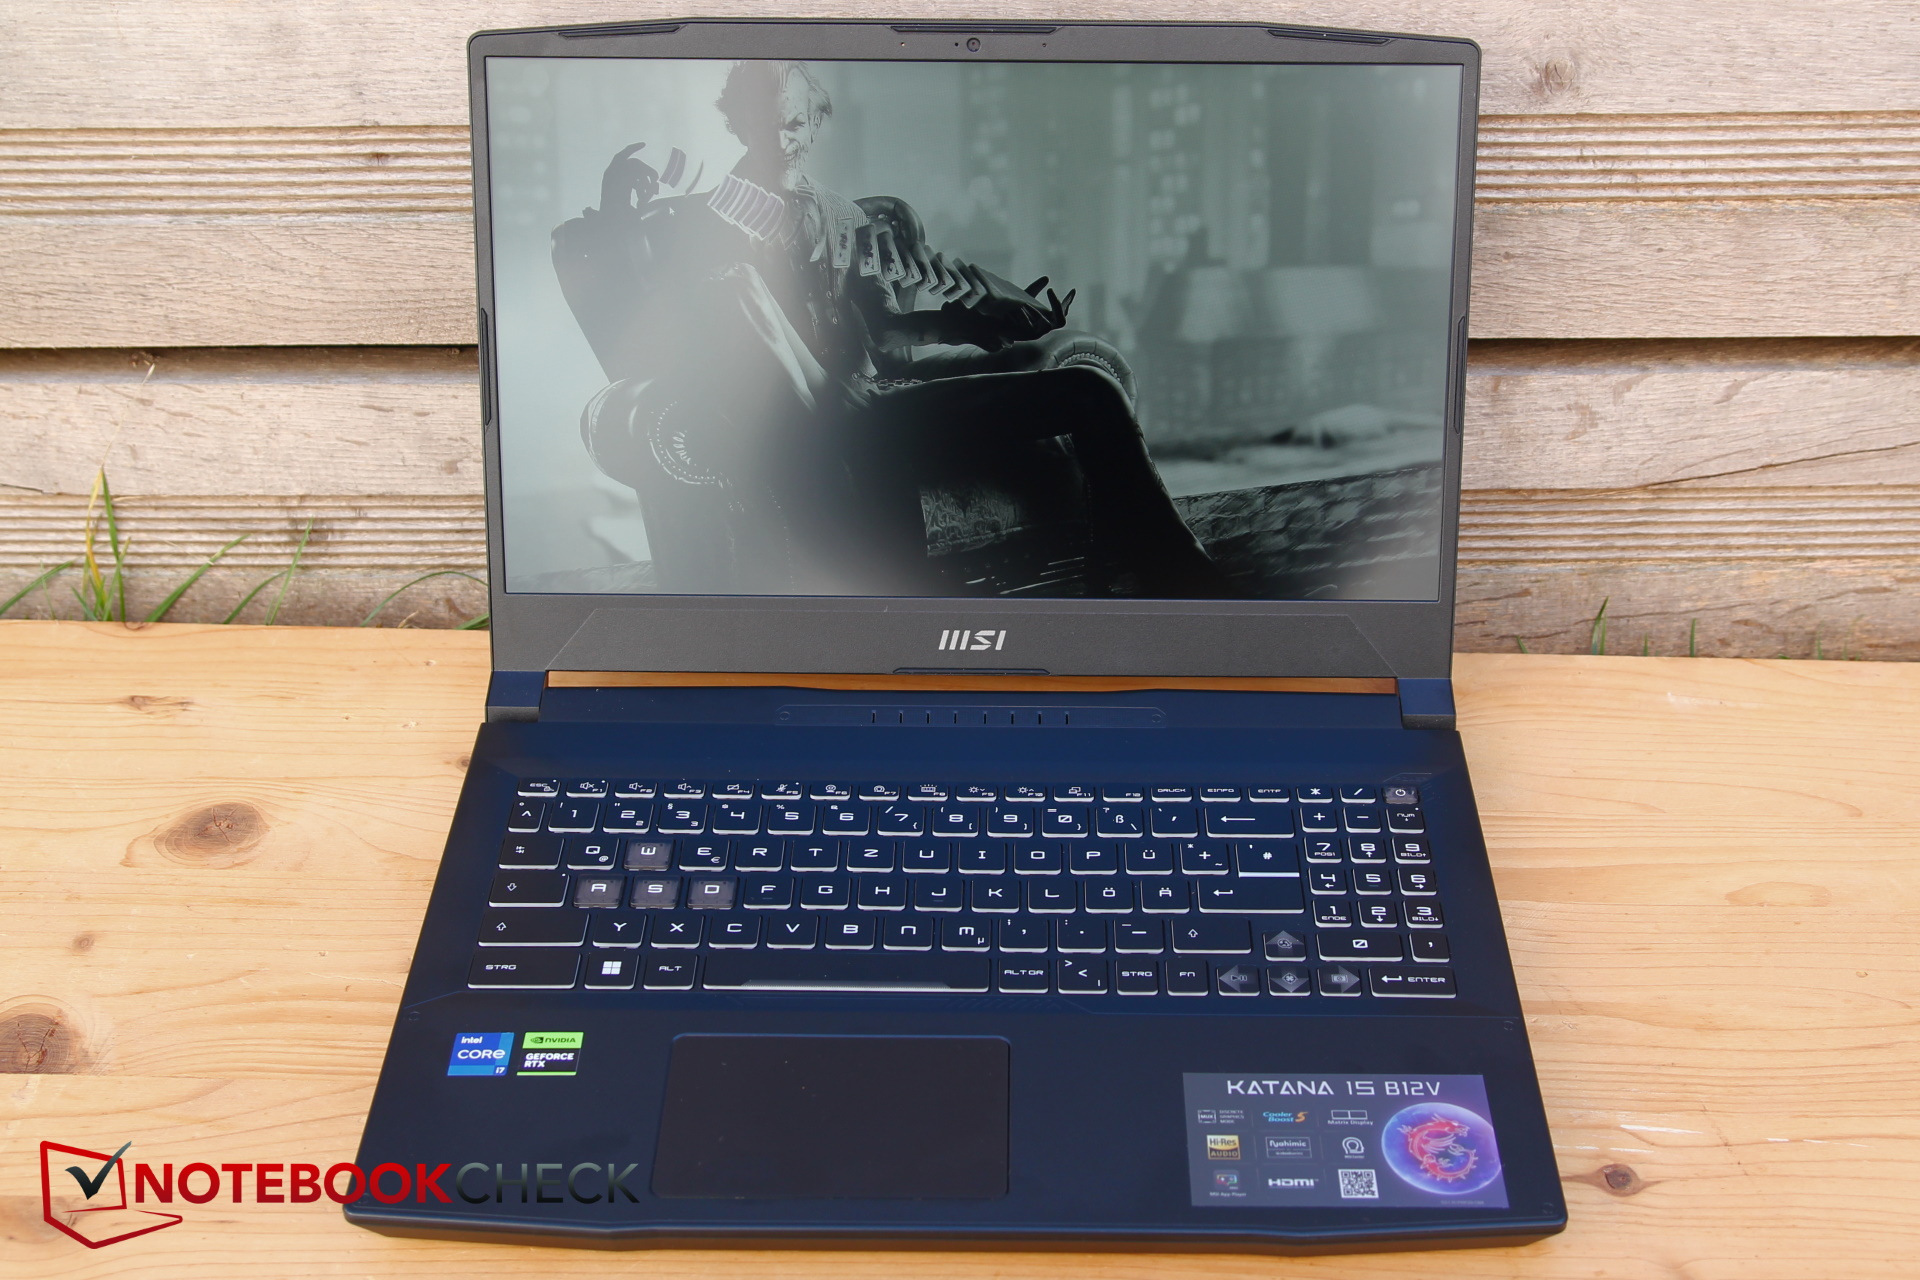
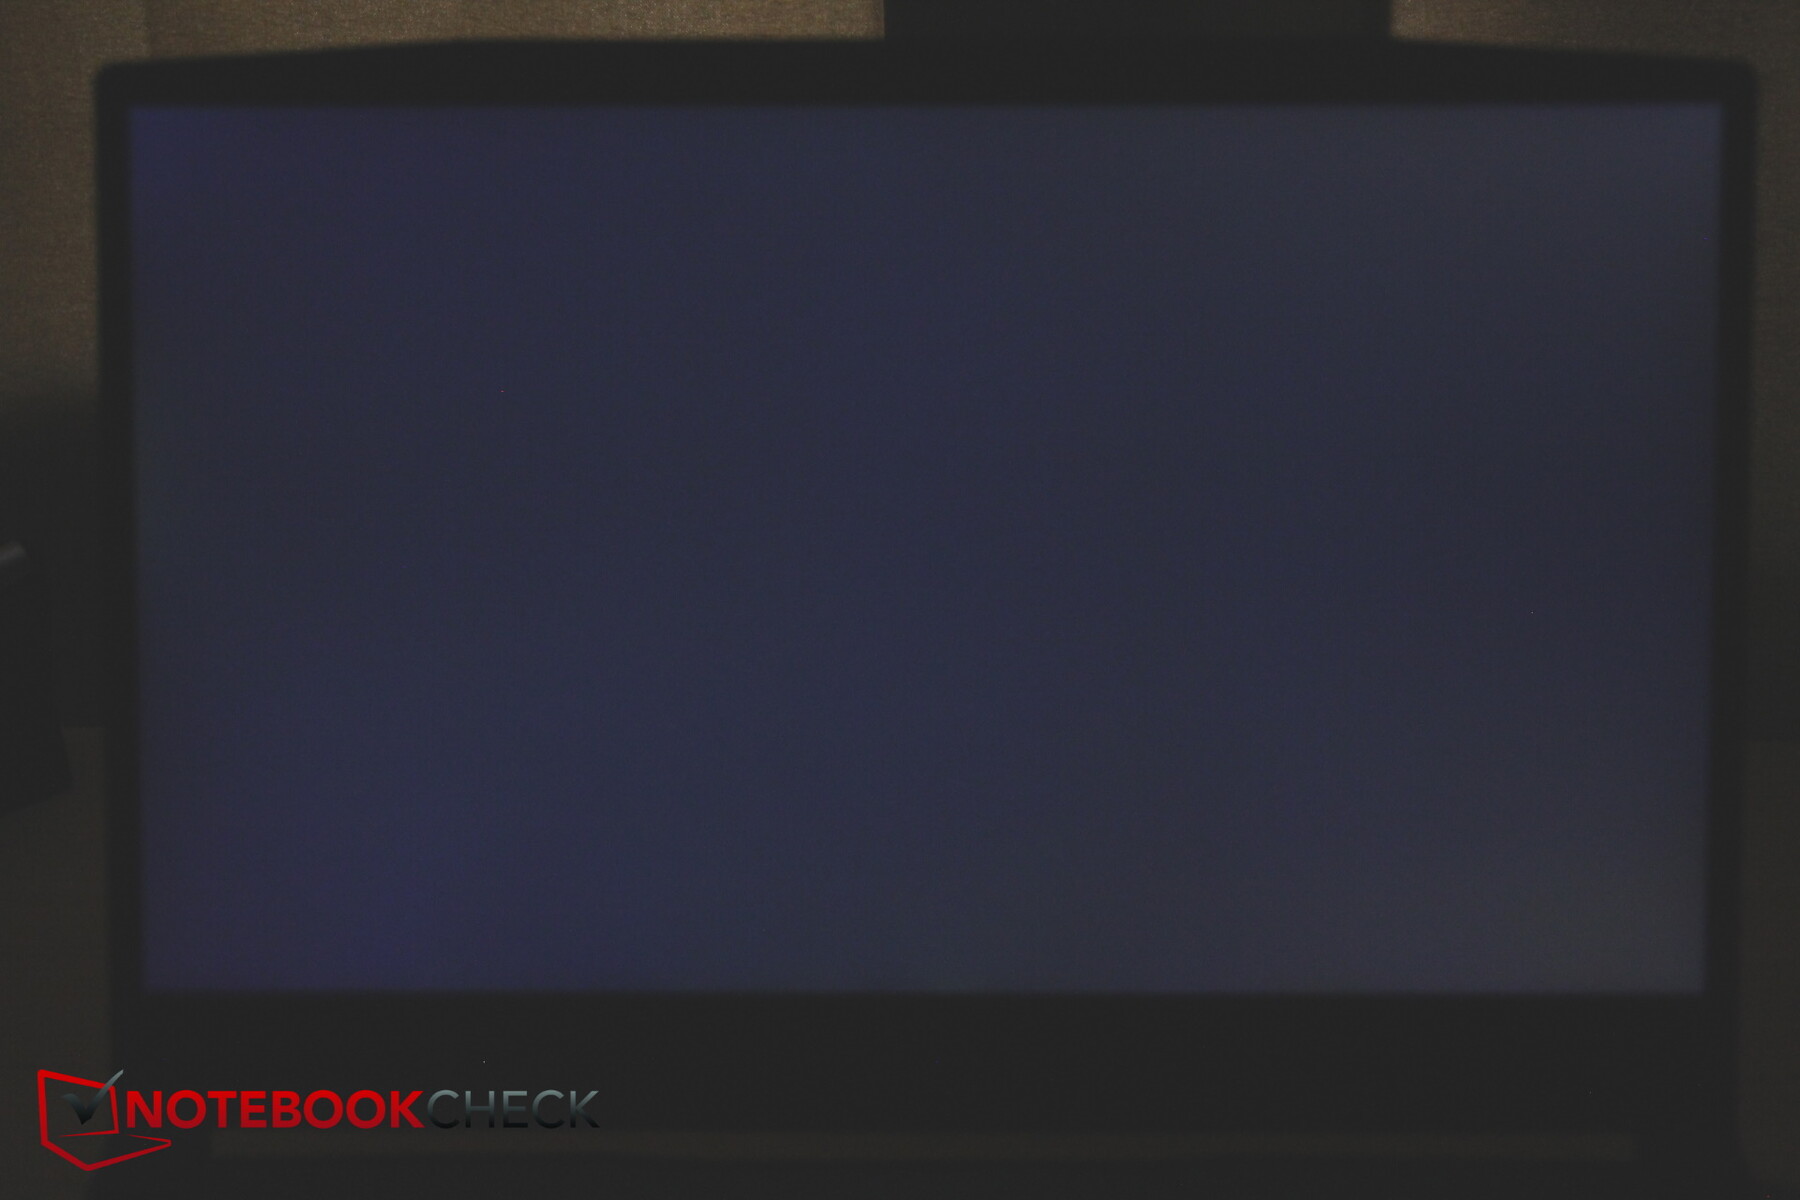
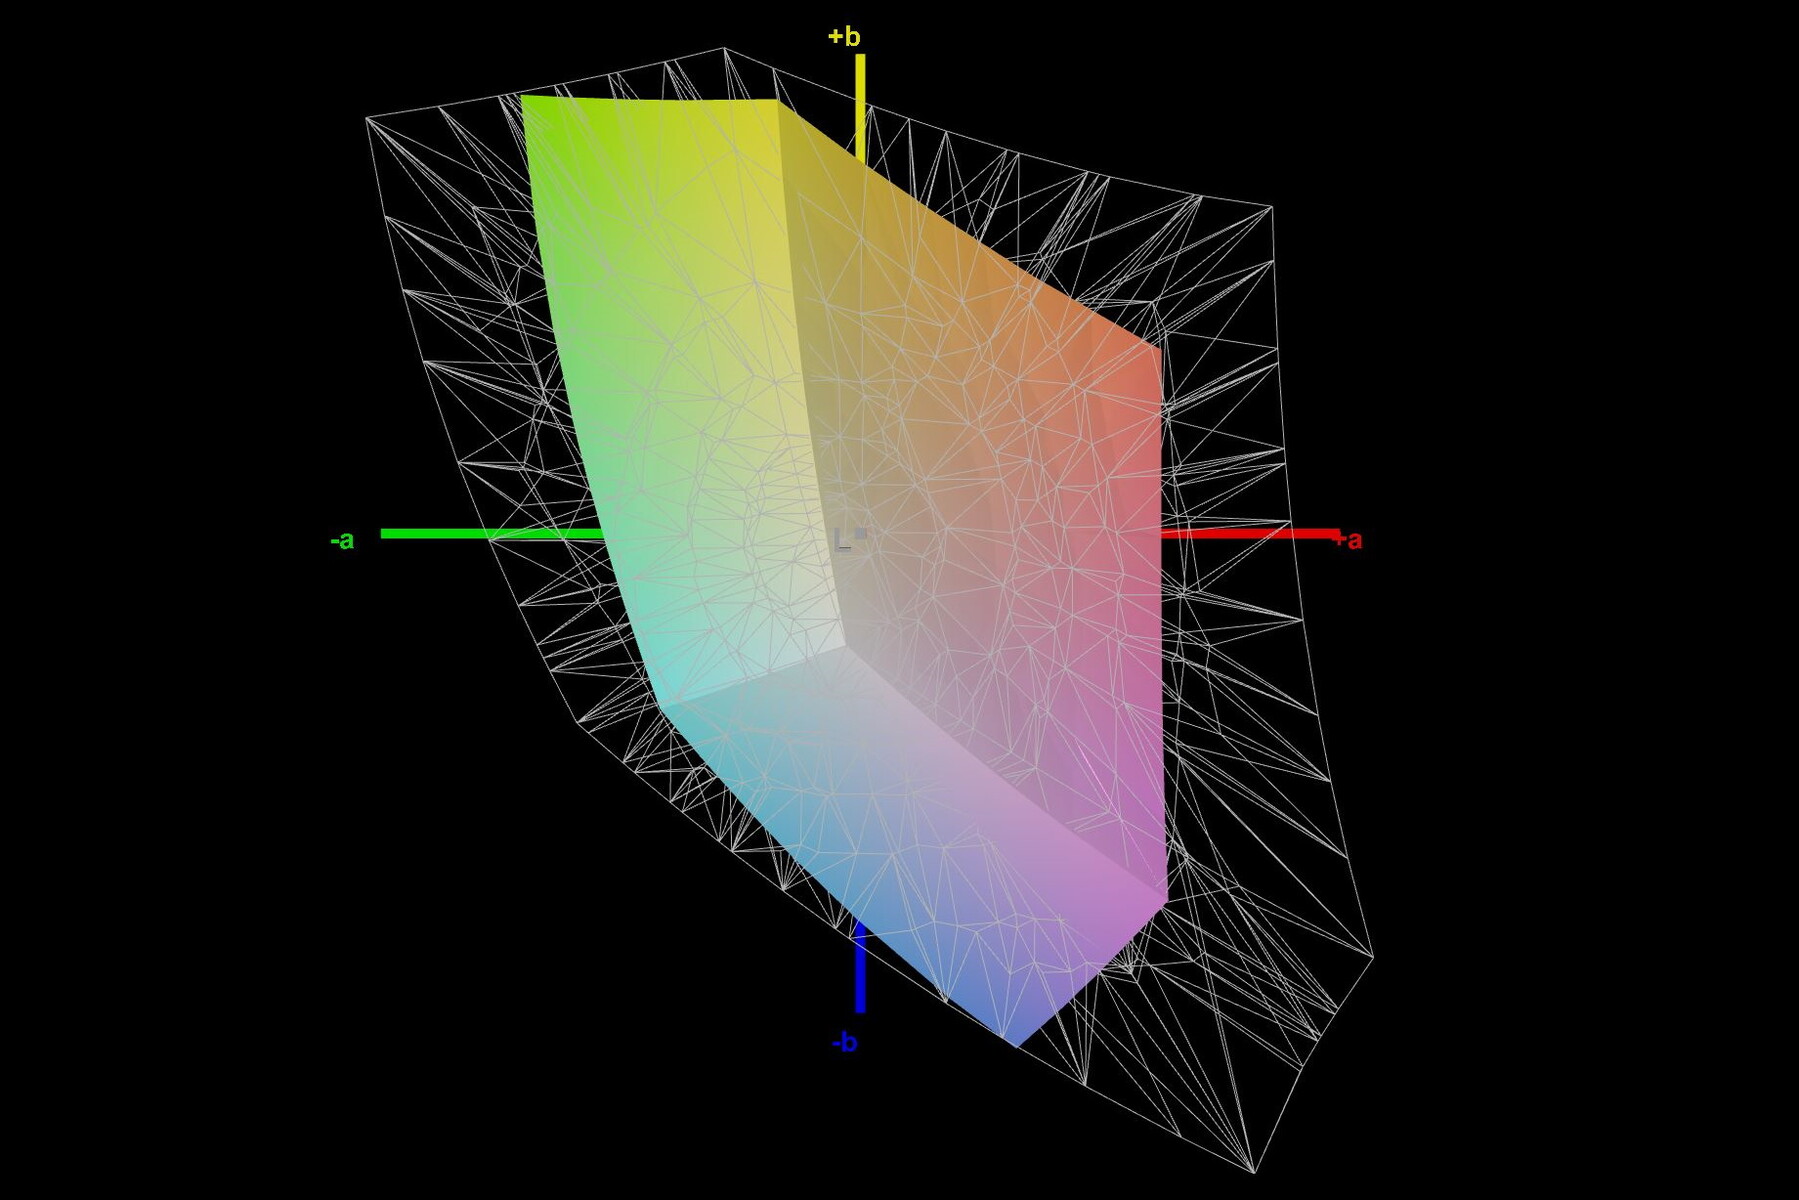
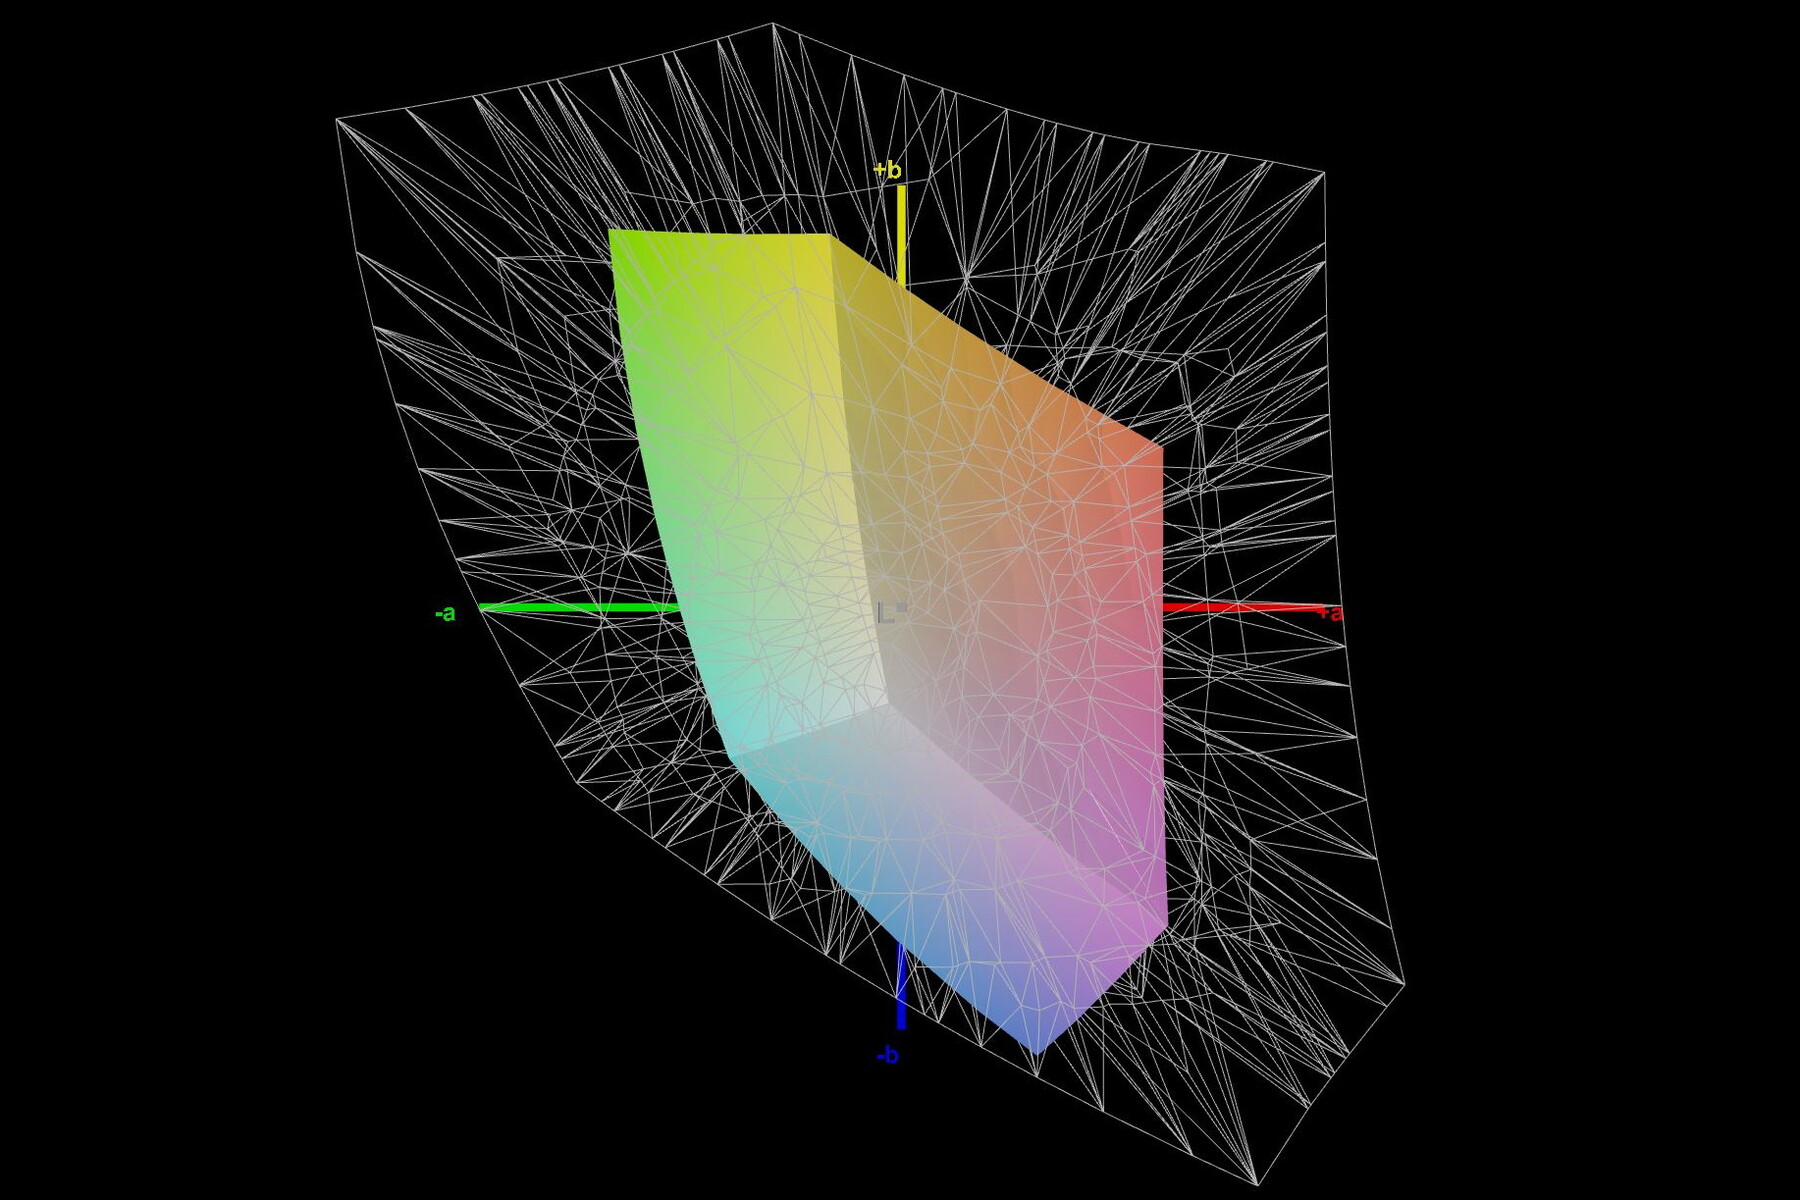
Display - 250 nits and 57% sRGB are budget values
MSI continues to use a Full HD display for the Katana, while many competitors already use QHD and higher. This is not necessarily an issue, as the resolution and the 144 Hz should fit well together with the RTX 4050. So far, there doesn't seem to be any alternative display options for the B13 either. Ultimately, it is the same panel as in the Katana GF66 and the Pulse GL66.
Unfortunately, the average brightness of 258 nits is rather below average these days, since most competing laptops offer brighter displays. At least the illumination of 92 percent is quite even, and the brightness decreases somewhat towards the bottom right.
The response times are rather suboptimal to mediocre for a gamer. At least PWM is not an issue in our model. Screen bleeding is only slight and not noticeable in most situations.
| |||||||||||||||||||||||||
Brightness Distribution: 92 %
Center on Battery: 257 cd/m²
Contrast: 1374:1 (Black: 0.19 cd/m²)
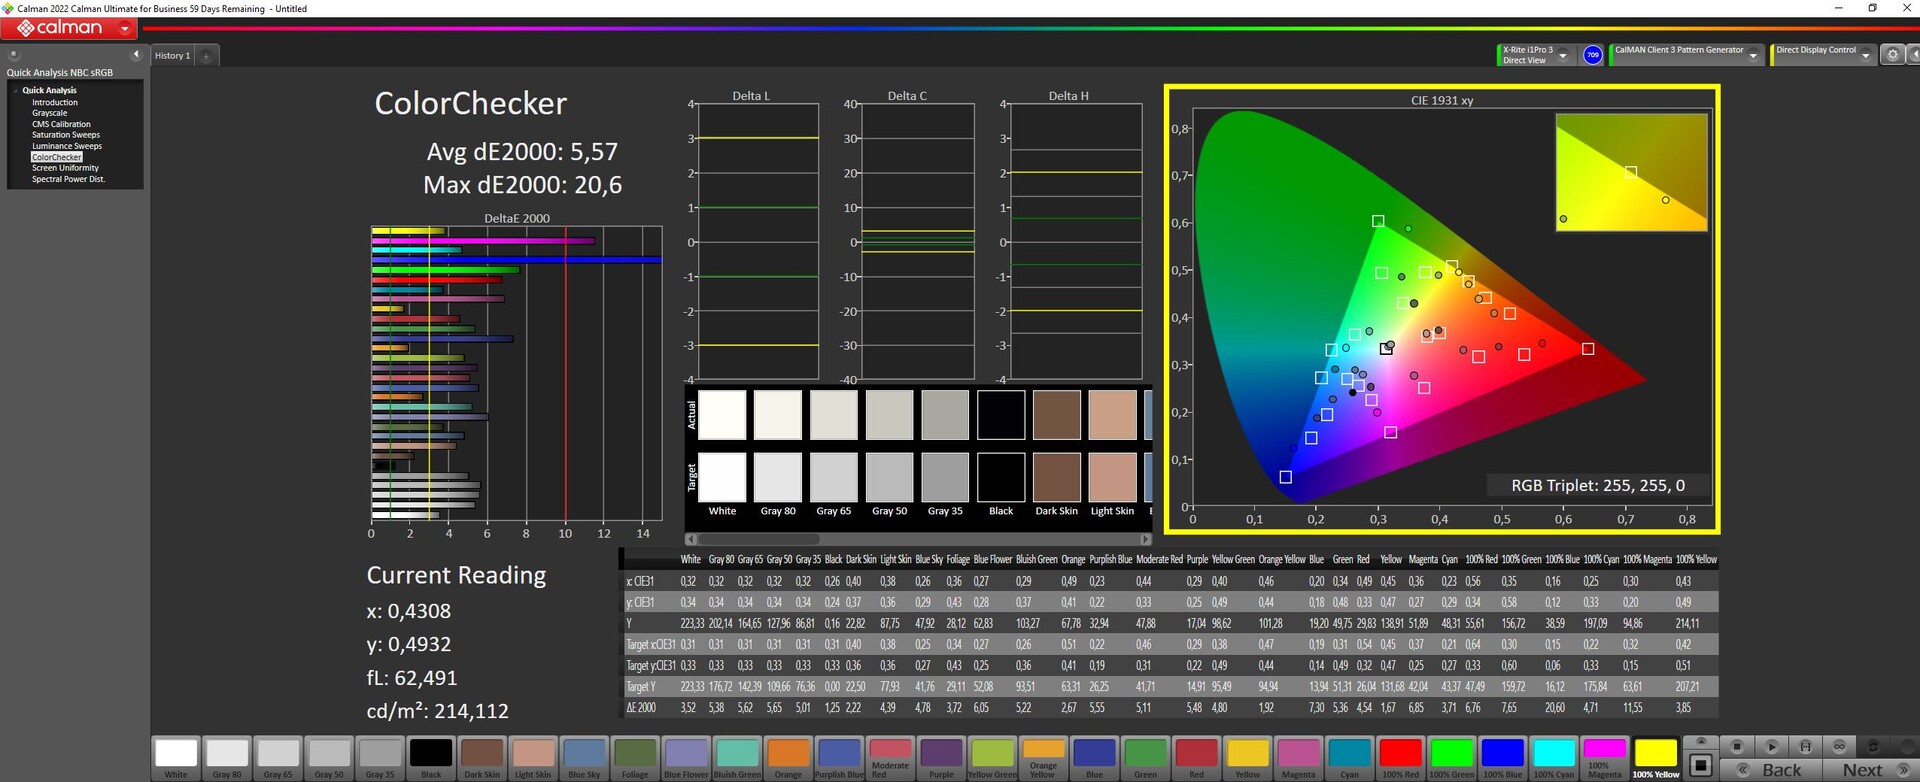
ΔE ColorChecker Calman: 5.57 | ∀{0.5-29.43 Ø4.78}
calibrated: 4.63
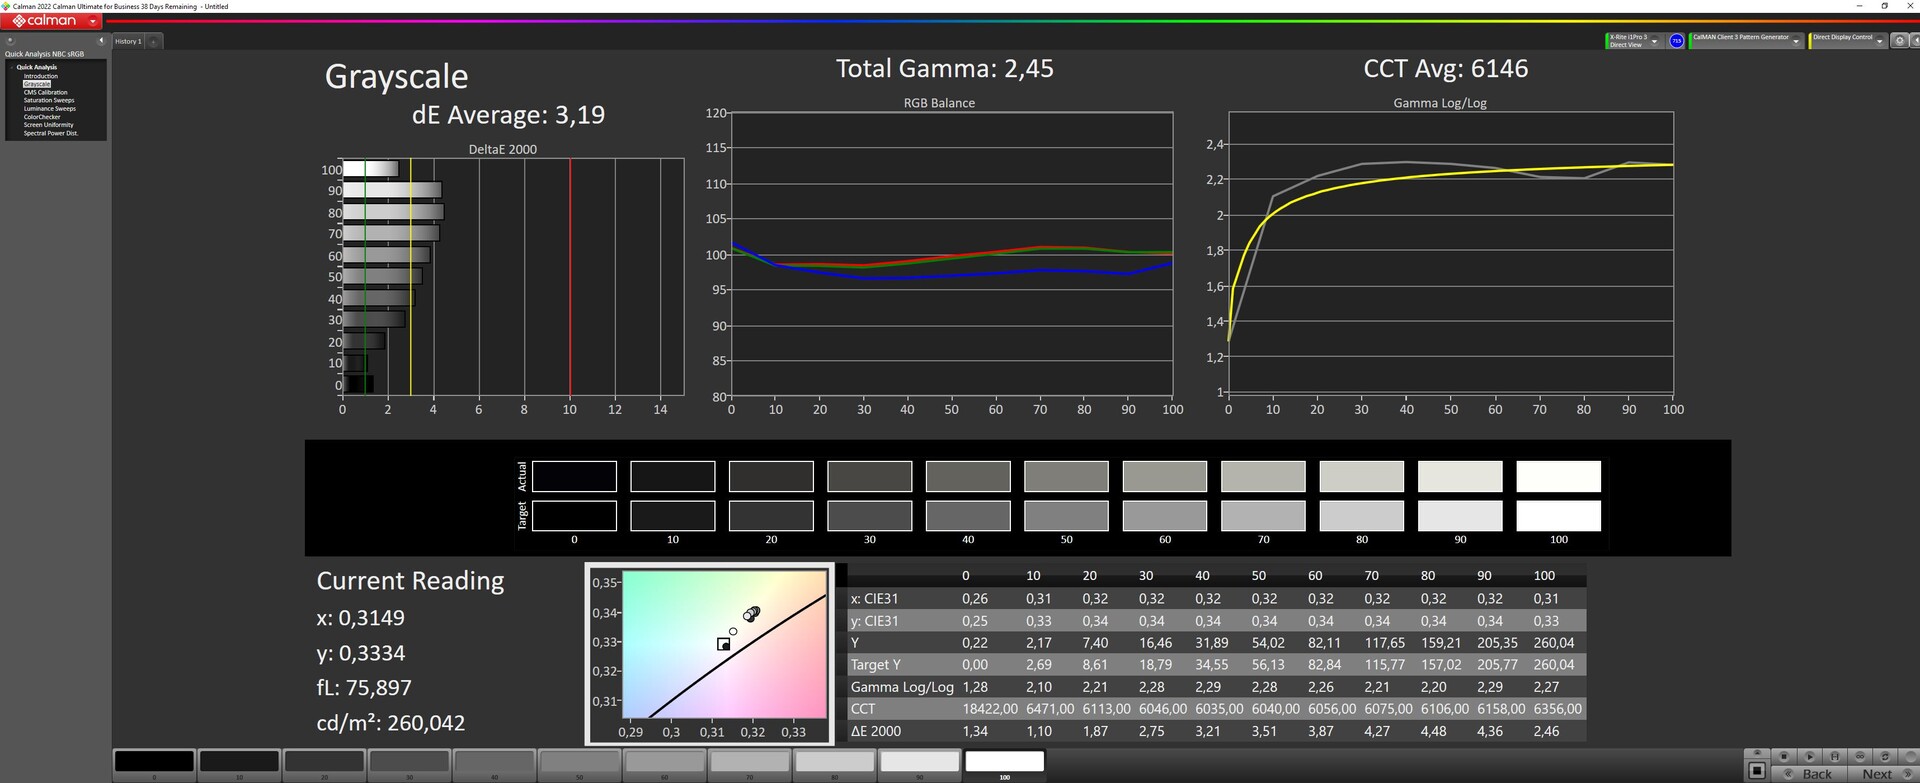
ΔE Greyscale Calman: 3.19 | ∀{0.09-98 Ø5}
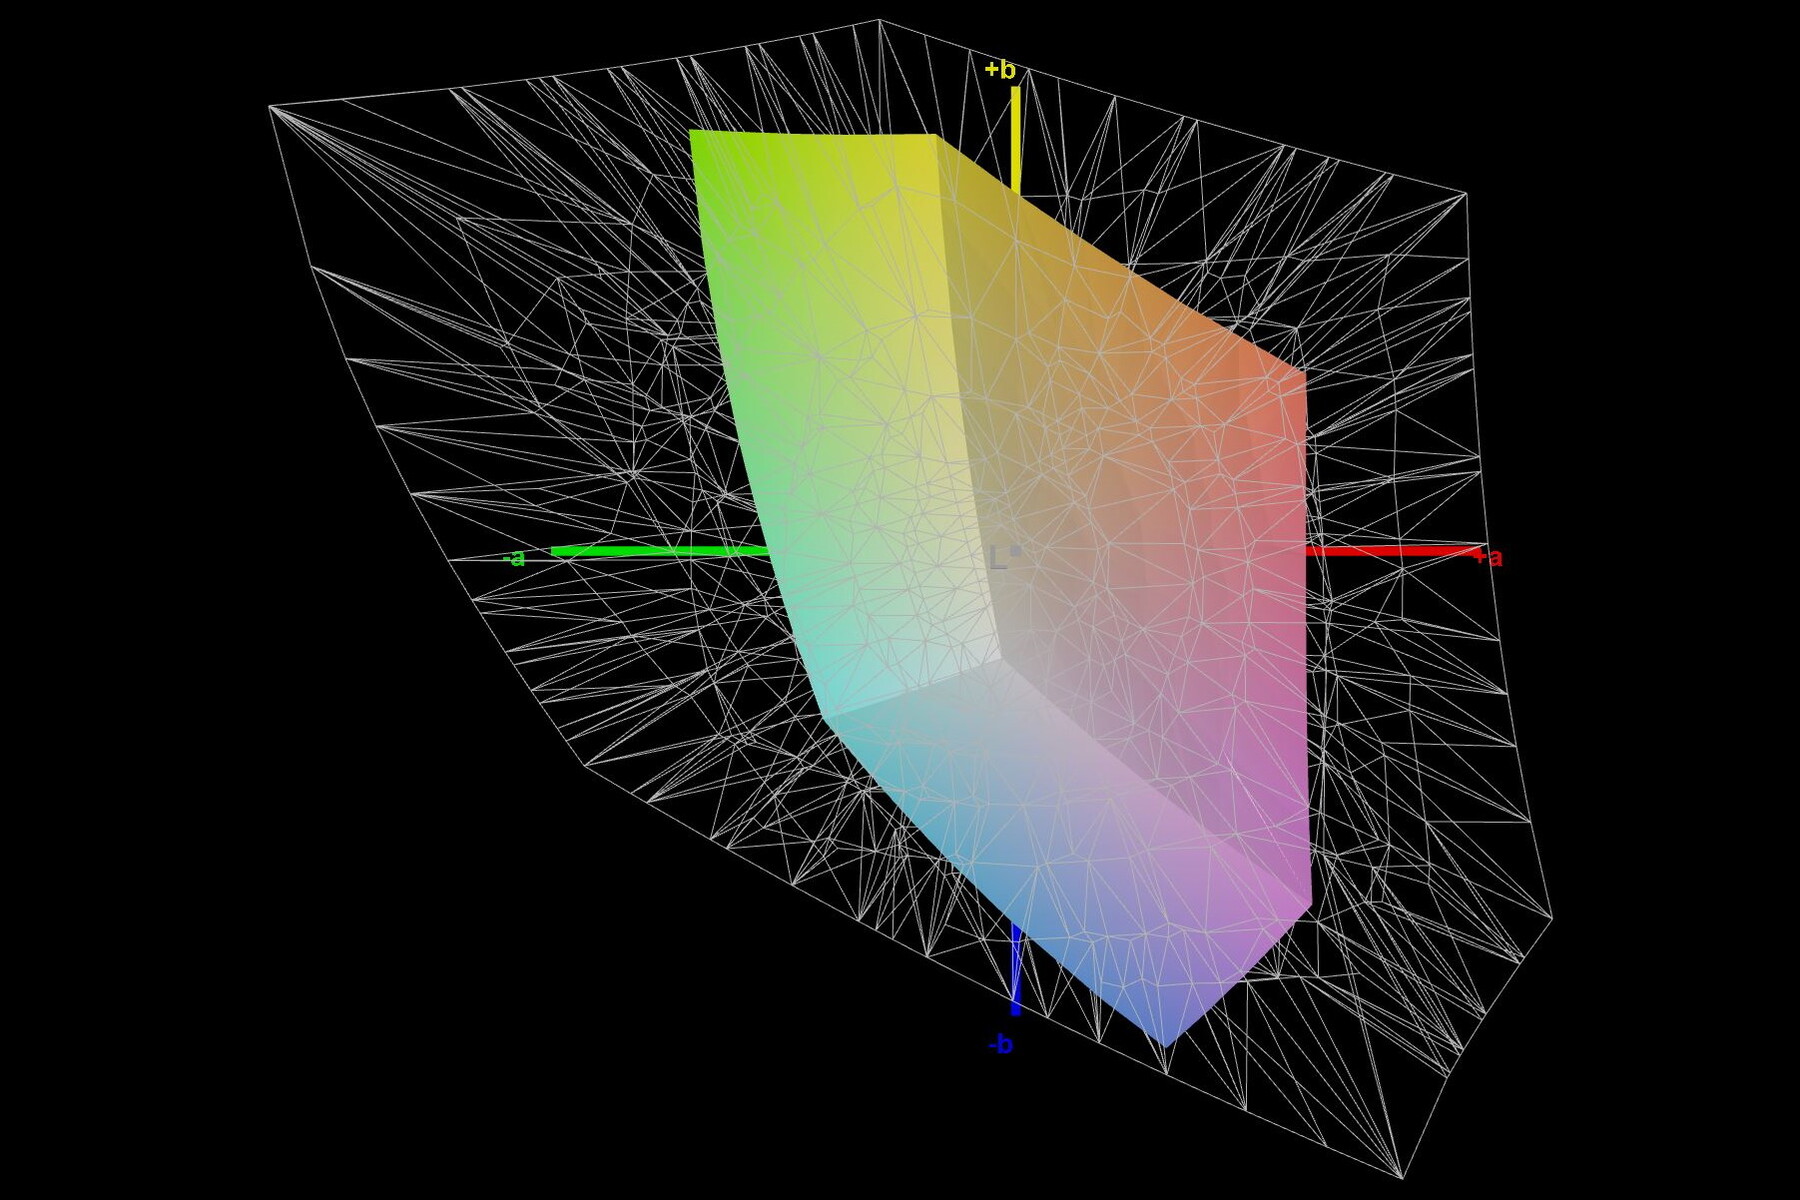
39.3% AdobeRGB 1998 (Argyll 3D)
56.8% sRGB (Argyll 3D)
38.1% Display P3 (Argyll 3D)
Gamma: 2.45
CCT: 6146 K
| MSI Katana 15 B12VEK AUOAF90 (B156HAN08.4), IPS, 1920x1080, 15.6" | MSI Katana GF66 12UGS AU Optronics AUOAF90, IPS, 1920x1080, 15.6" | MSI Pulse GL66 12UEK AU Optronics B156HAN08.4 (AUOAF90), IPS, 1920x1080, 15.6" | Lenovo Legion 5 15IAH7H 82RB CSOT MNF601CA1-3, IPS, 1920x1080, 15.6" | Asus TUF Gaming F15 FX507ZM TL156VDXP0101, IPS, 1920x1080, 15.6" | Schenker XMG Core 15 (M22) CSOT MNF601CA1-1, IPS, 2560x1440, 15.6" | |
|---|---|---|---|---|---|---|
| Display | 3% | 3% | 78% | 73% | 78% | |
| Display P3 Coverage (%) | 38.1 | 39.1 3% | 39 2% | 69.1 81% | 66.4 74% | 68.8 81% |
| sRGB Coverage (%) | 56.8 | 58.3 3% | 58.4 3% | 99.5 75% | 97 71% | 99.3 75% |
| AdobeRGB 1998 Coverage (%) | 39.3 | 40.4 3% | 40.3 3% | 70 78% | 68.5 74% | 69.9 78% |
| Response Times | -5% | -2% | 59% | 69% | 66% | |
| Response Time Grey 50% / Grey 80% * (ms) | 38.8 ? | 40 ? -3% | 38.8 ? -0% | 14.8 ? 62% | 5.6 ? 86% | 16 ? 59% |
| Response Time Black / White * (ms) | 26.8 ? | 28.4 ? -6% | 28 ? -4% | 12 ? 55% | 12.8 ? 52% | 7.6 ? 72% |
| PWM Frequency (Hz) | ||||||
| Screen | 1% | 29% | 1% | 26% | 15% | |
| Brightness middle (cd/m²) | 261 | 227 -13% | 248 -5% | 363.5 39% | 353.7 36% | 378 45% |
| Brightness (cd/m²) | 258 | 225 -13% | 245 -5% | 350 36% | 340 32% | 371 44% |
| Brightness Distribution (%) | 92 | 90 -2% | 86 -7% | 89 -3% | 89 -3% | 93 1% |
| Black Level * (cd/m²) | 0.19 | 0.21 -11% | 0.13 32% | 0.39 -105% | 0.34 -79% | 0.33 -74% |
| Contrast (:1) | 1374 | 1081 -21% | 1908 39% | 932 -32% | 1040 -24% | 1145 -17% |
| Colorchecker dE 2000 * | 5.57 | 4.19 25% | 3.14 44% | 3.68 34% | 1.74 69% | 2.84 49% |
| Colorchecker dE 2000 max. * | 20.6 | 17.45 15% | 5.82 72% | 8.92 57% | 3.63 82% | 5.51 73% |
| Colorchecker dE 2000 calibrated * | 4.63 | 3.81 18% | 3.14 32% | 0.53 89% | 0.5 89% | 2.75 41% |
| Greyscale dE 2000 * | 3.19 | 2.7 15% | 1.2 62% | 6.5 -104% | 2.1 34% | 4.08 -28% |
| Gamma | 2.45 90% | 2.208 100% | 2.49 88% | 2.2 100% | 2.3 96% | 2.4 92% |
| CCT | 6146 106% | 6176 105% | 6468 100% | 5995 108% | 6257 104% | 5841 111% |
| Total Average (Program / Settings) | -0% /
1% | 10% /
19% | 46% /
26% | 56% /
42% | 53% /
36% |
* ... smaller is better
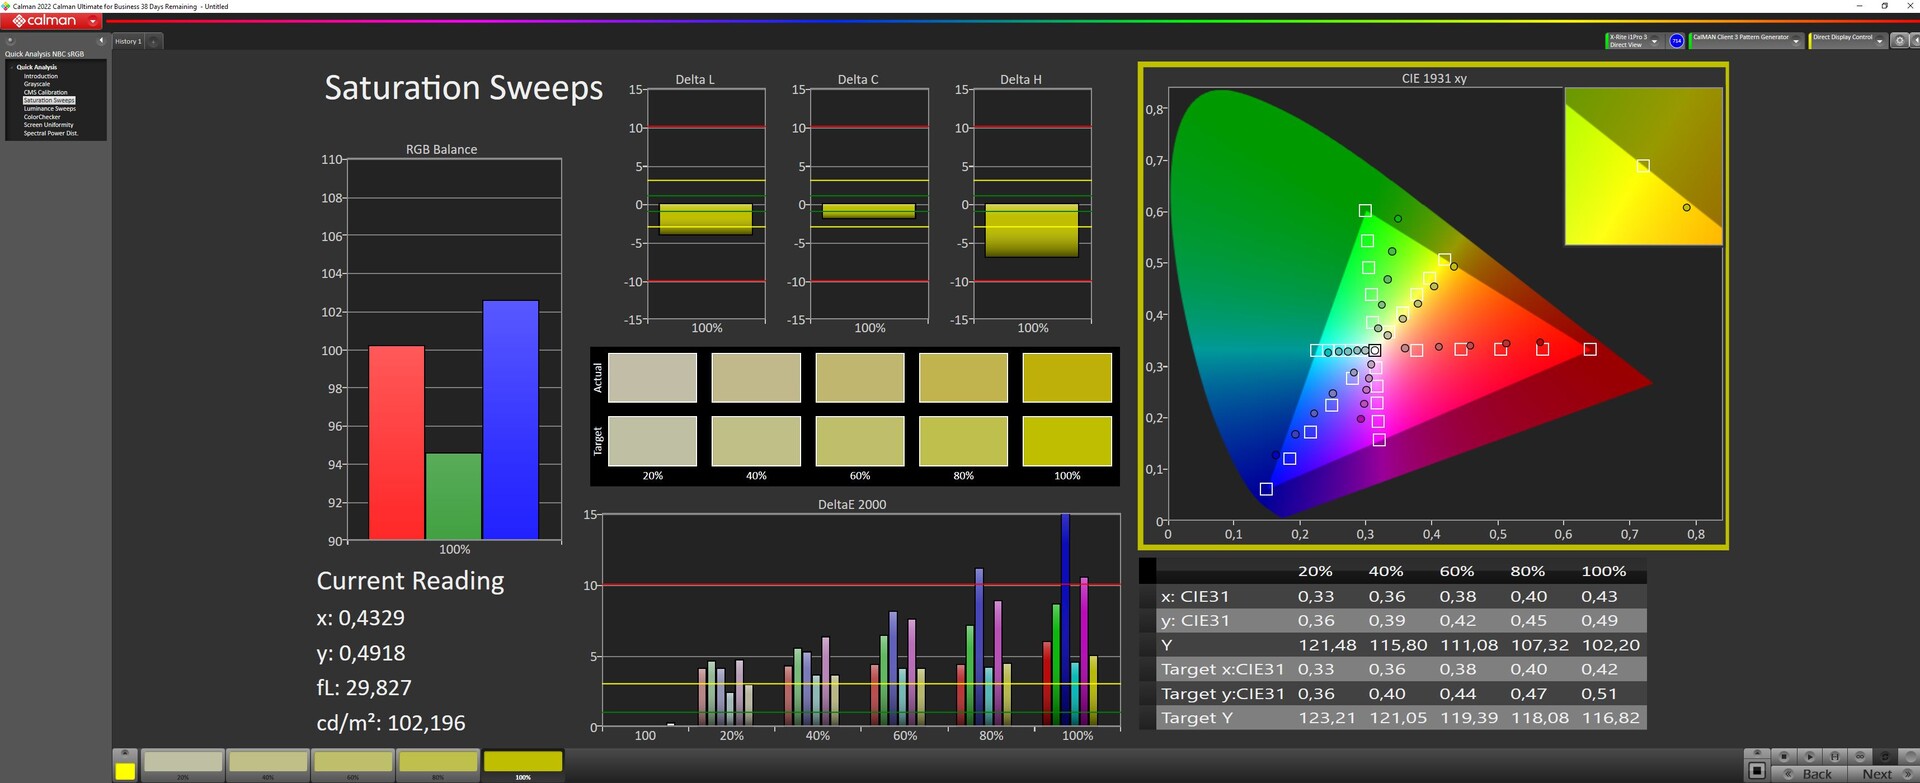
The manufacturer does not provide any information about the color space coverage. We measured just under 57 percent in sRGB and around 39 percent in AdobeRGB and DisplayP3. Here, too, the budget character of the Katana 15 is evident; the competition provides higher color space coverage.
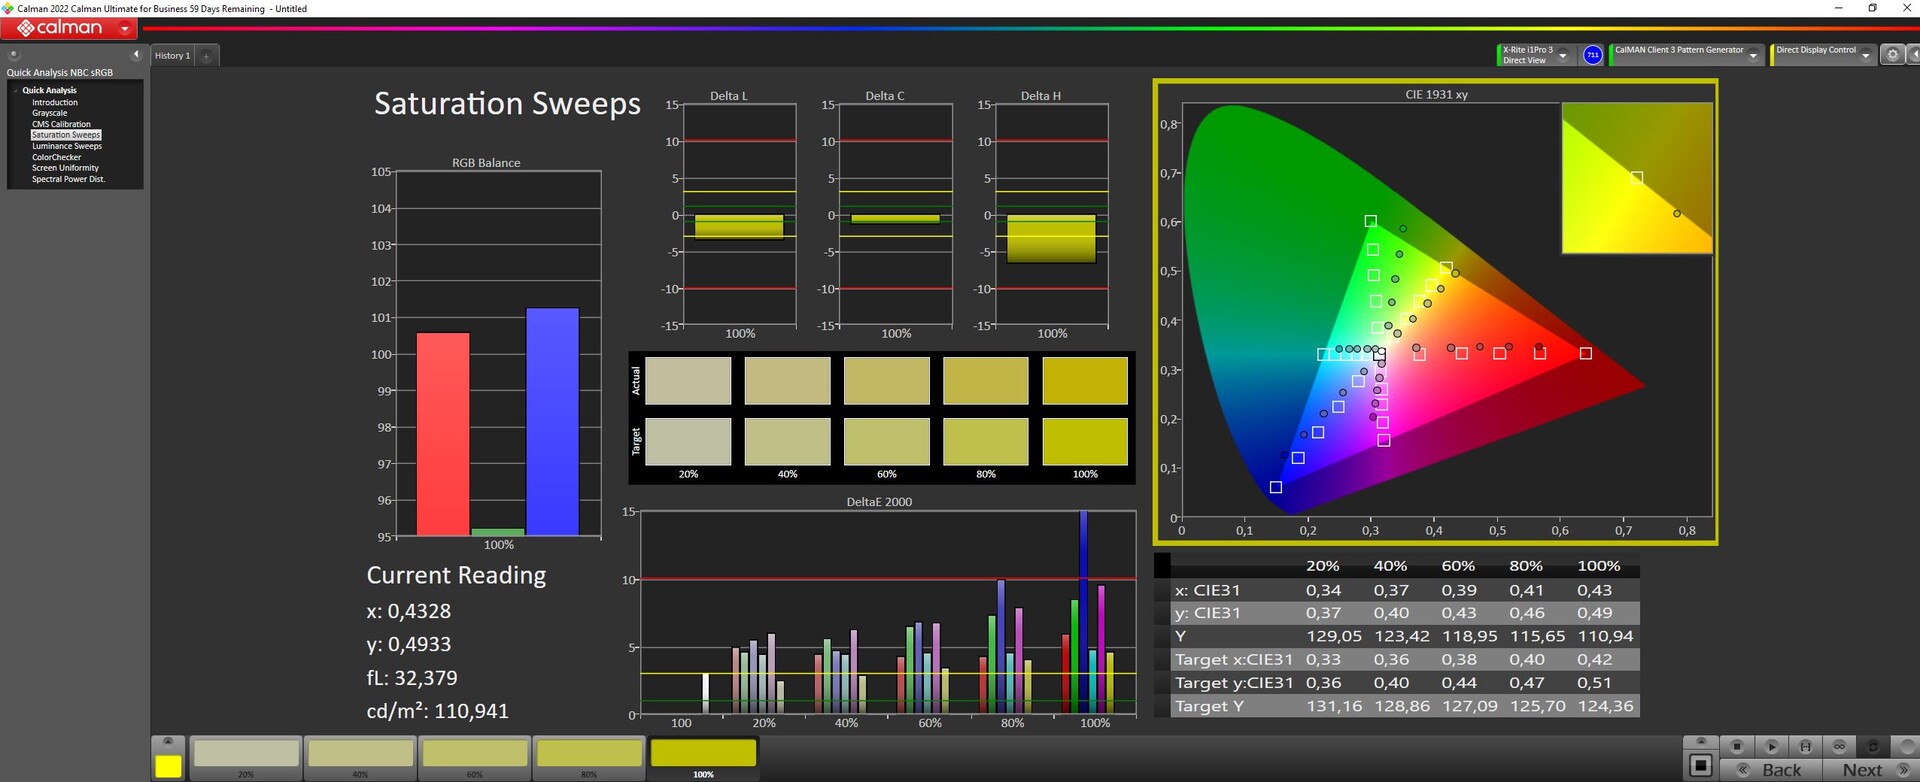
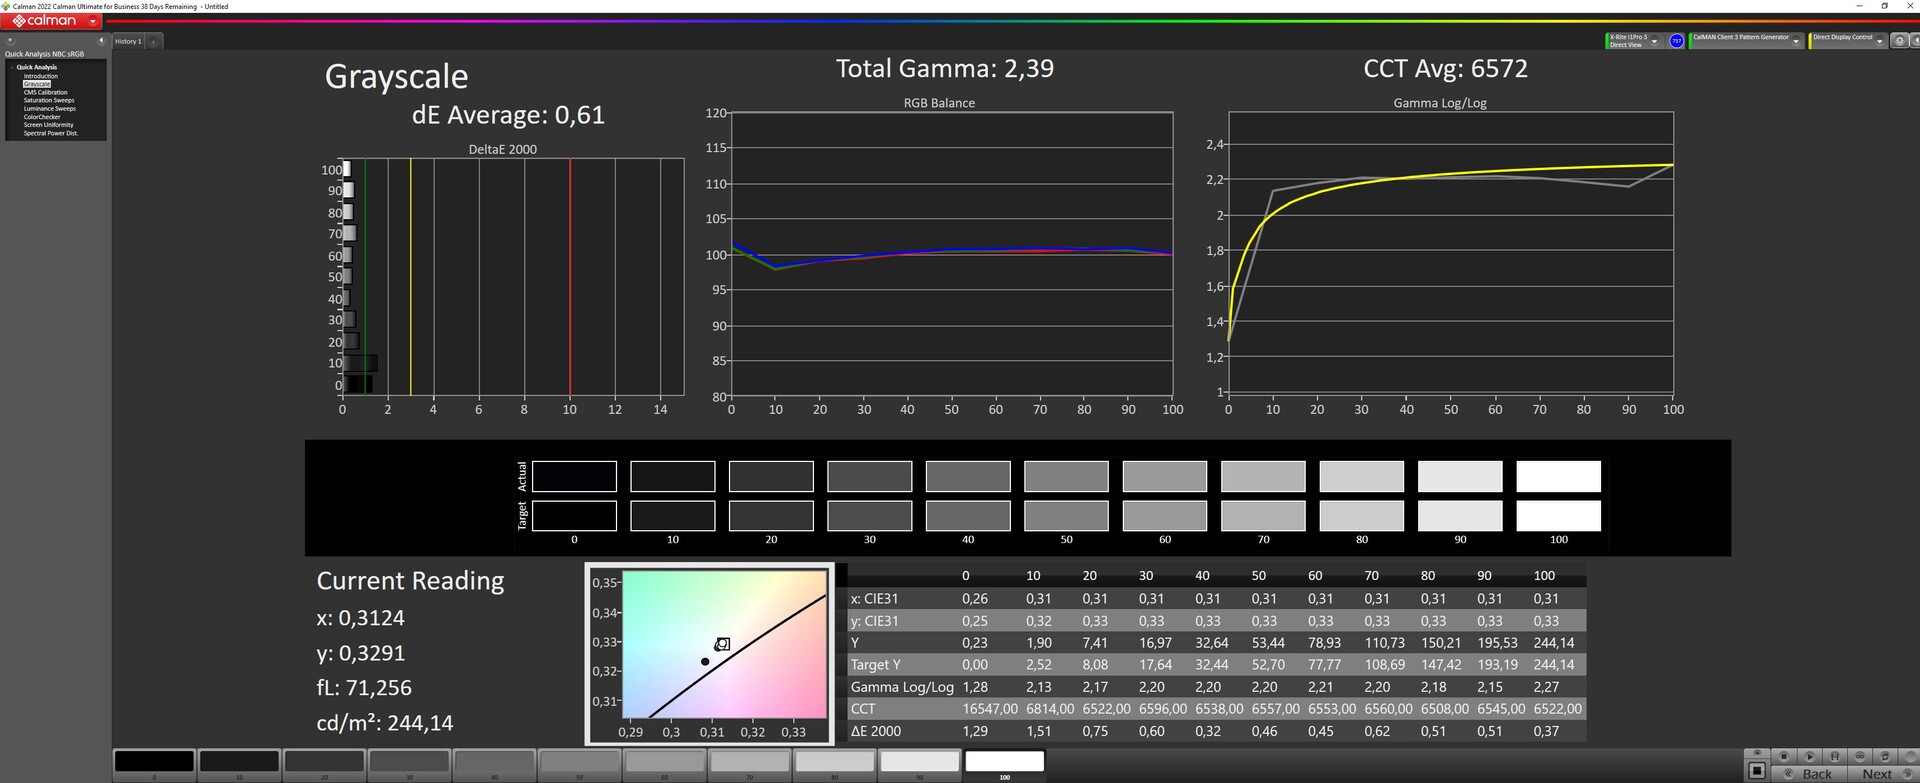
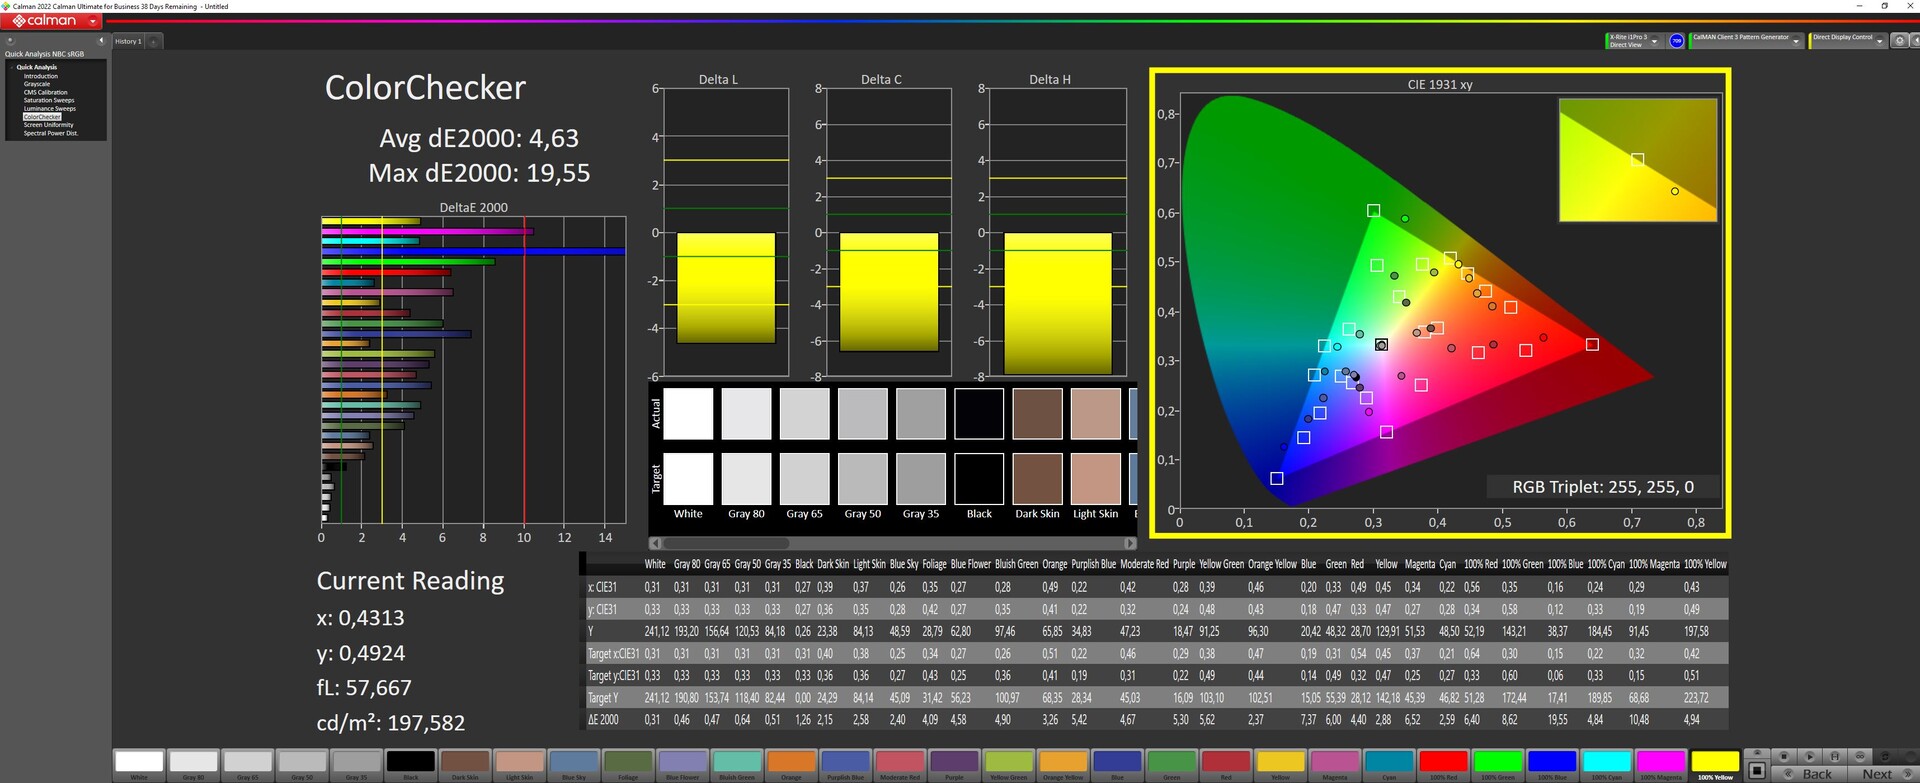
The display is not so well adjusted ex factory. We only measured against the sRGB standard here. Reducing the brightness only slightly lowers the DeltaE value for the gray levels, but it still remains just under 3. However, the Calman ColorChecker shows high color deviations.
Manual calibration minimizes the grayscale deviations to a good 0.61, but the ColorChecker's DeltaE value of 4.63 remains far too high. The display does not seem to be capable of more. Our calibrated icc color profile can be downloaded above.
Display Response Times
| ↔ Response Time Black to White | ||
|---|---|---|
| 26.8 ms ... rise ↗ and fall ↘ combined | ↗ 14.2 ms rise | 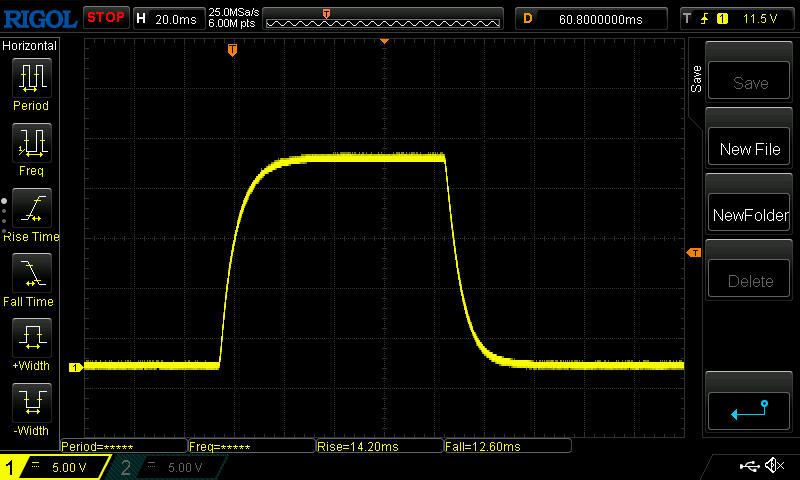 |
| ↘ 12.6 ms fall | ||
| The screen shows relatively slow response rates in our tests and may be too slow for gamers. In comparison, all tested devices range from 0.1 (minimum) to 240 (maximum) ms. » 66 % of all devices are better. This means that the measured response time is worse than the average of all tested devices (20.2 ms). | ||
| ↔ Response Time 50% Grey to 80% Grey | ||
| 38.8 ms ... rise ↗ and fall ↘ combined | ↗ 18.6 ms rise | 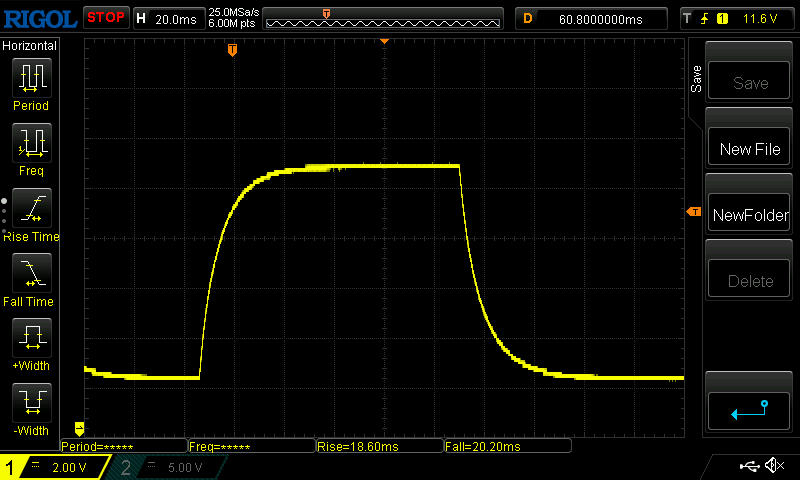 |
| ↘ 20.2 ms fall | ||
| The screen shows slow response rates in our tests and will be unsatisfactory for gamers. In comparison, all tested devices range from 0.165 (minimum) to 636 (maximum) ms. » 57 % of all devices are better. This means that the measured response time is worse than the average of all tested devices (31.6 ms). | ||
Screen Flickering / PWM (Pulse-Width Modulation)
| Screen flickering / PWM not detected | 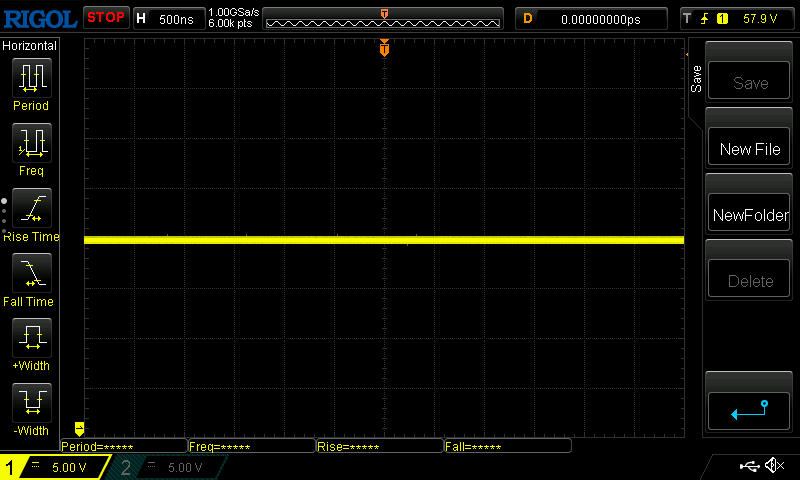 | ||
In comparison: 53 % of all tested devices do not use PWM to dim the display. If PWM was detected, an average of 8091 (minimum: 5 - maximum: 343500) Hz was measured. | |||
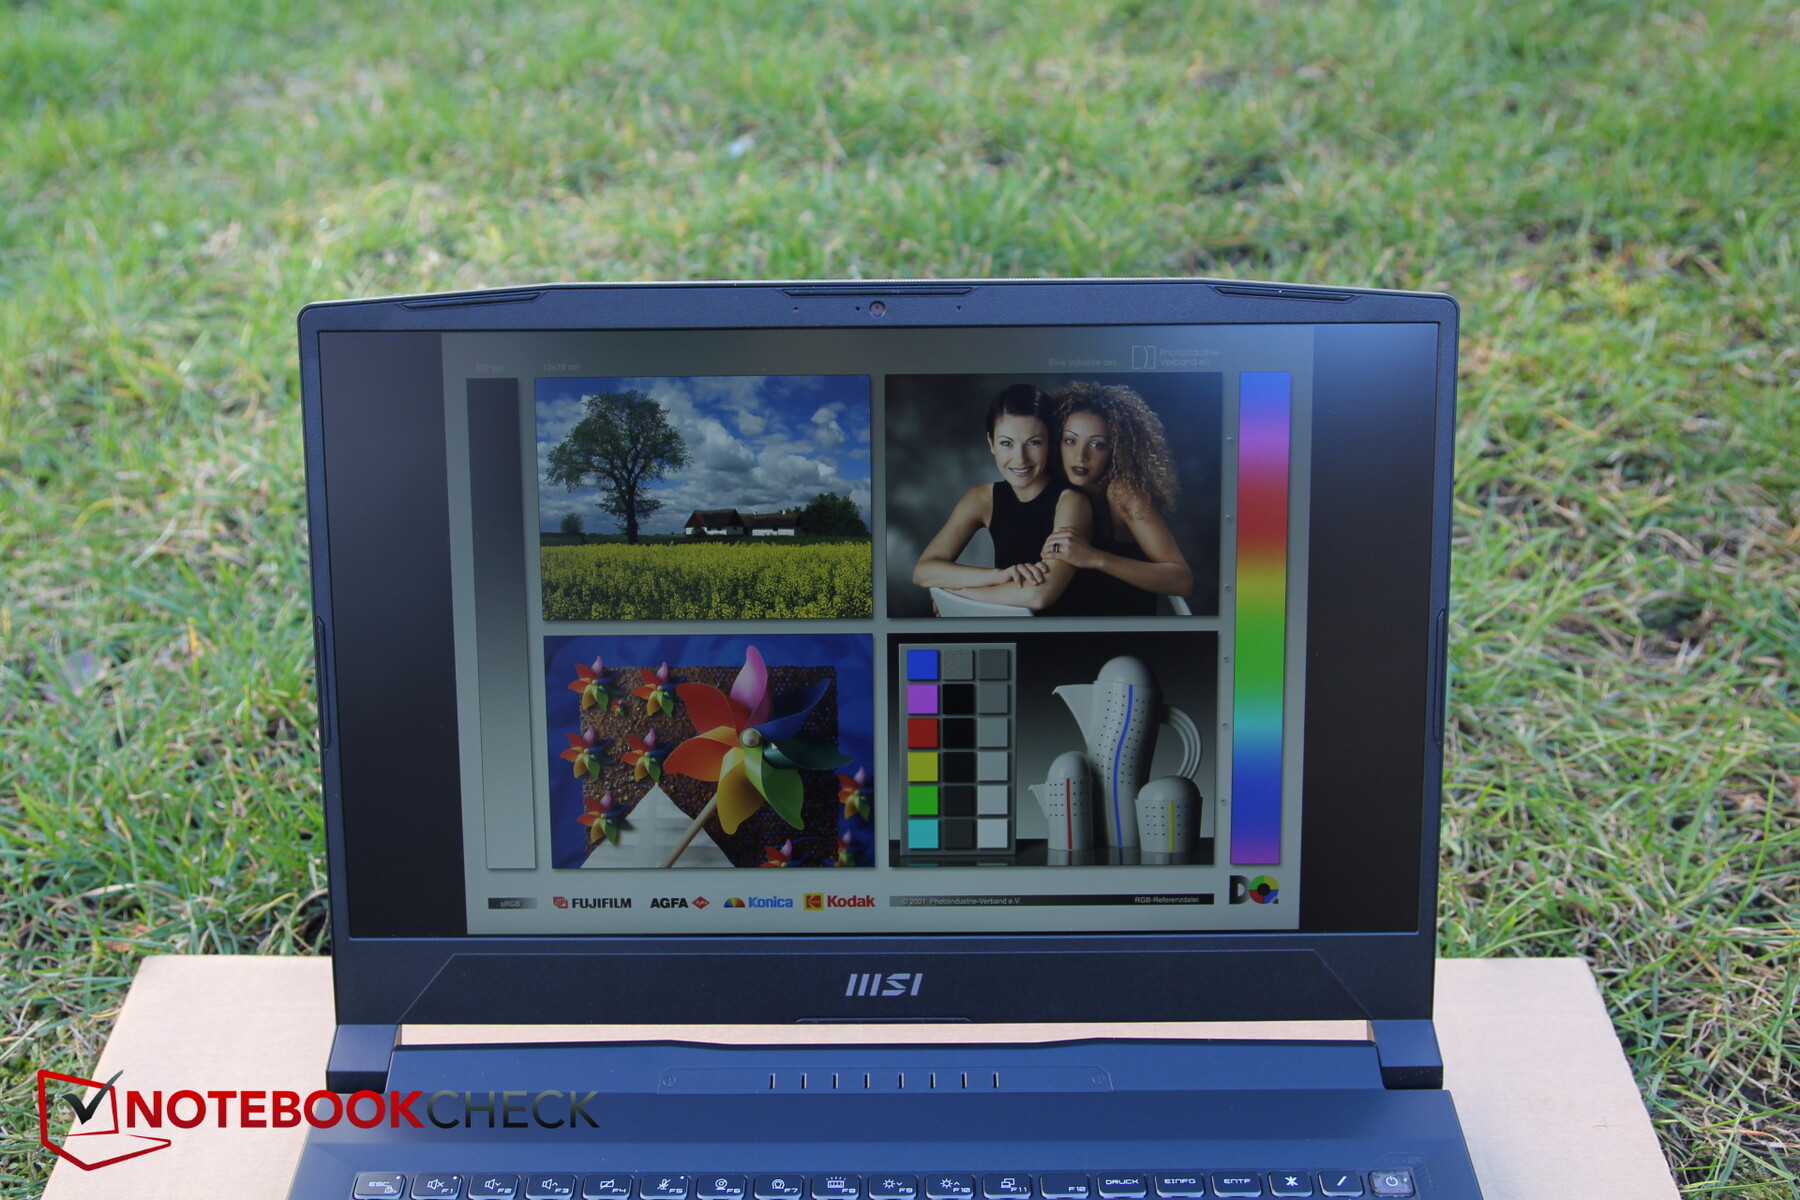
The matte surface filters out aggressive reflections outdoors. However, the panel's weak brightness definitely demands a place in the shade.
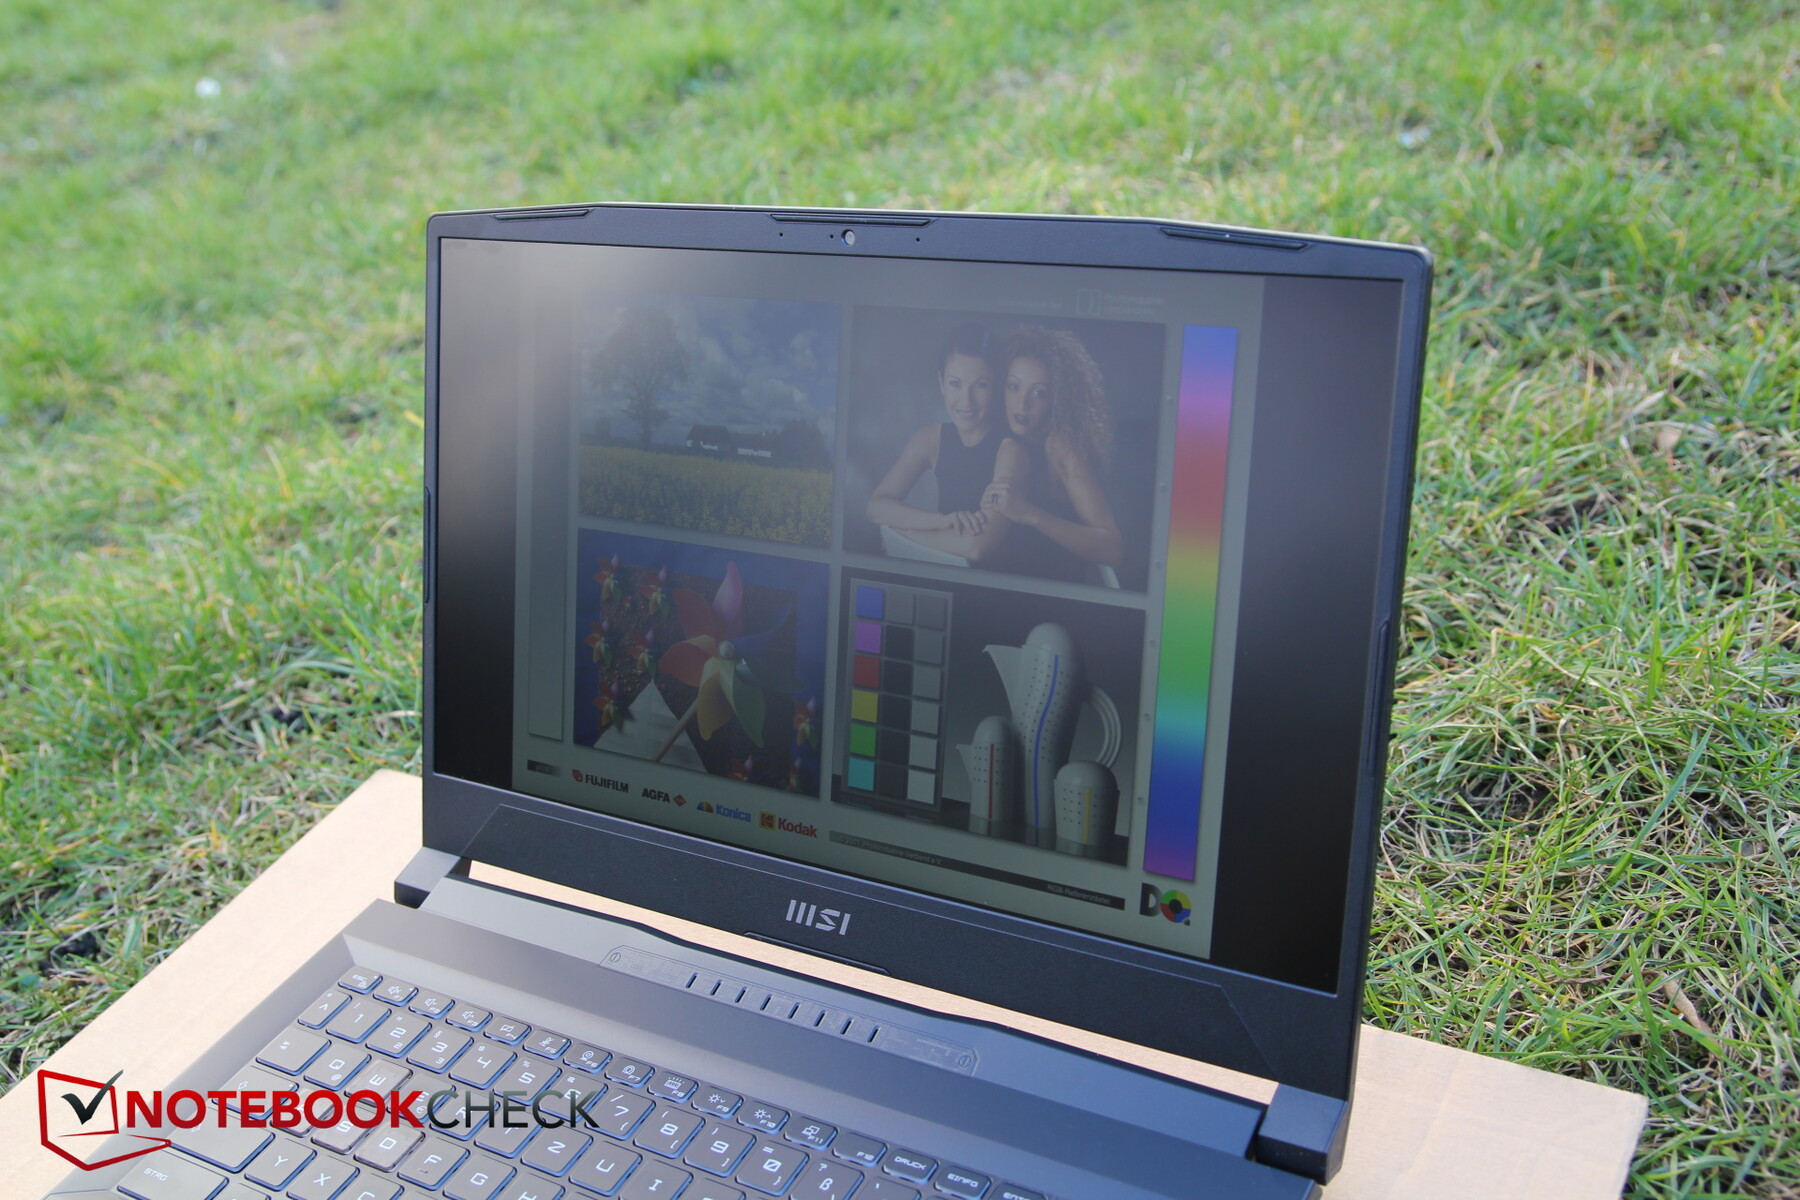
The viewing angle stability is okay. A drop in brightness is only visible at extreme viewing angles.

Performance - Katana 15 at the level of RTX 3060
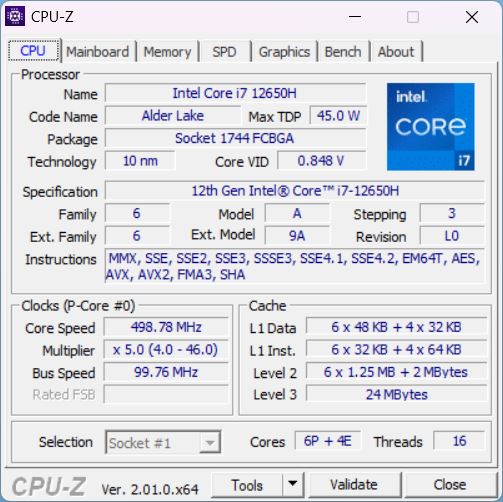
The MSI Katana 15 is advertised as a gaming laptop, and although its Core i7-12650H belongs to last year's Alder Lake series, it is definitely part of the lower high-end.
The CPU is combined with an Nvidia RTX 4050, the entry-level card among the new RTX 40xx models. In the Katana, it can consume up to 105 W. 16 GB RAM is the (lower) standard for a gamer these days.
Testing Conditions
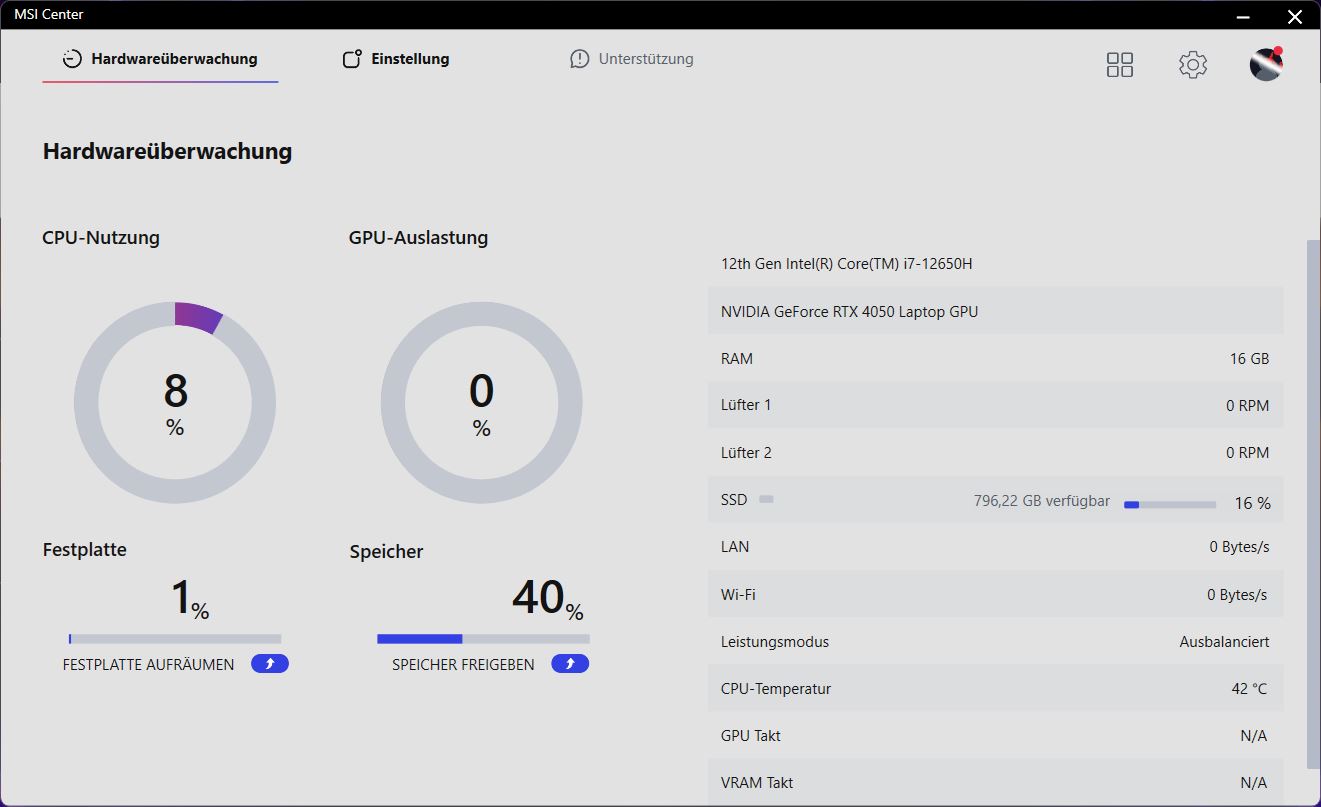
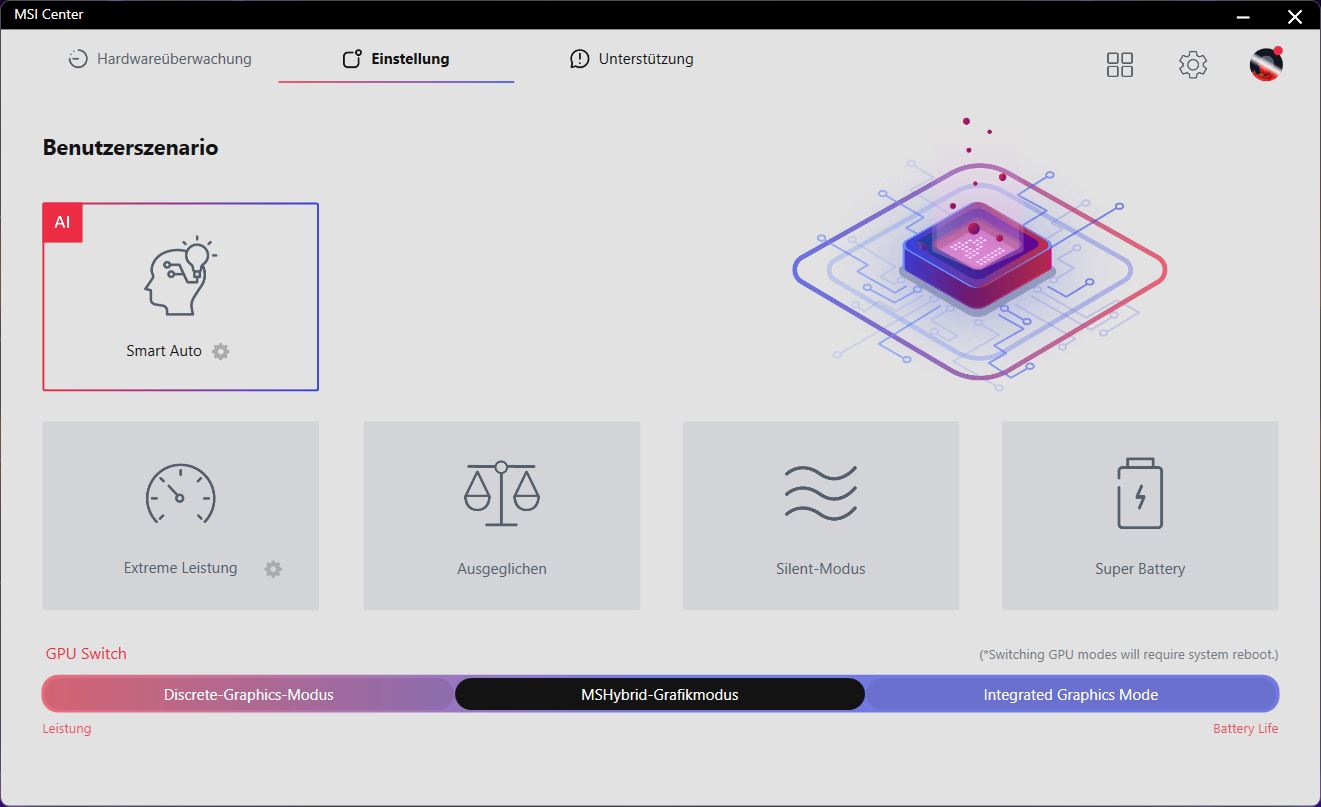
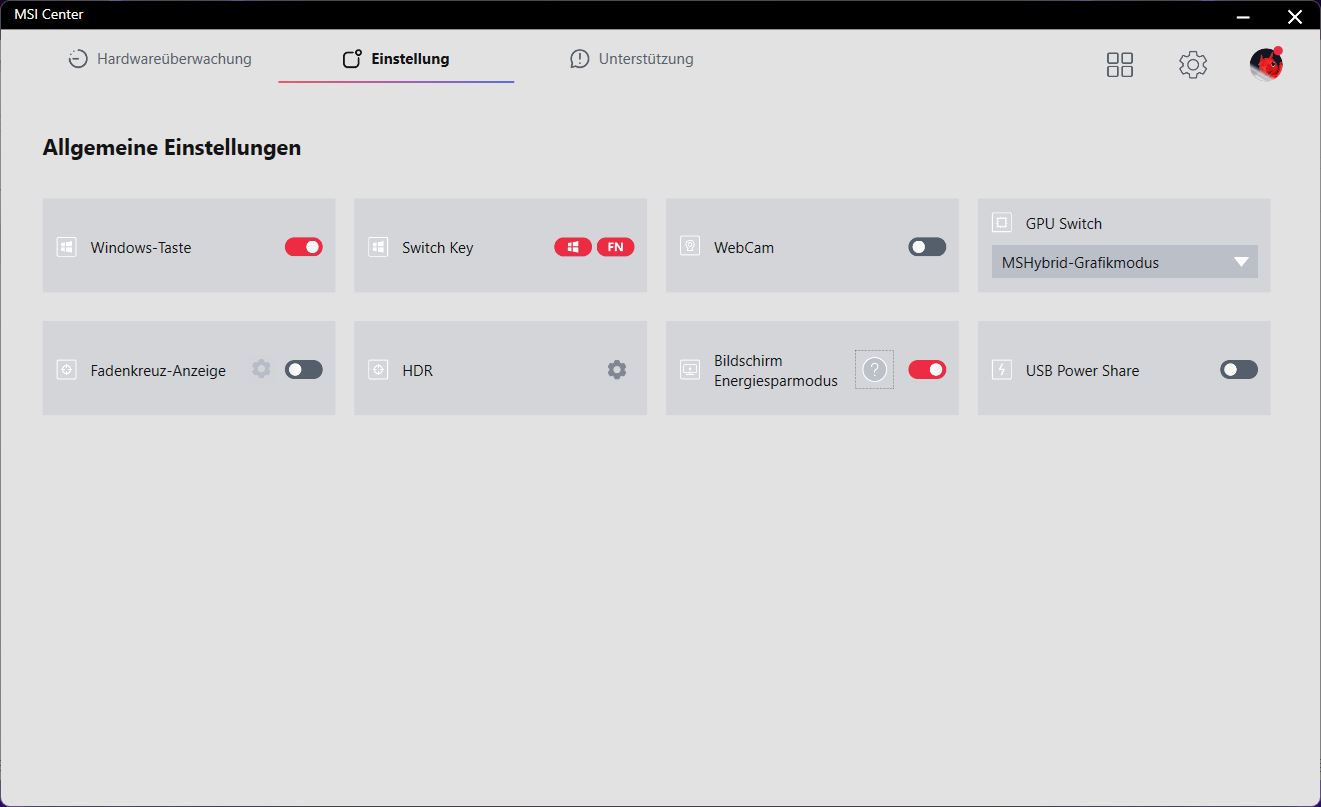
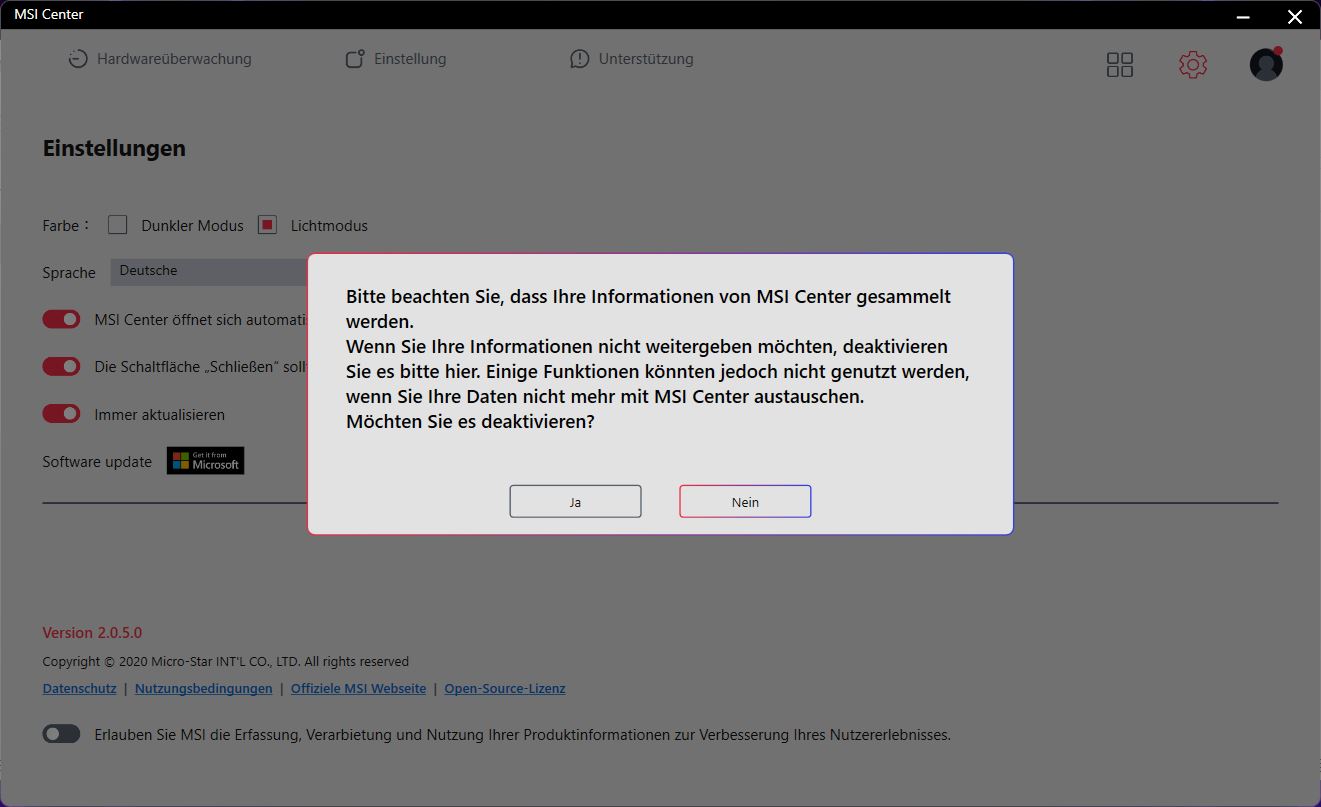
The MSI Center is the control center, which the manufacturer uses to collect various kinds of data, of course. Among other things, the performance settings are adjusted here. AI mode is preset by default here, which automatically adjusts performance values depending on the applied load. We placed our faith in the competence of AI and ran all benchmarks in this mode.
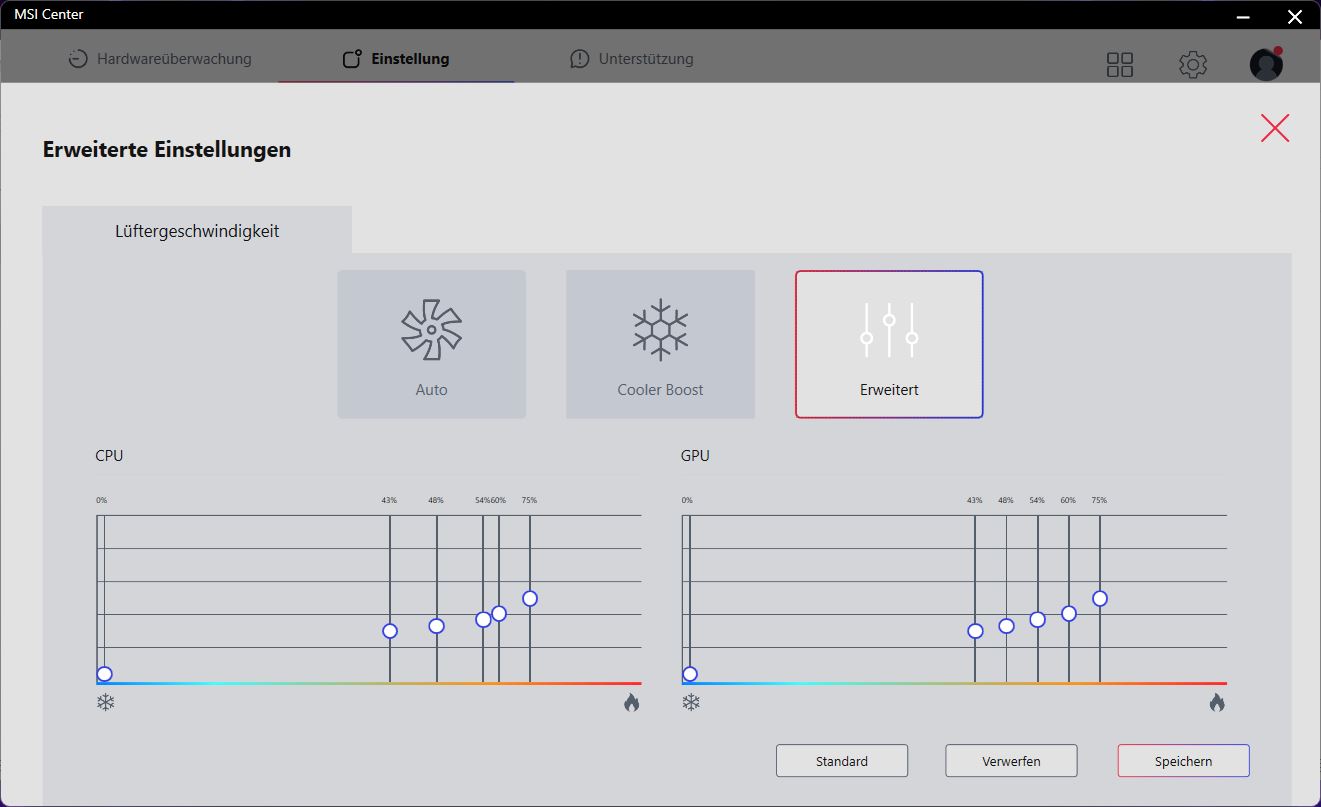
In addition to performance, other settings can be adjusted in the MSI Center. For example, you swap the functions of the fn and Windows keys, manually adjust fan curves in Extreme Performance mode, or switch iGPU and dGPU. The tool has problems with certain resolutions.
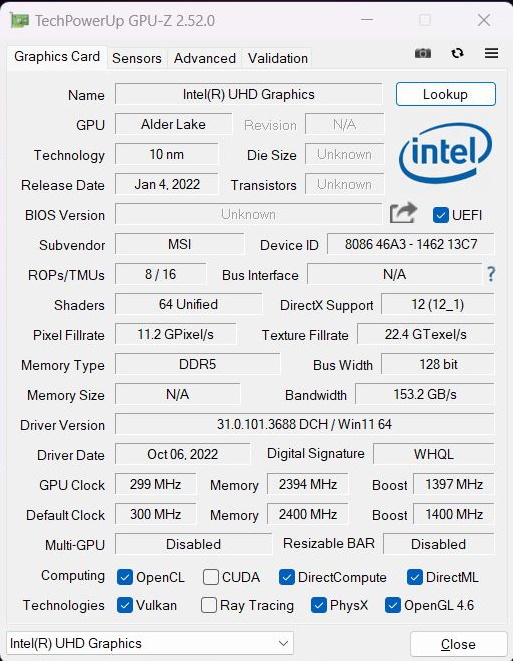
Most of the time, the GPU hybrid mode was activated in the MSI Center, which automatically switches between iGPU and dGPU. However, this did not work reliably in our benchmarks. For example, we had to manually activate the dGPU for Blender because the test automatically only ran with iGPU and produced very poor results.
Processor
In contrast to the commonly used i7-12700H, the i7-12650H has only 4 of the 8 E cores, but the 6 P cores are the same. The latter clock at up to 4.7 GHz. The CPU belongs to the lower high-end of the latest Intel generation. Alternatively, there is now also the Katana 15 B13 with a Gen13 CPU from Intel, the price of which is likely to be higher.
In the Cinebench loop, we observe a small drop in performance over the first two runs. Afterwards, performance is largely constant, but not overly high overall. Our Katana is at a disadvantage compared to the competition with i7-12700H, and it is also beaten by the Ryzen 7 6800H.
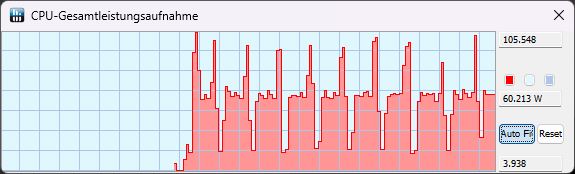
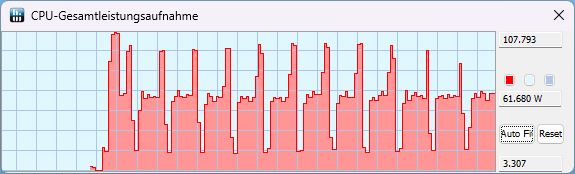
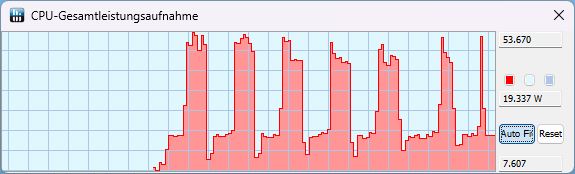
TDP remains almost the same in both KI and Extreme mode: we measured around 105 W at the beginning and end of a run, respectively, and the power consumption drops to 60 W in the course of the run. In battery mode, the peak is only 53 W, otherwise only 19 W is available.
Overall, CPU performance is on the expected level, but the single-core performance of the Katana is somewhat weaker.
Cinebench R15 Multi Sustained Load
Cinebench R23: Multi Core | Single Core
Cinebench R20: CPU (Multi Core) | CPU (Single Core)
Cinebench R15: CPU Multi 64Bit | CPU Single 64Bit
Blender: v2.79 BMW27 CPU
7-Zip 18.03: 7z b 4 | 7z b 4 -mmt1
Geekbench 5.5: Multi-Core | Single-Core
HWBOT x265 Benchmark v2.2: 4k Preset
LibreOffice : 20 Documents To PDF
R Benchmark 2.5: Overall mean
| CPU Performance rating | |
| Average of class Gaming | |
| Lenovo Legion 5 15IAH7H 82RB | |
| MSI Pulse GL66 12UEK | |
| Asus TUF Gaming F15 FX507ZM | |
| MSI Katana GF66 12UGS | |
| MSI Katana 15 B12VEK | |
| Schenker XMG Core 15 (M22) | |
| Average Intel Core i7-12650H | |
| Cinebench R23 / Multi Core | |
| Average of class Gaming (5668 - 40970, n=148, last 2 years) | |
| Lenovo Legion 5 15IAH7H 82RB | |
| Asus TUF Gaming F15 FX507ZM | |
| MSI Pulse GL66 12UEK | |
| MSI Katana GF66 12UGS | |
| MSI Katana 15 B12VEK | |
| Schenker XMG Core 15 (M22) | |
| Average Intel Core i7-12650H (5362 - 15537, n=14) | |
| Cinebench R23 / Single Core | |
| Average of class Gaming (1136 - 2267, n=148, last 2 years) | |
| MSI Pulse GL66 12UEK | |
| MSI Katana GF66 12UGS | |
| Lenovo Legion 5 15IAH7H 82RB | |
| Asus TUF Gaming F15 FX507ZM | |
| Average Intel Core i7-12650H (1428 - 1808, n=14) | |
| MSI Katana 15 B12VEK | |
| Schenker XMG Core 15 (M22) | |
| Cinebench R20 / CPU (Multi Core) | |
| Average of class Gaming (2179 - 16108, n=147, last 2 years) | |
| Lenovo Legion 5 15IAH7H 82RB | |
| Asus TUF Gaming F15 FX507ZM | |
| MSI Pulse GL66 12UEK | |
| MSI Katana GF66 12UGS | |
| MSI Katana 15 B12VEK | |
| Schenker XMG Core 15 (M22) | |
| Average Intel Core i7-12650H (2106 - 6009, n=14) | |
| Cinebench R20 / CPU (Single Core) | |
| Average of class Gaming (439 - 870, n=147, last 2 years) | |
| MSI Pulse GL66 12UEK | |
| MSI Katana GF66 12UGS | |
| Lenovo Legion 5 15IAH7H 82RB | |
| Asus TUF Gaming F15 FX507ZM | |
| Average Intel Core i7-12650H (552 - 696, n=14) | |
| MSI Katana 15 B12VEK | |
| Schenker XMG Core 15 (M22) | |
| Cinebench R15 / CPU Multi 64Bit | |
| Average of class Gaming (1537 - 6271, n=147, last 2 years) | |
| Lenovo Legion 5 15IAH7H 82RB | |
| Asus TUF Gaming F15 FX507ZM | |
| MSI Pulse GL66 12UEK | |
| MSI Katana GF66 12UGS | |
| MSI Katana GF66 12UGS | |
| Schenker XMG Core 15 (M22) | |
| MSI Katana 15 B12VEK | |
| Average Intel Core i7-12650H (753 - 2253, n=14) | |
| Cinebench R15 / CPU Single 64Bit | |
| Average of class Gaming (188.8 - 343, n=146, last 2 years) | |
| MSI Pulse GL66 12UEK | |
| MSI Katana GF66 12UGS | |
| MSI Katana GF66 12UGS | |
| Lenovo Legion 5 15IAH7H 82RB | |
| Asus TUF Gaming F15 FX507ZM | |
| Schenker XMG Core 15 (M22) | |
| MSI Katana 15 B12VEK | |
| Average Intel Core i7-12650H (206 - 261, n=14) | |
| Blender / v2.79 BMW27 CPU | |
| Average Intel Core i7-12650H (222 - 553, n=15) | |
| MSI Katana GF66 12UGS | |
| MSI Katana 15 B12VEK | |
| Schenker XMG Core 15 (M22) | |
| MSI Pulse GL66 12UEK | |
| Asus TUF Gaming F15 FX507ZM | |
| Lenovo Legion 5 15IAH7H 82RB | |
| Average of class Gaming (80 - 517, n=143, last 2 years) | |
| 7-Zip 18.03 / 7z b 4 | |
| Average of class Gaming (23795 - 148086, n=145, last 2 years) | |
| Lenovo Legion 5 15IAH7H 82RB | |
| Asus TUF Gaming F15 FX507ZM | |
| MSI Pulse GL66 12UEK | |
| Schenker XMG Core 15 (M22) | |
| MSI Katana 15 B12VEK | |
| MSI Katana GF66 12UGS | |
| Average Intel Core i7-12650H (27053 - 59034, n=14) | |
| 7-Zip 18.03 / 7z b 4 -mmt1 | |
| Average of class Gaming (4199 - 7508, n=145, last 2 years) | |
| MSI Pulse GL66 12UEK | |
| MSI Katana GF66 12UGS | |
| Lenovo Legion 5 15IAH7H 82RB | |
| Schenker XMG Core 15 (M22) | |
| Average Intel Core i7-12650H (5265 - 6116, n=14) | |
| MSI Katana 15 B12VEK | |
| Asus TUF Gaming F15 FX507ZM | |
| Geekbench 5.5 / Multi-Core | |
| Average of class Gaming (4557 - 27010, n=144, last 2 years) | |
| Lenovo Legion 5 15IAH7H 82RB | |
| Asus TUF Gaming F15 FX507ZM | |
| MSI Pulse GL66 12UEK | |
| MSI Katana GF66 12UGS | |
| MSI Katana 15 B12VEK | |
| Schenker XMG Core 15 (M22) | |
| Average Intel Core i7-12650H (6478 - 11284, n=16) | |
| Geekbench 5.5 / Single-Core | |
| Average of class Gaming (986 - 2423, n=144, last 2 years) | |
| MSI Pulse GL66 12UEK | |
| MSI Katana GF66 12UGS | |
| Lenovo Legion 5 15IAH7H 82RB | |
| Asus TUF Gaming F15 FX507ZM | |
| Average Intel Core i7-12650H (1590 - 1797, n=16) | |
| MSI Katana 15 B12VEK | |
| Schenker XMG Core 15 (M22) | |
| HWBOT x265 Benchmark v2.2 / 4k Preset | |
| Average of class Gaming (7.7 - 44.3, n=145, last 2 years) | |
| Lenovo Legion 5 15IAH7H 82RB | |
| Asus TUF Gaming F15 FX507ZM | |
| MSI Pulse GL66 12UEK | |
| Schenker XMG Core 15 (M22) | |
| MSI Katana 15 B12VEK | |
| Average Intel Core i7-12650H (6.62 - 17.4, n=16) | |
| MSI Katana GF66 12UGS | |
| LibreOffice / 20 Documents To PDF | |
| Schenker XMG Core 15 (M22) | |
| Asus TUF Gaming F15 FX507ZM | |
| Average of class Gaming (19 - 88.8, n=144, last 2 years) | |
| MSI Katana 15 B12VEK | |
| Average Intel Core i7-12650H (35.1 - 58.5, n=14) | |
| MSI Pulse GL66 12UEK | |
| Lenovo Legion 5 15IAH7H 82RB | |
| MSI Katana GF66 12UGS | |
| R Benchmark 2.5 / Overall mean | |
| MSI Katana 15 B12VEK | |
| Schenker XMG Core 15 (M22) | |
| Average Intel Core i7-12650H (0.4584 - 0.515, n=14) | |
| Asus TUF Gaming F15 FX507ZM | |
| Lenovo Legion 5 15IAH7H 82RB | |
| MSI Katana GF66 12UGS | |
| Average of class Gaming (0.3551 - 0.759, n=146, last 2 years) | |
| MSI Pulse GL66 12UEK | |
* ... smaller is better
AIDA64: FP32 Ray-Trace | FPU Julia | CPU SHA3 | CPU Queen | FPU SinJulia | FPU Mandel | CPU AES | CPU ZLib | FP64 Ray-Trace | CPU PhotoWorxx
| Performance rating | |
| Average of class Gaming | |
| Lenovo Legion 5 15IAH7H 82RB | |
| Schenker XMG Core 15 (M22) | |
| MSI Katana 15 B12VEK | |
| Asus TUF Gaming F15 FX507ZM | |
| MSI Pulse GL66 12UEK | |
| MSI Katana GF66 12UGS | |
| Average Intel Core i7-12650H | |
| AIDA64 / FP32 Ray-Trace | |
| Average of class Gaming (7192 - 85542, n=144, last 2 years) | |
| Lenovo Legion 5 15IAH7H 82RB | |
| Schenker XMG Core 15 (M22) | |
| MSI Katana 15 B12VEK | |
| Average Intel Core i7-12650H (5422 - 15620, n=14) | |
| Asus TUF Gaming F15 FX507ZM | |
| MSI Pulse GL66 12UEK | |
| MSI Katana GF66 12UGS | |
| AIDA64 / FPU Julia | |
| Average of class Gaming (35040 - 238426, n=144, last 2 years) | |
| Schenker XMG Core 15 (M22) | |
| Lenovo Legion 5 15IAH7H 82RB | |
| MSI Katana 15 B12VEK | |
| Average Intel Core i7-12650H (26386 - 76434, n=14) | |
| Asus TUF Gaming F15 FX507ZM | |
| MSI Pulse GL66 12UEK | |
| MSI Katana GF66 12UGS | |
| AIDA64 / CPU SHA3 | |
| Average of class Gaming (1728 - 9817, n=144, last 2 years) | |
| Lenovo Legion 5 15IAH7H 82RB | |
| Schenker XMG Core 15 (M22) | |
| Asus TUF Gaming F15 FX507ZM | |
| MSI Katana 15 B12VEK | |
| MSI Pulse GL66 12UEK | |
| MSI Katana GF66 12UGS | |
| Average Intel Core i7-12650H (1479 - 3244, n=14) | |
| AIDA64 / CPU Queen | |
| Average of class Gaming (49785 - 173351, n=144, last 2 years) | |
| MSI Pulse GL66 12UEK | |
| Lenovo Legion 5 15IAH7H 82RB | |
| MSI Katana GF66 12UGS | |
| Asus TUF Gaming F15 FX507ZM | |
| Schenker XMG Core 15 (M22) | |
| MSI Katana 15 B12VEK | |
| Average Intel Core i7-12650H (59278 - 89537, n=14) | |
| AIDA64 / FPU SinJulia | |
| Average of class Gaming (4424 - 33636, n=144, last 2 years) | |
| Schenker XMG Core 15 (M22) | |
| Lenovo Legion 5 15IAH7H 82RB | |
| MSI Pulse GL66 12UEK | |
| Asus TUF Gaming F15 FX507ZM | |
| MSI Katana GF66 12UGS | |
| MSI Katana 15 B12VEK | |
| Average Intel Core i7-12650H (4690 - 8726, n=14) | |
| AIDA64 / FPU Mandel | |
| Average of class Gaming (17585 - 128721, n=144, last 2 years) | |
| Schenker XMG Core 15 (M22) | |
| Lenovo Legion 5 15IAH7H 82RB | |
| MSI Katana 15 B12VEK | |
| Average Intel Core i7-12650H (15001 - 37738, n=14) | |
| Asus TUF Gaming F15 FX507ZM | |
| MSI Pulse GL66 12UEK | |
| MSI Katana GF66 12UGS | |
| AIDA64 / CPU AES | |
| Lenovo Legion 5 15IAH7H 82RB | |
| Average of class Gaming (19065 - 247074, n=144, last 2 years) | |
| MSI Pulse GL66 12UEK | |
| MSI Katana GF66 12UGS | |
| Schenker XMG Core 15 (M22) | |
| MSI Katana 15 B12VEK | |
| Asus TUF Gaming F15 FX507ZM | |
| Average Intel Core i7-12650H (32702 - 92530, n=14) | |
| AIDA64 / CPU ZLib | |
| Average of class Gaming (373 - 2531, n=144, last 2 years) | |
| Asus TUF Gaming F15 FX507ZM | |
| Lenovo Legion 5 15IAH7H 82RB | |
| MSI Pulse GL66 12UEK | |
| MSI Katana GF66 12UGS | |
| Schenker XMG Core 15 (M22) | |
| MSI Katana 15 B12VEK | |
| Average Intel Core i7-12650H (443 - 891, n=14) | |
| AIDA64 / FP64 Ray-Trace | |
| Average of class Gaming (3856 - 45446, n=144, last 2 years) | |
| Lenovo Legion 5 15IAH7H 82RB | |
| Schenker XMG Core 15 (M22) | |
| MSI Katana 15 B12VEK | |
| Average Intel Core i7-12650H (3096 - 8448, n=14) | |
| Asus TUF Gaming F15 FX507ZM | |
| MSI Pulse GL66 12UEK | |
| MSI Katana GF66 12UGS | |
| AIDA64 / CPU PhotoWorxx | |
| Average of class Gaming (10805 - 62916, n=144, last 2 years) | |
| MSI Katana 15 B12VEK | |
| Lenovo Legion 5 15IAH7H 82RB | |
| Asus TUF Gaming F15 FX507ZM | |
| Average Intel Core i7-12650H (22046 - 44164, n=14) | |
| Schenker XMG Core 15 (M22) | |
| MSI Katana GF66 12UGS | |
| MSI Pulse GL66 12UEK | |
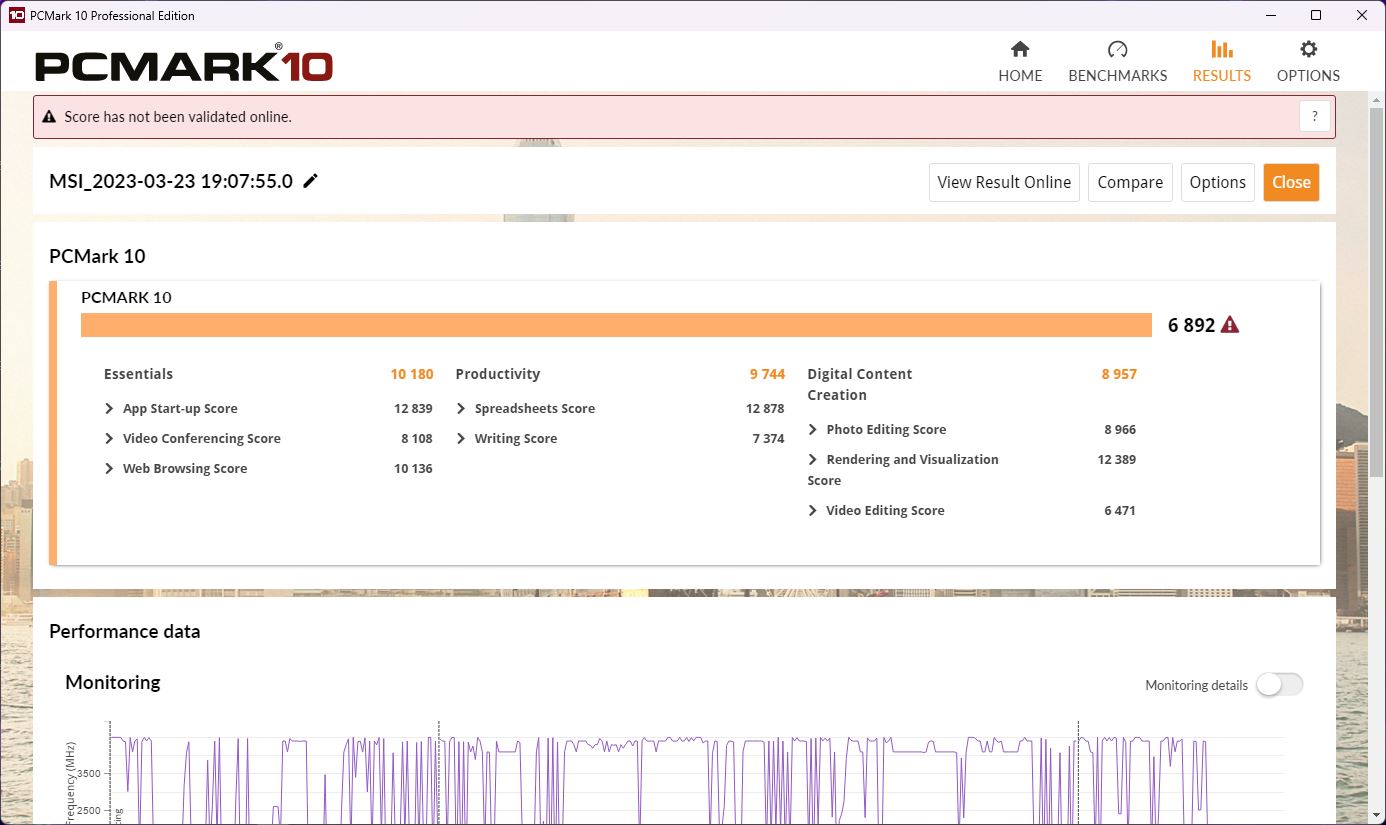
System Performance
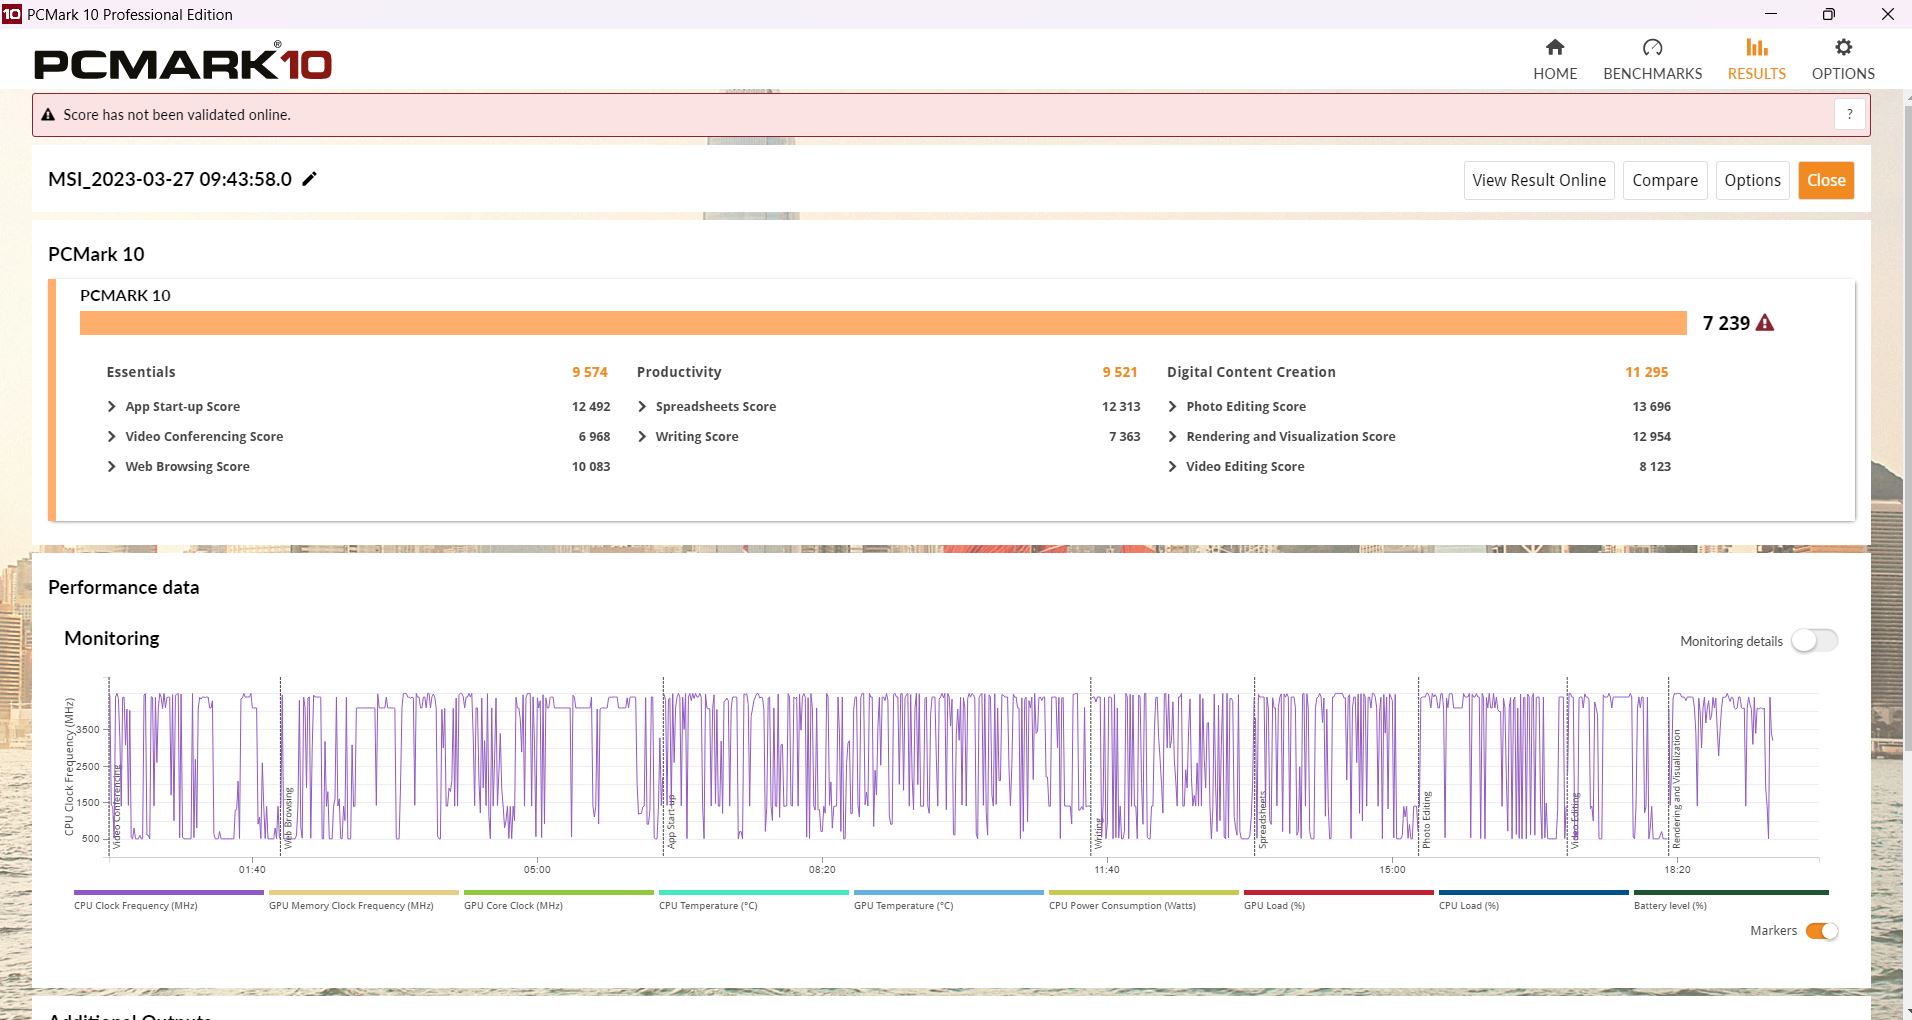
Unsurprisingly, the Katana cannot set itself apart from its sister models GF66 or GL66 in terms of system performance either. In comparison, it achieves a rather lower score. The score is better with the dGPU activated manually, but not in all subtests.
CrossMark: Overall | Productivity | Creativity | Responsiveness
| PCMark 10 / Score | |
| Lenovo Legion 5 15IAH7H 82RB | |
| Average of class Gaming (5776 - 9667, n=122, last 2 years) | |
| MSI Katana GF66 12UGS | |
| Asus TUF Gaming F15 FX507ZM | |
| Schenker XMG Core 15 (M22) | |
| MSI Pulse GL66 12UEK | |
| MSI Katana 15 B12VEK | |
| Average Intel Core i7-12650H, NVIDIA GeForce RTX 4050 Laptop GPU (n=1) | |
| PCMark 10 / Essentials | |
| Lenovo Legion 5 15IAH7H 82RB | |
| Schenker XMG Core 15 (M22) | |
| Average of class Gaming (8810 - 12600, n=127, last 2 years) | |
| Asus TUF Gaming F15 FX507ZM | |
| MSI Pulse GL66 12UEK | |
| MSI Katana GF66 12UGS | |
| MSI Katana 15 B12VEK | |
| Average Intel Core i7-12650H, NVIDIA GeForce RTX 4050 Laptop GPU (n=1) | |
| PCMark 10 / Productivity | |
| Lenovo Legion 5 15IAH7H 82RB | |
| Average of class Gaming (6662 - 16716, n=122, last 2 years) | |
| MSI Katana GF66 12UGS | |
| MSI Pulse GL66 12UEK | |
| MSI Katana 15 B12VEK | |
| Average Intel Core i7-12650H, NVIDIA GeForce RTX 4050 Laptop GPU (n=1) | |
| Schenker XMG Core 15 (M22) | |
| Asus TUF Gaming F15 FX507ZM | |
| PCMark 10 / Digital Content Creation | |
| Average of class Gaming (7440 - 19351, n=122, last 2 years) | |
| Lenovo Legion 5 15IAH7H 82RB | |
| Asus TUF Gaming F15 FX507ZM | |
| MSI Katana GF66 12UGS | |
| Schenker XMG Core 15 (M22) | |
| MSI Pulse GL66 12UEK | |
| MSI Katana 15 B12VEK | |
| Average Intel Core i7-12650H, NVIDIA GeForce RTX 4050 Laptop GPU (n=1) | |
| CrossMark / Overall | |
| MSI Pulse GL66 12UEK | |
| Lenovo Legion 5 15IAH7H 82RB | |
| Average of class Gaming (1247 - 2344, n=118, last 2 years) | |
| MSI Katana GF66 12UGS | |
| MSI Katana 15 B12VEK | |
| Average Intel Core i7-12650H, NVIDIA GeForce RTX 4050 Laptop GPU (n=1) | |
| Schenker XMG Core 15 (M22) | |
| CrossMark / Productivity | |
| MSI Pulse GL66 12UEK | |
| Lenovo Legion 5 15IAH7H 82RB | |
| MSI Katana GF66 12UGS | |
| Average of class Gaming (1299 - 2211, n=118, last 2 years) | |
| MSI Katana 15 B12VEK | |
| Average Intel Core i7-12650H, NVIDIA GeForce RTX 4050 Laptop GPU (n=1) | |
| Schenker XMG Core 15 (M22) | |
| CrossMark / Creativity | |
| Average of class Gaming (1275 - 2729, n=118, last 2 years) | |
| MSI Pulse GL66 12UEK | |
| Lenovo Legion 5 15IAH7H 82RB | |
| MSI Katana GF66 12UGS | |
| MSI Katana 15 B12VEK | |
| Average Intel Core i7-12650H, NVIDIA GeForce RTX 4050 Laptop GPU (n=1) | |
| Schenker XMG Core 15 (M22) | |
| CrossMark / Responsiveness | |
| MSI Pulse GL66 12UEK | |
| Lenovo Legion 5 15IAH7H 82RB | |
| MSI Katana GF66 12UGS | |
| Average of class Gaming (1030 - 2330, n=118, last 2 years) | |
| MSI Katana 15 B12VEK | |
| Average Intel Core i7-12650H, NVIDIA GeForce RTX 4050 Laptop GPU (n=1) | |
| Schenker XMG Core 15 (M22) | |
| PCMark 10 Score | 6892 points | |
Help | ||
| AIDA64 / Memory Copy | |
| Average of class Gaming (21750 - 108104, n=144, last 2 years) | |
| MSI Katana 15 B12VEK | |
| Asus TUF Gaming F15 FX507ZM | |
| Lenovo Legion 5 15IAH7H 82RB | |
| Average Intel Core i7-12650H (43261 - 69735, n=14) | |
| Schenker XMG Core 15 (M22) | |
| MSI Katana GF66 12UGS | |
| MSI Pulse GL66 12UEK | |
| AIDA64 / Memory Read | |
| Average of class Gaming (22956 - 104349, n=144, last 2 years) | |
| MSI Katana 15 B12VEK | |
| Lenovo Legion 5 15IAH7H 82RB | |
| Asus TUF Gaming F15 FX507ZM | |
| Average Intel Core i7-12650H (47313 - 67412, n=14) | |
| Schenker XMG Core 15 (M22) | |
| MSI Pulse GL66 12UEK | |
| MSI Katana GF66 12UGS | |
| AIDA64 / Memory Write | |
| Average of class Gaming (22297 - 133486, n=144, last 2 years) | |
| Lenovo Legion 5 15IAH7H 82RB | |
| Asus TUF Gaming F15 FX507ZM | |
| MSI Katana 15 B12VEK | |
| Schenker XMG Core 15 (M22) | |
| Average Intel Core i7-12650H (45617 - 59361, n=14) | |
| MSI Katana GF66 12UGS | |
| MSI Pulse GL66 12UEK | |
| AIDA64 / Memory Latency | |
| Average of class Gaming (59.5 - 259, n=144, last 2 years) | |
| Lenovo Legion 5 15IAH7H 82RB | |
| MSI Katana GF66 12UGS | |
| MSI Katana 15 B12VEK | |
| MSI Pulse GL66 12UEK | |
| Schenker XMG Core 15 (M22) | |
| Average Intel Core i7-12650H (71.6 - 103.9, n=14) | |
| Asus TUF Gaming F15 FX507ZM | |
* ... smaller is better
DPC Latency
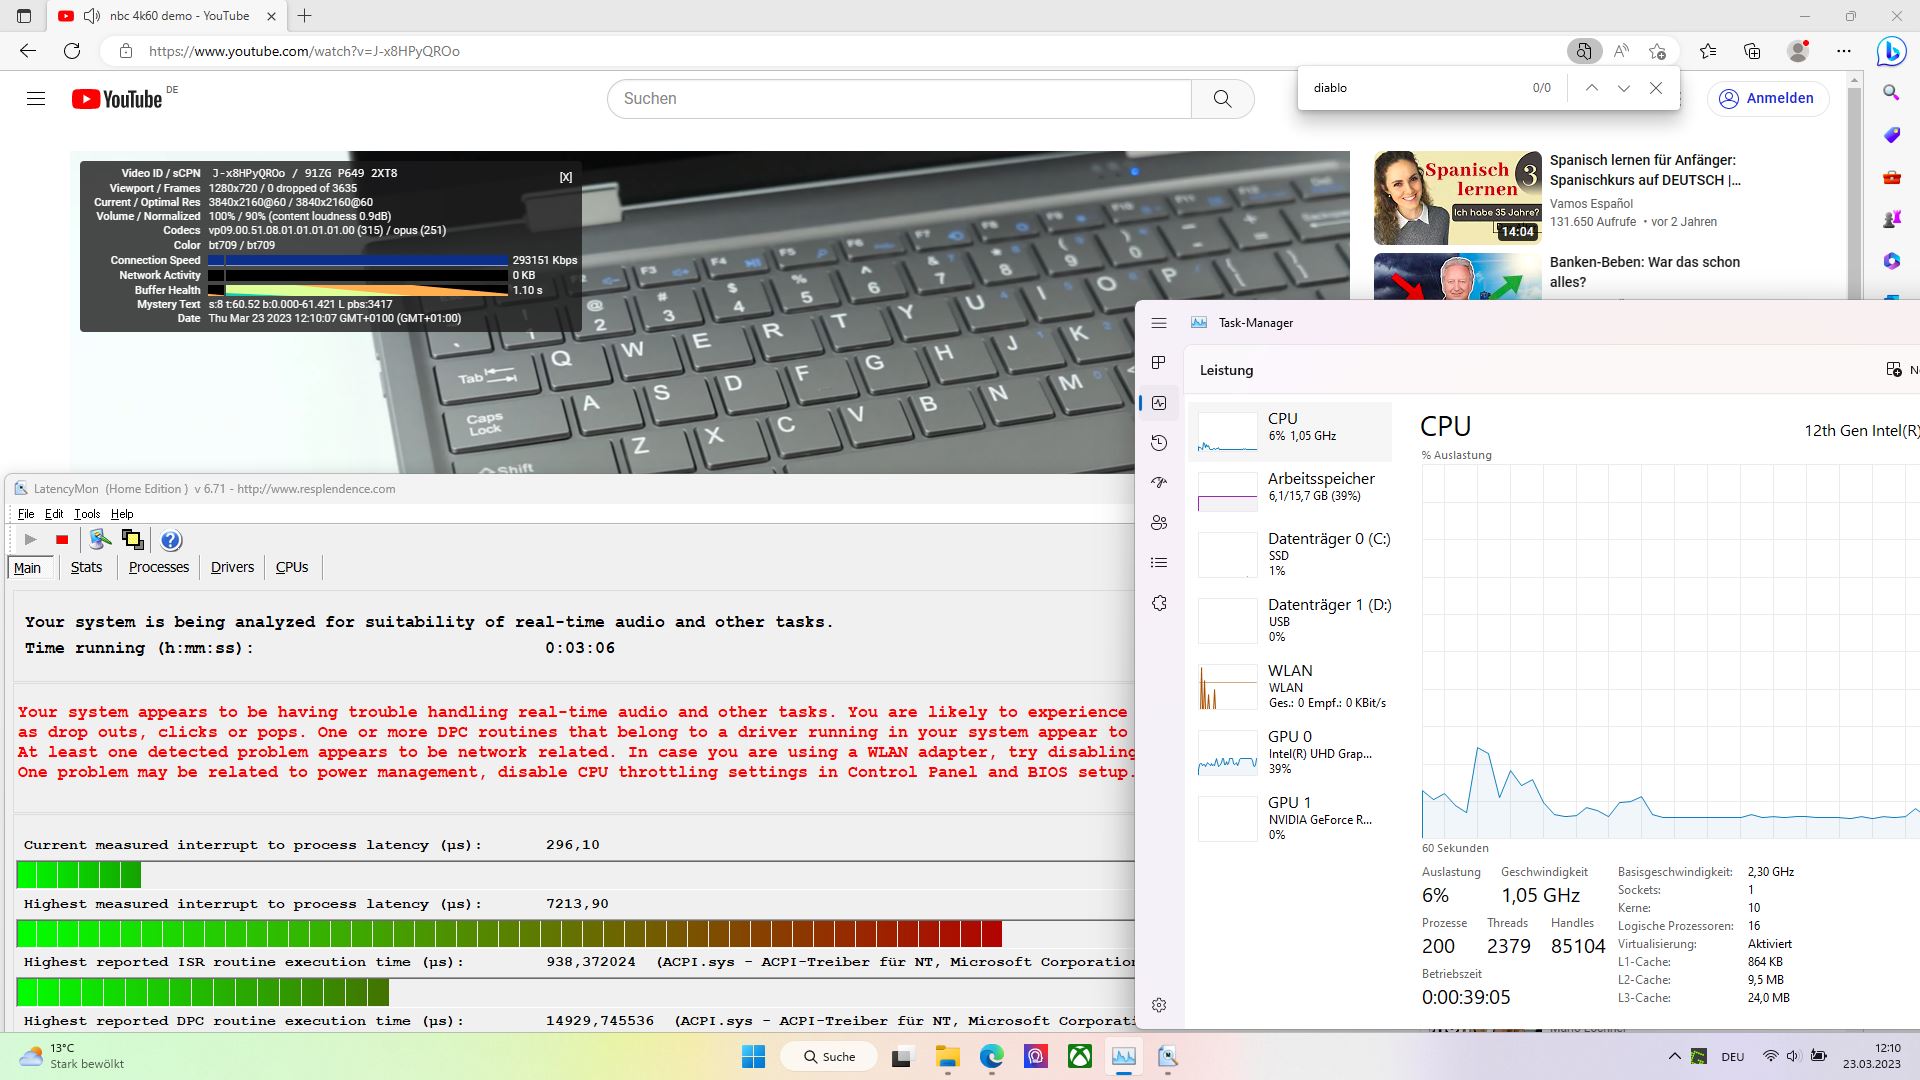
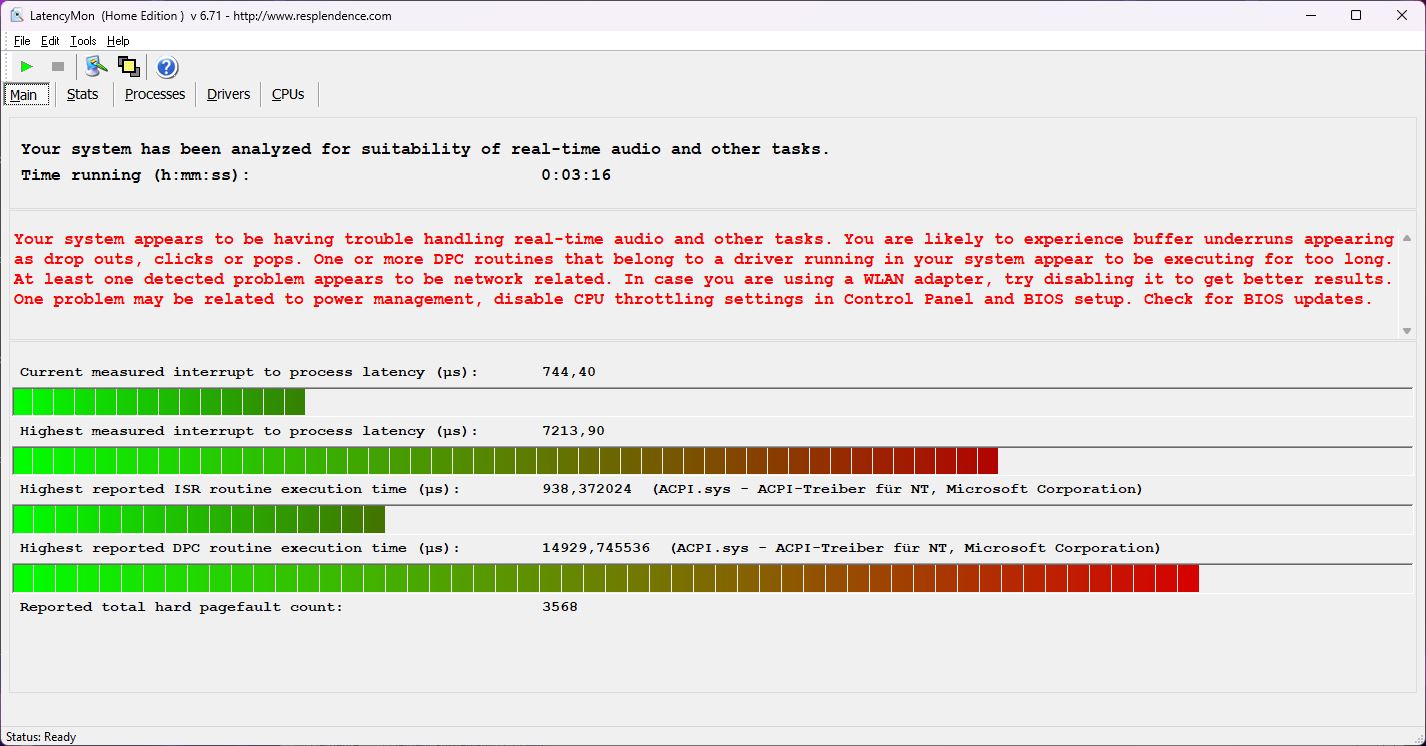
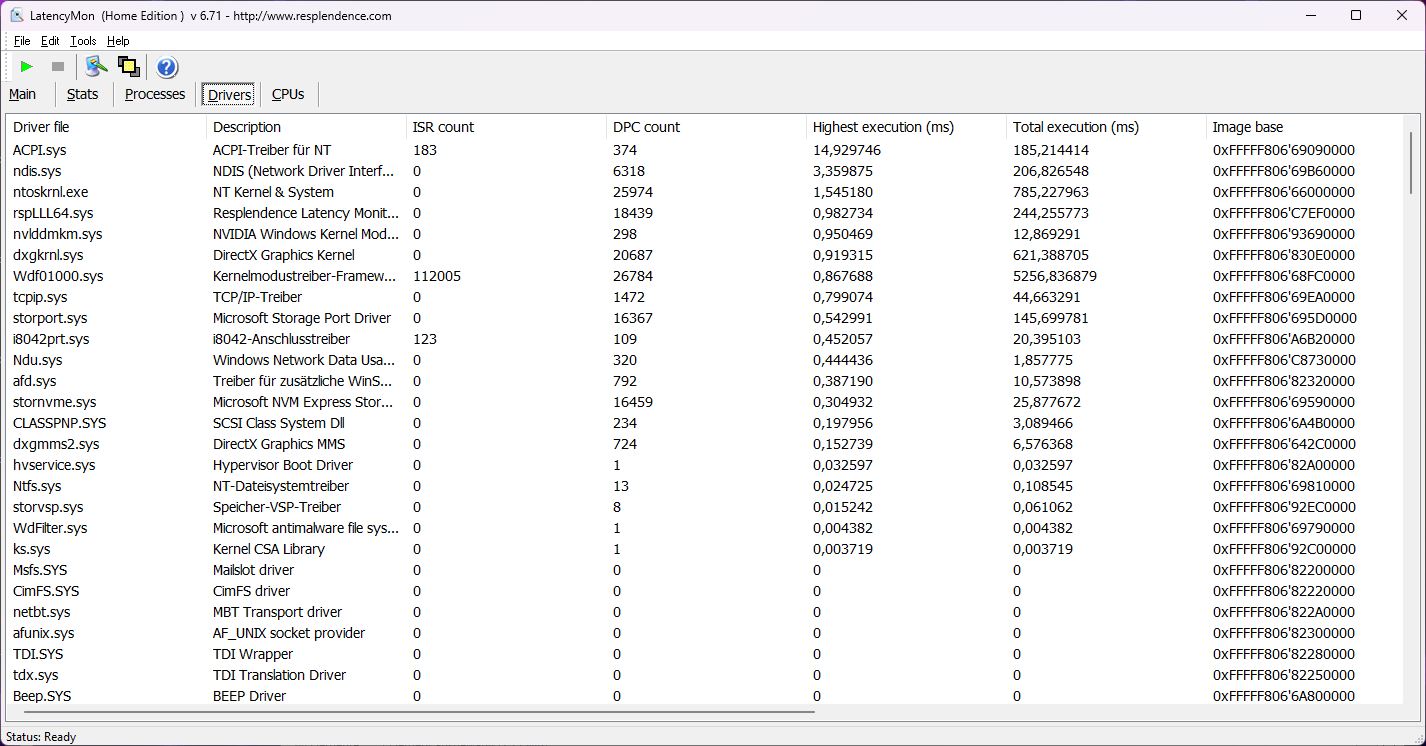
Currently, the Nvidia drivers for laptops with an RTX 40xx card still have very high latencies under LatencyMon and our Katana is no exception. The first latencies occur immediately after starting the tool. Opening several browser tabs and playing our 4K/60 fps YouTube video pushes the value sharply upwards. But there were no skipped frames.
| DPC Latencies / LatencyMon - interrupt to process latency (max), Web, Youtube, Prime95 | |
| MSI Katana 15 B12VEK | |
| Schenker XMG Core 15 (M22) | |
| MSI Pulse GL66 12UEK | |
| Lenovo Legion 5 15IAH7H 82RB | |
| Asus TUF Gaming F15 FX507ZM | |
| MSI Katana GF66 12UGS | |
* ... smaller is better
Storage Devices
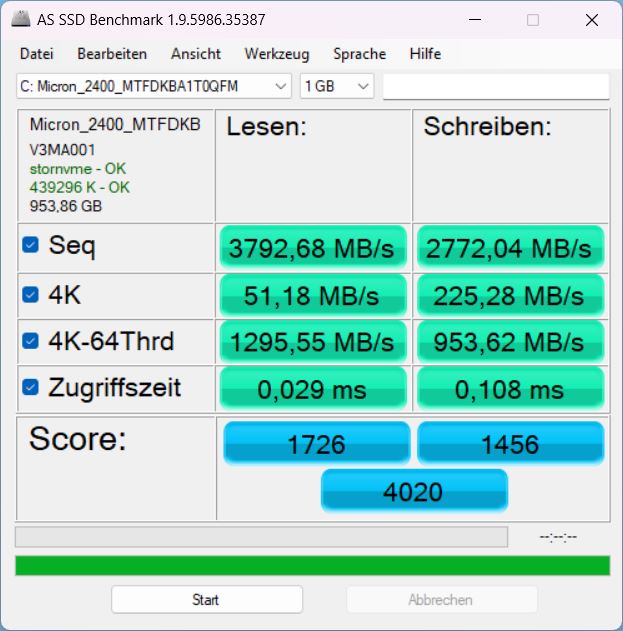
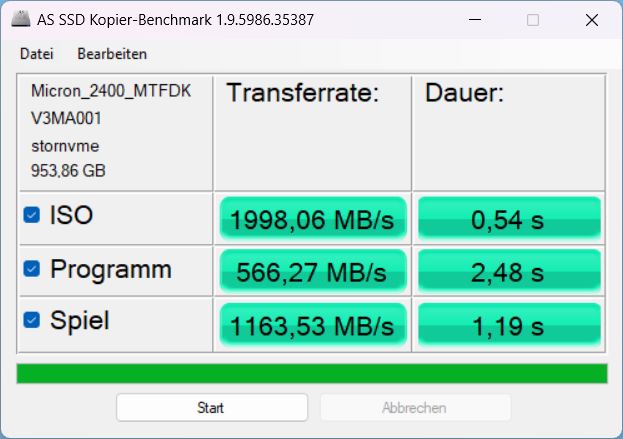
A 1 TB PCIe 4.0 x4 NVMe SSD from Micron serves as the main storage device. In the Katana, it does not fully exploit its performance potential and falls well behind the Micron 2450 models in the Katana GF66 or the Pulse GL66.
At least its performance is relatively constant, only decreasing minimally after longer periods of time. You can find more information about the model in our SSD bestseller list.

* ... smaller is better
Sustained Read Performance: DiskSpd Read Loop, Queue Depth 8
Graphics Card
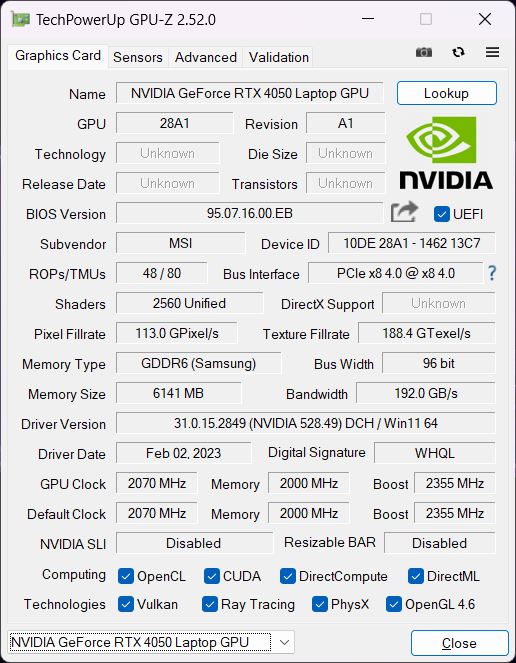
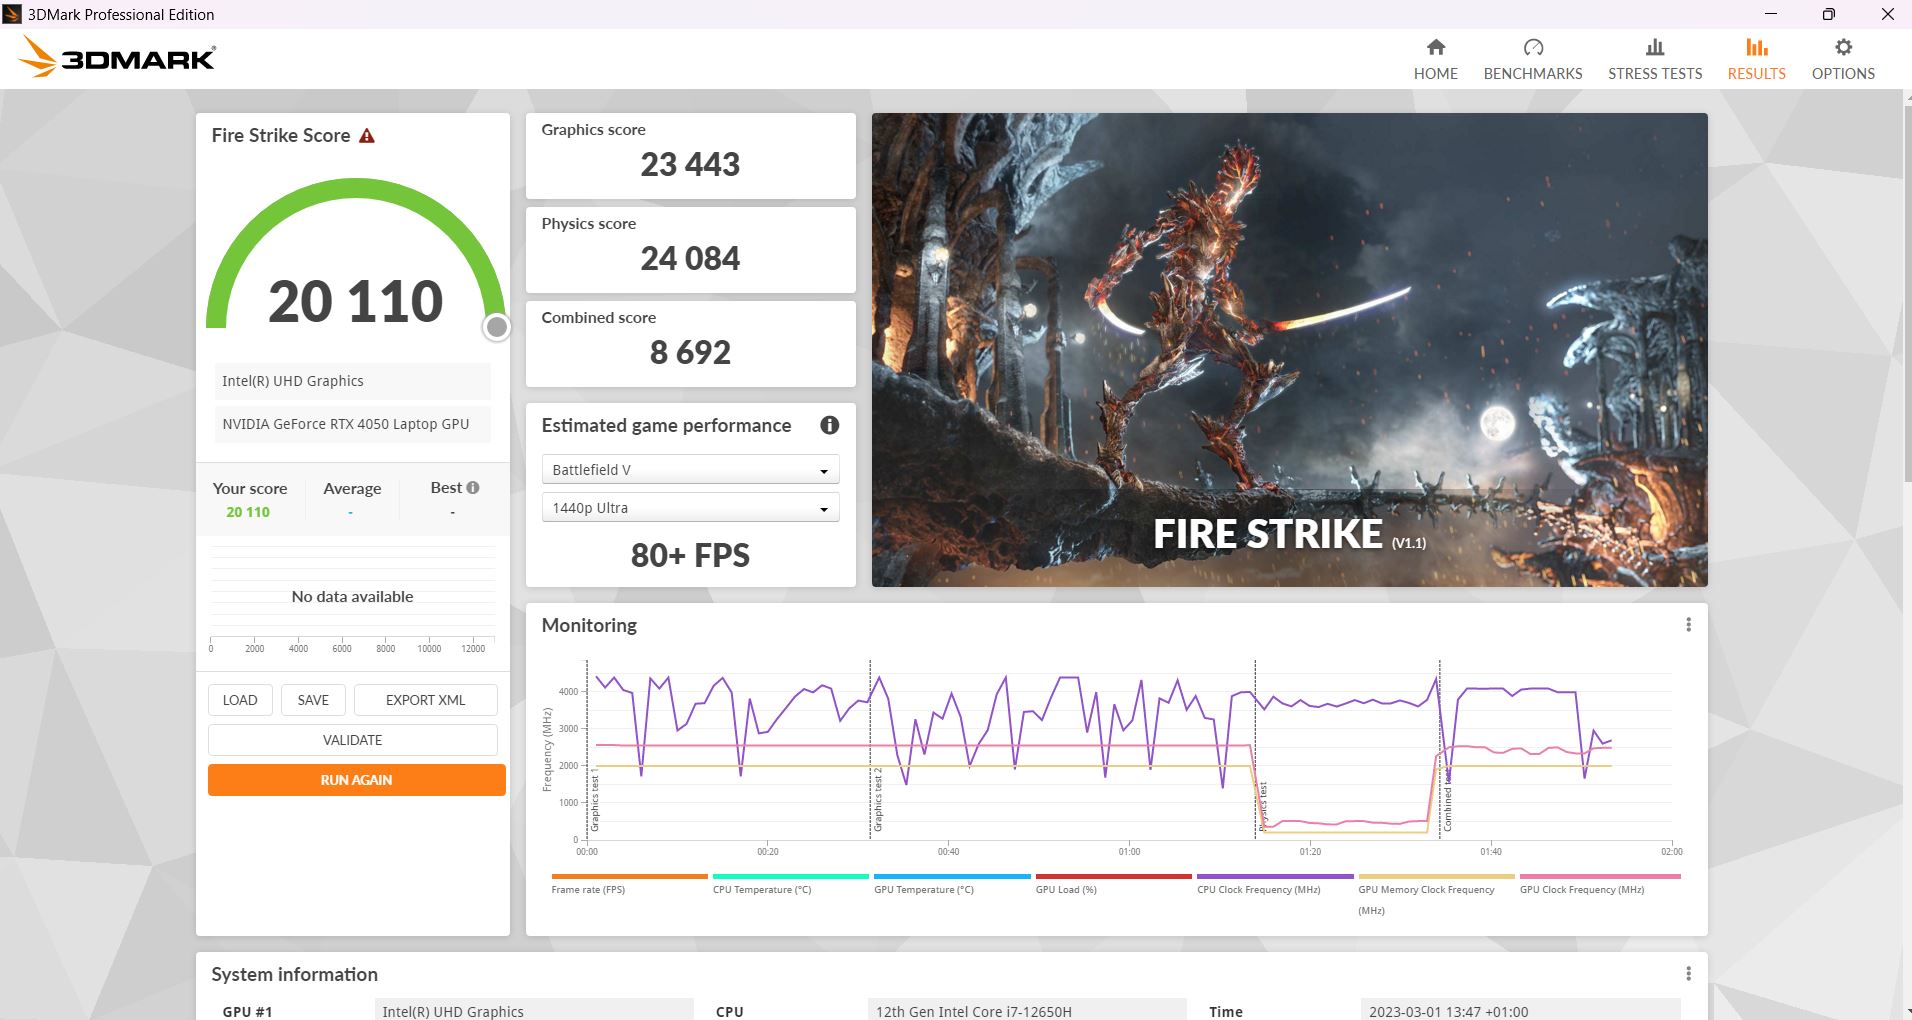
The Nvidia Geforce RTX 4050 is the entry card of the new RTX 40xx generation. Its performance should be roughly on par with an older RTX 3060, depending on the TGP selected (here 105 W), although current benchmarks suggest that the card hardly benefits from more than 100 W.
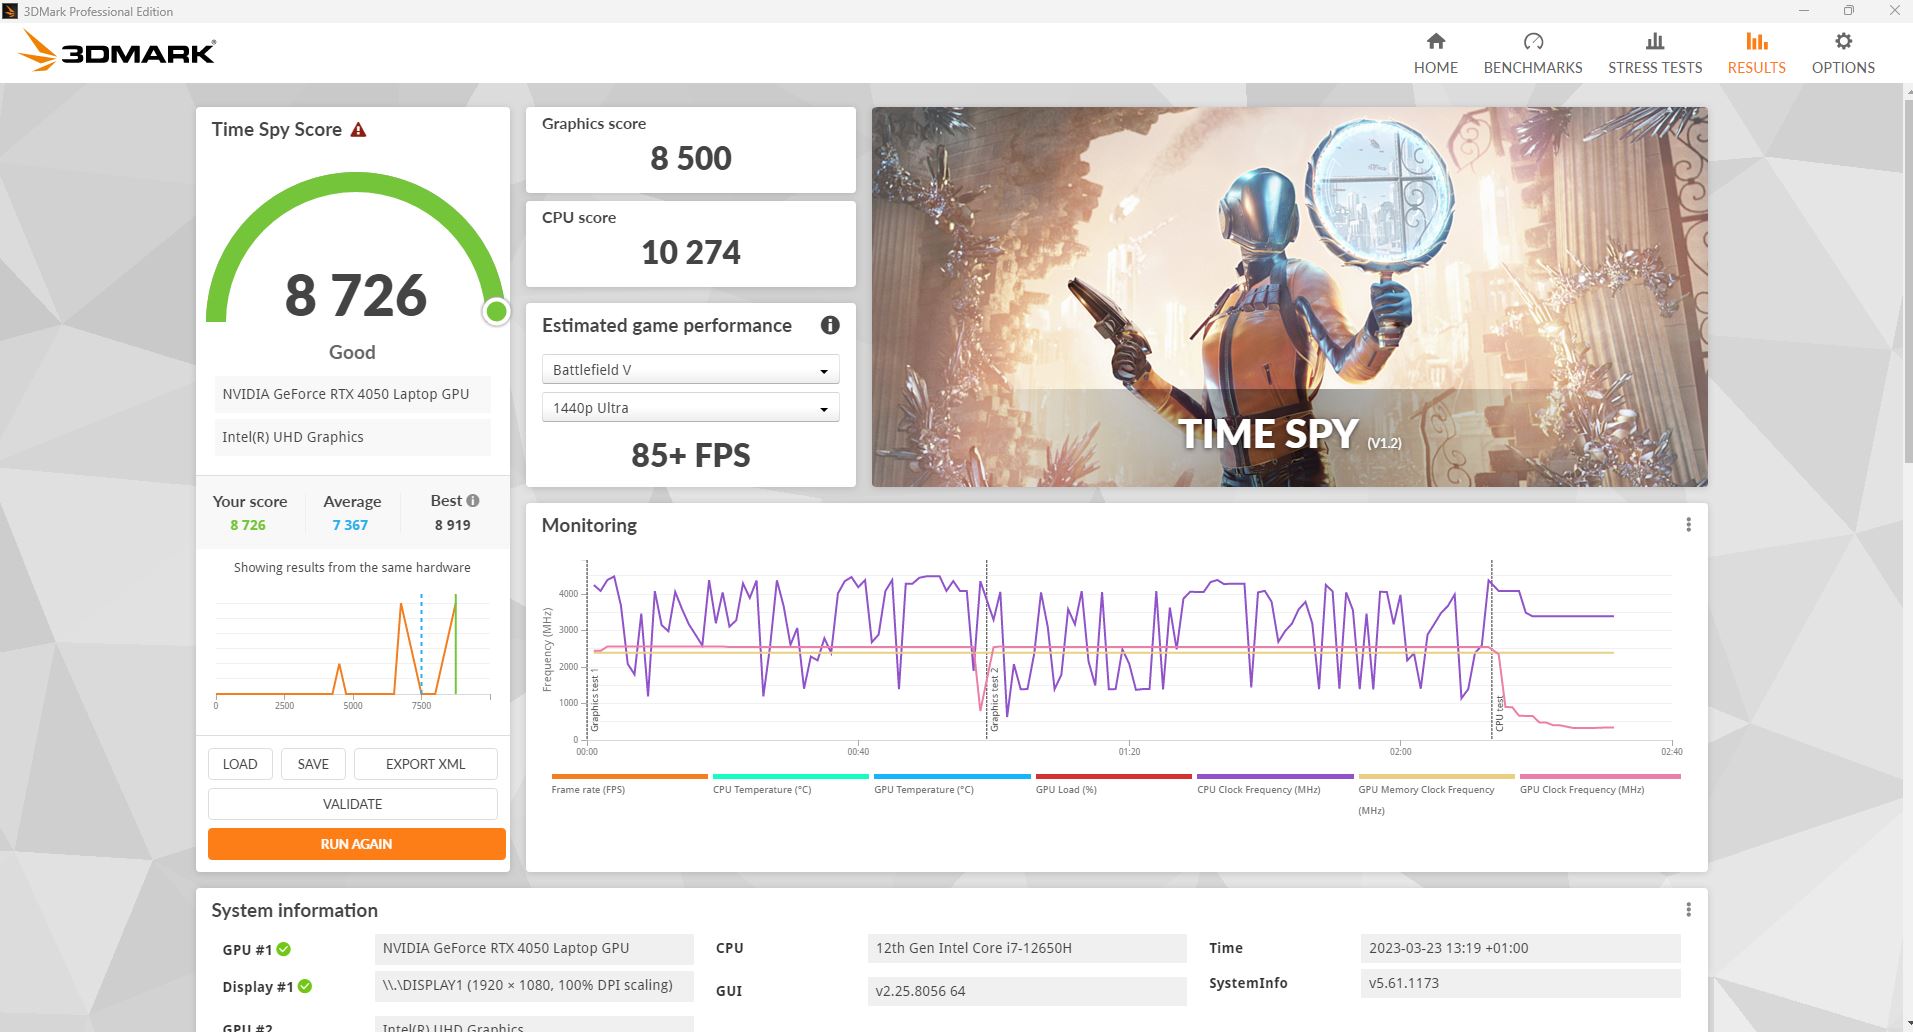
In the synthetic 3DMarks, the GPU performs pretty much at the expected level and is just ahead of last year's competition with the RTX 3060. The Katana GF66 with the RTX 3070 Ti is only around 10 percent ahead.
Away from the socket, of course, performance suffers. In another Fire Strike run in battery mode, the Katana only achieved 14,446 graphics points instead of the 23,443 points when plugged in.
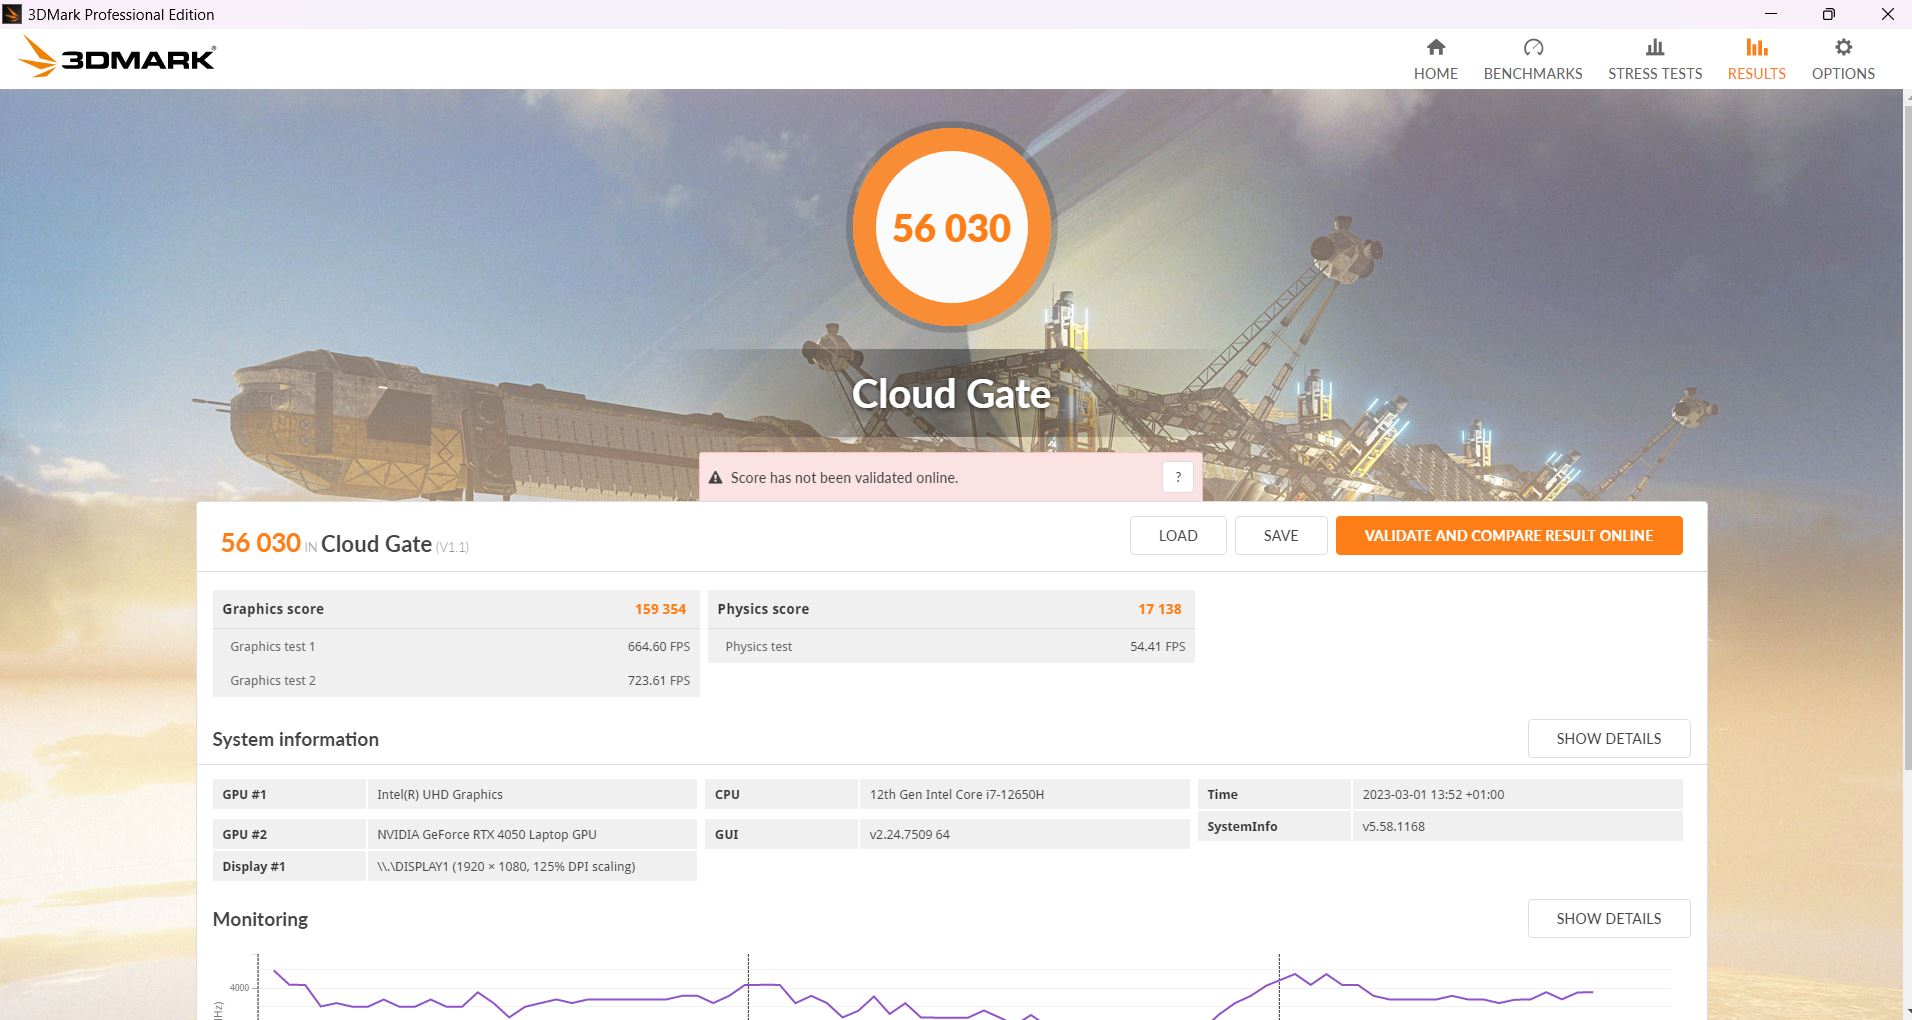
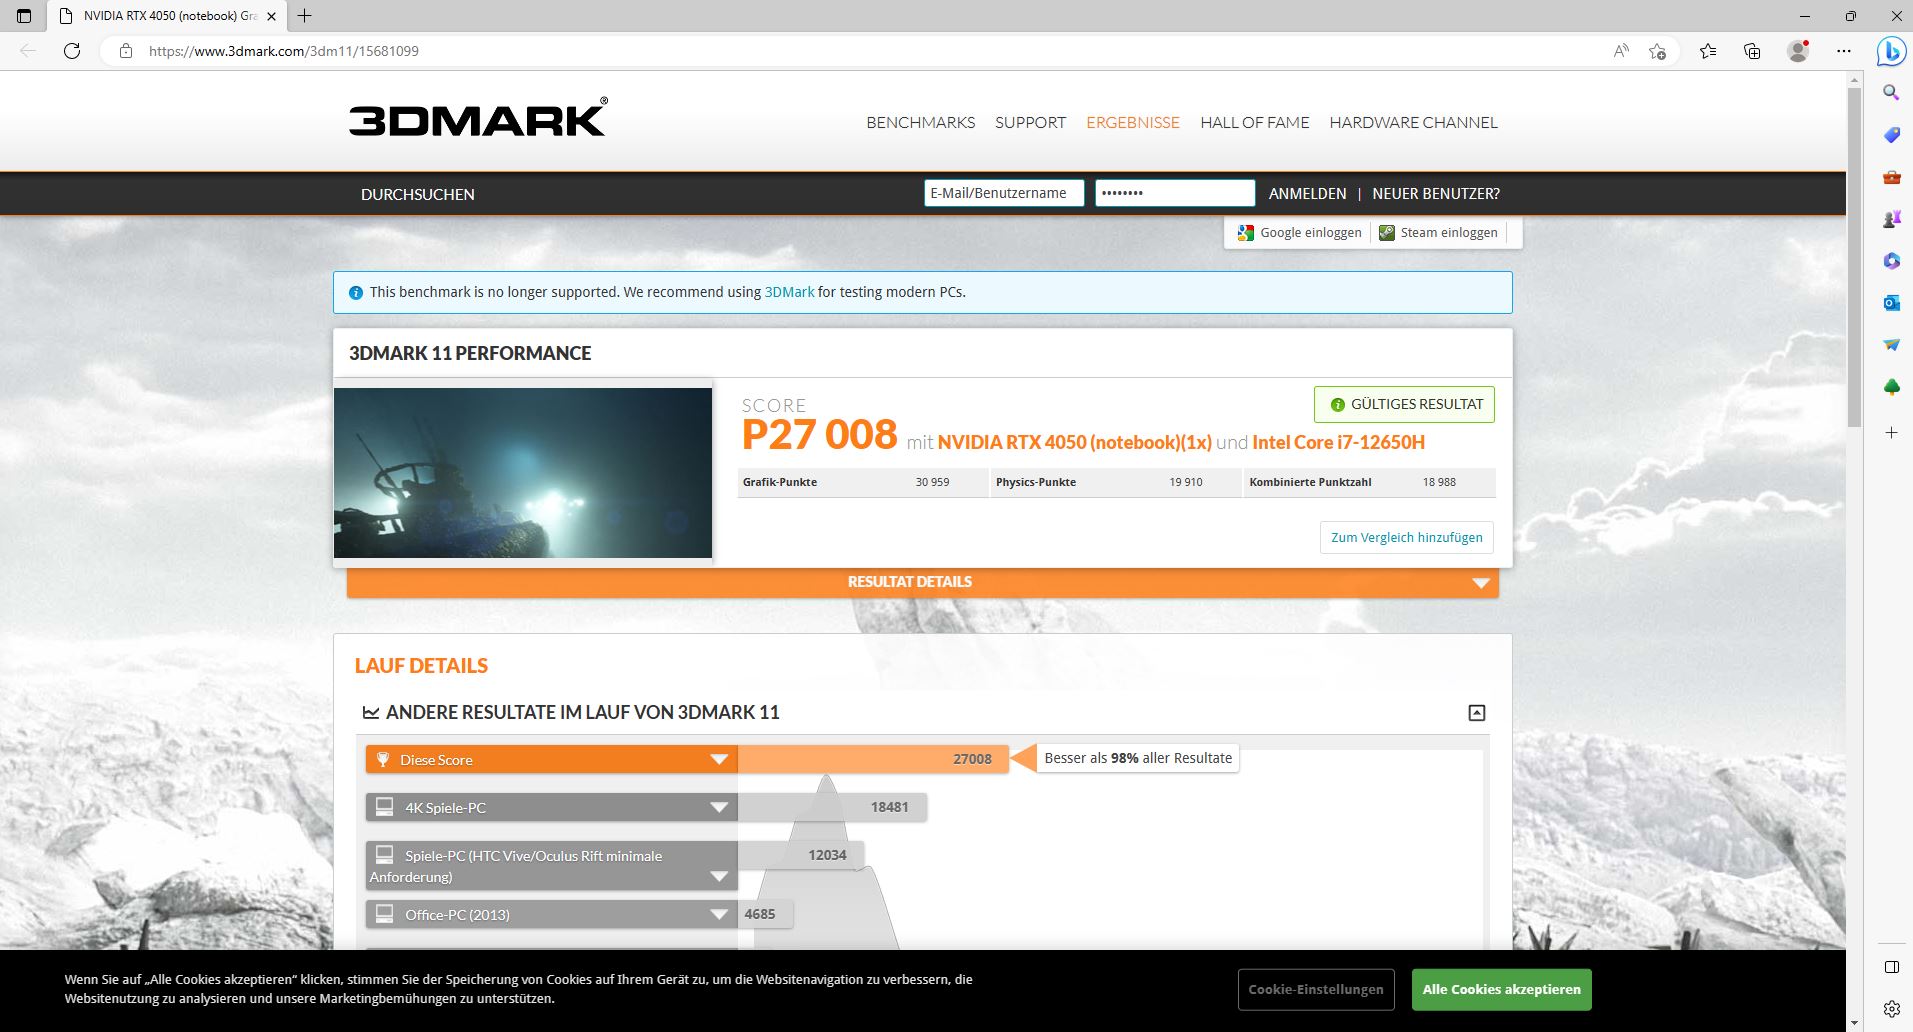
| 3DMark 11 Performance | 27008 points | |
| 3DMark Cloud Gate Standard Score | 56030 points | |
| 3DMark Fire Strike Score | 20110 points | |
| 3DMark Time Spy Score | 8726 points | |
Help | ||
* ... smaller is better
Gaming Performance
In the gaming benchmarks, the Katana 15 tends to assume a lower rank in comparison with the direct competition. Only the XMG Core 15 with its RTX 3060 is slightly slower, while the Pulse GL66 with an RTX 3060 is about as fast. The Legion 5 in particular, also with an RTX 3060, is noticeably faster.
In Far Cry 5, on the other hand, the Katana is even slightly ahead of the competition. So it also depends a lot on the game you play.
| The Witcher 3 - 1920x1080 Ultra Graphics & Postprocessing (HBAO+) | |
| Average of class Gaming (18.4 - 240, n=54, last 2 years) | |
| MSI Katana GF66 12UGS | |
| Asus TUF Gaming F15 FX507ZM | |
| Lenovo Legion 5 15IAH7H 82RB | |
| MSI Katana 15 B12VEK | |
| Schenker XMG Core 15 (M22) | |
| MSI Pulse GL66 12UEK | |
| GTA V - 1920x1080 Highest AA:4xMSAA + FX AF:16x | |
| Average of class Gaming (12.1 - 186.9, n=131, last 2 years) | |
| Lenovo Legion 5 15IAH7H 82RB | |
| MSI Katana GF66 12UGS | |
| Asus TUF Gaming F15 FX507ZM | |
| Schenker XMG Core 15 (M22) | |
| MSI Katana 15 B12VEK | |
| Final Fantasy XV Benchmark - 1920x1080 High Quality | |
| Average of class Gaming (19.2 - 215, n=142, last 2 years) | |
| Lenovo Legion 5 15IAH7H 82RB | |
| Asus TUF Gaming F15 FX507ZM | |
| Schenker XMG Core 15 (M22) | |
| MSI Katana GF66 12UGS | |
| MSI Katana 15 B12VEK | |
| Strange Brigade - 1920x1080 ultra AA:ultra AF:16 | |
| Average of class Gaming (38.9 - 456, n=129, last 2 years) | |
| MSI Katana GF66 12UGS | |
| Lenovo Legion 5 15IAH7H 82RB | |
| Asus TUF Gaming F15 FX507ZM | |
| Schenker XMG Core 15 (M22) | |
| MSI Katana 15 B12VEK | |
| Dota 2 Reborn - 1920x1080 ultra (3/3) best looking | |
| Lenovo Legion 5 15IAH7H 82RB | |
| Average of class Gaming (65.1 - 248, n=146, last 2 years) | |
| Asus TUF Gaming F15 FX507ZM | |
| MSI Pulse GL66 12UEK | |
| MSI Katana 15 B12VEK | |
| MSI Katana GF66 12UGS | |
| Schenker XMG Core 15 (M22) | |
A MUX switch is available, which allows you to choose either the iGPU or the dGPU in the MSI Center, which always involves a restart.
The Witcher 3 frame rate remains stable within the usual fluctuations (day/night cycle in the game). But competing laptops are often slightly faster, even those with the RTX 3060.
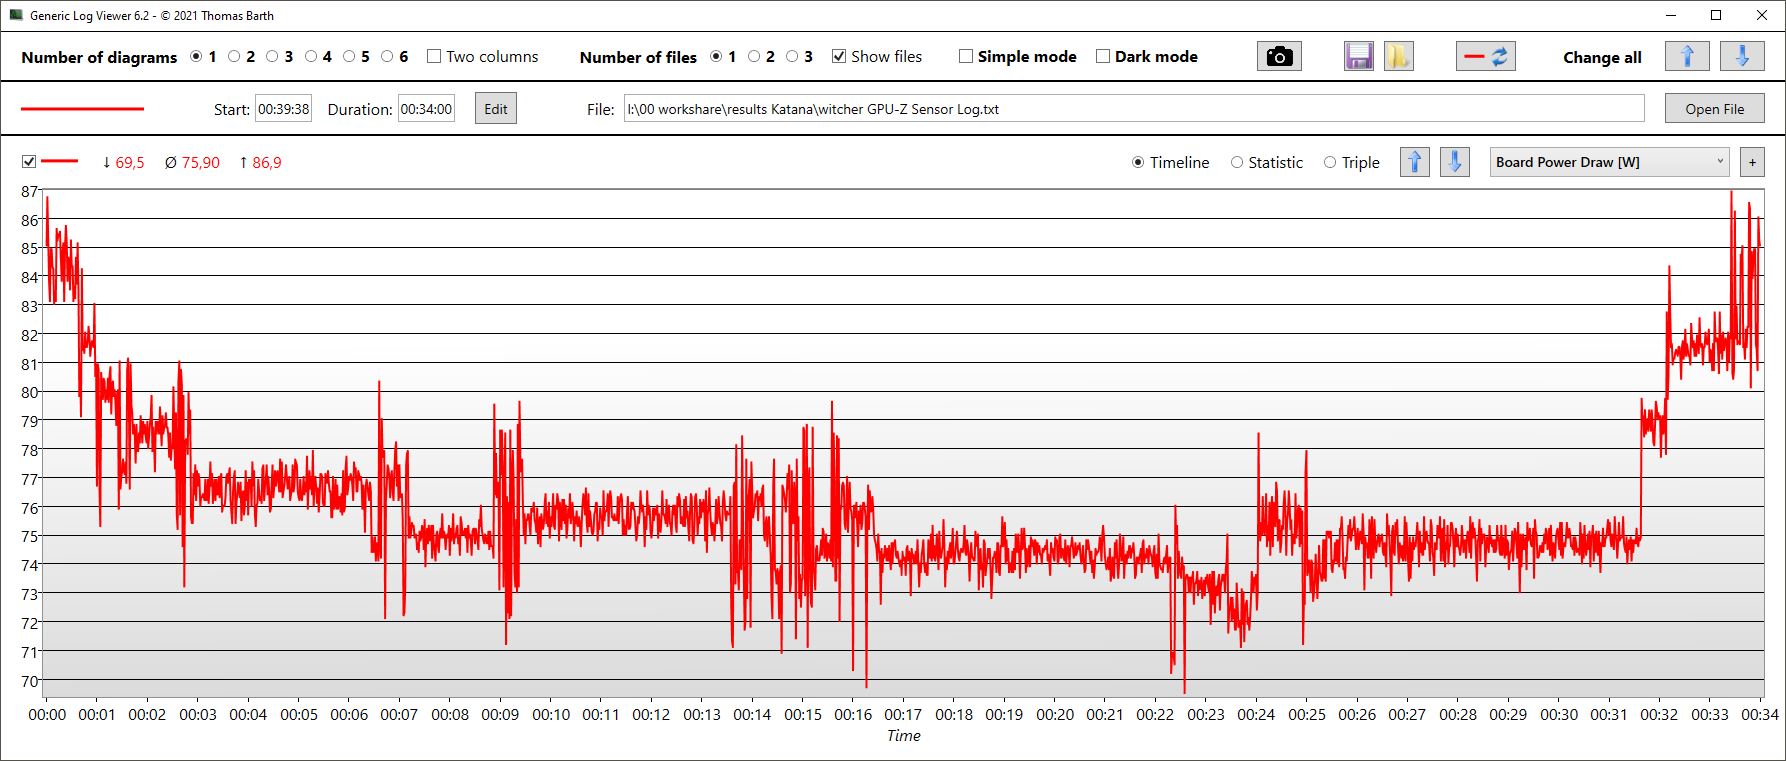
The GPU clock rate is quite stable at 2.4 GHz, and the memory clock is also constant at 2 GHz. GPU temperatures do not exceed 76 °C and average around 75 °C. The power consumption of 76 W on average is far from the specified 105 W.
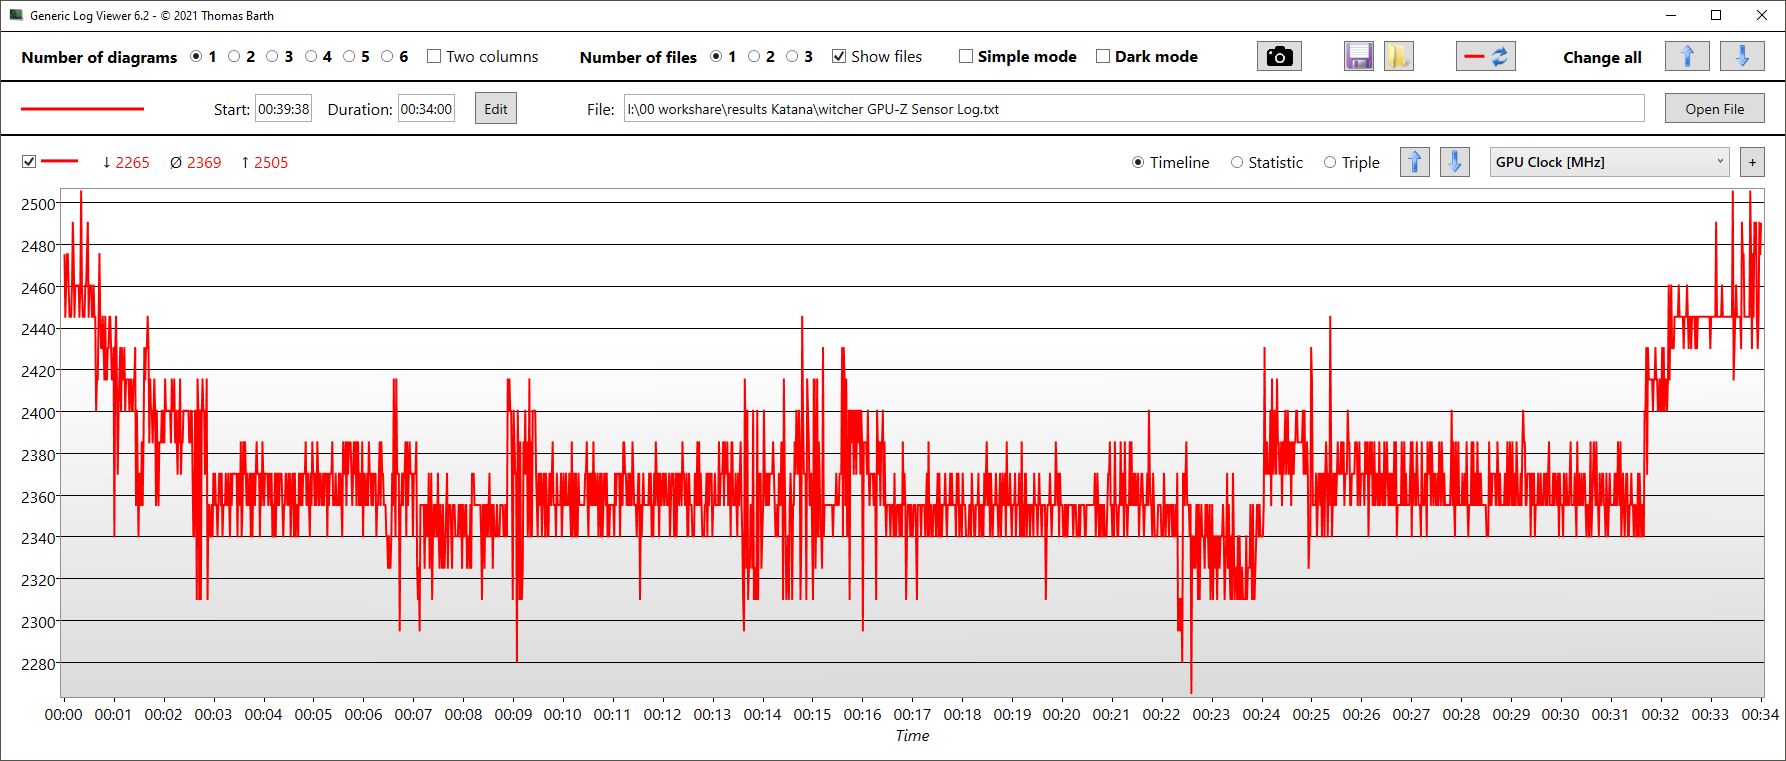
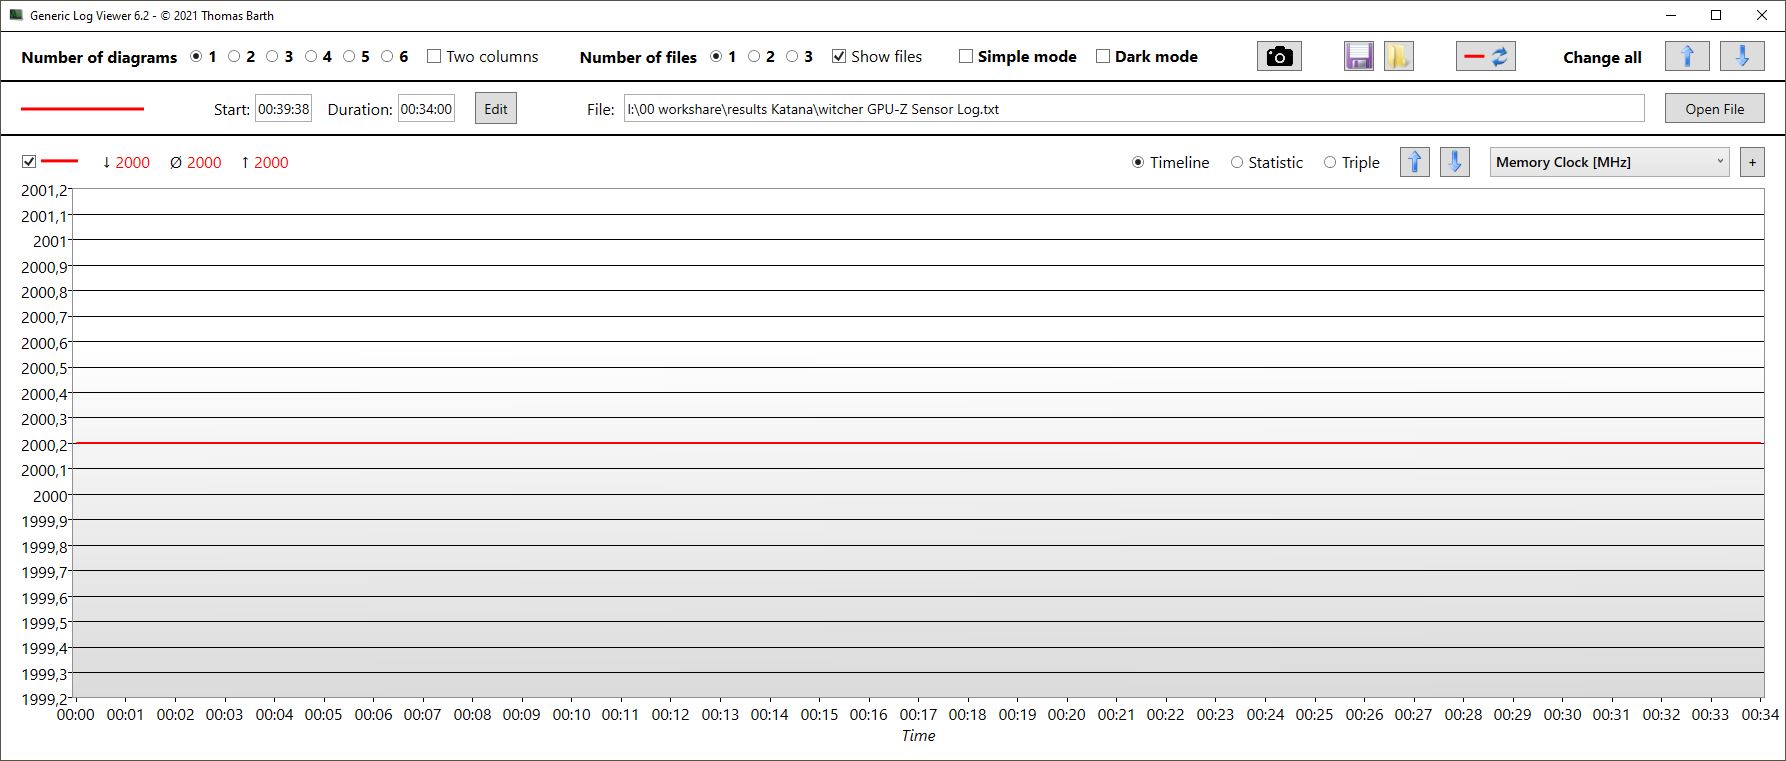
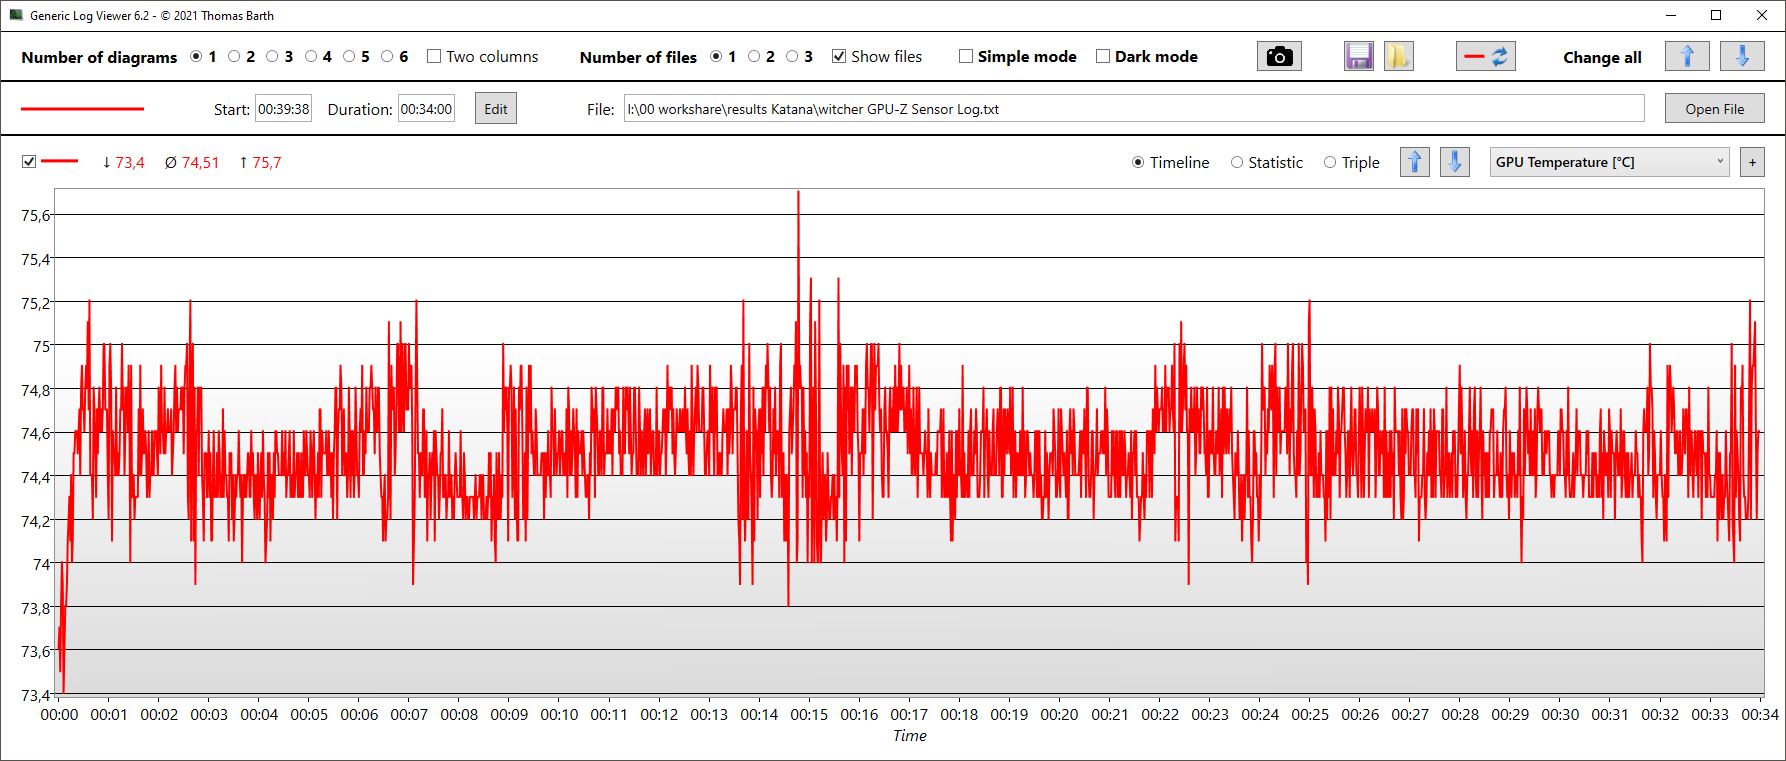
Witcher 3 FPS Chart
| low | med. | high | ultra | |
|---|---|---|---|---|
| GTA V (2015) | 183.5 | 176.6 | 172.7 | 92.2 |
| The Witcher 3 (2015) | 395 | 293 | 161 | 83 |
| Dota 2 Reborn (2015) | 175.1 | 158.1 | 150.5 | 142.5 |
| Final Fantasy XV Benchmark (2018) | 188 | 120.7 | 82.8 | |
| X-Plane 11.11 (2018) | 139.9 | 122.4 | 97 | |
| Far Cry 5 (2018) | 170 | 135 | 126 | 119 |
| Strange Brigade (2018) | 214 | 173 | 148.7 | |
| Dying Light 2 (2022) | 122.1 | 75.2 | 62.4 |
Emissions - In tranquillity lies the power of the sword
Noise
When idle on the desktop, the fans are mostly silent, even in Extreme Performance mode, which is unusual. And even in 3DMark06, the fans start up comparatively late and reach only 37.7 dB by the end of the first benchmark scenario. Only the Legion 5 is quieter, the Asus TUF Gaming is similarly quiet, while the sister models and the XMG Core are louder.
The moderate noise development is also evident in gaming (AI mode), and the Katana only becomes loud during combined CPU/GPU stress.
Noise level
| Idle |
| 24 / 24 / 24 dB(A) |
| Load |
| 37.71 / 54.55 dB(A) |
 | ||
30 dB silent 40 dB(A) audible 50 dB(A) loud |
||
min: | ||
| MSI Katana 15 B12VEK GeForce RTX 4050 Laptop GPU, i7-12650H, Micron 2400 MTFDKBA1T0QFM | MSI Katana GF66 12UGS GeForce RTX 3070 Ti Laptop GPU, i7-12700H, Micron 2450 1TB MTFDKBA1T0TFK | MSI Pulse GL66 12UEK GeForce RTX 3060 Laptop GPU, i9-12900H, Micron 2450 512GB MTFDKBA512TFK | Lenovo Legion 5 15IAH7H 82RB GeForce RTX 3060 Laptop GPU, i7-12700H | Asus TUF Gaming F15 FX507ZM GeForce RTX 3060 Laptop GPU, i7-12700H, SK Hynix HFM001TD3JX013N | Schenker XMG Core 15 (M22) GeForce RTX 3060 Laptop GPU, R7 6800H, Samsung SSD 980 Pro 1TB MZ-V8P1T0BW | |
|---|---|---|---|---|---|---|
| Noise | -9% | -11% | 1% | -3% | -2% | |
| off / environment * (dB) | 24 | 26 -8% | 23 4% | 23.3 3% | 23.2 3% | 23 4% |
| Idle Minimum * (dB) | 24 | 27 -13% | 23 4% | 23.5 2% | 23.6 2% | 23 4% |
| Idle Average * (dB) | 24 | 28 -17% | 27 -13% | 23.5 2% | 23.6 2% | 23 4% |
| Idle Maximum * (dB) | 24 | 31 -29% | 27 -13% | 26.8 -12% | 25.4 -6% | 23 4% |
| Load Average * (dB) | 37.71 | 44 -17% | 48.2 -28% | 29.3 22% | 38 -1% | 42.41 -12% |
| Witcher 3 ultra * (dB) | 45.75 | 44 4% | 56.9 -24% | 51.4 -12% | 54.1 -18% | 54.71 -20% |
| Load Maximum * (dB) | 54.55 | 45 18% | 56.94 -4% | 53 3% | 57.2 -5% | 55.05 -1% |
* ... smaller is better
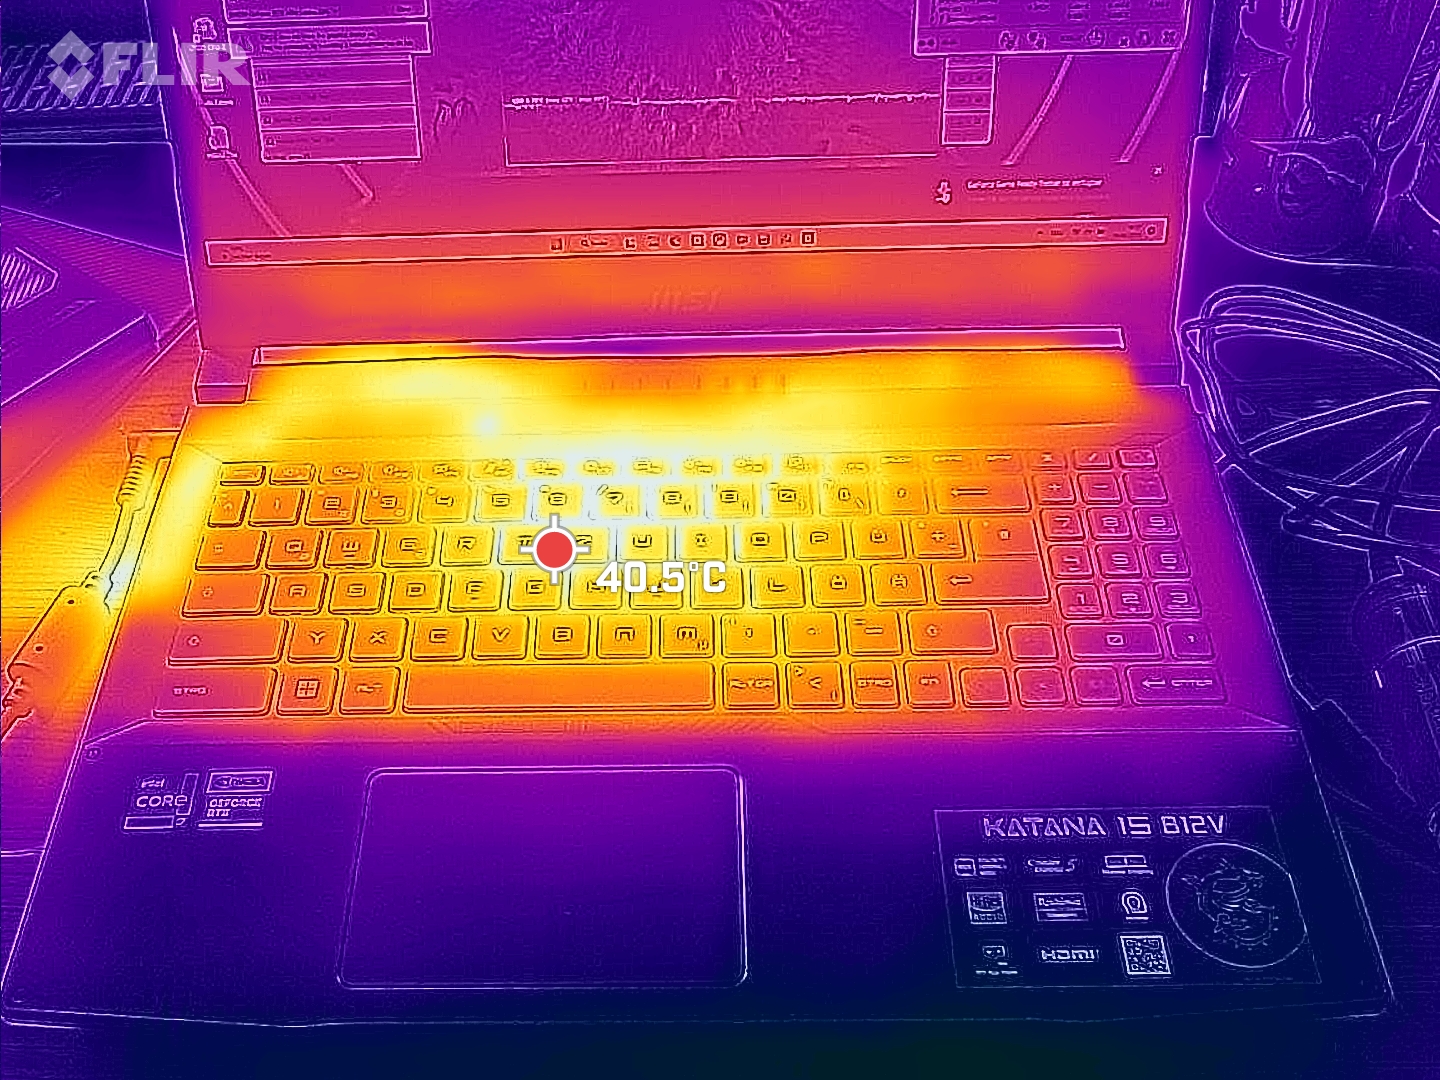
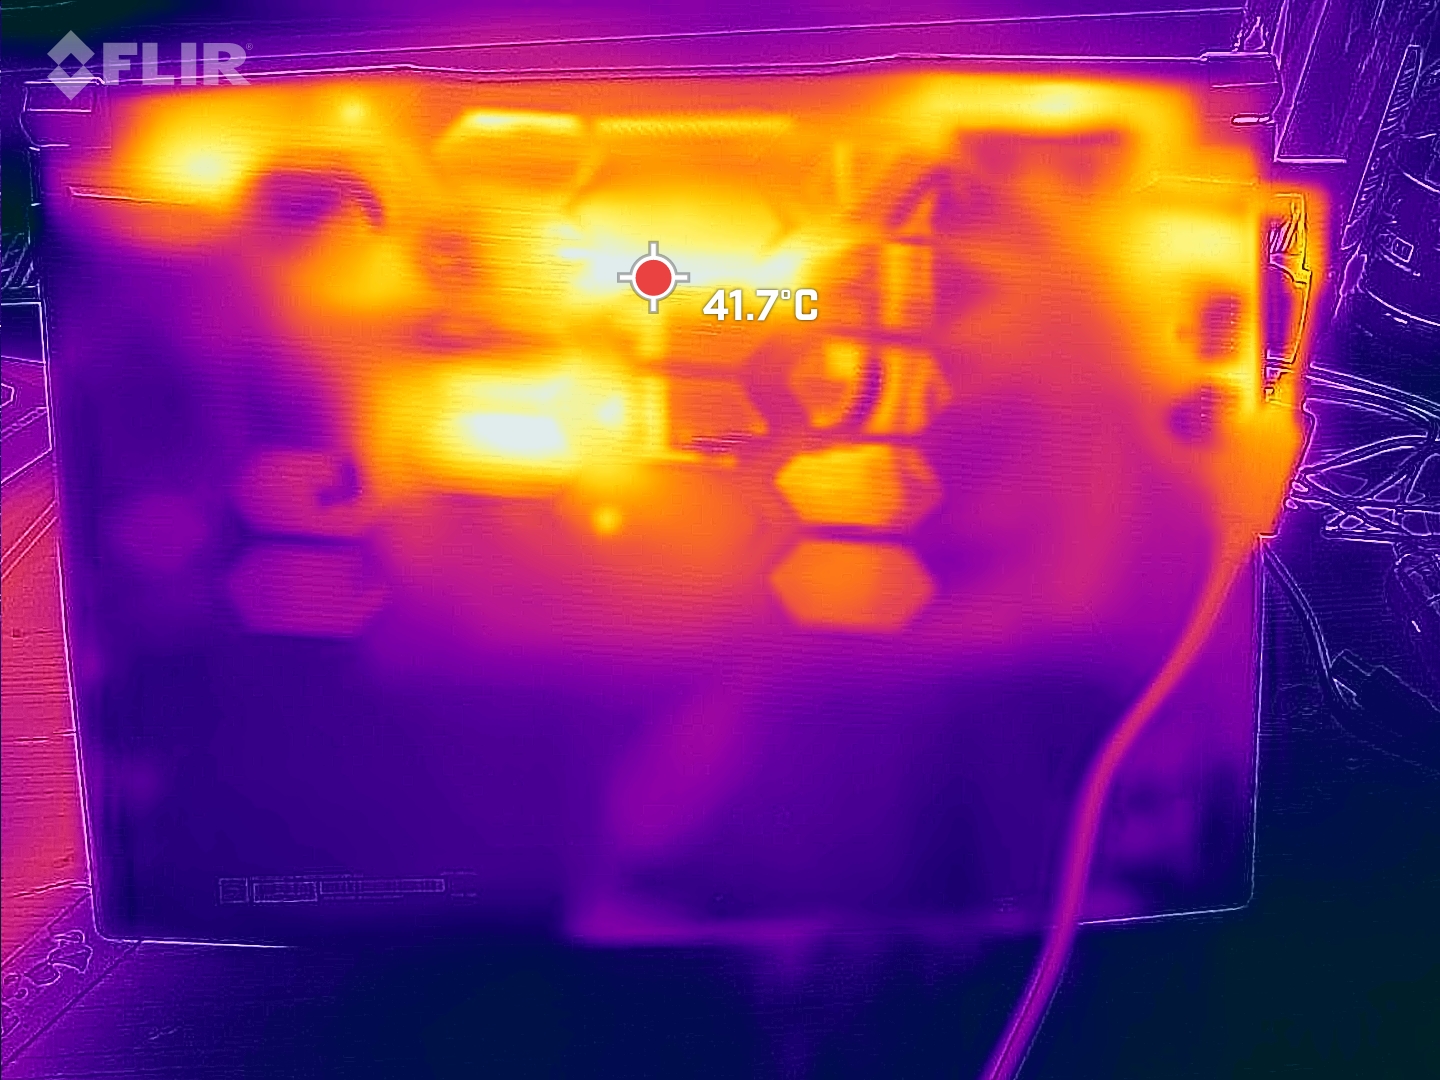
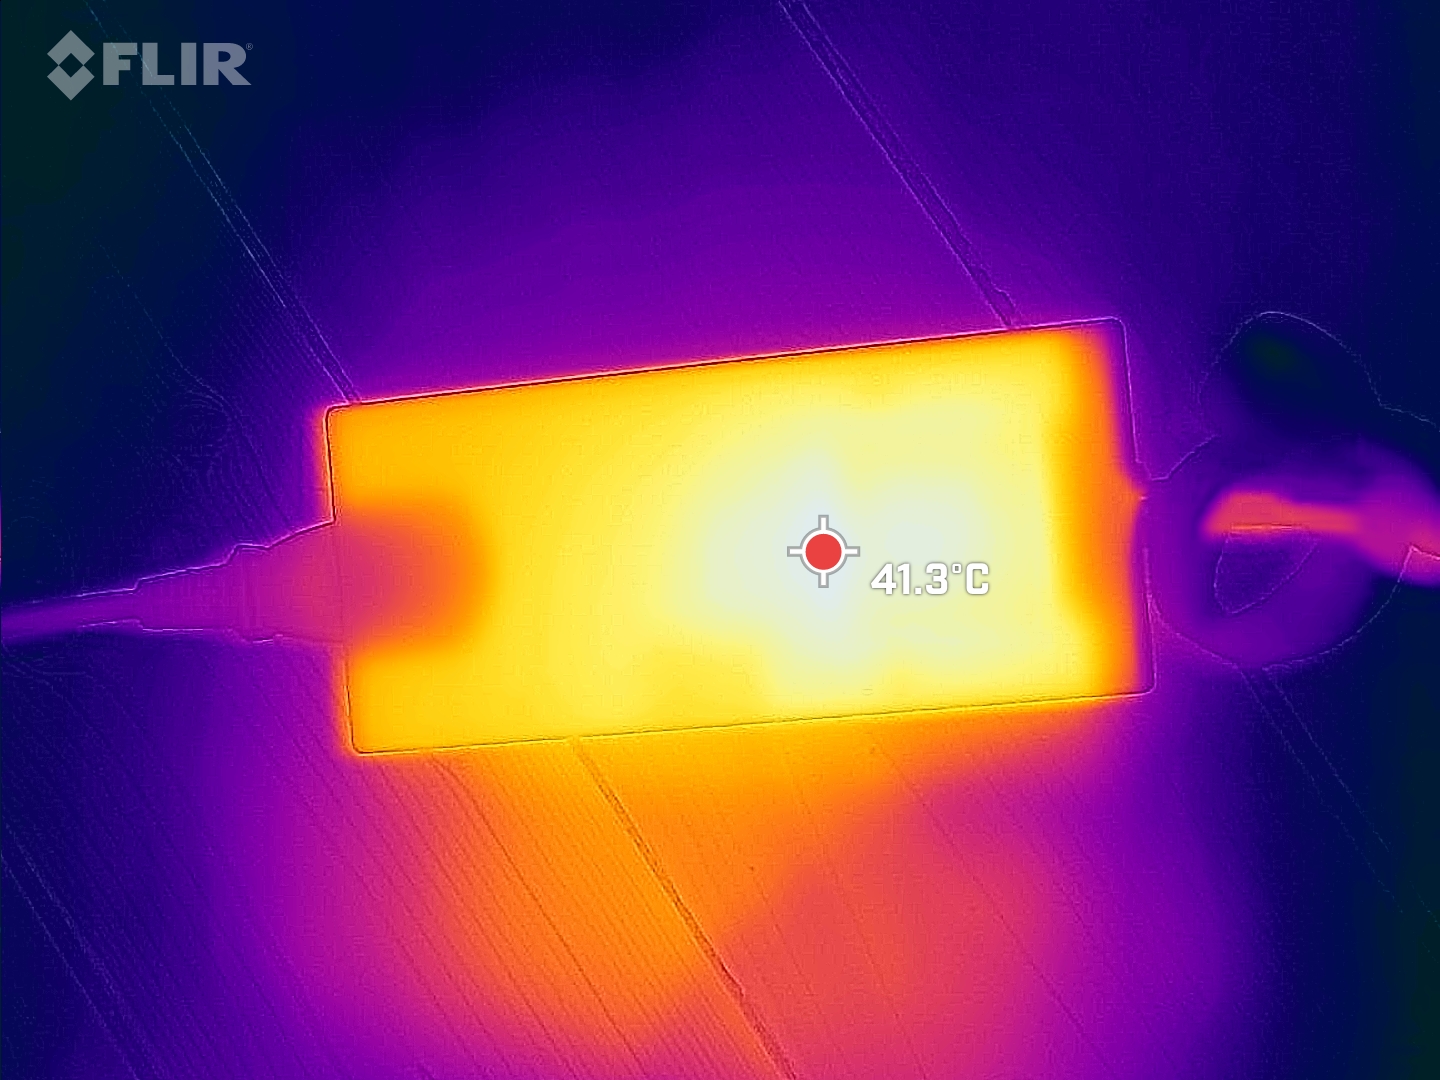
Temperature
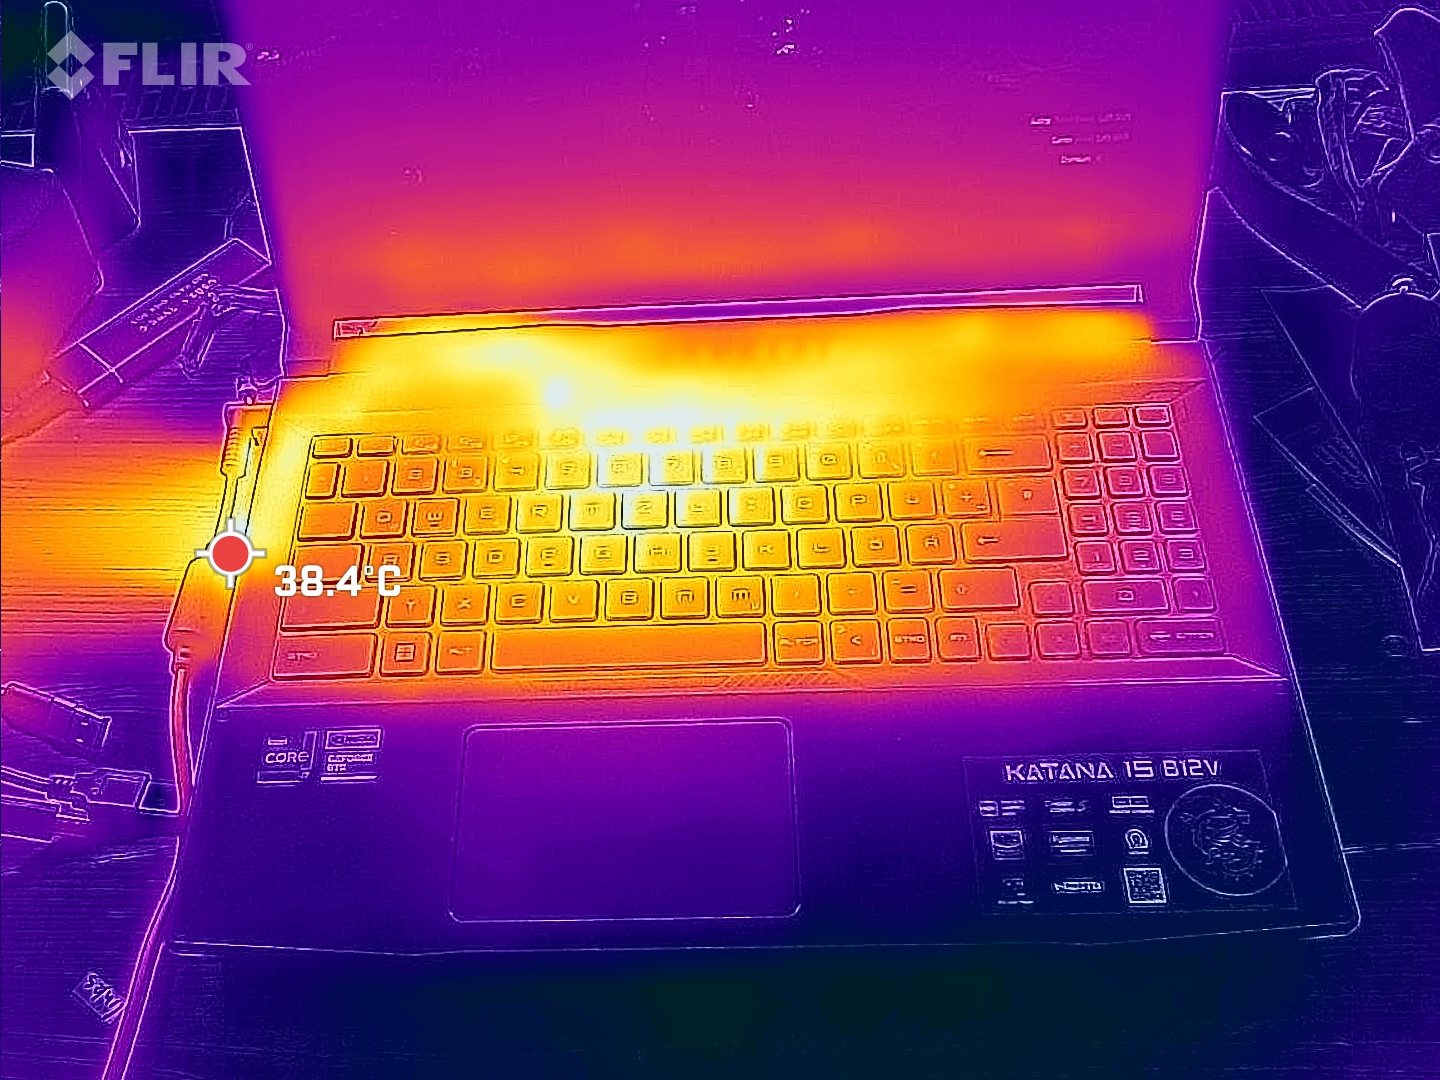
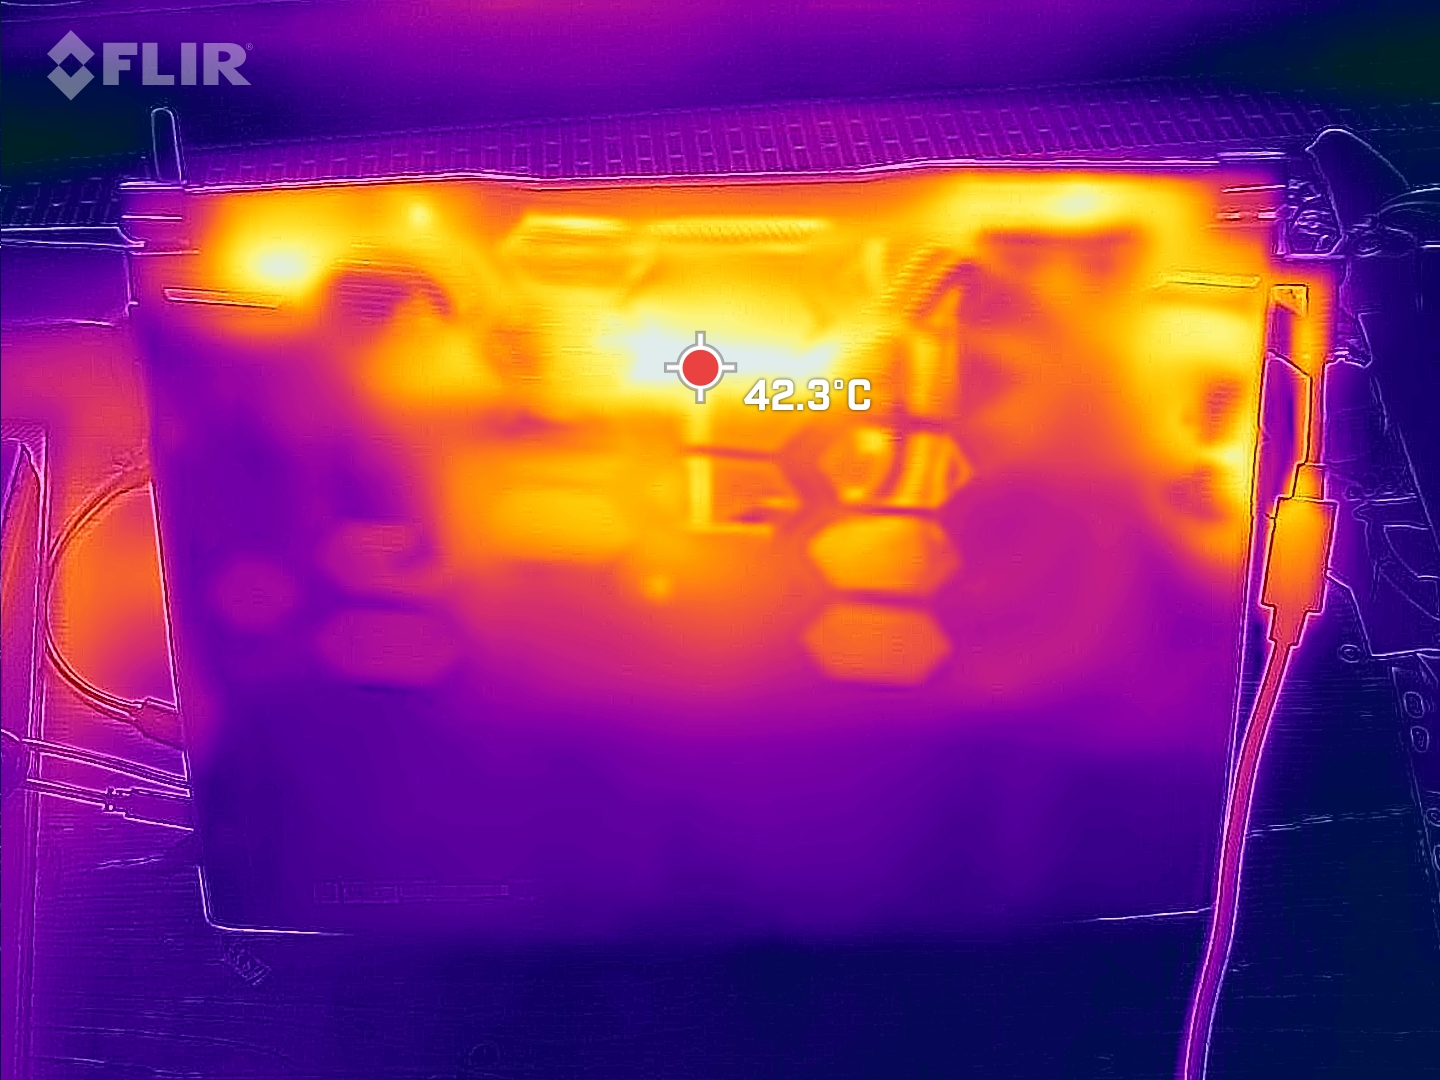
The hot spots are at just under 50 °C in the center towards the back. The palm rests remain cool at all times, but the WASD keys can heat up a little uncomfortably under heavy stress.
(-) The maximum temperature on the upper side is 47 °C / 117 F, compared to the average of 40.4 °C / 105 F, ranging from 21.2 to 68.8 °C for the class Gaming.
(-) The bottom heats up to a maximum of 48 °C / 118 F, compared to the average of 43.3 °C / 110 F
(+) In idle usage, the average temperature for the upper side is 29 °C / 84 F, compared to the device average of 33.9 °C / 93 F.
(±) Playing The Witcher 3, the average temperature for the upper side is 35 °C / 95 F, compared to the device average of 33.9 °C / 93 F.
(+) The palmrests and touchpad are cooler than skin temperature with a maximum of 23 °C / 73.4 F and are therefore cool to the touch.
(+) The average temperature of the palmrest area of similar devices was 28.8 °C / 83.8 F (+5.8 °C / 10.4 F).
| MSI Katana 15 B12VEK Intel Core i7-12650H, NVIDIA GeForce RTX 4050 Laptop GPU | MSI Katana GF66 12UGS Intel Core i7-12700H, NVIDIA GeForce RTX 3070 Ti Laptop GPU | MSI Pulse GL66 12UEK Intel Core i9-12900H, NVIDIA GeForce RTX 3060 Laptop GPU | Lenovo Legion 5 15IAH7H 82RB Intel Core i7-12700H, NVIDIA GeForce RTX 3060 Laptop GPU | Asus TUF Gaming F15 FX507ZM Intel Core i7-12700H, NVIDIA GeForce RTX 3060 Laptop GPU | Schenker XMG Core 15 (M22) AMD Ryzen 7 6800H, NVIDIA GeForce RTX 3060 Laptop GPU | |
|---|---|---|---|---|---|---|
| Heat | -17% | -2% | 16% | -2% | 6% | |
| Maximum Upper Side * (°C) | 47 | 61 -30% | 50 -6% | 37.8 20% | 44.4 6% | 48 -2% |
| Maximum Bottom * (°C) | 48 | 55 -15% | 47 2% | 51 -6% | 48.8 -2% | 51 -6% |
| Idle Upper Side * (°C) | 35 | 43 -23% | 36 -3% | 25.8 26% | 37.8 -8% | 28 20% |
| Idle Bottom * (°C) | 38 | 38 -0% | 38 -0% | 28.8 24% | 39.6 -4% | 33 13% |
* ... smaller is better
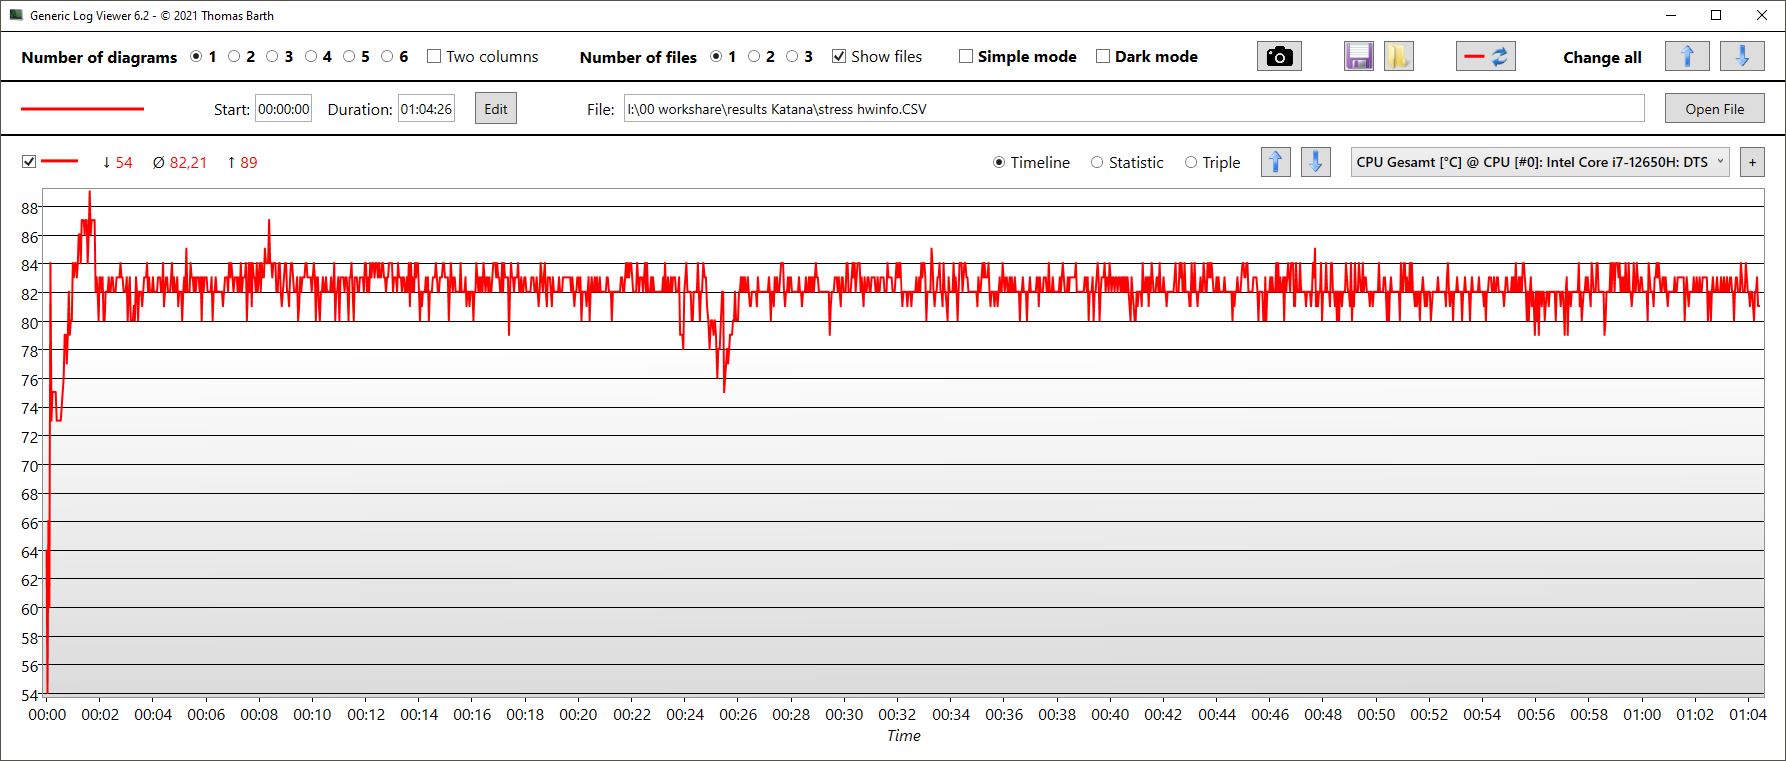
Stress Test
The cores start our stress test at 3.1 GHz very briefly. After a few seconds, core temperatures rise to 89 °C, after which the clock rates drop and reach a stable 2.5 GHz on average. Power consumption averages 50 W. Temperatures stabilize at around 82 °C.
The GPU clock fluctuates between 2 and 2.5 GHz. Average temperatures of 75 °C are reached, while power consumption is only around 62 W.
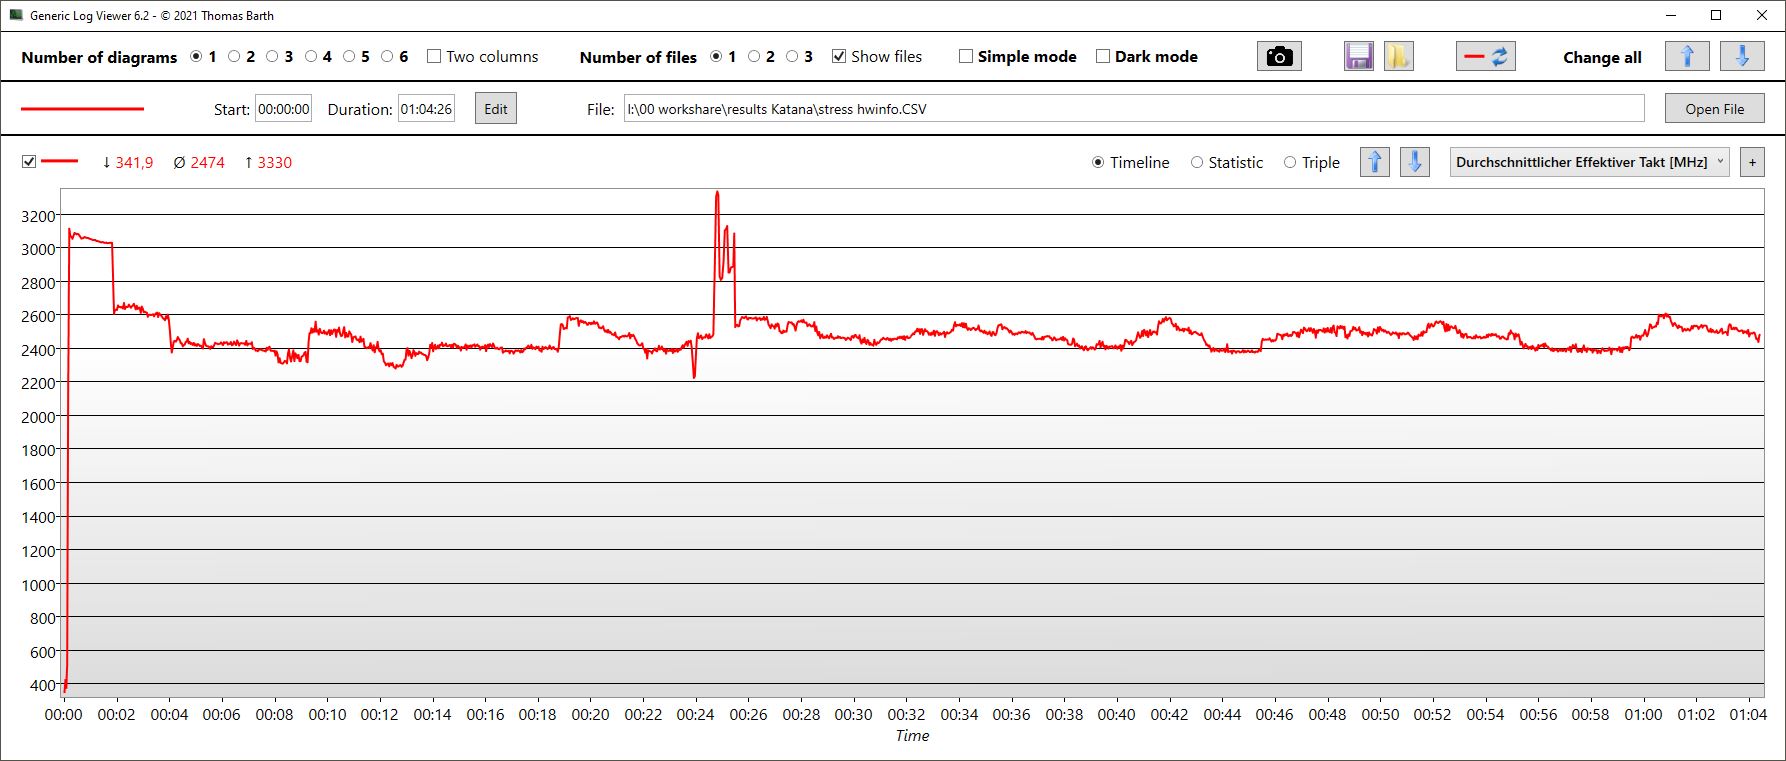
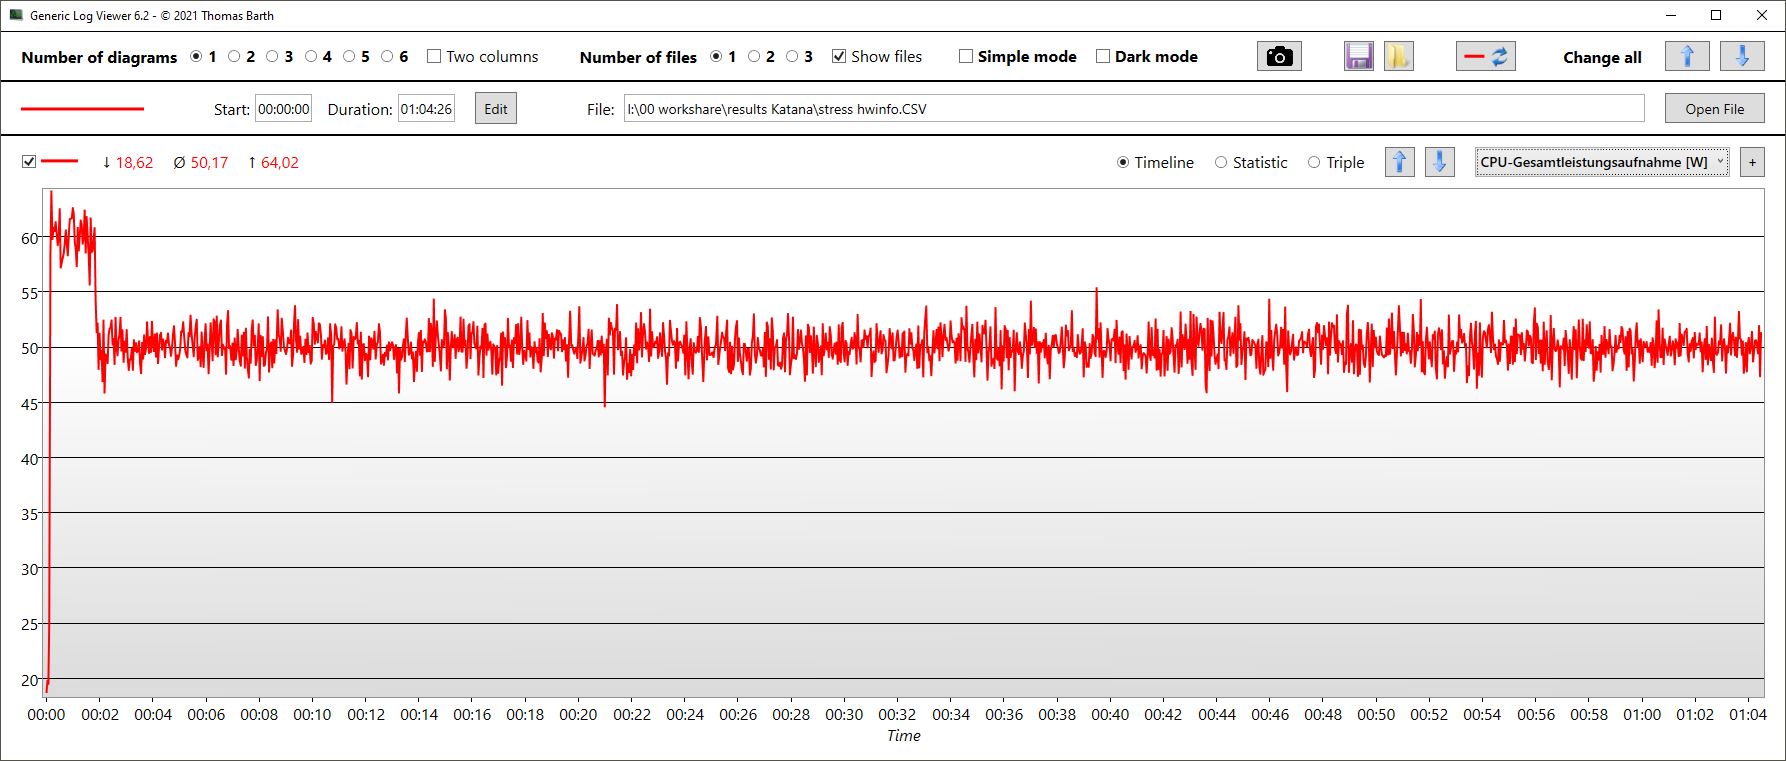
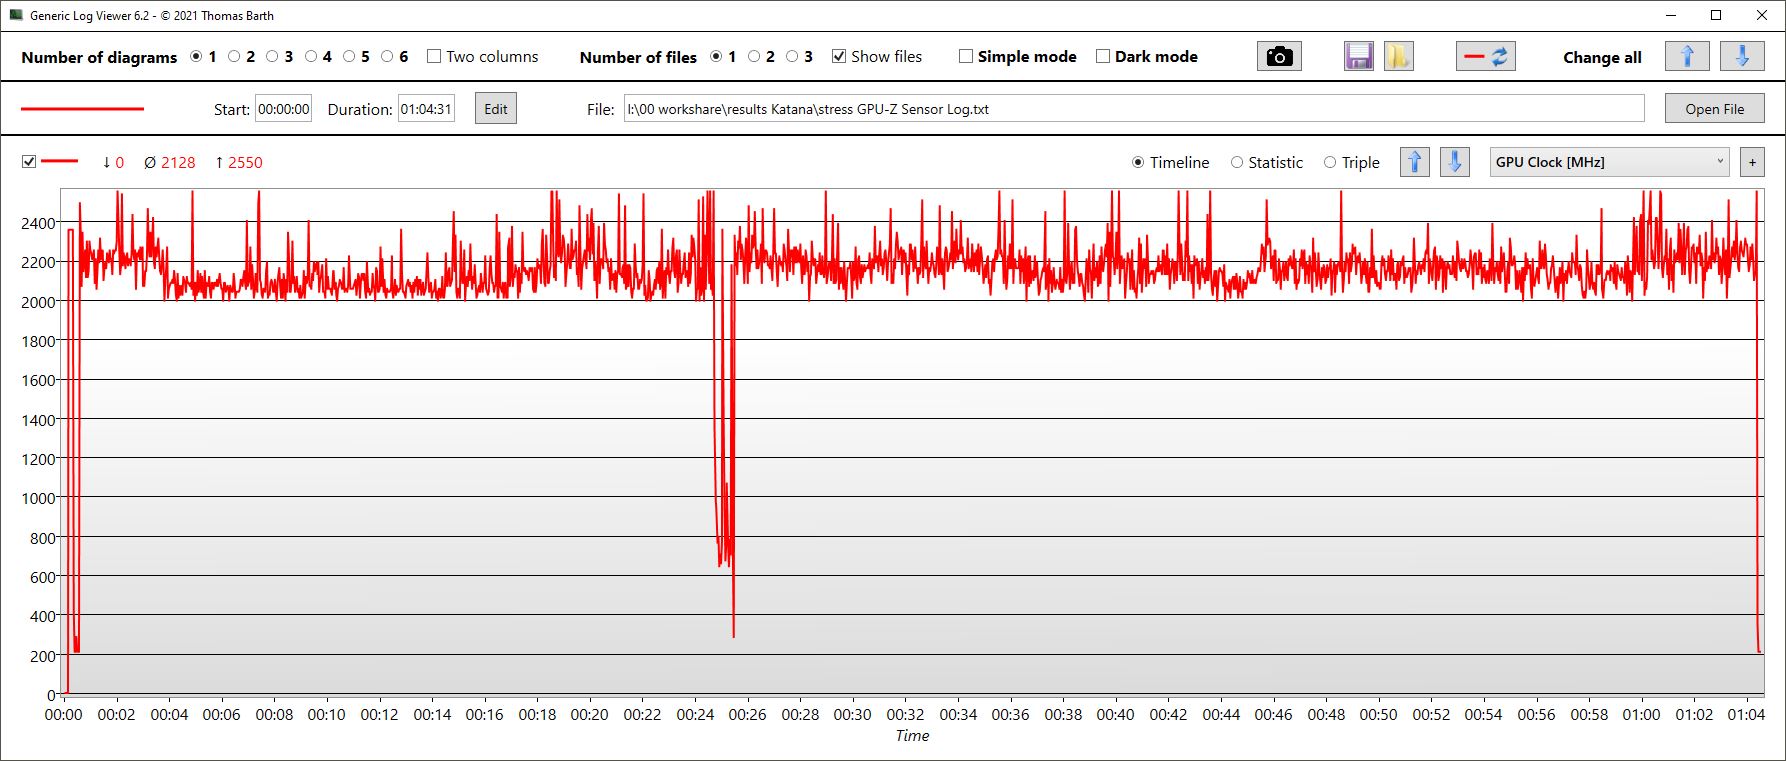
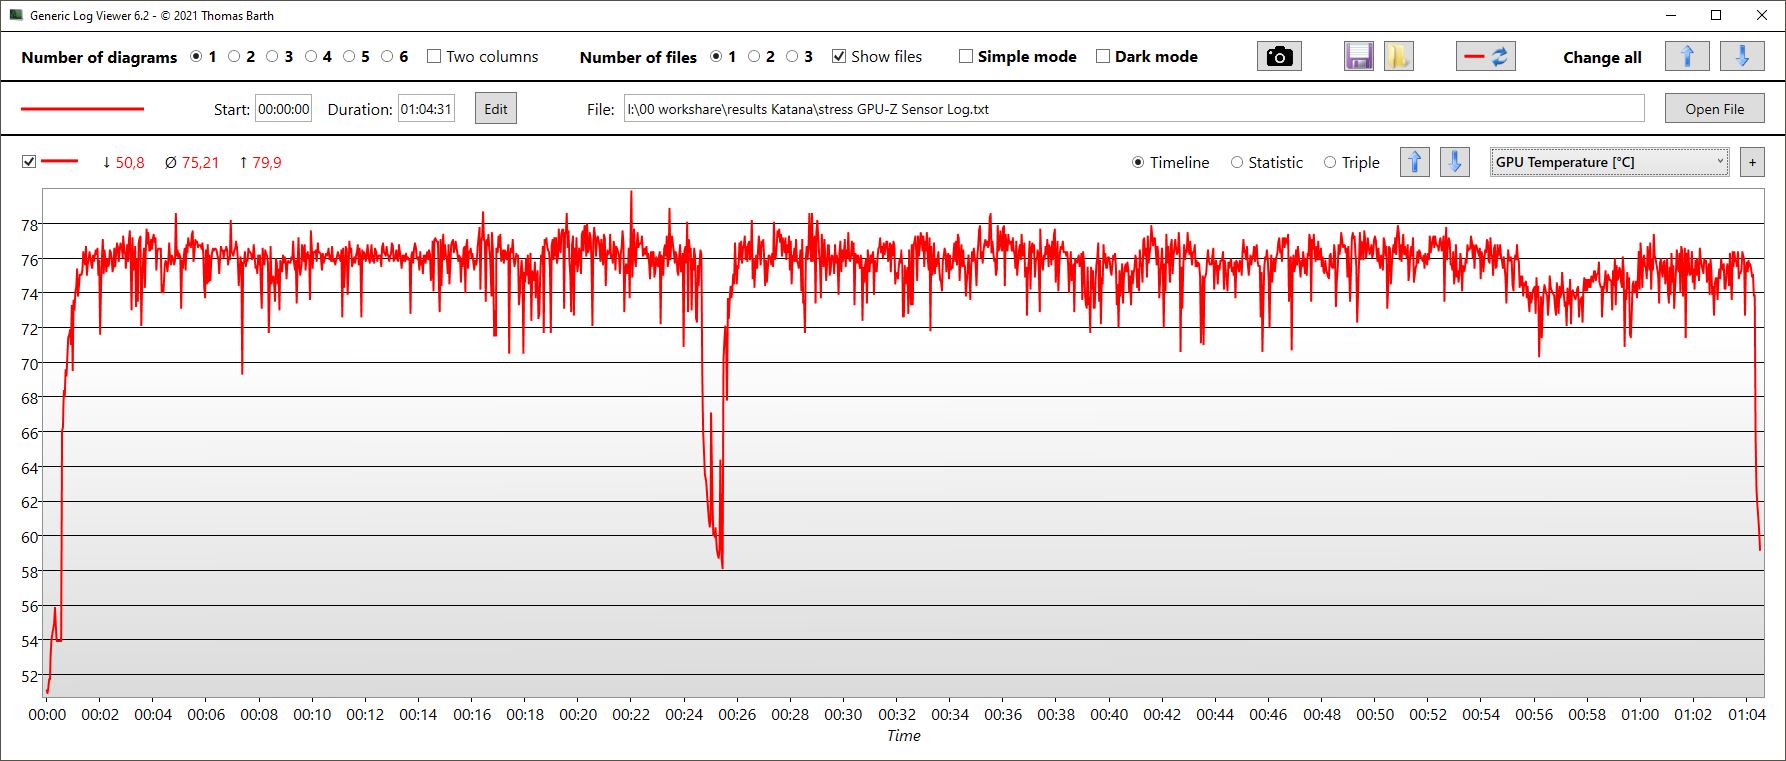
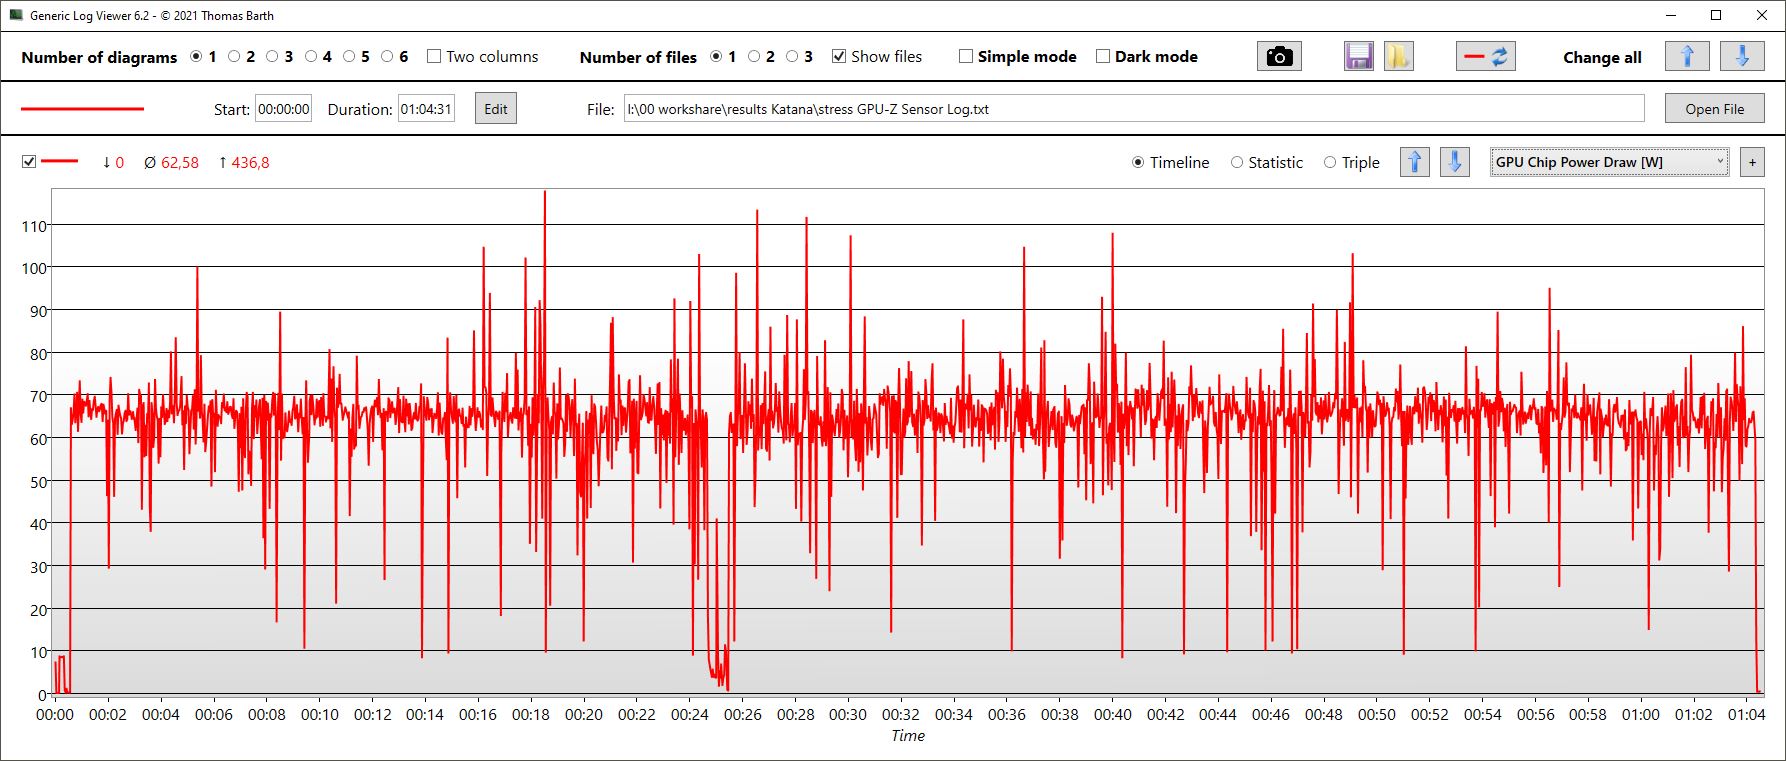
| CPU Clock (GHz) | GPU Clock (MHz) | Average CPU Temperature (°C) | Average GPU Temperature (°C) | |
| Prime95 + FurMark Stress | 2,5 | 2.121 | 82 | 75 |
| Witcher 3 Stress | 0.6 | 2.400 | 75 | 75 |
Speakers
The stereo speakers offer balanced mids and highs, but hardly any bass and medium volume at best. The headset jack is ideal for analogue devices.
MSI Katana 15 B12VEK audio analysis
(±) | speaker loudness is average but good (75.69 dB)
Bass 100 - 315 Hz
(-) | nearly no bass - on average 21.5% lower than median
(±) | linearity of bass is average (8.8% delta to prev. frequency)
Mids 400 - 2000 Hz
(+) | balanced mids - only 4.1% away from median
(+) | mids are linear (4.8% delta to prev. frequency)
Highs 2 - 16 kHz
(+) | balanced highs - only 2.3% away from median
(+) | highs are linear (4% delta to prev. frequency)
Overall 100 - 16.000 Hz
(±) | linearity of overall sound is average (17.3% difference to median)
Compared to same class
» 47% of all tested devices in this class were better, 12% similar, 41% worse
» The best had a delta of 6%, average was 18%, worst was 132%
Compared to all devices tested
» 31% of all tested devices were better, 8% similar, 60% worse
» The best had a delta of 4%, average was 24%, worst was 134%
Lenovo Legion 5 15IAH7H 82RB audio analysis
(+) | speakers can play relatively loud (83.3 dB)
Bass 100 - 315 Hz
(-) | nearly no bass - on average 28.2% lower than median
(±) | linearity of bass is average (12.9% delta to prev. frequency)
Mids 400 - 2000 Hz
(±) | higher mids - on average 5.7% higher than median
(±) | linearity of mids is average (7.4% delta to prev. frequency)
Highs 2 - 16 kHz
(+) | balanced highs - only 3.3% away from median
(+) | highs are linear (6.4% delta to prev. frequency)
Overall 100 - 16.000 Hz
(±) | linearity of overall sound is average (23.6% difference to median)
Compared to same class
» 85% of all tested devices in this class were better, 4% similar, 11% worse
» The best had a delta of 6%, average was 18%, worst was 132%
Compared to all devices tested
» 70% of all tested devices were better, 6% similar, 24% worse
» The best had a delta of 4%, average was 24%, worst was 134%
Power Management - Efficient RTX 4050 in the MSI Katana
Power Consumption
In terms of power consumption, the new Katana 15 is more economical than the competition with a last-gen GPU. Our test model has good rates while idling, and remains so even when gaming or under heavy stress. Although the 3D performance is also slightly lower, the difference in consumption is much greater than the difference in performance.
For example, both the Legion 5 and the XMG Core 15 up to the Asus TUF Gaming F15 consume almost 50 percent more when gaming with Witcher 3 than our Katana 15! But the Katana GF66 with its RTX 3070 Ti also only consumes 16 percent more in gaming.
We measured a short-term maximum consumption of up to 189 W. The standard Chicony power supply, which is designed for 240 W, should be able to handle this very well.
| Off / Standby | |
| Idle | |
| Load |
|
Key:
min: | |
| MSI Katana 15 B12VEK i7-12650H, GeForce RTX 4050 Laptop GPU, Micron 2400 MTFDKBA1T0QFM, IPS, 1920x1080, 15.6" | MSI Katana GF66 12UGS i7-12700H, GeForce RTX 3070 Ti Laptop GPU, Micron 2450 1TB MTFDKBA1T0TFK, IPS, 1920x1080, 15.6" | MSI Pulse GL66 12UEK i9-12900H, GeForce RTX 3060 Laptop GPU, Micron 2450 512GB MTFDKBA512TFK, IPS, 1920x1080, 15.6" | Lenovo Legion 5 15IAH7H 82RB i7-12700H, GeForce RTX 3060 Laptop GPU, , IPS, 1920x1080, 15.6" | Asus TUF Gaming F15 FX507ZM i7-12700H, GeForce RTX 3060 Laptop GPU, SK Hynix HFM001TD3JX013N, IPS, 1920x1080, 15.6" | Schenker XMG Core 15 (M22) R7 6800H, GeForce RTX 3060 Laptop GPU, Samsung SSD 980 Pro 1TB MZ-V8P1T0BW, IPS, 2560x1440, 15.6" | Average NVIDIA GeForce RTX 4050 Laptop GPU | Average of class Gaming | |
|---|---|---|---|---|---|---|---|---|
| Power Consumption | -26% | -6% | -121% | -34% | -34% | -30% | -69% | |
| Idle Minimum * (Watt) | 8.5 | 9 -6% | 7 18% | 19.8 -133% | 6.3 26% | 11.8 -39% | 9.95 ? -17% | 13.5 ? -59% |
| Idle Average * (Watt) | 10.2 | 13 -27% | 13 -27% | 26.2 -157% | 9.8 4% | 14.7 -44% | 15.8 ? -55% | 19.3 ? -89% |
| Idle Maximum * (Watt) | 11.3 | 20 -77% | 13.7 -21% | 48.2 -327% | 26.5 -135% | 15 -33% | 20.1 ? -78% | 25.8 ? -128% |
| Load Average * (Watt) | 84 | 100 -19% | 48.4 42% | 102.9 -23% | 103.8 -24% | 100 -19% | 88 ? -5% | 110.9 ? -32% |
| Witcher 3 ultra * (Watt) | 128 | 149 -16% | 148 -16% | 186.7 -46% | 189 -48% | 184 -44% | ||
| Load Maximum * (Watt) | 189 | 212 -12% | 244 -29% | 268 -42% | 241.9 -28% | 237 -25% | 176.3 ? 7% | 260 ? -38% |
* ... smaller is better
Power Consumption Witcher 3 / Stresstest
Power Consumption with an External Monitor
Battery Life
Where else do budget laptops save money? Correct, the battery. The model in the Katana 15 only has 53 Wh, which is standard in the Katana or Pulse. The rest of the competition has batteries ranging from 62 to 90 Wh. Accordingly, the runtimes are rather mediocre, despite the comparatively good energy efficiency.
A film night can be planned for about 4 hours and 20 minutes. Our WLAN test yields significantly different results, depending on the selected mode. In Balanced mode at maximum brightness (258 nits), the battery lasts only 2 hours and 20 minutes. In Power Saver at 150 nits, on the other hand, we measured about the same time as in the video test.
| MSI Katana 15 B12VEK i7-12650H, GeForce RTX 4050 Laptop GPU, 53.5 Wh | MSI Katana GF66 12UGS i7-12700H, GeForce RTX 3070 Ti Laptop GPU, 52 Wh | MSI Pulse GL66 12UEK i9-12900H, GeForce RTX 3060 Laptop GPU, 53.5 Wh | Lenovo Legion 5 15IAH7H 82RB i7-12700H, GeForce RTX 3060 Laptop GPU, 80 Wh | Asus TUF Gaming F15 FX507ZM i7-12700H, GeForce RTX 3060 Laptop GPU, 90 Wh | Schenker XMG Core 15 (M22) R7 6800H, GeForce RTX 3060 Laptop GPU, 62 Wh | Average of class Gaming | |
|---|---|---|---|---|---|---|---|
| Battery runtime | -26% | 9% | -6% | -8% | 27% | 46% | |
| H.264 (h) | 4.4 | 4 -9% | 8.1 ? 84% | ||||
| WiFi v1.3 (h) | 4.3 | 2.4 -44% | 5 16% | 4.8 12% | 7.8 81% | 6.79 ? 58% | |
| Load (h) | 1.5 | 1.4 -7% | 1.9 27% | 1.1 -27% | 1.1 -27% | 1.1 -27% | 1.43 ? -5% |
| Reader / Idle (h) | 8.1 | 15.8 | 9.62 ? |
Pros
Cons
Verdict - Budget RTX 4050 is still too expensive

The MSI Katana 15 B12 combines a Gen12 CPU with an RTX 4050, which is actually not a bad idea for a budget gamer. The CPU is anything but bad and the GPU in the Katana 15 proves to be significantly more efficient than last year's models.
However, our main point of criticism for budget gamers is the price: while you can get budget laptops with RTX 3060 from around US$800, you pay a whole US$1,499.99 here! The efficiency advantages of the RTX 4050 do not justify this price premium. More so since almost all other components in the Katana 15 are clearly budget class, ranging from the partly outdated ports to the rather dark Full HD display to the comparatively small battery. Added to this is the fact that the laptop's performance tends to fall behind most RTX 3060 gamers and the RTX 4050 clearly misses its TGP target of 105.
The MSI Katana 15 B12 combines a good last-gen CPU with a current RTX 4050, but fails to set a price that is reasonable for the many budget components. At present, the Katana 15 is simply too expensive.
After all, there are plenty of alternatives. If you want more performance and fewer budget components at yet lower prices, your best bet is the Lenovo Legion 5 with its RTX 3060. But most other RTX 3060 gamers should also be cheaper, better equipped and mostly faster.
Price and Availability
In MSI's official US webstore, the Katana 15 B12VGK-082 is priced at $1,499.99. Interested buyers (depending on location) may find the same model at cheaper prices elsewhere on resellers such as Amazon.
MSI Katana 15 B12VEK
- 03/28/2023 v7 (old)
Christian Hintze
Transparency
The selection of devices to be reviewed is made by our editorial team. The test sample was provided to the author as a loan by the manufacturer or retailer for the purpose of this review. The lender had no influence on this review, nor did the manufacturer receive a copy of this review before publication. There was no obligation to publish this review. As an independent media company, Notebookcheck is not subjected to the authority of manufacturers, retailers or publishers.
This is how Notebookcheck is testing
Every year, Notebookcheck independently reviews hundreds of laptops and smartphones using standardized procedures to ensure that all results are comparable. We have continuously developed our test methods for around 20 years and set industry standards in the process. In our test labs, high-quality measuring equipment is utilized by experienced technicians and editors. These tests involve a multi-stage validation process. Our complex rating system is based on hundreds of well-founded measurements and benchmarks, which maintains objectivity. Further information on our test methods can be found here.
Price comparison

