

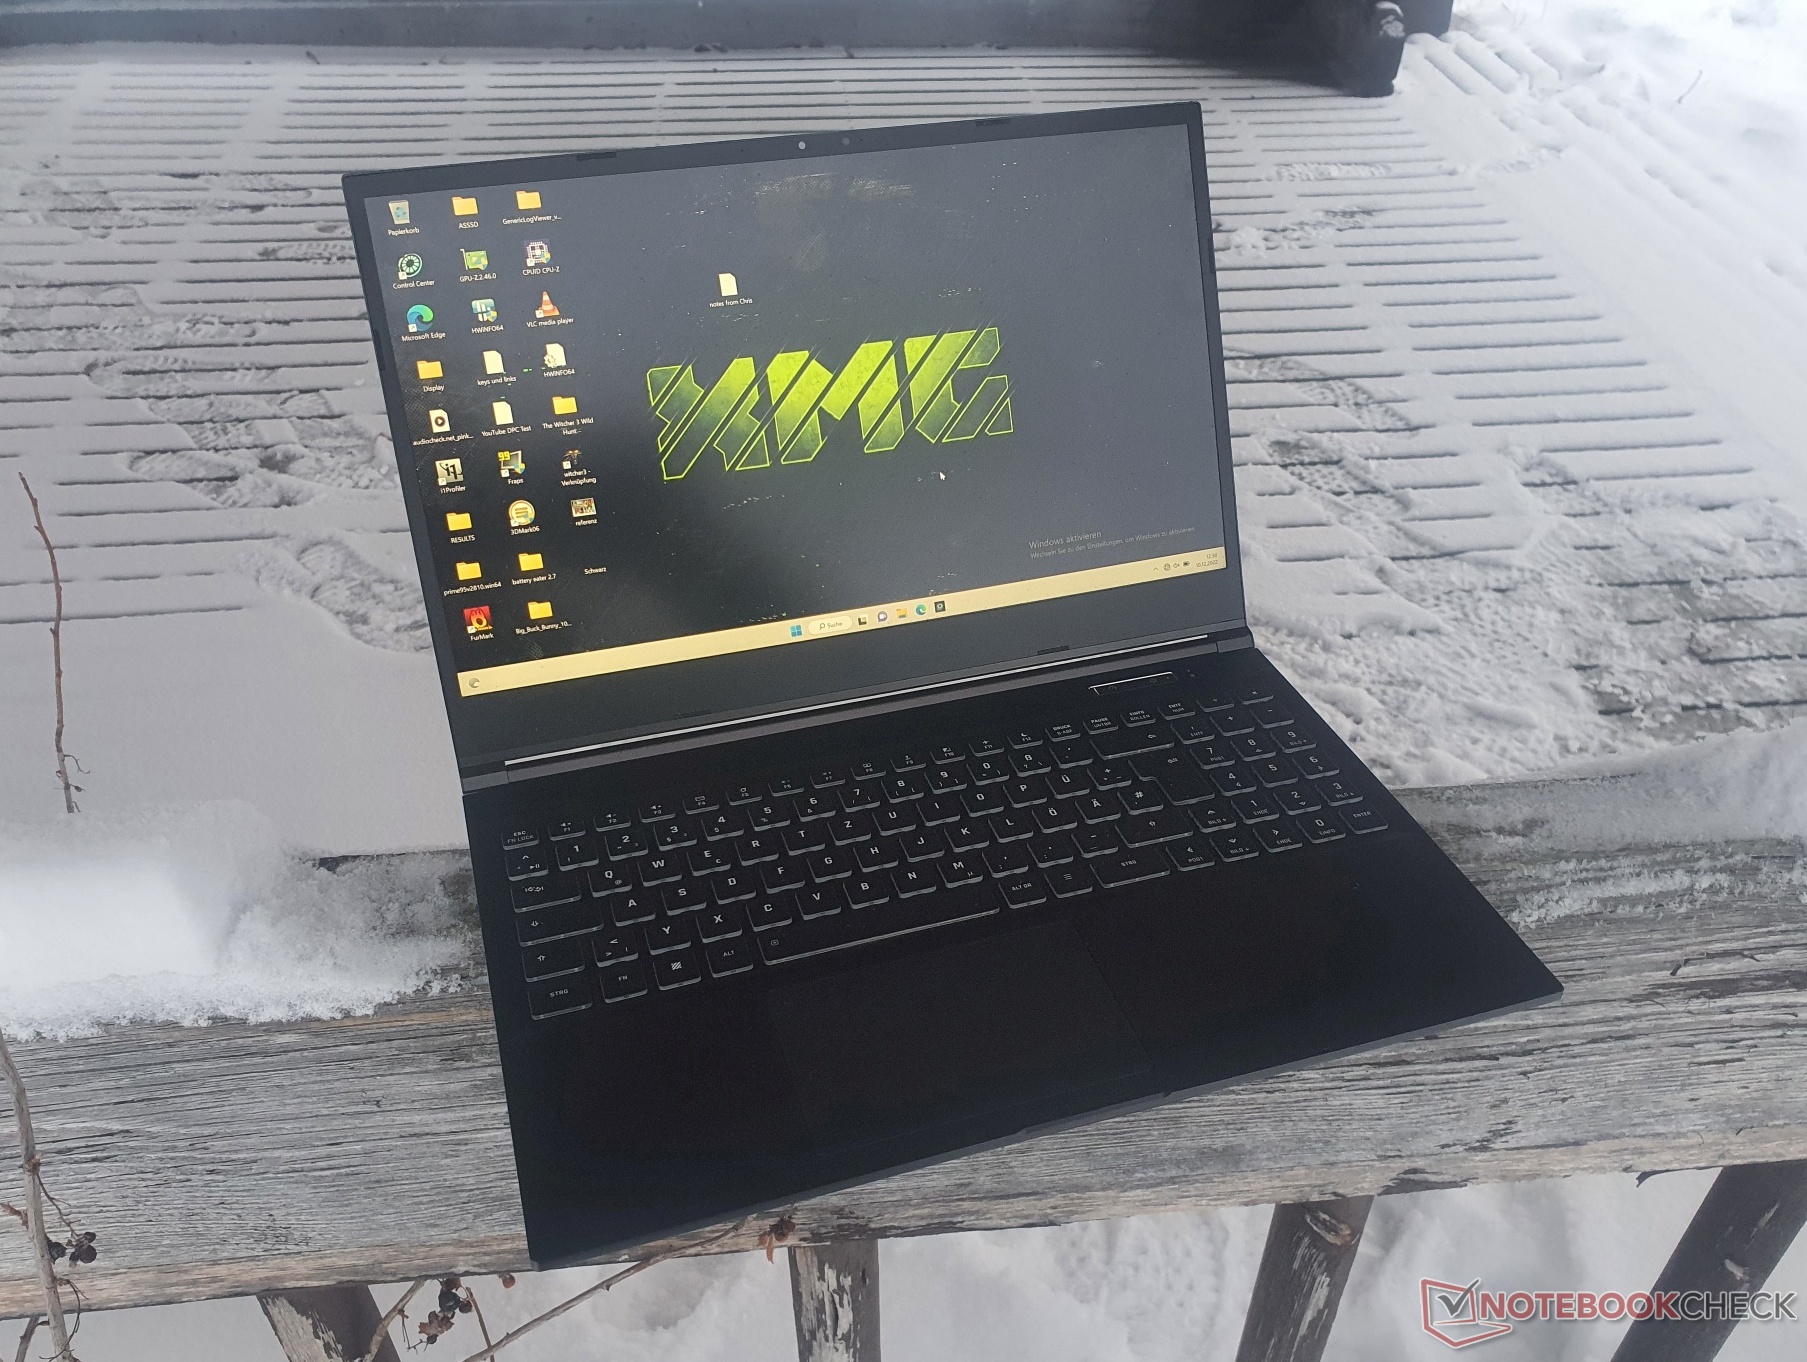
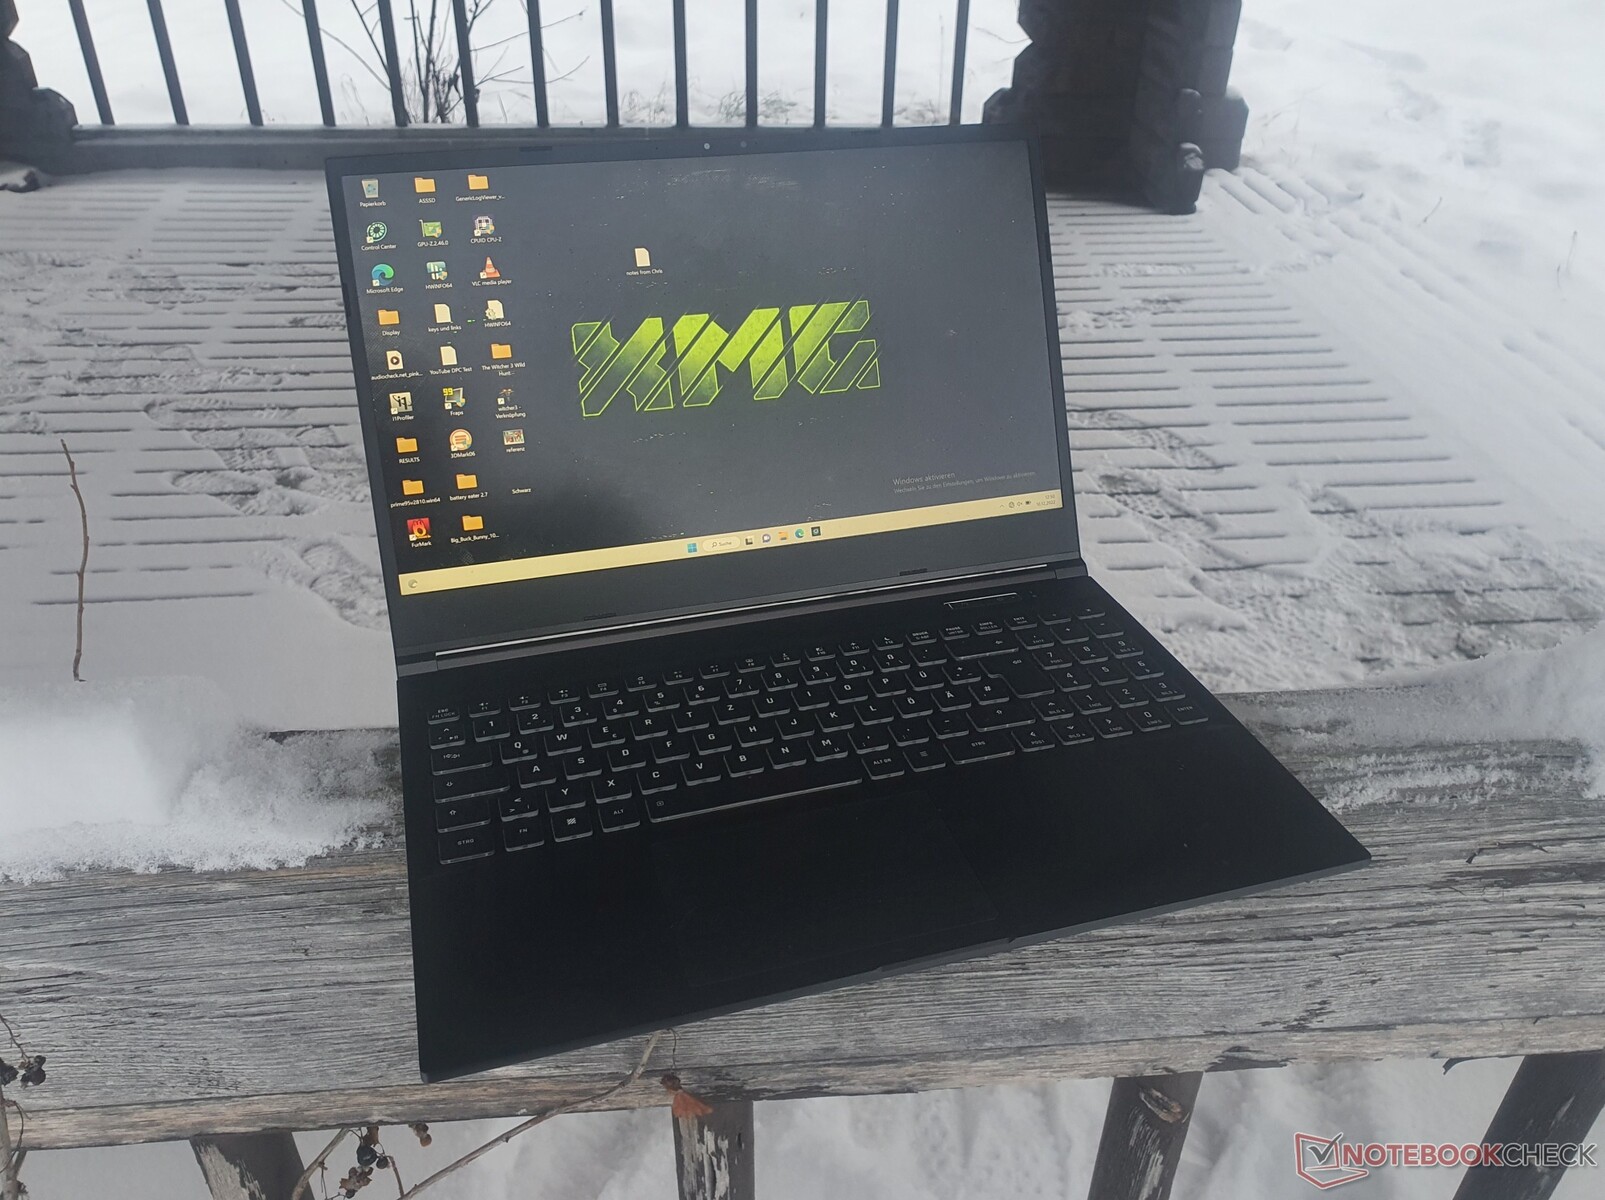
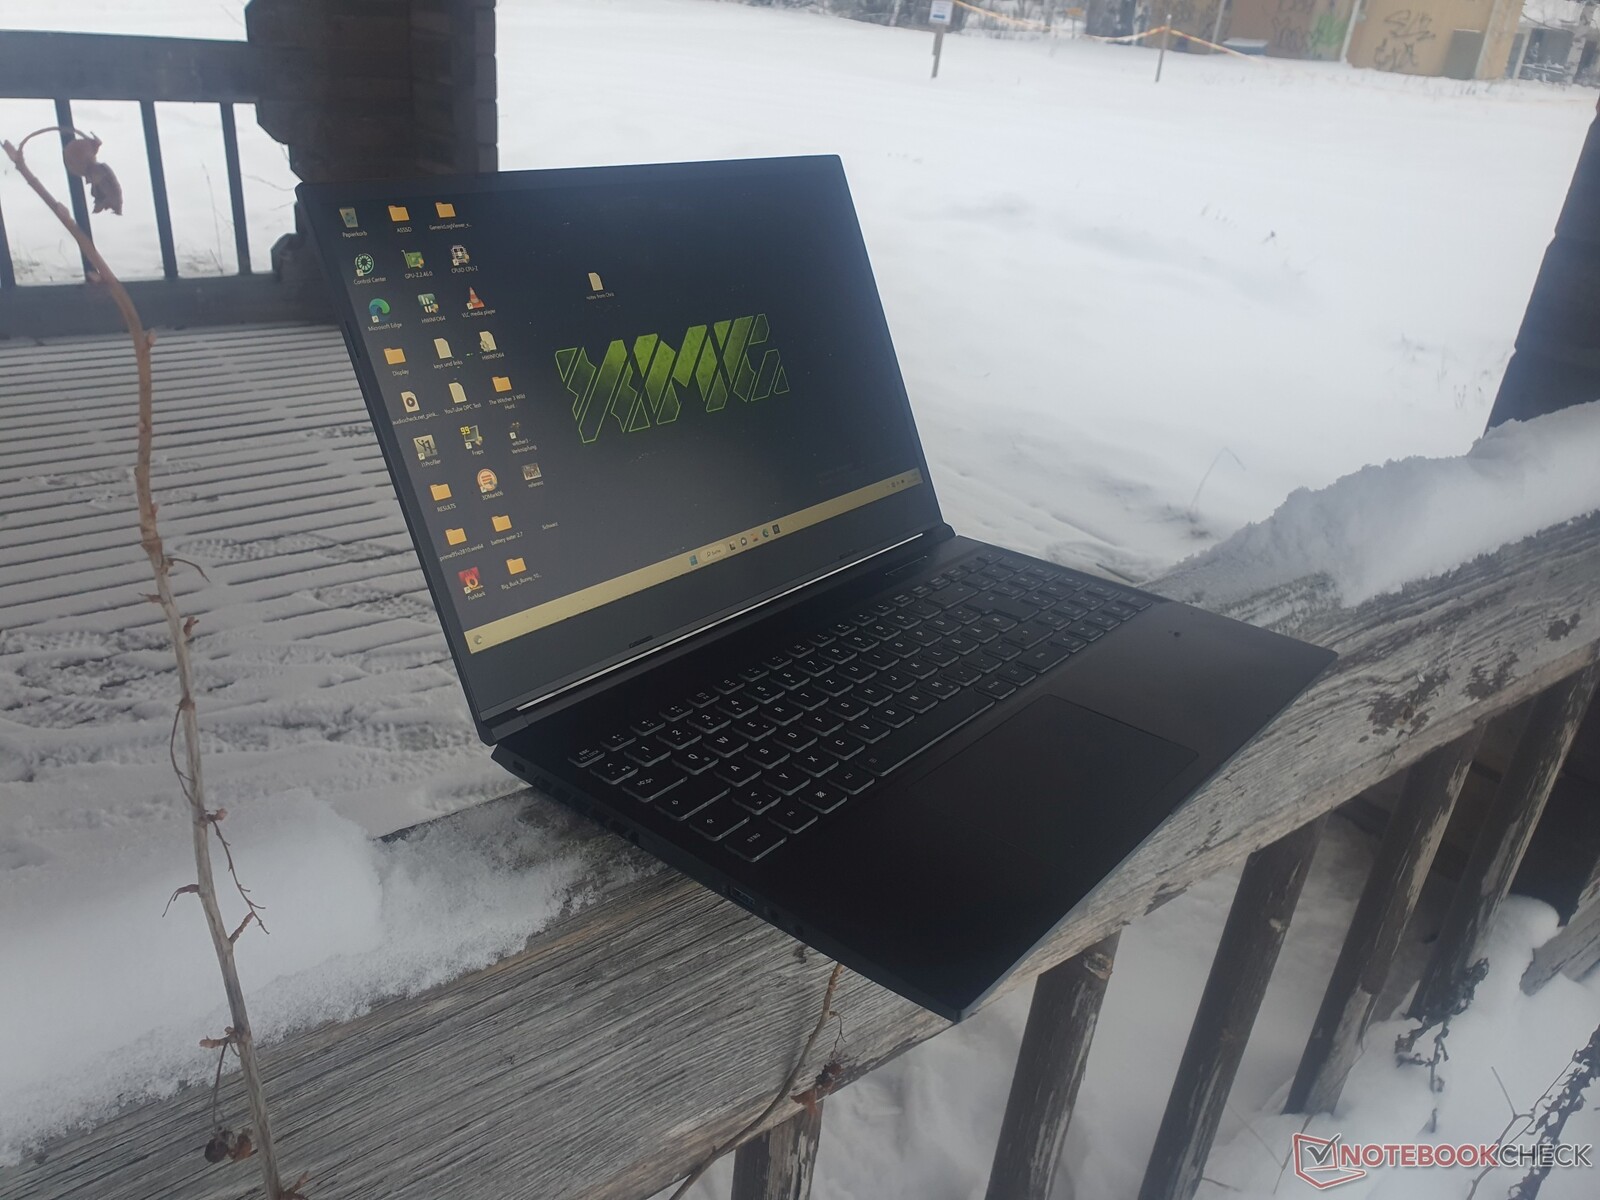
Schenker XMG Core 15 M22 in review: Gaming midrange with water connection
Schenker has made it its goal to deliver a strong upper mid-range gaming laptop with the XMG Core 15 (M22). Thus, this not only offers the maximum 140 W TGP of the Nvidia GeForce RTX 3060 including the MUX switch, but also a fast AMD Ryzen 7 6800H.
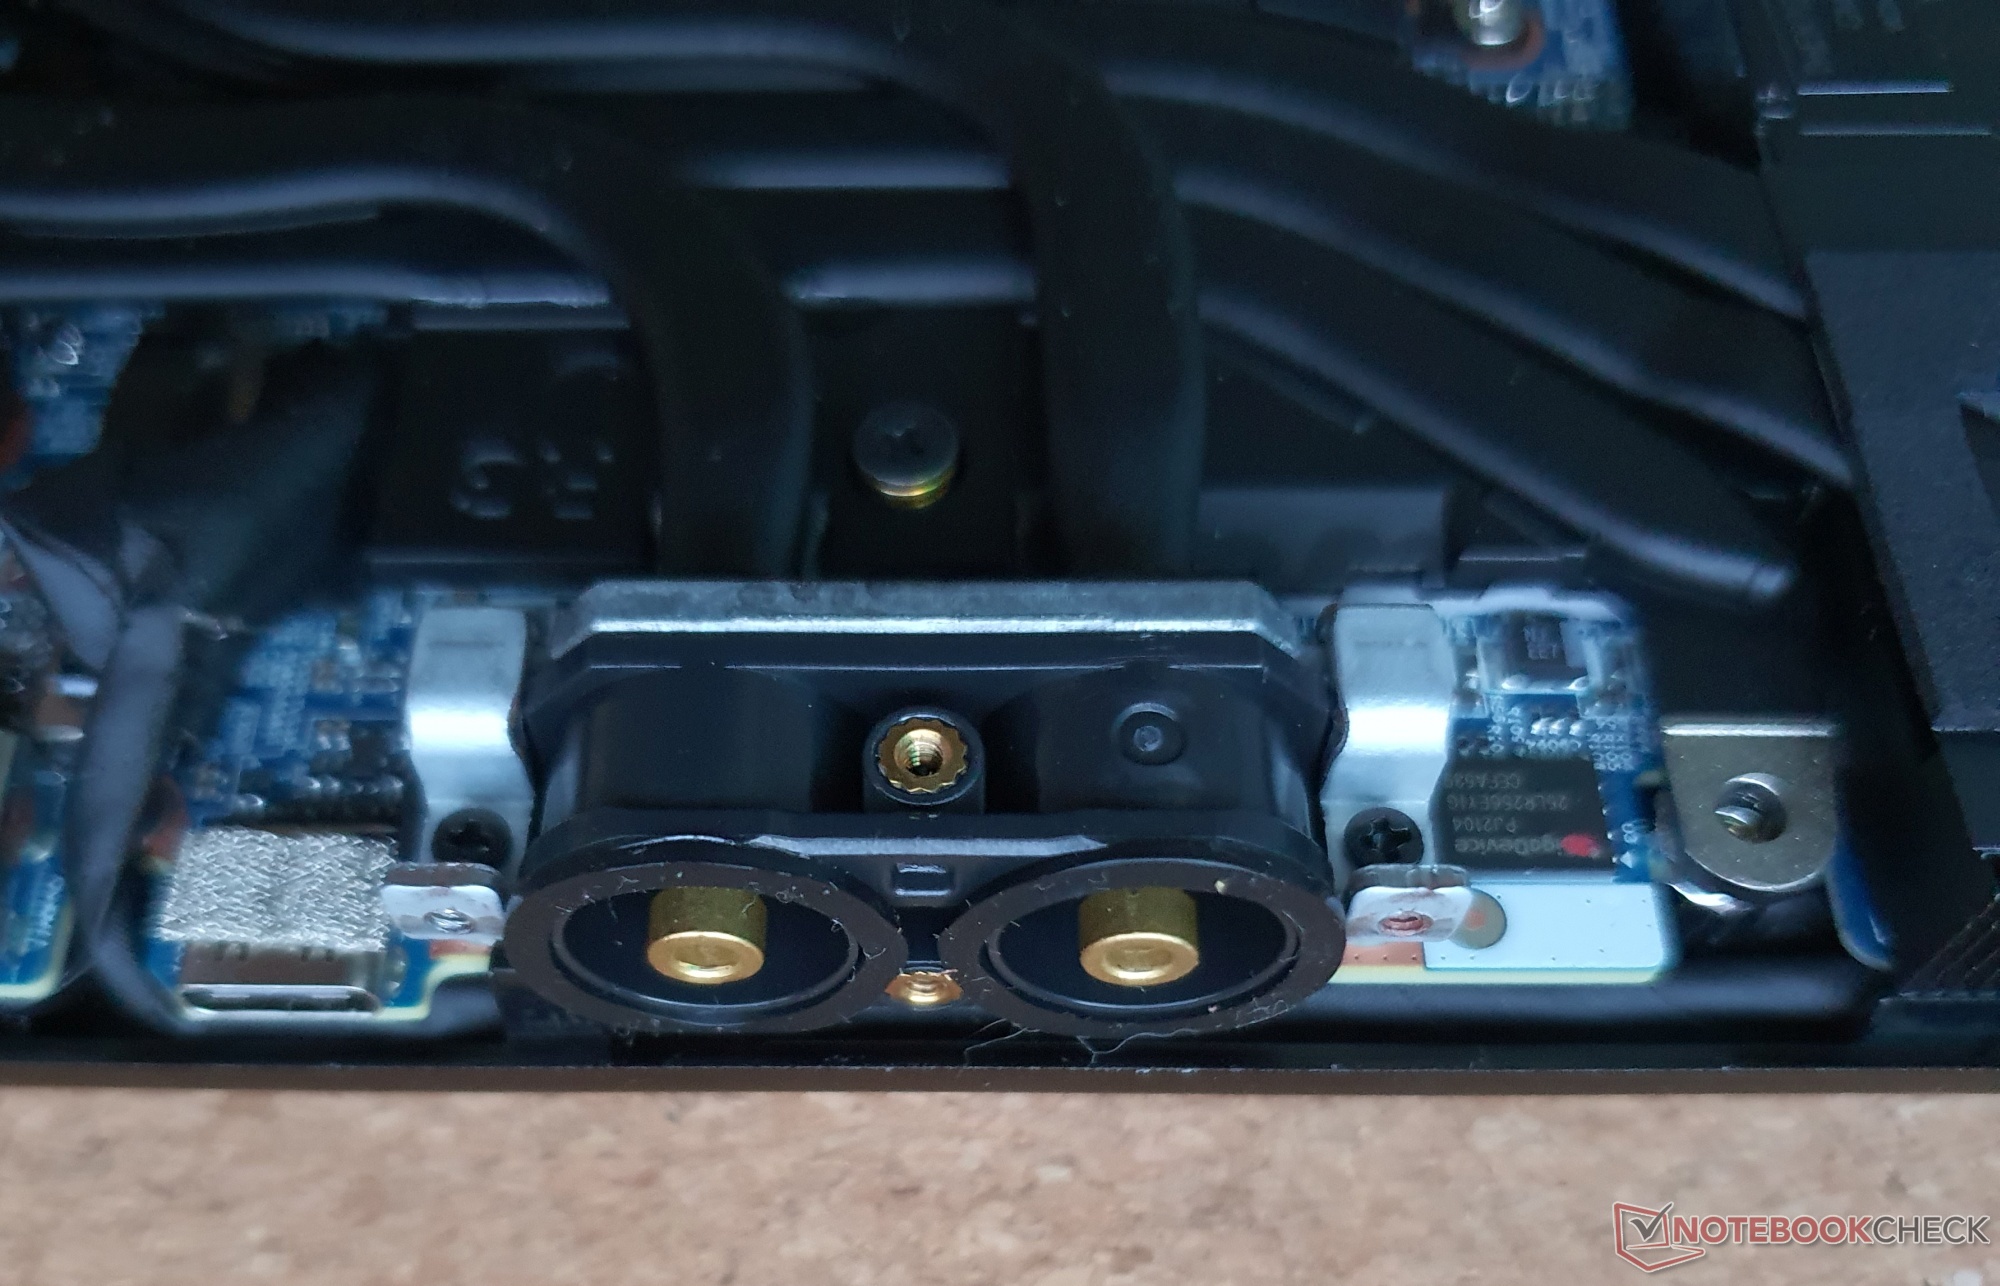
You get a 165 Hz fast WQHD panel as well as the support of an external water cooling, which is otherwise only used in Schenker's absolute upper class, which we have seen for example in the XMG Neo 15, which we have already tested in detail. All of this is available for 1,817 Euros (~$1935). The Core 15 ranks between Apex 15 and Neo 15.
There is plenty of competition in the mid-range segment, for example Asus' TUF Gaming F15, Lenovo's Legion 5 and the Alienware m15. XMG's own Fusion 15 is also interesting for our comparison.
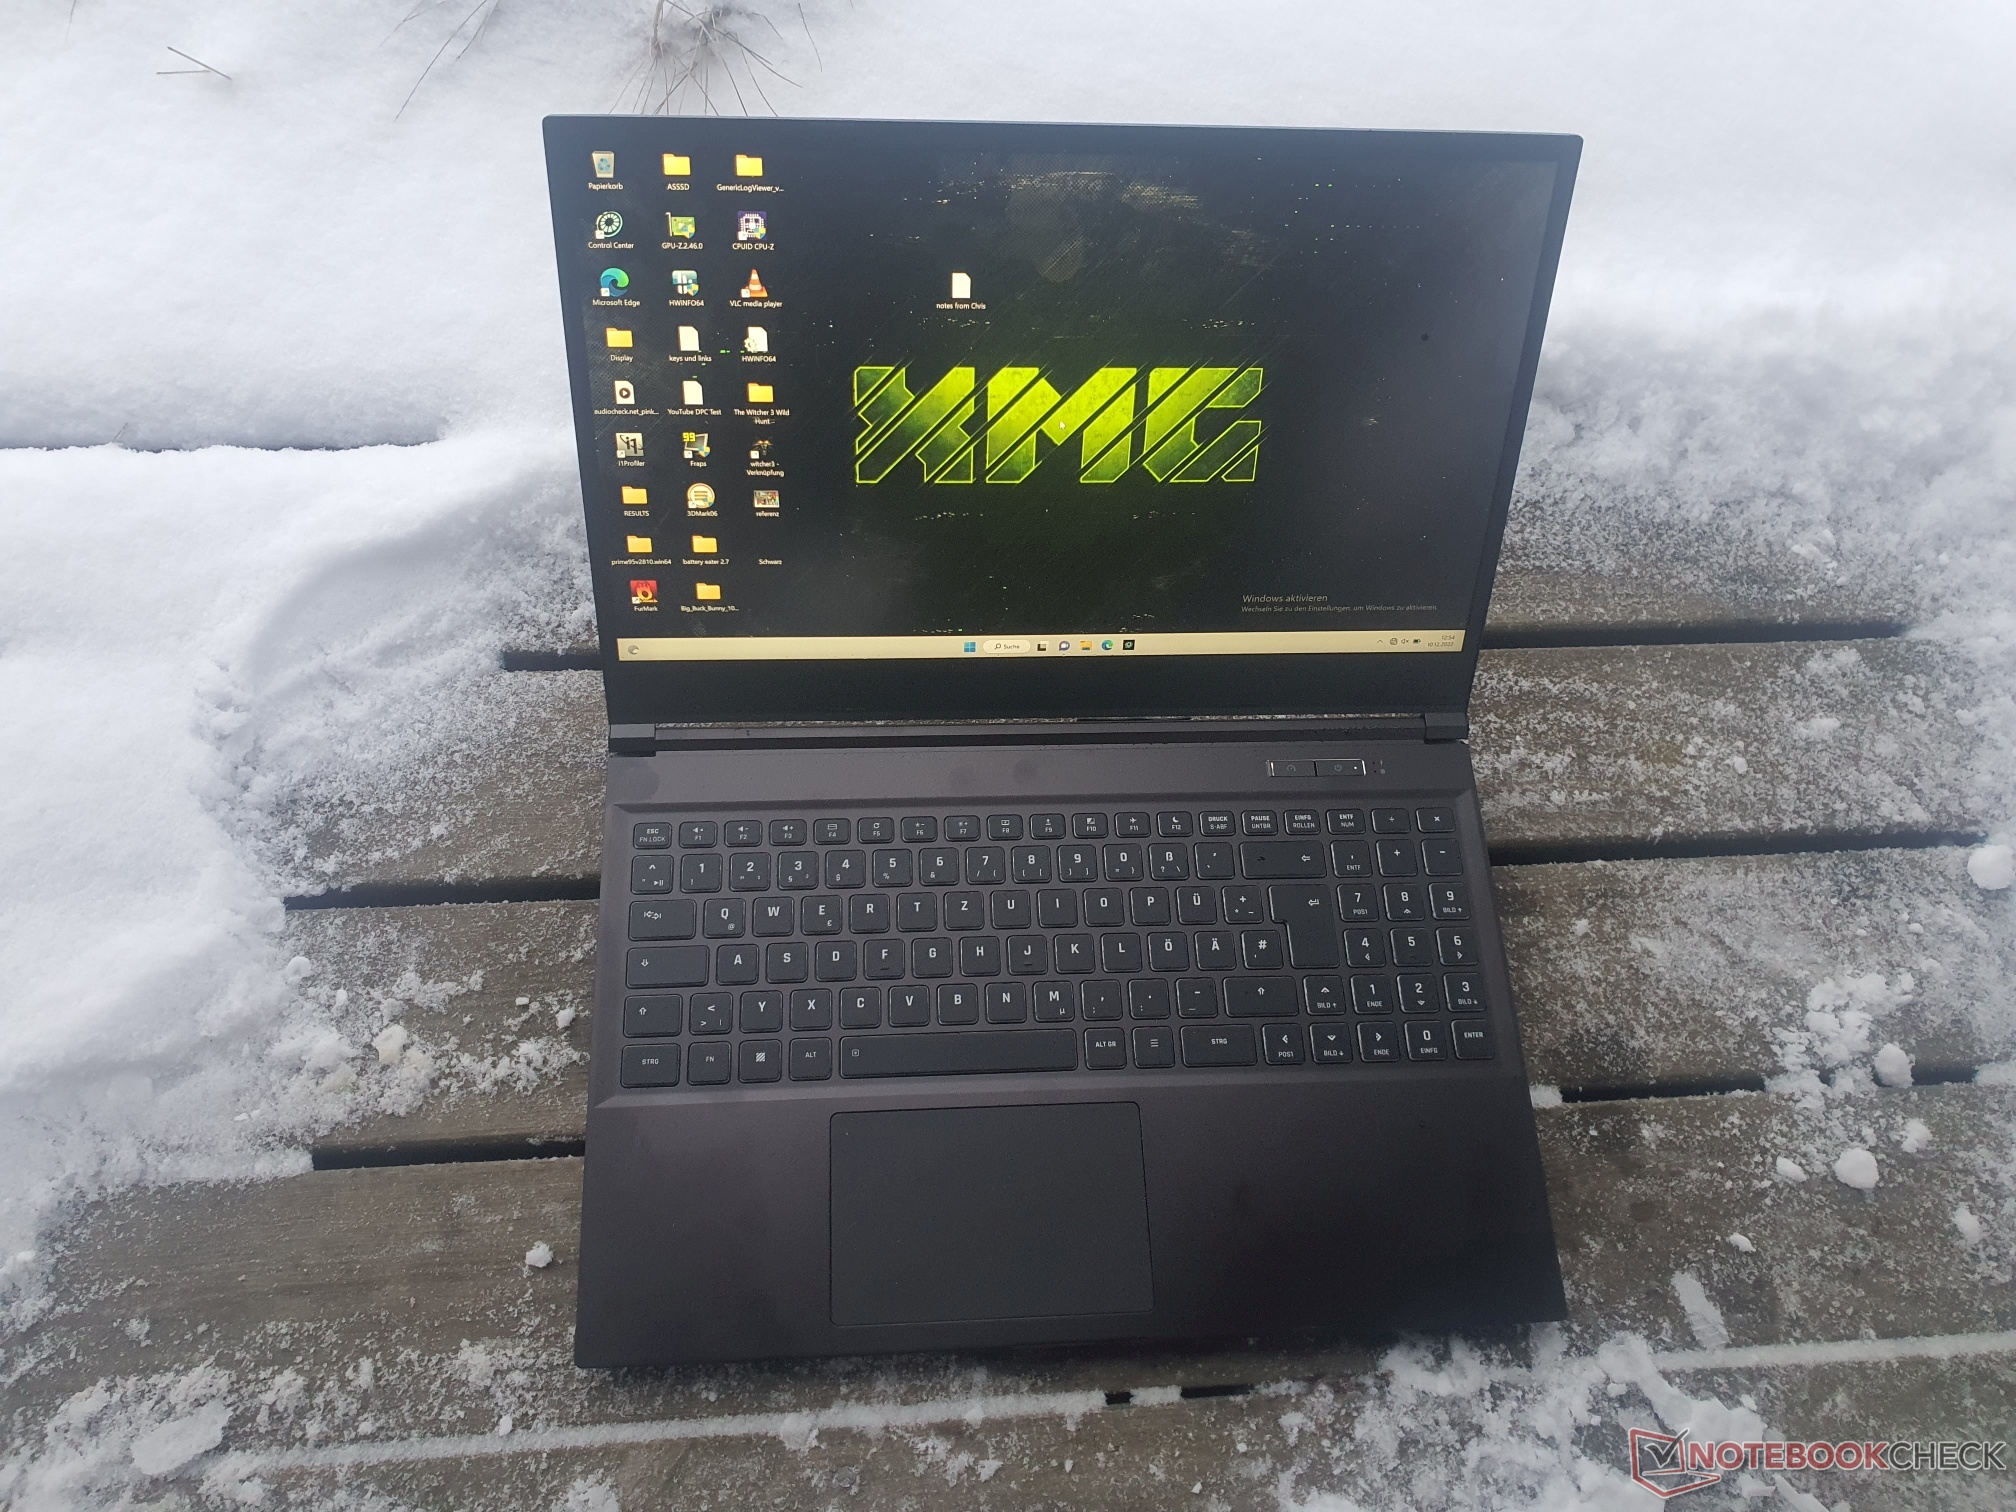
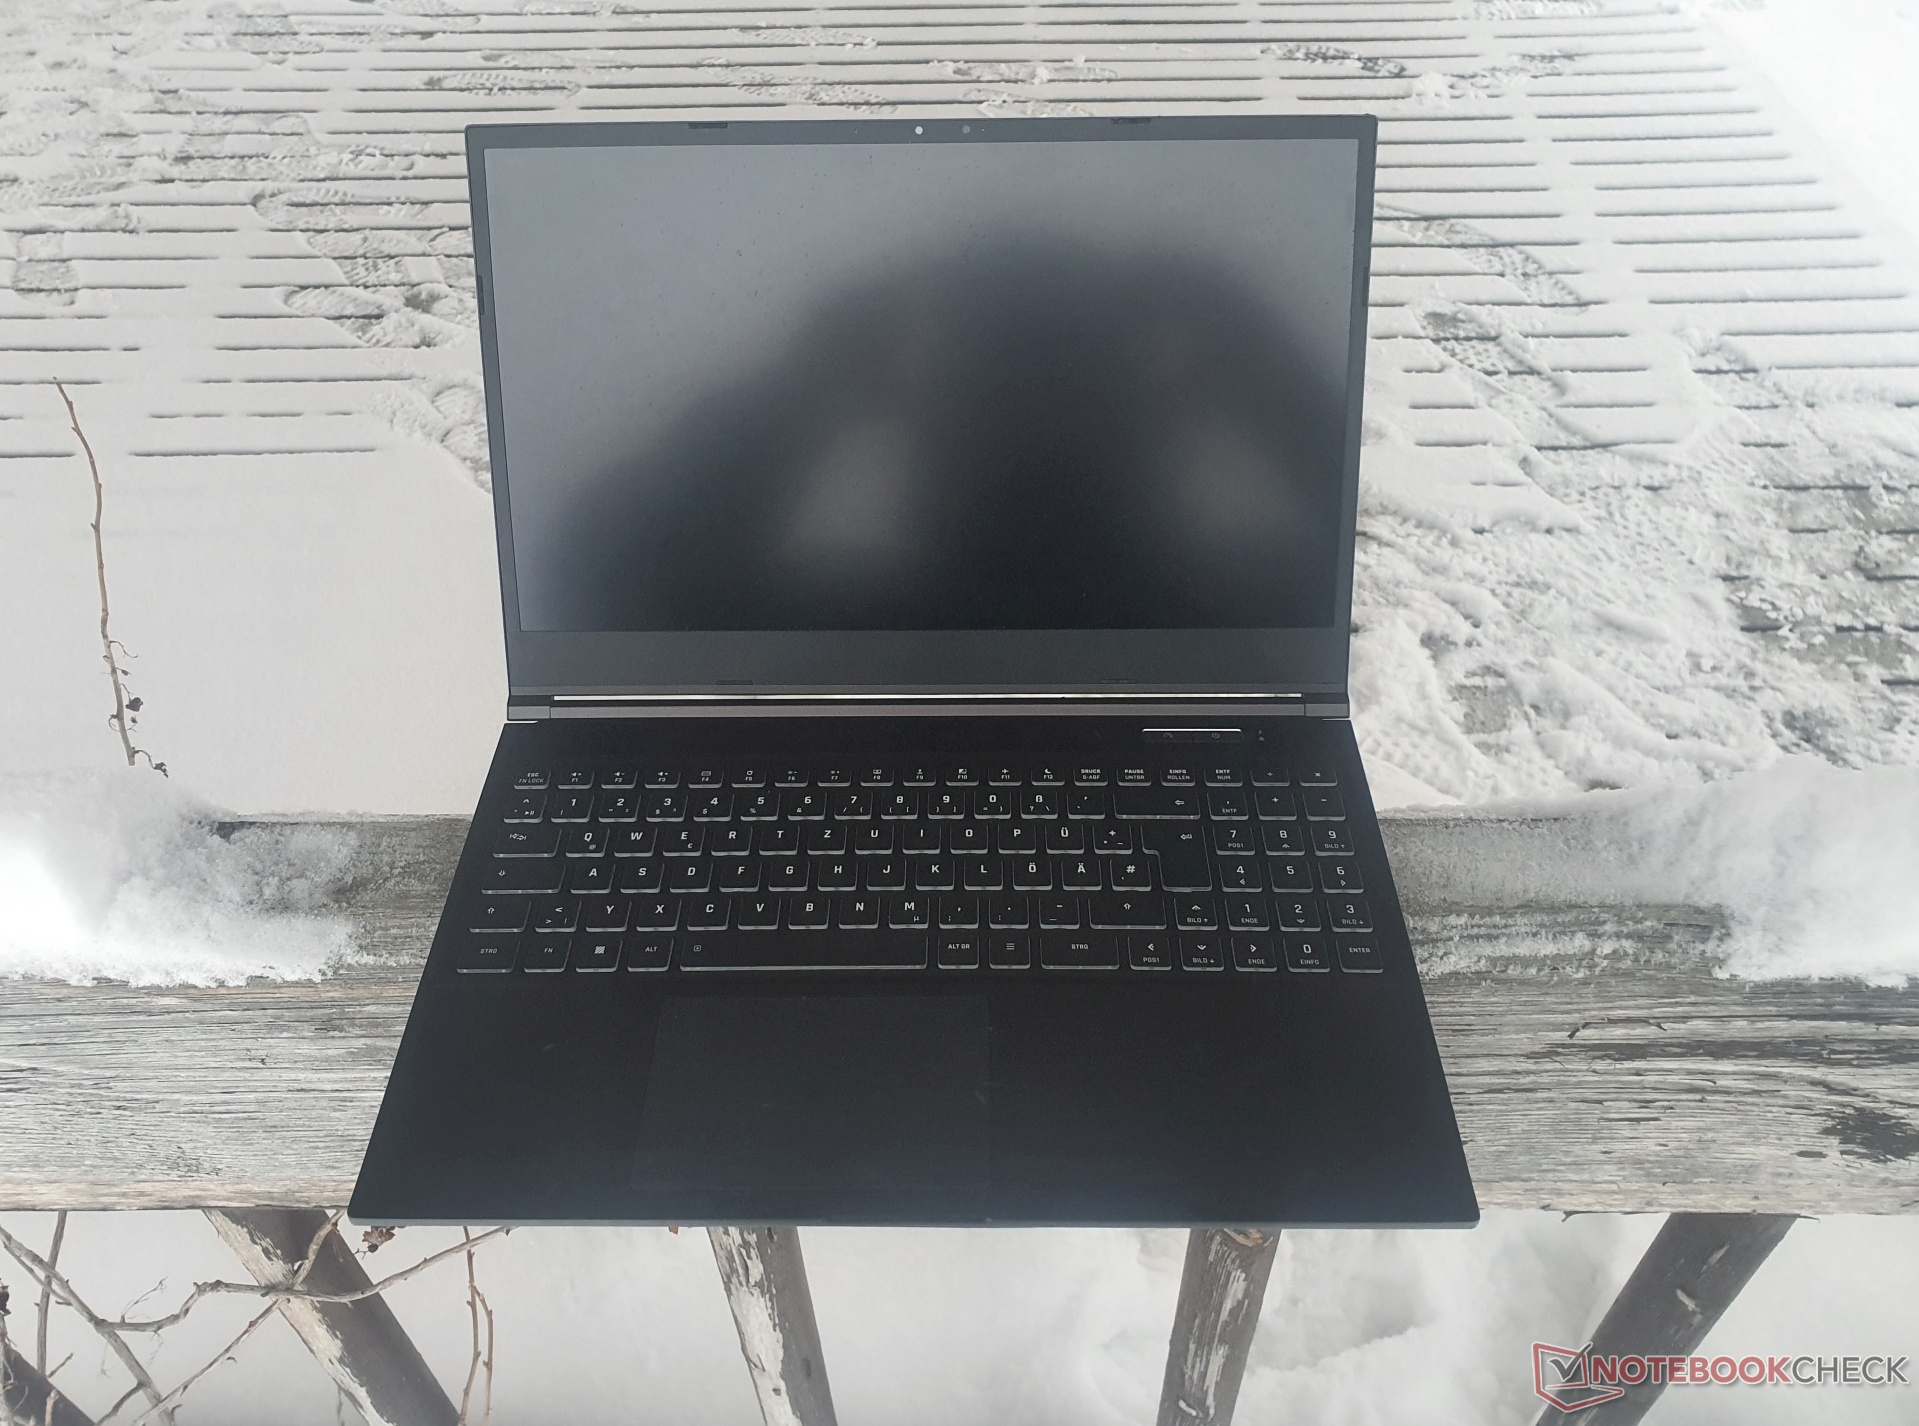
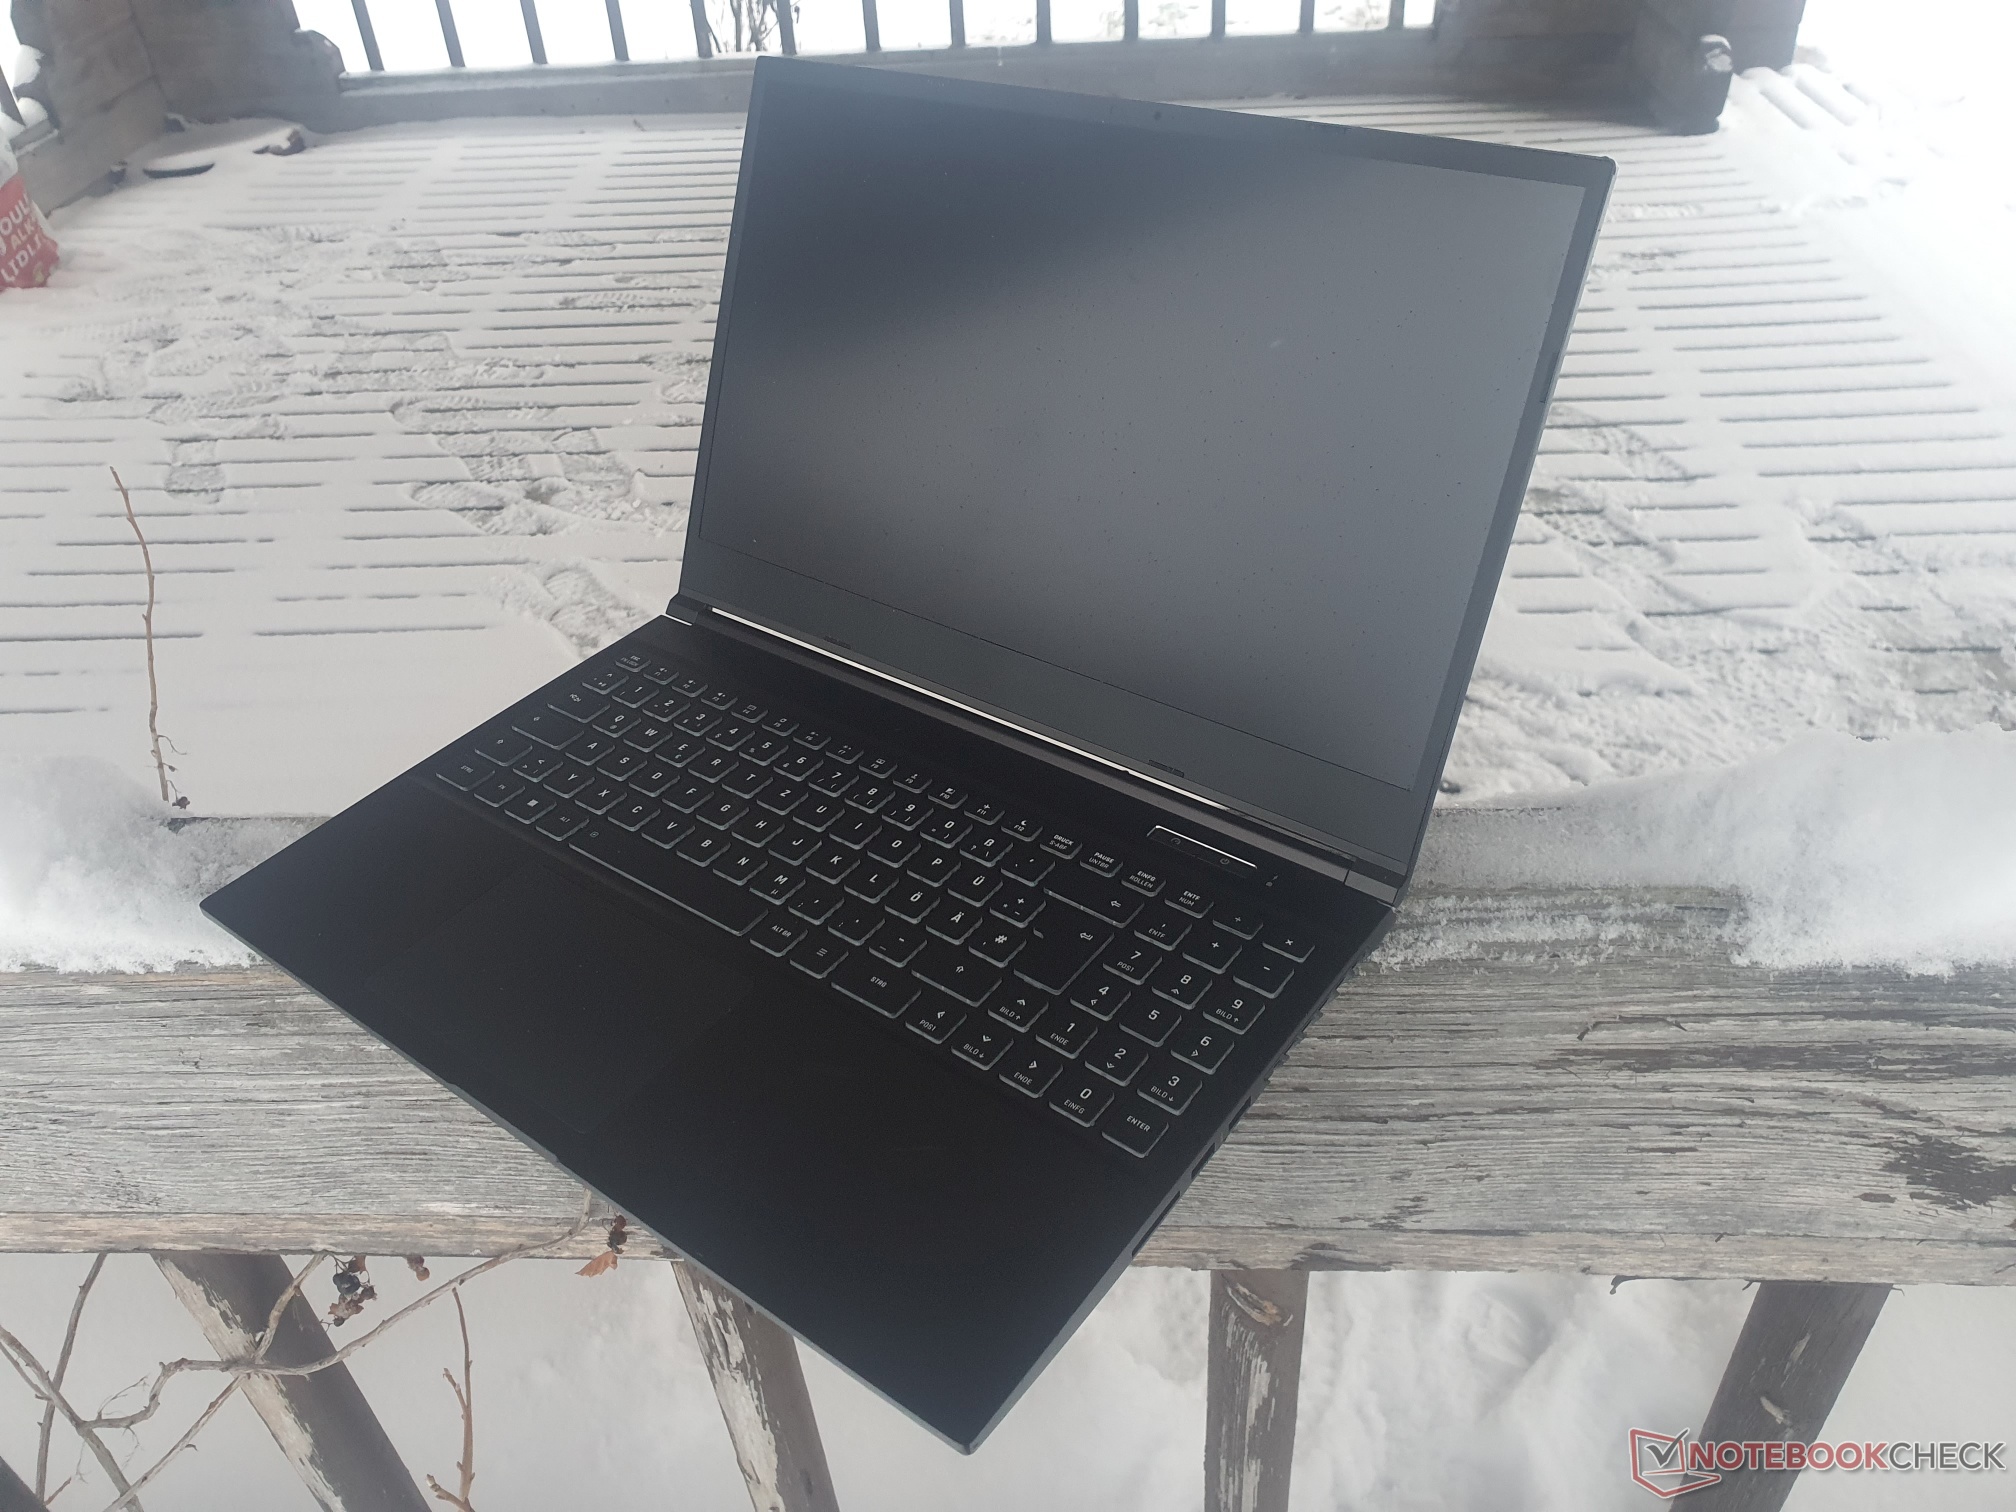
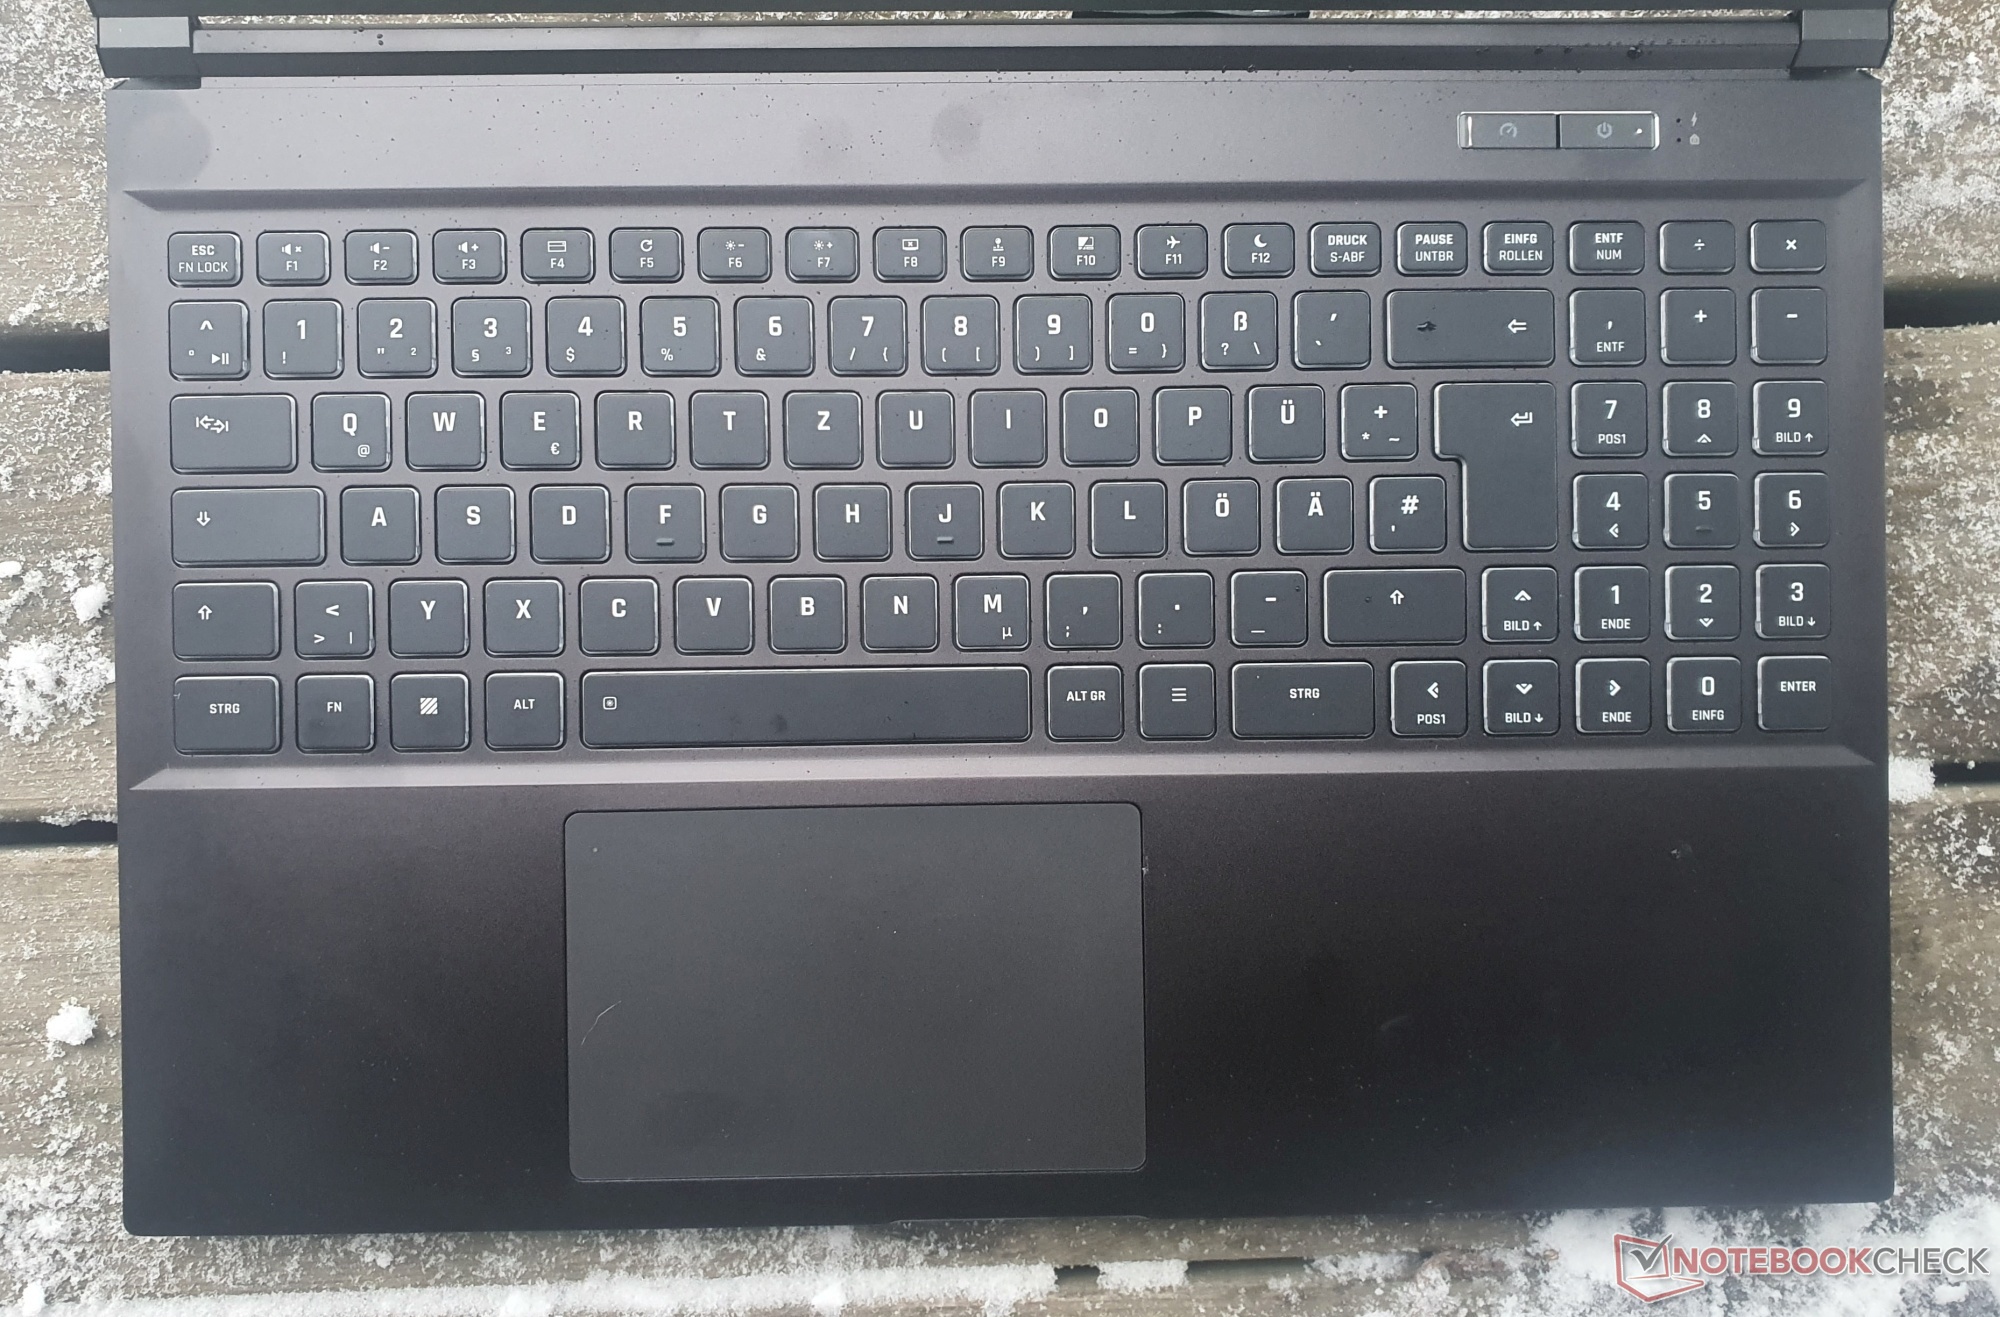
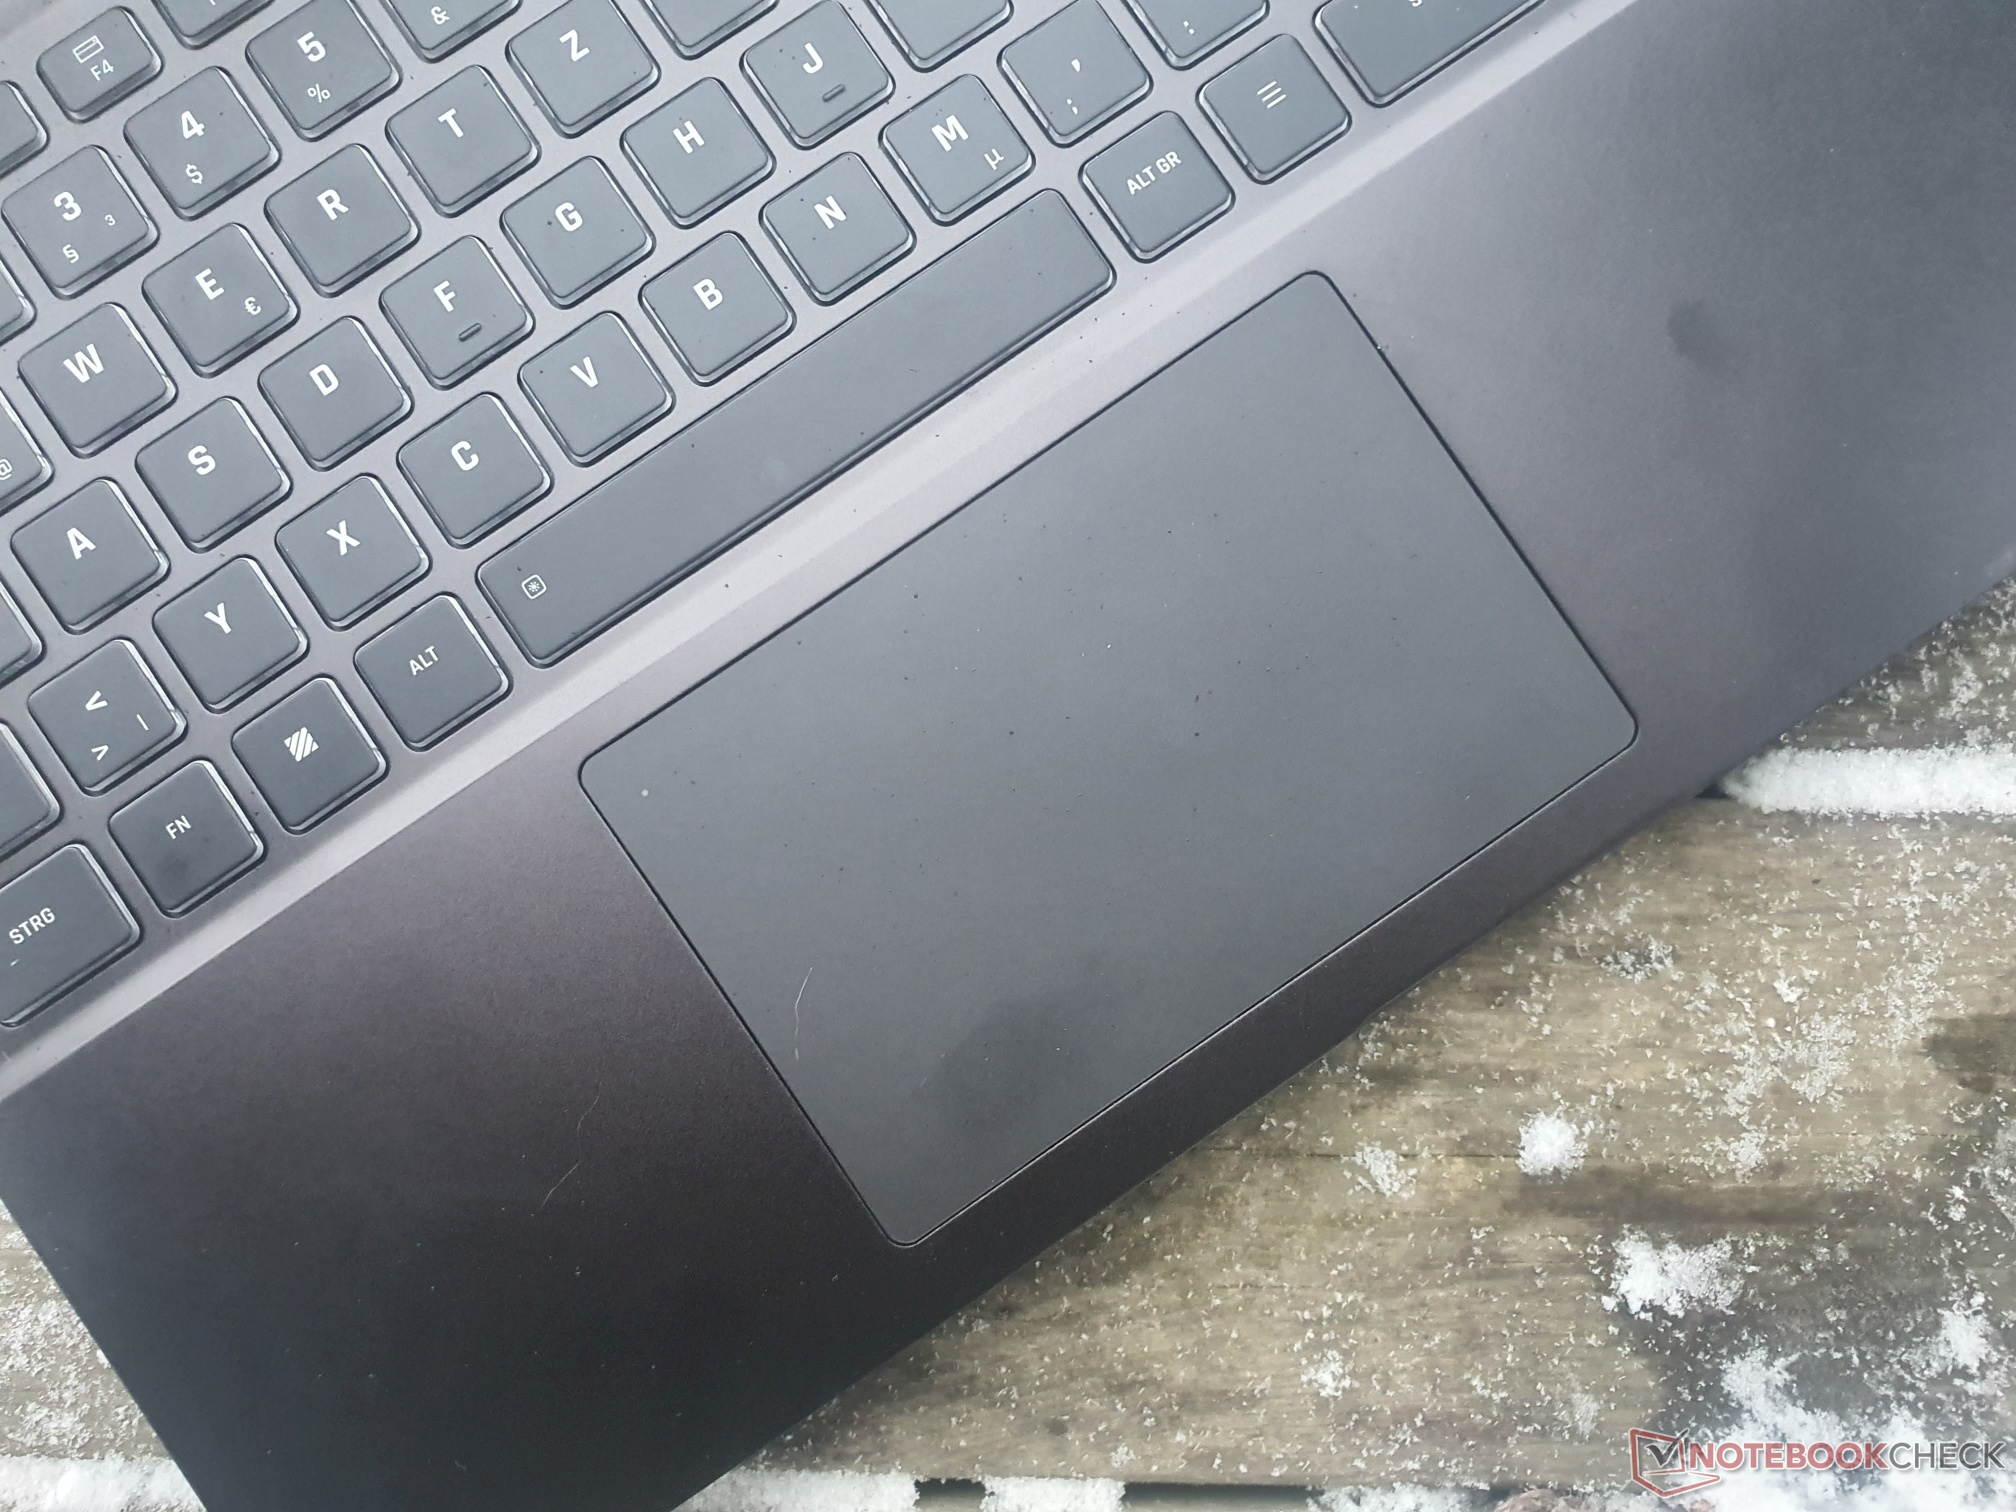
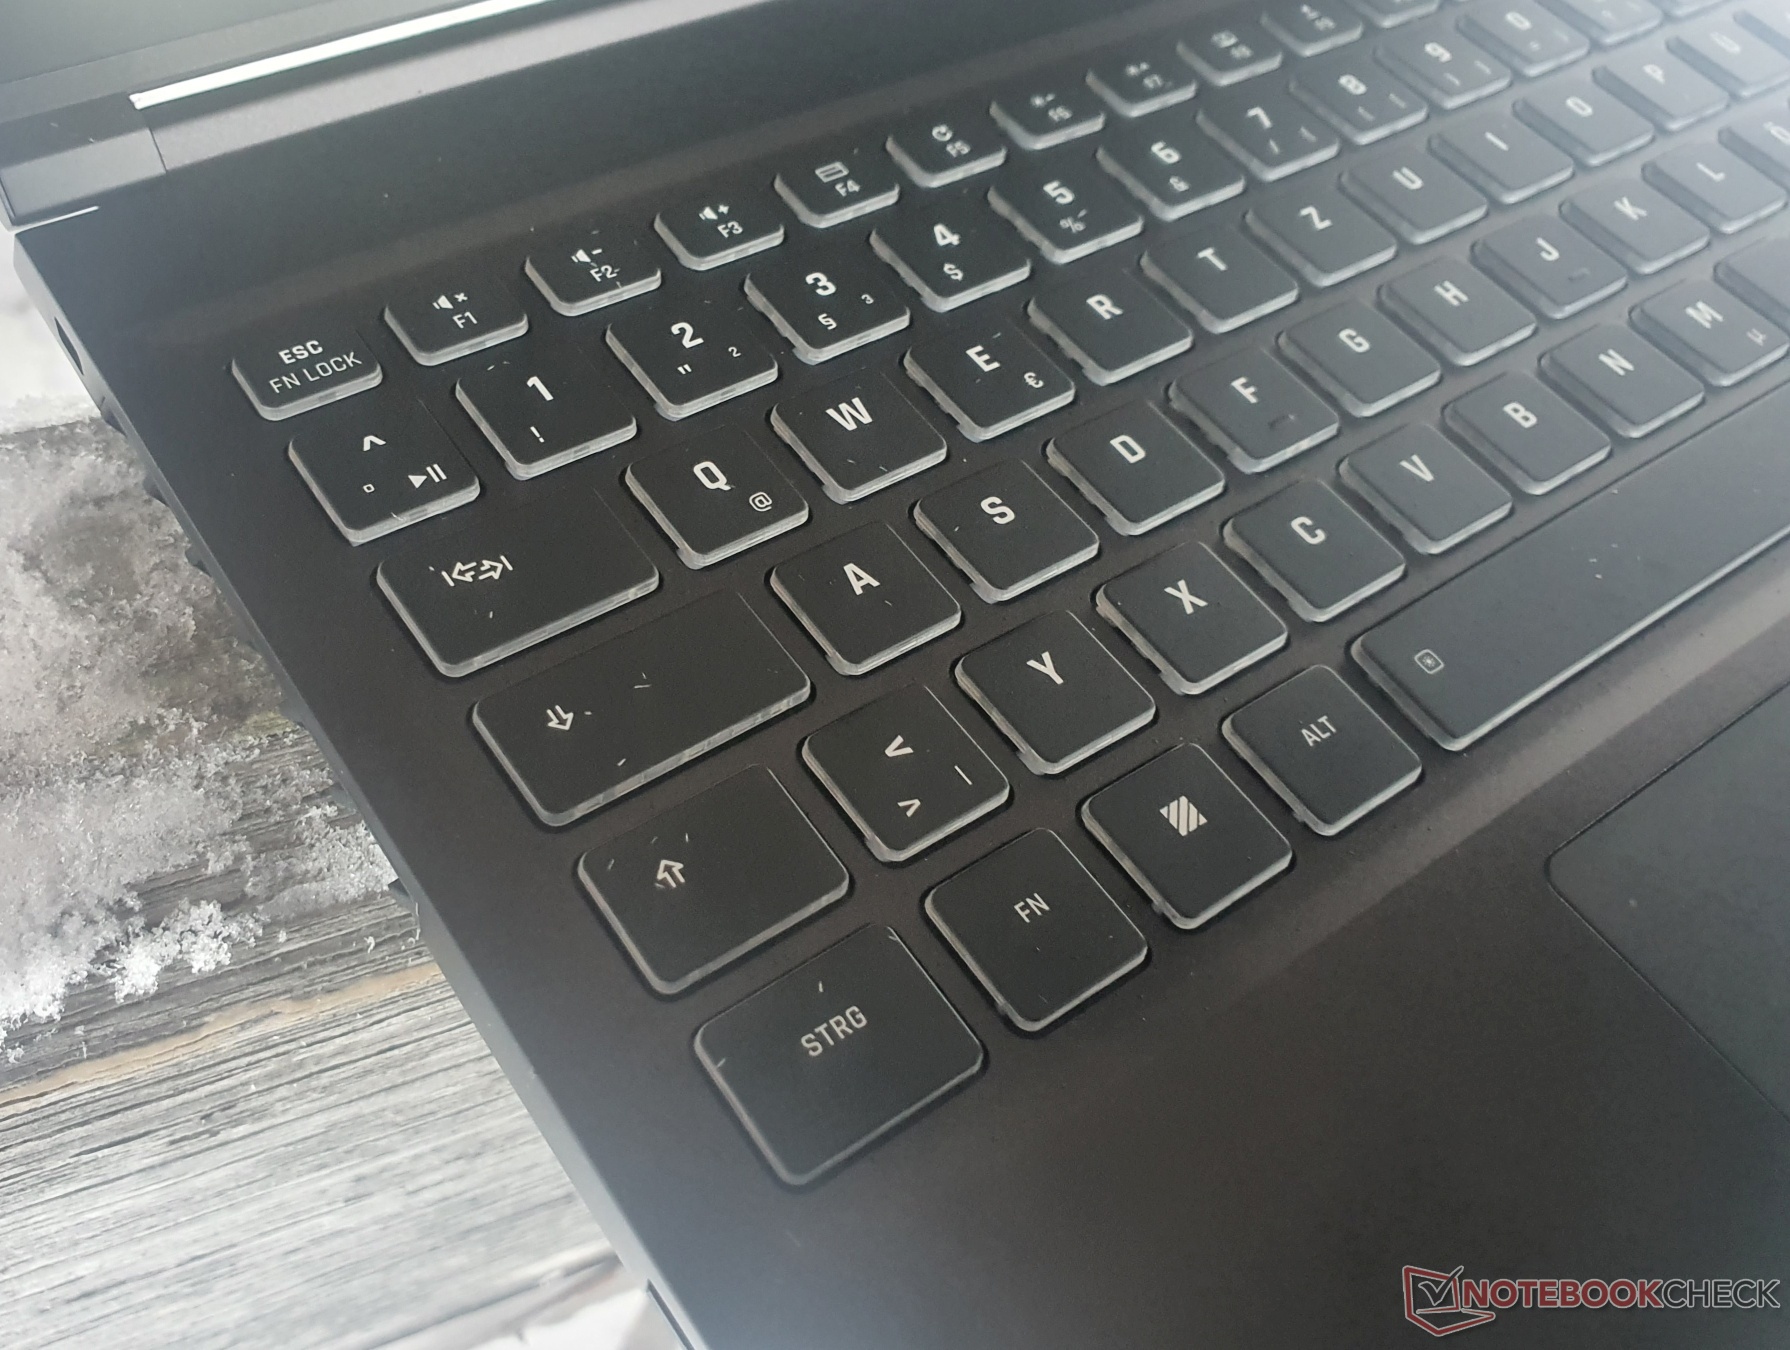
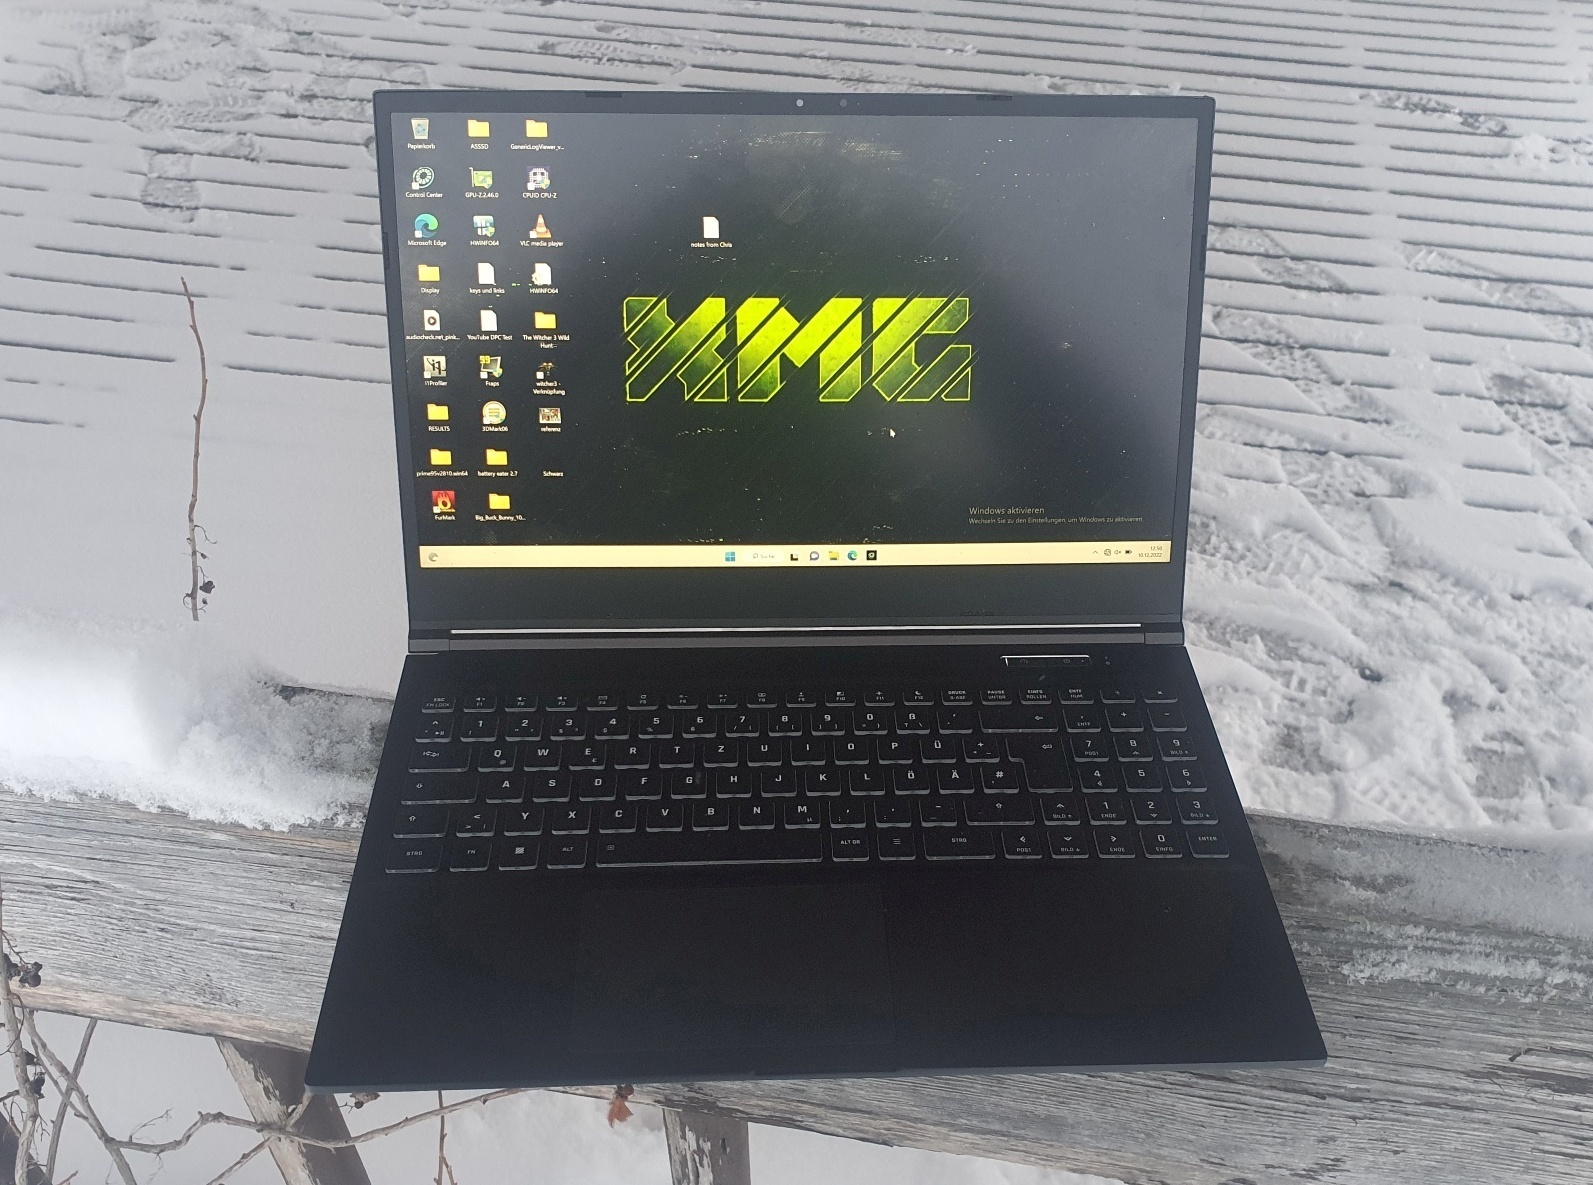
The Core 15's case has basically remained the same, so you can read about the details and the input devices in our Review of the predecessor model.
More Schenker reviews:
XMG Neo 15 (Ryzen 9 6900HX, RTX 3070 Ti, mech. keyboard, XMG Oasis)
XMG Neo 17 (Ryzen 9 6900HX, RTX 3080 Ti, mech. keyboard, XMG Oasis)
XMG Fusion 15 (Core i7-11800H, RTX 3070, mech. keyboard)
XMG Pro 15 (Core i7-12700H, RTX 3080 Ti)
XMG Pro 17 (Core i9-12900H, RTX 3080 Ti)
XMG Apex 15 Max (Ryzen 9 5900X desktop CPU, RTX 3070)
Possible competitors in comparison
Rating | Date | Model | Weight | Height | Size | Resolution | Price |
|---|---|---|---|---|---|---|---|
| 87.9 % v7 (old) | 01 / 2023 | SCHENKER XMG Core 15 (M22) R7 6800H, GeForce RTX 3060 Laptop GPU | 2.1 kg | 23 mm | 15.60" | 2560x1440 | |
| 87.5 % v7 (old) | 11 / 2022 | Lenovo Legion 5 15IAH7H 82RB i7-12700H, GeForce RTX 3060 Laptop GPU | 2.4 kg | 19.99 mm | 15.60" | 1920x1080 | |
| 87.4 % v7 (old) | 08 / 2022 | SCHENKER XMG Fusion 15 (Mid 22) i7-11800H, GeForce RTX 3070 Laptop GPU | 1.9 kg | 21.65 mm | 15.60" | 2560x1440 | |
| 87.2 % v7 (old) | 03 / 2022 | Asus TUF Gaming F15 FX507ZM i7-12700H, GeForce RTX 3060 Laptop GPU | 2.1 kg | 24.95 mm | 15.60" | 1920x1080 | |
| 84.7 % v7 (old) | 06 / 2021 | Alienware m15 R5 Ryzen Edition R7 5800H, GeForce RTX 3060 Laptop GPU | 2.5 kg | 22.85 mm | 15.60" | 1920x1080 | |
| 84.9 % v7 (old) | 03 / 2021 | SCHENKER XMG Core 15 Ampere R7 4800H, GeForce RTX 3060 Laptop GPU | 2 kg | 22.9 mm | 15.60" | 2560x1440 |
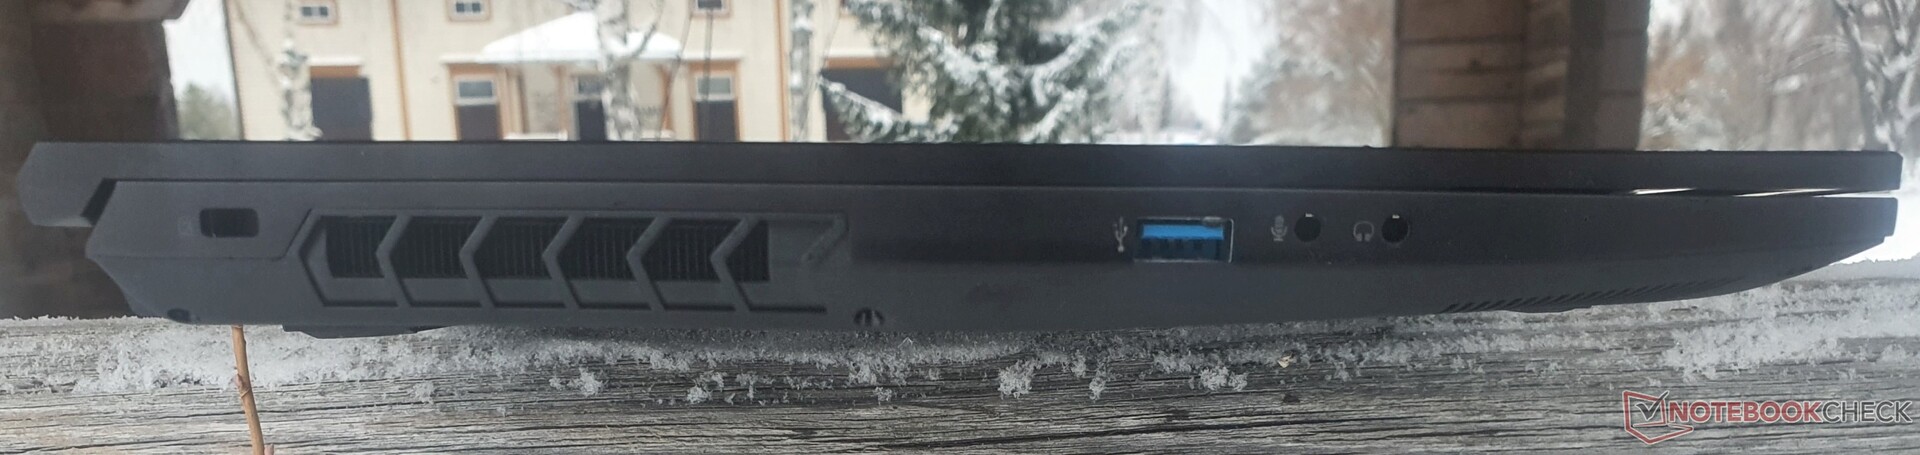
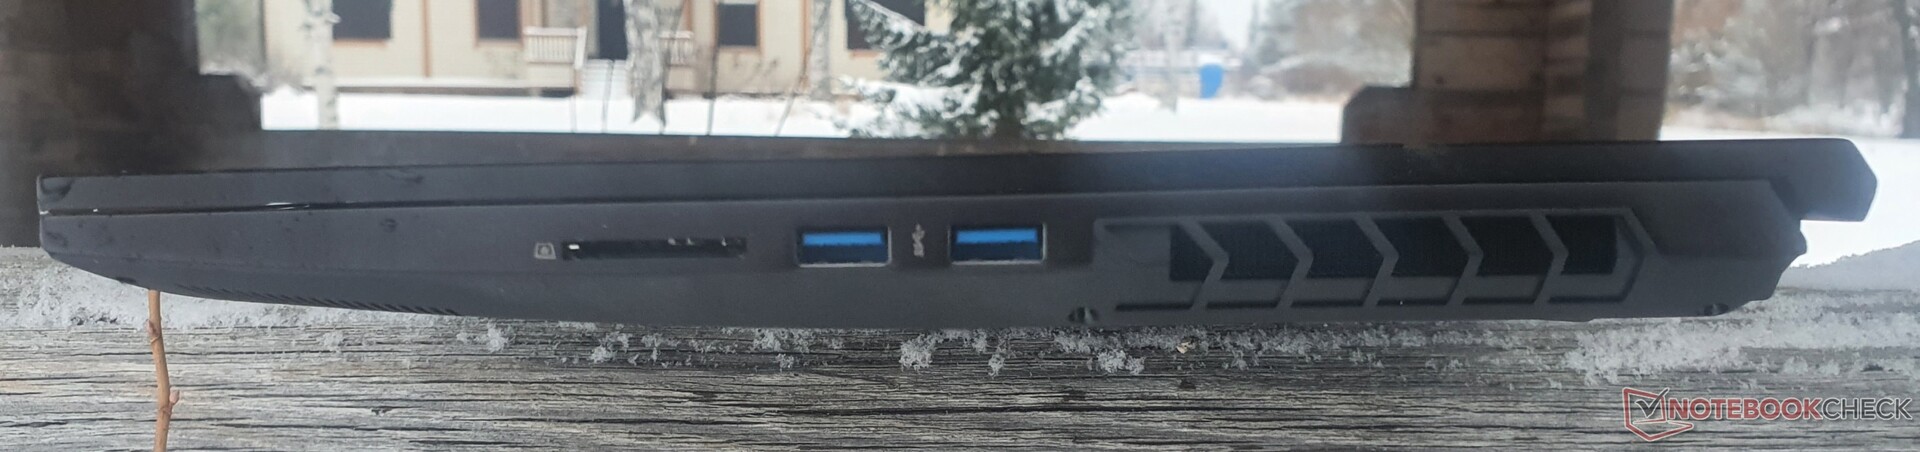
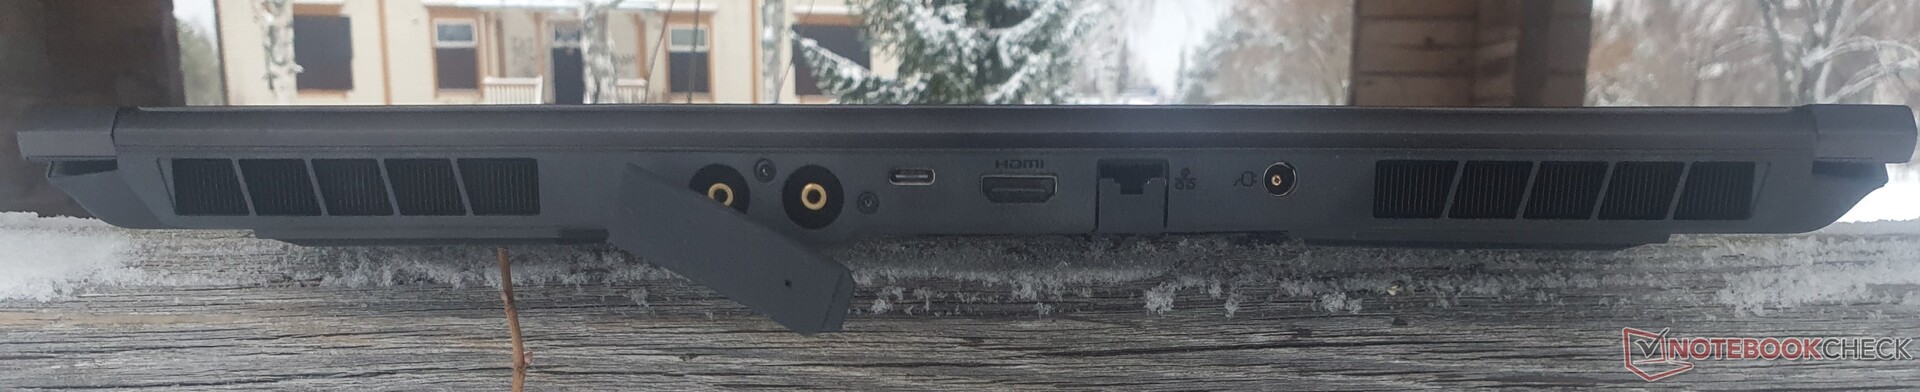
Features: water port, but no USB4 & USB-C-PD
Compared to the predecessor, the port for the external XMG Oasis water cooling is an interesting and useful innovation. The USB 2.0 port on the left side gives way to a faster USB-A 3.2 Gen2, while we still miss USB4 and charging via USB-C.
SD Card Reader
| SD Card Reader | |
| average JPG Copy Test (av. of 3 runs) | |
| Average of class Gaming (20 - 207, n=73, last 2 years) | |
| SCHENKER XMG Core 15 Ampere (Toshiba Exceria Pro SDXC 64 GB UHS-II) | |
| SCHENKER XMG Apex 15 Max (AV PRO microSD 128 GB V60) | |
| SCHENKER XMG Fusion 15 (Mid 22) (AV PRO microSD 128 GB V60) | |
| SCHENKER XMG Core 15 (M22) (AV PRO microSD 128 GB V60) | |
| maximum AS SSD Seq Read Test (1GB) | |
| Average of class Gaming (25.8 - 261, n=72, last 2 years) | |
| SCHENKER XMG Apex 15 Max (AV PRO microSD 128 GB V60) | |
| SCHENKER XMG Core 15 Ampere (Toshiba Exceria Pro SDXC 64 GB UHS-II) | |
| SCHENKER XMG Core 15 (M22) (AV PRO microSD 128 GB V60) | |
Communication

| Networking | |
| iperf3 receive AXE11000 6GHz | |
| Lenovo Legion 5 15IAH7H 82RB | |
| SCHENKER XMG Core 15 (M22) | |
| Average MediaTek RZ608 (430 - 961, n=16) | |
| iperf3 receive AXE11000 | |
| SCHENKER XMG Fusion 15 (Mid 22) | |
| Lenovo Legion 5 15IAH7H 82RB | |
| SCHENKER XMG Core 15 (M22) | |
| Average MediaTek RZ608 (430 - 975, n=20) | |
| iperf3 transmit AXE11000 6GHz | |
| Lenovo Legion 5 15IAH7H 82RB | |
| SCHENKER XMG Core 15 (M22) | |
| Average MediaTek RZ608 (572 - 980, n=16) | |
| iperf3 transmit AXE11000 | |
| Lenovo Legion 5 15IAH7H 82RB | |
| SCHENKER XMG Fusion 15 (Mid 22) | |
| SCHENKER XMG Core 15 (M22) | |
| Average MediaTek RZ608 (572 - 979, n=20) | |
| iperf3 receive AX12 | |
| Asus TUF Gaming F15 FX507ZM | |
| SCHENKER XMG Core 15 Ampere | |
| Alienware m15 R5 Ryzen Edition | |
| Average MediaTek RZ608 (837 - 880, n=2) | |
| iperf3 transmit AX12 | |
| SCHENKER XMG Core 15 Ampere | |
| Alienware m15 R5 Ryzen Edition | |
| Asus TUF Gaming F15 FX507ZM | |
| Average MediaTek RZ608 (657 - 821, n=2) | |

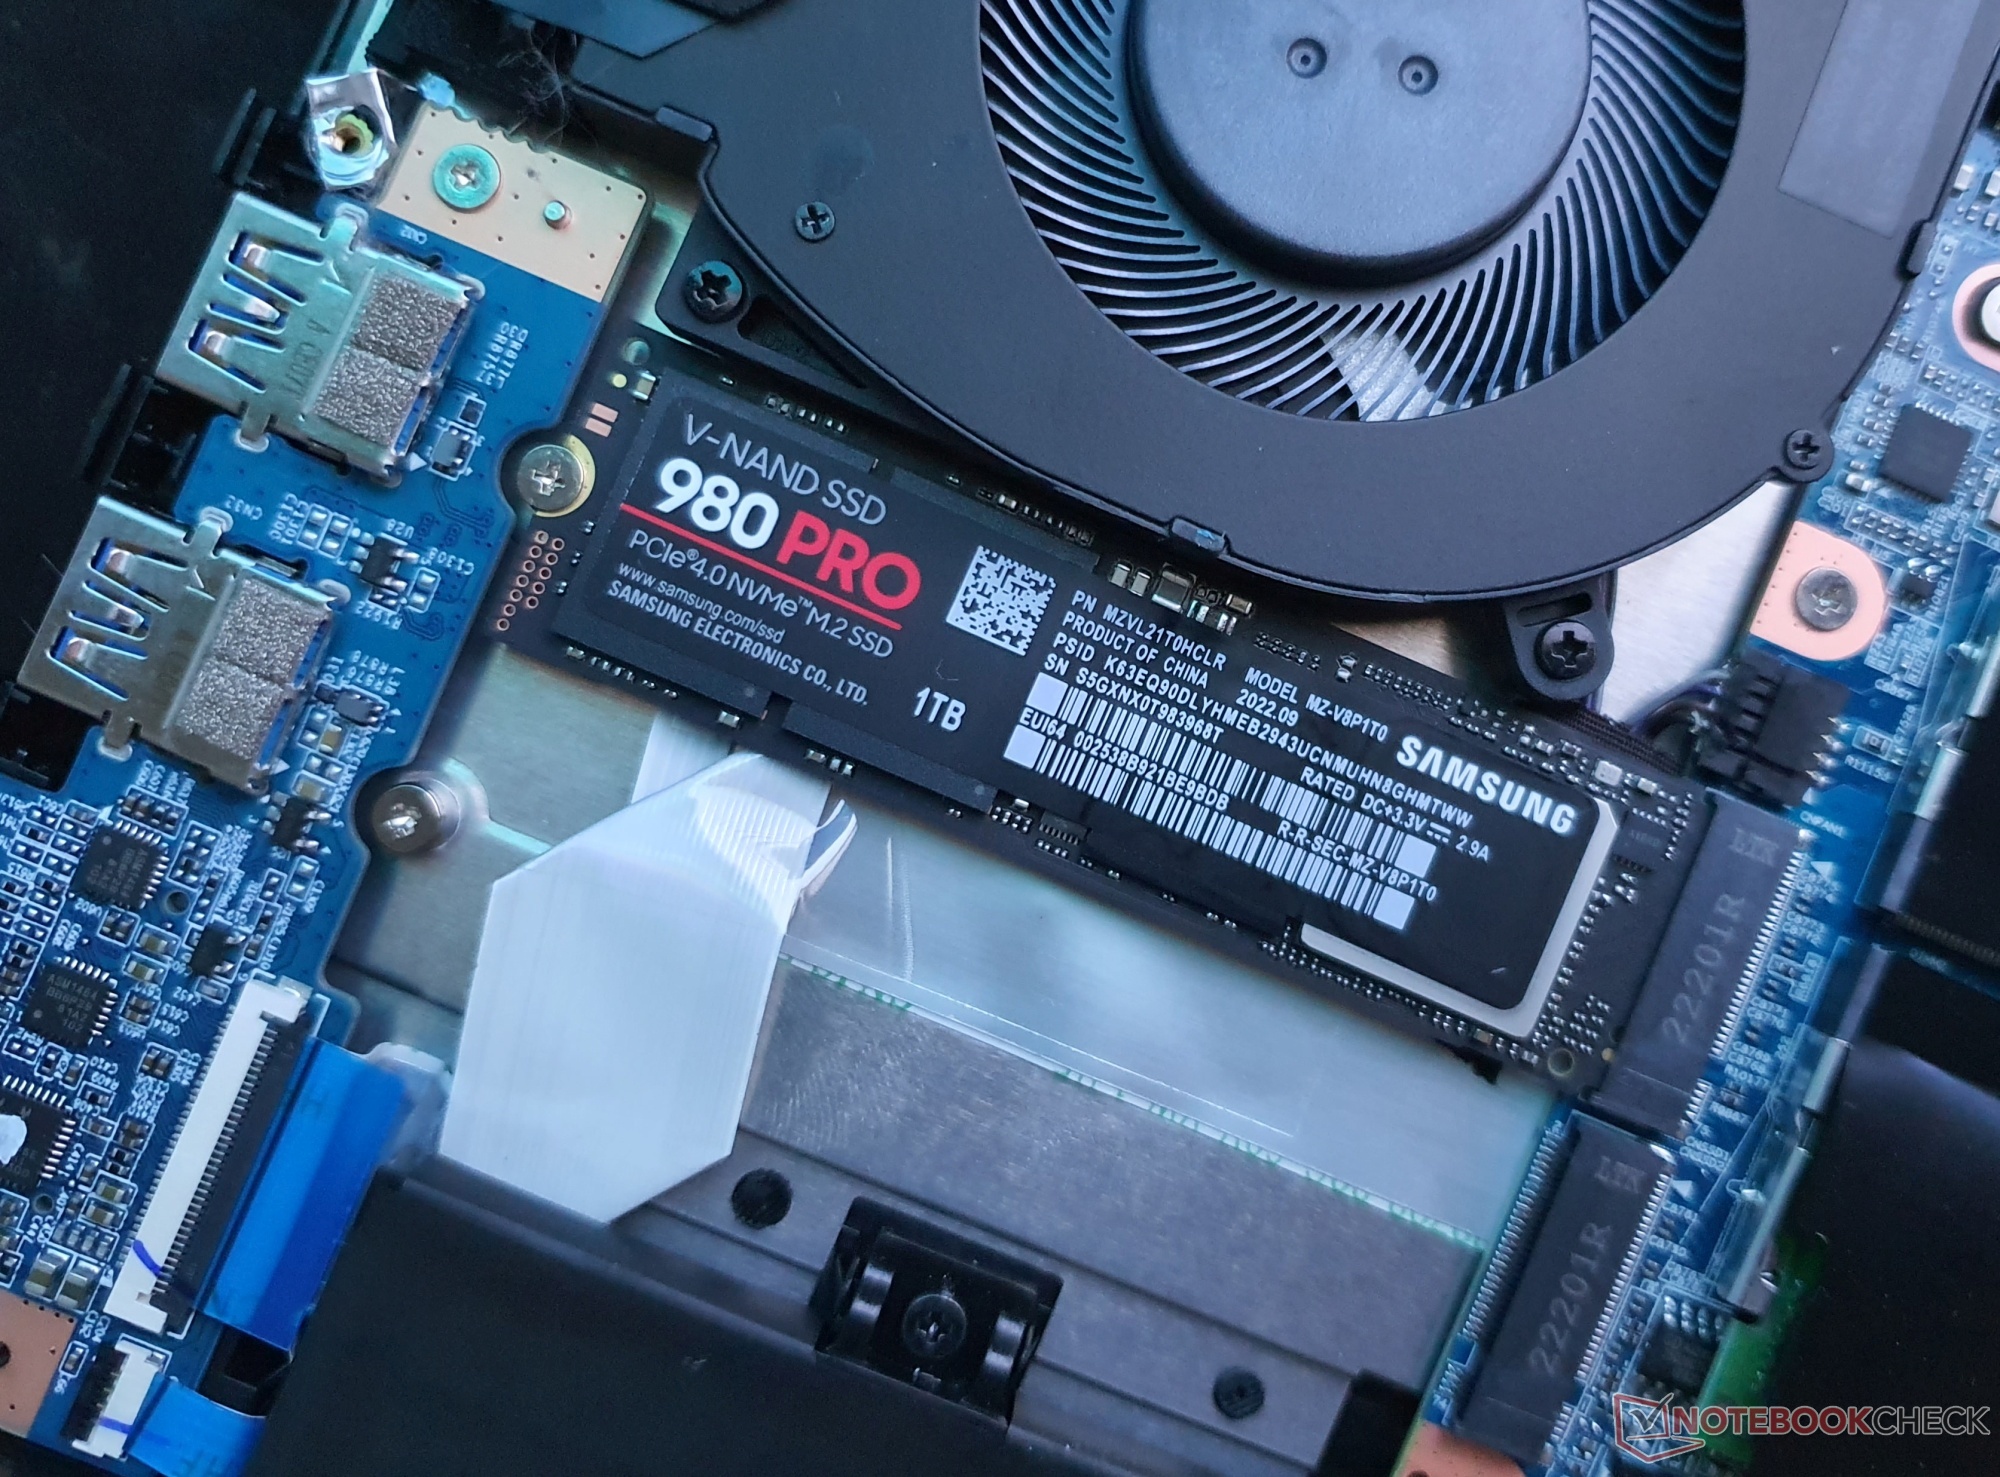
 GeForce RTX 3060 Laptop GPU, R7 6800H, Samsung SSD 980 Pro 1TB MZ-V8P1T0BW")
 GeForce RTX 3060 Laptop GPU, R7 6800H, Samsung SSD 980 Pro 1TB MZ-V8P1T0BW")
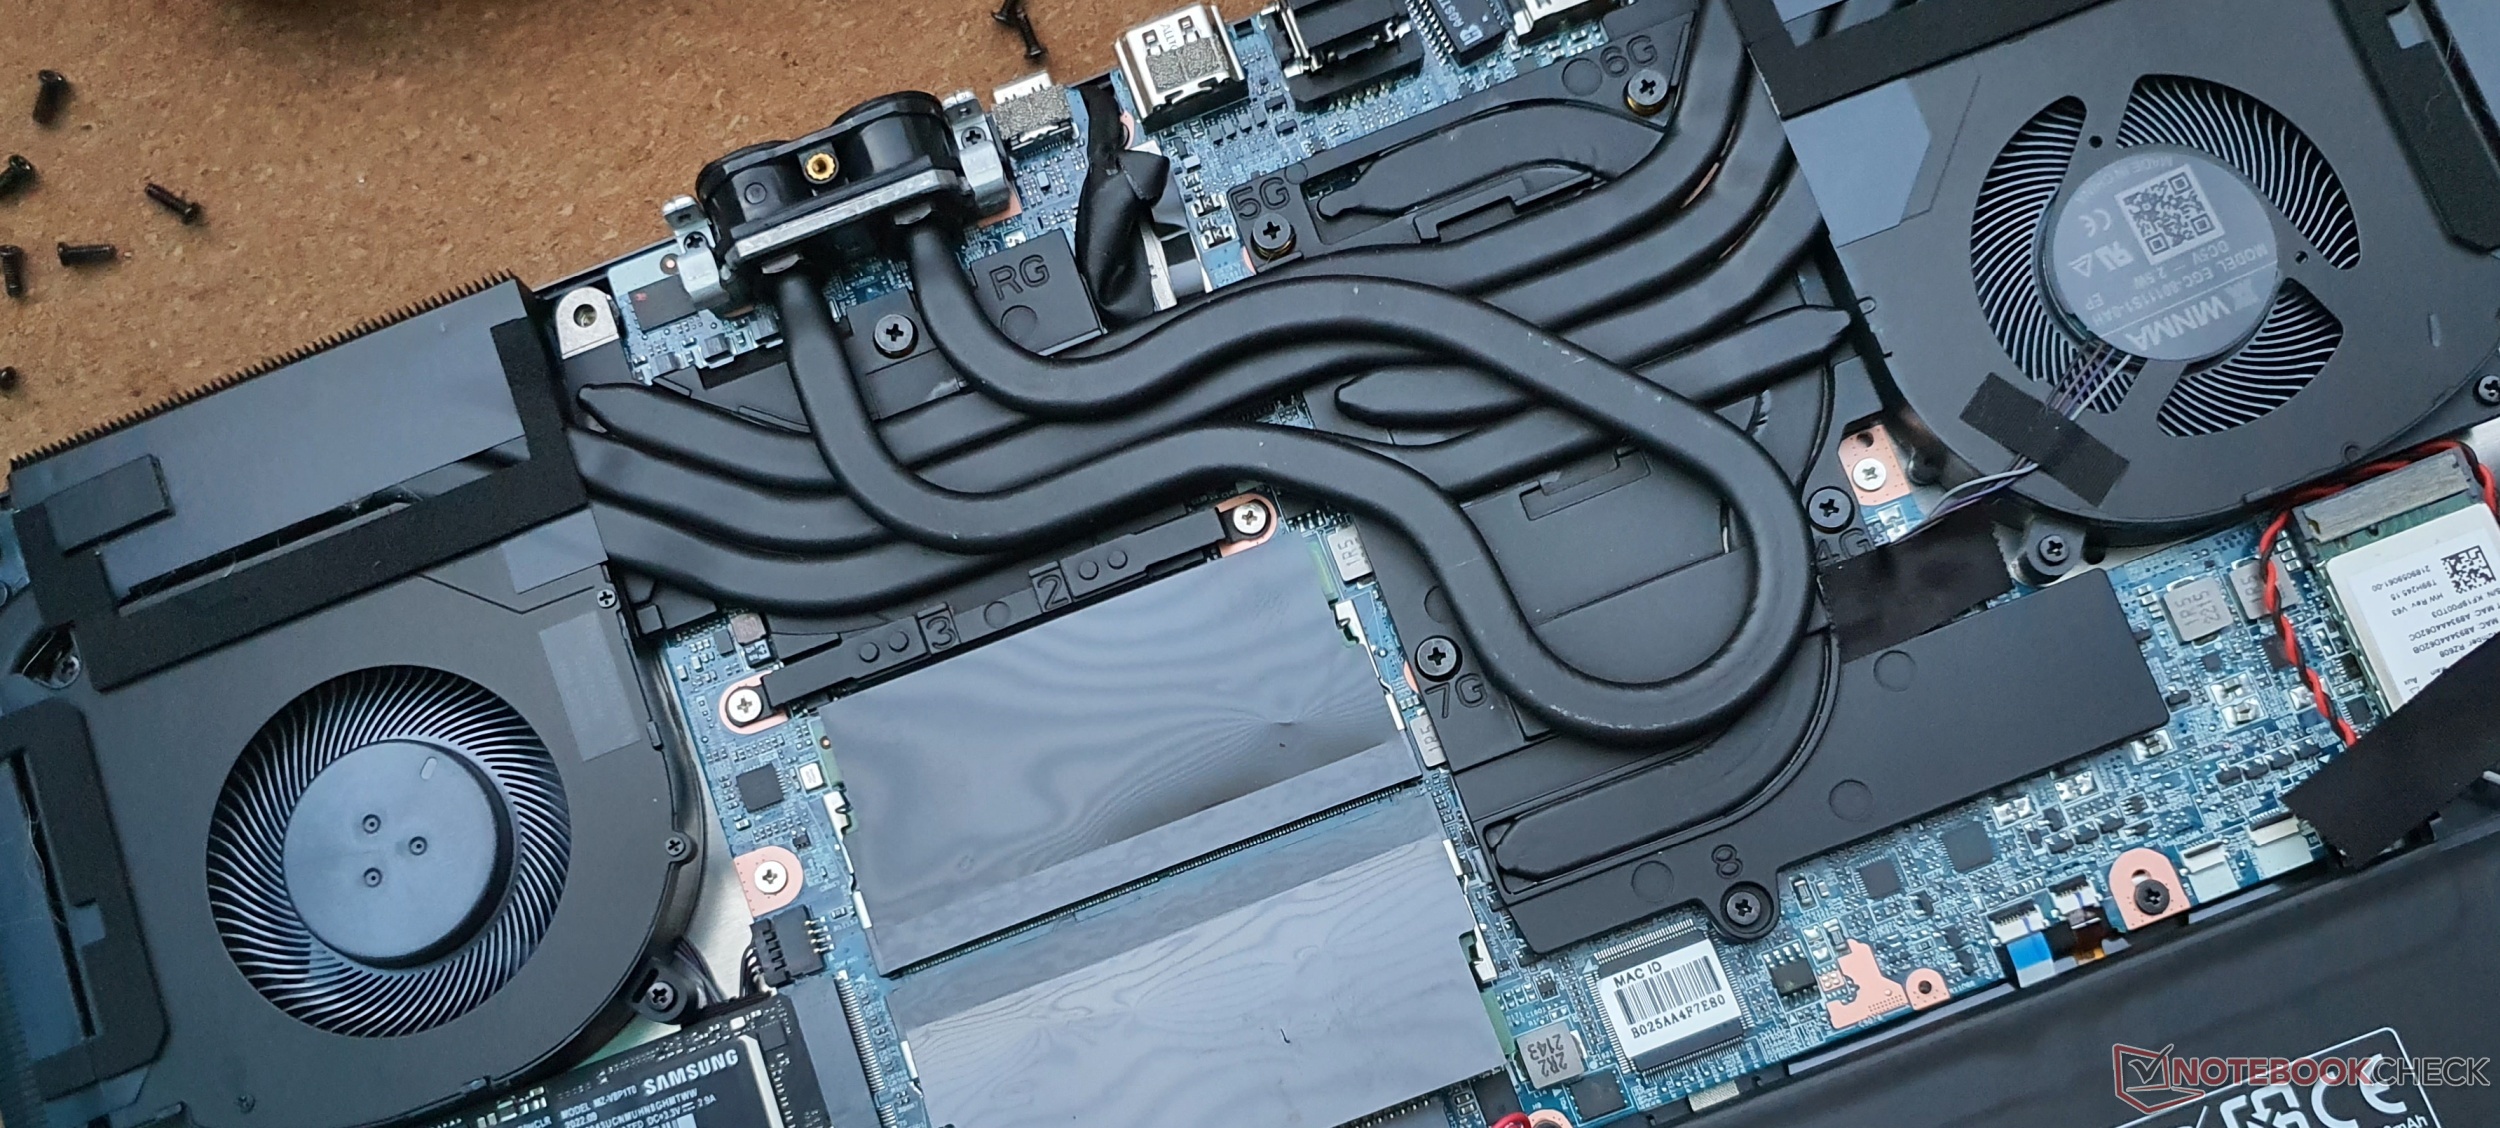
Maintenance
Display: WQHD 165 Hz with fast response times
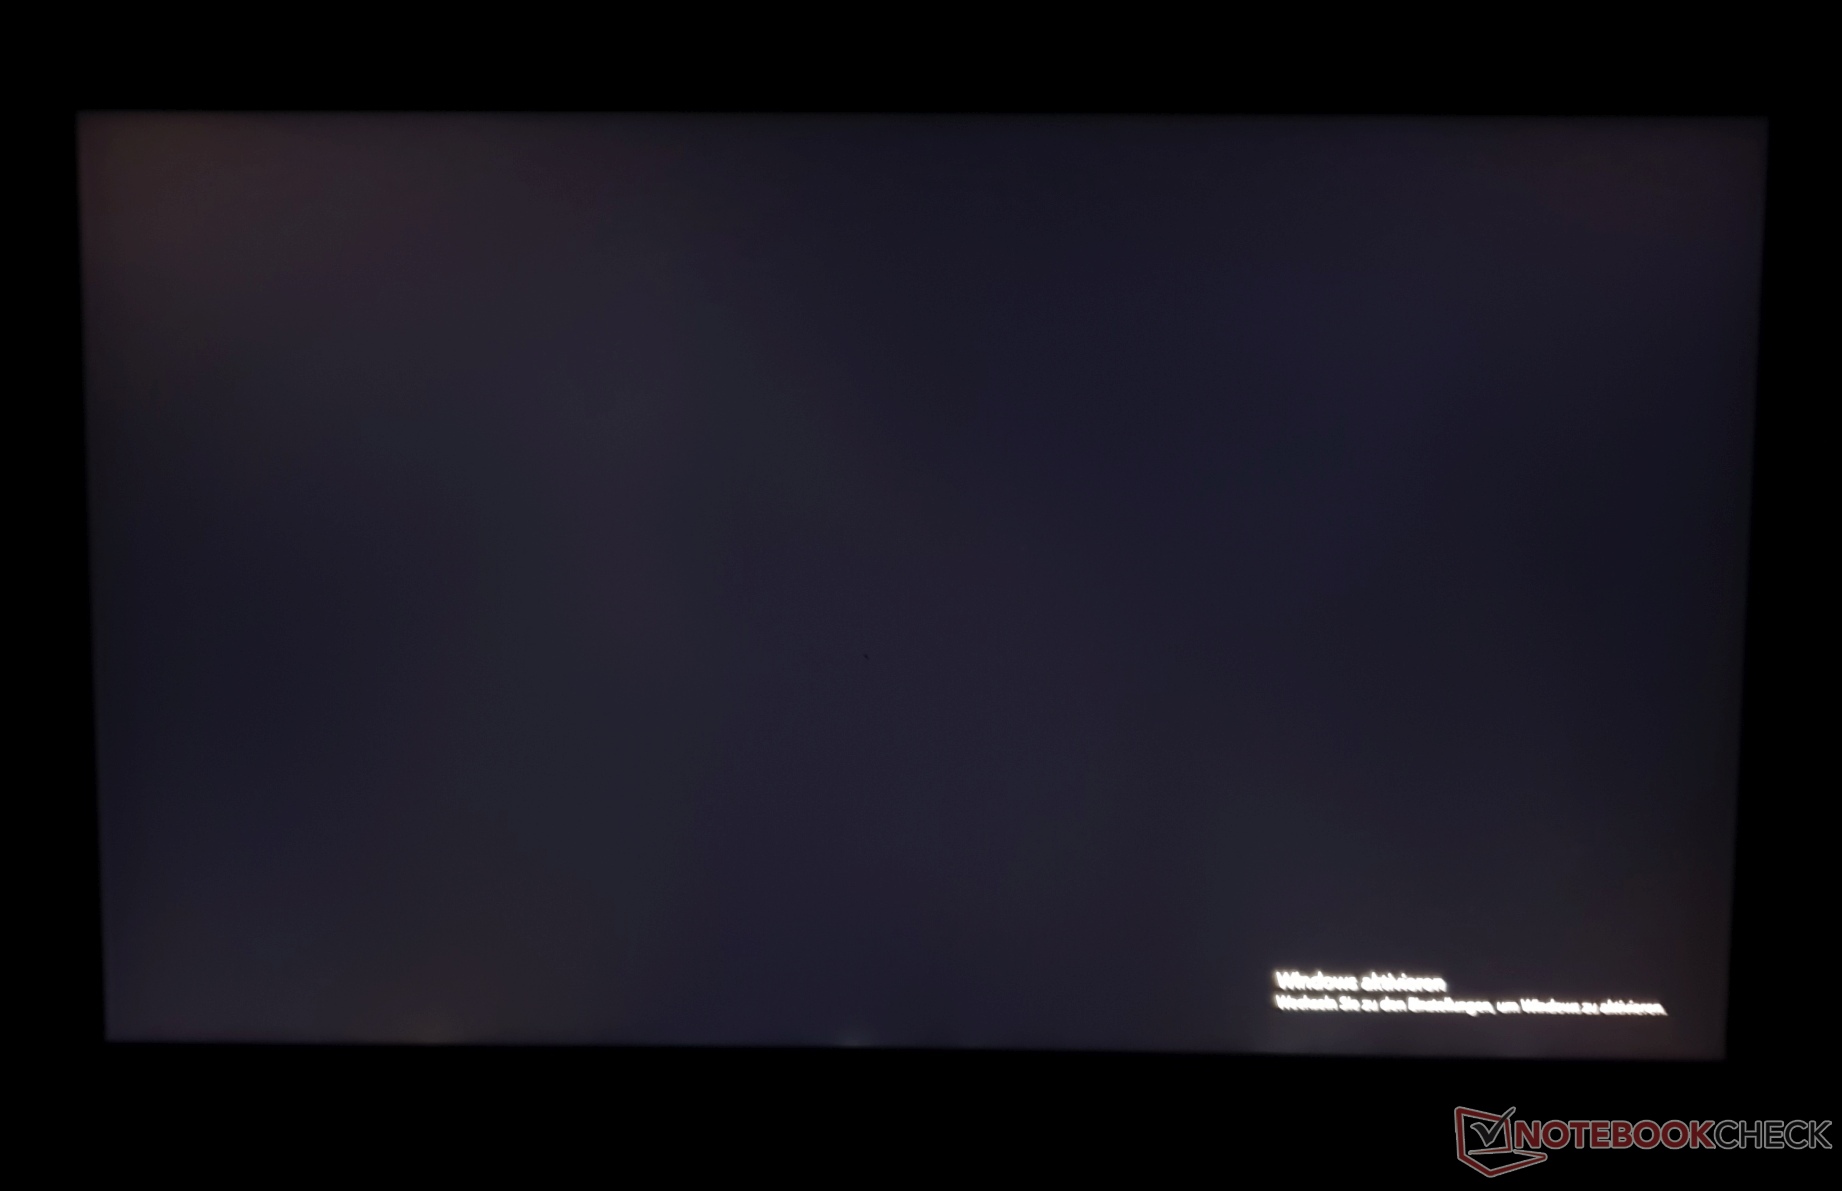
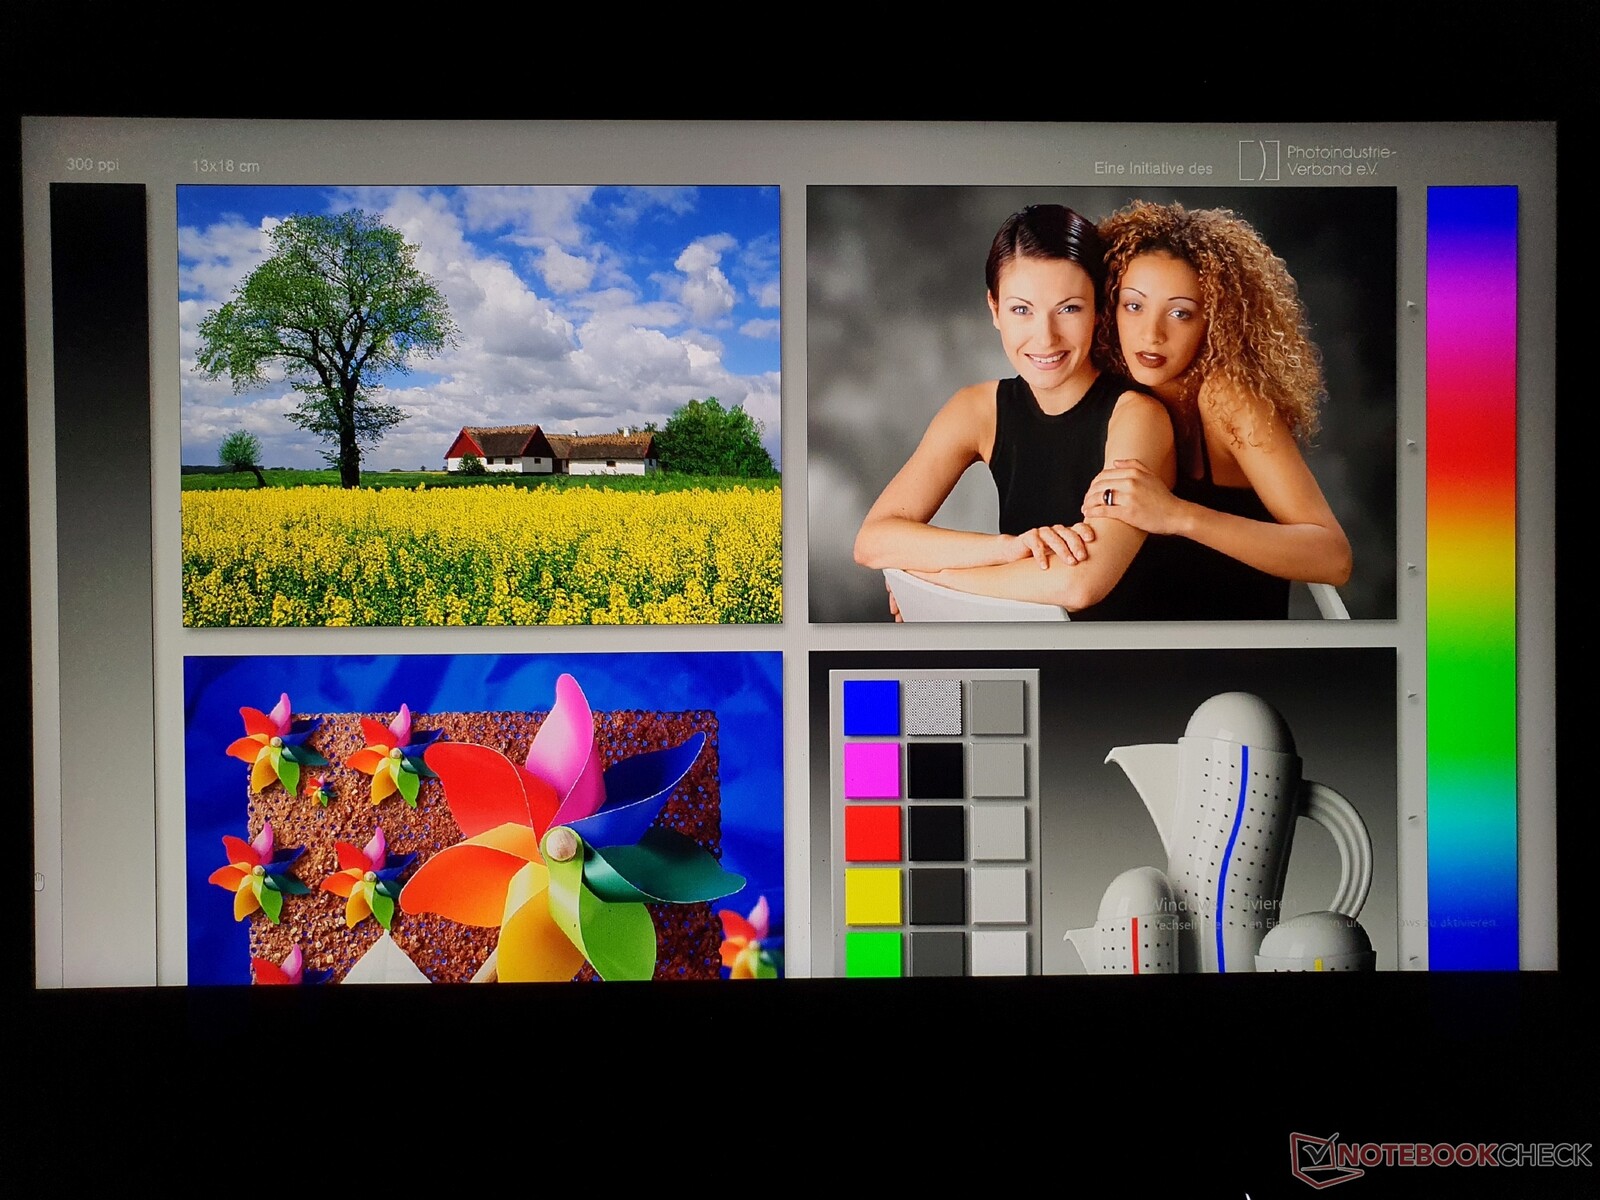
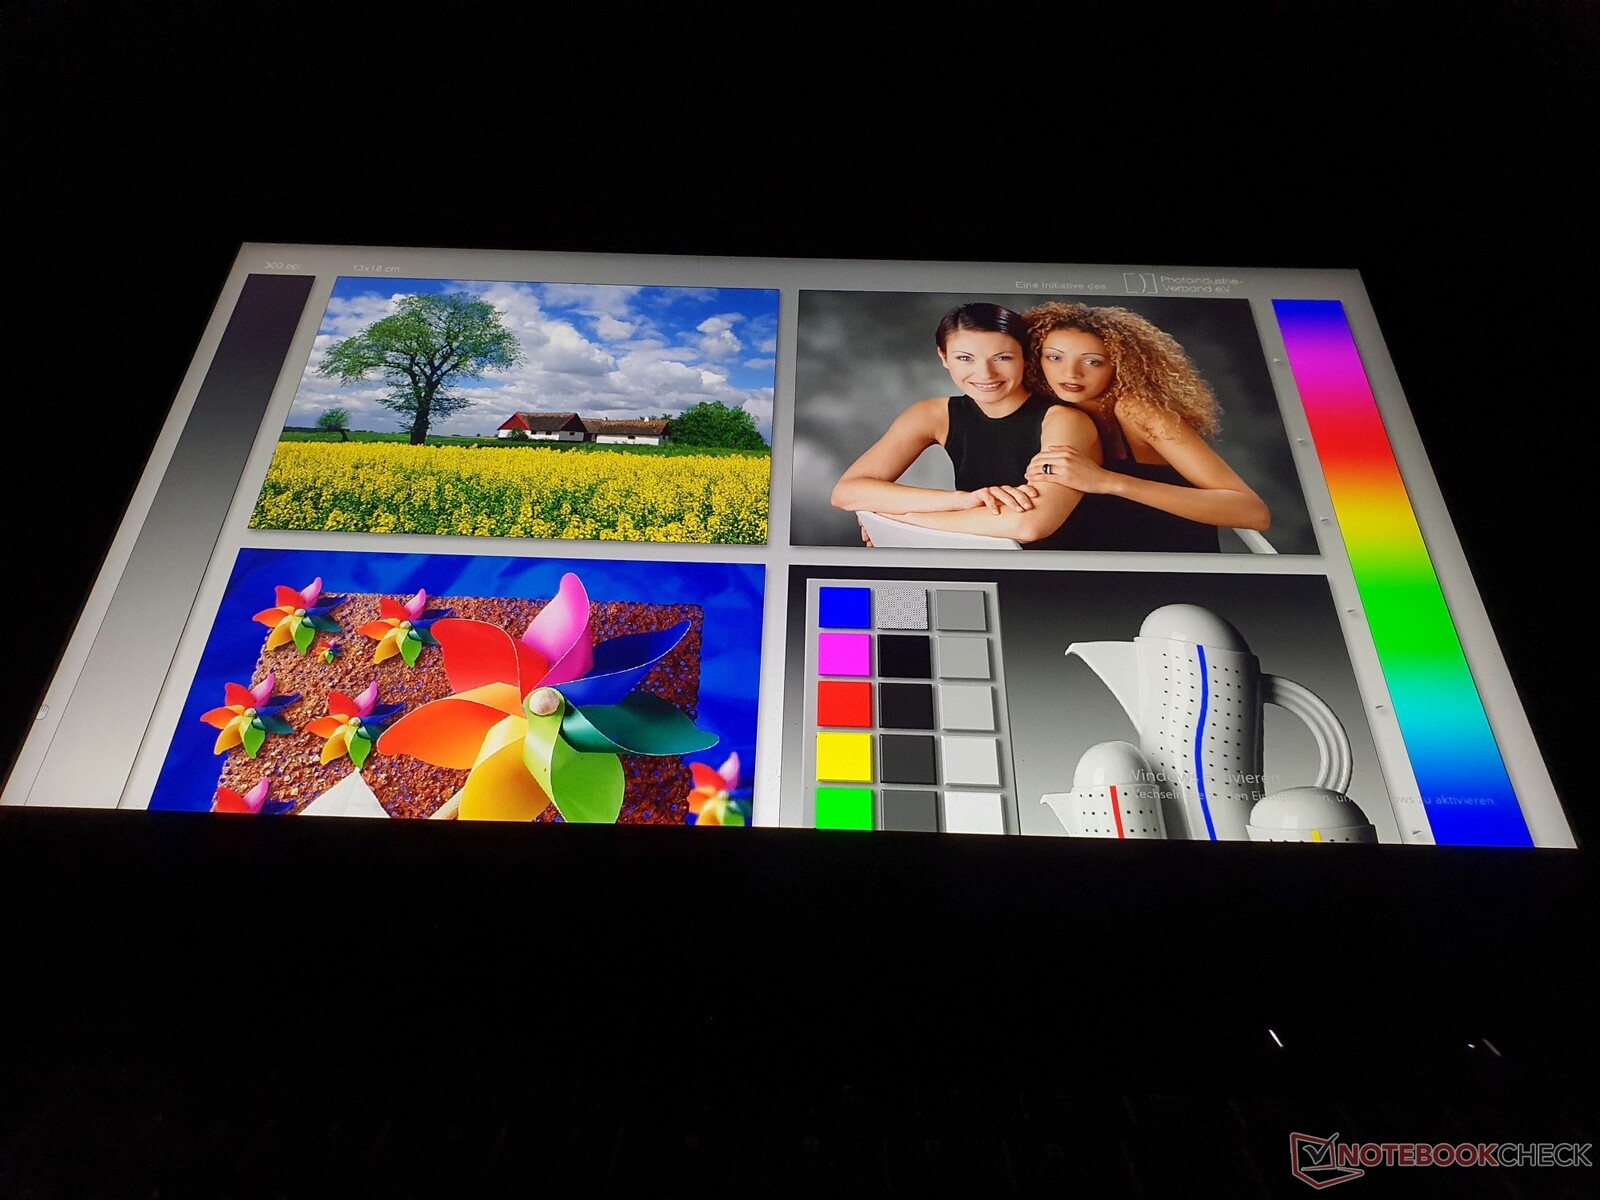
Schenker offers two display options for the XMG Core 15: FHD 144 Hz with 300 cd/m² and 90% sRGB as well as the WQHD panel (2,560 x 1,440) installed in the tested device with 165 Hz (83-165 Hz dynamic), specified 350 cd/m² and 95% sRGB. The brightness specification of the matte 16:9 display is exceeded with an average of 371 cd/m². The Legion 5 Pro is brighter with 500 cd/m², which is useful in outdoor use.
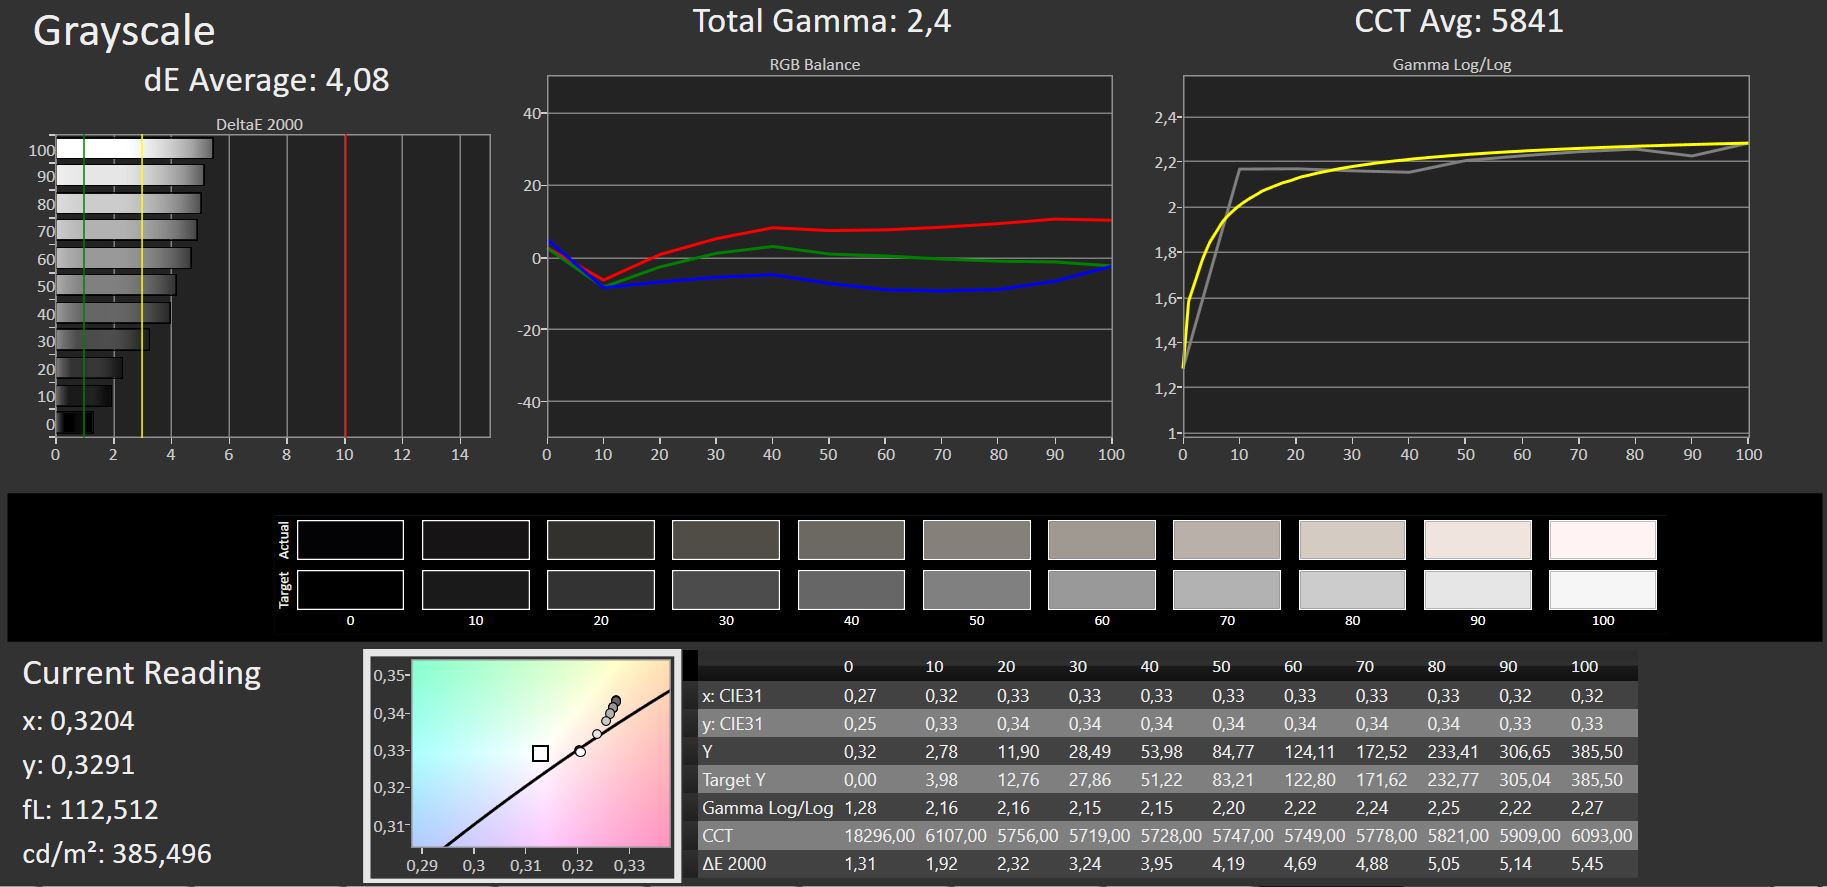
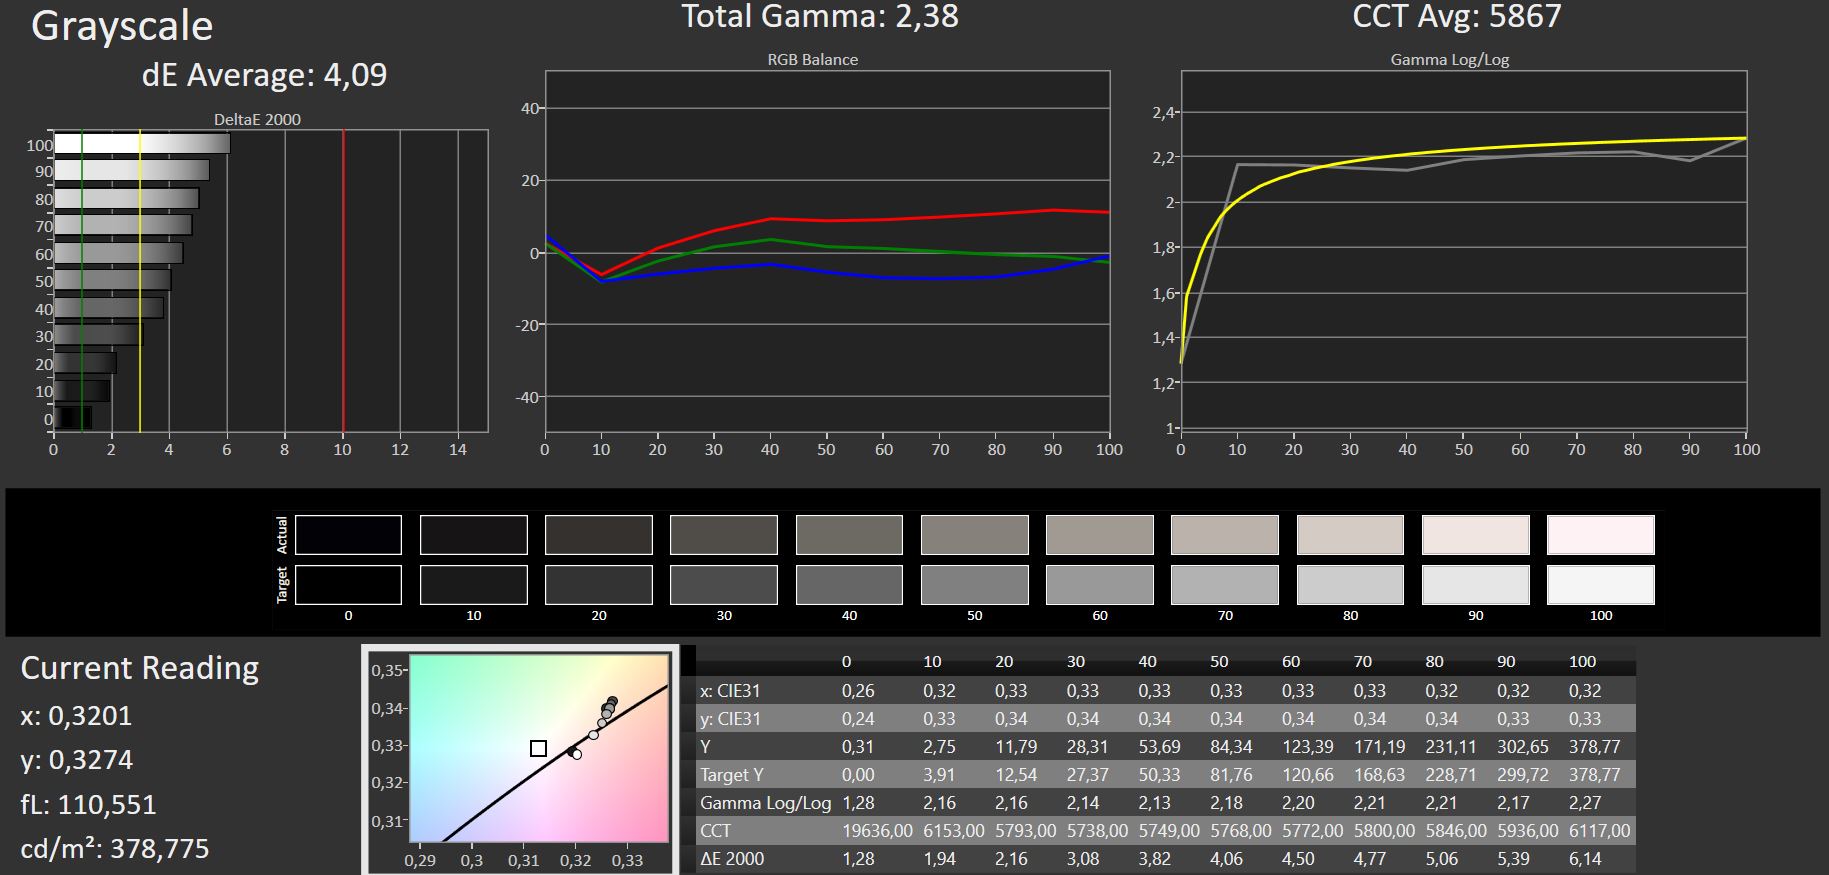
Contrast and black level are on a good level with 1,145:1 and 0.32 cd/m², respectively, while the illumination is pretty even. The white value of 5,841K is a bit away from the optimum (6,500K).
The response times are short to very short with 16 ms (GtG) as well as 7.6 ms (BtW), while only the Alienware m15 achieves a significant advantage in this area. We could not determine any PWM flickering.
| |||||||||||||||||||||||||
Brightness Distribution: 93 %
Center on Battery: 384 cd/m²
Contrast: 1145:1 (Black: 0.33 cd/m²)
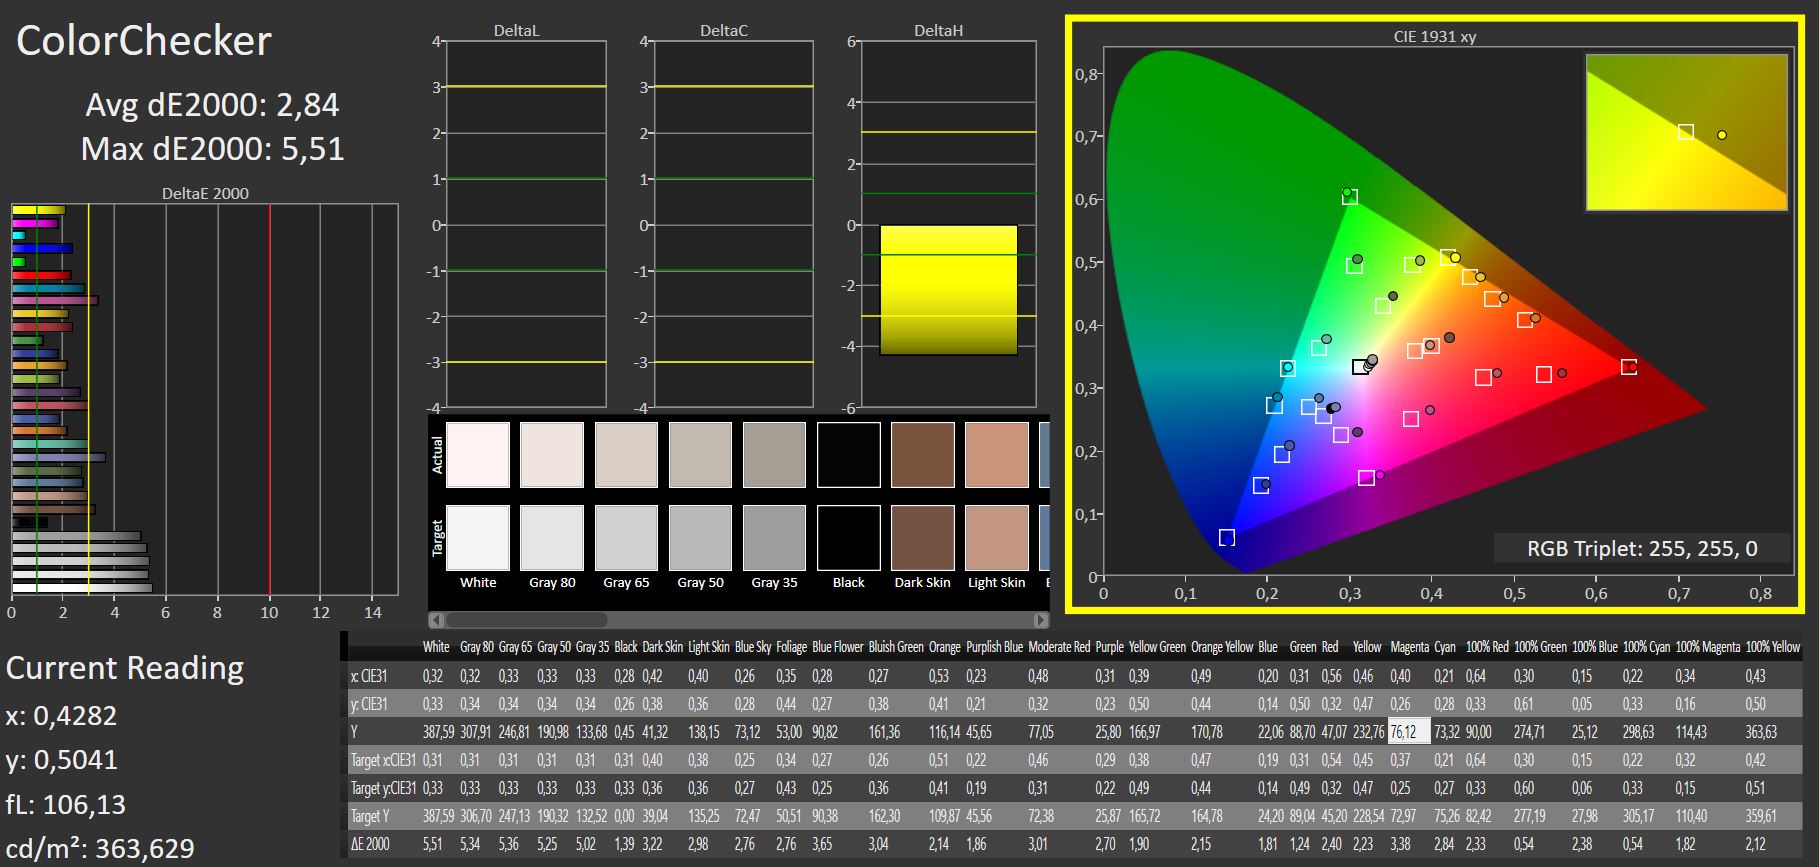
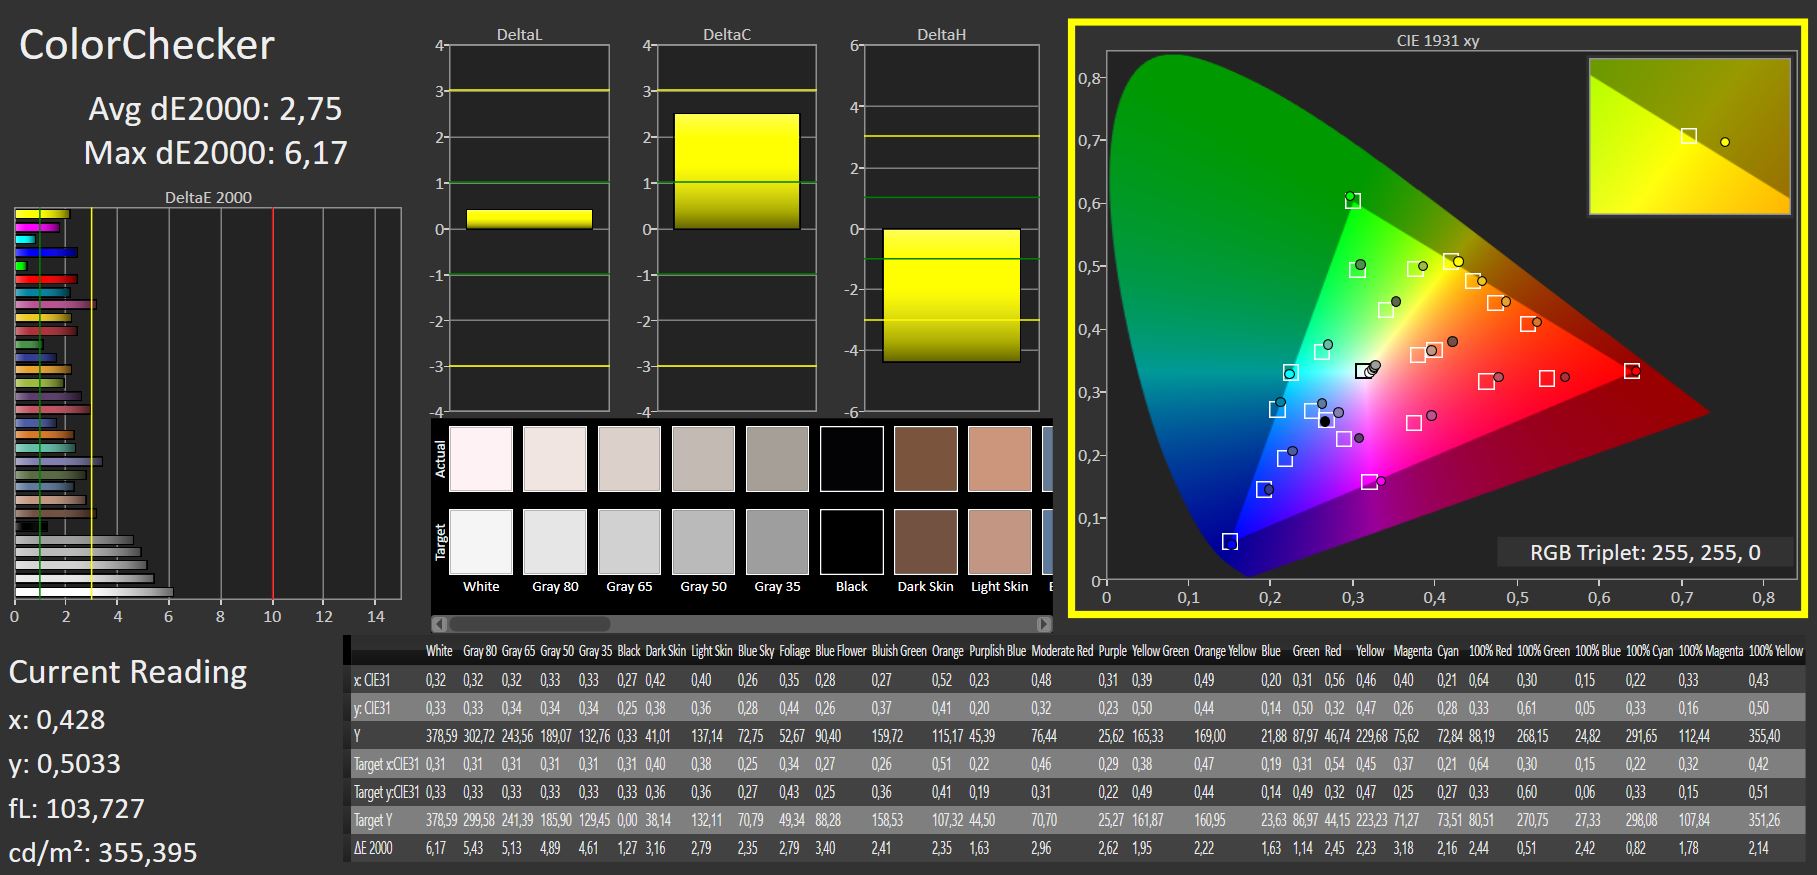
ΔE ColorChecker Calman: 2.84 | ∀{0.5-29.43 Ø4.83}
calibrated: 2.75
ΔE Greyscale Calman: 4.08 | ∀{0.09-98 Ø5.1}
69.9% AdobeRGB 1998 (Argyll 3D)
99.3% sRGB (Argyll 3D)
68.8% Display P3 (Argyll 3D)
Gamma: 2.4
CCT: 5841 K
| SCHENKER XMG Core 15 (M22) CSOT MNF601CA1-1, IPS, 2560x1440, 15.6" | SCHENKER XMG Fusion 15 (Mid 22) BOE CQ NE156QHM-NY2, IPS, 2560x1440, 15.6" | Lenovo Legion 5 15IAH7H 82RB CSOT MNF601CA1-3, IPS, 1920x1080, 15.6" | Asus TUF Gaming F15 FX507ZM TL156VDXP0101, IPS, 1920x1080, 15.6" | Alienware m15 R5 Ryzen Edition B156HAN, IPS, 1920x1080, 15.6" | SCHENKER XMG Core 15 Ampere BOE CQ NE156QHM-NY2, IPS, 2560x1440, 15.6" | |
|---|---|---|---|---|---|---|
| Display | -2% | 0% | -2% | 0% | ||
| Display P3 Coverage | 68.8 | 67.3 -2% | 69.1 0% | 66.4 -3% | 69.8 1% | |
| sRGB Coverage | 99.3 | 96.7 -3% | 99.5 0% | 97 -2% | 98.8 -1% | |
| AdobeRGB 1998 Coverage | 69.9 | 68.2 -2% | 70 0% | 68.5 -2% | 70.7 1% | |
| Response Times | 18% | -26% | -2% | 32% | -15% | |
| Response Time Grey 50% / Grey 80% * | 16 ? | 11.6 ? 27% | 14.8 ? 7% | 5.6 ? 65% | 4 ? 75% | 14.8 ? 7% |
| Response Time Black / White * | 7.6 ? | 7 ? 8% | 12 ? -58% | 12.8 ? -68% | 8.4 ? -11% | 10.4 ? -37% |
| PWM Frequency | ||||||
| Screen | -11% | -13% | 19% | 10% | 23% | |
| Brightness middle | 378 | 326 -14% | 363.5 -4% | 353.7 -6% | 329 -13% | 347 -8% |
| Brightness | 371 | 303 -18% | 350 -6% | 340 -8% | 321 -13% | 328 -12% |
| Brightness Distribution | 93 | 89 -4% | 89 -4% | 89 -4% | 92 -1% | 89 -4% |
| Black Level * | 0.33 | 0.33 -0% | 0.39 -18% | 0.34 -3% | 0.27 18% | 0.27 18% |
| Contrast | 1145 | 988 -14% | 932 -19% | 1040 -9% | 1219 6% | 1285 12% |
| Colorchecker dE 2000 * | 2.84 | 2.73 4% | 3.68 -30% | 1.74 39% | 2.78 2% | 1.66 42% |
| Colorchecker dE 2000 max. * | 5.51 | 9.54 -73% | 8.92 -62% | 3.63 34% | 4.88 11% | 3.03 45% |
| Colorchecker dE 2000 calibrated * | 2.75 | 1.36 51% | 0.53 81% | 0.5 82% | 1.63 41% | 1.23 55% |
| Greyscale dE 2000 * | 4.08 | 5.2 -27% | 6.5 -59% | 2.1 49% | 2.5 39% | 1.6 61% |
| Gamma | 2.4 92% | 2.074 106% | 2.2 100% | 2.3 96% | 2.106 104% | 2.278 97% |
| CCT | 5841 111% | 6911 94% | 5995 108% | 6257 104% | 6201 105% | 6430 101% |
| Color Space (Percent of AdobeRGB 1998) | 76 | 71 | ||||
| Color Space (Percent of sRGB) | 99 | 94 | ||||
| Total Average (Program / Settings) | 2% /
-5% | -13% /
-12% | 5% /
12% | 21% /
14% | 3% /
13% |
* ... smaller is better
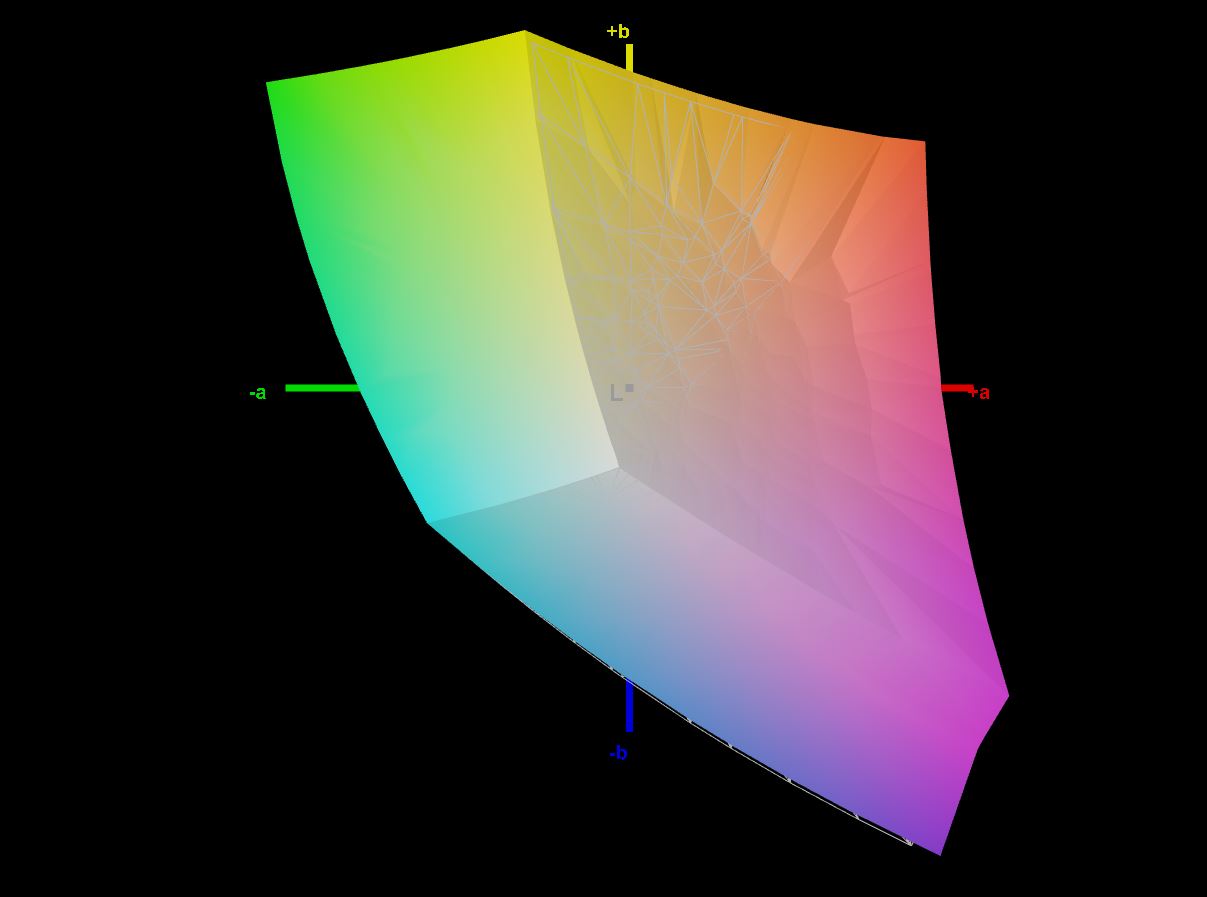
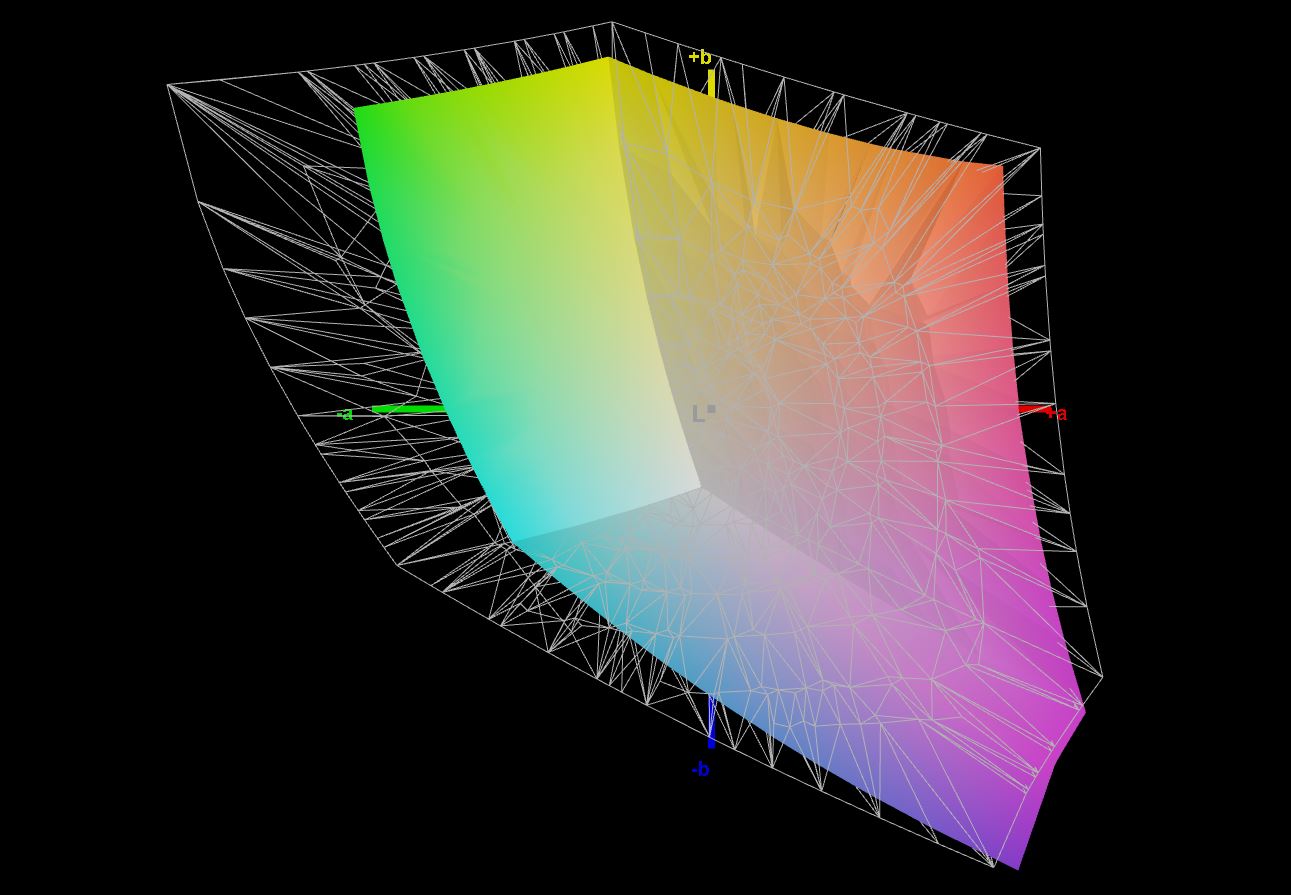
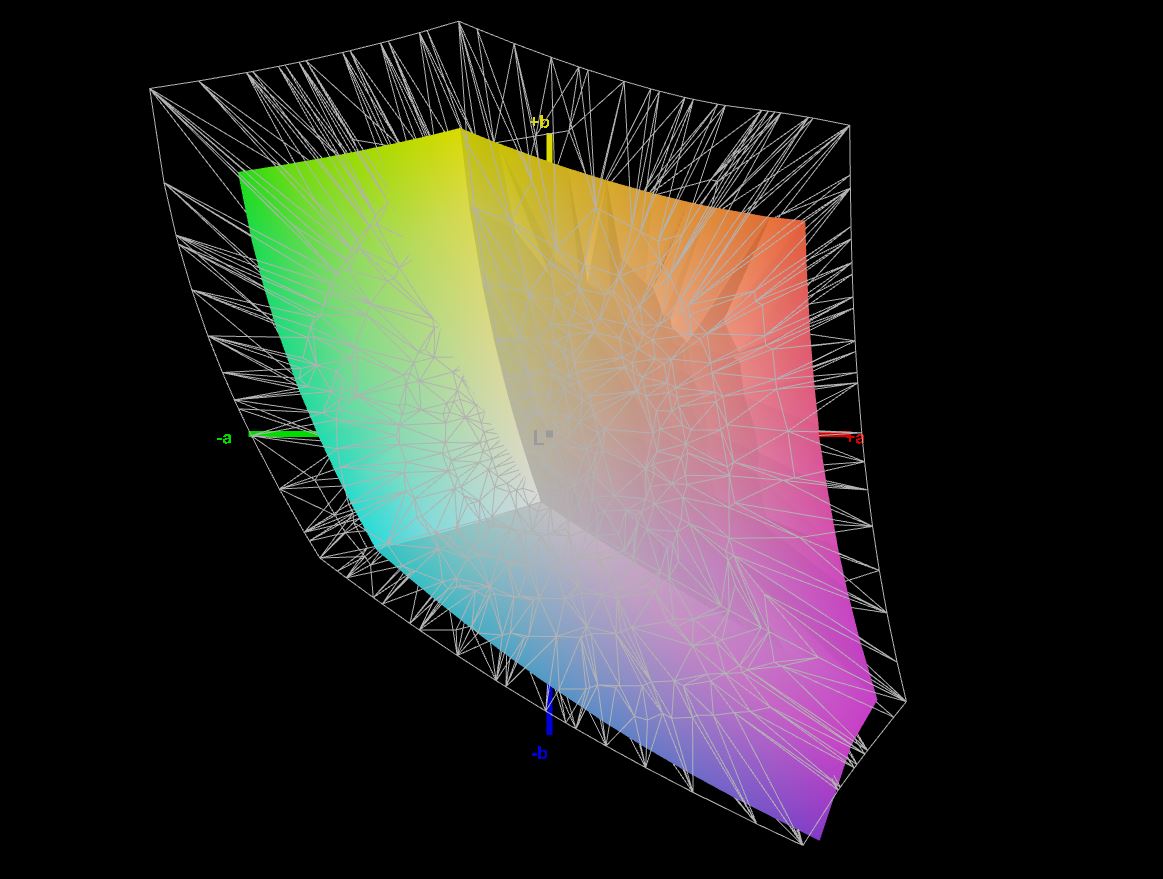
The sRGB color space is covered by 99.3%, which enables professional image editing in the digital field. However, larger color spaces, such as DCI-P3 for video editing and AdobeRGB for the goal of professional printing of edited images, are only covered by the Alienware m15 and the HP Envy 16 cover them almost completely.
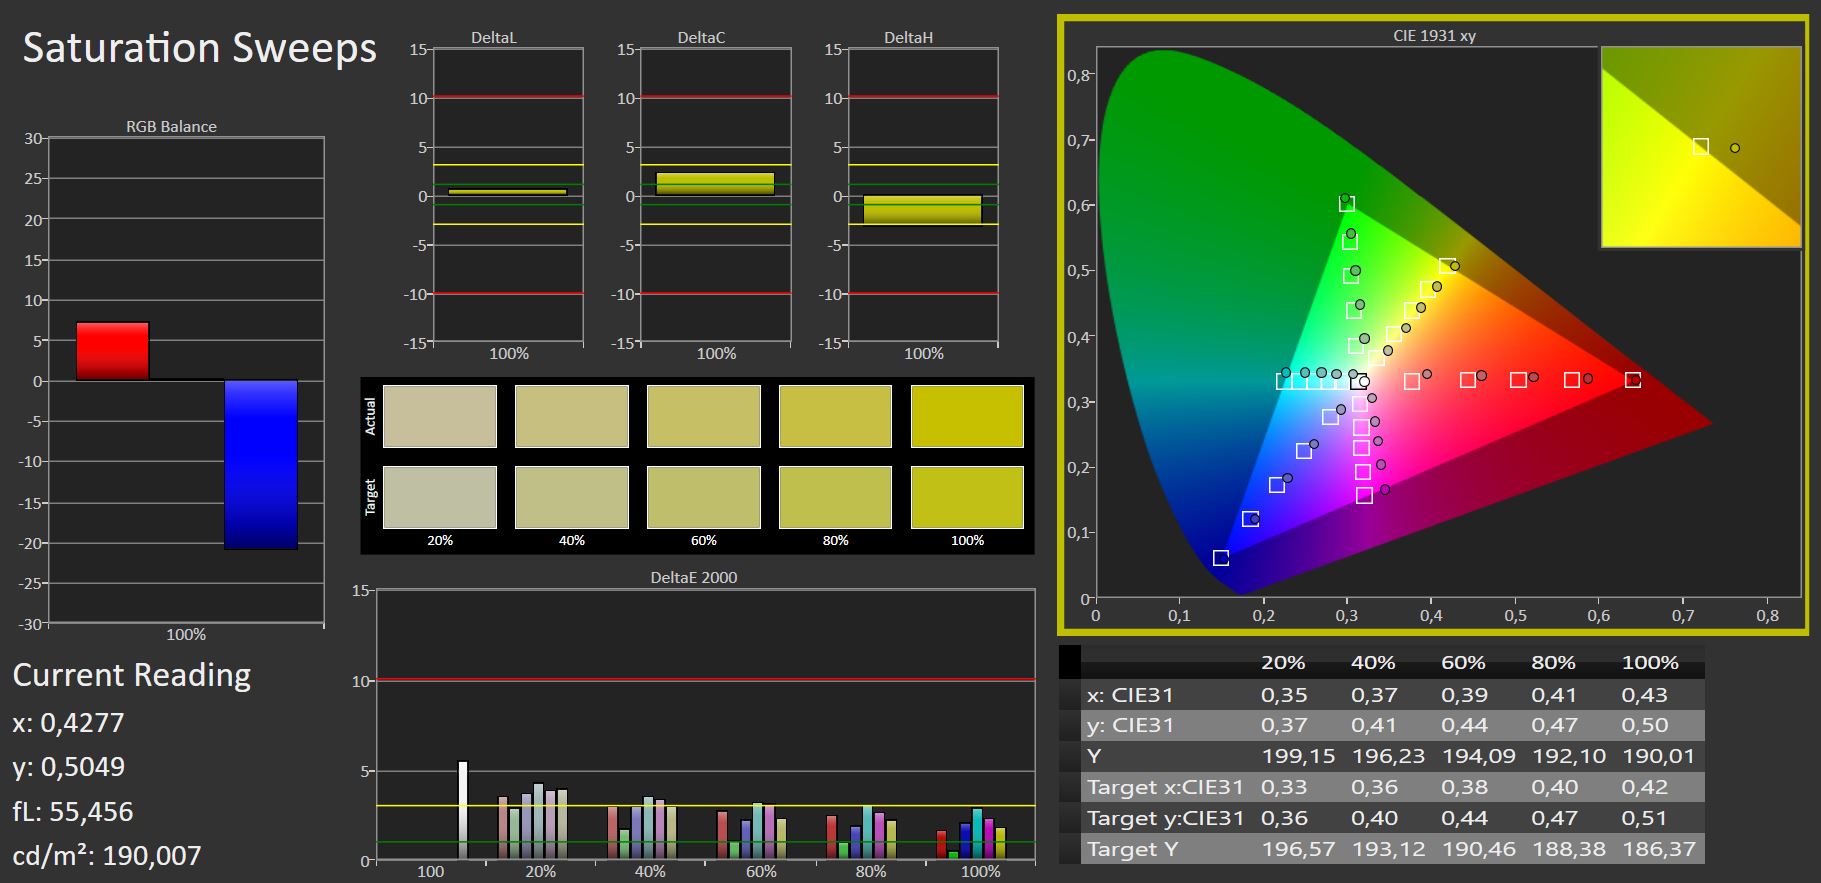
Almost all colors stay below the threshold of DeltaE 3. However, a slight red cast is visible ex-factory, which does not disappear even after our calibration. Our calibrated color profile can be downloaded here.

Display Response Times
| ↔ Response Time Black to White | ||
|---|---|---|
| 7.6 ms ... rise ↗ and fall ↘ combined | ↗ 3 ms rise | 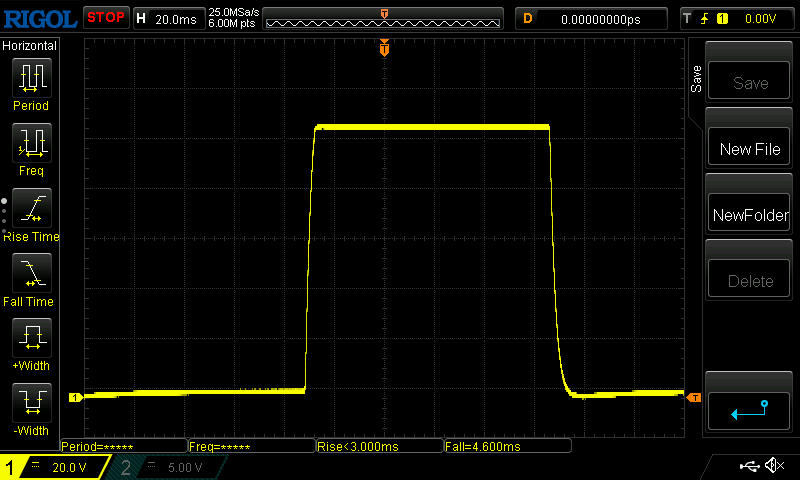 |
| ↘ 4.6 ms fall | ||
| The screen shows very fast response rates in our tests and should be very well suited for fast-paced gaming. In comparison, all tested devices range from 0.1 (minimum) to 240 (maximum) ms. » 20 % of all devices are better. This means that the measured response time is better than the average of all tested devices (20.5 ms). | ||
| ↔ Response Time 50% Grey to 80% Grey | ||
| 16 ms ... rise ↗ and fall ↘ combined | ↗ 7 ms rise | 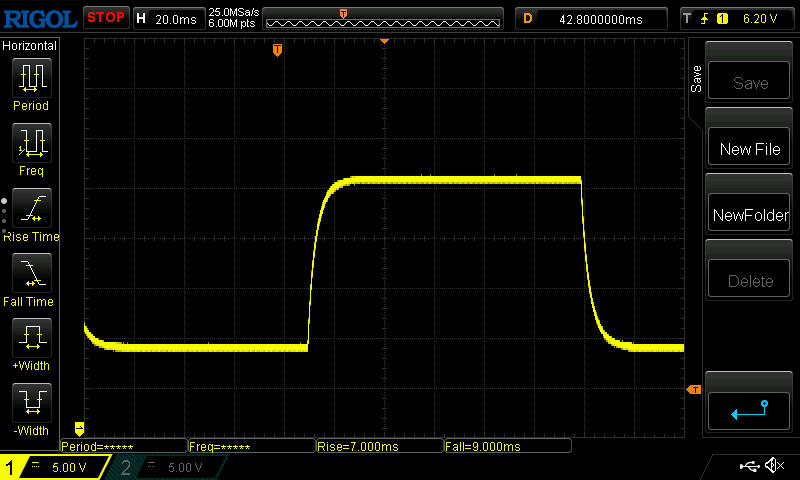 |
| ↘ 9 ms fall | ||
| The screen shows good response rates in our tests, but may be too slow for competitive gamers. In comparison, all tested devices range from 0.165 (minimum) to 636 (maximum) ms. » 28 % of all devices are better. This means that the measured response time is better than the average of all tested devices (32.1 ms). | ||
Screen Flickering / PWM (Pulse-Width Modulation)
| Screen flickering / PWM not detected | 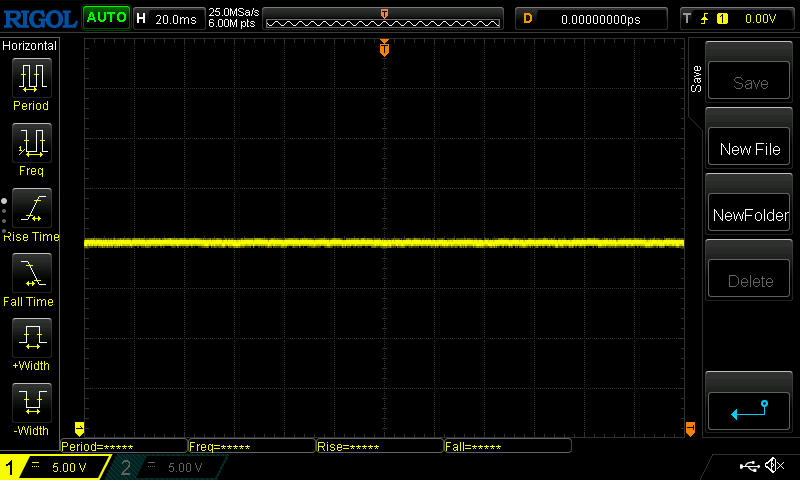 | ||
In comparison: 53 % of all tested devices do not use PWM to dim the display. If PWM was detected, an average of 8327 (minimum: 5 - maximum: 343500) Hz was measured. | |||
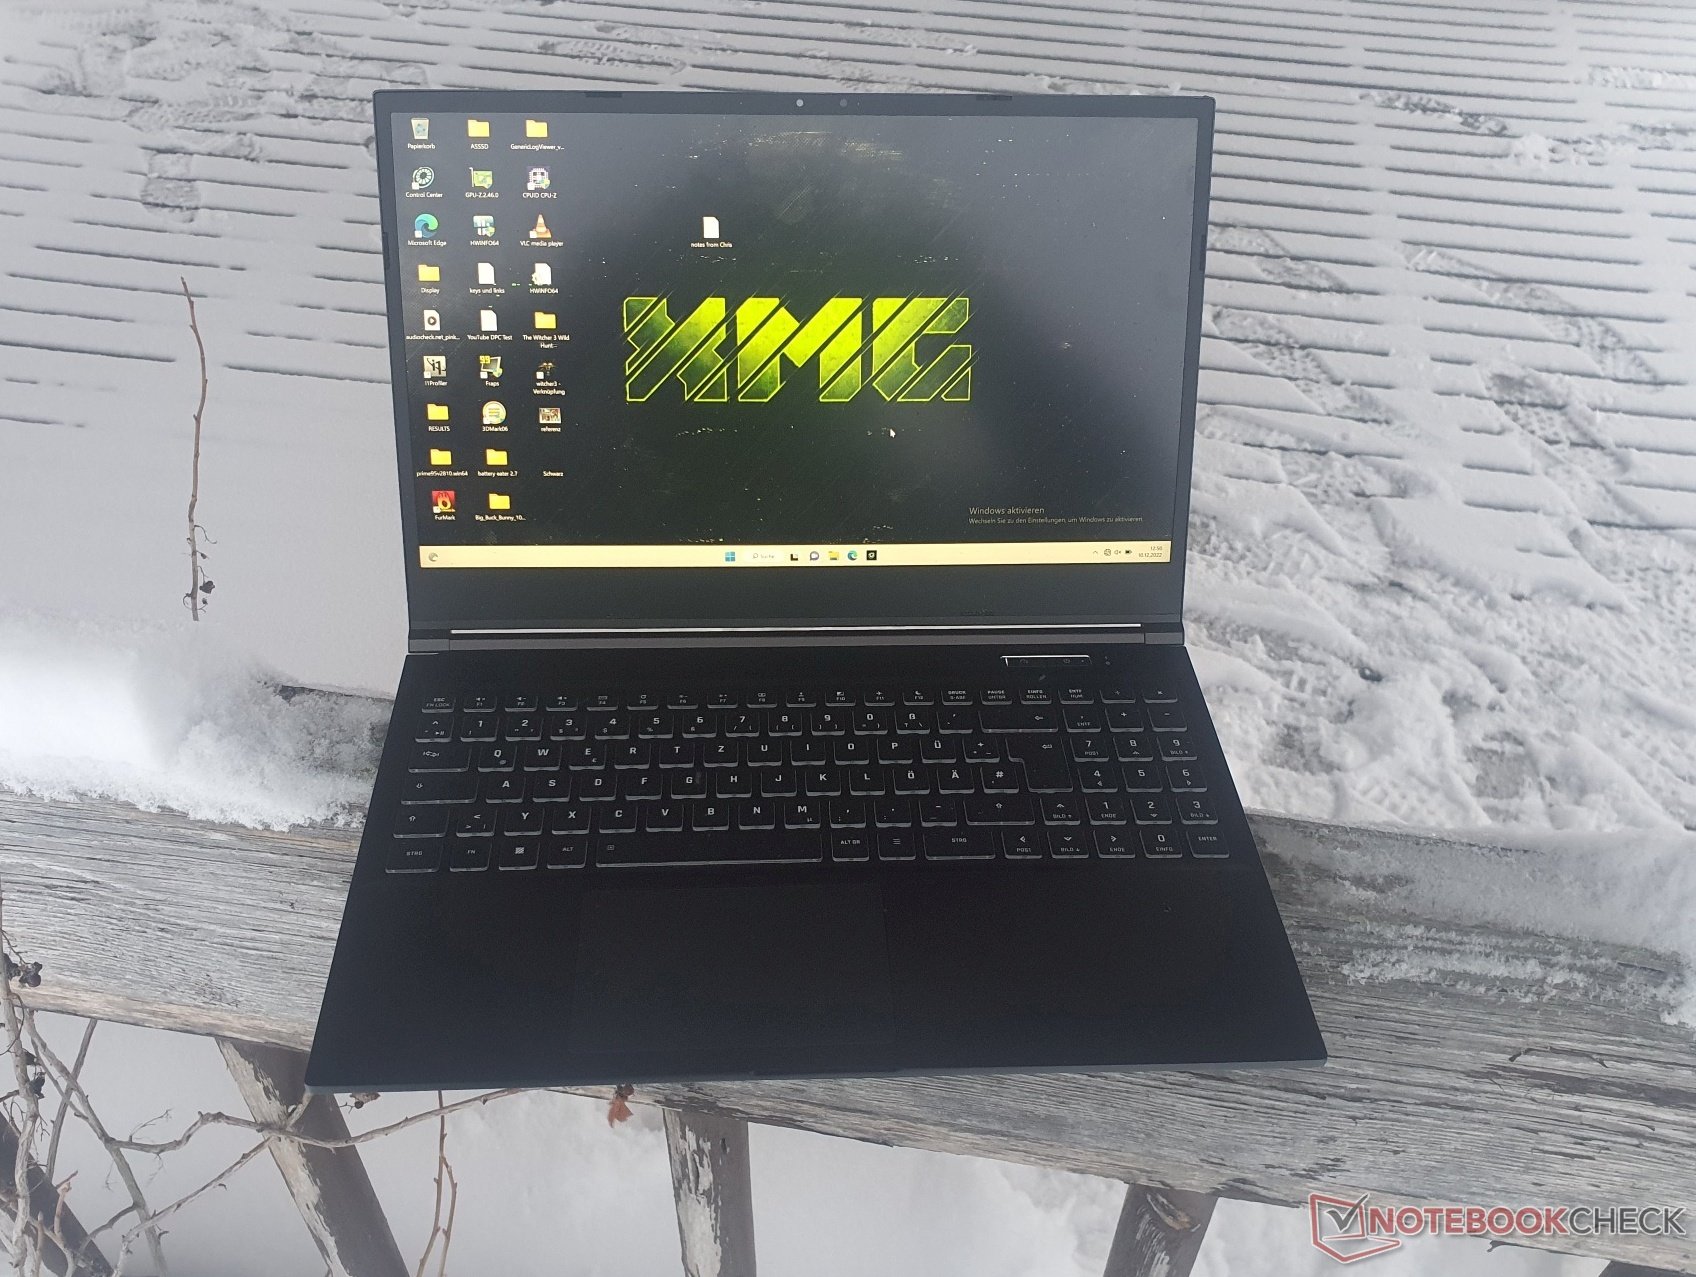
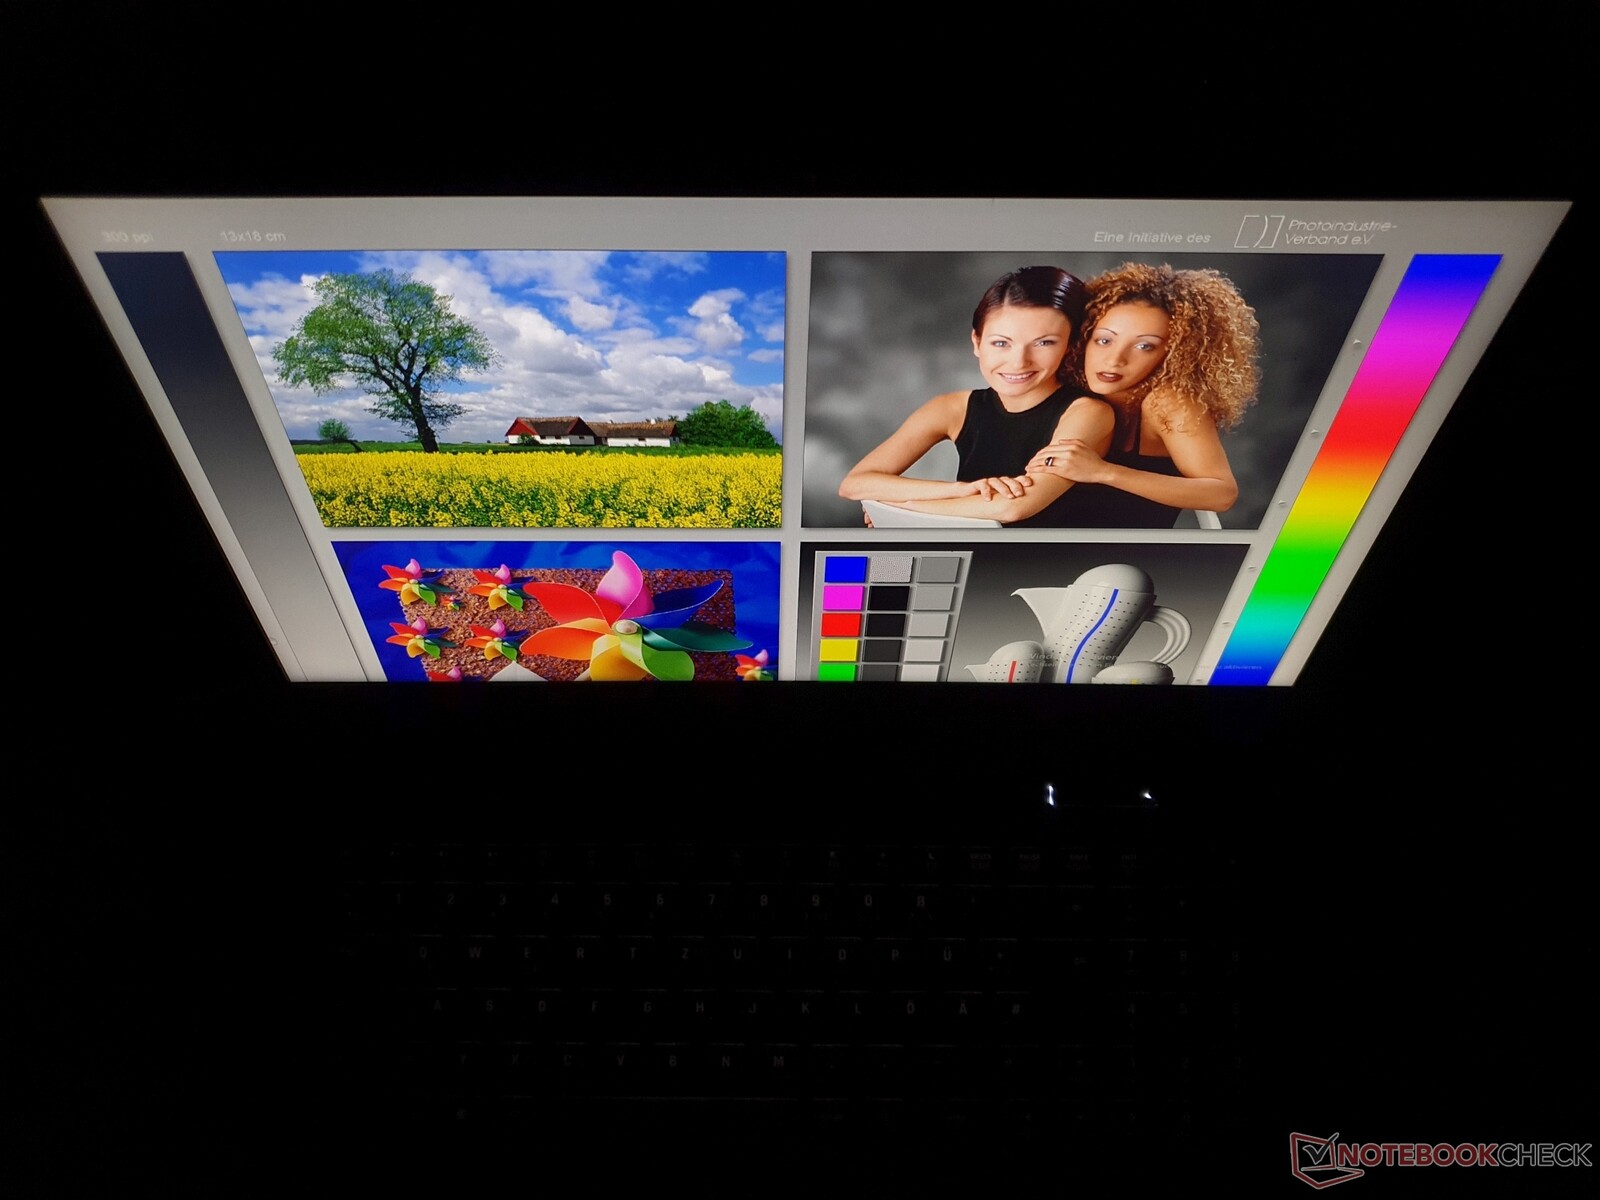
The display's 371 cd/m² can only be read well without direct sunlight in the back despite its matte finish.


Performance: RTX 3060 with maximum TGP, but there are faster ones
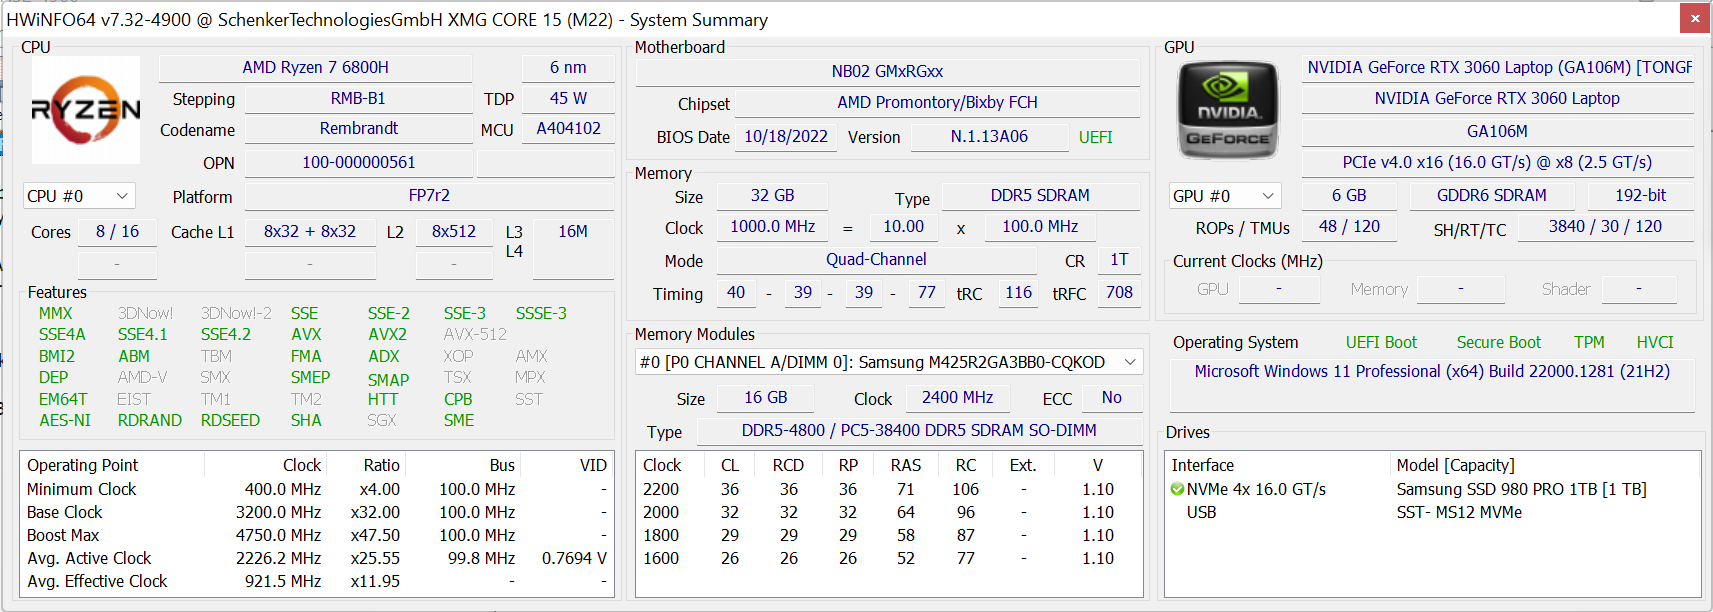
The 15.6-inch gaming laptop is very powerful thanks to its Nvidia RTX 3060 with 140 W TGP designed for current games, there is no other GPU option. The Ryzen 7 6800H processor is also strong and is the only choice. RAM and mass storage are generous with 32 GB DDR5-4800 (maximum 64 GB) and a 1 TB PCIe 4.0 SSD, respectively. Workstation tasks and video work are also completed quickly and produce very low emissions when using the external water cooling.
Test conditions
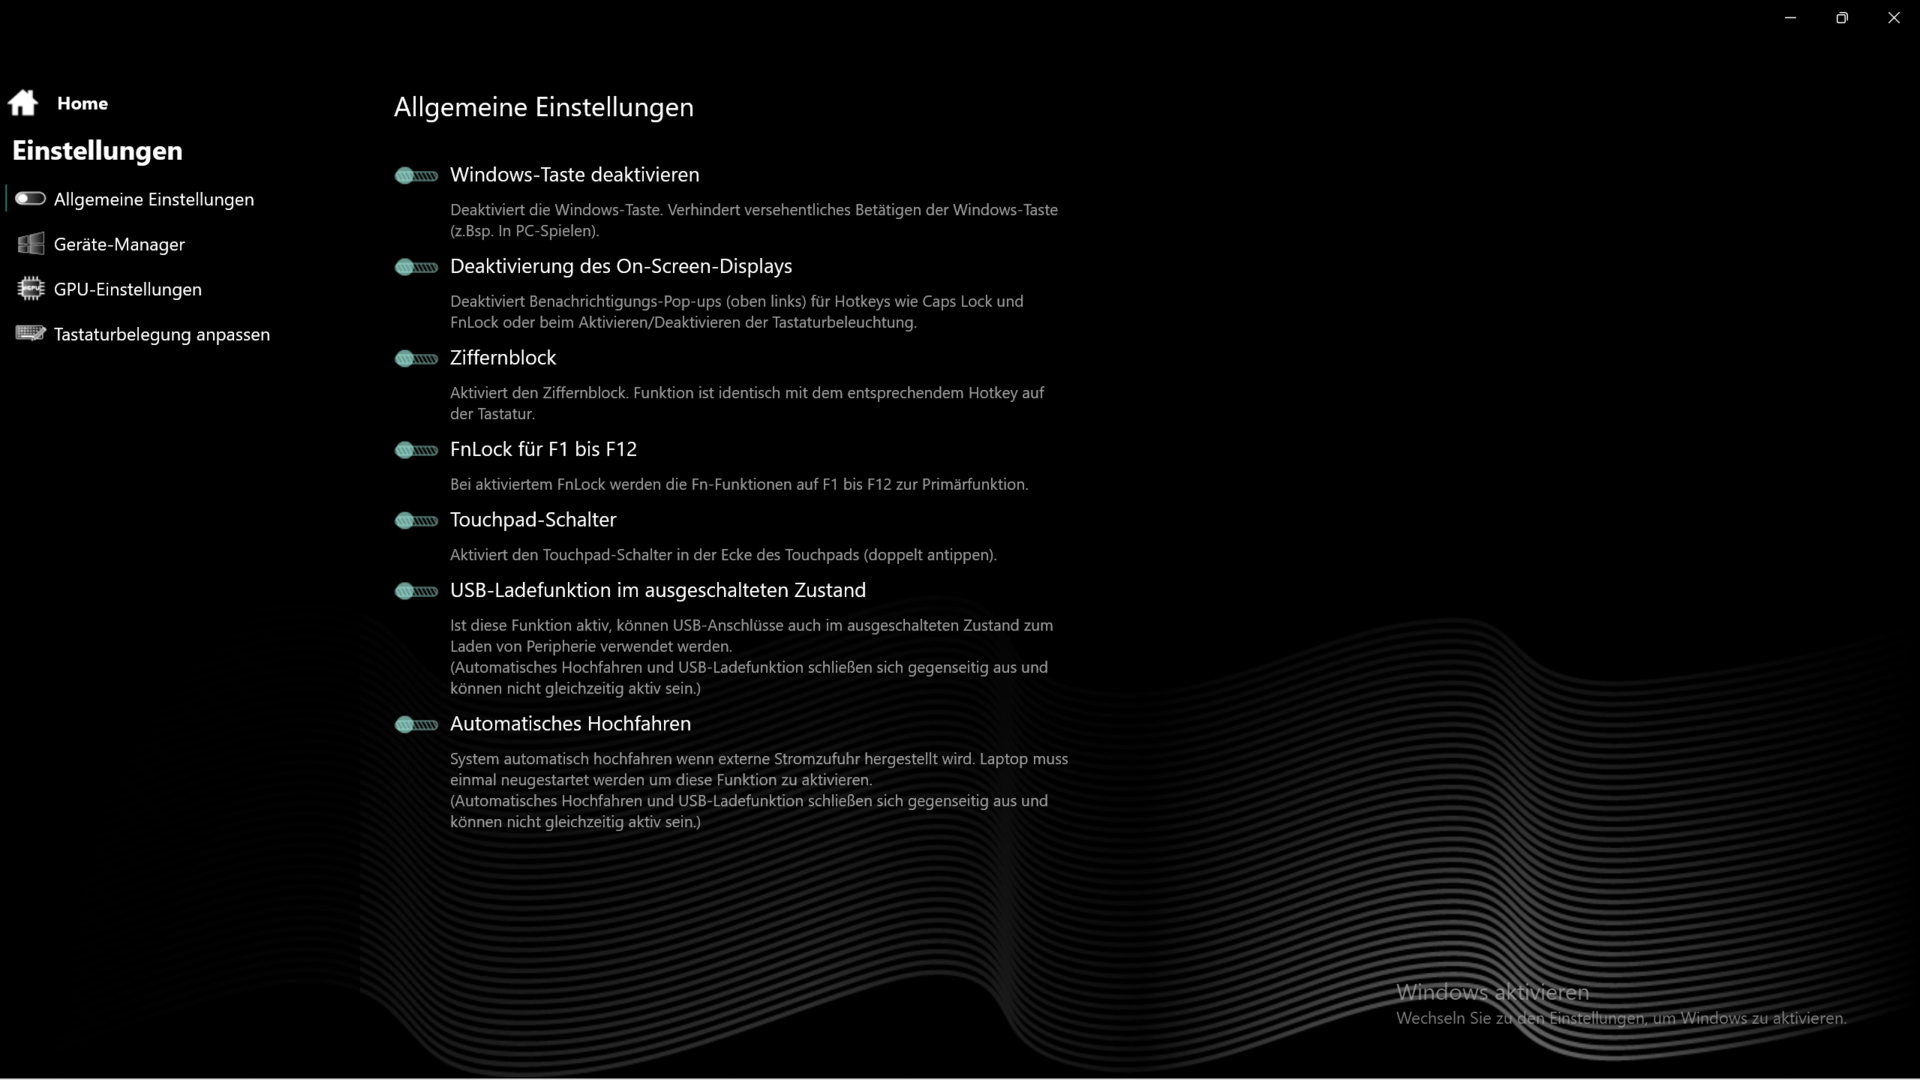
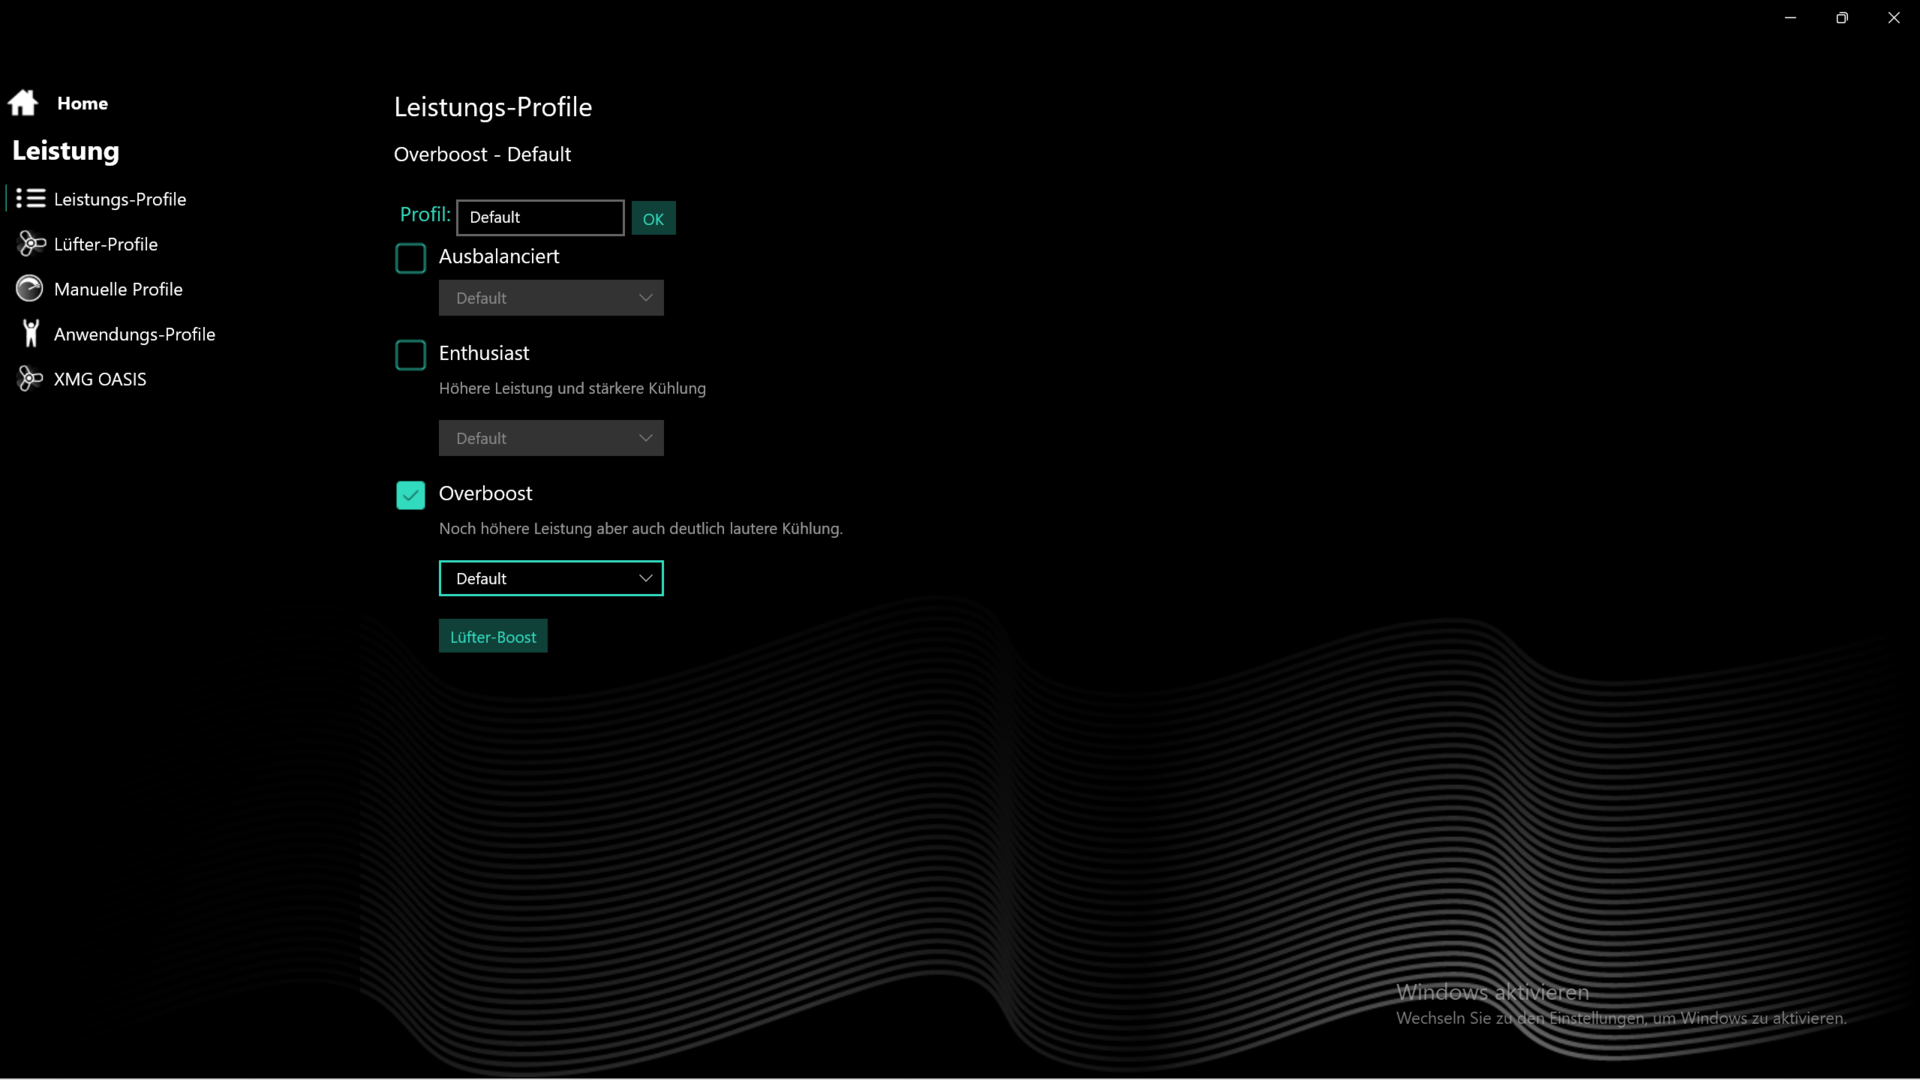
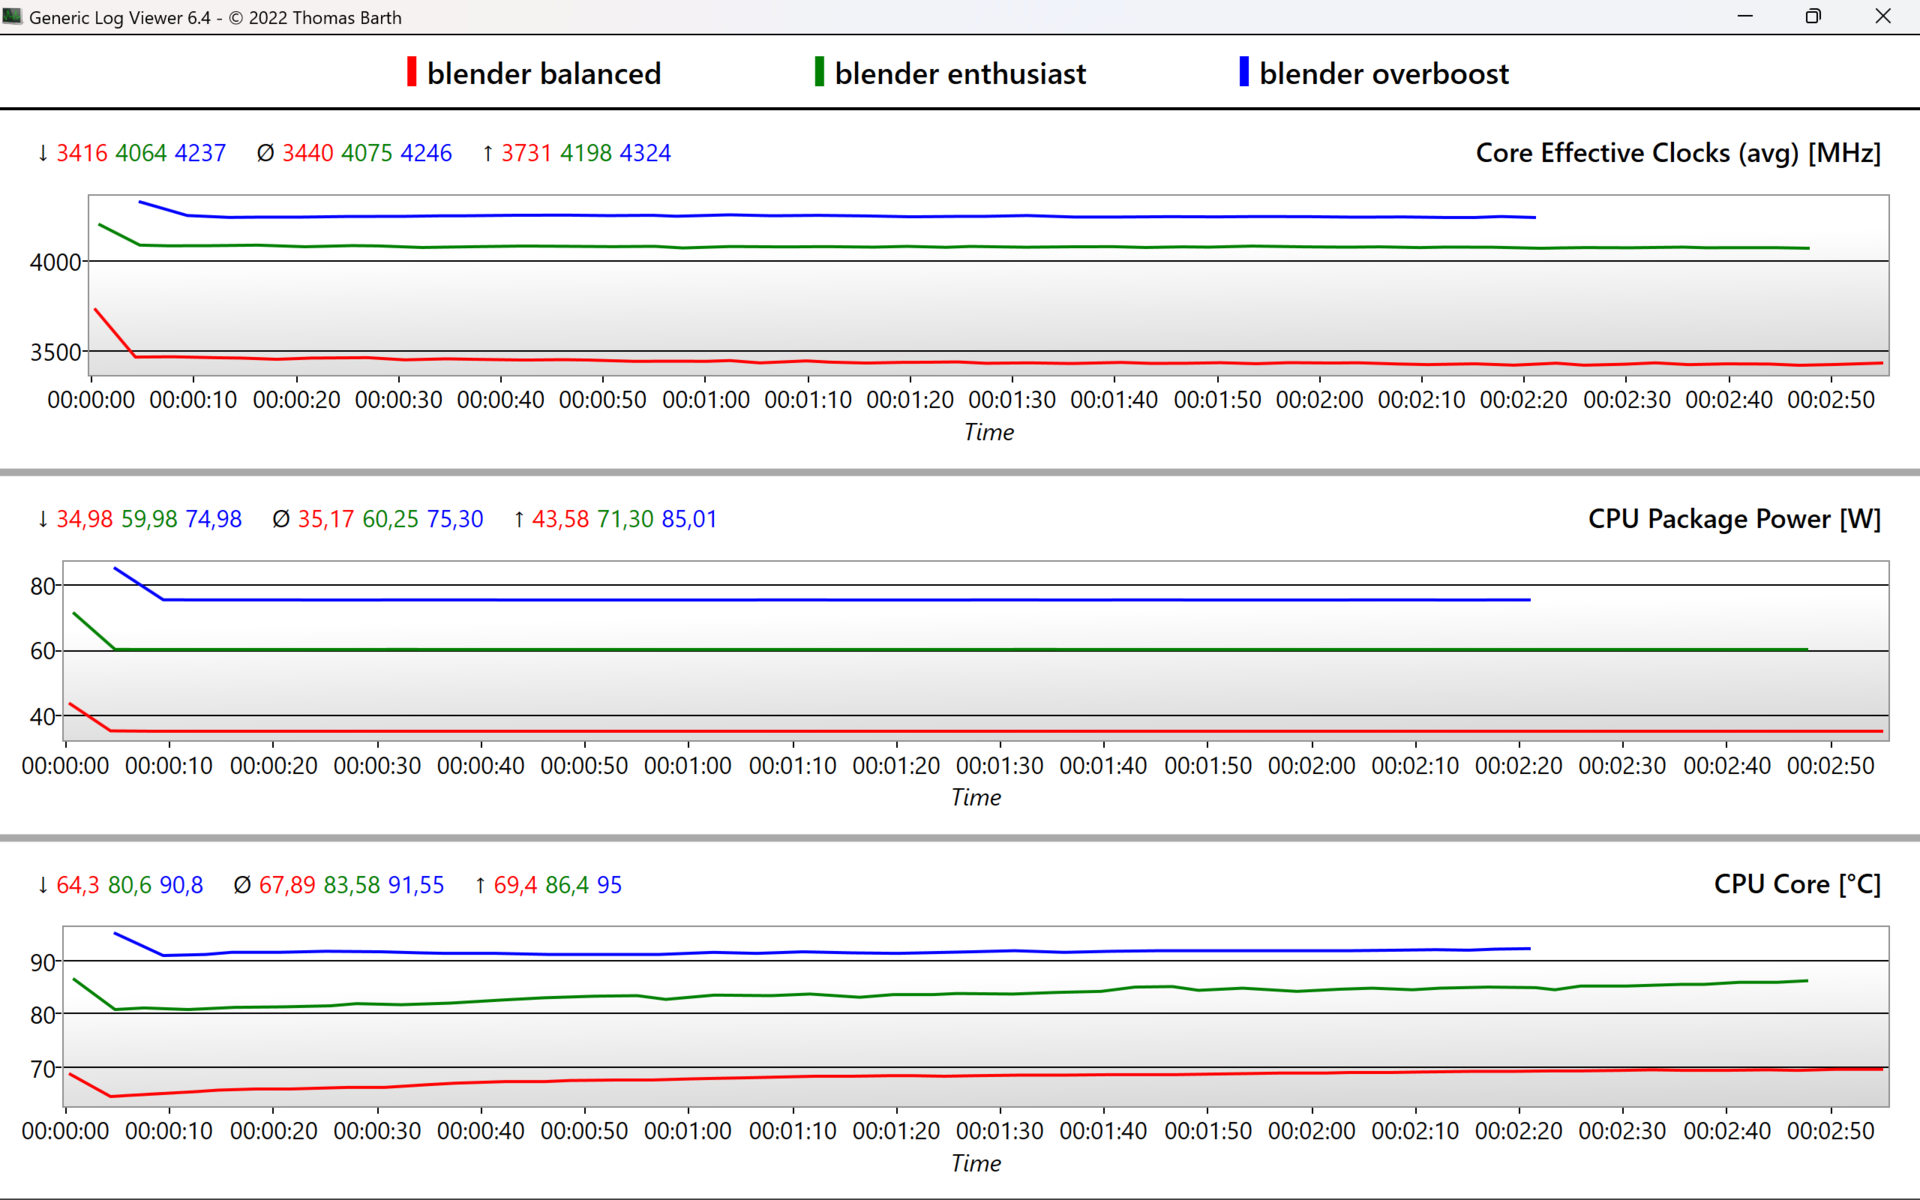
Schenker offers three power modes in the Core 15, but also individual profiles. The button to the left of the power button can be used to (de)activate a profile, which can be useful for many scenarios. Overboost allows a permanent power limit of 75 W for the CPU, 60 W in Enthusiast and 35 watts in Balanced mode. There is also the Fan Boost feature, which keeps the CPU cooler by about 5 °C with a much higher noise level.
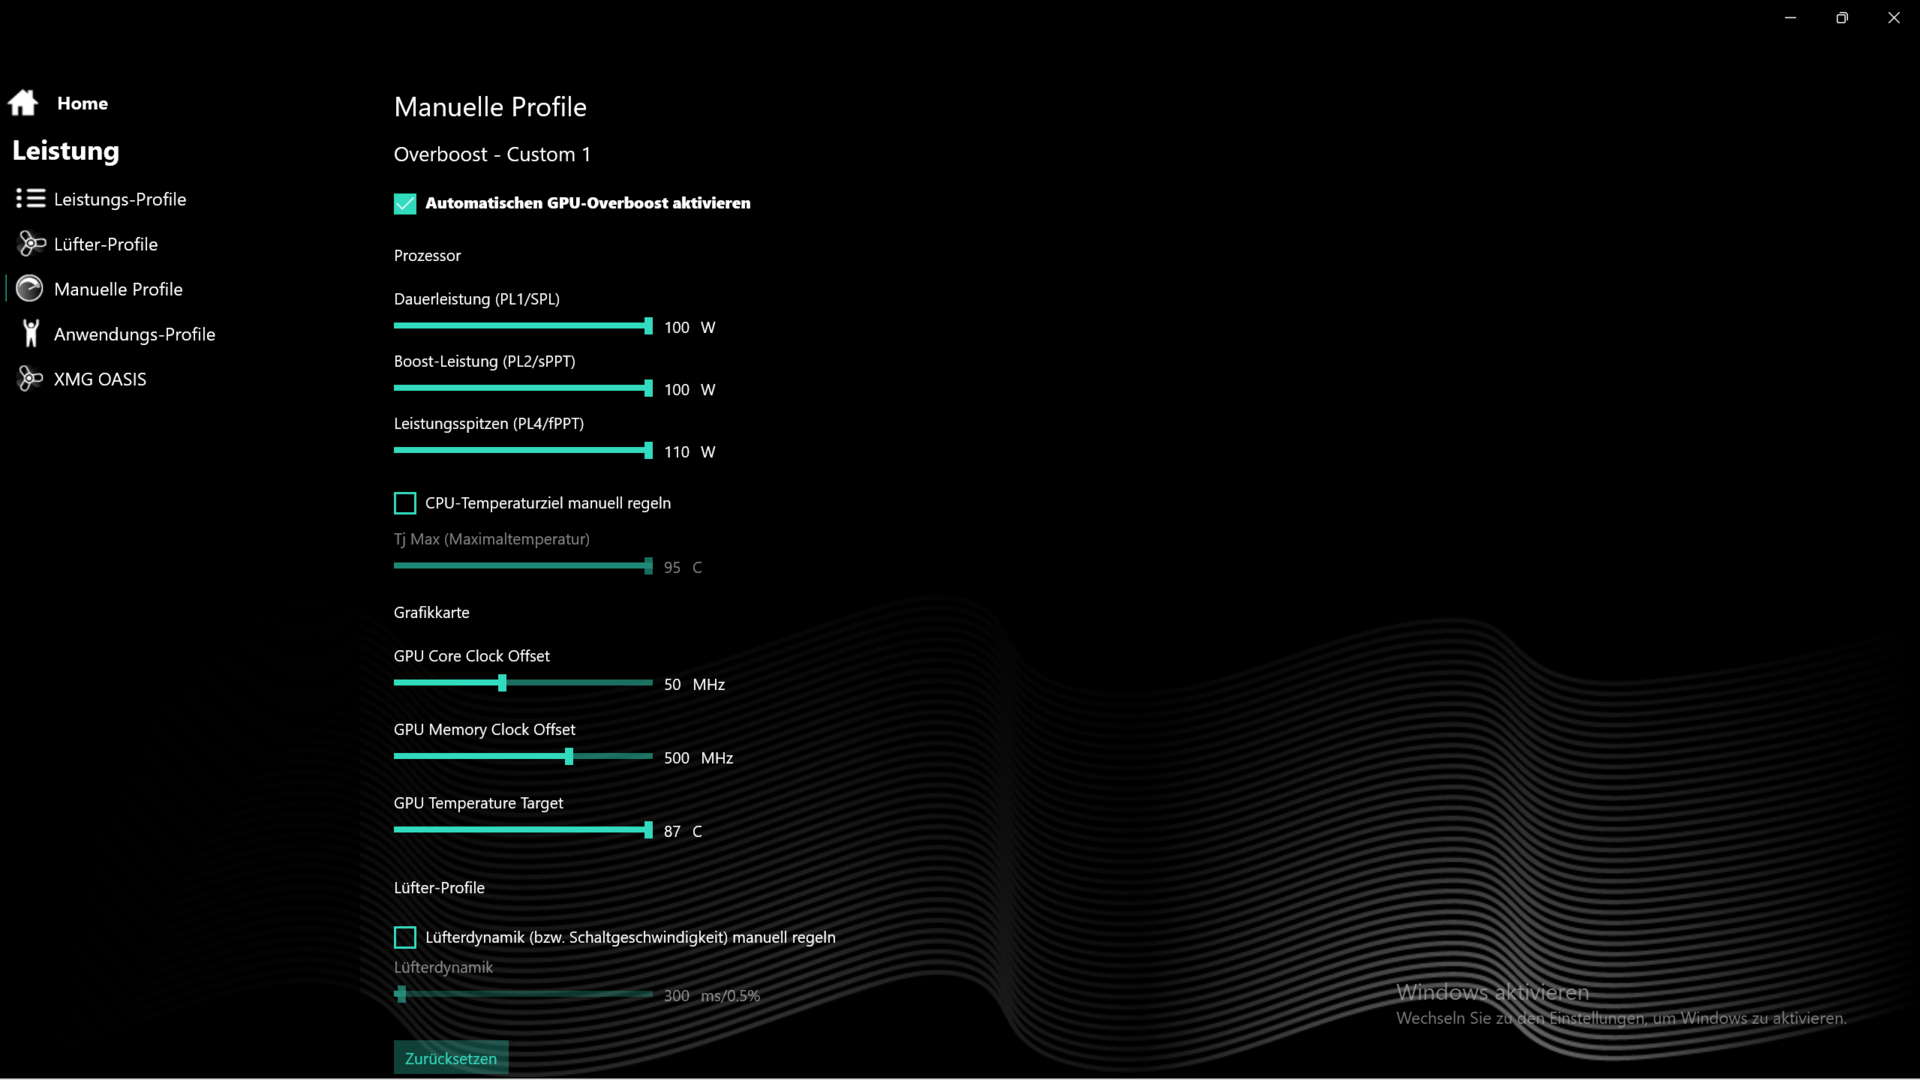
The performance benchmarks were run in the Overboost preset, but we still recommend Enthusiast, which is basically the same performance with quieter noise. Moving the TDP sliders to 100 W only added 5 W to the power limit, while overclocking the GPU to the recommended values (see the "GPU settings" screenshot) added a few bonus percentages.
Processor
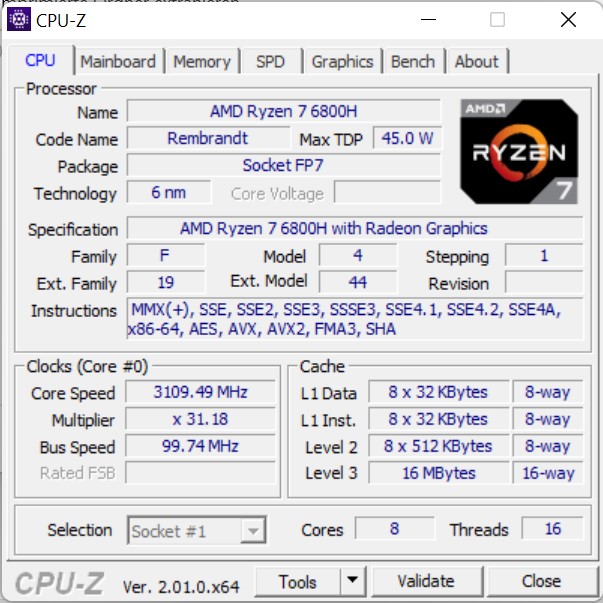
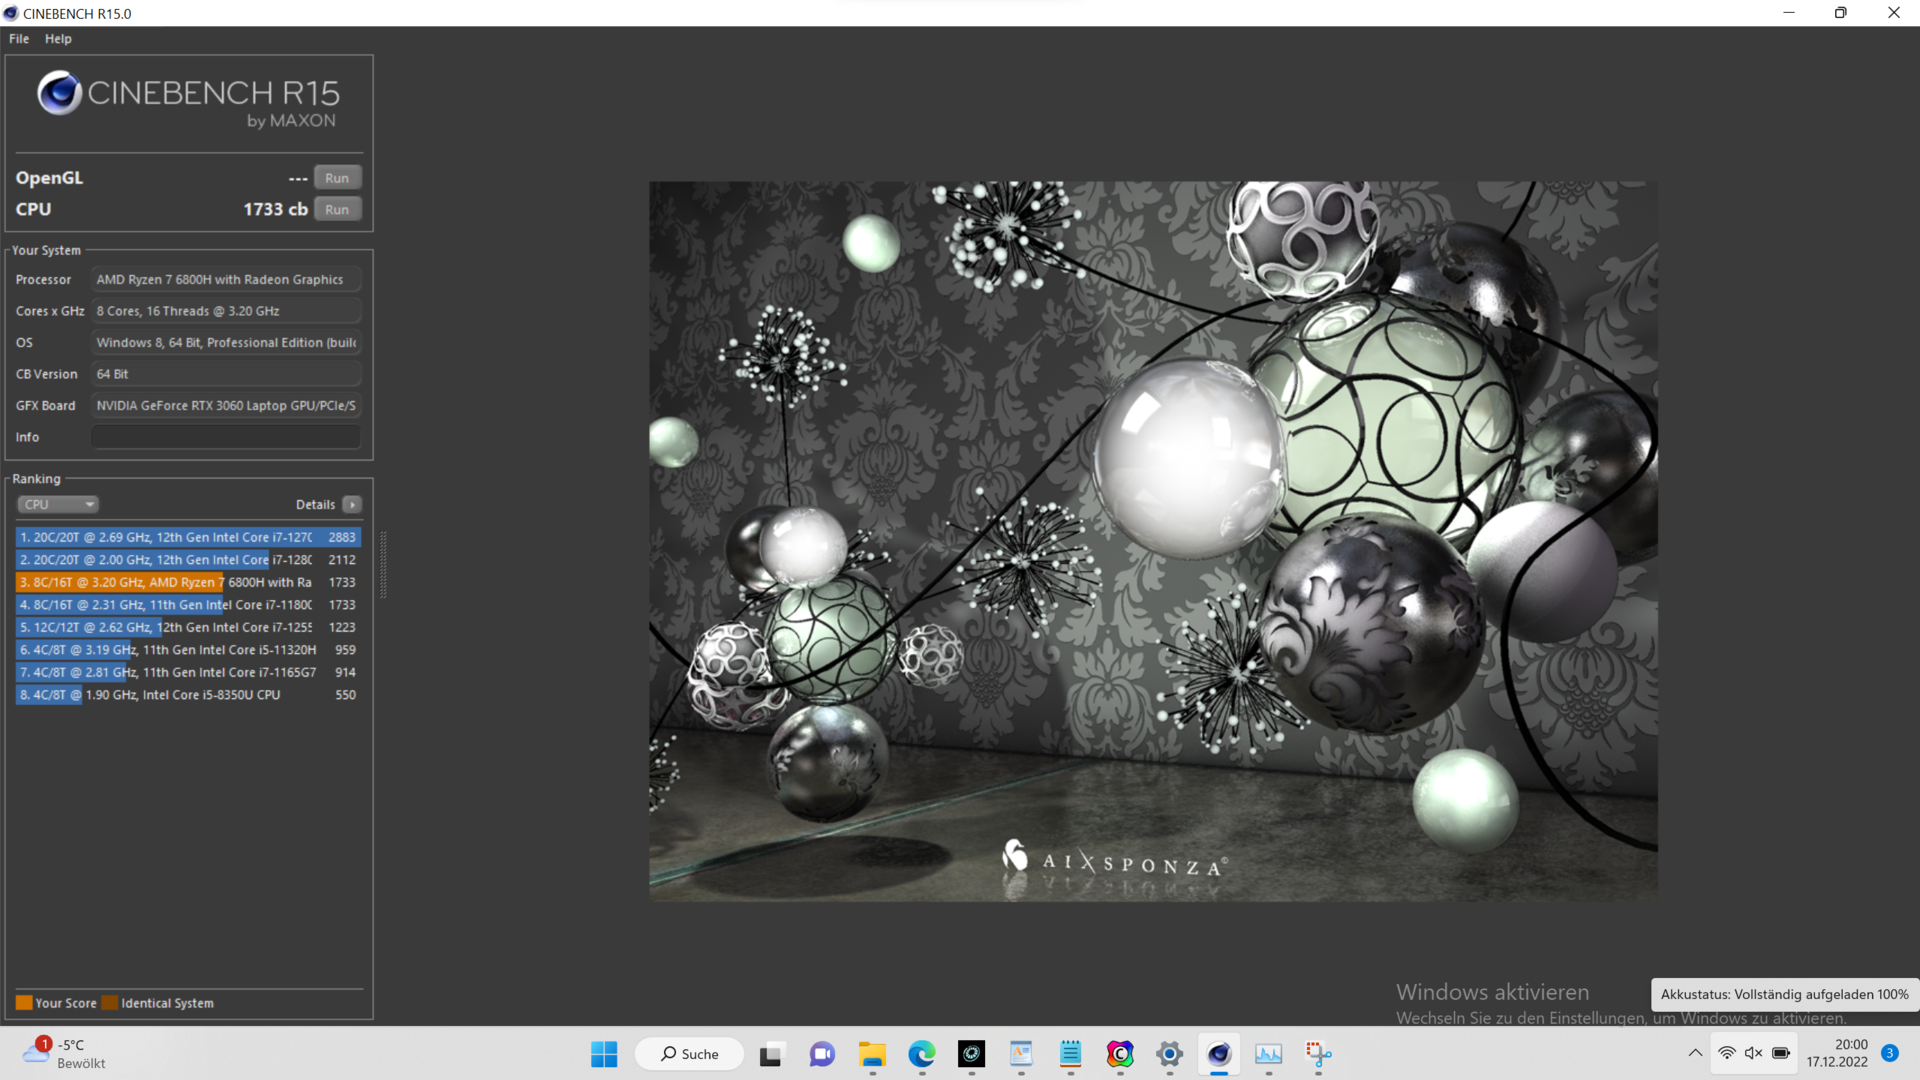
AMD's Ryzen 7 6800H is a 45 W CPU and runs permanently with 75 W in the XMG Core 15, so that a clock of 4.3 GHz for all eight cores can be maintained at about 92 °C (~198 °F). For a few seconds, 85 W is provided to the processor.
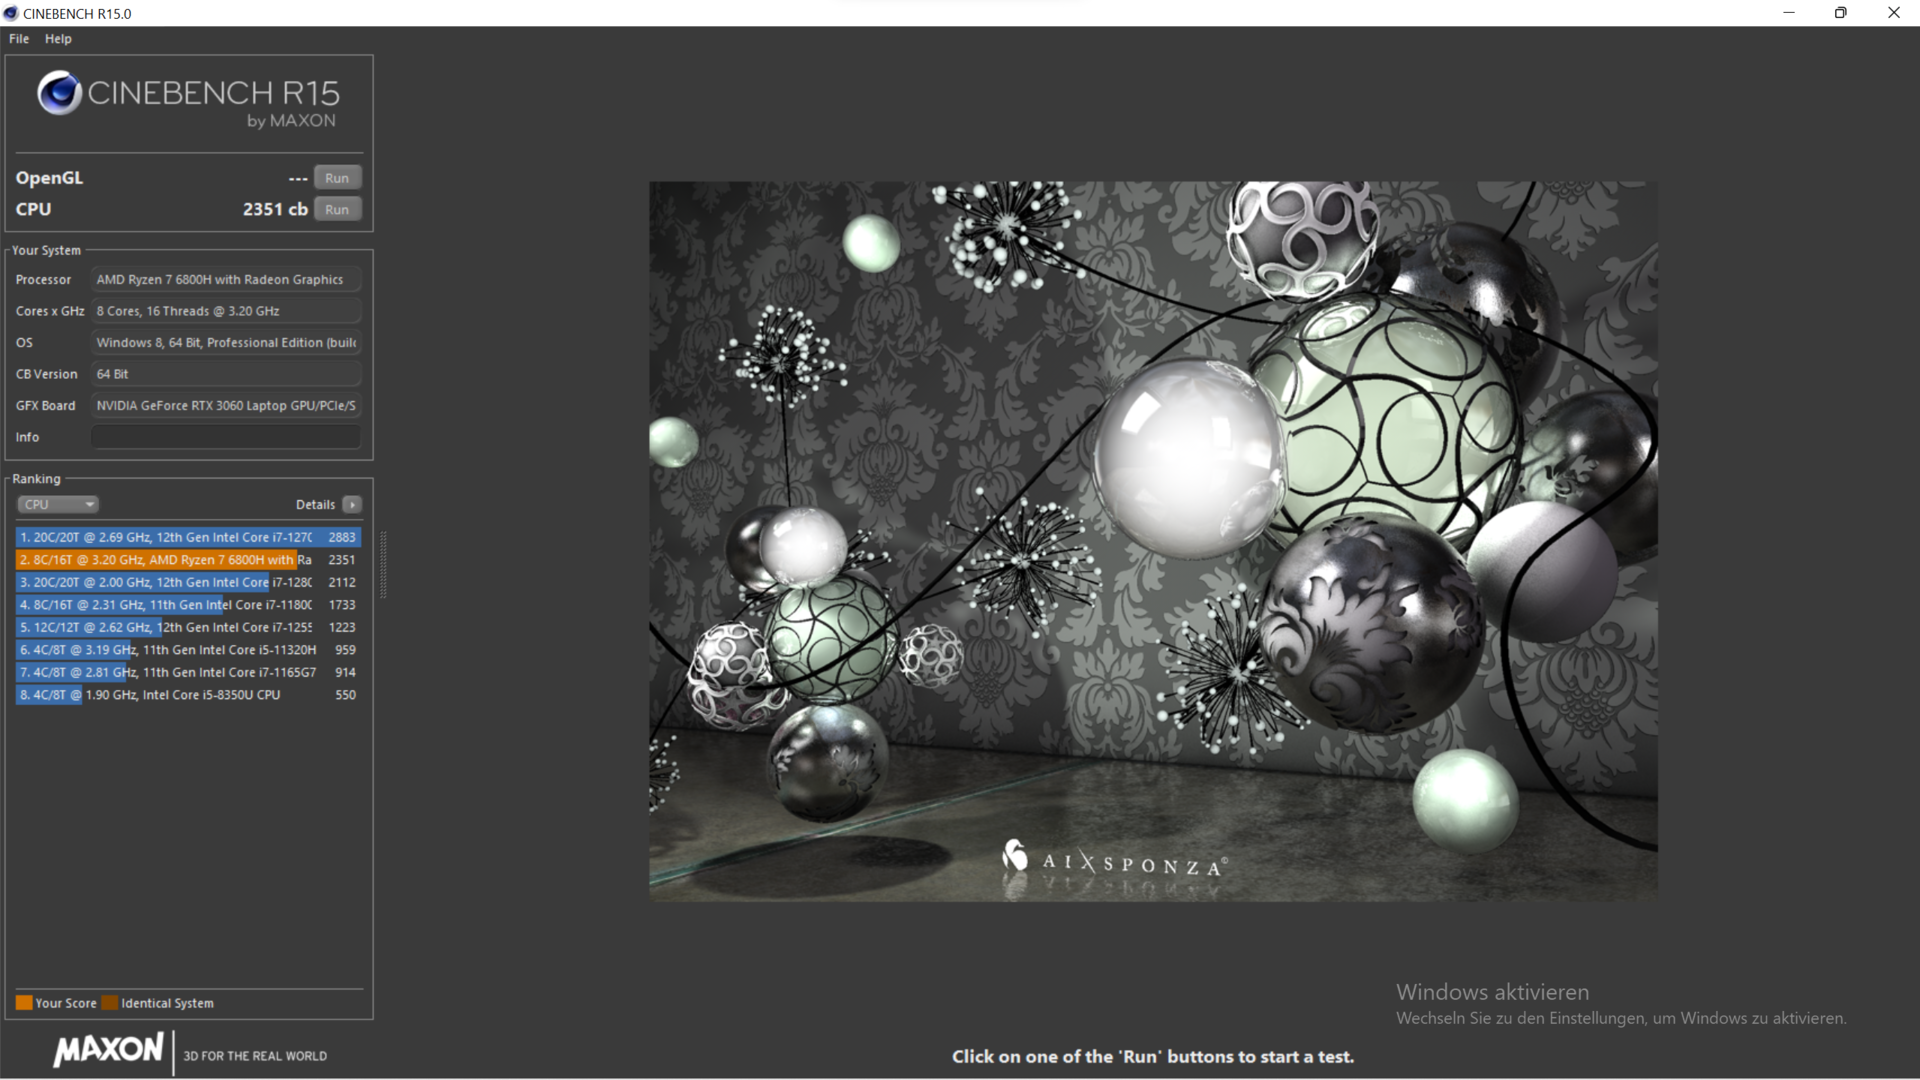
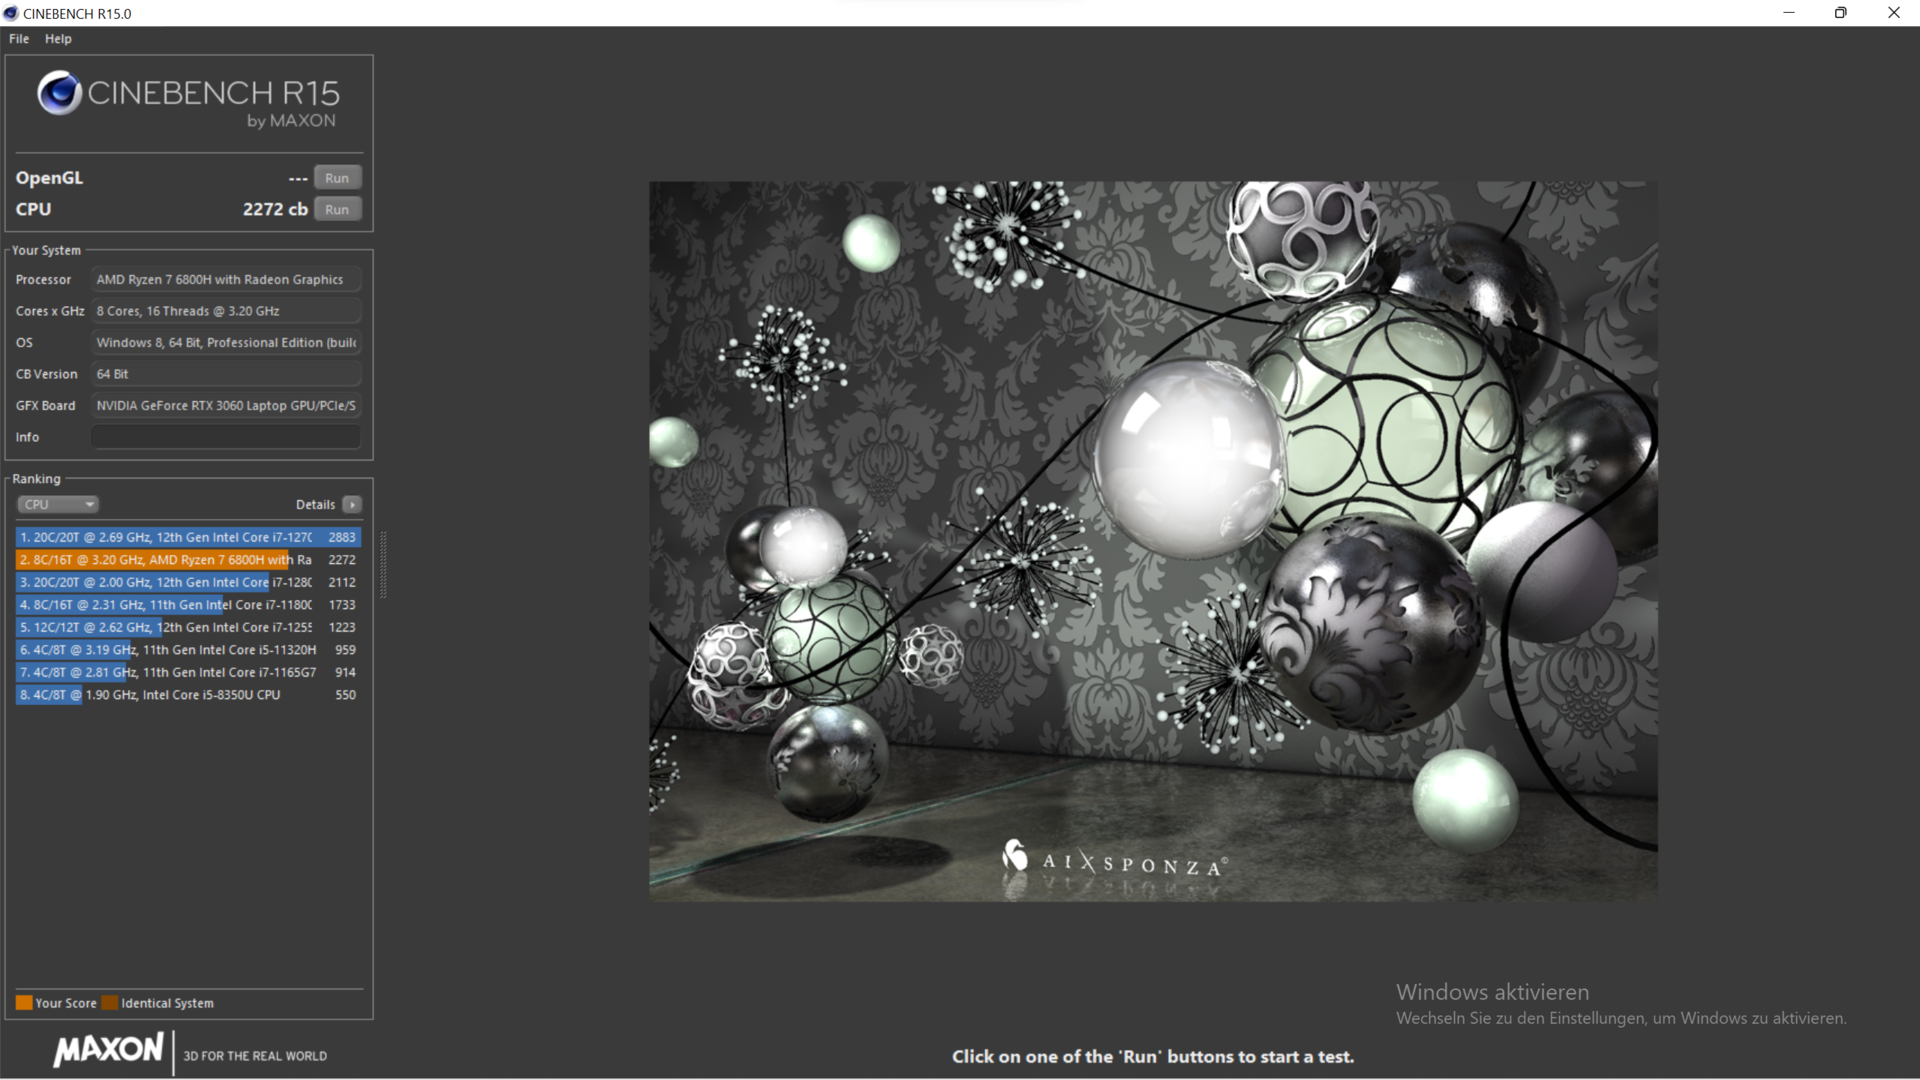
Our Cinebench R15 loop shows that the Core i7-12700H works significantly faster in the Legion 5 and TUF Gaming F15 , although XMG exploits the Ryzen 7 6800H's potential. At a 35 W power limit (balanced mode), the performance of the efficient Ryzen CPU only decreases by 20%.
In battery mode, the performance is reduced by about 25% despite Overboost.

Cinebench R15 Multi endurance test
Cinebench R23: Multi Core | Single Core
Cinebench R20: CPU (Multi Core) | CPU (Single Core)
Cinebench R15: CPU Multi 64Bit | CPU Single 64Bit
Blender: v2.79 BMW27 CPU
7-Zip 18.03: 7z b 4 | 7z b 4 -mmt1
Geekbench 5.5: Multi-Core | Single-Core
HWBOT x265 Benchmark v2.2: 4k Preset
LibreOffice : 20 Documents To PDF
R Benchmark 2.5: Overall mean
| CPU Performance Rating | |
| Average of class Gaming | |
| Lenovo Legion 5 15IAH7H 82RB | |
| Asus TUF Gaming F15 FX507ZM | |
| SCHENKER XMG Core 15 (M22) | |
| Average AMD Ryzen 7 6800H | |
| Alienware m15 R5 Ryzen Edition | |
| SCHENKER XMG Fusion 15 (Mid 22) | |
| SCHENKER XMG Core 15 Ampere | |
| Cinebench R23 / Multi Core | |
| Average of class Gaming (5668 - 40970, n=146, last 2 years) | |
| Lenovo Legion 5 15IAH7H 82RB | |
| Asus TUF Gaming F15 FX507ZM | |
| SCHENKER XMG Core 15 (M22) | |
| Average AMD Ryzen 7 6800H (11481 - 14660, n=11) | |
| Alienware m15 R5 Ryzen Edition | |
| SCHENKER XMG Core 15 Ampere | |
| SCHENKER XMG Fusion 15 (Mid 22) | |
| Cinebench R23 / Single Core | |
| Average of class Gaming (1136 - 2267, n=146, last 2 years) | |
| Lenovo Legion 5 15IAH7H 82RB | |
| Asus TUF Gaming F15 FX507ZM | |
| SCHENKER XMG Core 15 (M22) | |
| Average AMD Ryzen 7 6800H (1500 - 1552, n=9) | |
| SCHENKER XMG Fusion 15 (Mid 22) | |
| Alienware m15 R5 Ryzen Edition | |
| SCHENKER XMG Core 15 Ampere | |
| Cinebench R20 / CPU (Multi Core) | |
| Average of class Gaming (2179 - 16108, n=146, last 2 years) | |
| Lenovo Legion 5 15IAH7H 82RB | |
| Asus TUF Gaming F15 FX507ZM | |
| SCHENKER XMG Core 15 (M22) | |
| Average AMD Ryzen 7 6800H (4460 - 5661, n=9) | |
| Alienware m15 R5 Ryzen Edition | |
| SCHENKER XMG Core 15 Ampere | |
| SCHENKER XMG Fusion 15 (Mid 22) | |
| Cinebench R20 / CPU (Single Core) | |
| Average of class Gaming (439 - 870, n=146, last 2 years) | |
| Lenovo Legion 5 15IAH7H 82RB | |
| Asus TUF Gaming F15 FX507ZM | |
| SCHENKER XMG Core 15 (M22) | |
| Average AMD Ryzen 7 6800H (580 - 605, n=9) | |
| SCHENKER XMG Fusion 15 (Mid 22) | |
| Alienware m15 R5 Ryzen Edition | |
| SCHENKER XMG Core 15 Ampere | |
| Cinebench R15 / CPU Multi 64Bit | |
| Average of class Gaming (1537 - 6271, n=146, last 2 years) | |
| Lenovo Legion 5 15IAH7H 82RB | |
| Asus TUF Gaming F15 FX507ZM | |
| SCHENKER XMG Core 15 (M22) | |
| Average AMD Ryzen 7 6800H (1585 - 2366, n=10) | |
| Alienware m15 R5 Ryzen Edition | |
| SCHENKER XMG Core 15 Ampere | |
| SCHENKER XMG Fusion 15 (Mid 22) | |
| Cinebench R15 / CPU Single 64Bit | |
| Average of class Gaming (191.9 - 343, n=145, last 2 years) | |
| Lenovo Legion 5 15IAH7H 82RB | |
| Asus TUF Gaming F15 FX507ZM | |
| SCHENKER XMG Core 15 (M22) | |
| Average AMD Ryzen 7 6800H (182.7 - 250, n=10) | |
| Alienware m15 R5 Ryzen Edition | |
| SCHENKER XMG Fusion 15 (Mid 22) | |
| SCHENKER XMG Core 15 Ampere | |
| Blender / v2.79 BMW27 CPU | |
| SCHENKER XMG Fusion 15 (Mid 22) | |
| Alienware m15 R5 Ryzen Edition | |
| SCHENKER XMG Core 15 Ampere | |
| Average AMD Ryzen 7 6800H (213 - 268, n=8) | |
| SCHENKER XMG Core 15 (M22) | |
| Asus TUF Gaming F15 FX507ZM | |
| Lenovo Legion 5 15IAH7H 82RB | |
| Average of class Gaming (80 - 517, n=142, last 2 years) | |
| 7-Zip 18.03 / 7z b 4 | |
| Average of class Gaming (23795 - 148086, n=144, last 2 years) | |
| Lenovo Legion 5 15IAH7H 82RB | |
| Asus TUF Gaming F15 FX507ZM | |
| SCHENKER XMG Core 15 (M22) | |
| Average AMD Ryzen 7 6800H (55067 - 64817, n=8) | |
| Alienware m15 R5 Ryzen Edition | |
| SCHENKER XMG Core 15 Ampere | |
| SCHENKER XMG Fusion 15 (Mid 22) | |
| 7-Zip 18.03 / 7z b 4 -mmt1 | |
| Average of class Gaming (4199 - 7573, n=144, last 2 years) | |
| Lenovo Legion 5 15IAH7H 82RB | |
| SCHENKER XMG Core 15 (M22) | |
| Average AMD Ryzen 7 6800H (5521 - 5803, n=8) | |
| Alienware m15 R5 Ryzen Edition | |
| SCHENKER XMG Fusion 15 (Mid 22) | |
| Asus TUF Gaming F15 FX507ZM | |
| SCHENKER XMG Core 15 Ampere | |
| Geekbench 5.5 / Multi-Core | |
| Average of class Gaming (4557 - 27010, n=143, last 2 years) | |
| Lenovo Legion 5 15IAH7H 82RB | |
| Asus TUF Gaming F15 FX507ZM | |
| SCHENKER XMG Core 15 (M22) | |
| Average AMD Ryzen 7 6800H (8898 - 10355, n=10) | |
| SCHENKER XMG Fusion 15 (Mid 22) | |
| SCHENKER XMG Core 15 Ampere | |
| Alienware m15 R5 Ryzen Edition | |
| Geekbench 5.5 / Single-Core | |
| Average of class Gaming (986 - 2423, n=143, last 2 years) | |
| Lenovo Legion 5 15IAH7H 82RB | |
| Asus TUF Gaming F15 FX507ZM | |
| SCHENKER XMG Fusion 15 (Mid 22) | |
| SCHENKER XMG Core 15 (M22) | |
| Average AMD Ryzen 7 6800H (1518 - 1568, n=10) | |
| Alienware m15 R5 Ryzen Edition | |
| SCHENKER XMG Core 15 Ampere | |
| HWBOT x265 Benchmark v2.2 / 4k Preset | |
| Average of class Gaming (7.7 - 44.3, n=144, last 2 years) | |
| Lenovo Legion 5 15IAH7H 82RB | |
| Asus TUF Gaming F15 FX507ZM | |
| SCHENKER XMG Core 15 (M22) | |
| Average AMD Ryzen 7 6800H (14.9 - 18.5, n=9) | |
| Alienware m15 R5 Ryzen Edition | |
| SCHENKER XMG Core 15 Ampere | |
| SCHENKER XMG Fusion 15 (Mid 22) | |
| LibreOffice / 20 Documents To PDF | |
| SCHENKER XMG Core 15 (M22) | |
| SCHENKER XMG Core 15 Ampere | |
| Alienware m15 R5 Ryzen Edition | |
| Average AMD Ryzen 7 6800H (48.7 - 79.5, n=8) | |
| Asus TUF Gaming F15 FX507ZM | |
| SCHENKER XMG Fusion 15 (Mid 22) | |
| Average of class Gaming (19 - 96.6, n=142, last 2 years) | |
| Lenovo Legion 5 15IAH7H 82RB | |
| R Benchmark 2.5 / Overall mean | |
| SCHENKER XMG Core 15 Ampere | |
| SCHENKER XMG Fusion 15 (Mid 22) | |
| Alienware m15 R5 Ryzen Edition | |
| Average AMD Ryzen 7 6800H (0.4783 - 0.515, n=8) | |
| SCHENKER XMG Core 15 (M22) | |
| Asus TUF Gaming F15 FX507ZM | |
| Lenovo Legion 5 15IAH7H 82RB | |
| Average of class Gaming (0.3551 - 0.759, n=145, last 2 years) | |
* ... smaller is better
AIDA64: FP32 Ray-Trace | FPU Julia | CPU SHA3 | CPU Queen | FPU SinJulia | FPU Mandel | CPU AES | CPU ZLib | FP64 Ray-Trace | CPU PhotoWorxx
| Performance Rating | |
| Average of class Gaming | |
| Lenovo Legion 5 15IAH7H 82RB | |
| SCHENKER XMG Core 15 (M22) | |
| Average AMD Ryzen 7 6800H | |
| Alienware m15 R5 Ryzen Edition | |
| SCHENKER XMG Core 15 Ampere | |
| SCHENKER XMG Fusion 15 (Mid 22) | |
| Asus TUF Gaming F15 FX507ZM | |
| AIDA64 / FP32 Ray-Trace | |
| Average of class Gaming (7192 - 85542, n=143, last 2 years) | |
| Lenovo Legion 5 15IAH7H 82RB | |
| SCHENKER XMG Core 15 (M22) | |
| Average AMD Ryzen 7 6800H (12876 - 17031, n=8) | |
| SCHENKER XMG Core 15 Ampere | |
| Alienware m15 R5 Ryzen Edition | |
| SCHENKER XMG Fusion 15 (Mid 22) | |
| Asus TUF Gaming F15 FX507ZM | |
| AIDA64 / FPU Julia | |
| Average of class Gaming (35040 - 252486, n=143, last 2 years) | |
| SCHENKER XMG Core 15 (M22) | |
| Average AMD Ryzen 7 6800H (82673 - 105987, n=8) | |
| Alienware m15 R5 Ryzen Edition | |
| Lenovo Legion 5 15IAH7H 82RB | |
| SCHENKER XMG Core 15 Ampere | |
| SCHENKER XMG Fusion 15 (Mid 22) | |
| Asus TUF Gaming F15 FX507ZM | |
| AIDA64 / CPU SHA3 | |
| Average of class Gaming (1728 - 10389, n=143, last 2 years) | |
| Lenovo Legion 5 15IAH7H 82RB | |
| SCHENKER XMG Fusion 15 (Mid 22) | |
| SCHENKER XMG Core 15 (M22) | |
| Asus TUF Gaming F15 FX507ZM | |
| Average AMD Ryzen 7 6800H (2886 - 3634, n=8) | |
| Alienware m15 R5 Ryzen Edition | |
| SCHENKER XMG Core 15 Ampere | |
| AIDA64 / CPU Queen | |
| Average of class Gaming (50699 - 200651, n=143, last 2 years) | |
| Lenovo Legion 5 15IAH7H 82RB | |
| Asus TUF Gaming F15 FX507ZM | |
| SCHENKER XMG Core 15 Ampere | |
| Average AMD Ryzen 7 6800H (75117 - 106322, n=8) | |
| Alienware m15 R5 Ryzen Edition | |
| SCHENKER XMG Core 15 (M22) | |
| SCHENKER XMG Fusion 15 (Mid 22) | |
| AIDA64 / FPU SinJulia | |
| SCHENKER XMG Core 15 Ampere | |
| Average of class Gaming (5020 - 33636, n=143, last 2 years) | |
| SCHENKER XMG Core 15 (M22) | |
| Average AMD Ryzen 7 6800H (11771 - 13120, n=8) | |
| Alienware m15 R5 Ryzen Edition | |
| Lenovo Legion 5 15IAH7H 82RB | |
| Asus TUF Gaming F15 FX507ZM | |
| SCHENKER XMG Fusion 15 (Mid 22) | |
| AIDA64 / FPU Mandel | |
| Average of class Gaming (17585 - 134044, n=143, last 2 years) | |
| SCHENKER XMG Core 15 (M22) | |
| Average AMD Ryzen 7 6800H (45287 - 58327, n=8) | |
| Alienware m15 R5 Ryzen Edition | |
| Lenovo Legion 5 15IAH7H 82RB | |
| SCHENKER XMG Core 15 Ampere | |
| SCHENKER XMG Fusion 15 (Mid 22) | |
| Asus TUF Gaming F15 FX507ZM | |
| AIDA64 / CPU AES | |
| Lenovo Legion 5 15IAH7H 82RB | |
| SCHENKER XMG Fusion 15 (Mid 22) | |
| Alienware m15 R5 Ryzen Edition | |
| Average AMD Ryzen 7 6800H (67816 - 137383, n=8) | |
| Average of class Gaming (19065 - 328679, n=143, last 2 years) | |
| SCHENKER XMG Core 15 Ampere | |
| SCHENKER XMG Core 15 (M22) | |
| Asus TUF Gaming F15 FX507ZM | |
| AIDA64 / CPU ZLib | |
| Average of class Gaming (373 - 2531, n=143, last 2 years) | |
| Asus TUF Gaming F15 FX507ZM | |
| Lenovo Legion 5 15IAH7H 82RB | |
| SCHENKER XMG Core 15 (M22) | |
| SCHENKER XMG Core 15 Ampere | |
| Average AMD Ryzen 7 6800H (732 - 901, n=8) | |
| Alienware m15 R5 Ryzen Edition | |
| SCHENKER XMG Fusion 15 (Mid 22) | |
| AIDA64 / FP64 Ray-Trace | |
| Average of class Gaming (3856 - 45446, n=143, last 2 years) | |
| Lenovo Legion 5 15IAH7H 82RB | |
| SCHENKER XMG Core 15 (M22) | |
| Average AMD Ryzen 7 6800H (6917 - 8980, n=8) | |
| SCHENKER XMG Core 15 Ampere | |
| Alienware m15 R5 Ryzen Edition | |
| SCHENKER XMG Fusion 15 (Mid 22) | |
| Asus TUF Gaming F15 FX507ZM | |
| AIDA64 / CPU PhotoWorxx | |
| Average of class Gaming (10805 - 62916, n=143, last 2 years) | |
| Lenovo Legion 5 15IAH7H 82RB | |
| Asus TUF Gaming F15 FX507ZM | |
| SCHENKER XMG Core 15 (M22) | |
| Average AMD Ryzen 7 6800H (26496 - 30360, n=8) | |
| SCHENKER XMG Core 15 Ampere | |
| SCHENKER XMG Fusion 15 (Mid 22) | |
| Alienware m15 R5 Ryzen Edition | |
System performance
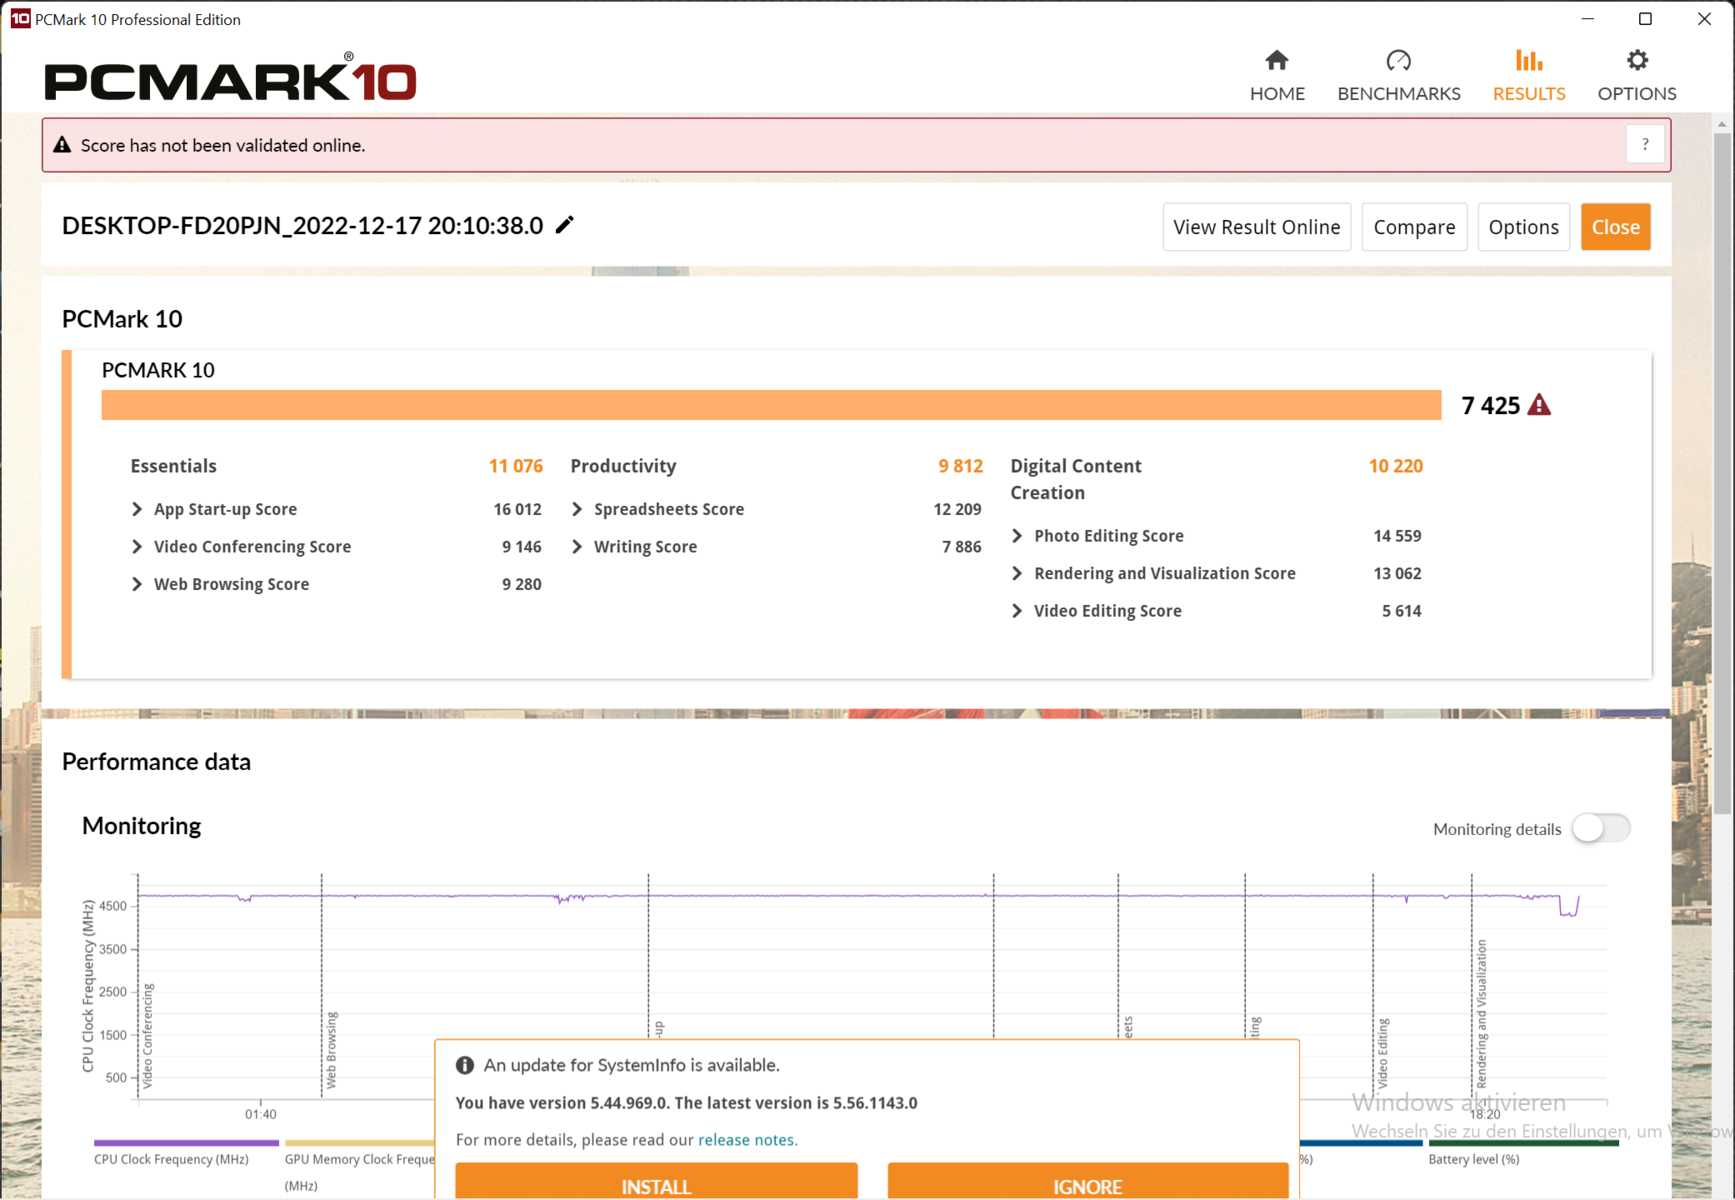
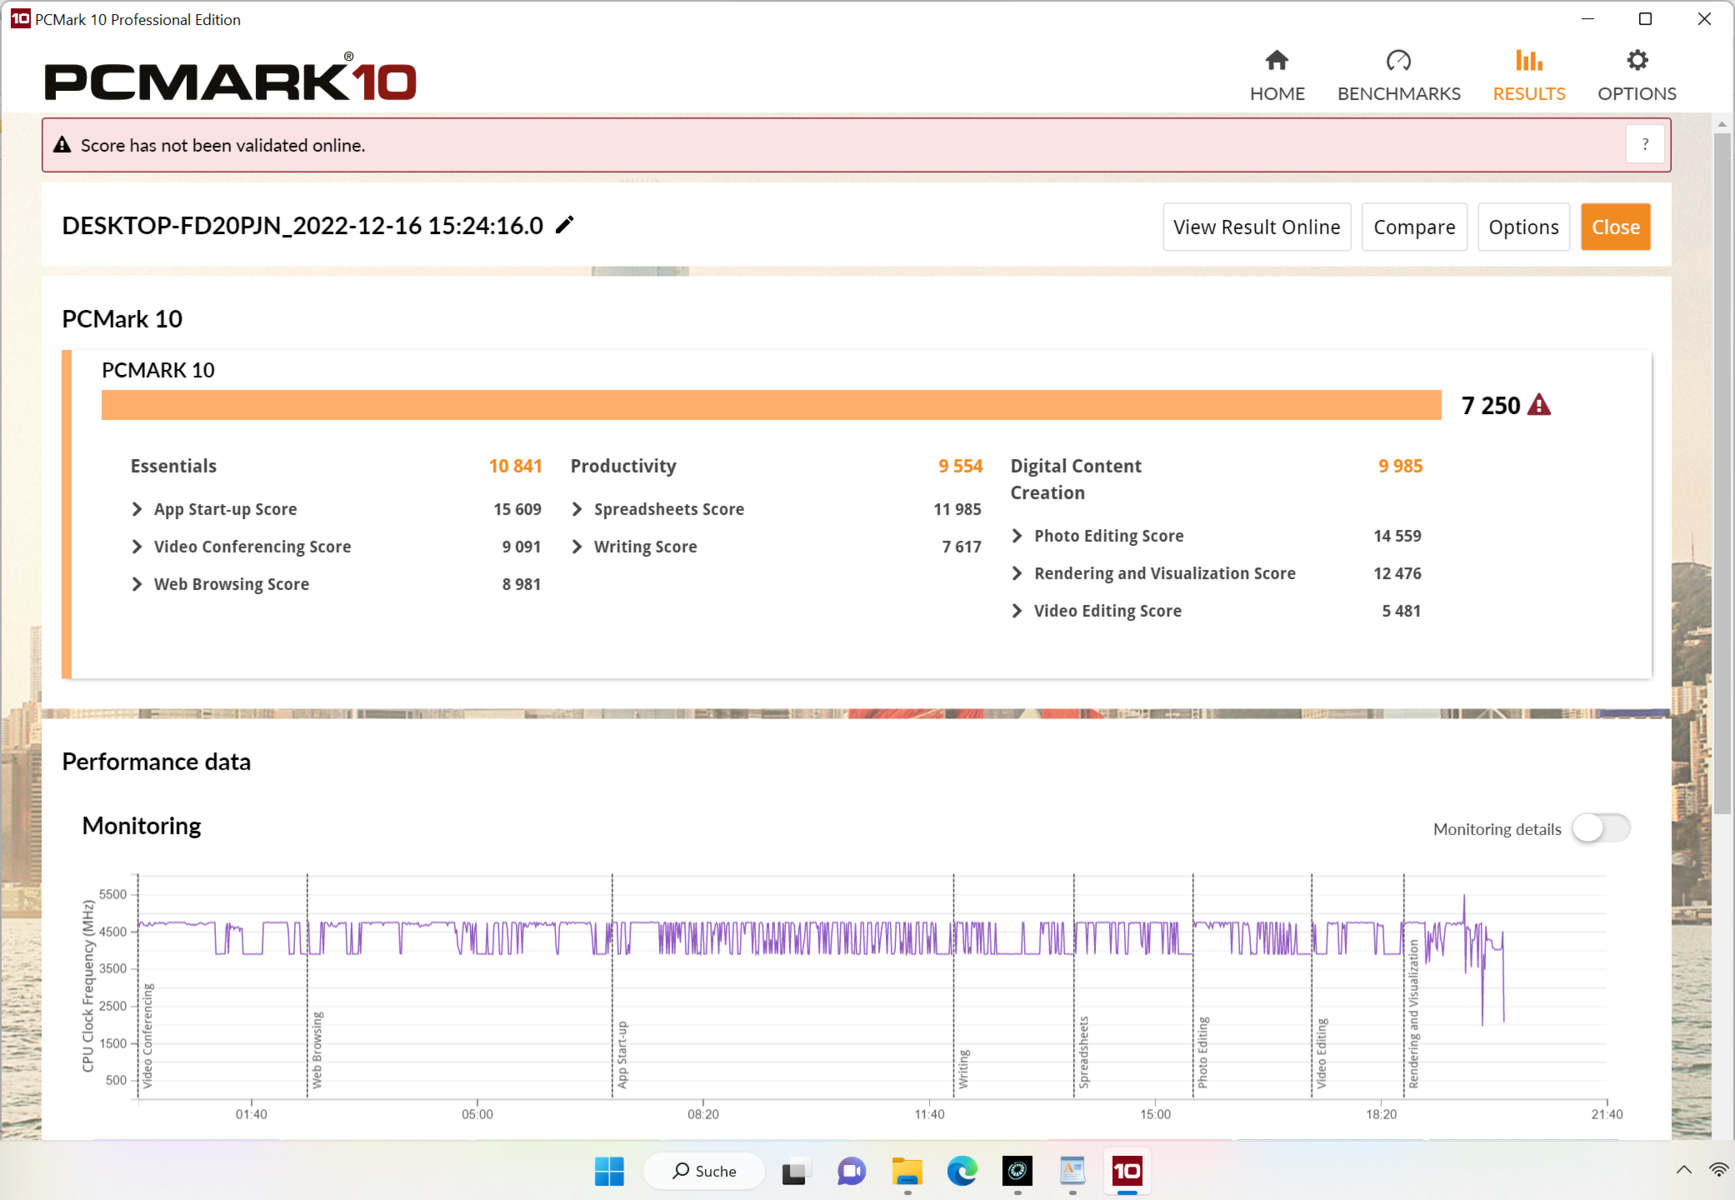
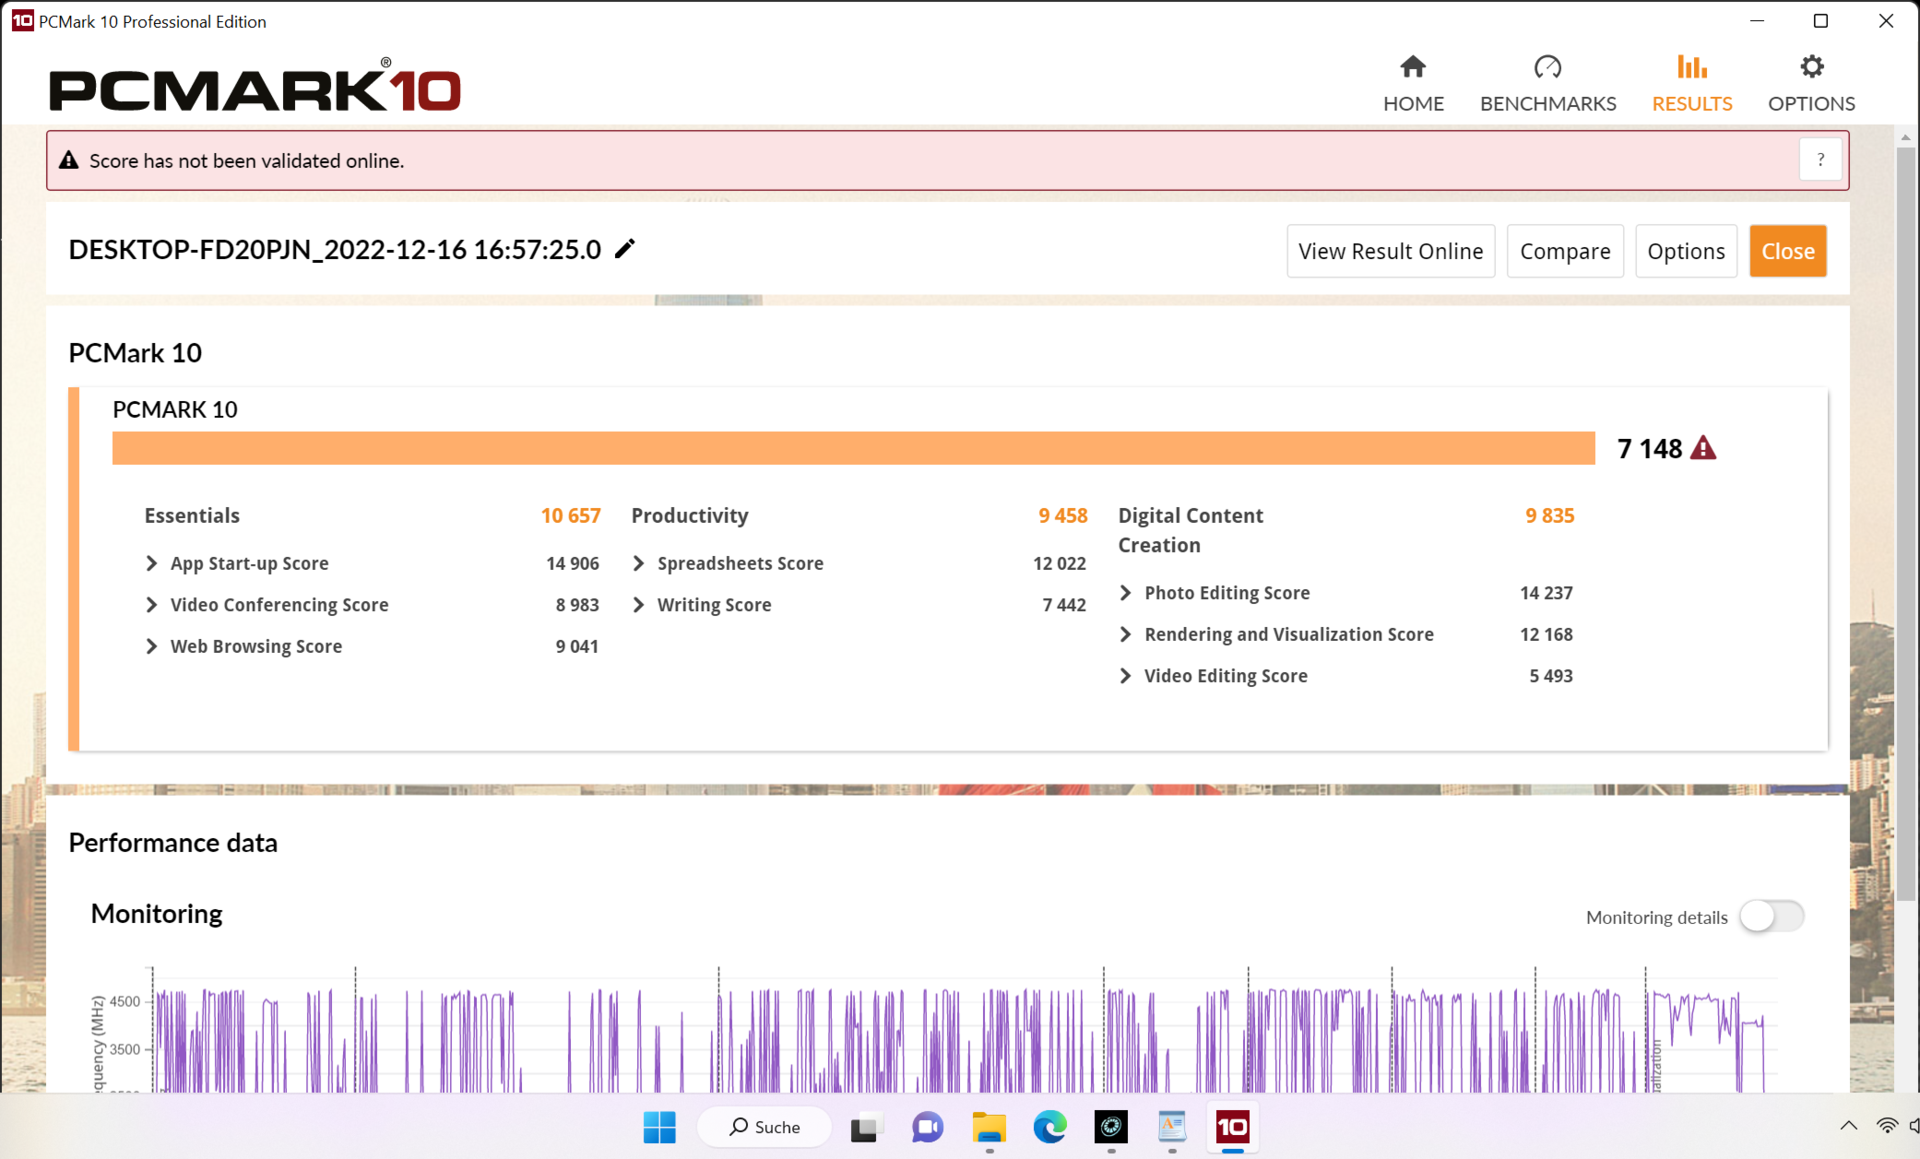
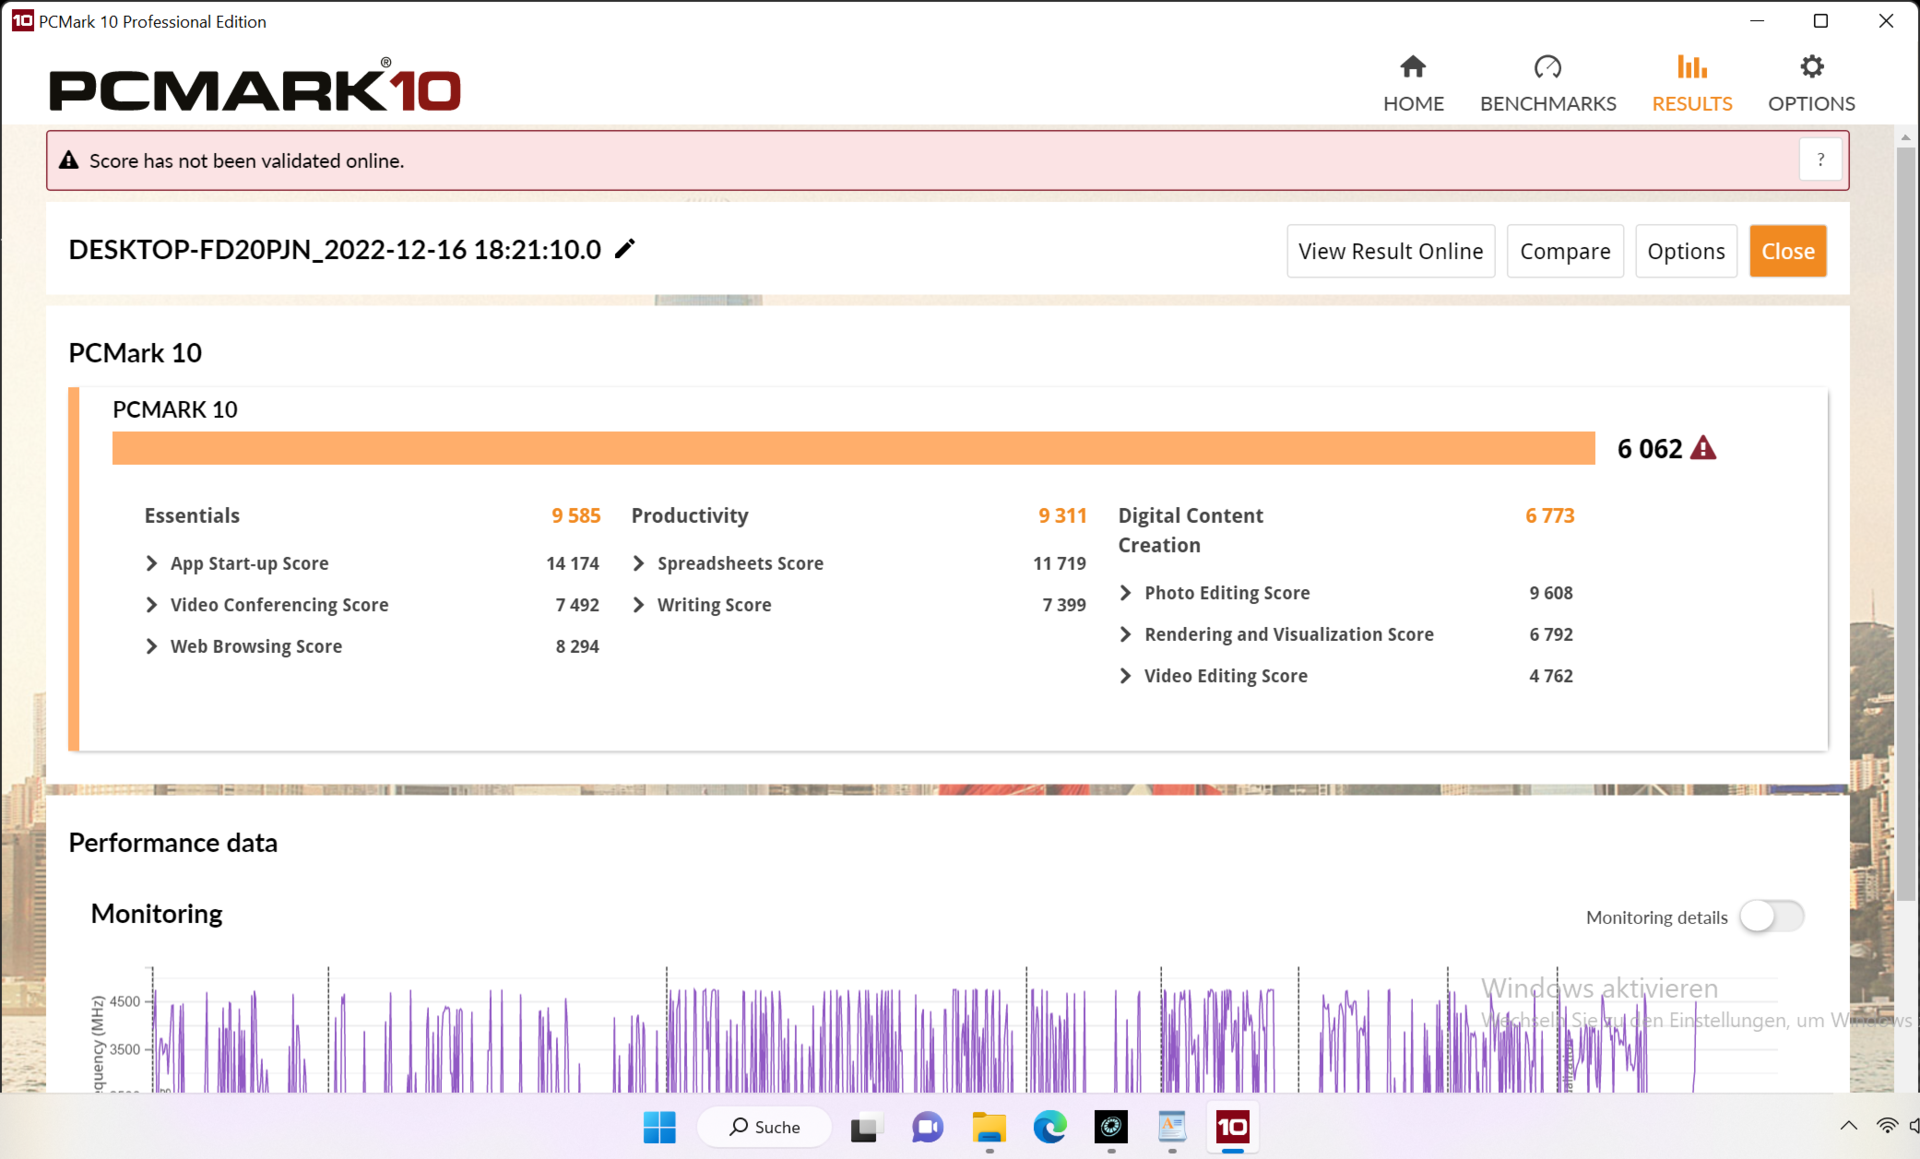
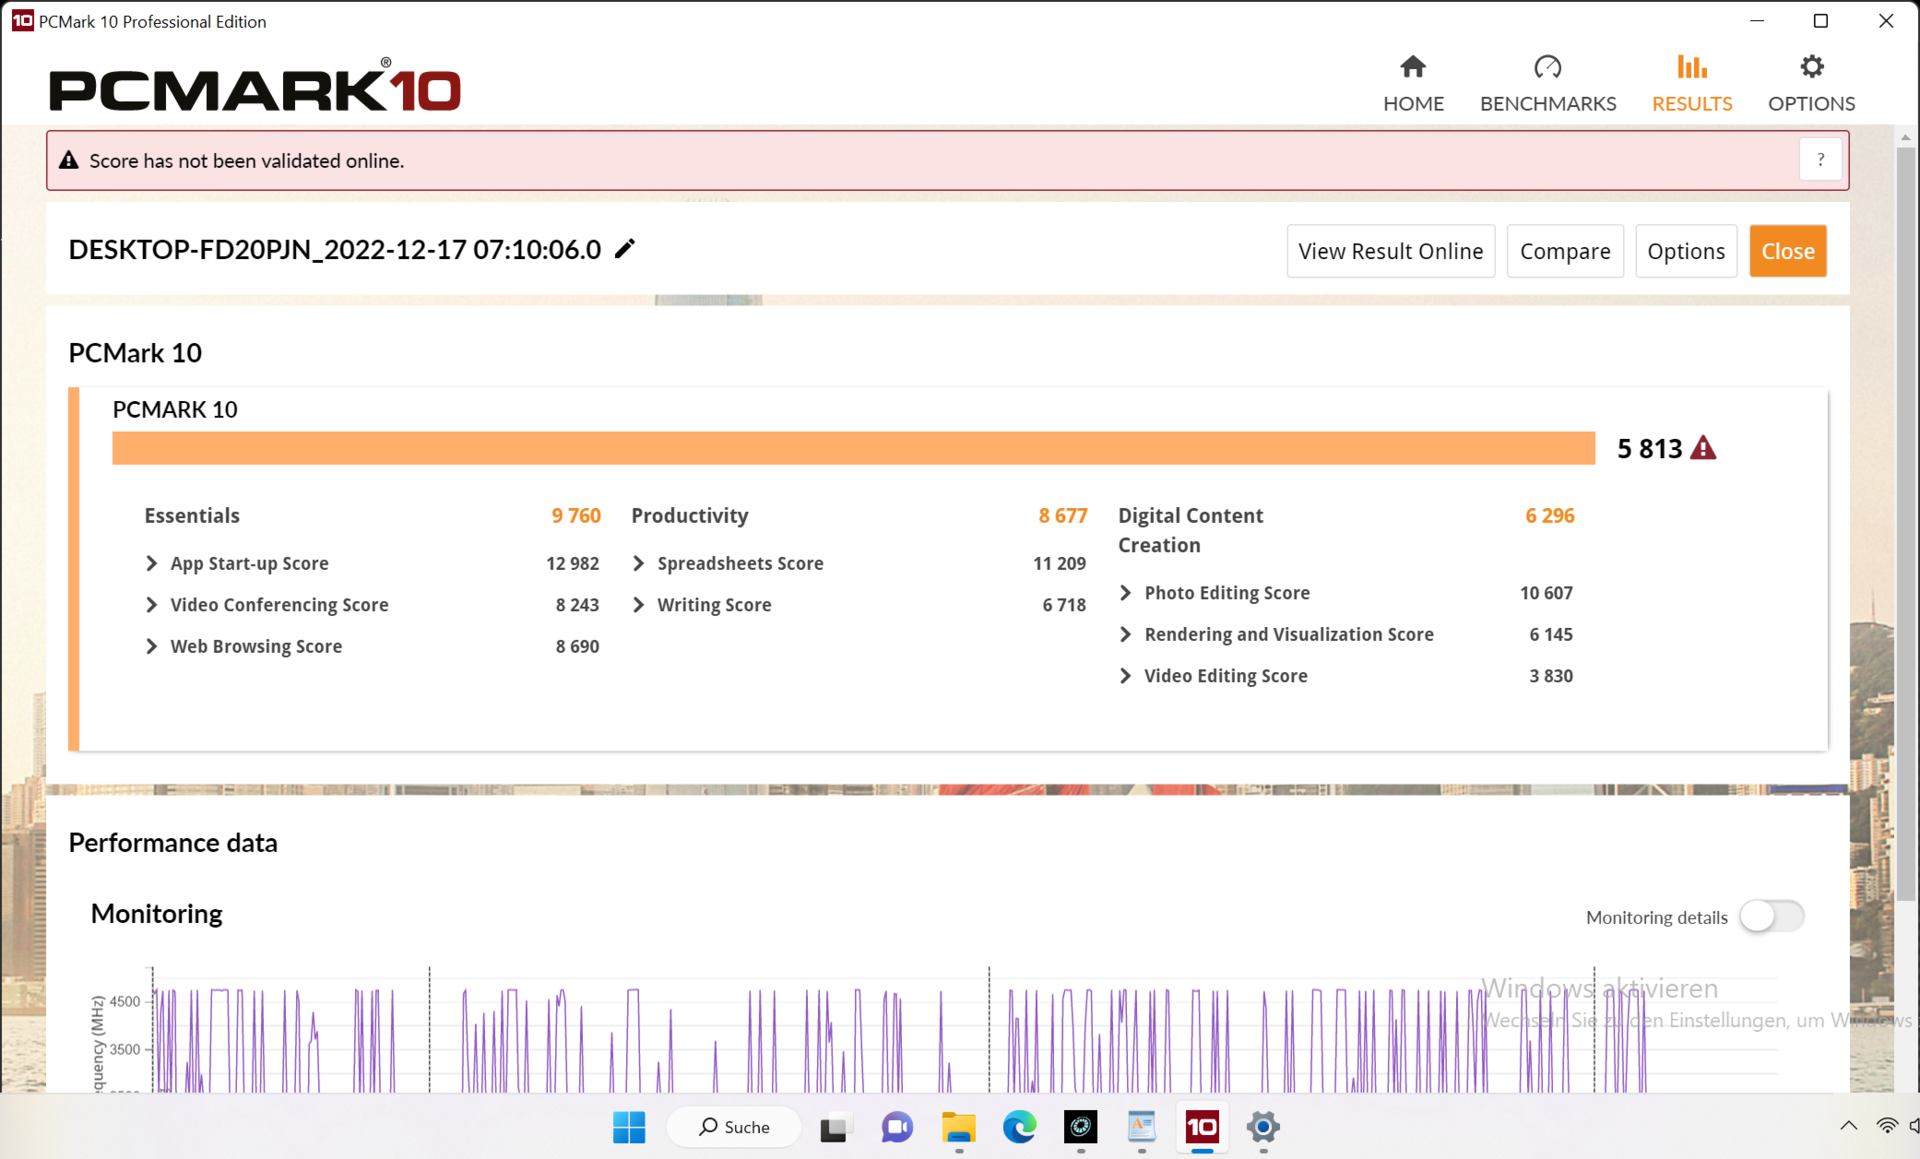
The PCMark 10 benchmark reveals a result on the expected level for the system configuration. Everyday tasks are processed swiftly and without lags.
Web surfing is a bit faster on Intel systems due to the stronger Turbo and the single-core performance - but the difference is hardly noticeable in practice.
CrossMark: Overall | Productivity | Creativity | Responsiveness
Mozilla Kraken 1.1: Total
Speedometer 2.0: Result
Octane V2: Total Score
Jetstream 2: 2.0 Total Score
WebXPRT 3: Overall
WebXPRT 4: Overall
| PCMark 10 / Score | |
| Lenovo Legion 5 15IAH7H 82RB | |
| Average of class Gaming (5776 - 9852, n=130, last 2 years) | |
| Asus TUF Gaming F15 FX507ZM | |
| SCHENKER XMG Core 15 (M22) | |
| Average AMD Ryzen 7 6800H, NVIDIA GeForce RTX 3060 Laptop GPU (n=1) | |
| Alienware m15 R5 Ryzen Edition | |
| SCHENKER XMG Fusion 15 (Mid 22) | |
| SCHENKER XMG Core 15 Ampere | |
| PCMark 10 / Essentials | |
| Lenovo Legion 5 15IAH7H 82RB | |
| SCHENKER XMG Core 15 (M22) | |
| Average AMD Ryzen 7 6800H, NVIDIA GeForce RTX 3060 Laptop GPU (n=1) | |
| Average of class Gaming (9057 - 12600, n=130, last 2 years) | |
| Asus TUF Gaming F15 FX507ZM | |
| Alienware m15 R5 Ryzen Edition | |
| SCHENKER XMG Fusion 15 (Mid 22) | |
| SCHENKER XMG Core 15 Ampere | |
| PCMark 10 / Productivity | |
| Lenovo Legion 5 15IAH7H 82RB | |
| Average of class Gaming (6662 - 14612, n=130, last 2 years) | |
| SCHENKER XMG Core 15 (M22) | |
| Average AMD Ryzen 7 6800H, NVIDIA GeForce RTX 3060 Laptop GPU (n=1) | |
| Asus TUF Gaming F15 FX507ZM | |
| Alienware m15 R5 Ryzen Edition | |
| SCHENKER XMG Fusion 15 (Mid 22) | |
| SCHENKER XMG Core 15 Ampere | |
| PCMark 10 / Digital Content Creation | |
| Average of class Gaming (7440 - 19351, n=130, last 2 years) | |
| Lenovo Legion 5 15IAH7H 82RB | |
| Asus TUF Gaming F15 FX507ZM | |
| SCHENKER XMG Core 15 (M22) | |
| Average AMD Ryzen 7 6800H, NVIDIA GeForce RTX 3060 Laptop GPU (n=1) | |
| Alienware m15 R5 Ryzen Edition | |
| SCHENKER XMG Core 15 Ampere | |
| SCHENKER XMG Fusion 15 (Mid 22) | |
| CrossMark / Overall | |
| Lenovo Legion 5 15IAH7H 82RB | |
| Average of class Gaming (1247 - 2344, n=112, last 2 years) | |
| SCHENKER XMG Fusion 15 (Mid 22) | |
| SCHENKER XMG Core 15 (M22) | |
| Average AMD Ryzen 7 6800H, NVIDIA GeForce RTX 3060 Laptop GPU (n=1) | |
| CrossMark / Productivity | |
| Lenovo Legion 5 15IAH7H 82RB | |
| Average of class Gaming (1299 - 2211, n=112, last 2 years) | |
| SCHENKER XMG Fusion 15 (Mid 22) | |
| SCHENKER XMG Core 15 (M22) | |
| Average AMD Ryzen 7 6800H, NVIDIA GeForce RTX 3060 Laptop GPU (n=1) | |
| CrossMark / Creativity | |
| Average of class Gaming (1275 - 2729, n=112, last 2 years) | |
| Lenovo Legion 5 15IAH7H 82RB | |
| SCHENKER XMG Core 15 (M22) | |
| Average AMD Ryzen 7 6800H, NVIDIA GeForce RTX 3060 Laptop GPU (n=1) | |
| SCHENKER XMG Fusion 15 (Mid 22) | |
| CrossMark / Responsiveness | |
| Lenovo Legion 5 15IAH7H 82RB | |
| Average of class Gaming (1030 - 2330, n=112, last 2 years) | |
| SCHENKER XMG Fusion 15 (Mid 22) | |
| SCHENKER XMG Core 15 (M22) | |
| Average AMD Ryzen 7 6800H, NVIDIA GeForce RTX 3060 Laptop GPU (n=1) | |
| Mozilla Kraken 1.1 / Total | |
| SCHENKER XMG Core 15 Ampere | |
| SCHENKER XMG Fusion 15 (Mid 22) | |
| Alienware m15 R5 Ryzen Edition | |
| SCHENKER XMG Core 15 (M22) | |
| Average AMD Ryzen 7 6800H, NVIDIA GeForce RTX 3060 Laptop GPU (n=1) | |
| Asus TUF Gaming F15 FX507ZM | |
| Lenovo Legion 5 15IAH7H 82RB | |
| Average of class Gaming (397 - 674, n=134, last 2 years) | |
| Speedometer 2.0 / Result | |
| Average of class Gaming (29 - 654, n=39, last 2 years) | |
| SCHENKER XMG Core 15 (M22) | |
| Average AMD Ryzen 7 6800H, NVIDIA GeForce RTX 3060 Laptop GPU (n=1) | |
| Alienware m15 R5 Ryzen Edition | |
| Octane V2 / Total Score | |
| Average of class Gaming (87588 - 132328, n=40, last 2 years) | |
| SCHENKER XMG Core 15 (M22) | |
| Average AMD Ryzen 7 6800H, NVIDIA GeForce RTX 3060 Laptop GPU (n=1) | |
| Alienware m15 R5 Ryzen Edition | |
| Jetstream 2 / 2.0 Total Score | |
| Average of class Gaming (231 - 477, n=50, last 2 years) | |
| Lenovo Legion 5 15IAH7H 82RB | |
| Asus TUF Gaming F15 FX507ZM | |
| SCHENKER XMG Core 15 (M22) | |
| Average AMD Ryzen 7 6800H, NVIDIA GeForce RTX 3060 Laptop GPU (n=1) | |
| Alienware m15 R5 Ryzen Edition | |
| WebXPRT 3 / Overall | |
| Lenovo Legion 5 15IAH7H 82RB | |
| Average of class Gaming (237 - 532, n=124, last 2 years) | |
| Asus TUF Gaming F15 FX507ZM | |
| SCHENKER XMG Core 15 (M22) | |
| Average AMD Ryzen 7 6800H, NVIDIA GeForce RTX 3060 Laptop GPU (n=1) | |
| Alienware m15 R5 Ryzen Edition | |
| SCHENKER XMG Fusion 15 (Mid 22) | |
| SCHENKER XMG Core 15 Ampere | |
| WebXPRT 4 / Overall | |
| Average of class Gaming (176.4 - 341, n=111, last 2 years) | |
| Lenovo Legion 5 15IAH7H 82RB | |
| SCHENKER XMG Core 15 (M22) | |
| Average AMD Ryzen 7 6800H, NVIDIA GeForce RTX 3060 Laptop GPU (n=1) | |
| SCHENKER XMG Fusion 15 (Mid 22) | |
* ... smaller is better
| PCMark 10 Score | 7250 points | |
Help | ||
| AIDA64 / Memory Copy | |
| Average of class Gaming (21750 - 97515, n=143, last 2 years) | |
| Asus TUF Gaming F15 FX507ZM | |
| Lenovo Legion 5 15IAH7H 82RB | |
| SCHENKER XMG Core 15 (M22) | |
| Average AMD Ryzen 7 6800H (48209 - 51186, n=8) | |
| SCHENKER XMG Fusion 15 (Mid 22) | |
| SCHENKER XMG Core 15 Ampere | |
| Alienware m15 R5 Ryzen Edition | |
| AIDA64 / Memory Read | |
| Average of class Gaming (22956 - 104349, n=143, last 2 years) | |
| Lenovo Legion 5 15IAH7H 82RB | |
| Asus TUF Gaming F15 FX507ZM | |
| SCHENKER XMG Core 15 (M22) | |
| Average AMD Ryzen 7 6800H (43828 - 51778, n=8) | |
| SCHENKER XMG Fusion 15 (Mid 22) | |
| SCHENKER XMG Core 15 Ampere | |
| Alienware m15 R5 Ryzen Edition | |
| AIDA64 / Memory Write | |
| Average of class Gaming (22297 - 133486, n=143, last 2 years) | |
| Lenovo Legion 5 15IAH7H 82RB | |
| Asus TUF Gaming F15 FX507ZM | |
| SCHENKER XMG Core 15 (M22) | |
| Average AMD Ryzen 7 6800H (51116 - 55307, n=8) | |
| SCHENKER XMG Fusion 15 (Mid 22) | |
| SCHENKER XMG Core 15 Ampere | |
| Alienware m15 R5 Ryzen Edition | |
| AIDA64 / Memory Latency | |
| Average of class Gaming (59.5 - 259, n=143, last 2 years) | |
| Lenovo Legion 5 15IAH7H 82RB | |
| SCHENKER XMG Fusion 15 (Mid 22) | |
| Average AMD Ryzen 7 6800H (83.1 - 104.1, n=8) | |
| SCHENKER XMG Core 15 (M22) | |
| SCHENKER XMG Core 15 Ampere | |
| Alienware m15 R5 Ryzen Edition | |
| Asus TUF Gaming F15 FX507ZM | |
* ... smaller is better
DPC latencies
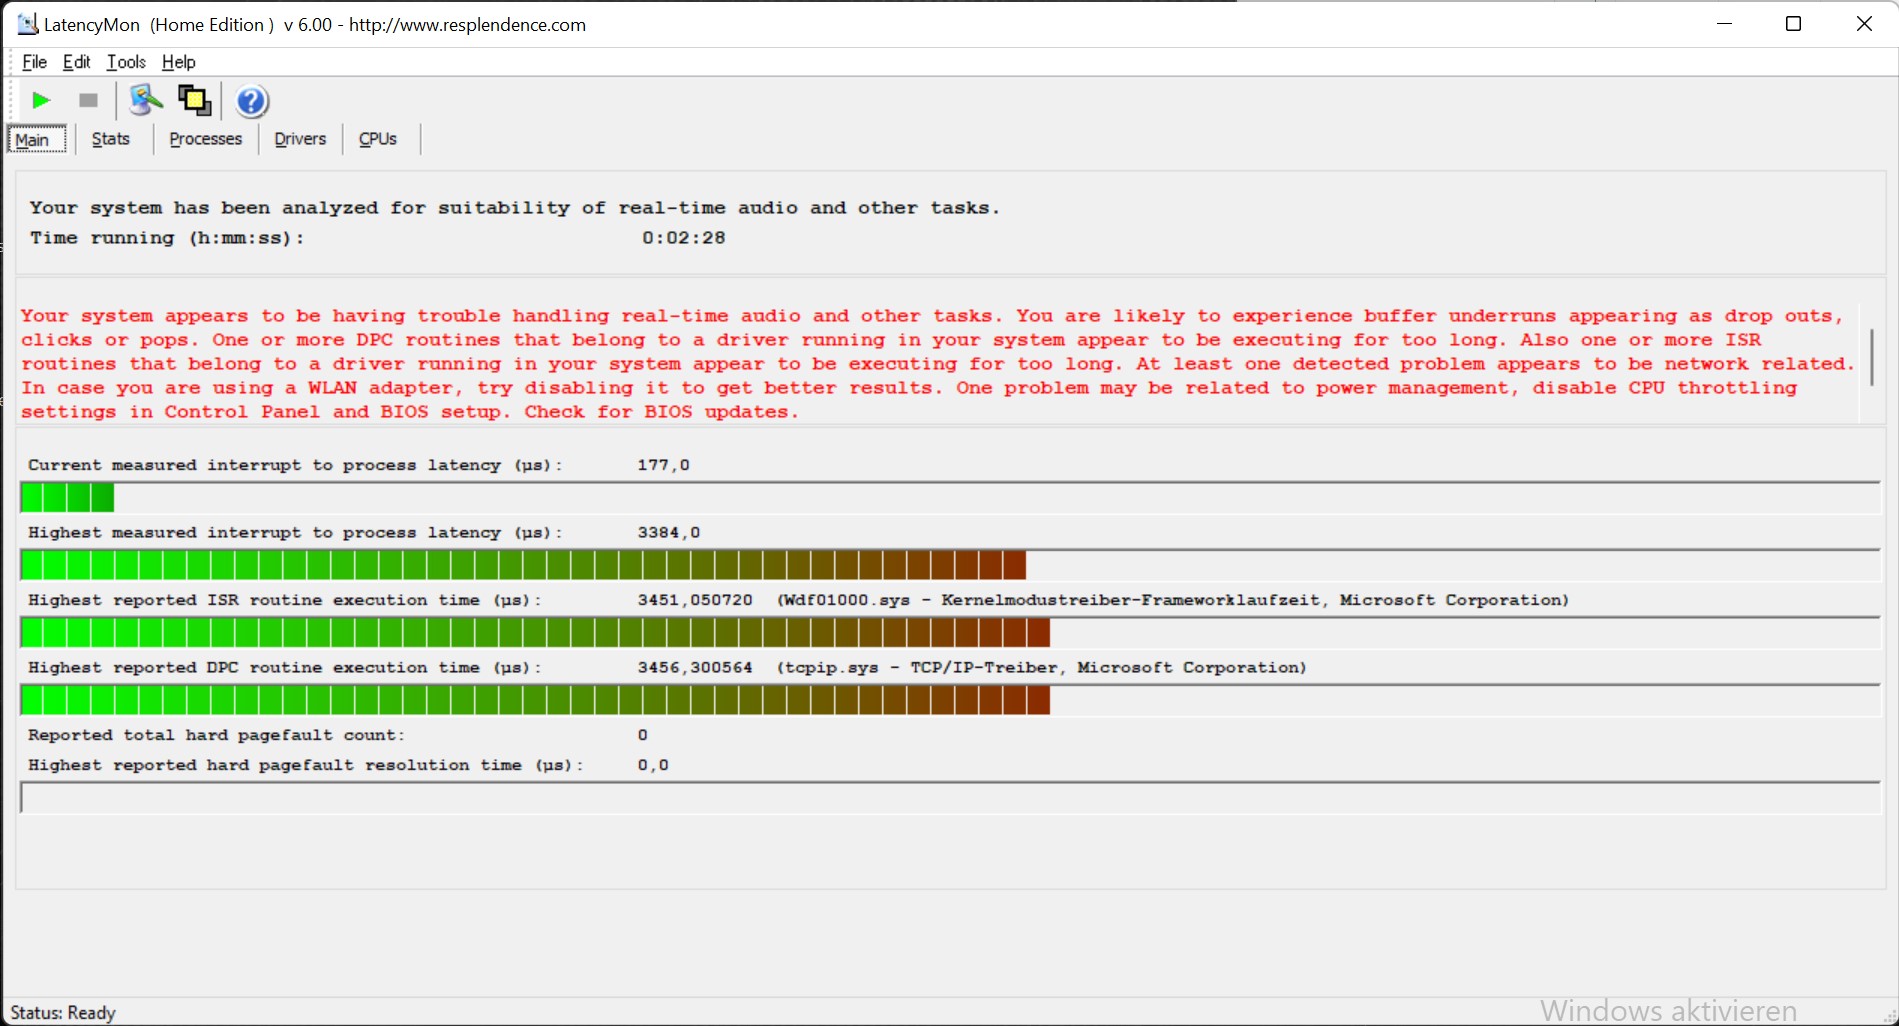
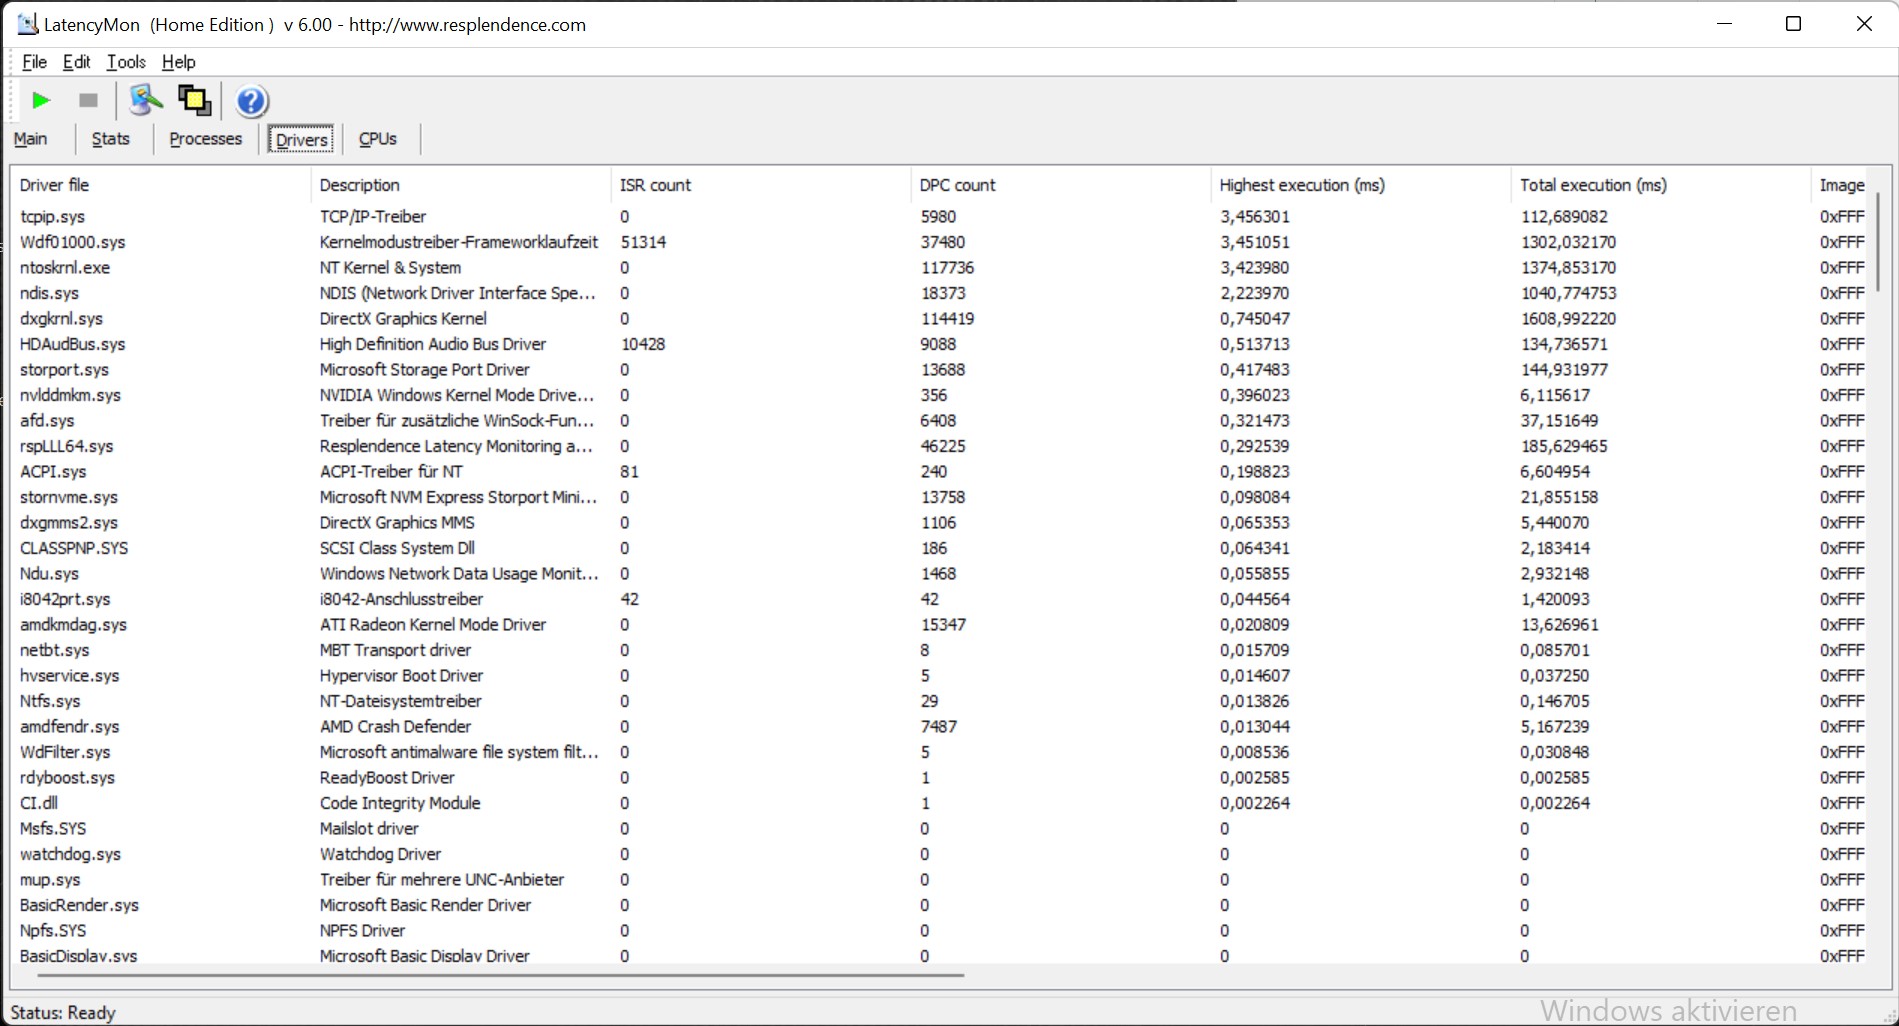
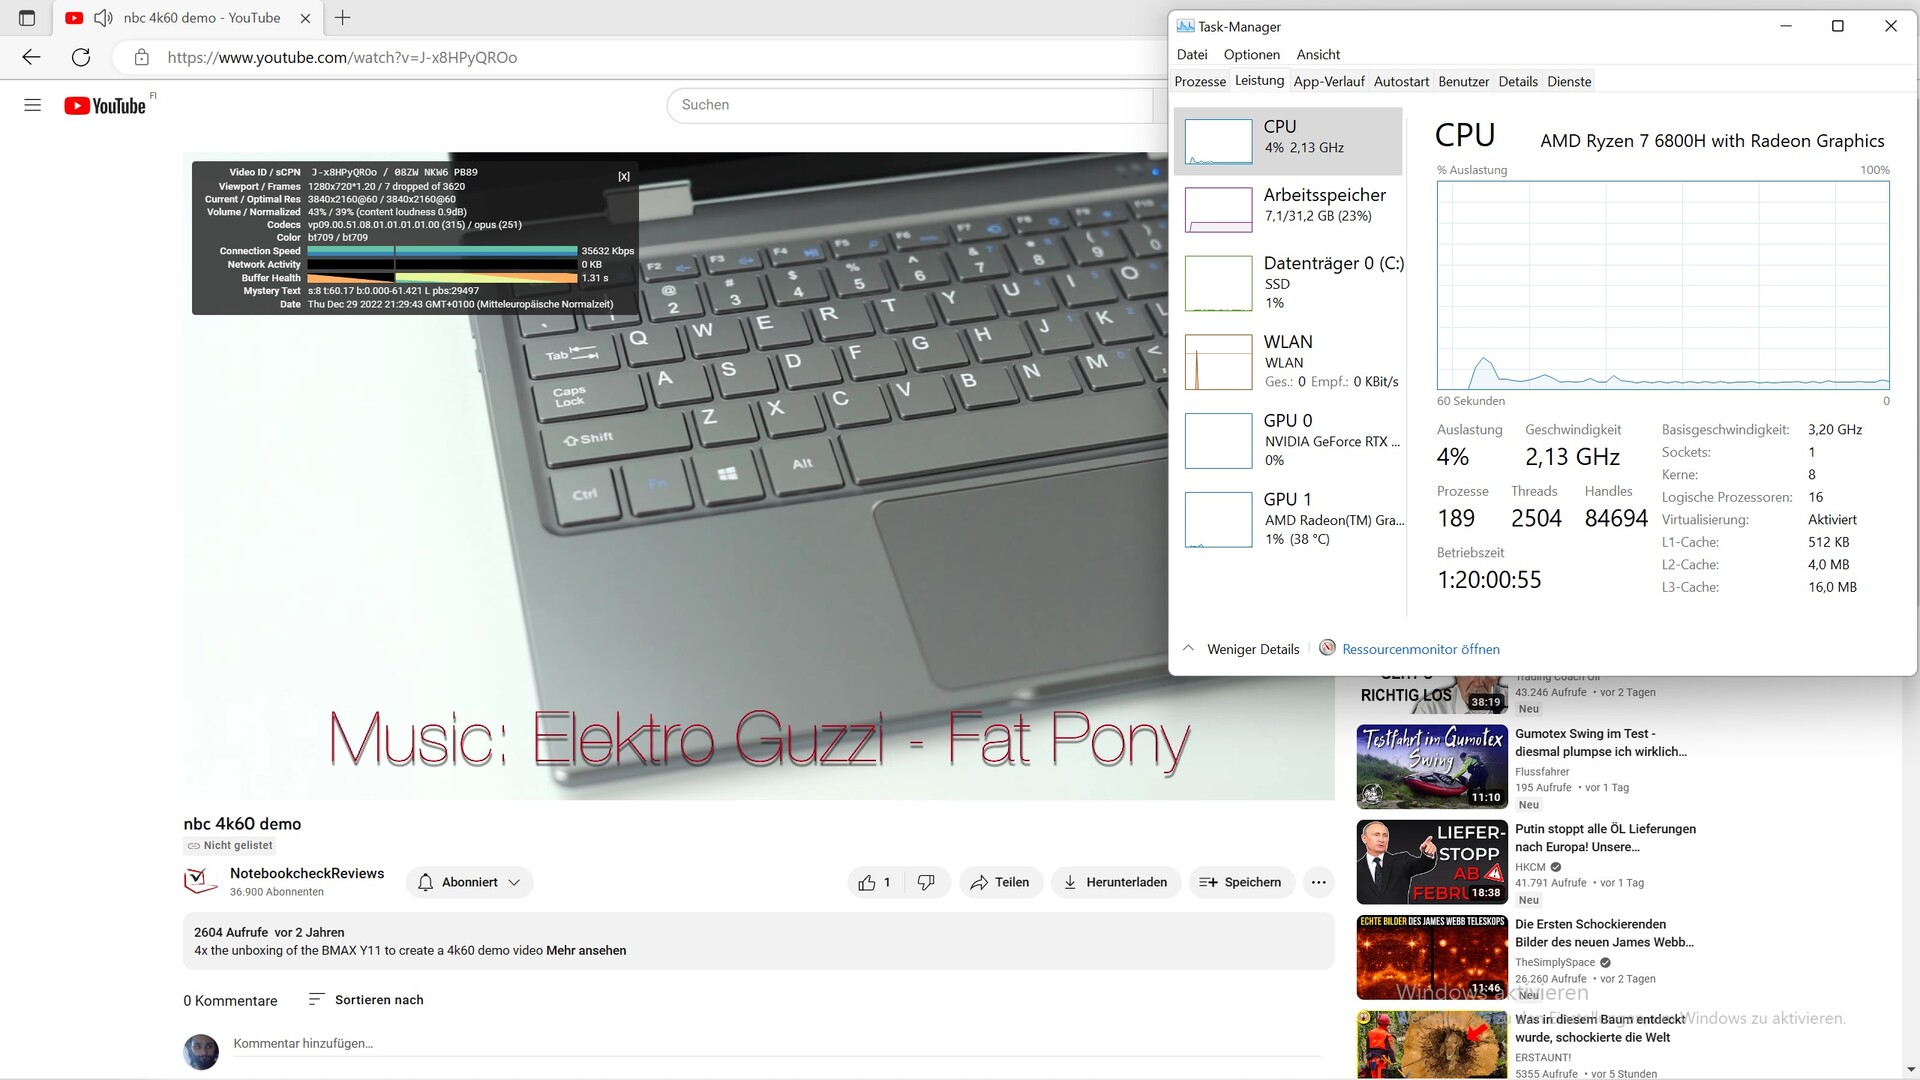
| DPC Latencies / LatencyMon - interrupt to process latency (max), Web, Youtube, Prime95 | |
| SCHENKER XMG Core 15 (M22) | |
| SCHENKER XMG Fusion 15 (Mid 22) | |
| Lenovo Legion 5 15IAH7H 82RB | |
| Asus TUF Gaming F15 FX507ZM | |
| SCHENKER XMG Core 15 Ampere | |
| Alienware m15 R5 Ryzen Edition | |
* ... smaller is better
Mass storage

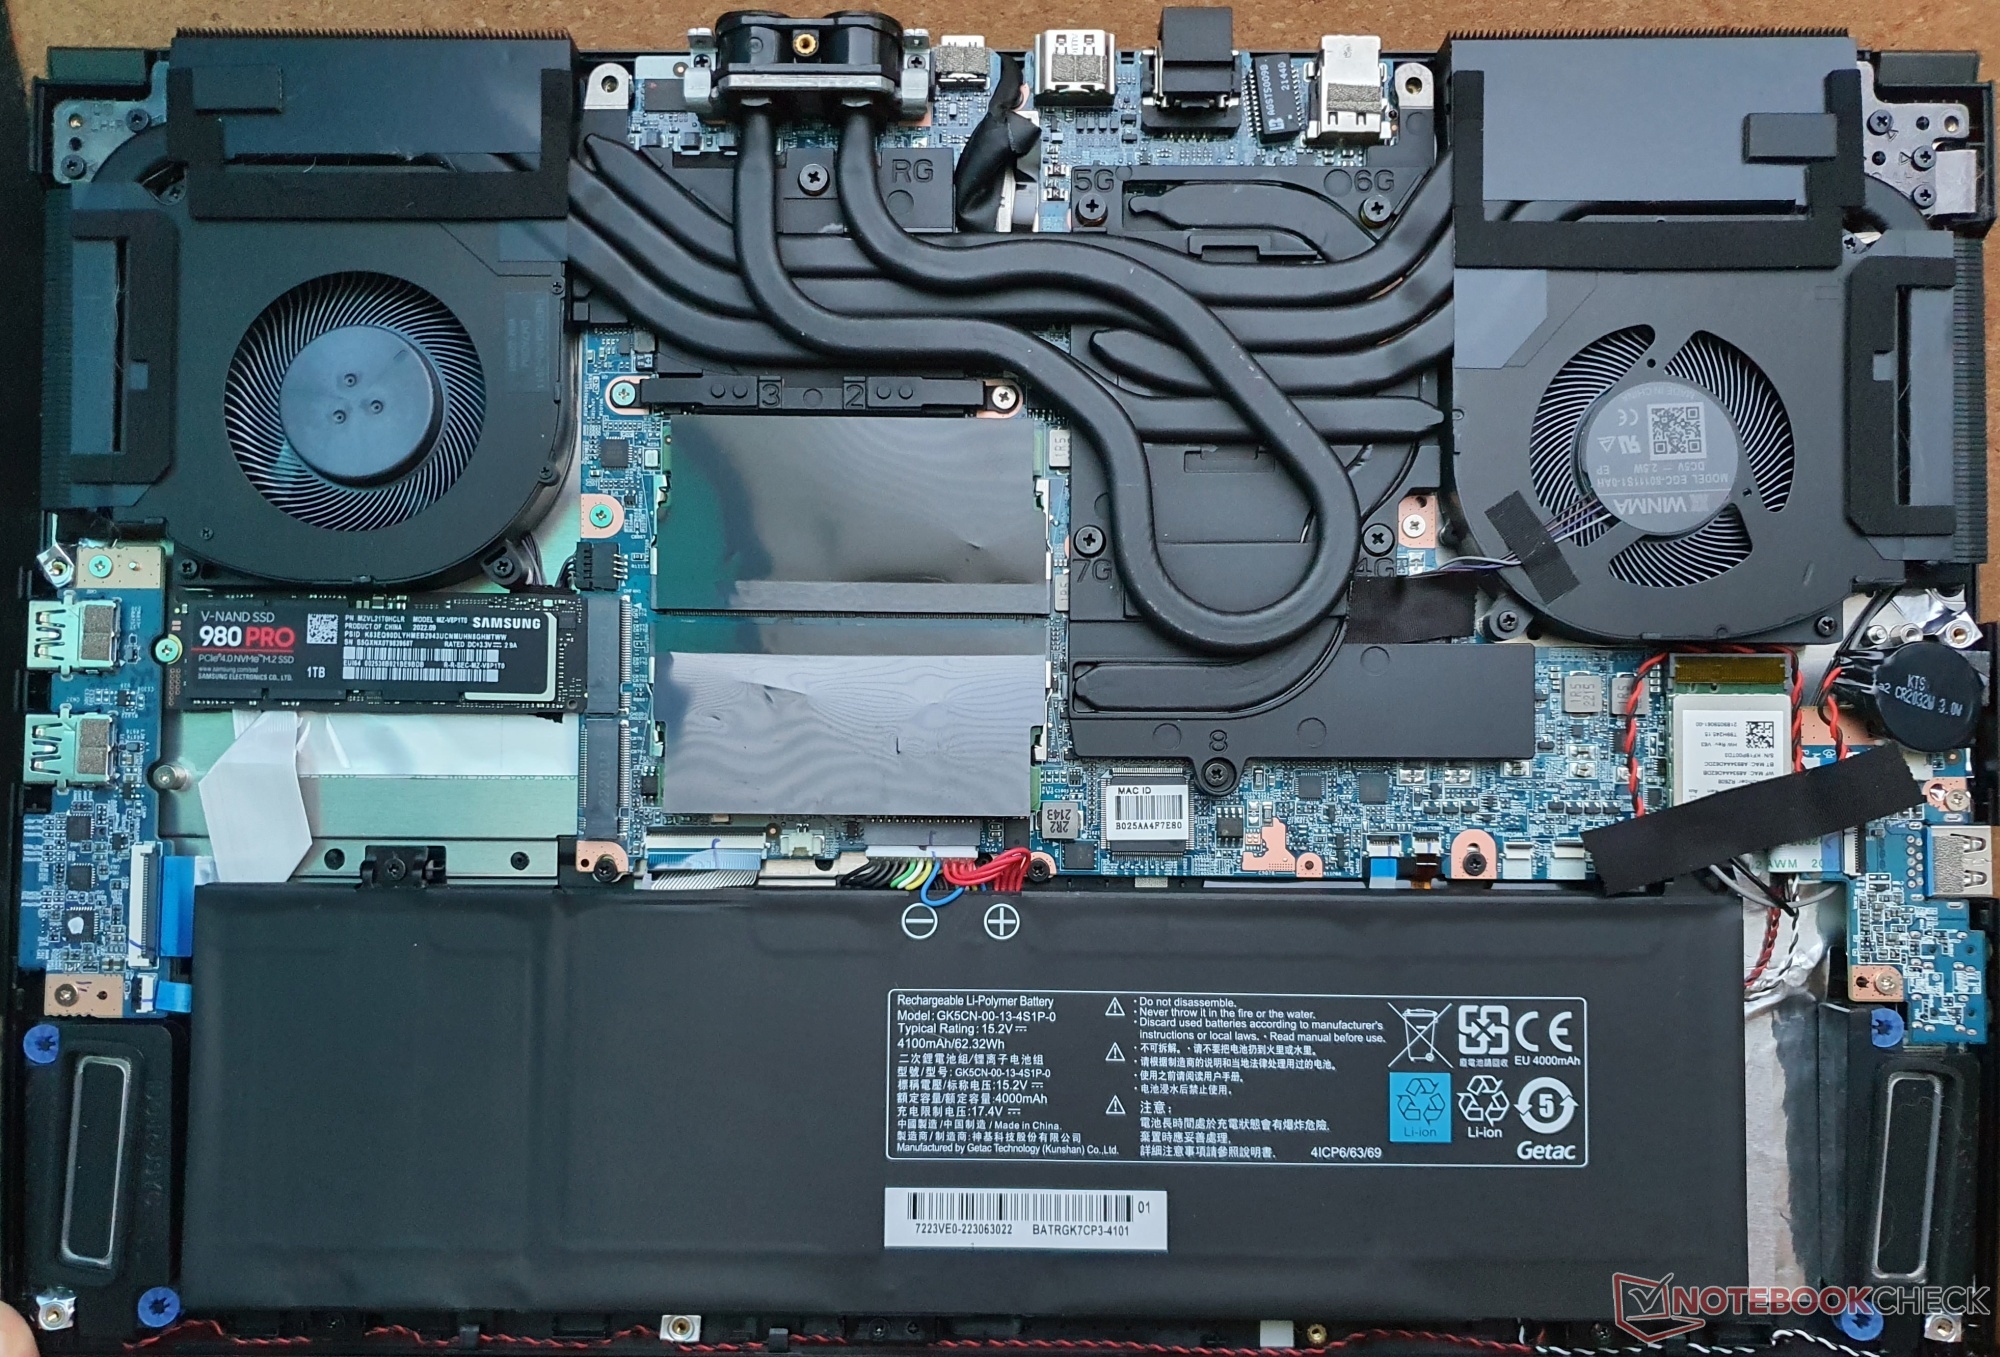
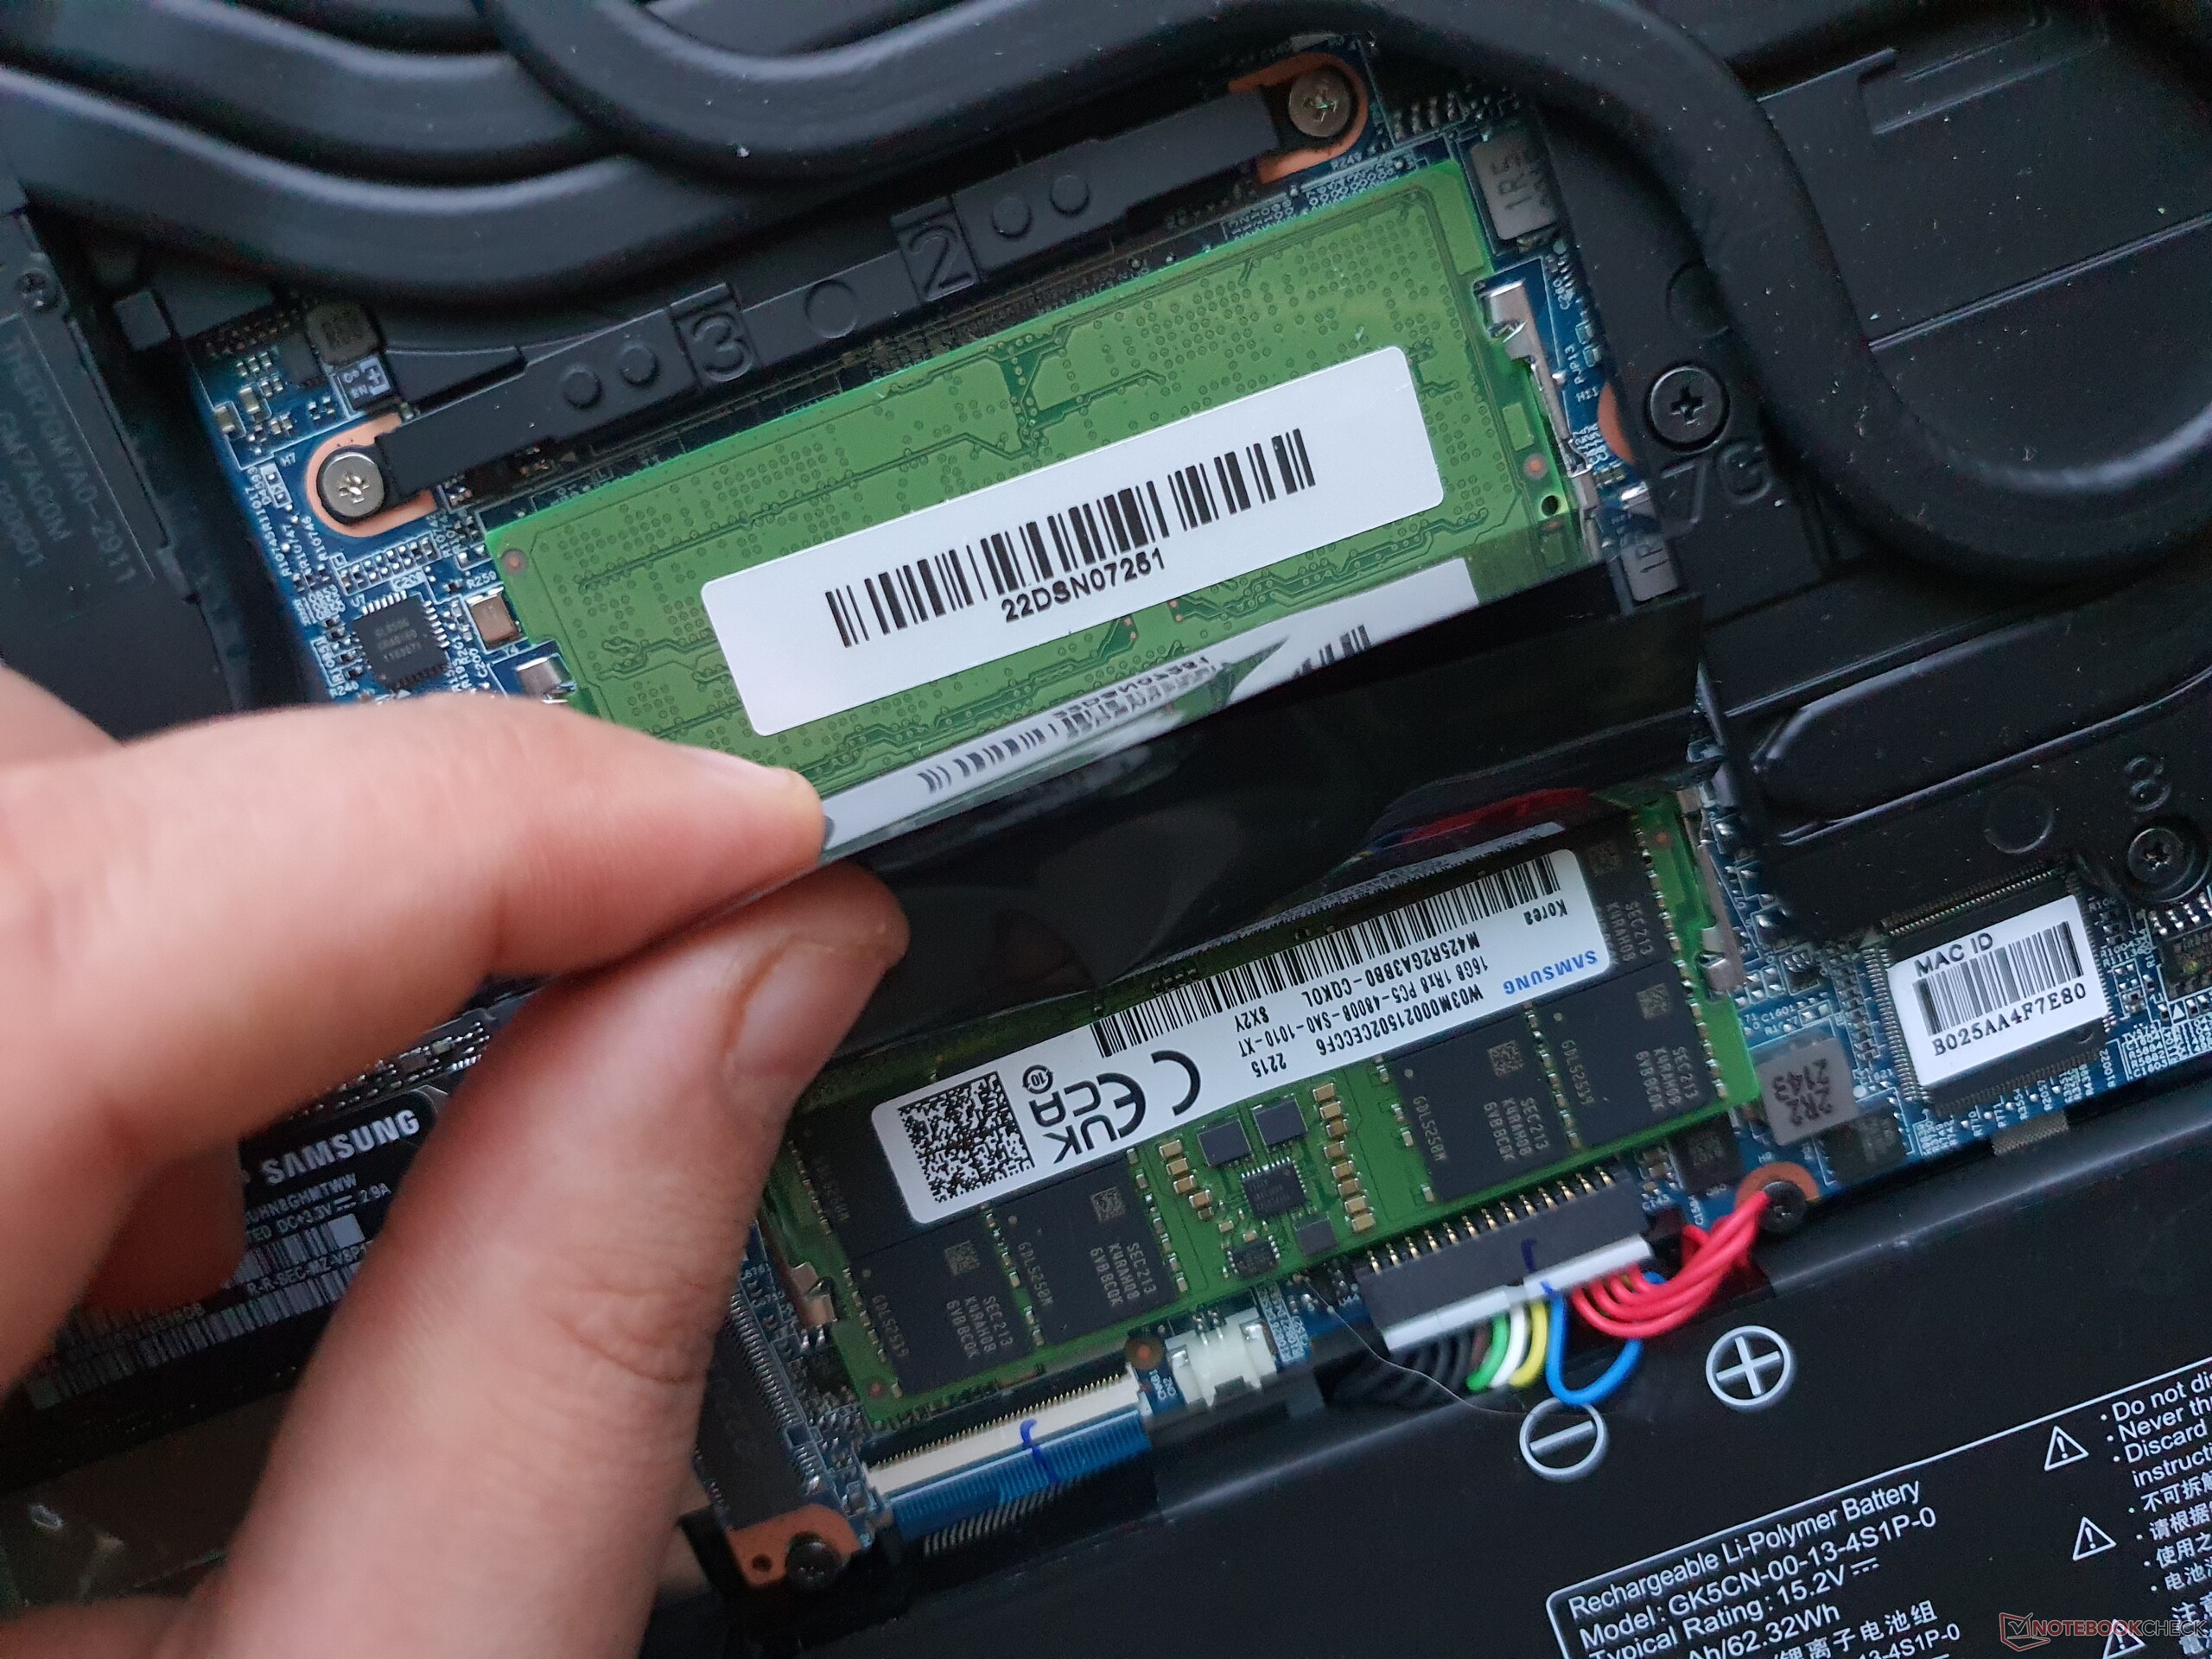
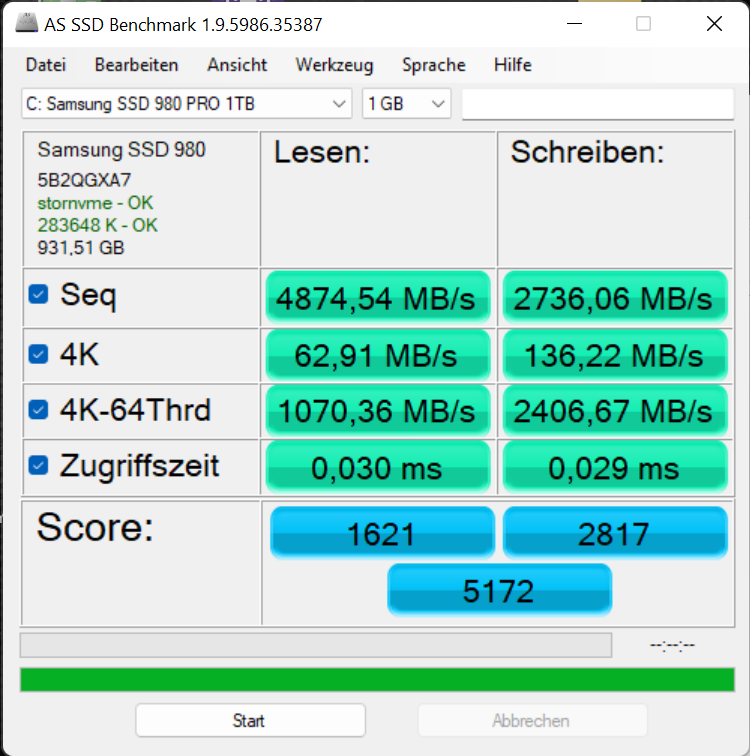
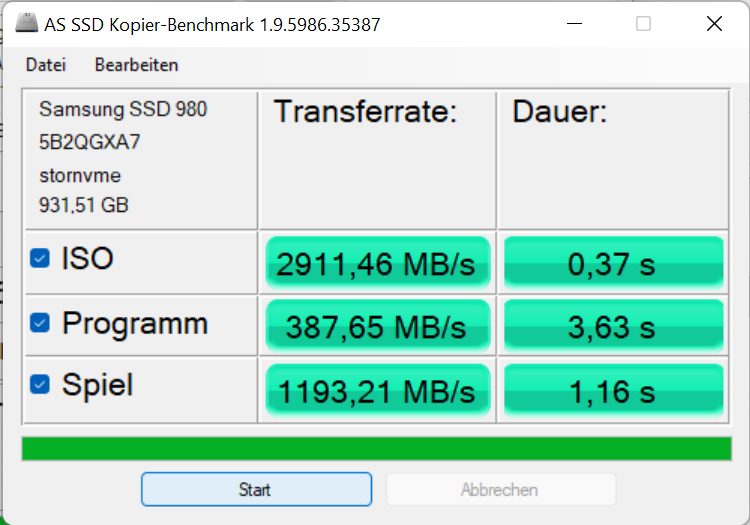
The installed Samsung 980 Pro 1 TB reaches PCIe 4.0 speeds even under permanent load, but struggles with 32 to 64 simultaneous 4K read/write processes in the XMG laptop, which is mainly relevant for servers. The same SSD is faster in the XMG Fusion 15, so its potential is not fully exploited by the Core 15.
| SCHENKER XMG Core 15 (M22) Samsung SSD 980 Pro 1TB MZ-V8P1T0BW | Lenovo Legion 5 15IAH7H 82RB | SCHENKER XMG Fusion 15 (Mid 22) Samsung SSD 980 Pro 1TB MZ-V8P1T0BW | Asus TUF Gaming F15 FX507ZM SK Hynix HFM001TD3JX013N | Alienware m15 R5 Ryzen Edition Toshiba KBG40ZNS512G NVMe | SCHENKER XMG Core 15 Ampere Samsung SSD 970 EVO Plus 1TB | |
|---|---|---|---|---|---|---|
| AS SSD | 37% | 21% | 7% | -78% | 5% | |
| Seq Read | 4874 | 5844.9 20% | 5171.96 6% | 3013 -38% | 2082 -57% | 2829 -42% |
| Seq Write | 2711 | 2038.42 -25% | 3881.37 43% | 2768 2% | 825 -70% | 2646 -2% |
| 4K Read | 63 | 71.99 14% | 66.29 5% | 66.9 6% | 42.41 -33% | 54.8 -13% |
| 4K Write | 136 | 310.54 128% | 189.98 40% | 184.8 36% | 98.3 -28% | 179.1 32% |
| 4K-64 Read | 1070 | 2771.98 159% | 2539.3 137% | 1923 80% | 1255 17% | 1734 62% |
| 4K-64 Write | 2407 | 4007.67 67% | 3144.88 31% | 2198 -9% | 738 -69% | 2396 0% |
| Access Time Read * | 0.03 | 0.037 -23% | 0.07 -133% | 0.03 -0% | 0.109 -263% | 0.033 -10% |
| Access Time Write * | 0.029 | 0.053 -83% | 0.022 24% | 0.081 -179% | 0.17 -486% | 0.021 28% |
| Score Read | 1621 | 3428 111% | 3123 93% | 2291 41% | 1506 -7% | 2072 28% |
| Score Write | 2814 | 4522 61% | 3723 32% | 2660 -5% | 918 -67% | 2839 1% |
| Score Total | 5168 | 9510 84% | 8376 62% | 6117 18% | 3136 -39% | 5965 15% |
| Copy ISO MB/s | 2911 | 2320.82 -20% | 2364.44 -19% | 2143 -26% | 1391 -52% | 2119 -27% |
| Copy Program MB/s | 388 | 429.5 11% | 329.45 -15% | 871 124% | 645 66% | 406.1 5% |
| Copy Game MB/s | 1193 | 1290.19 8% | 1079.59 -10% | 1840 54% | 1101 -8% | 1086 -9% |
| DiskSpd | 135% | 174% | 80% | -24% | 84% | |
| seq read | 3429 | 5217 52% | 4199 22% | 2383 -31% | 1726 -50% | 2367 -31% |
| seq write | 3148 | 4897 56% | 4299 37% | 2894 -8% | 1520 -52% | 2601 -17% |
| seq q8 t1 read | 6850 | 7087 3% | 6847 0% | 3554 -48% | 2314 -66% | 3347 -51% |
| seq q8 t1 write | 4927 | 1498 -70% | 4999 1% | 2869 -42% | 1449 -71% | 3263 -34% |
| 4k q1 t1 read | 61.1 | 74.8 22% | 77.9 27% | 69.4 14% | 48.3 -21% | 52.3 -14% |
| 4k q1 t1 write | 132.2 | 369 179% | 239 81% | 211 60% | 121 -8% | 204 54% |
| 4k q32 t16 read | 1010 | 4443 340% | 4309 327% | 2217 120% | 1301 29% | 1853 83% |
| 4k q32 t16 write | 345 | 2050 494% | 3435 896% | 2314 571% | 497 44% | 2683 678% |
| Total Average (Program / Settings) | 86% /
72% | 98% /
77% | 44% /
34% | -51% /
-59% | 45% /
33% |
* ... smaller is better
* ... smaller is better
Continuous: DiskSpd Read Loop, Queue Depth 8
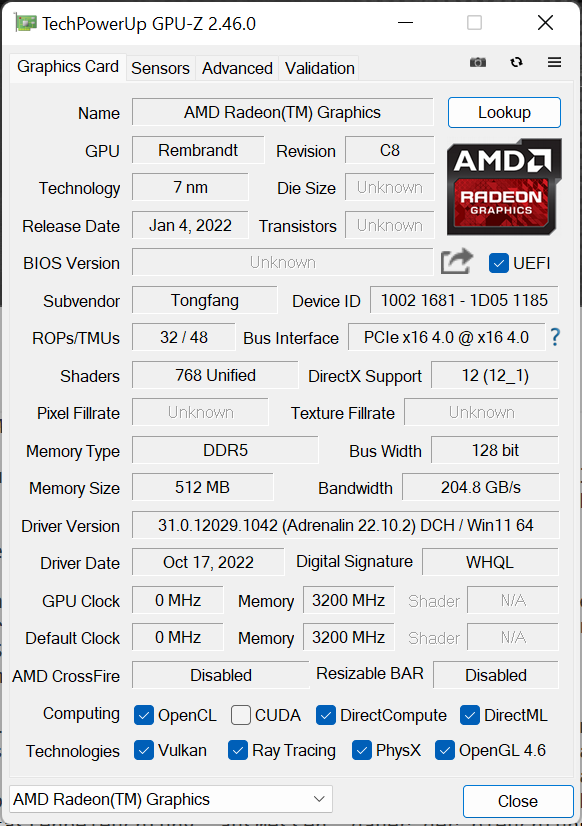
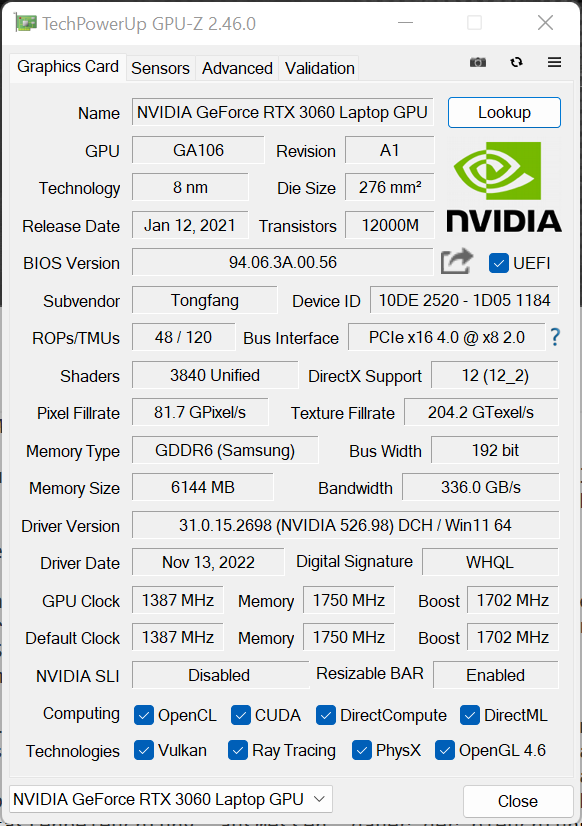
Graphics card
Besides an integrated Radeon 680M, the gaming laptop naturally has a dedicated graphics unit - in the case of the XMG Core 15, a GeForce RTX 3060 with 140-W TGP.
Many newer games can be rendered smoothly in native WQHD resolution, but very performance-hungry games will probably have to be enjoyed in FullHD or at lower detail levels.
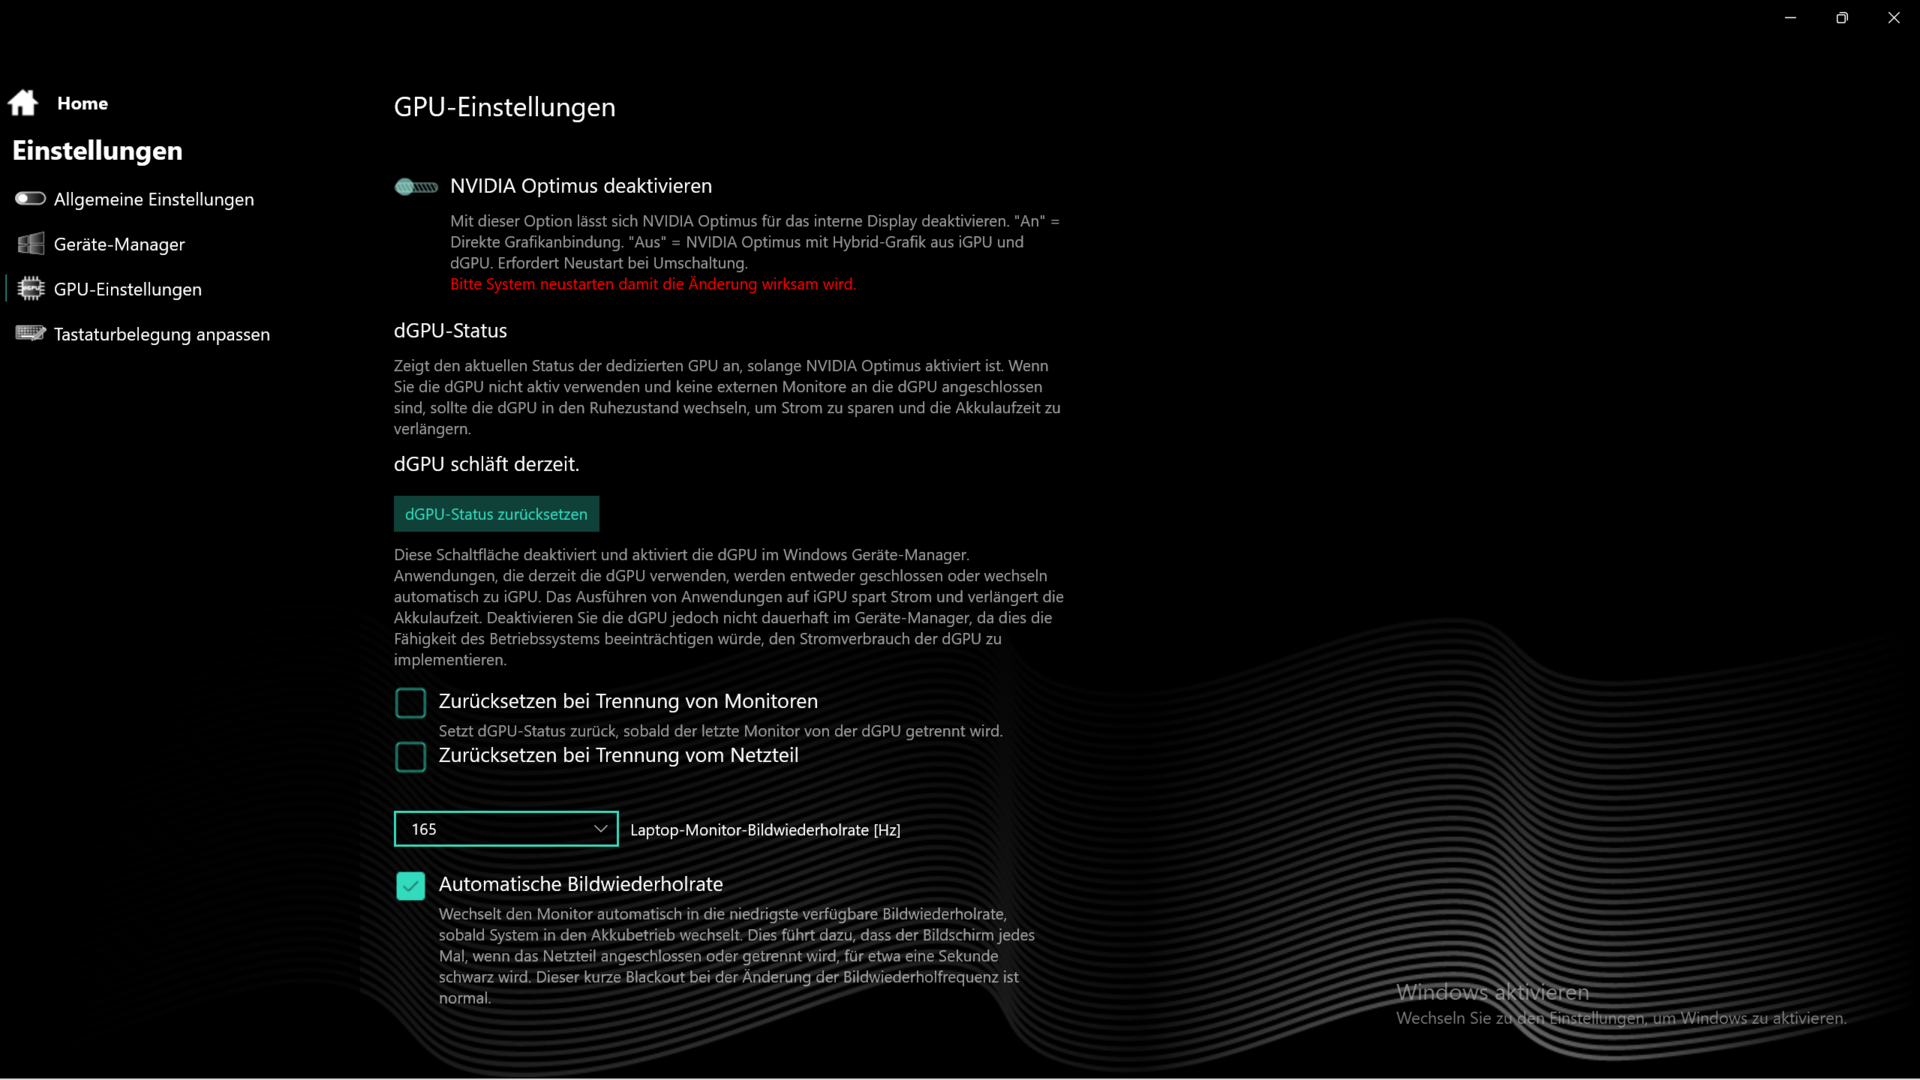
The overclock function of the XMG Control Center can boost the performance by 3-4% depending on the 3D application, and the MUX switch (restart required) adds ~5%. Nevertheless, the Core 15 has to admit defeat against other RTX 3060 gamers, even though the gap is not very big.
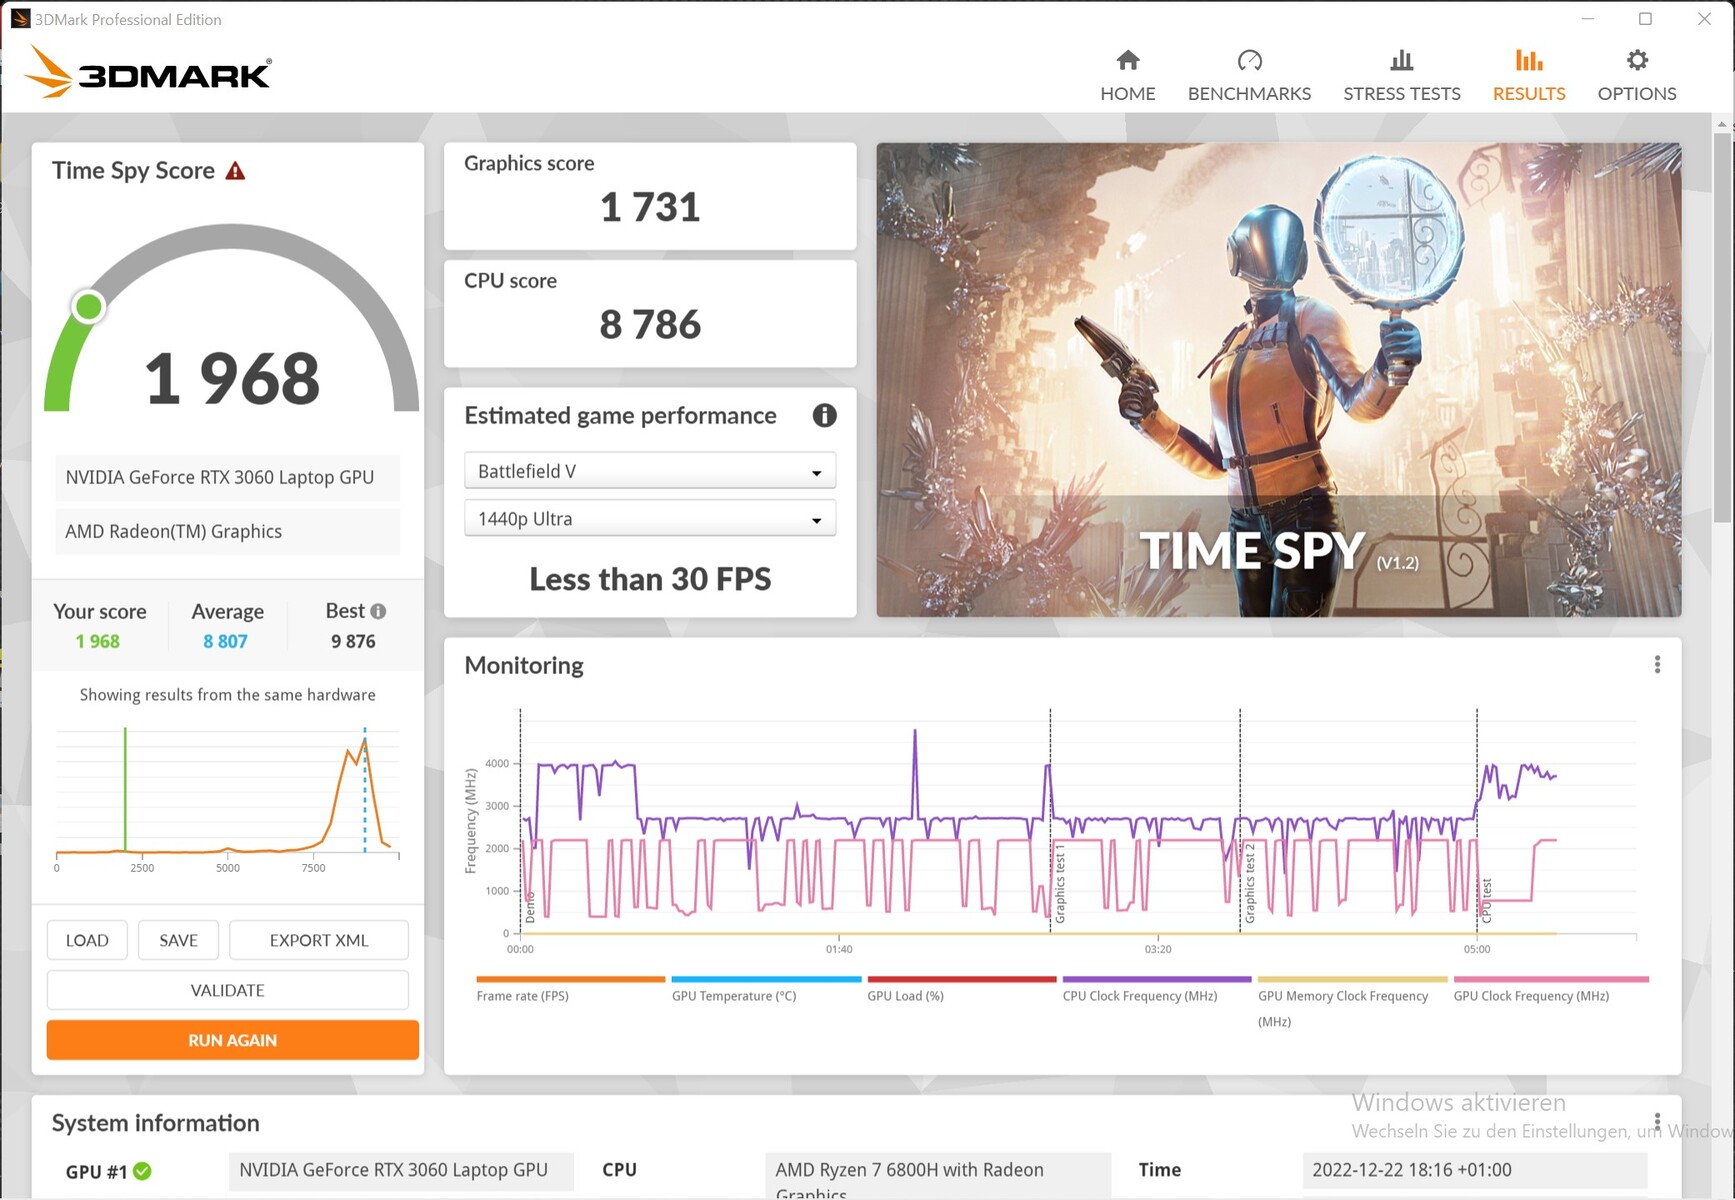
The graphics performance drops significantly on battery power, so only 25% of the original performance remains. This is partly due to the small 62 Wh battery, which would otherwise discharge too quickly.
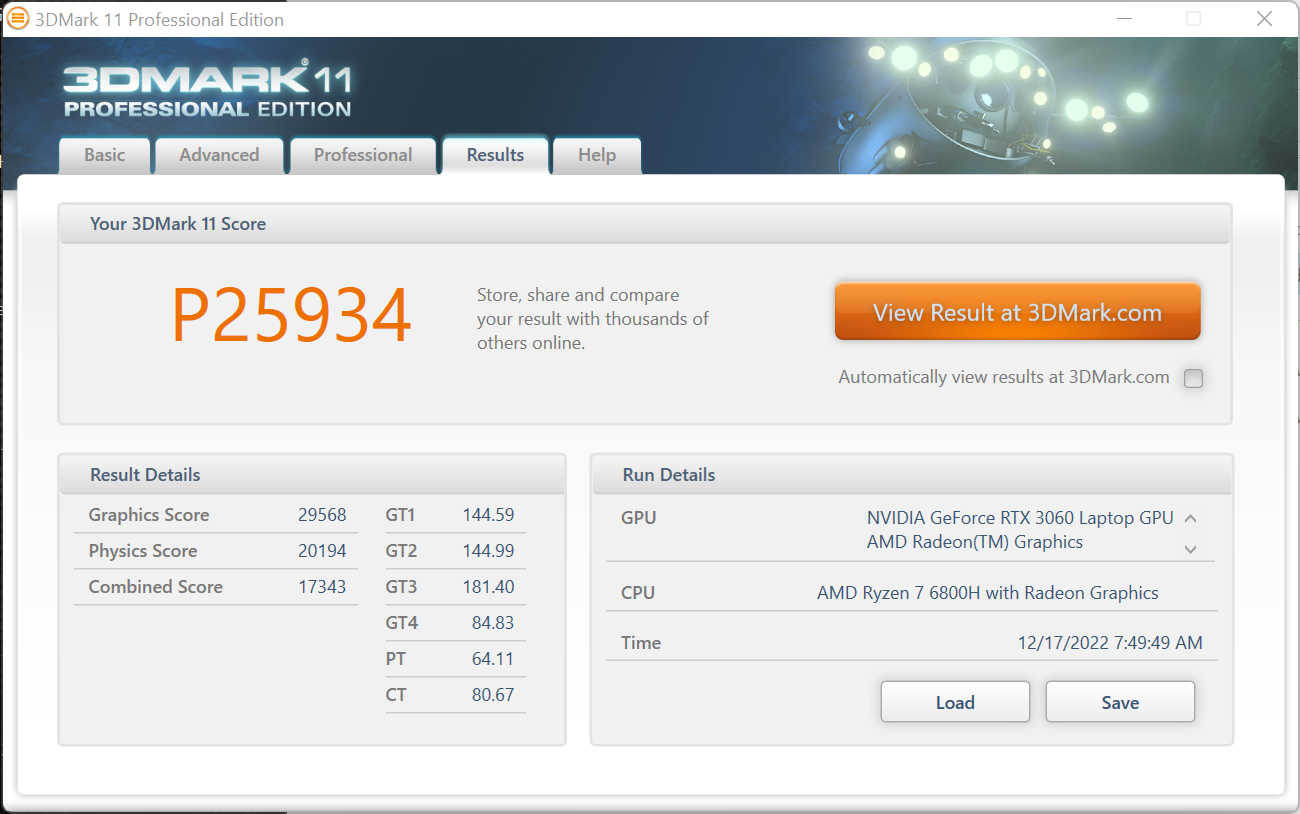
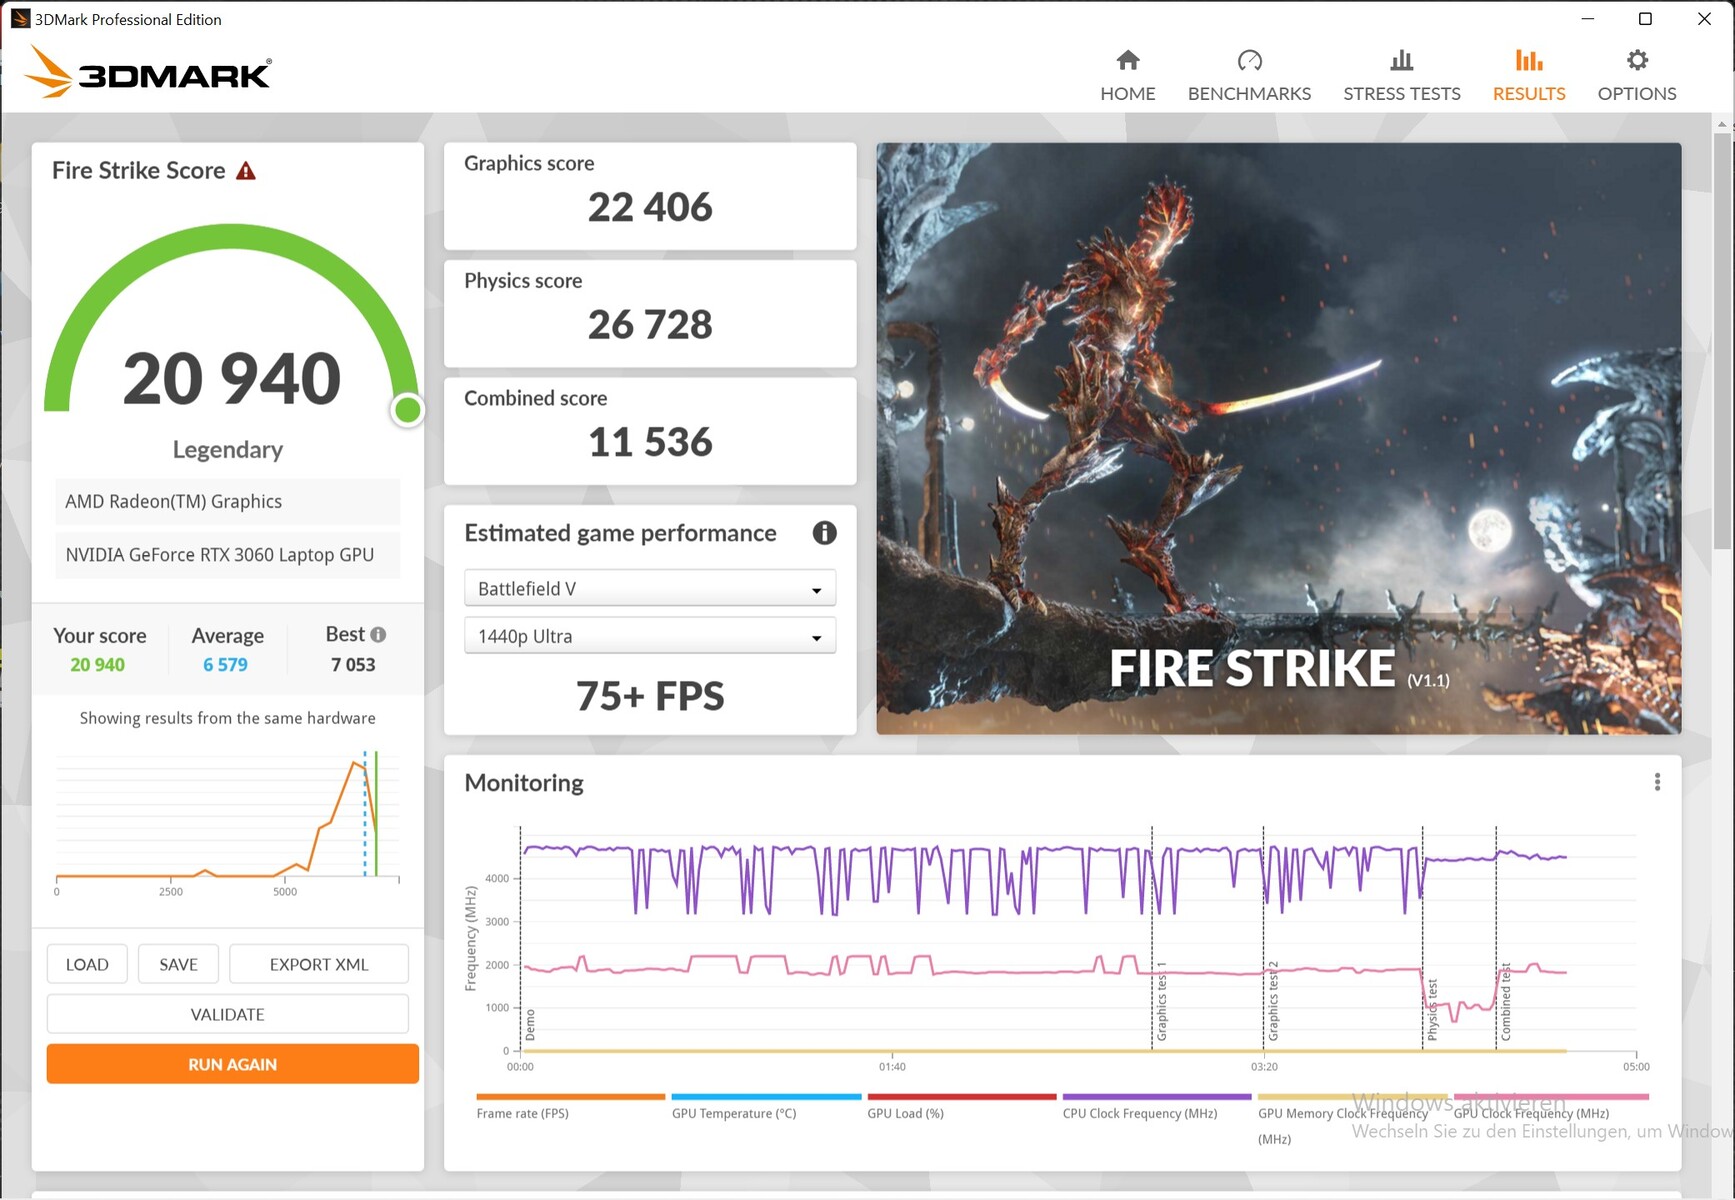
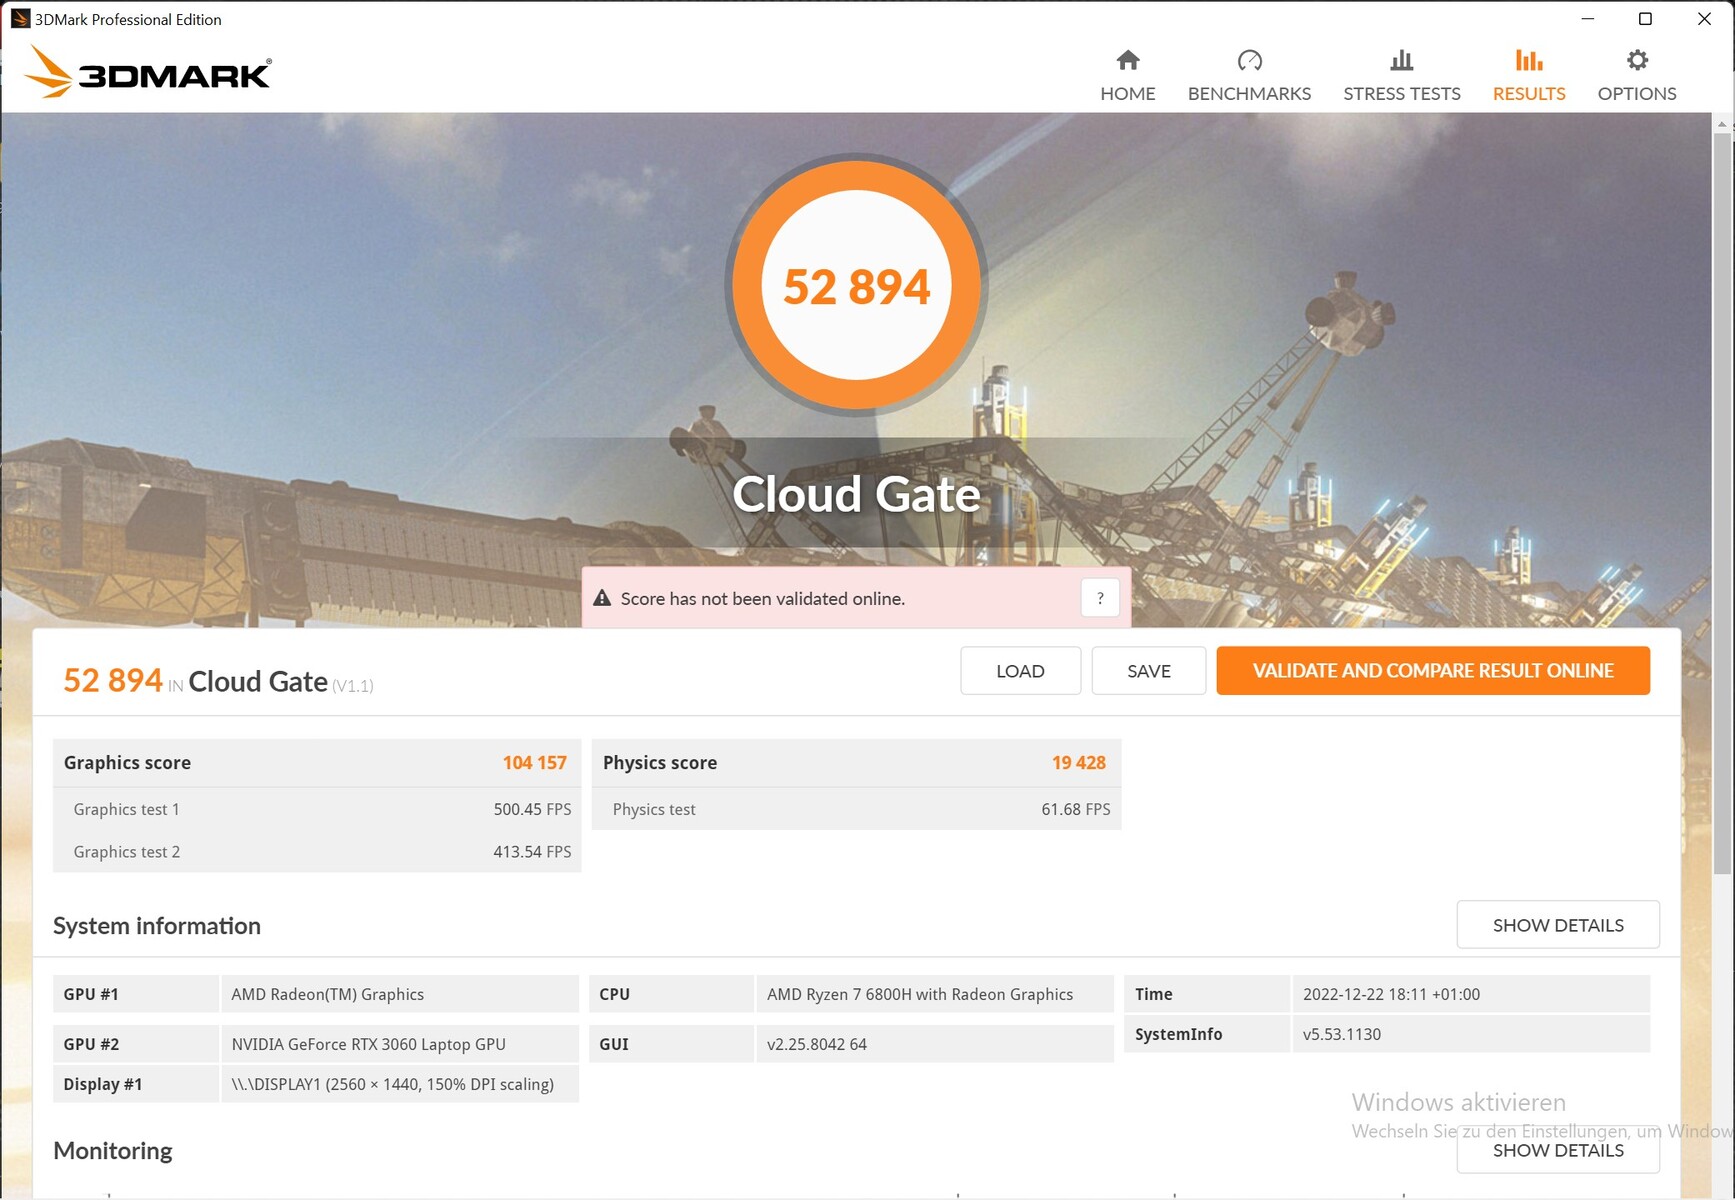
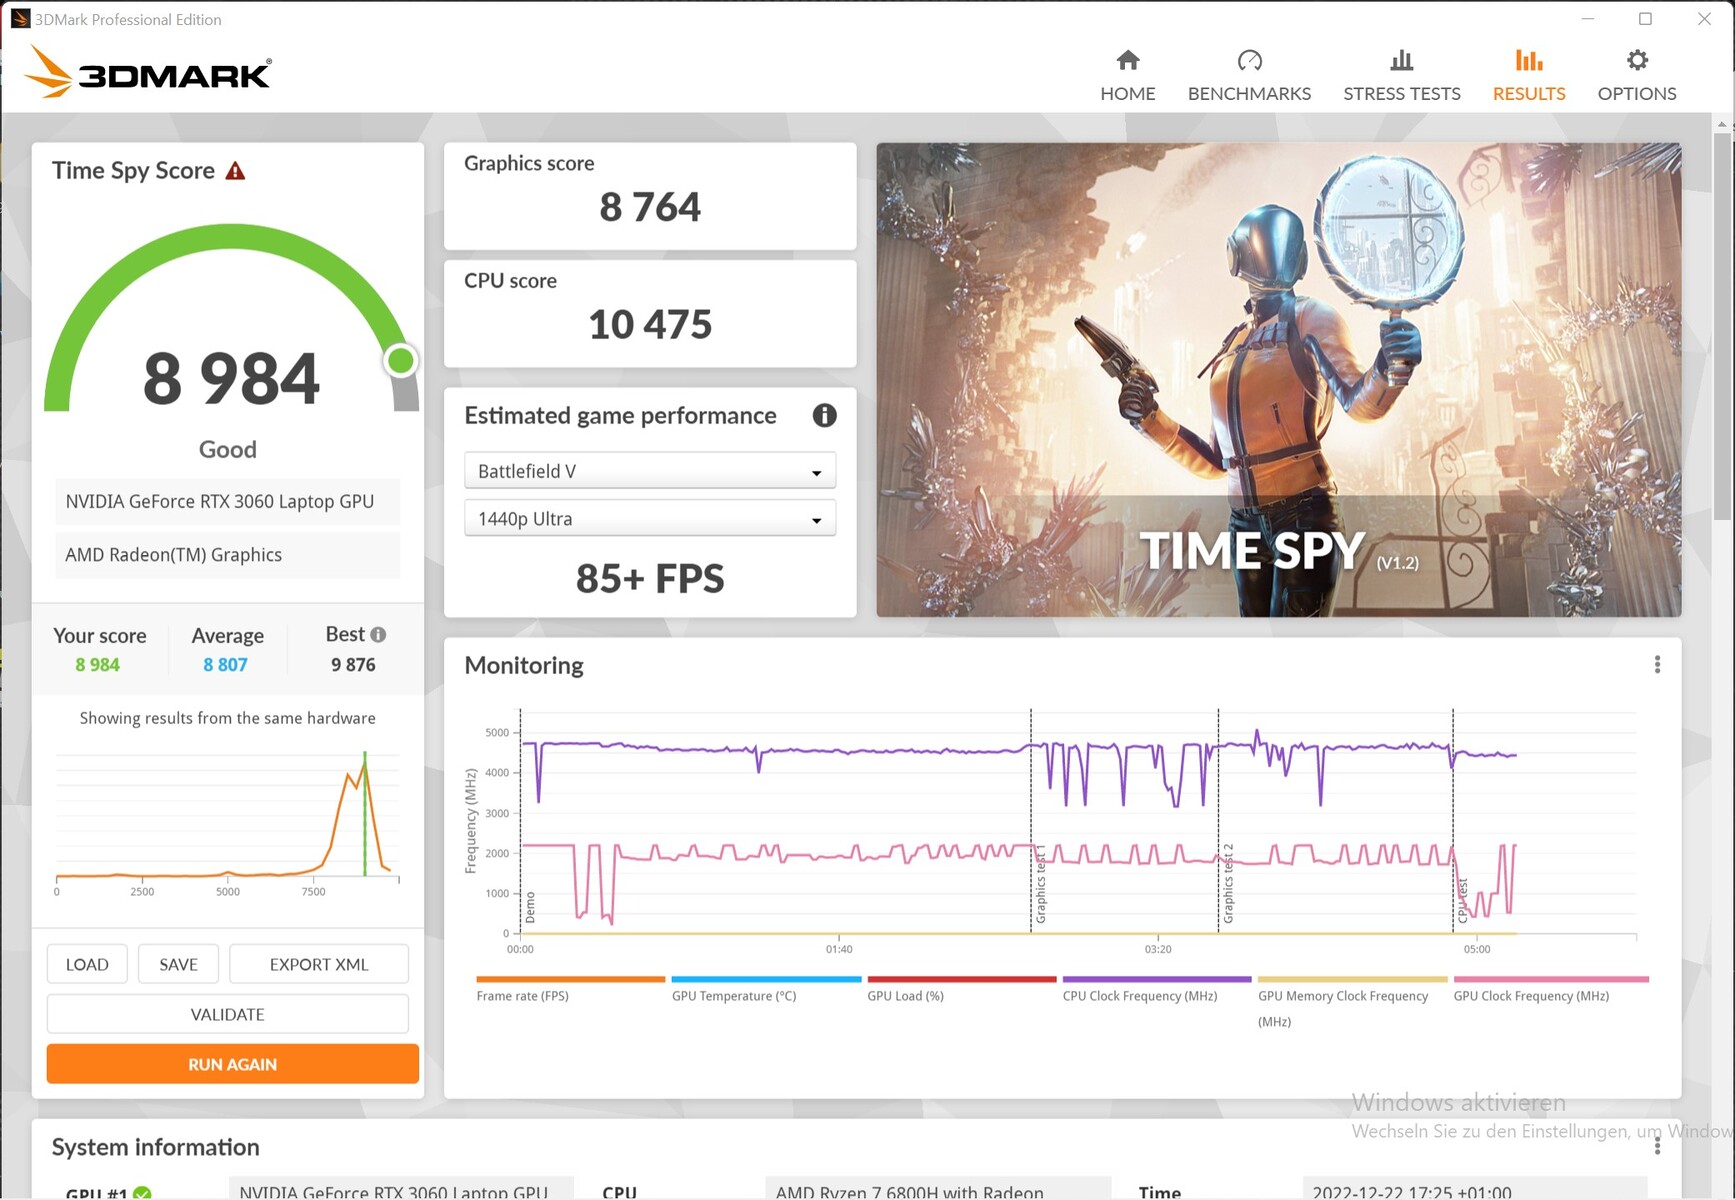
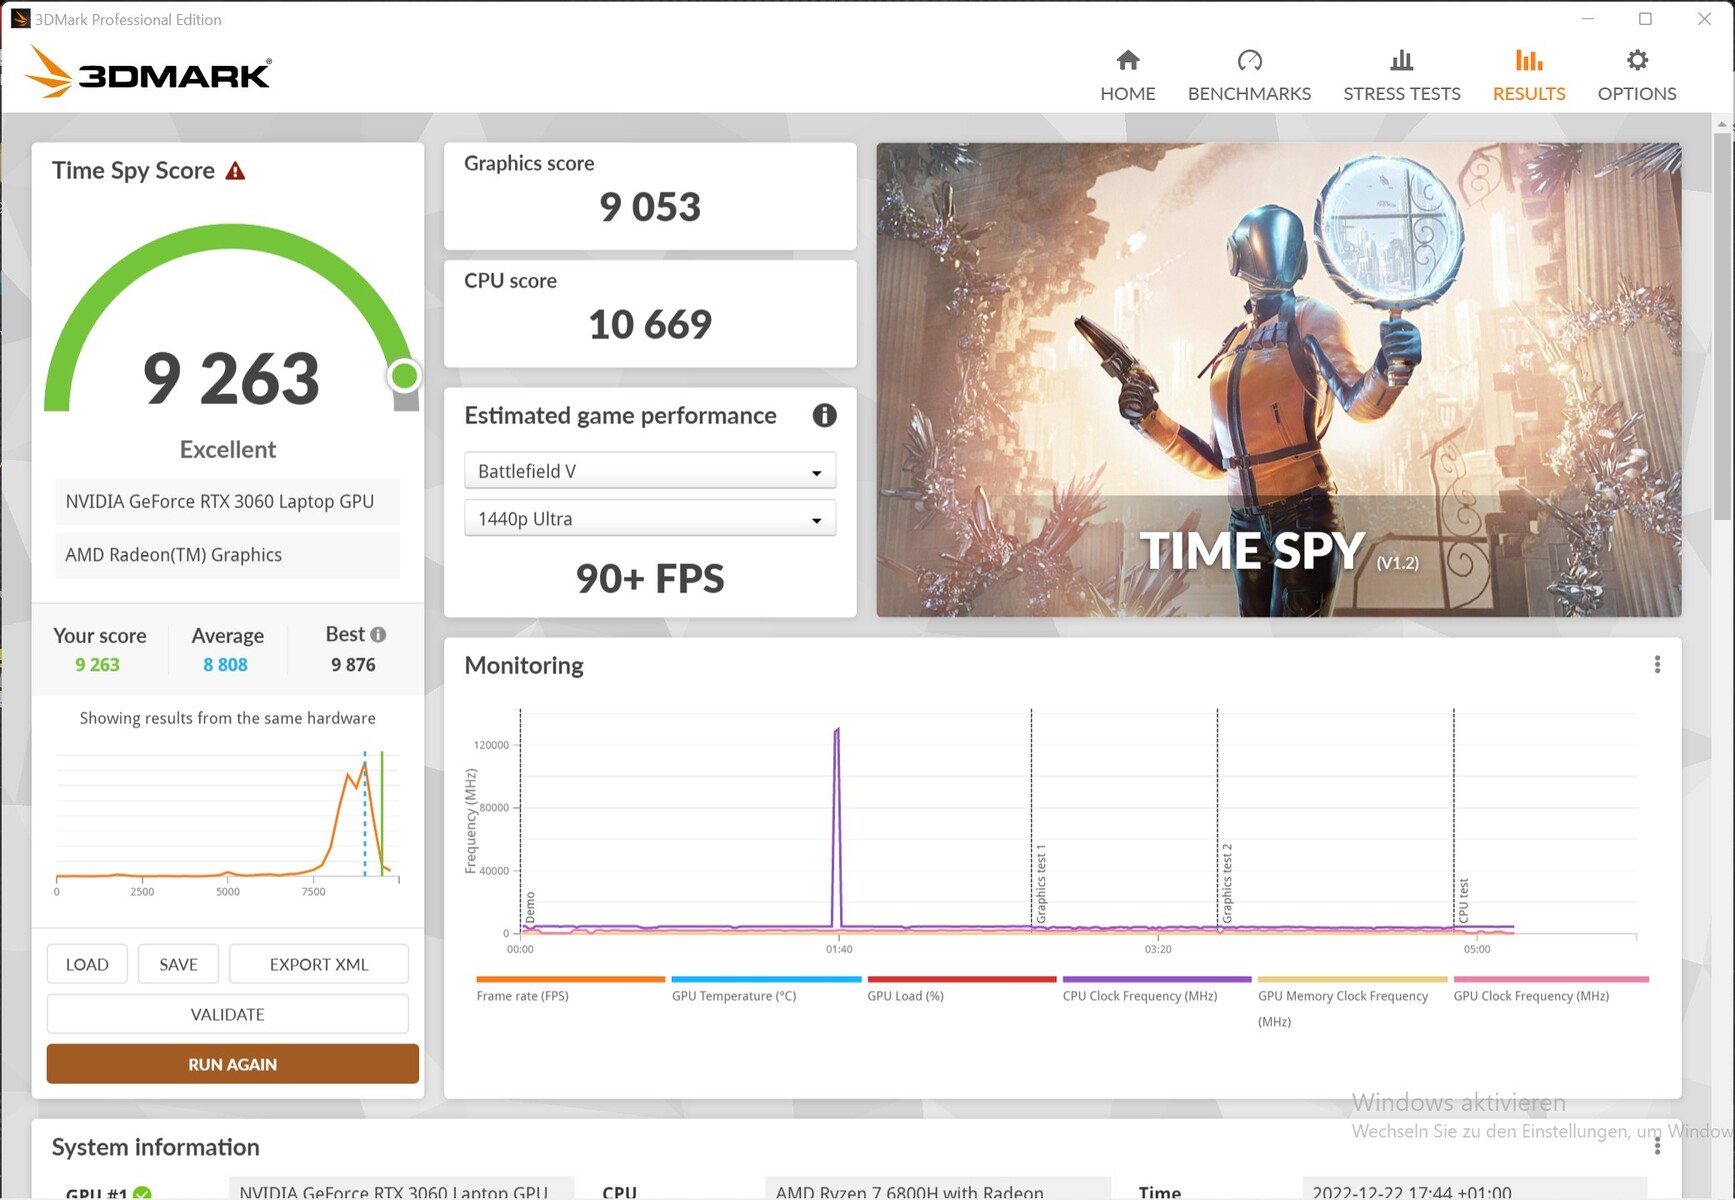
| 3DMark 11 Performance | 25934 points | |
| 3DMark Cloud Gate Standard Score | 52894 points | |
| 3DMark Fire Strike Score | 20940 points | |
| 3DMark Time Spy Score | 8984 points | |
Help | ||
* ... smaller is better
Gaming performance
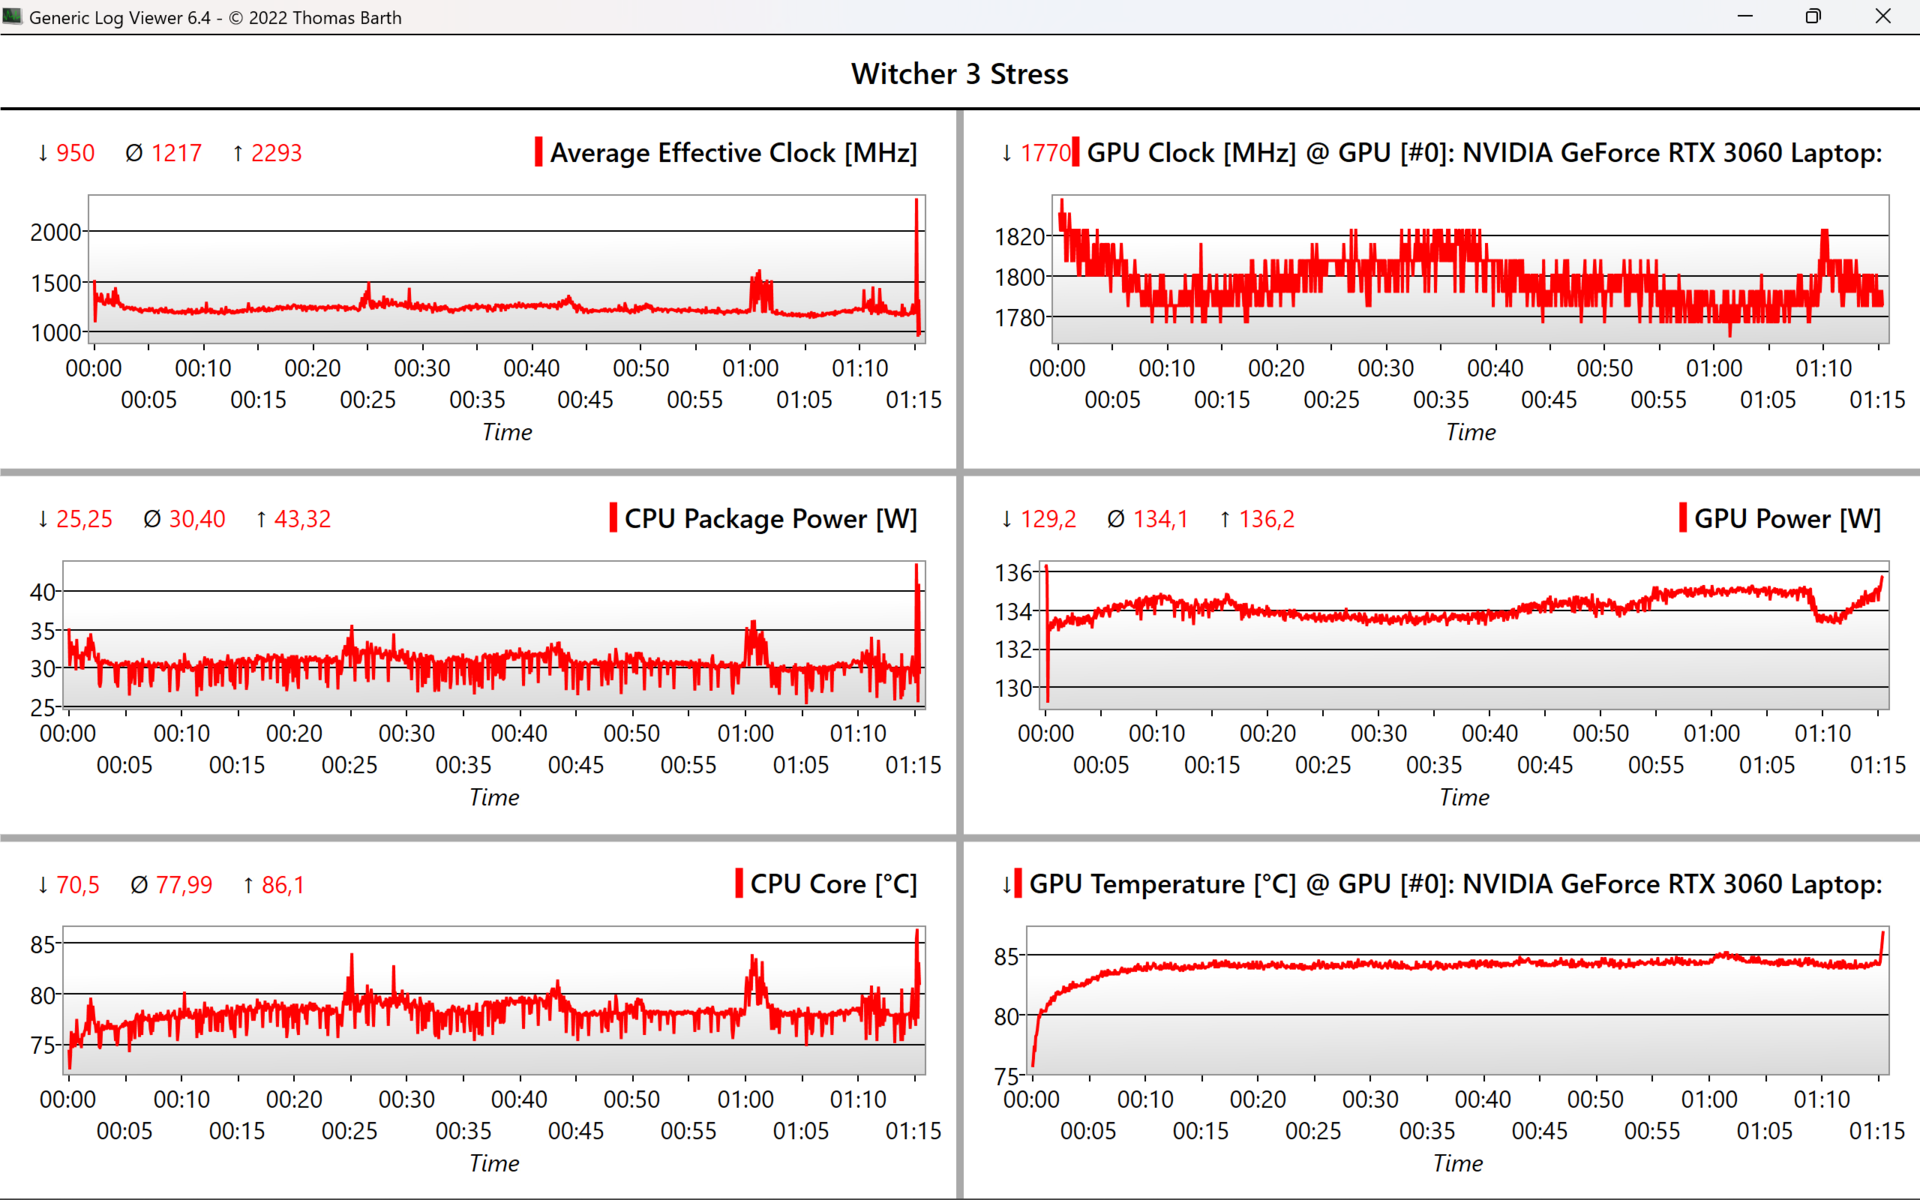
The competition with the same graphics unit outperforms the XMG Core 15 by up to 13% in gaming despite the high TGP, which we measure at 134 W, while it at least does not get too hot at 84 °C (~183 °F). The core clock of ~1,800 MHz is already above the specification of 1,702 MHz. The performance corresponds to the upper mid-range.
The clock rates remain stable even after an hour in The Witcher 3 and thus the FPS as well, as the two following graphs show.
Witcher 3 FPS-Diagram
| low | med. | high | ultra | QHD | |
|---|---|---|---|---|---|
| GTA V (2015) | 178.7 | 172.1 | 158.4 | 97.3 | 86.5 |
| The Witcher 3 (2015) | 303 | 253 | 159.7 | 81.5 | |
| Dota 2 Reborn (2015) | 136.8 | 126.5 | 117.6 | 112.3 | |
| Final Fantasy XV Benchmark (2018) | 178.4 | 119.5 | 91.9 | 67.5 | |
| X-Plane 11.11 (2018) | 104.8 | 93.3 | 74.2 | ||
| Far Cry 5 (2018) | 118 | 107 | 90 | ||
| Strange Brigade (2018) | 273 | 200 | 171.7 | 152.7 | |
| God of War (2022) | 92.6 | 73.1 | 51.5 | 44 |
Emissions: Quiet gaming with high FPS possible with the XMG Core 15
Noise emissions
The fans mostly stay off when idling and also when web surfing. While quite a loud 42 dB(A) is present during full CPU load, this can be contained especially by the balanced mode, which still has plenty of power at the ready.
It gets very loud with 55 dB(A) during gaming, but the low-frequency noise remains relatively pleasant. Here, too, the balanced mode provides a clear remedy, while the FPS only dropped by 5% in GTA V, for example, which is a very good result. Ex-factory, the XMG Fusion 15 and Alienware m15 remain significantly quieter when gaming with 46 and 48 dB(A), respectively.
.
Noise Level
| Idle |
| 23 / 23 / 23 dB(A) |
| Load |
| 42.41 / 55.05 dB(A) |
 | ||
30 dB silent 40 dB(A) audible 50 dB(A) loud |
||
min: | ||
| SCHENKER XMG Core 15 (M22) R7 6800H, GeForce RTX 3060 Laptop GPU | Lenovo Legion 5 15IAH7H 82RB i7-12700H, GeForce RTX 3060 Laptop GPU | SCHENKER XMG Fusion 15 (Mid 22) i7-11800H, GeForce RTX 3070 Laptop GPU | Asus TUF Gaming F15 FX507ZM i7-12700H, GeForce RTX 3060 Laptop GPU | Alienware m15 R5 Ryzen Edition R7 5800H, GeForce RTX 3060 Laptop GPU | SCHENKER XMG Core 15 Ampere R7 4800H, GeForce RTX 3060 Laptop GPU | |
|---|---|---|---|---|---|---|
| Noise | 3% | -9% | -1% | -7% | -8% | |
| off / environment * | 23 | 23.3 -1% | 26 -13% | 23.2 -1% | 24 -4% | 24 -4% |
| Idle Minimum * | 23 | 23.5 -2% | 26 -13% | 23.6 -3% | 24 -4% | 26 -13% |
| Idle Average * | 23 | 23.5 -2% | 28 -22% | 23.6 -3% | 25 -9% | 28 -22% |
| Idle Maximum * | 23 | 26.8 -17% | 31 -35% | 25.4 -10% | 35 -52% | 30 -30% |
| Load Average * | 42.41 | 29.3 31% | 45 -6% | 38 10% | 44 -4% | 42 1% |
| Witcher 3 ultra * | 54.71 | 51.4 6% | 46 16% | 54.1 1% | 48 12% | 50 9% |
| Load Maximum * | 55.05 | 53 4% | 48 13% | 57.2 -4% | 50 9% | 52 6% |
* ... smaller is better
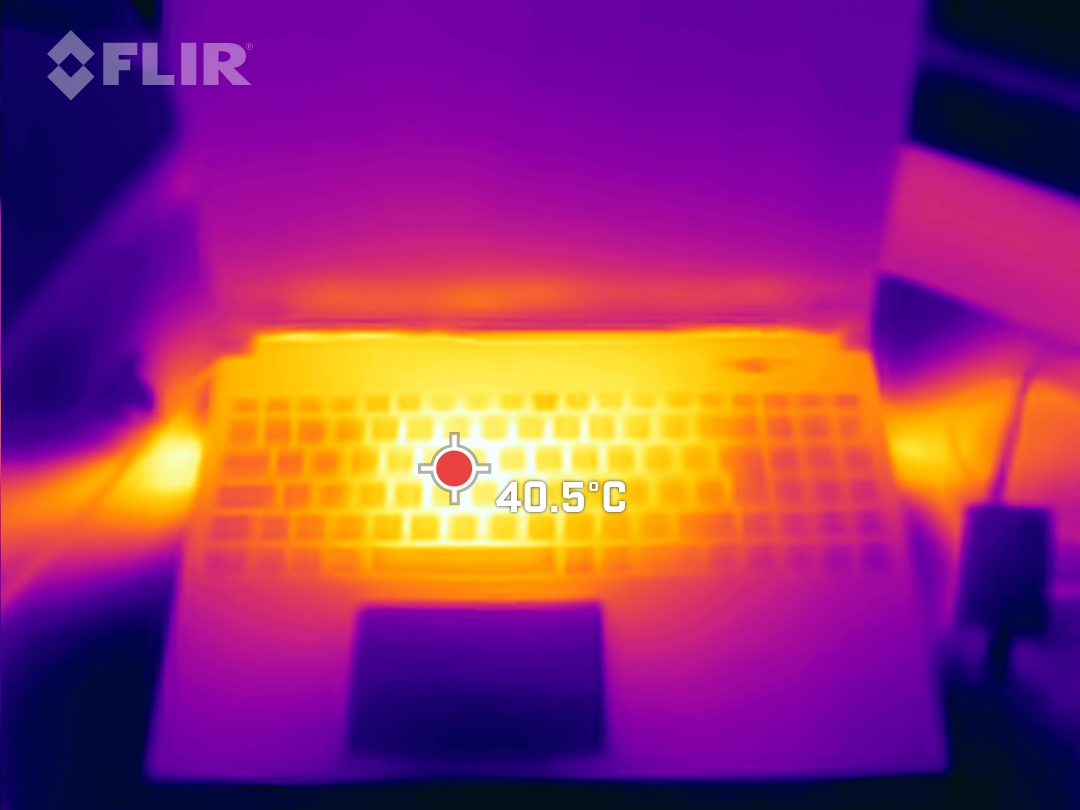
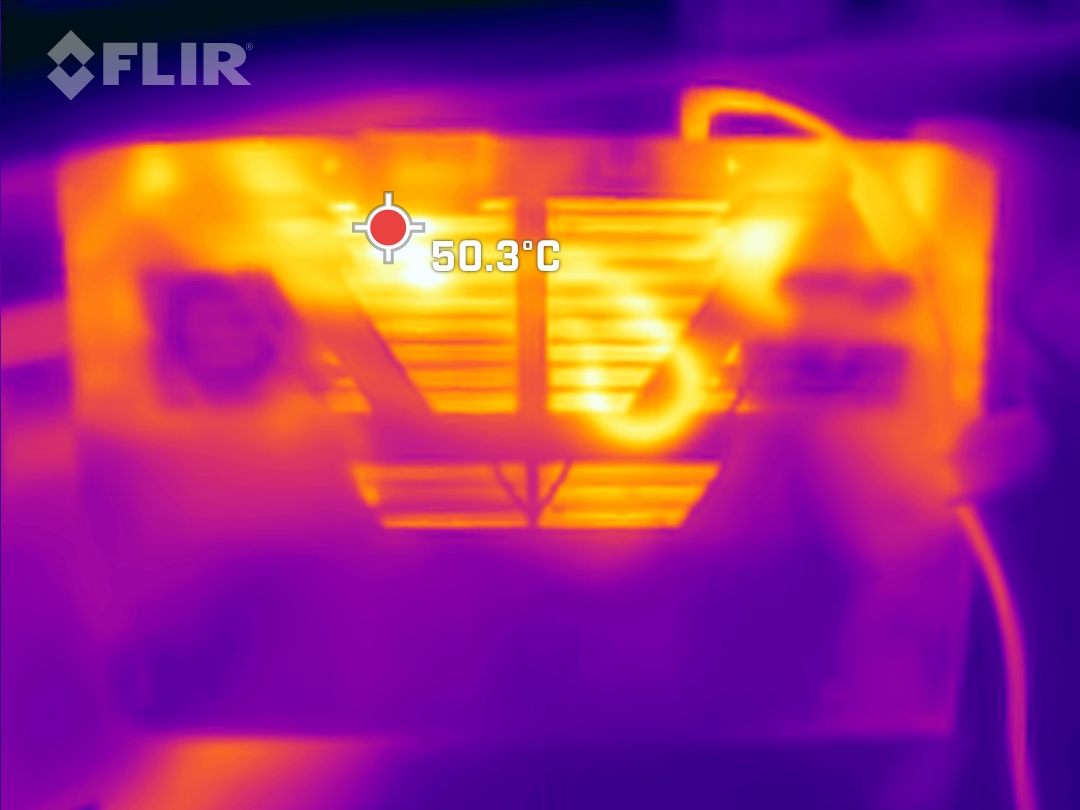
Temperature
The temperatures are never in hot territory even during gaming. Under maximum load, there is a hotspot of 51 °C (~124 °F) on the bottom of the device, while the Alienware m15 and Schenker XMG Fusion 15 run much hotter at 61 °C and 63 °C (~142 and ~145 °F), respectively.
(-) The maximum temperature on the upper side is 48 °C / 118 F, compared to the average of 40.5 °C / 105 F, ranging from 21.2 to 68.8 °C for the class Gaming.
(-) The bottom heats up to a maximum of 51 °C / 124 F, compared to the average of 43.3 °C / 110 F
(+) In idle usage, the average temperature for the upper side is 25.6 °C / 78 F, compared to the device average of 33.9 °C / 93 F.
(±) Playing The Witcher 3, the average temperature for the upper side is 34.9 °C / 95 F, compared to the device average of 33.9 °C / 93 F.
(+) The palmrests and touchpad are cooler than skin temperature with a maximum of 28 °C / 82.4 F and are therefore cool to the touch.
(±) The average temperature of the palmrest area of similar devices was 28.9 °C / 84 F (+0.9 °C / 1.6 F).
| SCHENKER XMG Core 15 (M22) AMD Ryzen 7 6800H, NVIDIA GeForce RTX 3060 Laptop GPU | Lenovo Legion 5 15IAH7H 82RB Intel Core i7-12700H, NVIDIA GeForce RTX 3060 Laptop GPU | SCHENKER XMG Fusion 15 (Mid 22) Intel Core i7-11800H, NVIDIA GeForce RTX 3070 Laptop GPU | Asus TUF Gaming F15 FX507ZM Intel Core i7-12700H, NVIDIA GeForce RTX 3060 Laptop GPU | Alienware m15 R5 Ryzen Edition AMD Ryzen 7 5800H, NVIDIA GeForce RTX 3060 Laptop GPU | SCHENKER XMG Core 15 Ampere AMD Ryzen 7 4800H, NVIDIA GeForce RTX 3060 Laptop GPU | |
|---|---|---|---|---|---|---|
| Heat | 11% | -20% | -11% | -20% | 2% | |
| Maximum Upper Side * | 48 | 37.8 21% | 52 -8% | 44.4 7% | 62 -29% | 48 -0% |
| Maximum Bottom * | 51 | 51 -0% | 63 -24% | 48.8 4% | 61 -20% | 50 2% |
| Idle Upper Side * | 28 | 25.8 8% | 37 -32% | 37.8 -35% | 36 -29% | 28 -0% |
| Idle Bottom * | 33 | 28.8 13% | 38 -15% | 39.6 -20% | 33 -0% | 31 6% |
* ... smaller is better
Stress test
Even in the combined stress test, the CPU still computes slightly above the base clock of 3.2 GHz, while it warms up to 86 °C (~187 °F) in the first 40 minutes and 93 °C (~199 °F) afterwards as the combined TDP shifts in favor of the CPU and it thus recovers to 4 GHz. The GPU temperature here is 86 °C while still clocking at ~1,400 MHz.
A GPU benchmark executed directly afterwards was performed without performance losses.
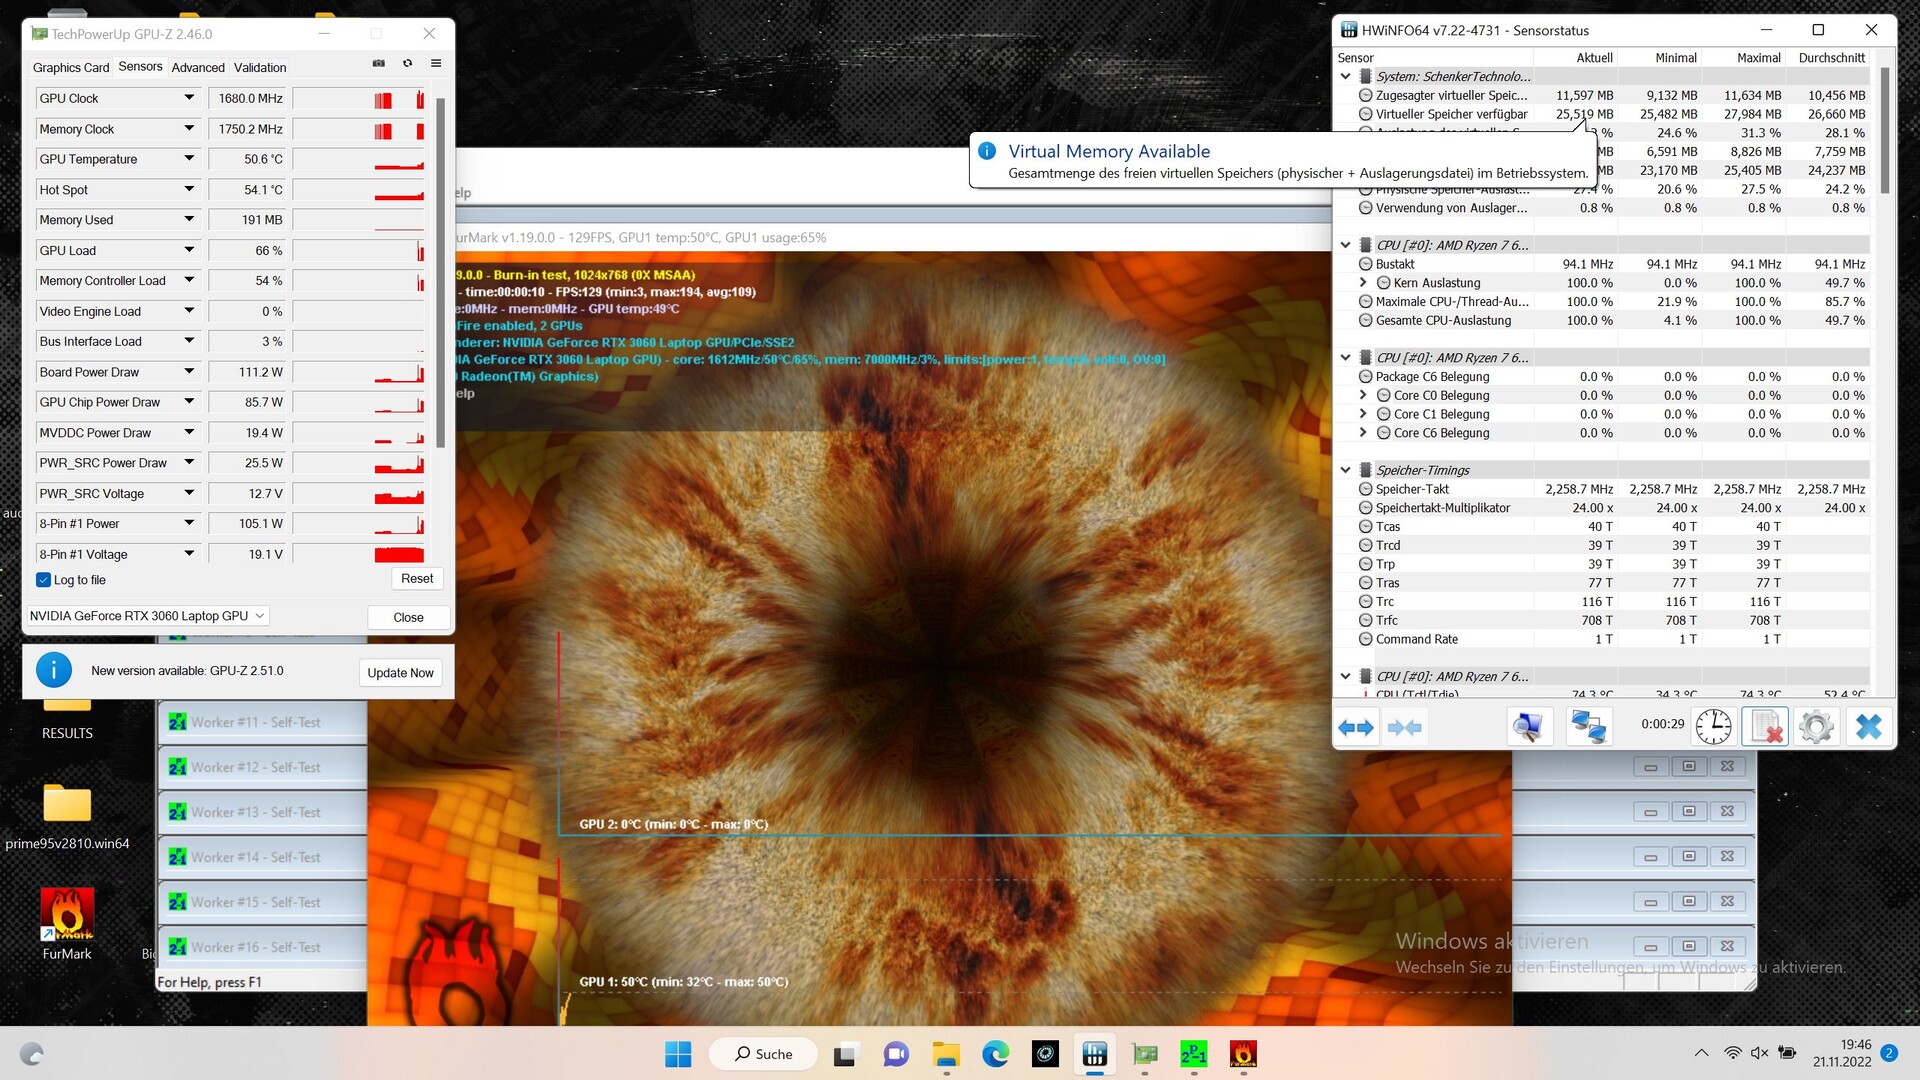
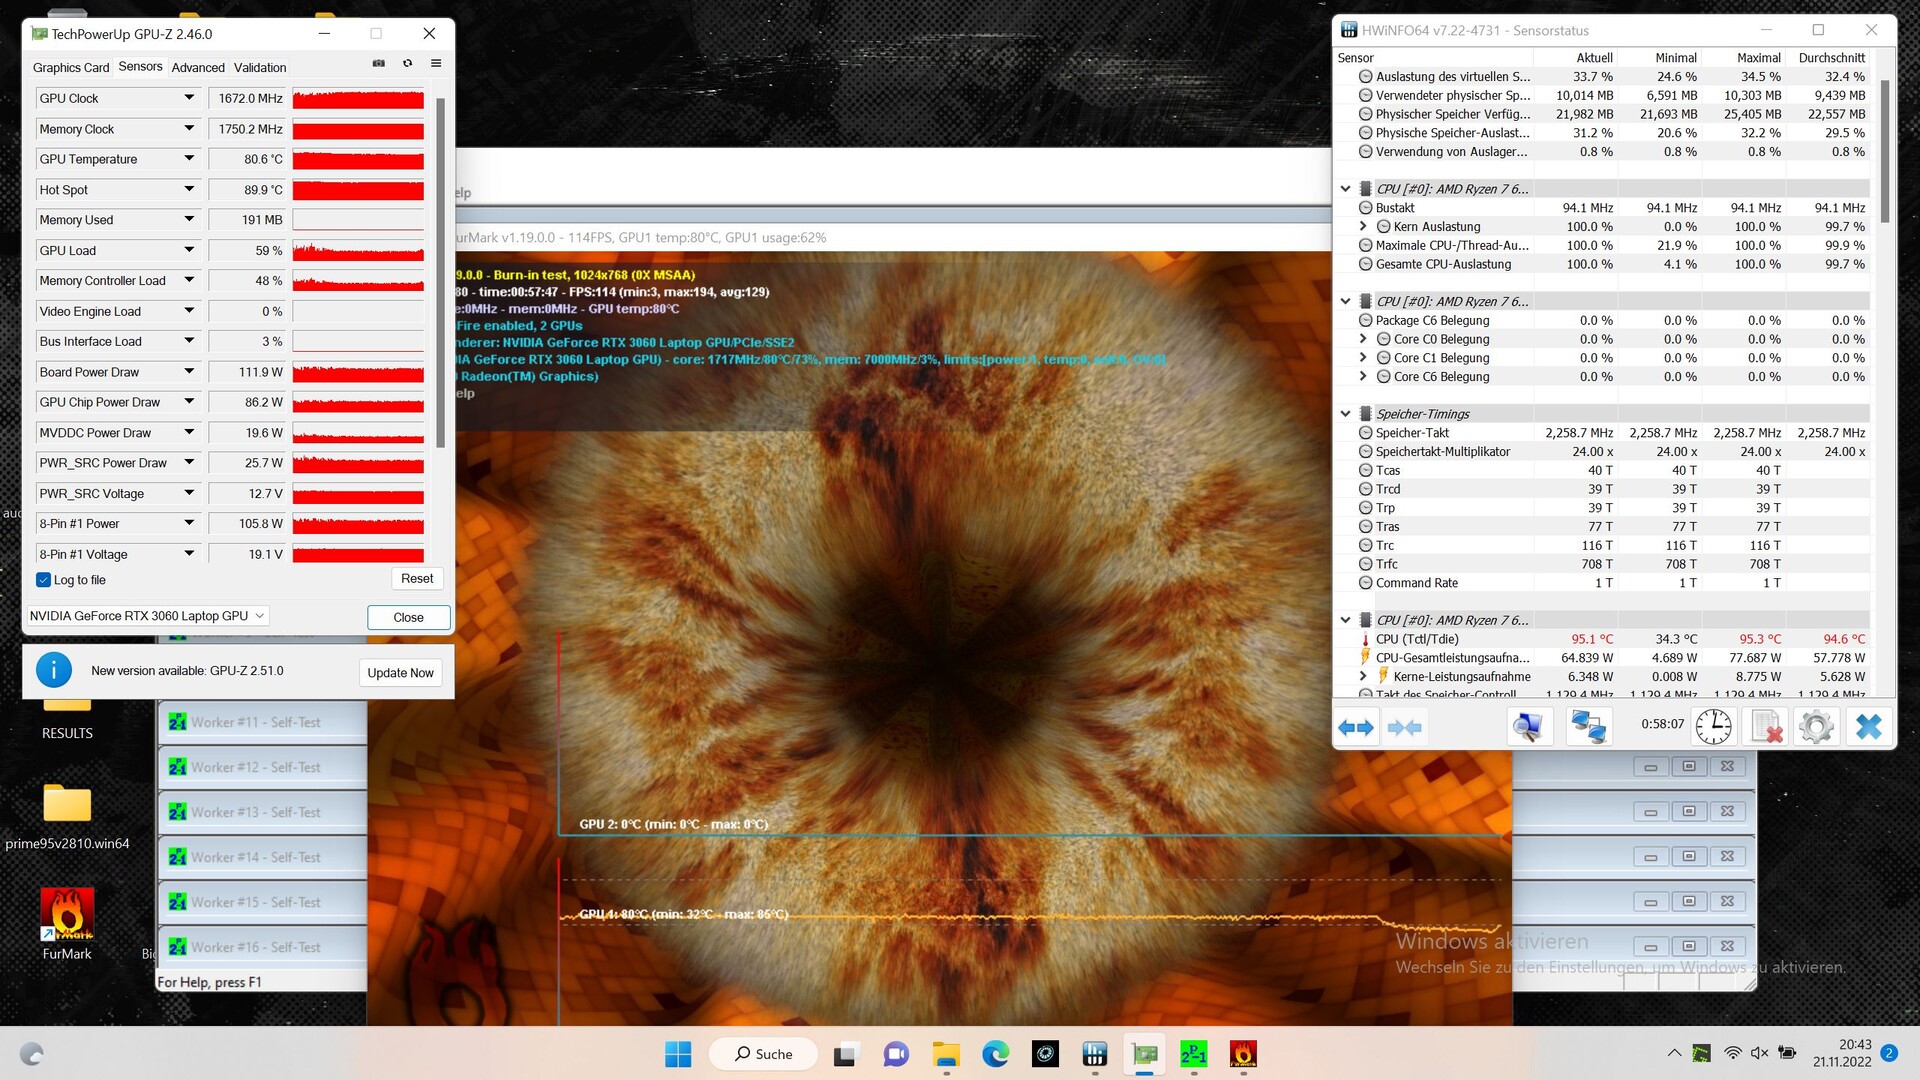
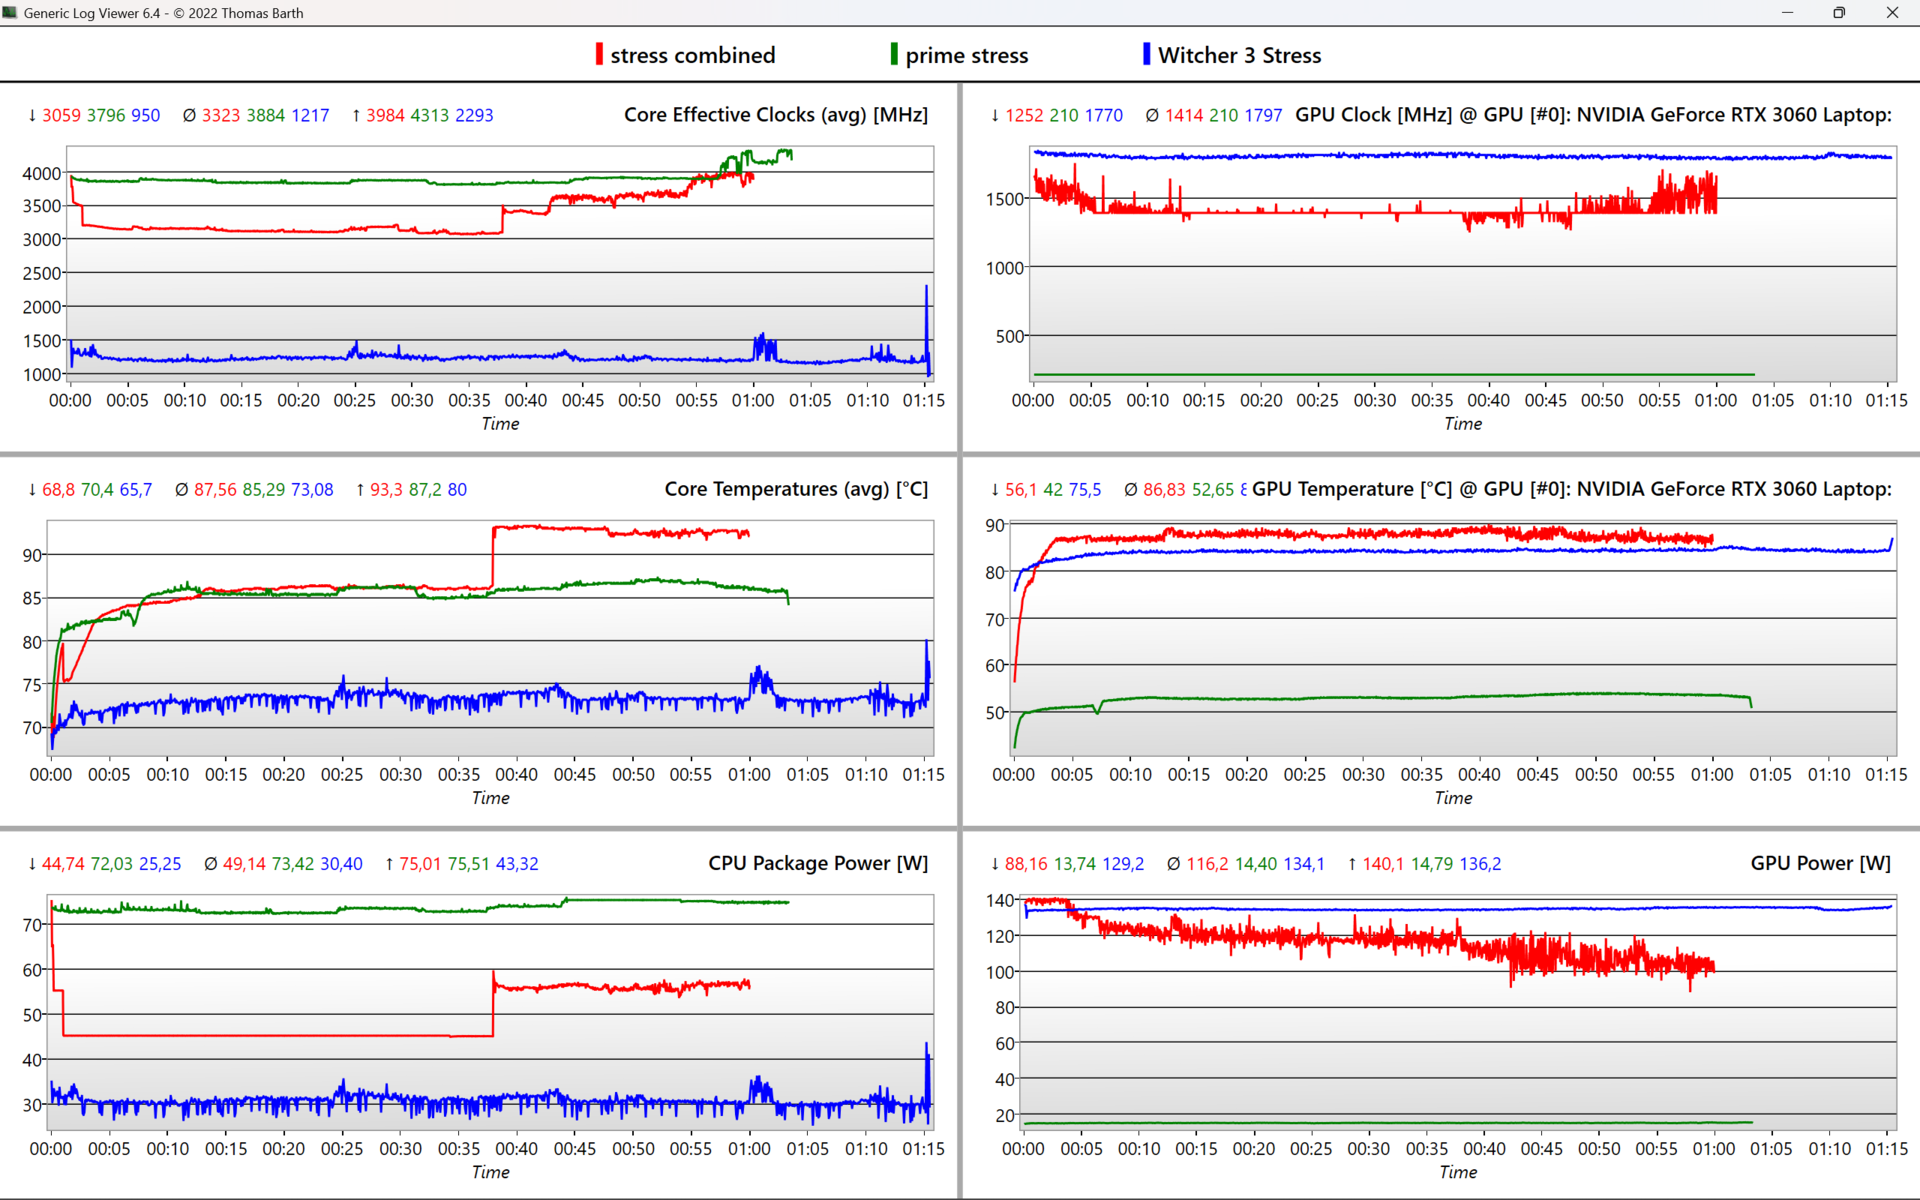
| CPU Clock (GHz) | GPU Clock (MHz) | Average CPU Temperature (°C) | Average GPU Temperature (°C) | |
| System Idle | 0.15 | 200 | 34 | 42 |
| Prime95, Stress | 3.9 | 200 | 85 | 53 |
| Prime95 + FurMark, Stress | 3.3 | 1,400 | 93 | 87 |
| Witcher 3, Stress | 1.2 | 1,800 | 73 | 84 |
Speaker
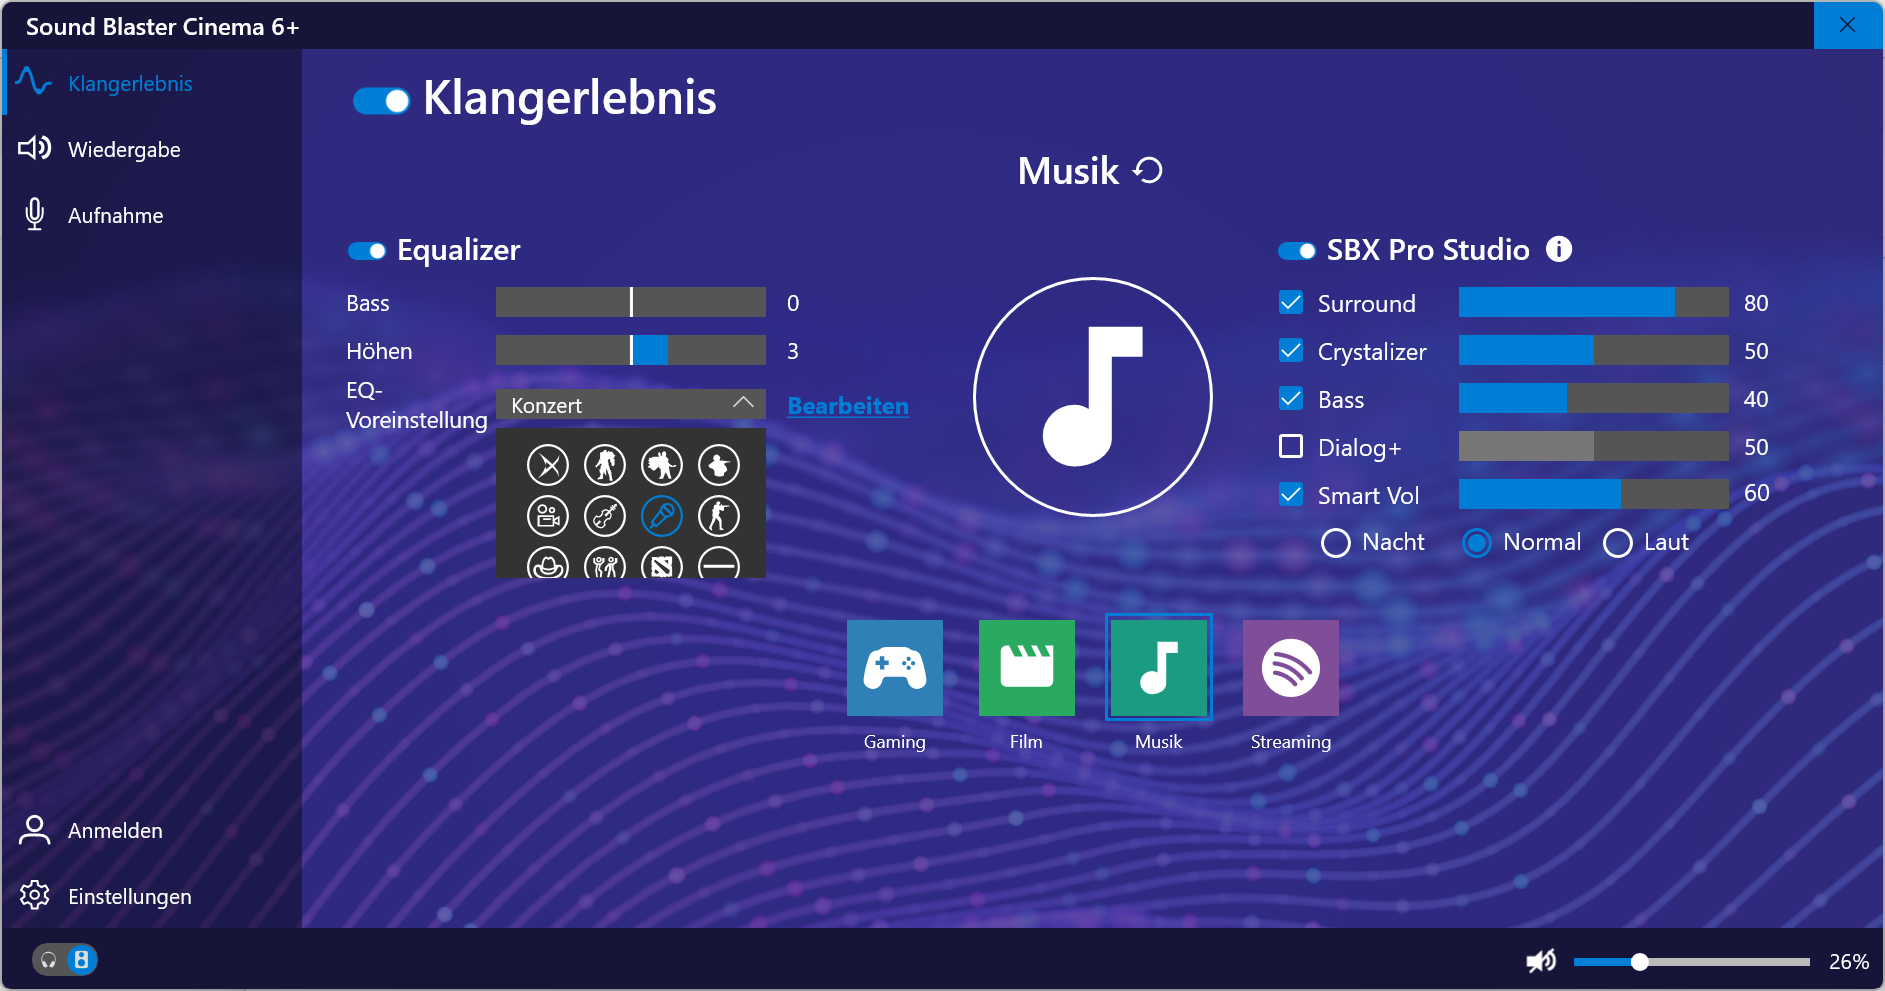
The stereo sound system offers linear and balanced highs and even has implied bass. The Sound Blaster Cinema 6+ software improves the sound by selecting different modes. For a better sound experience, headphones or an external sound system should still be connected via jack or Bluetooth.
SCHENKER XMG Core 15 (M22) audio analysis
(±) | speaker loudness is average but good (81.28 dB)
Bass 100 - 315 Hz
(-) | nearly no bass - on average 19.8% lower than median
(+) | bass is linear (6.4% delta to prev. frequency)
Mids 400 - 2000 Hz
(±) | higher mids - on average 6.2% higher than median
(±) | linearity of mids is average (7.9% delta to prev. frequency)
Highs 2 - 16 kHz
(+) | balanced highs - only 1.8% away from median
(+) | highs are linear (4.8% delta to prev. frequency)
Overall 100 - 16.000 Hz
(±) | linearity of overall sound is average (17.1% difference to median)
Compared to same class
» 46% of all tested devices in this class were better, 11% similar, 43% worse
» The best had a delta of 6%, average was 18%, worst was 132%
Compared to all devices tested
» 29% of all tested devices were better, 8% similar, 63% worse
» The best had a delta of 4%, average was 24%, worst was 134%
Lenovo Legion Slim 7-16IAH 82TF004YGE audio analysis
(±) | speaker loudness is average but good (73.4 dB)
Bass 100 - 315 Hz
(±) | reduced bass - on average 10% lower than median
(±) | linearity of bass is average (13.4% delta to prev. frequency)
Mids 400 - 2000 Hz
(+) | balanced mids - only 1.2% away from median
(+) | mids are linear (3.3% delta to prev. frequency)
Highs 2 - 16 kHz
(±) | higher highs - on average 5.5% higher than median
(±) | linearity of highs is average (10.6% delta to prev. frequency)
Overall 100 - 16.000 Hz
(+) | overall sound is linear (13% difference to median)
Compared to same class
» 18% of all tested devices in this class were better, 4% similar, 79% worse
» The best had a delta of 6%, average was 18%, worst was 132%
Compared to all devices tested
» 12% of all tested devices were better, 2% similar, 86% worse
» The best had a delta of 4%, average was 24%, worst was 134%
Power management: AMD gaming laptop with usable battery life
Energy consumption
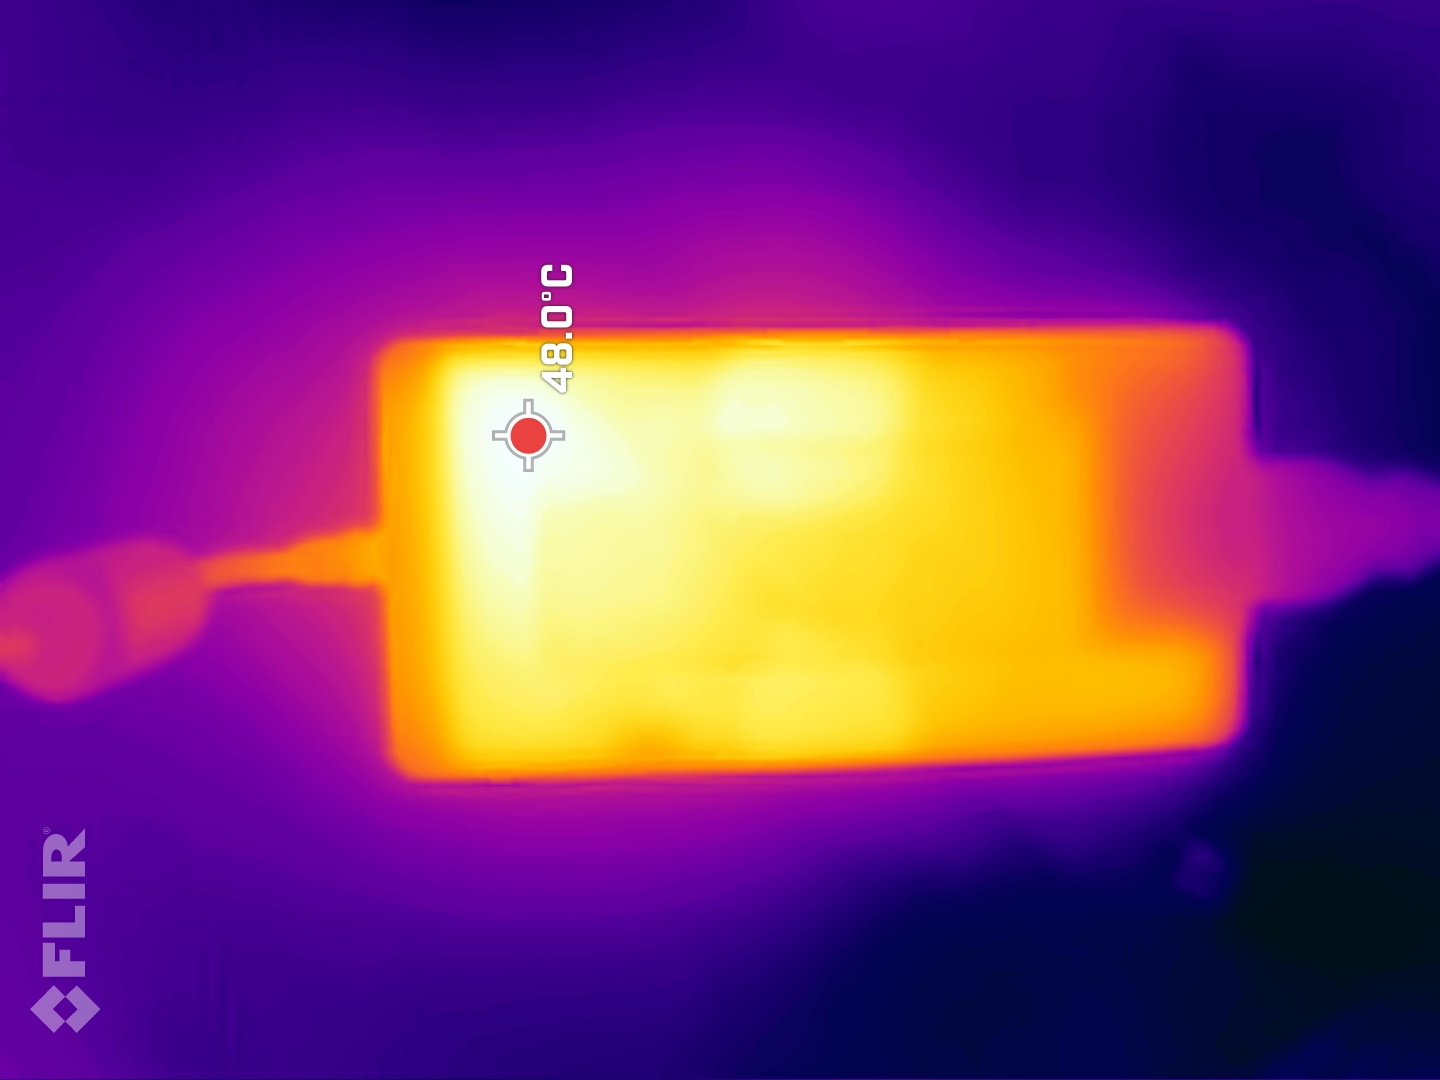
The energy consumption is basically on the expected level and is roughly on par with the competition in our comparison field. Only the Legion 5 draws considerably more juice from the socket in idle, whereas the TUF Gaming F15 is the most frugal in idle in our comparison. The 230 W power supply is up to its task, as it rarely reaches 236 W at peak.
| Idle | |
| Load |
|
Key:
min: | |
| SCHENKER XMG Core 15 (M22) R7 6800H, GeForce RTX 3060 Laptop GPU, Samsung SSD 980 Pro 1TB MZ-V8P1T0BW, IPS, 2560x1440, 15.6" | Lenovo Legion 5 15IAH7H 82RB i7-12700H, GeForce RTX 3060 Laptop GPU, , IPS, 1920x1080, 15.6" | SCHENKER XMG Fusion 15 (Mid 22) i7-11800H, GeForce RTX 3070 Laptop GPU, Samsung SSD 980 Pro 1TB MZ-V8P1T0BW, IPS, 2560x1440, 15.6" | Asus TUF Gaming F15 FX507ZM i7-12700H, GeForce RTX 3060 Laptop GPU, SK Hynix HFM001TD3JX013N, IPS, 1920x1080, 15.6" | Alienware m15 R5 Ryzen Edition R7 5800H, GeForce RTX 3060 Laptop GPU, Toshiba KBG40ZNS512G NVMe, IPS, 1920x1080, 15.6" | SCHENKER XMG Core 15 Ampere R7 4800H, GeForce RTX 3060 Laptop GPU, Samsung SSD 970 EVO Plus 1TB, IPS, 2560x1440, 15.6" | Average NVIDIA GeForce RTX 3060 Laptop GPU | Average of class Gaming | |
|---|---|---|---|---|---|---|---|---|
| Power Consumption | -64% | -10% | -1% | -12% | -2% | -5% | -31% | |
| Idle Minimum * | 11.8 | 19.8 -68% | 12 -2% | 6.3 47% | 11 7% | 11 7% | 10.4 ? 12% | 14.2 ? -20% |
| Idle Average * | 14.7 | 26.2 -78% | 17 -16% | 9.8 33% | 14 5% | 14 5% | 14.5 ? 1% | 20.2 ? -37% |
| Idle Maximum * | 15 | 48.2 -221% | 24 -60% | 26.5 -77% | 25 -67% | 20 -33% | 21.4 ? -43% | 27.2 ? -81% |
| Load Average * | 100 | 102.9 -3% | 106 -6% | 103.8 -4% | 123 -23% | 94 6% | 109.3 ? -9% | 107.7 ? -8% |
| Witcher 3 ultra * | 184 | 186.7 -1% | 159.9 13% | 189 -3% | 176 4% | 167 9% | ||
| Load Maximum * | 237 | 268 -13% | 208 12% | 241.9 -2% | 226 5% | 251 -6% | 206 ? 13% | 260 ? -10% |
* ... smaller is better
Energy consumption Witcher 3 / Stress test
Energy consumption with external monitor
Battery life
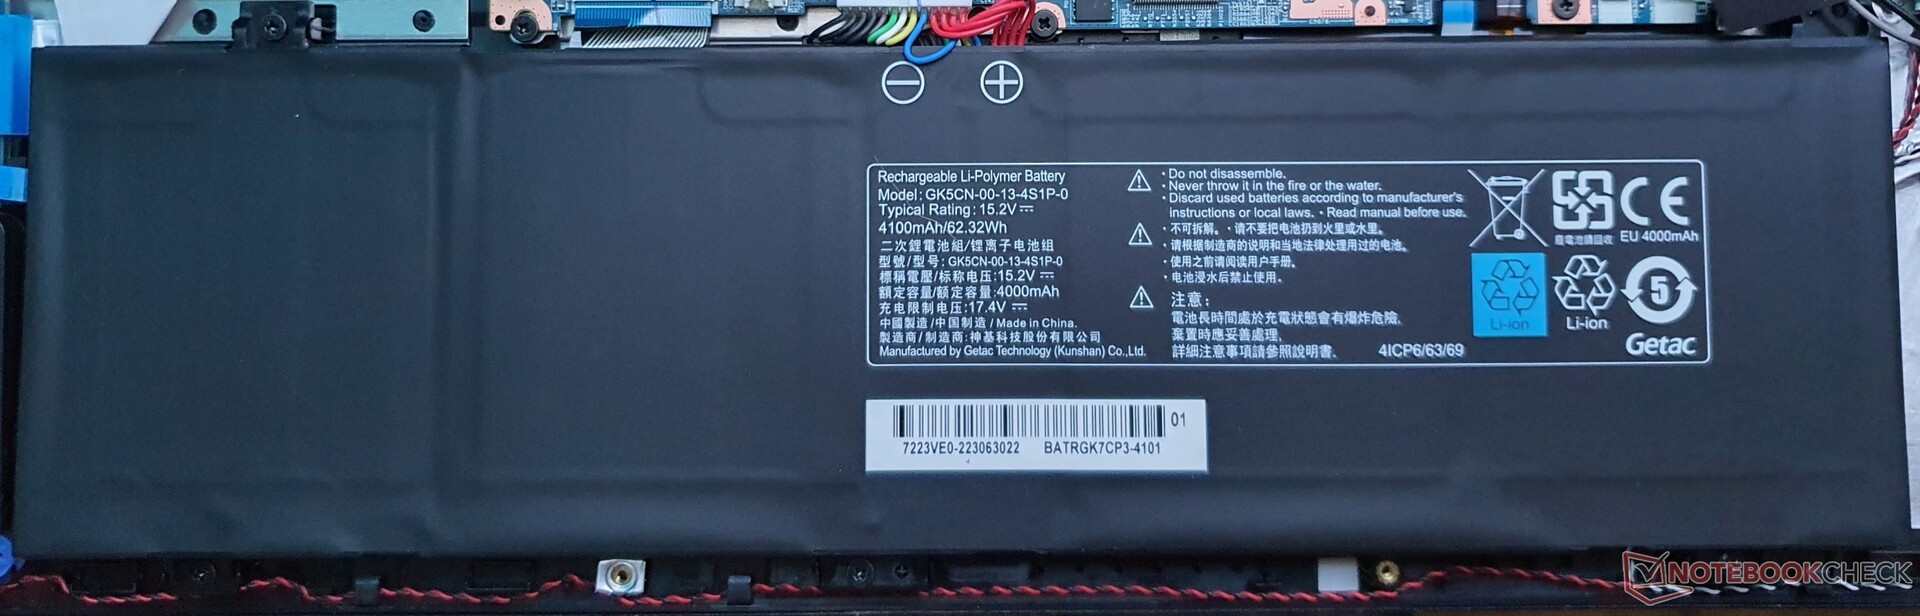
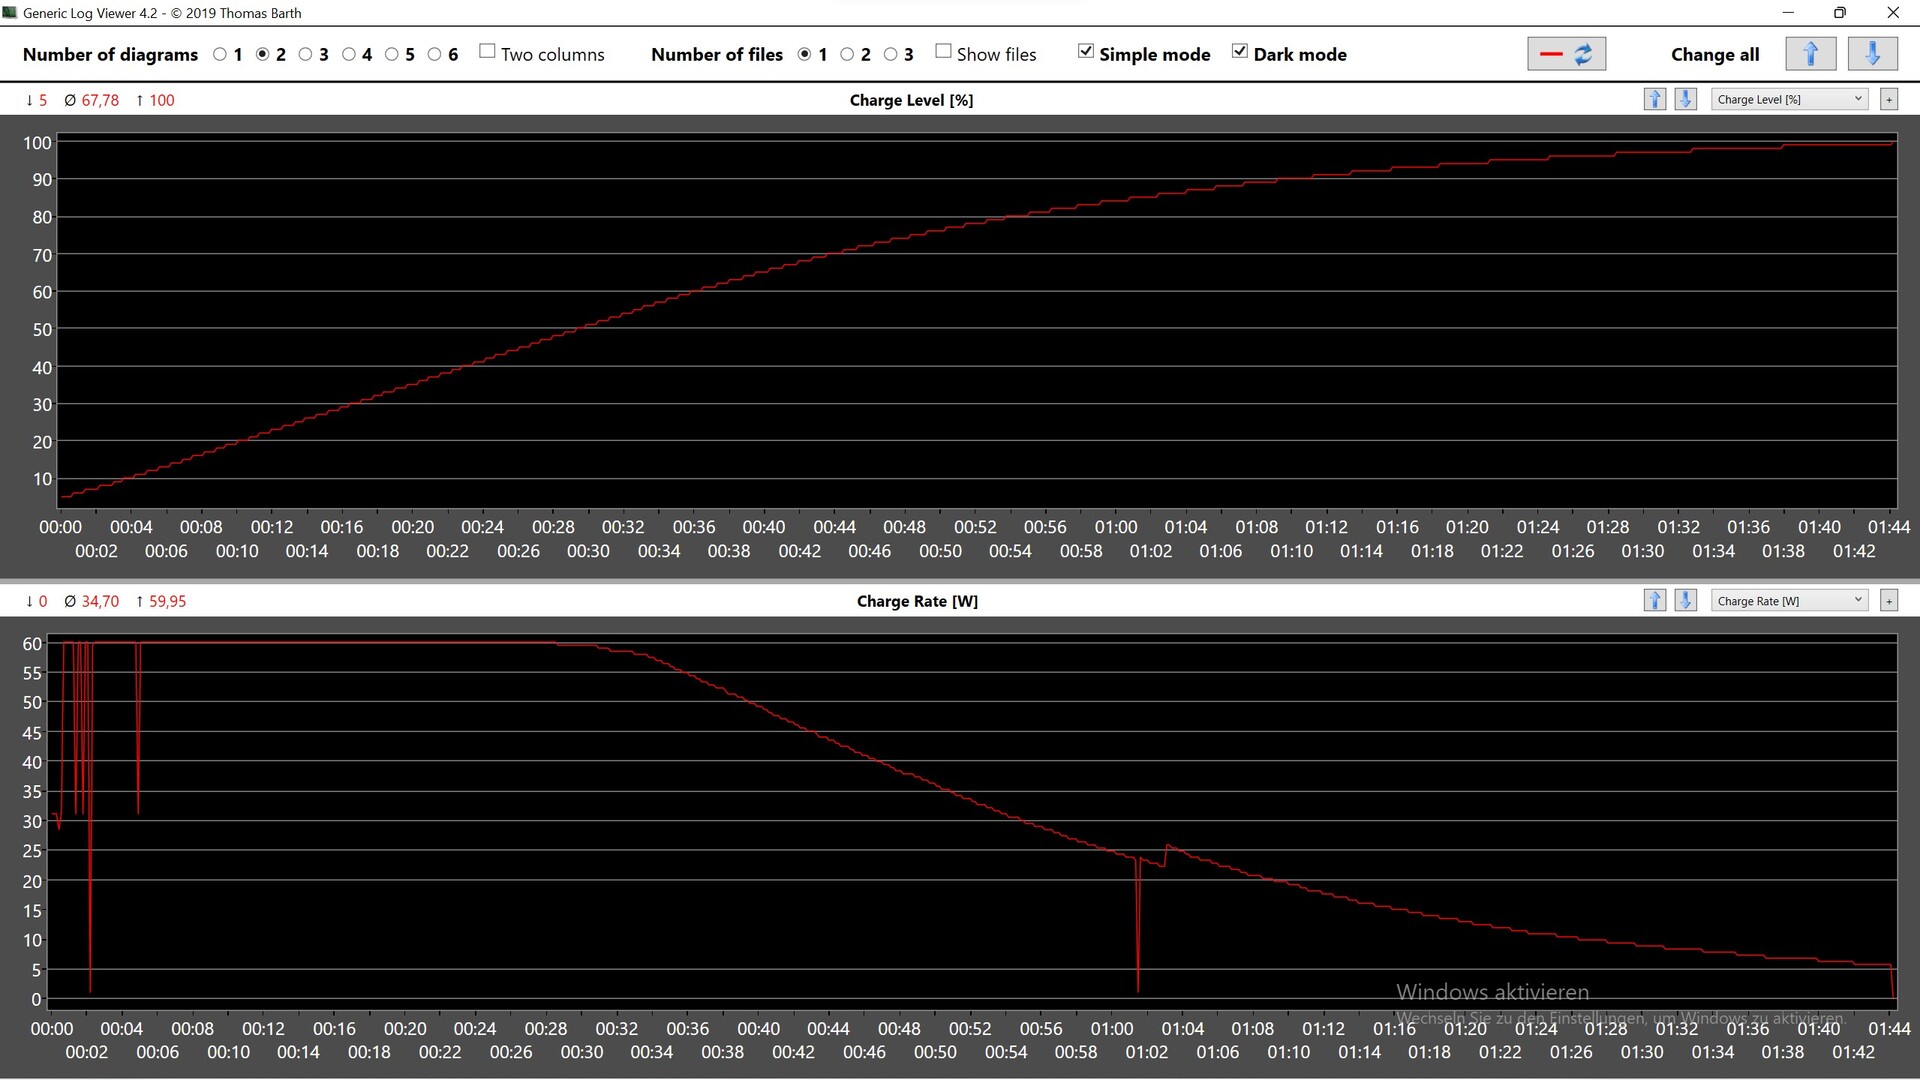
Despite the small 62 Wh battery, the runtimes of 7:45 h, for example when web surfing at 150 cd/m², are quite decent. We tested in Enthusiast mode, while the refresh rate is automatically reduced to 60 Hz on battery power.
The XMG Core 15 thus lasts the longest in our comparison field and is an efficient gamer, since the competition all relies on even bigger batteries, with 80 to 93 Wh. The battery is half recharged in 30 minutes.
| SCHENKER XMG Core 15 (M22) R7 6800H, GeForce RTX 3060 Laptop GPU, 62 Wh | Lenovo Legion 5 15IAH7H 82RB i7-12700H, GeForce RTX 3060 Laptop GPU, 80 Wh | SCHENKER XMG Fusion 15 (Mid 22) i7-11800H, GeForce RTX 3070 Laptop GPU, 93.48 Wh | Asus TUF Gaming F15 FX507ZM i7-12700H, GeForce RTX 3060 Laptop GPU, 90 Wh | Alienware m15 R5 Ryzen Edition R7 5800H, GeForce RTX 3060 Laptop GPU, 86 Wh | SCHENKER XMG Core 15 Ampere R7 4800H, GeForce RTX 3060 Laptop GPU, 62 Wh | Average of class Gaming | |
|---|---|---|---|---|---|---|---|
| Battery Runtime | -18% | 33% | -18% | -24% | -9% | 9% | |
| WiFi v1.3 | 465 | 302 -35% | 446 -4% | 285 -39% | 306 -34% | 348 -25% | 387 ? -17% |
| Load | 64 | 64 0% | 109 70% | 66 3% | 55 -14% | 69 8% | 85.8 ? 34% |
| H.264 | 448 | 525 | 360 | 457 ? | |||
| Witcher 3 ultra | 96 | 69.5 ? |
Pros
Cons
Verdict: Fast Schenker gaming laptop with RTX 3060
Overall, Schenker's XMG Core 15 turns out to be a solid upper mid-range gamer. The 3D performance is on an above-average level, but some models with the same TGP, like the Asus TUF Gaming or the Asus ROG Strix Scar, are even faster. The AMD Ryzen 7 6800H at least contributes to frugal operation, even though it lags (minimally) behind the Intel rivals with i7-12700H.
Despite the small 62 Wh battery, the compact gaming laptop achieves the longest battery life of 7:45 h in our comparison field, while the matte WQHD display with 165 Hz and fast response times is also more than respectable. Quiet gaming is possible without major performance losses thanks to the Balanced mode, but the gaming pleasure is very limited away from the power outlet.
Those who can do without USB4, Power Delivery and gaming on battery power will get a solid and potentially quiet mid-range gamer with optional water cooling for 1,817 Euros (~$1935).
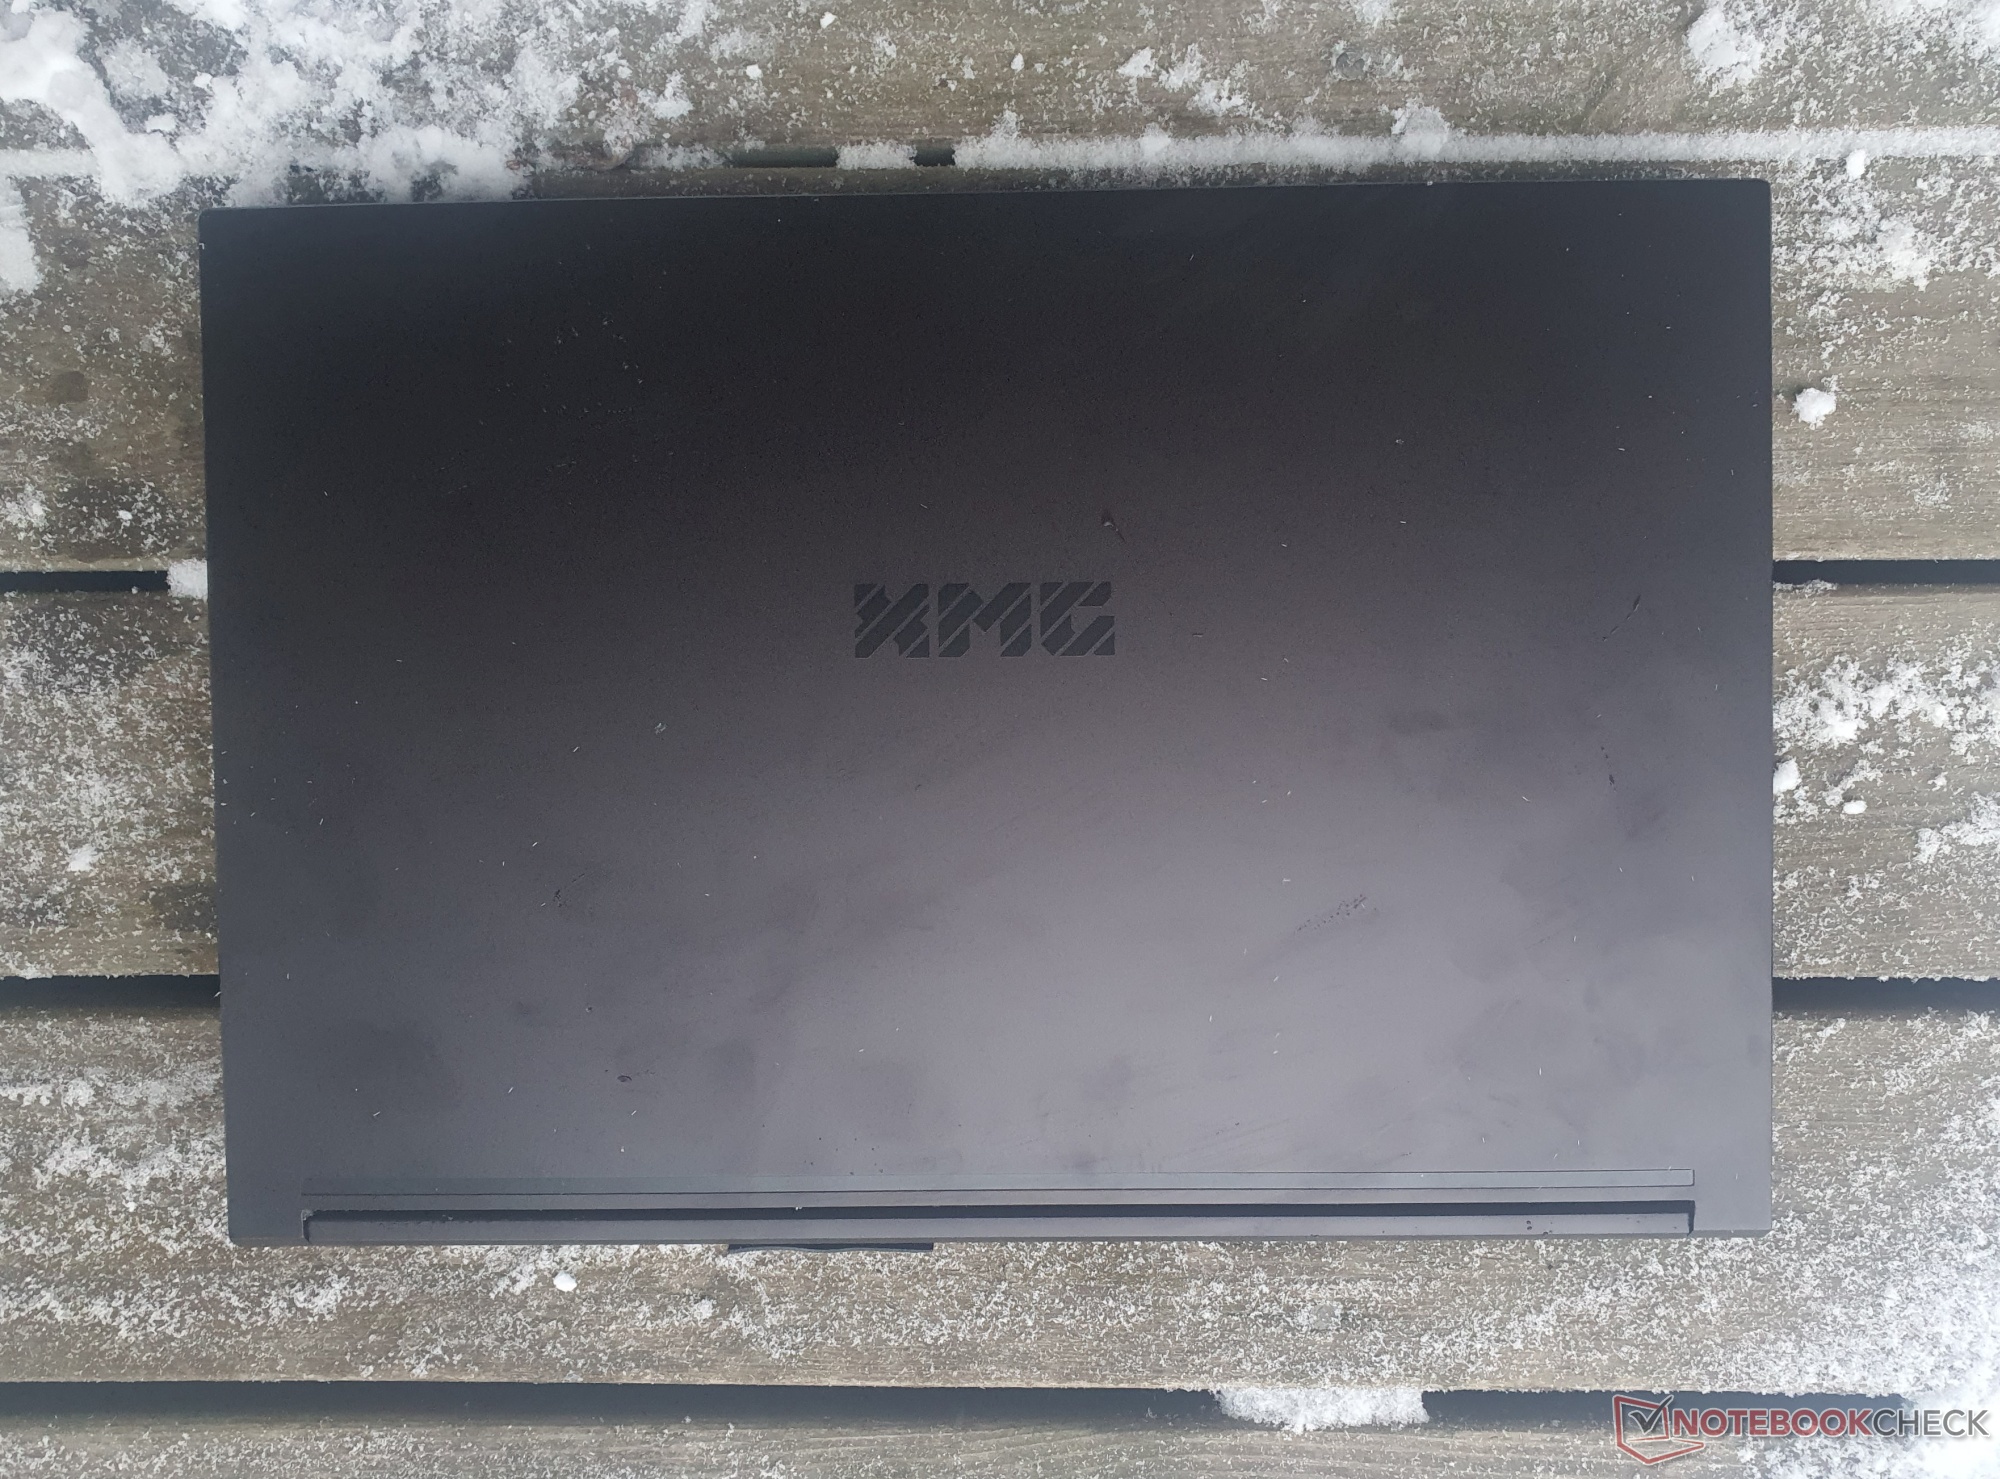
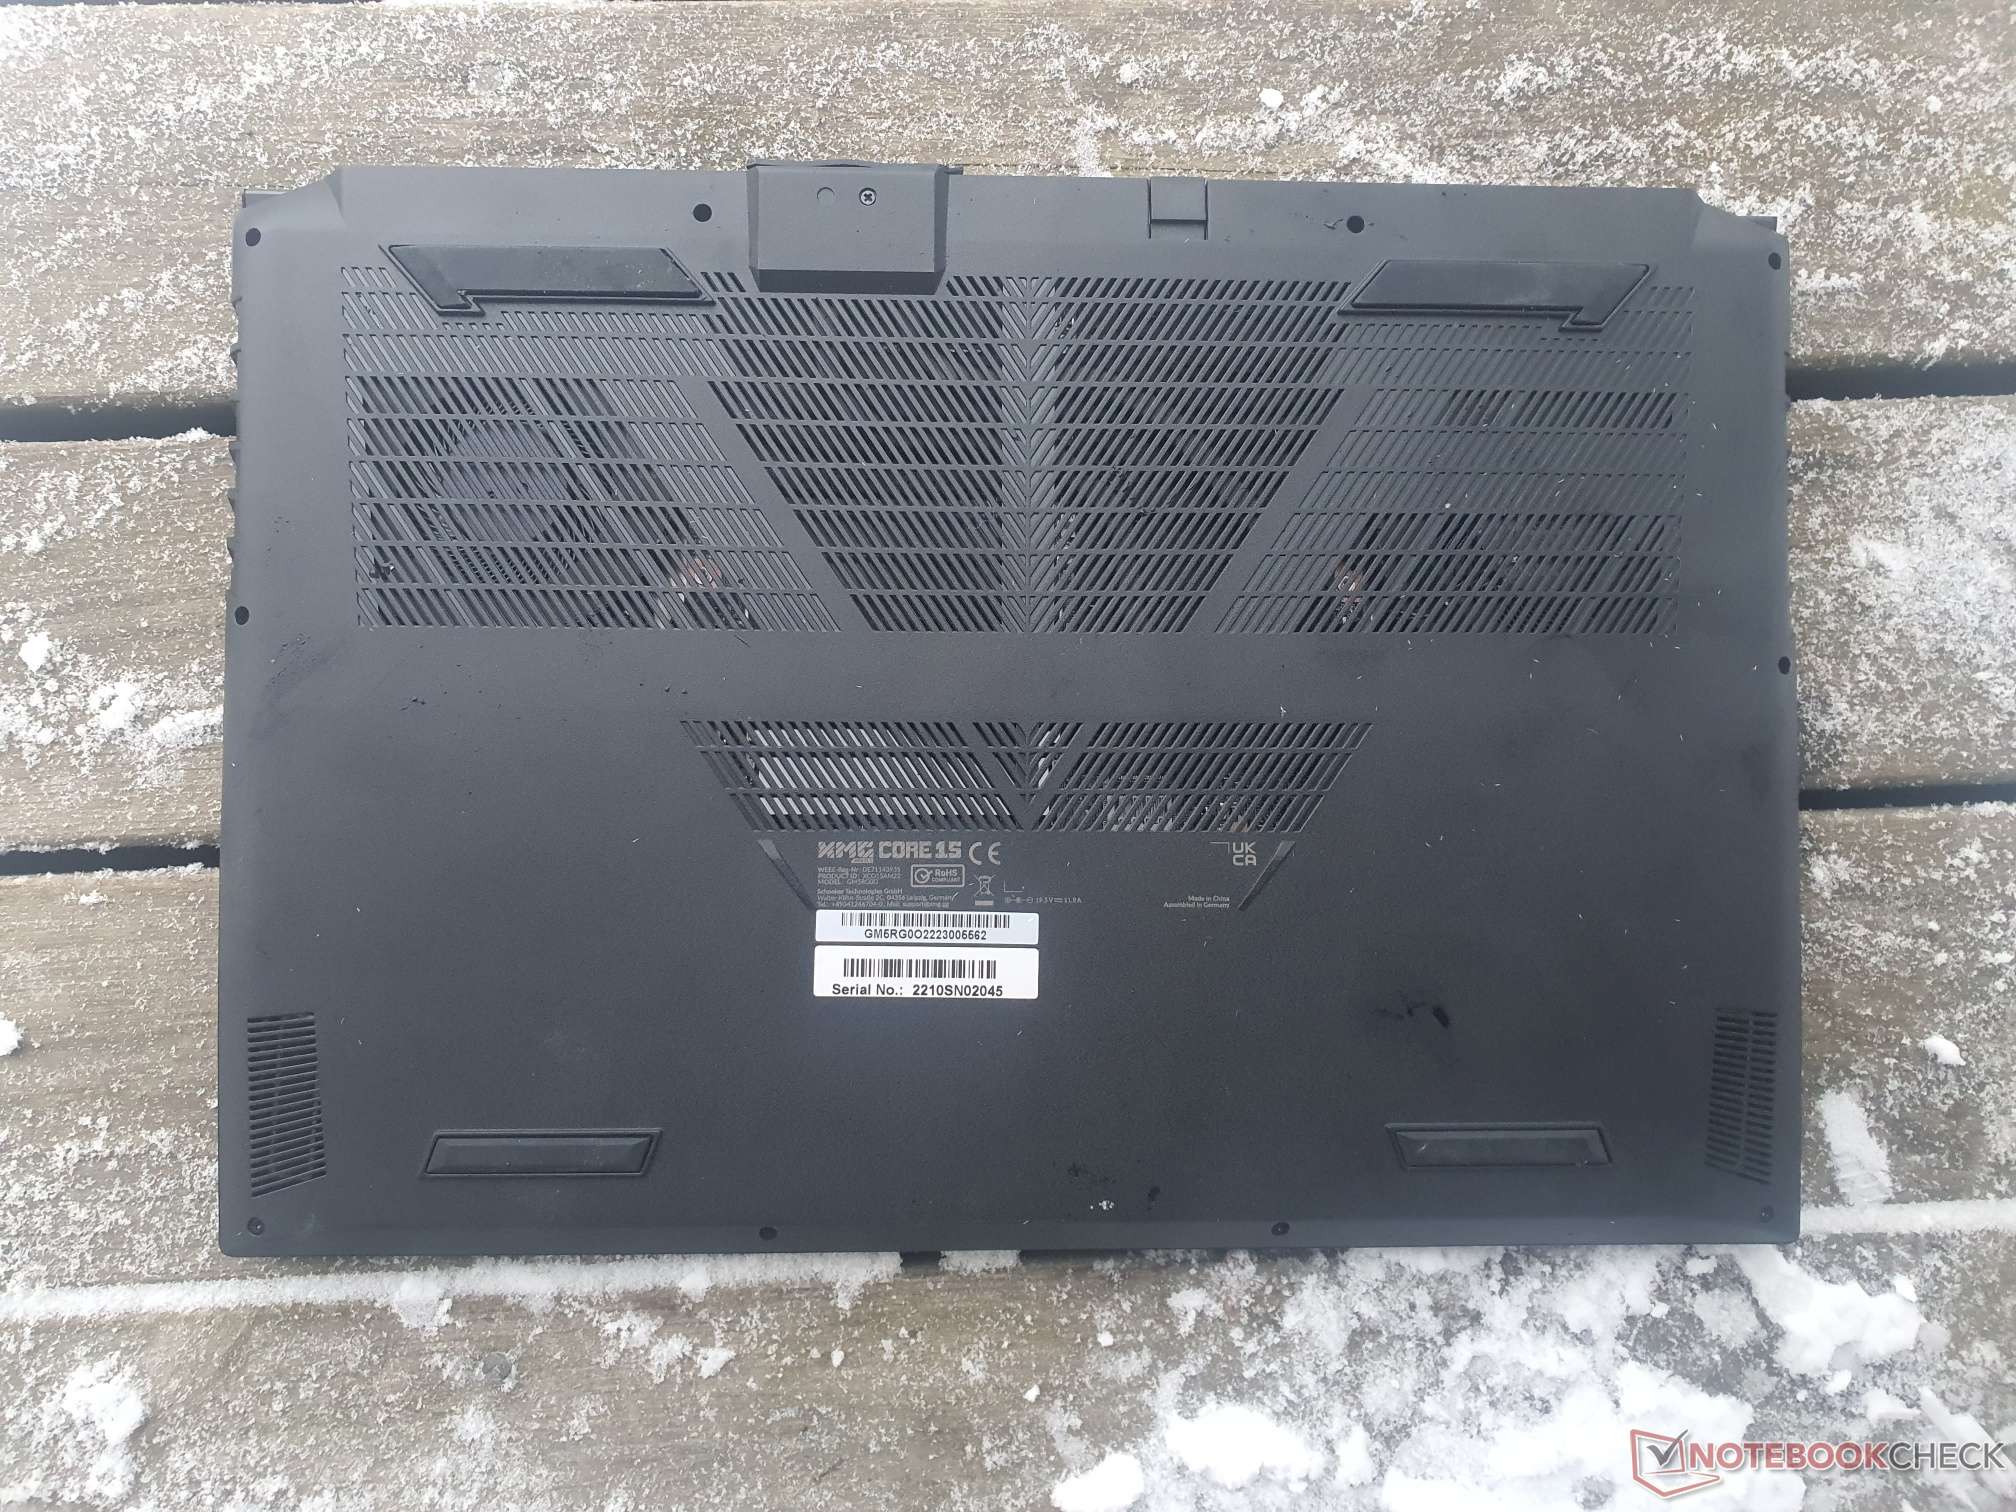
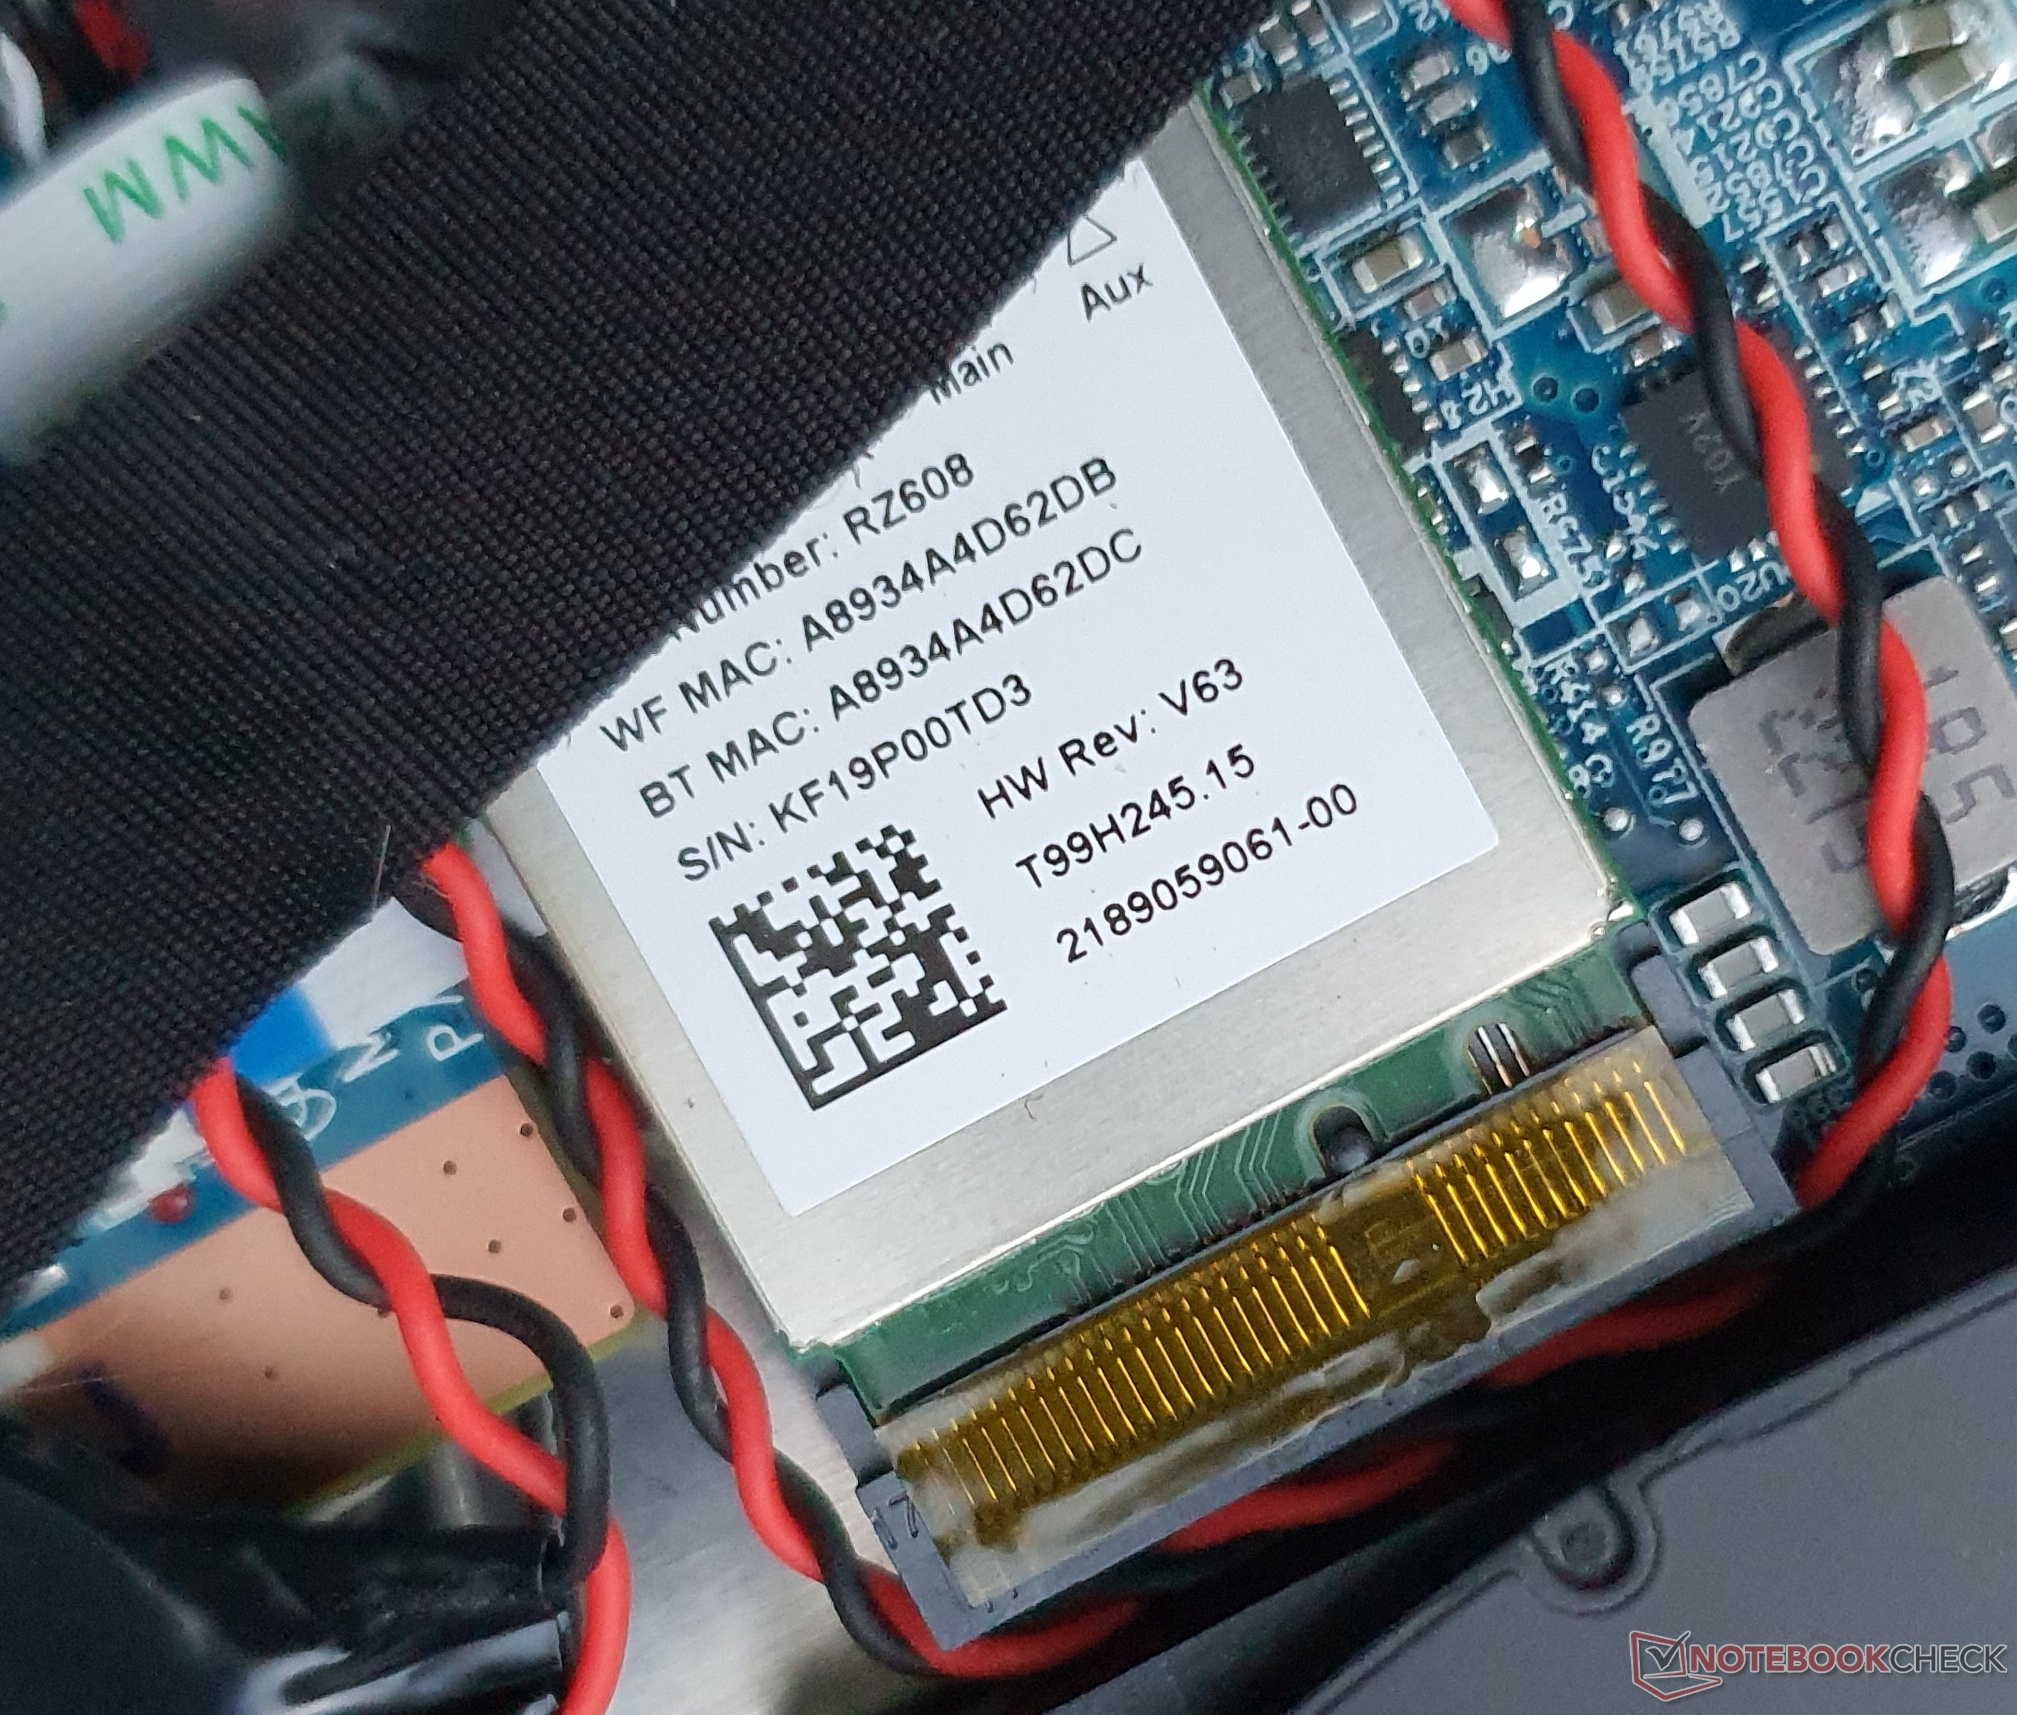
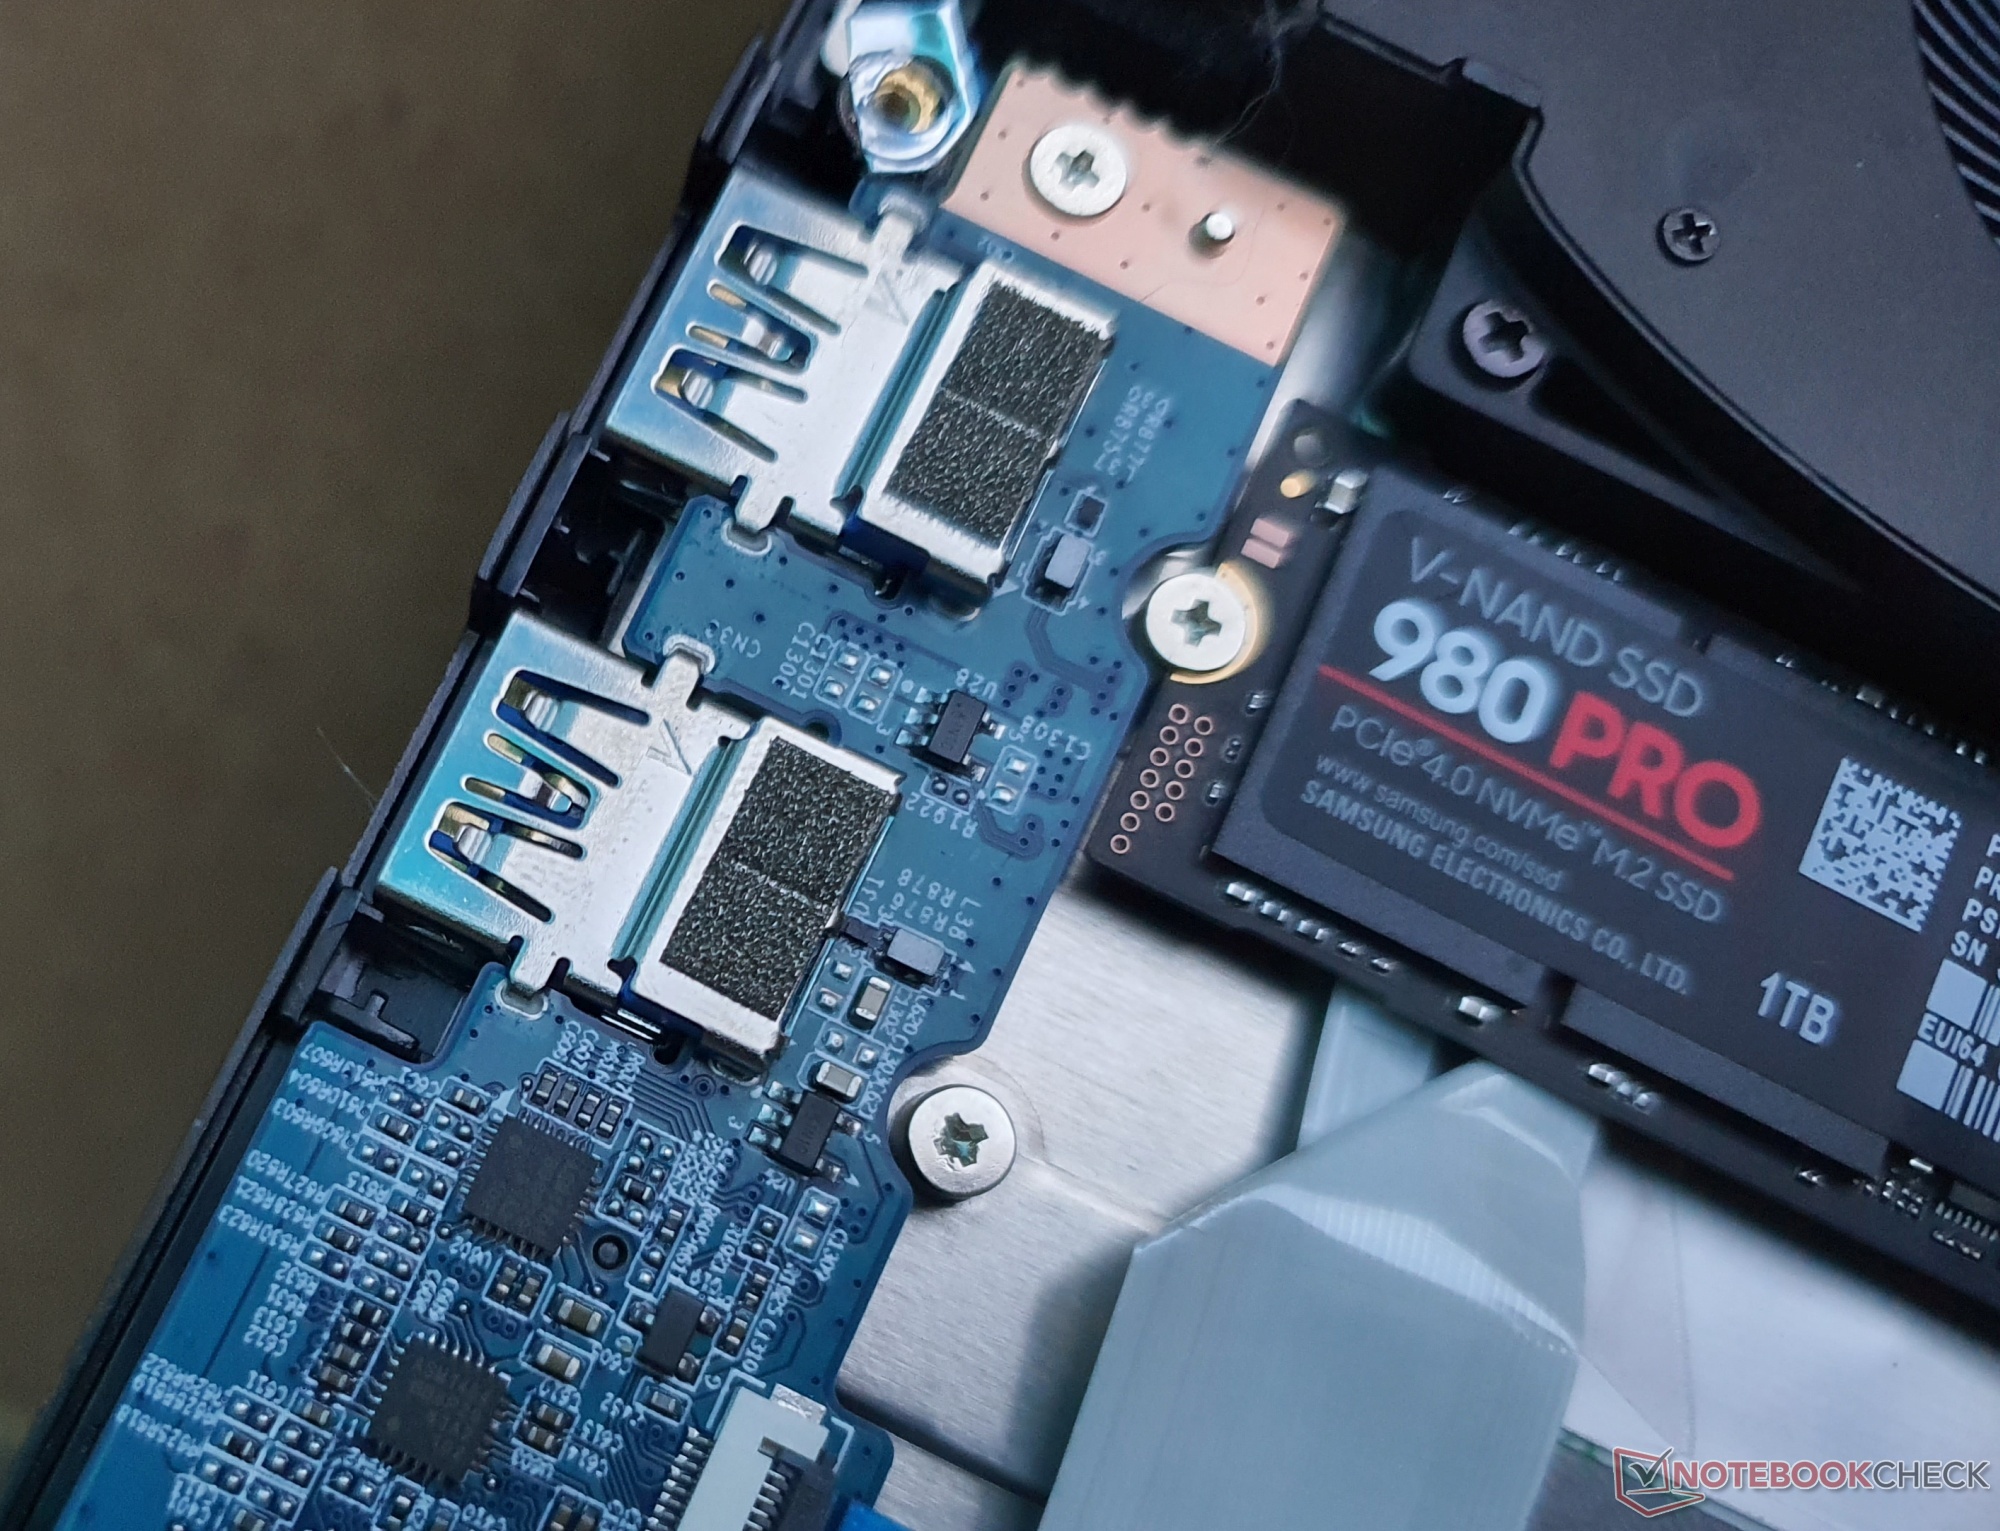
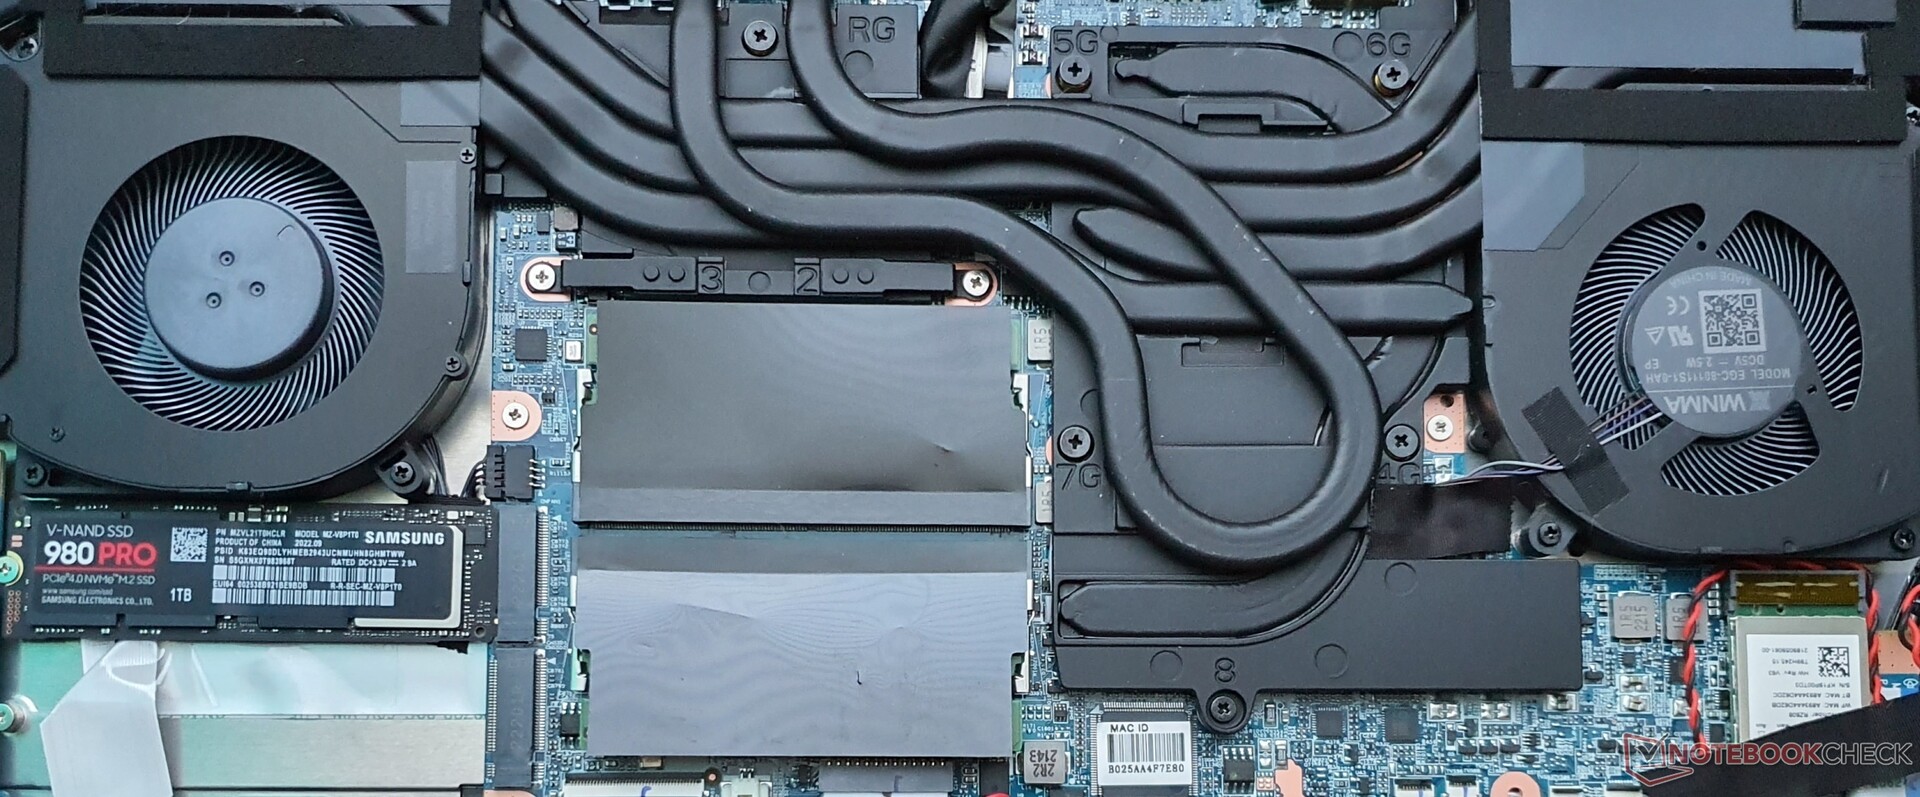
Maintenance is made easy, as there are two M.2-2280 slots for PCIe 4.0 SSDs, plus two RAM slots, and the somewhat slow WiFi module can also be changed. Per-Key RGB and Advanced Optimus have to be waived, but a MUX switch is available as well as the option to overclock the GPU.
Lenovo's Legion 5 Pro offers a potentially faster RTX 3070, a brighter and larger 16:10 display, and the better keyboard at a similar price. The XMG Fusion 15 from Lenovo offers an even better one since it is mechanical. The Legion Slim 7i is also a recommendation, since it is already available for 1,529 Euros (~$1629) in a similar configuration at the time of this review.
.
Price and availability
Schenker's XMG Core 15 (M22) is currently offered in the tested configuration for 1,817 Euro (~$1935) at Bestware. The currently cheapest model with the same CPU+GPU, but less memory and FHD 144 Hz panel is available for as little as 1,492 Euros (~$1589).
SCHENKER XMG Core 15 (M22)
- 01/02/2023 v7 (old)
Marvin Gollor
More articles related to this device
SCHENKER XMG Core 15 (M22) (XMG Core 15 Series)Related Articles


Price comparison

