 Deutsch
 English
 Español
 Français
 Italiano
 Nederlands
 Polski
 Português
 Русский
 Türkçe
 Svenska
 Chinese
 Magyar
Schenker XMG Pro 15 (RTX 3080 Ti) laptop review: The Mike Tyson of all-round laptops
At the beginning of the year, we reviewed the predecessor with the Tiger Lake CPU and RTX 3080. Now Schenker has created a new case and updated the hardware to Alder Lake and RTX 3080 Ti. This time, we are reviewing the variant with a QHD IPS display instead of a 4K OLED screen.
In addition to the predecessor, other 15-inch laptops with similar hardware are used for comparison, including the MSI Raider GE66 12UHS as well as the Razer Blade 15. We also compare the performance with that of the in-house XMG Neo 15 with and without its XMG Oasis liquid cooling system.
Possible Competitors in Comparison
Rating | Date | Model | Weight | Height | Size | Resolution | Best Price |
|---|---|---|---|---|---|---|---|
| 86.9 % | 07/2022 | SCHENKER XMG Pro 15 (i7-12700H, RTX 3080 Ti) i7-12700H, GeForce RTX 3080 Ti Laptop GPU | 2.4 kg | 25 mm | 15.60" | 2560x1440 | |
| 84.6 % | 01/2022 | SCHENKER XMG Pro 15 (Late 2021) i7-11800H, GeForce RTX 3080 Laptop GPU | 2 kg | 19.8 mm | 15.60" | 3840x2160 | |
| 88.4 % | 07/2022 | SCHENKER XMG Neo 15 (i7-12700H, RTX 3080 Ti) i7-12700H, GeForce RTX 3080 Ti Laptop GPU | 2.3 kg | 26.6 mm | 15.60" | 2560x1440 | |
| 87.4 % | 06/2022 | MSI Raider GE66 12UHS i9-12900HK, GeForce RTX 3080 Ti Laptop GPU | 2.4 kg | 23.4 mm | 15.60" | 3840x2160 | |
| 89.1 % | 03/2022 | Razer Blade 15 2022 i7-12800H, GeForce RTX 3080 Ti Laptop GPU | 2.1 kg | 16.99 mm | 15.60" | 2560x1440 |
Case: Thicker and heavier again
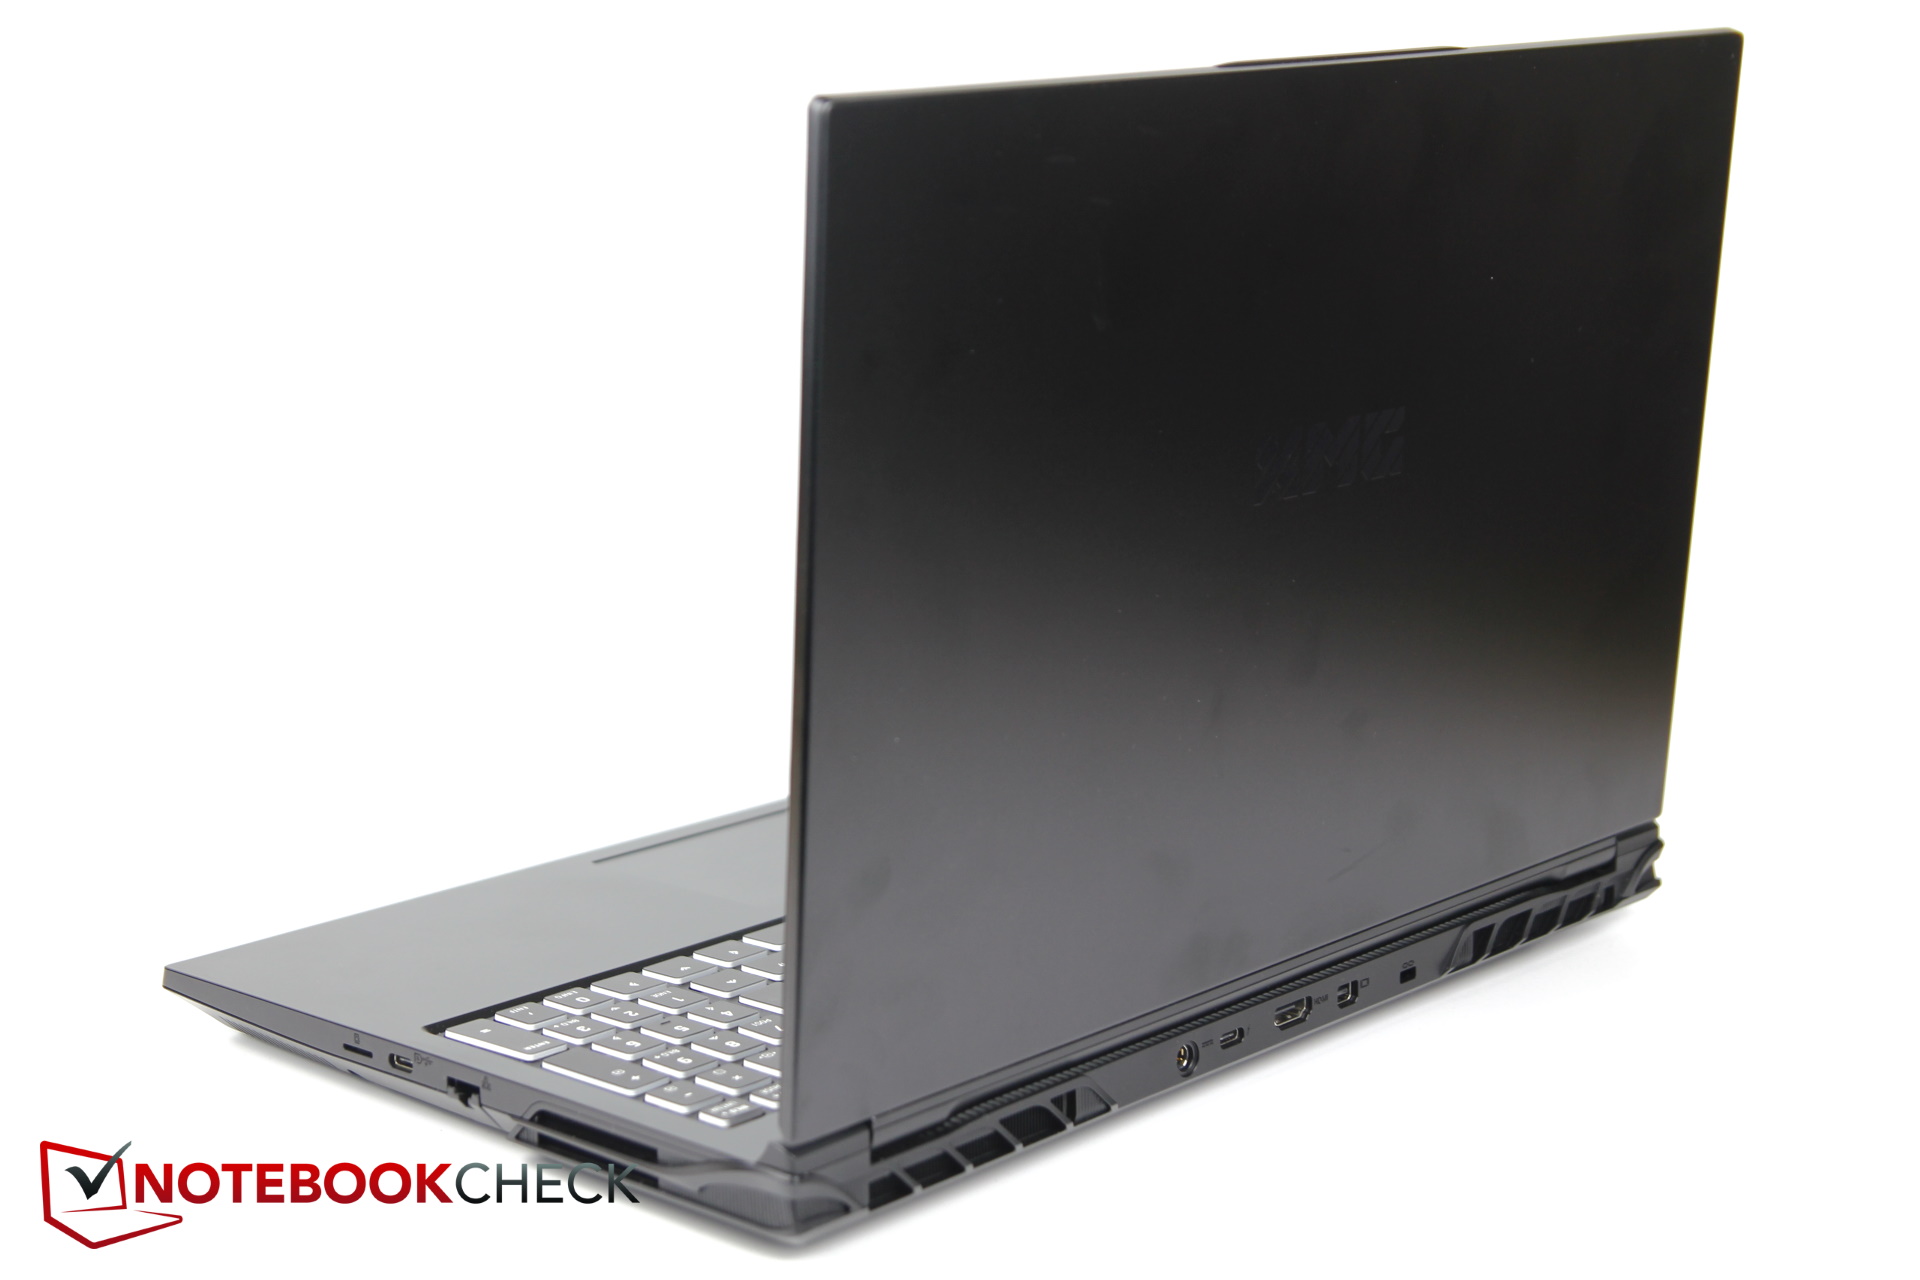
Schenker uses a new case, the Clevo PD50PNT. The display lid and the bottom shell are still made of aluminum, while the display bezel and the top shell are made of plastic. The display lid and base make slight creaking noises under torsion, but still give a sufficiently sturdy impression, especially the base. No uneven gaps were found, and the workmanship is on a good level.
The design is relatively simple and kept in black, which should also appeal to content creators. The XMG logo is barely visible on the lid because it is also dark. The surfaces are a magnet for fingerprints and grease marks.
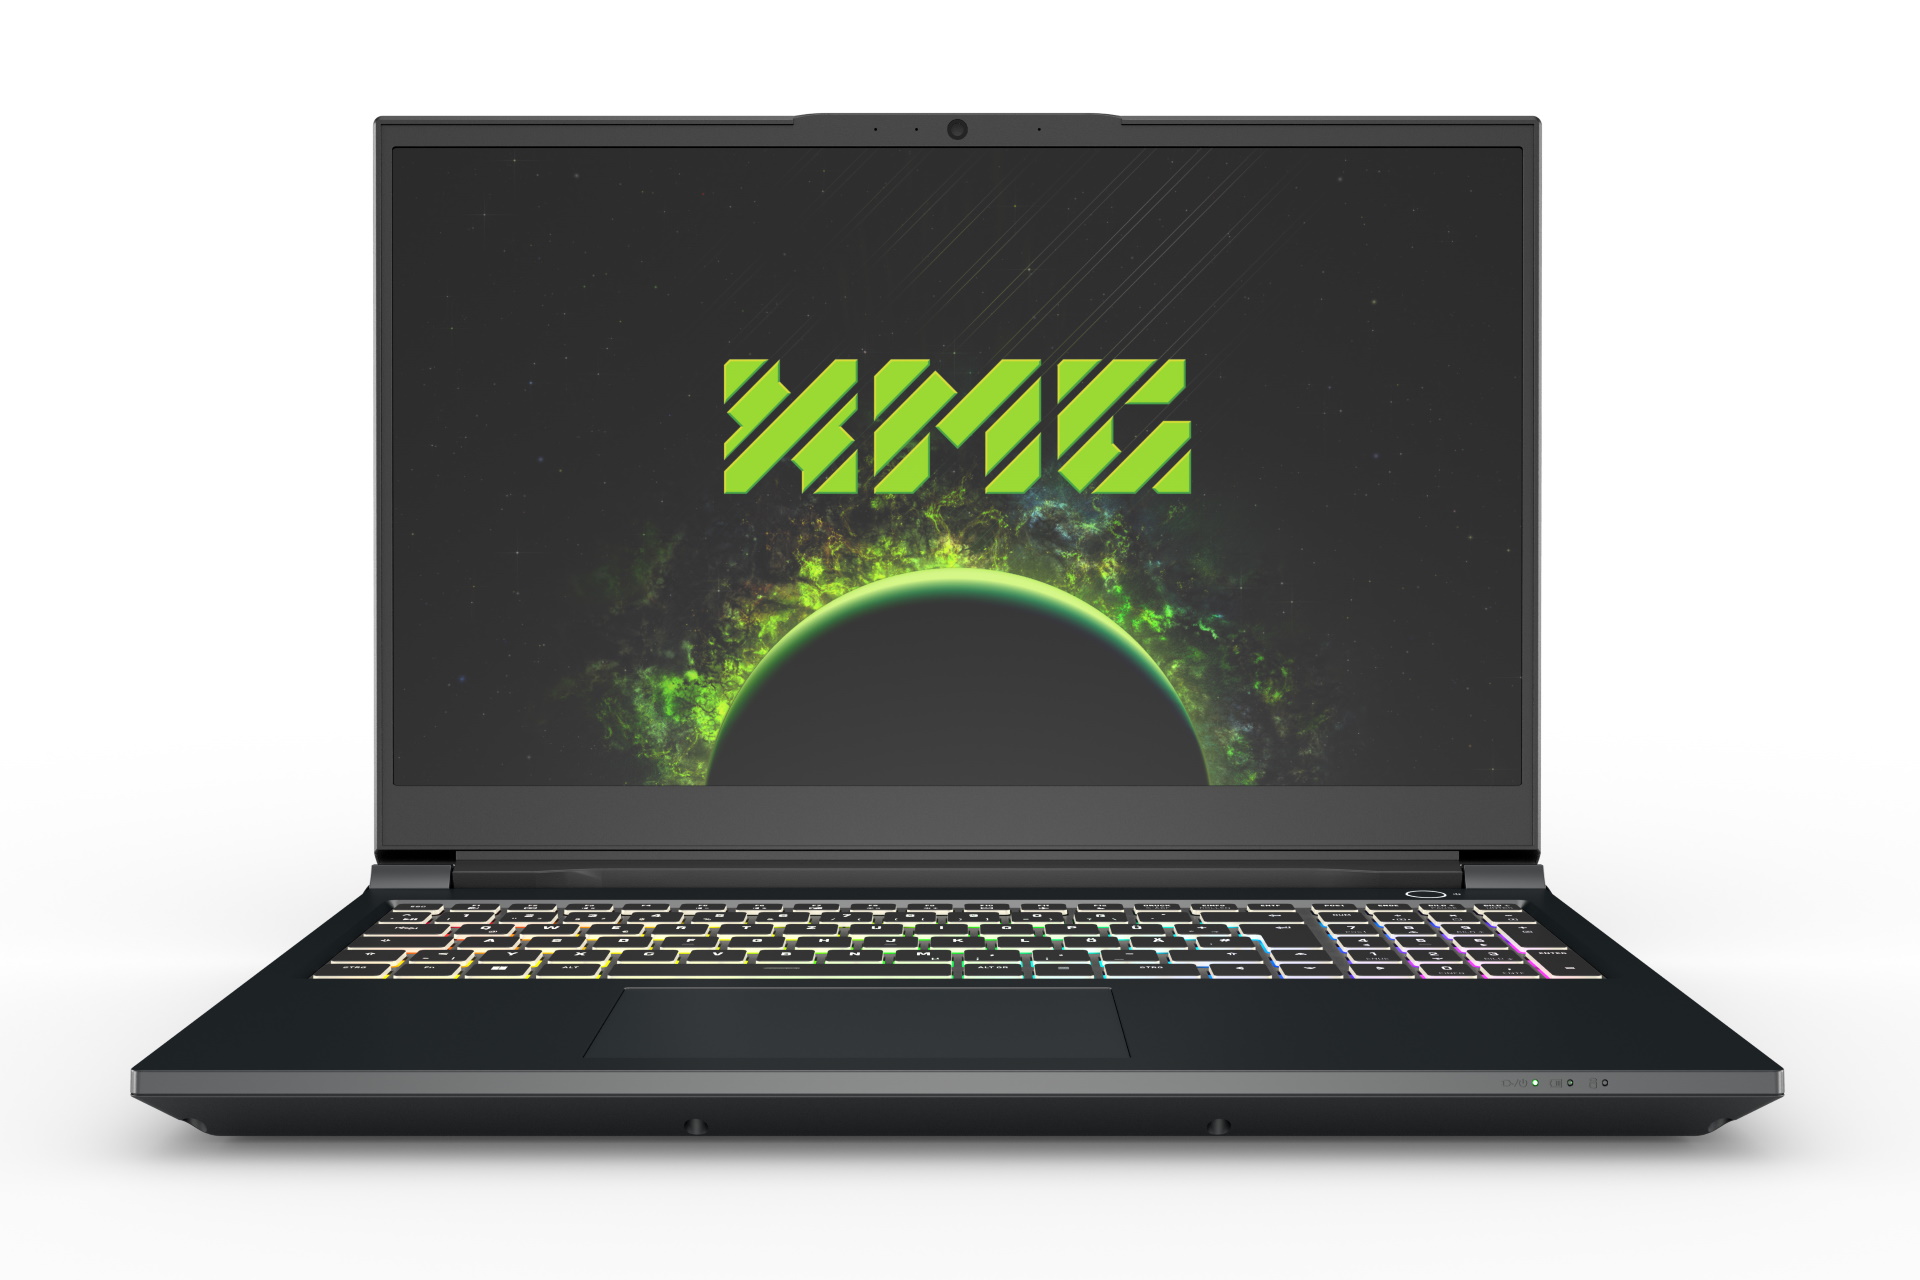
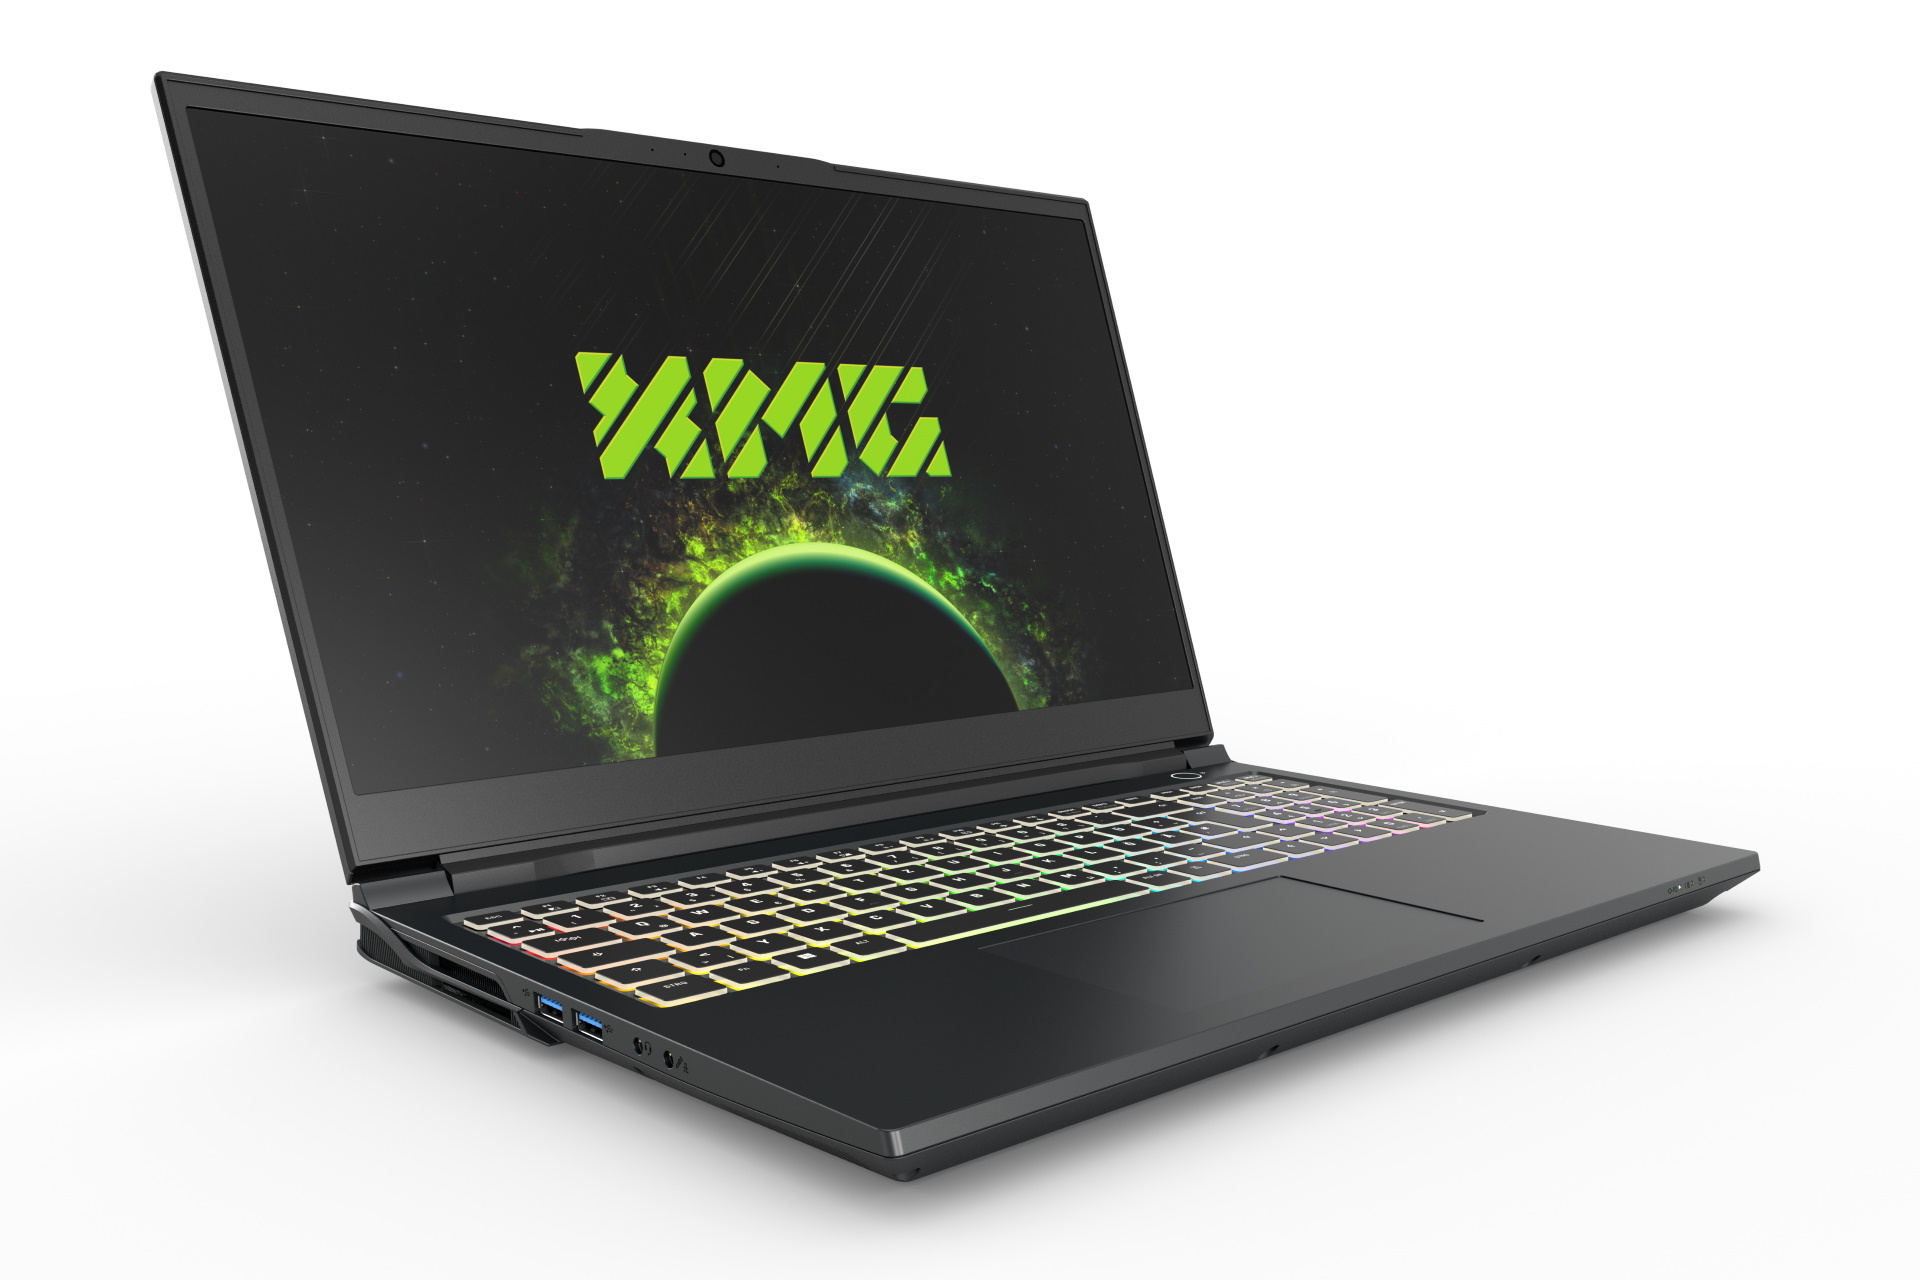
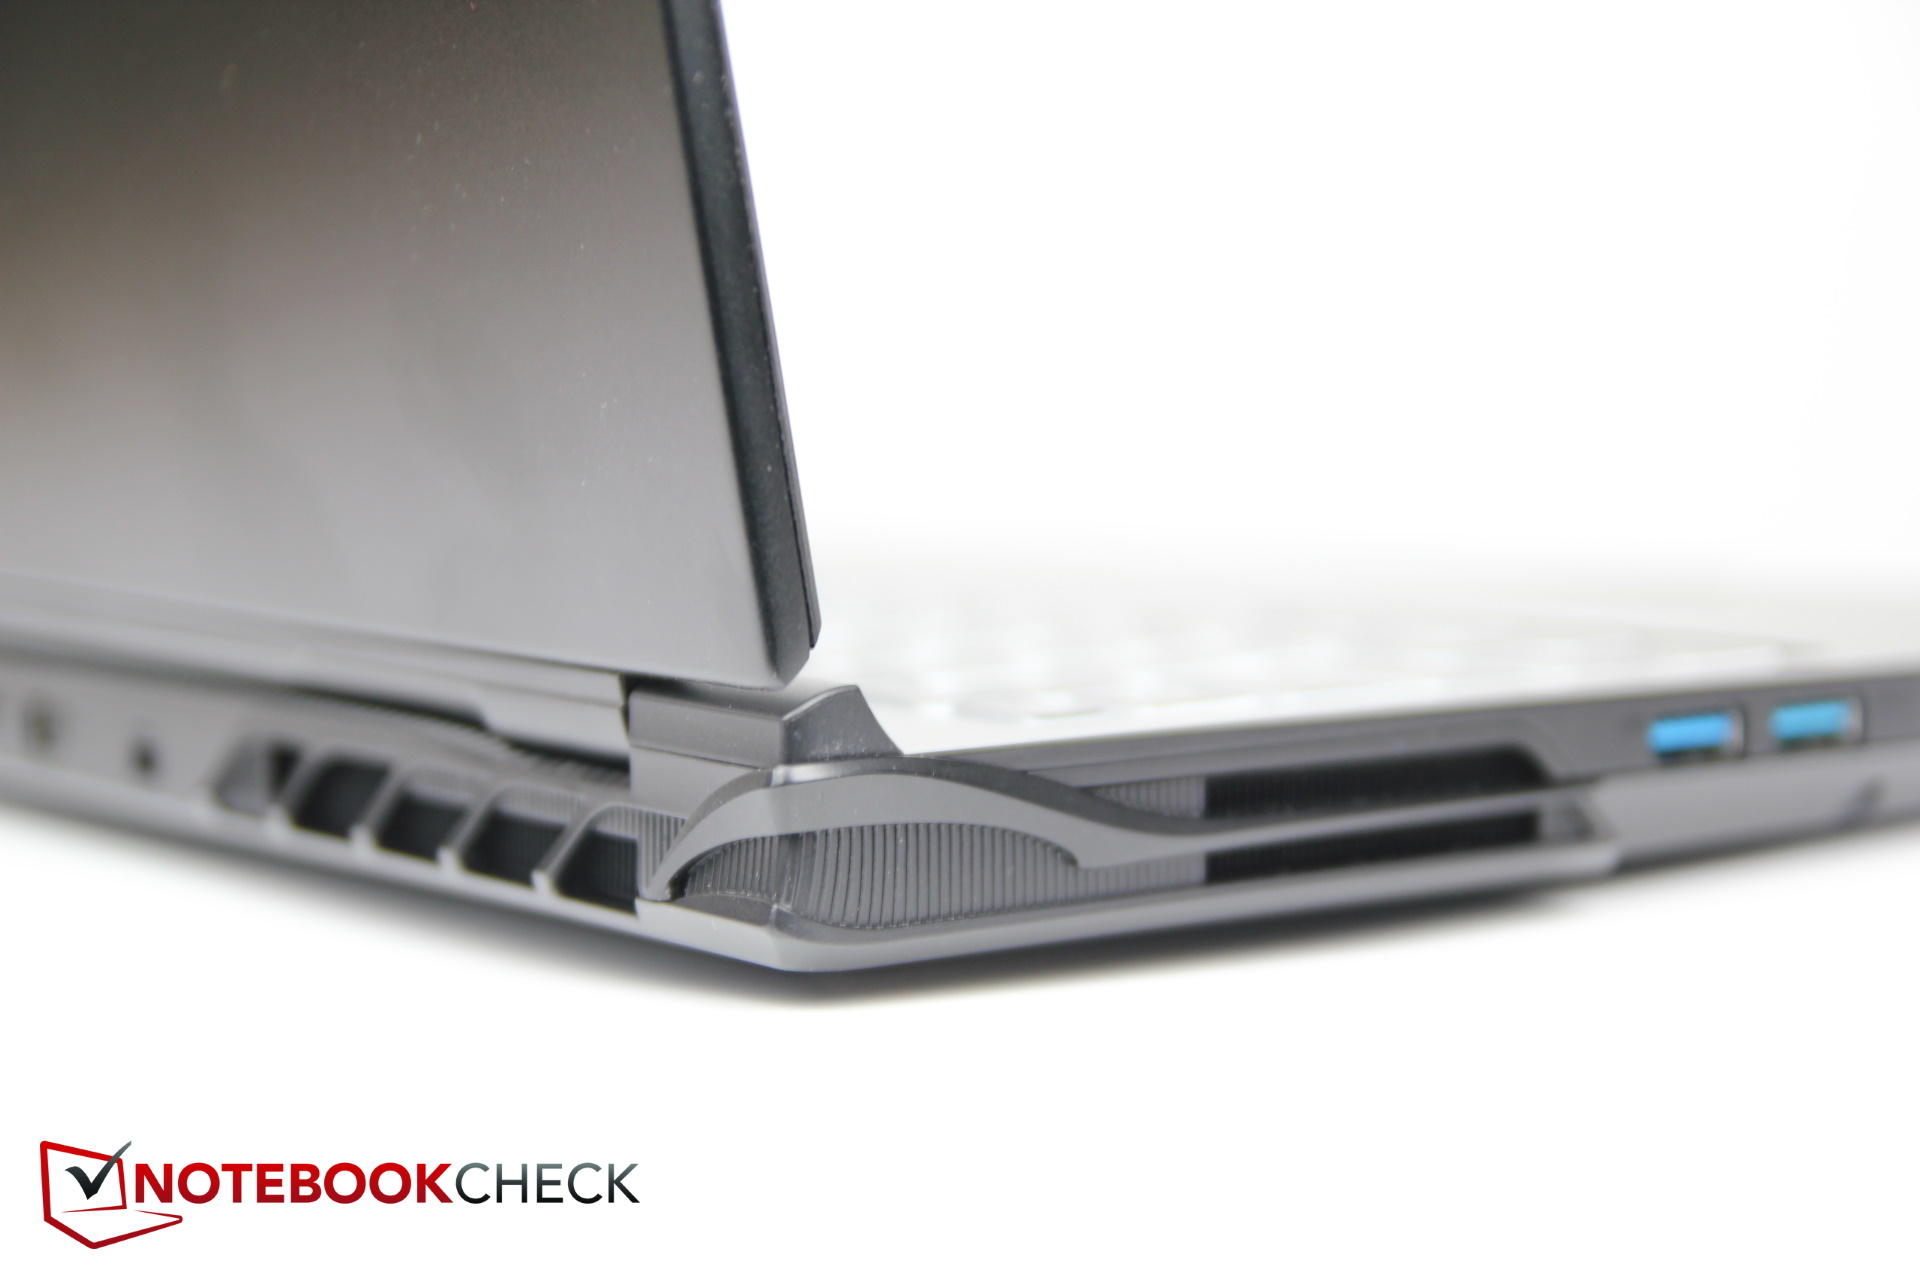
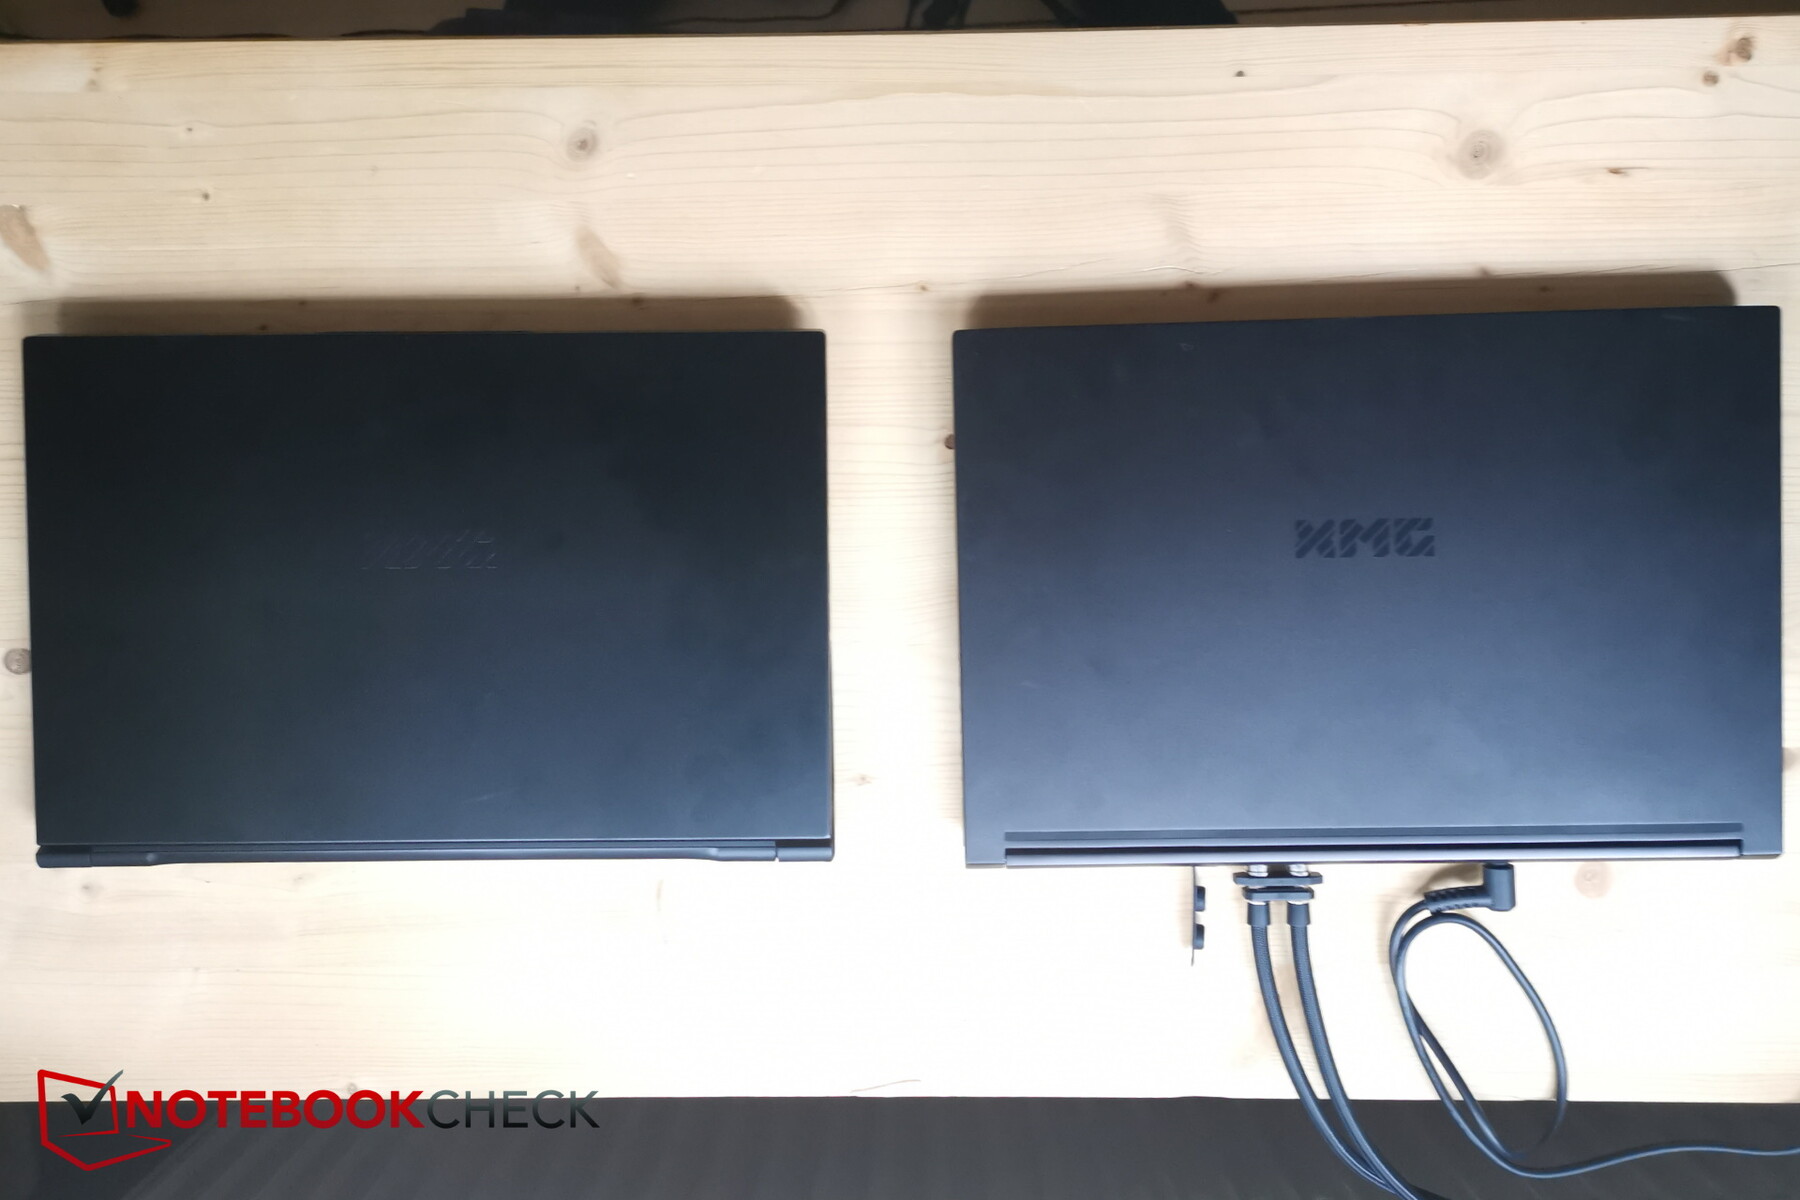
Interestingly, the new Pro 15 is slightly thicker (~25 mm) and heavier than its direct predecessor (19.8 mm). Width and depth, on the other hand, have remained almost the same, but the weight has increased by around 300 g.
This brings it closer to the XMG Neo 15 (26.6 mm), thus no longer ranking among the very thin devices that attempt to reach the dimensions of a Razer Blade 15 (~17 mm).
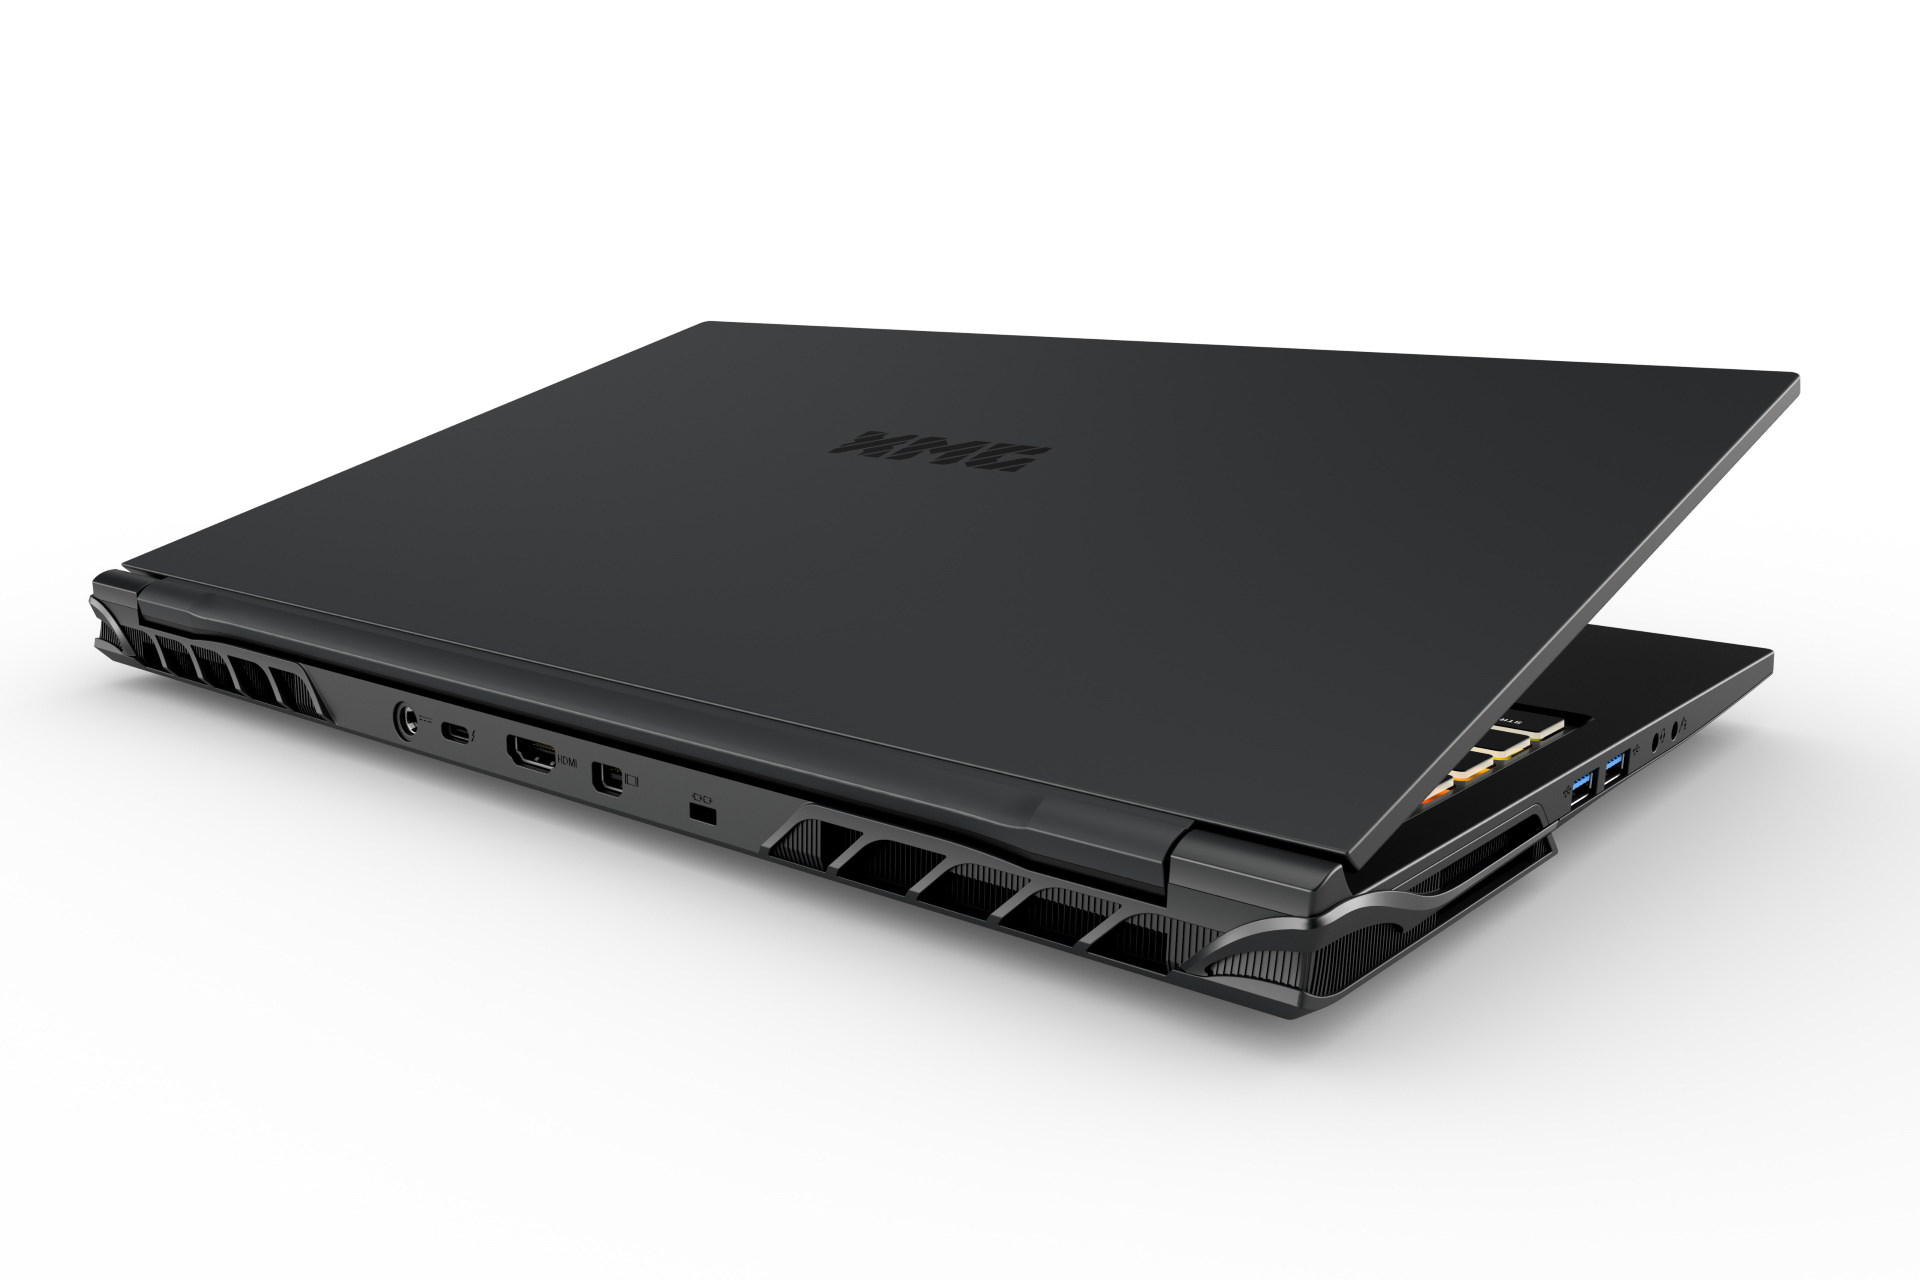
Equipment: VR ready and MicroSD
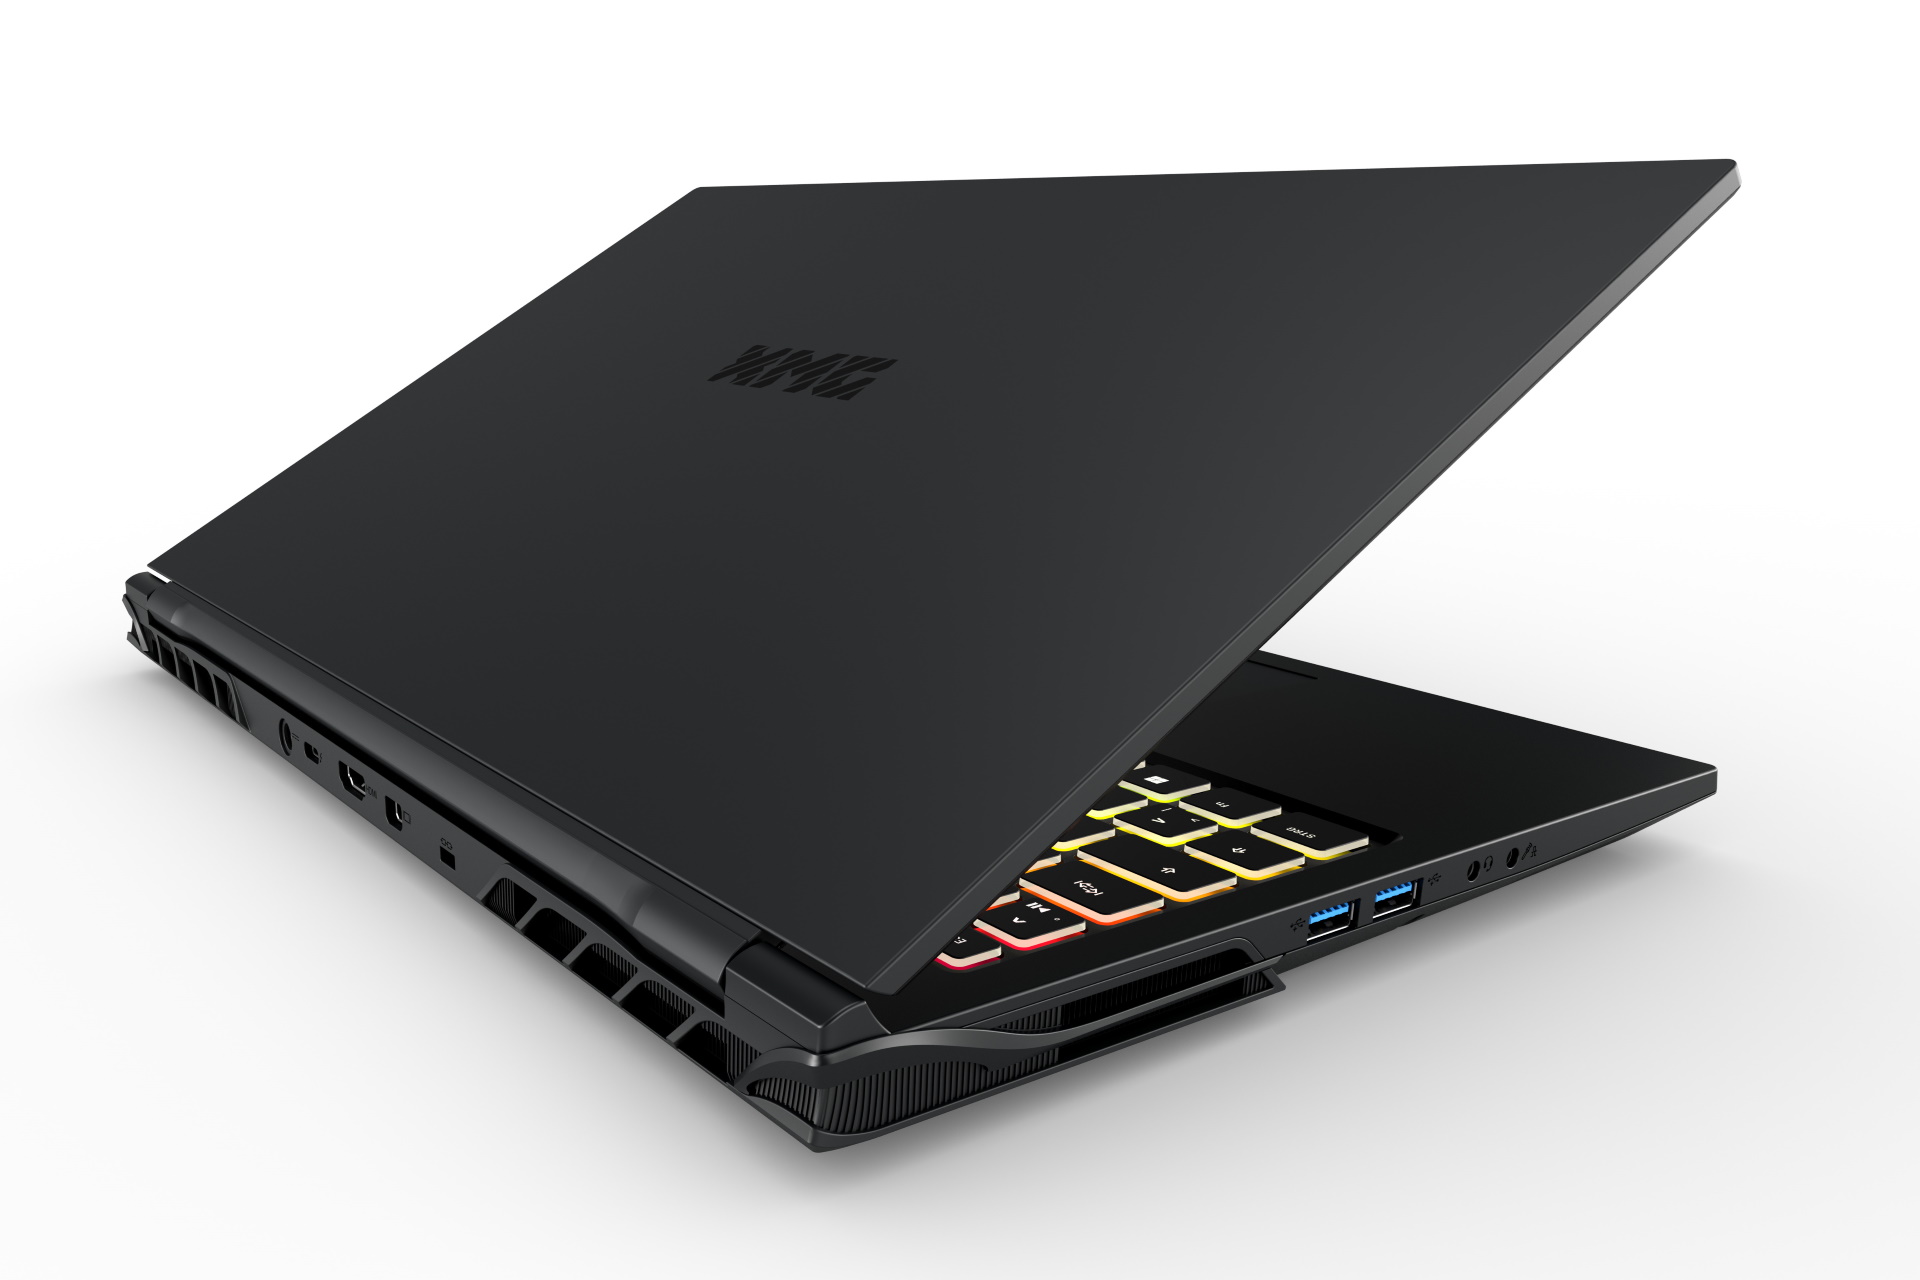
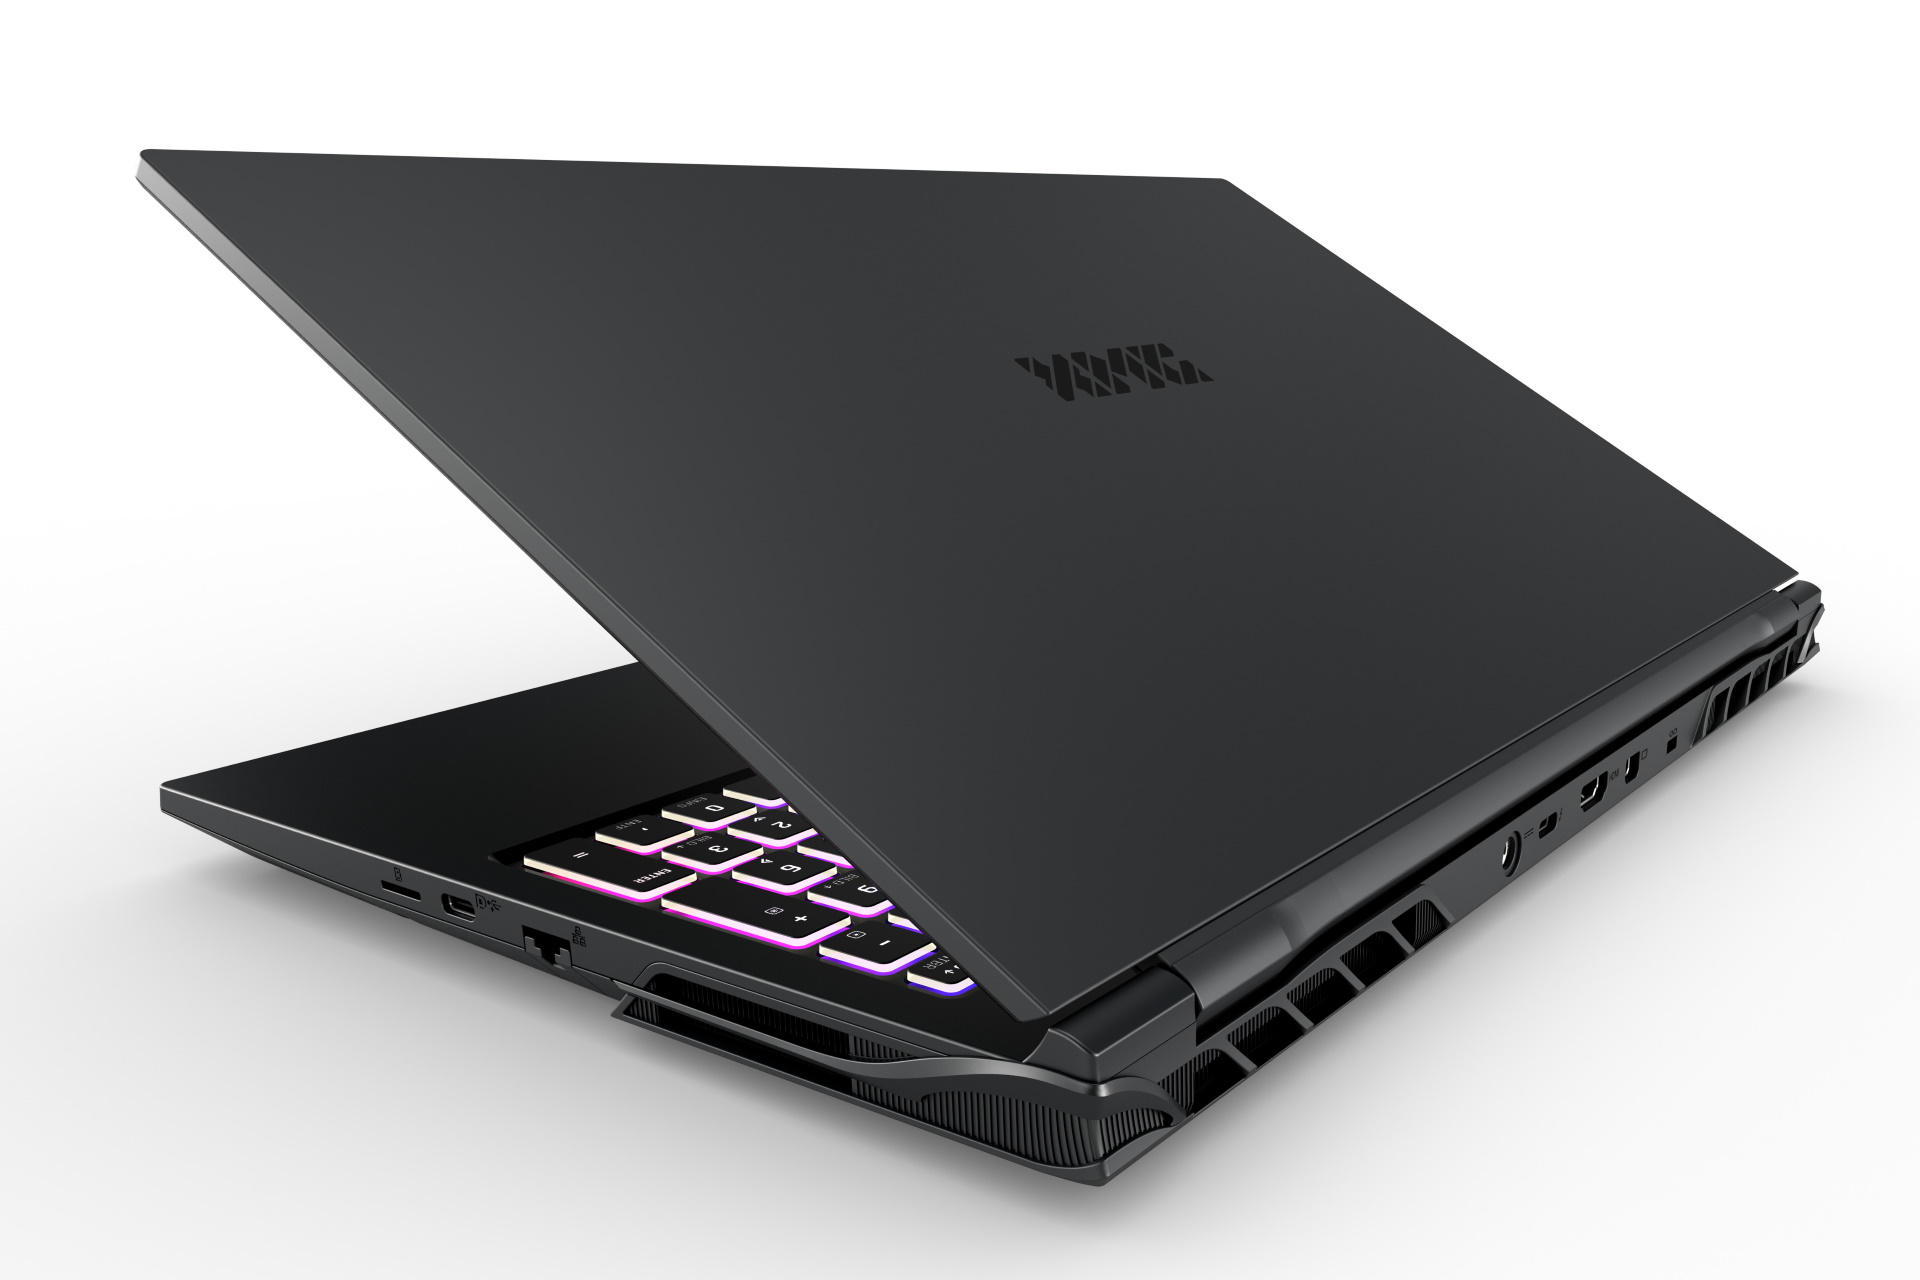
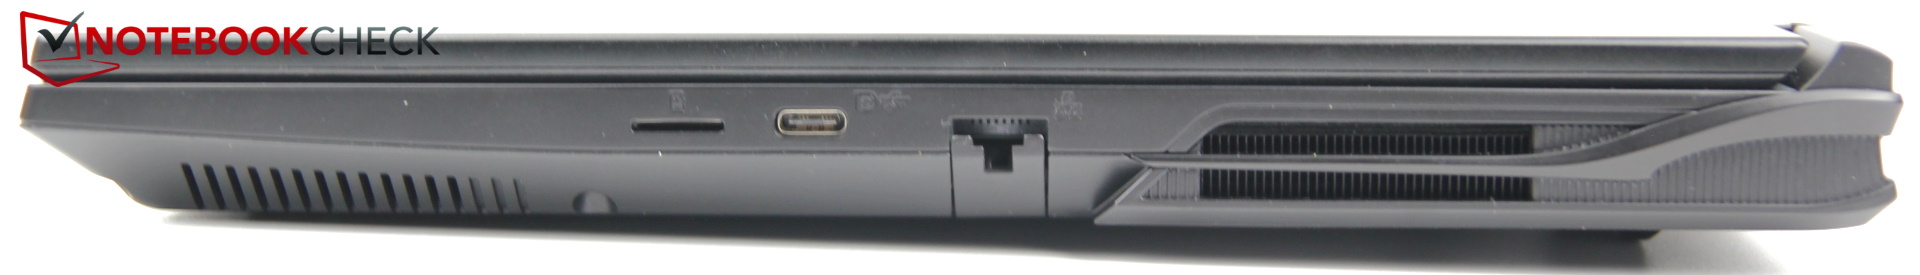
Schenker has reintroduced a card reader, but only in MicroSD format; the predecessor did not have an SD reader. This also changes the distribution of the USB ports: The two USB-A ports are now on the left, while a USB-C port is located on the right in addition to the microSD reader.

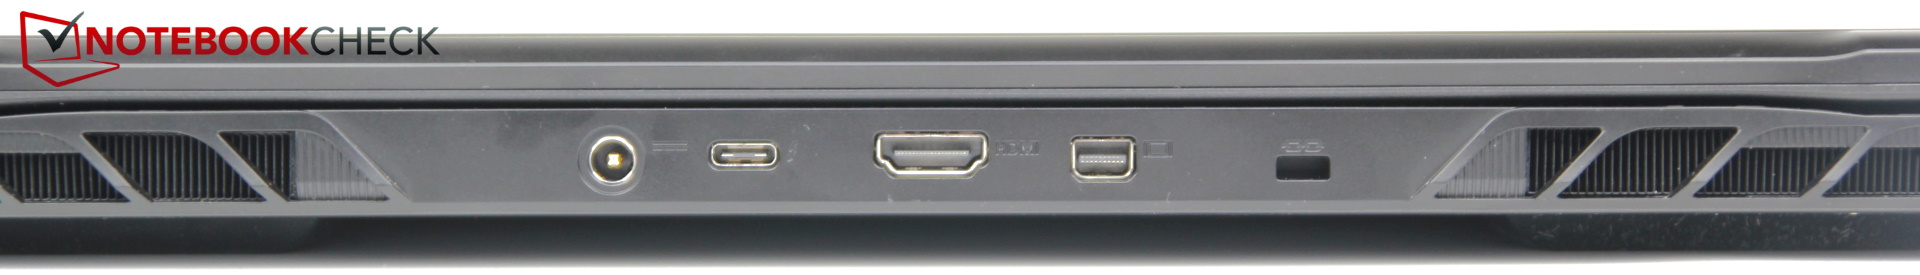
Together with a MiniDP on the back, this makes the Pro 15 VR capable.
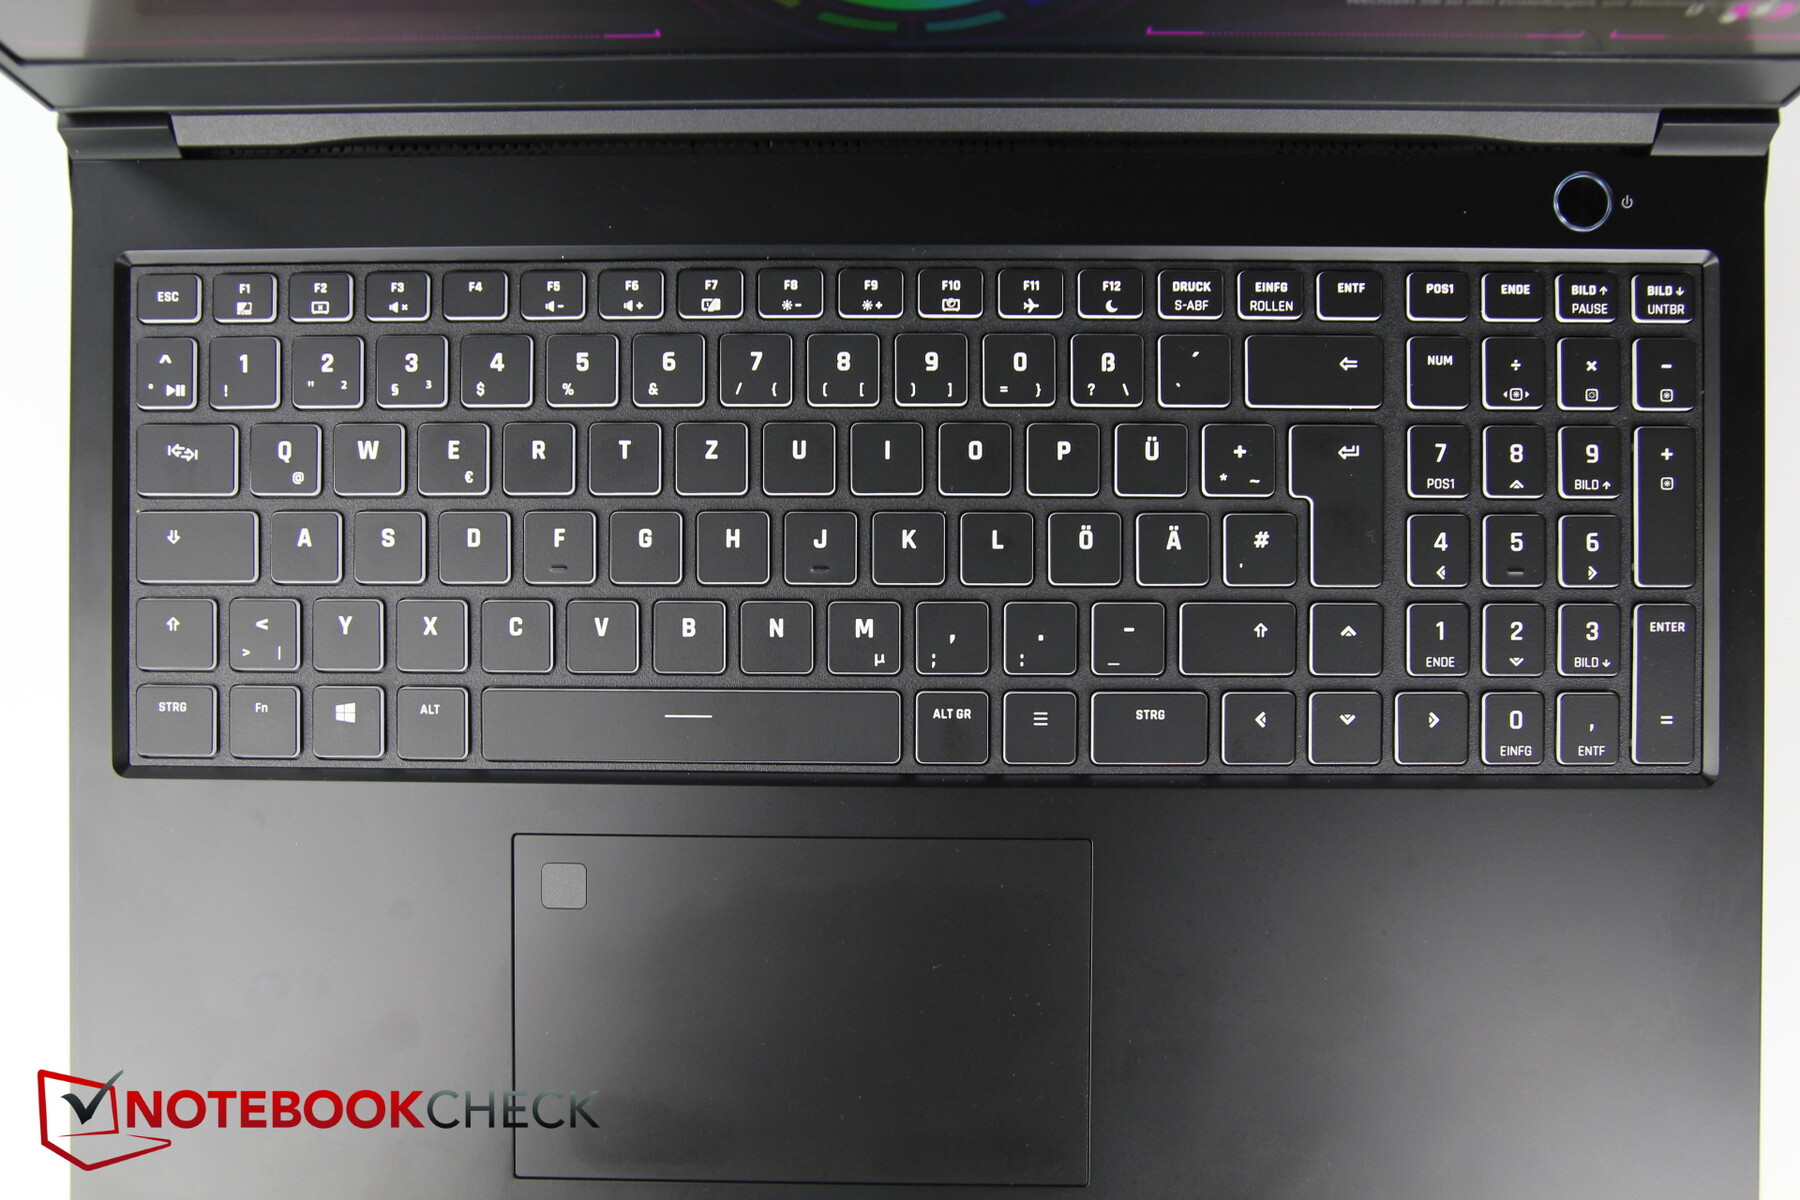
A fingerprint sensor has been integrated into the upper left corner of the touchpad.
The distribution of the ports is acceptable, but a thick network cable may get in the way of the right mouse hand.
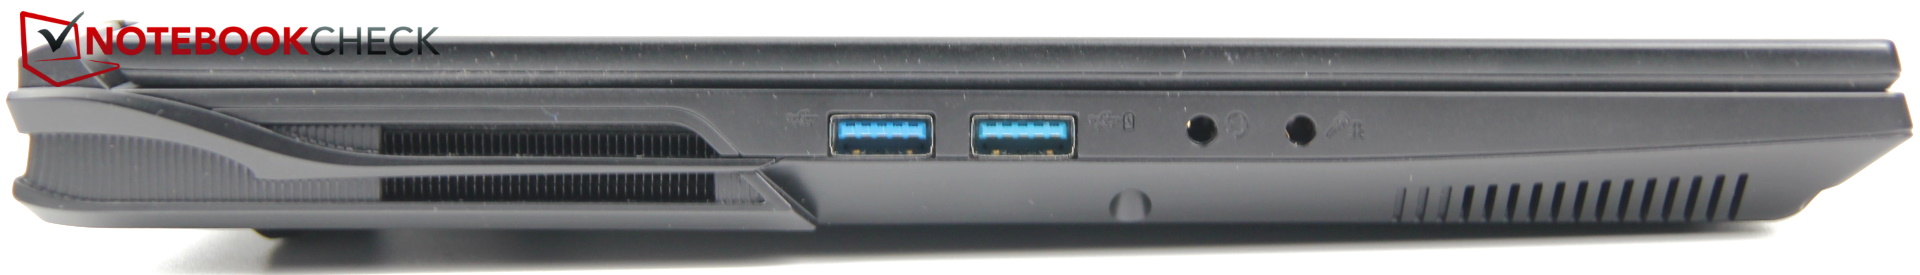
SD Card Reader
The MicroSD reader has a snap-in mechanism so that the card hardly sticks out. However, speeds with our AV PRO microSD 128 GB V60 test card are below average. The reader of the Razer Blade is twice as fast.
| SD Card Reader | |
| average JPG Copy Test (av. of 3 runs) | |
| Razer Blade 15 2022 (Toshiba Exceria Pro SDXC 64 GB UHS-II) | |
| SCHENKER XMG Neo 15 (i7-12700H, RTX 3080 Ti) | |
| Average of class Gaming (19 - 202, n=100, last 2 years) | |
| MSI Raider GE66 12UHS (AV PRO microSD 128 GB V60) | |
| SCHENKER XMG Pro 15 (i7-12700H, RTX 3080 Ti) | |
| maximum AS SSD Seq Read Test (1GB) | |
| Razer Blade 15 2022 (Toshiba Exceria Pro SDXC 64 GB UHS-II) | |
| Average of class Gaming (26 - 269, n=93, last 2 years) | |
| SCHENKER XMG Pro 15 (i7-12700H, RTX 3080 Ti) | |
| SCHENKER XMG Neo 15 (i7-12700H, RTX 3080 Ti) | |
Communication
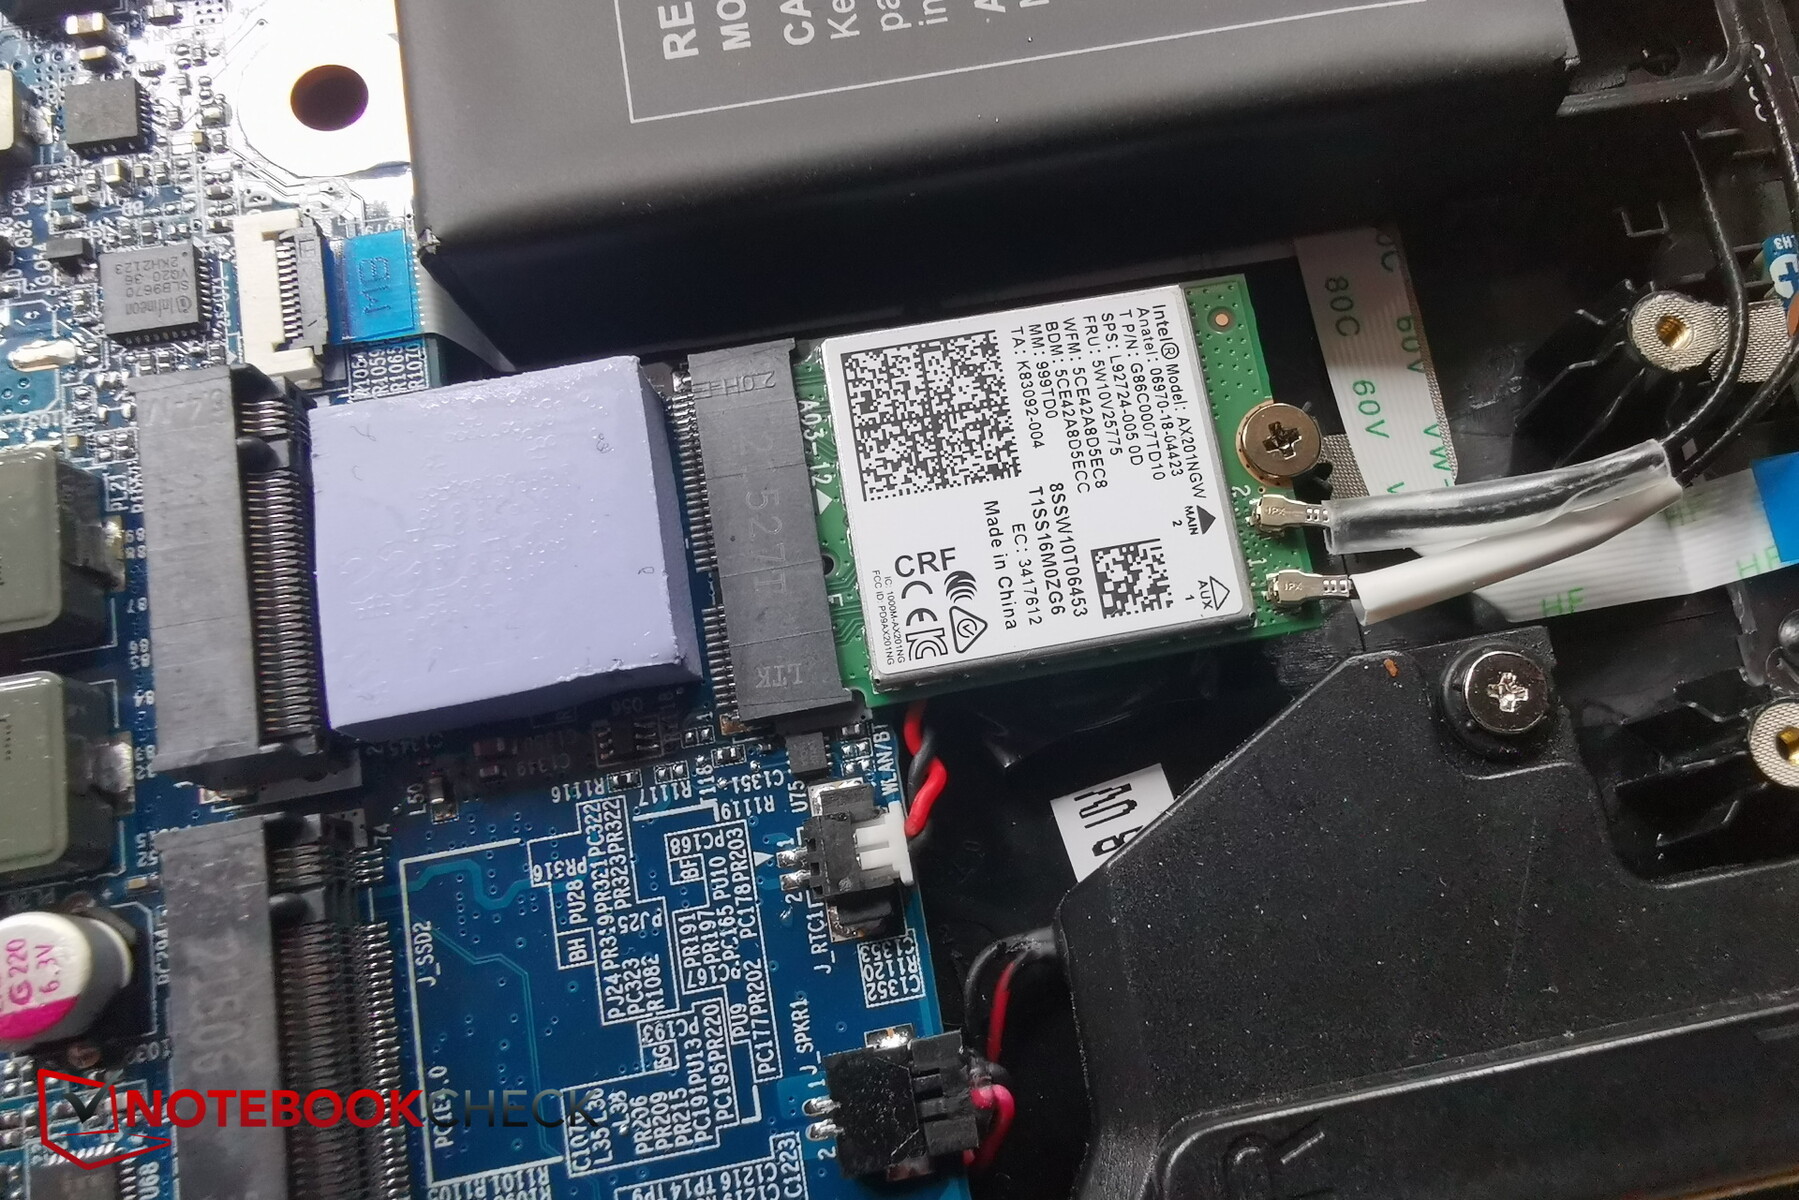
The manufacturer has opted for the popular Intel AX201 WiFi module, which does not yet support Wi-Fi 6e, but connects to 5 GHz networks.
The transfer rates of the Pro 15 are consistently in the high range.
Webcam
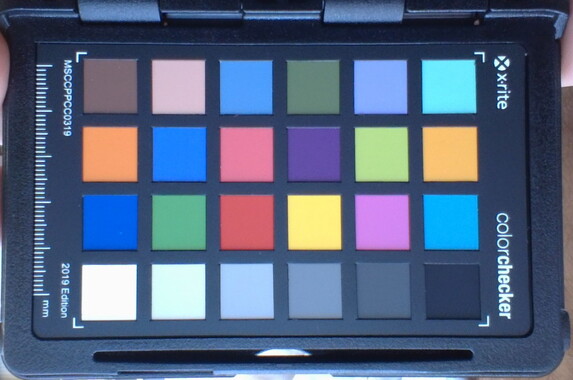
The webcam also gets an upgrade, namely from 720p to 1080p, which is Full HD. We measured acceptable color deviations, but the picture looks a bit grainy (outdoors, shadows) and pale despite Full HD.
 GeForce RTX 3080 Ti Laptop GPU, i7-12700H, Samsung SSD 980 Pro 1TB MZ-V8P1T0BW")
 GeForce RTX 3080 Ti Laptop GPU, i7-12700H, Samsung SSD 980 Pro 1TB MZ-V8P1T0BW")
Security
The Pro 15 offers a Kensington port, TPM, and a fingerprint sensor.
The sensor's integration into Windows Hello works reliably, and logging in is very fast.
Accessories and Warranty
The typical Schenker accessories, such as a USB stick with drivers or a mouse pad, are missing from the Pro, which only comes with a CD driver.
Schenker offers a 24-month warranty in Germany.
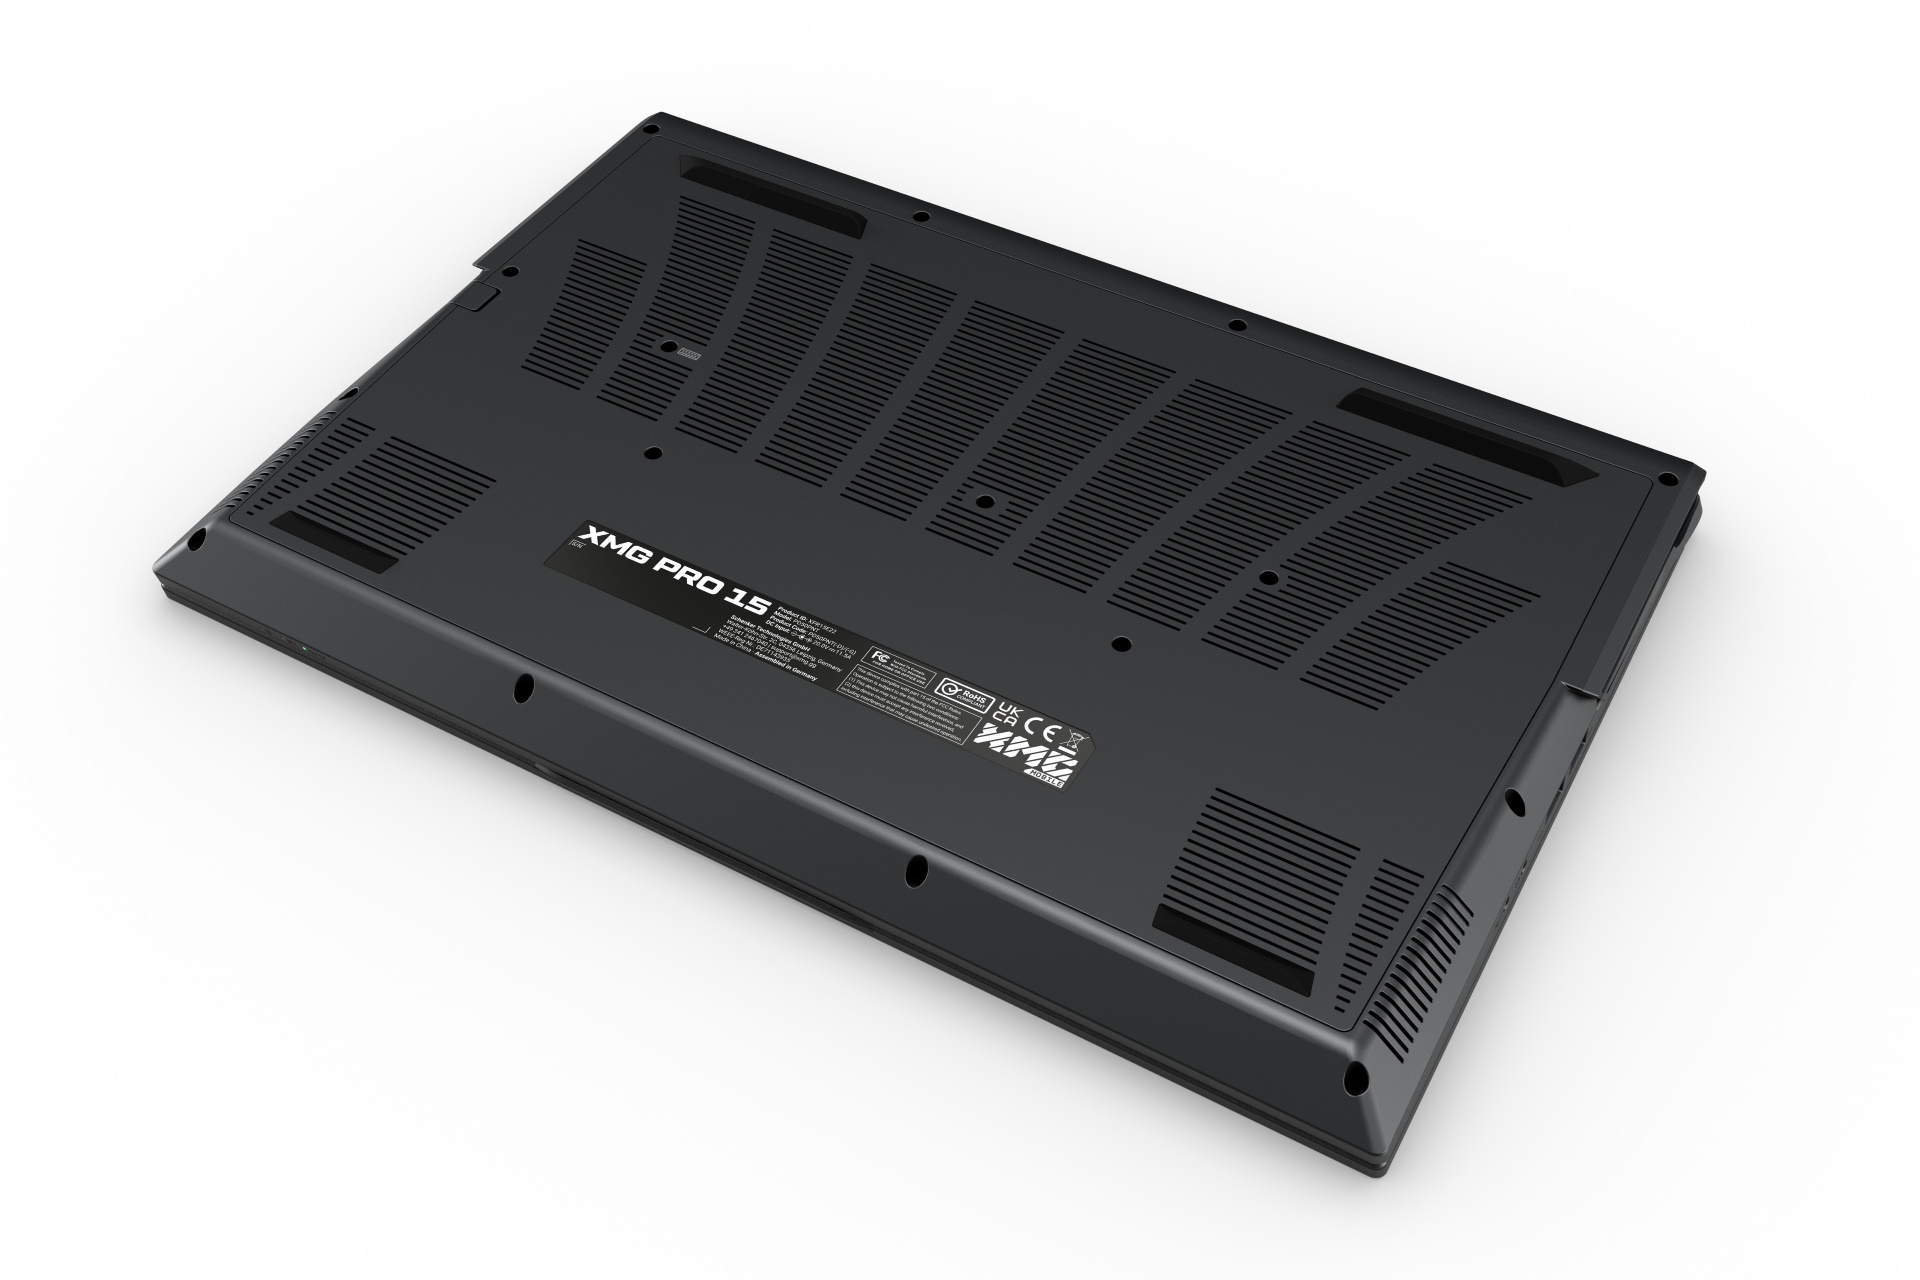
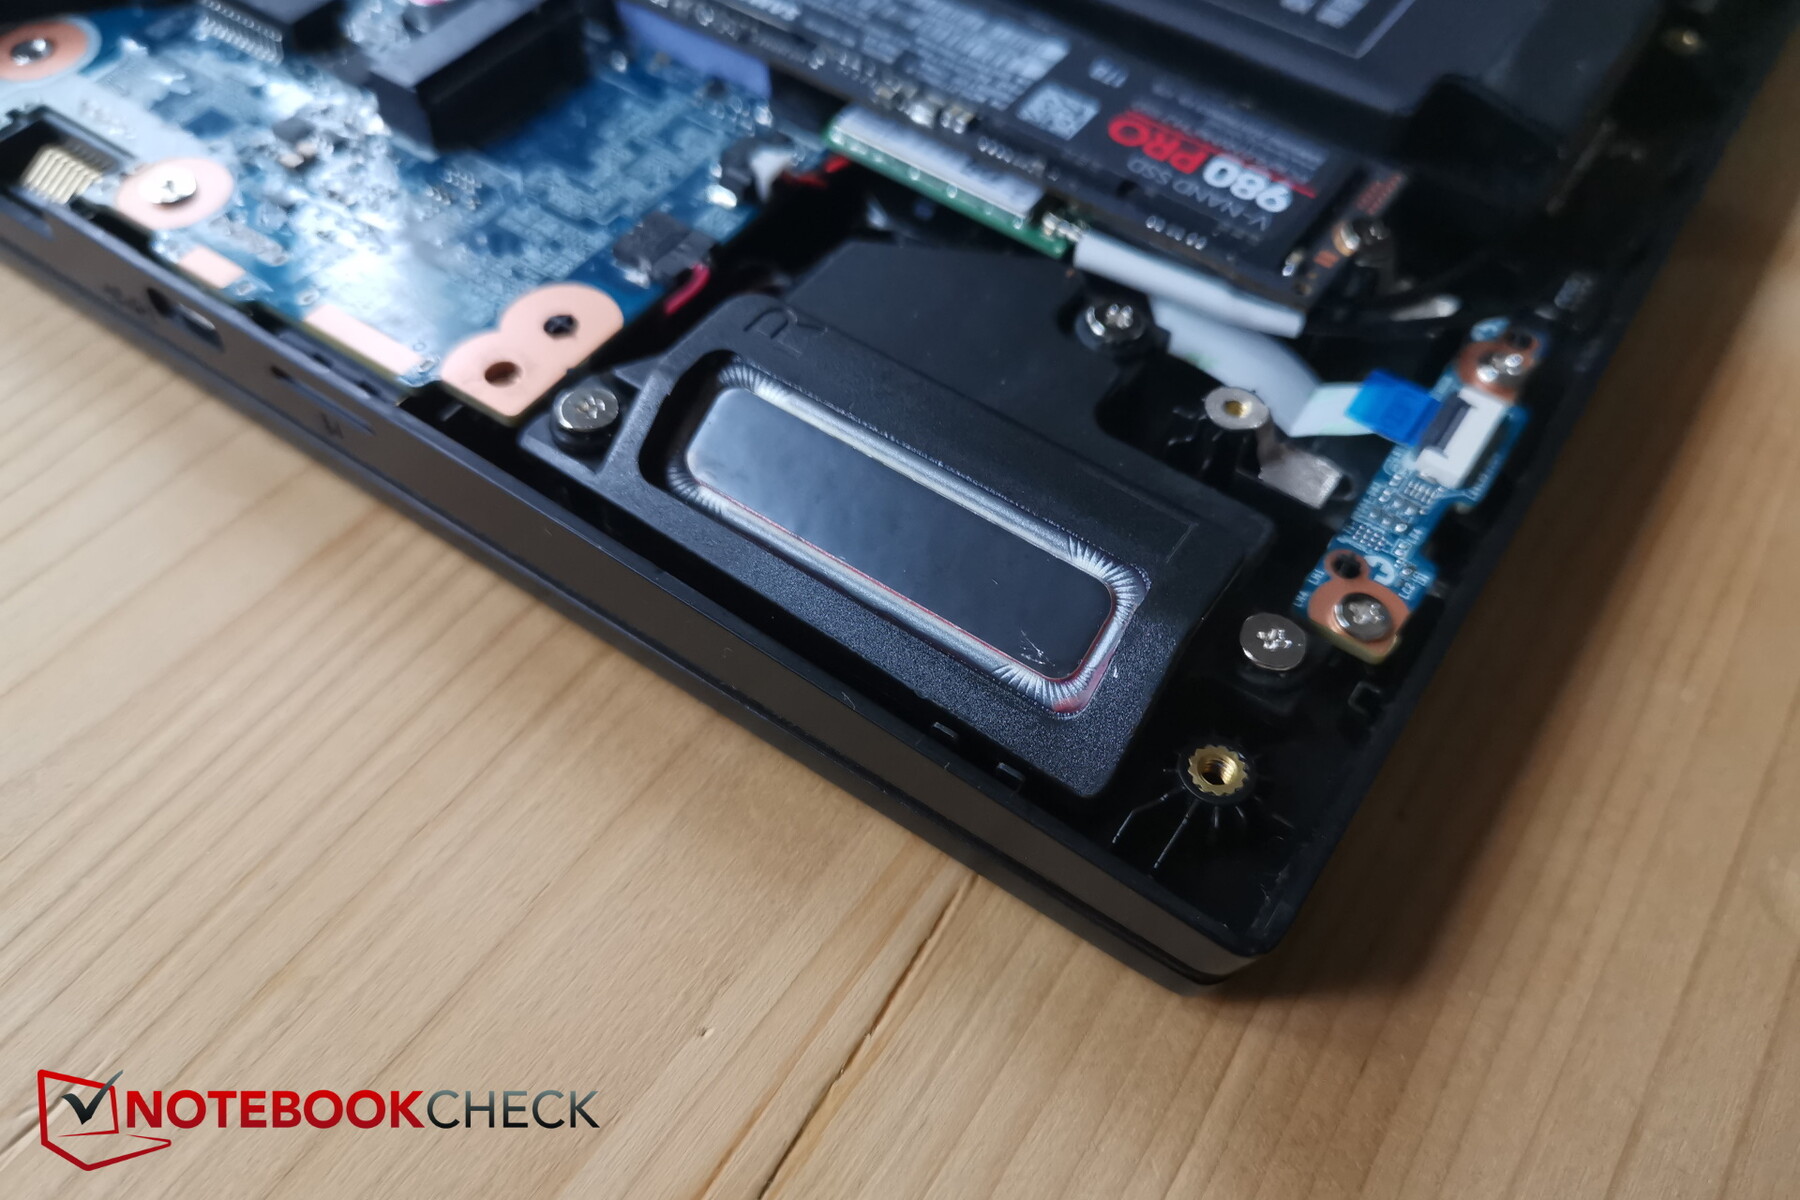
Maintenance
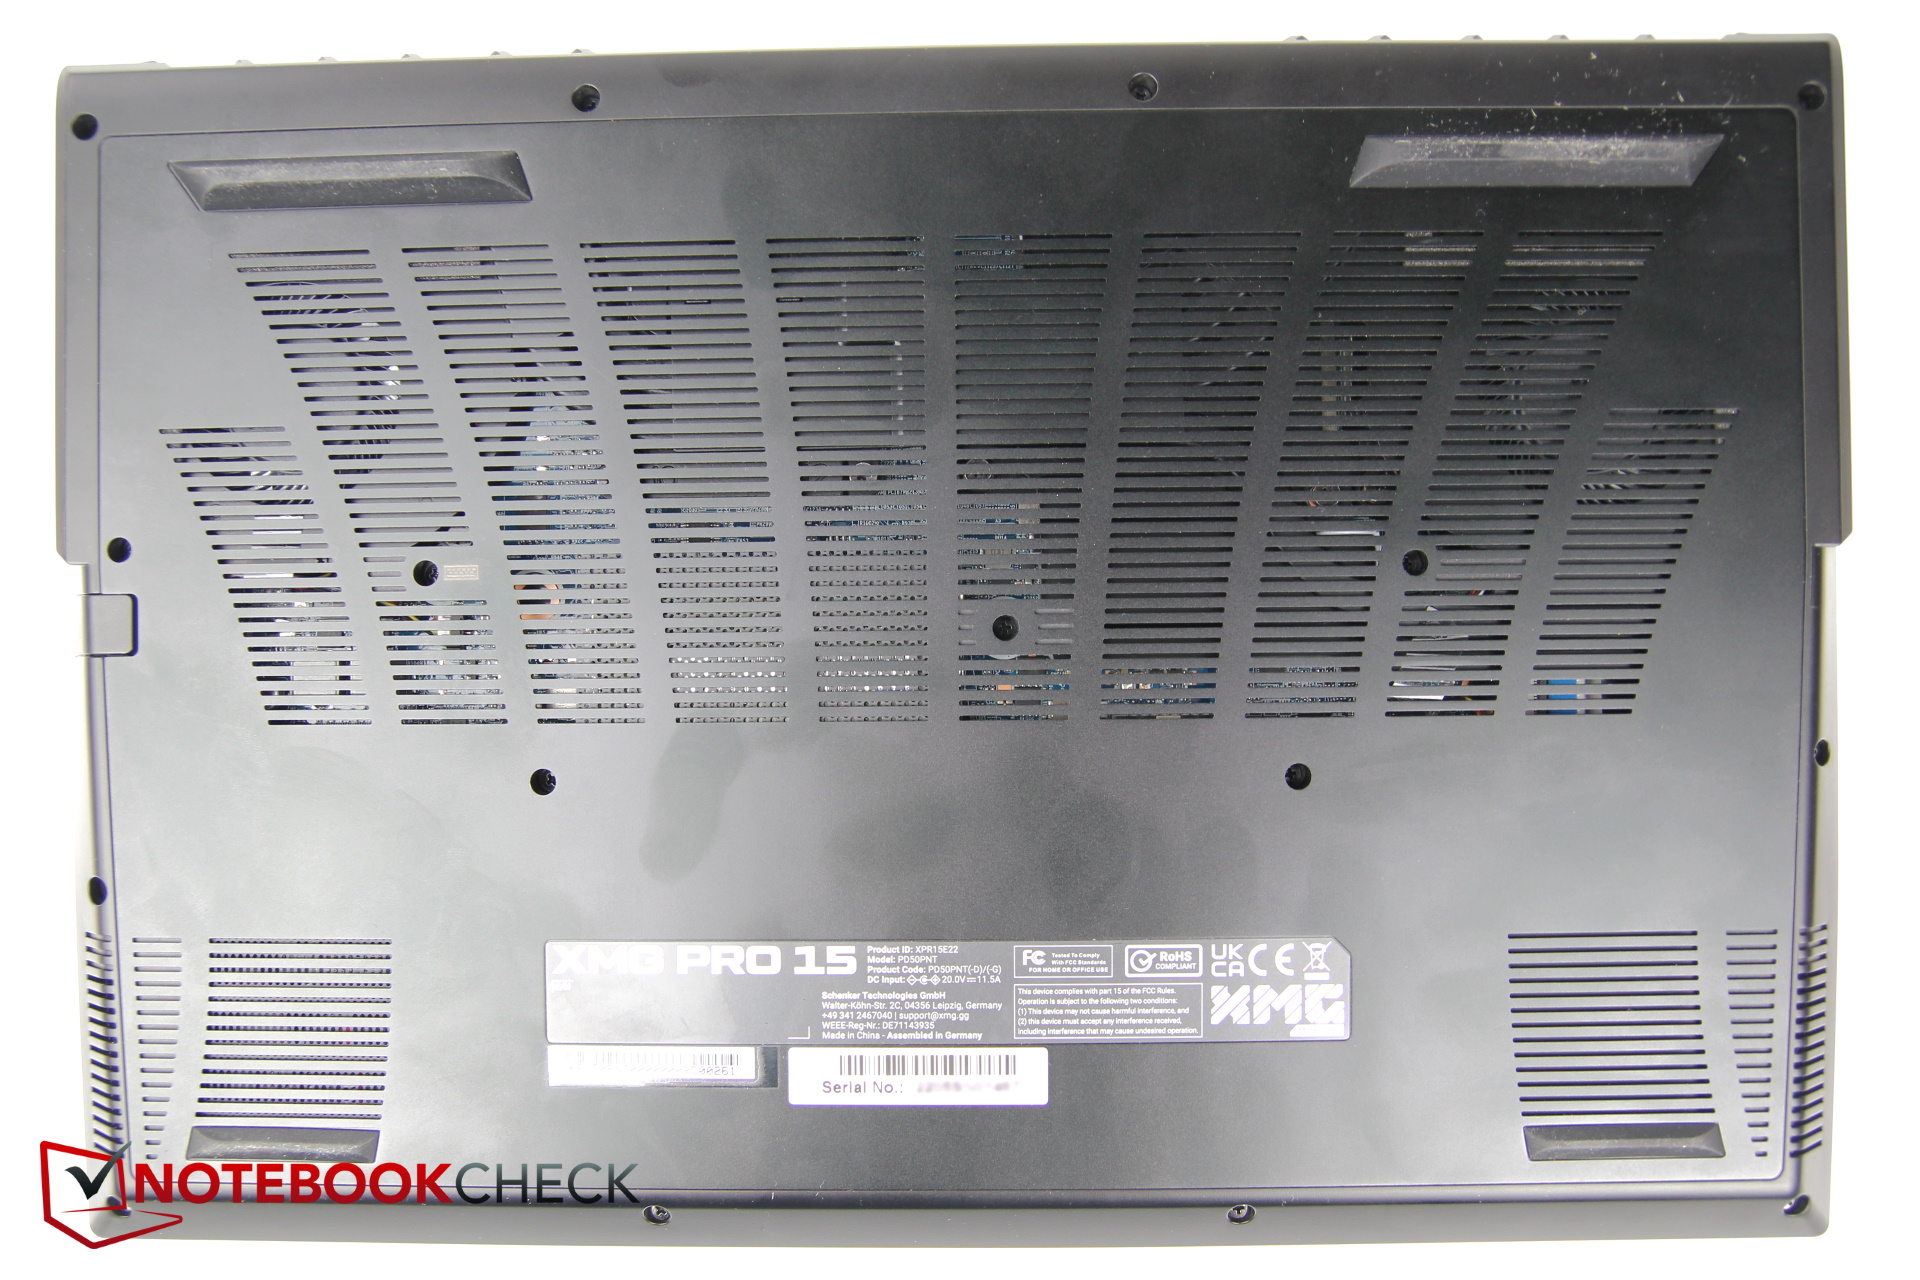
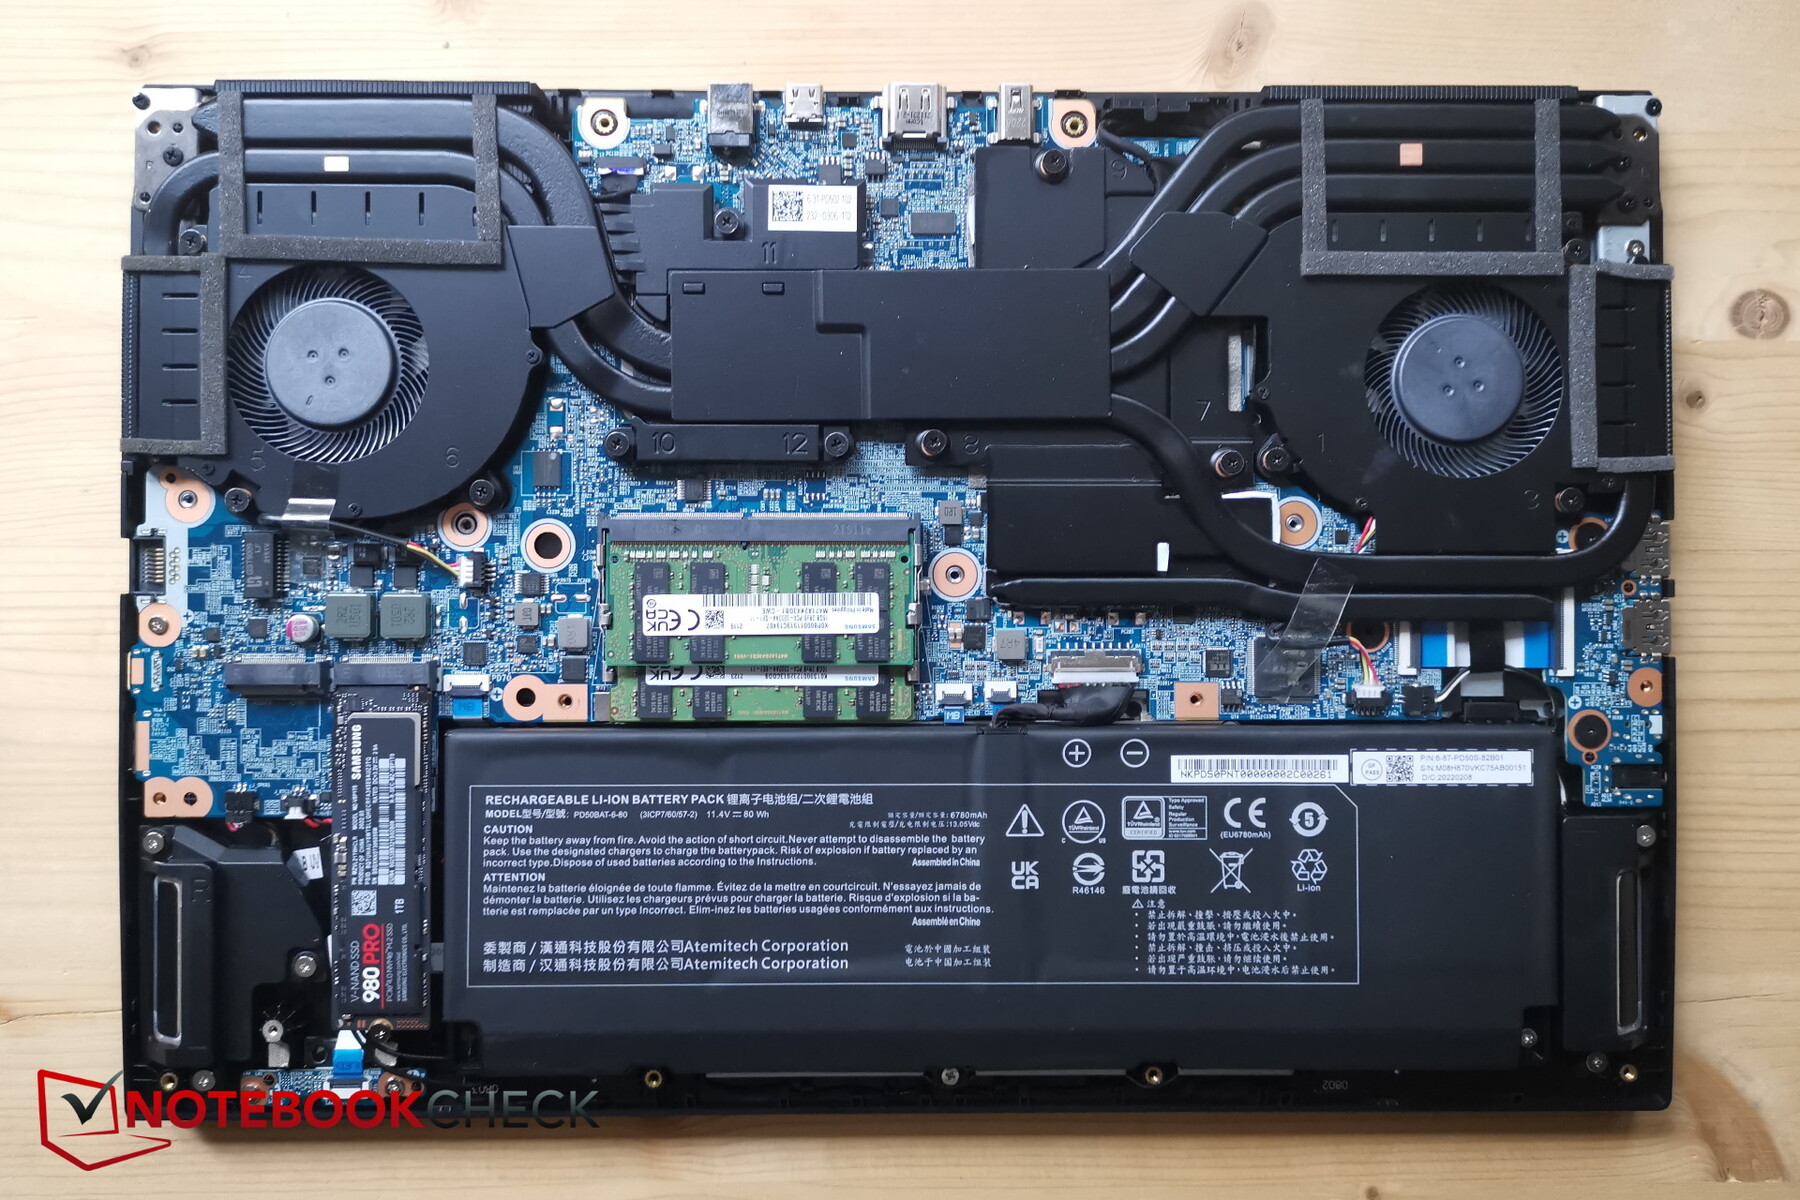
The aluminum underside is secured by 16 Phillips screws. Not even the Neo with its water ports has so many (14). Fortunately, all screws have the same length, so there is no confusion.
The baseplate can then be removed very easily without any additional tools, and you have access to the battery, the fans, the two M.2 slots and the RAM. Only the WiFi module is hidden, namely underneath the SSD, which is perhaps not so optimal in terms of cooling.
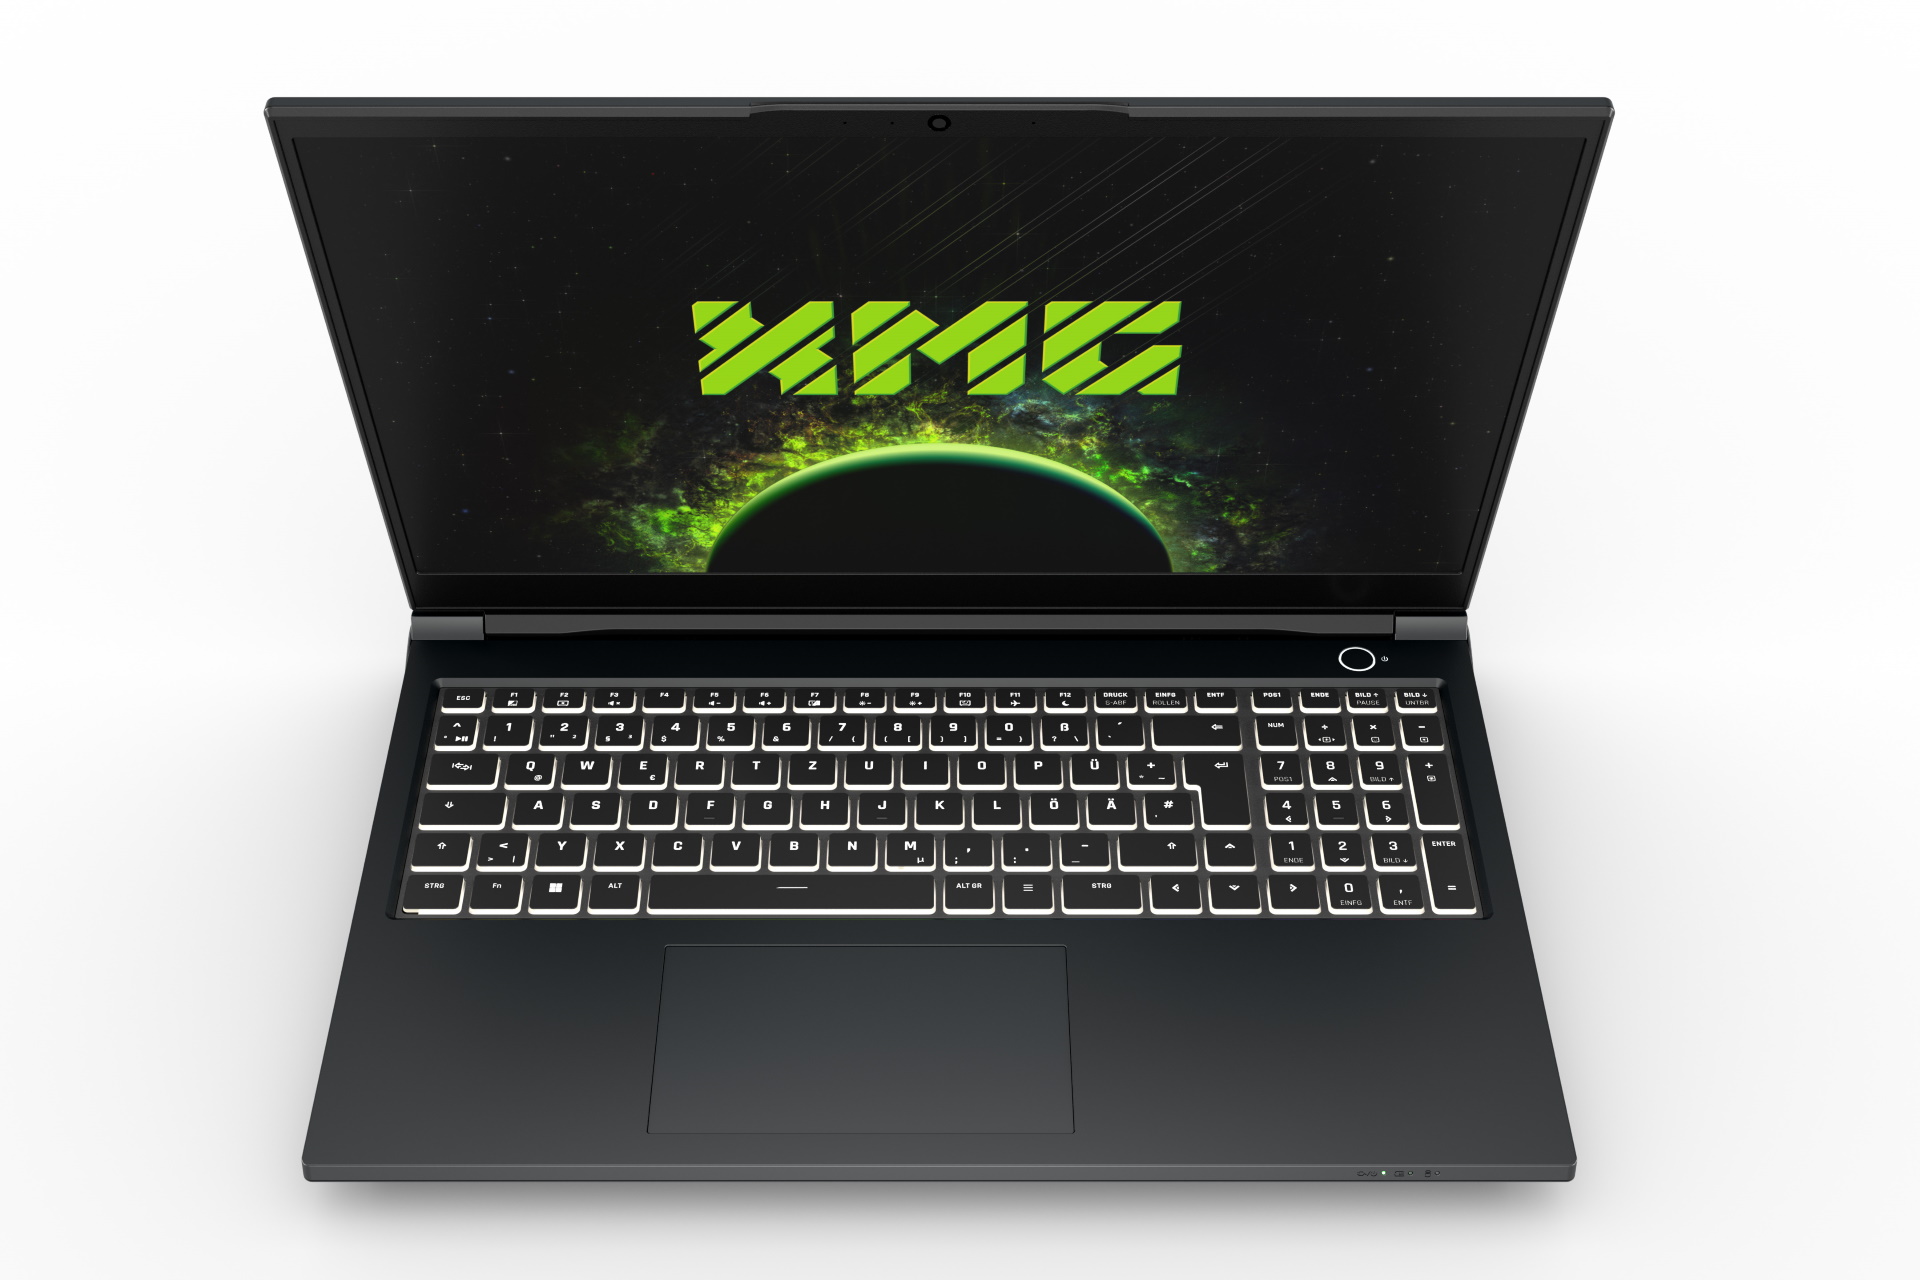
Input Devices: Per-key RGB
Keyboard
Instead of the optomechanical keyboard like in the Neo 15, Schenker uses a "normal" chiclet keyboard with RGB backlighting for each key in the Pro 15.
The layout is very tidy. While the keys have a small design, they are well spaced and there is still room for a numpad on the right.
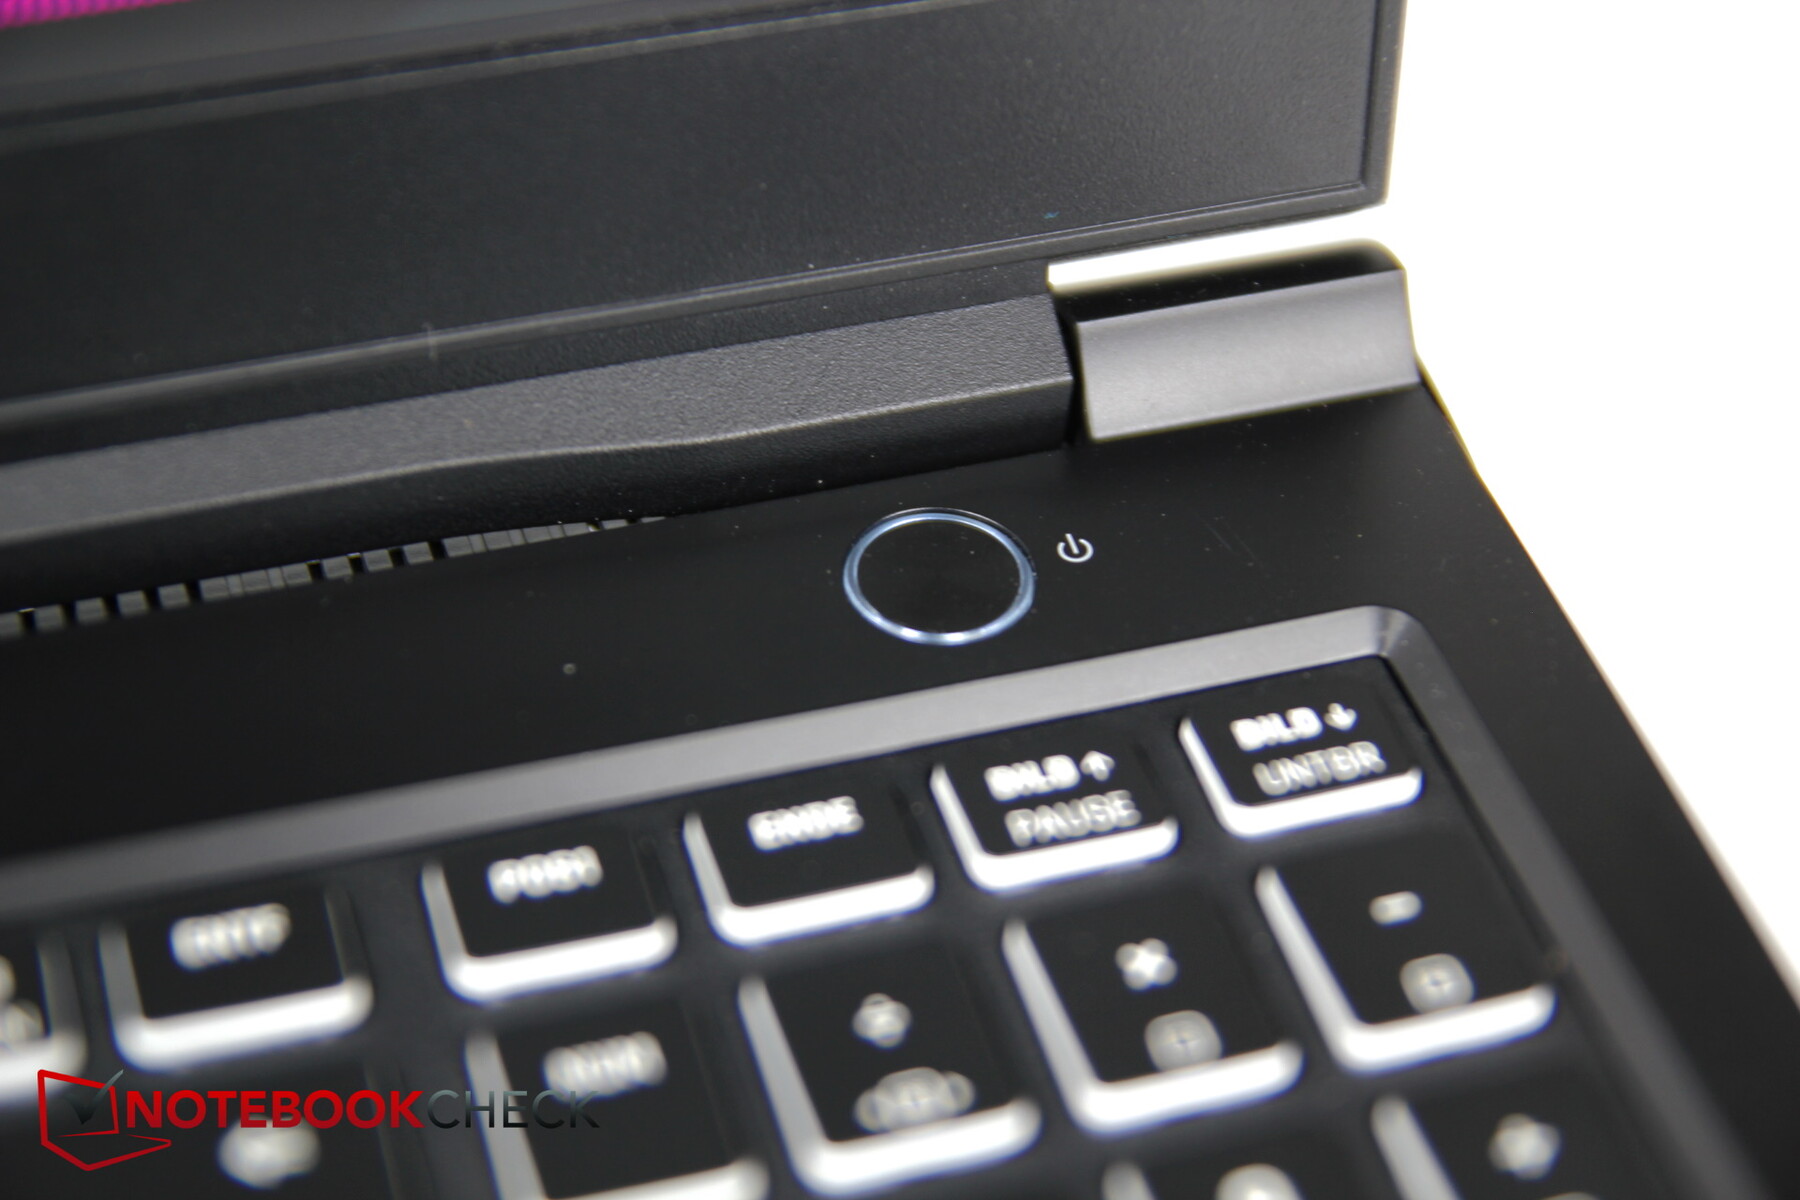
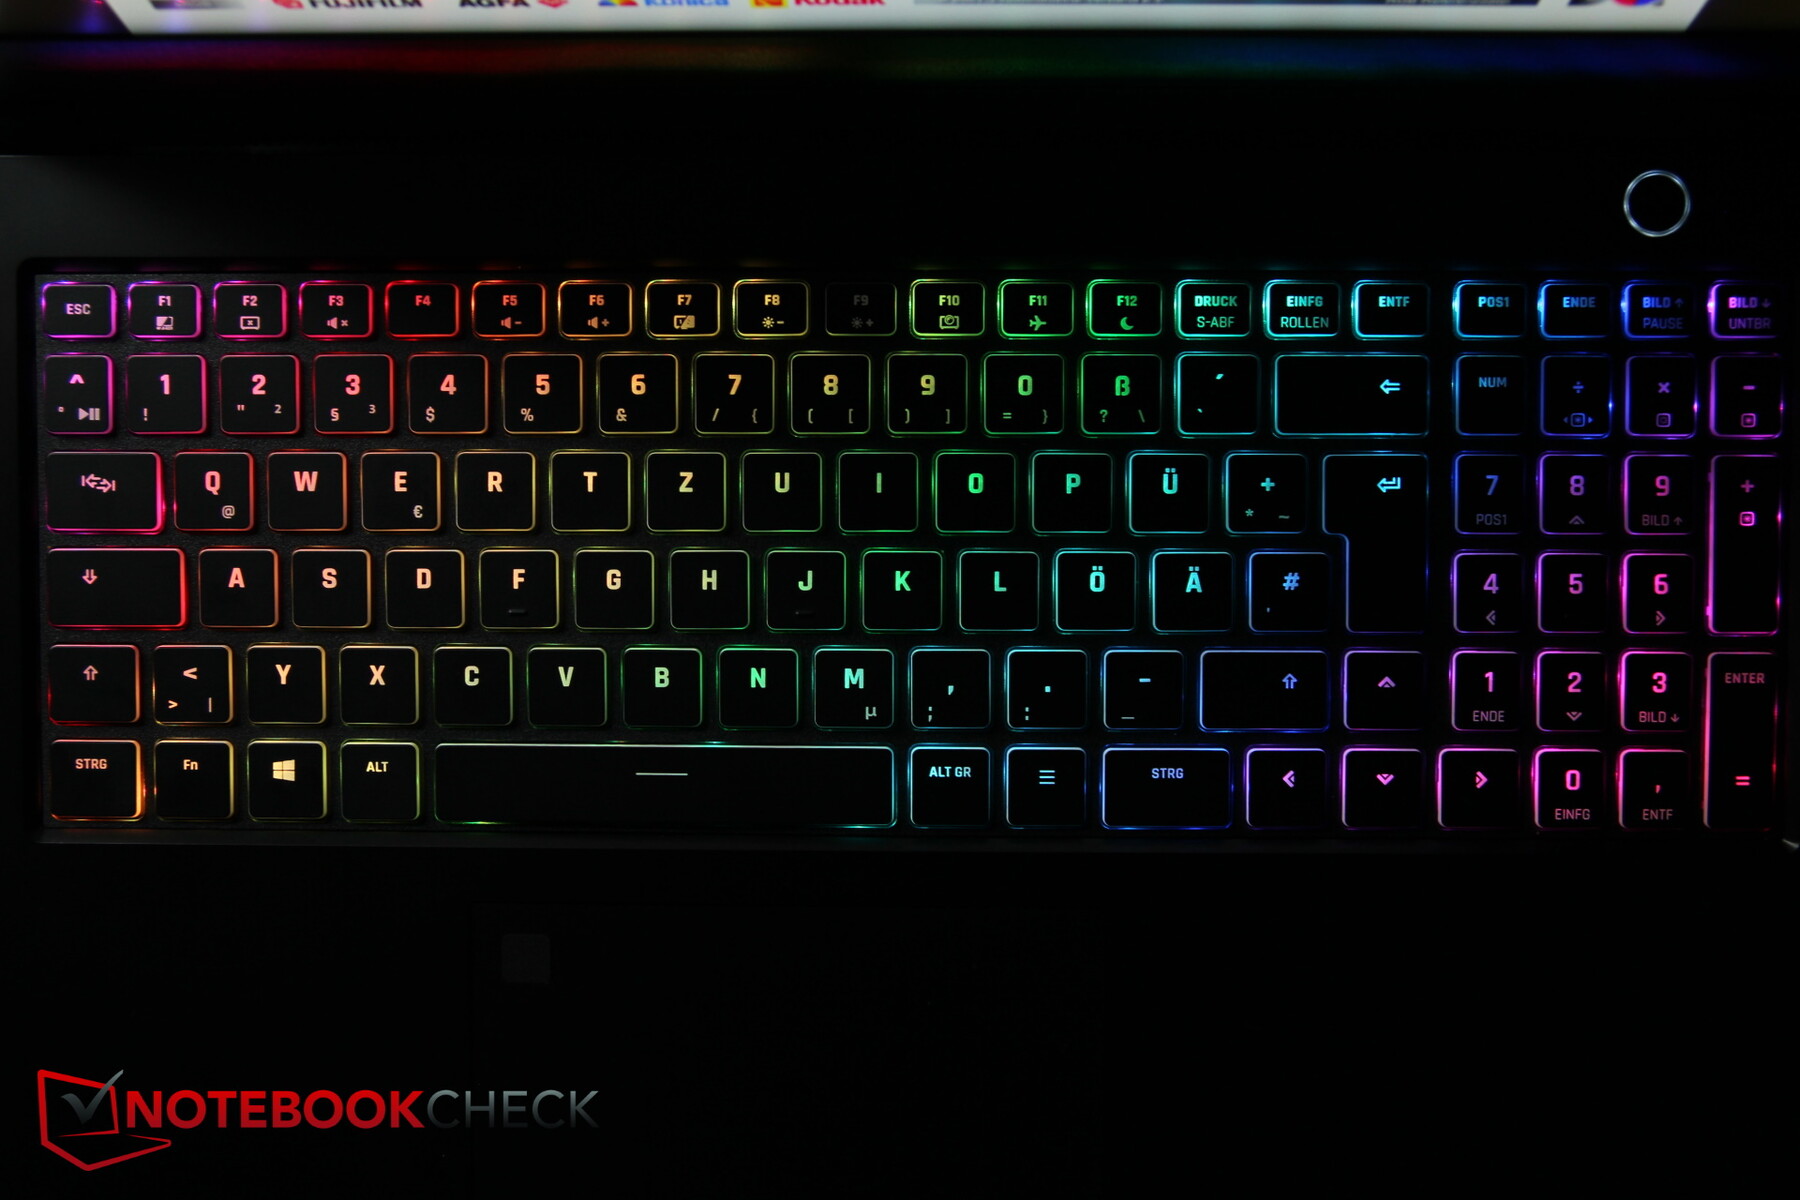

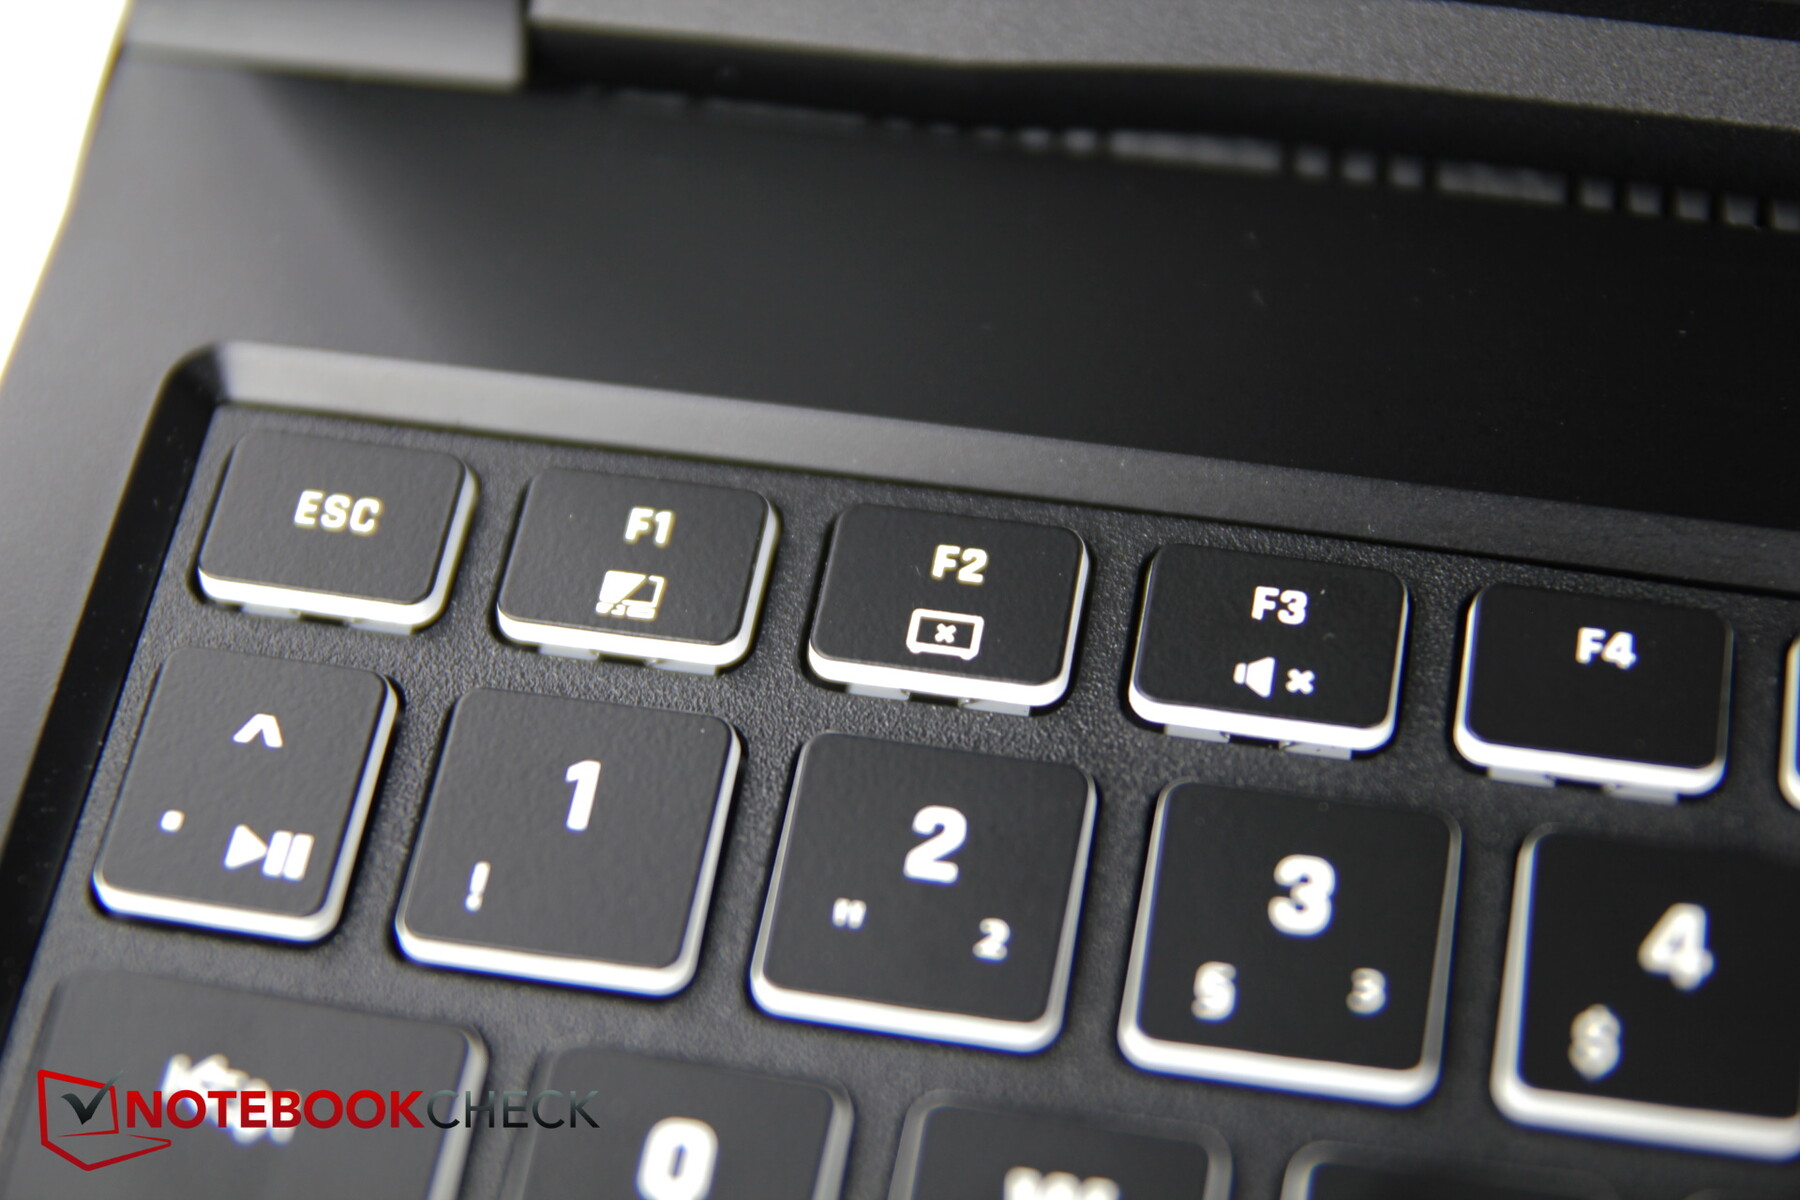
The power button has been installed as an extra key above the keyboard, and the arrow keys are of a normal size. Only the F keys have been halved in height. The lettering is not very large, but easy to read thanks to the clear white.
Typing is uncomplicated and fast, key travel is acceptable, and key feedback is palpable. Stroke noise is moderate.
Touchpad

The wide touchpad (~12.1 x 7.3 cm) has good gliding properties; only during very slow movements can it falter slightly. The dedicated mouse buttons of the predecessor are now history, unfortunately. The clicks of the integrated buttons are short, crisp and reliable, and the noise moderate to medium loud.
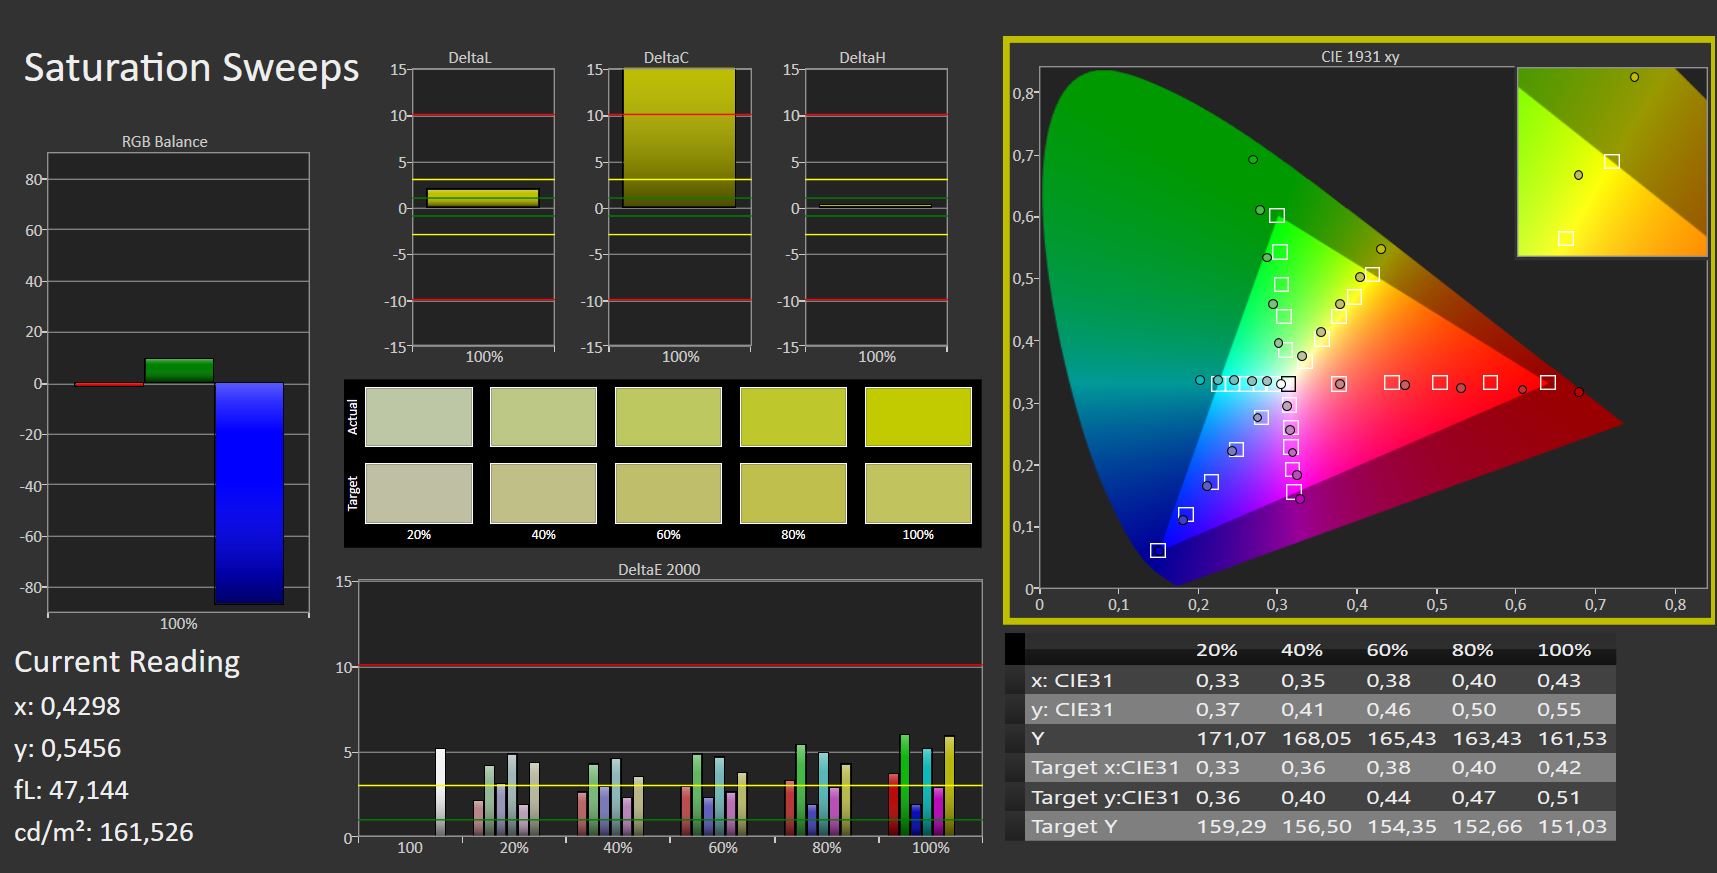
Display: Good color space coverage
Schenker uses a matte QHD IPS panel (2560 x 1440) from BOE with 165 Hz. Alternatively, the high quality 4K OLED option of the predecessor is again available, as well as a Full HD panel with poorer color space coverage.
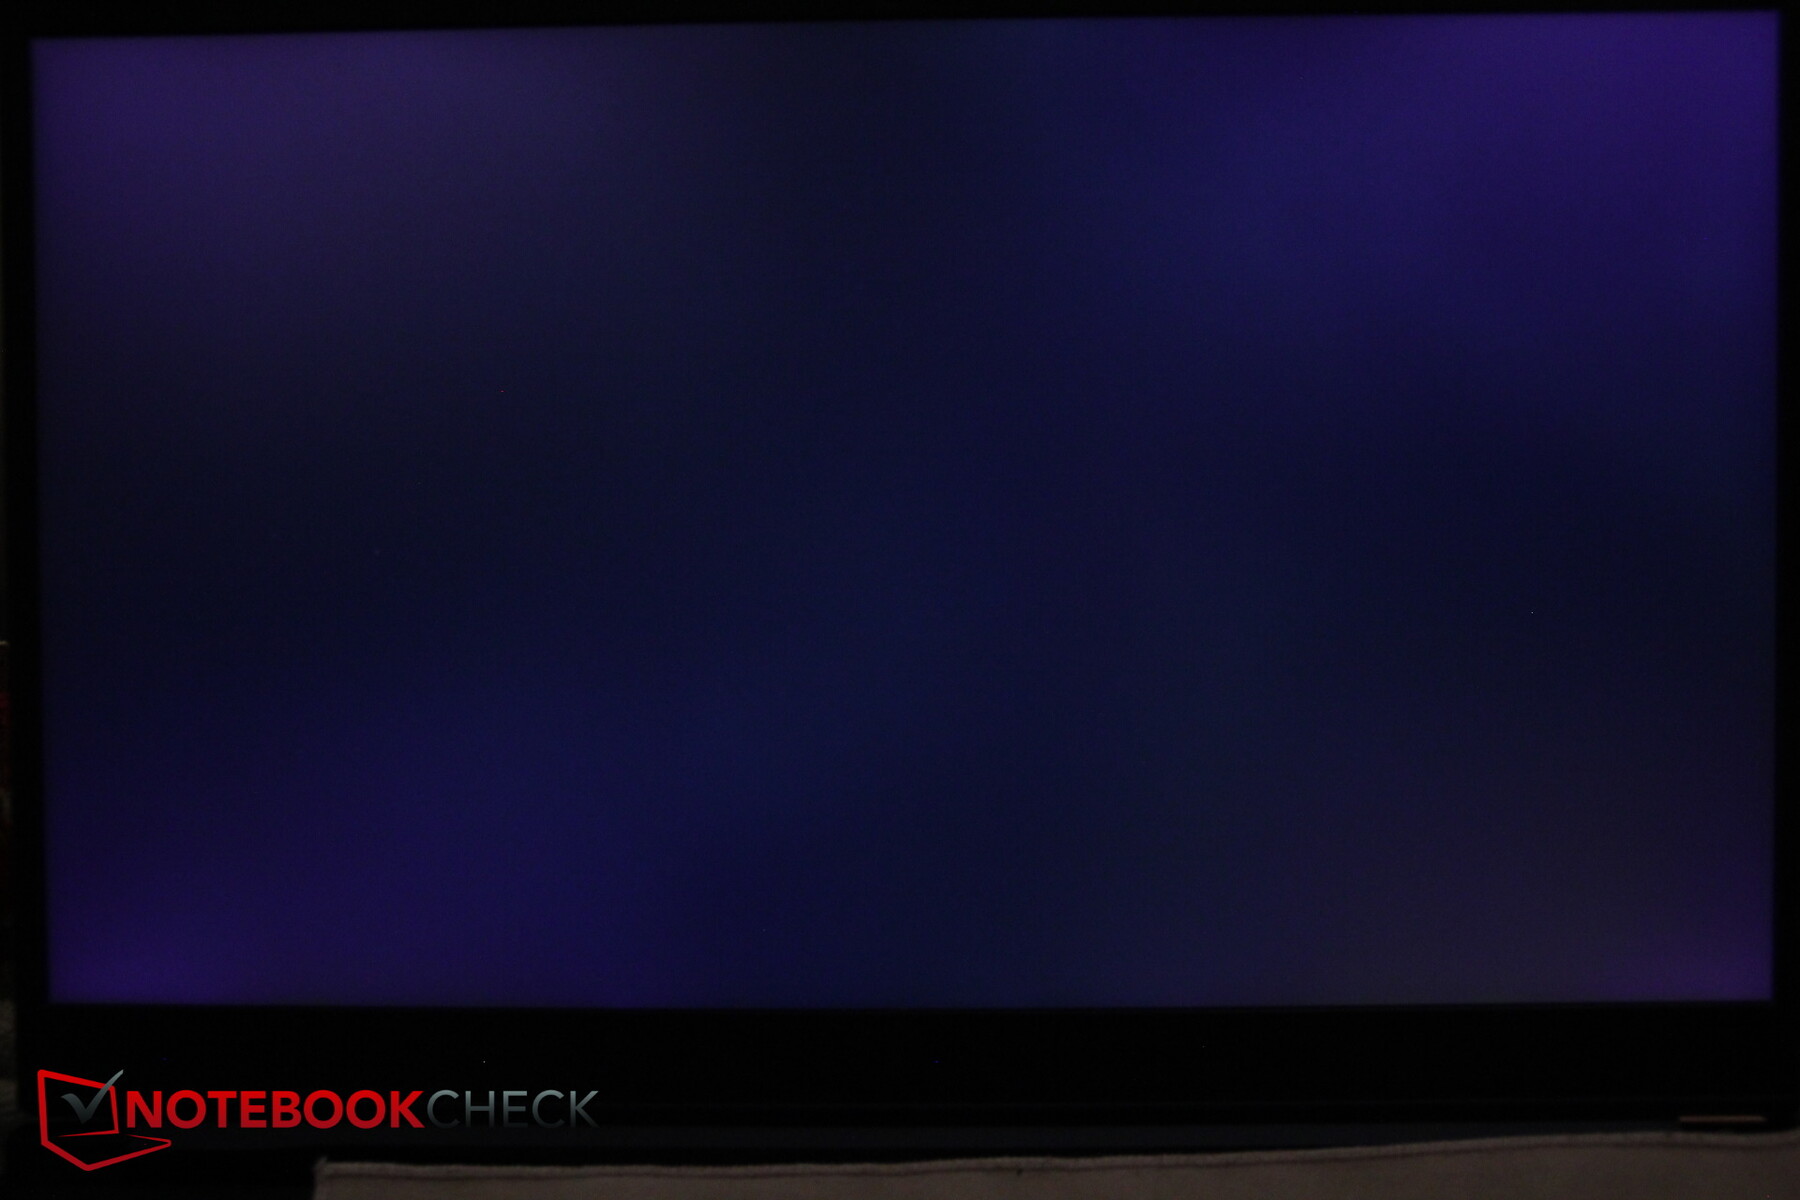
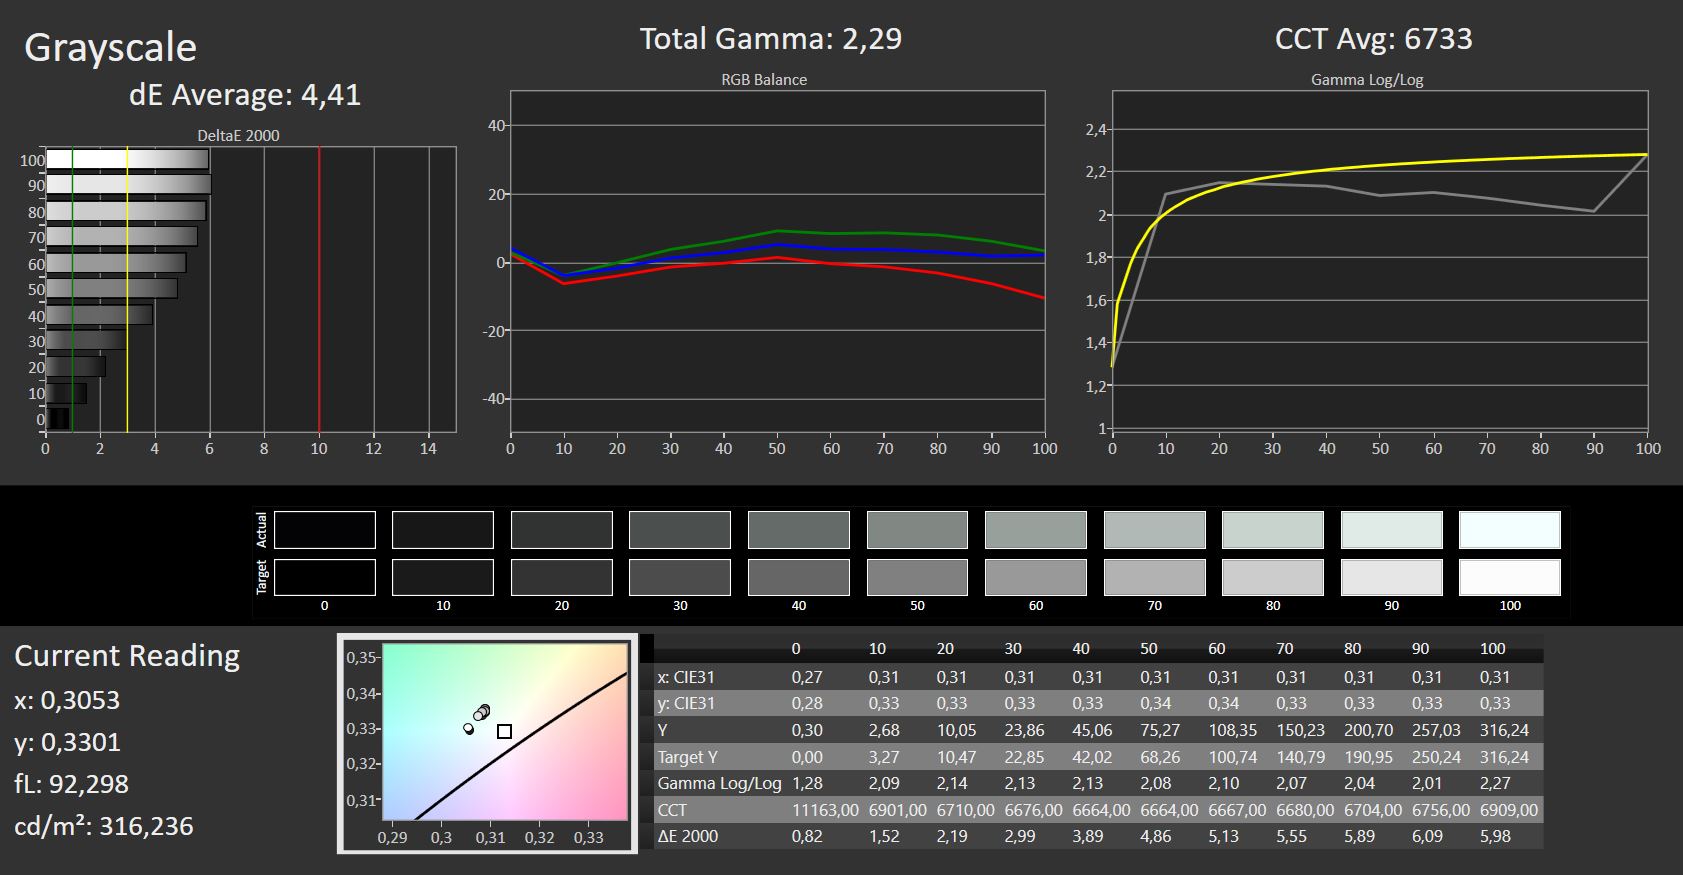
The brightness is just under 300 nits due to the less-than-uniform illumination. The contrast ratio could also be a little higher, but it is okay. Overall, the display doesn't deliver top values, but it is well-rounded overall: good response times, acceptable brightness and good color space coverage.
PWM is not used for brightness control. Screen bleeding is extremely minimal and hardly noticeable even in dark environments.
| |||||||||||||||||||||||||
Brightness Distribution: 83 %
Center on Battery: 319 cd/m²
Contrast: 991:1 (Black: 0.32 cd/m²)
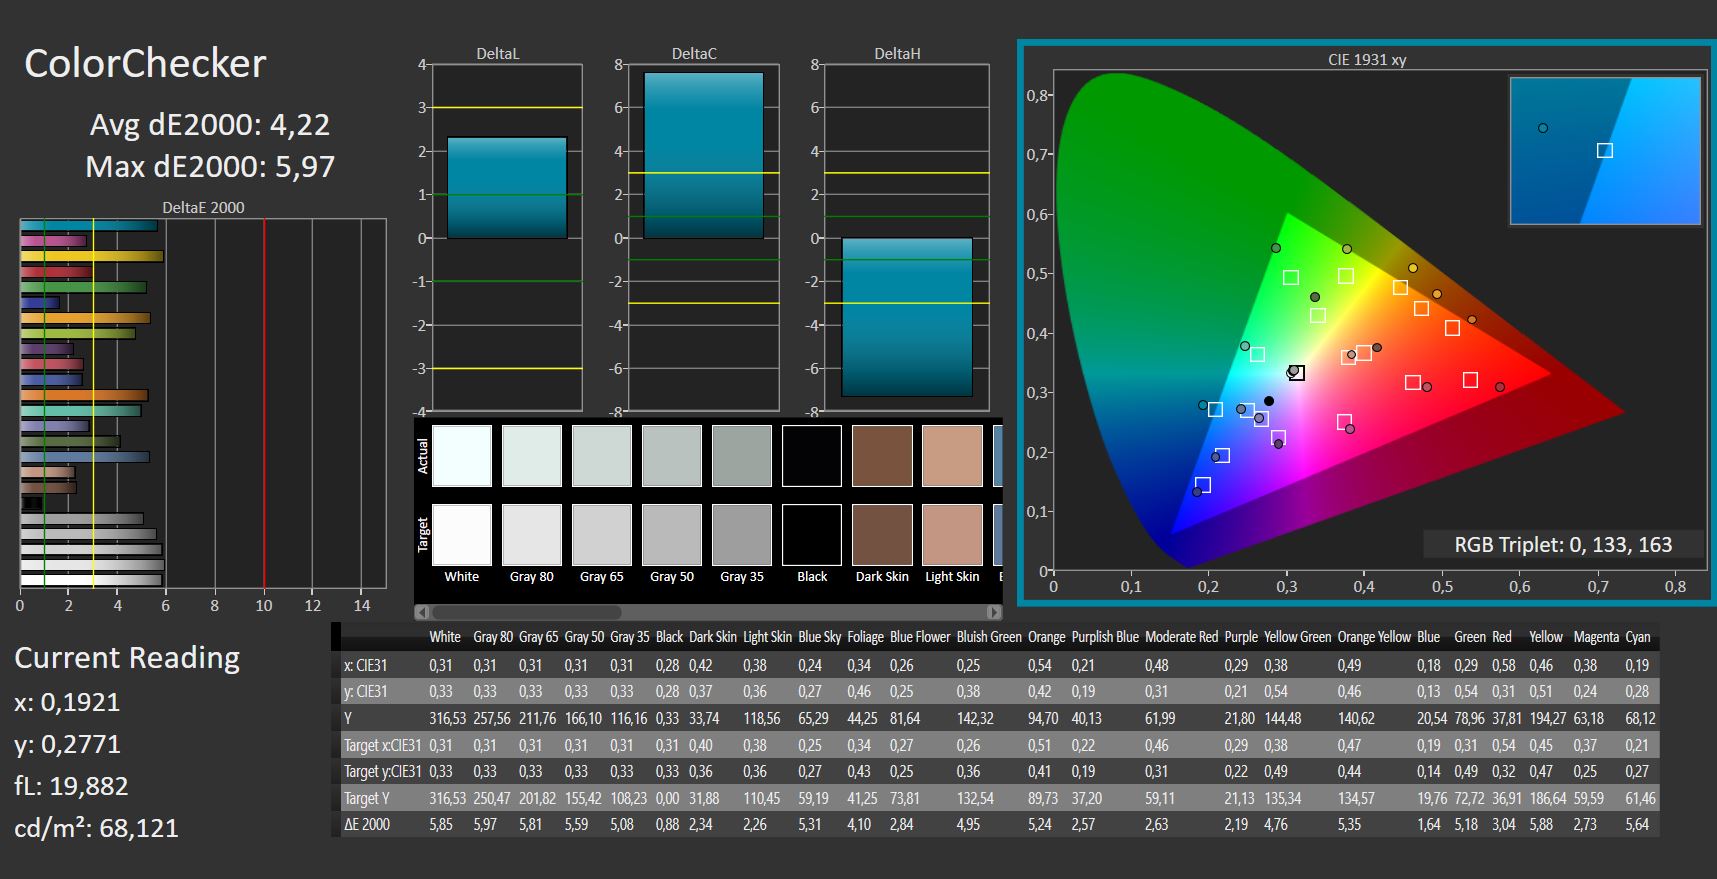
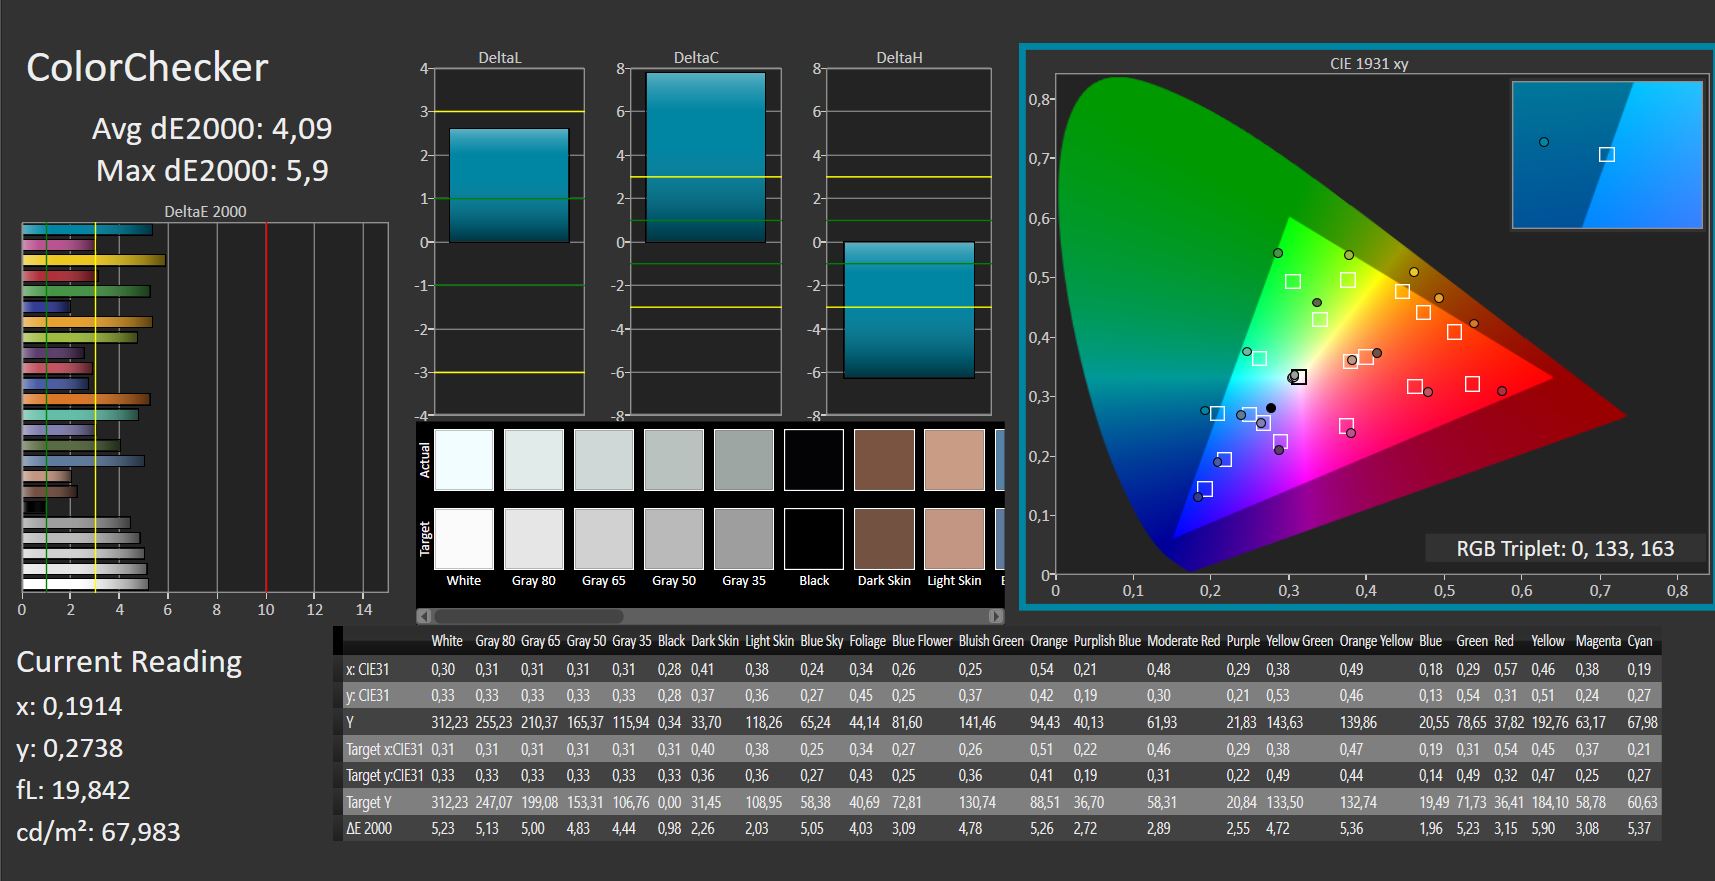
ΔE Color 4.22 | 0.5-29.43 Ø5, calibrated: 4.09
ΔE Greyscale 4.41 | 0.57-98 Ø5.3
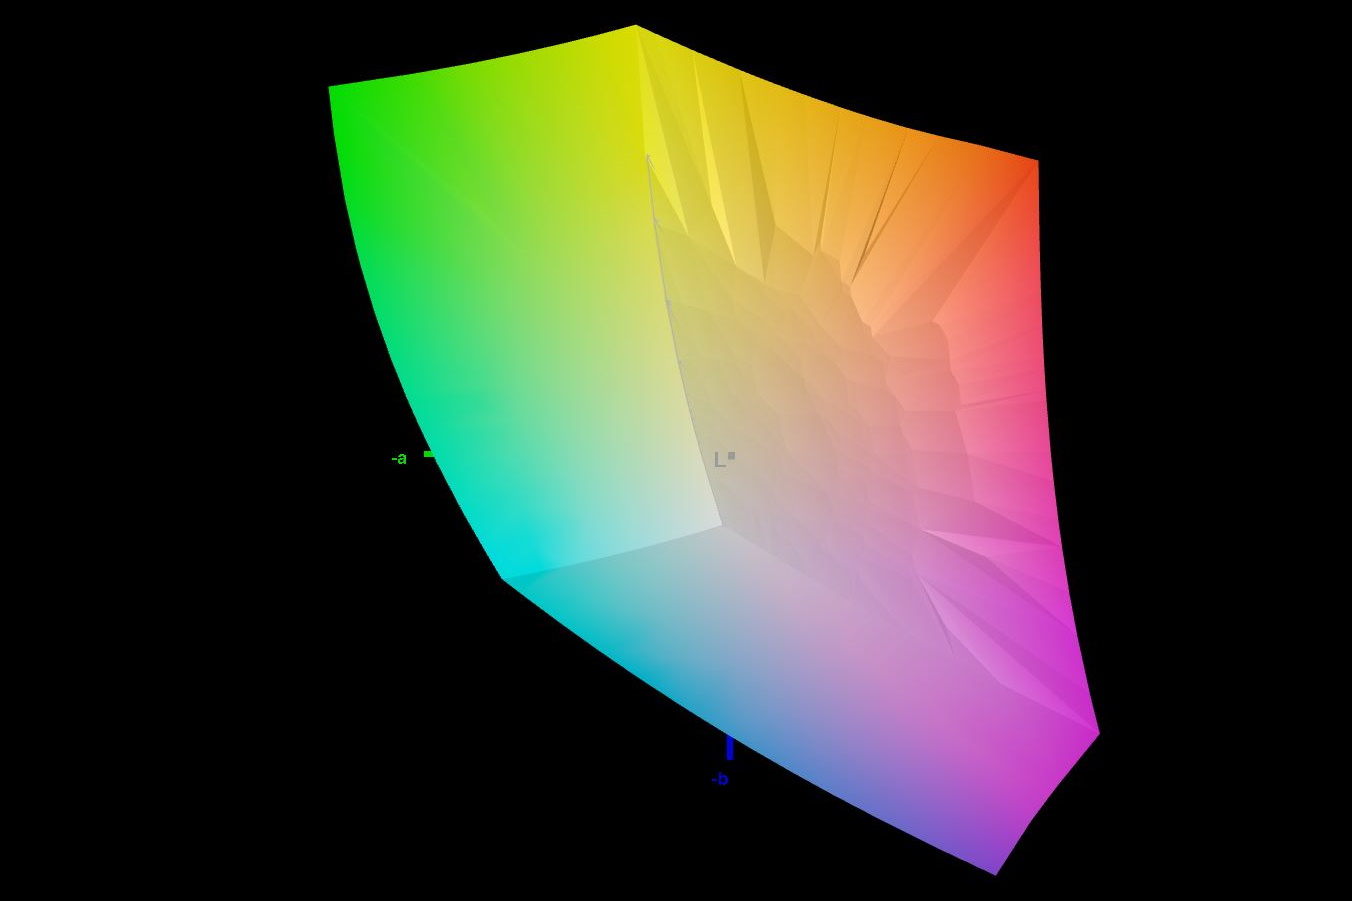
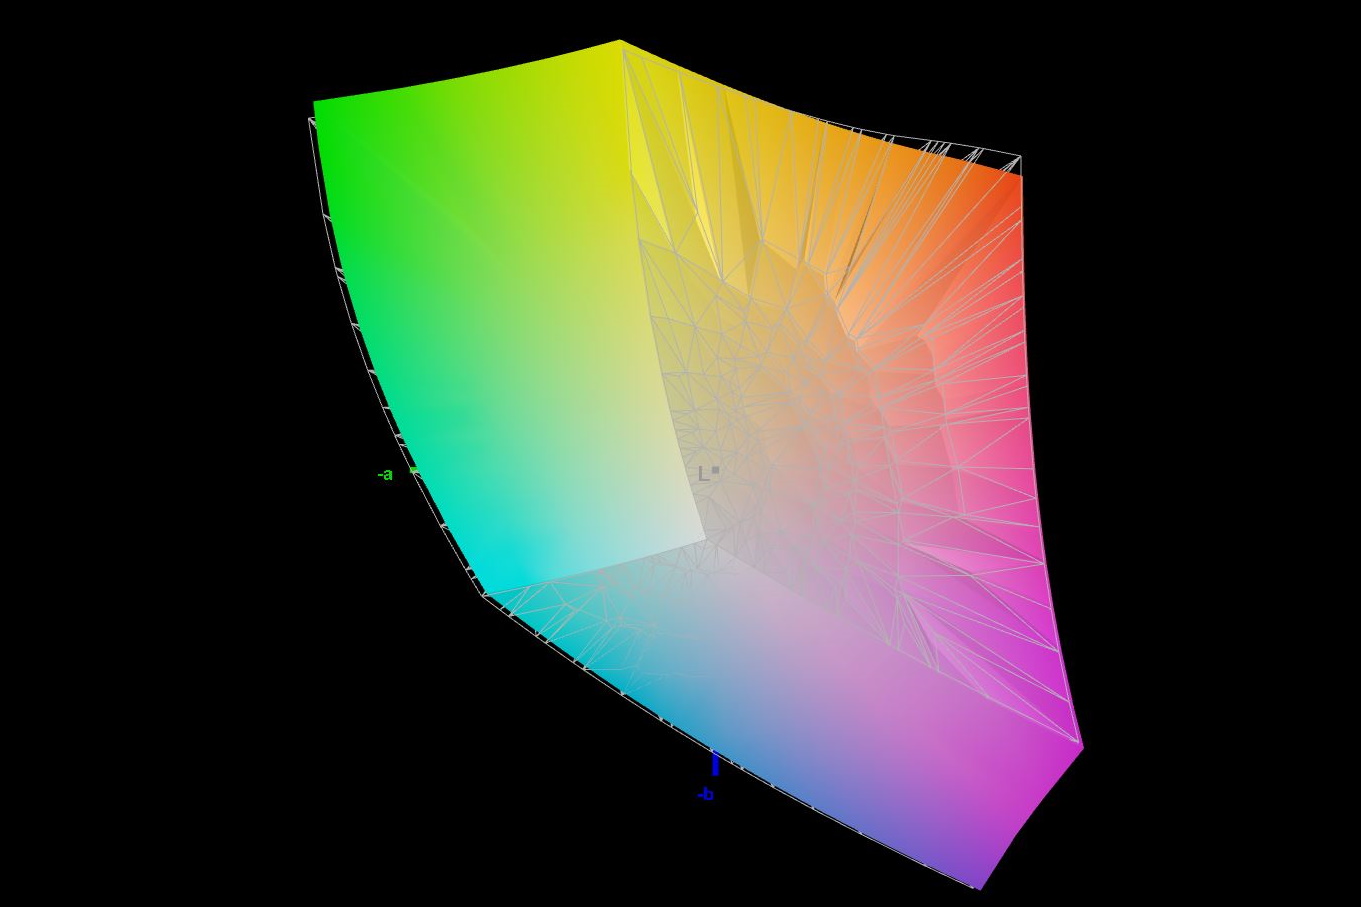
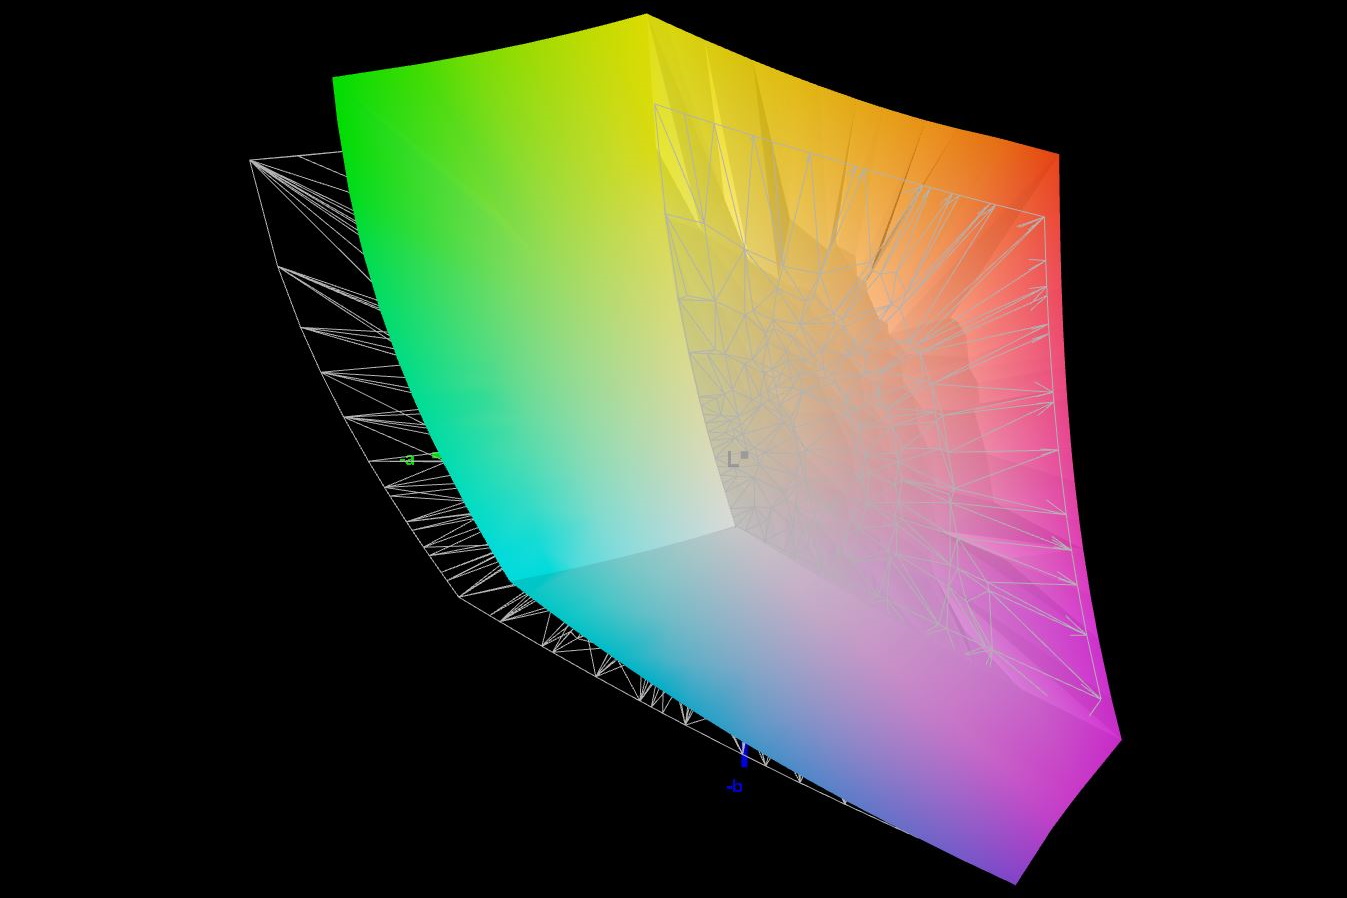
85.2% AdobeRGB 1998 (Argyll 2.2.0 3D)
99.9% sRGB (Argyll 2.2.0 3D)
97.5% Display P3 (Argyll 2.2.0 3D)
Gamma: 2.29
| SCHENKER XMG Pro 15 (i7-12700H, RTX 3080 Ti) BOE09C2 (BOE CQ NE156QHM-NY1), IPS, 2560x1440, 15.60 | SCHENKER XMG Pro 15 (Late 2021) Samsung ATNA56WR14-0, OLED, 3840x2160, 15.60 | SCHENKER XMG Neo 15 (i7-12700H, RTX 3080 Ti) BOE0A67, IPS, 2560x1440, 15.60 | MSI Raider GE66 12UHS AUO51EB, IPS, 3840x2160, 15.60 | Razer Blade 15 2022 Sharp LQ156T1JW03, IPS, 2560x1440, 15.60 | |
|---|---|---|---|---|---|
| Display | -5% | -17% | -3% | 1% | |
| Display P3 Coverage | 97.5 | 81.2 -17% | 68.2 -30% | 80.4 -18% | 99.1 2% |
| sRGB Coverage | 99.9 | 97.7 -2% | 97.2 -3% | 98.4 -2% | 99.9 0% |
| AdobeRGB 1998 Coverage | 85.2 | 89.1 5% | 69.4 -19% | 94.7 11% | 86.8 2% |
| Response Times | 79% | 3% | -44% | -21% | |
| Response Time Grey 50% / Grey 80% * | 13.2 ? | 3.2 ? 76% | 12.4 ? 6% | 18.8 ? -42% | 14.4 ? -9% |
| Response Time Black / White * | 8.8 ? | 1.6 ? 82% | 8.8 ? -0% | 12.8 ? -45% | 11.6 ? -32% |
| PWM Frequency | 60 ? | ||||
| Screen | 294% | 35% | 13% | 21% | |
| Brightness middle | 317 | 443 40% | 365 15% | 351 11% | 286 -10% |
| Brightness | 294 | 434 48% | 335 14% | 347 18% | 271 -8% |
| Brightness Distribution | 83 | 94 13% | 81 -2% | 90 8% | 89 7% |
| Black Level * | 0.32 | 0.02 94% | 0.32 -0% | 0.35 -9% | 0.25 22% |
| Contrast | 991 | 22150 2135% | 1141 15% | 1003 1% | 1144 15% |
| Colorchecker dE 2000 * | 4.22 | 3.73 12% | 1.38 67% | 2.54 40% | 2.74 35% |
| Colorchecker dE 2000 max. * | 5.97 | 8.12 -36% | 2.01 66% | 8.36 -40% | 5.21 13% |
| Colorchecker dE 2000 calibrated * | 4.09 | 1.22 70% | 0.67 84% | 2.52 38% | |
| Greyscale dE 2000 * | 4.41 | 2.5 43% | 1.36 69% | 4.1 7% | 1.1 75% |
| Gamma | 2.29 96% | 2.001 110% | 2.48 89% | 2.089 105% | 2.2 100% |
| CCT | 6733 97% | 6522 100% | 6412 101% | 7036 92% | 6408 101% |
| Total Average (Program / Settings) | 123% /
192% | 7% /
19% | -11% /
2% | 0% /
11% |
* ... smaller is better
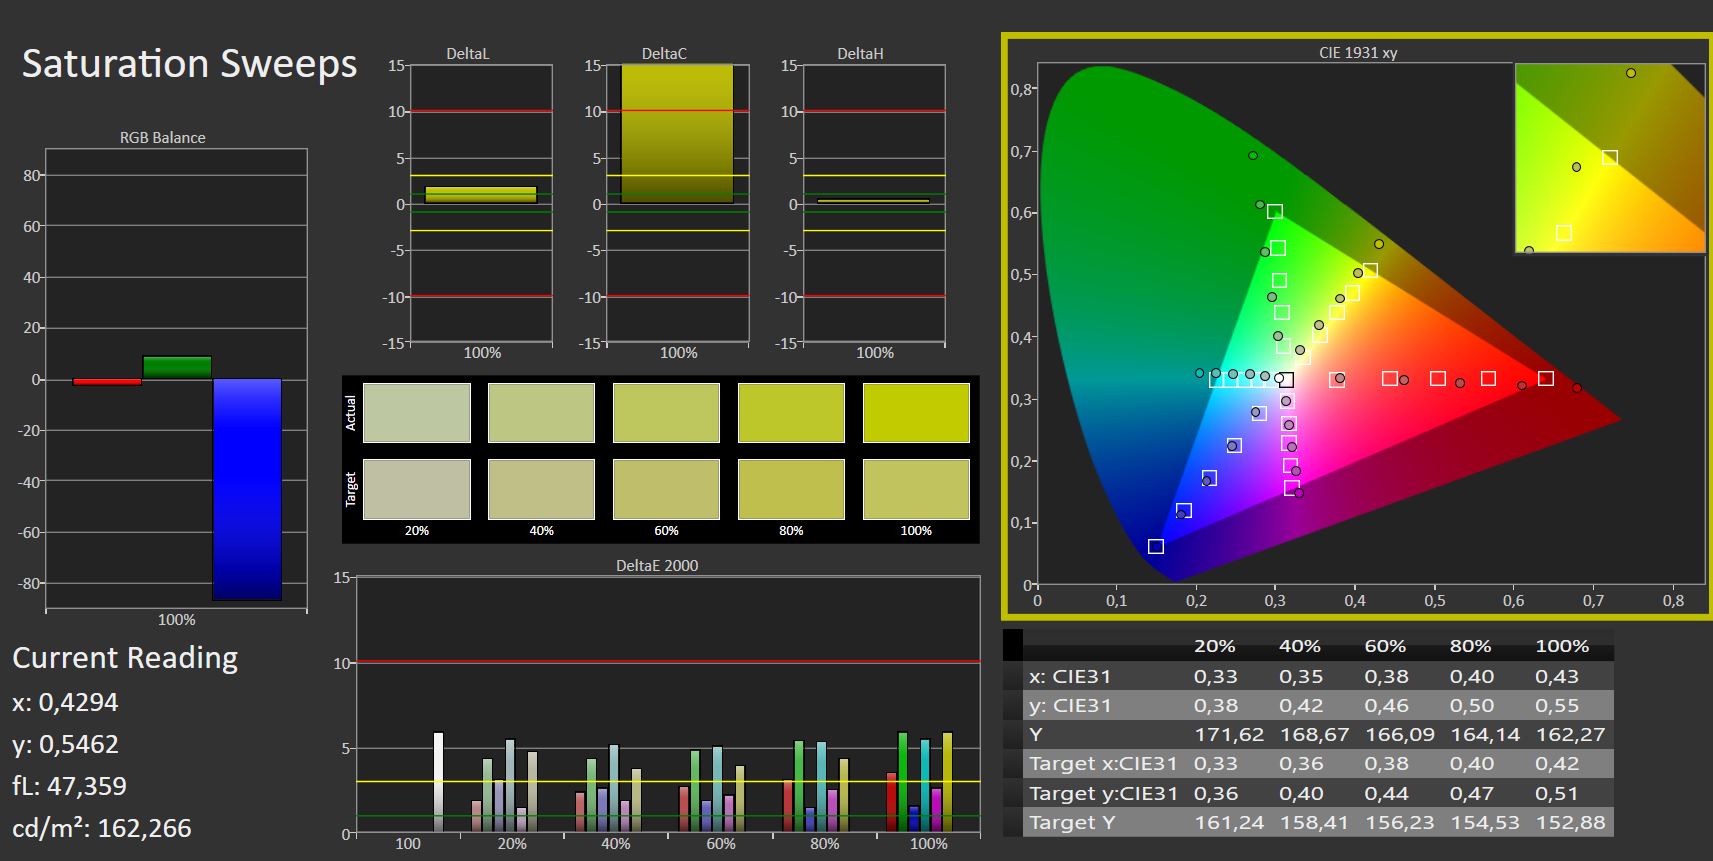
The panel in the Pro 15 covers sRGB completely and DCI-P3 at over 97 percent, AdobeRGB at 85 percent. Unlike the Neo, the panel is thus suitable for editing photos and videos.
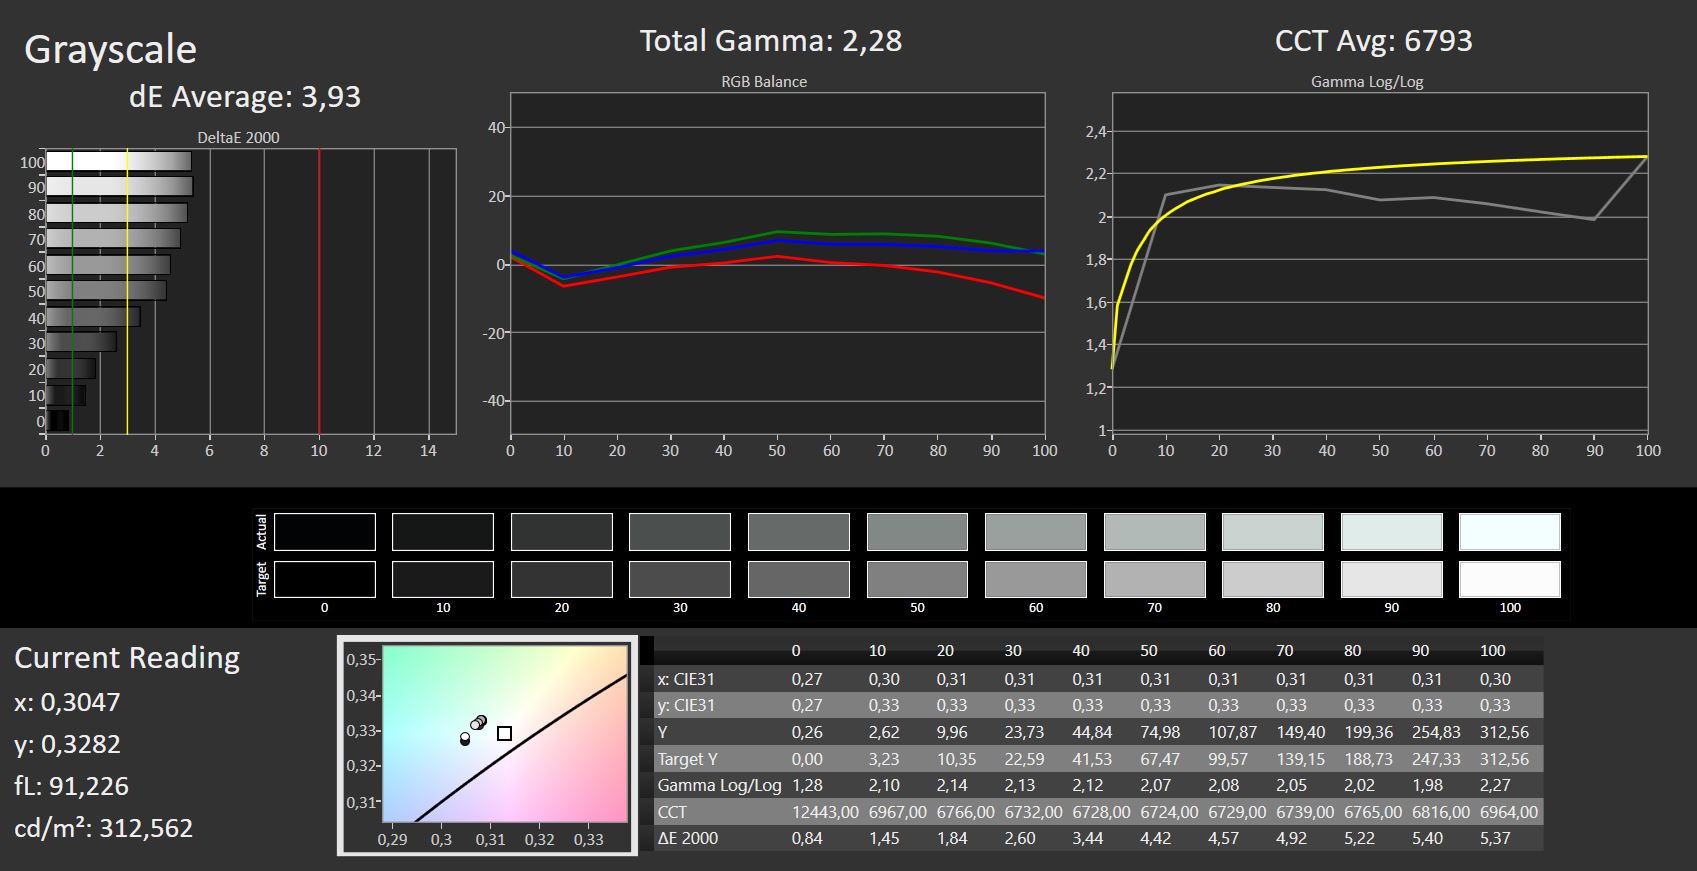
The display is properly calibrated ex-works; manual calibration hardly changes the average color deviation values.
Display Response Times
| ↔ Response Time Black to White | ||
|---|---|---|
| 8.8 ms ... rise ↗ and fall ↘ combined | ↗ 4.2 ms rise | 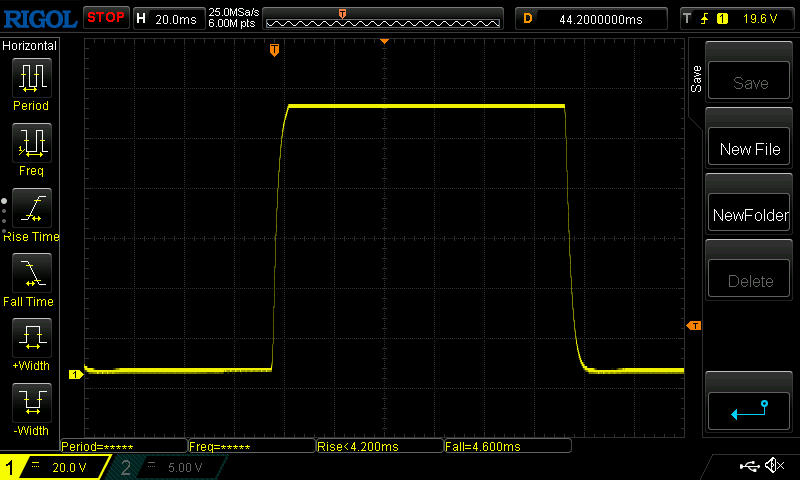 |
| ↘ 4.6 ms fall | ||
| The screen shows fast response rates in our tests and should be suited for gaming. In comparison, all tested devices range from 0.1 (minimum) to 240 (maximum) ms. » 19 % of all devices are better. This means that the measured response time is better than the average of all tested devices (21.5 ms). | ||
| ↔ Response Time 50% Grey to 80% Grey | ||
| 13.2 ms ... rise ↗ and fall ↘ combined | ↗ 6.2 ms rise | 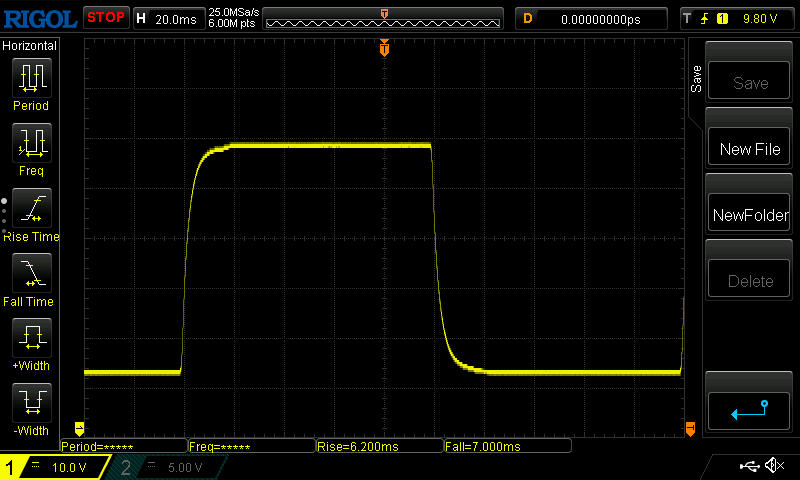 |
| ↘ 7 ms fall | ||
| The screen shows good response rates in our tests, but may be too slow for competitive gamers. In comparison, all tested devices range from 0.2 (minimum) to 636 (maximum) ms. » 21 % of all devices are better. This means that the measured response time is better than the average of all tested devices (33.7 ms). | ||
Screen Flickering / PWM (Pulse-Width Modulation)
| Screen flickering / PWM not detected | 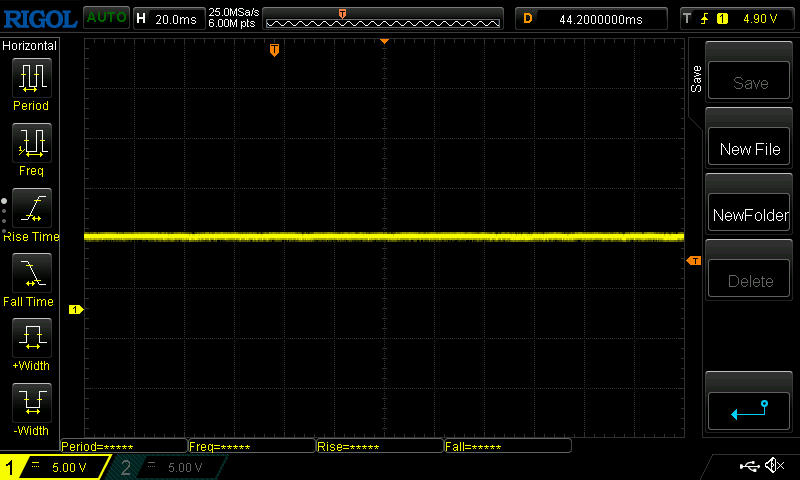 | ||
In comparison: 53 % of all tested devices do not use PWM to dim the display. If PWM was detected, an average of 17924 (minimum: 5 - maximum: 3846000) Hz was measured. | |||
The matte surface eliminates many reflections outdoors. However, due to the rather average brightness and a not-too high contrast, you should stay in the shade and ensure a direct frontal view.
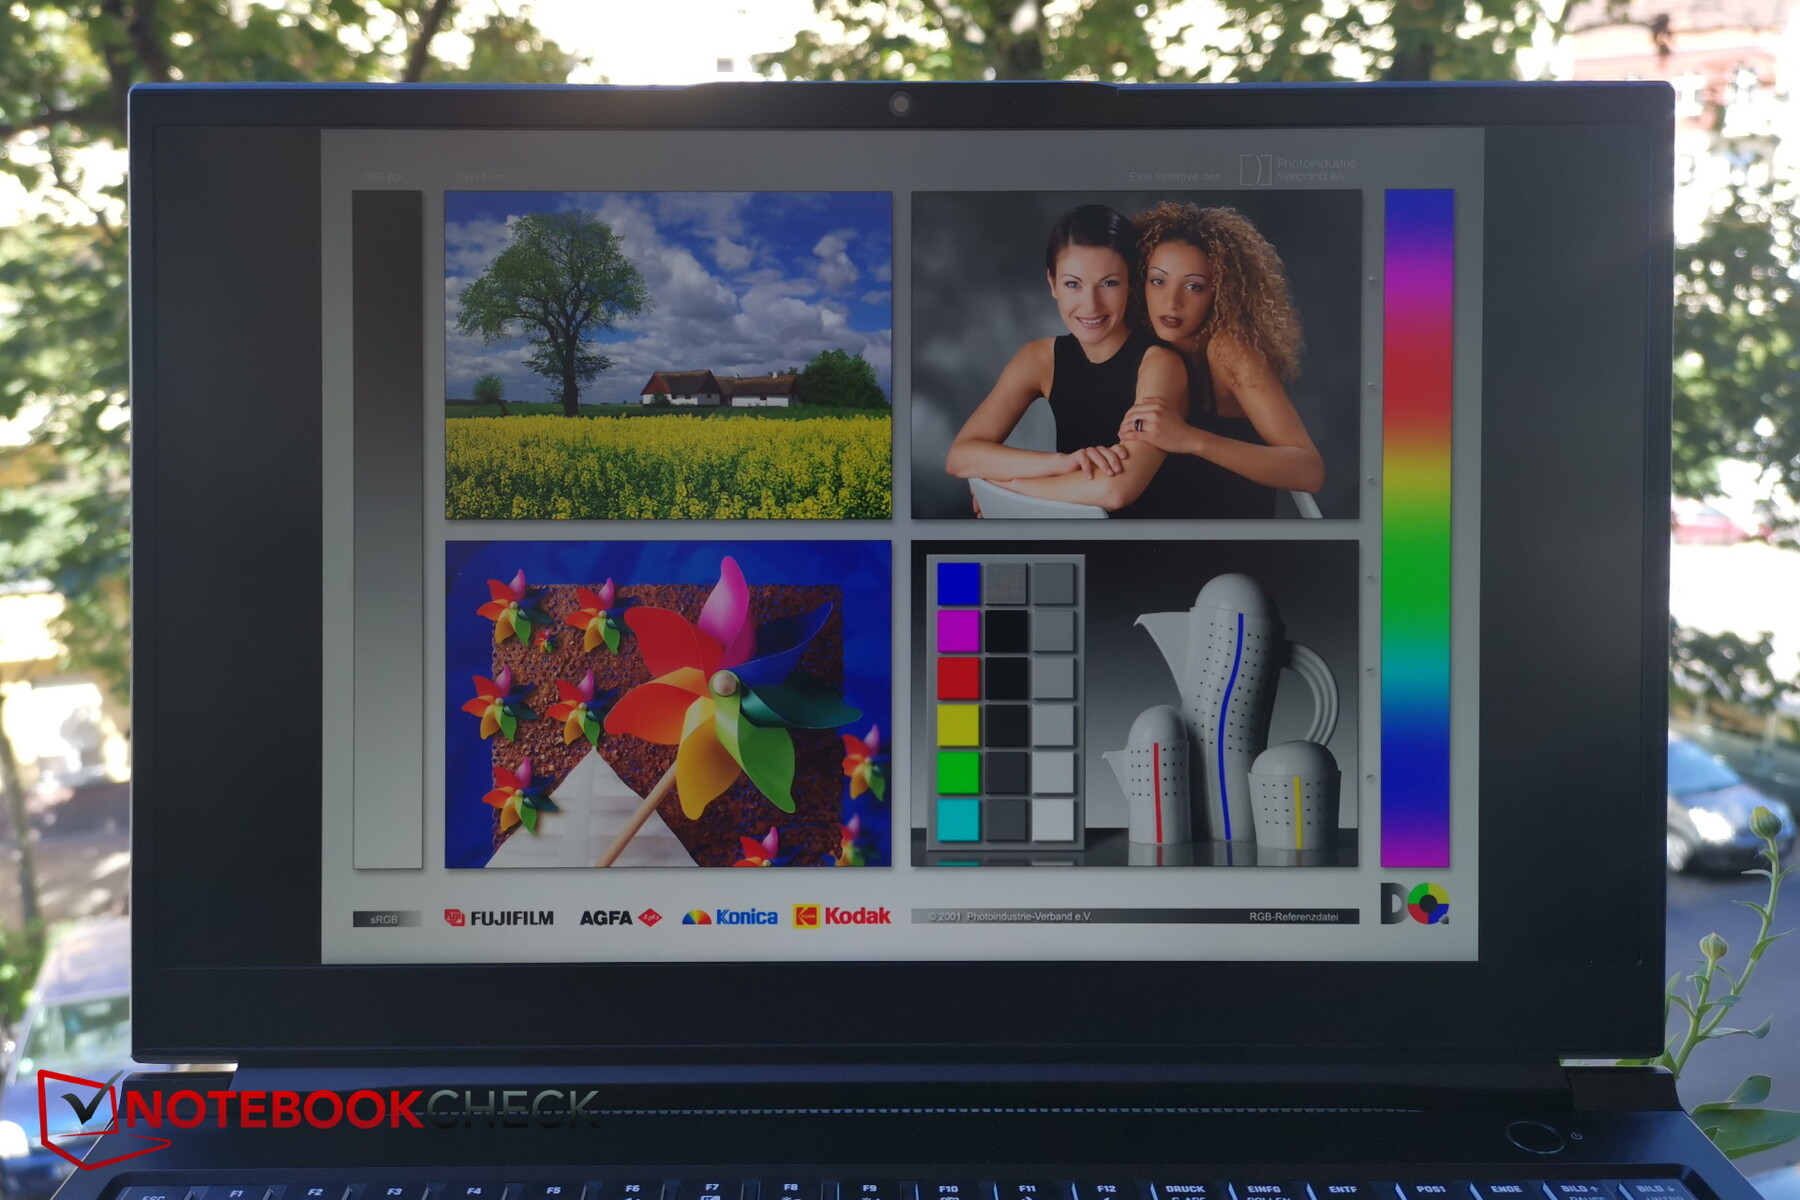
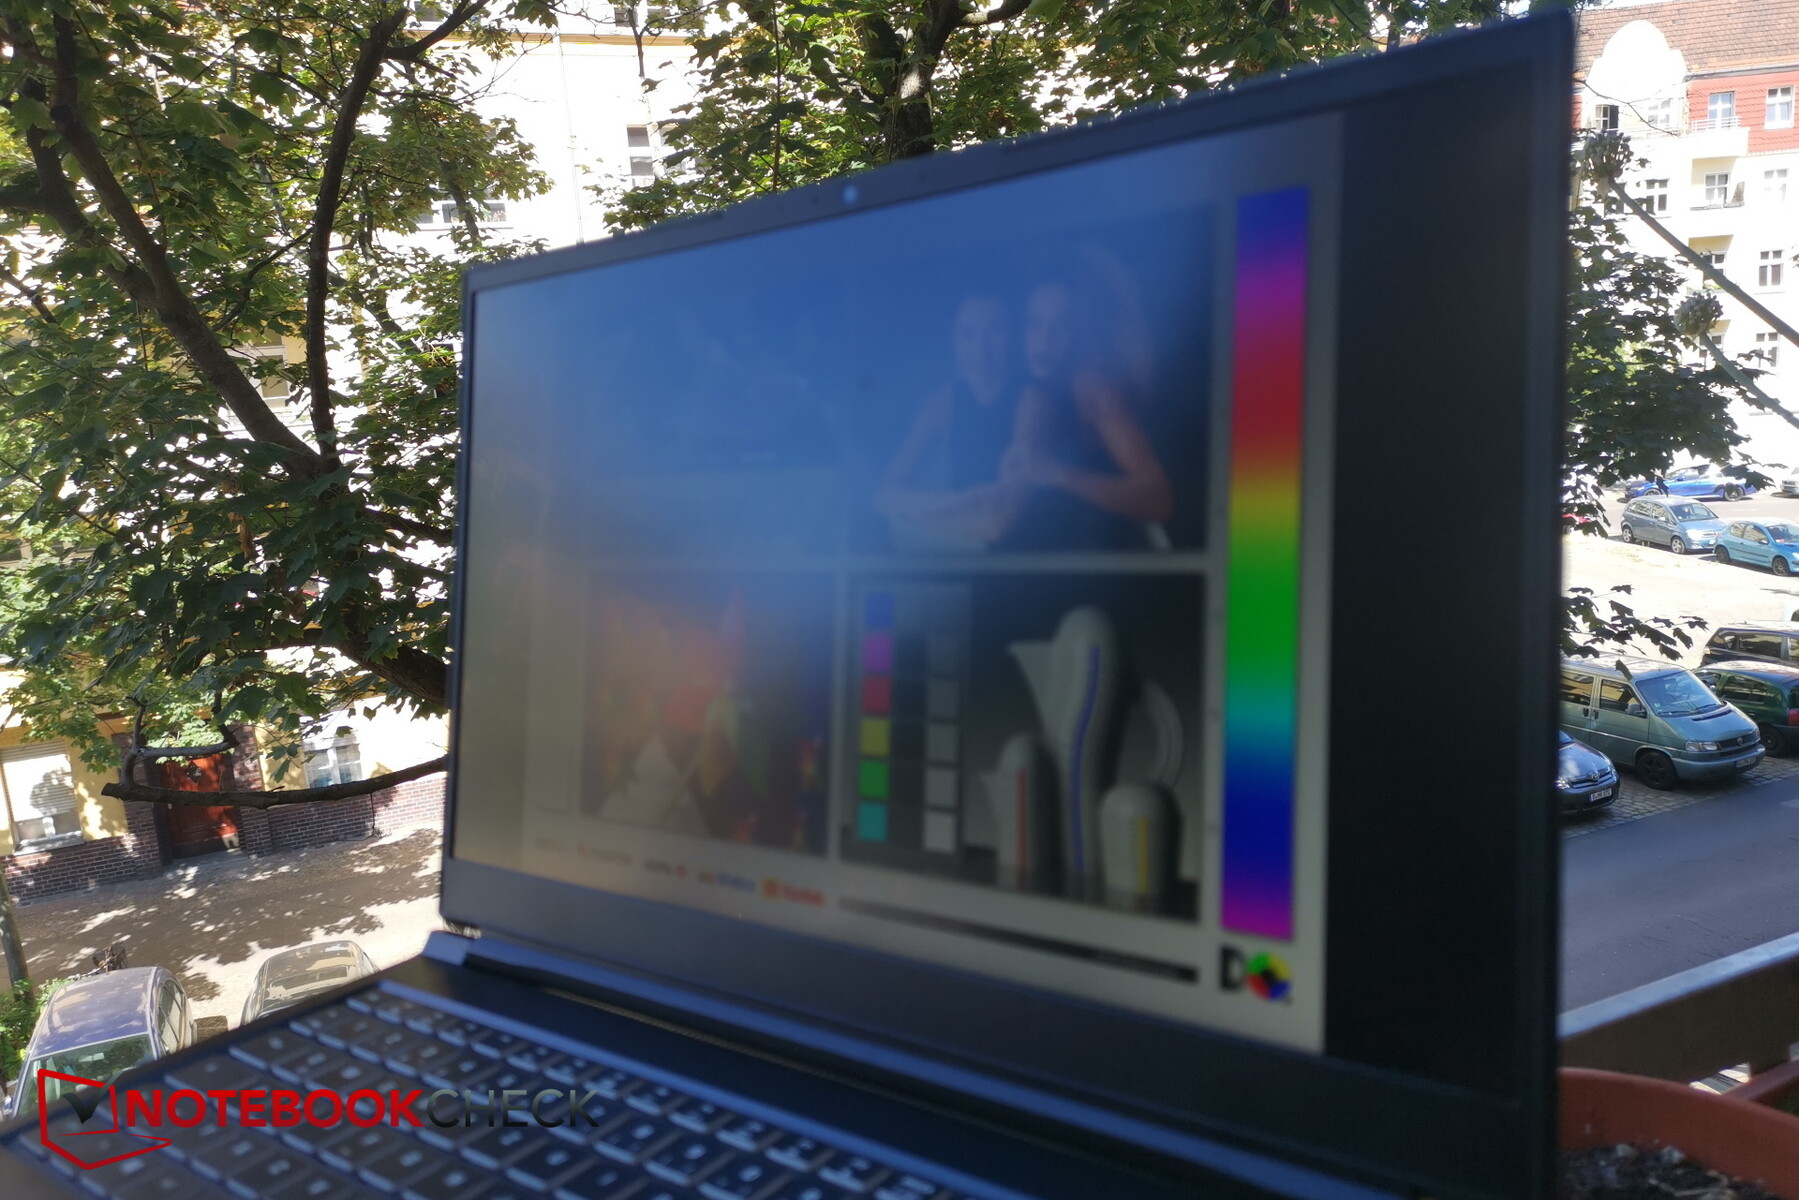
As is typical for IPS, the viewing angle stability is very good. Only under extreme viewing angles do brightness and colors suffer a little.

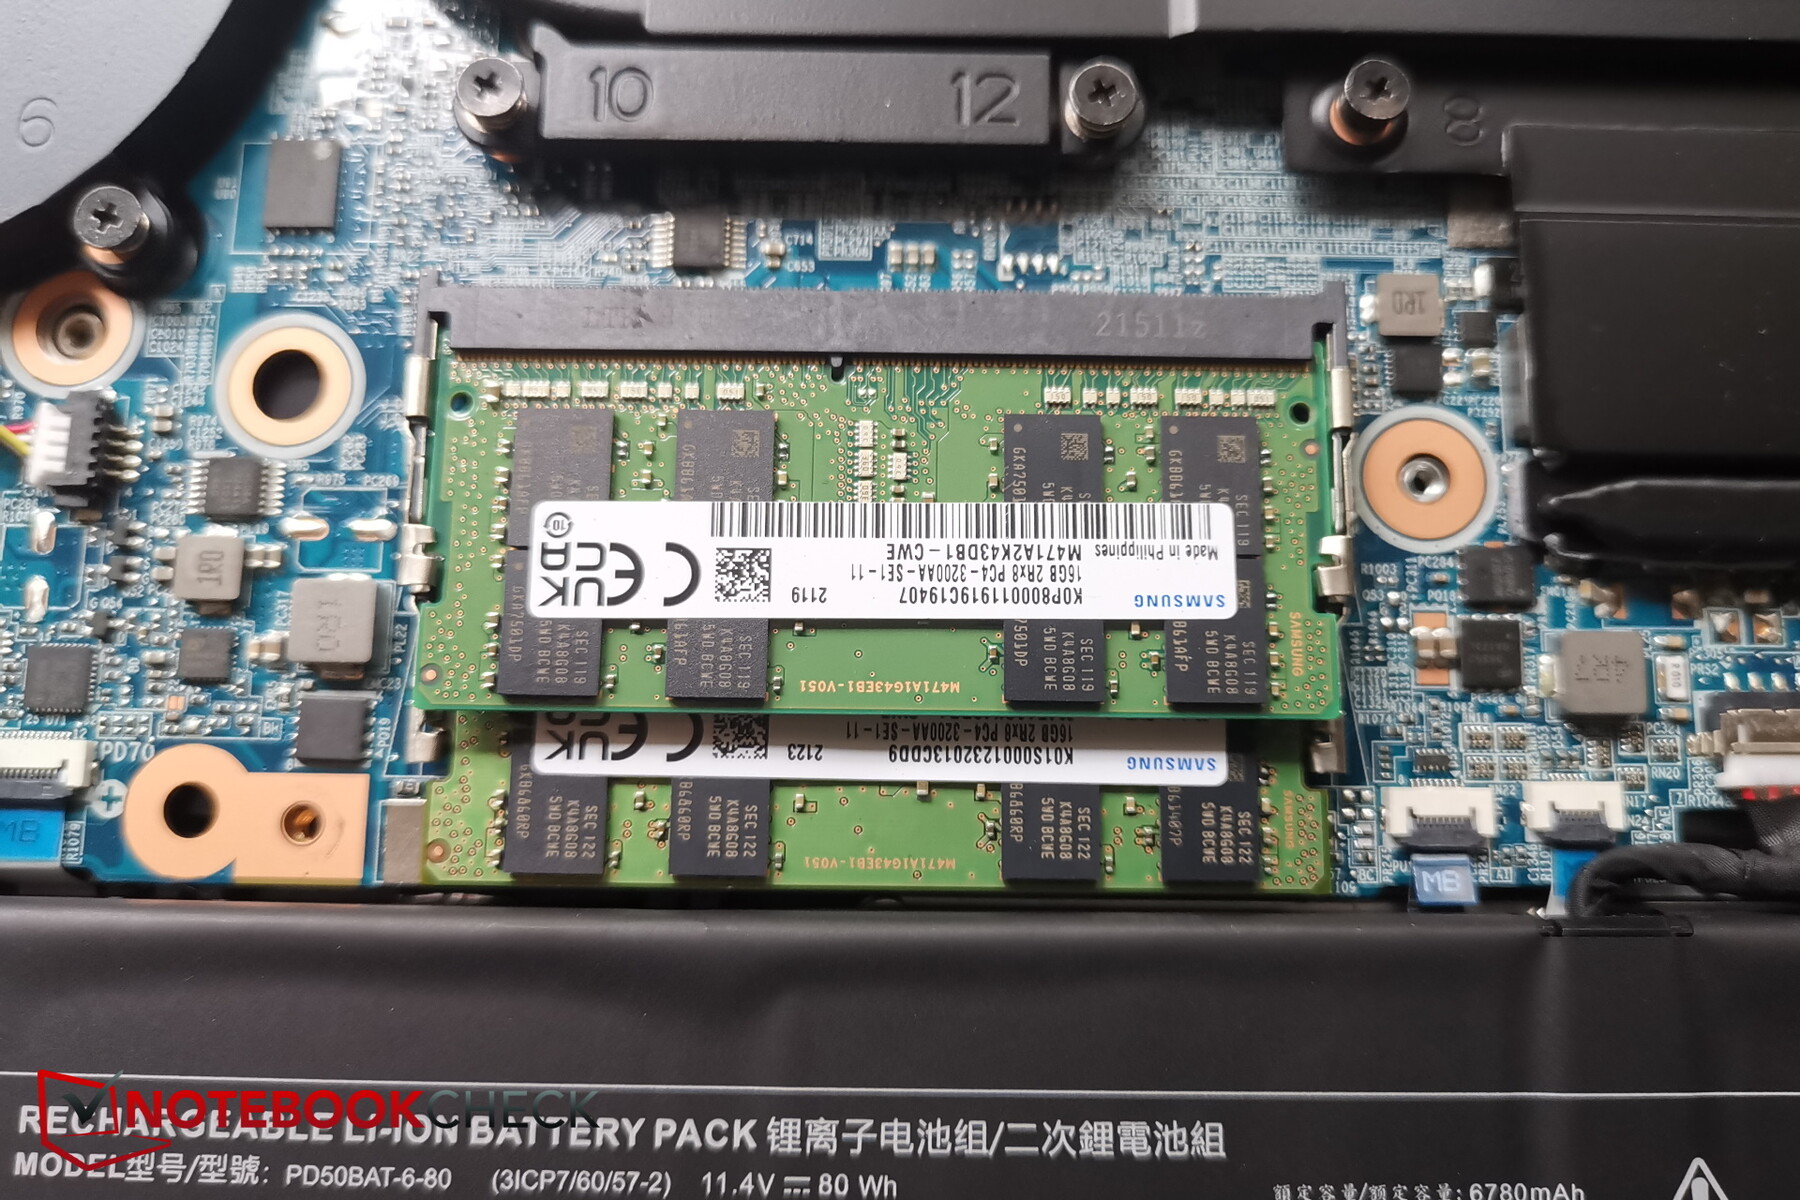
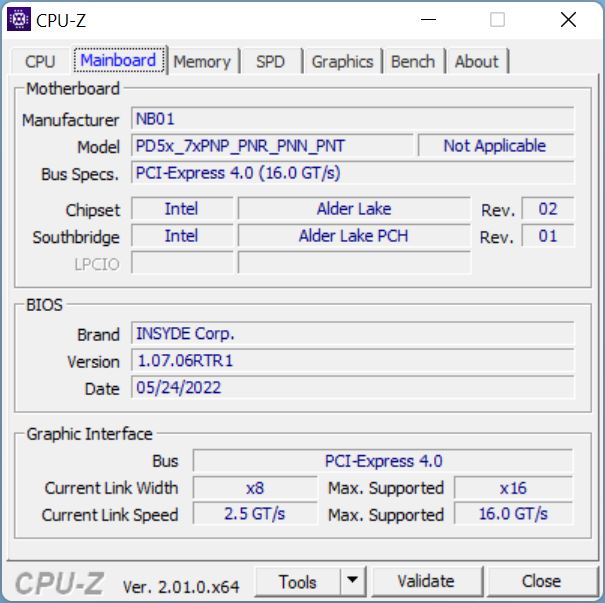
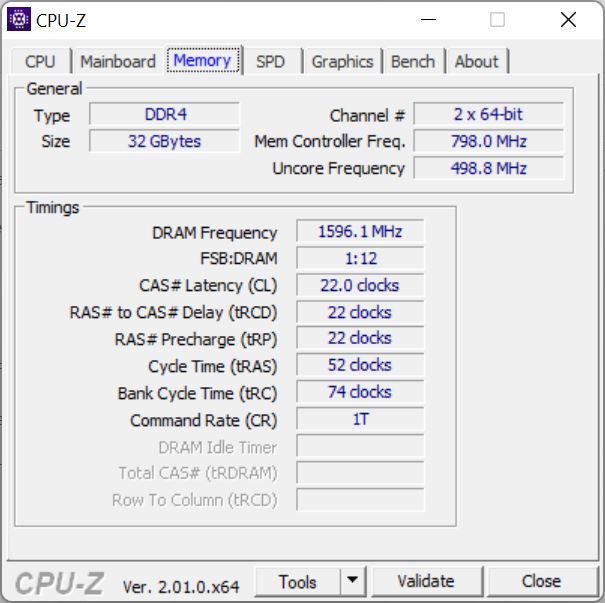
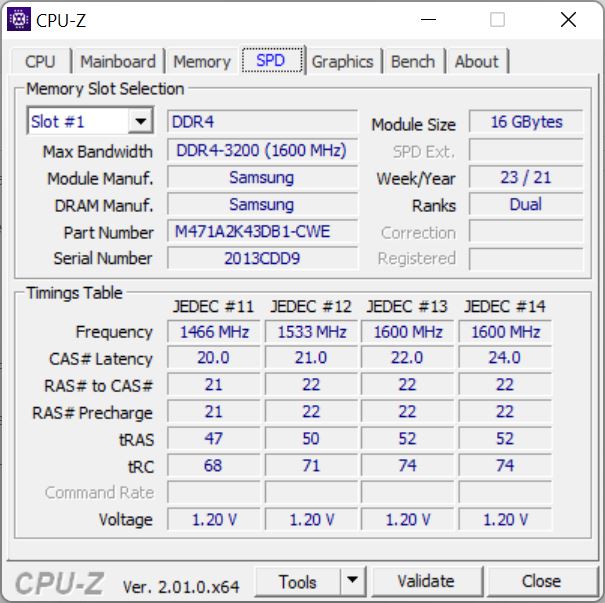
Performance: High performance, no DDR5
The XMG Pro 15 is aimed at gamers as well as content creators, which is reflected in the sleek design and the strong hardware (i7-12700H and RTX 3080 Ti) on the one hand, and in the QHD display with its good color space coverage on the other hand. A generous 32 GB of RAM also benefits both parties, but this is unfortunately only available in the DDR4 version here, unlike in the Neo.
Testing Conditions
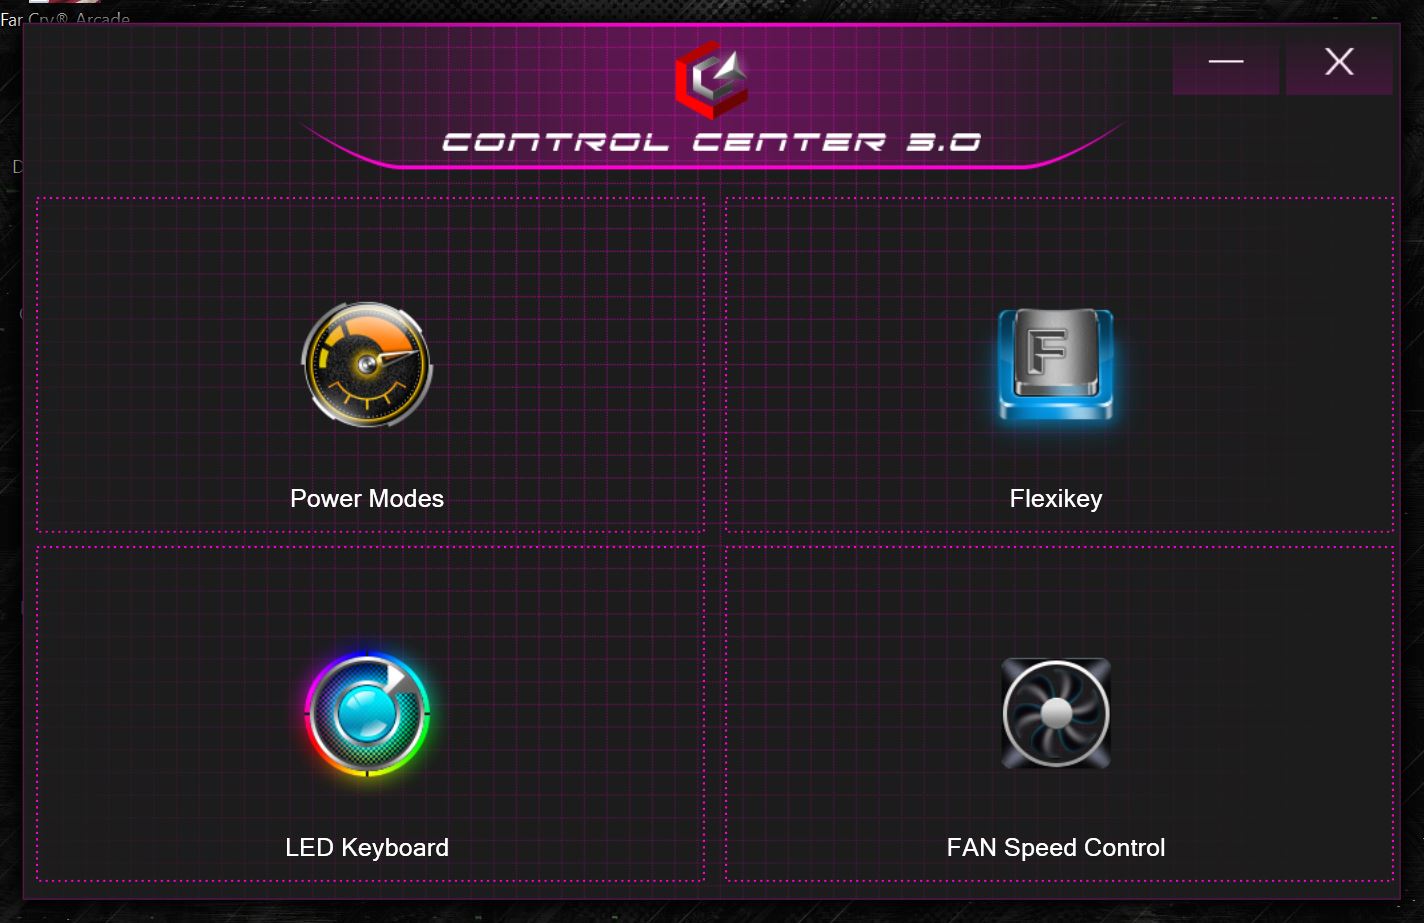
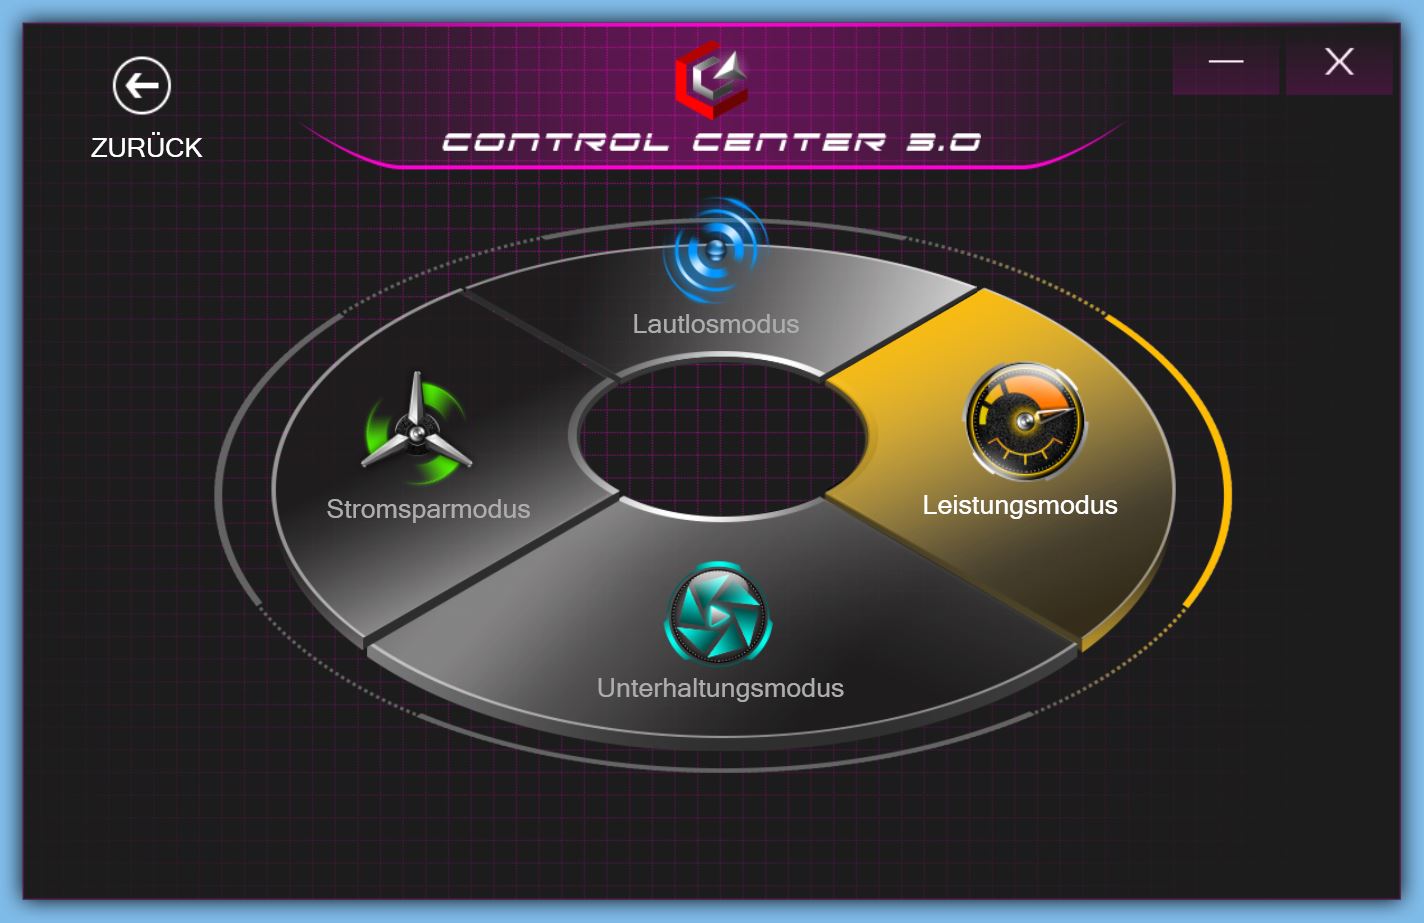
All important performance settings are adjusted in the XMG Control Center; Schenker uses different software here than in the XMG Neo. Manual settings for the offset values or Dynamic Boost are largely absent. Only the fan curve can be adjusted manually.
On the other hand, four performance modes can be selected: Silent, Power Saving, Entertainment and Performance. For the best benchmark results, we carried out our tests in the most powerful mode, which is Performance mode. However, Schenker recommends Entertainment mode, which is intended to be a good compromise between performance and noise.
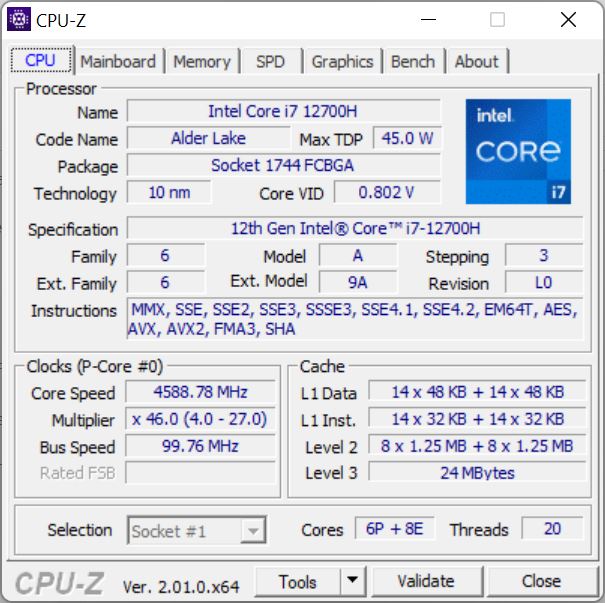
Processor
An Intel Core i7-12700H is used as the CPU (14 cores, 20 threads). The combined E and P cores roughly clock from 1.8 to 4.7 GHz. The CPU is very powerful and is used in many Intel gaming laptops.
In the Cinebench loop, the performance drops slightly over longer periods of time. Nevertheless, the curve is comparable to that of the MSI Raider GE66 with its i9-12900H, but the same i7-12700H is even faster in the Neo 15.
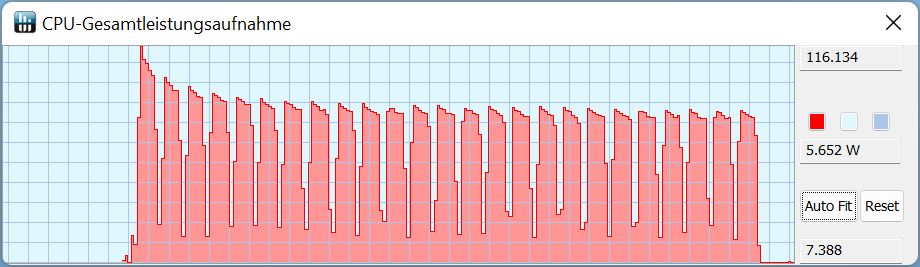
The TDP only briefly draws 116 W in the first run, after which it drops and stabilizes at around 80 to 85 W.
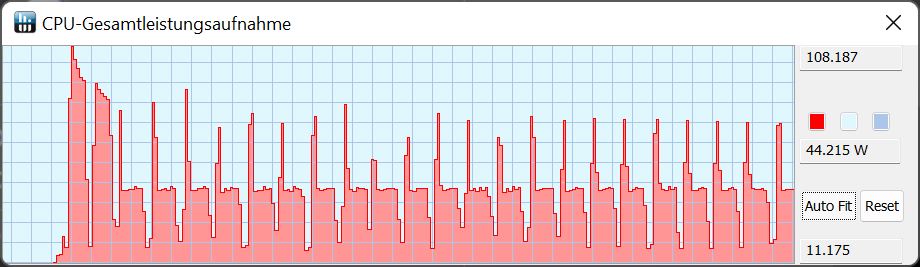
In Entertainment mode (instead of performance mode), the TDP briefly extracts 108 W in the first run before also dropping and stabilizing at 45 W with very short initial peaks of 55 to 80 W.
The Pro 15 beats the i7-11800H in the predecessor by around 30%. Overall, CPU performance in the Neo 15 and the MSI Raider is a few percentage points better, but the Pro 15 is still on a very good level, namely slightly above the expected rates.
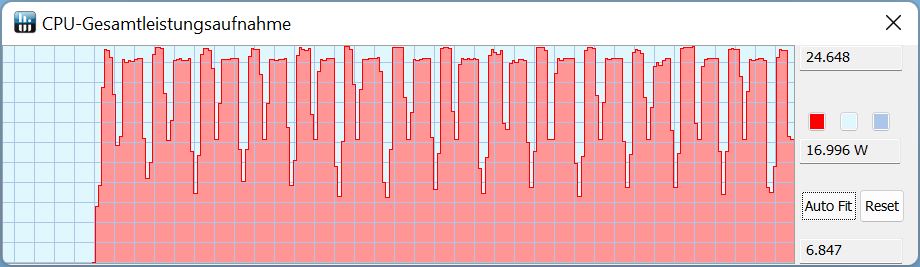
In Battery mode, the maximum power consumption is only 25 W, and the TDP sometimes drops to 16 W during the Cinebench runs. Performance is correspondingly lower, seeing reductions of around 57% compared to the plugged-in Performance mode.
Cinebench R15 Multi Sustained Load
Cinebench R23: Multi Core | Single Core
Cinebench R20: CPU (Multi Core) | CPU (Single Core)
Cinebench R15: CPU Multi 64Bit | CPU Single 64Bit
Blender: v2.79 BMW27 CPU
7-Zip 18.03: 7z b 4 | 7z b 4 -mmt1
Geekbench 5.5: Multi-Core | Single-Core
HWBOT x265 Benchmark v2.2: 4k Preset
LibreOffice : 20 Documents To PDF
R Benchmark 2.5: Overall mean
| CPU Performance Rating | |
| Average of class Gaming | |
| MSI Raider GE66 12UHS | |
| SCHENKER XMG Neo 15 (i7-12700H, RTX 3080 Ti) | |
| SCHENKER XMG Pro 15 (i7-12700H, RTX 3080 Ti) | |
| Average Intel Core i7-12700H | |
| Razer Blade 15 2022 | |
| SCHENKER XMG Pro 15 (Late 2021) | |
| Cinebench R23 / Multi Core | |
| Average of class Gaming (2435 - 34613, n=229, last 2 years) | |
| SCHENKER XMG Neo 15 (i7-12700H, RTX 3080 Ti) | |
| MSI Raider GE66 12UHS | |
| SCHENKER XMG Pro 15 (i7-12700H, RTX 3080 Ti) | |
| Average Intel Core i7-12700H (4032 - 19330, n=63) | |
| Razer Blade 15 2022 | |
| SCHENKER XMG Pro 15 (Late 2021) | |
| Cinebench R23 / Single Core | |
| MSI Raider GE66 12UHS | |
| SCHENKER XMG Pro 15 (i7-12700H, RTX 3080 Ti) | |
| Average of class Gaming (527 - 2235, n=227, last 2 years) | |
| SCHENKER XMG Neo 15 (i7-12700H, RTX 3080 Ti) | |
| Razer Blade 15 2022 | |
| Average Intel Core i7-12700H (778 - 1826, n=62) | |
| SCHENKER XMG Pro 15 (Late 2021) | |
| Cinebench R20 / CPU (Multi Core) | |
| Average of class Gaming (930 - 13769, n=227, last 2 years) | |
| SCHENKER XMG Neo 15 (i7-12700H, RTX 3080 Ti) | |
| MSI Raider GE66 12UHS | |
| SCHENKER XMG Pro 15 (i7-12700H, RTX 3080 Ti) | |
| Average Intel Core i7-12700H (1576 - 7407, n=63) | |
| Razer Blade 15 2022 | |
| SCHENKER XMG Pro 15 (Late 2021) | |
| Cinebench R20 / CPU (Single Core) | |
| MSI Raider GE66 12UHS | |
| SCHENKER XMG Pro 15 (i7-12700H, RTX 3080 Ti) | |
| Average of class Gaming (169 - 855, n=227, last 2 years) | |
| Razer Blade 15 2022 | |
| SCHENKER XMG Neo 15 (i7-12700H, RTX 3080 Ti) | |
| Average Intel Core i7-12700H (300 - 704, n=63) | |
| SCHENKER XMG Pro 15 (Late 2021) | |
| Cinebench R15 / CPU Multi 64Bit | |
| Average of class Gaming (400 - 5663, n=231, last 2 years) | |
| SCHENKER XMG Neo 15 (i7-12700H, RTX 3080 Ti) | |
| SCHENKER XMG Pro 15 (i7-12700H, RTX 3080 Ti) | |
| MSI Raider GE66 12UHS | |
| Average Intel Core i7-12700H (1379 - 2916, n=69) | |
| Razer Blade 15 2022 | |
| SCHENKER XMG Pro 15 (Late 2021) | |
| Cinebench R15 / CPU Single 64Bit | |
| Average of class Gaming (79.2 - 318, n=230, last 2 years) | |
| MSI Raider GE66 12UHS | |
| SCHENKER XMG Pro 15 (i7-12700H, RTX 3080 Ti) | |
| SCHENKER XMG Neo 15 (i7-12700H, RTX 3080 Ti) | |
| Razer Blade 15 2022 | |
| Average Intel Core i7-12700H (113 - 263, n=64) | |
| SCHENKER XMG Pro 15 (Late 2021) | |
| Blender / v2.79 BMW27 CPU | |
| SCHENKER XMG Pro 15 (Late 2021) | |
| Razer Blade 15 2022 | |
| Average Intel Core i7-12700H (168 - 732, n=62) | |
| Average of class Gaming (87 - 1259, n=225, last 2 years) | |
| SCHENKER XMG Pro 15 (i7-12700H, RTX 3080 Ti) | |
| MSI Raider GE66 12UHS | |
| SCHENKER XMG Neo 15 (i7-12700H, RTX 3080 Ti) | |
| 7-Zip 18.03 / 7z b 4 | |
| Average of class Gaming (11386 - 140932, n=226, last 2 years) | |
| SCHENKER XMG Neo 15 (i7-12700H, RTX 3080 Ti) | |
| MSI Raider GE66 12UHS | |
| SCHENKER XMG Pro 15 (i7-12700H, RTX 3080 Ti) | |
| Razer Blade 15 2022 | |
| Average Intel Core i7-12700H (22844 - 73067, n=62) | |
| SCHENKER XMG Pro 15 (Late 2021) | |
| 7-Zip 18.03 / 7z b 4 -mmt1 | |
| Average of class Gaming (2685 - 7581, n=226, last 2 years) | |
| MSI Raider GE66 12UHS | |
| SCHENKER XMG Neo 15 (i7-12700H, RTX 3080 Ti) | |
| SCHENKER XMG Pro 15 (i7-12700H, RTX 3080 Ti) | |
| Razer Blade 15 2022 | |
| Average Intel Core i7-12700H (2743 - 5972, n=62) | |
| SCHENKER XMG Pro 15 (Late 2021) | |
| Geekbench 5.5 / Multi-Core | |
| MSI Raider GE66 12UHS | |
| Average of class Gaming (1946 - 22200, n=231, last 2 years) | |
| SCHENKER XMG Neo 15 (i7-12700H, RTX 3080 Ti) | |
| Razer Blade 15 2022 | |
| SCHENKER XMG Pro 15 (i7-12700H, RTX 3080 Ti) | |
| Average Intel Core i7-12700H (5144 - 13745, n=63) | |
| SCHENKER XMG Pro 15 (Late 2021) | |
| Geekbench 5.5 / Single-Core | |
| MSI Raider GE66 12UHS | |
| Average of class Gaming (158 - 2193, n=231, last 2 years) | |
| SCHENKER XMG Pro 15 (i7-12700H, RTX 3080 Ti) | |
| Razer Blade 15 2022 | |
| SCHENKER XMG Neo 15 (i7-12700H, RTX 3080 Ti) | |
| Average Intel Core i7-12700H (803 - 1851, n=63) | |
| SCHENKER XMG Pro 15 (Late 2021) | |
| HWBOT x265 Benchmark v2.2 / 4k Preset | |
| Average of class Gaming (3 - 37.6, n=229, last 2 years) | |
| SCHENKER XMG Neo 15 (i7-12700H, RTX 3080 Ti) | |
| MSI Raider GE66 12UHS | |
| SCHENKER XMG Pro 15 (i7-12700H, RTX 3080 Ti) | |
| Razer Blade 15 2022 | |
| Average Intel Core i7-12700H (4.67 - 21.8, n=63) | |
| SCHENKER XMG Pro 15 (Late 2021) | |
| LibreOffice / 20 Documents To PDF | |
| Razer Blade 15 2022 | |
| Average of class Gaming (32.8 - 332, n=223, last 2 years) | |
| SCHENKER XMG Pro 15 (i7-12700H, RTX 3080 Ti) | |
| SCHENKER XMG Pro 15 (Late 2021) | |
| SCHENKER XMG Neo 15 (i7-12700H, RTX 3080 Ti) | |
| Average Intel Core i7-12700H (34.2 - 95.3, n=62) | |
| MSI Raider GE66 12UHS | |
| R Benchmark 2.5 / Overall mean | |
| SCHENKER XMG Pro 15 (Late 2021) | |
| Average Intel Core i7-12700H (0.4441 - 1.052, n=62) | |
| Razer Blade 15 2022 | |
| Average of class Gaming (0.3609 - 4.47, n=226, last 2 years) | |
| SCHENKER XMG Neo 15 (i7-12700H, RTX 3080 Ti) | |
| SCHENKER XMG Pro 15 (i7-12700H, RTX 3080 Ti) | |
| MSI Raider GE66 12UHS | |
* ... smaller is better
AIDA64: FP32 Ray-Trace | FPU Julia | CPU SHA3 | CPU Queen | FPU SinJulia | FPU Mandel | CPU AES | CPU ZLib | FP64 Ray-Trace | CPU PhotoWorxx
| Performance Rating | |
| Average of class Gaming | |
| SCHENKER XMG Pro 15 (Late 2021) | |
| Average Intel Core i7-12700H | |
| SCHENKER XMG Neo 15 (i7-12700H, RTX 3080 Ti) | |
| MSI Raider GE66 12UHS | |
| SCHENKER XMG Pro 15 (i7-12700H, RTX 3080 Ti) | |
| Razer Blade 15 2022 | |
| AIDA64 / FP32 Ray-Trace | |
| Average of class Gaming (3069 - 60169, n=222, last 2 years) | |
| SCHENKER XMG Pro 15 (Late 2021) | |
| Average Intel Core i7-12700H (2585 - 17957, n=62) | |
| SCHENKER XMG Neo 15 (i7-12700H, RTX 3080 Ti) | |
| SCHENKER XMG Pro 15 (i7-12700H, RTX 3080 Ti) | |
| MSI Raider GE66 12UHS | |
| Razer Blade 15 2022 | |
| AIDA64 / FPU Julia | |
| Average of class Gaming (18567 - 252486, n=222, last 2 years) | |
| SCHENKER XMG Pro 15 (Late 2021) | |
| Average Intel Core i7-12700H (12439 - 90760, n=62) | |
| SCHENKER XMG Neo 15 (i7-12700H, RTX 3080 Ti) | |
| SCHENKER XMG Pro 15 (i7-12700H, RTX 3080 Ti) | |
| MSI Raider GE66 12UHS | |
| Razer Blade 15 2022 | |
| AIDA64 / CPU SHA3 | |
| SCHENKER XMG Pro 15 (Late 2021) | |
| Average of class Gaming (629 - 10389, n=222, last 2 years) | |
| SCHENKER XMG Neo 15 (i7-12700H, RTX 3080 Ti) | |
| Average Intel Core i7-12700H (833 - 4242, n=62) | |
| MSI Raider GE66 12UHS | |
| SCHENKER XMG Pro 15 (i7-12700H, RTX 3080 Ti) | |
| Razer Blade 15 2022 | |
| AIDA64 / CPU Queen | |
| Average of class Gaming (15371 - 200651, n=222, last 2 years) | |
| MSI Raider GE66 12UHS | |
| SCHENKER XMG Pro 15 (i7-12700H, RTX 3080 Ti) | |
| SCHENKER XMG Neo 15 (i7-12700H, RTX 3080 Ti) | |
| Average Intel Core i7-12700H (57923 - 103202, n=62) | |
| Razer Blade 15 2022 | |
| SCHENKER XMG Pro 15 (Late 2021) | |
| AIDA64 / FPU SinJulia | |
| Average of class Gaming (2137 - 32988, n=222, last 2 years) | |
| SCHENKER XMG Neo 15 (i7-12700H, RTX 3080 Ti) | |
| SCHENKER XMG Pro 15 (Late 2021) | |
| SCHENKER XMG Pro 15 (i7-12700H, RTX 3080 Ti) | |
| MSI Raider GE66 12UHS | |
| Razer Blade 15 2022 | |
| Average Intel Core i7-12700H (3249 - 9939, n=62) | |
| AIDA64 / FPU Mandel | |
| Average of class Gaming (10291 - 134044, n=222, last 2 years) | |
| SCHENKER XMG Pro 15 (Late 2021) | |
| Average Intel Core i7-12700H (7135 - 44760, n=62) | |
| SCHENKER XMG Neo 15 (i7-12700H, RTX 3080 Ti) | |
| SCHENKER XMG Pro 15 (i7-12700H, RTX 3080 Ti) | |
| MSI Raider GE66 12UHS | |
| Razer Blade 15 2022 | |
| AIDA64 / CPU AES | |
| SCHENKER XMG Pro 15 (Late 2021) | |
| Average of class Gaming (19065 - 328679, n=222, last 2 years) | |
| MSI Raider GE66 12UHS | |
| Average Intel Core i7-12700H (31839 - 144360, n=62) | |
| SCHENKER XMG Neo 15 (i7-12700H, RTX 3080 Ti) | |
| SCHENKER XMG Pro 15 (i7-12700H, RTX 3080 Ti) | |
| Razer Blade 15 2022 | |
| AIDA64 / CPU ZLib | |
| Average of class Gaming (150.9 - 2409, n=222, last 2 years) | |
| SCHENKER XMG Neo 15 (i7-12700H, RTX 3080 Ti) | |
| SCHENKER XMG Pro 15 (i7-12700H, RTX 3080 Ti) | |
| MSI Raider GE66 12UHS | |
| Average Intel Core i7-12700H (305 - 1171, n=62) | |
| Razer Blade 15 2022 | |
| SCHENKER XMG Pro 15 (Late 2021) | |
| AIDA64 / FP64 Ray-Trace | |
| Average of class Gaming (1518 - 31796, n=222, last 2 years) | |
| SCHENKER XMG Pro 15 (Late 2021) | |
| Average Intel Core i7-12700H (1437 - 9692, n=62) | |
| SCHENKER XMG Neo 15 (i7-12700H, RTX 3080 Ti) | |
| SCHENKER XMG Pro 15 (i7-12700H, RTX 3080 Ti) | |
| MSI Raider GE66 12UHS | |
| Razer Blade 15 2022 | |
| AIDA64 / CPU PhotoWorxx | |
| Razer Blade 15 2022 | |
| MSI Raider GE66 12UHS | |
| SCHENKER XMG Neo 15 (i7-12700H, RTX 3080 Ti) | |
| Average of class Gaming (10805 - 60161, n=223, last 2 years) | |
| Average Intel Core i7-12700H (12863 - 52207, n=62) | |
| SCHENKER XMG Pro 15 (i7-12700H, RTX 3080 Ti) | |
| SCHENKER XMG Pro 15 (Late 2021) | |
System Performance
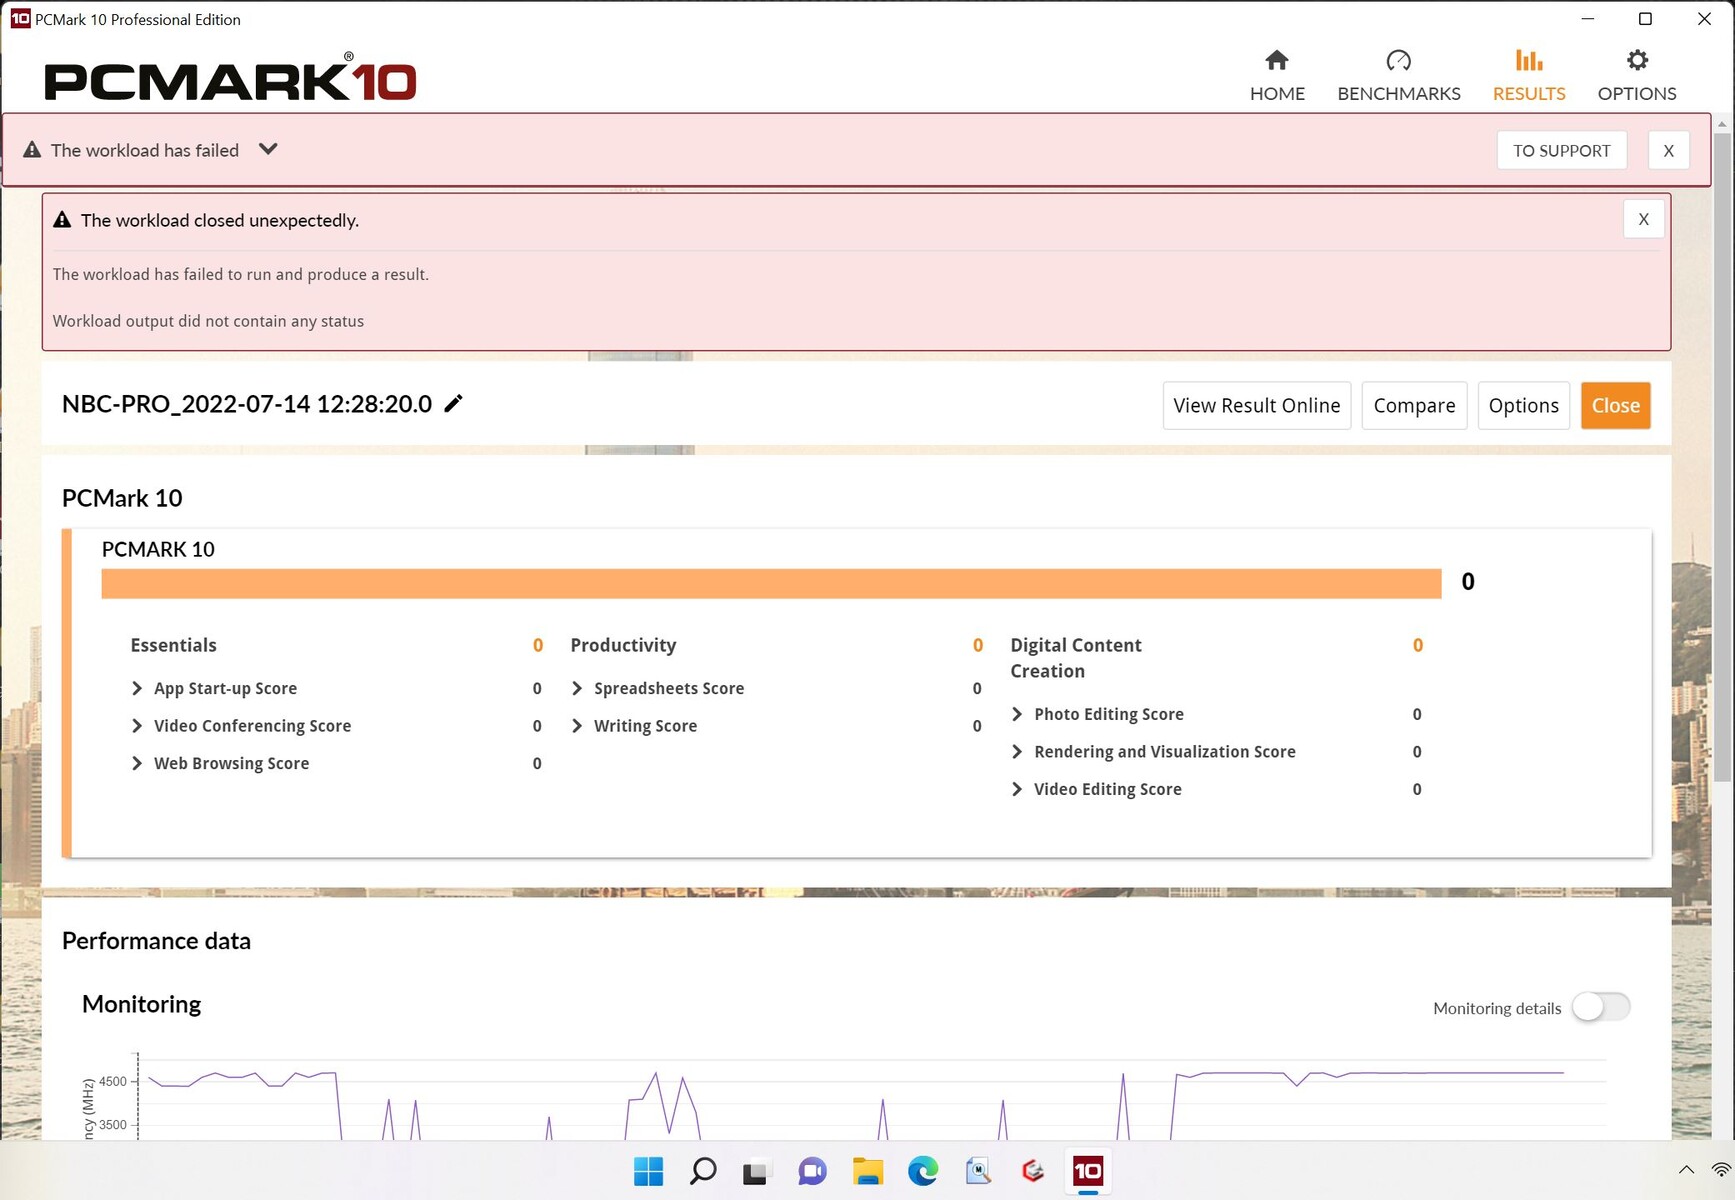
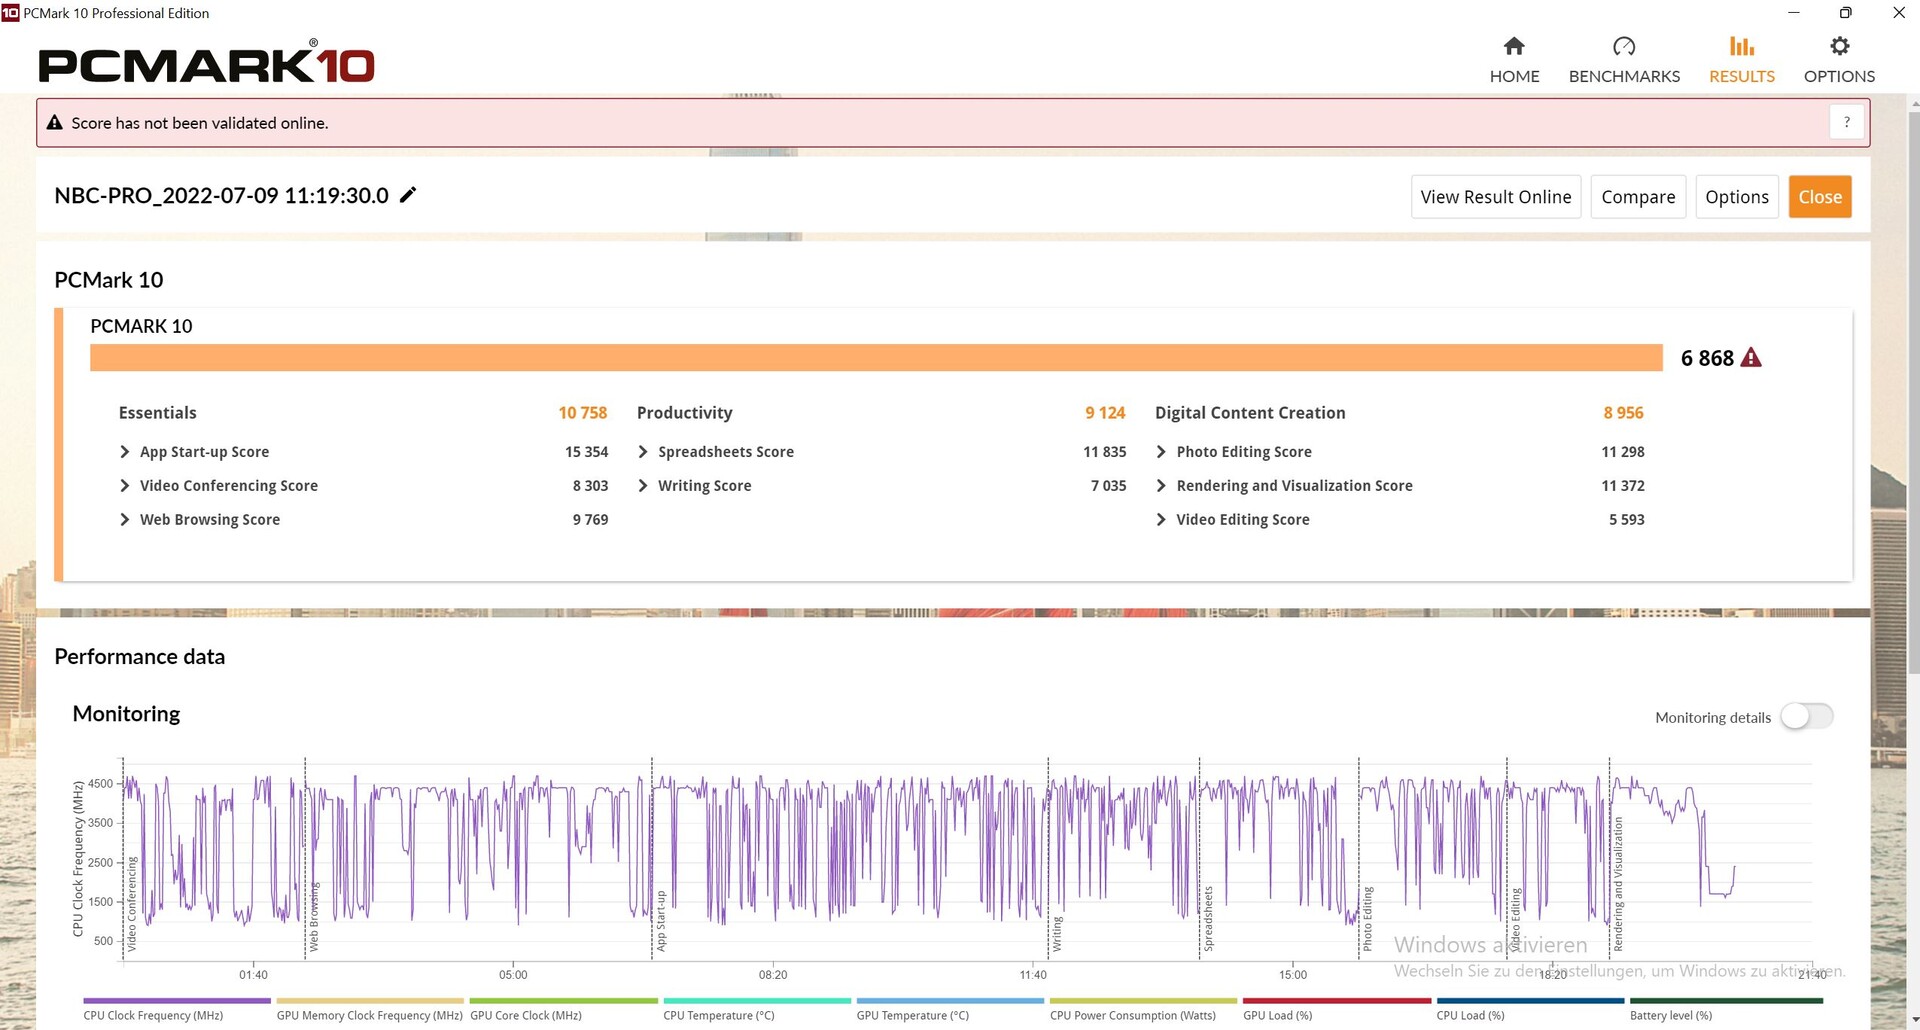
In PCMark 10, the benchmark values are roughly on par with the expected level, but performance falls sharply in the area of content creation.
CrossMark: Overall | Productivity | Creativity | Responsiveness
| PCMark 10 / Score | |
| MSI Raider GE66 12UHS | |
| Razer Blade 15 2022 | |
| SCHENKER XMG Neo 15 (i7-12700H, RTX 3080 Ti) | |
| Average of class Gaming (5235 - 9852, n=197, last 2 years) | |
| Average Intel Core i7-12700H, NVIDIA GeForce RTX 3080 Ti Laptop GPU (6868 - 7638, n=7) | |
| SCHENKER XMG Pro 15 (i7-12700H, RTX 3080 Ti) | |
| SCHENKER XMG Pro 15 (Late 2021) | |
| PCMark 10 / Essentials | |
| MSI Raider GE66 12UHS | |
| SCHENKER XMG Pro 15 (i7-12700H, RTX 3080 Ti) | |
| Razer Blade 15 2022 | |
| Average of class Gaming (8300 - 12334, n=196, last 2 years) | |
| SCHENKER XMG Neo 15 (i7-12700H, RTX 3080 Ti) | |
| Average Intel Core i7-12700H, NVIDIA GeForce RTX 3080 Ti Laptop GPU (9987 - 11318, n=7) | |
| SCHENKER XMG Pro 15 (Late 2021) | |
| PCMark 10 / Productivity | |
| MSI Raider GE66 12UHS | |
| Average of class Gaming (7244 - 11833, n=196, last 2 years) | |
| Razer Blade 15 2022 | |
| Average Intel Core i7-12700H, NVIDIA GeForce RTX 3080 Ti Laptop GPU (8944 - 10726, n=7) | |
| SCHENKER XMG Pro 15 (i7-12700H, RTX 3080 Ti) | |
| SCHENKER XMG Neo 15 (i7-12700H, RTX 3080 Ti) | |
| SCHENKER XMG Pro 15 (Late 2021) | |
| PCMark 10 / Digital Content Creation | |
| MSI Raider GE66 12UHS | |
| SCHENKER XMG Neo 15 (i7-12700H, RTX 3080 Ti) | |
| Razer Blade 15 2022 | |
| Average of class Gaming (6462 - 18475, n=196, last 2 years) | |
| Average Intel Core i7-12700H, NVIDIA GeForce RTX 3080 Ti Laptop GPU (8956 - 12249, n=7) | |
| SCHENKER XMG Pro 15 (Late 2021) | |
| SCHENKER XMG Pro 15 (i7-12700H, RTX 3080 Ti) | |
| CrossMark / Overall | |
| Average of class Gaming (1247 - 2334, n=167, last 2 years) | |
| Average Intel Core i7-12700H, NVIDIA GeForce RTX 3080 Ti Laptop GPU (1761 - 1861, n=4) | |
| SCHENKER XMG Neo 15 (i7-12700H, RTX 3080 Ti) | |
| SCHENKER XMG Pro 15 (Late 2021) | |
| CrossMark / Productivity | |
| Average of class Gaming (1299 - 2204, n=167, last 2 years) | |
| Average Intel Core i7-12700H, NVIDIA GeForce RTX 3080 Ti Laptop GPU (1645 - 1800, n=4) | |
| SCHENKER XMG Neo 15 (i7-12700H, RTX 3080 Ti) | |
| SCHENKER XMG Pro 15 (Late 2021) | |
| CrossMark / Creativity | |
| SCHENKER XMG Neo 15 (i7-12700H, RTX 3080 Ti) | |
| Average of class Gaming (1275 - 2514, n=167, last 2 years) | |
| Average Intel Core i7-12700H, NVIDIA GeForce RTX 3080 Ti Laptop GPU (1936 - 2041, n=4) | |
| SCHENKER XMG Pro 15 (Late 2021) | |
| CrossMark / Responsiveness | |
| Average of class Gaming (1030 - 2330, n=167, last 2 years) | |
| Average Intel Core i7-12700H, NVIDIA GeForce RTX 3080 Ti Laptop GPU (1461 - 1868, n=4) | |
| SCHENKER XMG Pro 15 (Late 2021) | |
| SCHENKER XMG Neo 15 (i7-12700H, RTX 3080 Ti) | |
| PCMark 10 Score | 6868 points | |
Help | ||
| AIDA64 / Memory Copy | |
| MSI Raider GE66 12UHS | |
| SCHENKER XMG Neo 15 (i7-12700H, RTX 3080 Ti) | |
| Razer Blade 15 2022 | |
| Average of class Gaming (21842 - 92565, n=222, last 2 years) | |
| Average Intel Core i7-12700H (25615 - 80511, n=62) | |
| SCHENKER XMG Pro 15 (Late 2021) | |
| SCHENKER XMG Pro 15 (i7-12700H, RTX 3080 Ti) | |
| AIDA64 / Memory Read | |
| MSI Raider GE66 12UHS | |
| SCHENKER XMG Neo 15 (i7-12700H, RTX 3080 Ti) | |
| Razer Blade 15 2022 | |
| Average of class Gaming (24879 - 90647, n=222, last 2 years) | |
| Average Intel Core i7-12700H (25586 - 79442, n=62) | |
| SCHENKER XMG Pro 15 (Late 2021) | |
| SCHENKER XMG Pro 15 (i7-12700H, RTX 3080 Ti) | |
| AIDA64 / Memory Write | |
| Razer Blade 15 2022 | |
| SCHENKER XMG Neo 15 (i7-12700H, RTX 3080 Ti) | |
| MSI Raider GE66 12UHS | |
| Average of class Gaming (21619 - 103259, n=222, last 2 years) | |
| Average Intel Core i7-12700H (23679 - 88660, n=62) | |
| SCHENKER XMG Pro 15 (Late 2021) | |
| SCHENKER XMG Pro 15 (i7-12700H, RTX 3080 Ti) | |
| AIDA64 / Memory Latency | |
| MSI Raider GE66 12UHS | |
| SCHENKER XMG Pro 15 (Late 2021) | |
| Average of class Gaming (59.5 - 152.5, n=219, last 2 years) | |
| Average Intel Core i7-12700H (76.2 - 133.9, n=60) | |
| Razer Blade 15 2022 | |
* ... smaller is better
DPC Latency
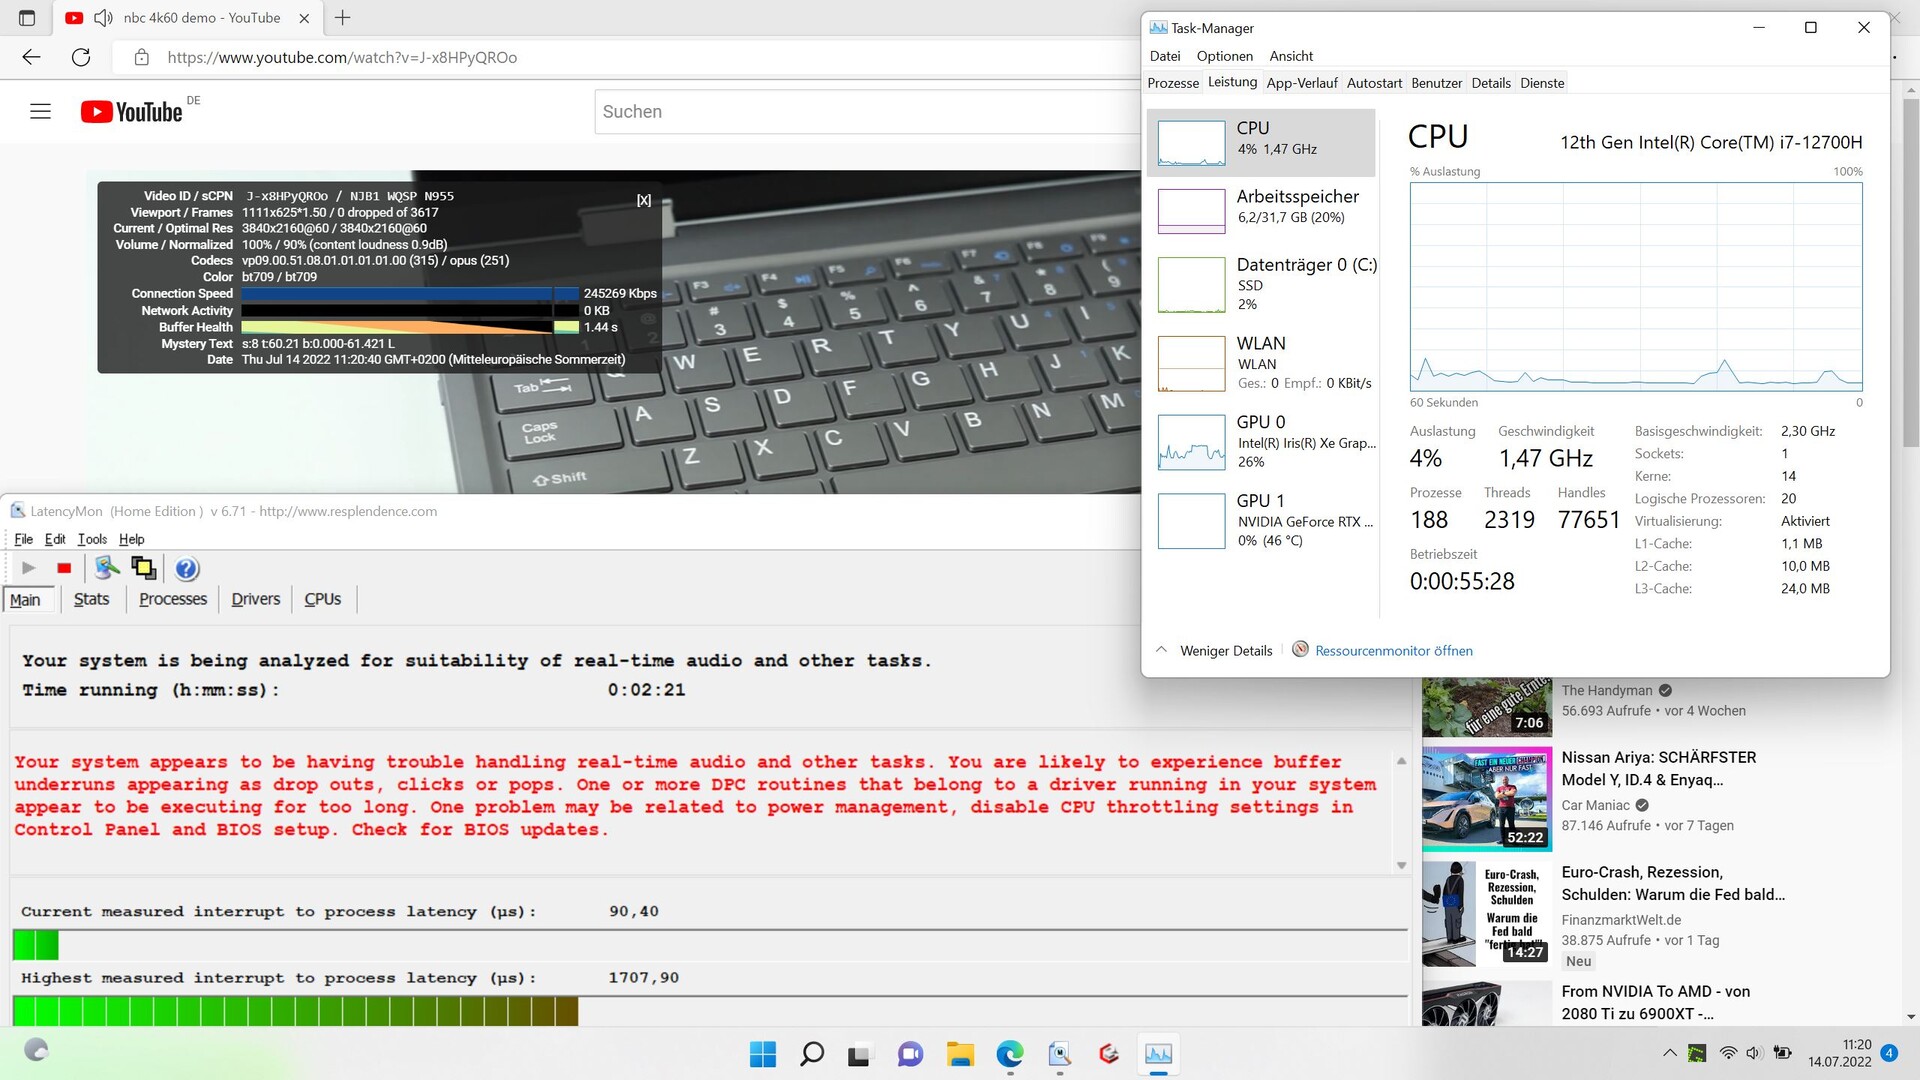
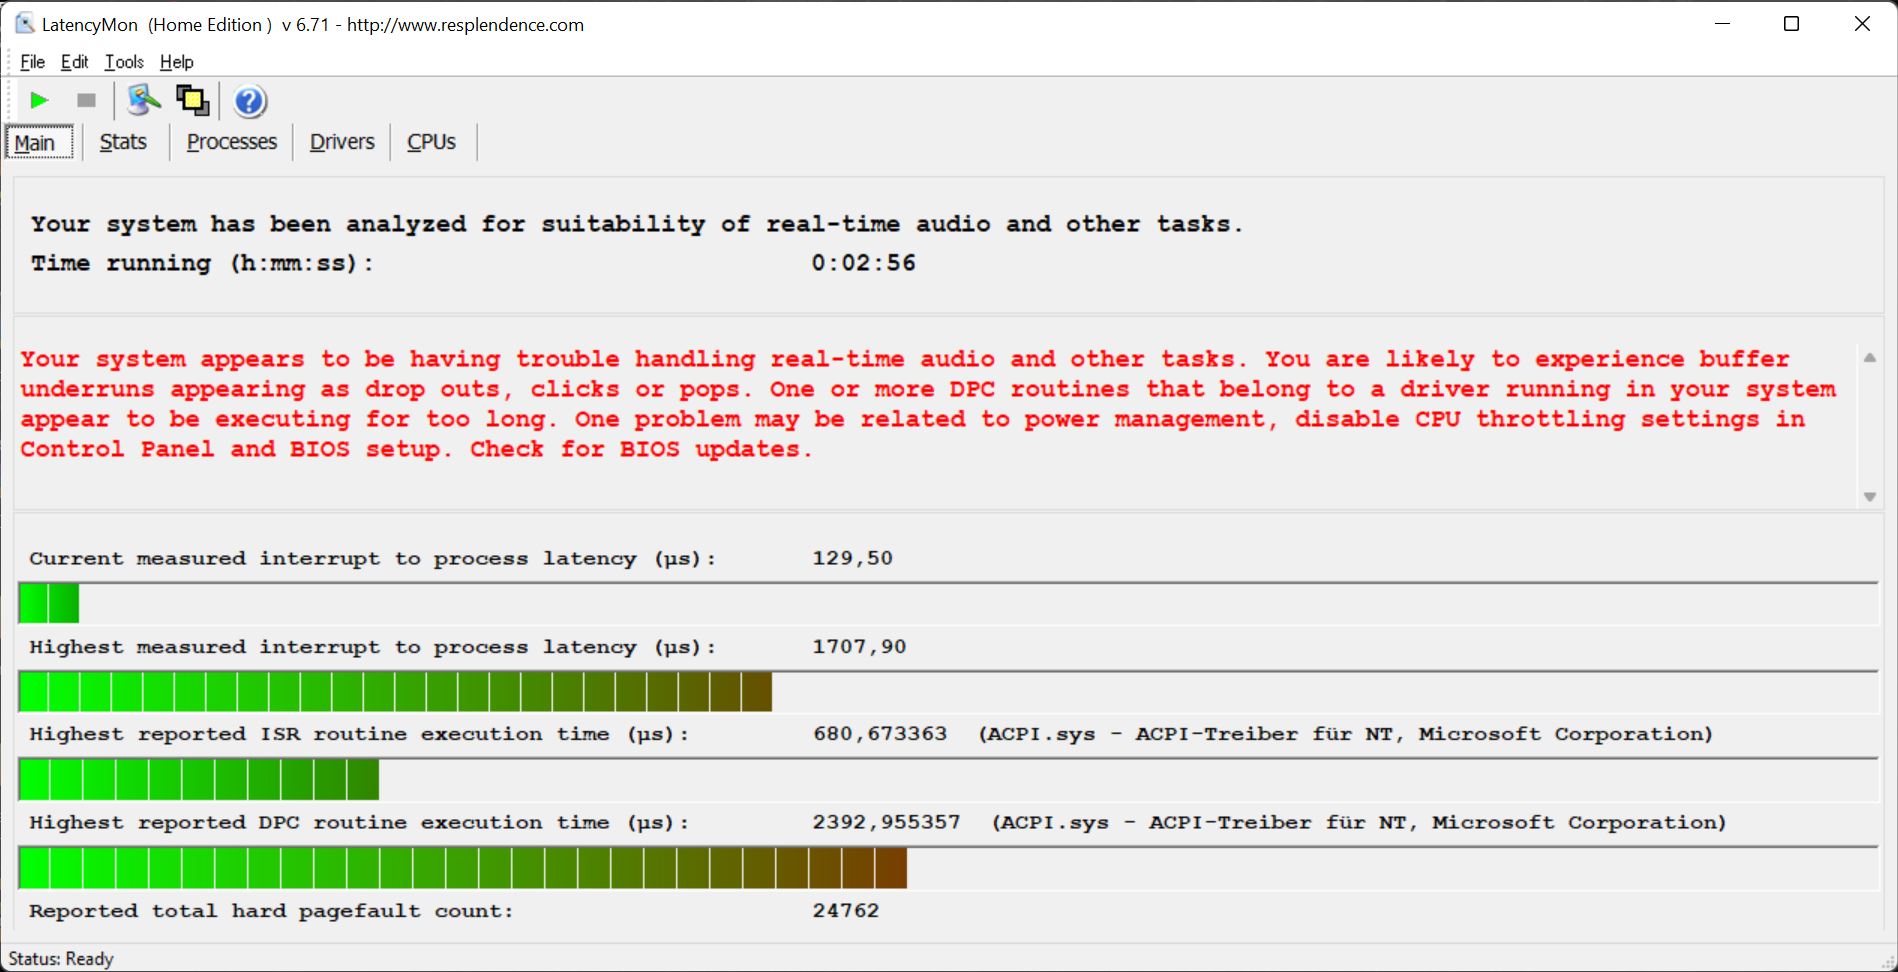
Browser opening did not cause any problems, but there were issues when loading our website. The determined latency increased when opening multiple tabs and when playing our 4K/60 fps YouTube video. At the very least, the video ran without dropped frames, but the latency is still relatively quite high.
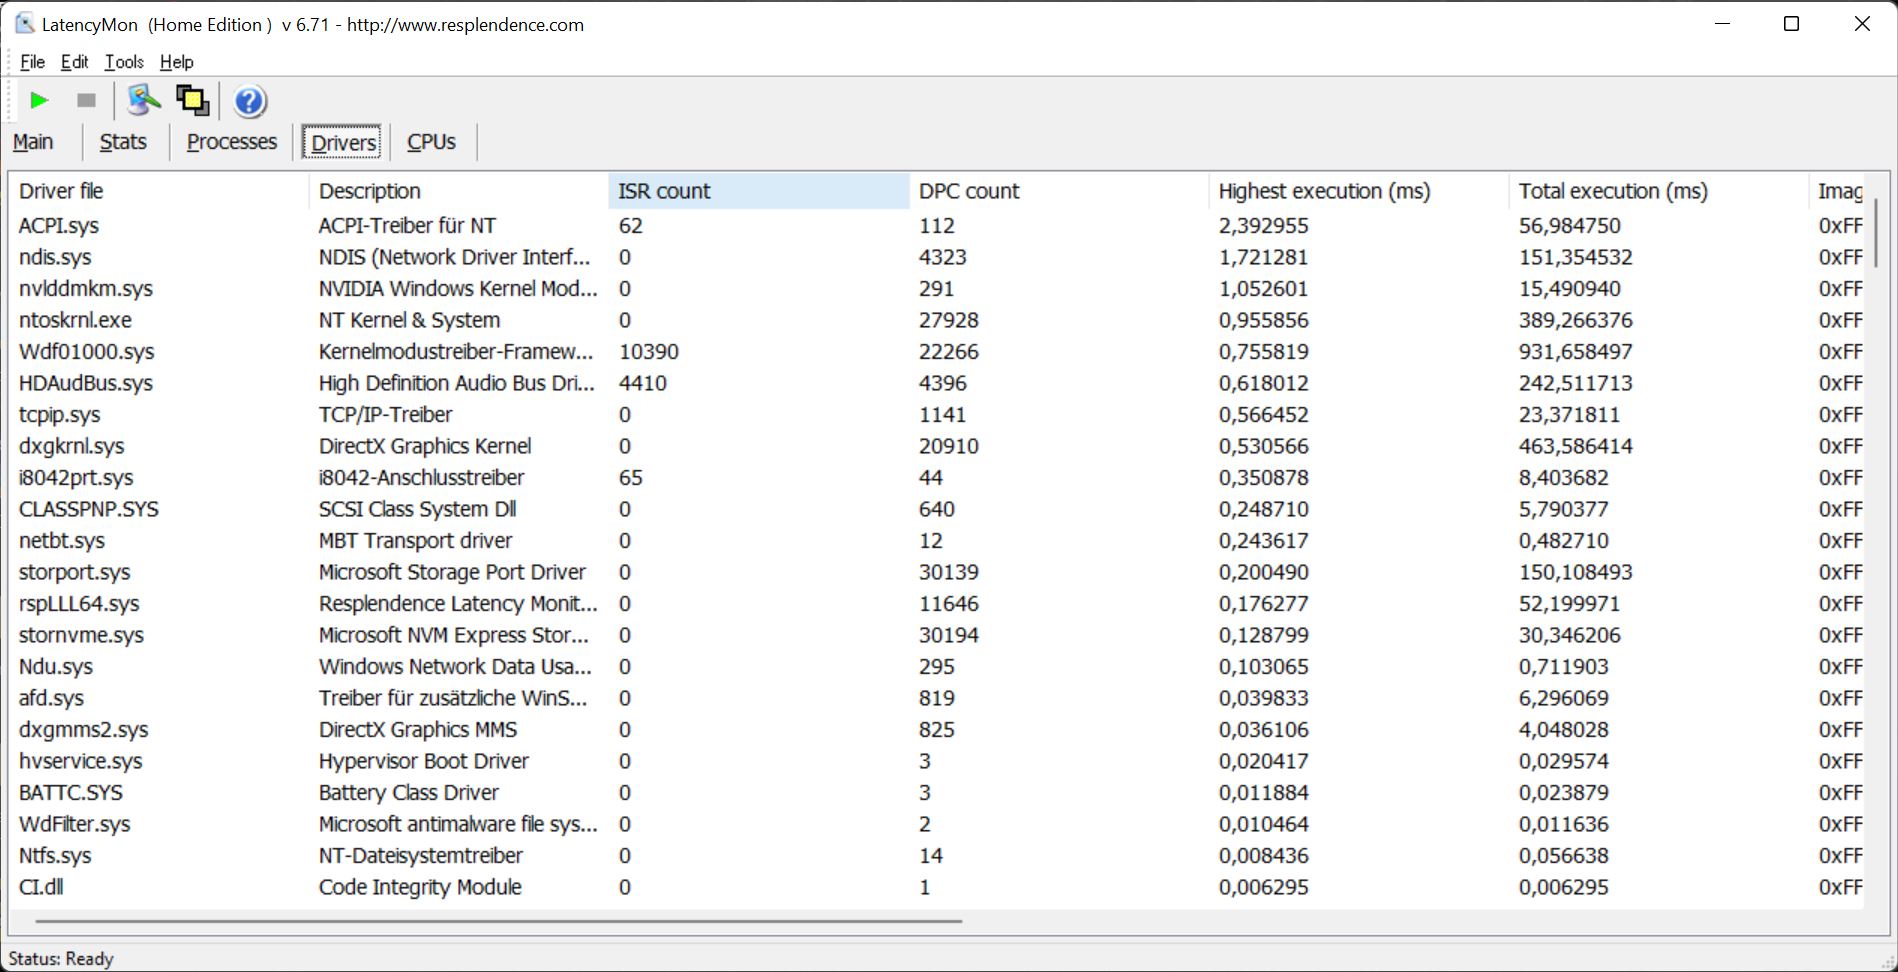
| DPC Latencies / LatencyMon - interrupt to process latency (max), Web, Youtube, Prime95 | |
| MSI Raider GE66 12UHS | |
| SCHENKER XMG Neo 15 (i7-12700H, RTX 3080 Ti) | |
| SCHENKER XMG Pro 15 (i7-12700H, RTX 3080 Ti) | |
| Razer Blade 15 2022 | |
| SCHENKER XMG Pro 15 (Late 2021) | |
* ... smaller is better
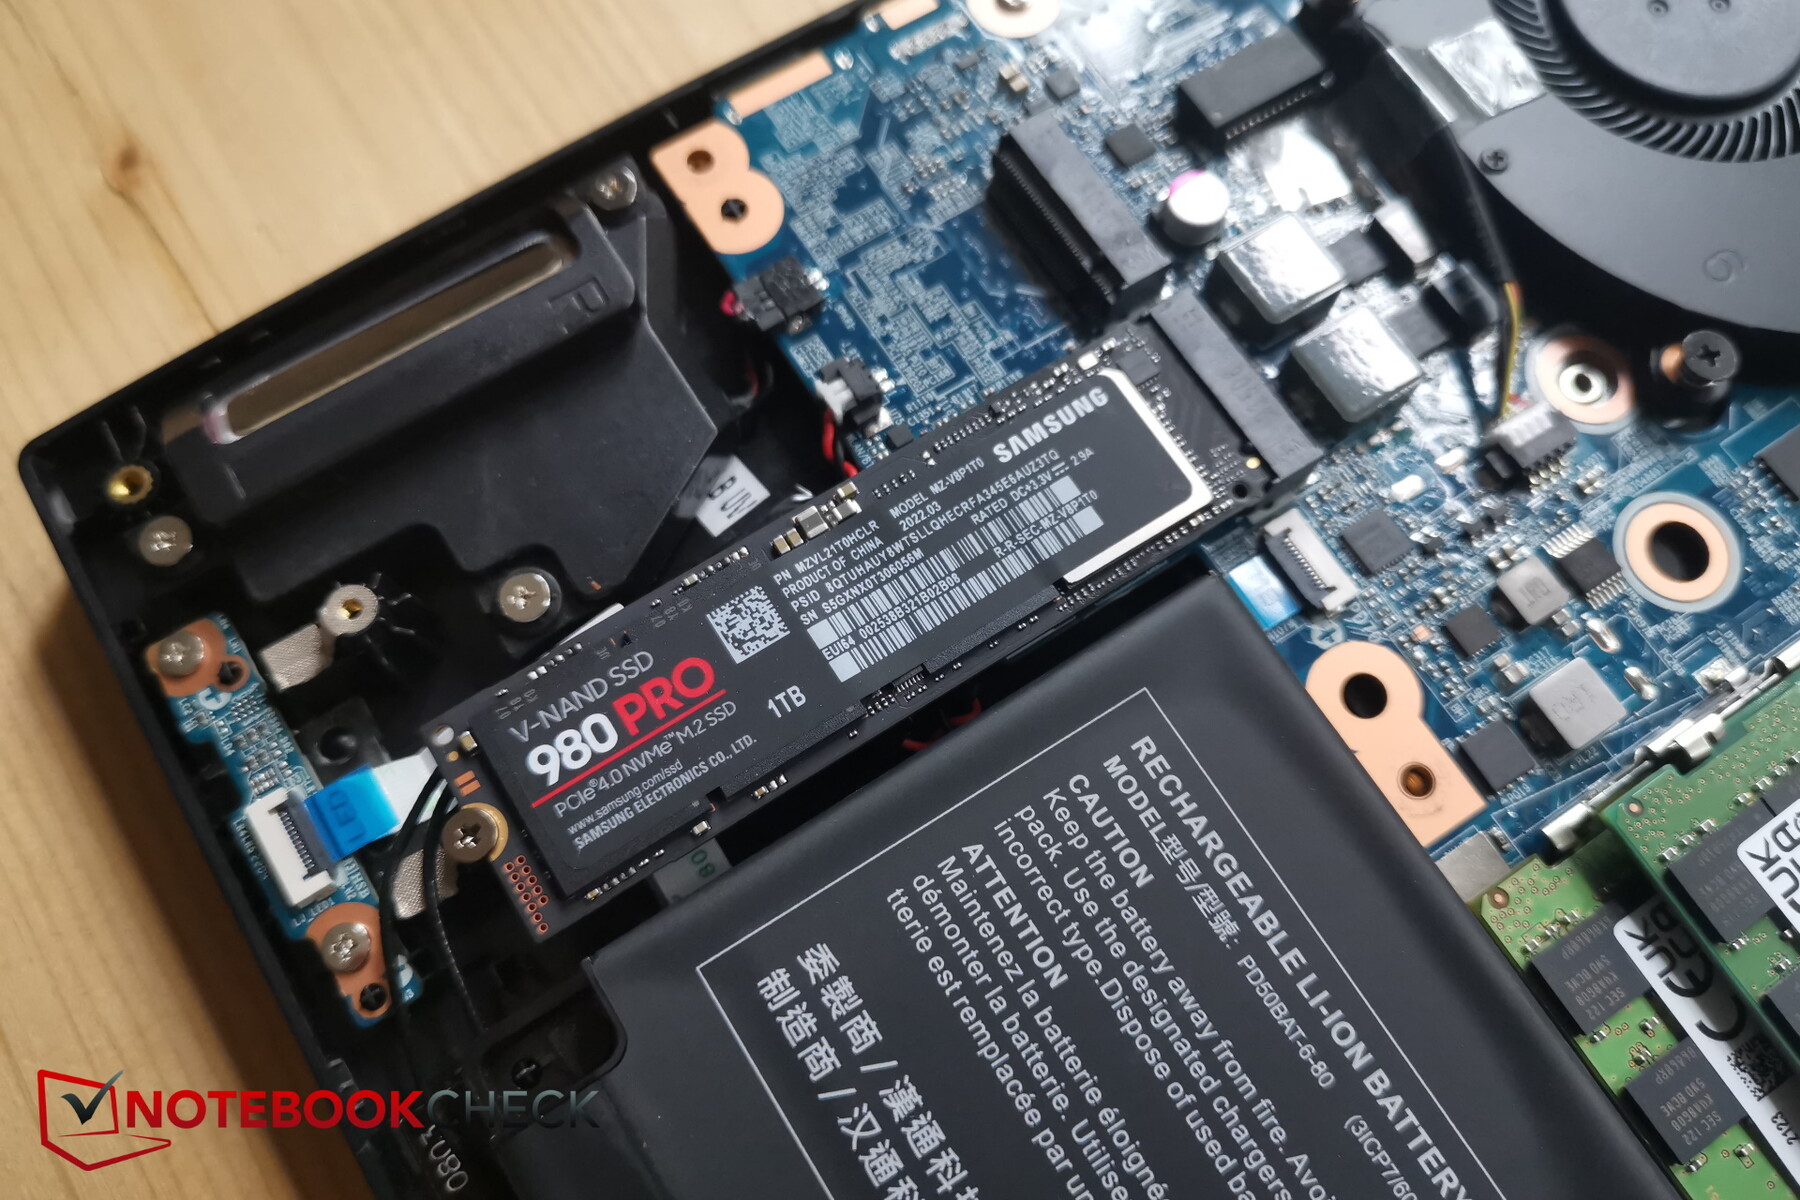
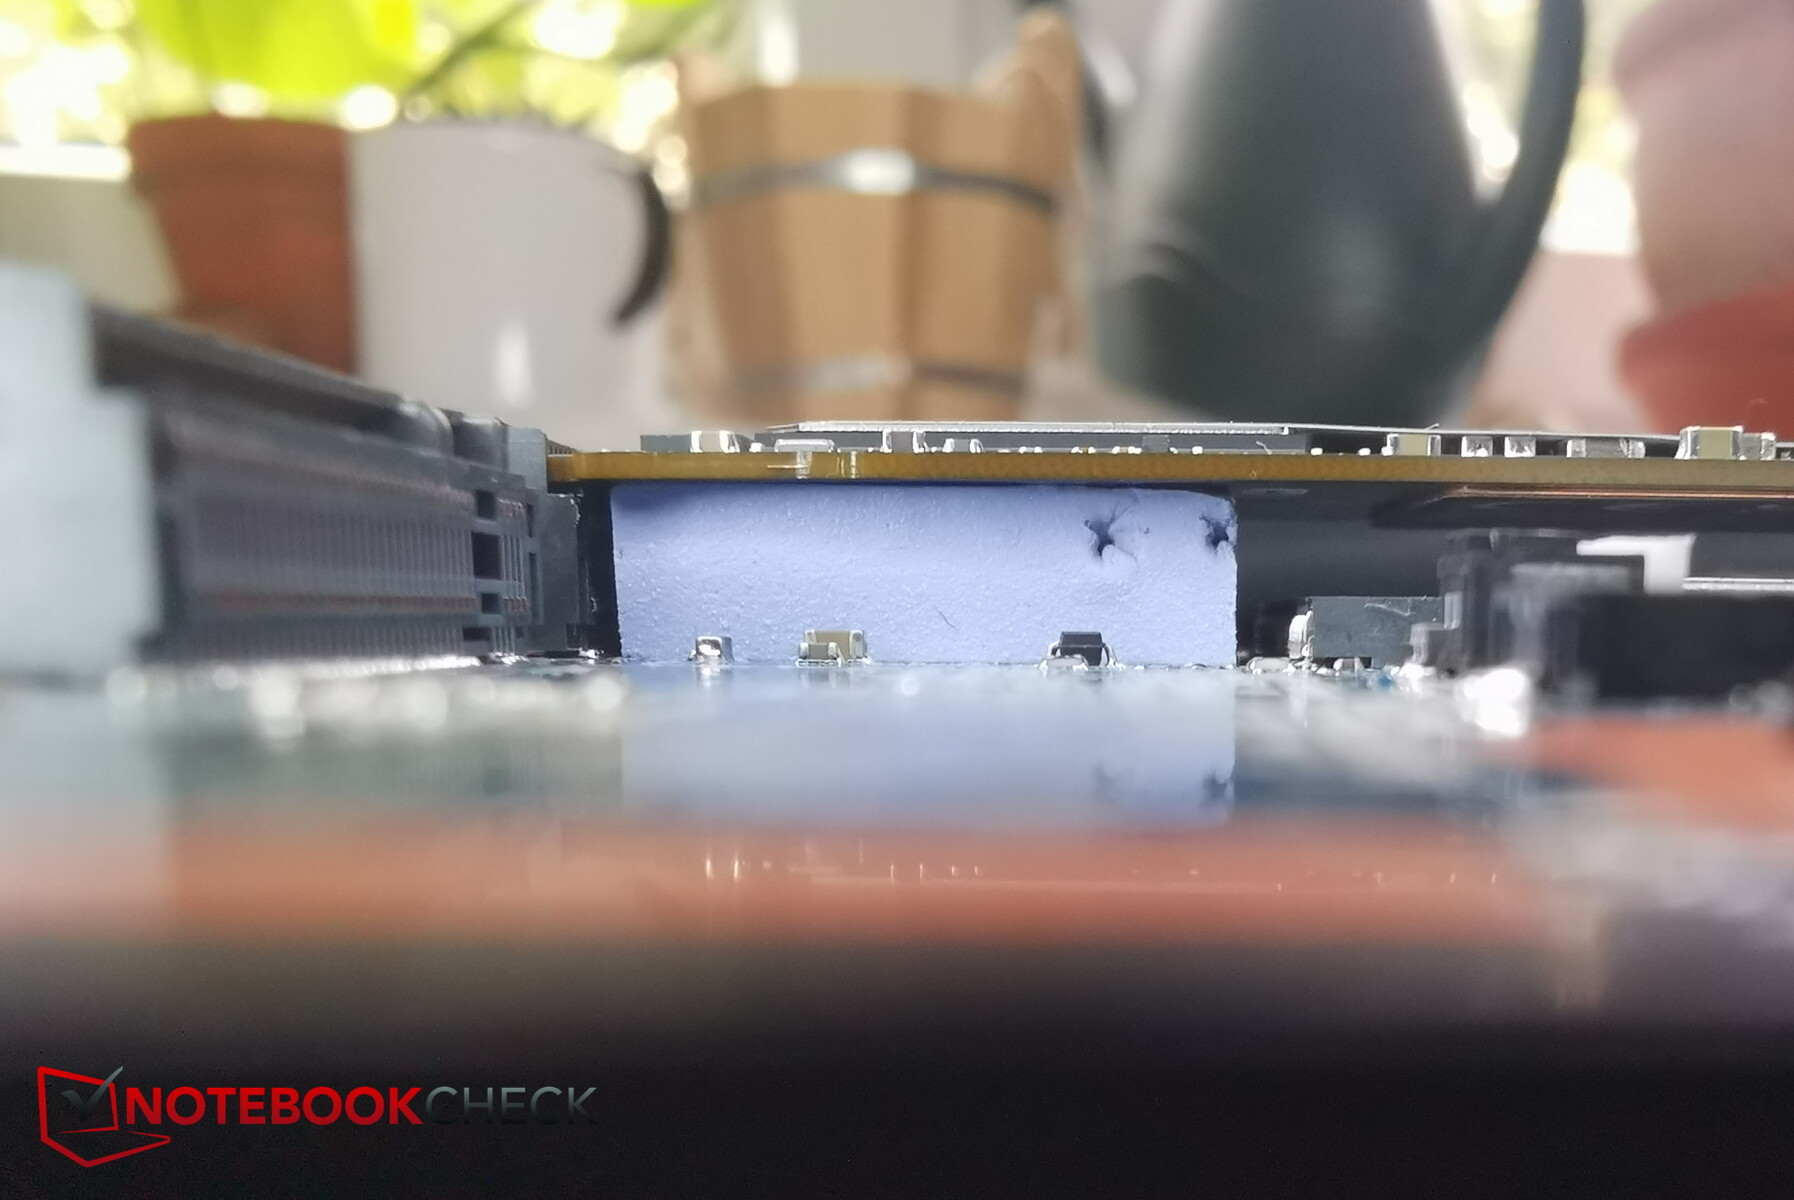
Storage Devices
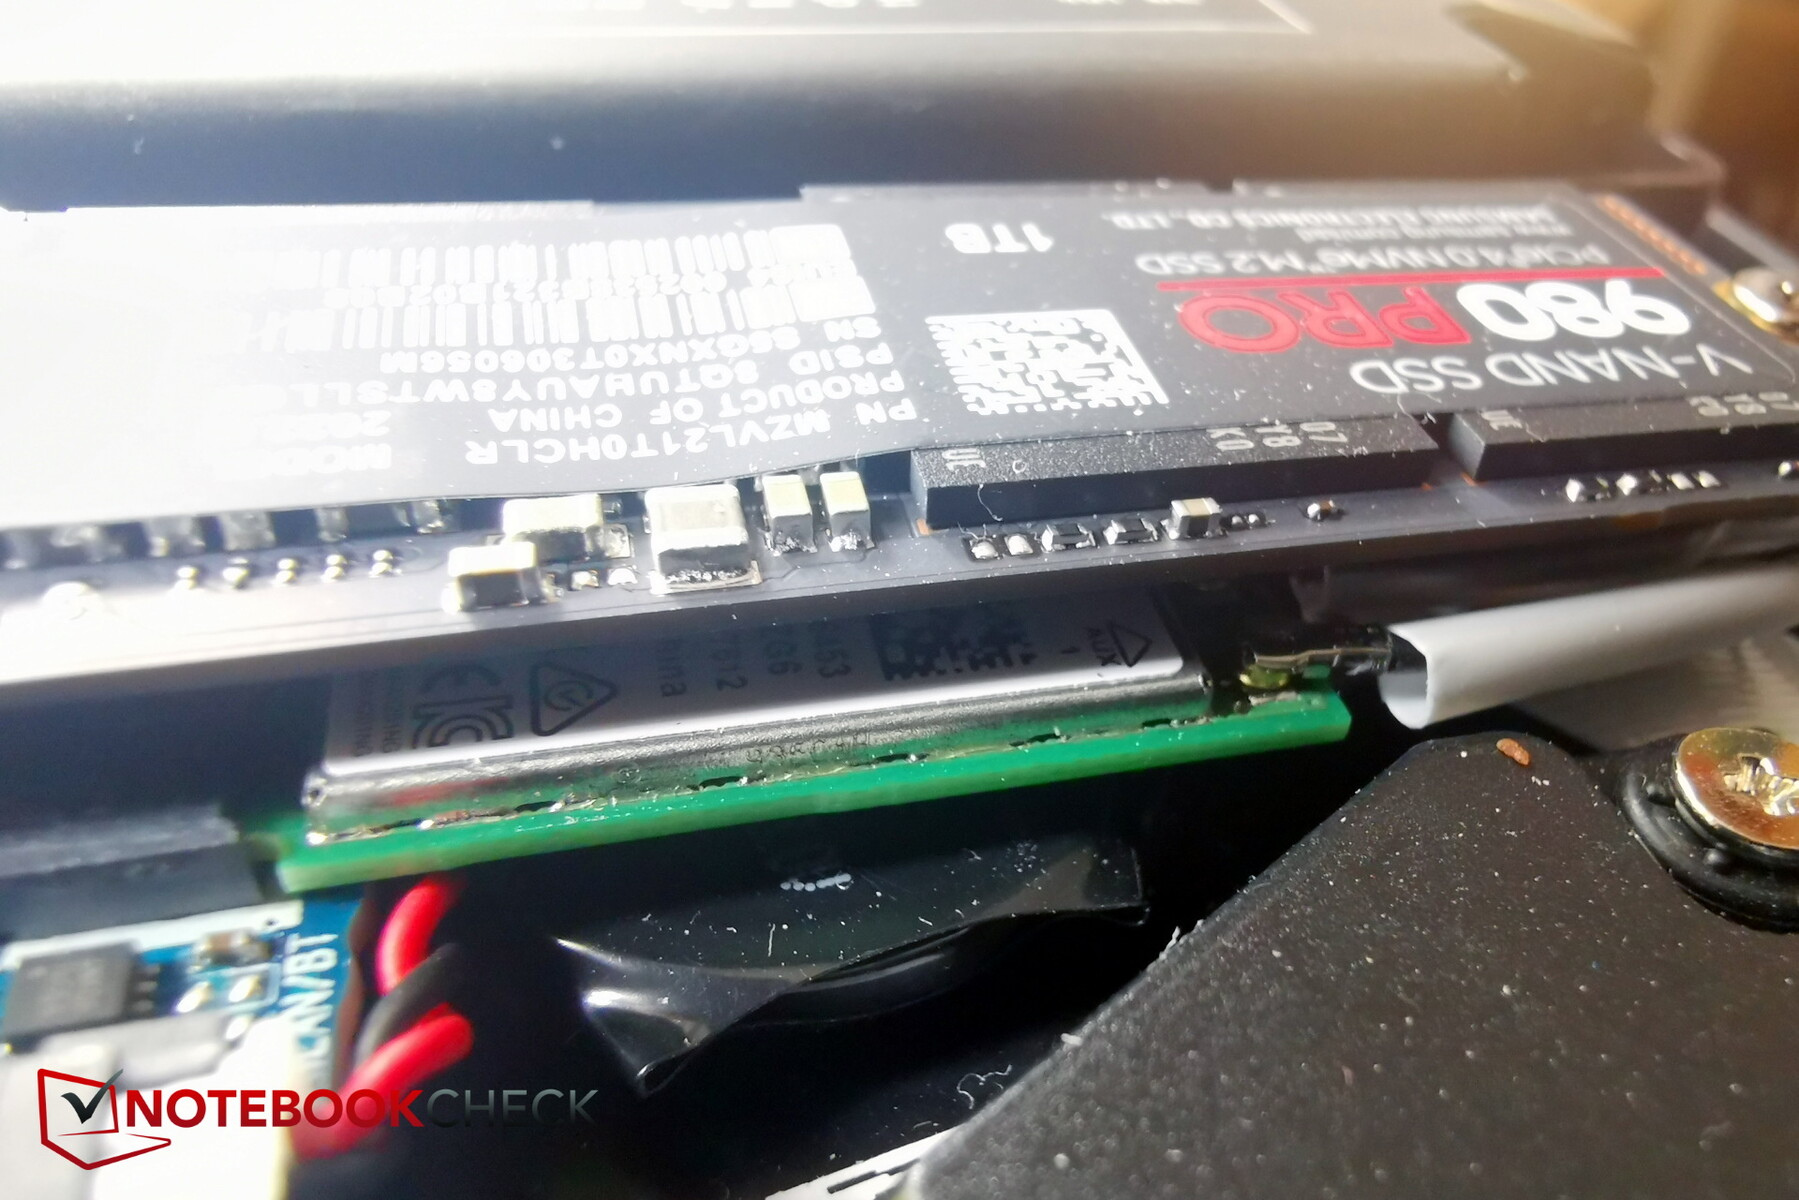
The installed Samsung SSD 980 Pro with 1 TB and PCIe 4.0 ranks 11th in our SSD/HDD best list. It is also quite fast in the Pro 15, but the sustained performance is not constant, which means the performance can be significantly lower. This may indicate a possible cooling problem here, which could also explain the low PCMark10 score.
Right next to the Samsung SSD is another M.2 slot for a secondary storage drive.
Upon enquiry, the manufacturer stated that the review sample was issued by XMG before the internal release of the model series and is said to have an incorrect cooling pad that is not used in the series model. Apparently, however, there is nothing unusual about the cooling pad. The XMG Pro 17 also shows a decrease in the long-term performance of the SSD under testing.

* ... smaller is better
Sustained Performance Read: DiskSpd Read Loop, Queue Depth 8
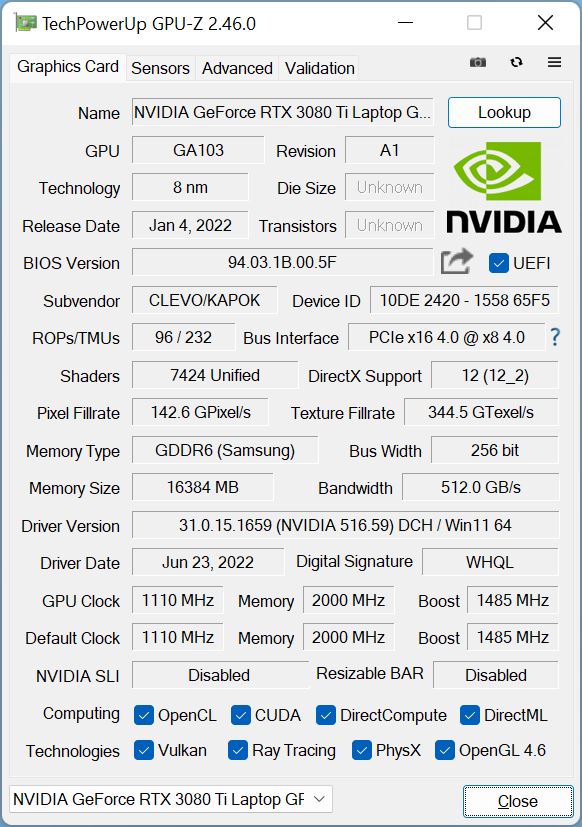
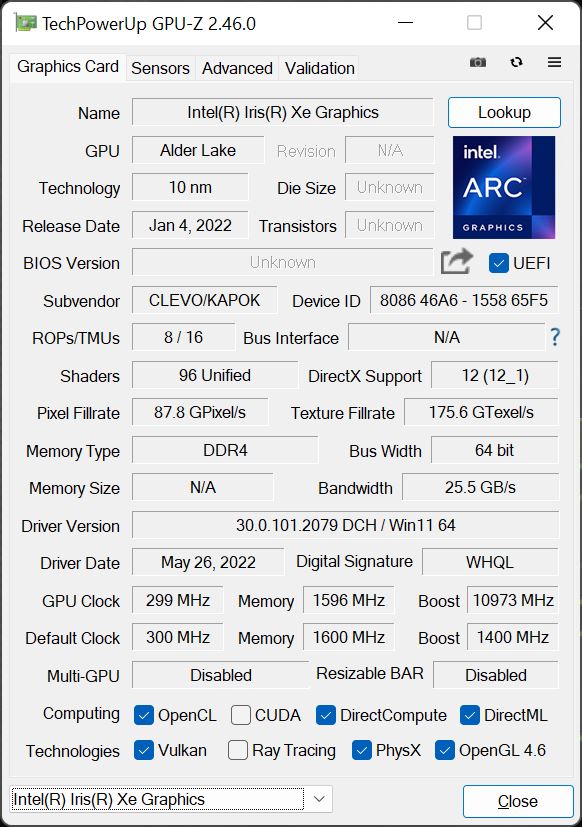
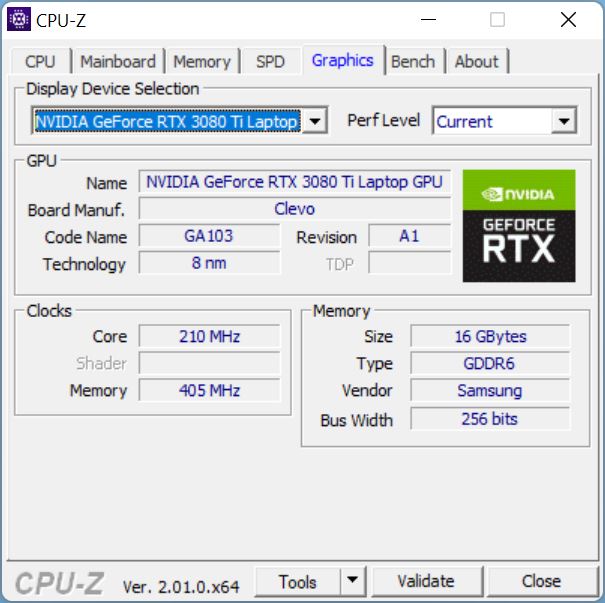
Graphics Card
The Nvidia Geforce RTX 3080 Ti is currently the most powerful laptop graphics card available. However, its performance strongly depends on the TGP set by the manufacturer. In the case of the Pro 15, the GPU is allowed up to 155 W (including Dynamic Boost). According to Nvidia, up to 175 W is possible. Nevertheless, 3D performance should be very high in all applications.
Only the MSI Raider is faster in 3DMark 11, and the Neo 15 sometimes overtakes the Pro 15 in the other 3DMarks, but the differences are rather small.
In Battery mode, 3D performance drops by a whopping 86% in another Time Spy run!
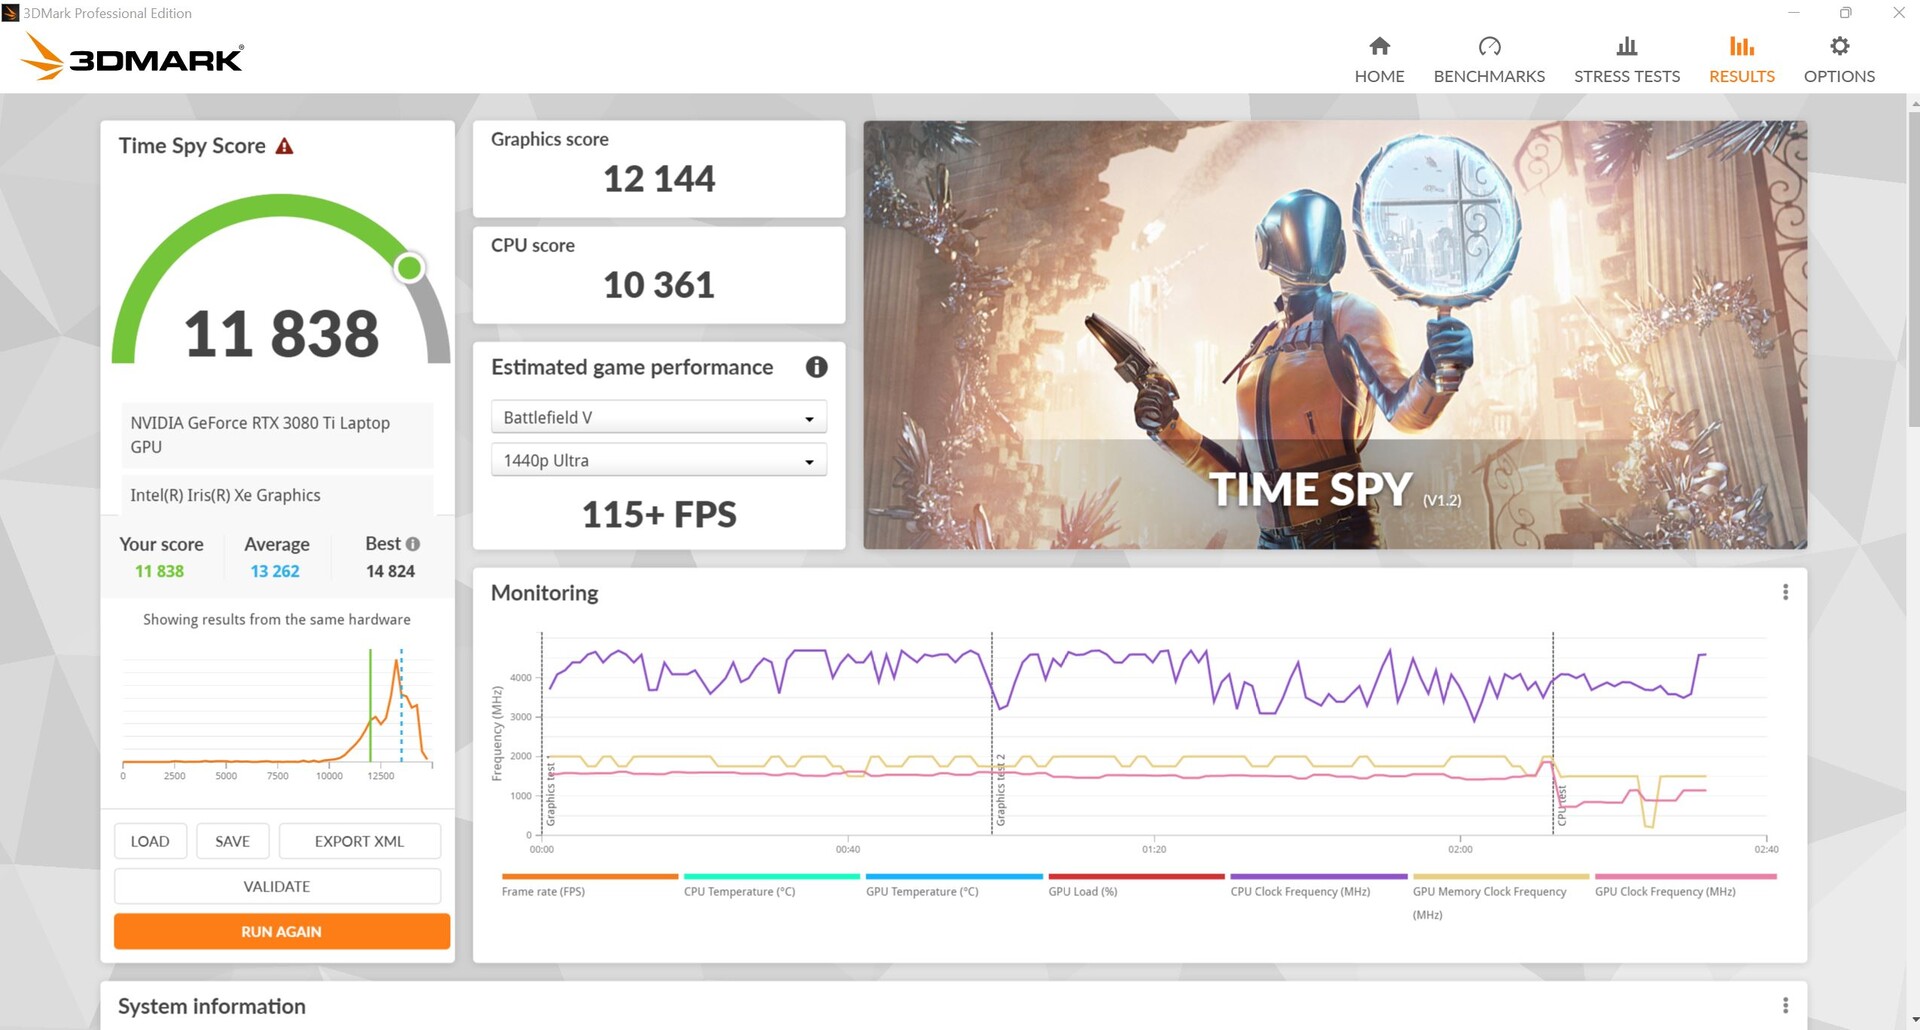

| 3DMark 11 Performance | 33321 points | |
| 3DMark Cloud Gate Standard Score | 60607 points | |
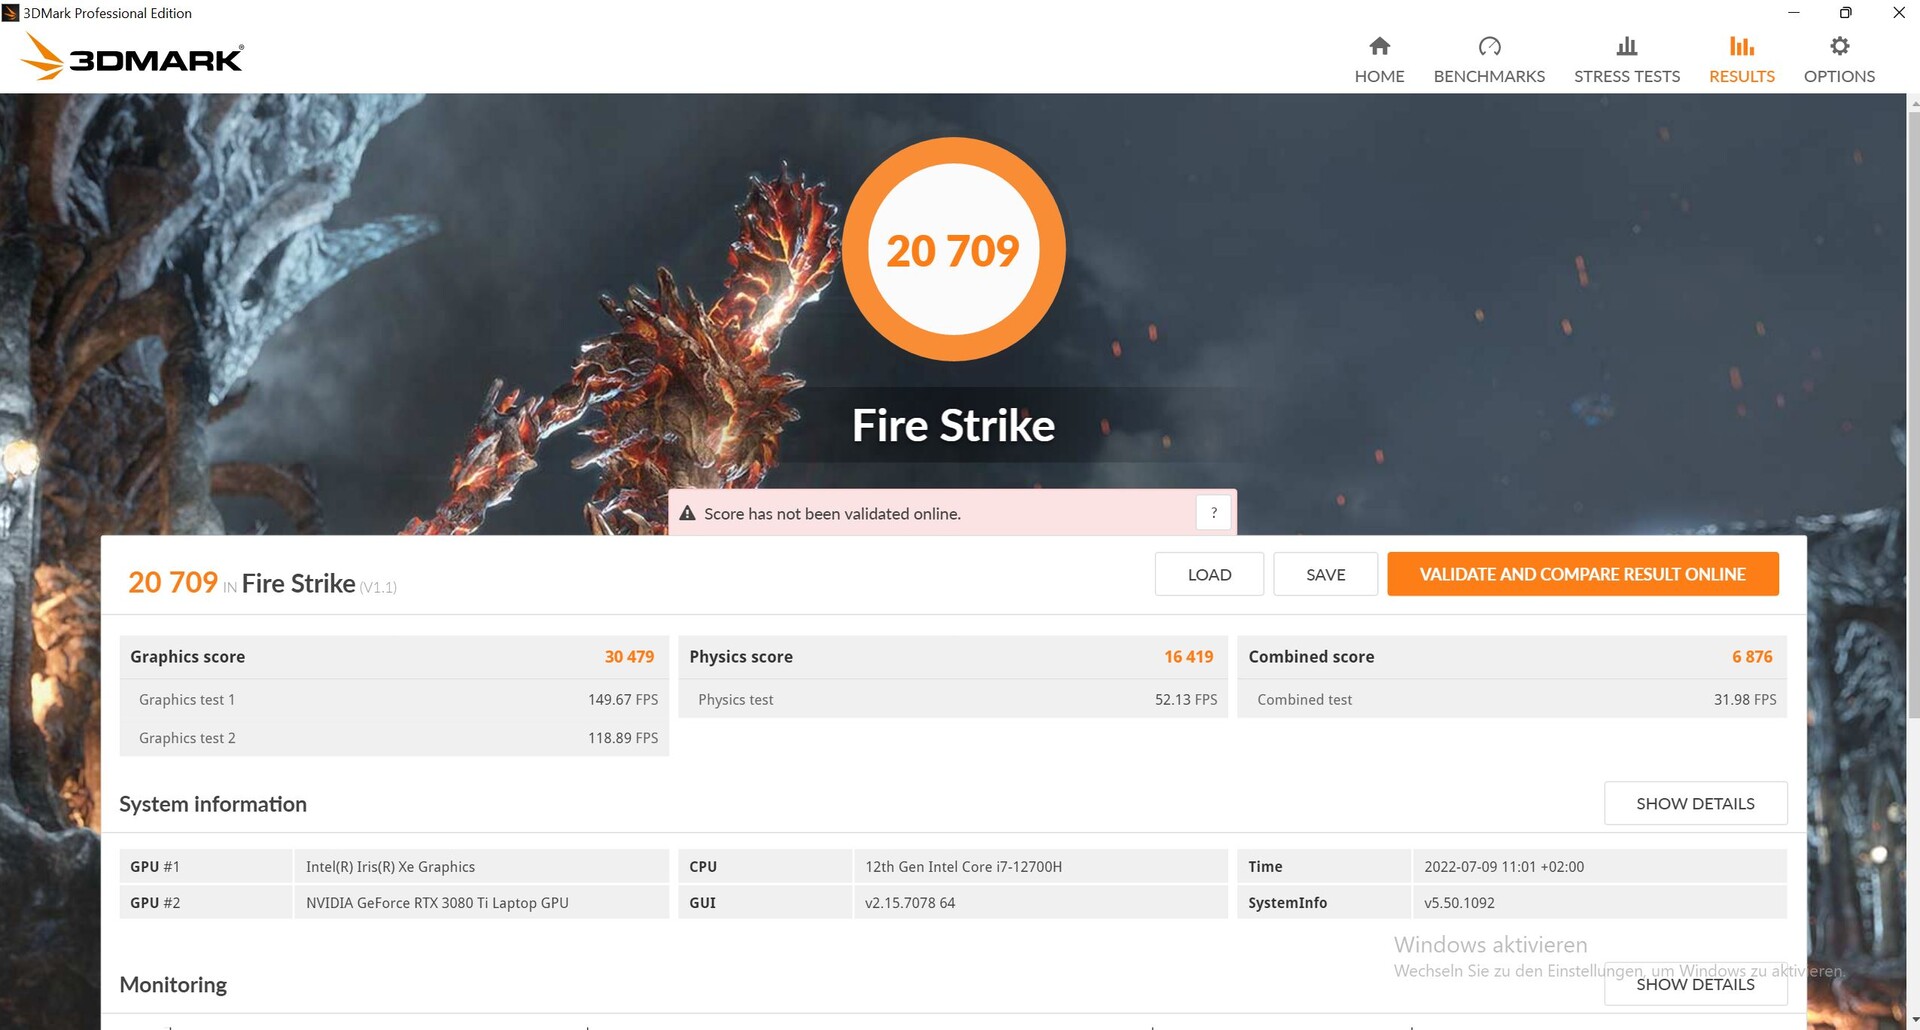
| 3DMark Fire Strike Score | 20709 points | |
| 3DMark Time Spy Score | 11838 points | |
Help | ||
Gaming Performance
The Pro 15 is often just below average in low graphics settings, and slightly above in high details. Overall, gaming performance is at the expected level. However, the Neo 15 and the MSI Raider in particular are almost always faster, even in high details. In Strange Brigade, the Pro 15 is the fastest device.
However, things become a little tight in terms of ray tracing, depending on the game and detail level. In Dying Light 2 with high ray tracing settings and Full HD, the Pro 15 manages 38 fps, but stutters in native QHD resolution at just over 20 fps. But this is no different in other laptops with the RTX 3080 Ti.
The Witcher 3 Ultra frame rate is fairly constant over an hour and fluctuates between 110 and 125 fps.
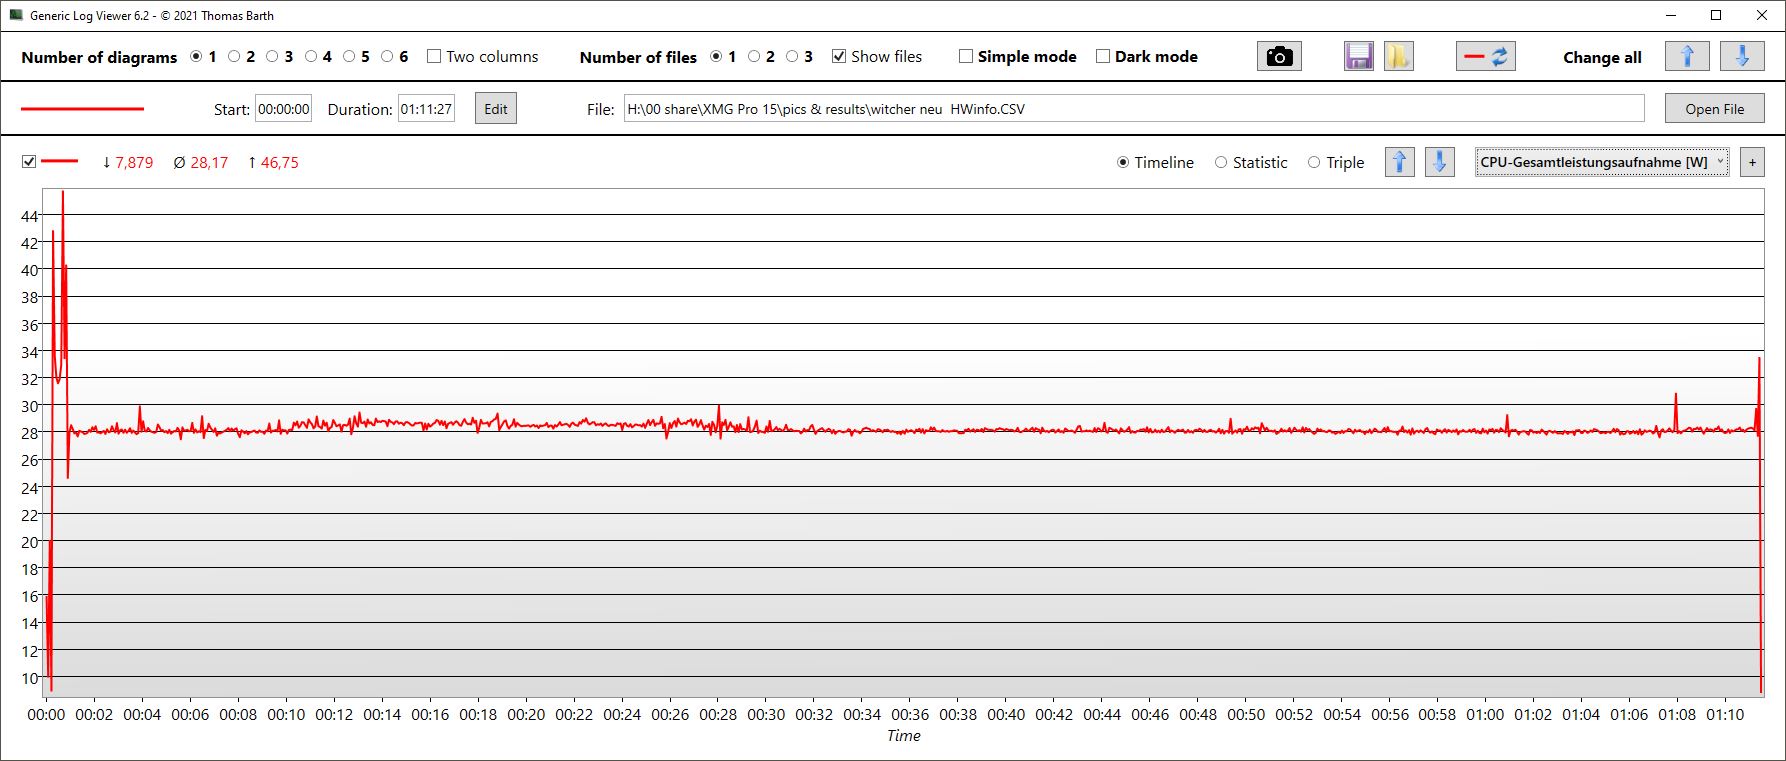
The CPU heats up to an average of 77 °C and the power consumption is only 28 W, also because Witcher 3 cannot utilize newer processors well, especially the new E and P cores of the Intel CPUs.
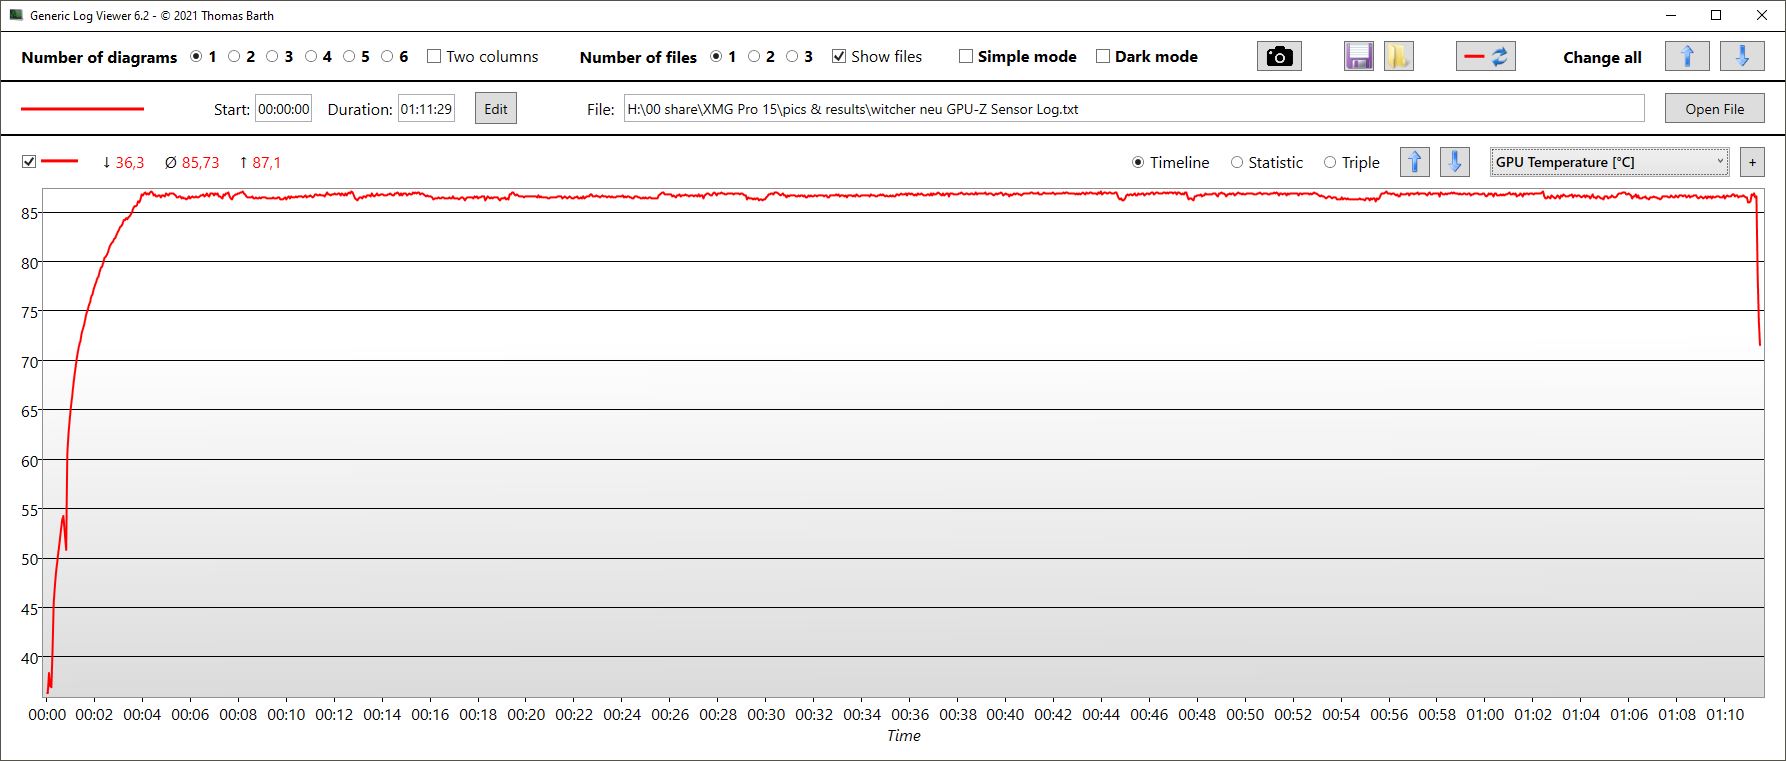
The GPU heats up to an average of 86 °C. It cannot maintain the Turbo rate and clocks at an average of 1.4 GHz.
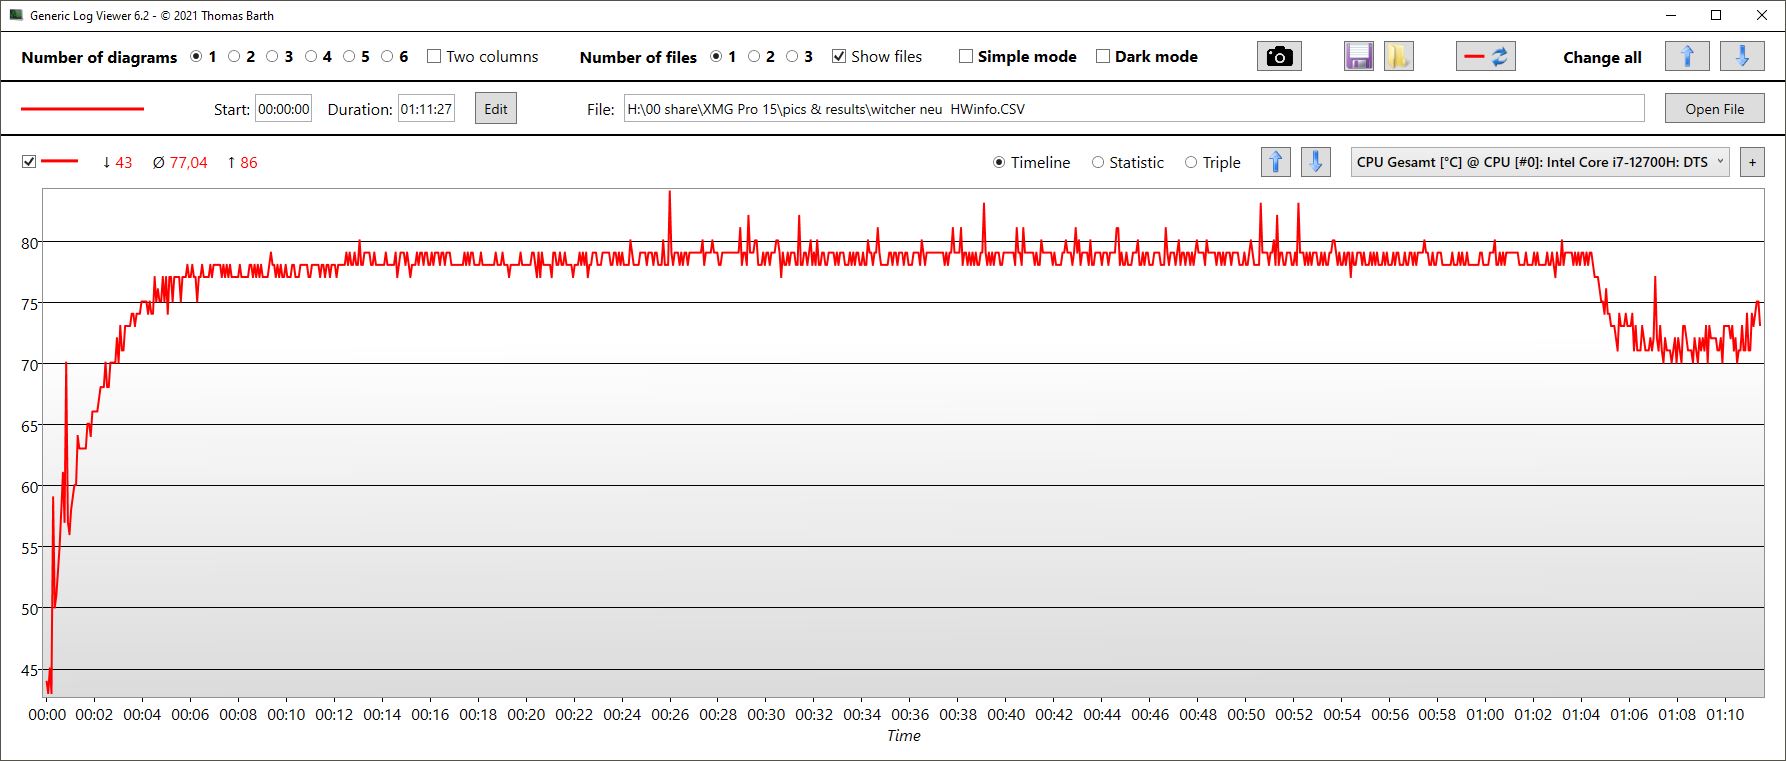
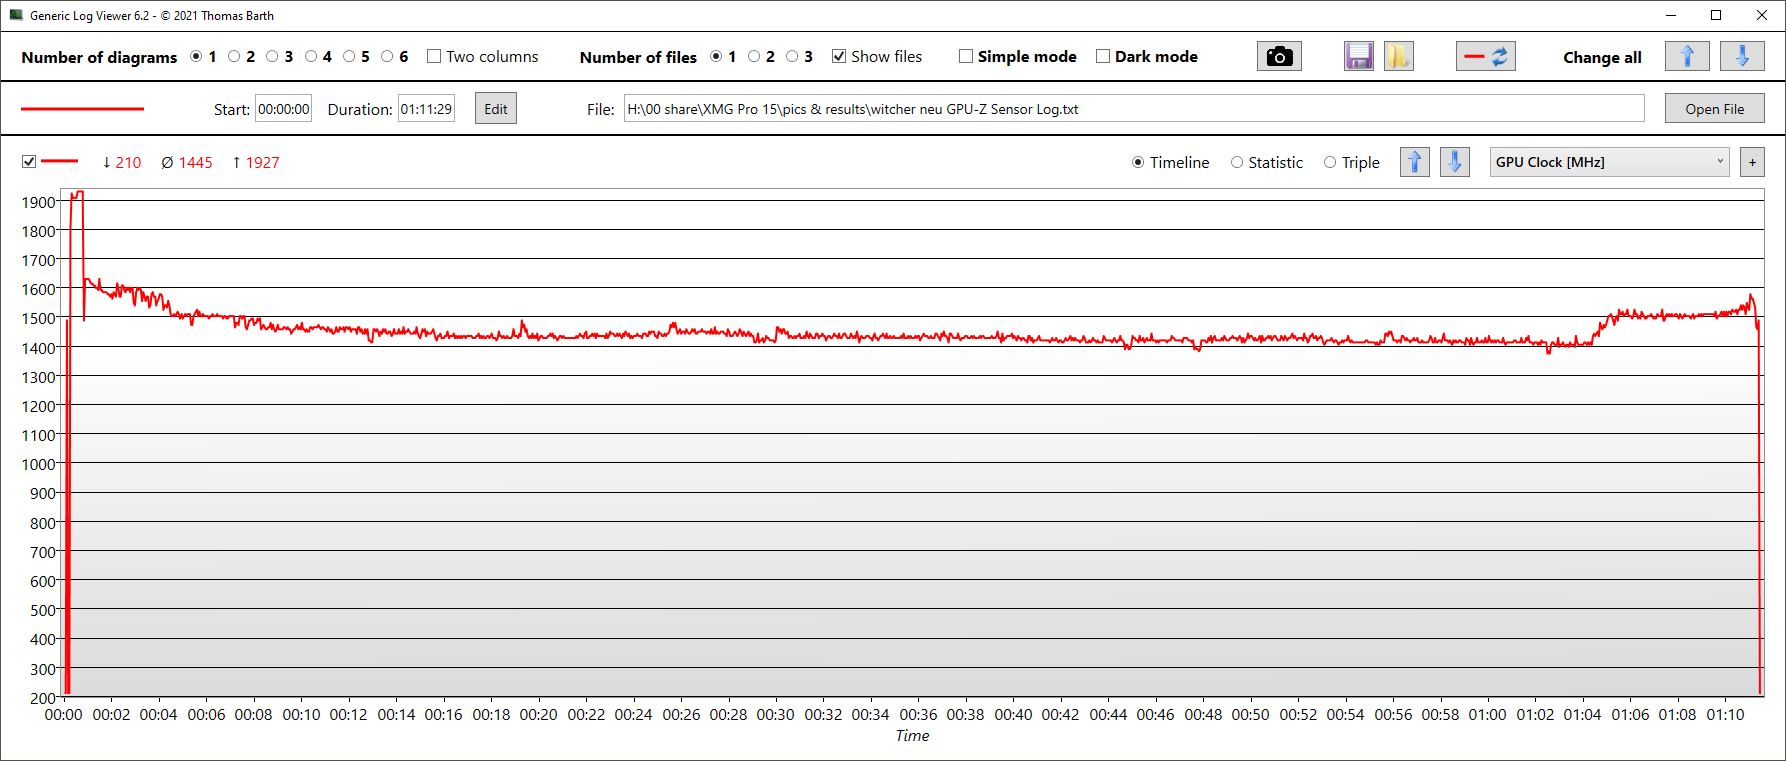
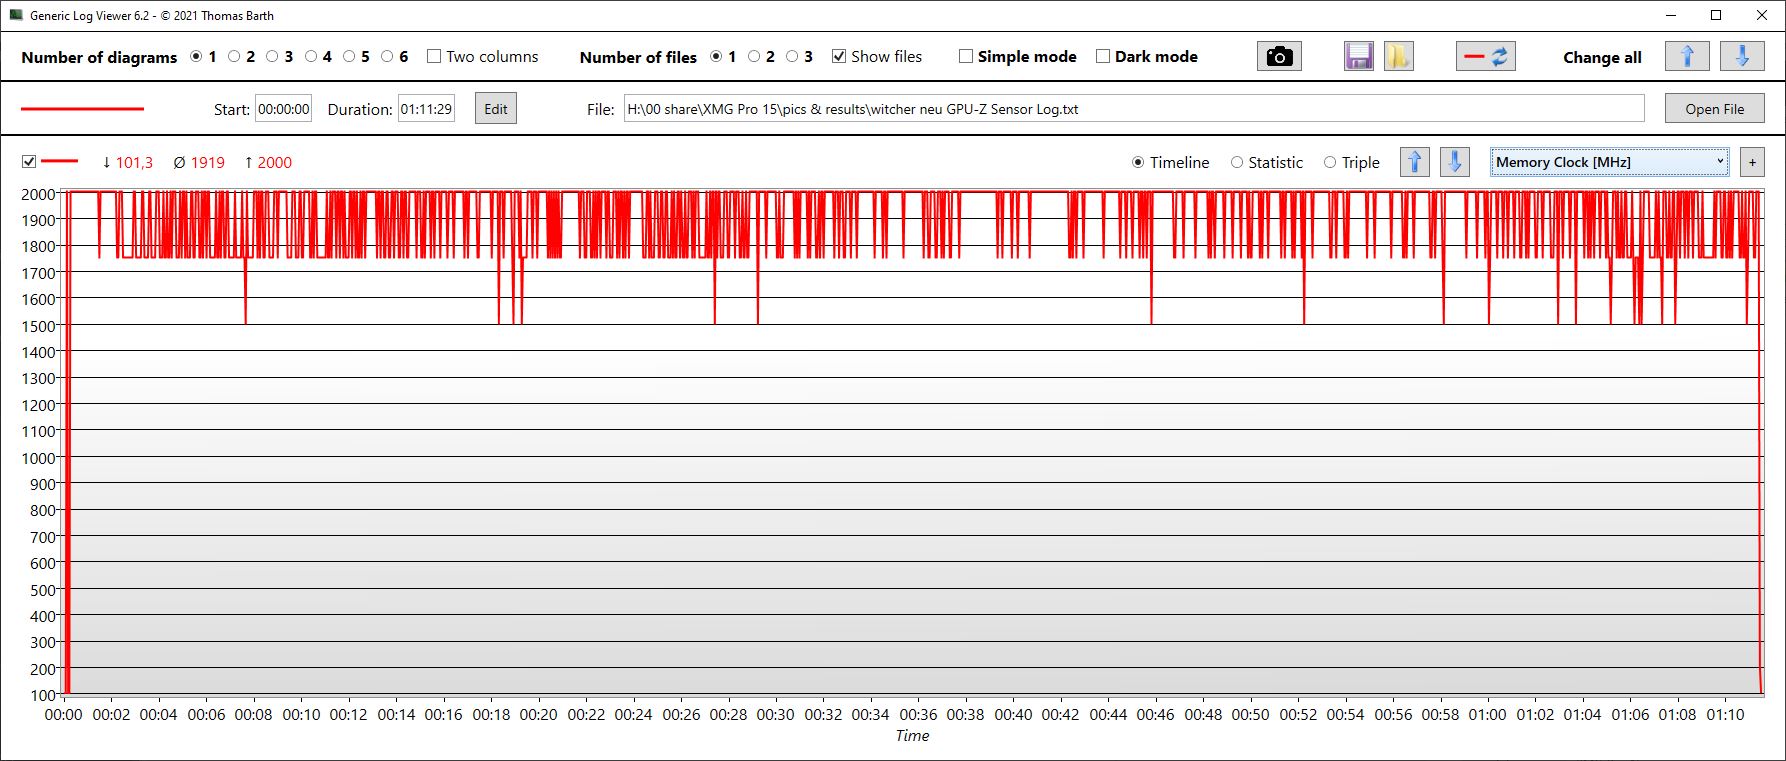
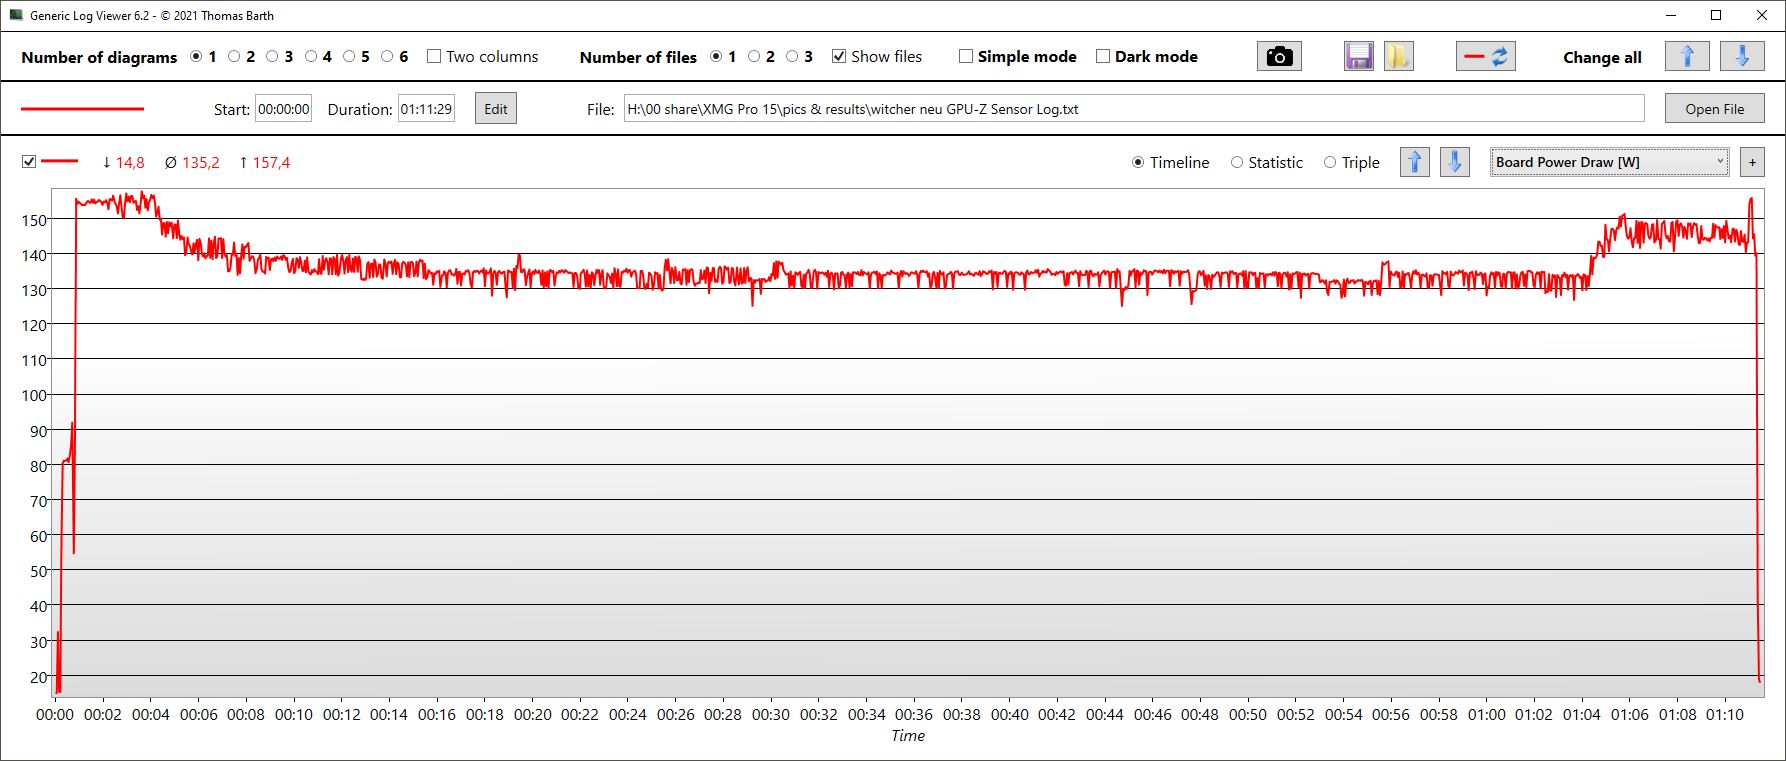
Witcher 3 FPS Chart
| low | med. | high | ultra | QHD | |
| GTA V (2015) | 185 | 175.8 | 175.7 | 119.2 | 105.7 |
| The Witcher 3 (2015) | 366 | 319 | 211 | 119 | |
| Dota 2 Reborn (2015) | 161.1 | 148.4 | 138.9 | 131.7 | |
| Final Fantasy XV Benchmark (2018) | 177.5 | 148.3 | 110.4 | 88.8 | |
| X-Plane 11.11 (2018) | 140.2 | 125.2 | 100.1 | ||
| Far Cry 5 (2018) | 164 | 134 | 130 | 120 | 116 |
| Strange Brigade (2018) | 415.8 | 274 | 232 | 200 | 153.8 |
| Dying Light 2 (2022) | 123 | 99 | 84.4 | 59 |
Emissions: Fans quickly hit their limit
System Noise
It can happen that the Pro 15's fans stand still, but this is rare, even in Silent mode (idle). Sometimes the second fan also runs quietly in Entertainment or Performance mode. Nevertheless, this fan behavior is already an improvement over the even louder predecessor.
Overall, the fans of the Pro 15 rev up quite loudly and very quickly, and also have a hard time slowing down again. For example, the fans spin up after only 16 seconds in 3DMark06 and reach their maximum after 40 seconds. Other laptops remain quiet longer and don't necessarily rev up to maximum volume under average loads. This was also the case in Entertainment mode, but the maximum volume here was 54.5 dB instead of 56.5 dB. The Razer Blade and even the MSI Raider are significantly quieter under load.
When launching 3D programs like Witcher 3 or 3DMark06, we hear an electronic whirring that probably comes from the GPU.
Noise Level
| Idle |
| 23 / 31.22 / 33.09 dB(A) |
| Load |
| 56.35 / 56.89 dB(A) |
 | ||
30 dB silent 40 dB(A) audible 50 dB(A) loud |
||
min: | ||
| SCHENKER XMG Pro 15 (i7-12700H, RTX 3080 Ti) GeForce RTX 3080 Ti Laptop GPU, i7-12700H, Samsung SSD 980 Pro 1TB MZ-V8P1T0BW | SCHENKER XMG Pro 15 (Late 2021) GeForce RTX 3080 Laptop GPU, i7-11800H, Samsung SSD 980 Pro 1TB MZ-V8P1T0BW | SCHENKER XMG Neo 15 (i7-12700H, RTX 3080 Ti) GeForce RTX 3080 Ti Laptop GPU, i7-12700H, Samsung SSD 980 Pro 1TB MZ-V8P1T0BW | MSI Raider GE66 12UHS GeForce RTX 3080 Ti Laptop GPU, i9-12900HK, Samsung PM9A1 MZVL22T0HBLB | Razer Blade 15 2022 GeForce RTX 3080 Ti Laptop GPU, i7-12800H, SSSTC CA6-8D1024 | |
|---|---|---|---|---|---|
| Noise | -11% | 8% | 2% | 8% | |
| off / environment * | 23 | 24 -4% | 23 -0% | 26 -13% | 25.4 -10% |
| Idle Minimum * | 23 | 31 -35% | 23 -0% | 27 -17% | 26.2 -14% |
| Idle Average * | 31.22 | 37 -19% | 26.39 15% | 30 4% | 26.2 16% |
| Idle Maximum * | 33.09 | 41 -24% | 26.39 20% | 39 -18% | 28.4 14% |
| Load Average * | 56.35 | 56 1% | 45.52 19% | 45 20% | 44.7 21% |
| Witcher 3 ultra * | 56.89 | 53 7% | 55.89 2% | 45 21% | 44.7 21% |
| Load Maximum * | 56.89 | 58 -2% | 55.89 2% | 47 17% | 51.9 9% |
* ... smaller is better
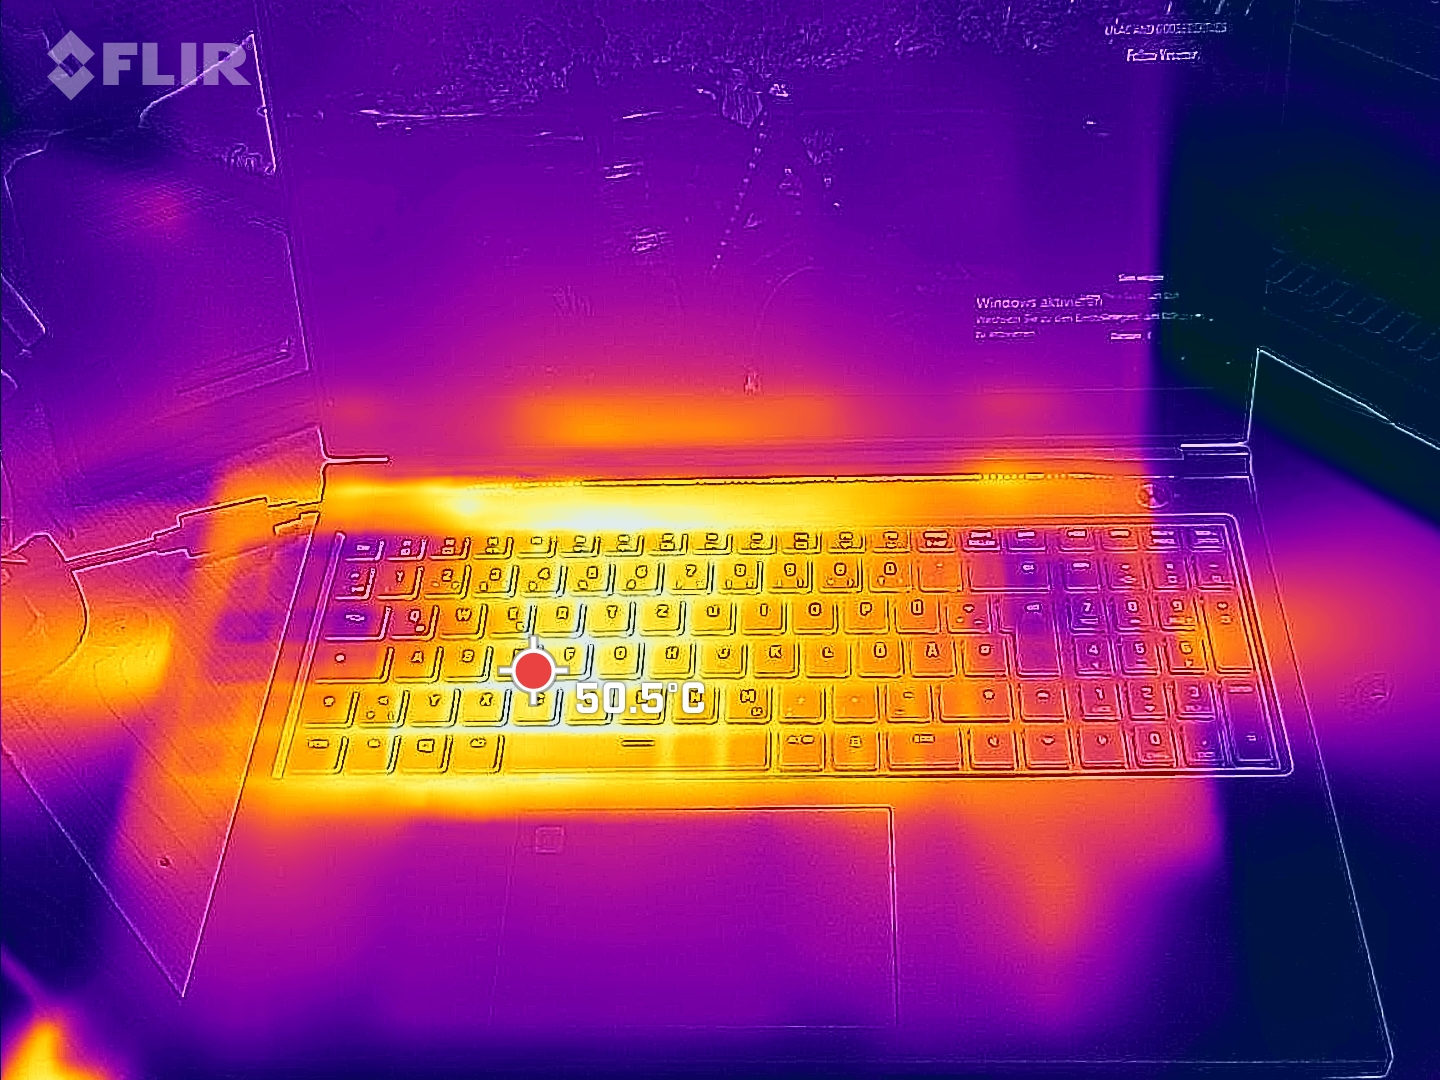
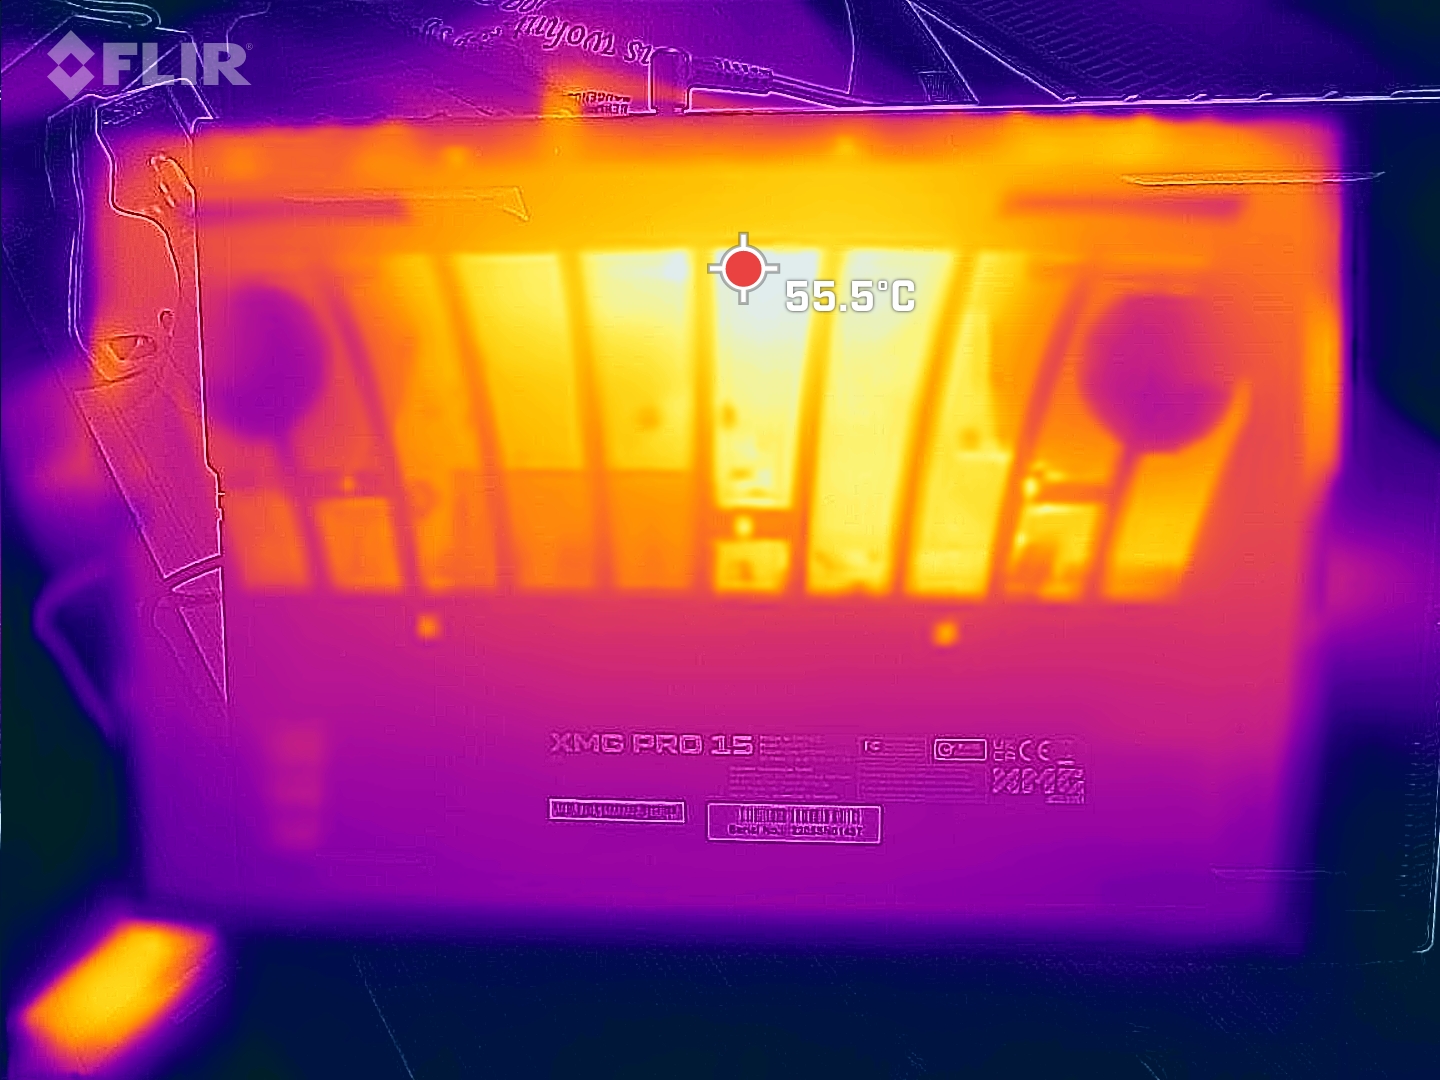
Temperature
The underside can heat up to 60 °C during gaming, and it is not much cooler on the top in the center. The WASD key area registers around 52 °C. The Razer Blade is significantly cooler, and the strong MSI Raider gets similarly hot.
At least the palm rests remain in a comfortable range.
(-) The maximum temperature on the upper side is 57 °C / 135 F, compared to the average of 40.4 °C / 105 F, ranging from 21.2 to 68.8 °C for the class Gaming.
(-) The bottom heats up to a maximum of 52 °C / 126 F, compared to the average of 43.2 °C / 110 F
(+) In idle usage, the average temperature for the upper side is 30 °C / 86 F, compared to the device average of 33.8 °C / 93 F.
(-) Playing The Witcher 3, the average temperature for the upper side is 44.7 °C / 112 F, compared to the device average of 33.8 °C / 93 F.
(+) The palmrests and touchpad are reaching skin temperature as a maximum (34 °C / 93.2 F) and are therefore not hot.
(-) The average temperature of the palmrest area of similar devices was 28.9 °C / 84 F (-5.1 °C / -9.2 F).
| SCHENKER XMG Pro 15 (i7-12700H, RTX 3080 Ti) Intel Core i7-12700H, NVIDIA GeForce RTX 3080 Ti Laptop GPU | SCHENKER XMG Pro 15 (Late 2021) Intel Core i7-11800H, NVIDIA GeForce RTX 3080 Laptop GPU | SCHENKER XMG Neo 15 (i7-12700H, RTX 3080 Ti) Intel Core i7-12700H, NVIDIA GeForce RTX 3080 Ti Laptop GPU | MSI Raider GE66 12UHS Intel Core i9-12900HK, NVIDIA GeForce RTX 3080 Ti Laptop GPU | Razer Blade 15 2022 Intel Core i7-12800H, NVIDIA GeForce RTX 3080 Ti Laptop GPU | |
|---|---|---|---|---|---|
| Heat | 4% | -6% | -4% | -2% | |
| Maximum Upper Side * | 57 | 44 23% | 44 23% | 54 5% | 50 12% |
| Maximum Bottom * | 52 | 60 -15% | 56 -8% | 65 -25% | 47 10% |
| Idle Upper Side * | 32 | 30 6% | 38 -19% | 30 6% | 37.4 -17% |
| Idle Bottom * | 34 | 34 -0% | 41 -21% | 35 -3% | 38.4 -13% |
* ... smaller is better
Stress Test
The cores start our stress test at over 3.8 GHz. The clock rates slowly drop and there are periodic minor drops, whereby the thermal limit of the Pro 15 apparently only kicks in very late. Thus the average core temperature is a high 95 °C! At the same time, a fairly high average clock rate of around 3.2 GHz is possible.
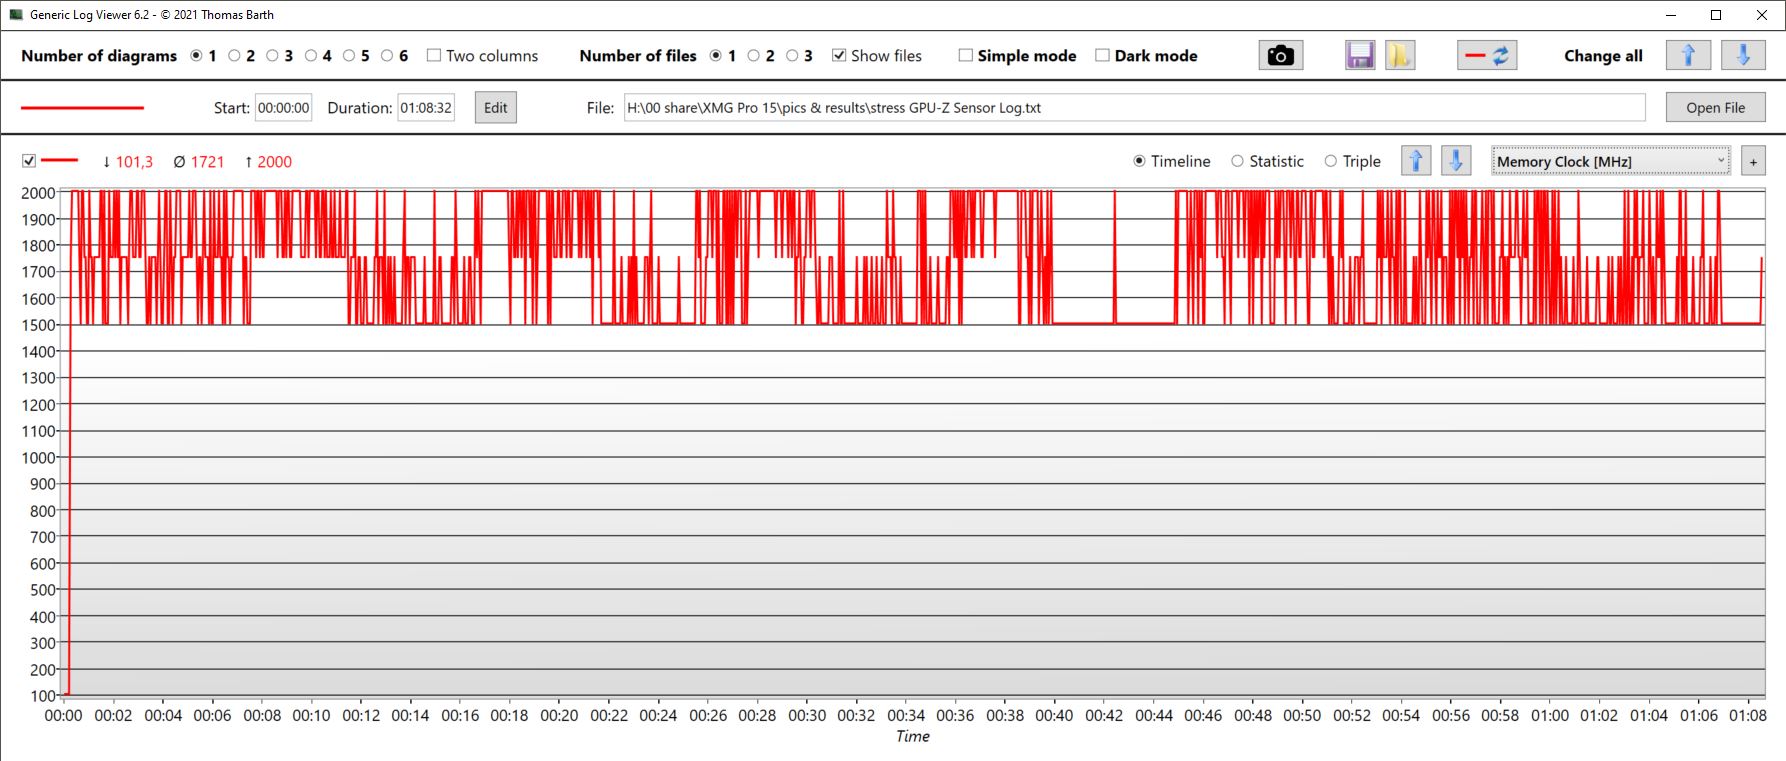
The GPU heats up less (around 69 °C), but the clock fluctuates significantly (average at 1.2 GHz). The memory clock also varies between 1.5 and 2 GHz. The card draws around 69 W from the power supply on average, and only occasionally reaches 150 W and only very briefly.
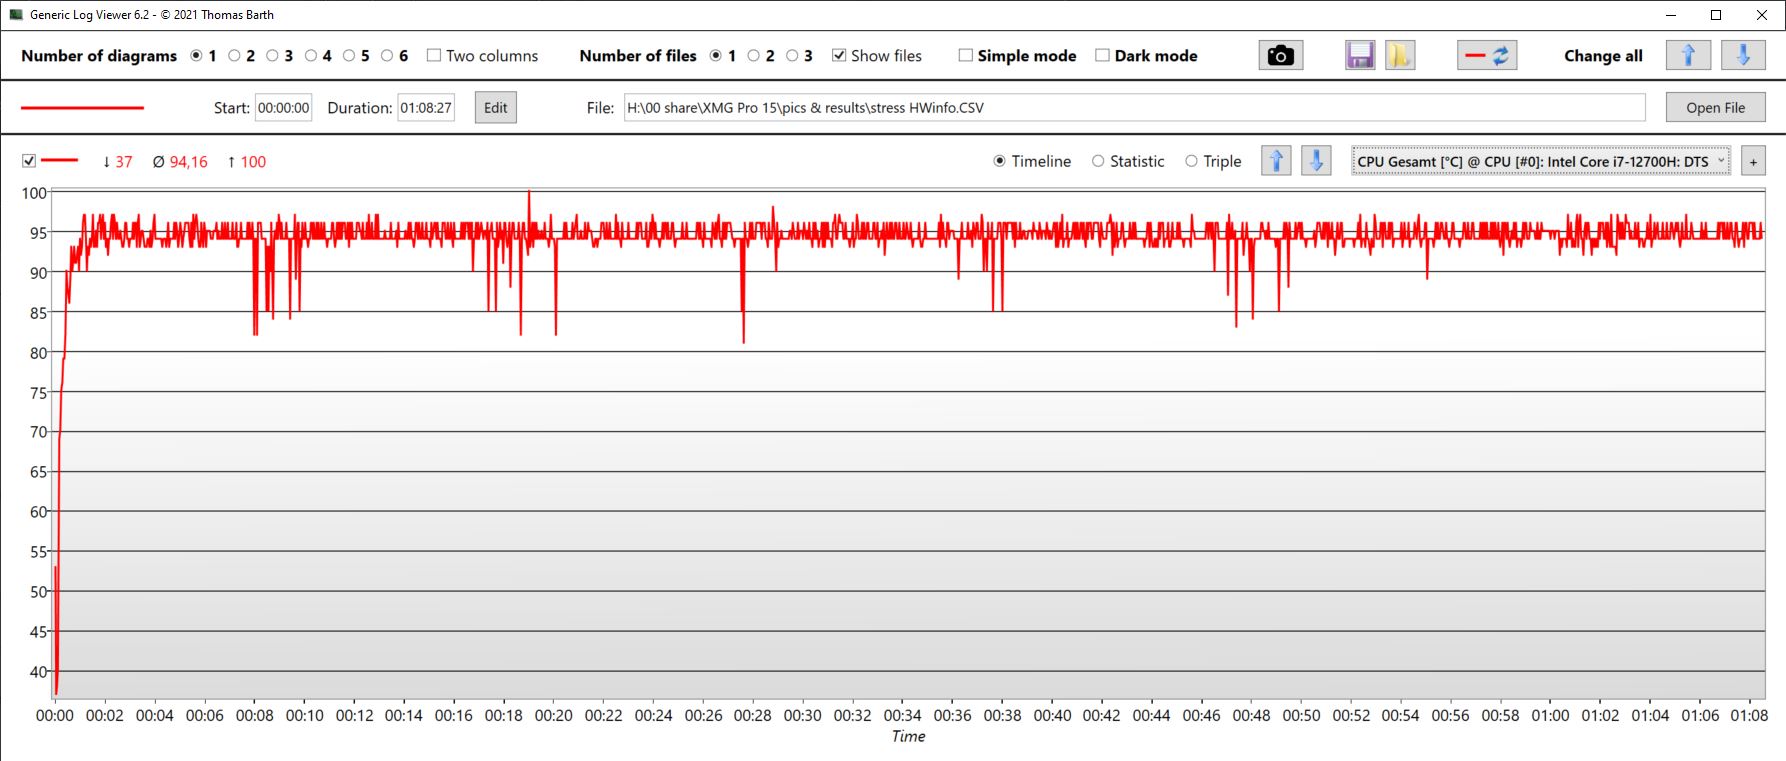
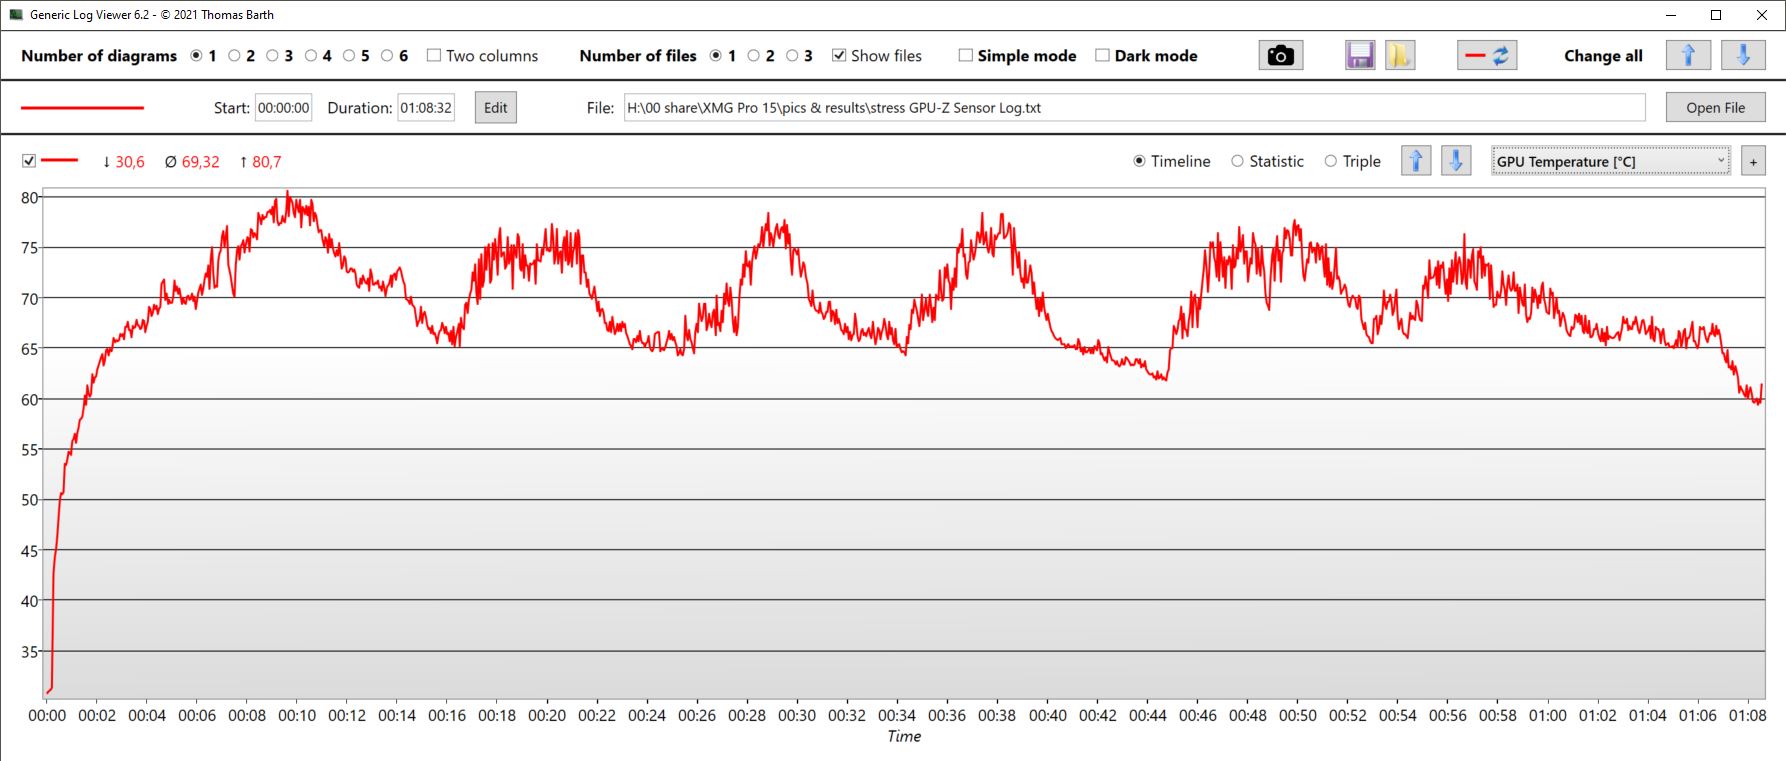
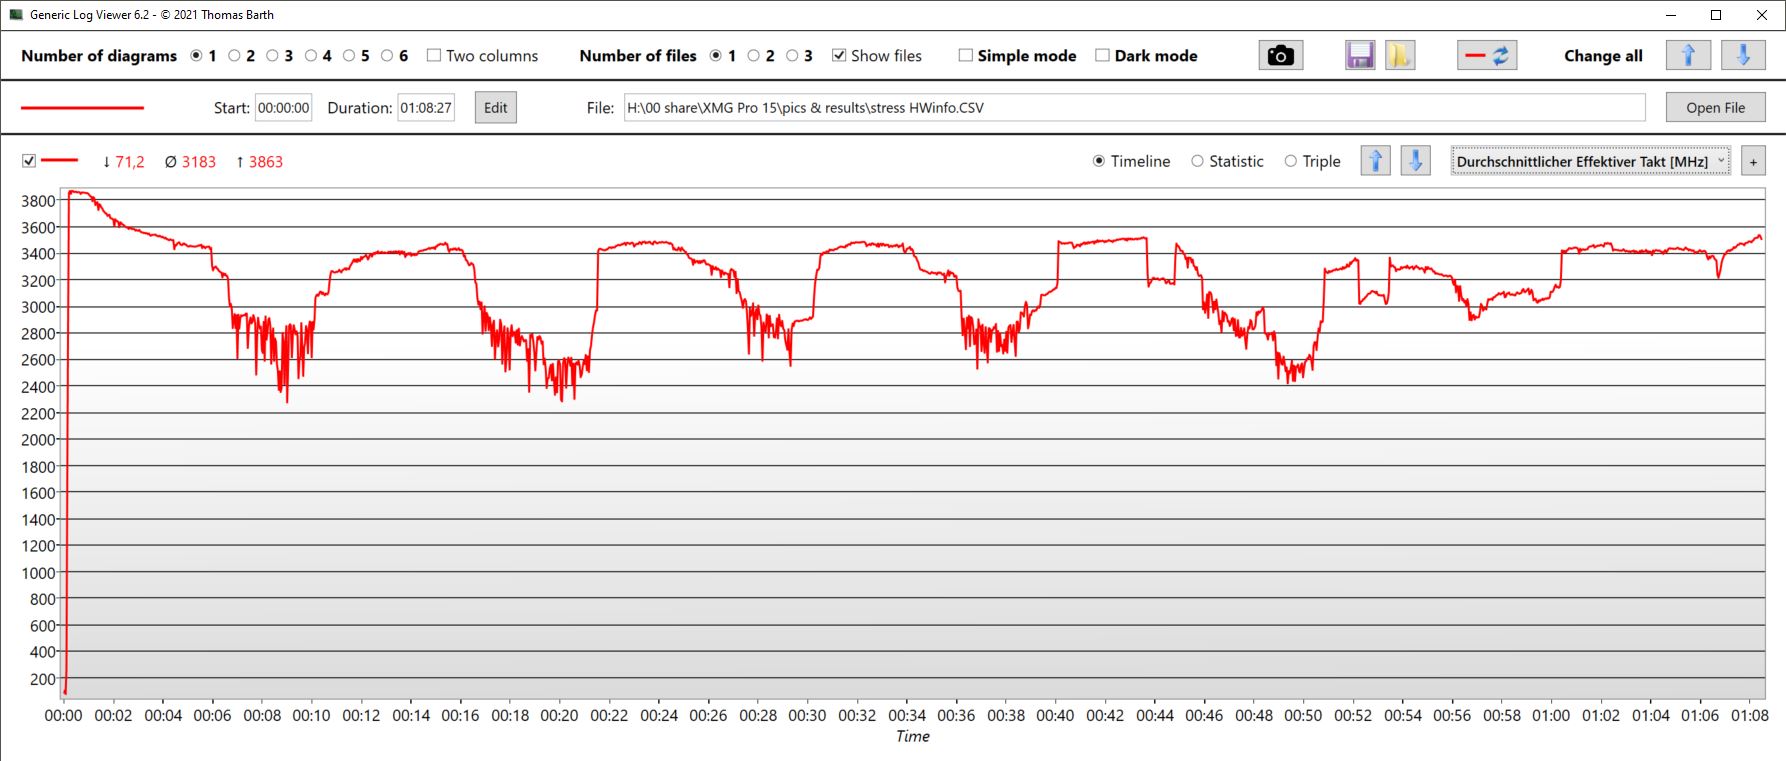
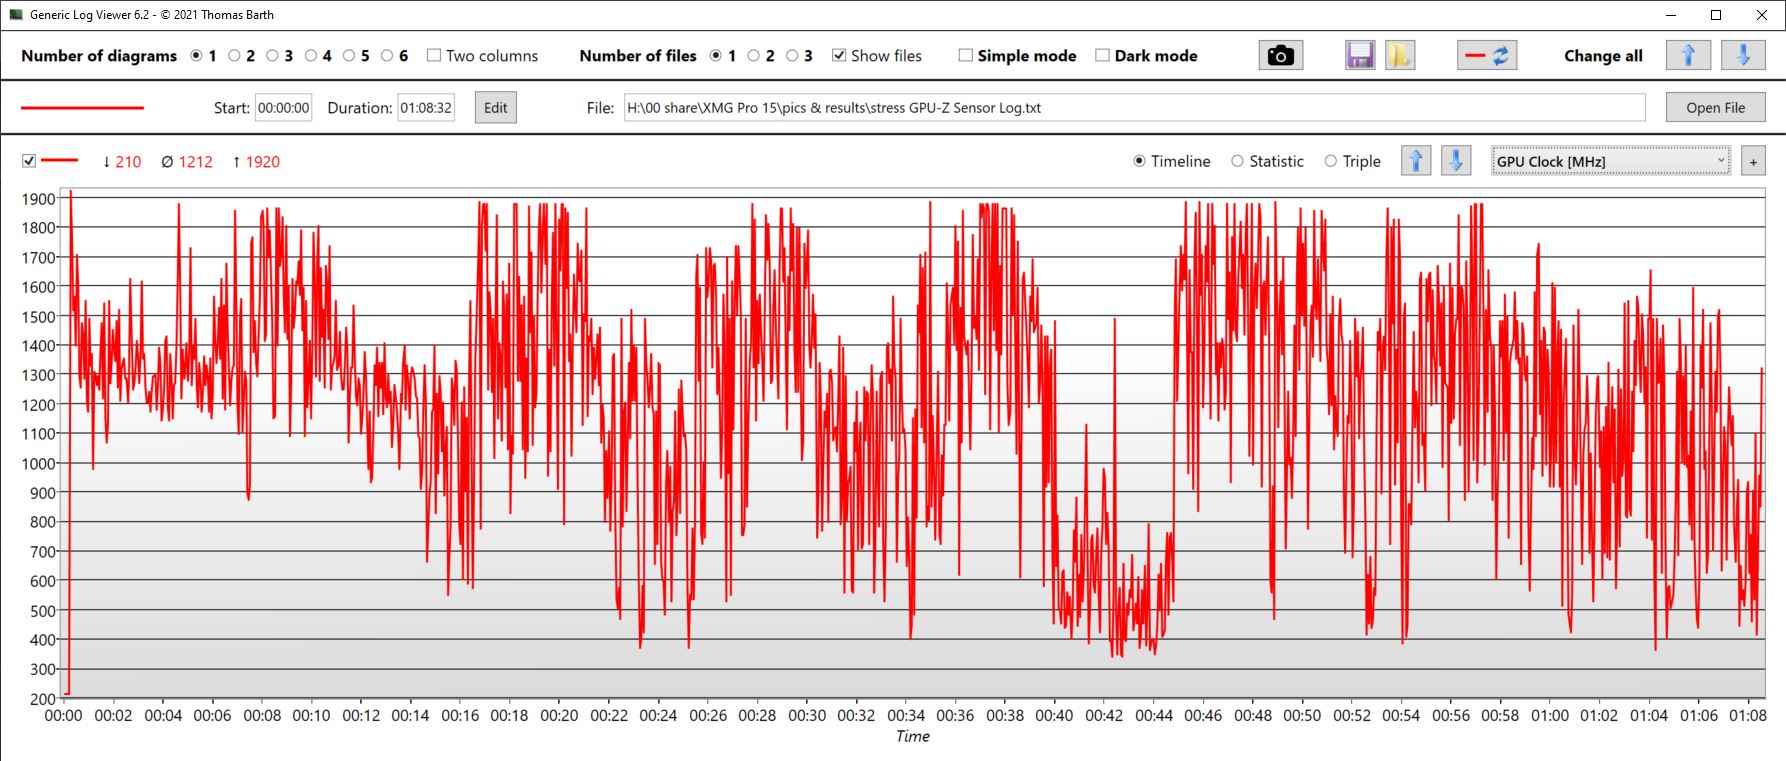
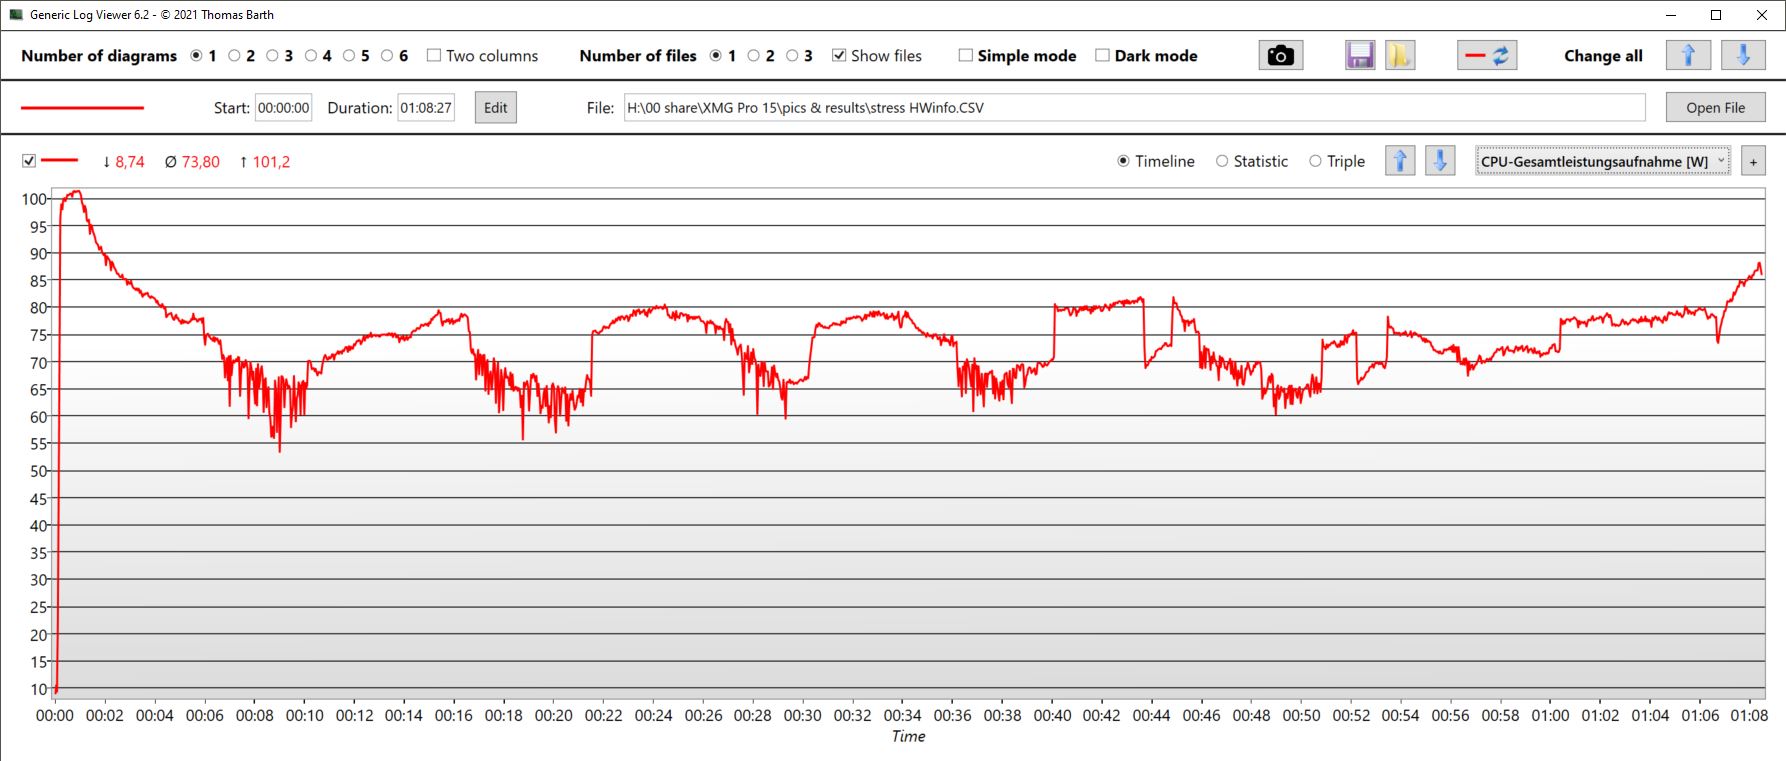
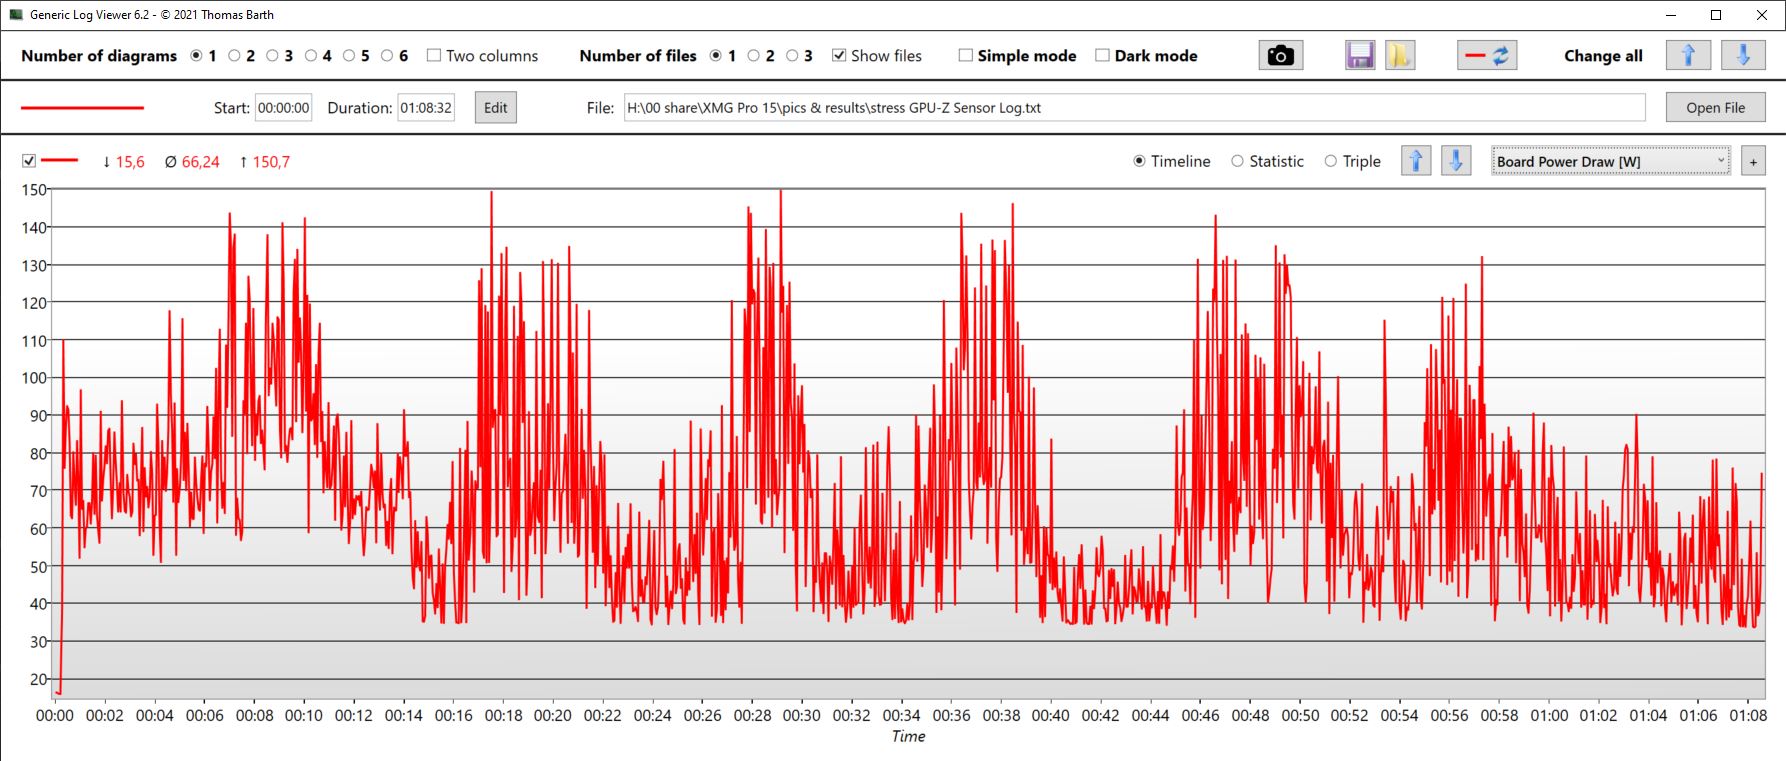
| CPU Clock (GHz) | GPU Clock (MHz) | Average CPU Temperature (°C) | Average GPU Temperature (°C) | |
| Prime95 + FurMark Stress | 3,2 GHz | 1.212 | 95 | 69 |
| Witcher 3 Stress | 3,4 | 1.445 | 77 | 86 |
Speakers
The speakers are not particularly loud. At least the bass is average instead of completely underrepresented, while the trebles are balanced.
External analogue audio devices can be connected via two jack slots.
SCHENKER XMG Pro 15 (i7-12700H, RTX 3080 Ti) audio analysis
(±) | speaker loudness is average but good (75.82 dB)
Bass 100 - 315 Hz
(±) | reduced bass - on average 13% lower than median
(±) | linearity of bass is average (14.1% delta to prev. frequency)
Mids 400 - 2000 Hz
(+) | balanced mids - only 4.5% away from median
(+) | mids are linear (5.3% delta to prev. frequency)
Highs 2 - 16 kHz
(+) | balanced highs - only 3% away from median
(+) | highs are linear (5.6% delta to prev. frequency)
Overall 100 - 16.000 Hz
(±) | linearity of overall sound is average (16.3% difference to median)
Compared to same class
» 38% of all tested devices in this class were better, 6% similar, 56% worse
» The best had a delta of 6%, average was 18%, worst was 132%
Compared to all devices tested
» 22% of all tested devices were better, 5% similar, 73% worse
» The best had a delta of 4%, average was 25%, worst was 134%
MSI Raider GE66 12UHS audio analysis
(+) | speakers can play relatively loud (84 dB)
Bass 100 - 315 Hz
(-) | nearly no bass - on average 17% lower than median
(±) | linearity of bass is average (11% delta to prev. frequency)
Mids 400 - 2000 Hz
(±) | higher mids - on average 5.6% higher than median
(+) | mids are linear (3.9% delta to prev. frequency)
Highs 2 - 16 kHz
(+) | balanced highs - only 4.6% away from median
(+) | highs are linear (6.3% delta to prev. frequency)
Overall 100 - 16.000 Hz
(±) | linearity of overall sound is average (17.1% difference to median)
Compared to same class
» 43% of all tested devices in this class were better, 12% similar, 45% worse
» The best had a delta of 6%, average was 18%, worst was 132%
Compared to all devices tested
» 26% of all tested devices were better, 8% similar, 67% worse
» The best had a delta of 4%, average was 25%, worst was 134%
Energy Management: Astounding power behavior when idle
Power Consumption
One gets the impression that the performance modes of the Pro 15 are not fully optimized. Measuring the consumption rates was not so straightforward in idle. The lowest consumption with minimized brightness in flight mode was difficult to achieve in energy-saving mode; the measured 40 W is extremely high. If you switch to the nominally higher entertainment mode under the otherwise same settings, consumption then drops to about 10 W within a few seconds. Switching back to the energy-saving mode again displays 40 W without any noticeable slowdown after more than a minute. No bothersome background processes were detected. Only the Control Center was opened and closed in between. And even in Performance mode, idle consumption is quite high at 35 W.
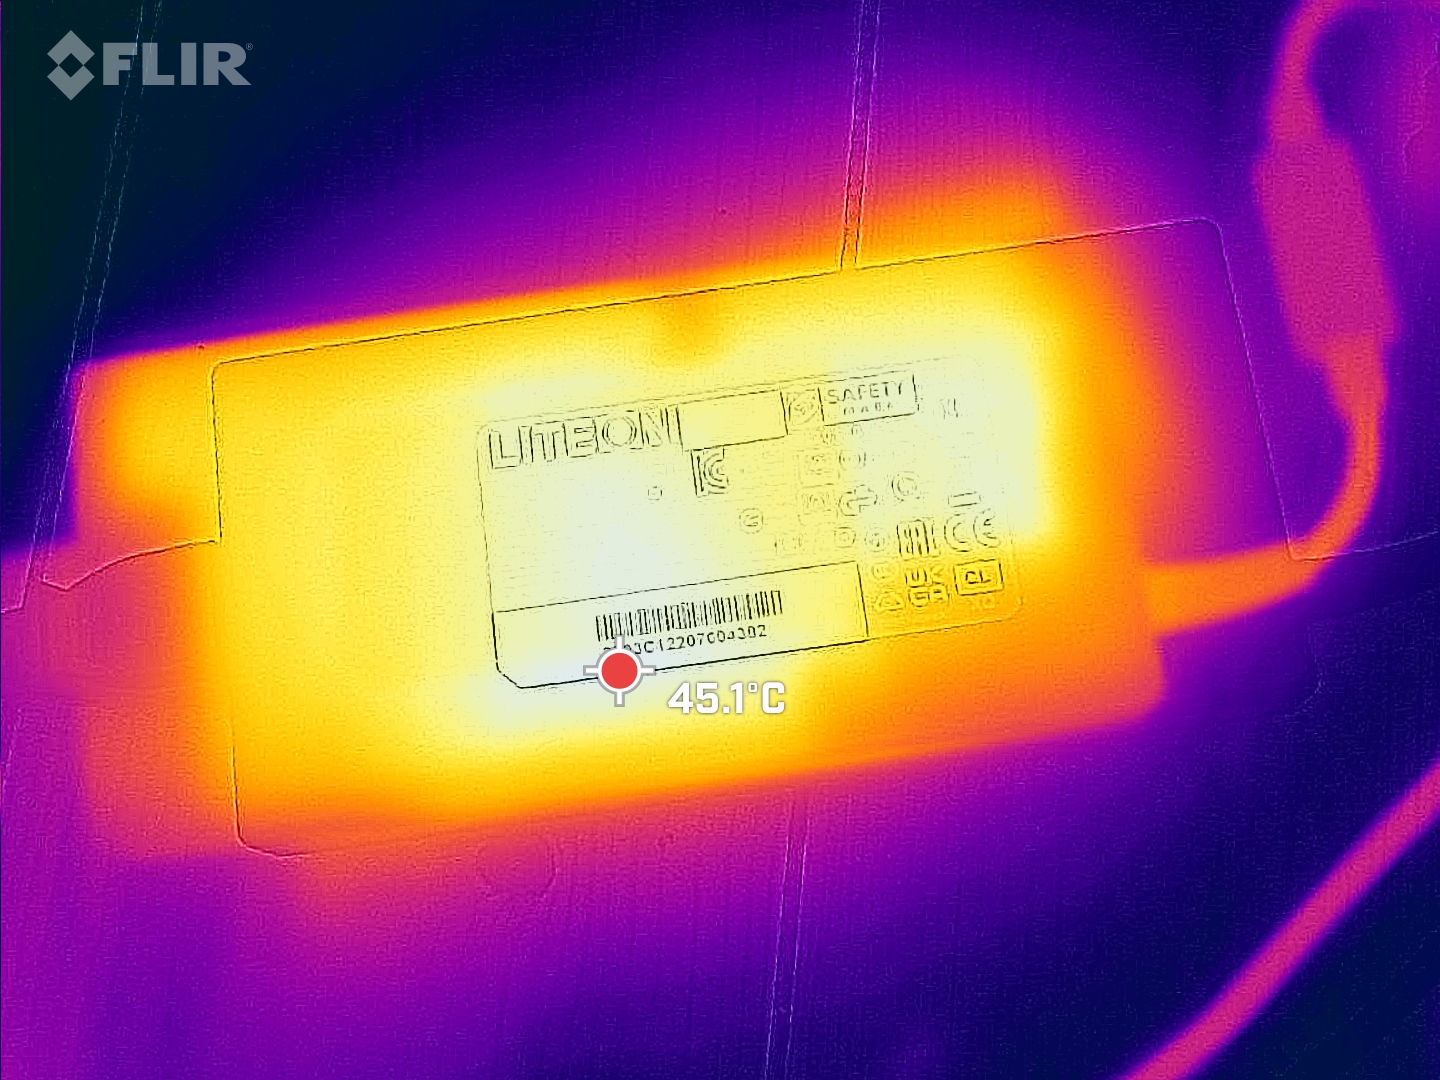
Gaming demands an average of 235 W (input power at the wall socket), and we also measured very short load peaks of a maximum of 273 W in the stress test. The 230 W power supply (output power, size approx. 15.4 x 7.5 cm) should just about suffice here.
| Idle | |
| Load |
|
| SCHENKER XMG Pro 15 (i7-12700H, RTX 3080 Ti) i7-12700H, GeForce RTX 3080 Ti Laptop GPU, Samsung SSD 980 Pro 1TB MZ-V8P1T0BW, IPS, 2560x1440, 15.60 | SCHENKER XMG Pro 15 (Late 2021) i7-11800H, GeForce RTX 3080 Laptop GPU, Samsung SSD 980 Pro 1TB MZ-V8P1T0BW, OLED, 3840x2160, 15.60 | SCHENKER XMG Neo 15 (i7-12700H, RTX 3080 Ti) i7-12700H, GeForce RTX 3080 Ti Laptop GPU, Samsung SSD 980 Pro 1TB MZ-V8P1T0BW, IPS, 2560x1440, 15.60 | MSI Raider GE66 12UHS i9-12900HK, GeForce RTX 3080 Ti Laptop GPU, Samsung PM9A1 MZVL22T0HBLB, IPS, 3840x2160, 15.60 | Razer Blade 15 2022 i7-12800H, GeForce RTX 3080 Ti Laptop GPU, SSSTC CA6-8D1024, IPS, 2560x1440, 15.60 | Average NVIDIA GeForce RTX 3080 Ti Laptop GPU | Average of class Gaming | |
|---|---|---|---|---|---|---|---|
| Power Consumption | -11% | -6% | -5% | -56% | -24% | -6% | |
| Idle Minimum * | 10 | 20 -100% | 15 -50% | 16 -60% | 33.2 -232% | 17.2 ? -72% | 13.7 ? -37% |
| Idle Average * | 15.2 | 22 -45% | 18 -18% | 19 -25% | 36.4 -139% | 23.3 ? -53% | 19.1 ? -26% |
| Idle Maximum * | 35 | 26 26% | 18 49% | 26 26% | 37.6 -7% | 30.8 ? 12% | 26.8 ? 23% |
| Load Average * | 116 | 103 11% | 123 -6% | 110 5% | 116.7 -1% | 121.2 ? -4% | 110.9 ? 4% |
| Witcher 3 ultra * | 235 | 186 21% | 234 -0% | 202 14% | 172 27% | ||
| Load Maximum * | 273 | 218 20% | 301 -10% | 242 11% | 228.6 16% | 276 ? -1% | 250 ? 8% |
* ... smaller is better
Power consumption Witcher 3
Power consumption with an external monitor
Battery Life
Schenker installs an 80 Wh battery, the same as in the Razer. The MSI Raider has considerably more reserves with 99 Wh.
Browsing lasts between 5.5 and 6 hours, depending on the brightness, and watching videos lasts around 5 hours. The runtimes are not particularly long in comparison; competing devices last longer, especially when watching videos. The Pro could learn something from the Neo, which has more stamina with its 93 Wh battery.
| SCHENKER XMG Pro 15 (i7-12700H, RTX 3080 Ti) i7-12700H, GeForce RTX 3080 Ti Laptop GPU, 80 Wh | SCHENKER XMG Pro 15 (Late 2021) i7-11800H, GeForce RTX 3080 Laptop GPU, 73 Wh | SCHENKER XMG Neo 15 (i7-12700H, RTX 3080 Ti) i7-12700H, GeForce RTX 3080 Ti Laptop GPU, 93 Wh | MSI Raider GE66 12UHS i9-12900HK, GeForce RTX 3080 Ti Laptop GPU, 99 Wh | Razer Blade 15 2022 i7-12800H, GeForce RTX 3080 Ti Laptop GPU, 80 Wh | Average of class Gaming | |
|---|---|---|---|---|---|---|
| Battery Runtime | -4% | 17% | 9% | -16% | 3% | |
| H.264 | 316 | 392 24% | 428 35% | 426 35% | 399 ? 26% | |
| WiFi v1.3 | 349 | 314 -10% | 464 33% | 340 -3% | 292 -16% | 368 ? 5% |
| Load | 106 | 78 -26% | 88 -17% | 102 -4% | 84.2 ? -21% | |
| Reader / Idle | 636 | 544 ? |
Pros
Cons
Verdict: But, but, my dear Pro 15
The XMG Pro 15 brings a lot of features that constitute a good gamer or a good work laptop for content creators. First and foremost, the QHD screen with its fast response times and good color space coverage. The hardware is also impressive, the input devices are decent at the least, the WiFi is very fast, and the general performance is high.
Schenker attempts to counteract the typical disadvantages of laptops with strong hardware with a thicker case, but this only works to a limited extent. Yes, the new Pro 15 is a little quieter than the old, thinner Pro 15, but it is still one of the loudest devices in the comparison field, and the fans very quickly reach their limits. At the same time, the temperatures have not really improved.
And so the many advantages of the Pro 15 are accompanied by some small "but(s)": The QHD display is fundamentally decent, but the illumination is uneven. Schenker has installed a fast Samsung 980 Pro SSD, but it throttles under constant load (heat). Performance is very high, but the device becomes very loud and hot very quickly. An SD reader is back on board again, but it only reads MicroSD cards and is slow.
The XMG Pro 15 is a very fast gaming and work computer with many good features which, however, often seem to be out of balance.
Price and Availability
The Pro 15 is currently unavailable nationwide in Germany, the manufacturer's homeland. Only Schenker's own store bestware.com lists the device, but not in our review configuration; the corresponding display or the RTX 3080 Ti cannot be selected at present.
Prices start at €1,978.99 (just under US$ 2000) for the model with an OLED display, but a weaker RTX 3060, 16 of GB RAM and a 500 GB SSD. With an RTX 3070 Ti, 32 GB and a 1 TB SSD, the model costs €2,510 (US$ ~2520).
SCHENKER XMG Pro 15 (i7-12700H, RTX 3080 Ti)
-
07/21/2022 v7
Christian Hintze
More articles related to this device
SCHENKER XMG Pro 15 (i7-12700H, RTX 3080 Ti) (XMG Pro 15 Series)Related Articles

Pricecompare

