 Deutsch
 English
 Español
 Français
 Italiano
 Nederlands
 Polski
 Português
 Русский
 Türkçe
 Svenska
 Chinese
 Magyar
Schenker XMG Fusion 15 (Mid 22) in review: Lightweight RTX 3070 laptop with good battery life

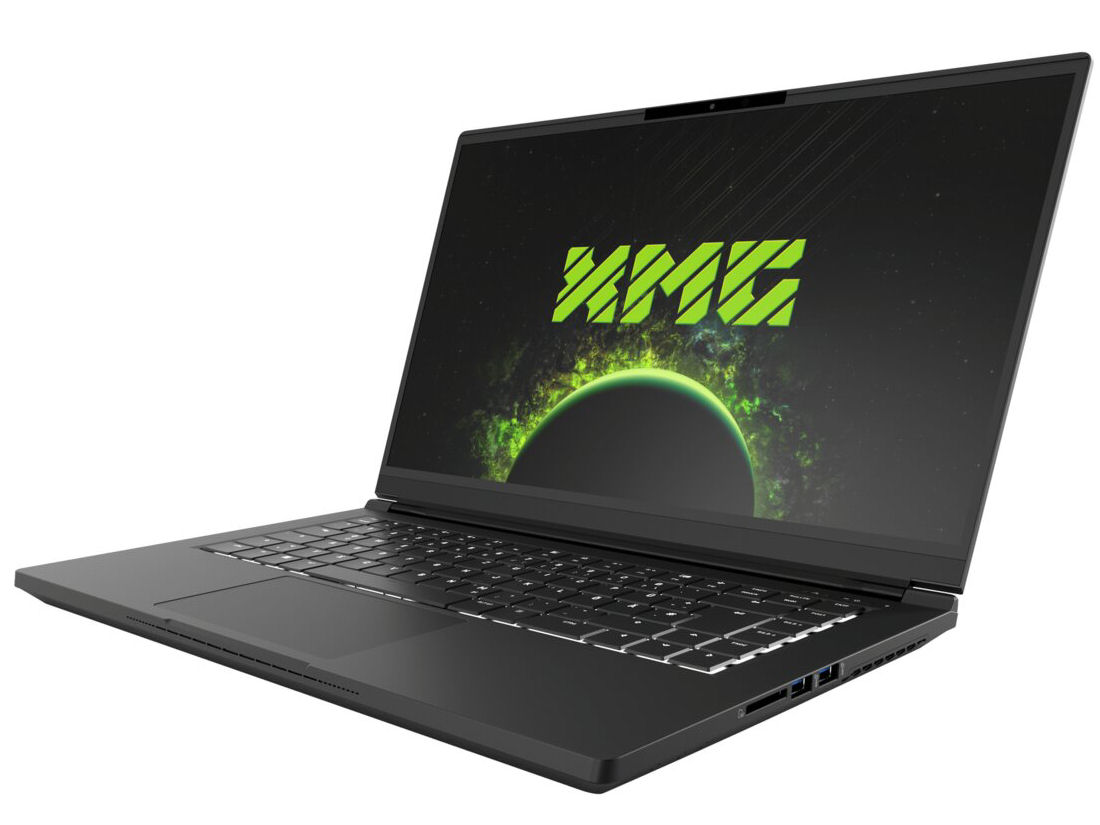
The Schenker XMG Fusion 15 is mainly a gaming laptop, but it's also designed for the creative sector. The device offers a compromise between performance, small size and portability: High-end hardware (Core i7-11800H, GeForce RTX 3070 Laptop) is paired with a 93 Wh battery and packed into a compact case. The whole package weighs just under 2 kg (~4.4 lb). A barebone from Intel (NUC X15 Laptop Kit C71FBF) serves as the basis for the Fusion.
Its competitors are similarly compact, lightweight devices like the Razer Blade 15 Base model, the MSI Delta 15 and the Asus TUF Dash F15 FX517ZR. The broader group of competitors includes laptops like the Acer Nitro 5 AN515-58 and the HP Omen 16.
Possible contenders in comparison
Rating | Date | Model | Weight | Height | Size | Resolution | Best Price |
|---|---|---|---|---|---|---|---|
| 87.4 % | 08/2022 | SCHENKER XMG Fusion 15 (Mid 22) i7-11800H, GeForce RTX 3070 Laptop GPU | 1.9 kg | 21.65 mm | 15.60" | 2560x1440 | |
| 85.8 % | 07/2022 | Asus TUF Dash F15 FX517ZR i7-12650H, GeForce RTX 3070 Laptop GPU | 2 kg | 20.7 mm | 15.60" | 2560x1440 | |
| 84 % | 06/2022 | Acer Nitro 5 AN515-58-72QR i7-12700H, GeForce RTX 3070 Ti Laptop GPU | 2.5 kg | 26.8 mm | 15.60" | 2560x1440 | |
| 85.5 % | 05/2022 | HP Omen 16-b1090ng i7-12700H, GeForce RTX 3070 Ti Laptop GPU | 2.3 kg | 23 mm | 16.10" | 2560x1440 | |
| 82.9 % | 10/2021 | MSI Delta 15 A5EFK R9 5900HX, Radeon RX 6700M | 2 kg | 19 mm | 15.60" | 1920x1080 | |
| 85.5 % | 03/2021 | Razer Blade 15 Base Edition 2021, i7-10750H RTX 3060 i7-10750H, GeForce RTX 3060 Laptop GPU | 2.1 kg | 19.9 mm | 15.60" | 1920x1080 |
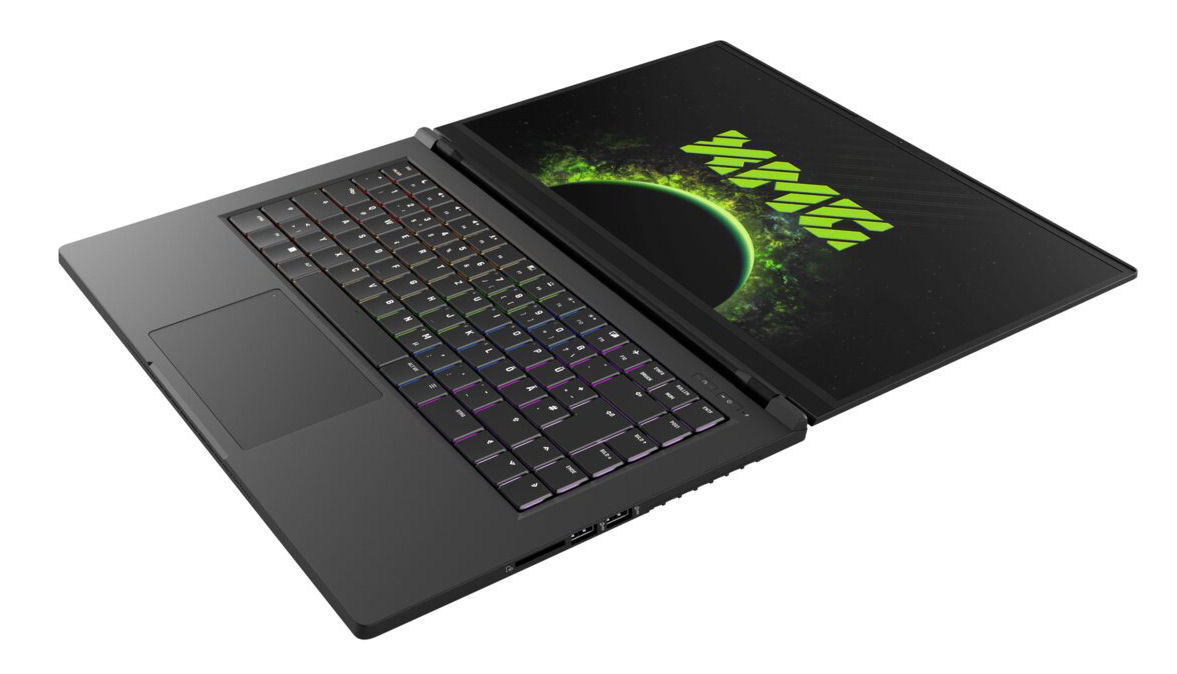
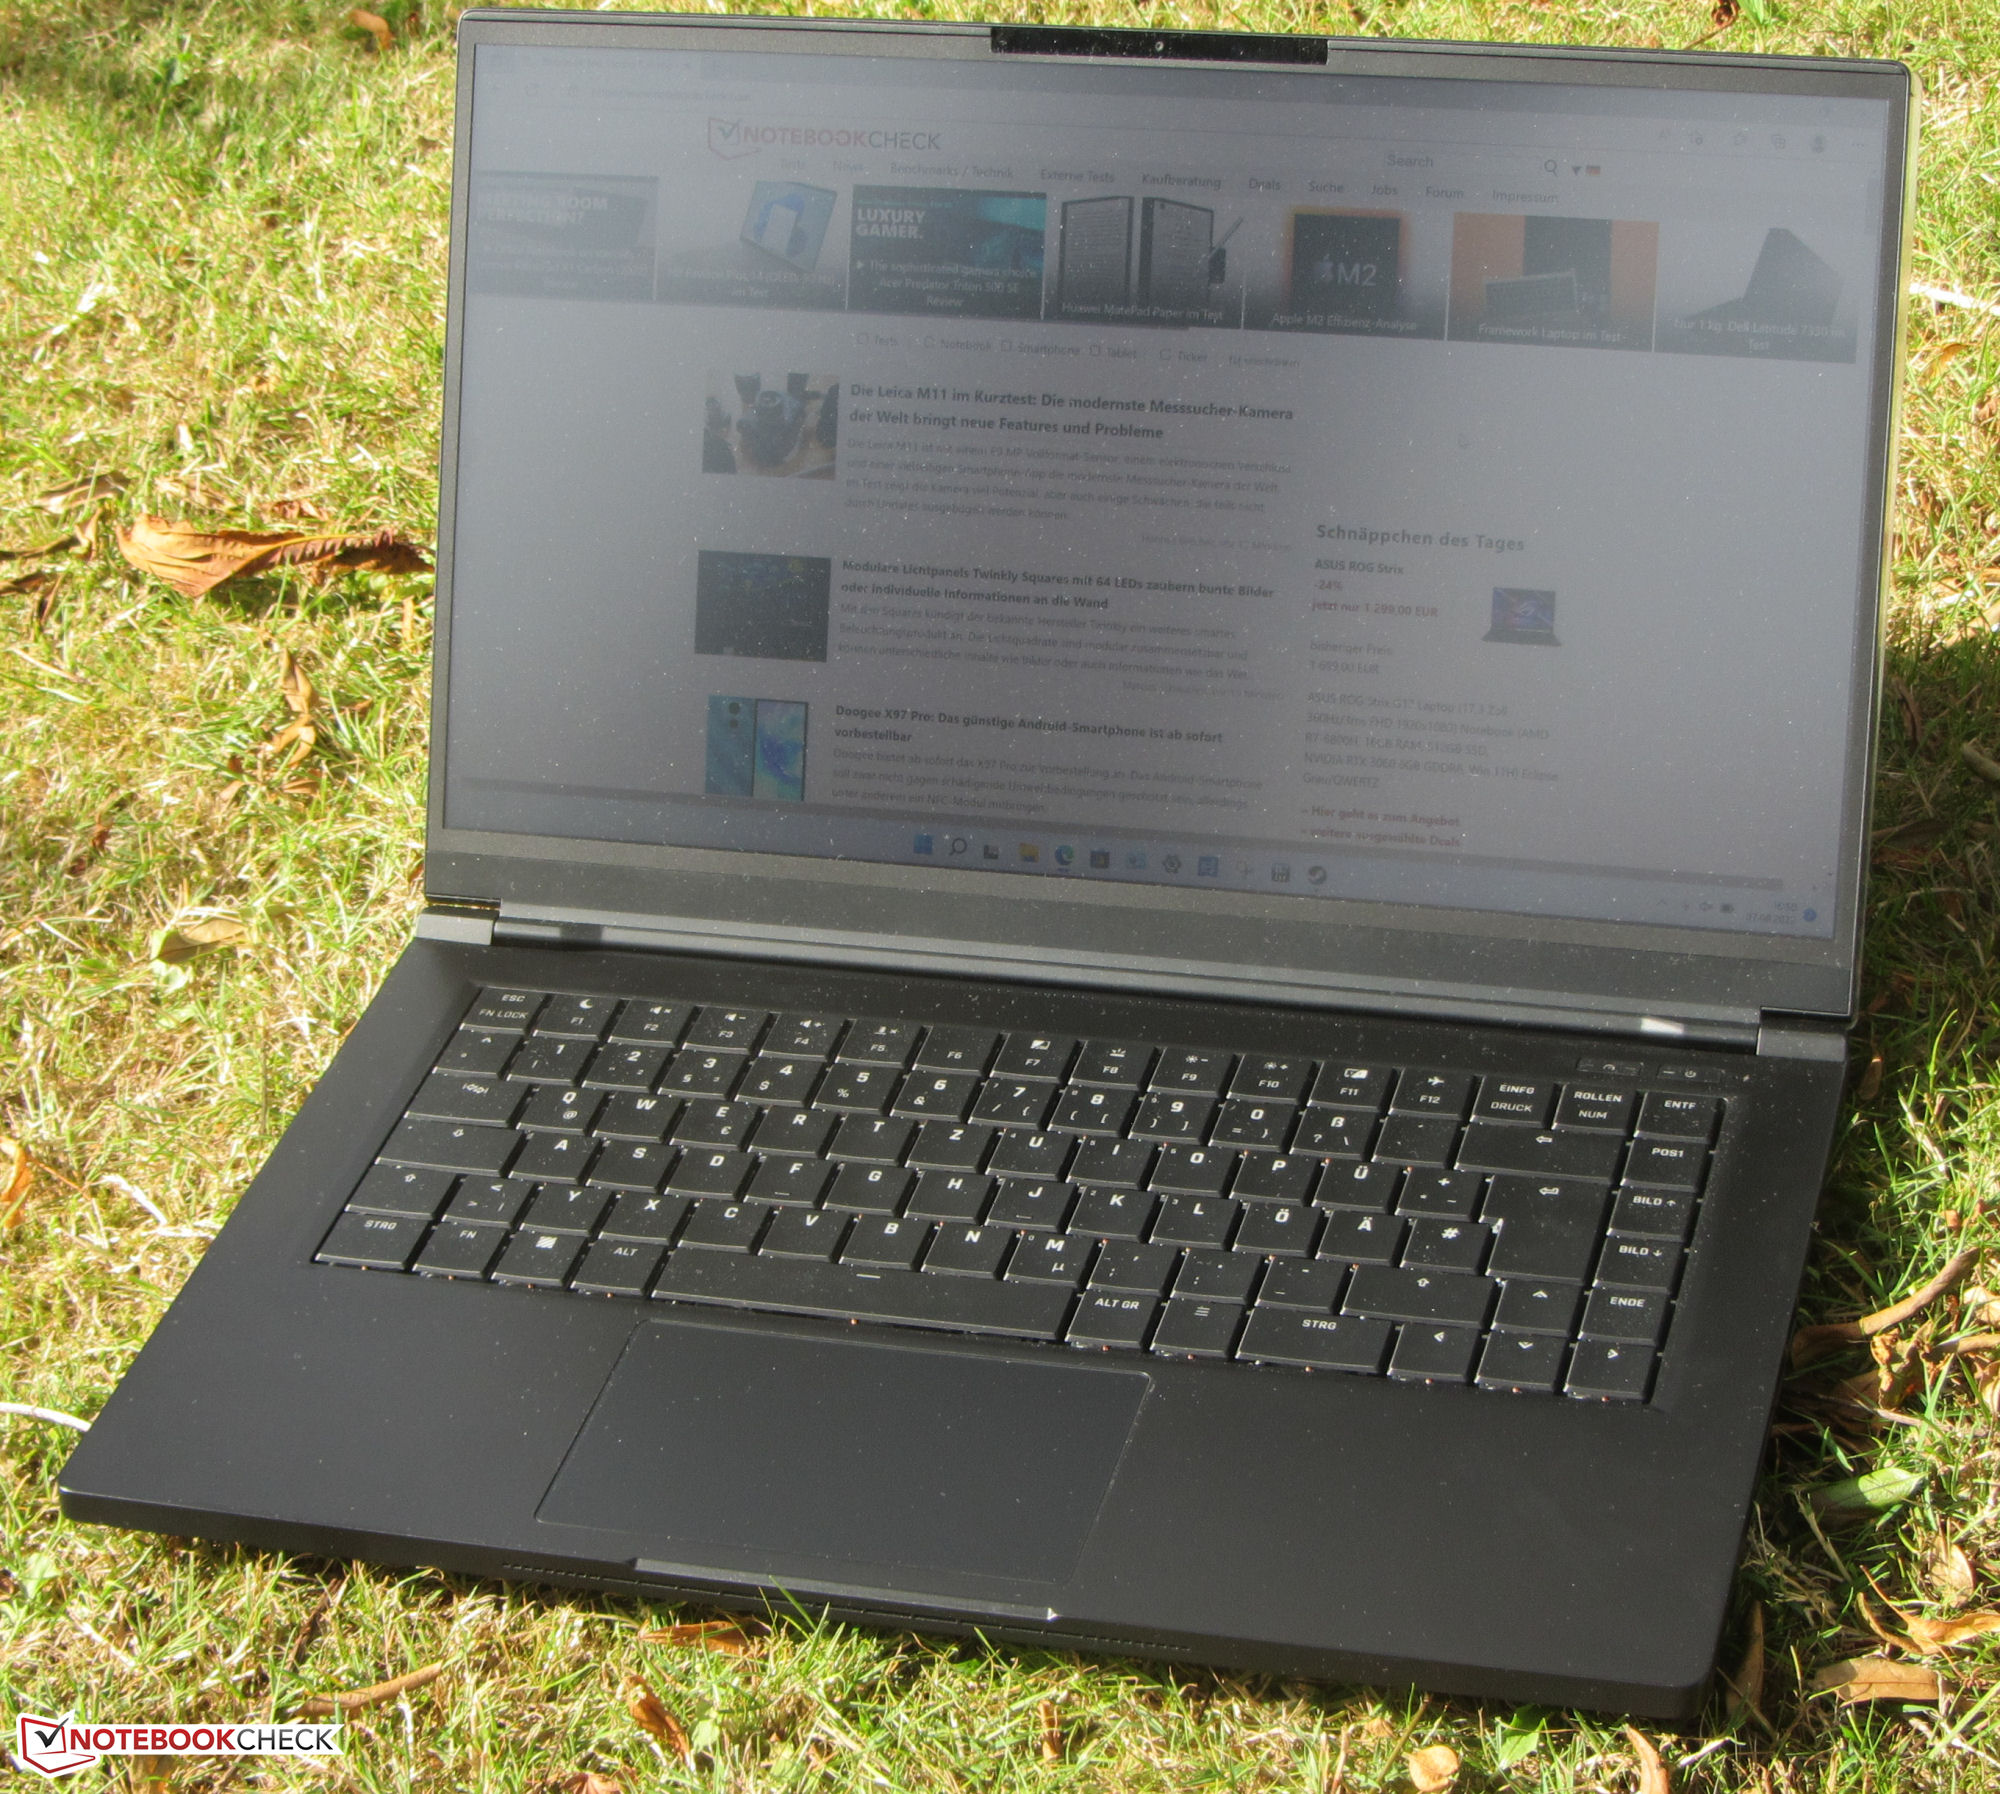
Case - A magnesium chassis for the Fusion
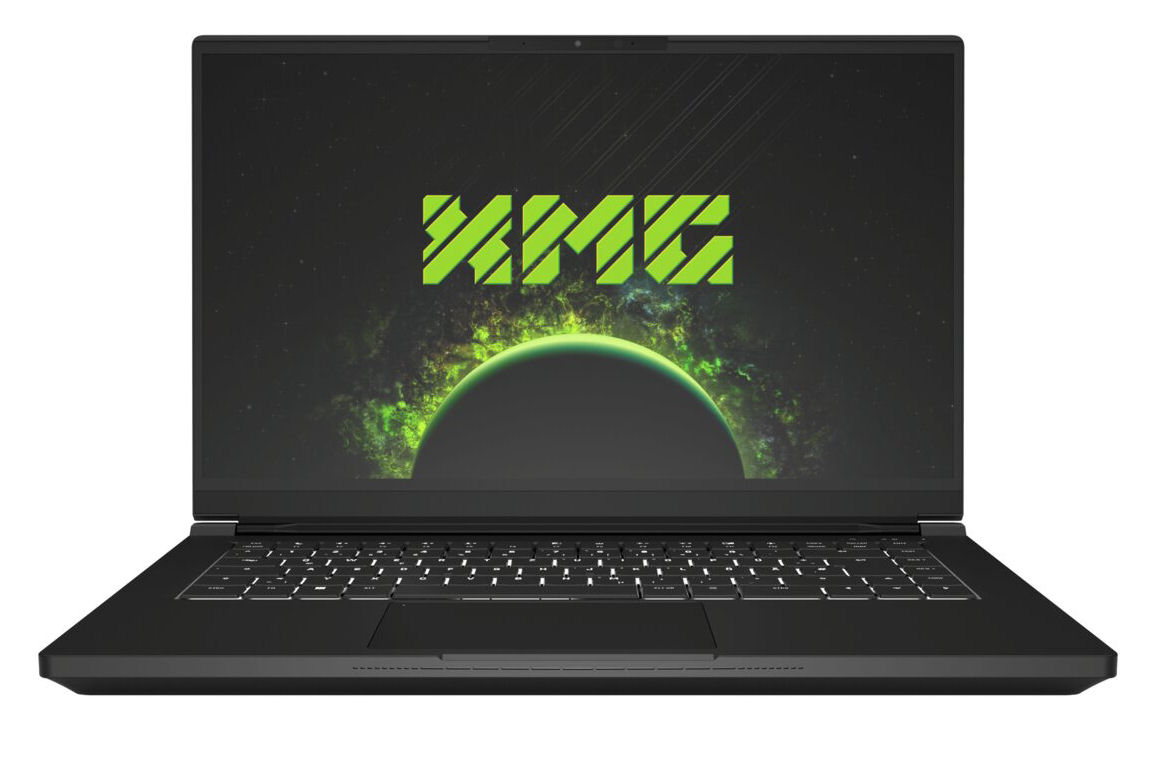
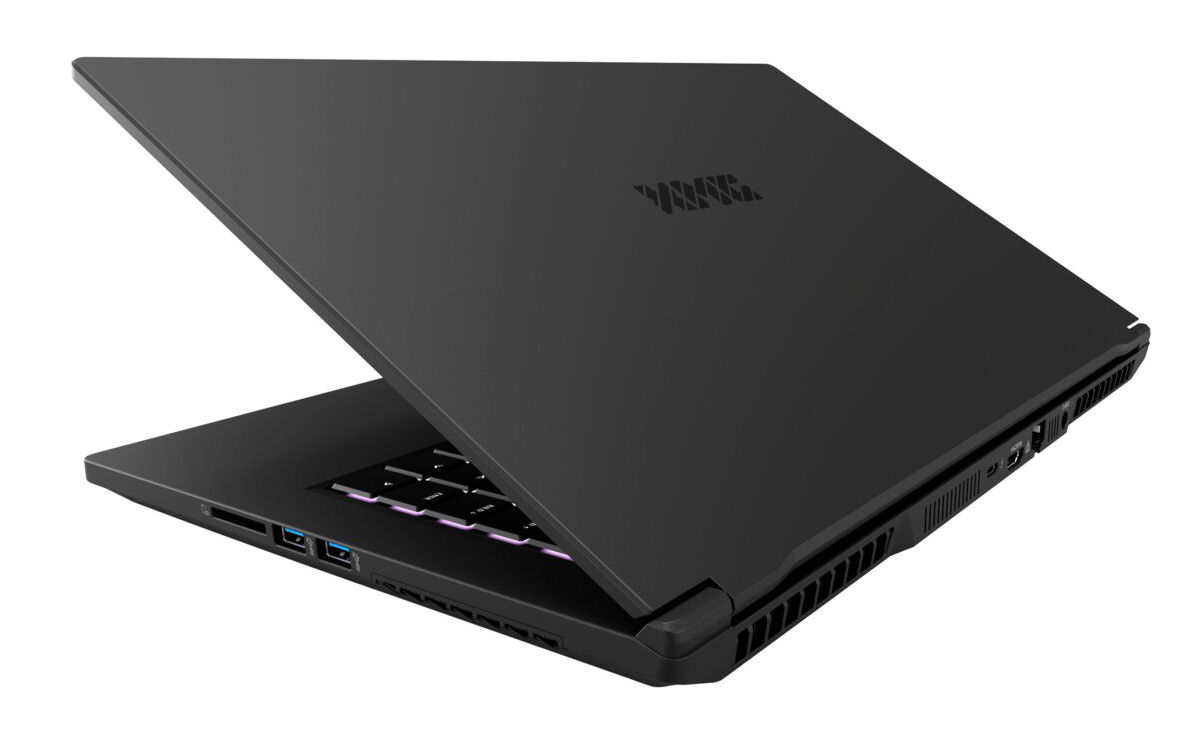
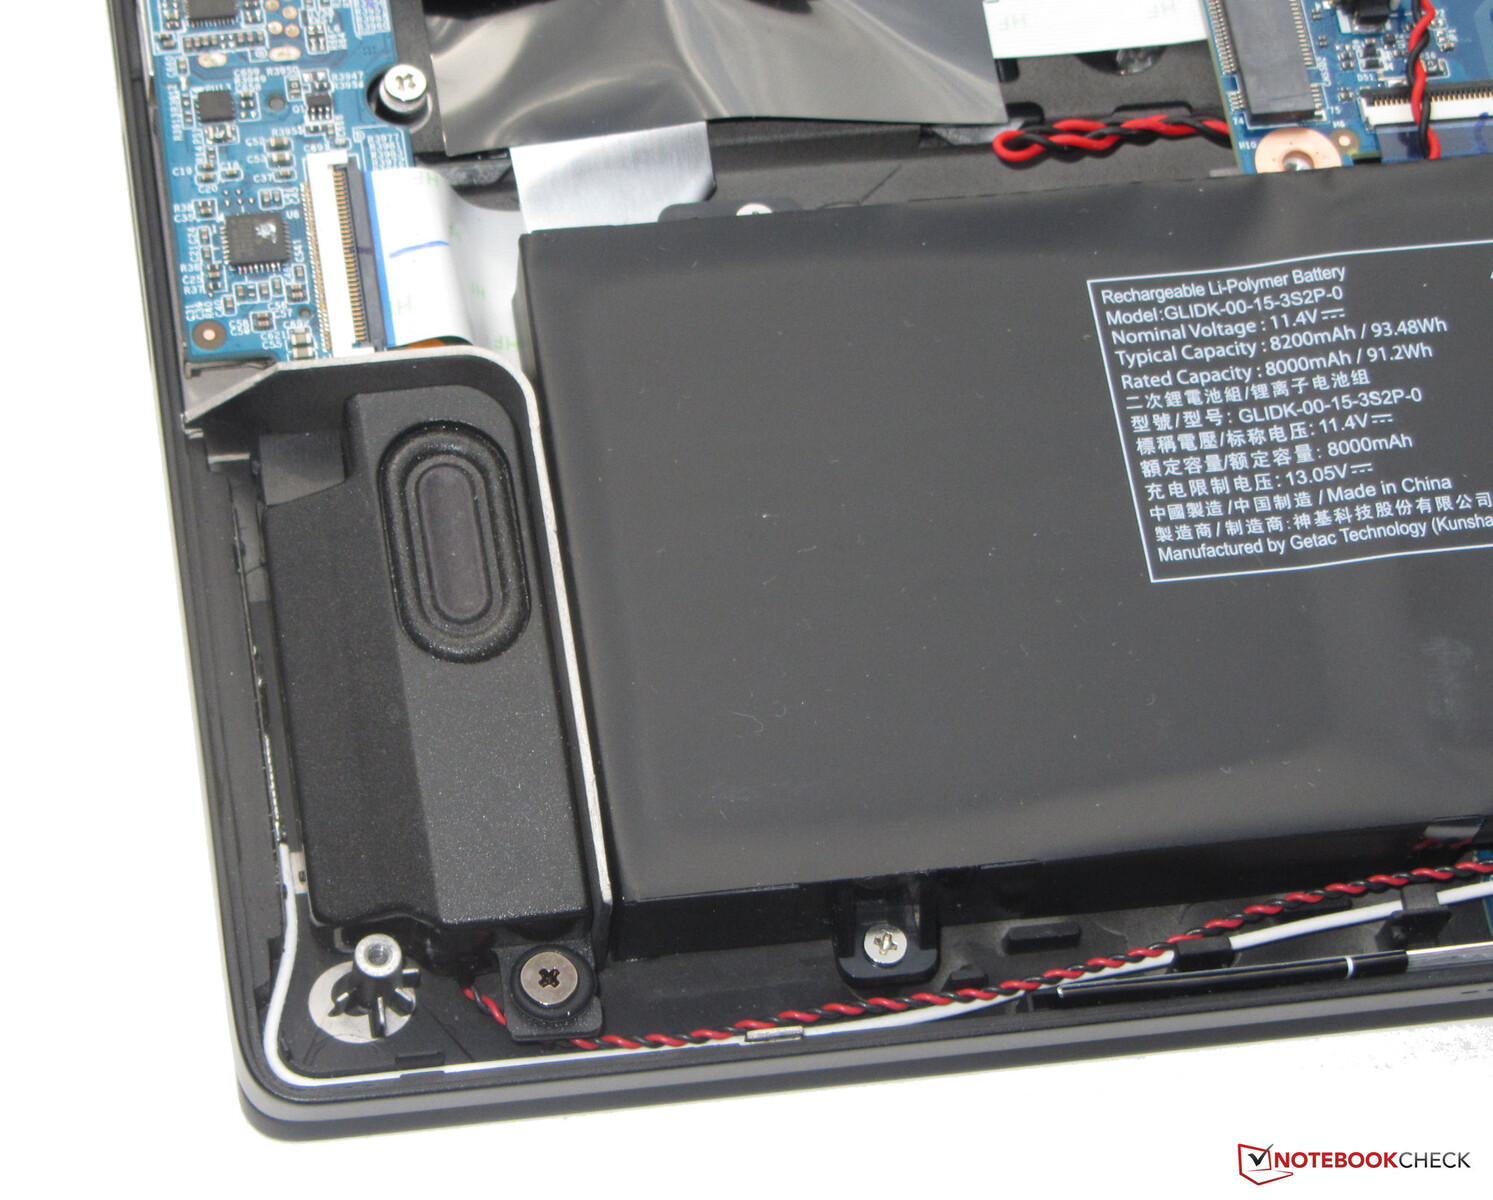
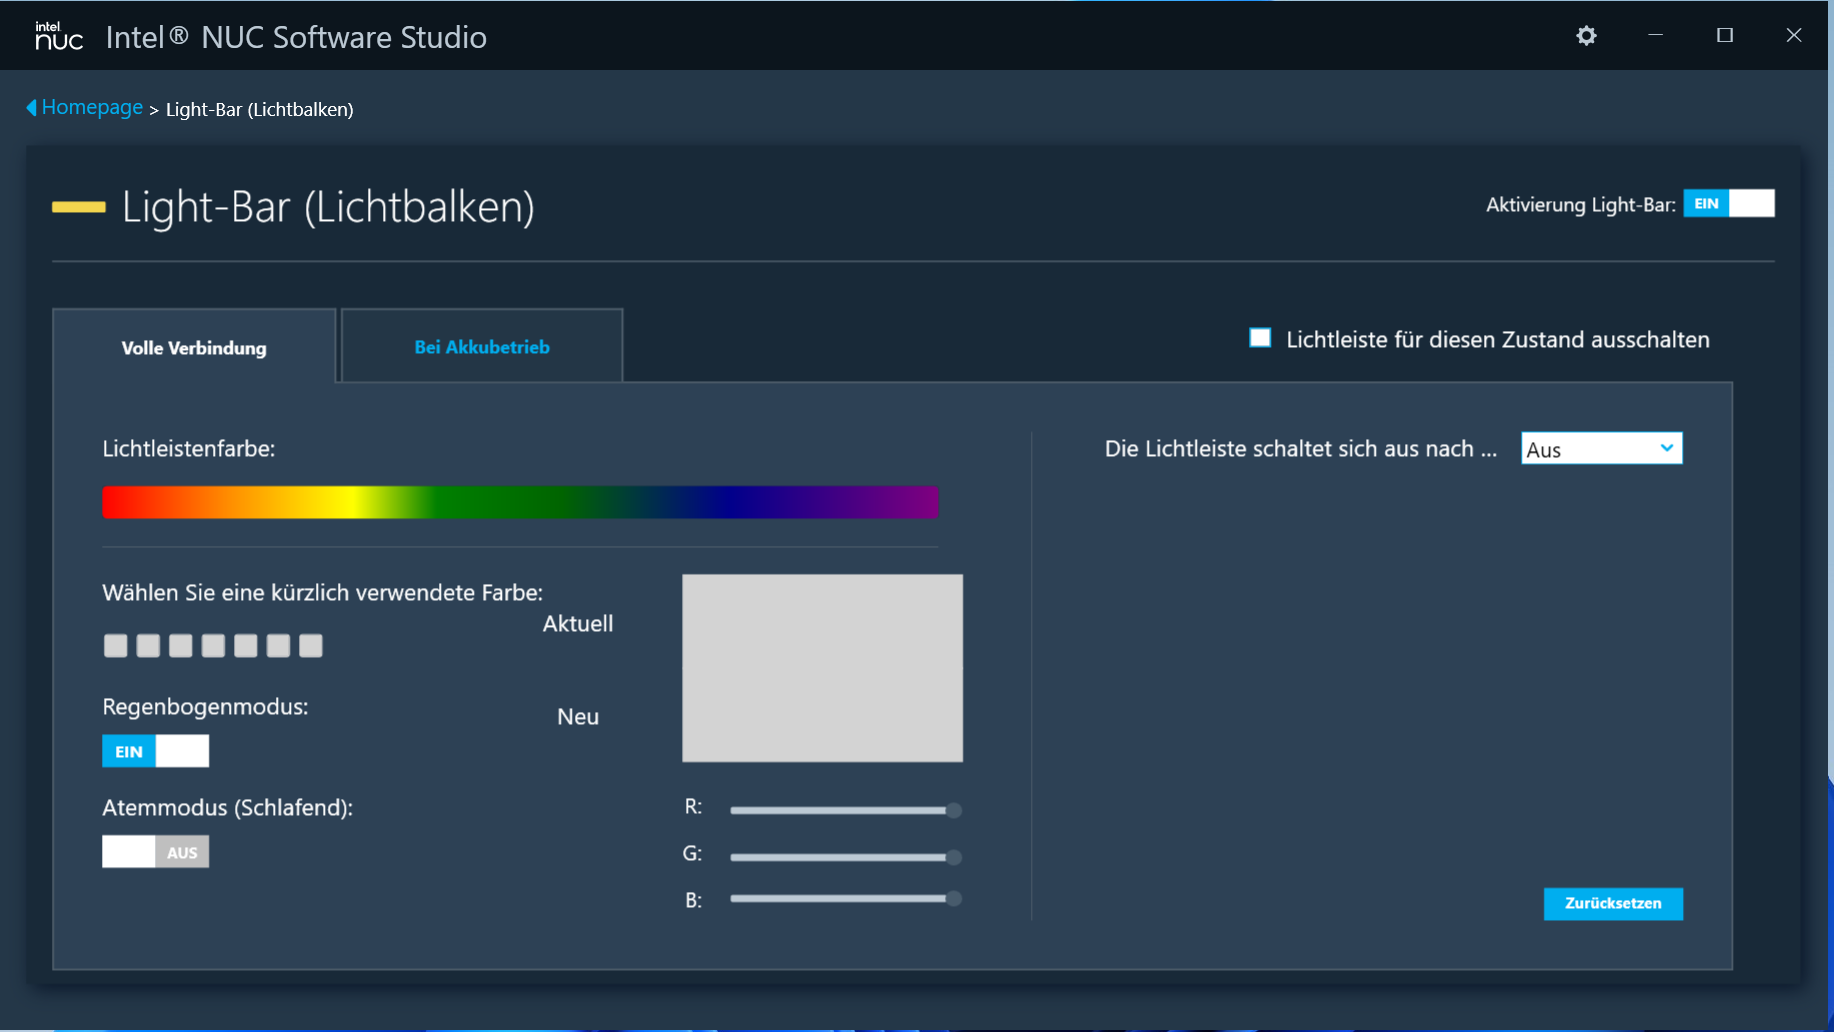
The matte black case is crafted from a magnesium alloy, and it offers a sleek, no-frills design. Schenker opts for smooth surfaces. A configurable LED strip (RGB) on the case's side that's facing the user provides some color in addition to the keyboard lighting. The battery is built into the device (screwed, not glued). You can access the interior after removing the bottom cover.
The laptop doesn't exhibit any manufacturing flaws. The gap dimensions are accurate, and there are no material protrusions to be found. The base unit can hardly be bent, but the lid can. The hinges keep the lid firmly in position, and the maximum opening angle is 180 degrees. A one-hand opening of the lid is possible.

The Fusion can't quite match the compact dimensions of the Blade 15, but it undercuts its weight by about 200 grams (~7 oz). This makes it the lightest device in the comparison field.
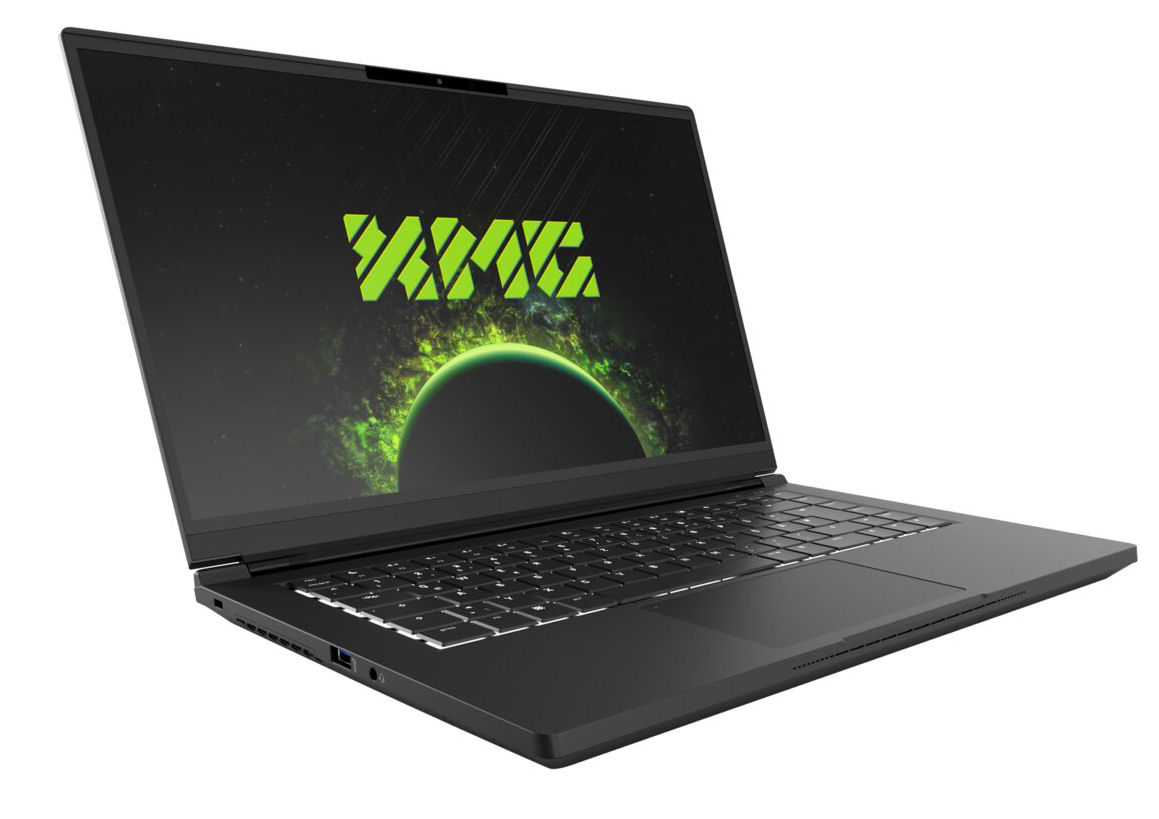
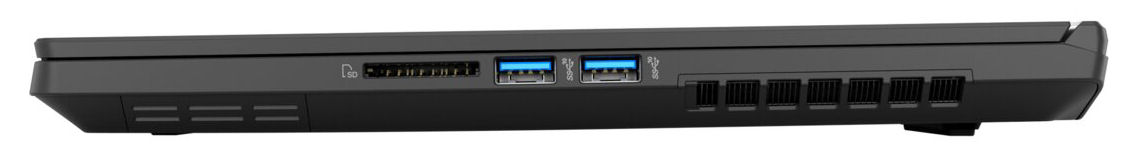
Connectivity - XMG 15 equipped with Thunderbolt 4
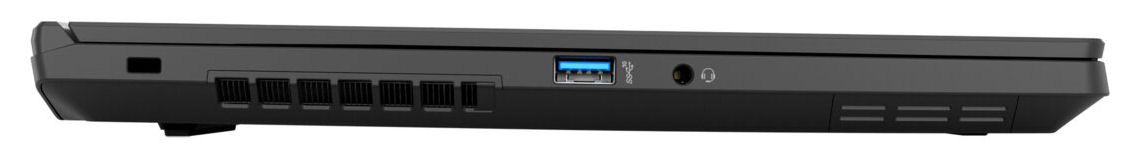
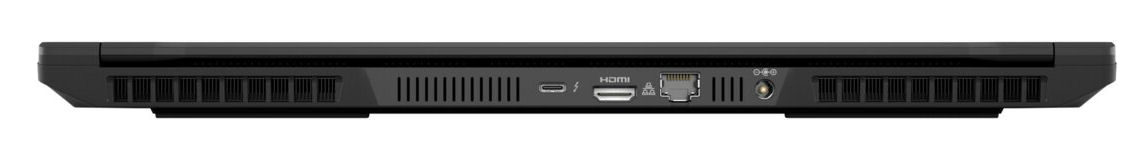
The Fusion has three USB-A ports (USB 3.2 Gen 2) and one USB-C port (Thunderbolt 4). The latter supports DisplayPort via USB-C. Altogether, the laptop offers two video outputs (1x DP, 1x HDMI). Furthermore, there's a combined audio jack, a Gigabit Ethernet port and a slot for a cable lock.
The ports are distributed across three sides of the laptop. Good: The video outputs, the Ethernet port and the power connection are located at the back of the device. Therefore, the corresponding cables run towards the back and don't get in the way.
SD card reader
With maximum transfer rates of 77 MB/s (transfer of 250 jpg image files of about 5 MB each), the SD memory card reader (reference card: 128 GB AV PRO V60 microSD) exhibits medium speeds.
| SD Card Reader - average JPG Copy Test (av. of 3 runs) | |
| Average of class Gaming (19 - 202, n=100, last 2 years) | |
| SCHENKER XMG Fusion 15 (Mid 22) (AV PRO microSD 128 GB V60) | |
| HP Omen 16-b1090ng (AV PRO microSD 128 GB V60) | |
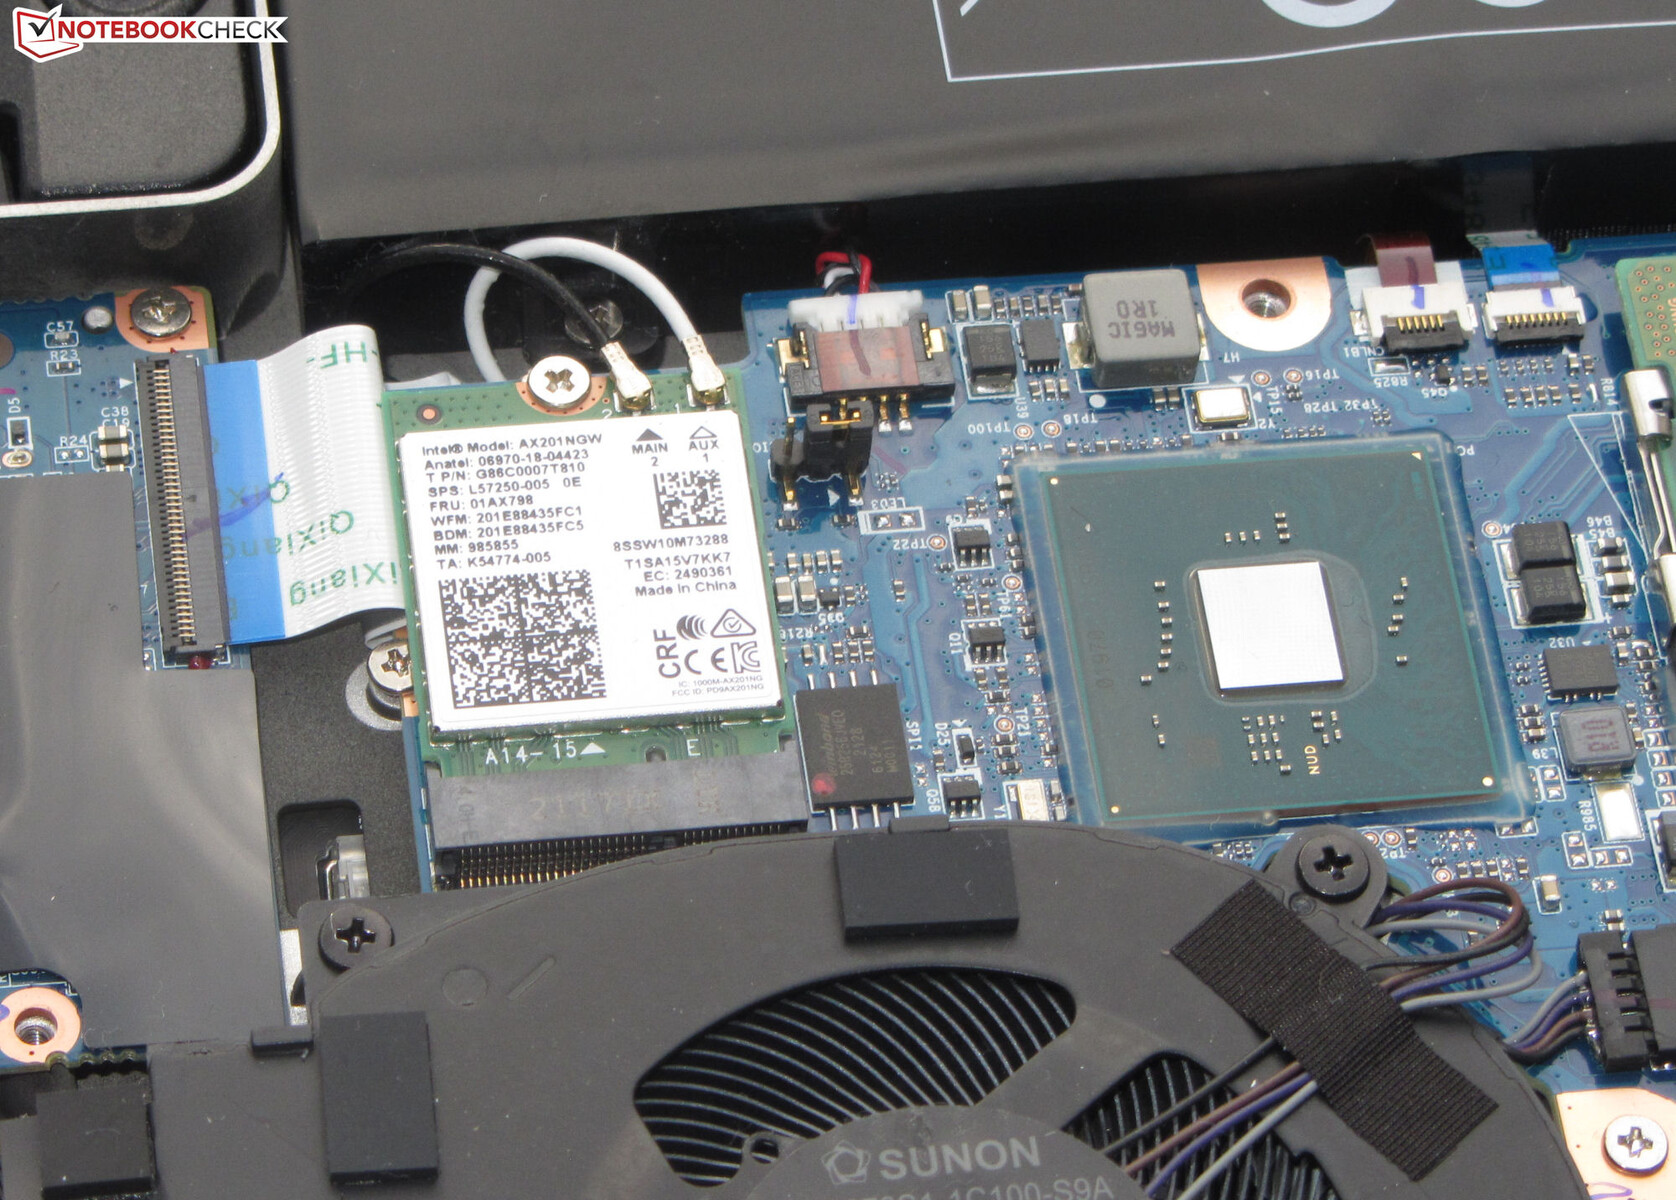
Communication
The Wi-Fi transfer rates determined under optimal conditions (no other Wi-Fi devices nearby, short distance between laptop and server PC) are very good, and they are in line with the Wi-Fi chip's capabilities (Intel AX201; 802.11ax). A Gigabit Ethernet chip (Intel I225-V, 2.5 gigabits) handles wired network connections.
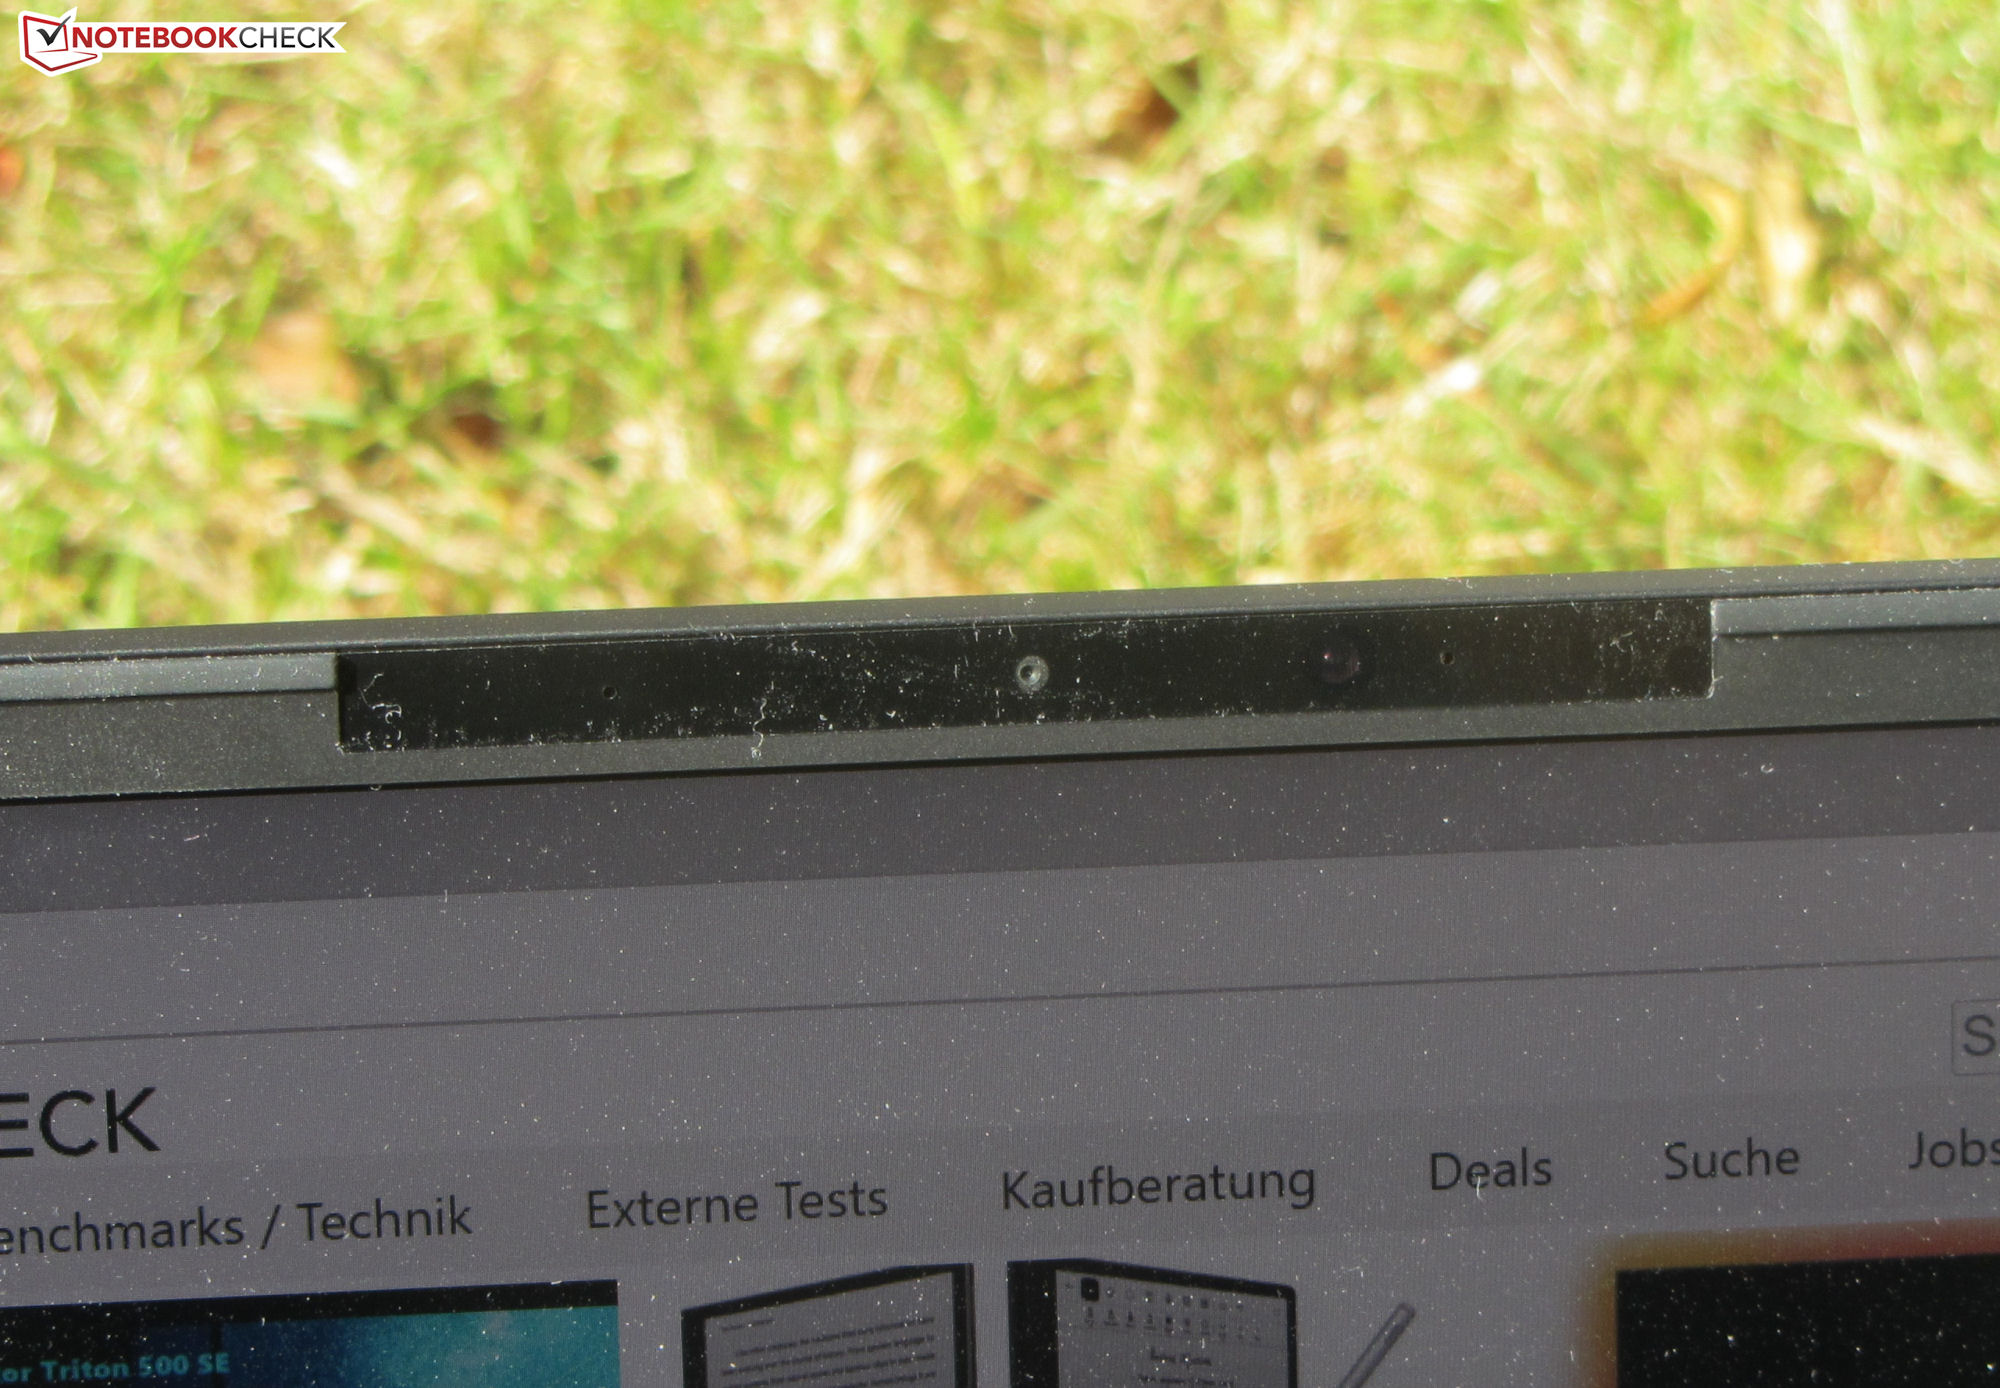
Webcam
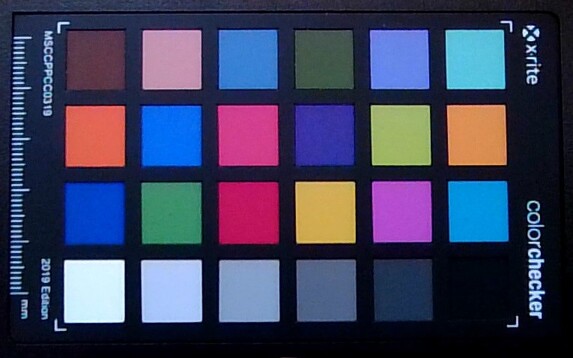
The webcam (0.9 MP) produces images in a maximum resolution of 1,280x720 pixels. There are issues with color accuracy: The colors deviate from the target. The camera doesn't have a mechanical shutter.
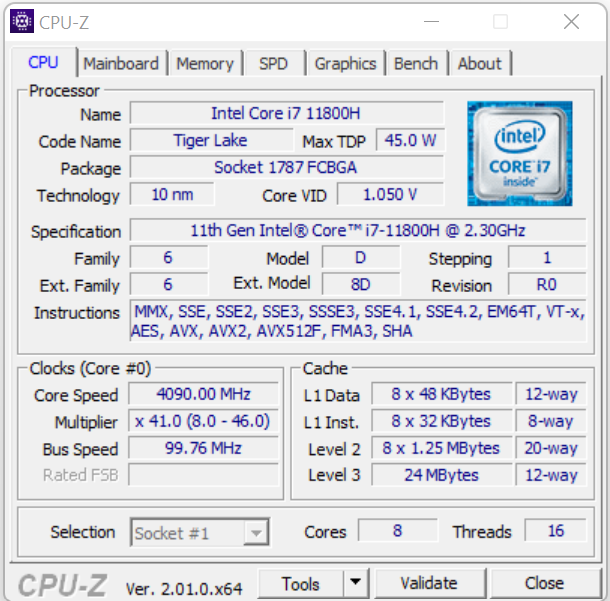
 GeForce RTX 3070 Laptop GPU, i7-11800H, Samsung SSD 980 Pro 1TB MZ-V8P1T0BW")
 GeForce RTX 3070 Laptop GPU, i7-11800H, Samsung SSD 980 Pro 1TB MZ-V8P1T0BW")
Accessories
Along with warranty information and a printed user manual, the laptop comes with a USB stick (drivers, instructions), stickers and a mouse pad.
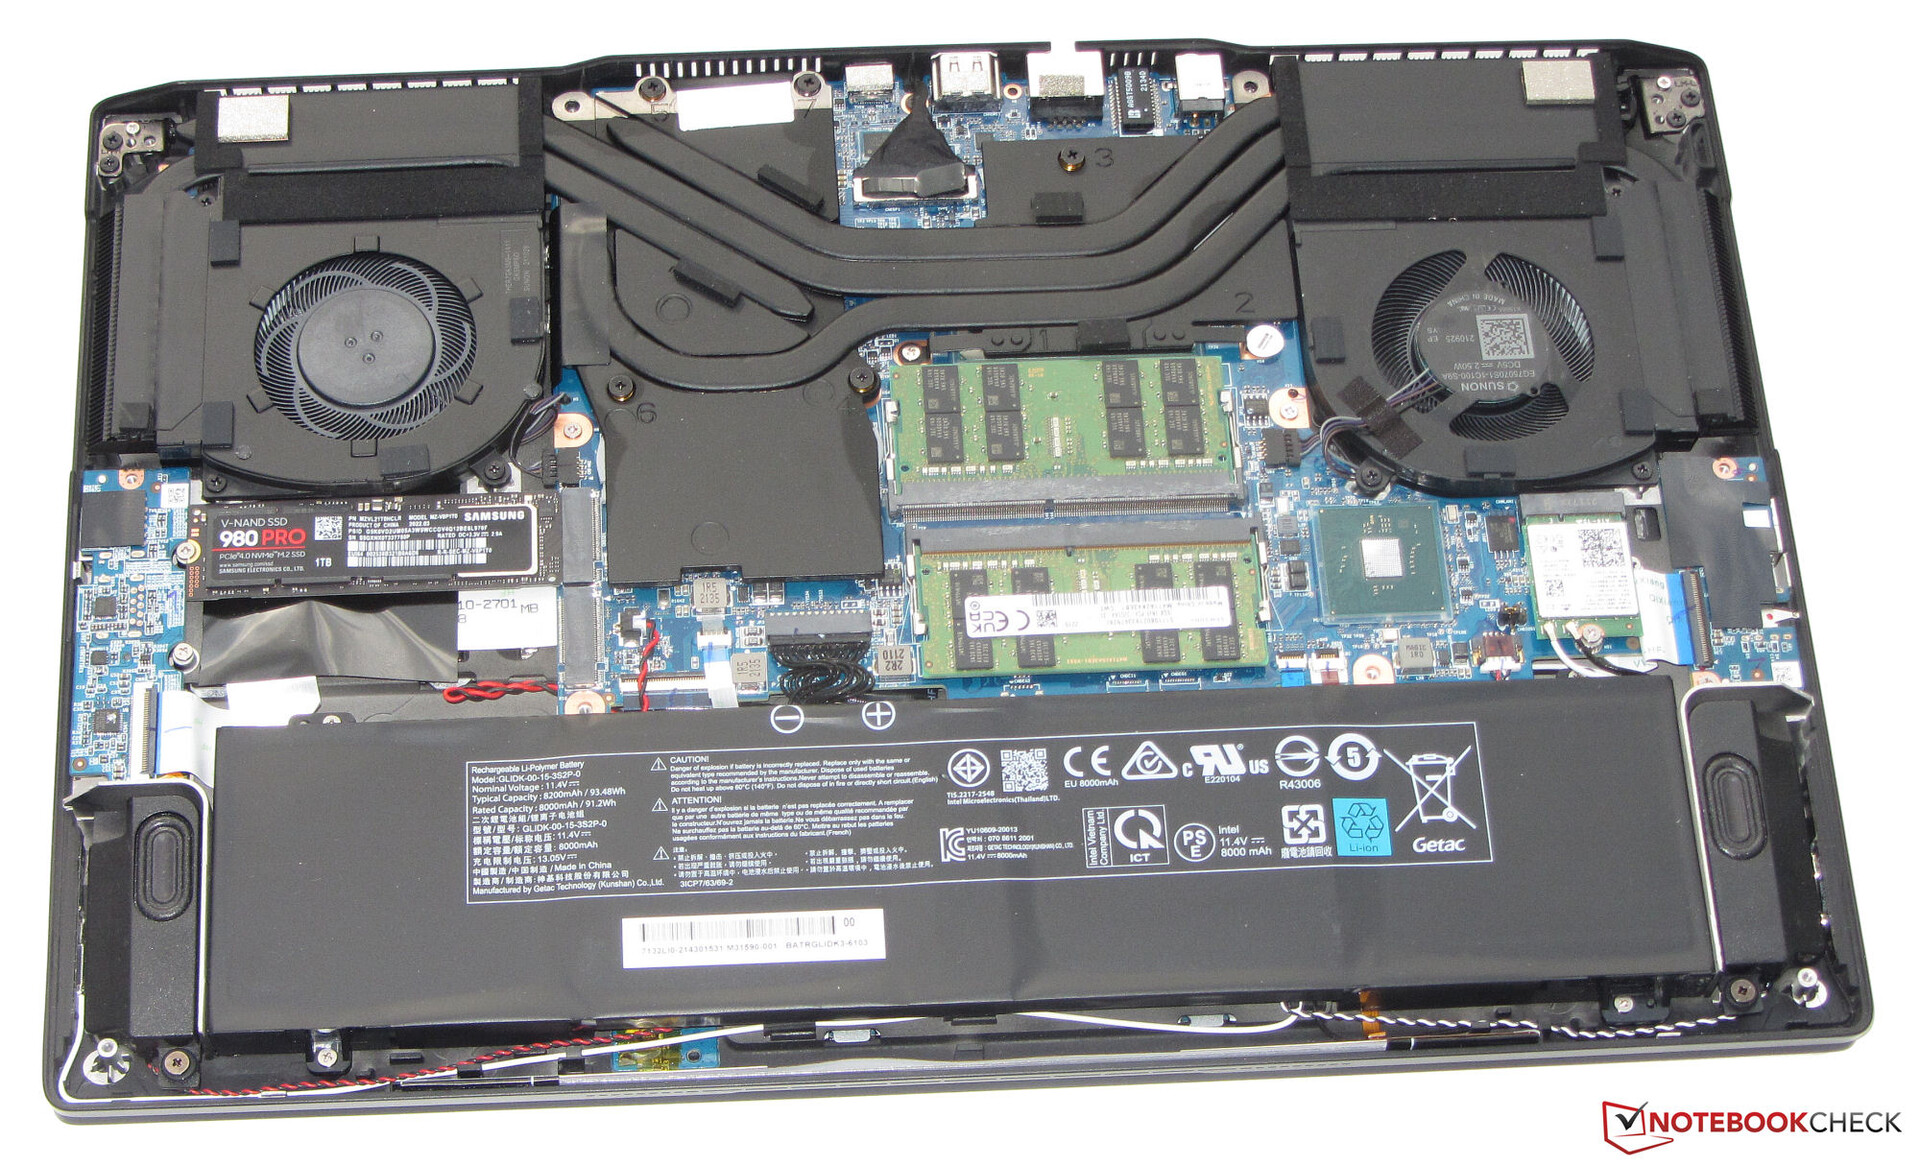
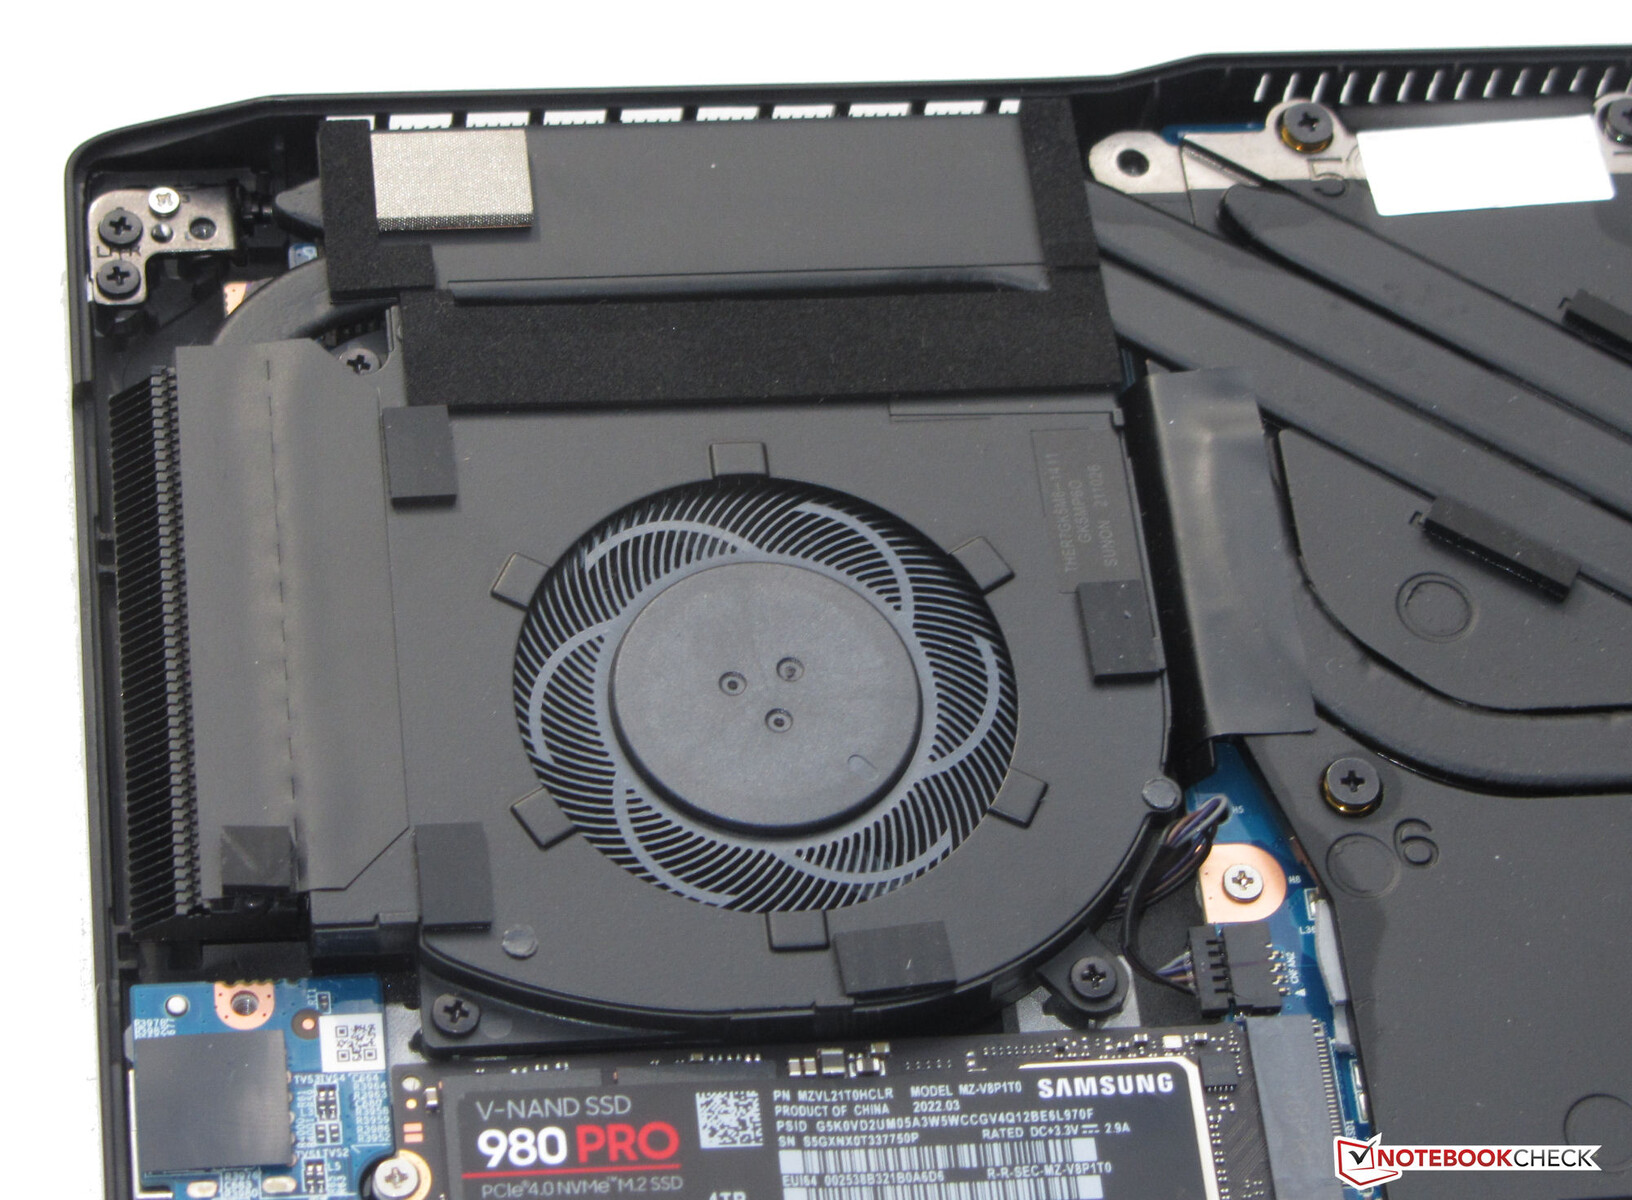
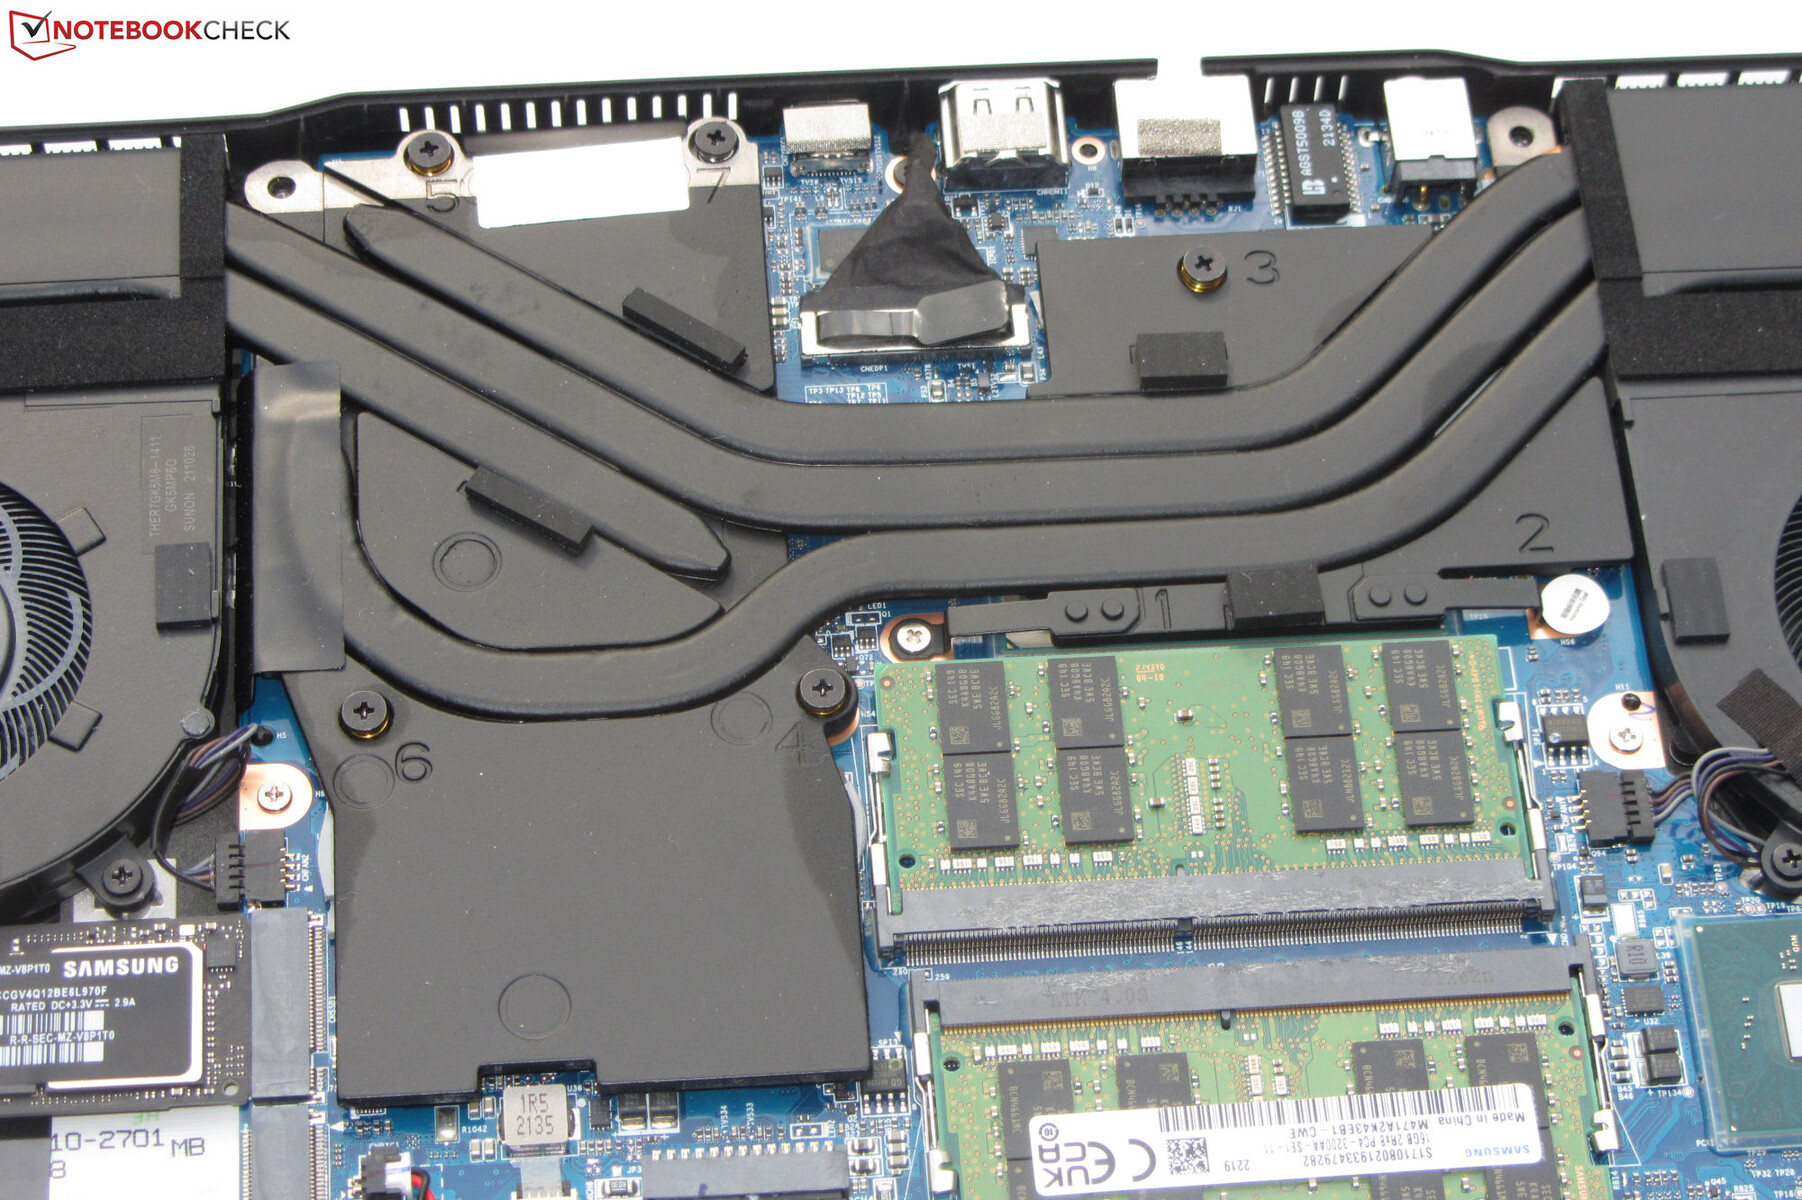
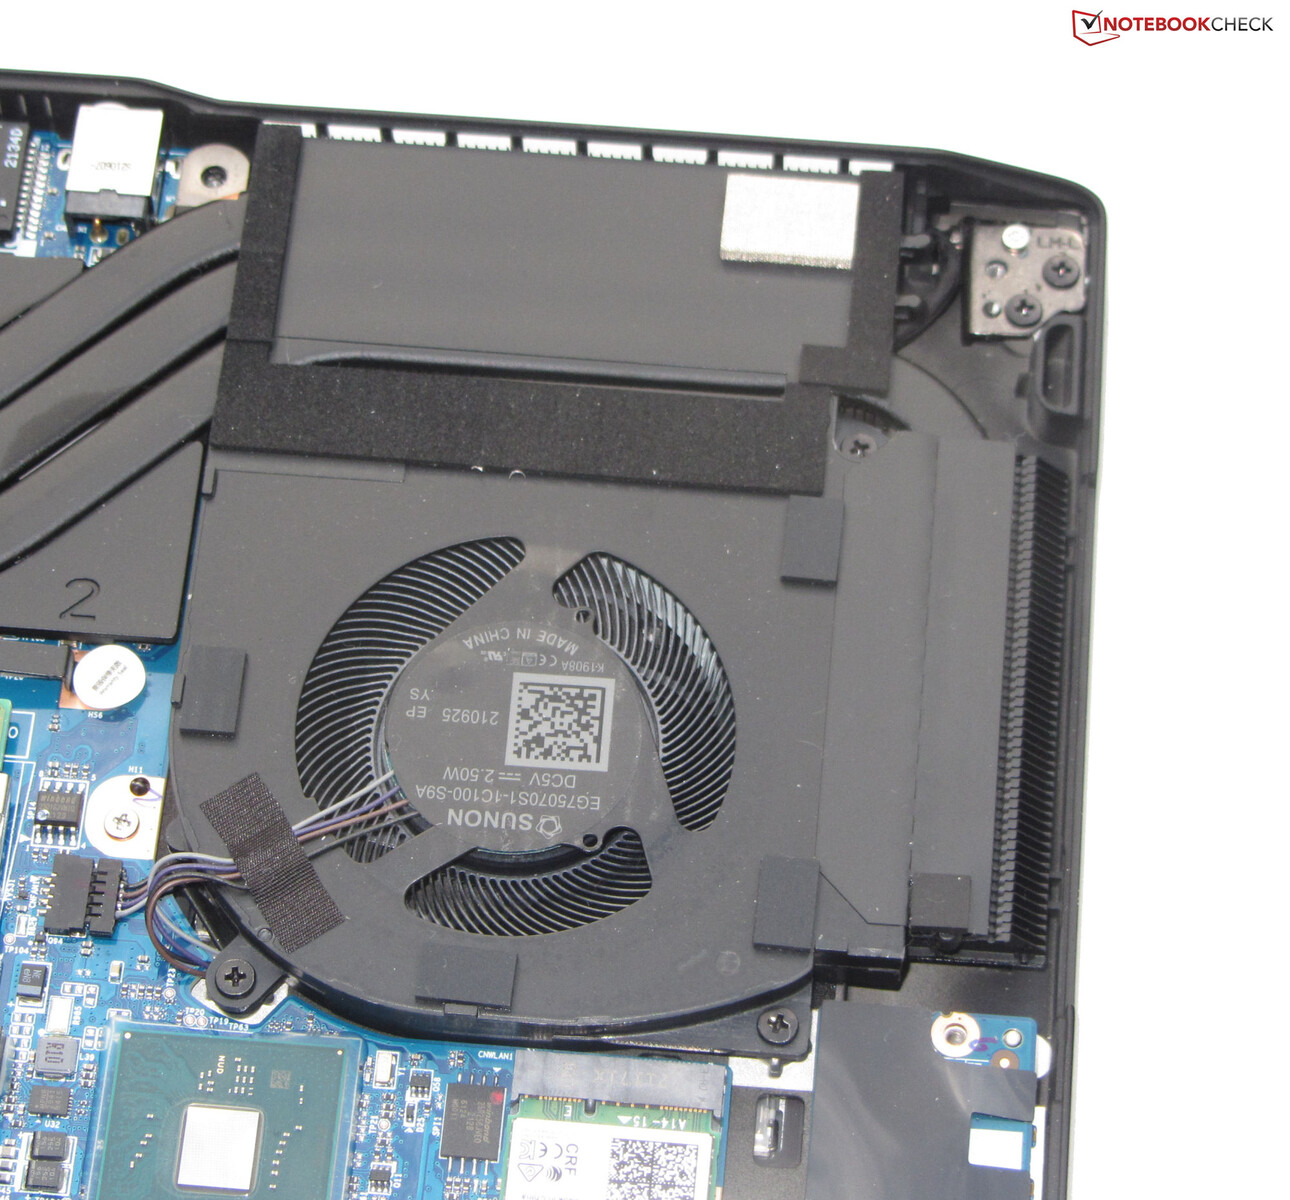
Maintenance
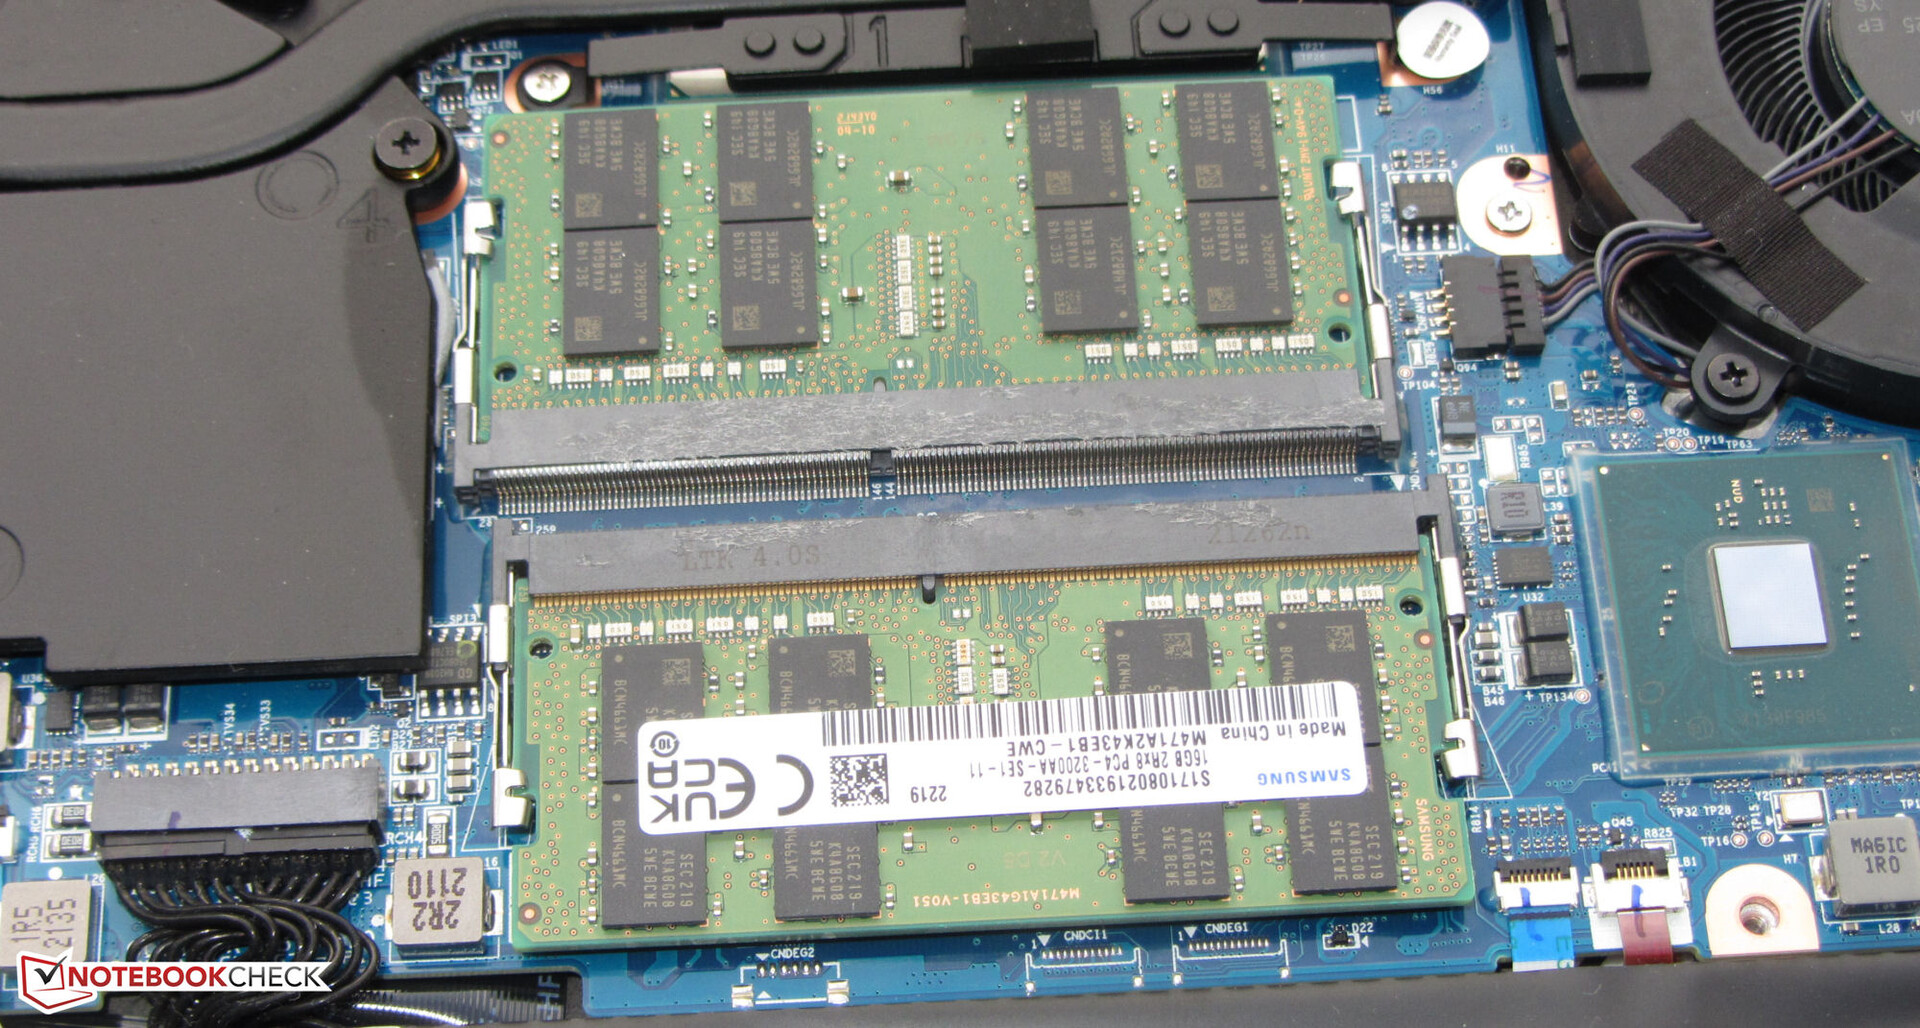
Maintenance and upgrade procedures can be carried out without issues. After loosening all screws on the bottom of the device, the bottom cover can be removed quite easily. You then have access to the RAM slots (both occupied), the SSD (PCIe 4), the second M.2-2280 slot (PCIe 3/SATA), the Wi-Fi module, the fans, the BIOS battery and the battery.
Warranty
The base warranty covers two years - including pick-up service and 6 months of quick repair (repair within 48 hours). A 36-month warranty costs between 100 and 149 Euros (~$99.53 and $148.30) - depending on the quick-repair period selected.
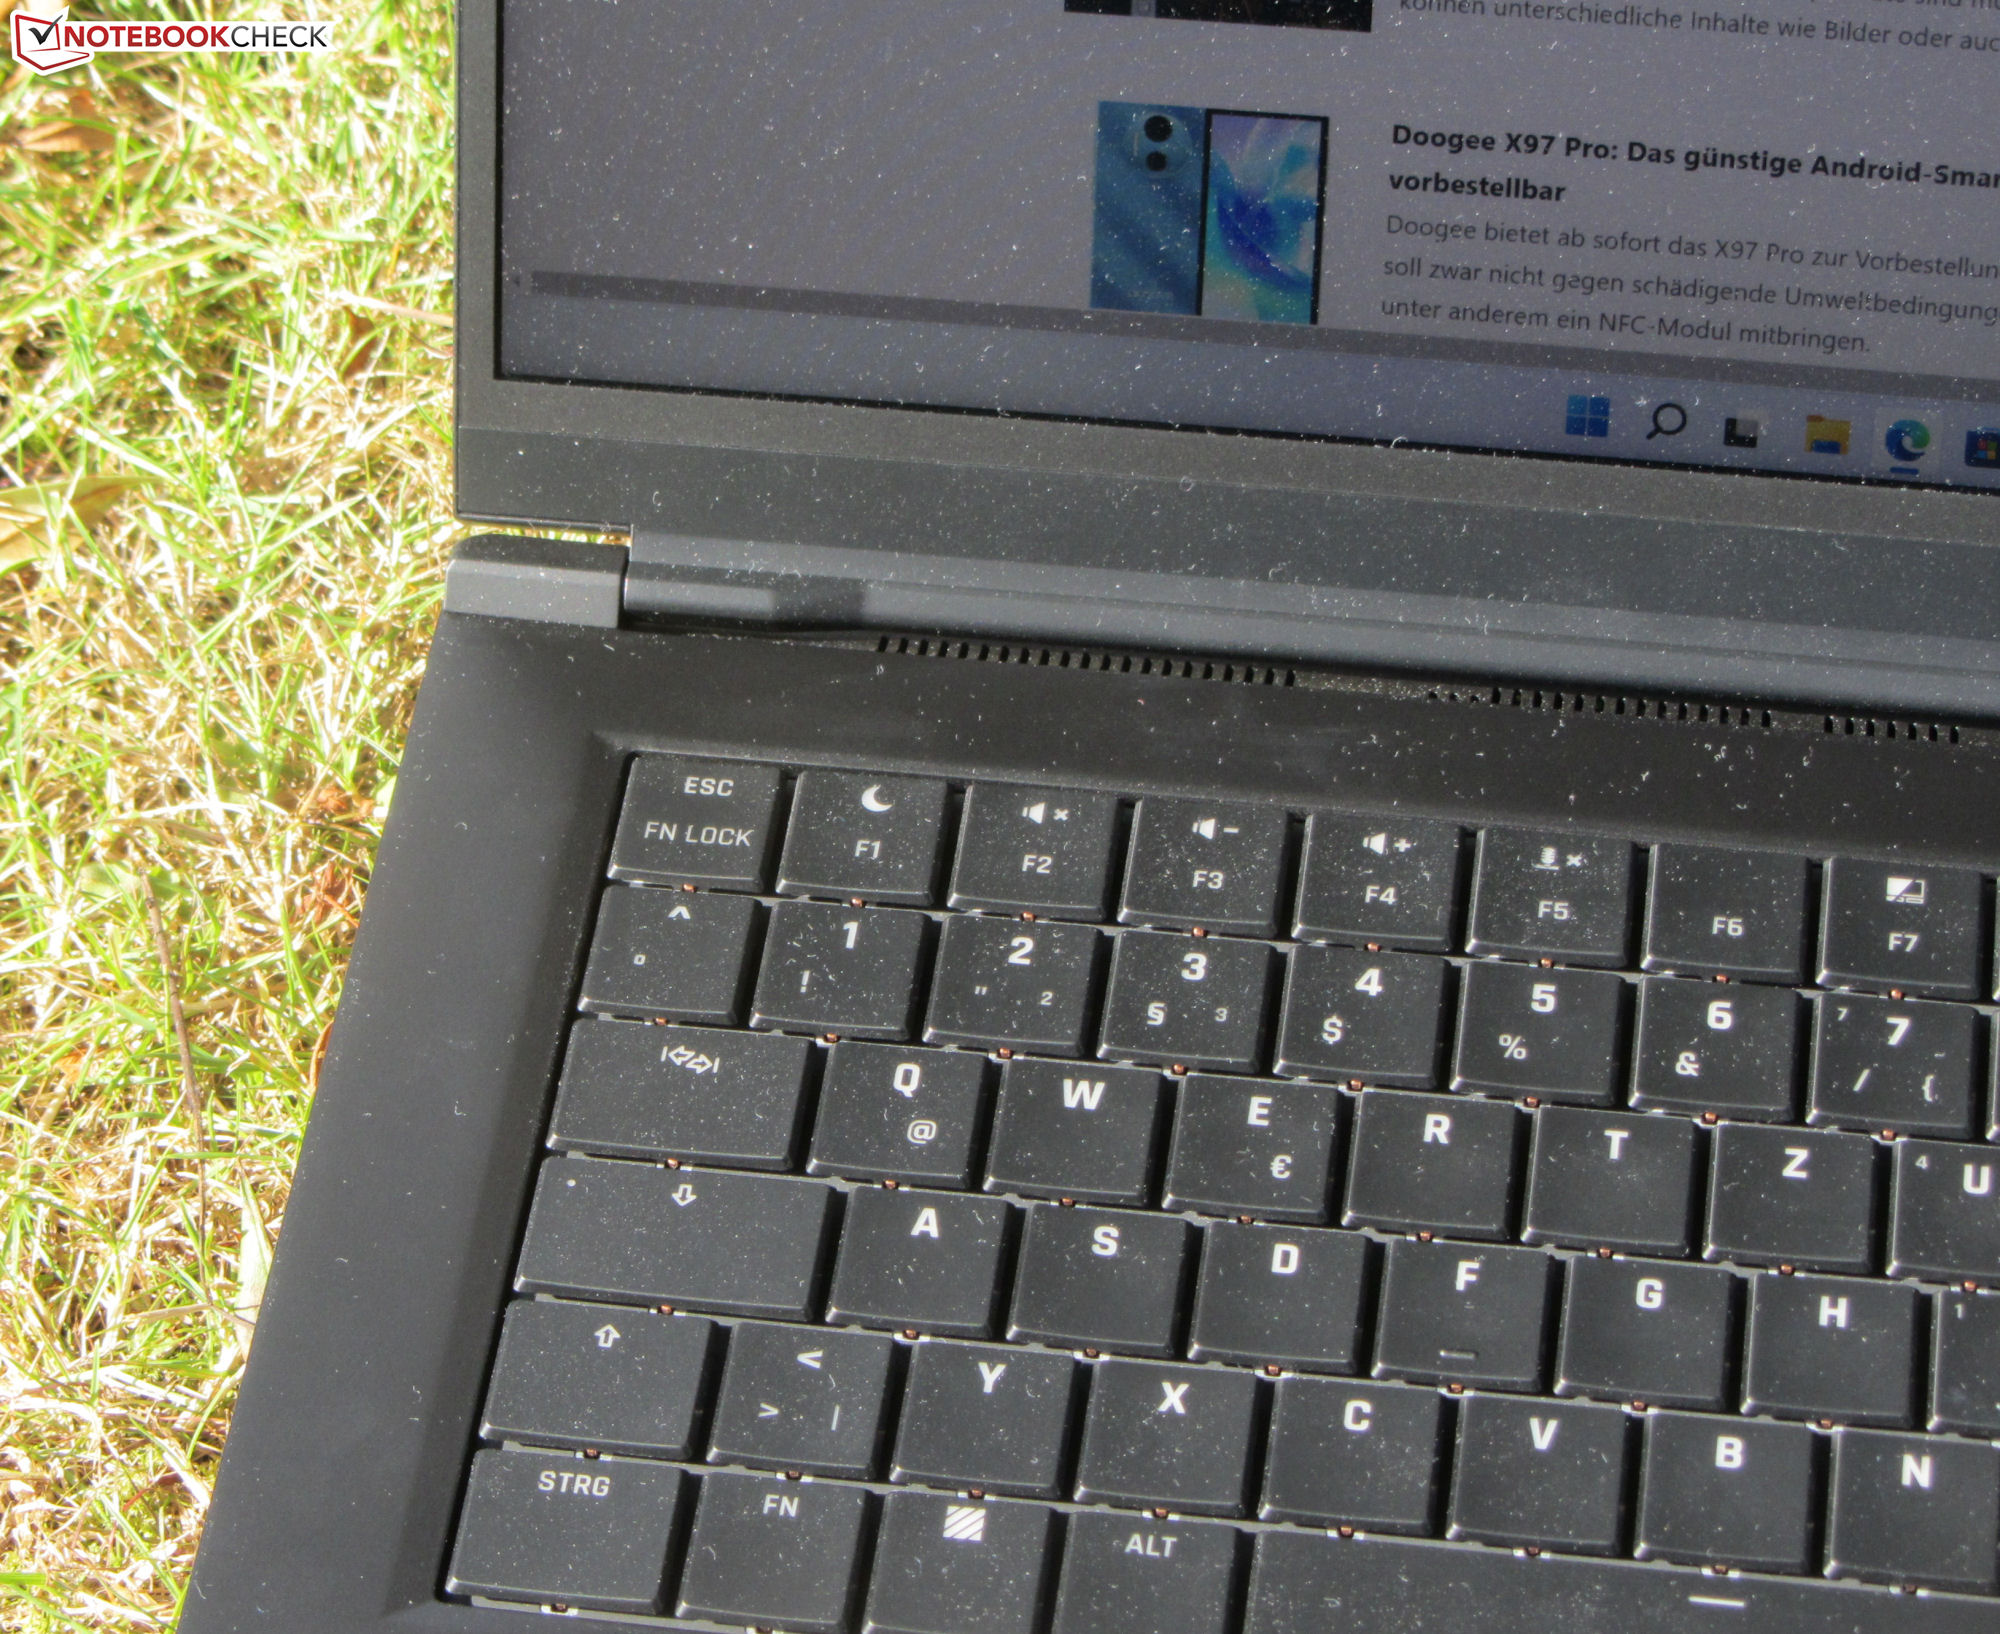
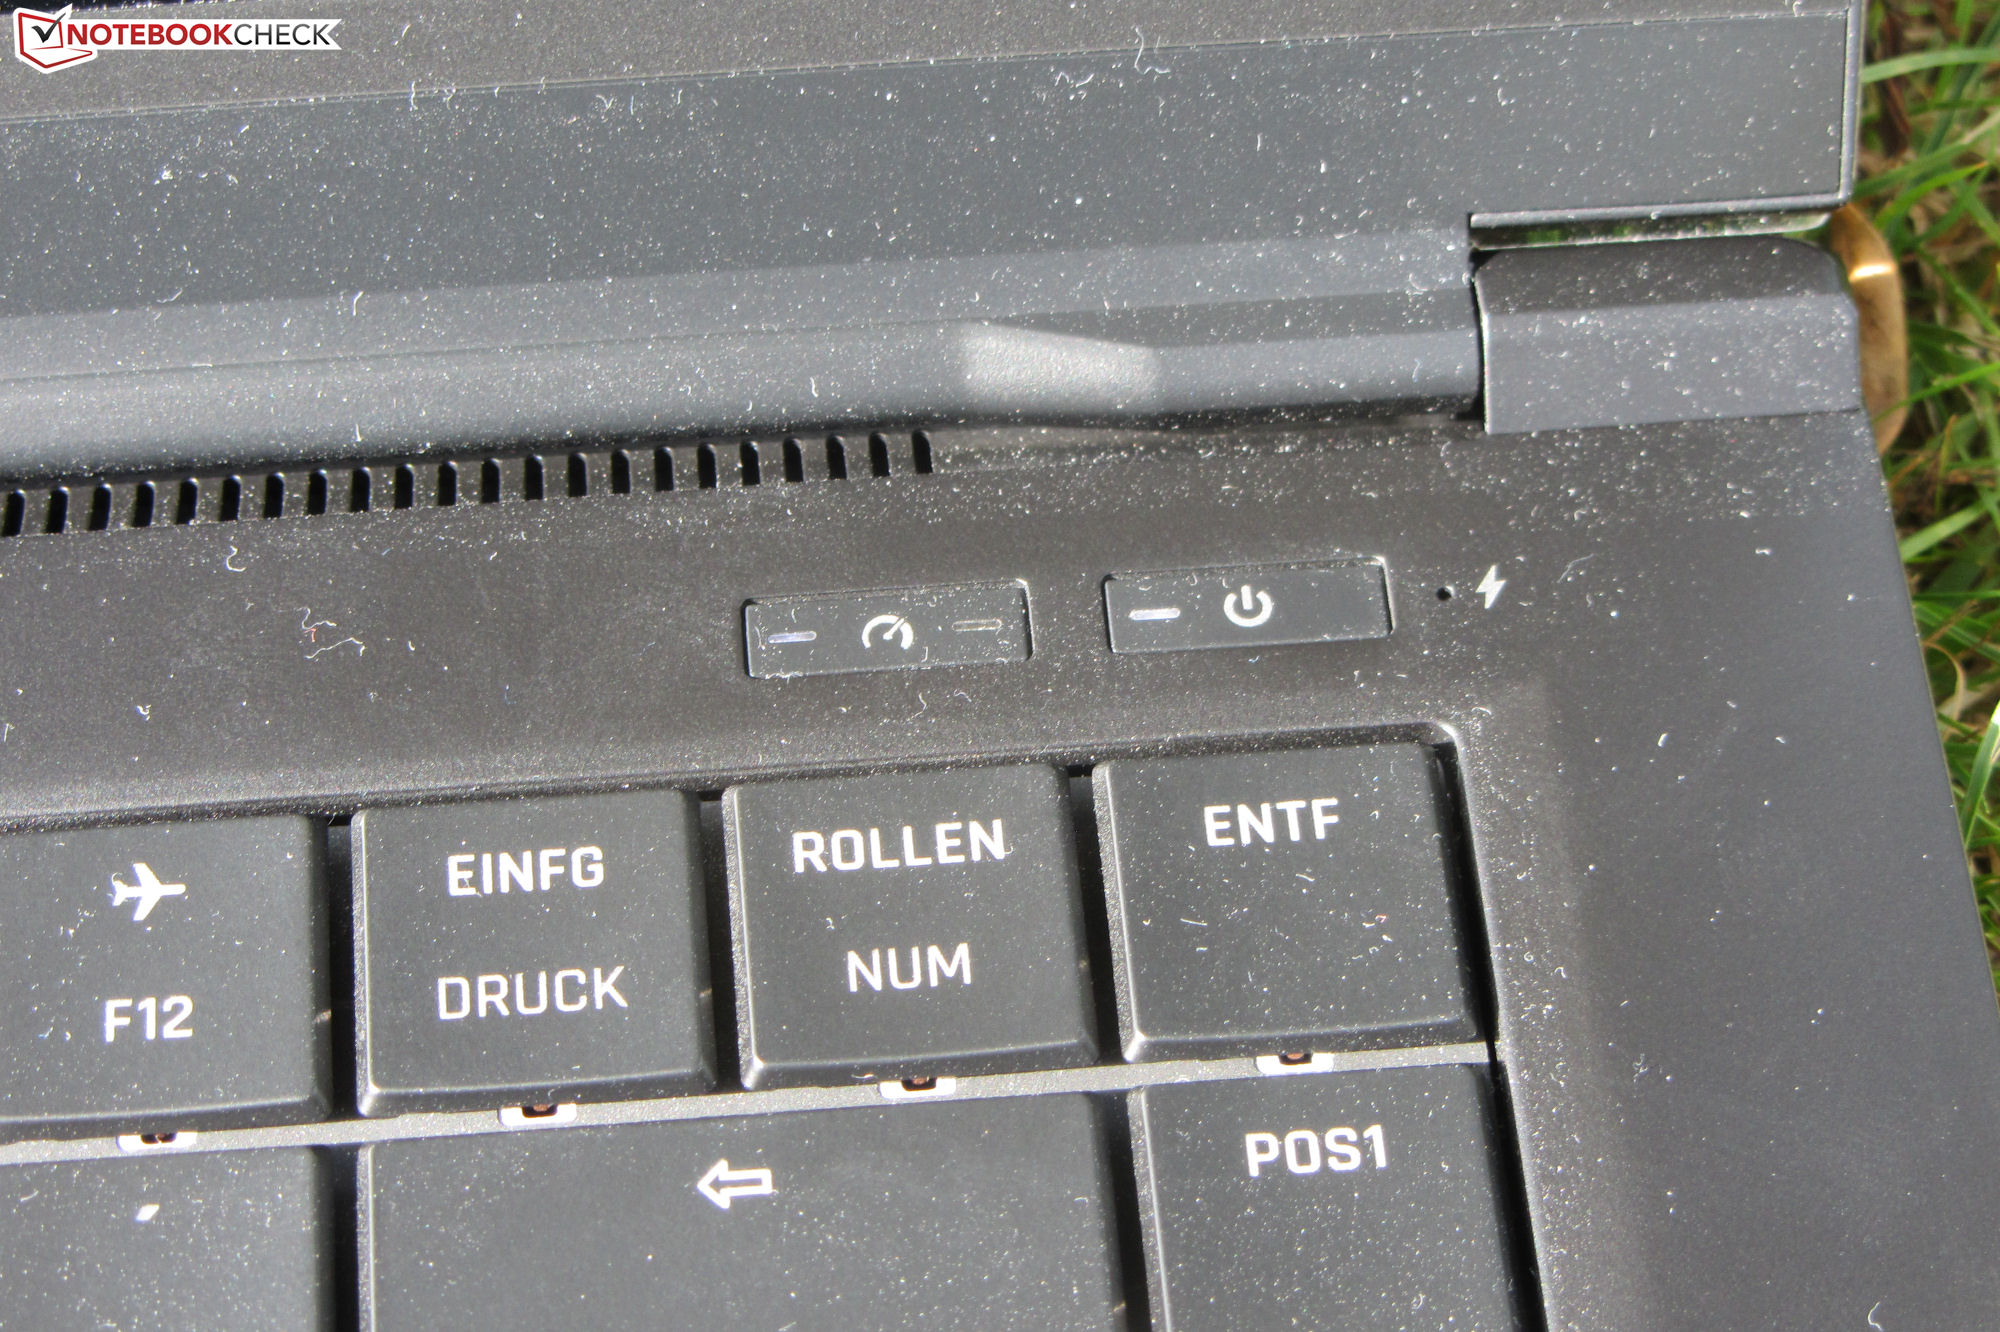
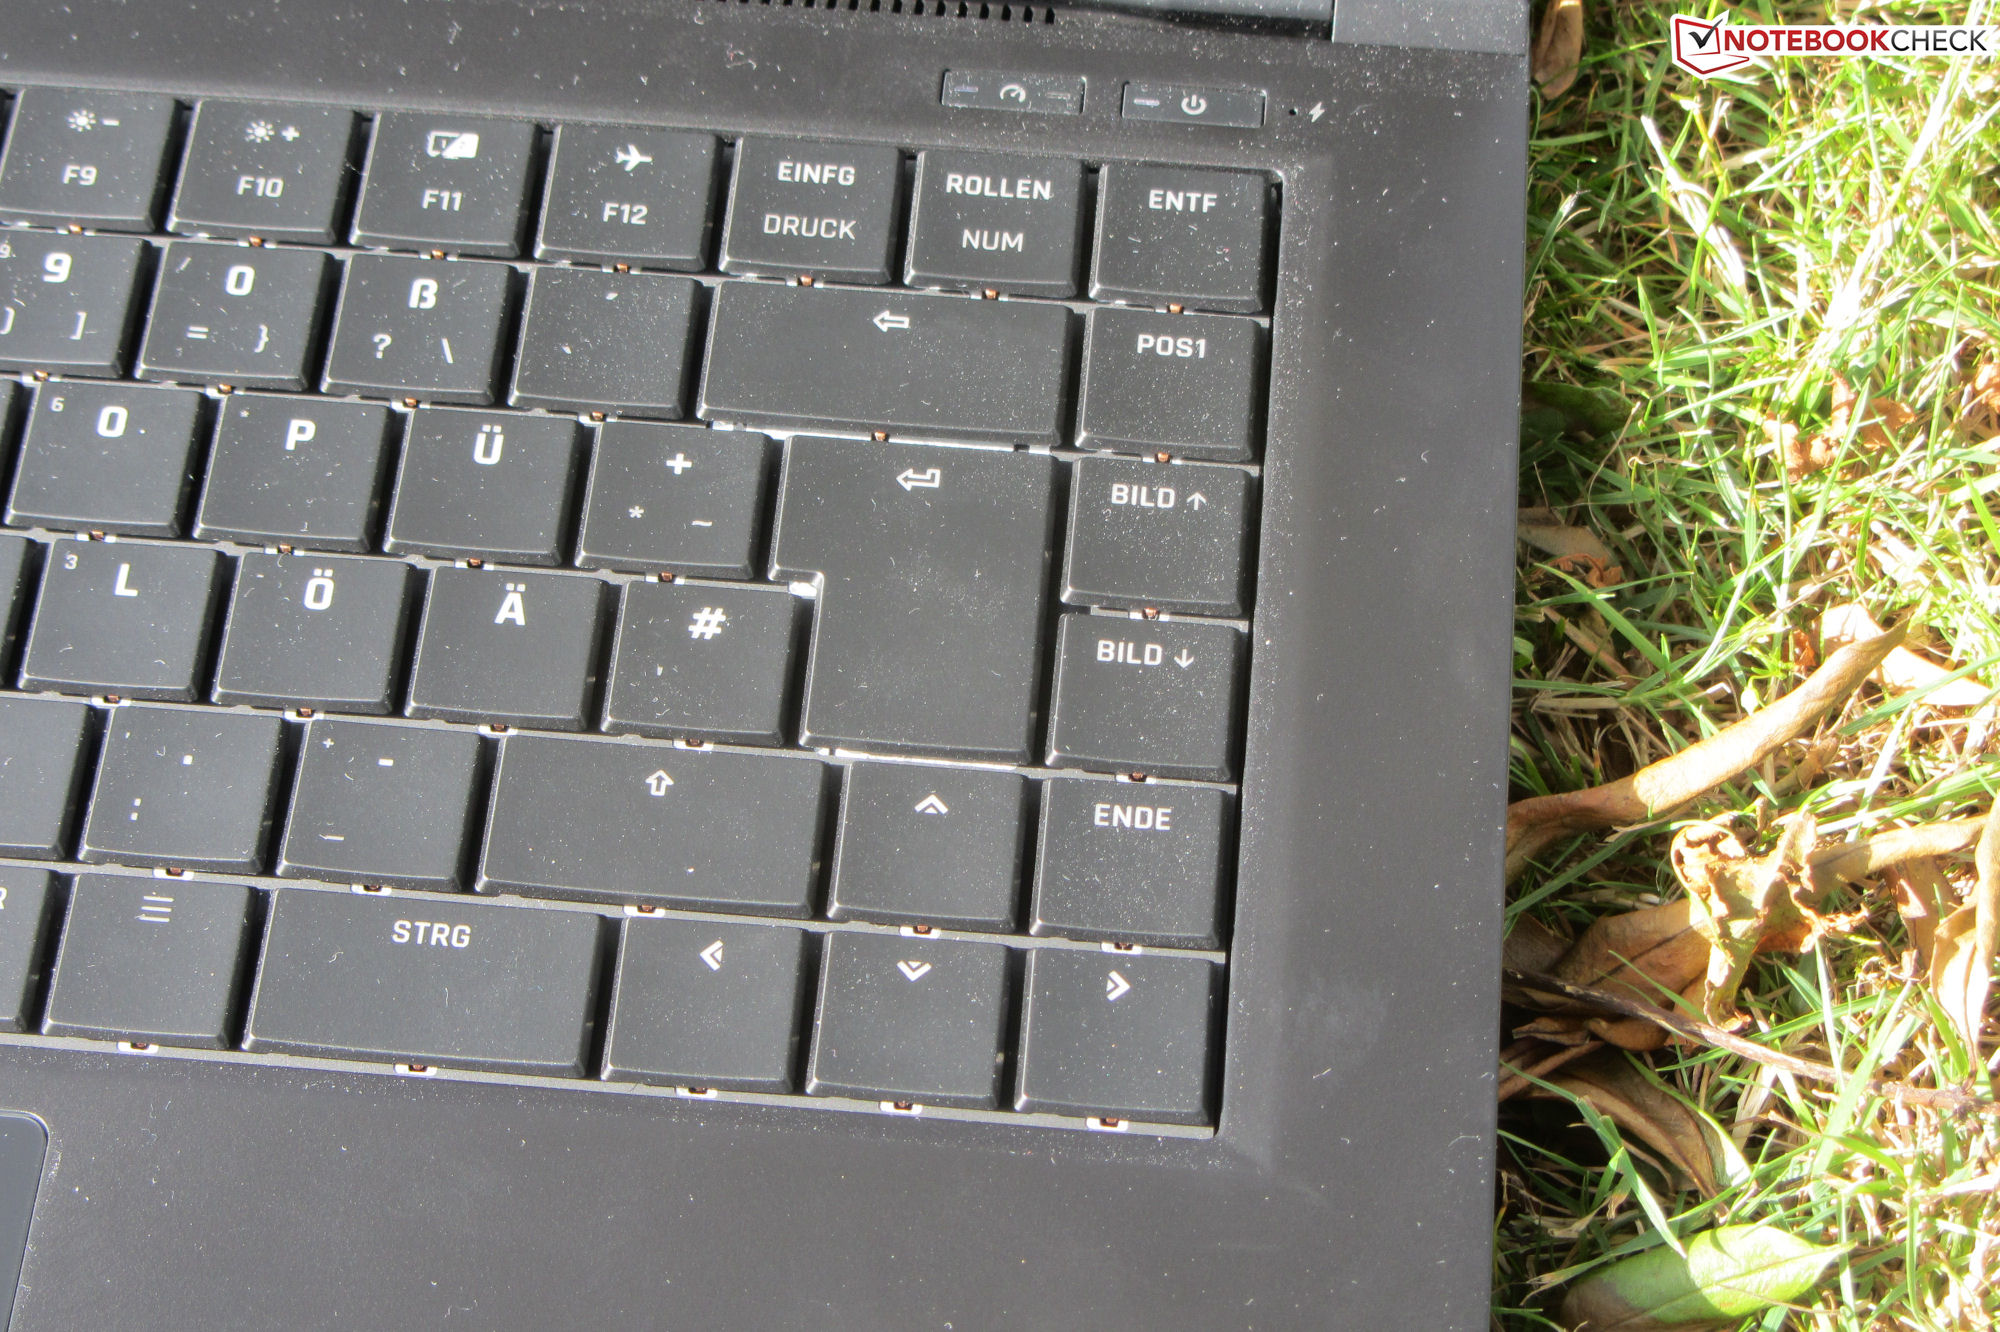
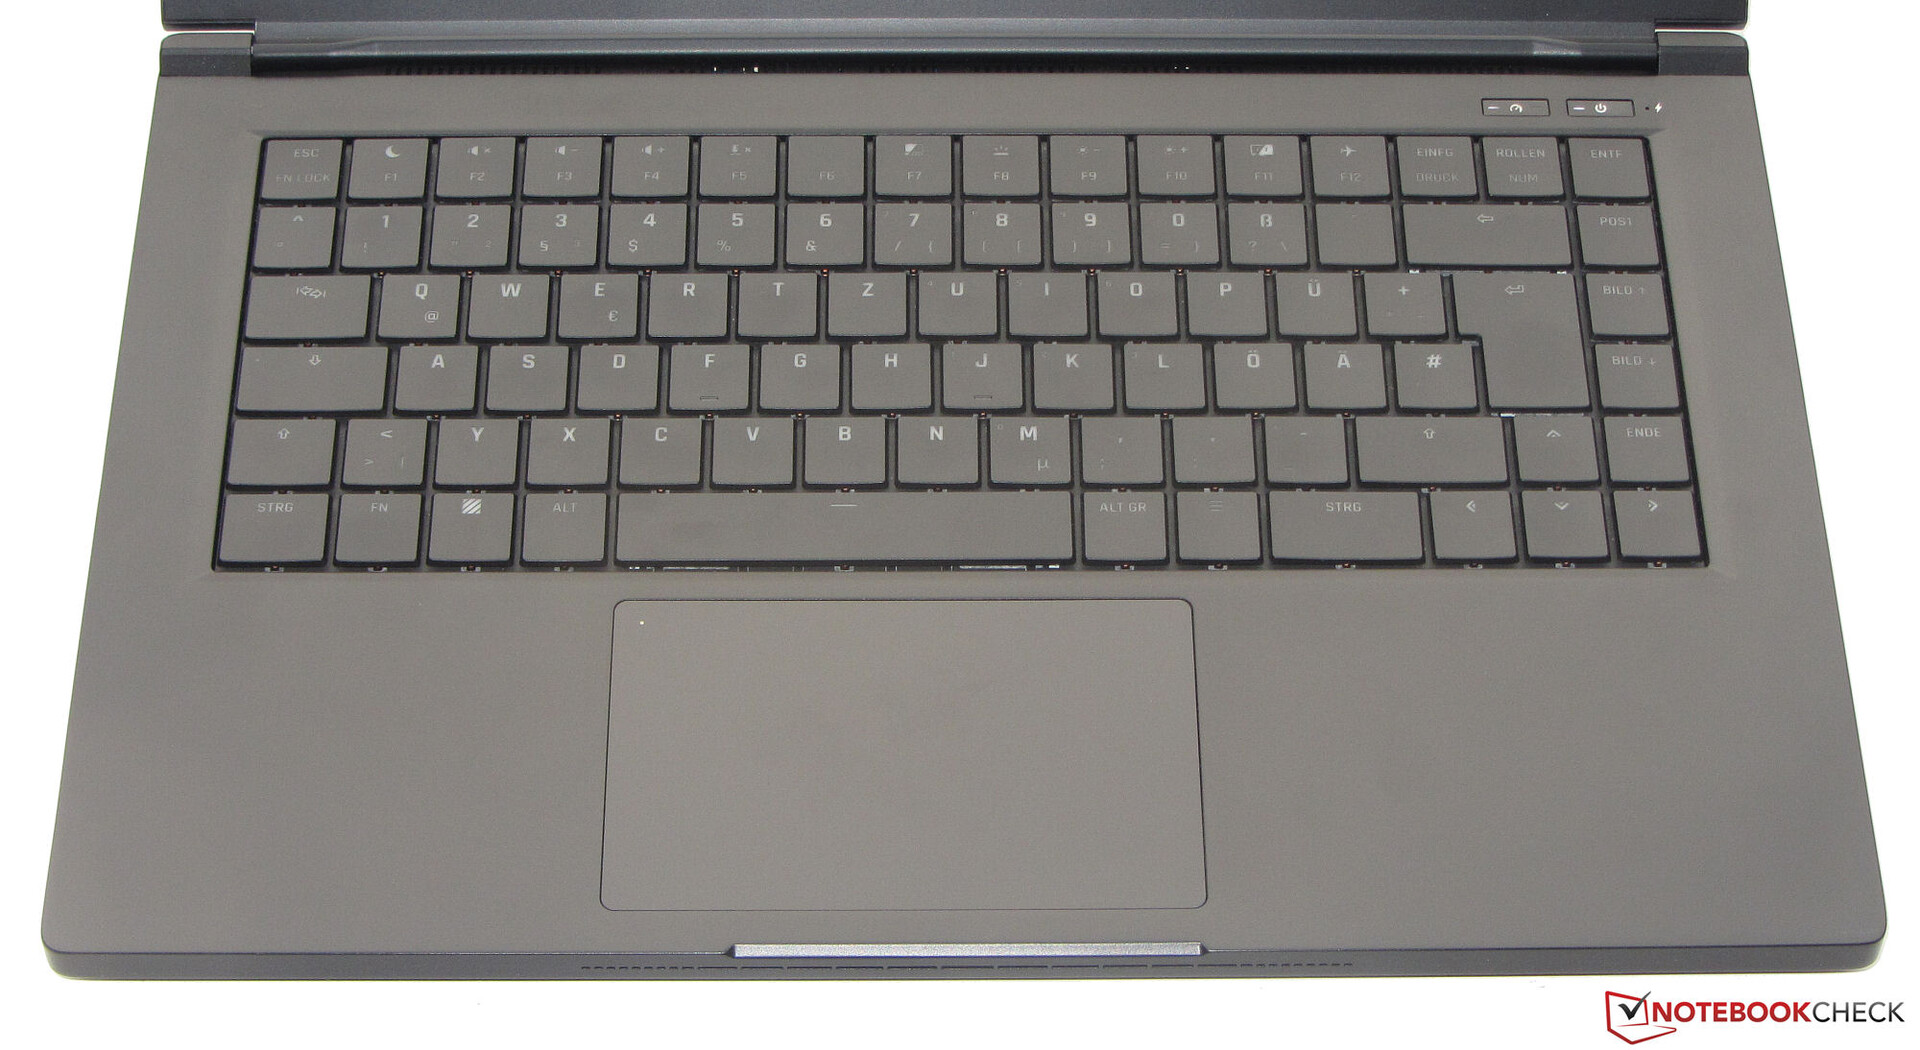
Input devices - The Schenker laptop comes with a mechanical keyboard
Keyboard
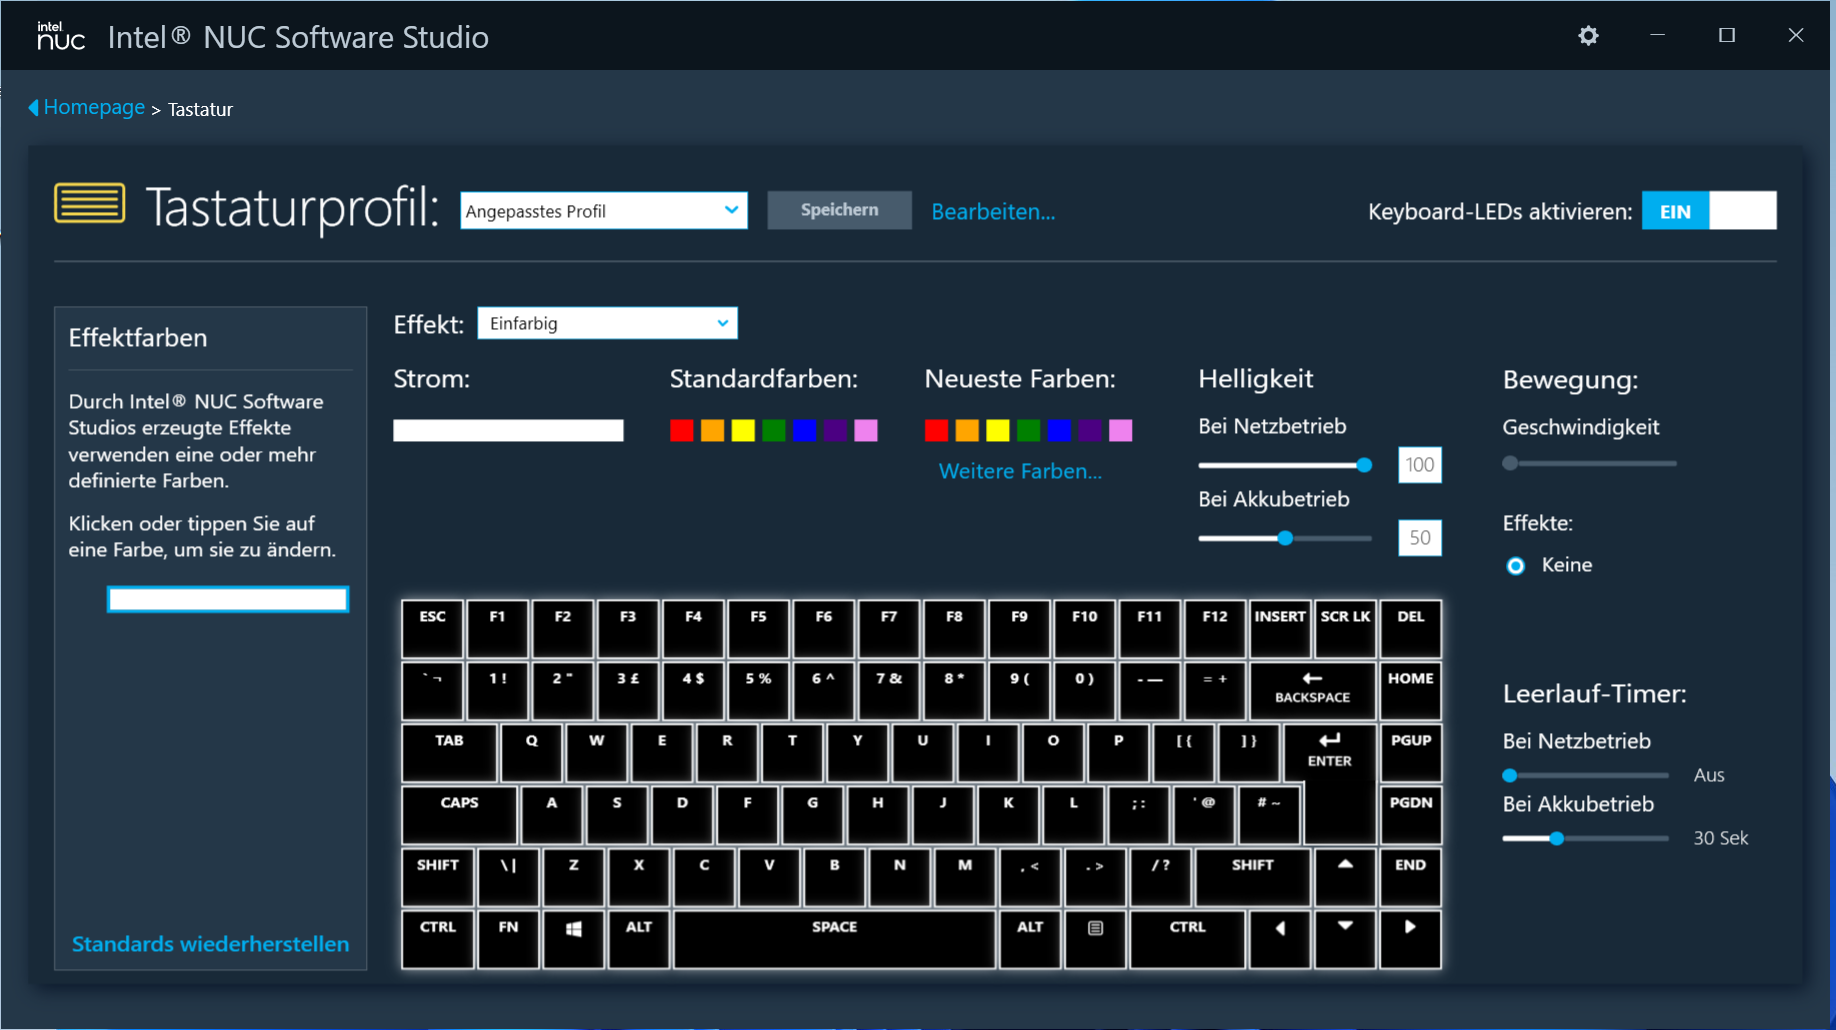
The mechanical keyboard (with RGB single-key illumination) consists of concavely curved keys. These offer a medium travel and have a clearly audible and noticeable pressure point. The keyboard doesn't yield during typing. The two-stage lighting is controlled via a function key. Overall, this is a balanced and well-made keyboard.
Touchpad
A multitouch-capable ClickPad (about 11.7 x 7.2 cm/~4.6 x 2.8 in) serves as mouse replacement. Its smooth surface makes it easy for fingers to glide on it. The pad has a short travel and a clear pressure point. Double tapping the upper left corner turns the pad on/off (indicated by an LED).
Display - IPS on board
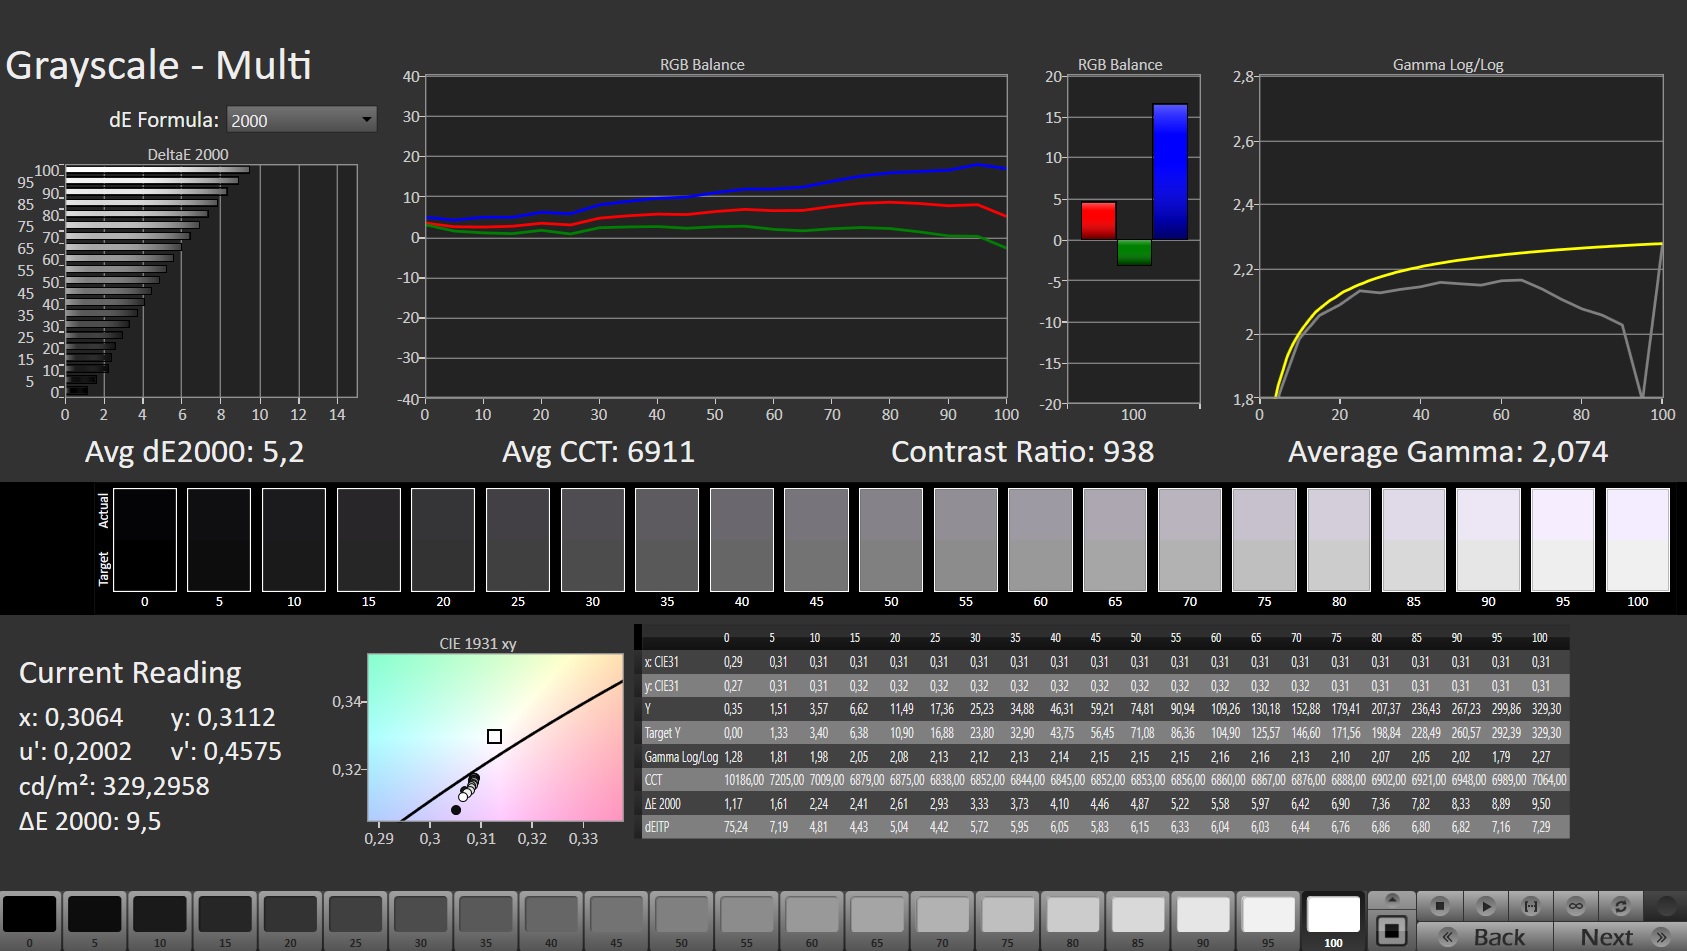
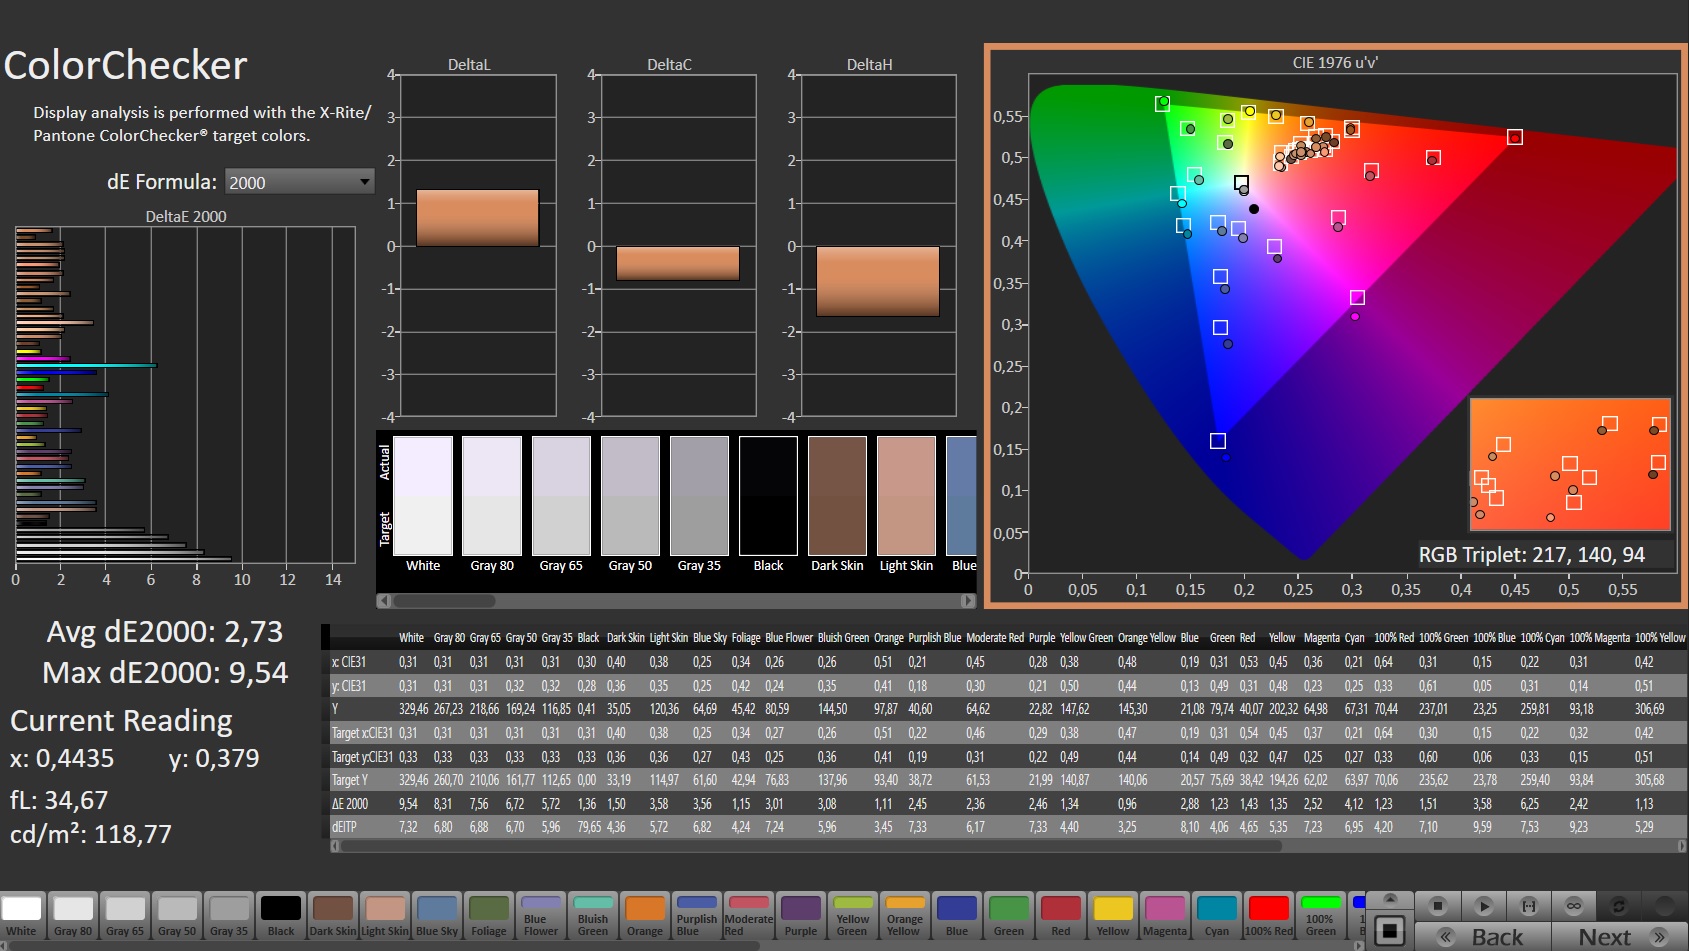
The brightness (303.1 cd/m²) and contrast (988:1) of the matte 15.6-inch display (2,560x1,440 pixels) barely meet their respective targets. The 165 Hz panel has fast response times. No PWM flickering could be detected.

| |||||||||||||||||||||||||
Brightness Distribution: 89 %
Center on Battery: 326 cd/m²
Contrast: 988:1 (Black: 0.33 cd/m²)
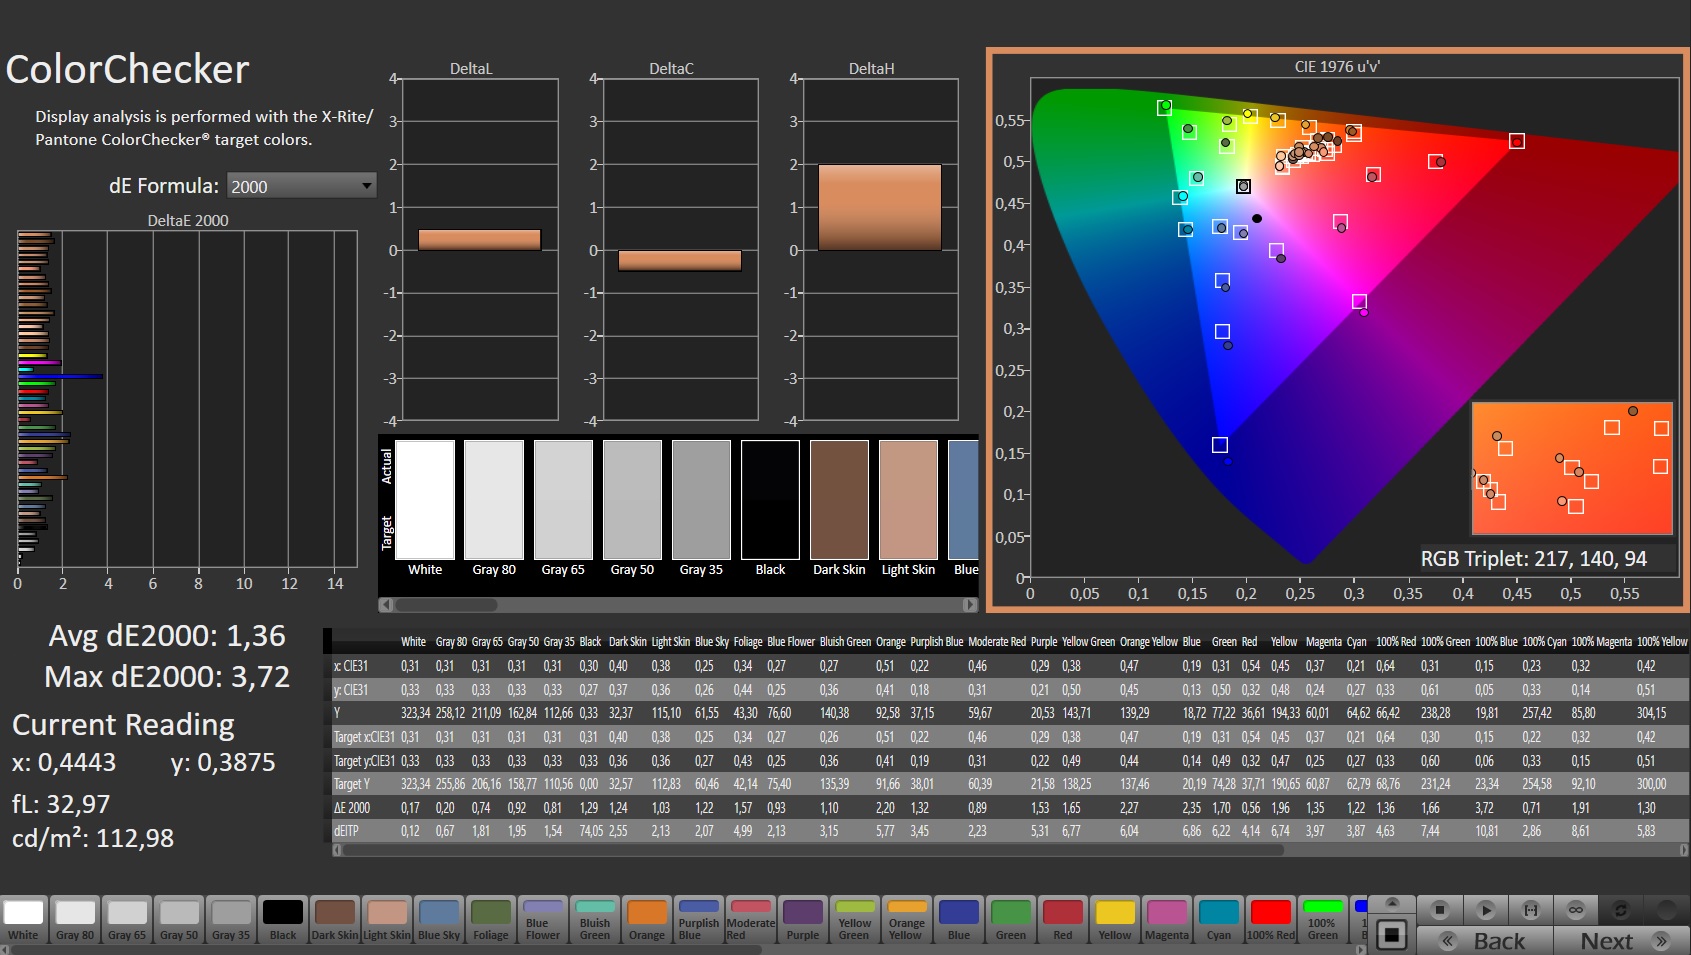
ΔE Color 2.73 | 0.5-29.43 Ø5, calibrated: 1.36
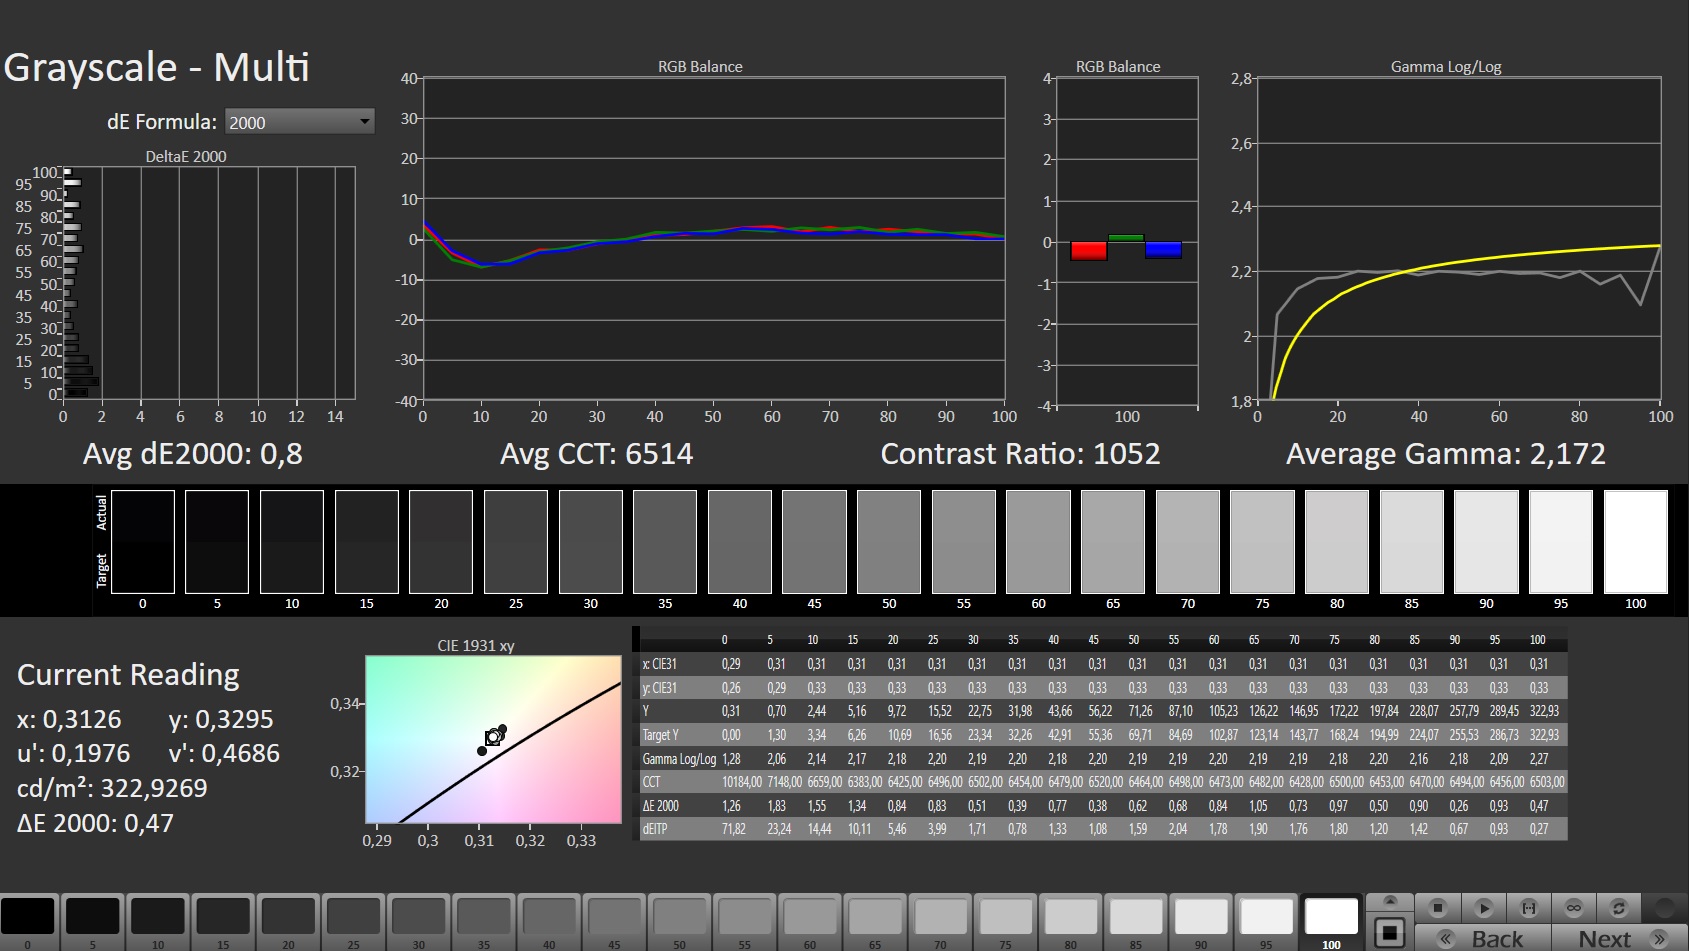
ΔE Greyscale 5.2 | 0.57-98 Ø5.3
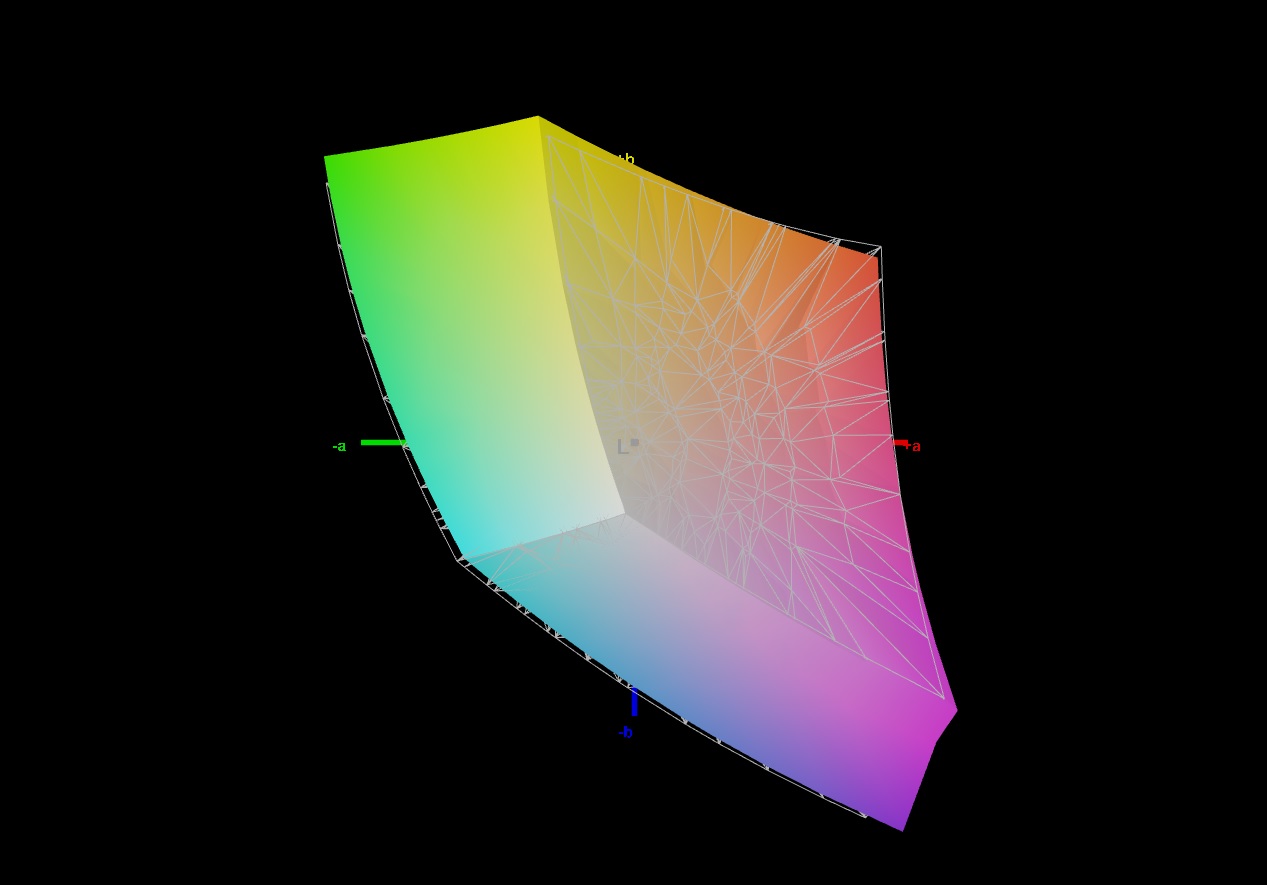
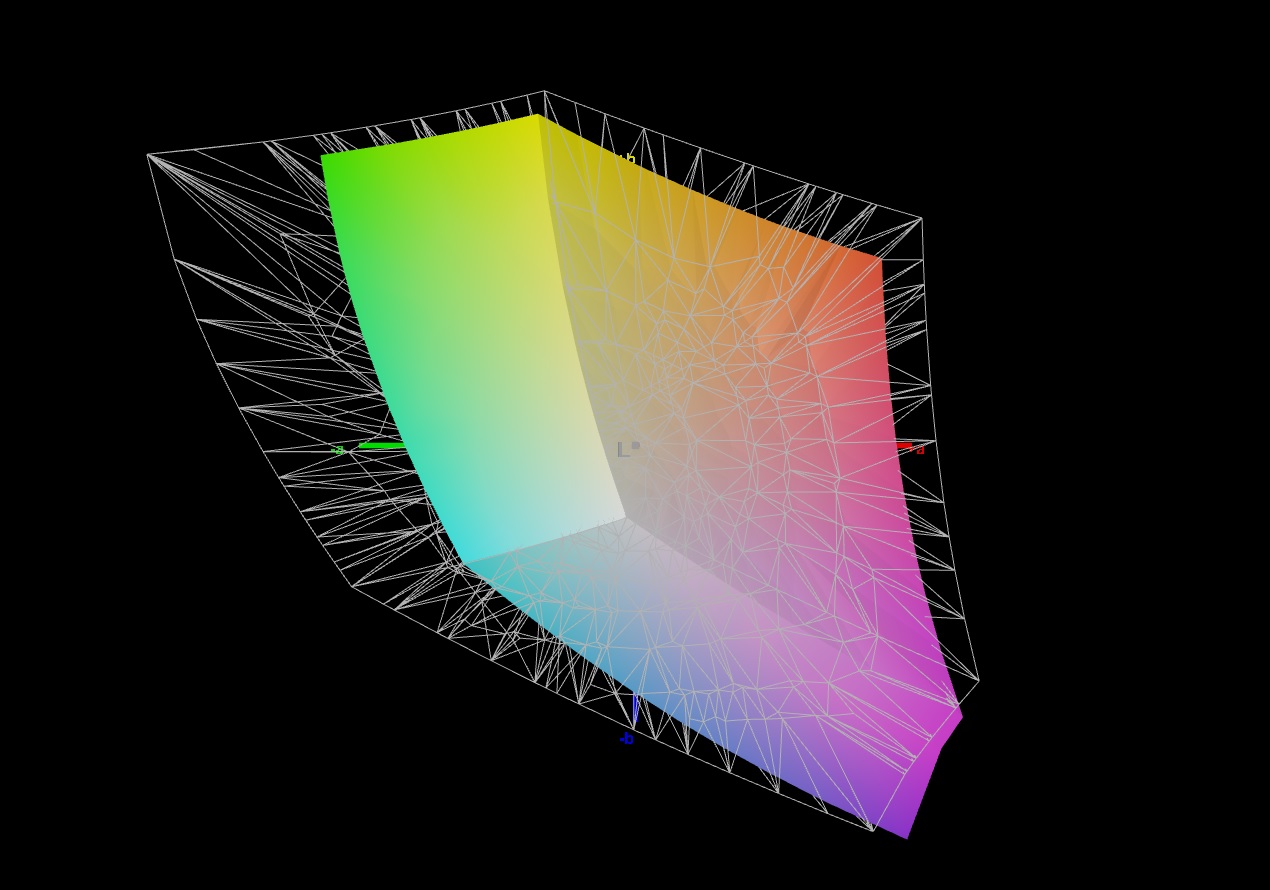
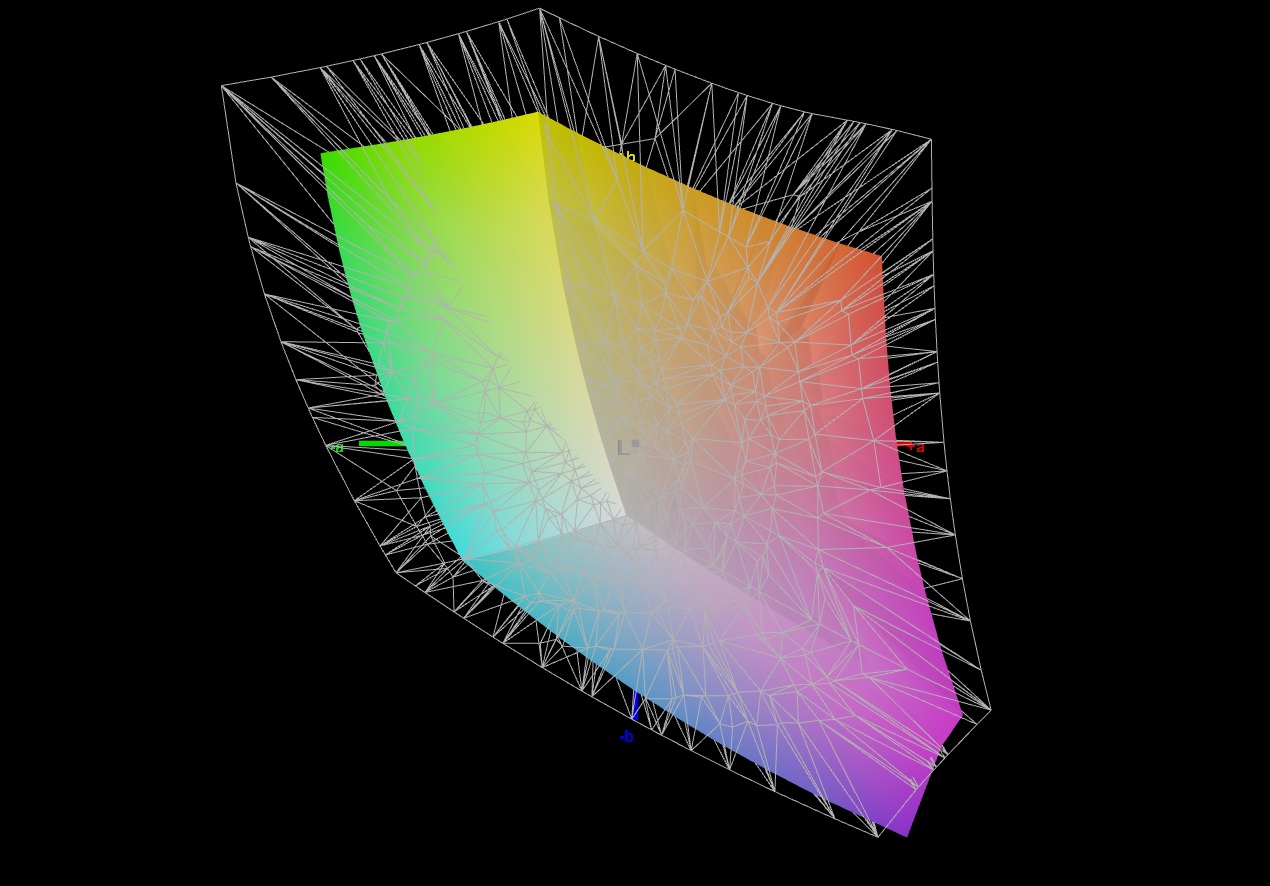
68.2% AdobeRGB 1998 (Argyll 2.2.0 3D)
96.7% sRGB (Argyll 2.2.0 3D)
67.3% Display P3 (Argyll 2.2.0 3D)
Gamma: 2.074
| SCHENKER XMG Fusion 15 (Mid 22) BOE CQ NE156QHM-NY2, IPS, 2560x1440, 15.60 | Asus TUF Dash F15 FX517ZR BOE CQ NE156QHM-NY1, IPS, 2560x1440, 15.60 | Acer Nitro 5 AN515-58-72QR Chi Mei N156KME-GNA, IPS, 2560x1440, 15.60 | HP Omen 16-b1090ng BOE09E5, IPS, 2560x1440, 16.10 | MSI Delta 15 A5EFK LQ156M1JW03 (SHP155D), IPS-Level, 1920x1080, 15.60 | Razer Blade 15 Base Edition 2021, i7-10750H RTX 3060 BOE NV156FHM-N4K, IPS, 1920x1080, 15.60 | |
|---|---|---|---|---|---|---|
| Display | 25% | 23% | 4% | -0% | -4% | |
| Display P3 Coverage | 67.3 | 98.4 46% | 95.6 42% | 71 5% | 66.5 -1% | 64.3 -4% |
| sRGB Coverage | 96.7 | 99.9 3% | 99.8 3% | 97.9 1% | 97.8 1% | 91.8 -5% |
| AdobeRGB 1998 Coverage | 68.2 | 85.9 26% | 85.2 25% | 73.3 7% | 67.6 -1% | 65.5 -4% |
| Response Times | 9% | -41% | -30% | -30% | -10% | |
| Response Time Grey 50% / Grey 80% * | 11.6 ? | 5.6 ? 52% | 15.7 ? -35% | 14.5 ? -25% | 12.8 ? -10% | 8.8 ? 24% |
| Response Time Black / White * | 7 ? | 9.4 ? -34% | 10.2 ? -46% | 9.4 ? -34% | 10.4 ? -49% | 10 ? -43% |
| PWM Frequency | 23580 ? | 1000 ? | ||||
| Screen | 20% | 8% | -5% | 1% | -12% | |
| Brightness middle | 326 | 286 -12% | 332 2% | 335 3% | 291 -11% | 317.2 -3% |
| Brightness | 303 | 266 -12% | 303 0% | 319 5% | 266 -12% | 306 1% |
| Brightness Distribution | 89 | 87 -2% | 86 -3% | 90 1% | 88 -1% | 89 0% |
| Black Level * | 0.33 | 0.25 24% | 0.29 12% | 0.28 15% | 0.36 -9% | 0.31 6% |
| Contrast | 988 | 1144 16% | 1145 16% | 1196 21% | 808 -18% | 1023 4% |
| Colorchecker dE 2000 * | 2.73 | 2.14 22% | 3.61 -32% | 4.38 -60% | 2.98 -9% | 4.37 -60% |
| Colorchecker dE 2000 max. * | 9.54 | 5.22 45% | 7.71 19% | 9.48 1% | 7.59 20% | 6.62 31% |
| Colorchecker dE 2000 calibrated * | 1.36 | 0.67 51% | 0.59 57% | 1.33 2% | 0.91 33% | 2.67 -96% |
| Greyscale dE 2000 * | 5.2 | 2.8 46% | 5.2 -0% | 7 -35% | 4.2 19% | 4.5 13% |
| Gamma | 2.074 106% | 2.23 99% | 2.155 102% | 2.103 105% | 2.293 96% | 2.4 92% |
| CCT | 6911 94% | 7092 92% | 6724 97% | 6244 104% | 7624 85% | 7418 88% |
| Color Space (Percent of AdobeRGB 1998) | 59.2 | |||||
| Color Space (Percent of sRGB) | 91.4 | |||||
| Total Average (Program / Settings) | 18% /
19% | -3% /
4% | -10% /
-7% | -10% /
-3% | -9% /
-10% |
* ... smaller is better
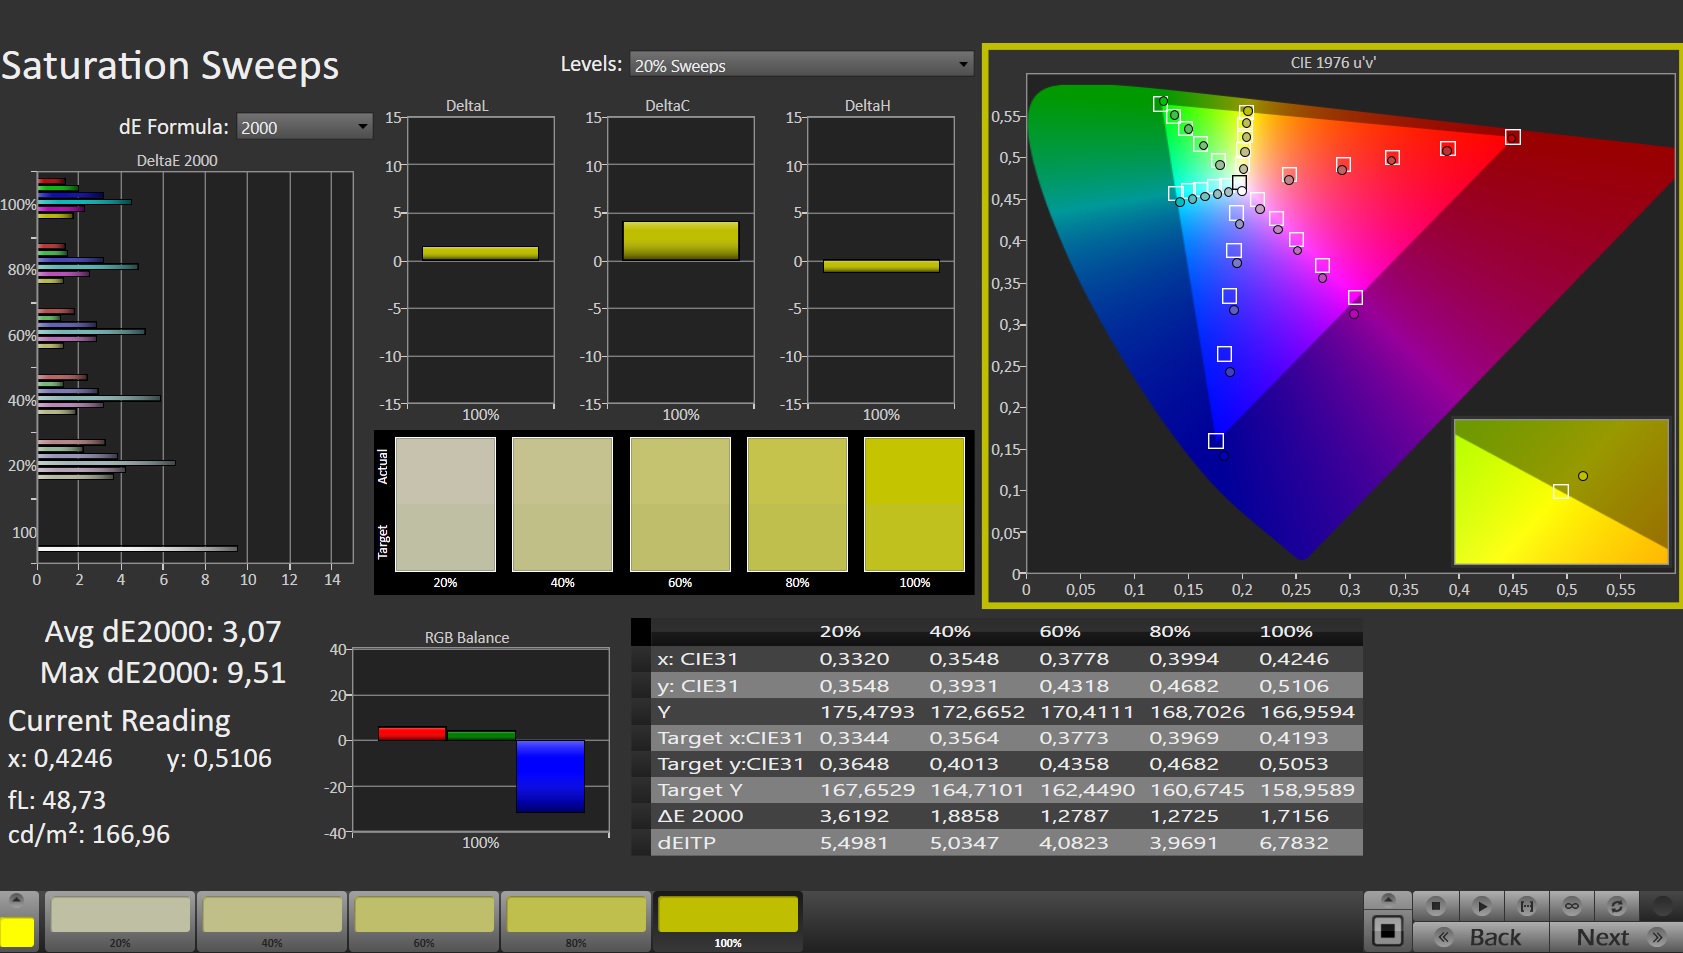
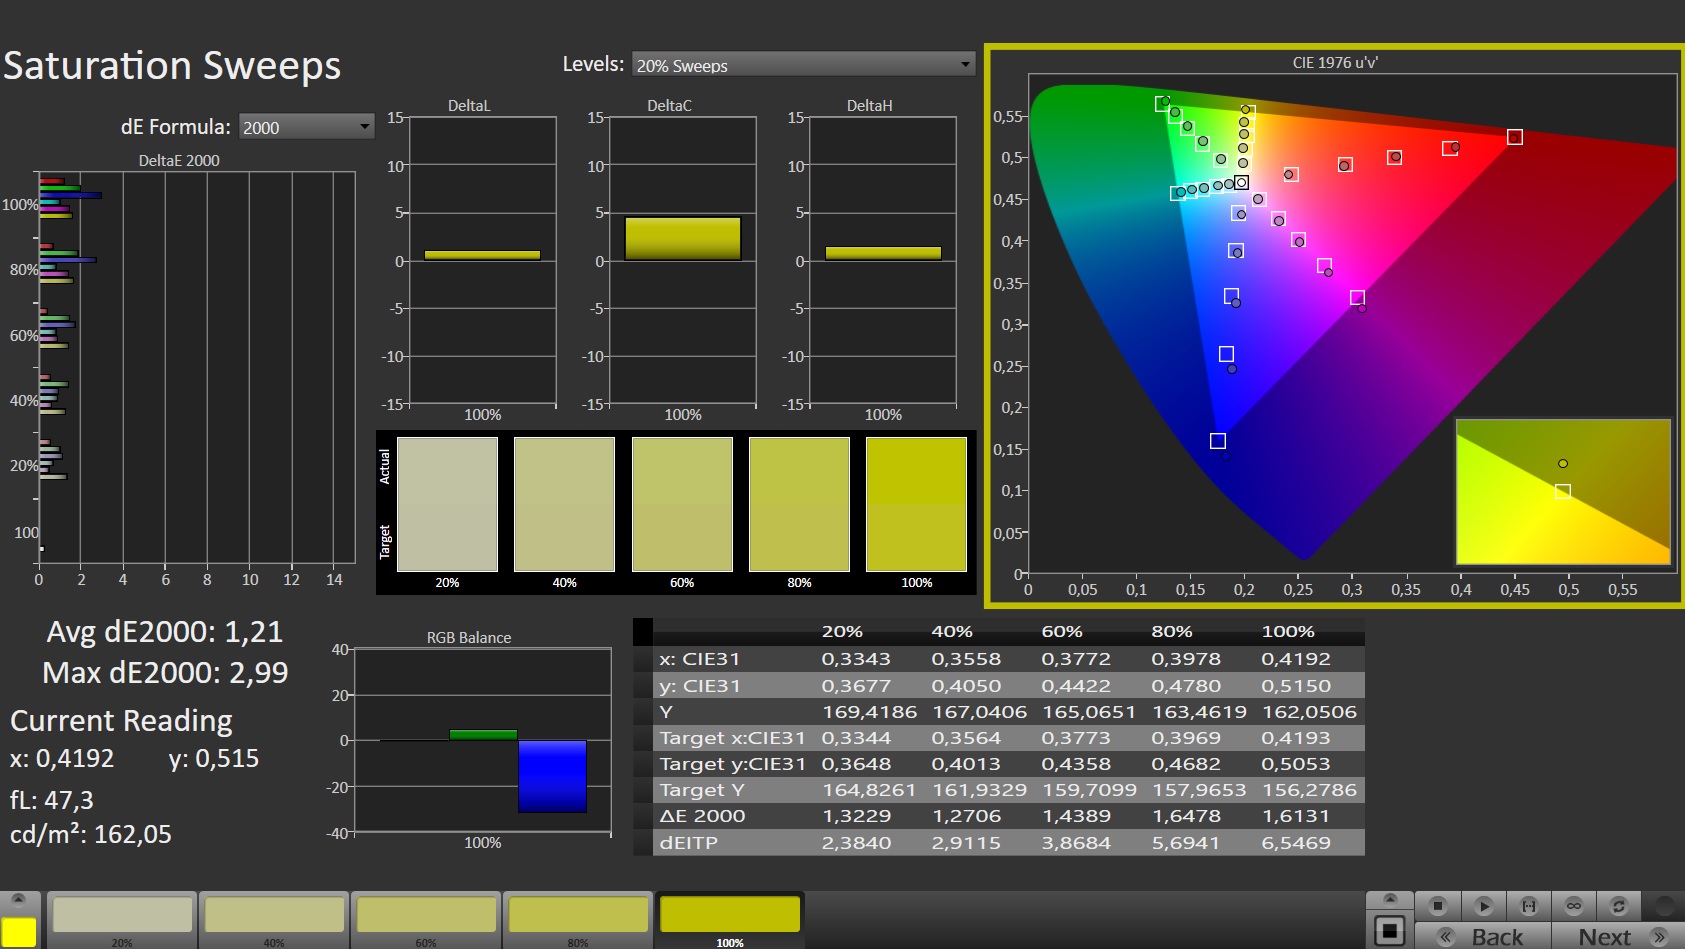
Right from the box the display reproduces colors well. The deviation of 2.73 is within the target range (Delta E < 3) - this minor deviation isn't perceptible for viewers. Calibration leads to improvements: The color deviation drops to 1.36, and the grayscale is displayed in a more balanced way. The display can reproduce the sRGB color space (96.7%) almost completely; the AdobeRGB and DCI-P3 color spaces are reproduced at 68% and 67%, respectively.
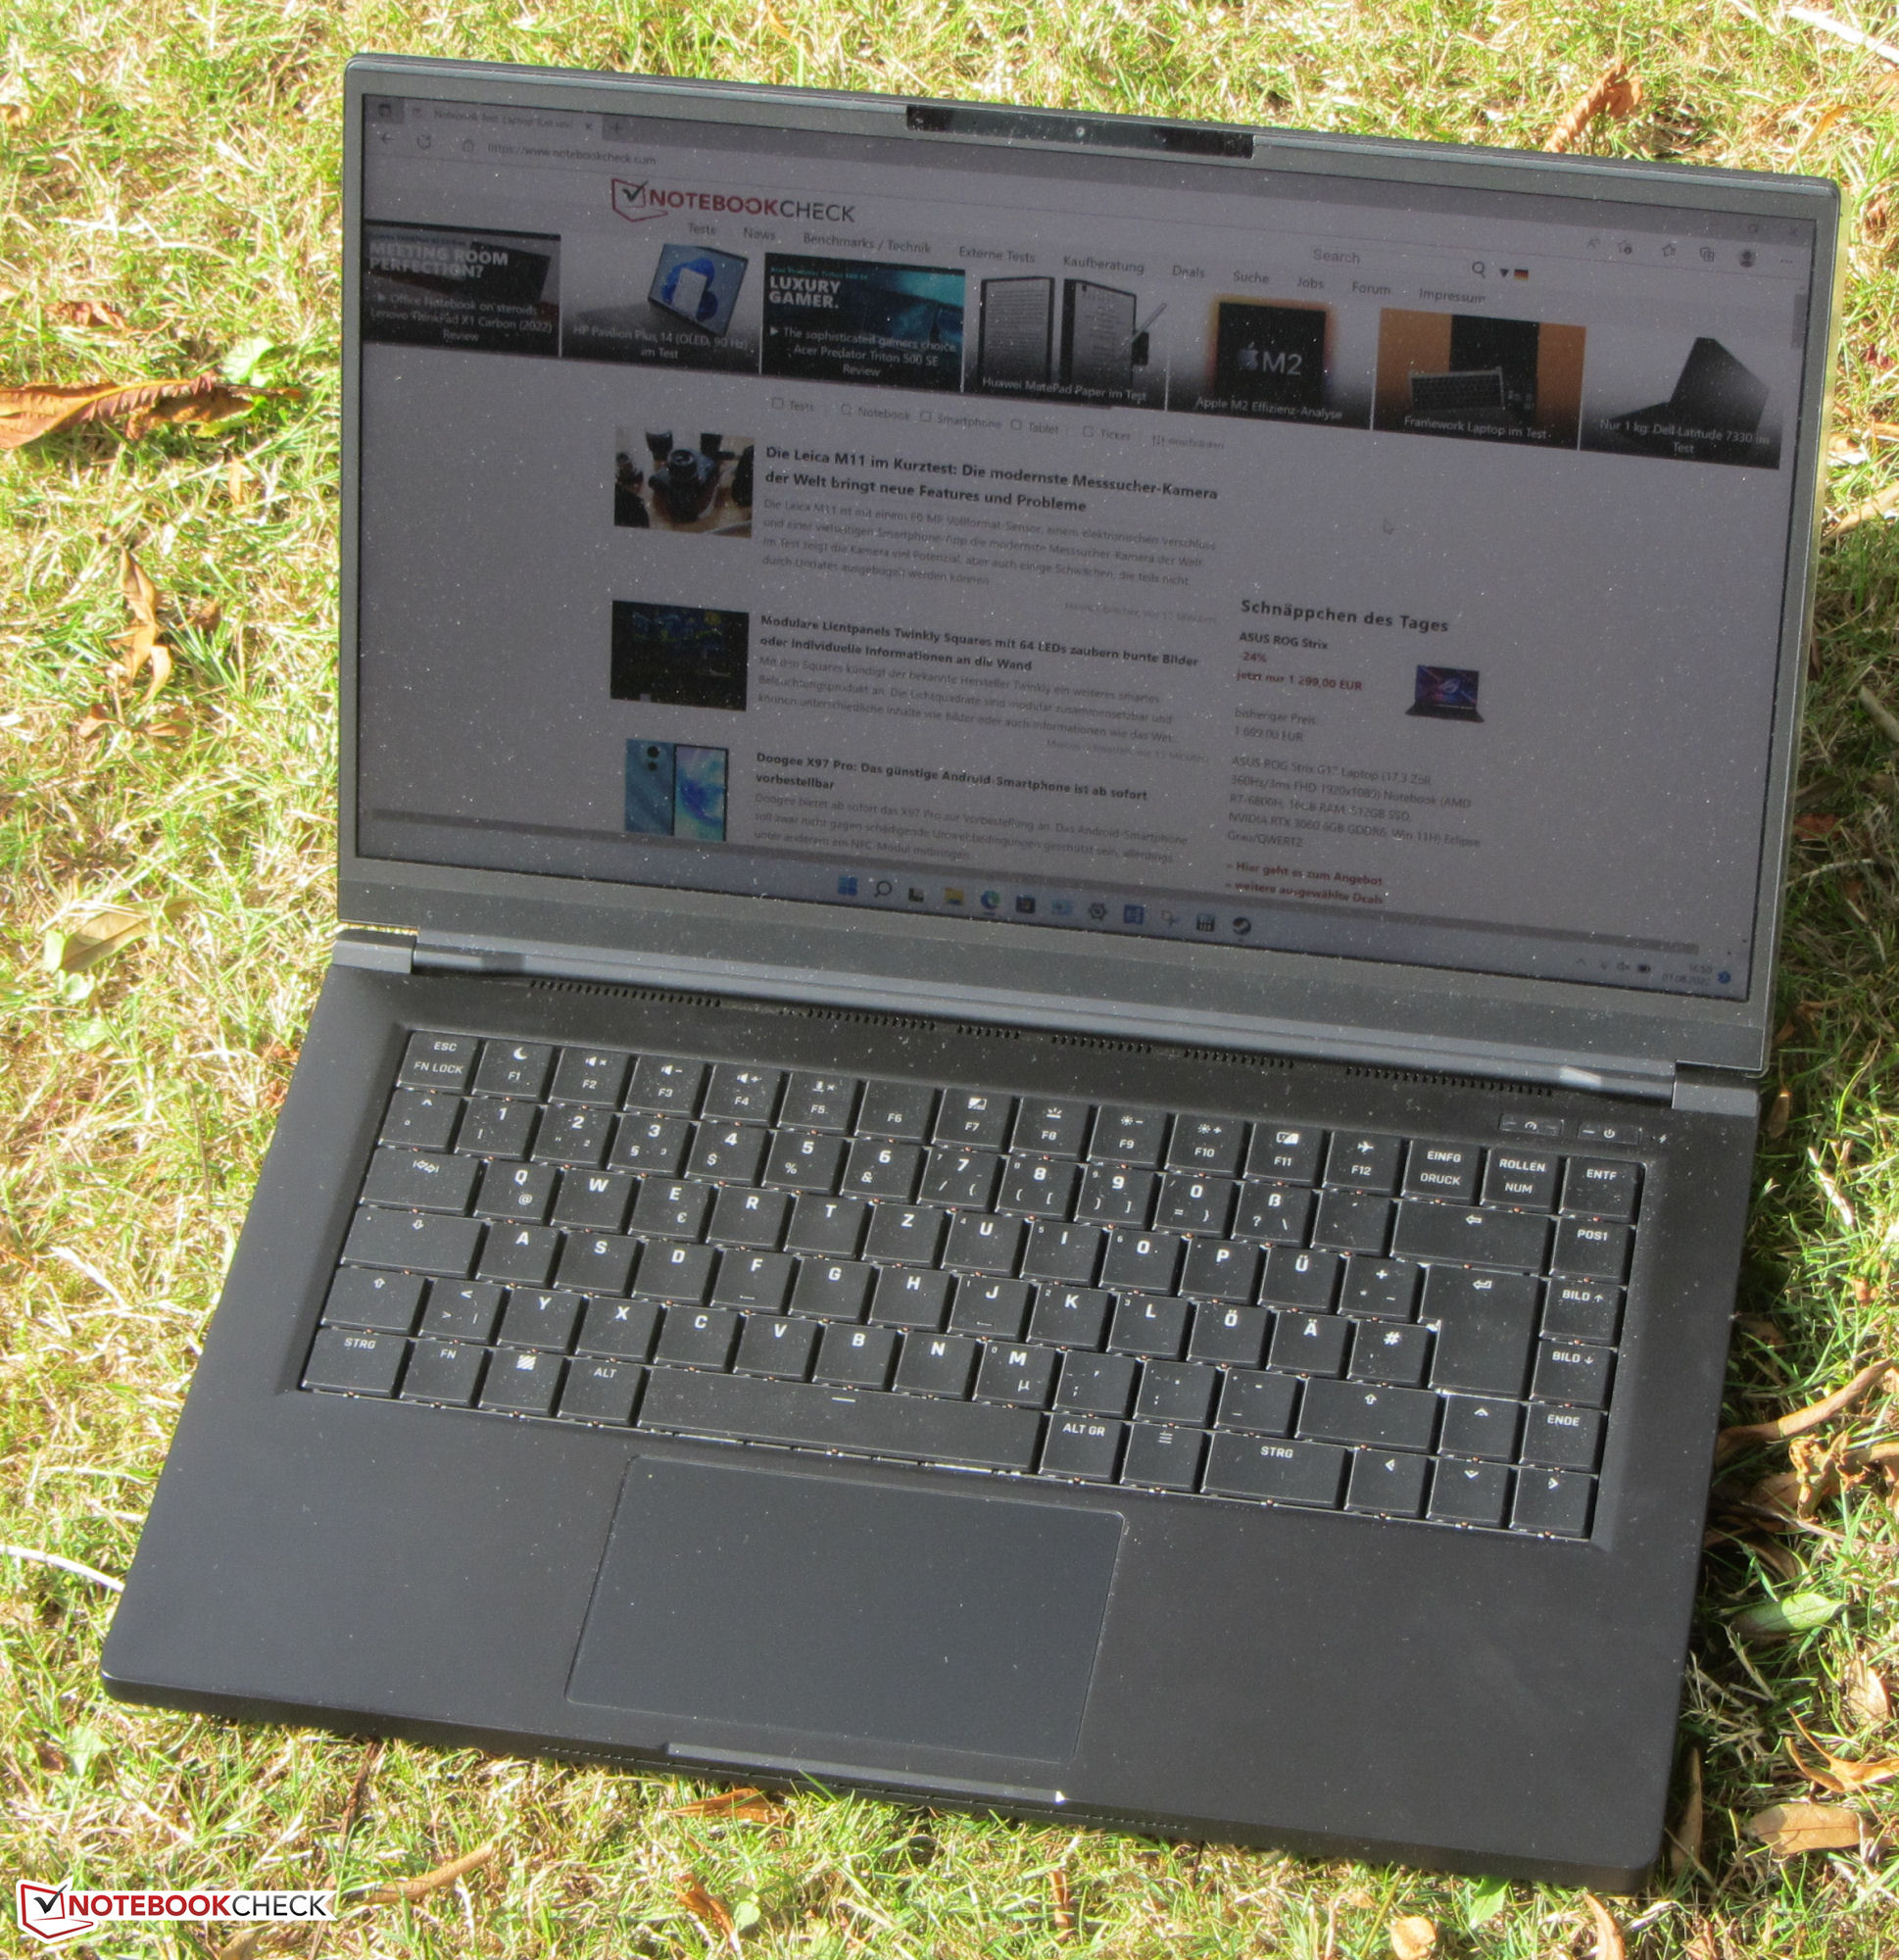
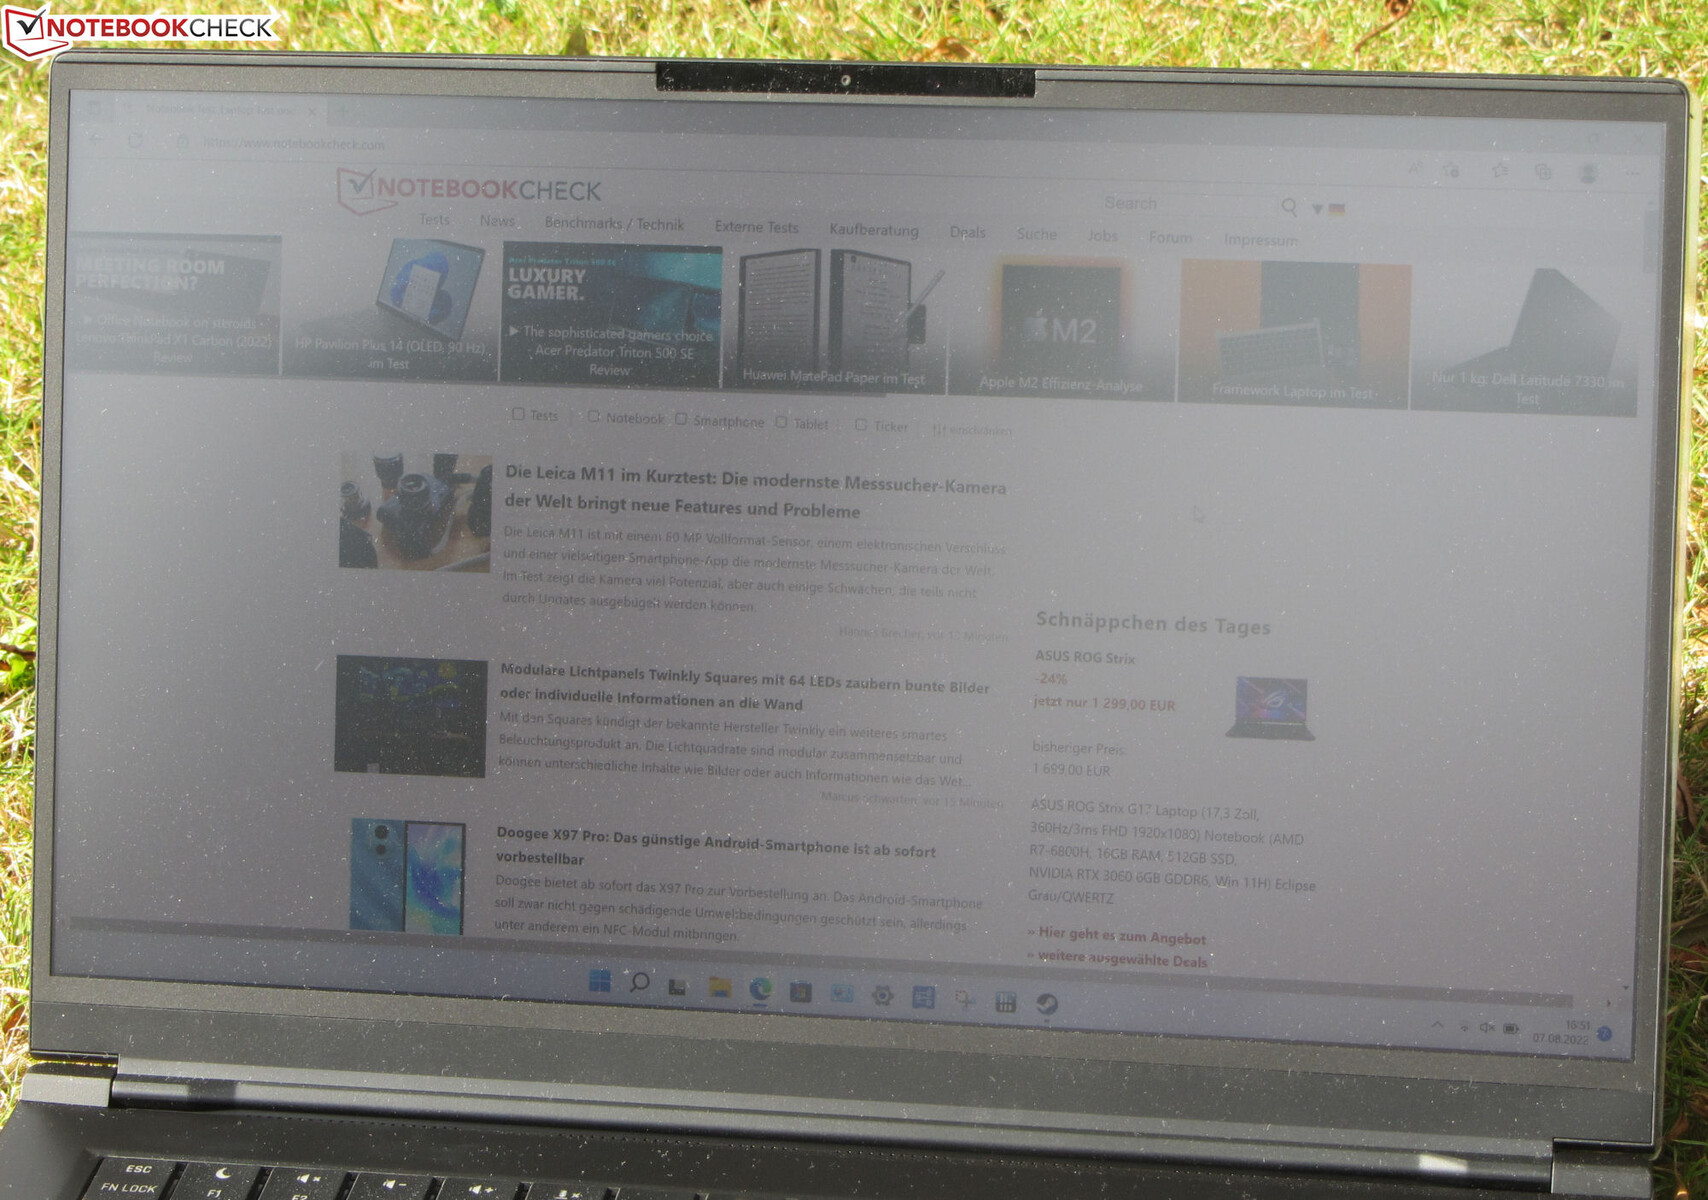
The viewing-angle stable IPS panel is legible from any position. Outdoor readability is possible when the sun isn't shining too brightly.

Display Response Times
| ↔ Response Time Black to White | ||
|---|---|---|
| 7 ms ... rise ↗ and fall ↘ combined | ↗ 3.3 ms rise |  |
| ↘ 3.7 ms fall | ||
| The screen shows very fast response rates in our tests and should be very well suited for fast-paced gaming. In comparison, all tested devices range from 0.1 (minimum) to 240 (maximum) ms. » 16 % of all devices are better. This means that the measured response time is better than the average of all tested devices (21.5 ms). | ||
| ↔ Response Time 50% Grey to 80% Grey | ||
| 11.6 ms ... rise ↗ and fall ↘ combined | ↗ 5.6 ms rise |  |
| ↘ 6 ms fall | ||
| The screen shows good response rates in our tests, but may be too slow for competitive gamers. In comparison, all tested devices range from 0.2 (minimum) to 636 (maximum) ms. » 20 % of all devices are better. This means that the measured response time is better than the average of all tested devices (33.7 ms). | ||
Screen Flickering / PWM (Pulse-Width Modulation)
| Screen flickering / PWM not detected |  | ||
In comparison: 53 % of all tested devices do not use PWM to dim the display. If PWM was detected, an average of 17909 (minimum: 5 - maximum: 3846000) Hz was measured. | |||
Performance - Tiger Lake meets Ampere
With the XMG Fusion 15, Schenker has a powerful 15.6-inch laptop in its lineup that is designed for various application areas.


Test conditions
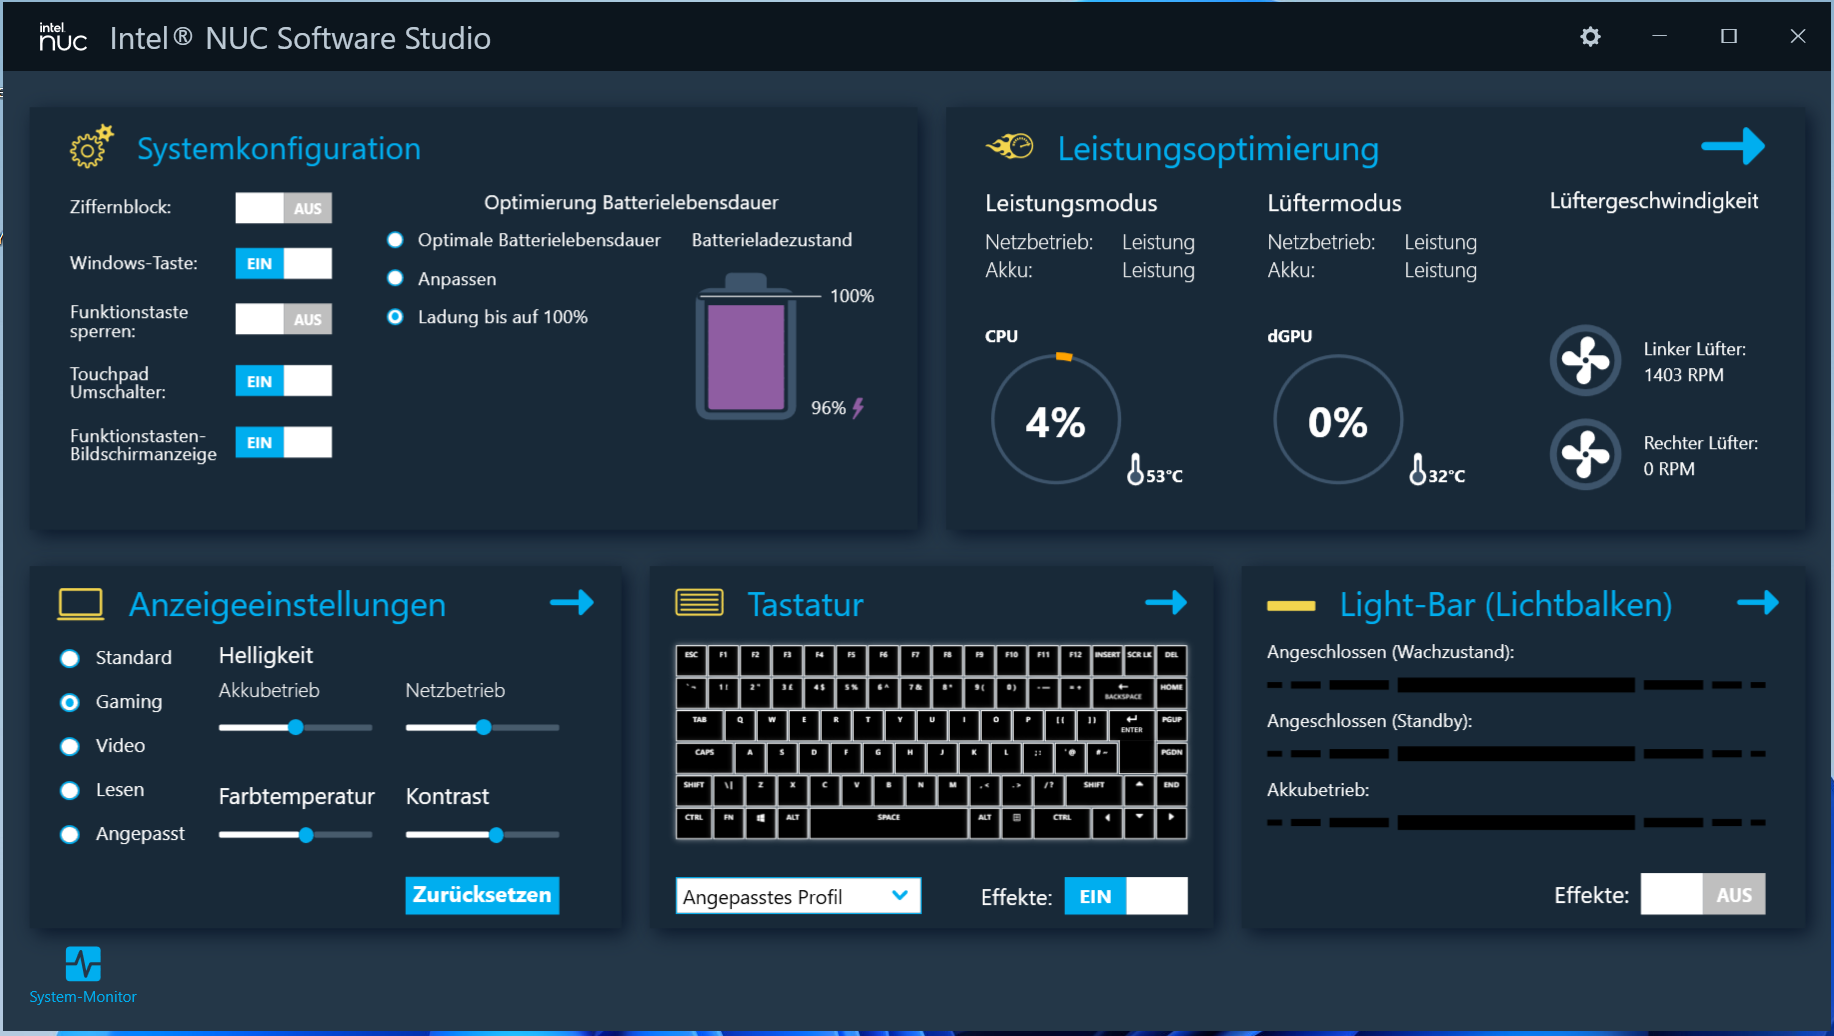
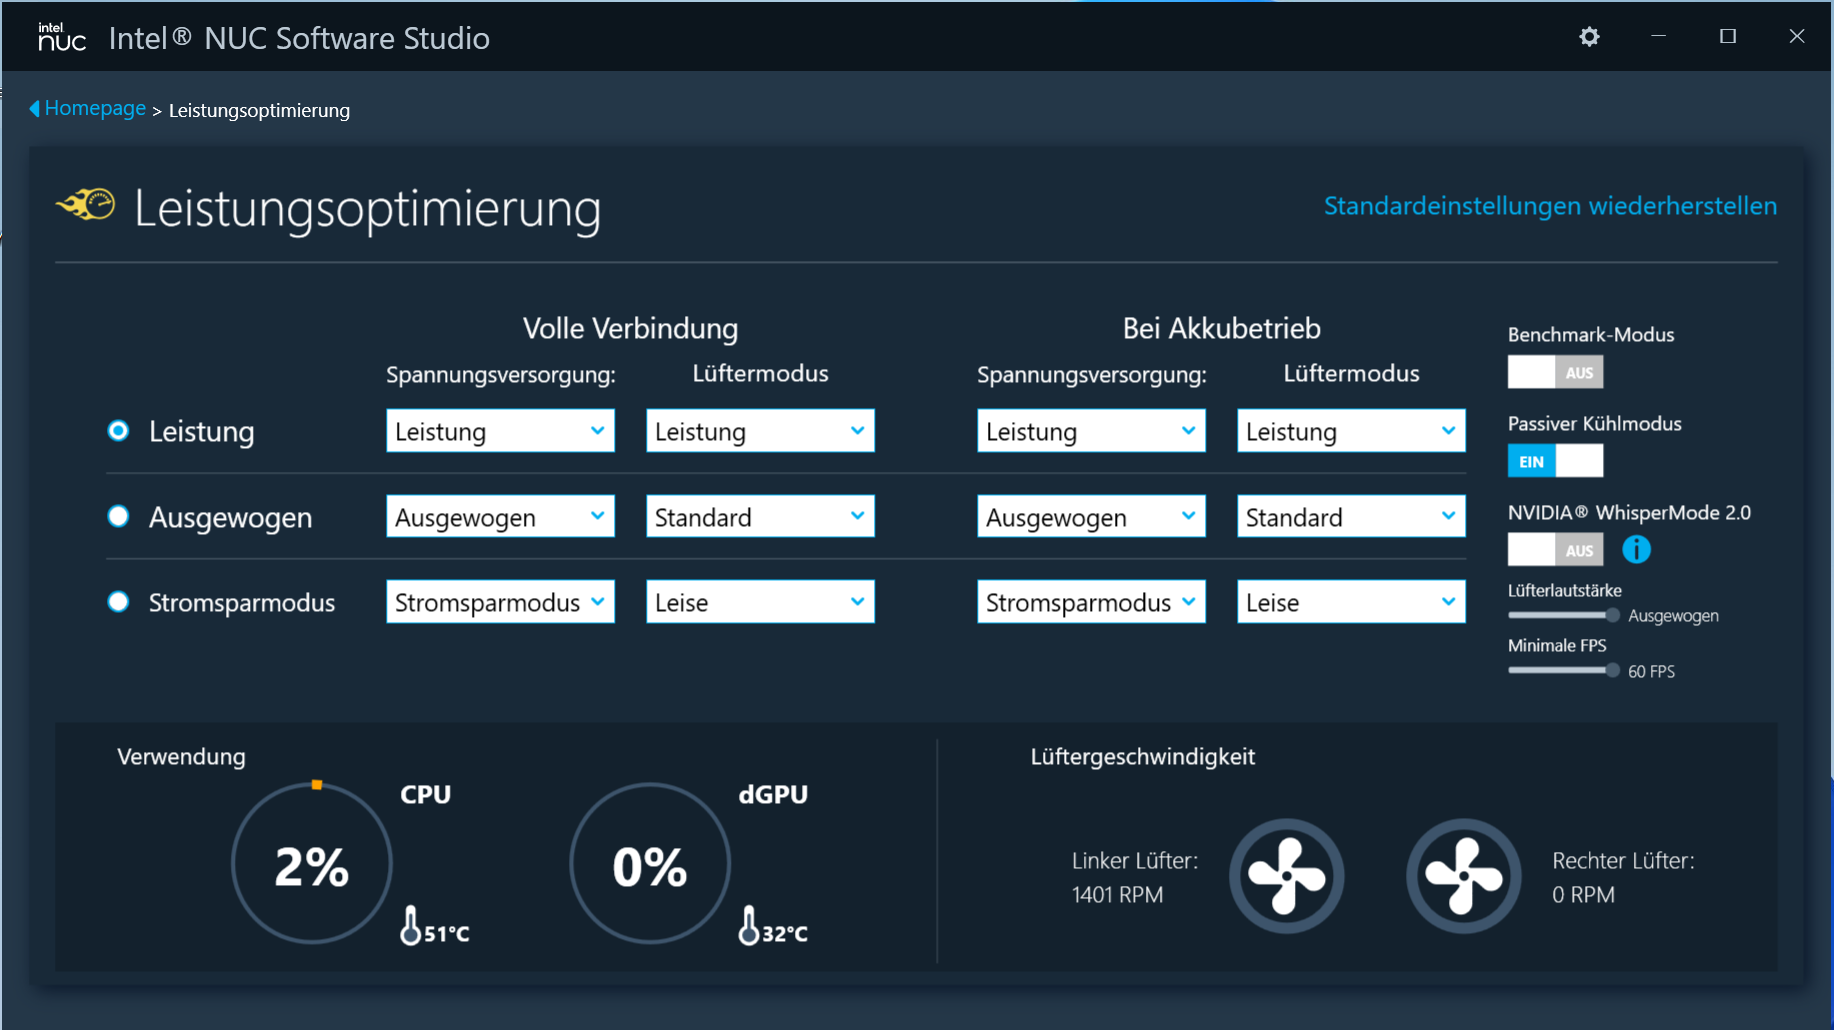
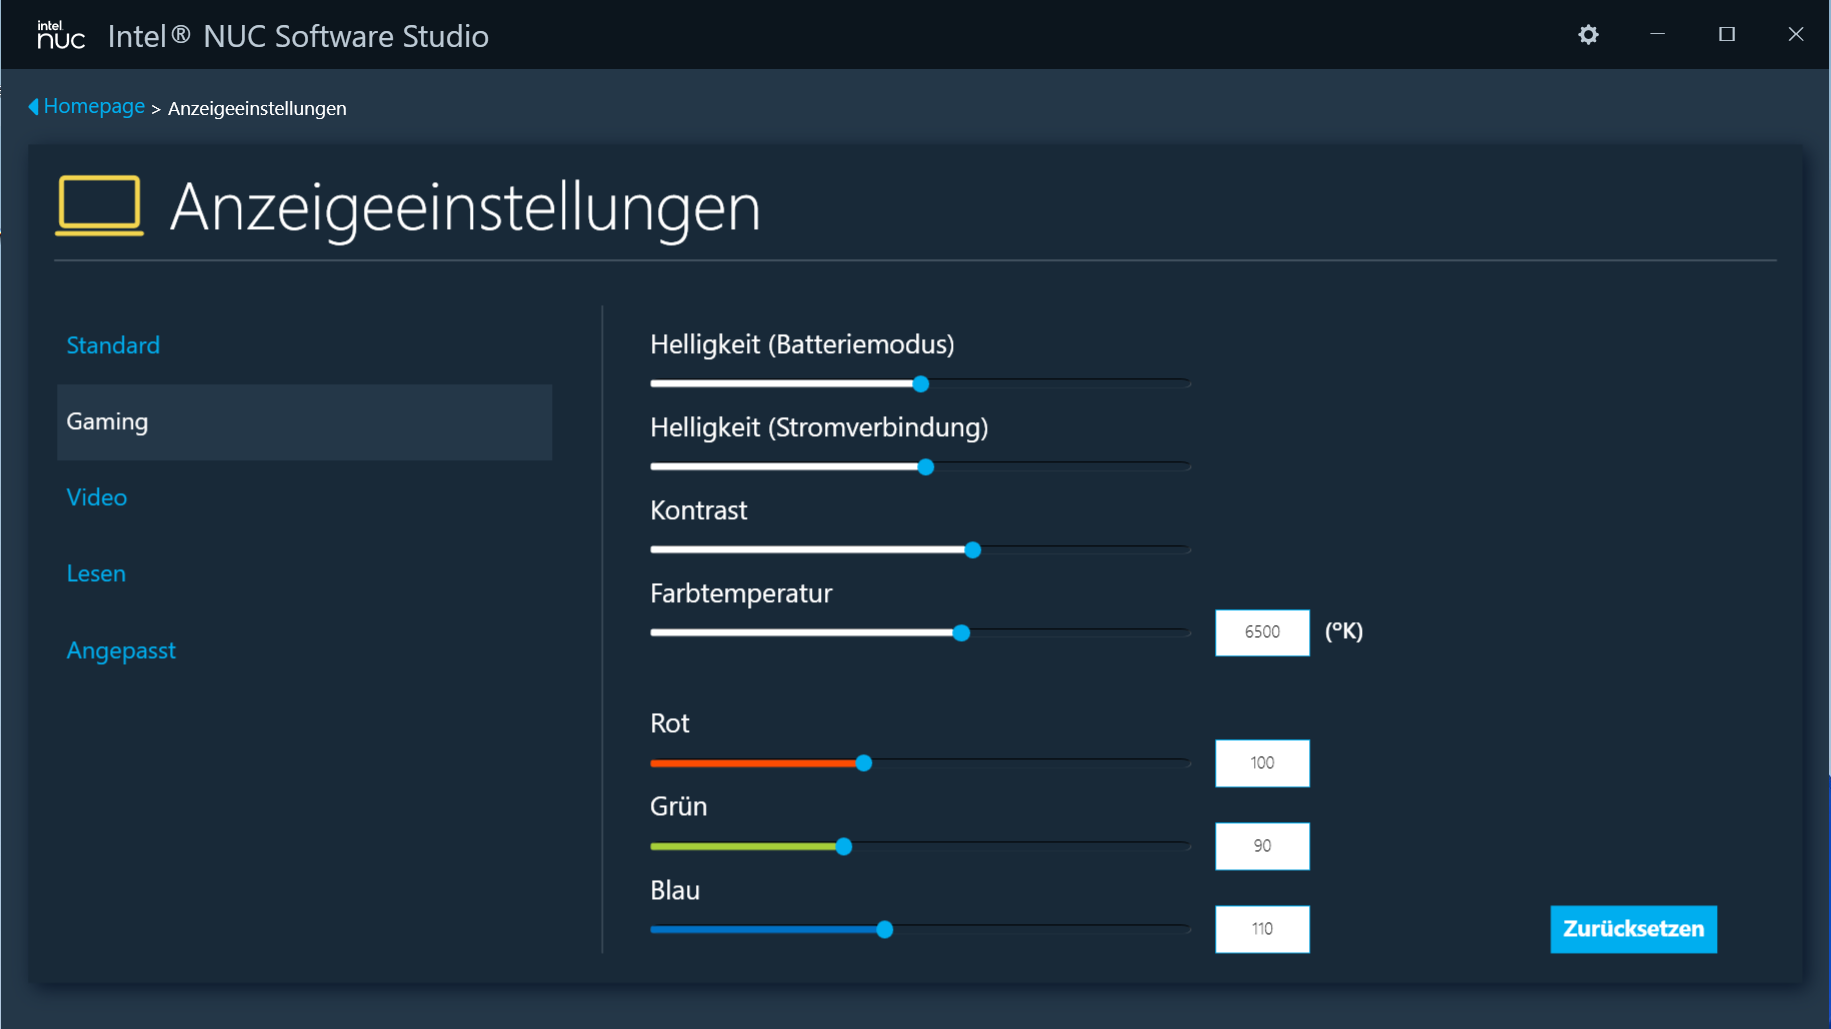
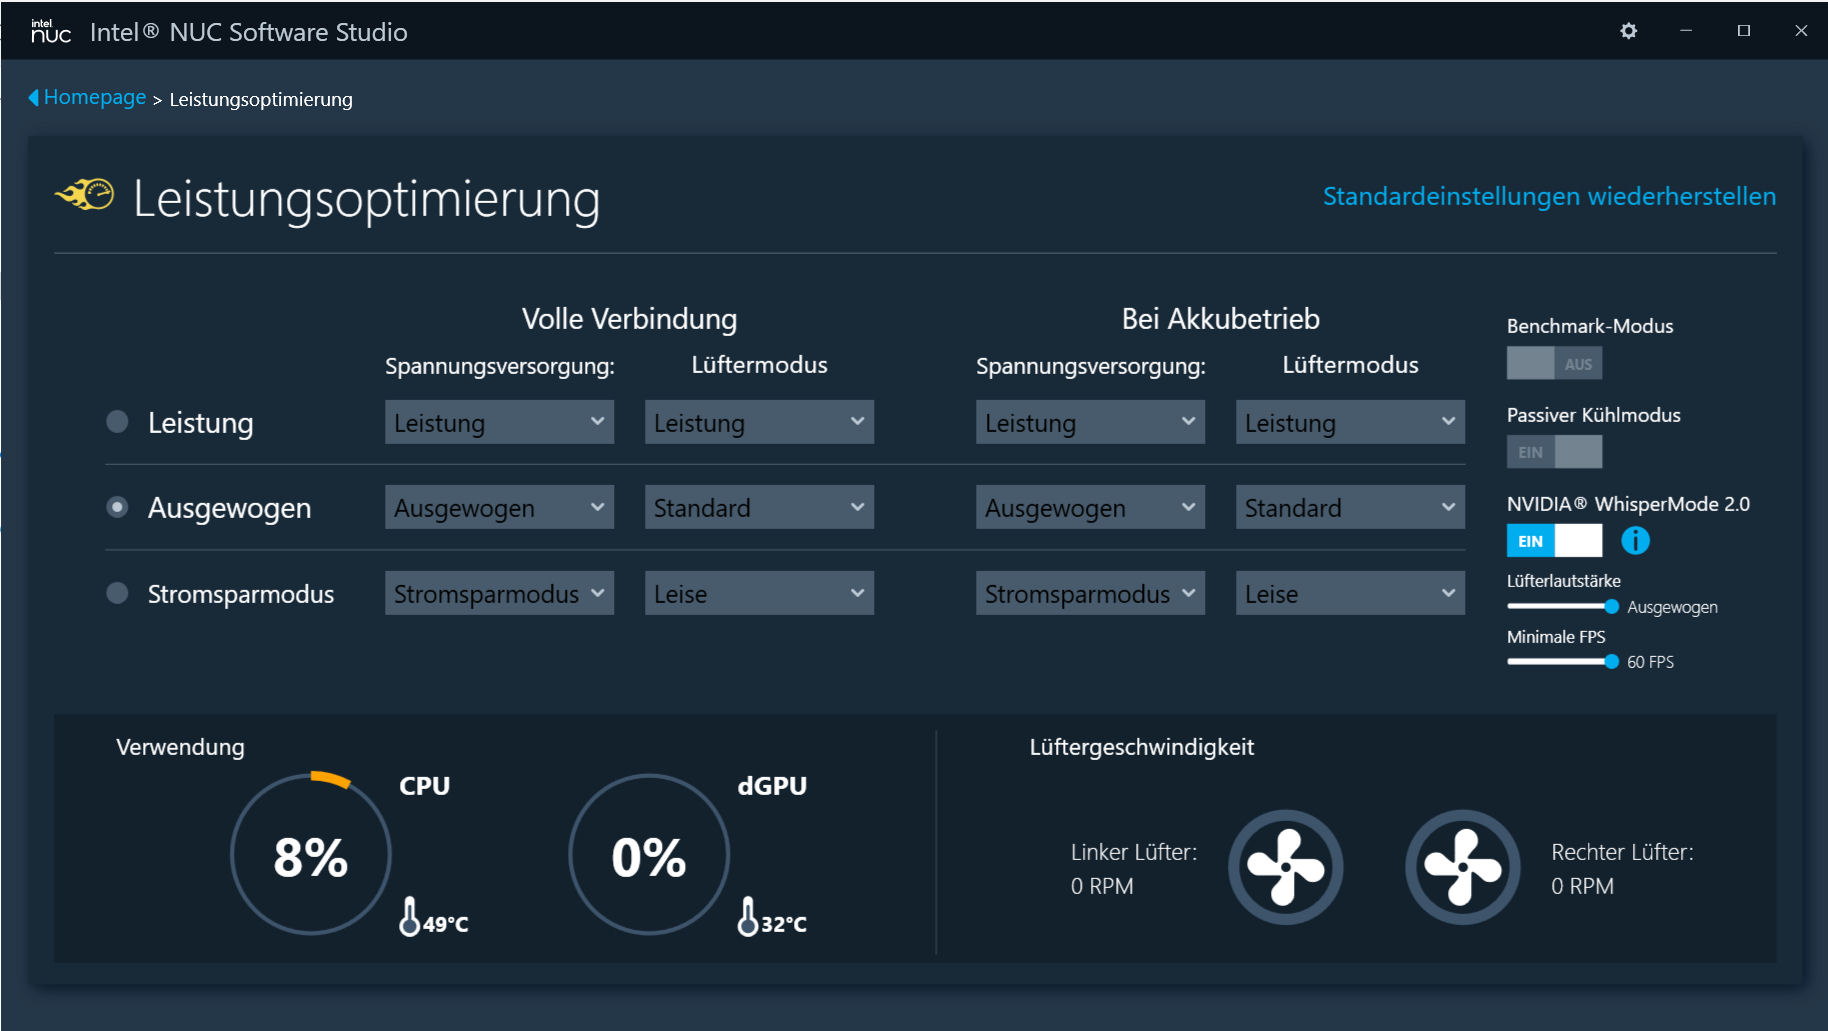
The laptop's preinstalled control center (Intel NUC Software Studio) allows users to adjust performance, among other things. There are three performance profiles available, which can be switched between within the application or via a separate button (next to the power button). A fourth profile is available within the center, which can only be activated with a mouse click: "Benchmark mode". This profile releases the built-in hardware's maximum performance and lets the fans continuously work at full power.
Our test is run using the "Balanced" profile and the active "Passive Cooling Mode" function. These are the default settings out of the box. The passive cooling mode makes the fans stop as soon as the temperatures allow it. Otherwise, a fan would permanently run at a low speed.
| Performance | Balanced | Power-saving | Benchmark Mode | |
|---|---|---|---|---|
| Power Limit 1 | 65 W | 45 W | 30 W | 100 W |
| Power Limit 2 | 90 W | 65 W | 60 W | 110 W |
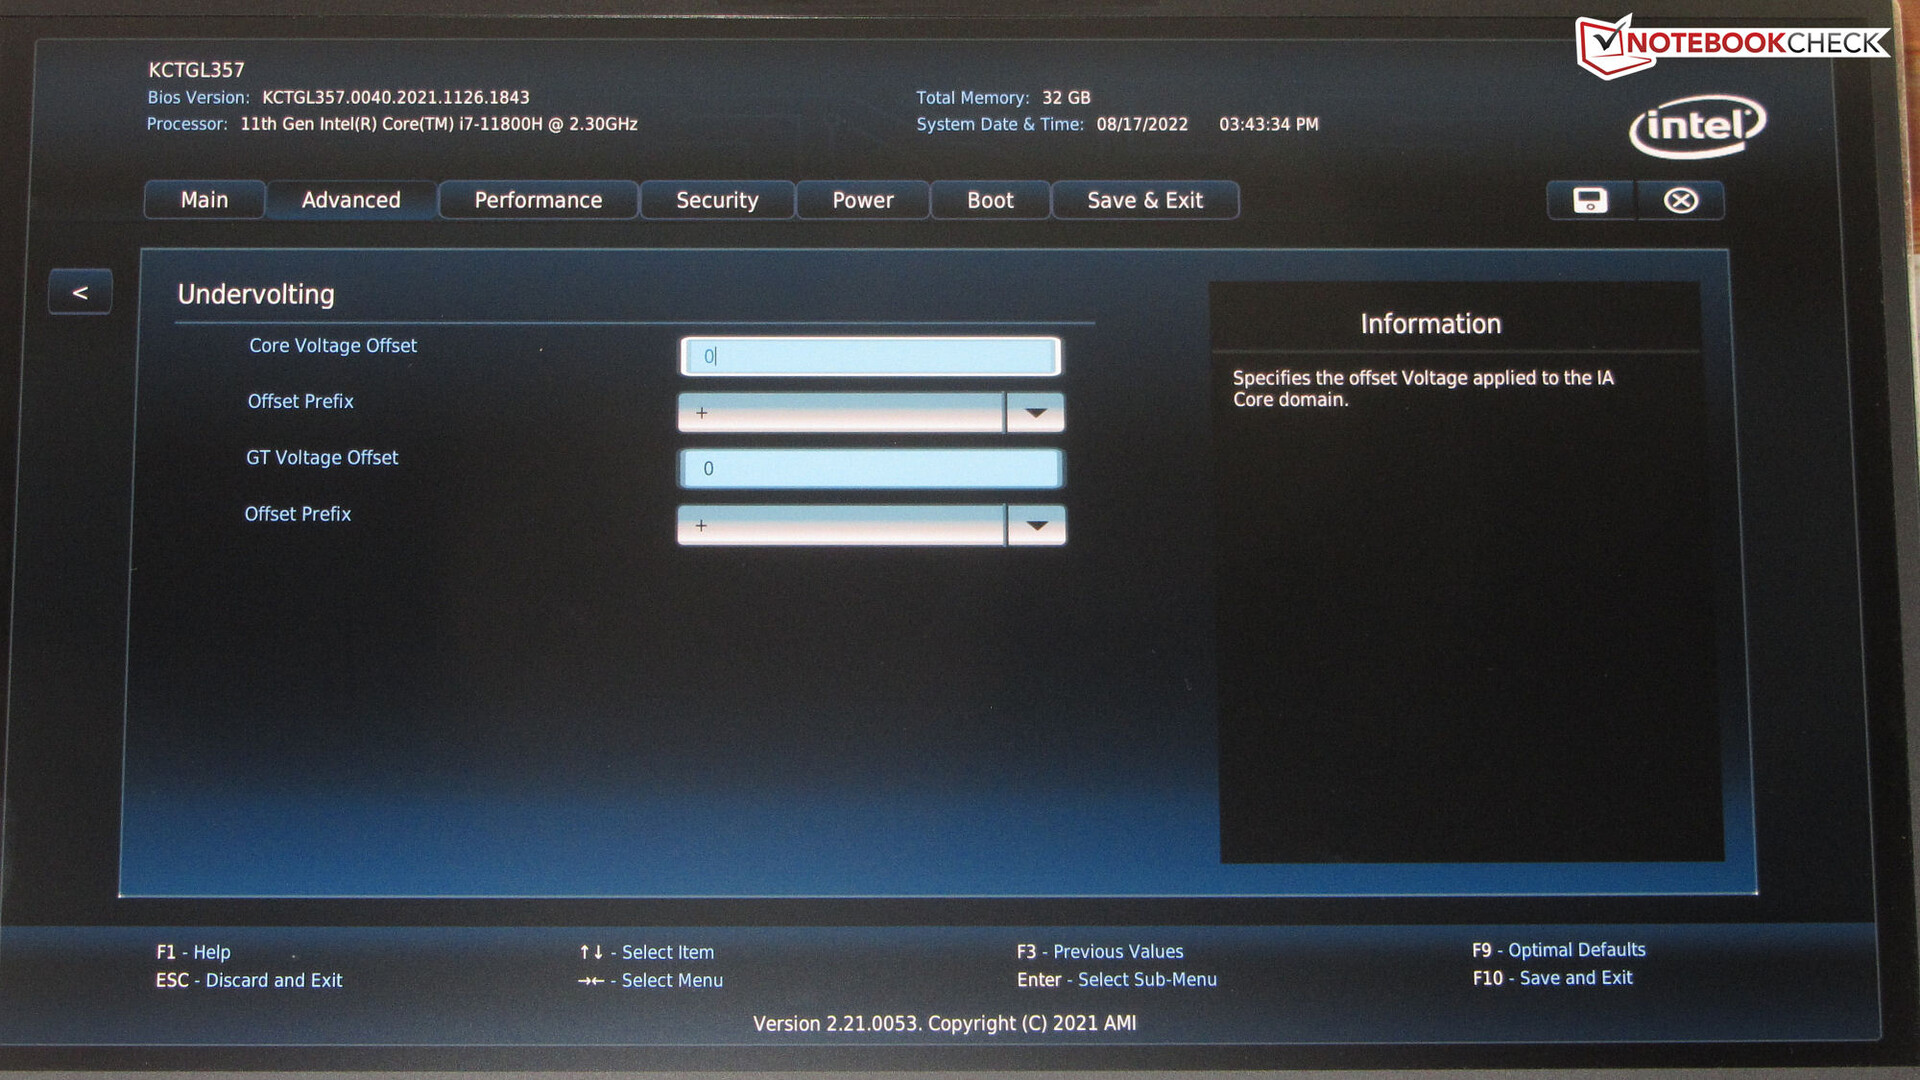
Undervolting via BIOS
The processor and iGPU can be operated with lower voltages than those intended by the manufacturer (undervolting). As a result, energy consumption and heat development decrease. But beware: Lowering the voltage too much can lead to an unstable or faulty system. In this case, it's necessary to return to the previous voltage level. Undervolting is done at the user's own risk.
Processor
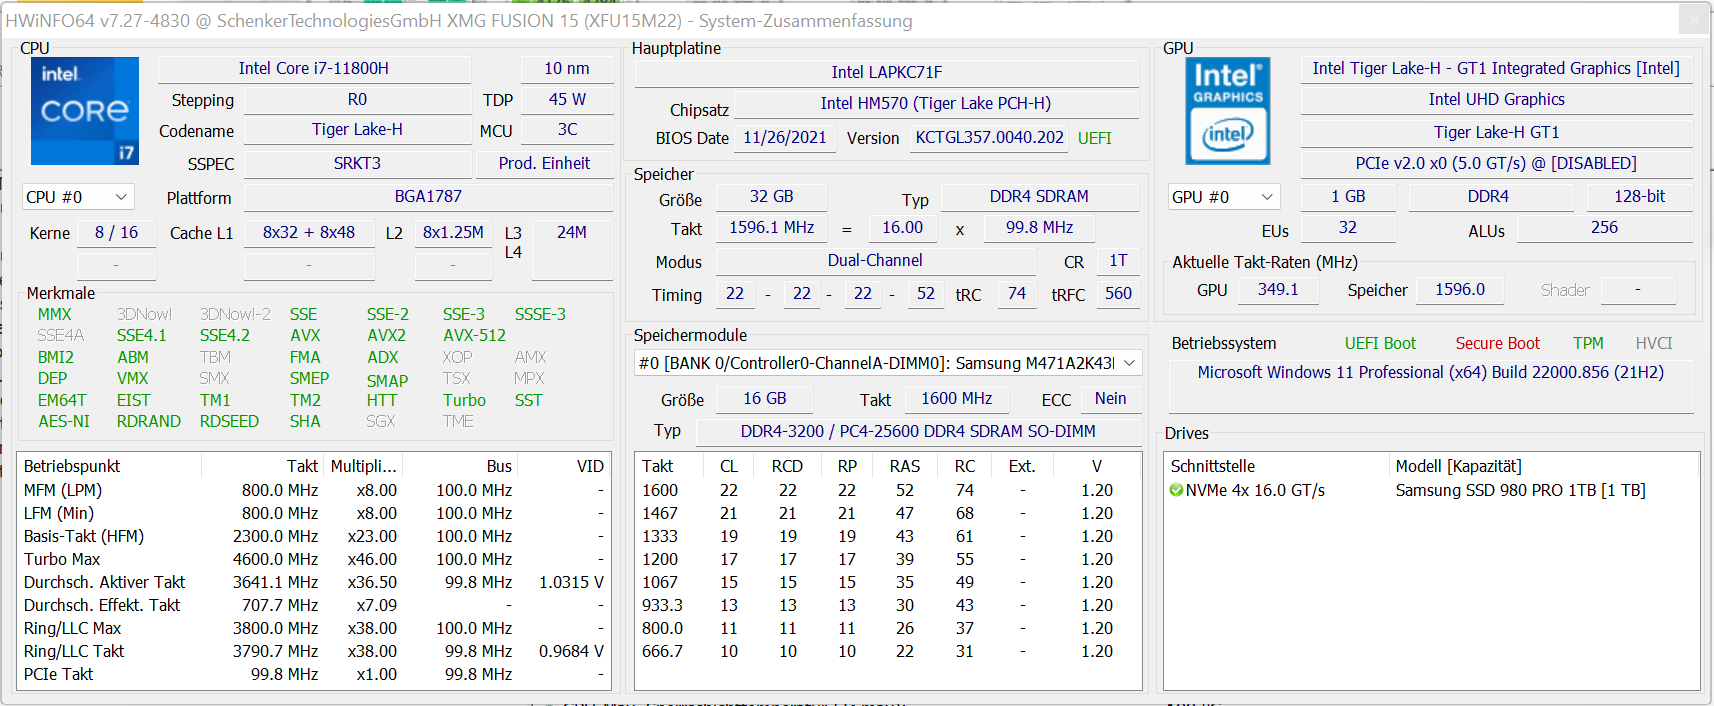
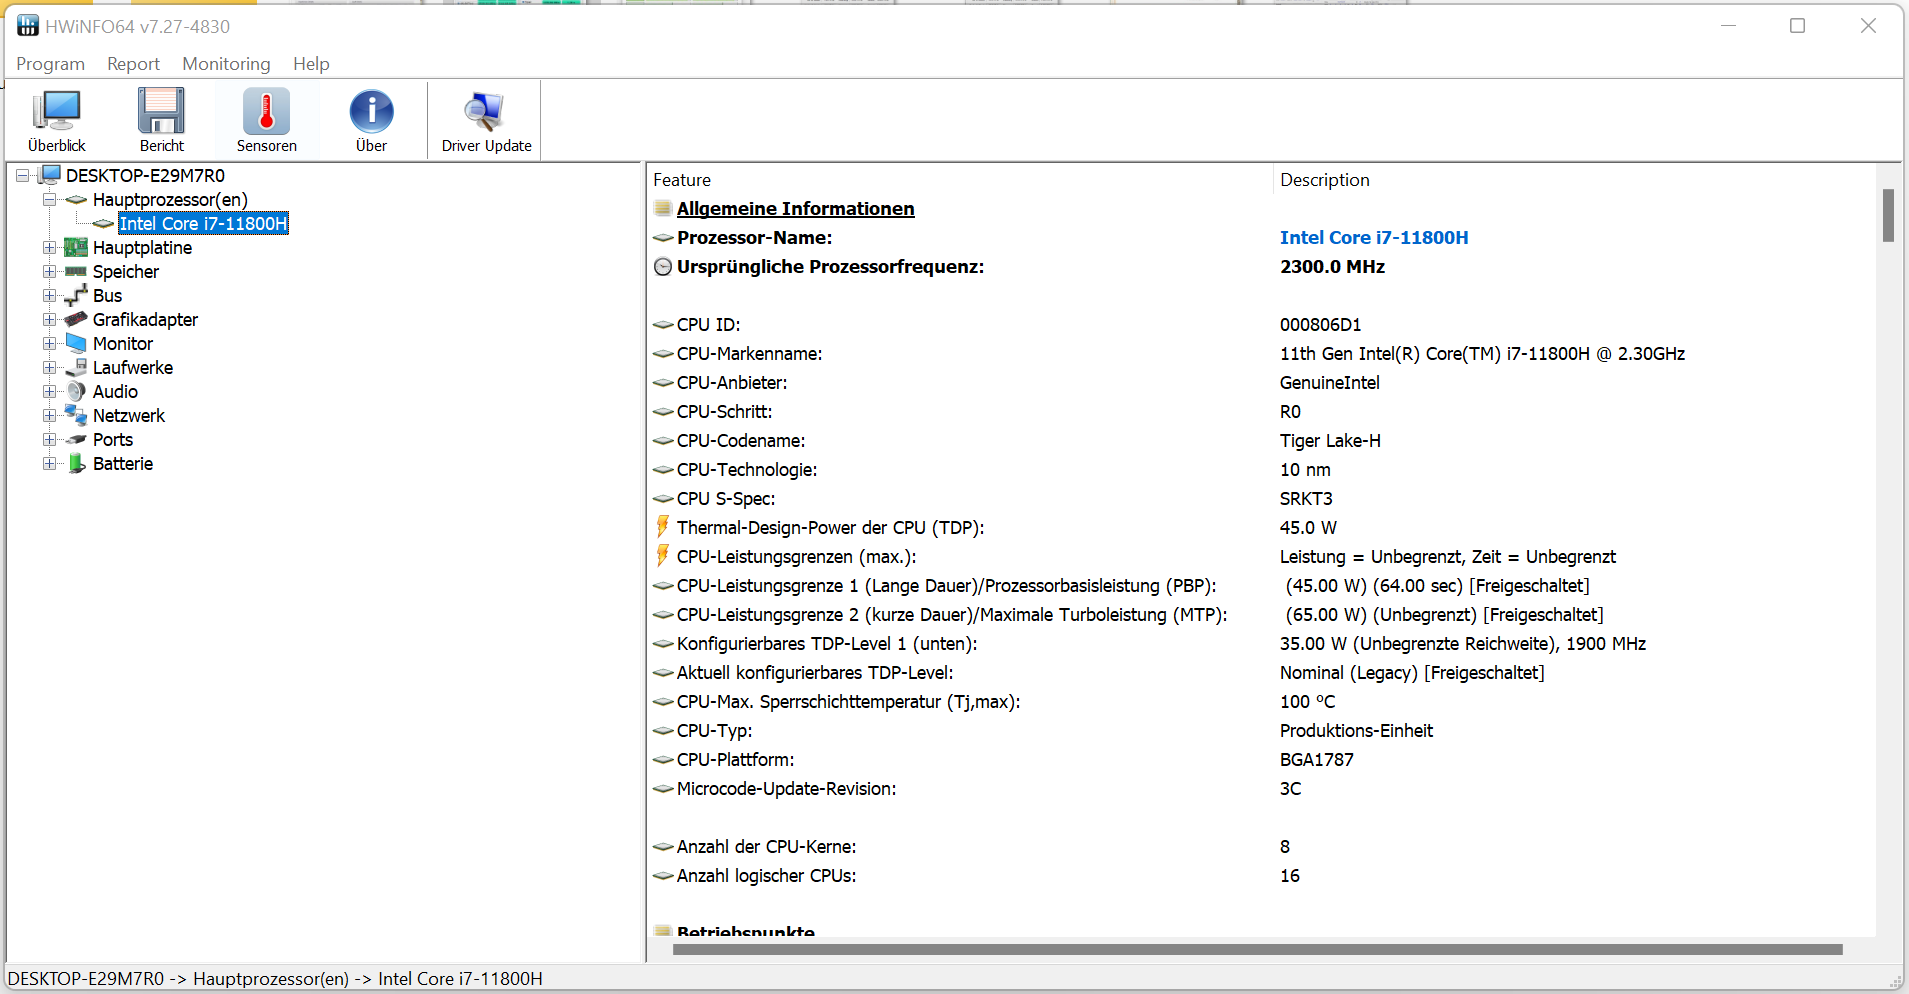
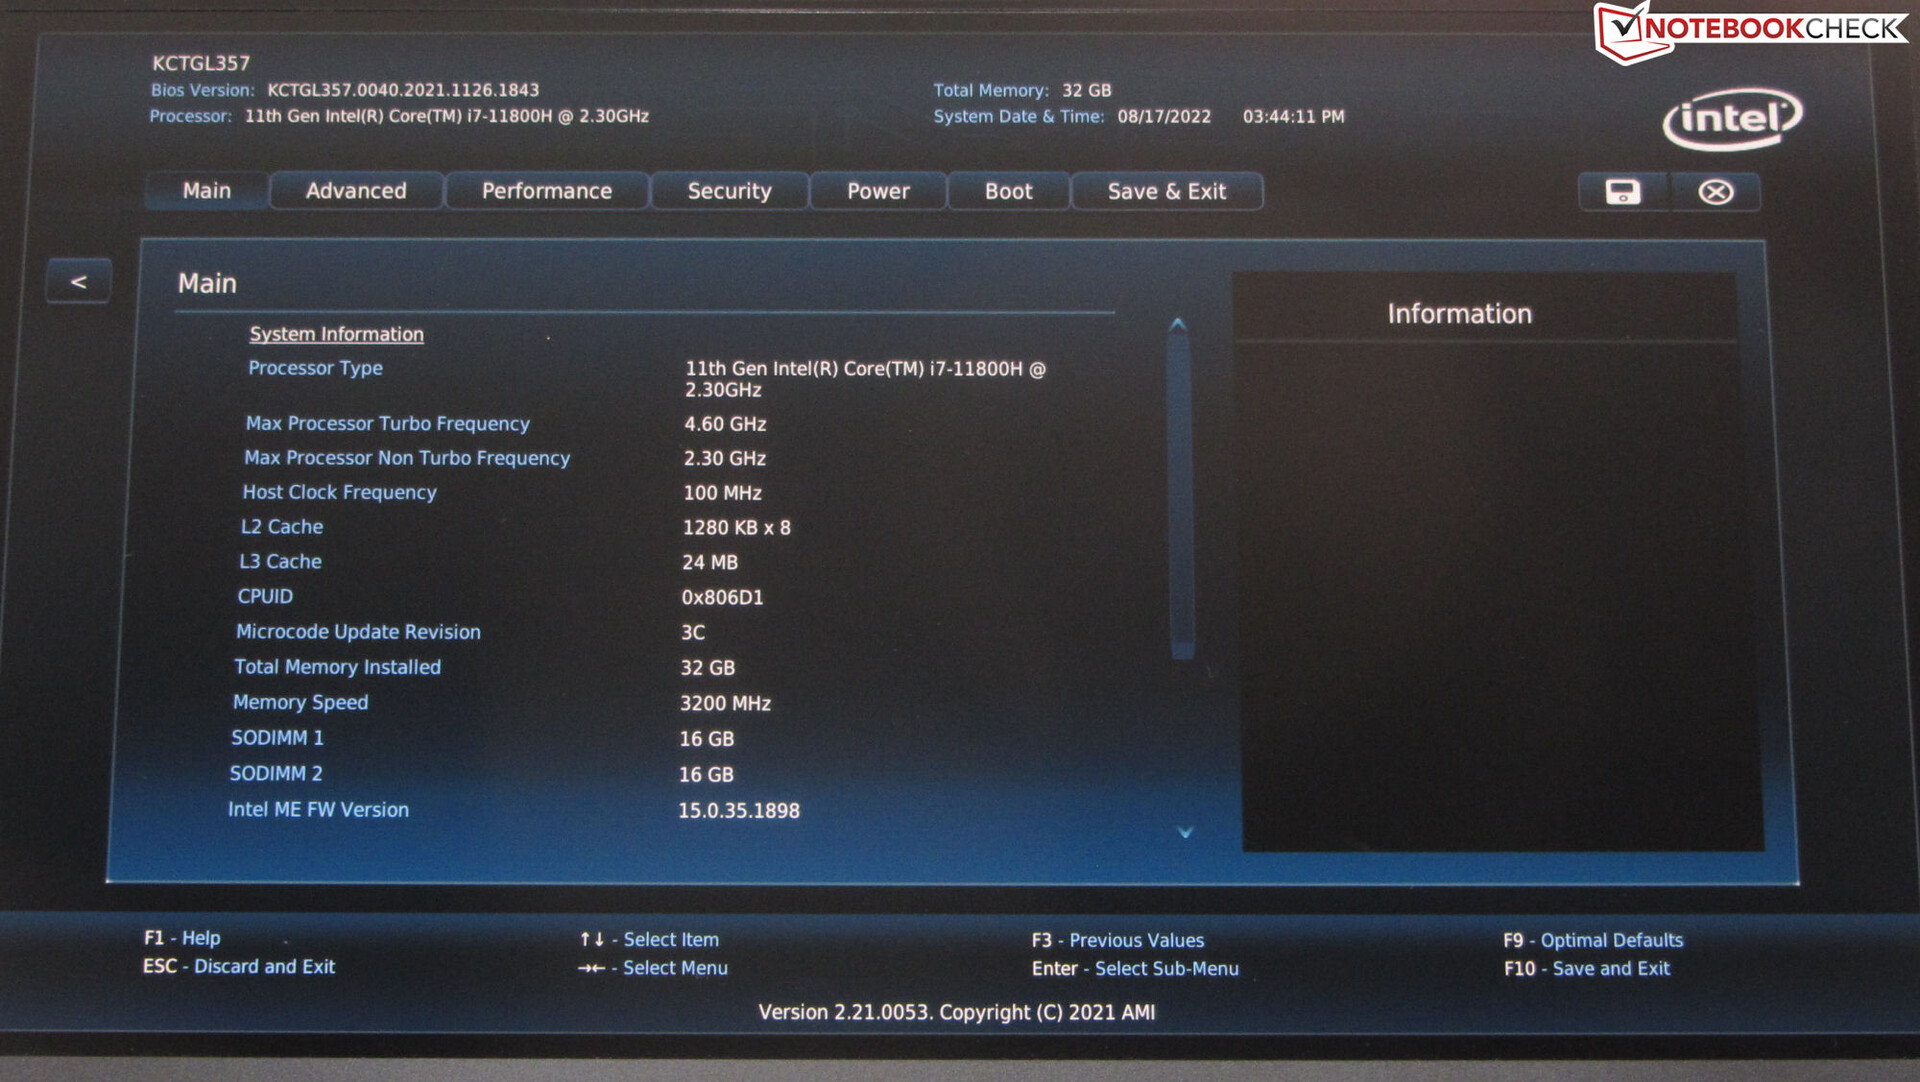
The Core-i7-11800H quad-core processor (Tiger Lake) runs at a base clock rate of 2.3 GHz. An increase to 4.2 GHz (eight cores) or 4.6 GHz (one core) is possible via Turbo. Hyper-Threading (two threads per core) is supported.
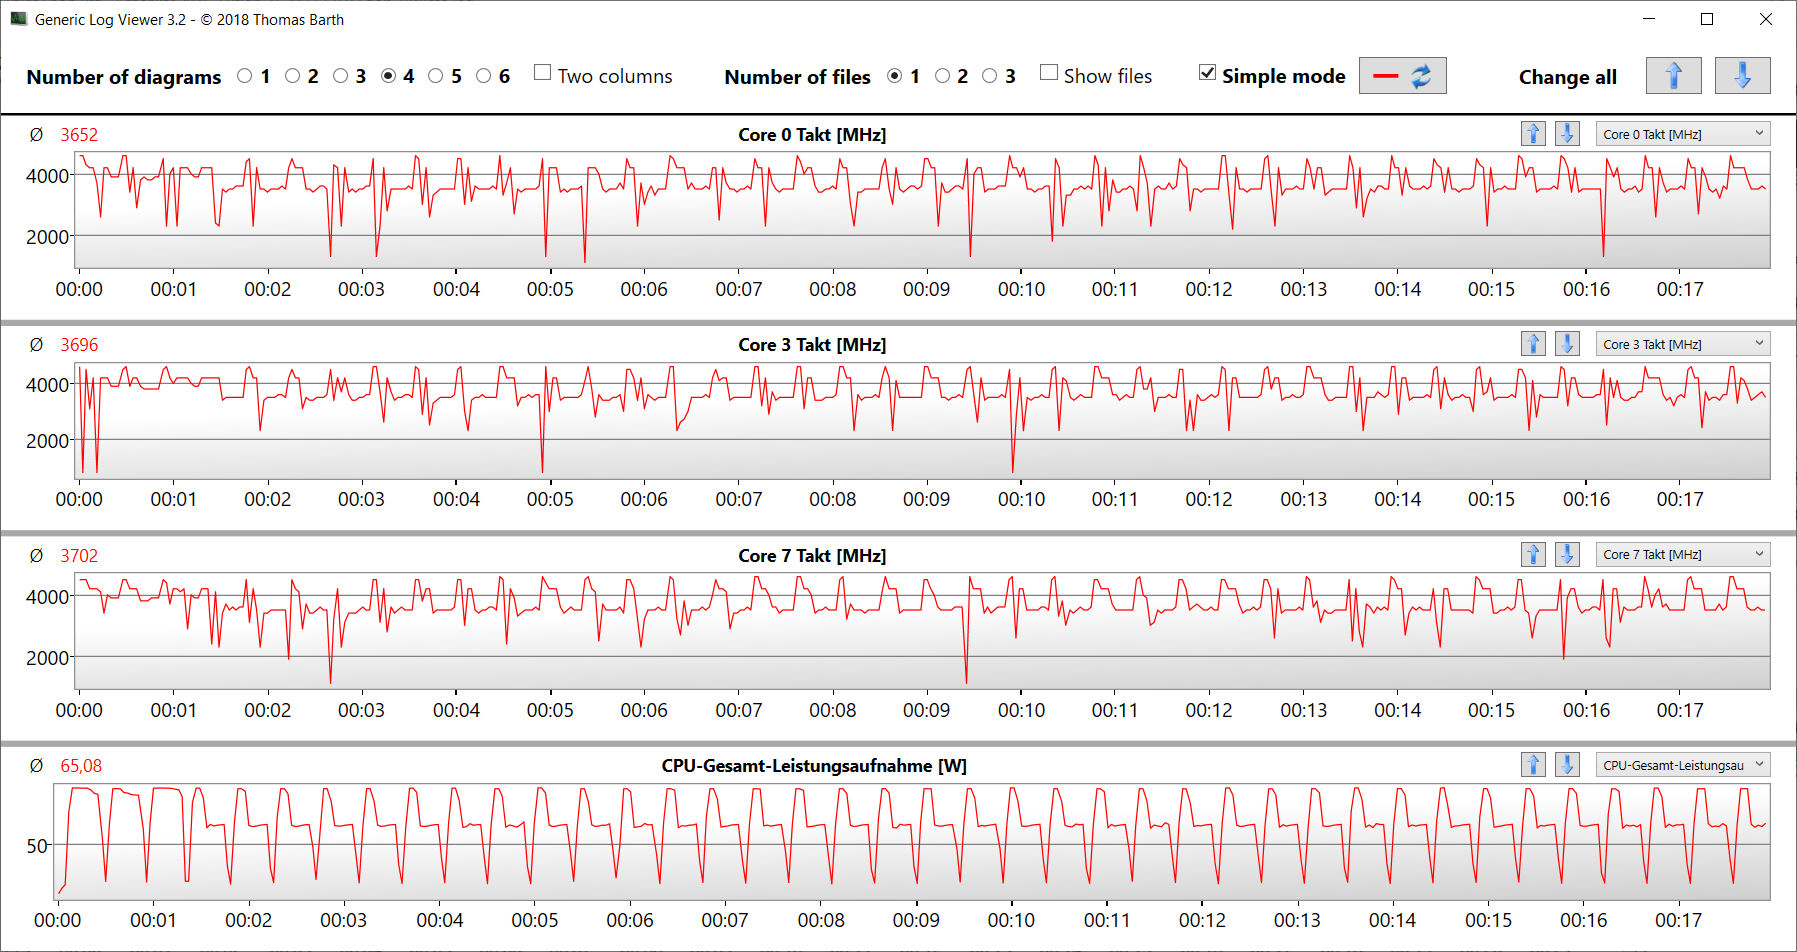
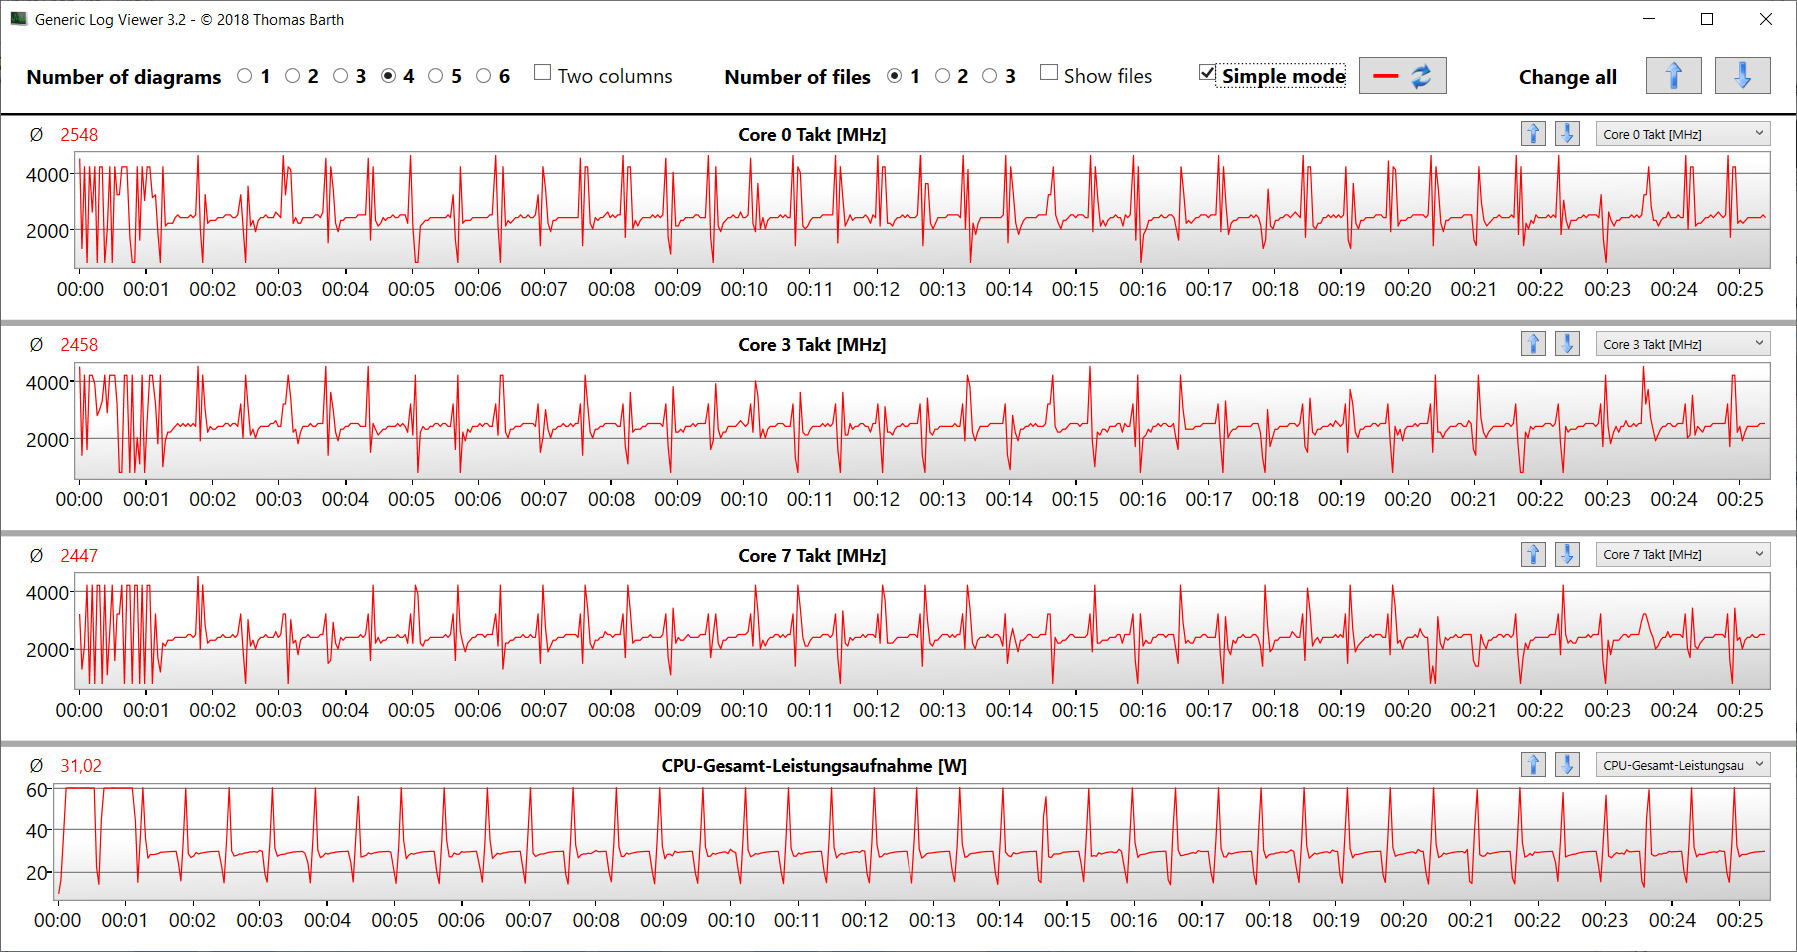
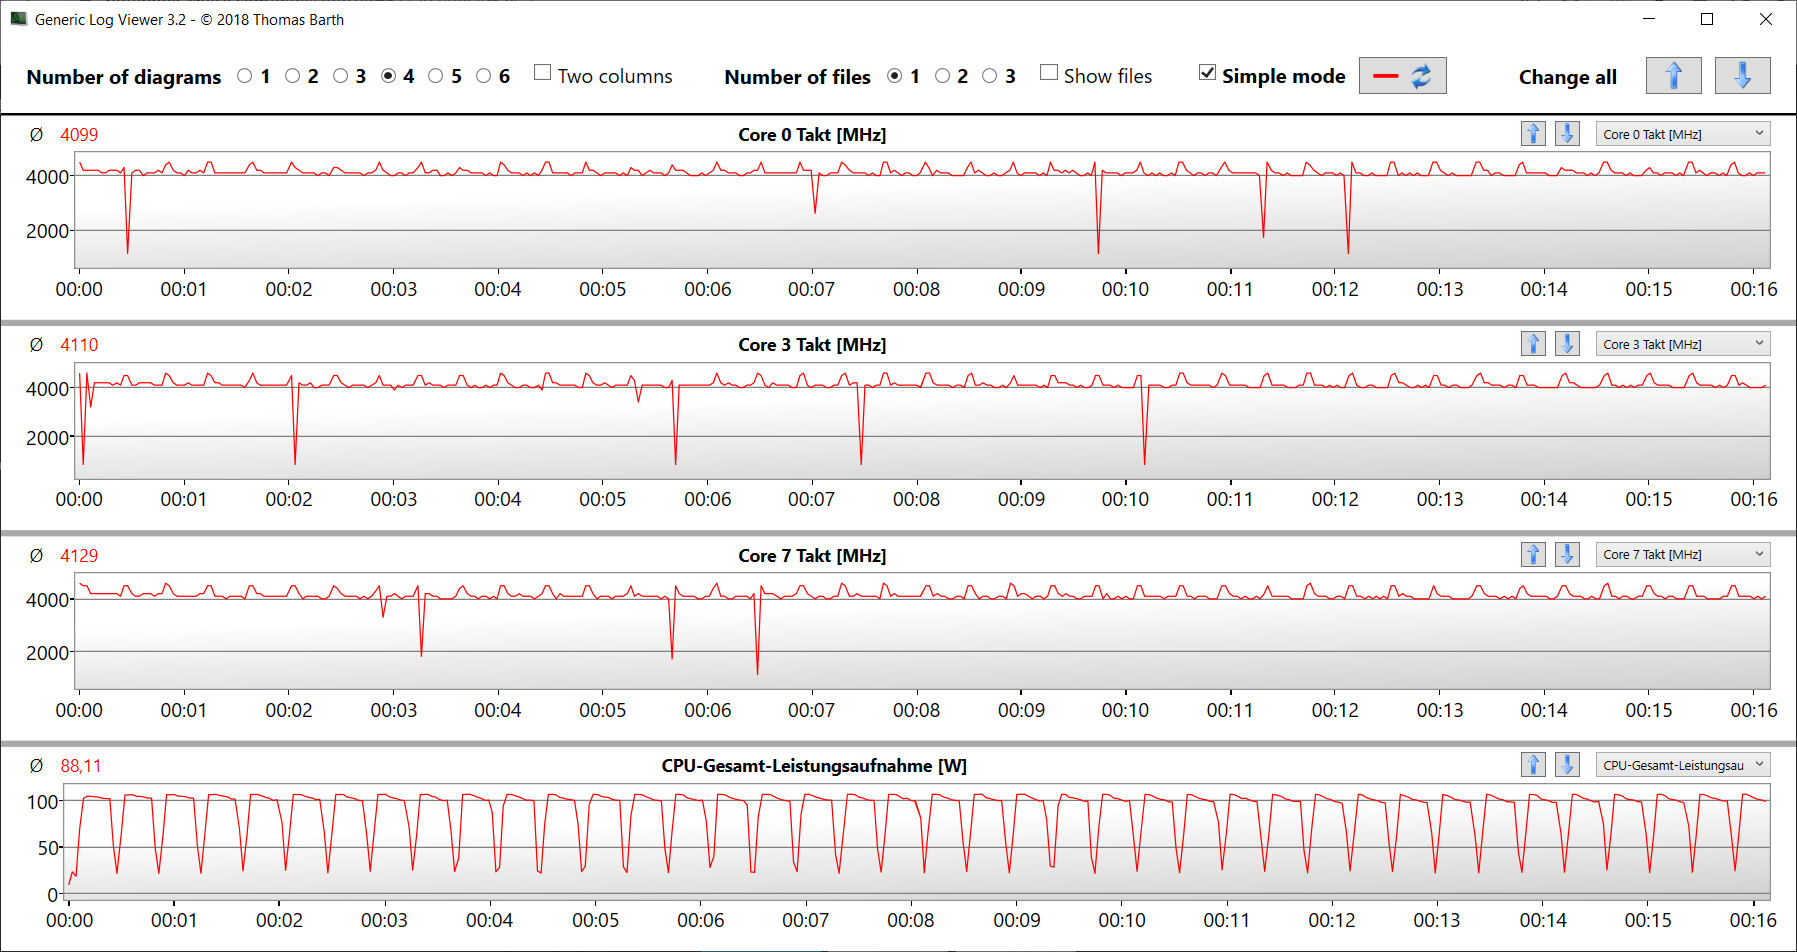
The Cinebench R15 benchmark's multithread test is processed at 1.3 to 4.2 GHz, while the single-thread test is run at 1.1 to 4.6 GHz. The clock rates remain at a similar level on battery power.

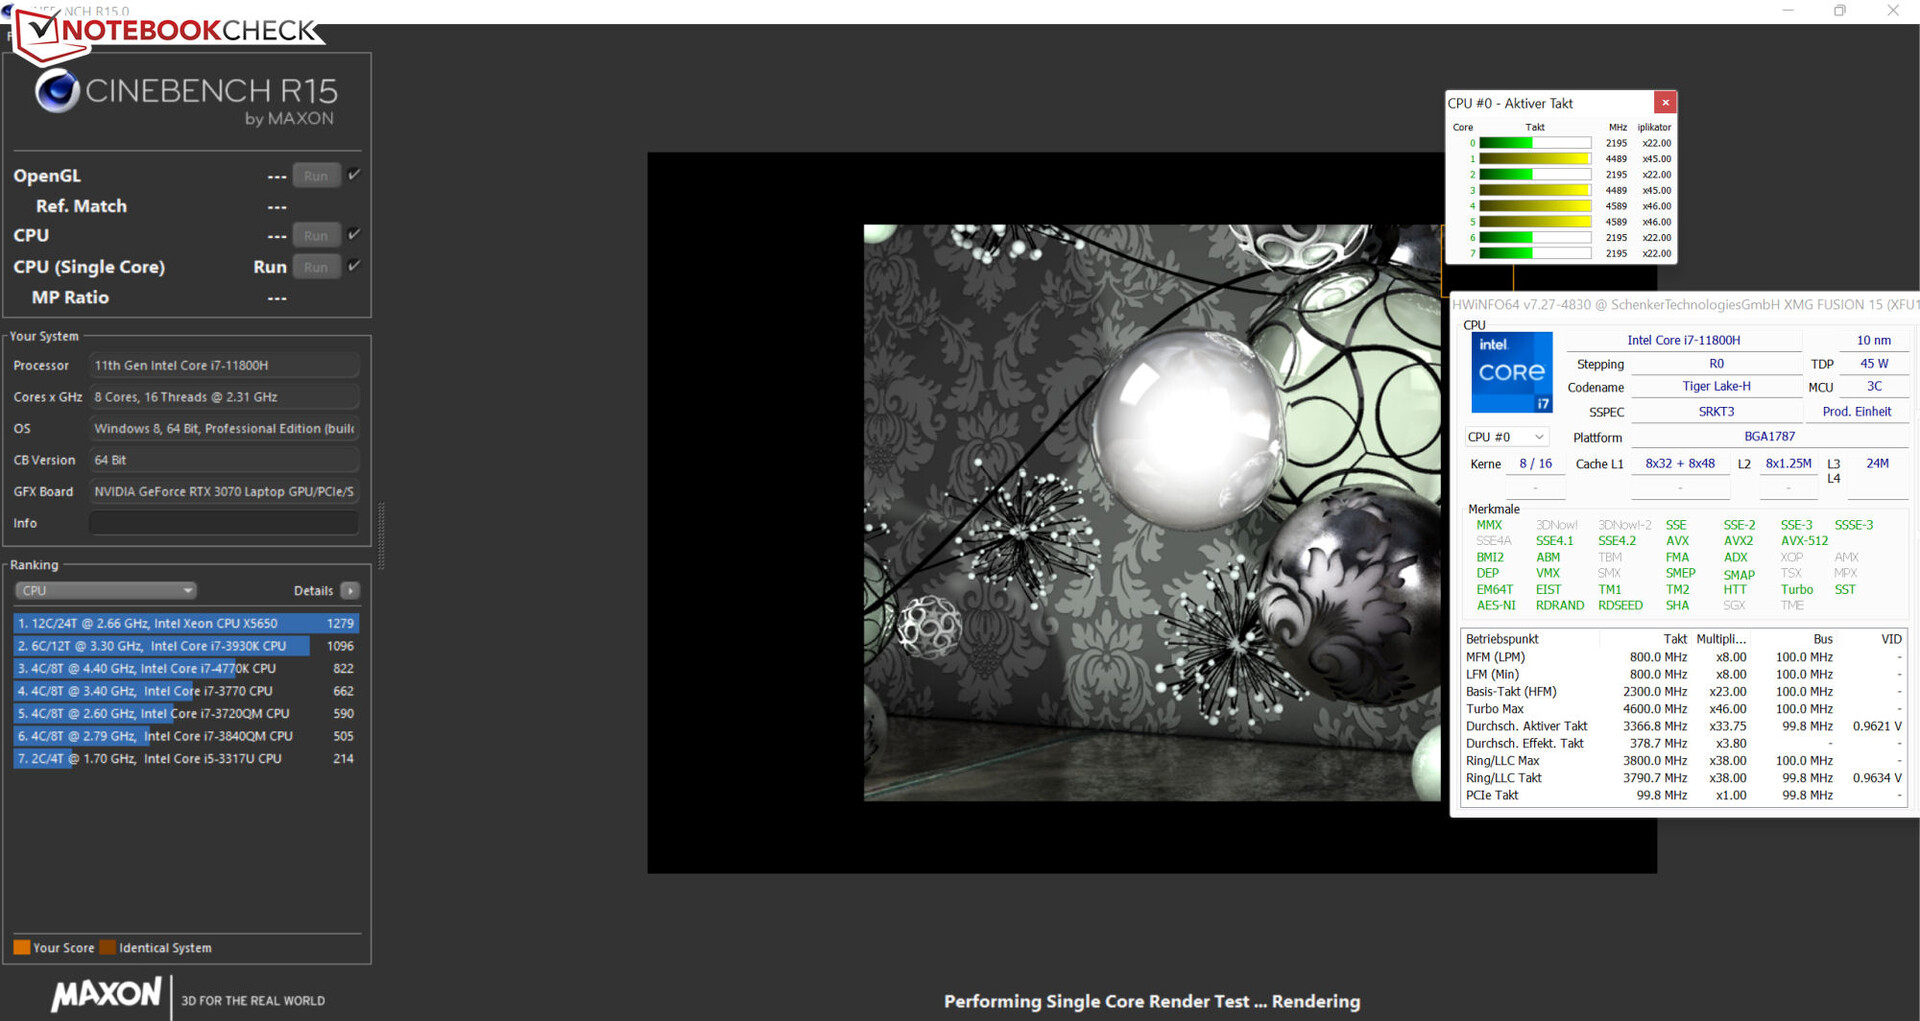
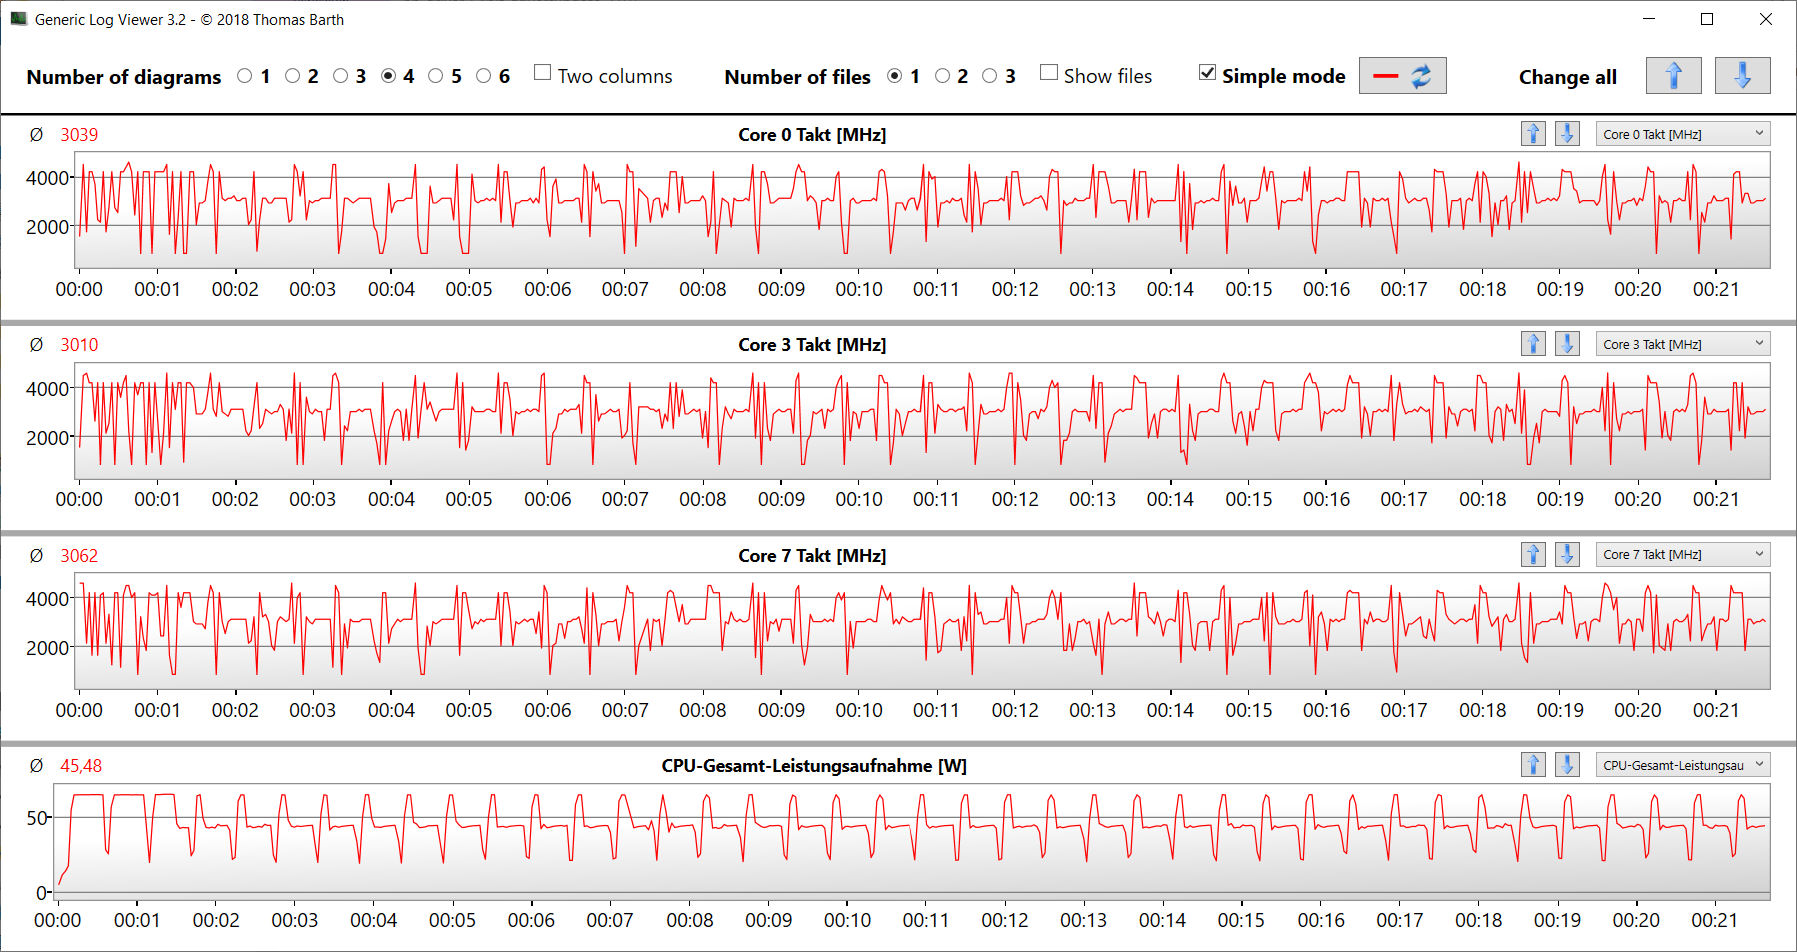
We verify if the CPU Turbo is consistently used when plugged in by running the Cinebench R15 benchmark's multithread test for at least 30 minutes. Turbo is used to a medium extent. The "Benchmark Mode" profile exploits the CPU Turbo almost completely.
Cinebench R15 Multi endurance test
| CPU Performance Rating - Percent | |
| Average of class Gaming | |
| HP Omen 16-b1090ng | |
| Acer Nitro 5 AN515-58-72QR | |
| Asus TUF Dash F15 FX517ZR | |
| SCHENKER XMG Fusion 15 (Mid 22) | |
| SCHENKER XMG Fusion 15 (Mid 22) | |
| MSI Delta 15 A5EFK | |
| Average Intel Core i7-11800H | |
| SCHENKER XMG Fusion 15 (Mid 22) | |
| SCHENKER XMG Fusion 15 (Mid 22) | |
| Razer Blade 15 Base Edition 2021, i7-10750H RTX 3060 | |
| Cinebench R23 | |
| Multi Core | |
| Average of class Gaming (2435 - 34613, n=229, last 2 years) | |
| Acer Nitro 5 AN515-58-72QR | |
| HP Omen 16-b1090ng | |
| Asus TUF Dash F15 FX517ZR | |
| SCHENKER XMG Fusion 15 (Mid 22) (Benchmark-Modus) | |
| SCHENKER XMG Fusion 15 (Mid 22) (Leistung) | |
| MSI Delta 15 A5EFK | |
| Average Intel Core i7-11800H (6508 - 14088, n=48) | |
| SCHENKER XMG Fusion 15 (Mid 22) | |
| SCHENKER XMG Fusion 15 (Mid 22) (Stromsparmodus) | |
| Razer Blade 15 Base Edition 2021, i7-10750H RTX 3060 | |
| Single Core | |
| Acer Nitro 5 AN515-58-72QR | |
| Average of class Gaming (527 - 2235, n=227, last 2 years) | |
| Asus TUF Dash F15 FX517ZR | |
| HP Omen 16-b1090ng | |
| SCHENKER XMG Fusion 15 (Mid 22) | |
| SCHENKER XMG Fusion 15 (Mid 22) (Benchmark-Modus) | |
| SCHENKER XMG Fusion 15 (Mid 22) (Leistung) | |
| Average Intel Core i7-11800H (1386 - 1522, n=45) | |
| SCHENKER XMG Fusion 15 (Mid 22) (Stromsparmodus) | |
| MSI Delta 15 A5EFK | |
| Razer Blade 15 Base Edition 2021, i7-10750H RTX 3060 | |
| Cinebench R20 | |
| CPU (Multi Core) | |
| Average of class Gaming (930 - 13769, n=227, last 2 years) | |
| Acer Nitro 5 AN515-58-72QR | |
| HP Omen 16-b1090ng | |
| Asus TUF Dash F15 FX517ZR | |
| SCHENKER XMG Fusion 15 (Mid 22) (Benchmark-Modus) | |
| SCHENKER XMG Fusion 15 (Mid 22) (Leistung) | |
| MSI Delta 15 A5EFK | |
| Average Intel Core i7-11800H (2498 - 5408, n=50) | |
| SCHENKER XMG Fusion 15 (Mid 22) | |
| SCHENKER XMG Fusion 15 (Mid 22) (Stromsparmodus) | |
| Razer Blade 15 Base Edition 2021, i7-10750H RTX 3060 | |
| CPU (Single Core) | |
| Average of class Gaming (169 - 855, n=227, last 2 years) | |
| Asus TUF Dash F15 FX517ZR | |
| HP Omen 16-b1090ng | |
| Acer Nitro 5 AN515-58-72QR | |
| SCHENKER XMG Fusion 15 (Mid 22) (Benchmark-Modus) | |
| SCHENKER XMG Fusion 15 (Mid 22) (Leistung) | |
| SCHENKER XMG Fusion 15 (Mid 22) | |
| MSI Delta 15 A5EFK | |
| Average Intel Core i7-11800H (520 - 586, n=47) | |
| SCHENKER XMG Fusion 15 (Mid 22) (Stromsparmodus) | |
| Razer Blade 15 Base Edition 2021, i7-10750H RTX 3060 | |
| Cinebench R15 | |
| CPU Multi 64Bit | |
| Average of class Gaming (400 - 5663, n=231, last 2 years) | |
| HP Omen 16-b1090ng | |
| Acer Nitro 5 AN515-58-72QR | |
| Asus TUF Dash F15 FX517ZR | |
| MSI Delta 15 A5EFK | |
| SCHENKER XMG Fusion 15 (Mid 22) (Benchmark-Modus) | |
| SCHENKER XMG Fusion 15 (Mid 22) (Leistung) | |
| Average Intel Core i7-11800H (1342 - 2173, n=50) | |
| SCHENKER XMG Fusion 15 (Mid 22) | |
| SCHENKER XMG Fusion 15 (Mid 22) (Stromsparmodus) | |
| Razer Blade 15 Base Edition 2021, i7-10750H RTX 3060 | |
| CPU Single 64Bit | |
| Average of class Gaming (79.2 - 318, n=230, last 2 years) | |
| Acer Nitro 5 AN515-58-72QR | |
| HP Omen 16-b1090ng | |
| Asus TUF Dash F15 FX517ZR | |
| MSI Delta 15 A5EFK | |
| SCHENKER XMG Fusion 15 (Mid 22) | |
| SCHENKER XMG Fusion 15 (Mid 22) (Leistung) | |
| SCHENKER XMG Fusion 15 (Mid 22) (Benchmark-Modus) | |
| Average Intel Core i7-11800H (201 - 231, n=46) | |
| SCHENKER XMG Fusion 15 (Mid 22) (Stromsparmodus) | |
| Razer Blade 15 Base Edition 2021, i7-10750H RTX 3060 | |
| Blender - v2.79 BMW27 CPU | |
| Razer Blade 15 Base Edition 2021, i7-10750H RTX 3060 | |
| SCHENKER XMG Fusion 15 (Mid 22) (Stromsparmodus) | |
| SCHENKER XMG Fusion 15 (Mid 22) | |
| Average Intel Core i7-11800H (217 - 454, n=46) | |
| SCHENKER XMG Fusion 15 (Mid 22) (Leistung) | |
| MSI Delta 15 A5EFK | |
| Asus TUF Dash F15 FX517ZR | |
| SCHENKER XMG Fusion 15 (Mid 22) (Benchmark-Modus) | |
| Acer Nitro 5 AN515-58-72QR | |
| Average of class Gaming (87 - 1259, n=225, last 2 years) | |
| HP Omen 16-b1090ng | |
| 7-Zip 18.03 | |
| 7z b 4 | |
| Average of class Gaming (11386 - 140932, n=226, last 2 years) | |
| HP Omen 16-b1090ng | |
| MSI Delta 15 A5EFK | |
| Asus TUF Dash F15 FX517ZR | |
| Acer Nitro 5 AN515-58-72QR | |
| SCHENKER XMG Fusion 15 (Mid 22) (Benchmark-Modus) | |
| SCHENKER XMG Fusion 15 (Mid 22) (Leistung) | |
| Average Intel Core i7-11800H (33718 - 56758, n=46) | |
| SCHENKER XMG Fusion 15 (Mid 22) | |
| SCHENKER XMG Fusion 15 (Mid 22) (Stromsparmodus) | |
| Razer Blade 15 Base Edition 2021, i7-10750H RTX 3060 | |
| 7z b 4 -mmt1 | |
| Average of class Gaming (2685 - 7581, n=226, last 2 years) | |
| HP Omen 16-b1090ng | |
| Acer Nitro 5 AN515-58-72QR | |
| Asus TUF Dash F15 FX517ZR | |
| MSI Delta 15 A5EFK | |
| SCHENKER XMG Fusion 15 (Mid 22) (Benchmark-Modus) | |
| SCHENKER XMG Fusion 15 (Mid 22) | |
| Average Intel Core i7-11800H (5138 - 5732, n=46) | |
| SCHENKER XMG Fusion 15 (Mid 22) (Leistung) | |
| SCHENKER XMG Fusion 15 (Mid 22) (Stromsparmodus) | |
| Razer Blade 15 Base Edition 2021, i7-10750H RTX 3060 | |
| Geekbench 5.5 | |
| Multi-Core | |
| Average of class Gaming (1946 - 22200, n=231, last 2 years) | |
| HP Omen 16-b1090ng | |
| Asus TUF Dash F15 FX517ZR | |
| Acer Nitro 5 AN515-58-72QR | |
| SCHENKER XMG Fusion 15 (Mid 22) (Benchmark-Modus) | |
| SCHENKER XMG Fusion 15 (Mid 22) (Leistung) | |
| MSI Delta 15 A5EFK | |
| Average Intel Core i7-11800H (4655 - 9851, n=40) | |
| SCHENKER XMG Fusion 15 (Mid 22) | |
| SCHENKER XMG Fusion 15 (Mid 22) (Stromsparmodus) | |
| Razer Blade 15 Base Edition 2021, i7-10750H RTX 3060 | |
| Single-Core | |
| HP Omen 16-b1090ng | |
| Average of class Gaming (158 - 2210, n=231, last 2 years) | |
| Asus TUF Dash F15 FX517ZR | |
| Acer Nitro 5 AN515-58-72QR | |
| SCHENKER XMG Fusion 15 (Mid 22) (Benchmark-Modus) | |
| SCHENKER XMG Fusion 15 (Mid 22) (Leistung) | |
| SCHENKER XMG Fusion 15 (Mid 22) | |
| MSI Delta 15 A5EFK | |
| Average Intel Core i7-11800H (1429 - 1625, n=40) | |
| SCHENKER XMG Fusion 15 (Mid 22) (Stromsparmodus) | |
| Razer Blade 15 Base Edition 2021, i7-10750H RTX 3060 | |
| HWBOT x265 Benchmark v2.2 - 4k Preset | |
| Average of class Gaming (3 - 37.6, n=229, last 2 years) | |
| HP Omen 16-b1090ng | |
| Acer Nitro 5 AN515-58-72QR | |
| Asus TUF Dash F15 FX517ZR | |
| SCHENKER XMG Fusion 15 (Mid 22) (Benchmark-Modus) | |
| SCHENKER XMG Fusion 15 (Mid 22) (Leistung) | |
| MSI Delta 15 A5EFK | |
| Average Intel Core i7-11800H (7.38 - 17.4, n=46) | |
| SCHENKER XMG Fusion 15 (Mid 22) | |
| SCHENKER XMG Fusion 15 (Mid 22) (Stromsparmodus) | |
| Razer Blade 15 Base Edition 2021, i7-10750H RTX 3060 | |
| LibreOffice - 20 Documents To PDF | |
| MSI Delta 15 A5EFK | |
| Average of class Gaming (32.8 - 332, n=223, last 2 years) | |
| Razer Blade 15 Base Edition 2021, i7-10750H RTX 3060 | |
| SCHENKER XMG Fusion 15 (Mid 22) | |
| Average Intel Core i7-11800H (38.6 - 59.9, n=45) | |
| SCHENKER XMG Fusion 15 (Mid 22) (Stromsparmodus) | |
| SCHENKER XMG Fusion 15 (Mid 22) (Benchmark-Modus) | |
| SCHENKER XMG Fusion 15 (Mid 22) (Leistung) | |
| Acer Nitro 5 AN515-58-72QR | |
| HP Omen 16-b1090ng | |
| Asus TUF Dash F15 FX517ZR | |
| R Benchmark 2.5 - Overall mean | |
| Razer Blade 15 Base Edition 2021, i7-10750H RTX 3060 | |
| SCHENKER XMG Fusion 15 (Mid 22) (Stromsparmodus) | |
| Average Intel Core i7-11800H (0.548 - 0.615, n=46) | |
| SCHENKER XMG Fusion 15 (Mid 22) | |
| SCHENKER XMG Fusion 15 (Mid 22) (Leistung) | |
| SCHENKER XMG Fusion 15 (Mid 22) (Benchmark-Modus) | |
| MSI Delta 15 A5EFK | |
| Average of class Gaming (0.3609 - 4.47, n=226, last 2 years) | |
| Asus TUF Dash F15 FX517ZR | |
| Acer Nitro 5 AN515-58-72QR | |
| HP Omen 16-b1090ng | |
* ... smaller is better
AIDA64: FP32 Ray-Trace | FPU Julia | CPU SHA3 | CPU Queen | FPU SinJulia | FPU Mandel | CPU AES | CPU ZLib | FP64 Ray-Trace | CPU PhotoWorxx
| Performance Rating | |
| Average of class Gaming | |
| MSI Delta 15 A5EFK | |
| SCHENKER XMG Fusion 15 (Mid 22) | |
| SCHENKER XMG Fusion 15 (Mid 22) | |
| SCHENKER XMG Fusion 15 (Mid 22) | |
| Asus TUF Dash F15 FX517ZR | |
| Average Intel Core i7-11800H | |
| HP Omen 16-b1090ng | |
| SCHENKER XMG Fusion 15 (Mid 22) | |
| Acer Nitro 5 AN515-58-72QR | |
| AIDA64 / FP32 Ray-Trace | |
| Average of class Gaming (3069 - 60169, n=222, last 2 years) | |
| SCHENKER XMG Fusion 15 (Mid 22) (v6.70.6000, Benchmark-Modus) | |
| SCHENKER XMG Fusion 15 (Mid 22) (v6.70.6000, Leistung) | |
| MSI Delta 15 A5EFK (v6.33.5700) | |
| Asus TUF Dash F15 FX517ZR (v6.70.6000) | |
| Average Intel Core i7-11800H (8772 - 15961, n=20) | |
| SCHENKER XMG Fusion 15 (Mid 22) (v6.70.6000) | |
| SCHENKER XMG Fusion 15 (Mid 22) (v6.70.6000, Stromsparmodus) | |
| Acer Nitro 5 AN515-58-72QR (v6.50.5800) | |
| HP Omen 16-b1090ng (v6.50.5800) | |
| AIDA64 / FPU Julia | |
| MSI Delta 15 A5EFK (v6.33.5700) | |
| Average of class Gaming (18567 - 252486, n=222, last 2 years) | |
| Asus TUF Dash F15 FX517ZR (v6.70.6000) | |
| SCHENKER XMG Fusion 15 (Mid 22) (v6.70.6000, Benchmark-Modus) | |
| SCHENKER XMG Fusion 15 (Mid 22) (v6.70.6000) | |
| SCHENKER XMG Fusion 15 (Mid 22) (v6.70.6000, Leistung) | |
| Average Intel Core i7-11800H (39404 - 65636, n=20) | |
| SCHENKER XMG Fusion 15 (Mid 22) (v6.70.6000, Stromsparmodus) | |
| Acer Nitro 5 AN515-58-72QR (v6.50.5800) | |
| HP Omen 16-b1090ng (v6.50.5800) | |
| AIDA64 / CPU SHA3 | |
| Average of class Gaming (629 - 10389, n=222, last 2 years) | |
| SCHENKER XMG Fusion 15 (Mid 22) (v6.70.6000, Benchmark-Modus) | |
| SCHENKER XMG Fusion 15 (Mid 22) (v6.70.6000, Leistung) | |
| SCHENKER XMG Fusion 15 (Mid 22) (v6.70.6000) | |
| Average Intel Core i7-11800H (2599 - 4439, n=20) | |
| MSI Delta 15 A5EFK (v6.33.5700) | |
| Acer Nitro 5 AN515-58-72QR (v6.50.5800) | |
| Asus TUF Dash F15 FX517ZR (v6.70.6000) | |
| SCHENKER XMG Fusion 15 (Mid 22) (v6.70.6000, Stromsparmodus) | |
| HP Omen 16-b1090ng (v6.50.5800) | |
| AIDA64 / CPU Queen | |
| Average of class Gaming (15371 - 200651, n=222, last 2 years) | |
| MSI Delta 15 A5EFK (v6.33.5700) | |
| HP Omen 16-b1090ng (v6.50.5800) | |
| Acer Nitro 5 AN515-58-72QR (v6.50.5800) | |
| SCHENKER XMG Fusion 15 (Mid 22) (v6.70.6000, Leistung) | |
| SCHENKER XMG Fusion 15 (Mid 22) (v6.70.6000, Benchmark-Modus) | |
| Average Intel Core i7-11800H (85233 - 91941, n=20) | |
| Asus TUF Dash F15 FX517ZR (v6.70.6000) | |
| SCHENKER XMG Fusion 15 (Mid 22) (v6.70.6000, Stromsparmodus) | |
| SCHENKER XMG Fusion 15 (Mid 22) | |
| AIDA64 / FPU SinJulia | |
| MSI Delta 15 A5EFK (v6.33.5700) | |
| Average of class Gaming (2137 - 32988, n=222, last 2 years) | |
| Acer Nitro 5 AN515-58-72QR (v6.50.5800) | |
| SCHENKER XMG Fusion 15 (Mid 22) (v6.70.6000, Benchmark-Modus) | |
| SCHENKER XMG Fusion 15 (Mid 22) (v6.70.6000, Leistung) | |
| HP Omen 16-b1090ng (v6.50.5800) | |
| Average Intel Core i7-11800H (6420 - 9792, n=20) | |
| SCHENKER XMG Fusion 15 (Mid 22) (v6.70.6000) | |
| Asus TUF Dash F15 FX517ZR (v6.70.6000) | |
| SCHENKER XMG Fusion 15 (Mid 22) (v6.70.6000, Stromsparmodus) | |
| AIDA64 / FPU Mandel | |
| MSI Delta 15 A5EFK (v6.33.5700) | |
| Average of class Gaming (10291 - 134044, n=222, last 2 years) | |
| SCHENKER XMG Fusion 15 (Mid 22) (v6.70.6000, Benchmark-Modus) | |
| SCHENKER XMG Fusion 15 (Mid 22) (v6.70.6000, Leistung) | |
| SCHENKER XMG Fusion 15 (Mid 22) (v6.70.6000) | |
| Average Intel Core i7-11800H (23365 - 39464, n=20) | |
| Asus TUF Dash F15 FX517ZR (v6.70.6000) | |
| SCHENKER XMG Fusion 15 (Mid 22) (v6.70.6000, Stromsparmodus) | |
| Acer Nitro 5 AN515-58-72QR | |
| HP Omen 16-b1090ng (v6.50.5800) | |
| AIDA64 / CPU AES | |
| SCHENKER XMG Fusion 15 (Mid 22) (v6.70.6000, Benchmark-Modus) | |
| SCHENKER XMG Fusion 15 (Mid 22) (v6.70.6000) | |
| SCHENKER XMG Fusion 15 (Mid 22) (v6.70.6000, Leistung) | |
| MSI Delta 15 A5EFK (v6.33.5700) | |
| Average Intel Core i7-11800H (74617 - 149388, n=20) | |
| Average of class Gaming (19065 - 328679, n=222, last 2 years) | |
| SCHENKER XMG Fusion 15 (Mid 22) (v6.70.6000, Stromsparmodus) | |
| HP Omen 16-b1090ng (v6.50.5800) | |
| Asus TUF Dash F15 FX517ZR (v6.70.6000) | |
| Acer Nitro 5 AN515-58-72QR (v6.50.5800) | |
| AIDA64 / CPU ZLib | |
| Average of class Gaming (150.9 - 2409, n=222, last 2 years) | |
| Acer Nitro 5 AN515-58-72QR (v6.50.5800) | |
| HP Omen 16-b1090ng (v6.50.5800) | |
| Asus TUF Dash F15 FX517ZR (v6.70.6000) | |
| MSI Delta 15 A5EFK (v6.33.5700) | |
| SCHENKER XMG Fusion 15 (Mid 22) (v6.70.6000, Benchmark-Modus) | |
| SCHENKER XMG Fusion 15 (Mid 22) (v6.70.6000, Leistung) | |
| SCHENKER XMG Fusion 15 (Mid 22) (v6.70.6000) | |
| SCHENKER XMG Fusion 15 (Mid 22) (v6.70.6000, Stromsparmodus) | |
| Average Intel Core i7-11800H (461 - 830, n=43) | |
| AIDA64 / FP64 Ray-Trace | |
| Average of class Gaming (1518 - 31796, n=222, last 2 years) | |
| SCHENKER XMG Fusion 15 (Mid 22) (v6.70.6000, Benchmark-Modus) | |
| SCHENKER XMG Fusion 15 (Mid 22) (v6.70.6000, Leistung) | |
| MSI Delta 15 A5EFK (v6.33.5700) | |
| Asus TUF Dash F15 FX517ZR (v6.70.6000) | |
| Average Intel Core i7-11800H (4545 - 8717, n=21) | |
| SCHENKER XMG Fusion 15 (Mid 22) (v6.70.6000) | |
| SCHENKER XMG Fusion 15 (Mid 22) (v6.70.6000, Stromsparmodus) | |
| Acer Nitro 5 AN515-58-72QR (v6.50.5800) | |
| HP Omen 16-b1090ng (v6.50.5800) | |
| AIDA64 / CPU PhotoWorxx | |
| HP Omen 16-b1090ng (v6.50.5800) | |
| Average of class Gaming (10805 - 60161, n=223, last 2 years) | |
| Asus TUF Dash F15 FX517ZR (v6.70.6000) | |
| SCHENKER XMG Fusion 15 (Mid 22) (v6.70.6000, Benchmark-Modus) | |
| SCHENKER XMG Fusion 15 (Mid 22) (v6.70.6000, Leistung) | |
| SCHENKER XMG Fusion 15 (Mid 22) (v6.70.6000) | |
| SCHENKER XMG Fusion 15 (Mid 22) (v6.70.6000, Stromsparmodus) | |
| Average Intel Core i7-11800H (11898 - 26757, n=21) | |
| Acer Nitro 5 AN515-58-72QR (v6.50.5800) | |
| MSI Delta 15 A5EFK (v6.33.5700) | |
System performance
The well-rounded and smoothly running system offers sufficient processing power for demanding applications like rendering and gaming. The PCMark results are good. The RAM's transfer rates are at a normal level for DDR4-3200 memory.
CrossMark: Overall | Productivity | Creativity | Responsiveness
| PCMark 10 / Score | |
| Average of class Gaming (5235 - 9852, n=197, last 2 years) | |
| HP Omen 16-b1090ng | |
| MSI Delta 15 A5EFK | |
| Acer Nitro 5 AN515-58-72QR | |
| Average Intel Core i7-11800H, NVIDIA GeForce RTX 3070 Laptop GPU (6126 - 7311, n=11) | |
| Asus TUF Dash F15 FX517ZR | |
| SCHENKER XMG Fusion 15 (Mid 22) (Benchmark-Modus) | |
| Razer Blade 15 Base Edition 2021, i7-10750H RTX 3060 | |
| SCHENKER XMG Fusion 15 (Mid 22) | |
| PCMark 10 / Essentials | |
| Average of class Gaming (8300 - 12334, n=196, last 2 years) | |
| MSI Delta 15 A5EFK | |
| HP Omen 16-b1090ng | |
| Razer Blade 15 Base Edition 2021, i7-10750H RTX 3060 | |
| Average Intel Core i7-11800H, NVIDIA GeForce RTX 3070 Laptop GPU (9248 - 10832, n=11) | |
| Asus TUF Dash F15 FX517ZR | |
| Acer Nitro 5 AN515-58-72QR | |
| SCHENKER XMG Fusion 15 (Mid 22) (Benchmark-Modus) | |
| SCHENKER XMG Fusion 15 (Mid 22) | |
| PCMark 10 / Productivity | |
| Average of class Gaming (6662 - 11833, n=196, last 2 years) | |
| HP Omen 16-b1090ng | |
| Asus TUF Dash F15 FX517ZR | |
| MSI Delta 15 A5EFK | |
| SCHENKER XMG Fusion 15 (Mid 22) (Benchmark-Modus) | |
| Average Intel Core i7-11800H, NVIDIA GeForce RTX 3070 Laptop GPU (8571 - 9669, n=11) | |
| Acer Nitro 5 AN515-58-72QR | |
| SCHENKER XMG Fusion 15 (Mid 22) | |
| Razer Blade 15 Base Edition 2021, i7-10750H RTX 3060 | |
| PCMark 10 / Digital Content Creation | |
| Average of class Gaming (6462 - 18475, n=196, last 2 years) | |
| HP Omen 16-b1090ng | |
| MSI Delta 15 A5EFK | |
| Acer Nitro 5 AN515-58-72QR | |
| Average Intel Core i7-11800H, NVIDIA GeForce RTX 3070 Laptop GPU (7627 - 10851, n=11) | |
| Asus TUF Dash F15 FX517ZR | |
| Razer Blade 15 Base Edition 2021, i7-10750H RTX 3060 | |
| SCHENKER XMG Fusion 15 (Mid 22) (Benchmark-Modus) | |
| SCHENKER XMG Fusion 15 (Mid 22) | |
| CrossMark / Overall | |
| Average of class Gaming (1247 - 2334, n=168, last 2 years) | |
| Asus TUF Dash F15 FX517ZR | |
| Acer Nitro 5 AN515-58-72QR | |
| SCHENKER XMG Fusion 15 (Mid 22) | |
| Average Intel Core i7-11800H, NVIDIA GeForce RTX 3070 Laptop GPU (1569 - 1656, n=3) | |
| CrossMark / Productivity | |
| Average of class Gaming (1299 - 2204, n=168, last 2 years) | |
| Acer Nitro 5 AN515-58-72QR | |
| Asus TUF Dash F15 FX517ZR | |
| SCHENKER XMG Fusion 15 (Mid 22) | |
| Average Intel Core i7-11800H, NVIDIA GeForce RTX 3070 Laptop GPU (1573 - 1640, n=3) | |
| CrossMark / Creativity | |
| Average of class Gaming (1275 - 2514, n=168, last 2 years) | |
| Asus TUF Dash F15 FX517ZR | |
| Acer Nitro 5 AN515-58-72QR | |
| SCHENKER XMG Fusion 15 (Mid 22) | |
| Average Intel Core i7-11800H, NVIDIA GeForce RTX 3070 Laptop GPU (1613 - 1692, n=3) | |
| CrossMark / Responsiveness | |
| Average of class Gaming (1030 - 2330, n=168, last 2 years) | |
| Acer Nitro 5 AN515-58-72QR | |
| SCHENKER XMG Fusion 15 (Mid 22) | |
| Asus TUF Dash F15 FX517ZR | |
| Average Intel Core i7-11800H, NVIDIA GeForce RTX 3070 Laptop GPU (1435 - 1600, n=3) | |
| PCMark 8 Home Score Accelerated v2 | 4521 points | |
| PCMark 8 Creative Score Accelerated v2 | 6766 points | |
| PCMark 8 Work Score Accelerated v2 | 5851 points | |
| PCMark 10 Score | 6126 points | |
Help | ||
| AIDA64 / Memory Copy | |
| HP Omen 16-b1090ng | |
| Average of class Gaming (21842 - 92565, n=222, last 2 years) | |
| Asus TUF Dash F15 FX517ZR | |
| SCHENKER XMG Fusion 15 (Mid 22) | |
| Acer Nitro 5 AN515-58-72QR | |
| Average Intel Core i7-11800H (24508 - 48144, n=21) | |
| MSI Delta 15 A5EFK | |
| AIDA64 / Memory Read | |
| HP Omen 16-b1090ng | |
| Average of class Gaming (24879 - 90647, n=222, last 2 years) | |
| Asus TUF Dash F15 FX517ZR | |
| SCHENKER XMG Fusion 15 (Mid 22) | |
| MSI Delta 15 A5EFK | |
| Average Intel Core i7-11800H (25882 - 50365, n=20) | |
| Acer Nitro 5 AN515-58-72QR | |
| AIDA64 / Memory Write | |
| HP Omen 16-b1090ng | |
| Average of class Gaming (21619 - 103259, n=222, last 2 years) | |
| Asus TUF Dash F15 FX517ZR | |
| SCHENKER XMG Fusion 15 (Mid 22) | |
| Acer Nitro 5 AN515-58-72QR | |
| MSI Delta 15 A5EFK | |
| Average Intel Core i7-11800H (22240 - 46214, n=20) | |
| AIDA64 / Memory Latency | |
| Asus TUF Dash F15 FX517ZR | |
| SCHENKER XMG Fusion 15 (Mid 22) | |
| HP Omen 16-b1090ng | |
| Average of class Gaming (59.5 - 152.5, n=219, last 2 years) | |
| MSI Delta 15 A5EFK | |
| Average Intel Core i7-11800H (71.9 - 104.1, n=44) | |
| Acer Nitro 5 AN515-58-72QR | |
| Acer Nitro 5 AN515-58-72QR | |
* ... smaller is better
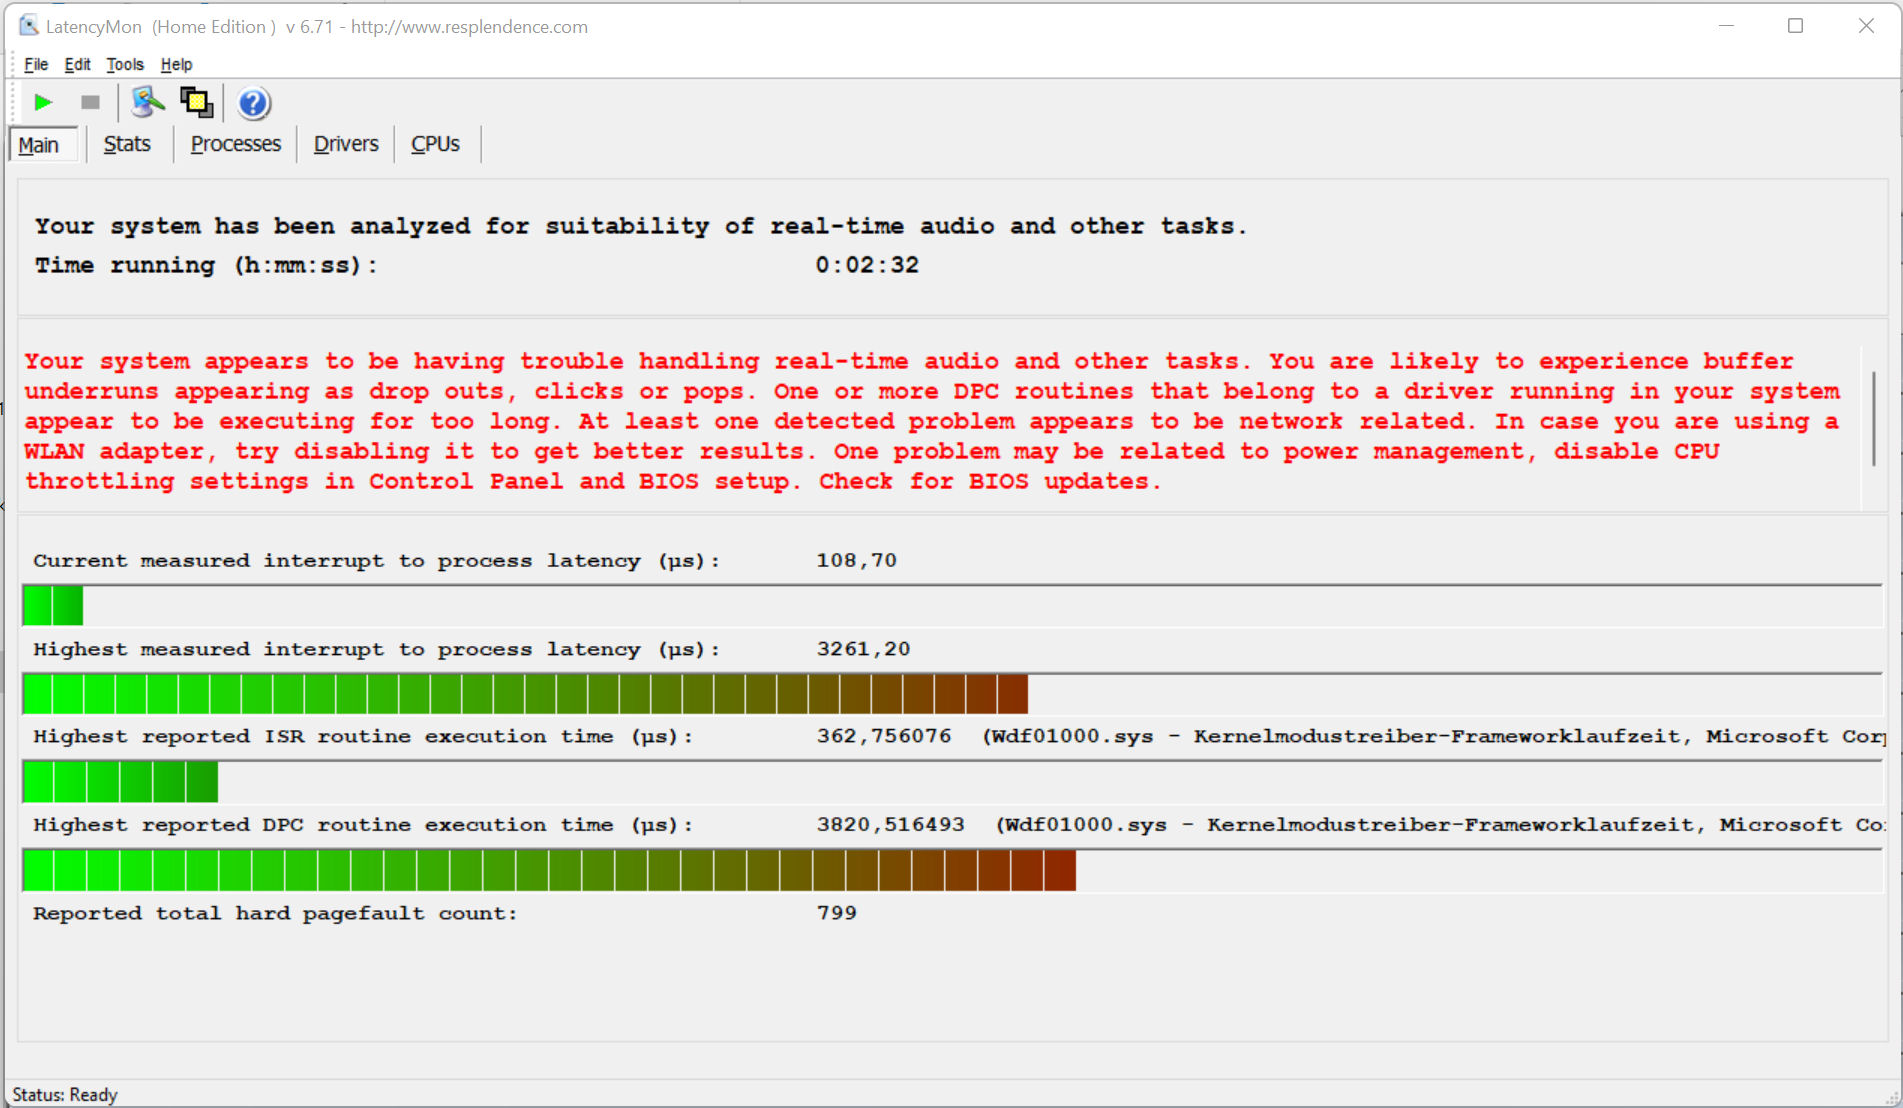
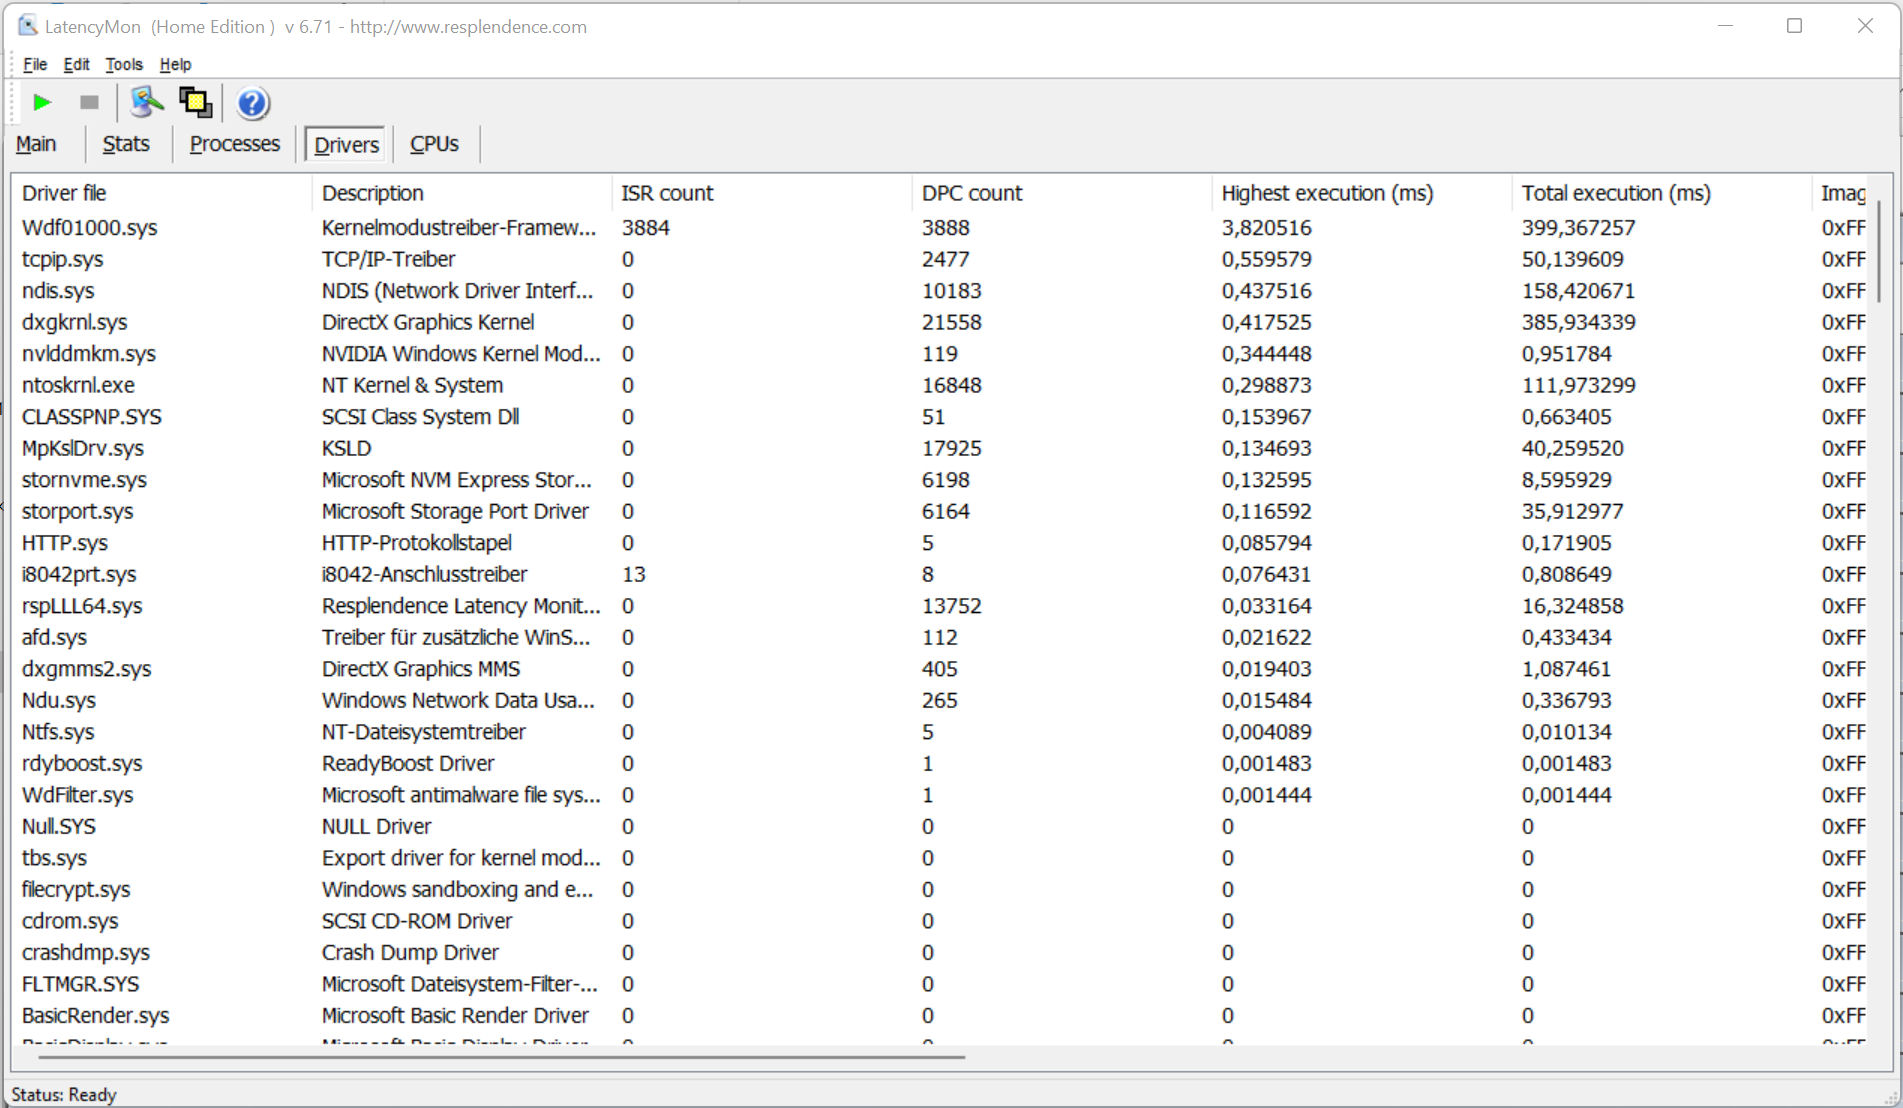
DPC latencies
The standardized latency monitor test (web browsing, 4K video playback, high-load Prime95) revealed irregularities with DPC latencies. The system doesn't seem to be suitable for real-time video and audio editing. Future software updates could lead to improvements or to worse performance as well.
| DPC Latencies / LatencyMon - interrupt to process latency (max), Web, Youtube, Prime95 | |
| SCHENKER XMG Fusion 15 (Mid 22) | |
| MSI Delta 15 A5EFK | |
| Acer Nitro 5 AN515-58-72QR | |
| HP Omen 16-b1090ng | |
| Razer Blade 15 Base Edition 2021, i7-10750H RTX 3060 | |
| Asus TUF Dash F15 FX517ZR | |
* ... smaller is better
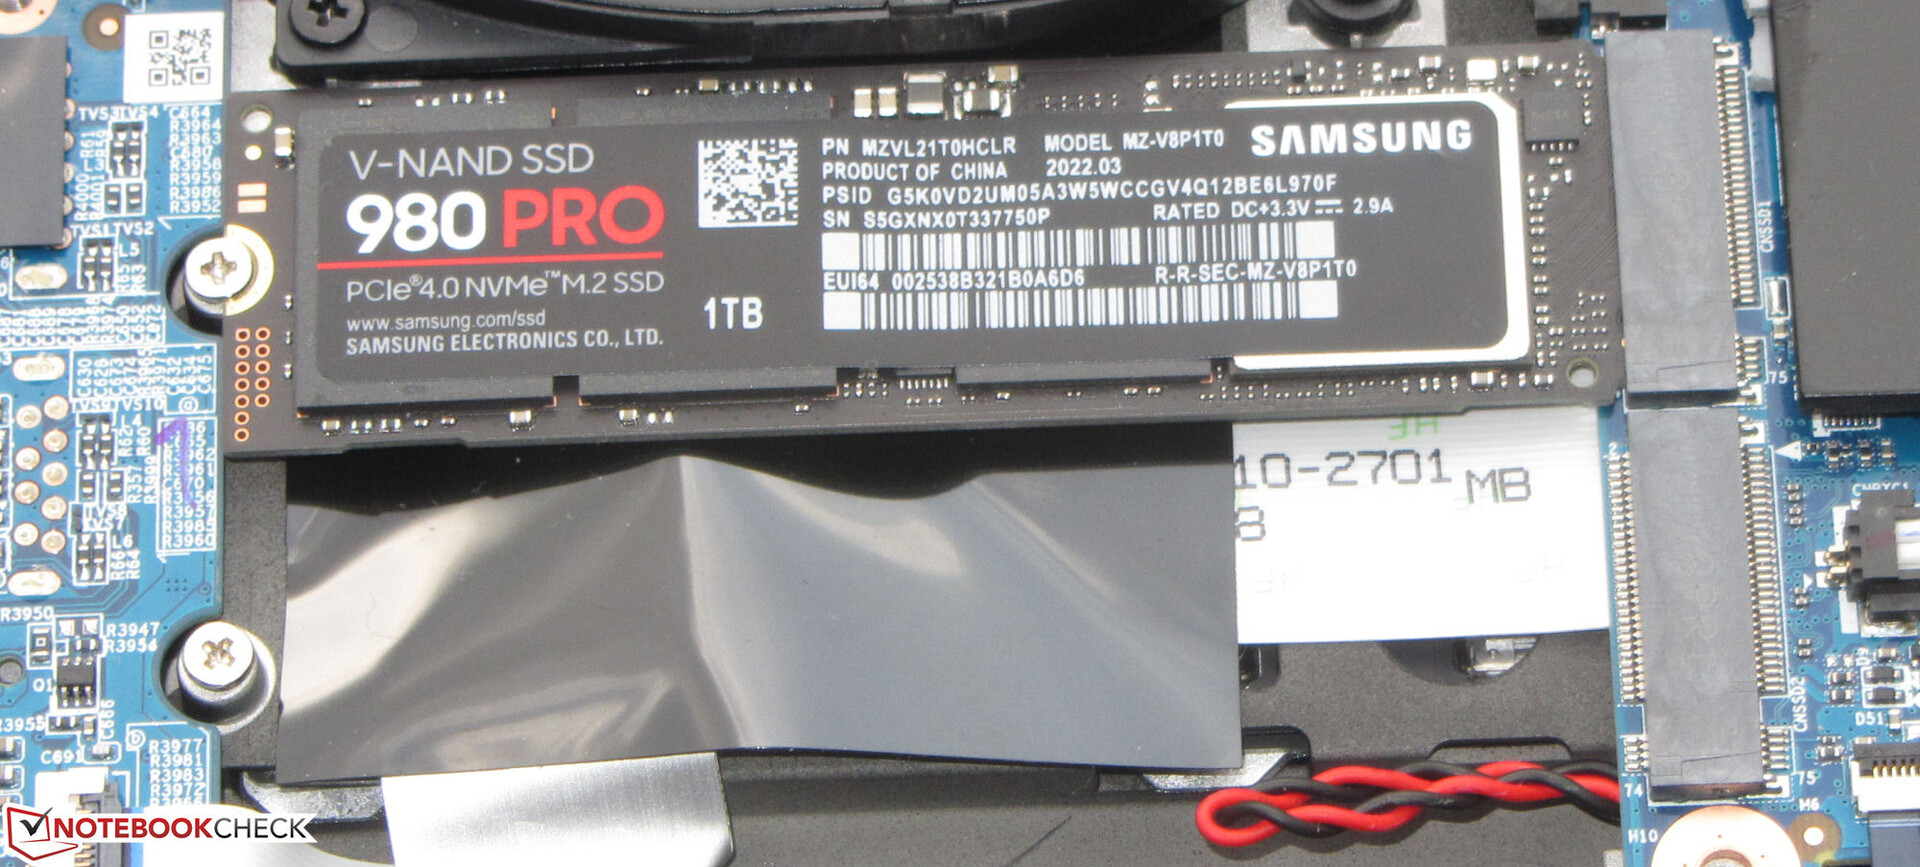
Storage
Schenker equips the laptop with a PCIe 4 SSD (1 TB, M.2 2280) from Samsung that delivers excellent transfer rates. The laptop has room for a total of two M.2-2280 SSDs (1x PCIe 4.0, 1x PCIe 3.0/SATA). RAID 0/1 is supported.

* ... smaller is better
Continuous load read: DiskSpd Read Loop, Queue Depth 8
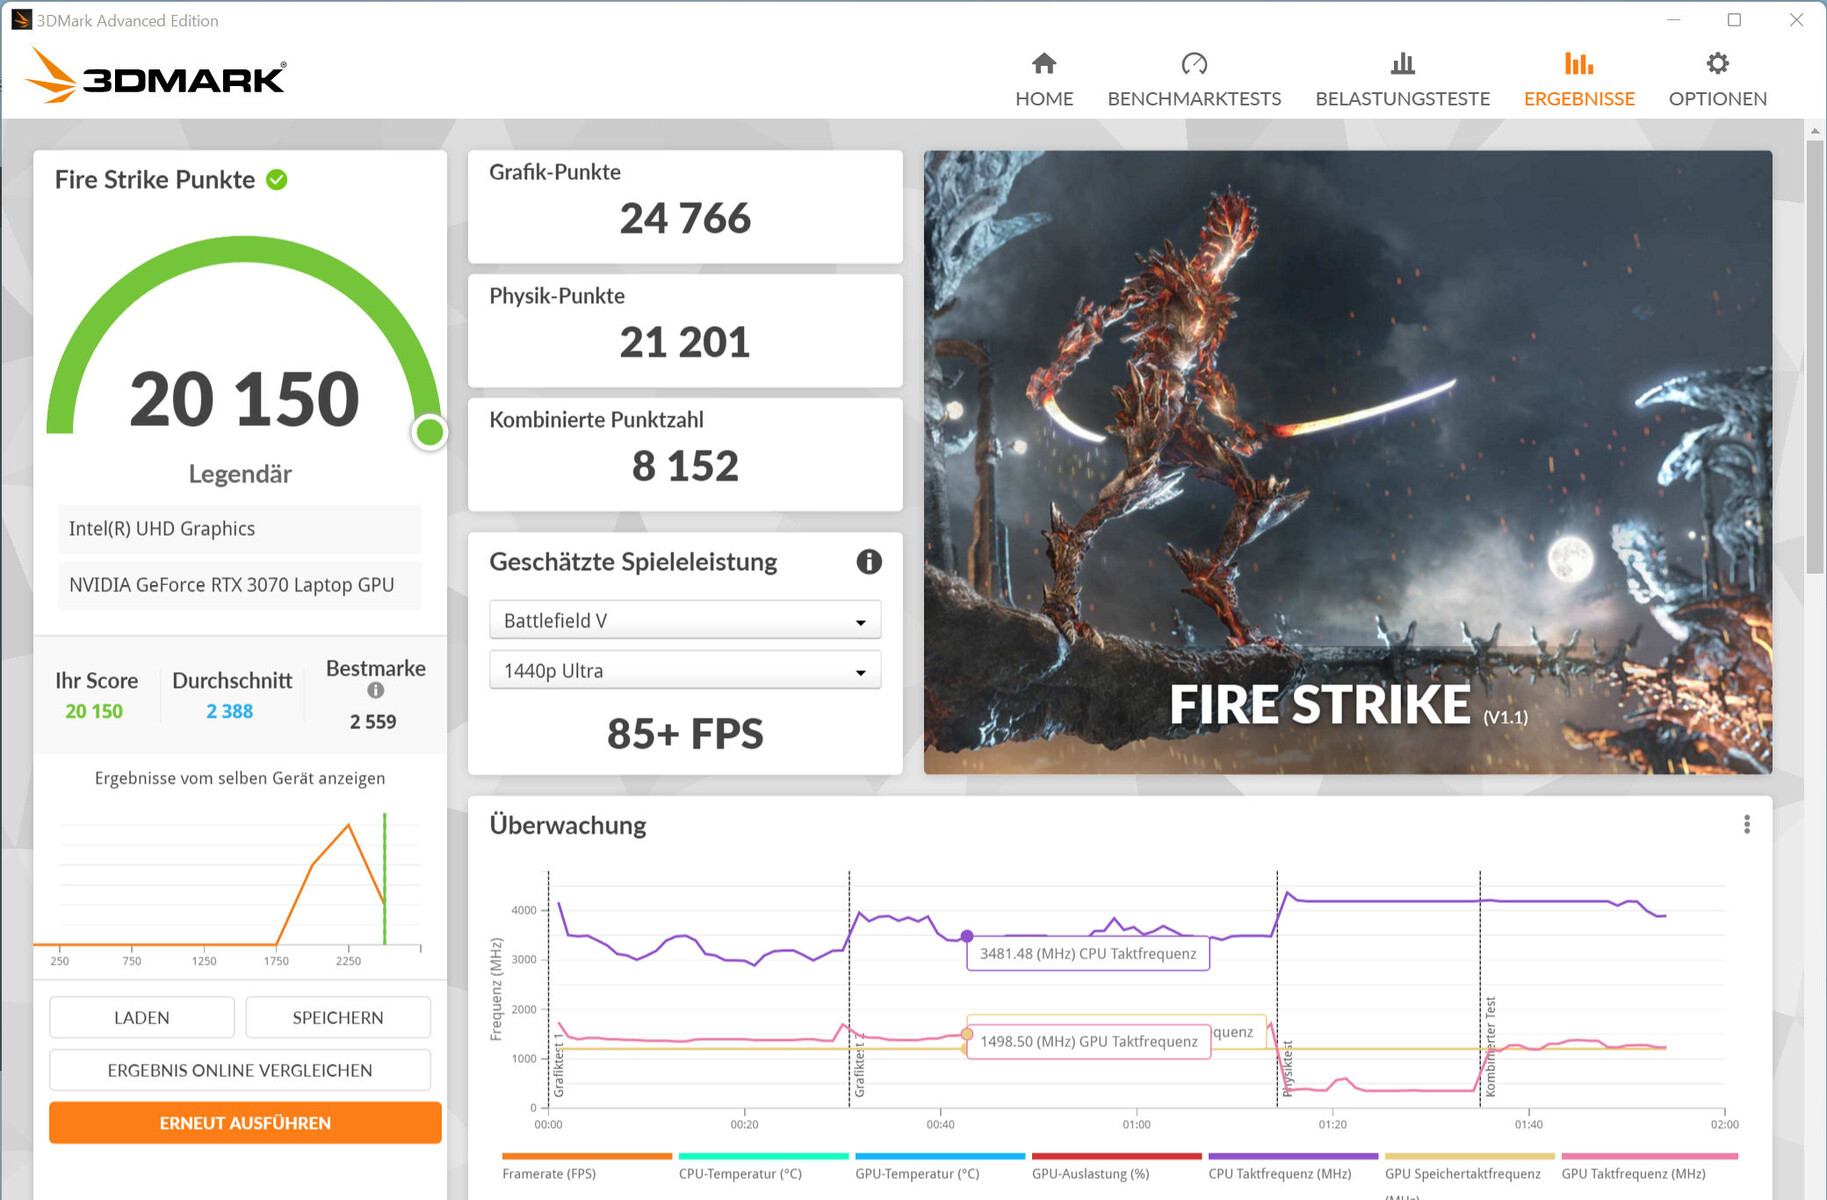
Graphics card
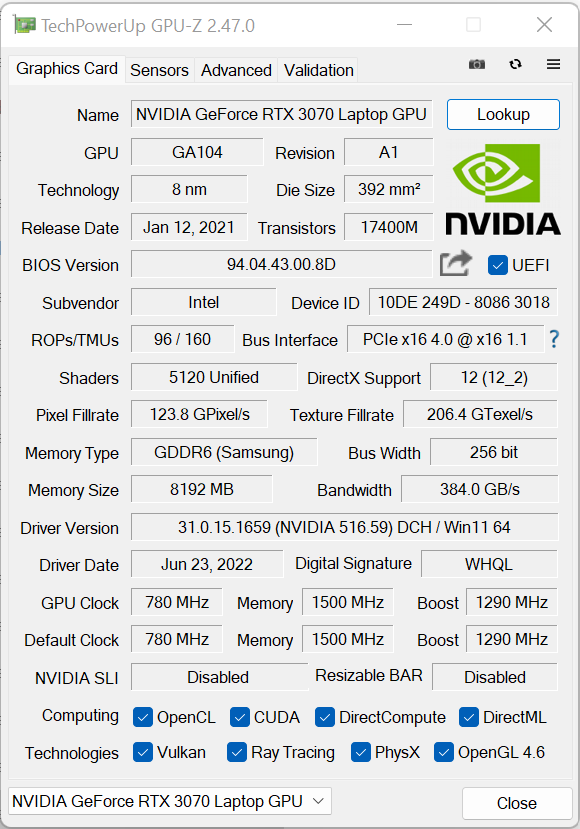
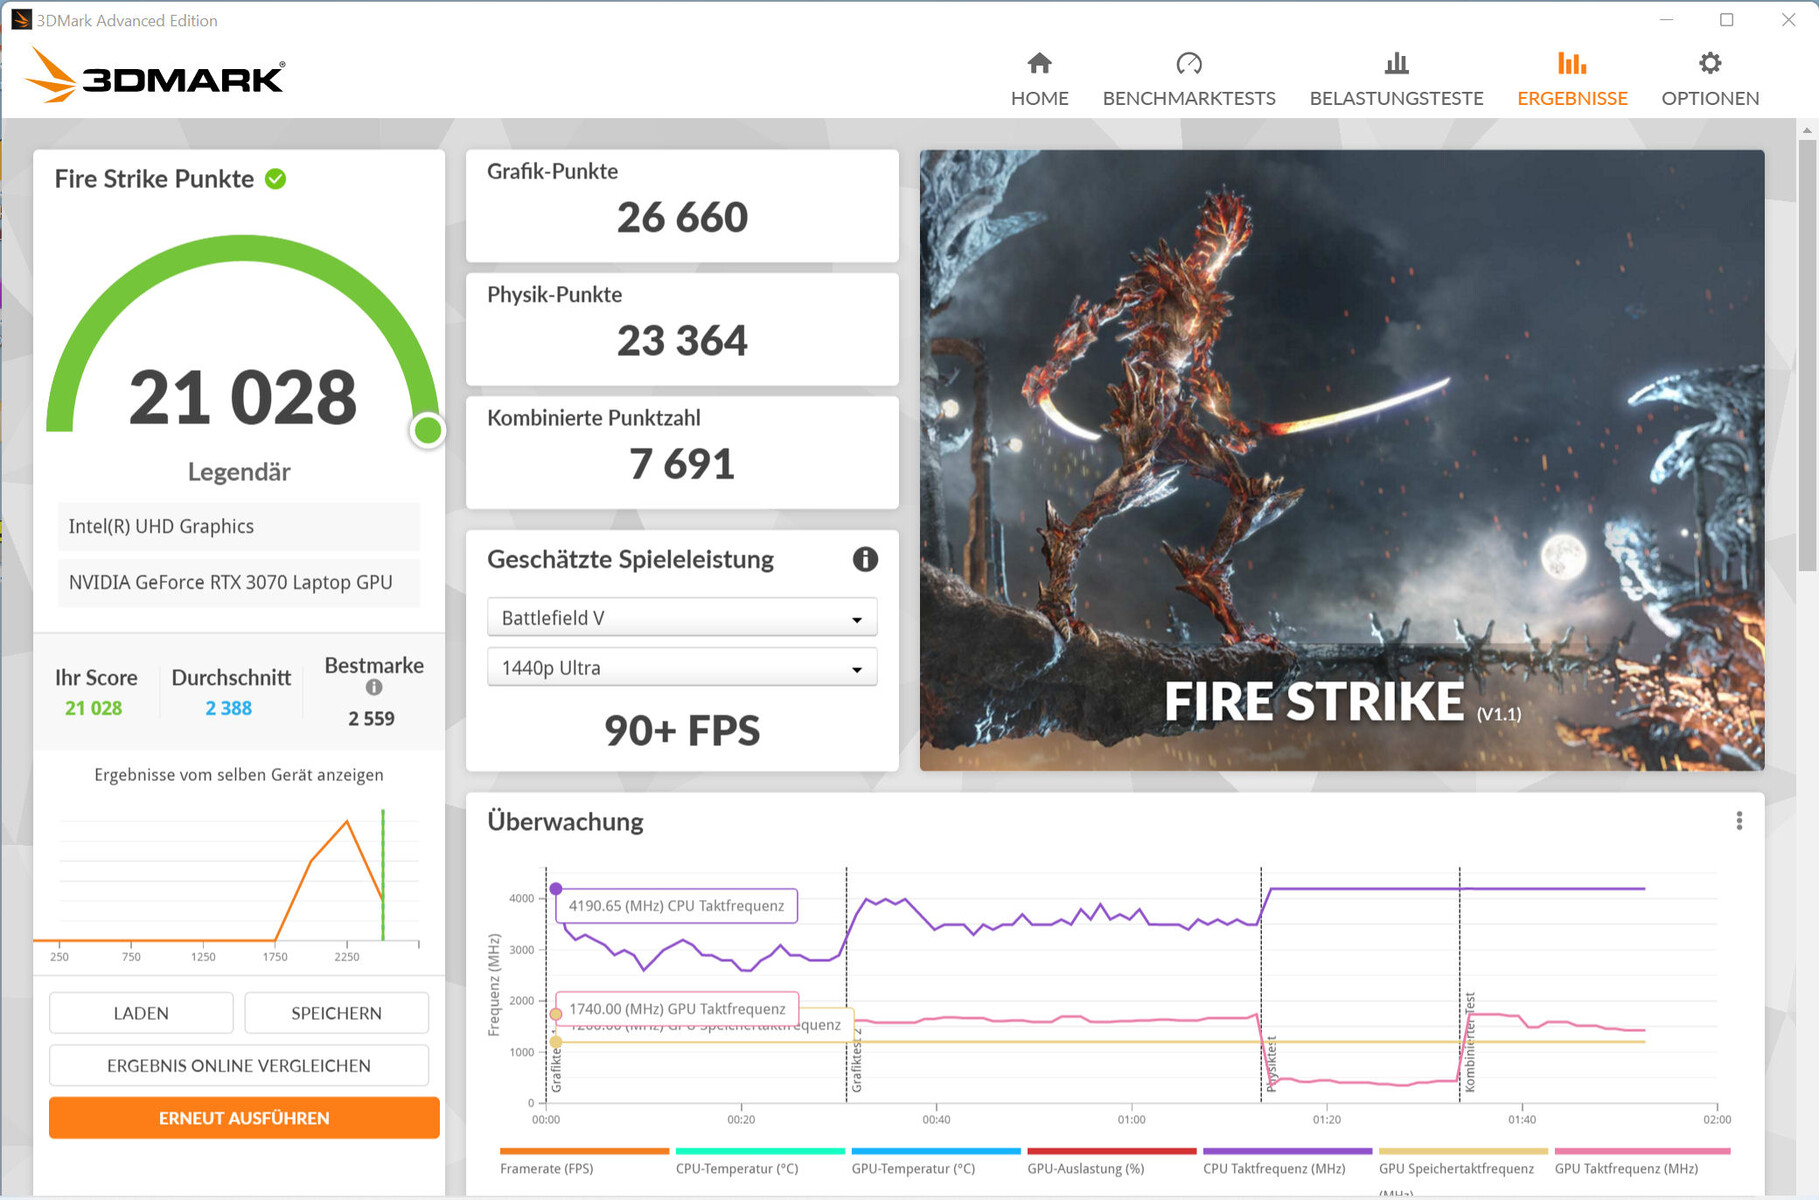
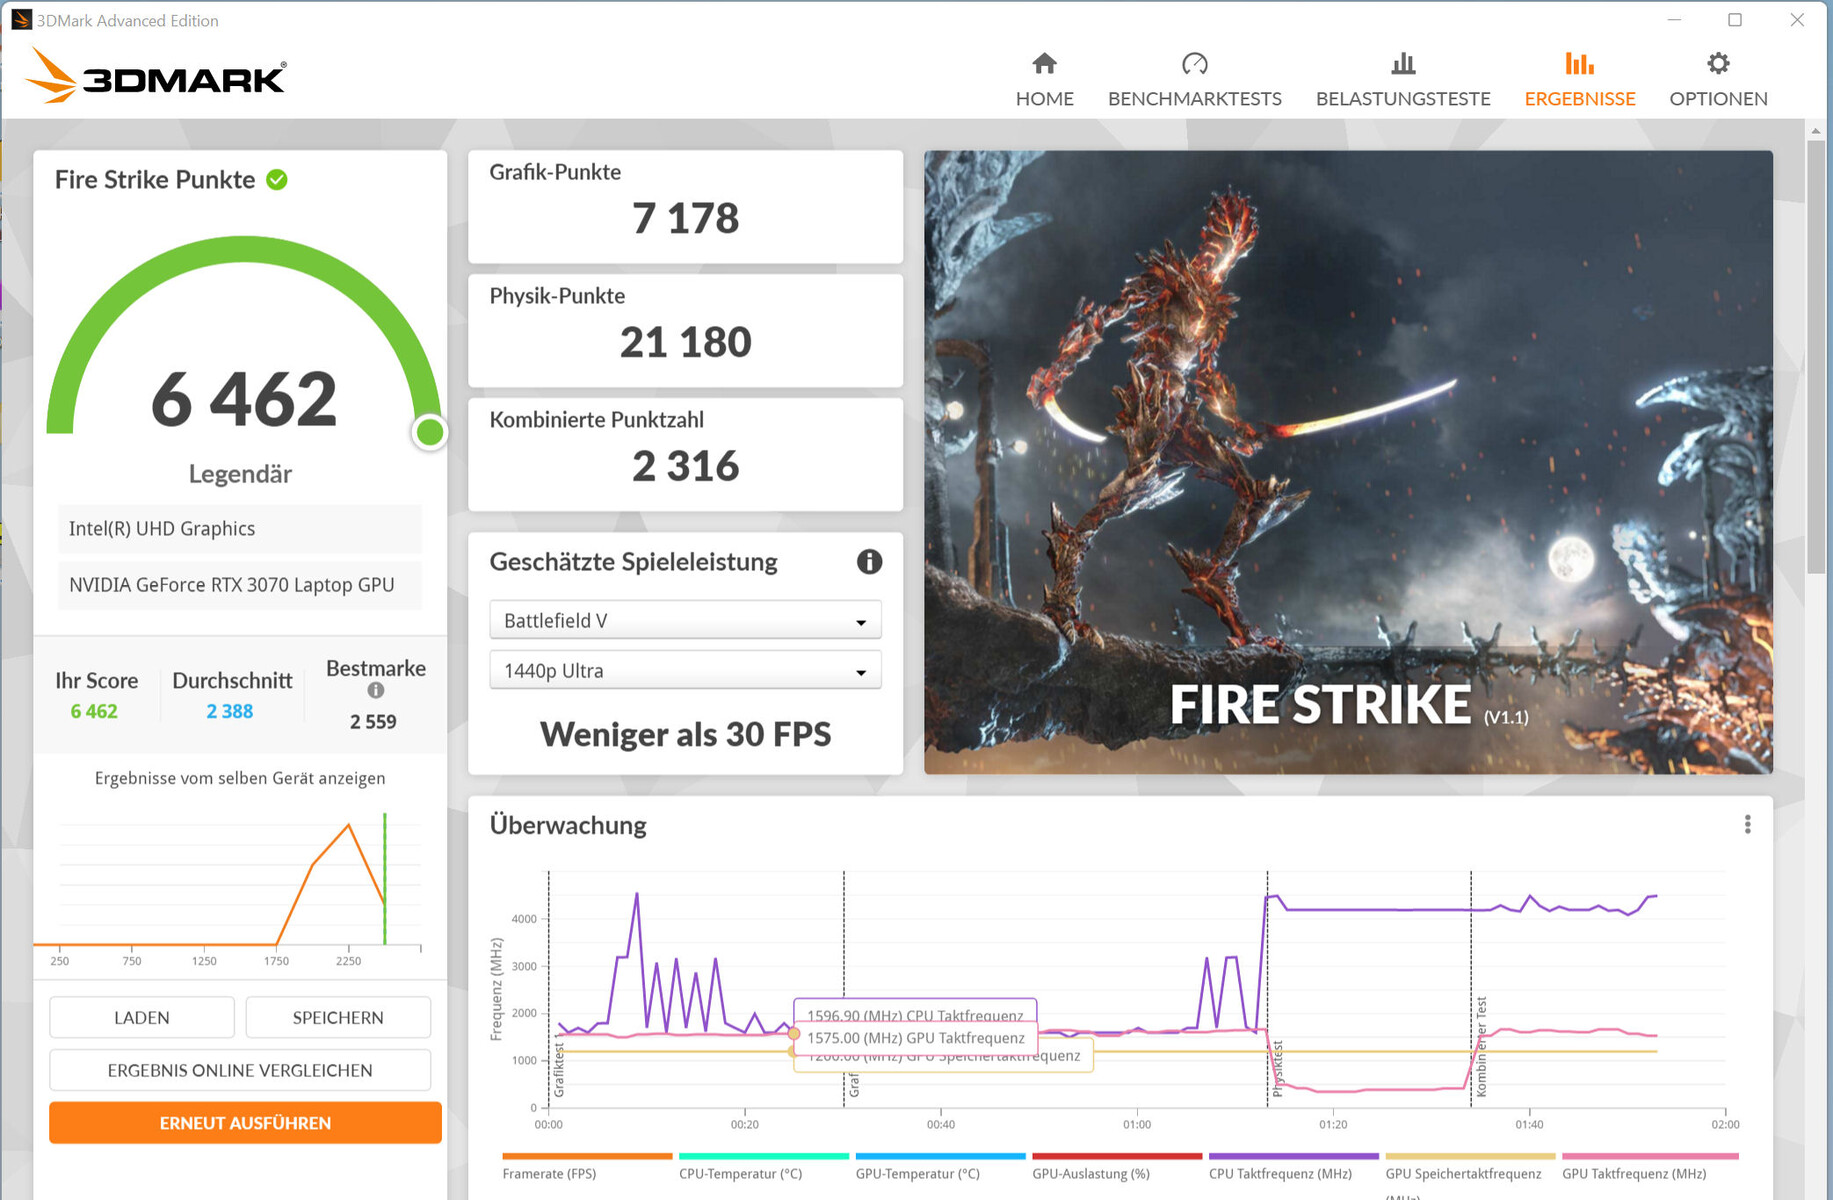
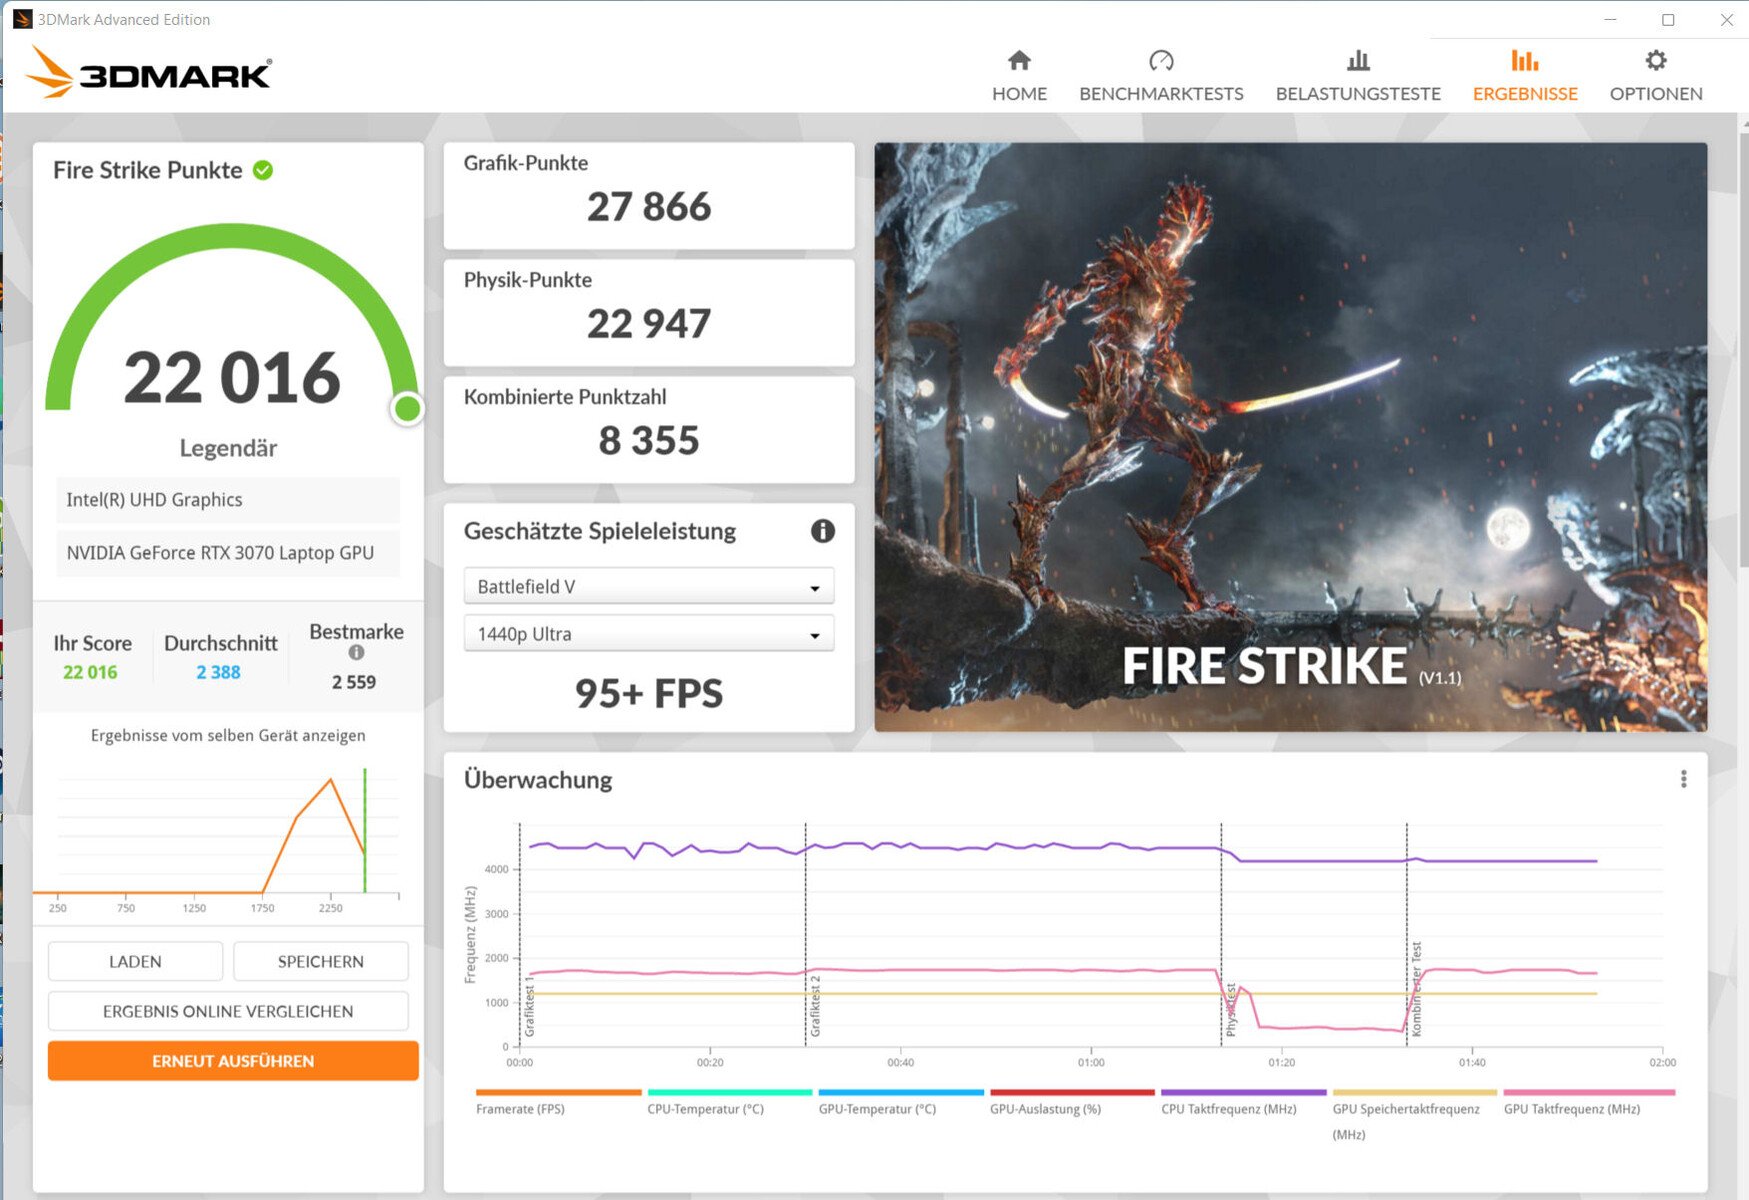
The actual performance of an RTX 3000 GPU depends on a few factors: Cooling, memory configuration and the maximum TGP that a laptop manufacturer selects within the limits defined by Nvidia. Schenker provides the built-in GeForce RTX 3070 Laptop GPU with a maximum TGP of 145 watts (125 watts + 20 watts Dynamic Boost). However, the Dynamic Boost is only used when the "Benchmark Mode" profile is active. The GPU can access fast GDDR6 graphics memory (8,192 MB).
The "Balanced" profile leads to benchmark results on par with the previously determined average for the RTX 3070. The "Benchmark Mode" profile allows the rates to increase. Even then, the maximum TGP (145 W) is not fully utilized - this is shown by our The Witcher 3 test. However, part of the Dynamic Boost is used.
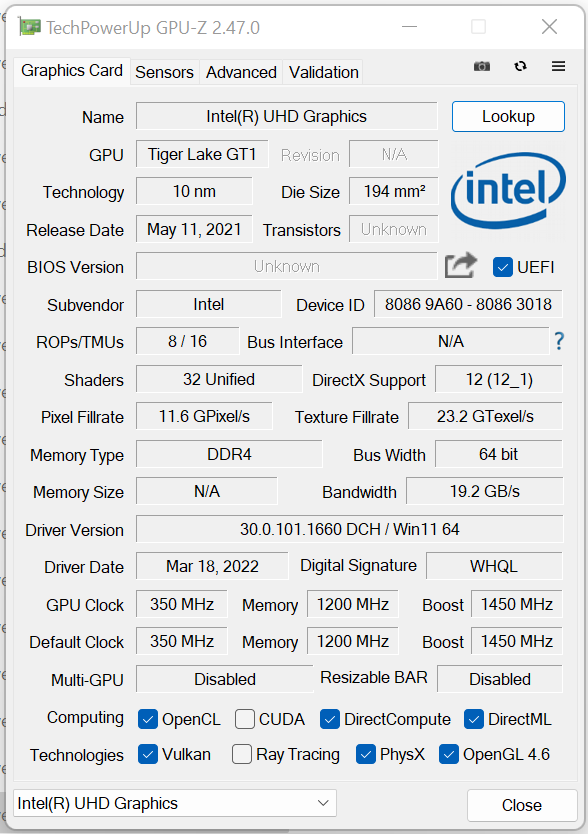
The UHD Graphics Xe 32EUs graphics core that is integrated into the processor is active, and the laptop works with Nvidia's Optimus graphics-switching solution. The Fusion doesn't offer the option of direct image output via the RTX 3070 GPU.

| 3DMark Performance Rating - Percent | |
| Average of class Gaming | |
| SCHENKER XMG Fusion 15 (Mid 22) | |
| Acer Nitro 5 AN515-58-72QR | |
| MSI Delta 15 A5EFK -1! | |
| SCHENKER XMG Fusion 15 (Mid 22) | |
| HP Omen 16-b1090ng | |
| Average NVIDIA GeForce RTX 3070 Laptop GPU | |
| SCHENKER XMG Fusion 15 (Mid 22) | |
| Asus TUF Dash F15 FX517ZR | |
| Razer Blade 15 Base Edition 2021, i7-10750H RTX 3060 | |
| SCHENKER XMG Fusion 15 (Mid 22) | |
| 3DMark 11 - 1280x720 Performance GPU | |
| Average of class Gaming (1029 - 72070, n=230, last 2 years) | |
| SCHENKER XMG Fusion 15 (Mid 22) (Benchmark-Modus) | |
| Acer Nitro 5 AN515-58-72QR | |
| SCHENKER XMG Fusion 15 (Mid 22) (Leistung) | |
| HP Omen 16-b1090ng | |
| MSI Delta 15 A5EFK | |
| Average NVIDIA GeForce RTX 3070 Laptop GPU (12535 - 38275, n=54) | |
| SCHENKER XMG Fusion 15 (Mid 22) | |
| Asus TUF Dash F15 FX517ZR | |
| Razer Blade 15 Base Edition 2021, i7-10750H RTX 3060 | |
| SCHENKER XMG Fusion 15 (Mid 22) (Stromsparmodus) | |
| Geekbench 5.5 - OpenCL Score | |
| Acer Nitro 5 AN515-58-72QR | |
| Average of class Gaming (5039 - 226512, n=230, last 2 years) | |
| SCHENKER XMG Apex 15 Max | |
| SCHENKER XMG Fusion 15 (Mid 22) (Benchmark-Modus) | |
| SCHENKER XMG Fusion 15 (Mid 22) (Leistung) | |
| SCHENKER XMG Fusion 15 (Mid 22) | |
| HP Omen 16-b1090ng | |
| Asus TUF Dash F15 FX517ZR | |
| Average NVIDIA GeForce RTX 3070 Laptop GPU (5732 - 125874, n=52) | |
| Razer Blade 15 Base Edition 2021, i7-10750H RTX 3060 | |
| MSI Delta 15 A5EFK | |
| SCHENKER XMG Fusion 15 (Mid 22) (Stromsparmodus) | |
| 3DMark 11 Performance | 26211 points | |
| 3DMark Cloud Gate Standard Score | 48271 points | |
| 3DMark Fire Strike Score | 20150 points | |
| 3DMark Time Spy Score | 9025 points | |
Help | ||
Gaming performance
The hardware allows QHD gaming at high to maximum settings. Higher resolutions can also be used when a corresponding display is connected - with reduced settings at times. The frame rates are on par with the RTX 3070 average. The "Benchmark Mode" profile leads to an increase in frame rates.
| The Witcher 3 - 1920x1080 Ultra Graphics & Postprocessing (HBAO+) | |
| Average of class Gaming (8.61 - 216, n=225, last 2 years) | |
| SCHENKER XMG Fusion 15 (Mid 22) (Benchmark-Modus) | |
| Acer Nitro 5 AN515-58-72QR | |
| HP Omen 16-b1090ng | |
| MSI Delta 15 A5EFK | |
| SCHENKER XMG Fusion 15 (Mid 22) | |
| Average NVIDIA GeForce RTX 3070 Laptop GPU (34.9 - 109, n=52) | |
| Asus TUF Dash F15 FX517ZR | |
| Razer Blade 15 Base Edition 2021, i7-10750H RTX 3060 | |
| Dota 2 Reborn - 1920x1080 ultra (3/3) best looking | |
| HP Omen 16-b1090ng | |
| Average of class Gaming (26.9 - 220, n=235, last 2 years) | |
| Acer Nitro 5 AN515-58-72QR | |
| SCHENKER XMG Fusion 15 (Mid 22) | |
| SCHENKER XMG Fusion 15 (Mid 22) (Benchmark-Modus) | |
| Razer Blade 15 Base Edition 2021, i7-10750H RTX 3060 | |
| Average NVIDIA GeForce RTX 3070 Laptop GPU (26.9 - 163.9, n=58) | |
| SCHENKER XMG Fusion 15 (Mid 22) (Leistung) | |
| MSI Delta 15 A5EFK | |
| Asus TUF Dash F15 FX517ZR | |
| SCHENKER XMG Fusion 15 (Mid 22) (Stromsparmodus) | |
| X-Plane 11.11 - 1920x1080 high (fps_test=3) | |
| HP Omen 16-b1090ng | |
| Average of class Gaming (12.4 - 166.2, n=240, last 2 years) | |
| Asus TUF Dash F15 FX517ZR | |
| Acer Nitro 5 AN515-58-72QR | |
| SCHENKER XMG Fusion 15 (Mid 22) | |
| Average NVIDIA GeForce RTX 3070 Laptop GPU (12.4 - 118.8, n=61) | |
| Razer Blade 15 Base Edition 2021, i7-10750H RTX 3060 | |
| SCHENKER XMG Fusion 15 (Mid 22) (Benchmark-Modus) | |
| SCHENKER XMG Fusion 15 (Mid 22) (Leistung) | |
| SCHENKER XMG Fusion 15 (Mid 22) (Stromsparmodus) | |
| Final Fantasy XV Benchmark | |
| 1920x1080 High Quality | |
| Average of class Gaming (9.13 - 194.9, n=225, last 2 years) | |
| SCHENKER XMG Fusion 15 (Mid 22) (1.3, Benchmark-Modus) | |
| HP Omen 16-b1090ng | |
| SCHENKER XMG Fusion 15 (Mid 22) (1.3, Leistung) | |
| SCHENKER XMG Fusion 15 (Mid 22) (1.3) | |
| Acer Nitro 5 AN515-58-72QR (1.3) | |
| Average NVIDIA GeForce RTX 3070 Laptop GPU (27.9 - 107, n=49) | |
| Asus TUF Dash F15 FX517ZR (1.3) | |
| MSI Delta 15 A5EFK | |
| Razer Blade 15 Base Edition 2021, i7-10750H RTX 3060 (1.3) | |
| SCHENKER XMG Fusion 15 (Mid 22) (1.3, Stromsparmodus) | |
| 2560x1440 High Quality | |
| Average of class Gaming (19.8 - 162.9, n=160, last 2 years) | |
| SCHENKER XMG Fusion 15 (Mid 22) (1.3, Benchmark-Modus) | |
| SCHENKER XMG Fusion 15 (Mid 22) (1.3, Leistung) | |
| SCHENKER XMG Fusion 15 (Mid 22) (1.3) | |
| Acer Nitro 5 AN515-58-72QR (1.3) | |
| Average NVIDIA GeForce RTX 3070 Laptop GPU (19.8 - 79.9, n=25) | |
| Asus TUF Dash F15 FX517ZR (1.3) | |
| SCHENKER XMG Fusion 15 (Mid 22) (1.3, Stromsparmodus) | |
| GTA V | |
| 2560x1440 Highest Settings possible AA:4xMSAA + FX AF:16x | |
| Average of class Gaming (5.61 - 160.6, n=136, last 2 years) | |
| SCHENKER XMG Fusion 15 (Mid 22) (Benchmark-Modus) | |
| SCHENKER XMG Fusion 15 (Mid 22) (Leistung) | |
| SCHENKER XMG Fusion 15 (Mid 22) | |
| Average NVIDIA GeForce RTX 3070 Laptop GPU (70.8 - 97.1, n=19) | |
| Acer Nitro 5 AN515-58-72QR | |
| Asus TUF Dash F15 FX517ZR | |
| 1920x1080 Highest Settings possible AA:4xMSAA + FX AF:16x | |
| HP Omen 16-b1090ng | |
| Average of class Gaming (6.38 - 167.7, n=215, last 2 years) | |
| SCHENKER XMG Fusion 15 (Mid 22) (Benchmark-Modus) | |
| Asus TUF Dash F15 FX517ZR | |
| SCHENKER XMG Fusion 15 (Mid 22) (Leistung) | |
| SCHENKER XMG Fusion 15 (Mid 22) | |
| Acer Nitro 5 AN515-58-72QR | |
| Average NVIDIA GeForce RTX 3070 Laptop GPU (21.7 - 125.8, n=50) | |
| MSI Delta 15 A5EFK | |
| Razer Blade 15 Base Edition 2021, i7-10750H RTX 3060 | |
| SCHENKER XMG Fusion 15 (Mid 22) (Stromsparmodus) | |
| Strange Brigade | |
| 2560x1440 ultra AA:ultra AF:16 | |
| Average of class Gaming (79.8 - 322, n=136, last 2 years) | |
| Acer Nitro 5 AN515-58-72QR (1.47.22.14 D3D12) | |
| SCHENKER XMG Fusion 15 (Mid 22) (1.47.22.14 D3D12, Benchmark-Modus) | |
| SCHENKER XMG Fusion 15 (Mid 22) (1.47.22.14 D3D12) | |
| Average NVIDIA GeForce RTX 3070 Laptop GPU (82.3 - 140.5, n=18) | |
| Asus TUF Dash F15 FX517ZR (1.47.22.14 D3D12) | |
| 1920x1080 ultra AA:ultra AF:16 | |
| Average of class Gaming (14.6 - 421, n=223, last 2 years) | |
| SCHENKER XMG Fusion 15 (Mid 22) (1.47.22.14 D3D12, Benchmark-Modus) | |
| Acer Nitro 5 AN515-58-72QR (1.47.22.14 D3D12) | |
| SCHENKER XMG Fusion 15 (Mid 22) (1.47.22.14 D3D12, Leistung) | |
| MSI Delta 15 A5EFK (1.47.22.14 D3D12) | |
| SCHENKER XMG Fusion 15 (Mid 22) (1.47.22.14 D3D12) | |
| Average NVIDIA GeForce RTX 3070 Laptop GPU (36.2 - 194, n=46) | |
| Asus TUF Dash F15 FX517ZR (1.47.22.14 D3D12) | |
| HP Omen 16-b1090ng (1.47.22.14 D3D12) | |
| Razer Blade 15 Base Edition 2021, i7-10750H RTX 3060 (1.47.22.14 D3D12) | |
| SCHENKER XMG Fusion 15 (Mid 22) (1.47.22.14 D3D12, Stromsparmodus) | |
| F1 2021 | |
| 2560x1440 Ultra High Preset + Raytracing AA:T AF:16x | |
| Average of class Gaming (47.5 - 204, n=39, last 2 years) | |
| SCHENKER XMG Fusion 15 (Mid 22) (874931, Benchmark-Modus) | |
| SCHENKER XMG Fusion 15 (Mid 22) (874931, Leistung) | |
| Average NVIDIA GeForce RTX 3070 Laptop GPU (67.1 - 90.2, n=11) | |
| Acer Nitro 5 AN515-58-72QR (874931) | |
| SCHENKER XMG Fusion 15 (Mid 22) (874931) | |
| Asus TUF Dash F15 FX517ZR (874931) | |
| 1920x1080 Ultra High Preset + Raytracing AA:T AF:16x | |
| SCHENKER XMG Fusion 15 (Mid 22) (874931, Benchmark-Modus) | |
| Average of class Gaming (13.5 - 271, n=63, last 2 years) | |
| SCHENKER XMG Fusion 15 (Mid 22) (874931, Leistung) | |
| Acer Nitro 5 AN515-58-72QR (874931) | |
| SCHENKER XMG Fusion 15 (Mid 22) (874931) | |
| MSI Delta 15 A5EFK | |
| Average NVIDIA GeForce RTX 3070 Laptop GPU (33.1 - 123.1, n=23) | |
| Asus TUF Dash F15 FX517ZR (874931) | |
| SCHENKER XMG Fusion 15 (Mid 22) (874931, Stromsparmodus) | |
| Far Cry 5 | |
| 2560x1440 Ultra Preset AA:T | |
| Average of class Gaming (14 - 194, n=92, last 2 years) | |
| SCHENKER XMG Fusion 15 (Mid 22) (Benchmark-Modus) | |
| Average NVIDIA GeForce RTX 3070 Laptop GPU (81 - 101, n=18) | |
| SCHENKER XMG Fusion 15 (Mid 22) | |
| Asus TUF Dash F15 FX517ZR | |
| Acer Nitro 5 AN515-58-72QR | |
| 1920x1080 Ultra Preset AA:T | |
| Average of class Gaming (14 - 218, n=124, last 2 years) | |
| SCHENKER XMG Fusion 15 (Mid 22) (Benchmark-Modus) | |
| SCHENKER XMG Fusion 15 (Mid 22) | |
| Average NVIDIA GeForce RTX 3070 Laptop GPU (89 - 140, n=36) | |
| Asus TUF Dash F15 FX517ZR | |
| MSI Delta 15 A5EFK | |
| Acer Nitro 5 AN515-58-72QR | |
In order to verify whether the frame rates remain largely constant over a prolonged period of time, we let the game The Witcher 3 run for about 60 minutes at Full HD resolution and maximum quality settings. The character is not moved. A drop in frame rates wasn't found.
The Witcher 3 FPS diagram
| low | med. | high | ultra | QHD | |
| GTA V (2015) | 183.5 | 177 | 168.5 | 100 | 83.4 |
| The Witcher 3 (2015) | 348 | 260 | 163.4 | 91.8 | |
| Dota 2 Reborn (2015) | 155.7 | 139.4 | 132.8 | 125.3 | |
| Final Fantasy XV Benchmark (2018) | 171.3 | 121.6 | 93.8 | 72.1 | |
| X-Plane 11.11 (2018) | 121.2 | 111 | 86.8 | ||
| Far Cry 5 (2018) | 152 | 122 | 115 | 109 | 89 |
| Strange Brigade (2018) | 389 | 232 | 188.8 | 165.6 | 124.1 |
| F1 2021 (2021) | 267 | 194.2 | 170.1 | 105 | 79.8 |
Emissions - The Schenker laptop generates plenty of heat
Noise emissions
The two fans produce quite little noise in everyday use (office, Internet). They even stand still occasionally. Things get loud under full load with maximum sound pressure levels of 48 dB(A) (stress test) and 46 dB(A) (our The Witcher 3 test), respectively, but this isn't excessively loud. Most competitors produce more noise, with only the Asus TUF Dash F15 being about on par.
Noise development under load can be reduced in two ways: By using the "Power-saving Mode" profile or by activating the GeForce GPU's "WhisperMode 2.0". The latter can be turned on in the Control Center (in the "Performance Optimization" section). It incorporates the "Power-saving Mode" profile. WhisperMode should achieve the lowest possible noise level by using frame rate levels that are sufficient for a computer game (at least 30 to 60 fps). The GPU doesn't need to work at full power; it produces less heat and the fans can slow down.
A word about the "Benchmark Mode" profile: The fans run continuously at full speed and are - unsurprisingly - clearly audible. All of this is reflected in a constant hissing. Our review sample's fans don't emit any unpleasant background noise.
Noise Level
| Idle |
| 26 / 28 / 31 dB(A) |
| Load |
| 45 / 48 dB(A) |
 | ||
30 dB silent 40 dB(A) audible 50 dB(A) loud |
||
min: | ||
| SCHENKER XMG Fusion 15 (Mid 22) i7-11800H, GeForce RTX 3070 Laptop GPU | Asus TUF Dash F15 FX517ZR i7-12650H, GeForce RTX 3070 Laptop GPU | Acer Nitro 5 AN515-58-72QR i7-12700H, GeForce RTX 3070 Ti Laptop GPU | HP Omen 16-b1090ng i7-12700H, GeForce RTX 3070 Ti Laptop GPU | MSI Delta 15 A5EFK R9 5900HX, Radeon RX 6700M | Razer Blade 15 Base Edition 2021, i7-10750H RTX 3060 i7-10750H, GeForce RTX 3060 Laptop GPU | |
|---|---|---|---|---|---|---|
| Noise | -4% | -6% | -11% | -6% | 5% | |
| off / environment * | 26 | 26 -0% | 26 -0% | 26 -0% | 25 4% | 25.3 3% |
| Idle Minimum * | 26 | 26 -0% | 26 -0% | 30 -15% | 25 4% | 25.4 2% |
| Idle Average * | 28 | 32 -14% | 29 -4% | 31 -11% | 30 -7% | 25.4 9% |
| Idle Maximum * | 31 | 33 -6% | 33 -6% | 33 -6% | 40 -29% | 25.4 18% |
| Load Average * | 45 | 48 -7% | 47 -4% | 49 -9% | 47 -4% | 42.5 6% |
| Witcher 3 ultra * | 46 | 47 -2% | 53 -15% | 53 -15% | 48 -4% | 42 9% |
| Load Maximum * | 48 | 49 -2% | 53 -10% | 57 -19% | 51 -6% | 52.2 -9% |
* ... smaller is better
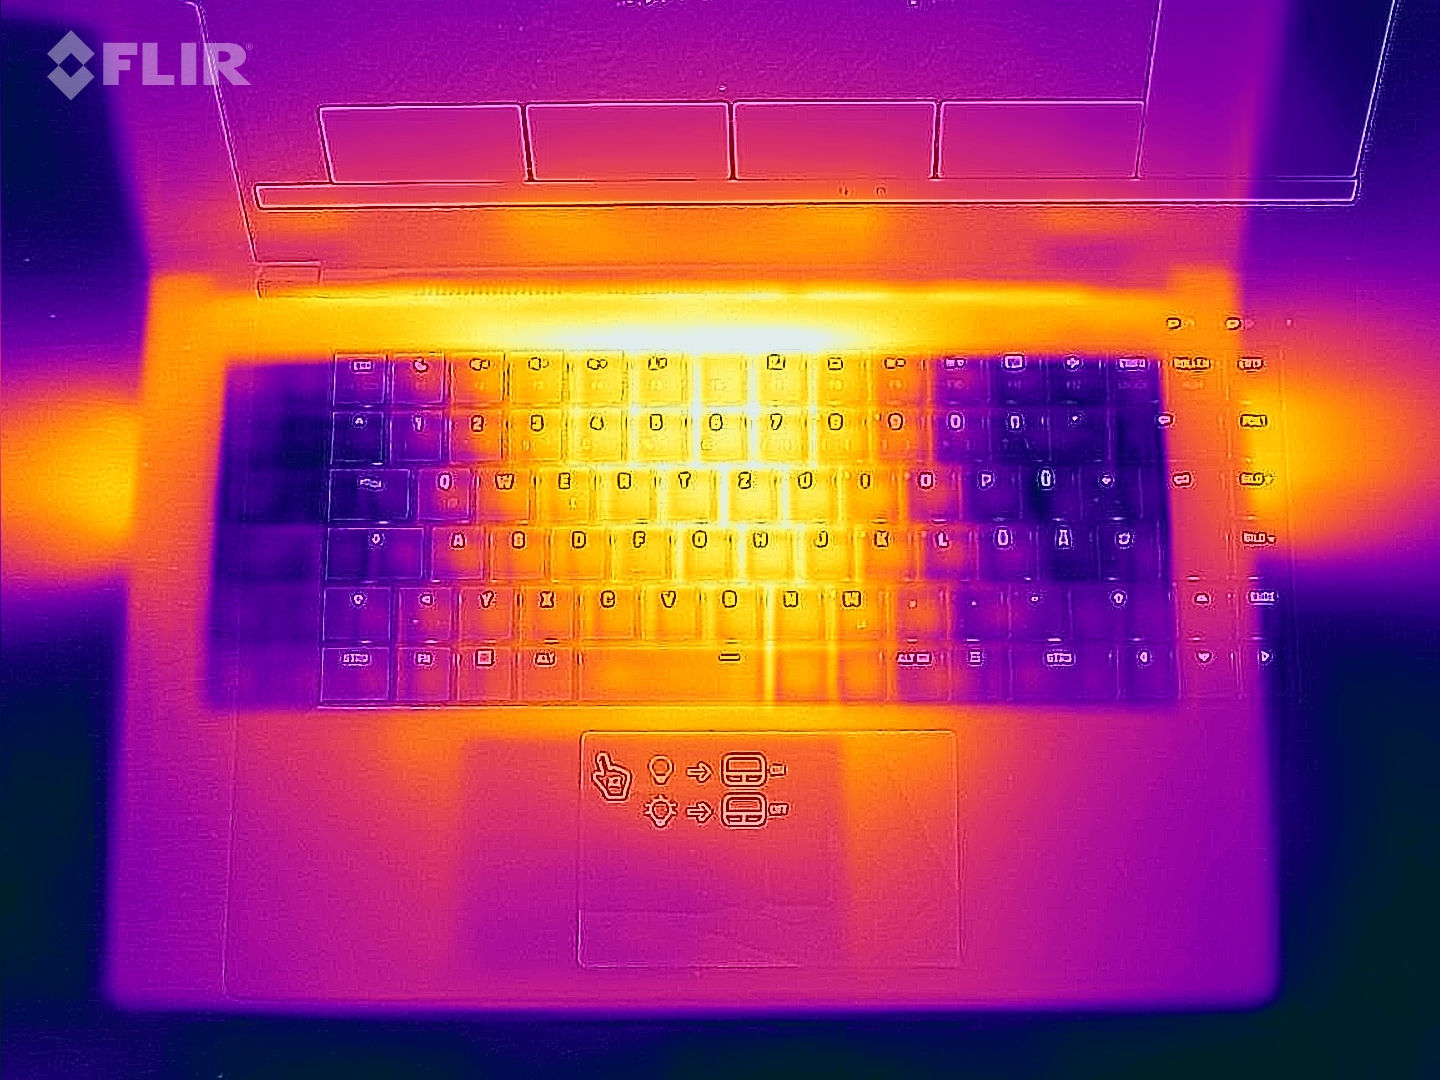
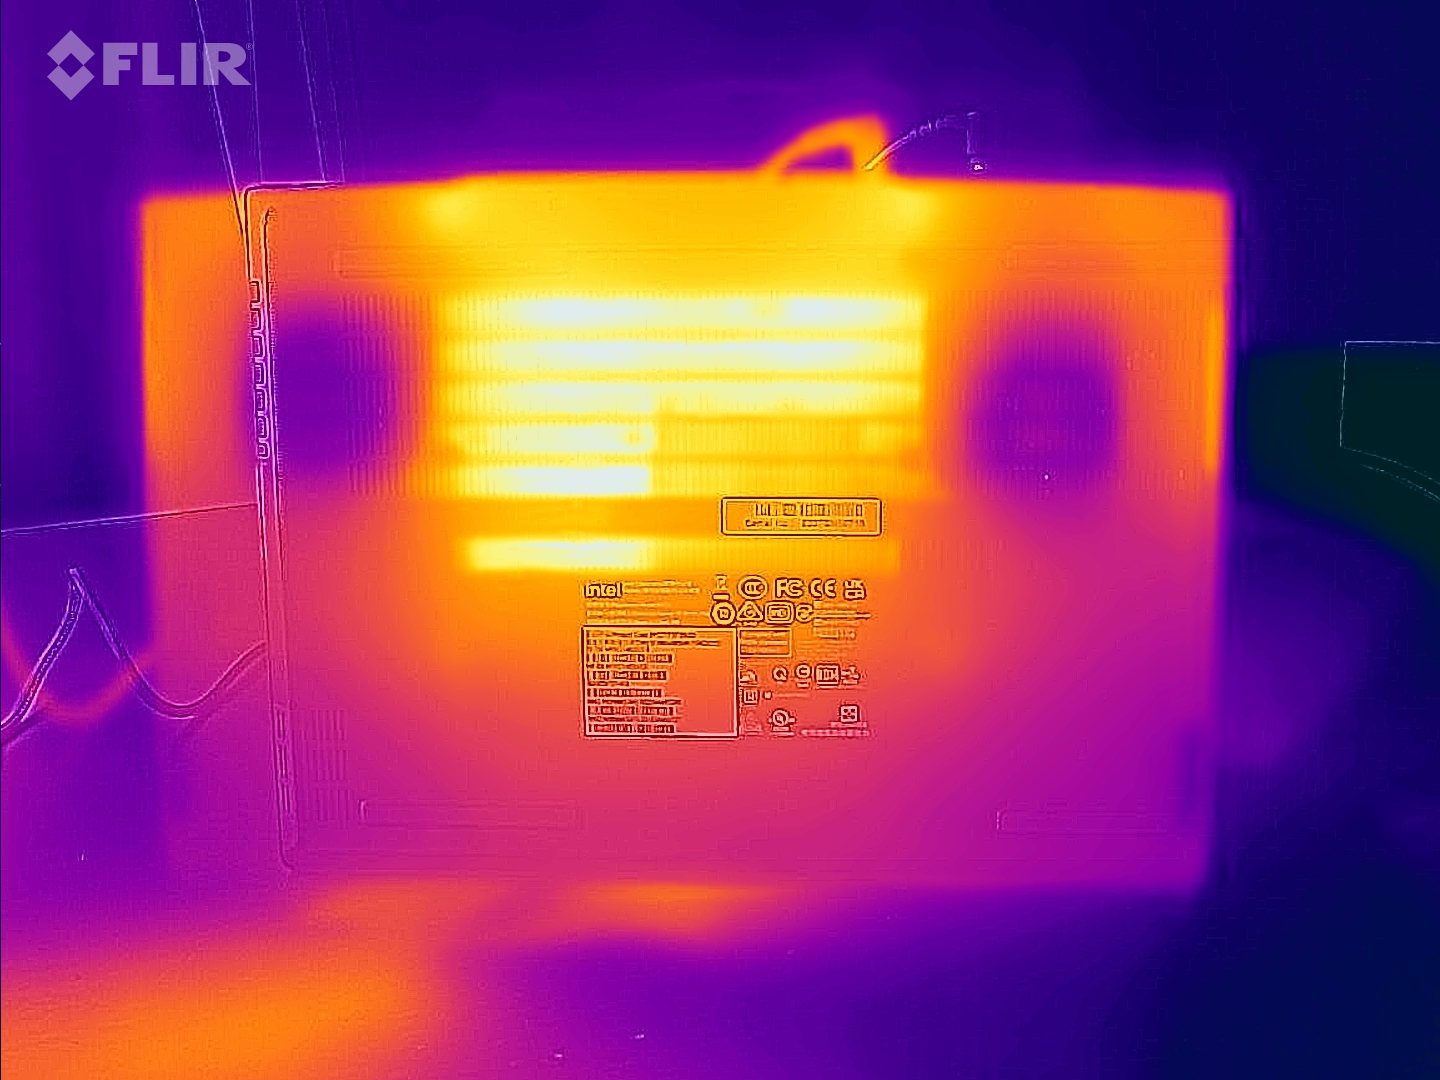
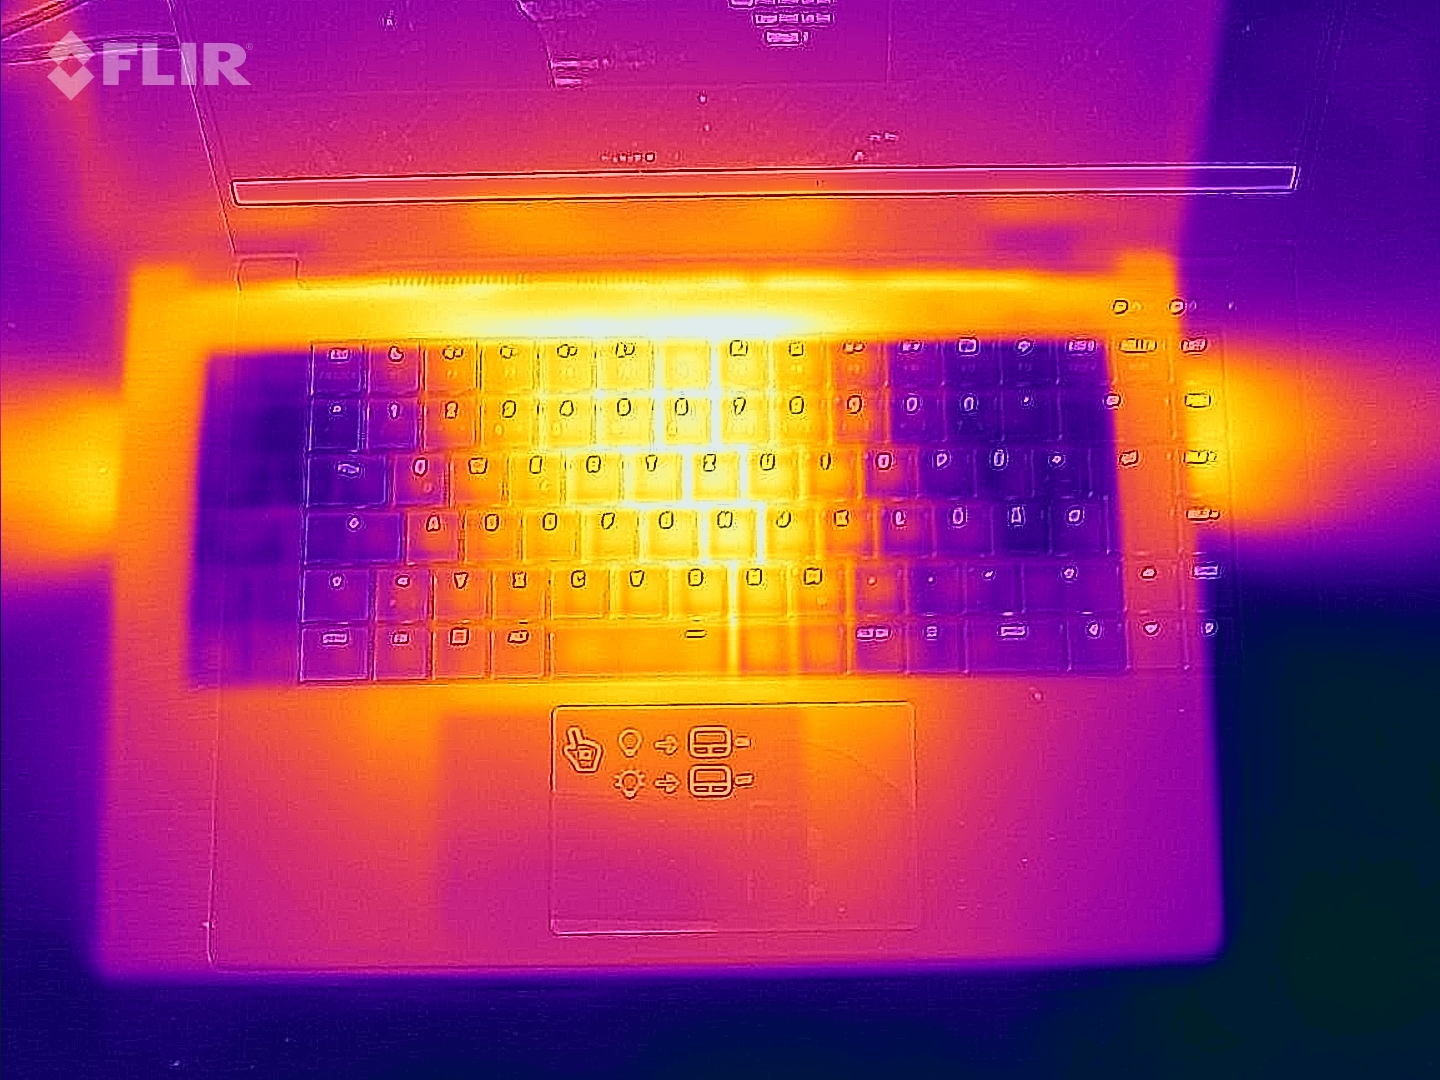
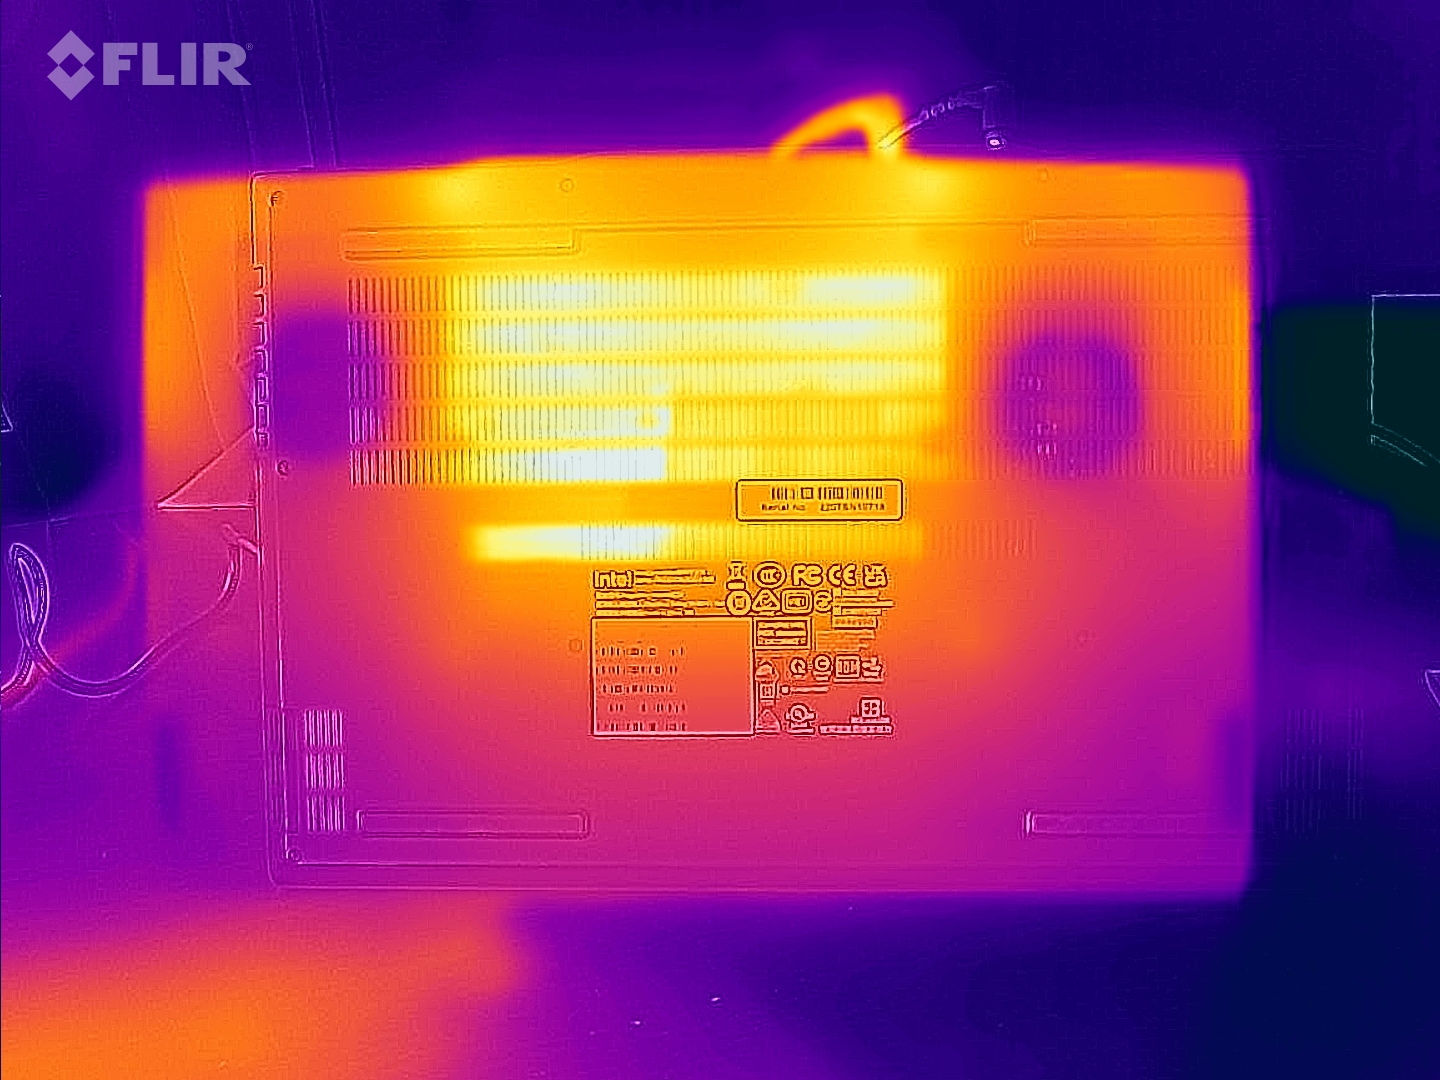
Temperature
In everyday use (office, Internet), the case temperatures remain within an acceptable range. However, the laptop heats up significantly under load (stress stress test, our The Witcher 3 test). Temperatures just above 60 °C (~140 °F) can be registered at several measuring points. The CPU temperatures are no cause for concern.
(-) The maximum temperature on the upper side is 52 °C / 126 F, compared to the average of 40.4 °C / 105 F, ranging from 21.2 to 68.8 °C for the class Gaming.
(-) The bottom heats up to a maximum of 63 °C / 145 F, compared to the average of 43.2 °C / 110 F
(±) In idle usage, the average temperature for the upper side is 35.6 °C / 96 F, compared to the device average of 33.8 °C / 93 F.
(-) Playing The Witcher 3, the average temperature for the upper side is 48.8 °C / 120 F, compared to the device average of 33.8 °C / 93 F.
(-) The palmrests and touchpad can get very hot to the touch with a maximum of 46 °C / 114.8 F.
(-) The average temperature of the palmrest area of similar devices was 28.9 °C / 84 F (-17.1 °C / -30.8 F).
| SCHENKER XMG Fusion 15 (Mid 22) Intel Core i7-11800H, NVIDIA GeForce RTX 3070 Laptop GPU | Asus TUF Dash F15 FX517ZR Intel Core i7-12650H, NVIDIA GeForce RTX 3070 Laptop GPU | Acer Nitro 5 AN515-58-72QR Intel Core i7-12700H, NVIDIA GeForce RTX 3070 Ti Laptop GPU | HP Omen 16-b1090ng Intel Core i7-12700H, NVIDIA GeForce RTX 3070 Ti Laptop GPU | MSI Delta 15 A5EFK AMD Ryzen 9 5900HX, AMD Radeon RX 6700M | Razer Blade 15 Base Edition 2021, i7-10750H RTX 3060 Intel Core i7-10750H, NVIDIA GeForce RTX 3060 Laptop GPU | |
|---|---|---|---|---|---|---|
| Heat | 8% | 12% | 22% | 14% | 12% | |
| Maximum Upper Side * | 52 | 52 -0% | 48 8% | 41 21% | 50 4% | 45.2 13% |
| Maximum Bottom * | 63 | 52 17% | 51 19% | 62 2% | 55 13% | 48 24% |
| Idle Upper Side * | 37 | 33 11% | 34 8% | 25 32% | 31 16% | 34.4 7% |
| Idle Bottom * | 38 | 36 5% | 33 13% | 26 32% | 30 21% | 37.2 2% |
* ... smaller is better
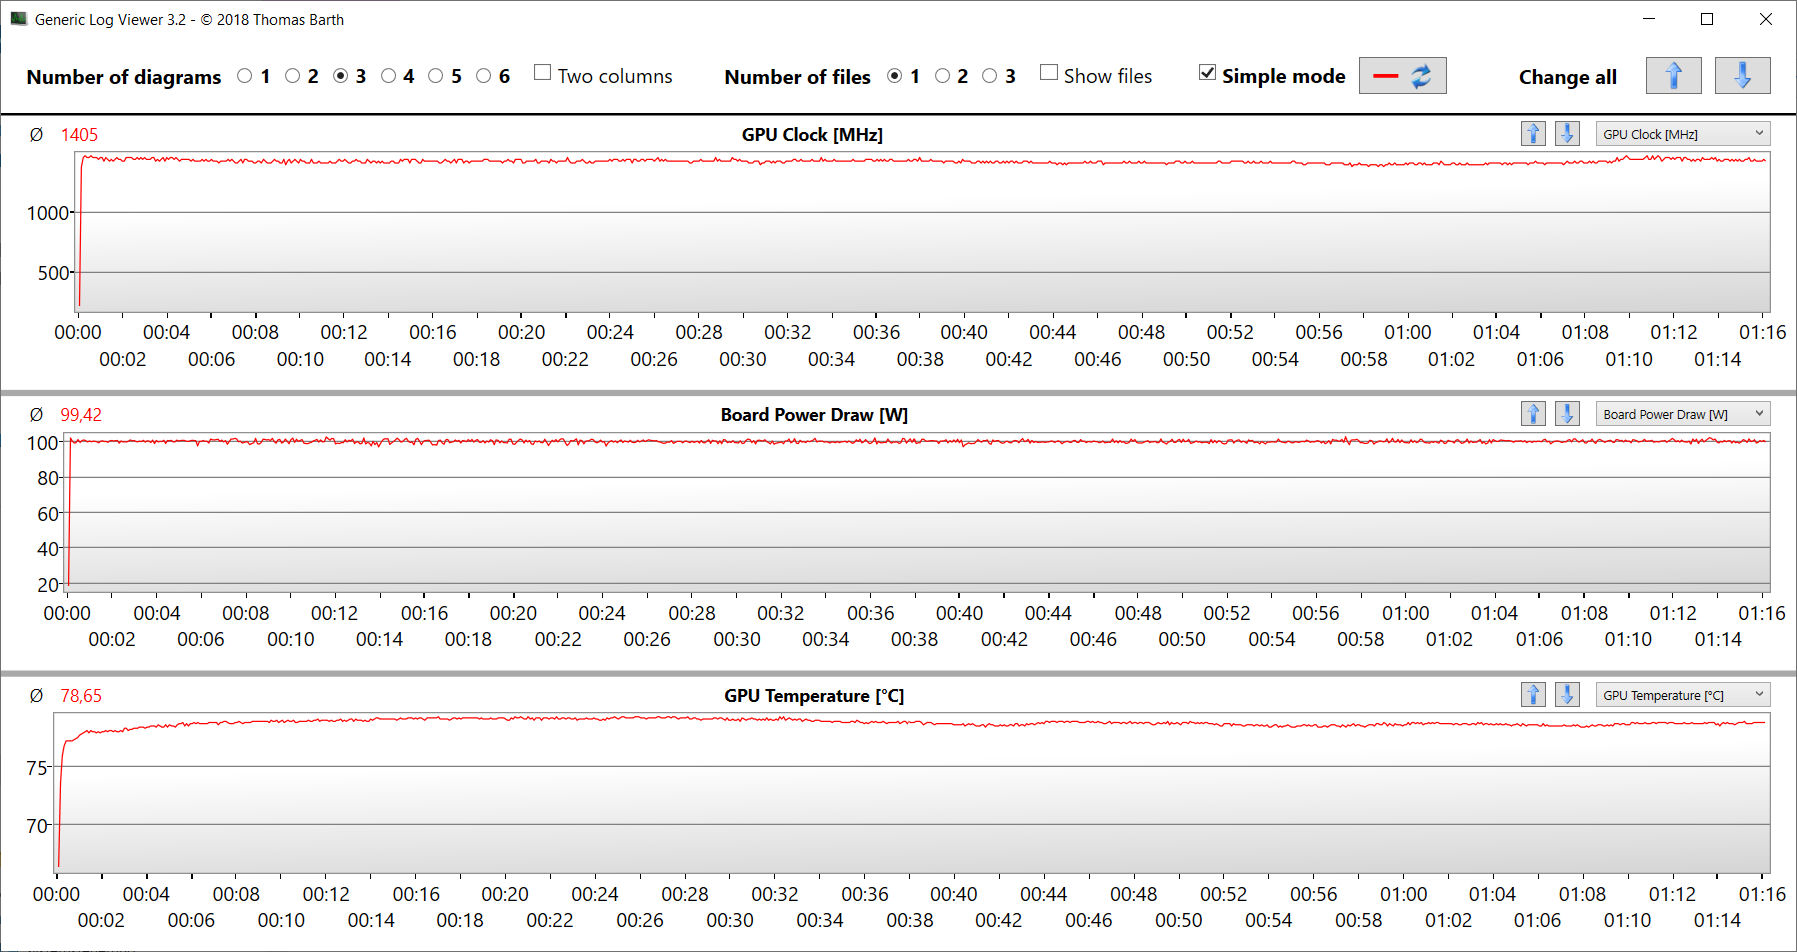
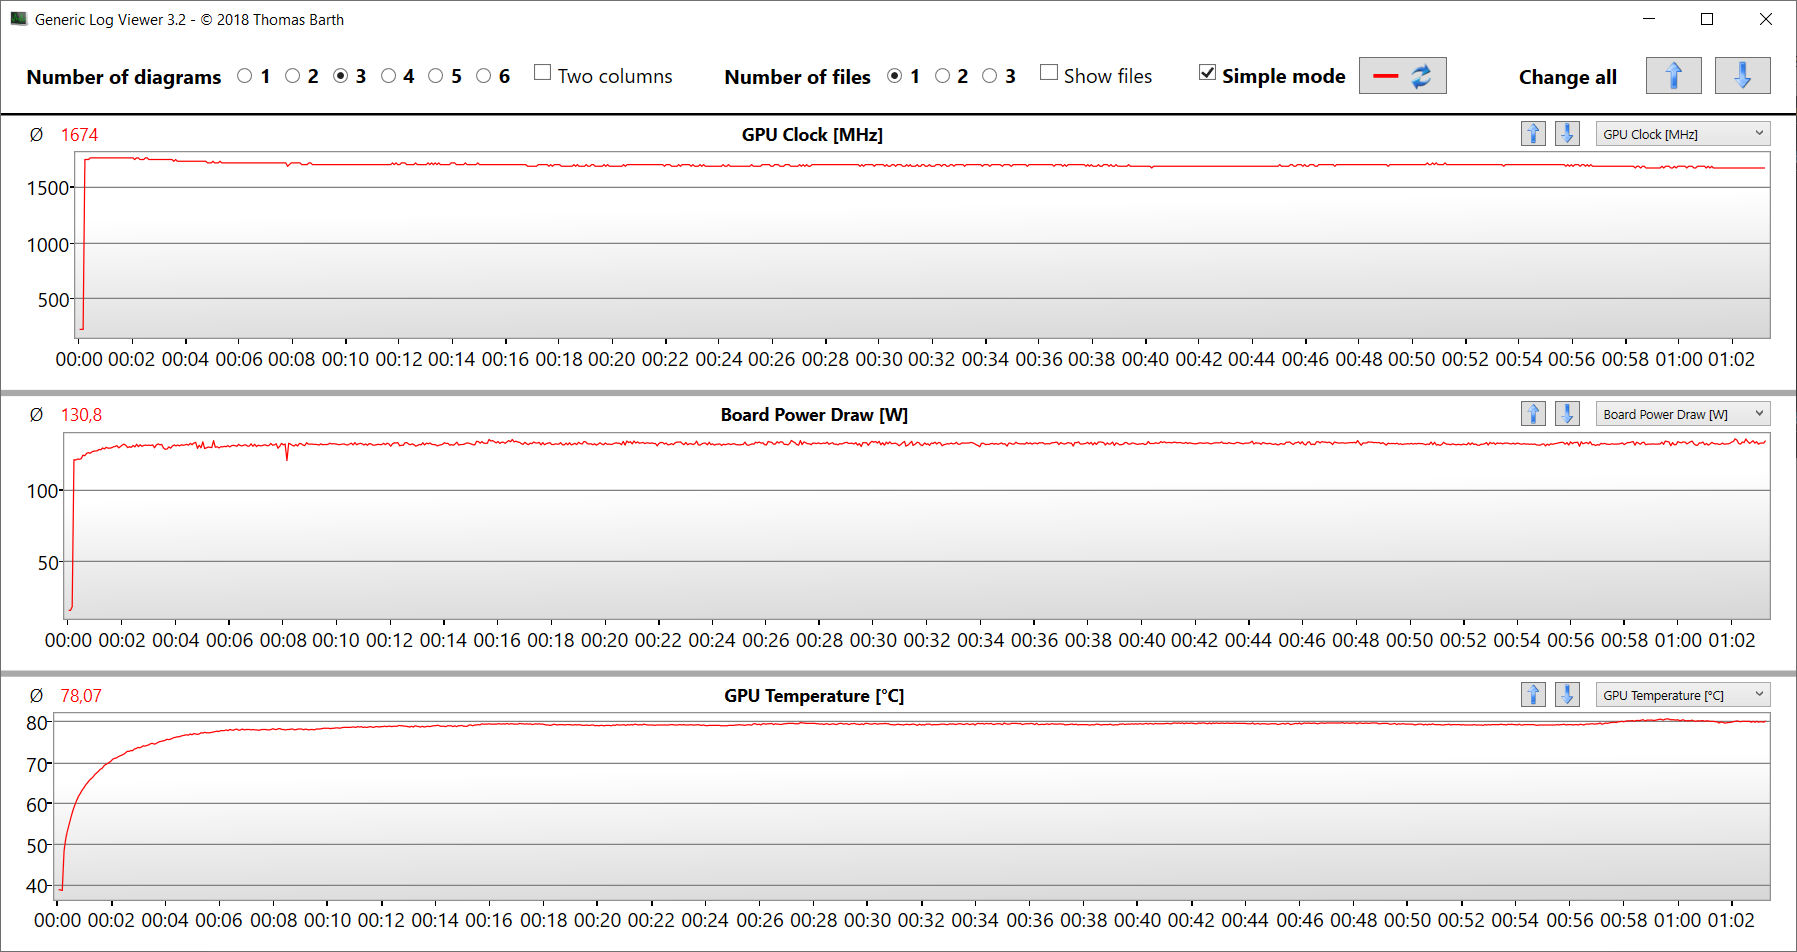
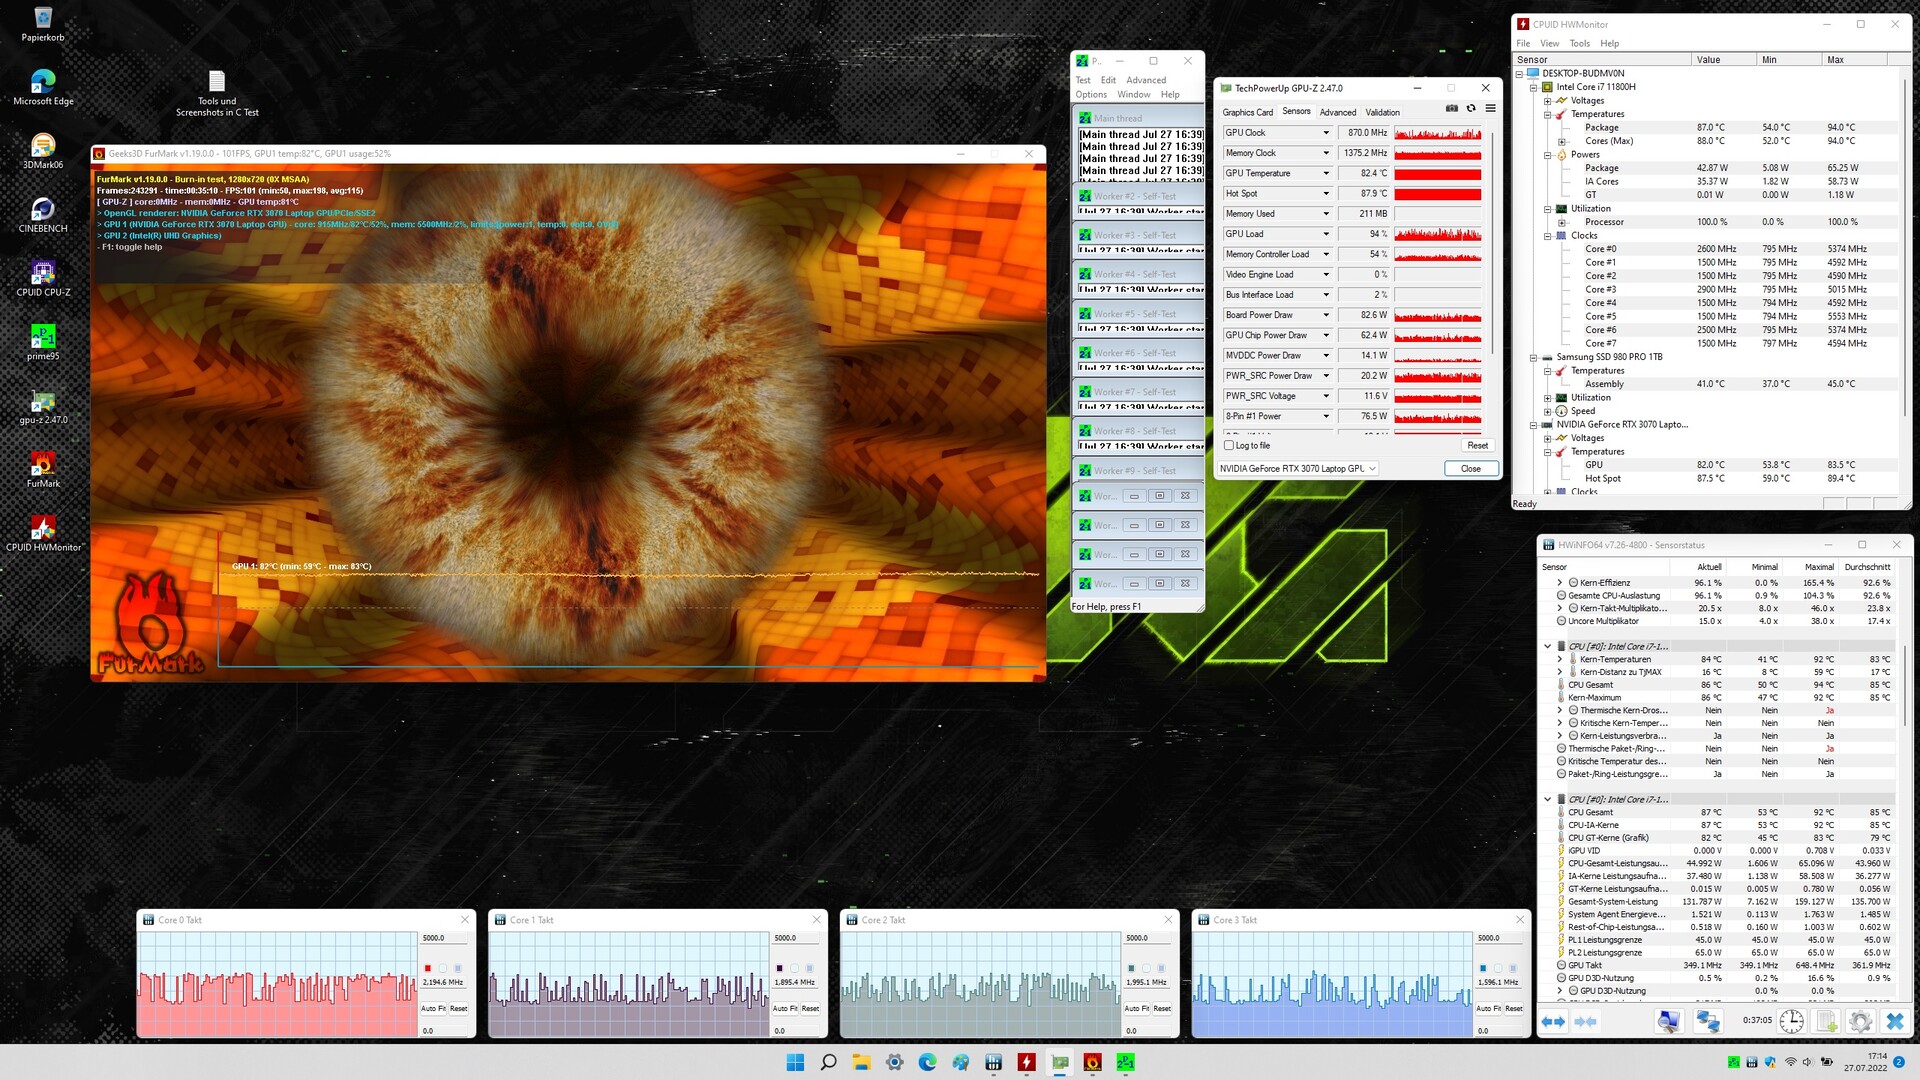
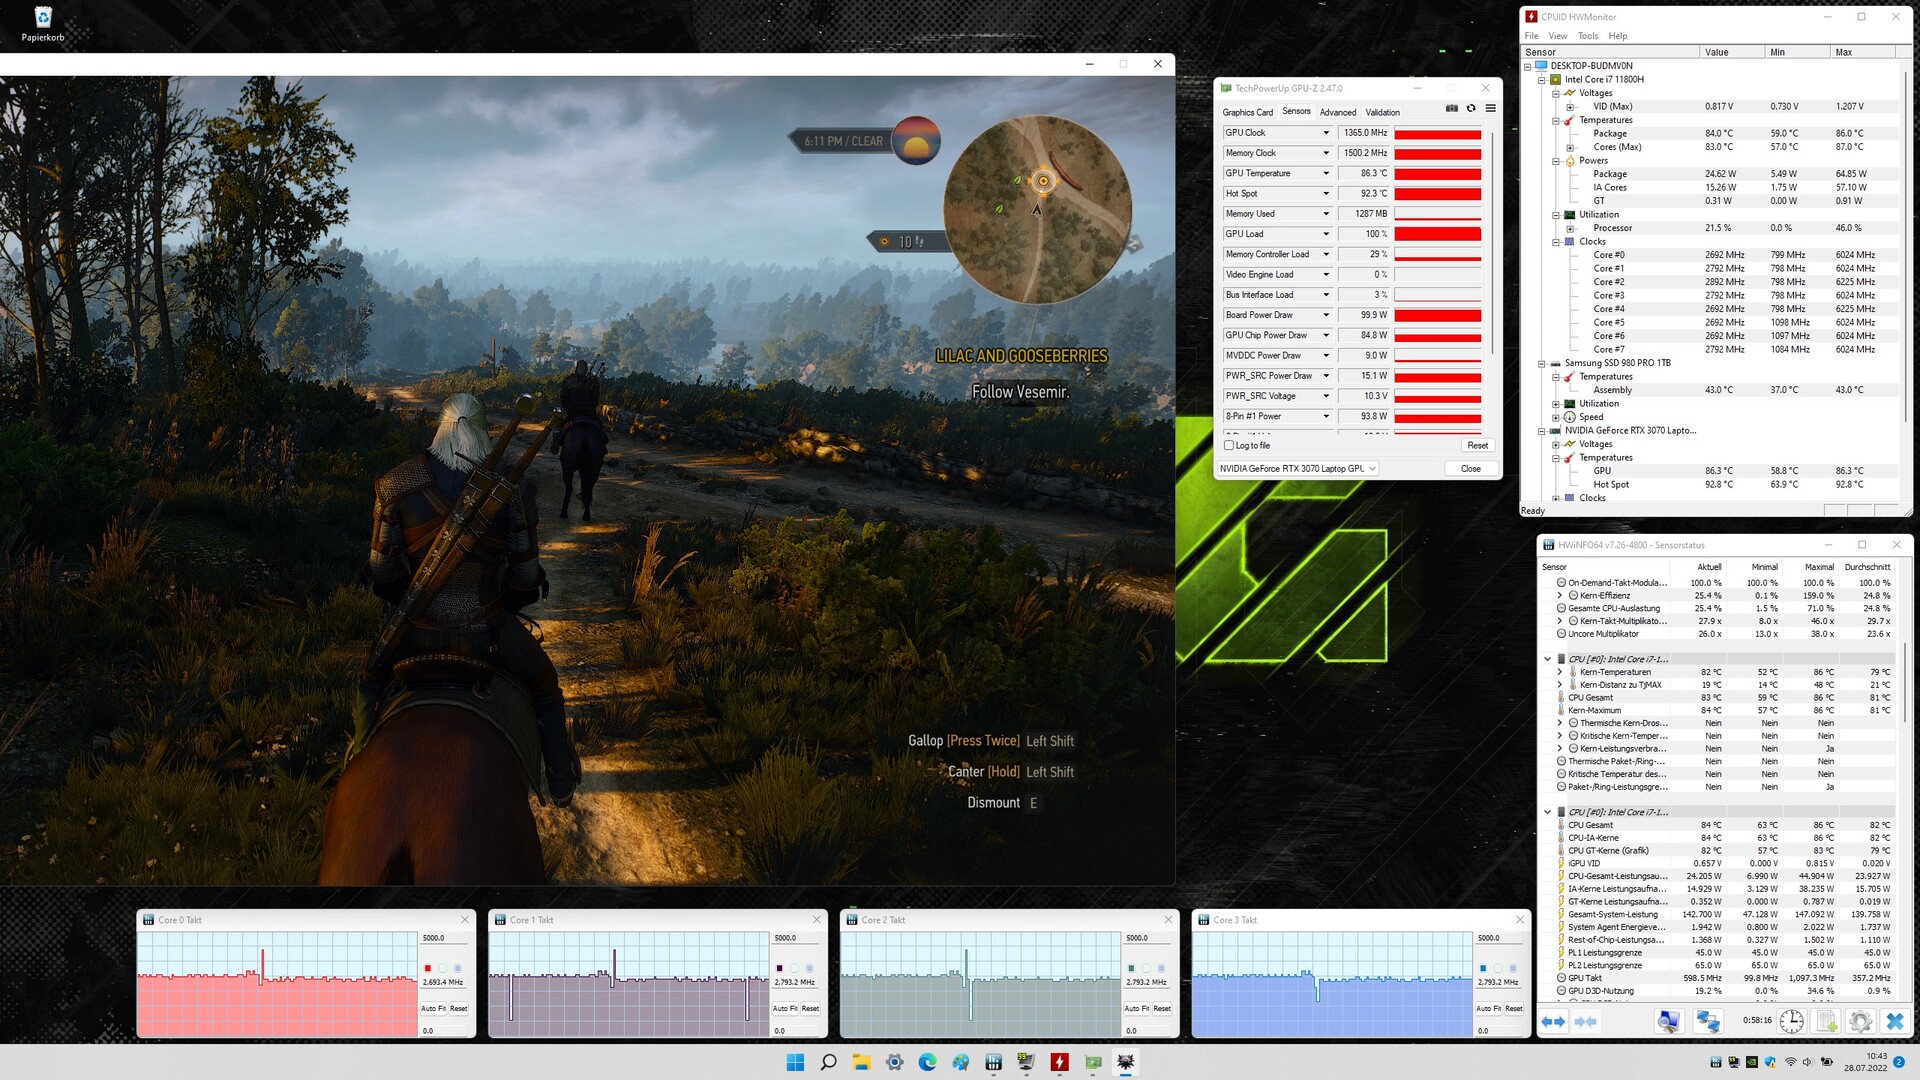
Stress test
The CPU (1.8 to 4.2 GHz) and GPU (1,000 to 1,700 MHz) initiate the stress test (Prime95 and FurMark run for at least an hour) with a high level of fluctuating operating speeds. As the test progresses, the clock rates drop. The stress test represents an extreme scenario. We use this test to verify that the system remains stable under full load.
Speakers
The stereo speakers deliver a comparatively good sound, but it hardly has any bass. We recommend using headphones or external speakers for a better sound experience.
SCHENKER XMG Fusion 15 (Mid 22) audio analysis
(+) | speakers can play relatively loud (82 dB)
Bass 100 - 315 Hz
(-) | nearly no bass - on average 17.6% lower than median
(±) | linearity of bass is average (12.1% delta to prev. frequency)
Mids 400 - 2000 Hz
(+) | balanced mids - only 3% away from median
(+) | mids are linear (3.9% delta to prev. frequency)
Highs 2 - 16 kHz
(+) | balanced highs - only 2.8% away from median
(+) | highs are linear (5.5% delta to prev. frequency)
Overall 100 - 16.000 Hz
(+) | overall sound is linear (13.3% difference to median)
Compared to same class
» 17% of all tested devices in this class were better, 5% similar, 78% worse
» The best had a delta of 6%, average was 18%, worst was 132%
Compared to all devices tested
» 11% of all tested devices were better, 3% similar, 87% worse
» The best had a delta of 4%, average was 25%, worst was 134%
Energy management - NUC delivers good battery life
Energy consumption
Overall, power consumption is at a normal level for the hardware installed here. Our The Witcher 3 test and the stress test result in an average power consumption of 208 watts and up to 160 watts, respectively. While our The Witcher 3 test is run with constant energy consumption, the demand fluctuates and drops in the course of the stress test. The included power supply (230 watts) is of sufficient capacity.
| Off / Standby | |
| Idle | |
| Load |
|
| SCHENKER XMG Fusion 15 (Mid 22) i7-11800H, GeForce RTX 3070 Laptop GPU | Asus TUF Dash F15 FX517ZR i7-12650H, GeForce RTX 3070 Laptop GPU | Acer Nitro 5 AN515-58-72QR i7-12700H, GeForce RTX 3070 Ti Laptop GPU | HP Omen 16-b1090ng i7-12700H, GeForce RTX 3070 Ti Laptop GPU | MSI Delta 15 A5EFK R9 5900HX, Radeon RX 6700M | Razer Blade 15 Base Edition 2021, i7-10750H RTX 3060 i7-10750H, GeForce RTX 3060 Laptop GPU | Average NVIDIA GeForce RTX 3070 Laptop GPU | Average of class Gaming | |
|---|---|---|---|---|---|---|---|---|
| Power Consumption | 10% | 2% | 17% | -2% | 2% | -16% | -13% | |
| Idle Minimum * | 12 | 10 17% | 7 42% | 4 67% | 10 17% | 11.7 2% | 15.6 ? -30% | 13.8 ? -15% |
| Idle Average * | 17 | 14 18% | 15 12% | 10 41% | 18 -6% | 16 6% | 20.1 ? -18% | 19.2 ? -13% |
| Idle Maximum * | 24 | 20 17% | 24 -0% | 19 21% | 25 -4% | 29.3 -22% | 29.4 ? -23% | 26.9 ? -12% |
| Load Average * | 106 | 122 -15% | 124 -17% | 114 -8% | 101 5% | 95.6 10% | 110.8 ? -5% | 111.1 ? -5% |
| Witcher 3 ultra * | 159.9 | 138.6 13% | 195.1 -22% | 183.2 -15% | 187 -17% | 141.3 12% | ||
| Load Maximum * | 208 | 189 9% | 220 -6% | 221 -6% | 217 -4% | 197 5% | 214 ? -3% | 251 ? -21% |
* ... smaller is better
Energy consumption during The Witcher 3 / Stress test
Energy consumption with an external monitor
Battery life
The Schenker laptop delivers the best battery life in the comparison field - no surprise: The laptop has the highest battery capacity (93 Wh). The 15.6-incher achieves runtimes of 7:26 hours and 7:28 hours in our Wi-Fi test (accessing websites via a script) and video test (short film Big Buck Bunny (H.264 encoding, Full HD) running in a loop), respectively. The laptop's power-saving features are disabled during both tests, and the display brightness is set to about 150 cd/m². In addition, the wireless modules are disabled for the video test.
| SCHENKER XMG Fusion 15 (Mid 22) i7-11800H, GeForce RTX 3070 Laptop GPU, 93.48 Wh | Asus TUF Dash F15 FX517ZR i7-12650H, GeForce RTX 3070 Laptop GPU, 76 Wh | Acer Nitro 5 AN515-58-72QR i7-12700H, GeForce RTX 3070 Ti Laptop GPU, 57.5 Wh | HP Omen 16-b1090ng i7-12700H, GeForce RTX 3070 Ti Laptop GPU, 83 Wh | MSI Delta 15 A5EFK R9 5900HX, Radeon RX 6700M, 82 Wh | Razer Blade 15 Base Edition 2021, i7-10750H RTX 3060 i7-10750H, GeForce RTX 3060 Laptop GPU, 65 Wh | Average of class Gaming | |
|---|---|---|---|---|---|---|---|
| Battery Runtime | -9% | -46% | -18% | -12% | -34% | -23% | |
| Reader / Idle | 931 | 650 -30% | 340 -63% | 603 -35% | 664 -29% | 466 -50% | 544 ? -42% |
| H.264 | 448 | 346 -23% | 283 -37% | 399 ? -11% | |||
| WiFi v1.3 | 446 | 417 -7% | 234 -48% | 336 -25% | 474 6% | 289 -35% | 368 ? -17% |
| Load | 109 | 137 26% | 72 -34% | 114 5% | 96 -12% | 91 -17% | 84.4 ? -23% |
Pros
Cons
Verdict - Compact and powerful
Rendering and gaming are among this compact, lightweight laptop's core competencies. QHD gaming is possible at high to maximum settings. Its focus is not on maximum performance, but on a compromise between performance and portability.
With the XMG Fusion 15 (Mid 22), Schenker delivers a thoroughly accomplished compact gaming laptop. It won't get any style points, though.
The Core i7-11800H and the GeForce RTX 3070 can run at consistently high clock rates. Depending on the settings, the GPU performance rates range at or above the RTX 3070 average. The laptop heats up significantly under load, and noise development reaches the usual class level. The device can operate quietly in everyday use.
A 93 Wh battery ensures practical runtimes of about 7:30 hours - a pretty good rate. Too bad: The battery can't be charged via the USB-C port (Thunderbolt 4). This would have been a very useful feature, especially for a device that is designed for mobility. However, the Thunderbolt 4 port opens up expansion options in the form of a docking solution or an external GPU.
The mechanical keyboard (with RGB single-key backlighting) left a good impression, and it's likely to be an important criterion for many potential buyers. The matte QHD display (15.6-inch, IPS, 165 Hz) doesn't suffer from any major weaknesses, but it isn't a top display, either. The panel scores points with good color reproduction, very decent color-space coverage and fast response times.
An alternative to the Fusion would be the Asus TUF Dash F15 FX517ZR, which is also light and compact. The laptop offers better color-space coverage, Adaptive Sync, a dGPU mode and Power Delivery. The GPU performance is slightly behind that of the Fusion 15, though.
Price and availability
The Schenker XMG Fusion 15 (Mid 2022) can be customized in Schenker's online store. The configuration variant provided to us (Core i7-11800H, GeForce RTX 3070 Laptop, 32 GB RAM, 1 TB SSD, QHD display) is available for just under 2,000 Euros (~$1,991). Entry-level models are available starting at about 1,500 Euros (~$1,493).
Tip: At the time of writing, the online store offers a discount of 150 Euros (~$149) on every configuration of the Fusion. The discount is applied in the shopping cart.
SCHENKER XMG Fusion 15 (Mid 22)
-
08/21/2022 v7
Sascha Mölck
More articles related to this device
SCHENKER XMG Fusion 15 (Mid 22) (XMG Fusion 15 Series)Related Articles

Pricecompare

