LG Gram 14T90N Convertible Review: A CPU Downgrade
The 14-inch 2020 LG Gram 14T90N succeeds last year's Gram 14T990 that was revealed ahead of CES 2019. The second generation model brings Comet Lake-U CPU options on-board to replace the older Whiskey Lake-U family.
Our test unit here comes with the Core i7-10510U CPU, 1080p touchscreen, 512 GB NVMe SSD, and 16 GB of DDR4 RAM for $1400 USD retail. There appears to be no other configuration with Intel 10th gen CPU options aside from the Core i7 SKU in review.
Direct competitors include other subnotebook convertibles like the Asus ZenBook 14 Flip, Dell XPS 13 7390 2-in-1, Lenovo Yoga C940, HP Spectre x360 13, and the Microsoft Surface Pro series.
More LG reviews:
Rating | Date | Model | Weight | Height | Size | Resolution | Price |
|---|---|---|---|---|---|---|---|
| 81.2 % v7 (old) | 04 / 2020 | LG Gram 14T90N i7-10510U, UHD Graphics 620 | 1.2 kg | 18 mm | 14.00" | 1920x1080 | |
| 81.2 % v7 (old) | 02 / 2020 | Asus ZenBook 14 UM431DA-AM020T R7 3700U, Vega 10 | 1.4 kg | 16 mm | 14.00" | 1920x1080 | |
| 86.3 % v7 (old) | 10 / 2019 | Dell XPS 13 7390 2-in-1 Core i7 i7-1065G7, Iris Plus Graphics G7 (Ice Lake 64 EU) | 1.3 kg | 13 mm | 13.40" | 1920x1200 | |
| 88.5 % v7 (old) | 03 / 2020 | Lenovo ThinkPad X1 Carbon G7 20R1-000YUS i7-10510U, UHD Graphics 620 | 1.2 kg | 15.4 mm | 14.00" | 3840x2160 | |
| 85.9 % v7 (old) | 11 / 2019 | Dell XPS 13 7390 Core i7-10710U i7-10710U, UHD Graphics 620 | 1.2 kg | 11.6 mm | 13.30" | 3840x2160 |
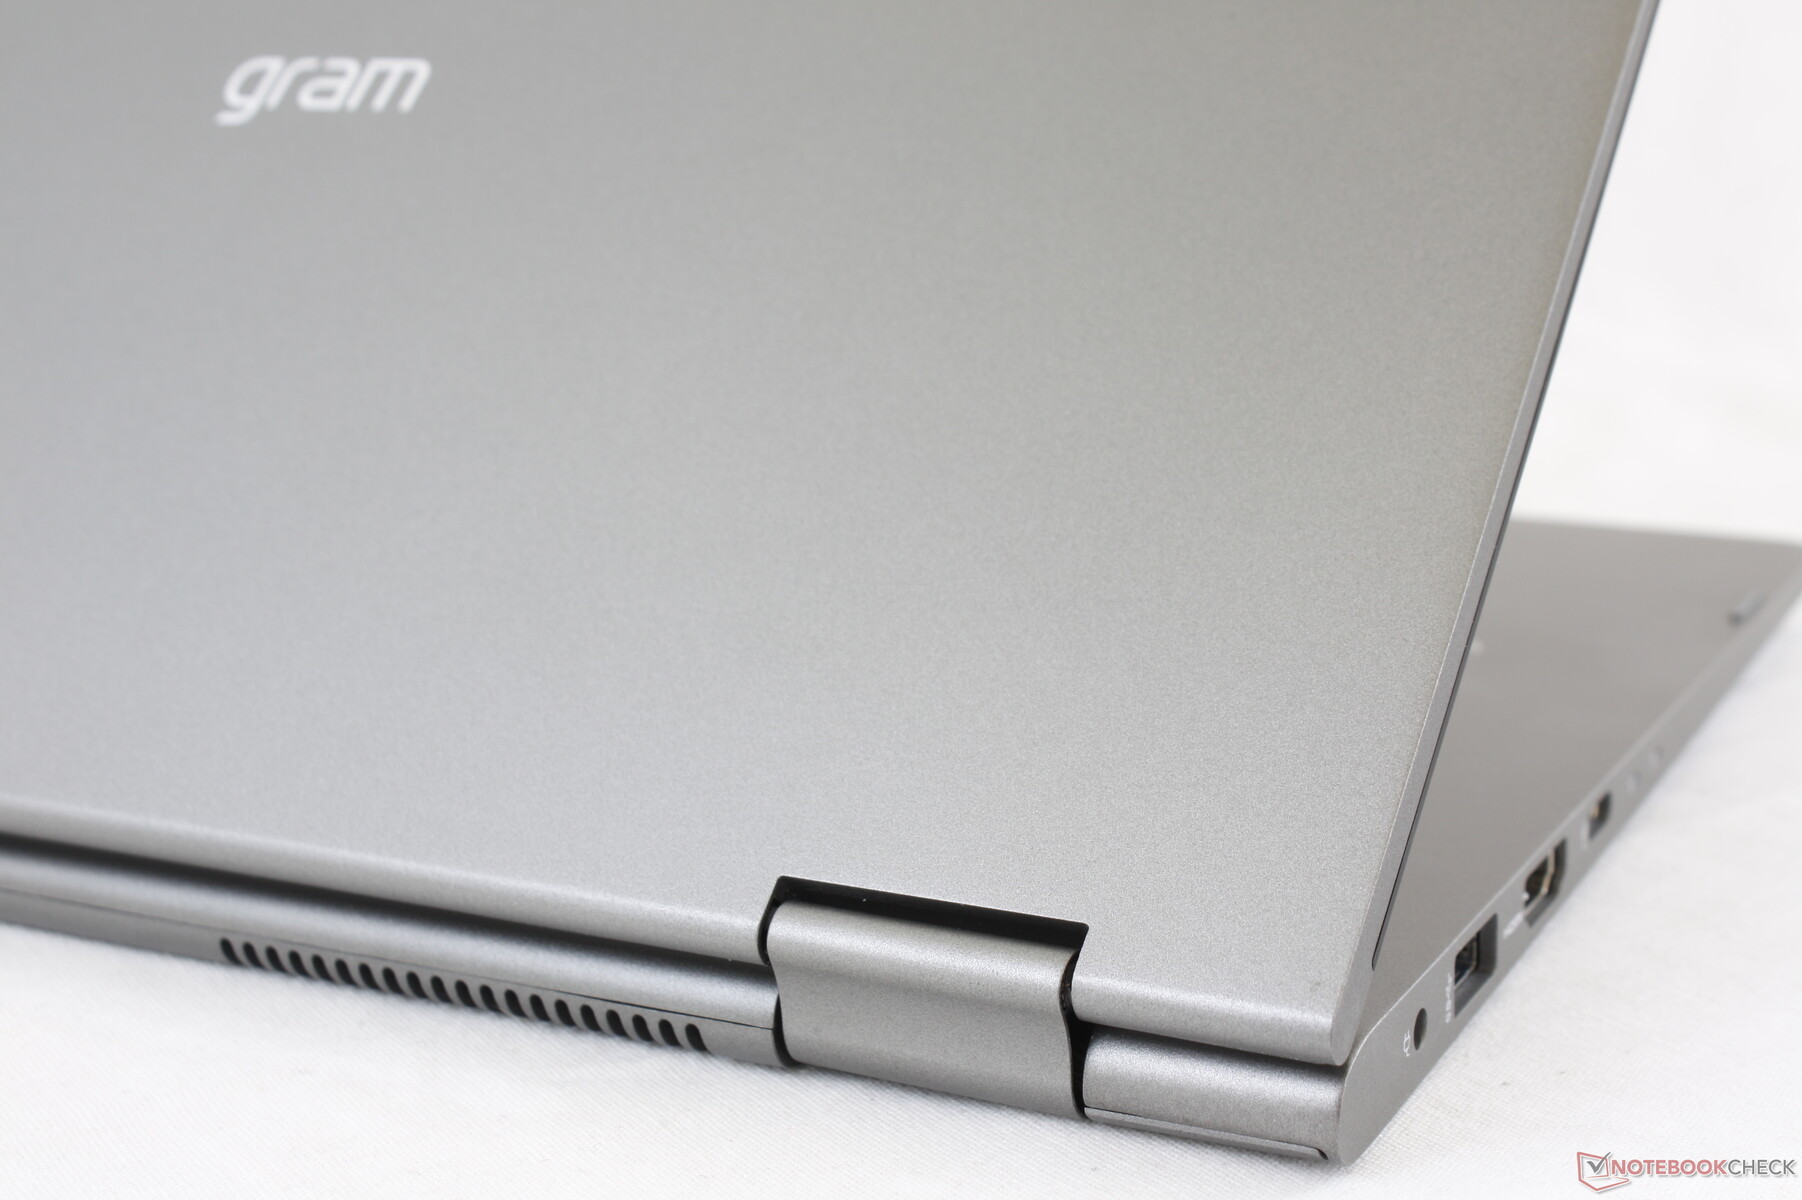
Case
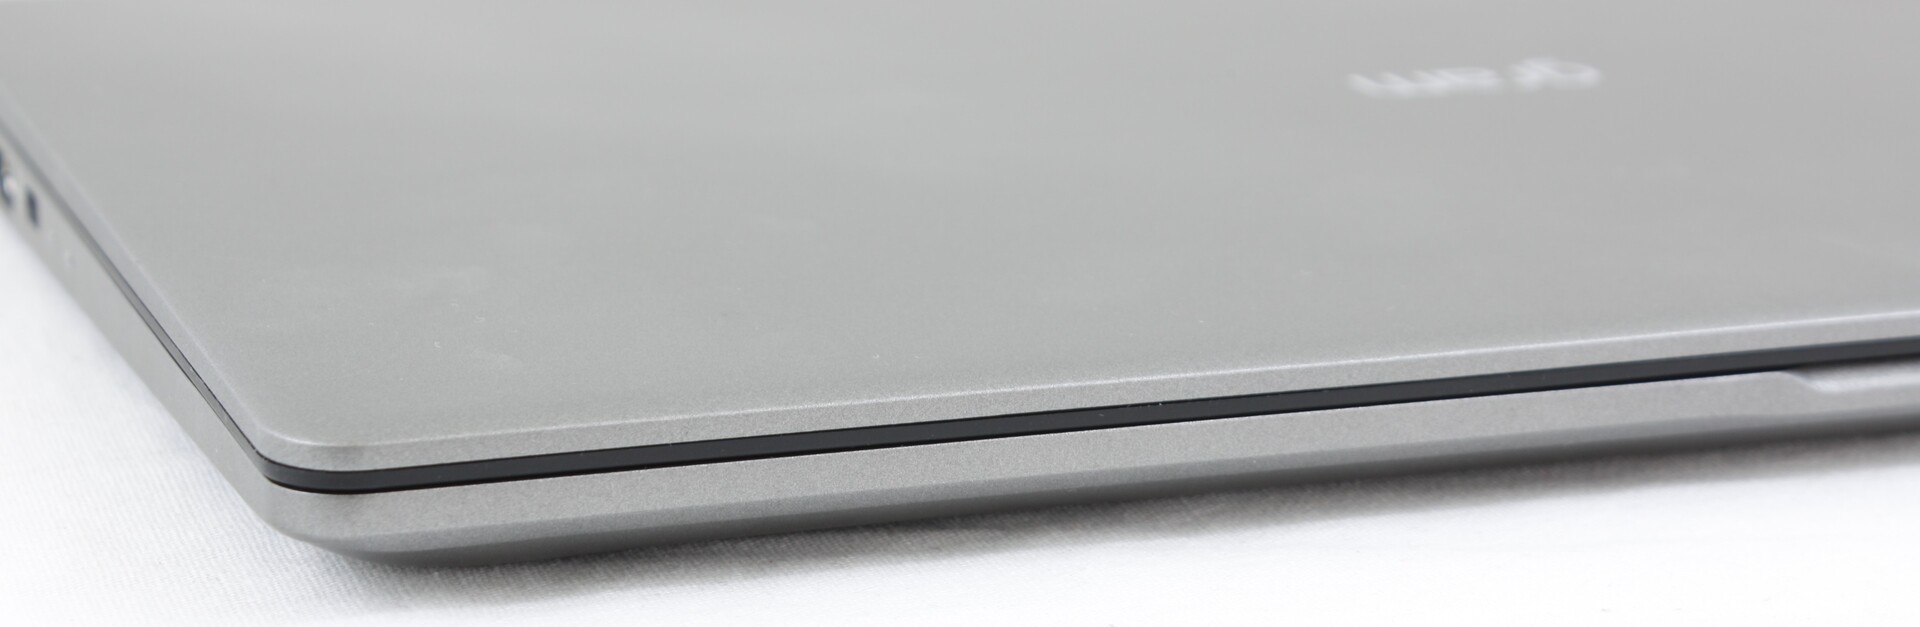
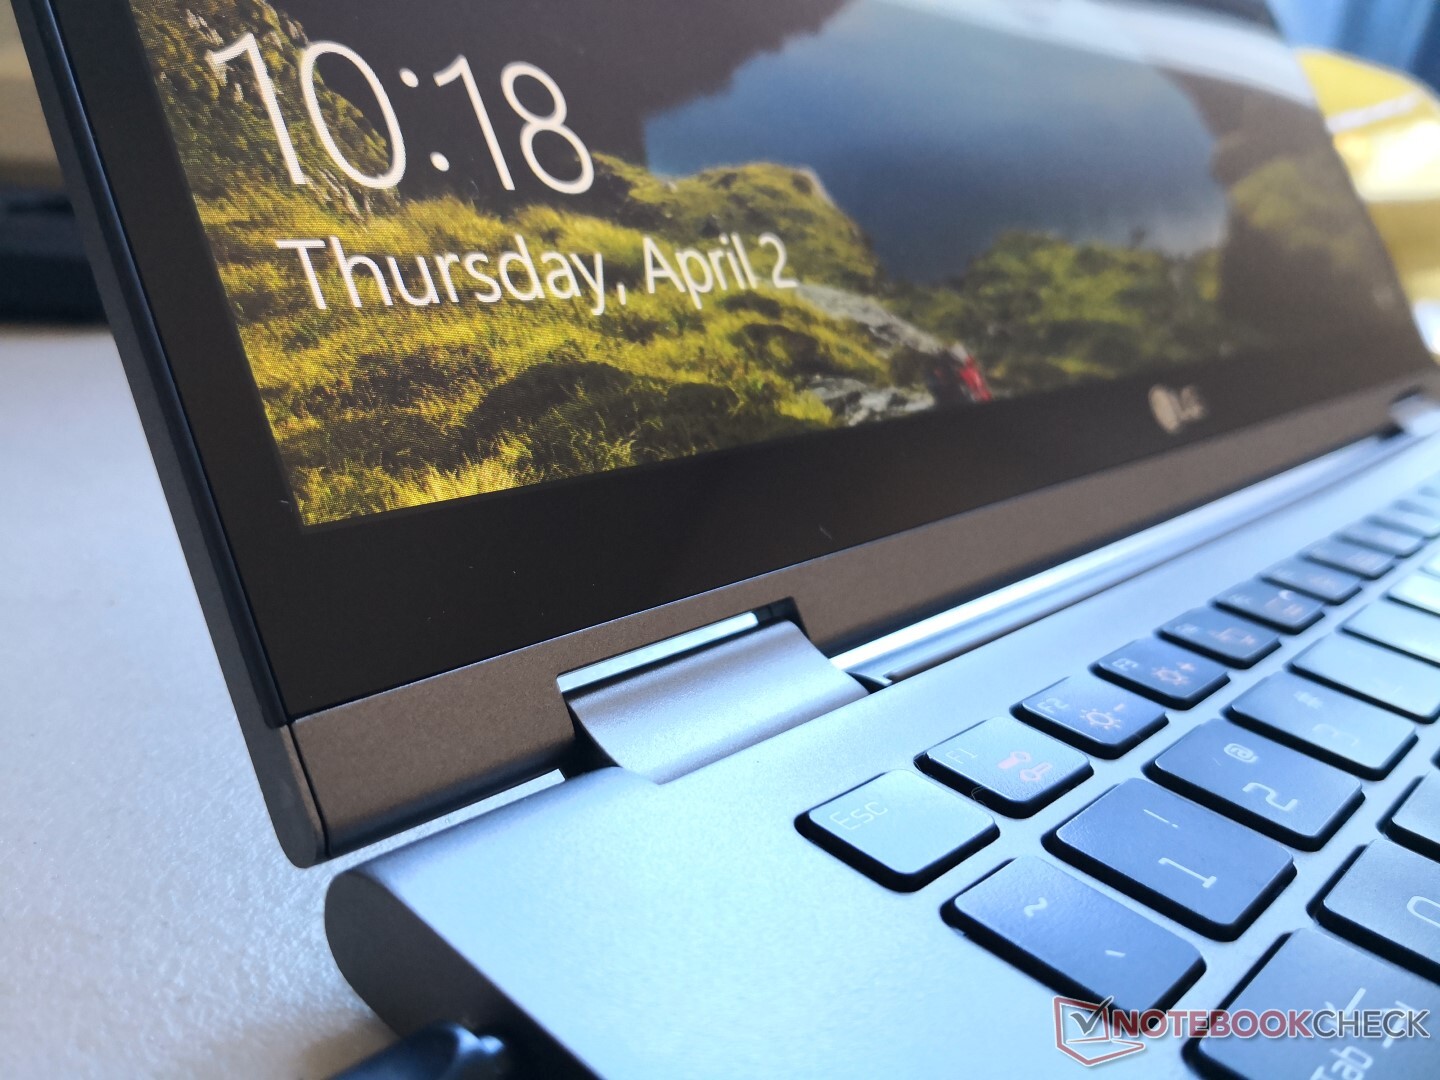
LG advertises an aluminum alloy body that satisfies MIL-STD 810G standards. In practice, however, the chassis is more flexible than most competing Ultrabook convertibles like the HP Spectre x360 13, Dell XPS 13 7390 2-in-1, or Asus ZenBook 14 Flip. This is especially true of the display which doesn't feel nearly as rigid as the displays on any of the aforementioned alternatives. It's still a high quality design and look, but users shouldn't expect it to be as sturdy in the hand. We find the chassis to be most similar to the Samsung Notebook 9 Pen in terms of rigidity.
It's worth noting that the LG Gram 14T90N convertible uses the exact same chassis as the Gram 14T990 convertible which is itself a modified Gram 14Z980 clamshell. Thus, the 14T90N will only be worthwhile if you value its newer Comet Lake-U CPU and Thunderbolt 3 compatibility.
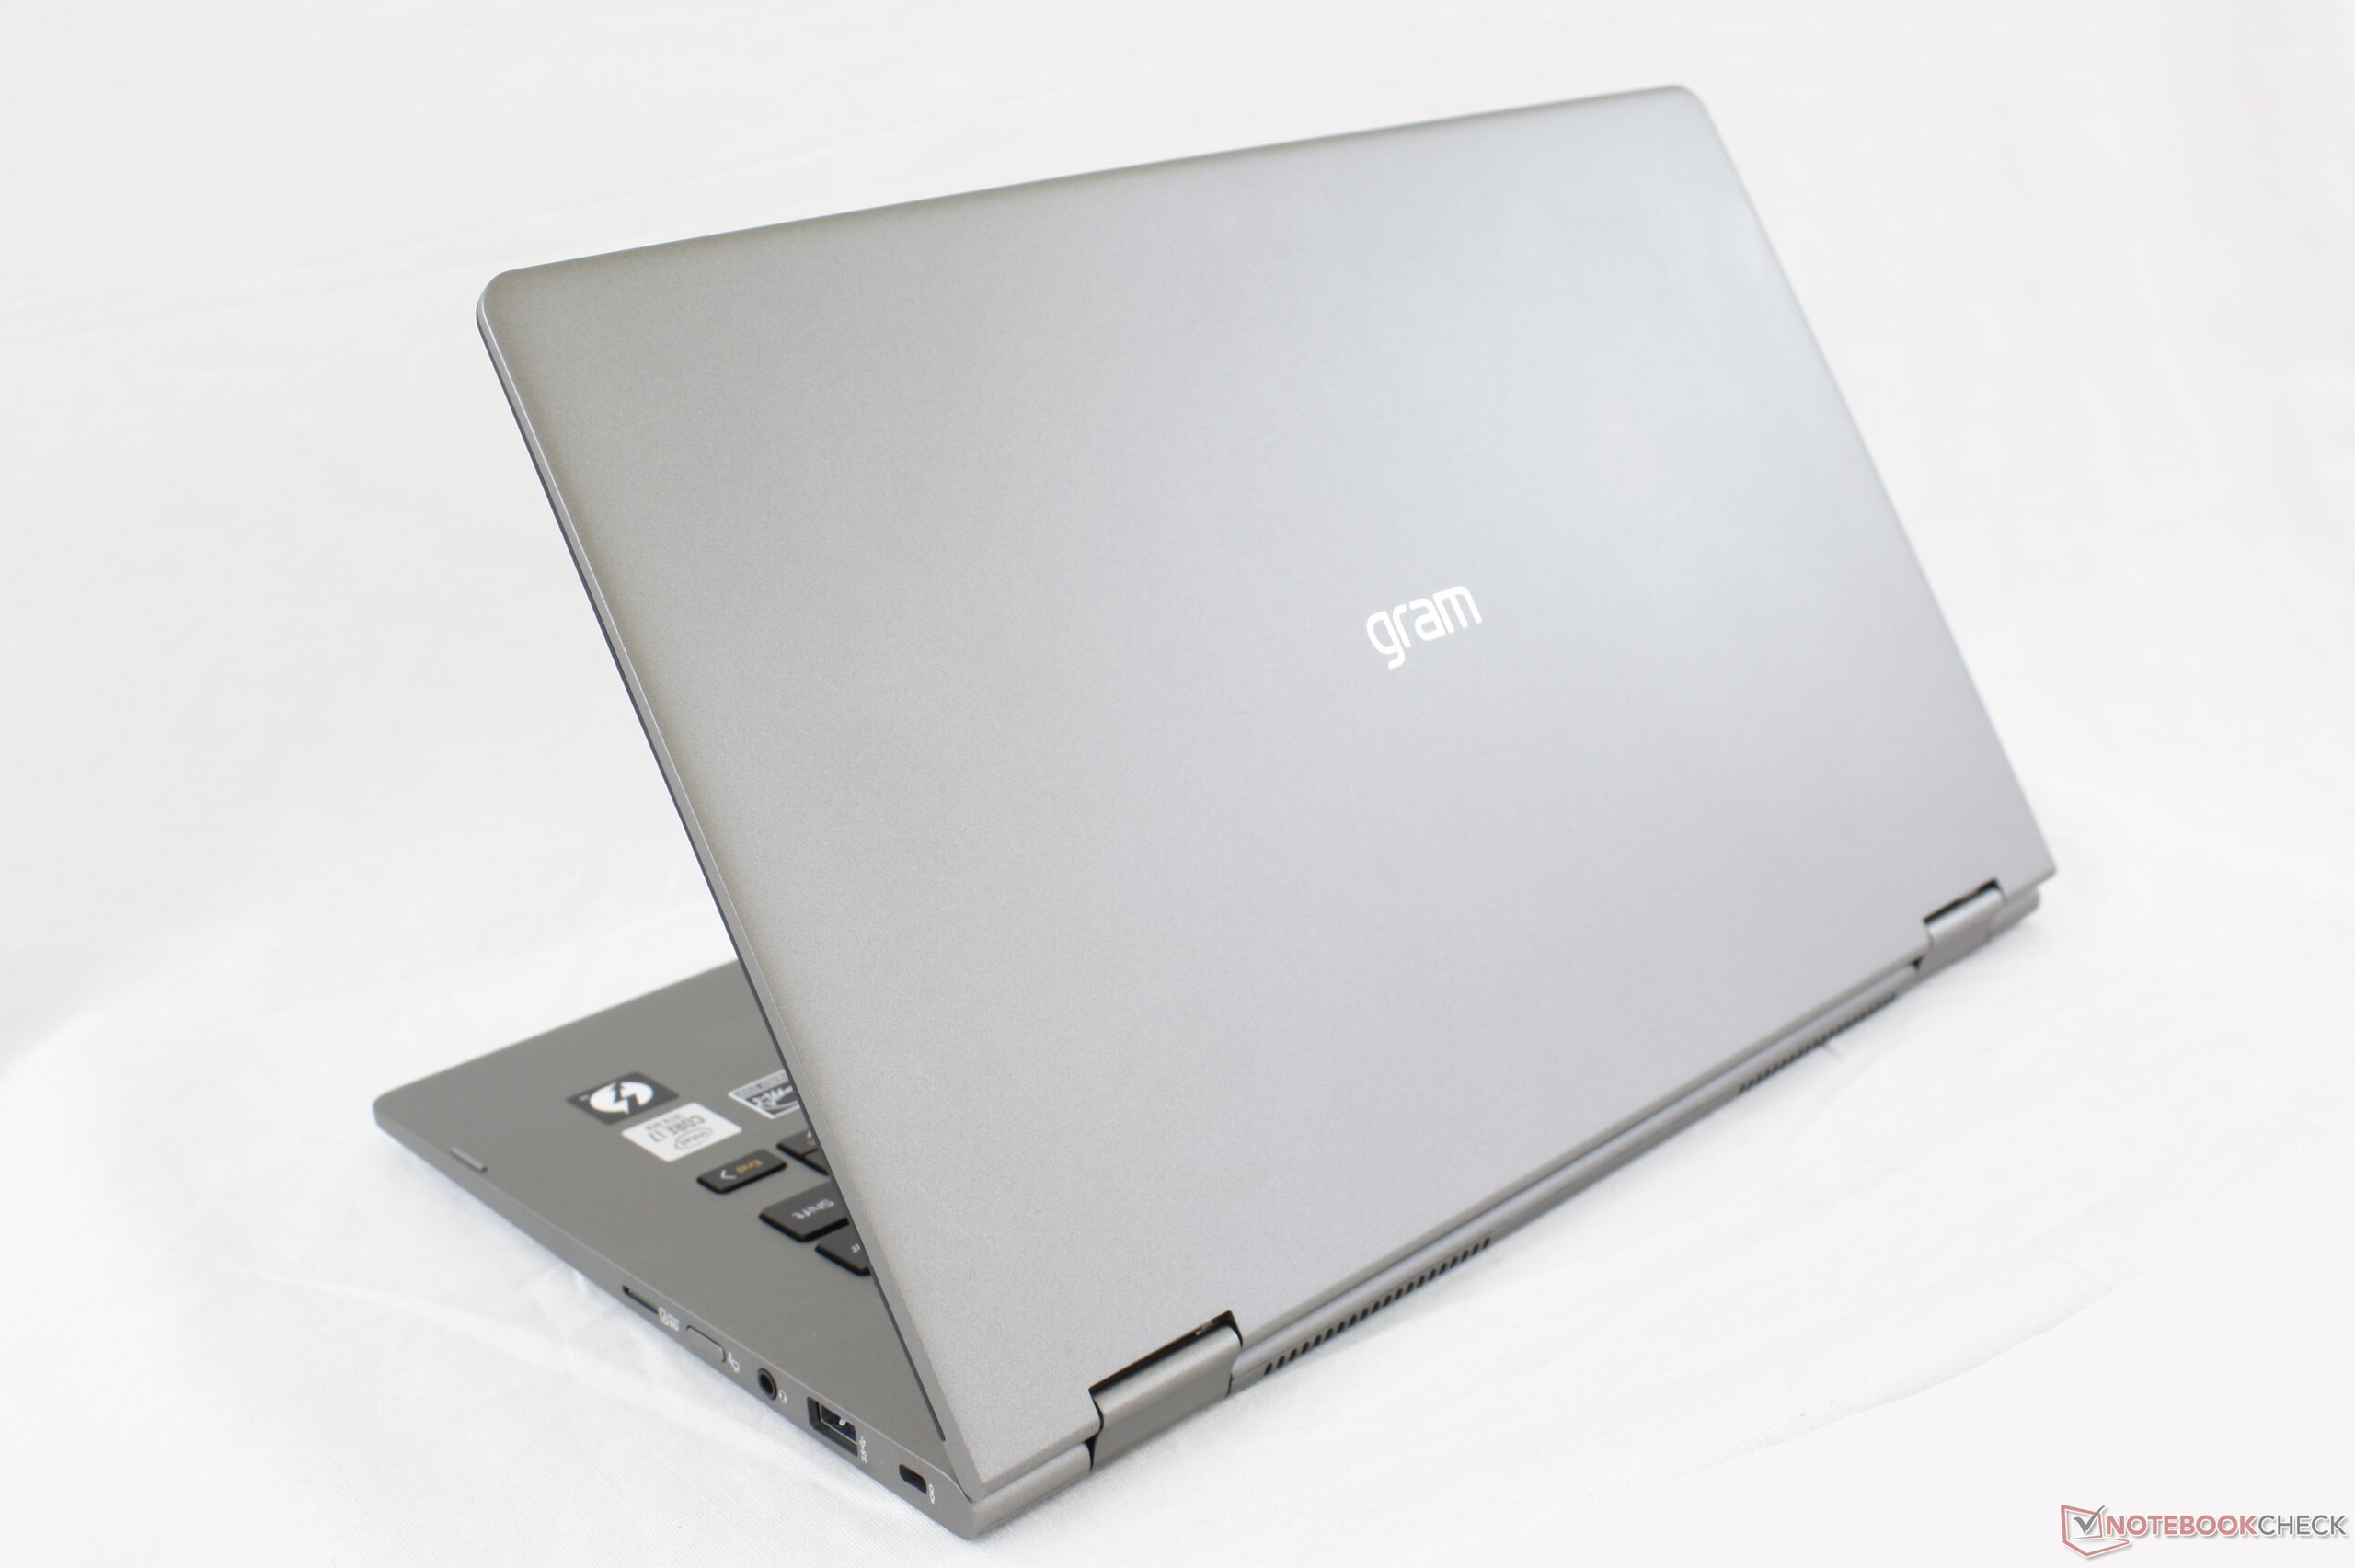

As its name would suggest, one of the key selling points of the LG convertible is its light weight of only 1.2 kg. This is actually heavier than the Gram 14 clamshell by about 200 g due to the slightly thicker profile and stronger hinges, but the system is still one of the lighter subnotebooks in its category. The HP Spectre x360 13, for example, is heavier than our Gram 14 convertible even though it carries a smaller 13.3-inch display.
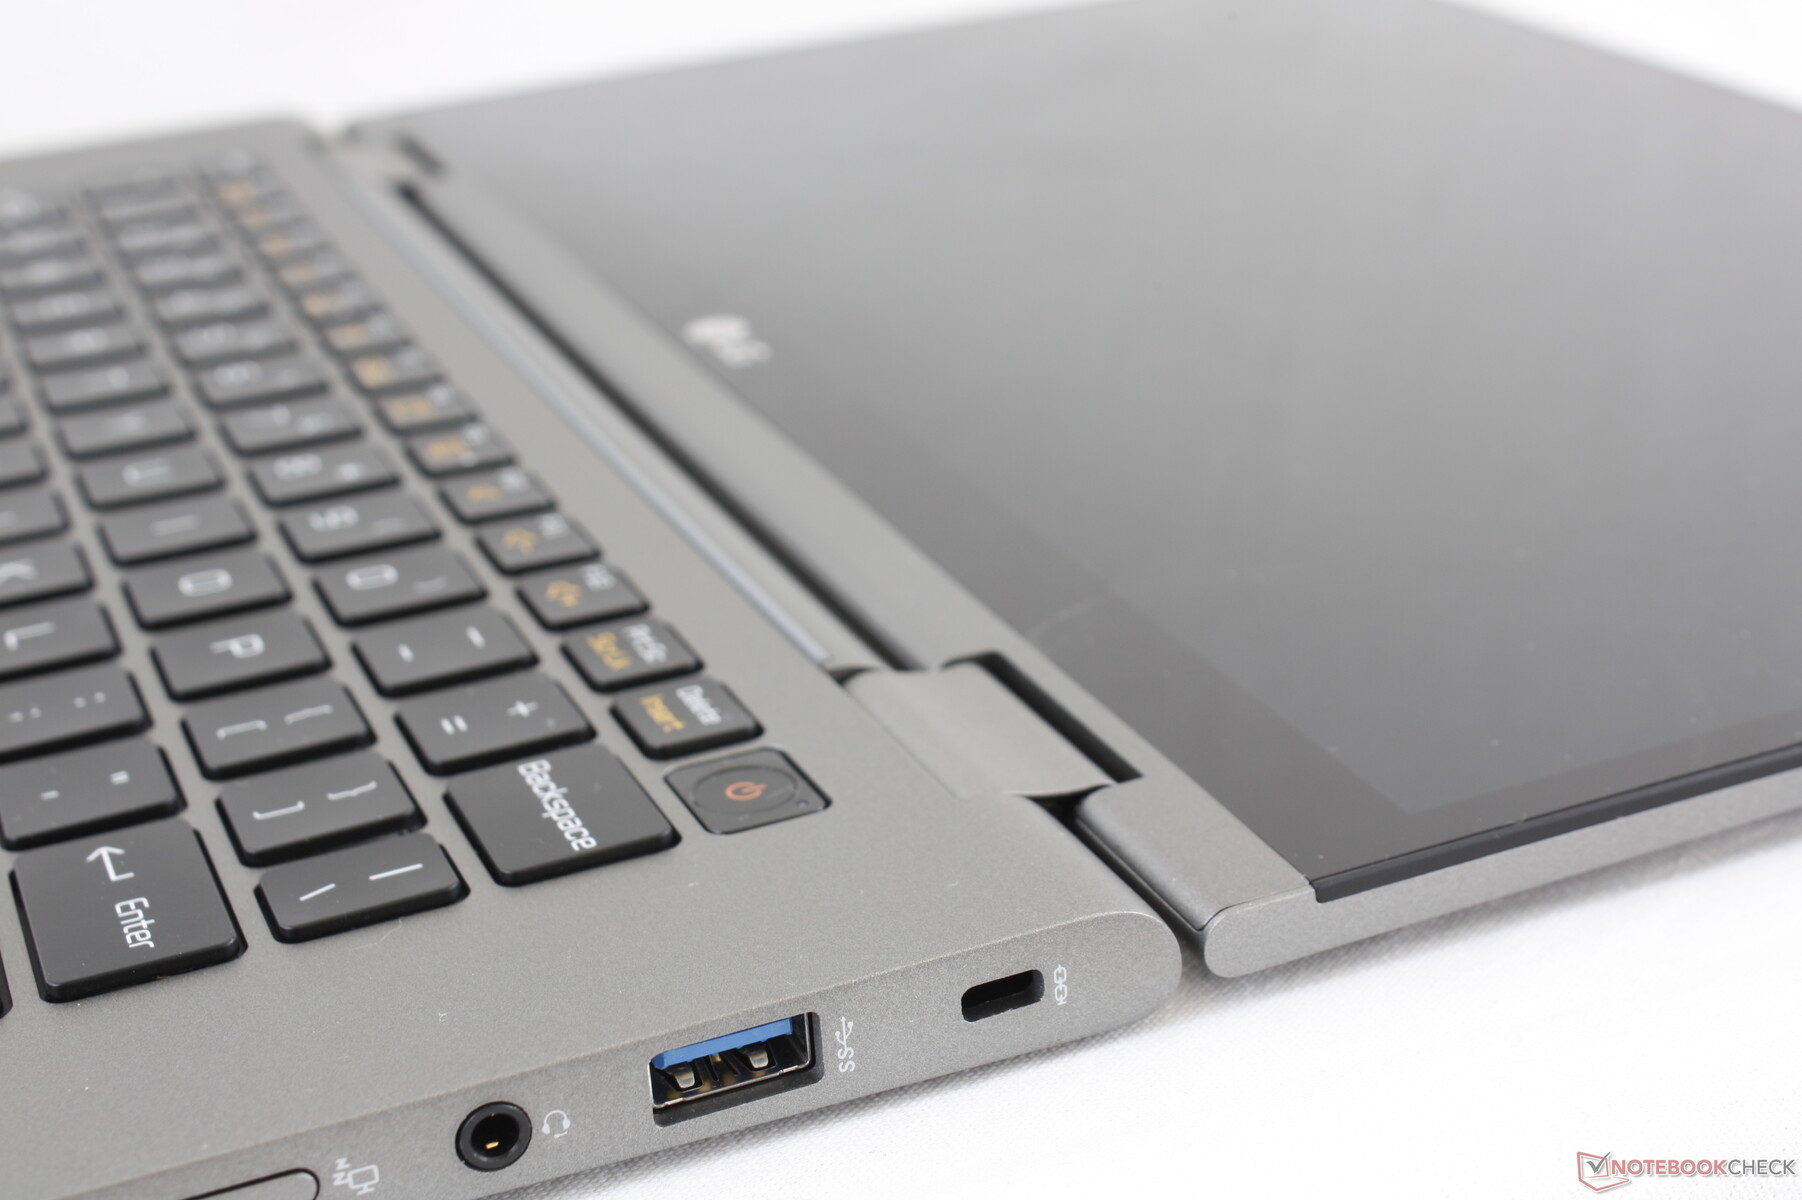

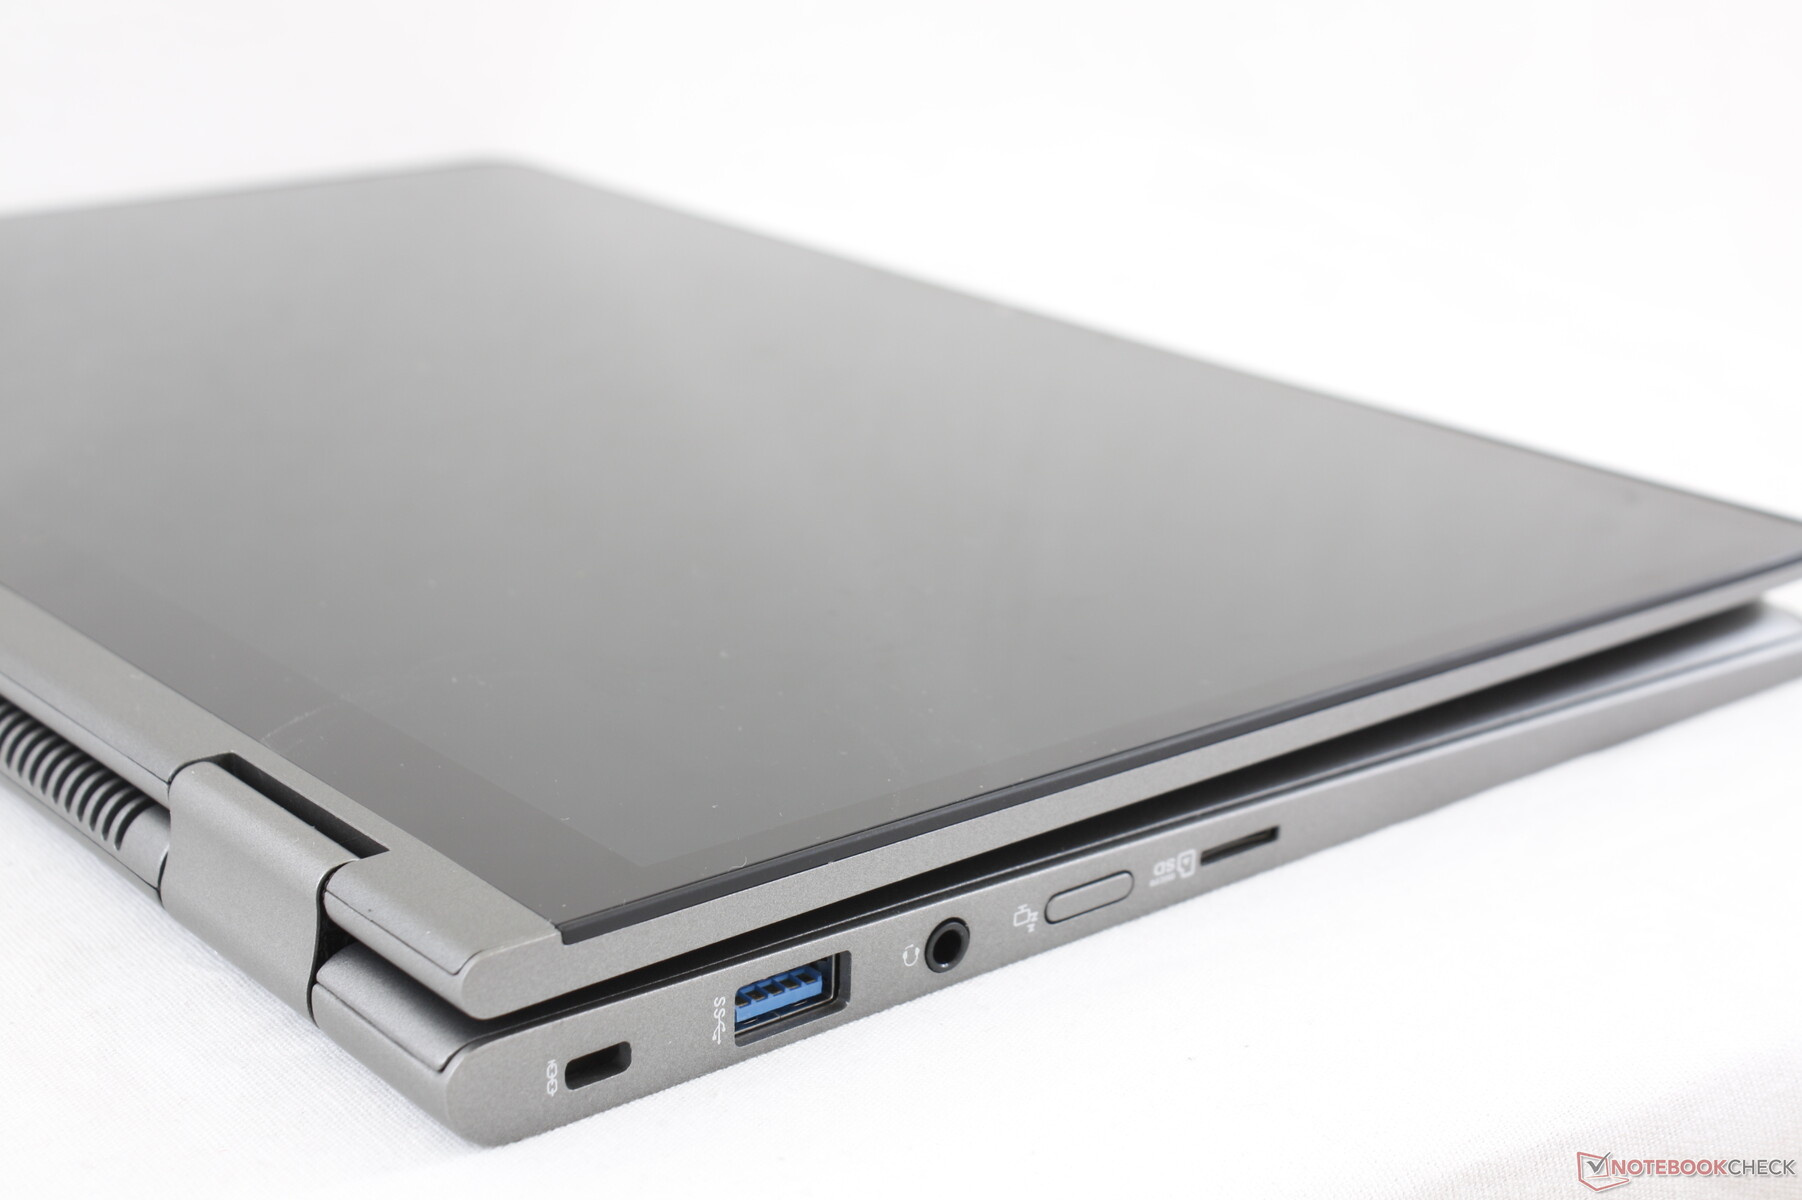
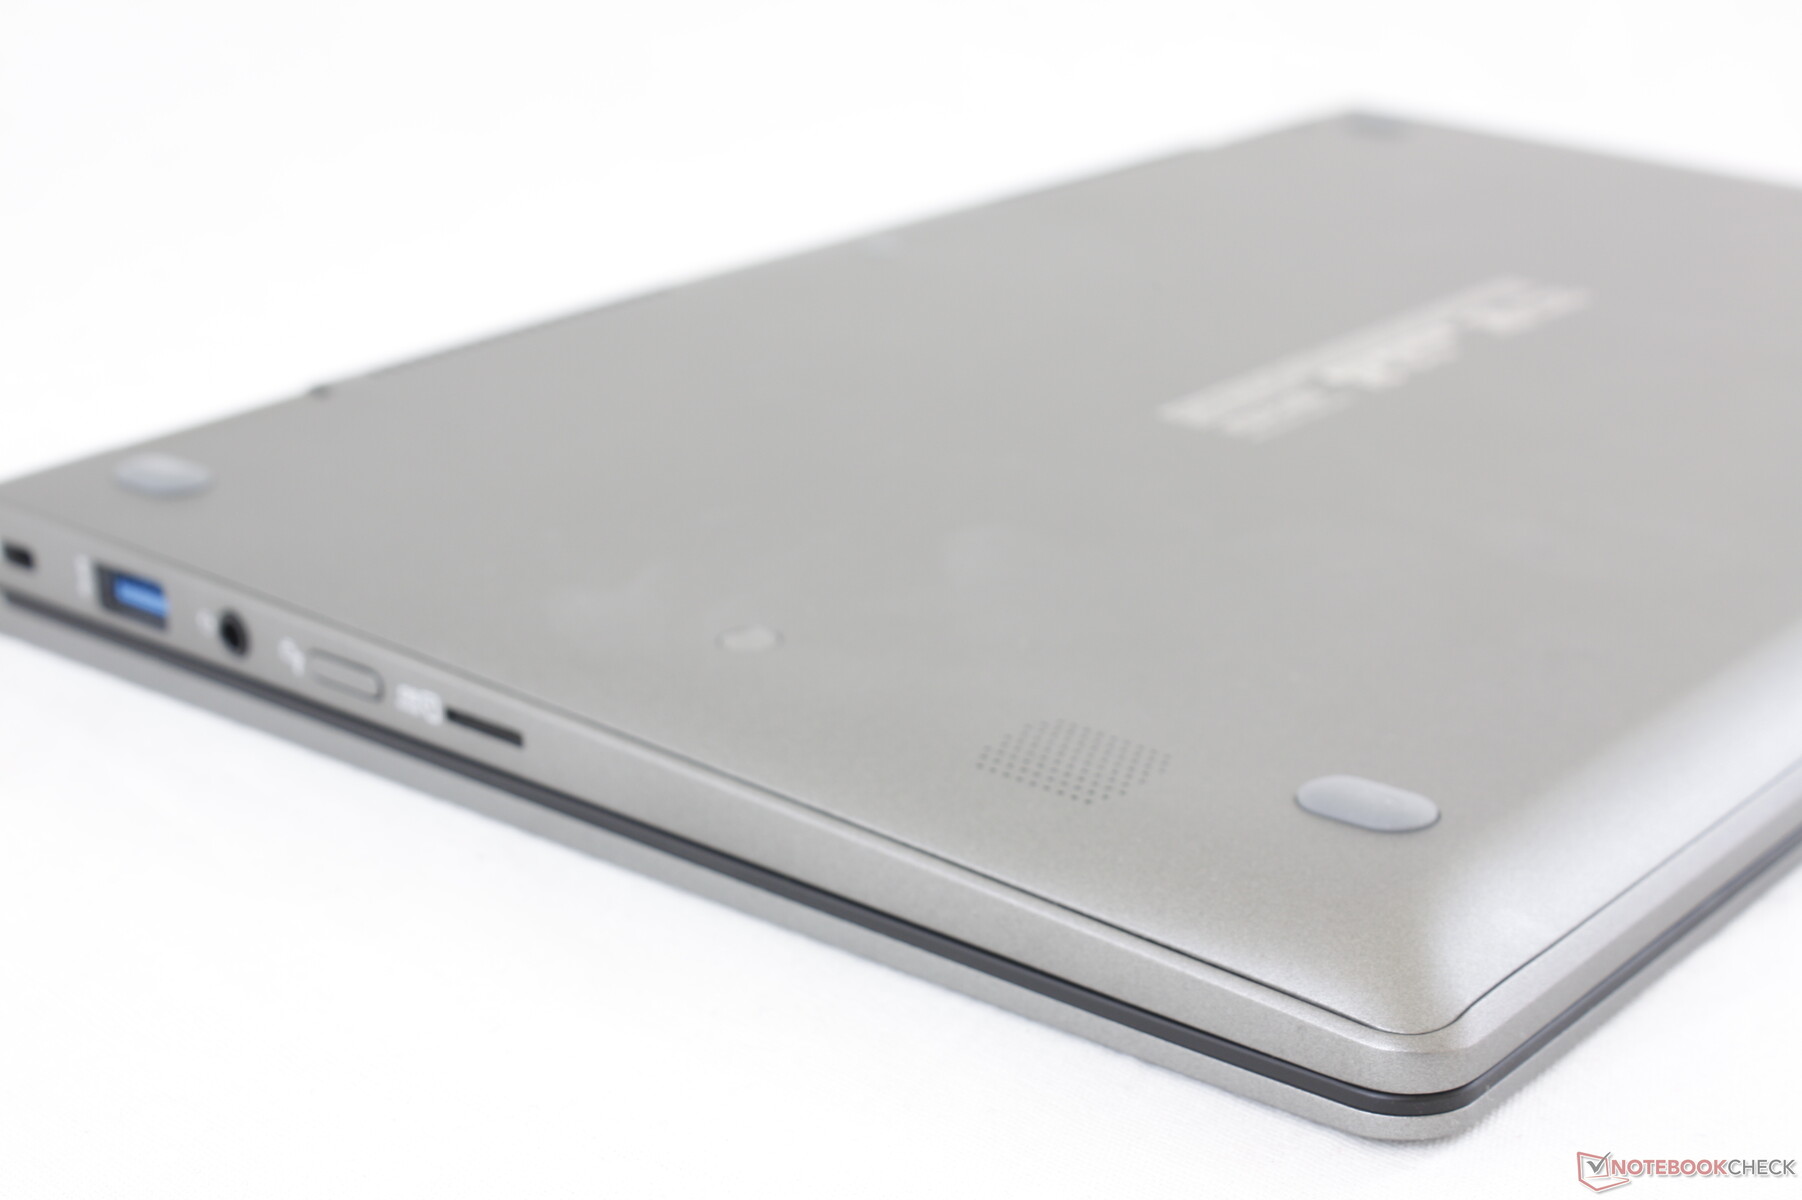
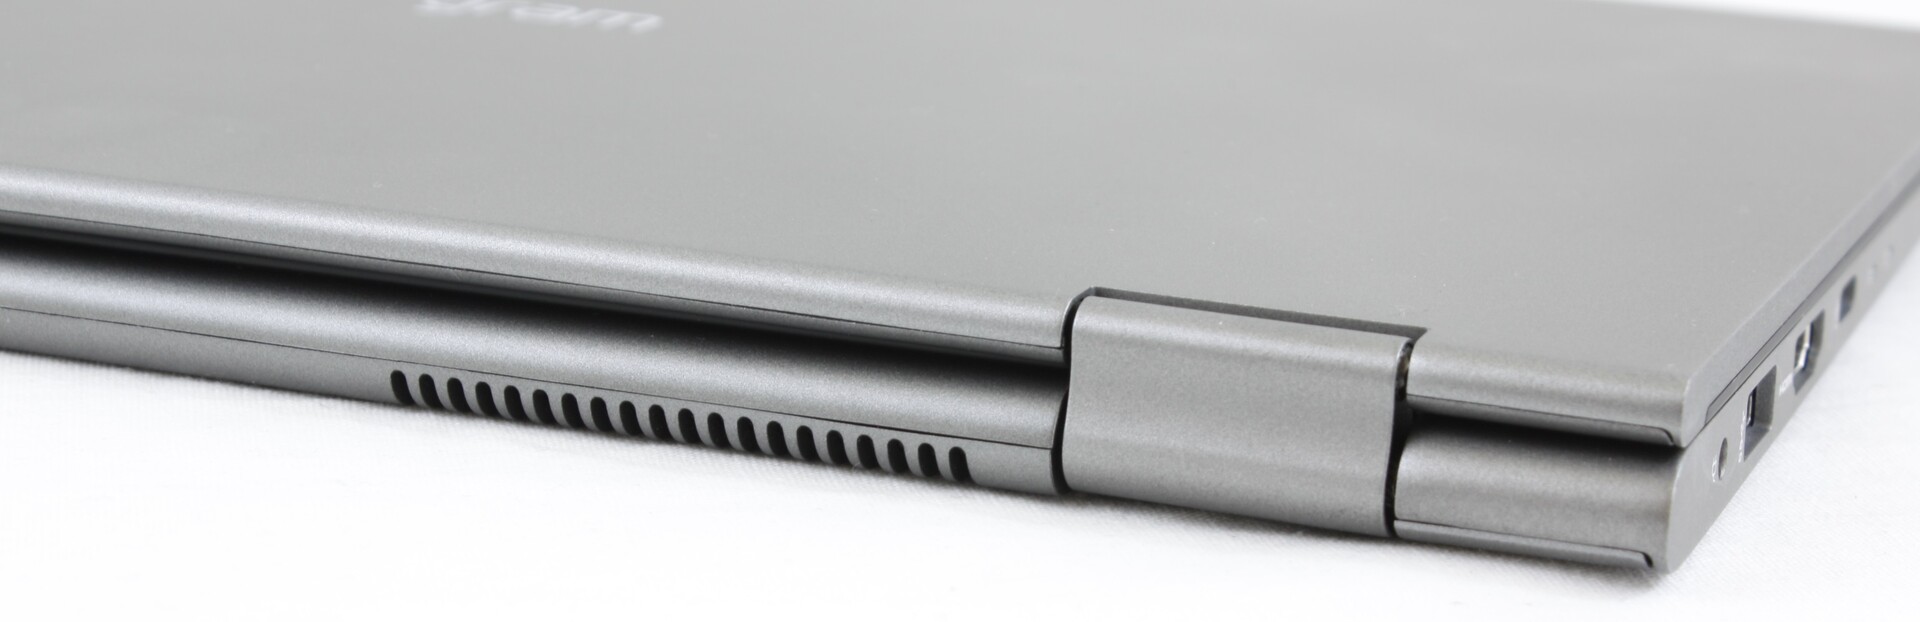
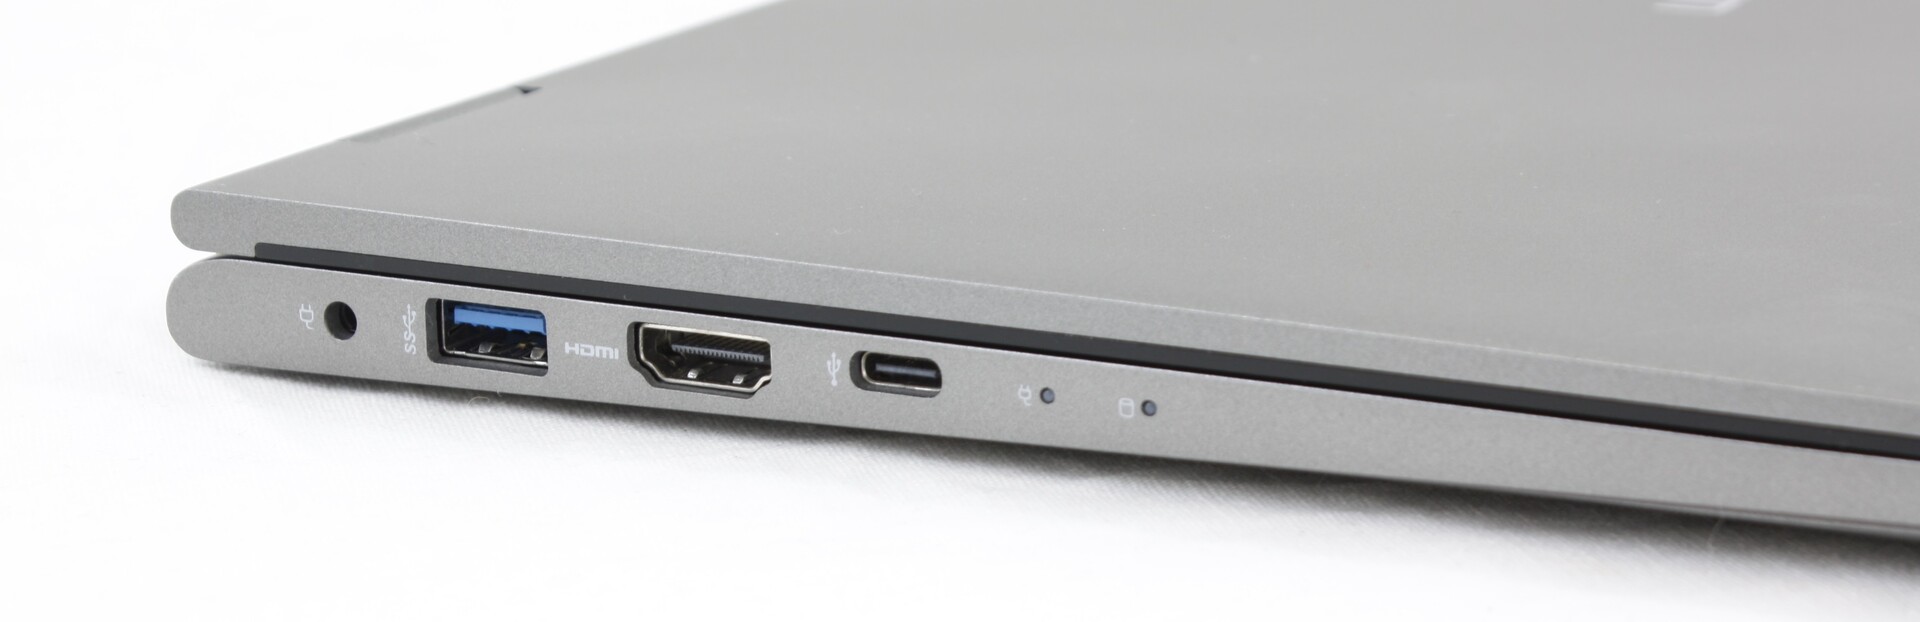
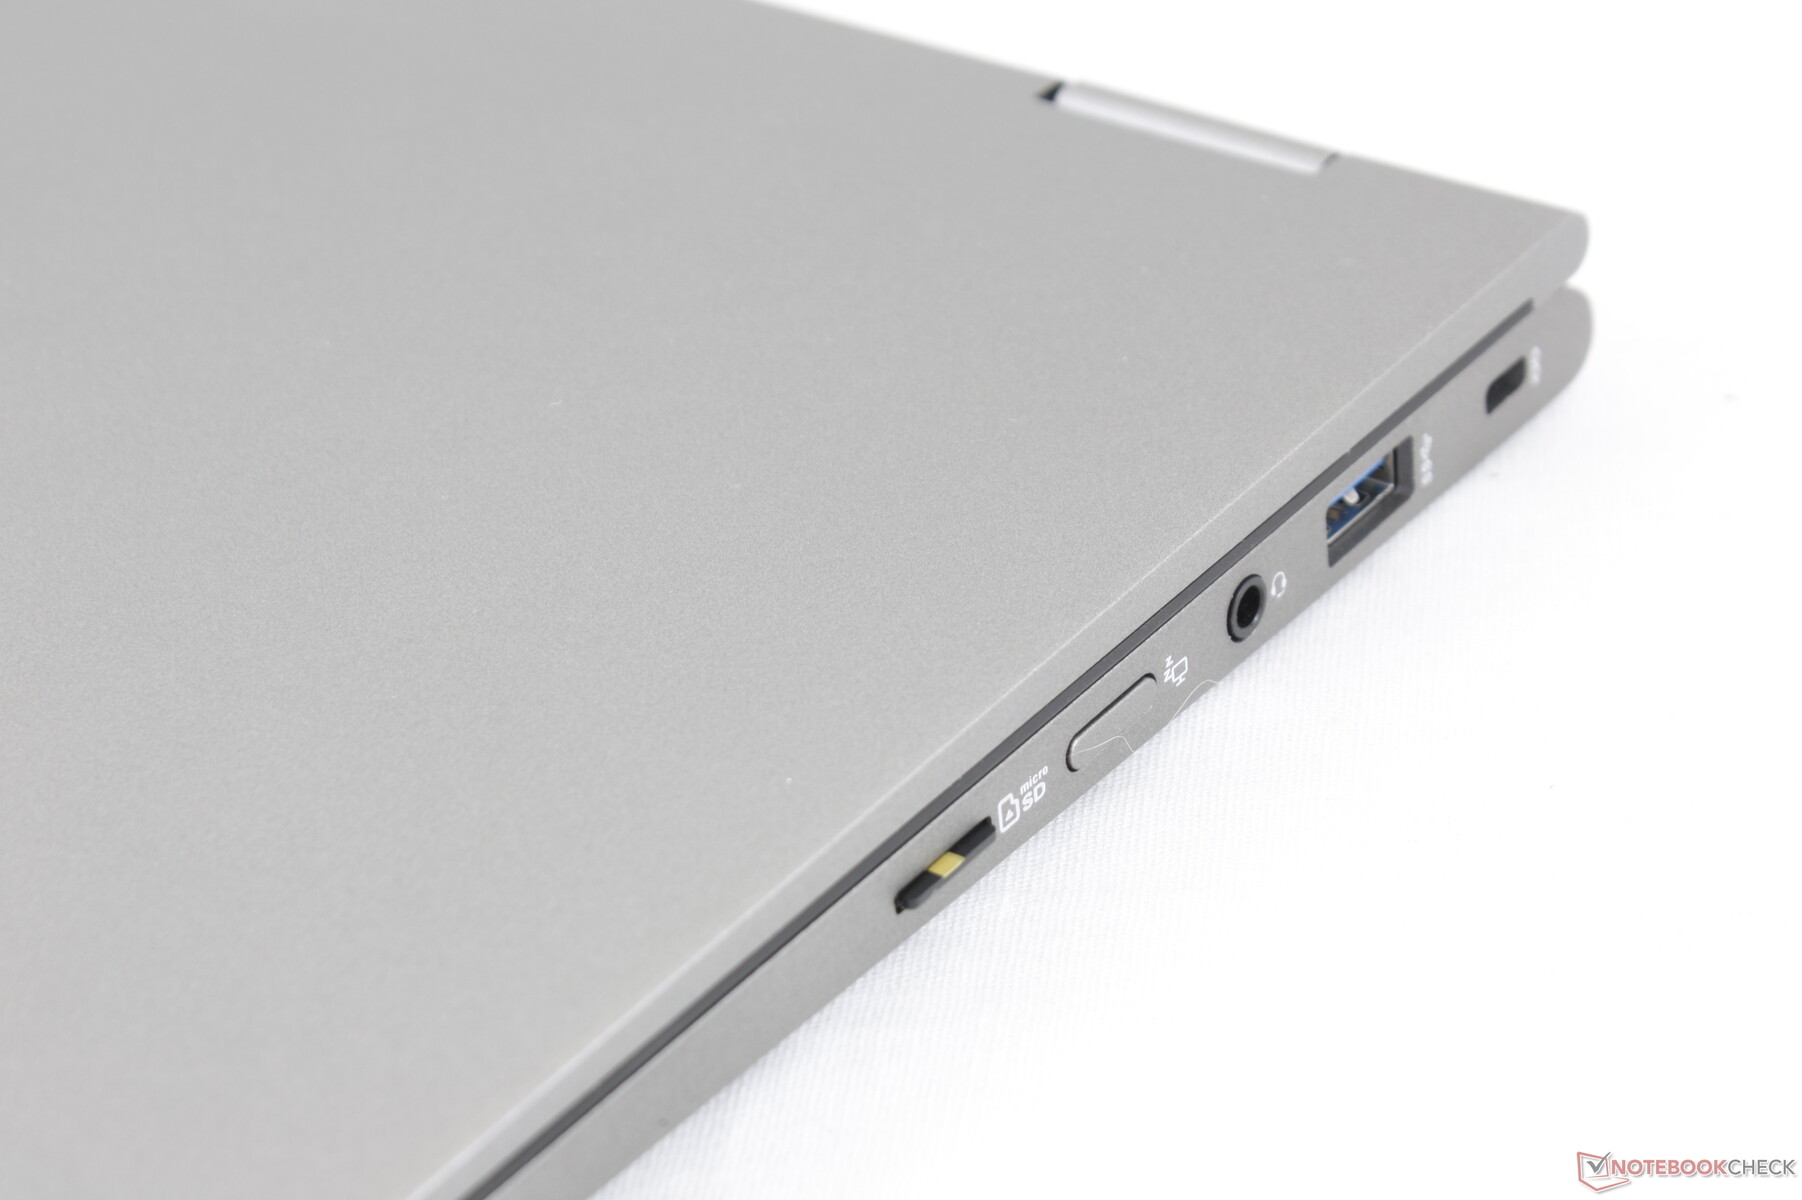
Connectivity
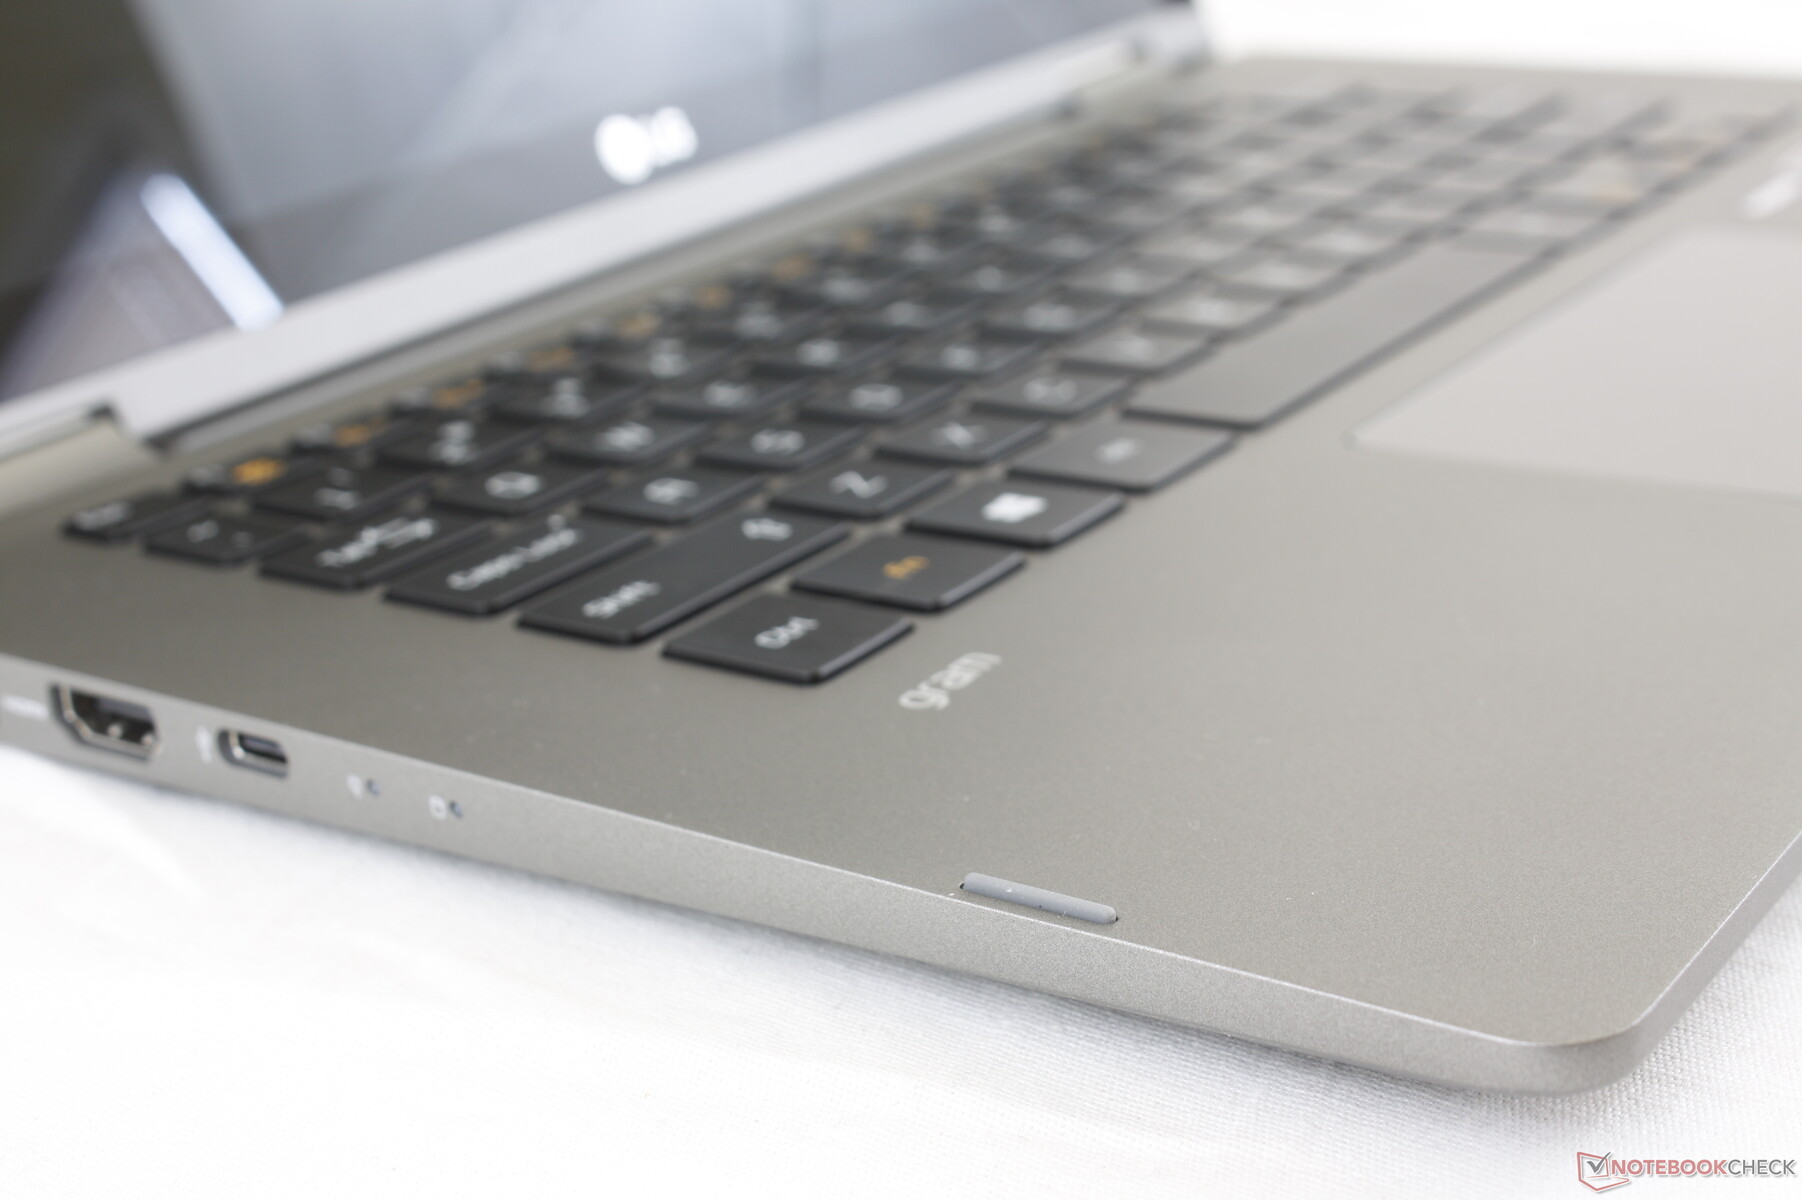
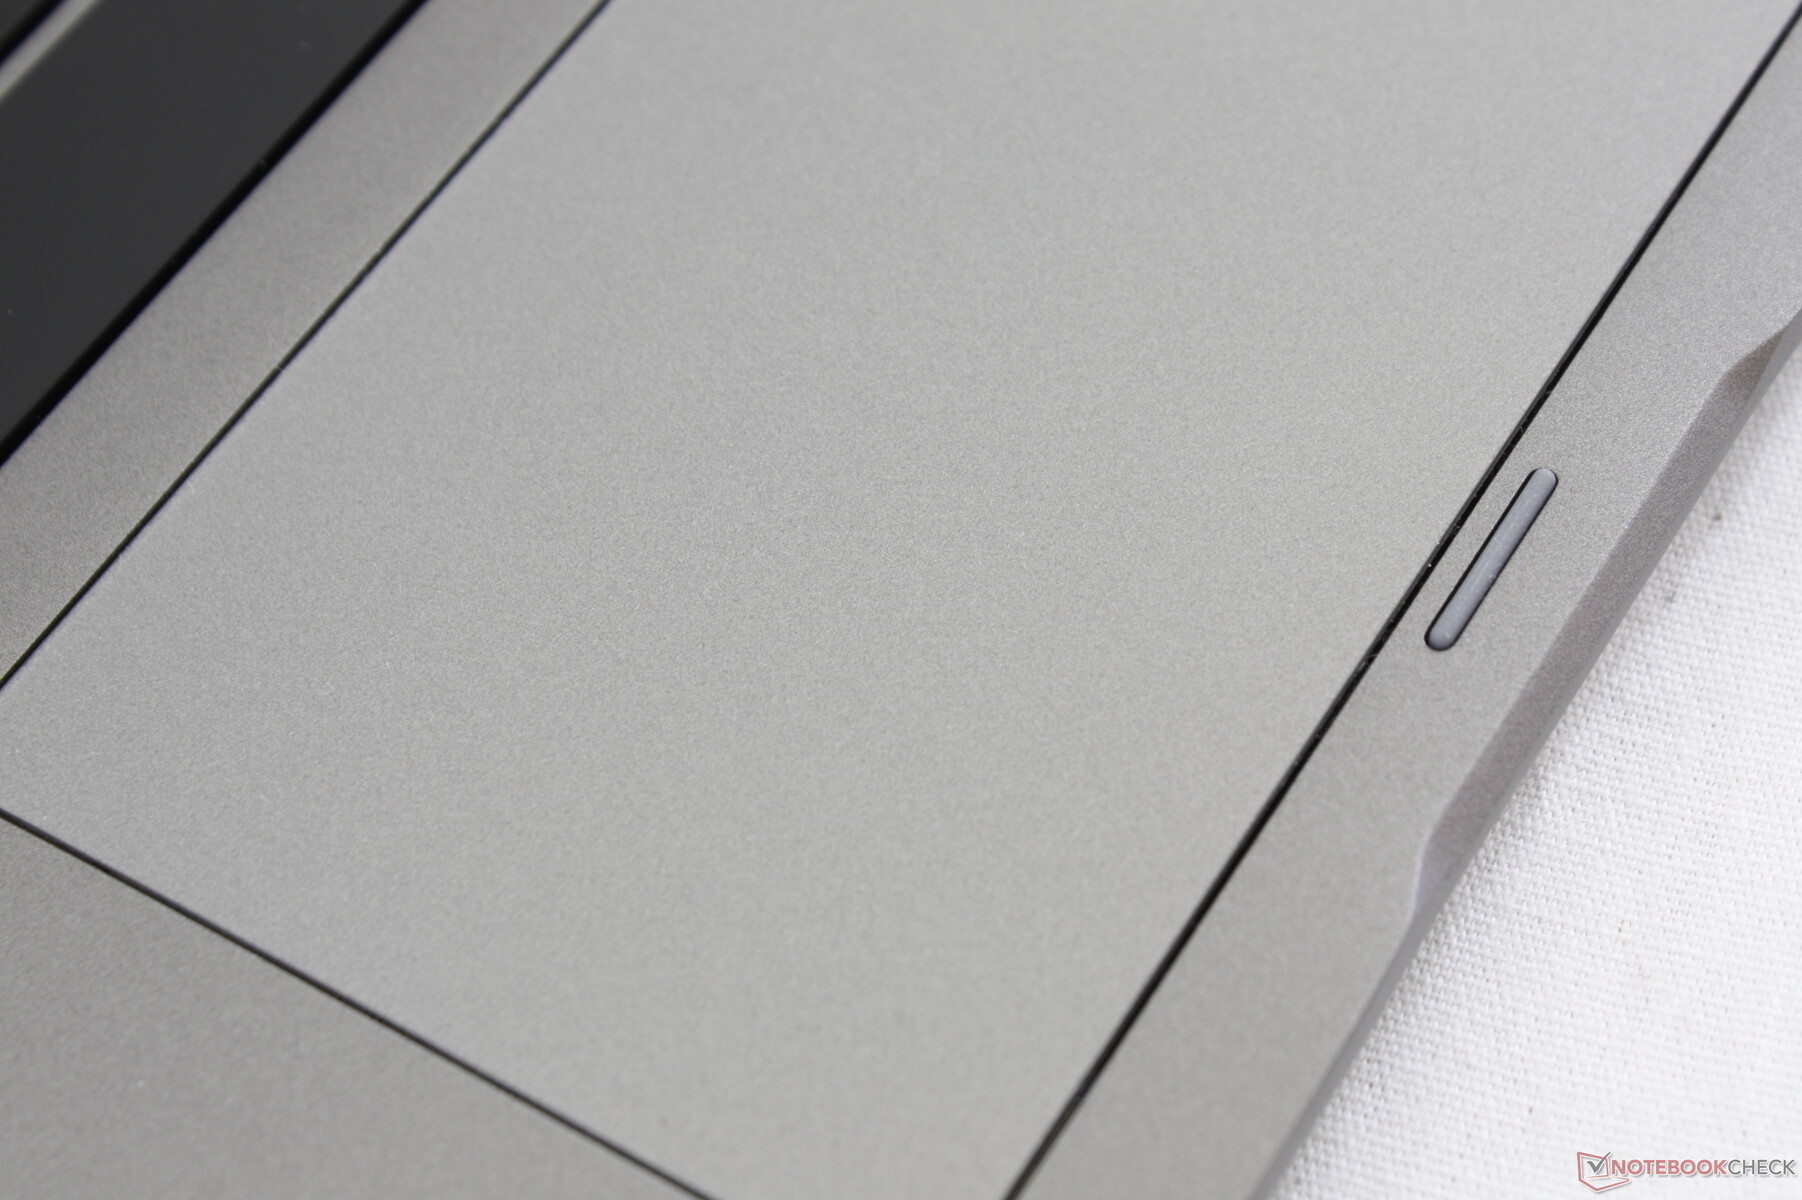
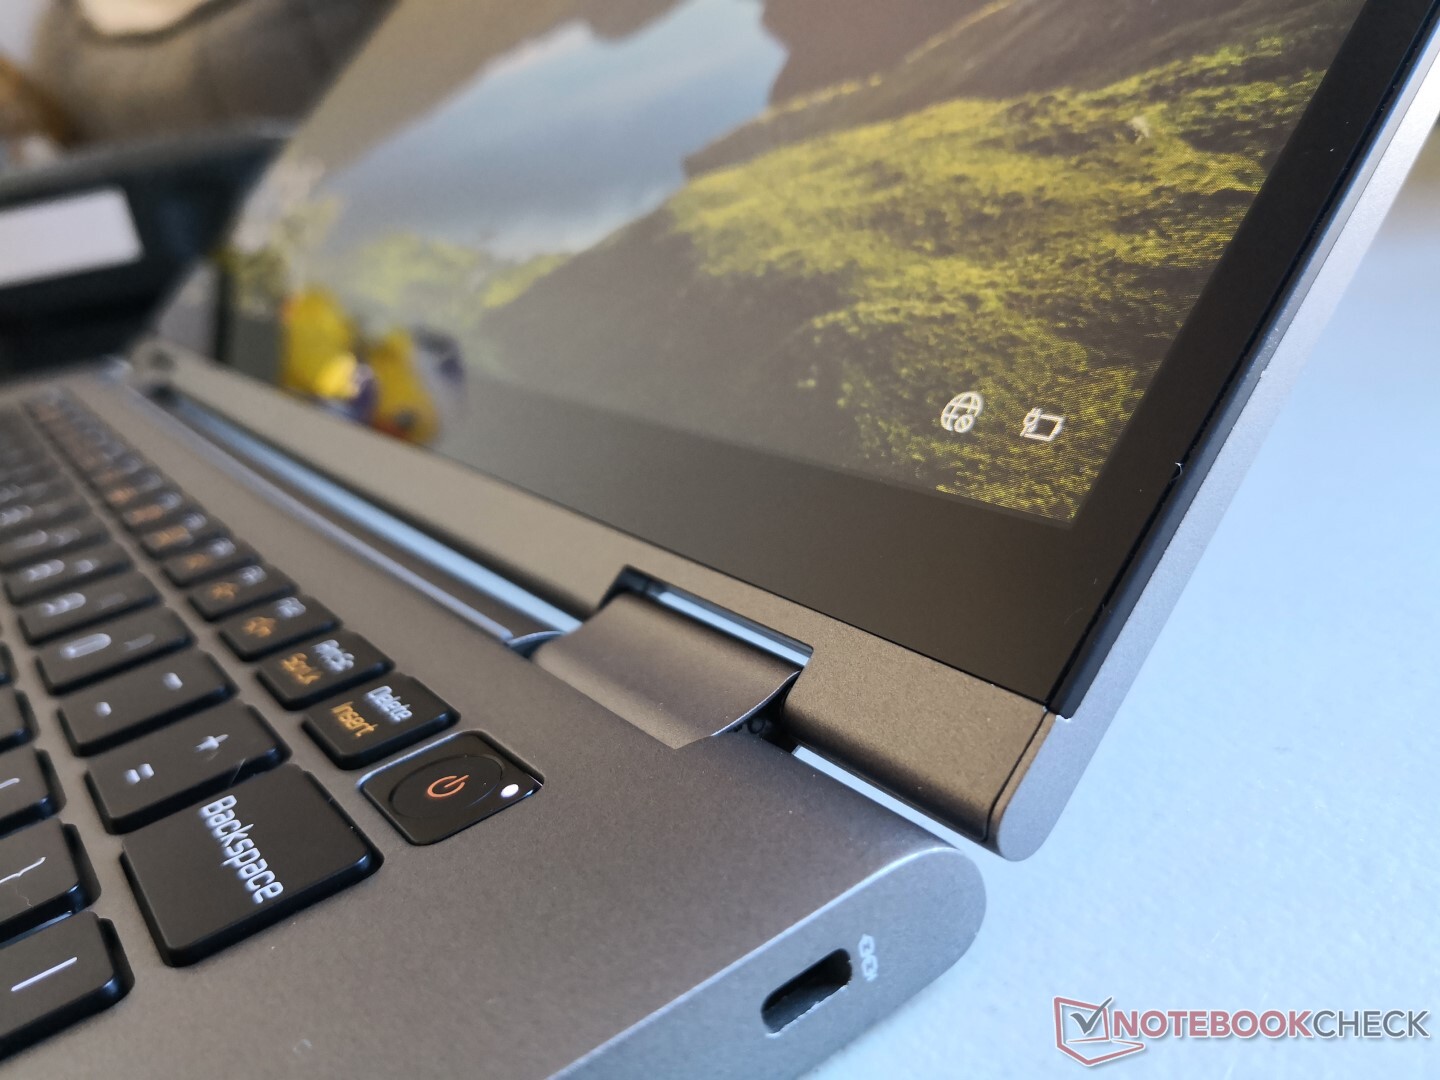
Port options and positioning are identical to the clamshell Gram 14 save for the addition of a Sleep button along the right edge. It's not a very useful feature especially since we can't find a way to customize the button.
One major connectivity update from last year's Gram 14T990 is the addition of Thunderbolt 3 support as exemplified by the huge Thunderbolt sticker on the right palm rest.
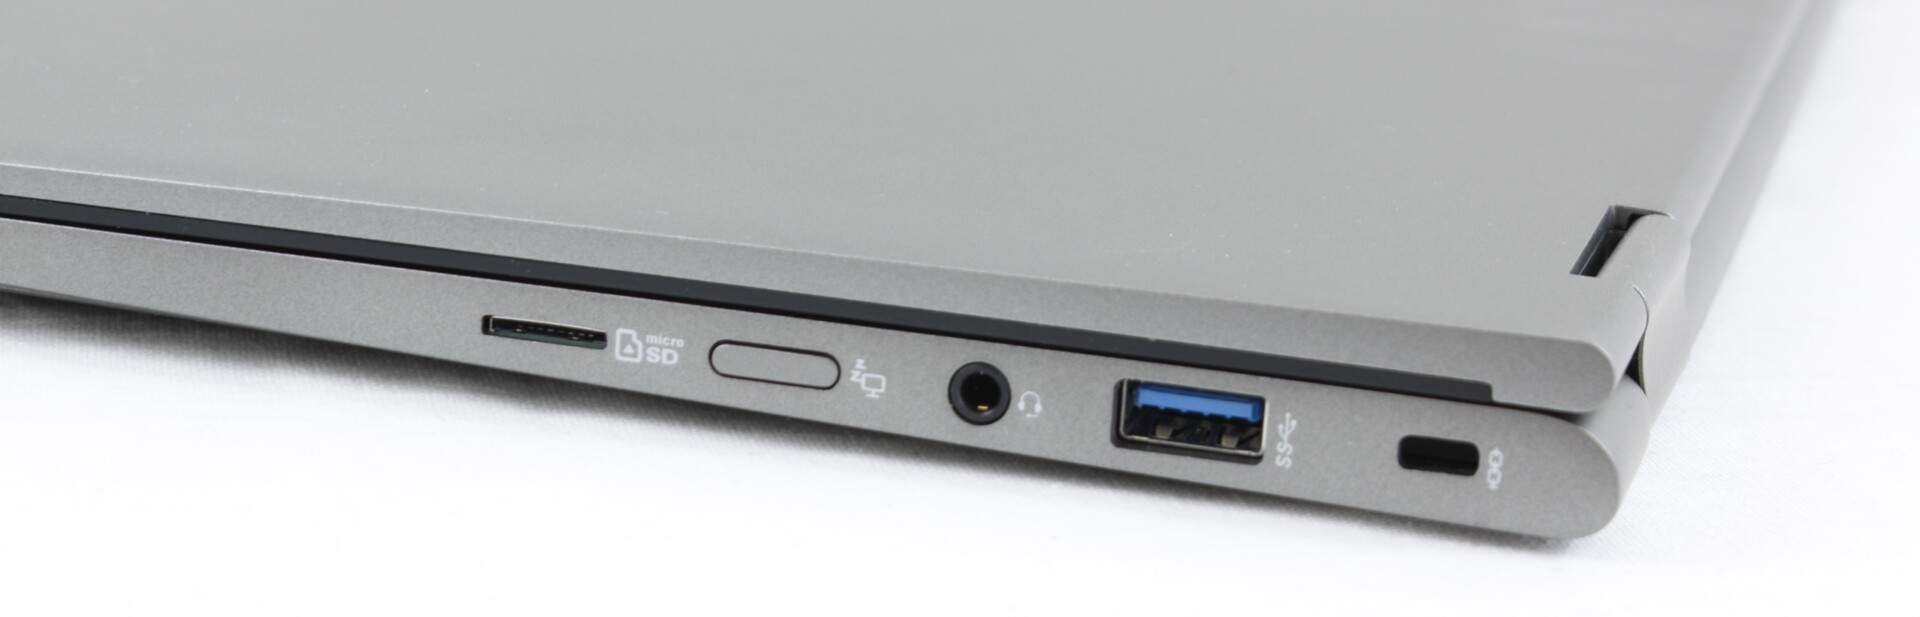
SD Card Reader
The spring-loaded MicroSD reader offers average transfer rates of ~80 MB/s. Moving 1 GB worth of pictures from our UHS-II test card to desktop takes about 14 seconds compared to half that on the XPS 13.
| SD Card Reader | |
| average JPG Copy Test (av. of 3 runs) | |
| Dell XPS 13 7390 2-in-1 Core i7 (Toshiba Exceria Pro M501 64 GB UHS-II) | |
| LG Gram 14T90N (Toshiba Exceria Pro M501 64 GB UHS-II) | |
| LG Gram 14Z980-U.AAW5U1 (Toshiba Exceria Pro M501 microSDXC 64GB) | |
| Asus ZenBook 14 UM431DA-AM020T (Toshiba Exceria Pro SDXC 64 GB UHS-II) | |
| maximum AS SSD Seq Read Test (1GB) | |
| Dell XPS 13 7390 2-in-1 Core i7 (Toshiba Exceria Pro M501 64 GB UHS-II) | |
| LG Gram 14Z980-U.AAW5U1 (Toshiba Exceria Pro M501 microSDXC 64GB) | |
| LG Gram 14T90N (Toshiba Exceria Pro M501 64 GB UHS-II) | |
| Asus ZenBook 14 UM431DA-AM020T (Toshiba Exceria Pro SDXC 64 GB UHS-II) | |
Communication
The Intel AX201 comes standard for Wi-Fi 6 and Bluetooth 5 compatibility. We're able to record real-world average transfer rates of 800 to 900 Mbps when standing one meter away from our Wi-Fi 6-enabled Netgear RAX200 router. Though slower than expected when compared to other Wi-Fi 6 laptops, we at least did not experience any connectivity issues.
Webcam

Maintenance
The bottom panel is difficult to remove because all screws are hidden underneath rubber feet. The pads themselves are also difficult to remove without careful tools and a steady hand. Based on disassembly guides for the identical Gram 14T990, however, the Gram 14 T90N will be nearly exactly the same under the hood including the single SODIMM slot and two M.2 2280 bays.
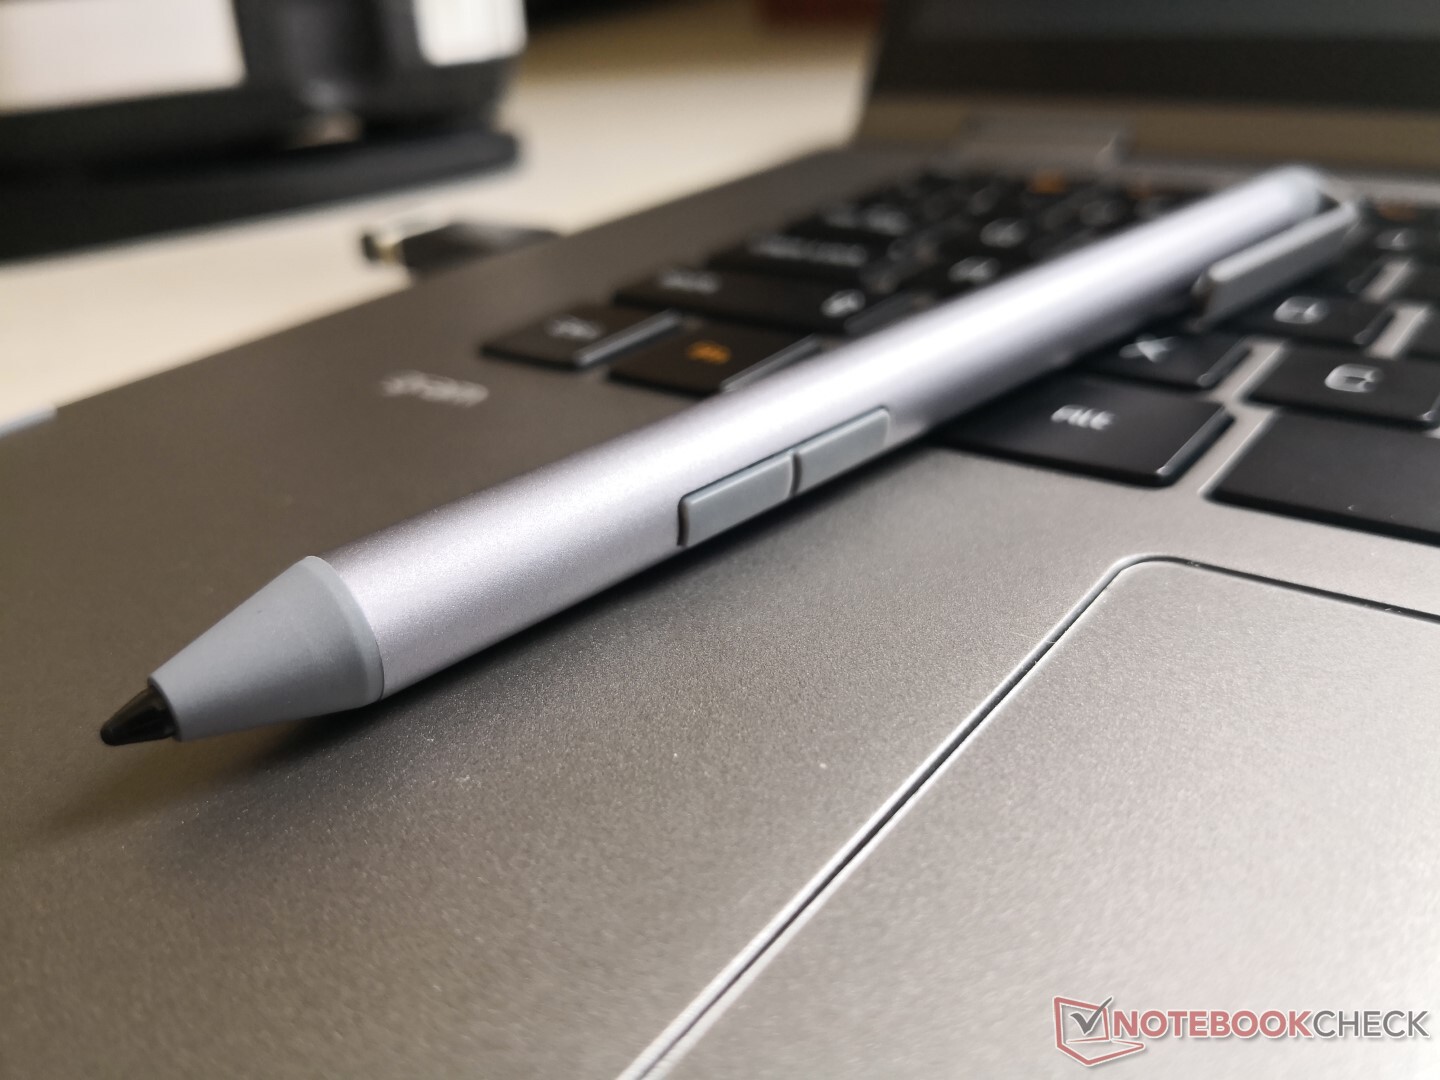
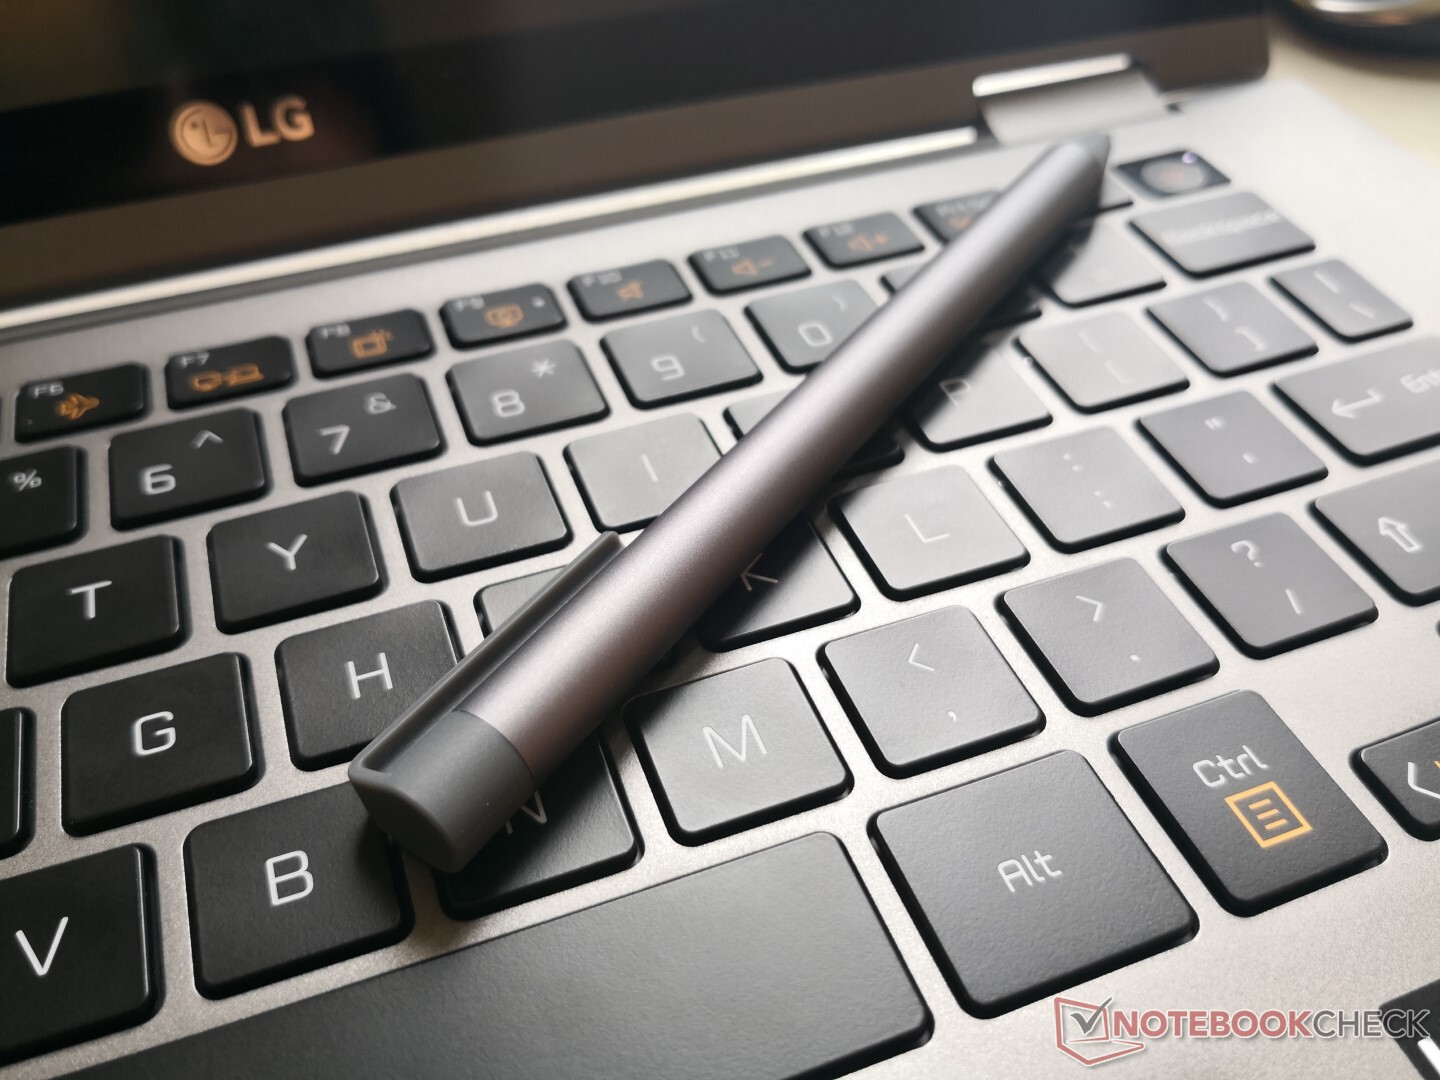
Accessories and Warranty
In-the-box extras include an active stylus and a USB Type-C to RJ-45 adapter. LG could have sweetened the deal even more by throwing in a faux leather sleeve. The stylus is thinner than the Microsoft Surface Pen and so it can be difficult to grip for larger hands.
The standard one-year limited warranty applies
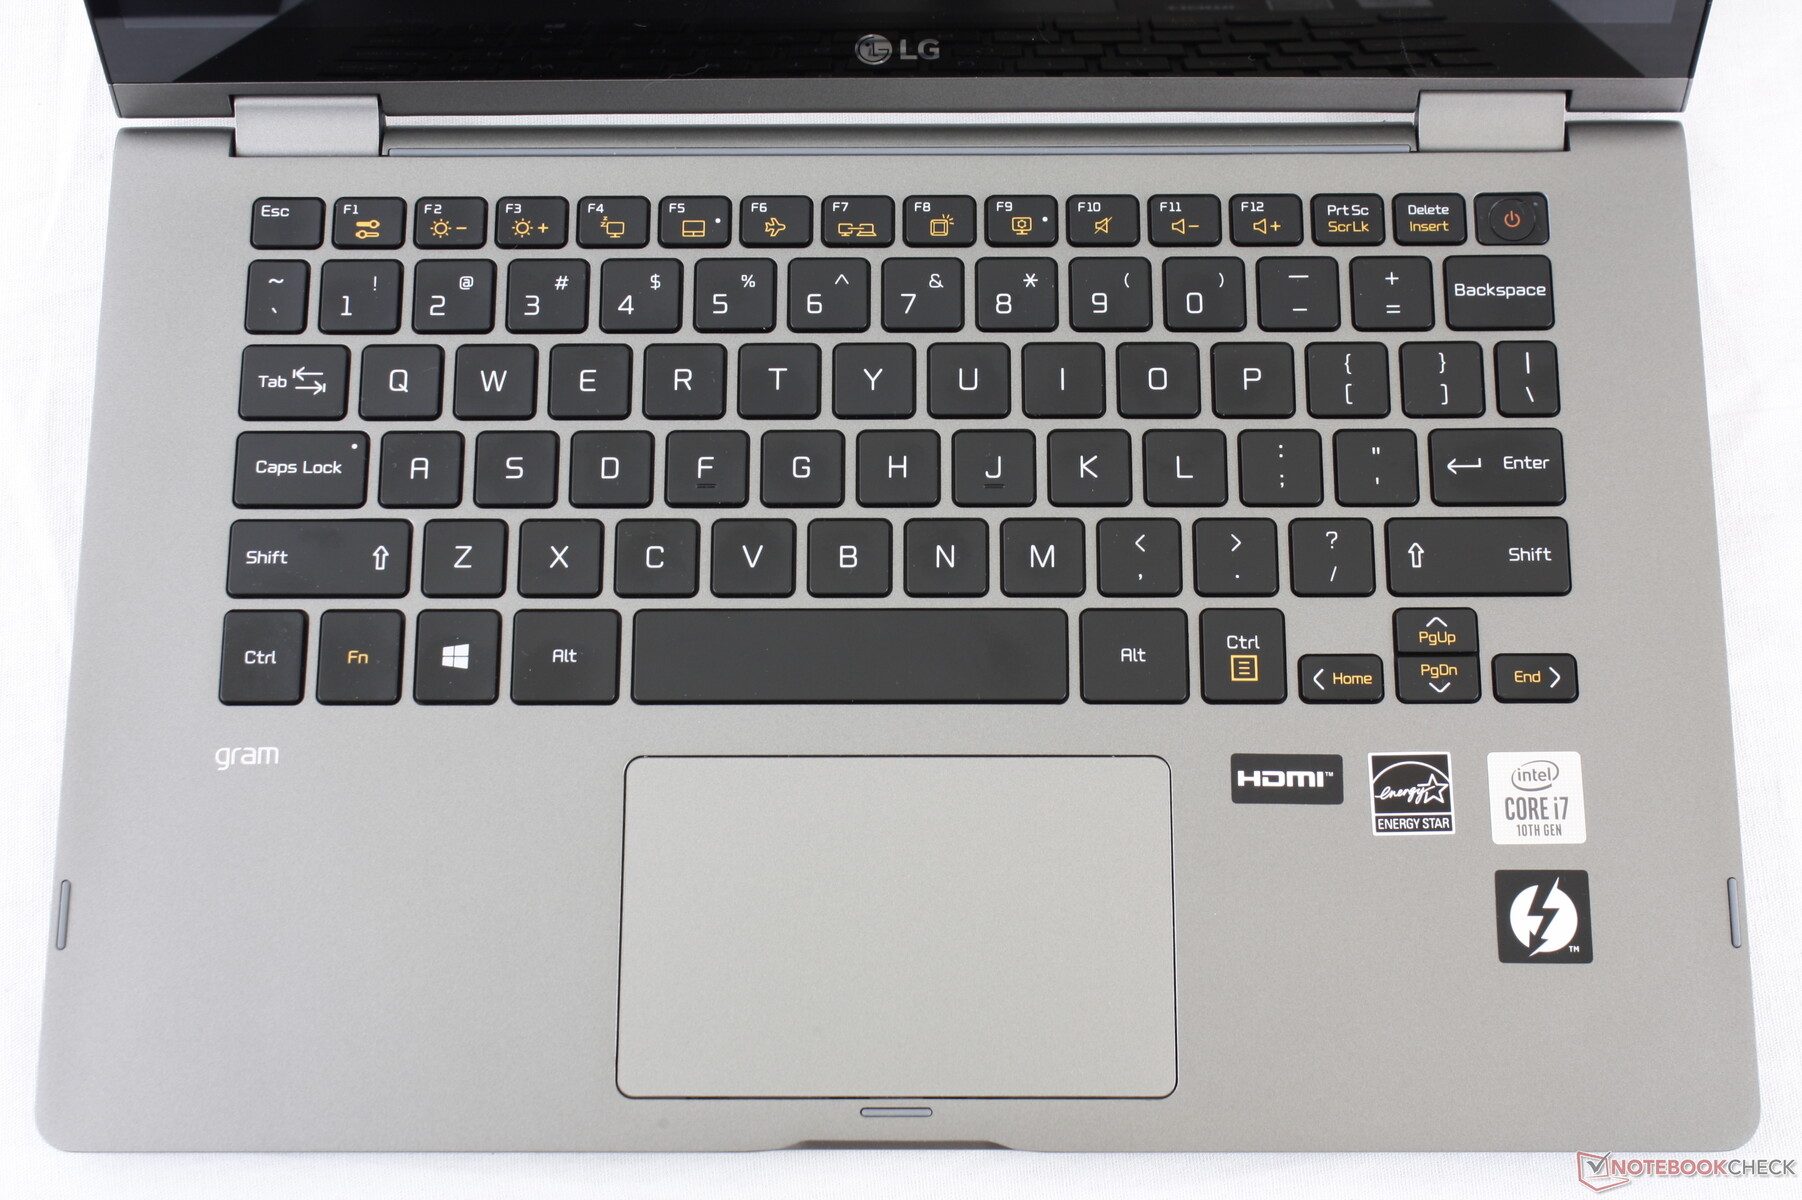
Input Devices
Keyboard
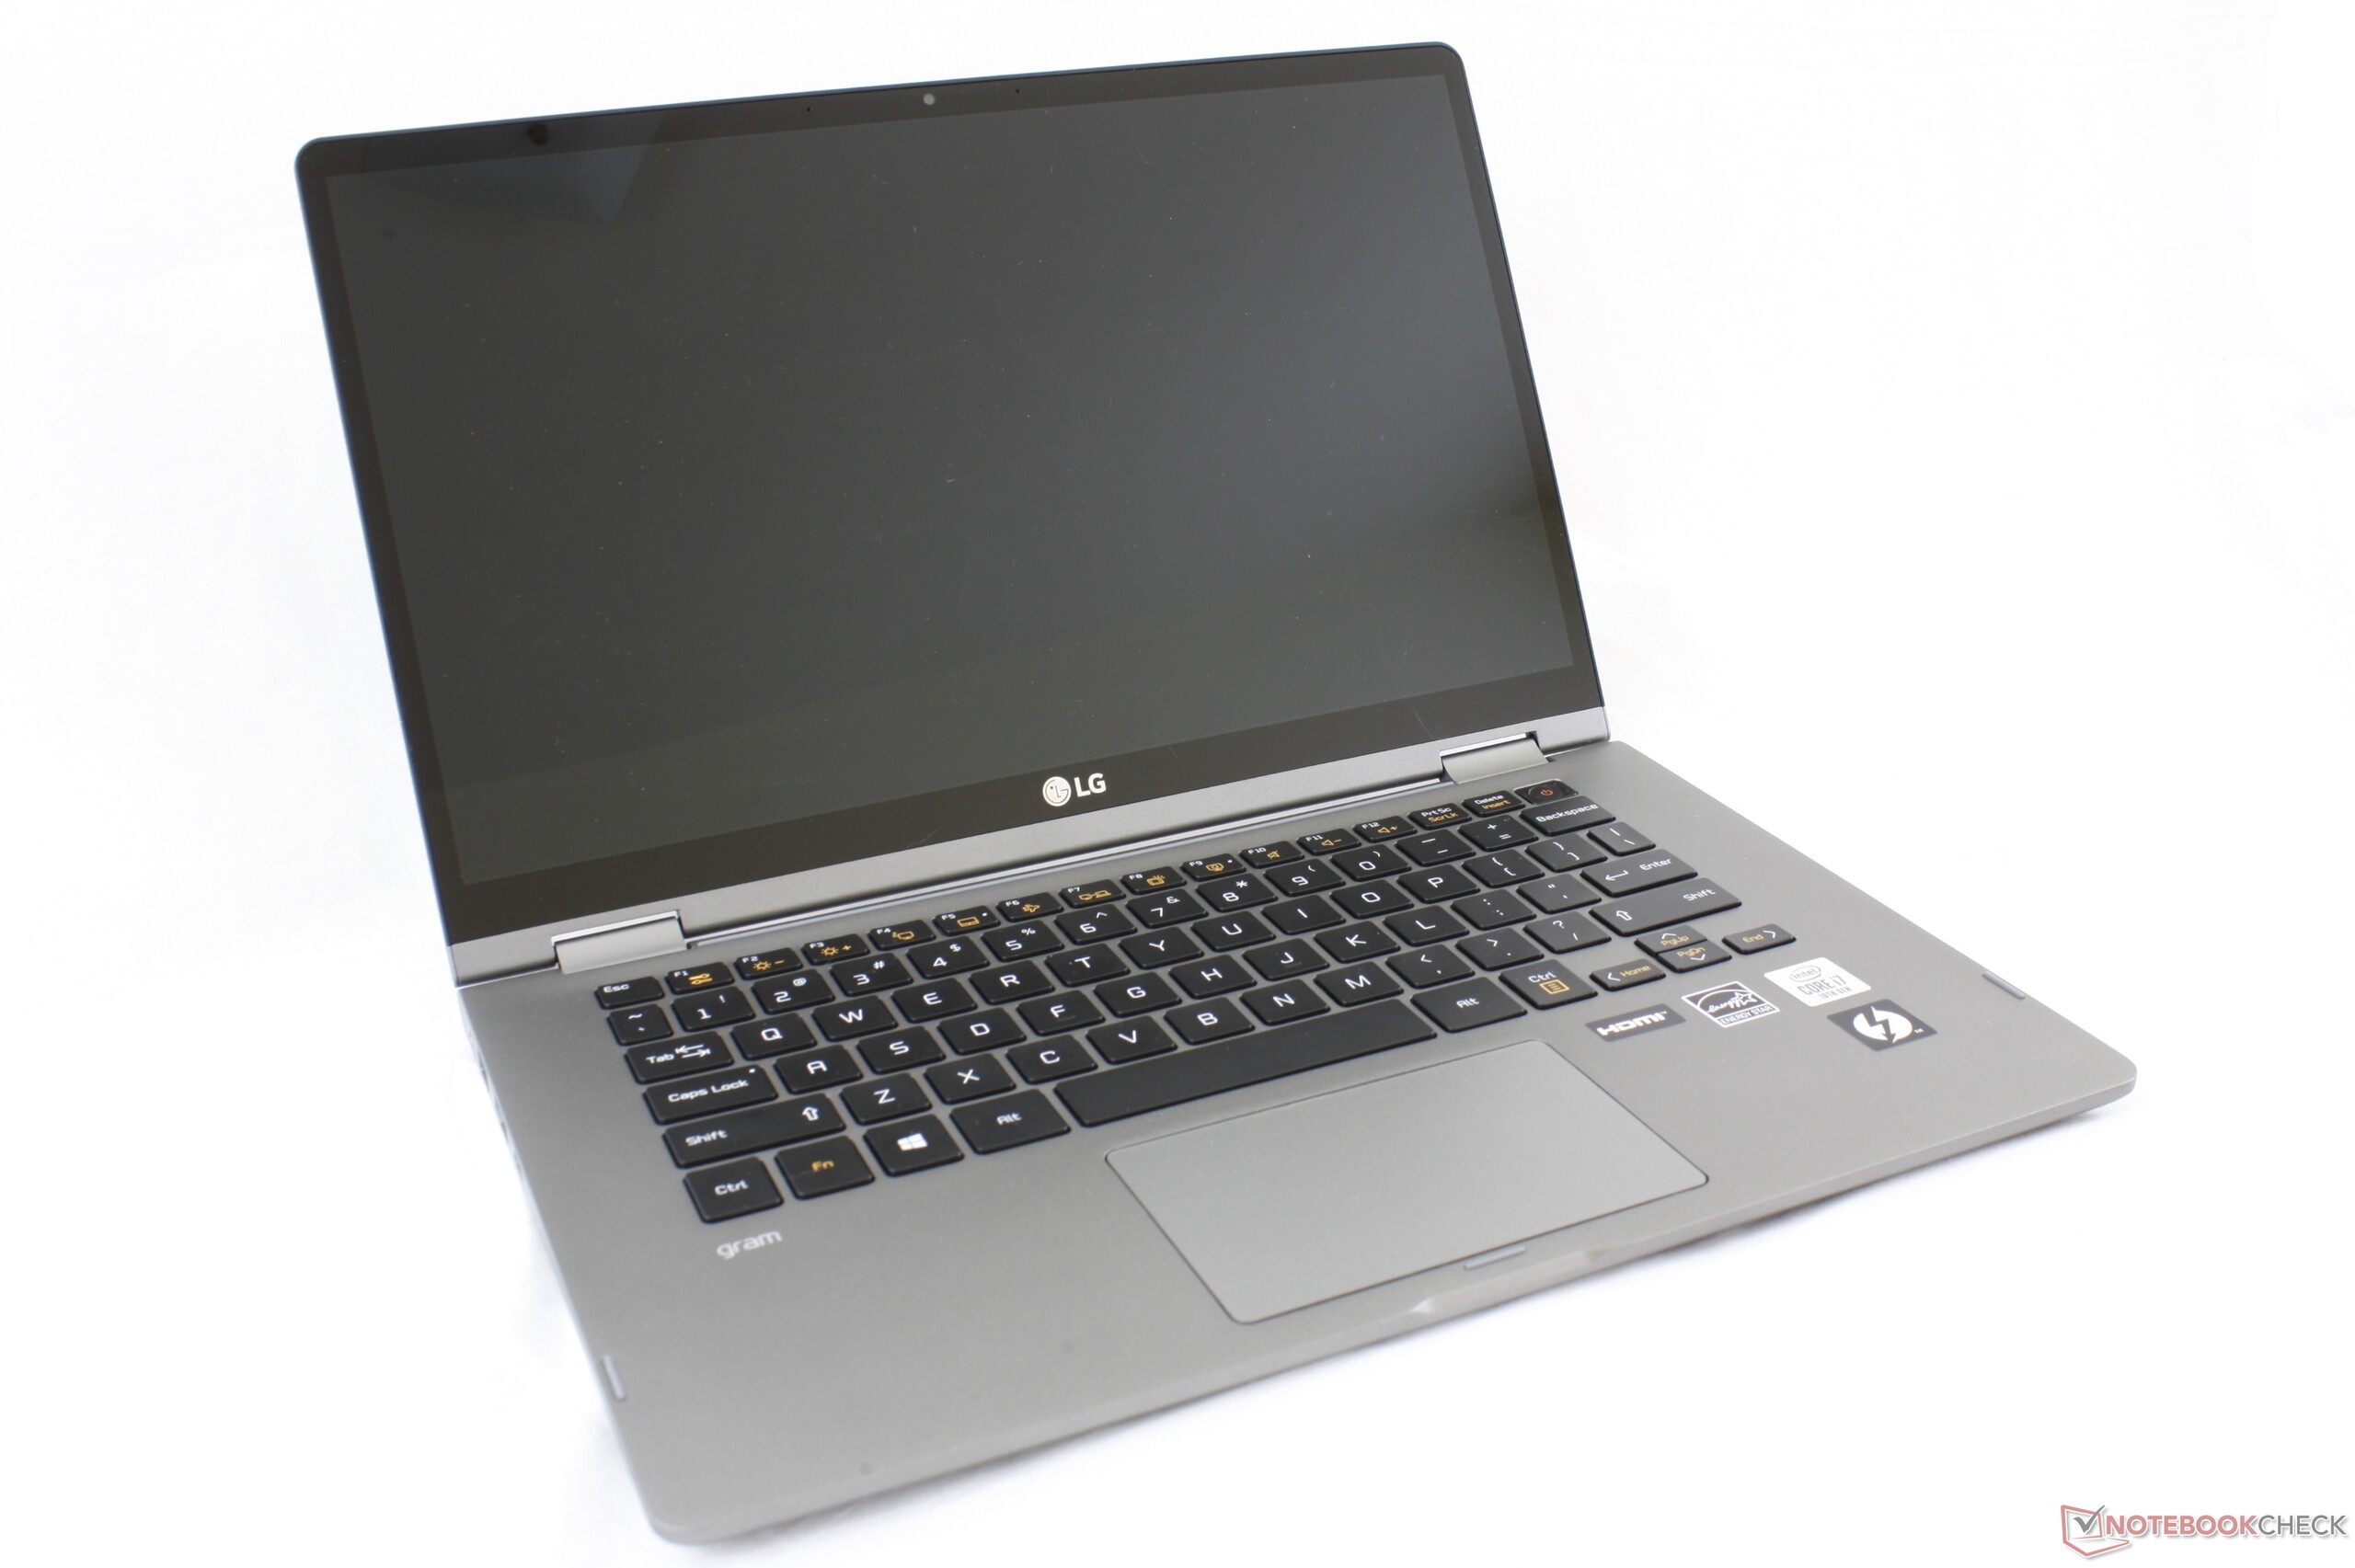
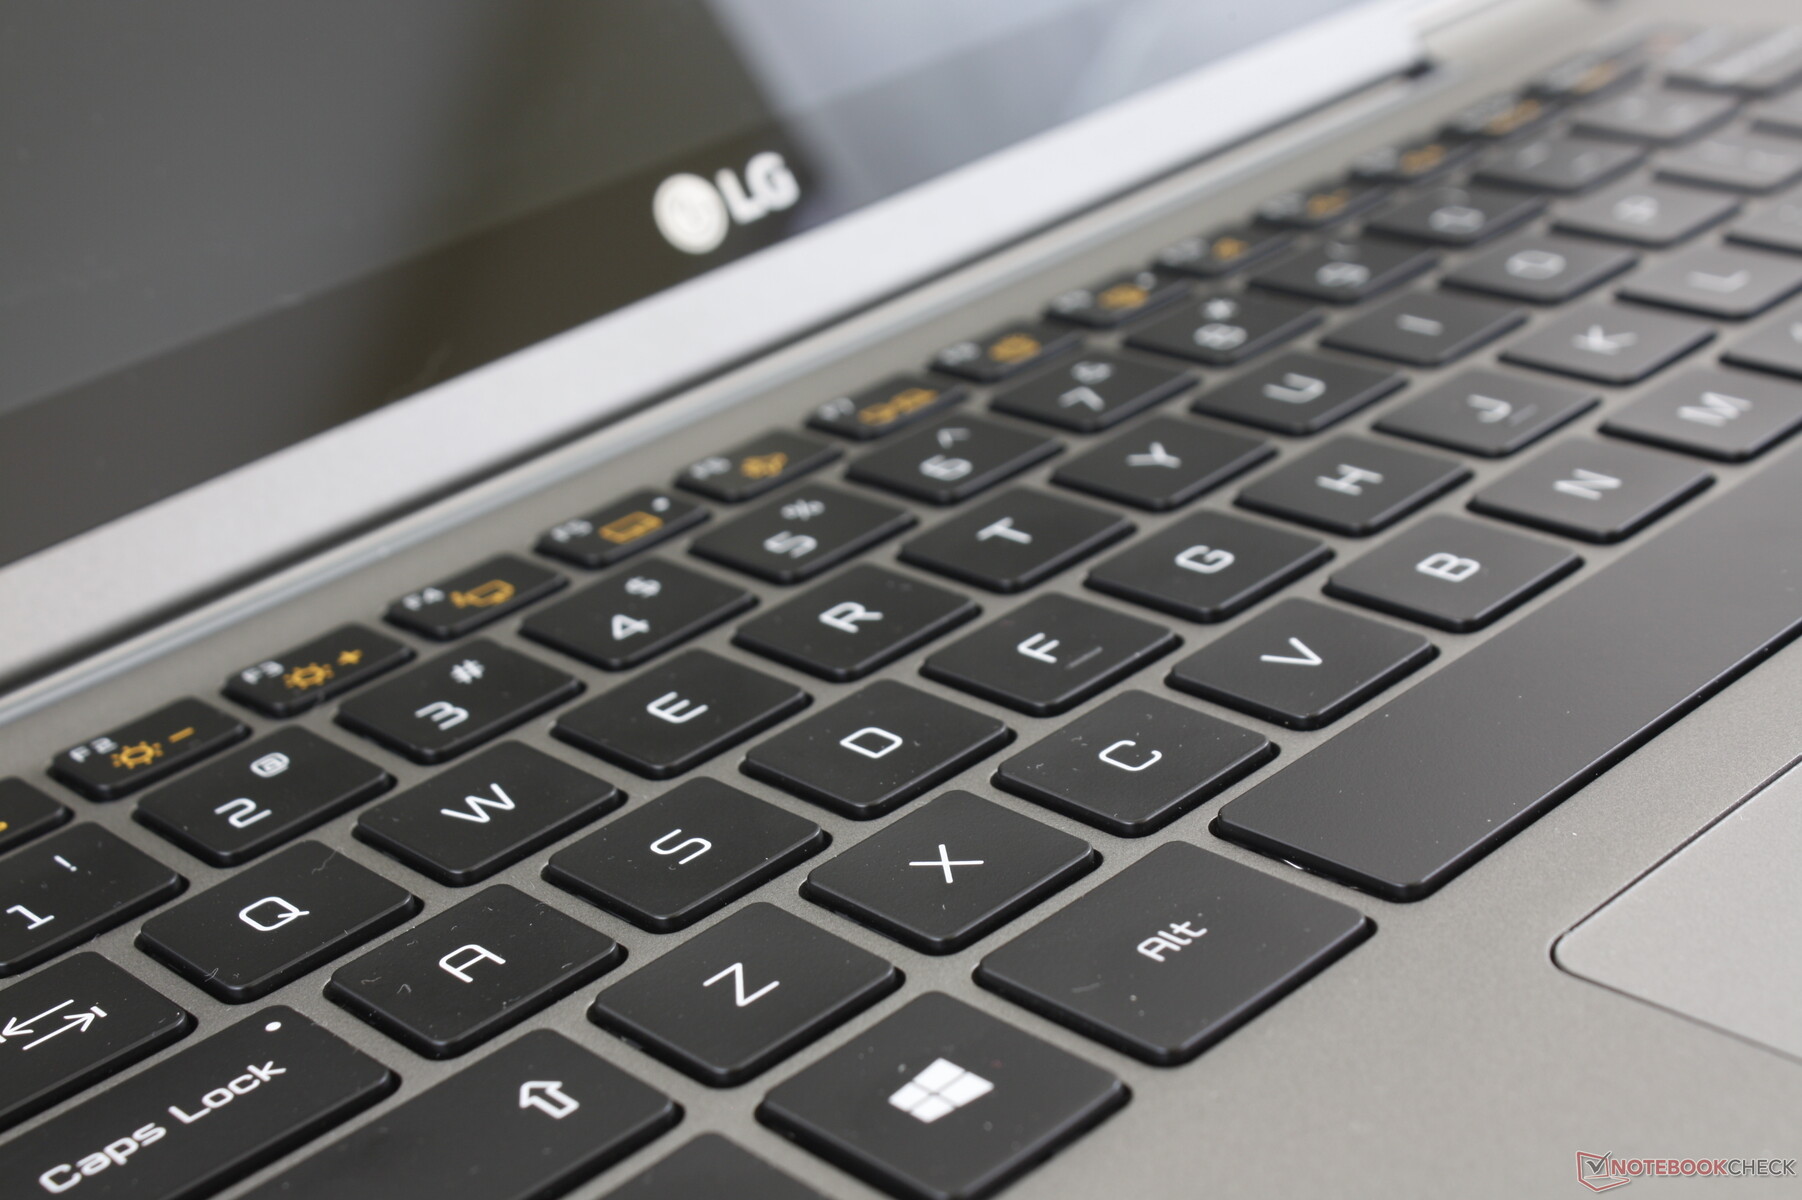
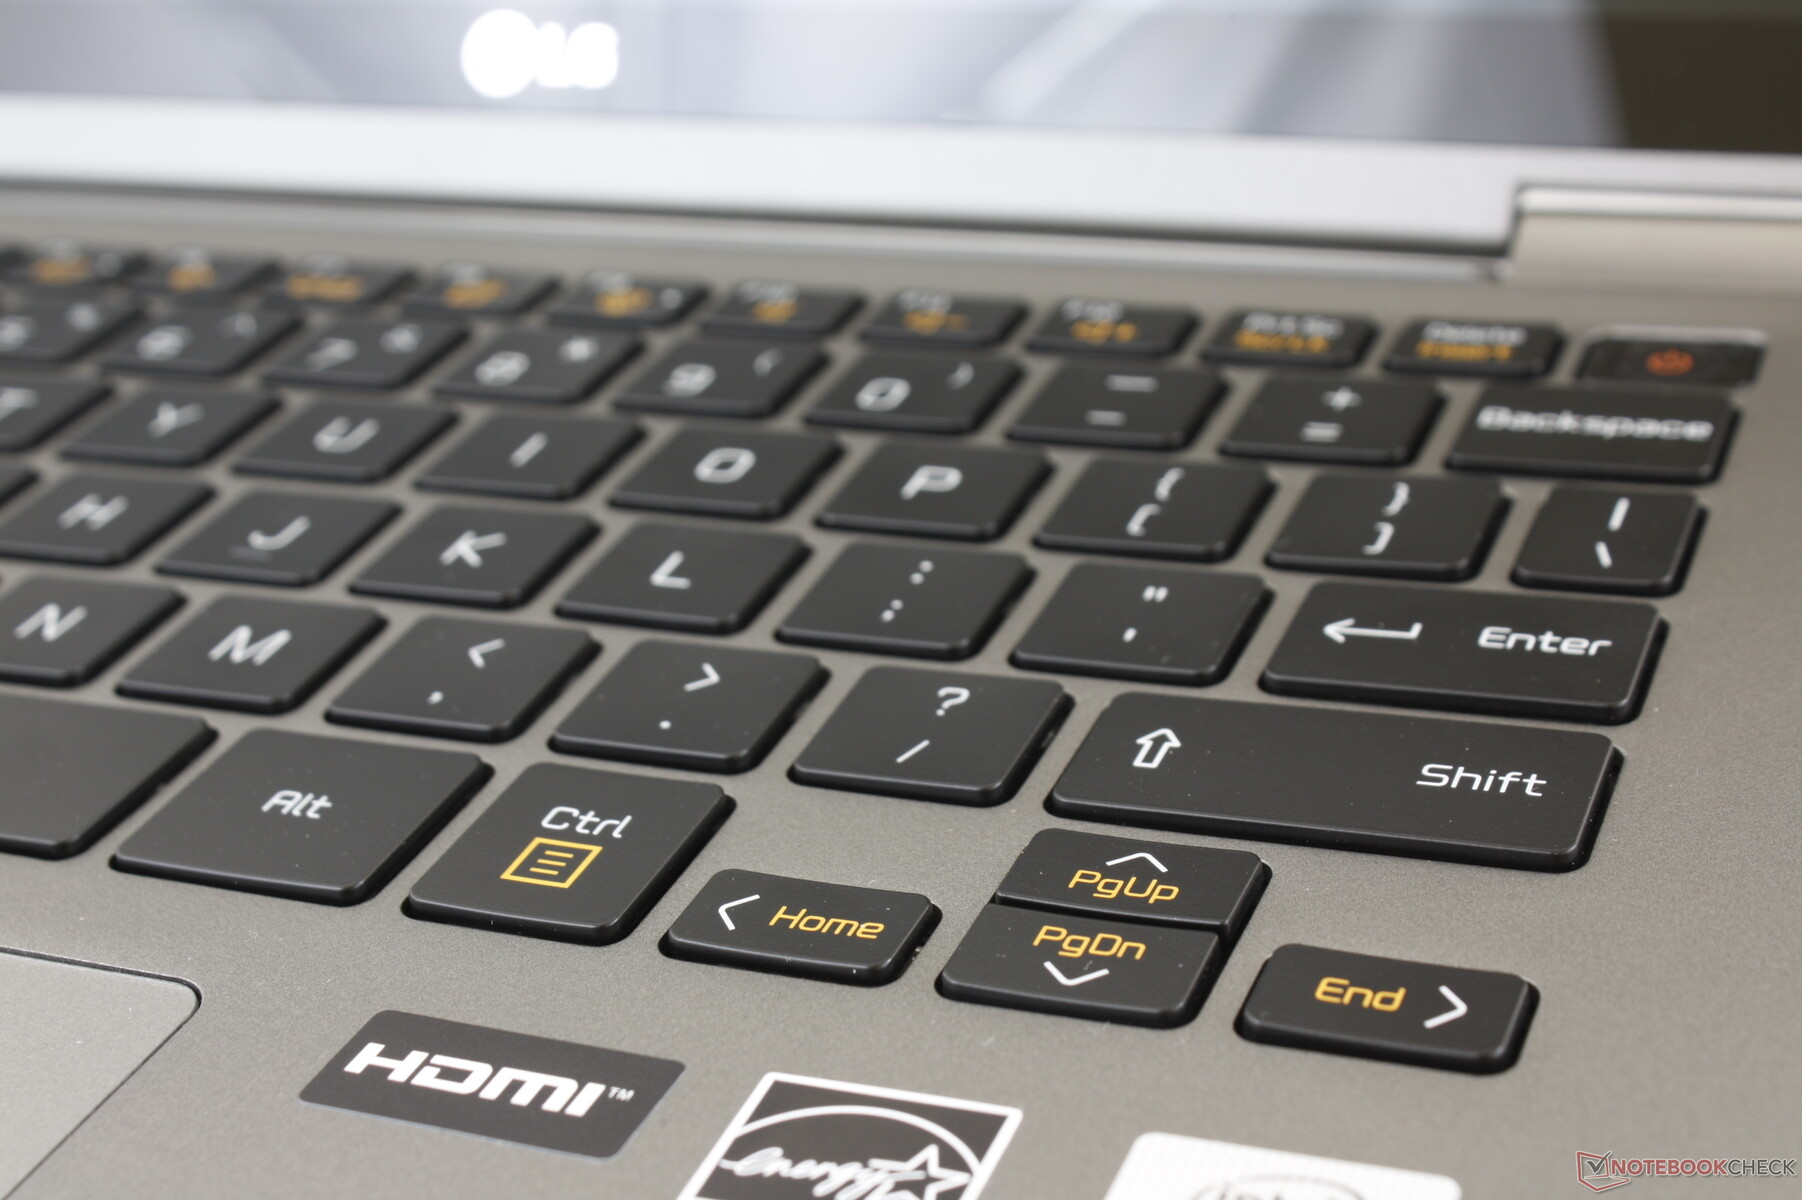
The keyboard remains identical to the 13.3-inch Gram 13 down to the size, layout, and feel. Feedback is satisfactory but weaker when compared to the keys on the HP Spectre 13 or XPS 13 7390 2-in-1. Clatter is minimal for a quiet typing experience. For future revisions, we would like to see larger Enter keys and Directional keys and dedicated auxiliary keys for the microphone, webcam, and volume control.
Touchpad
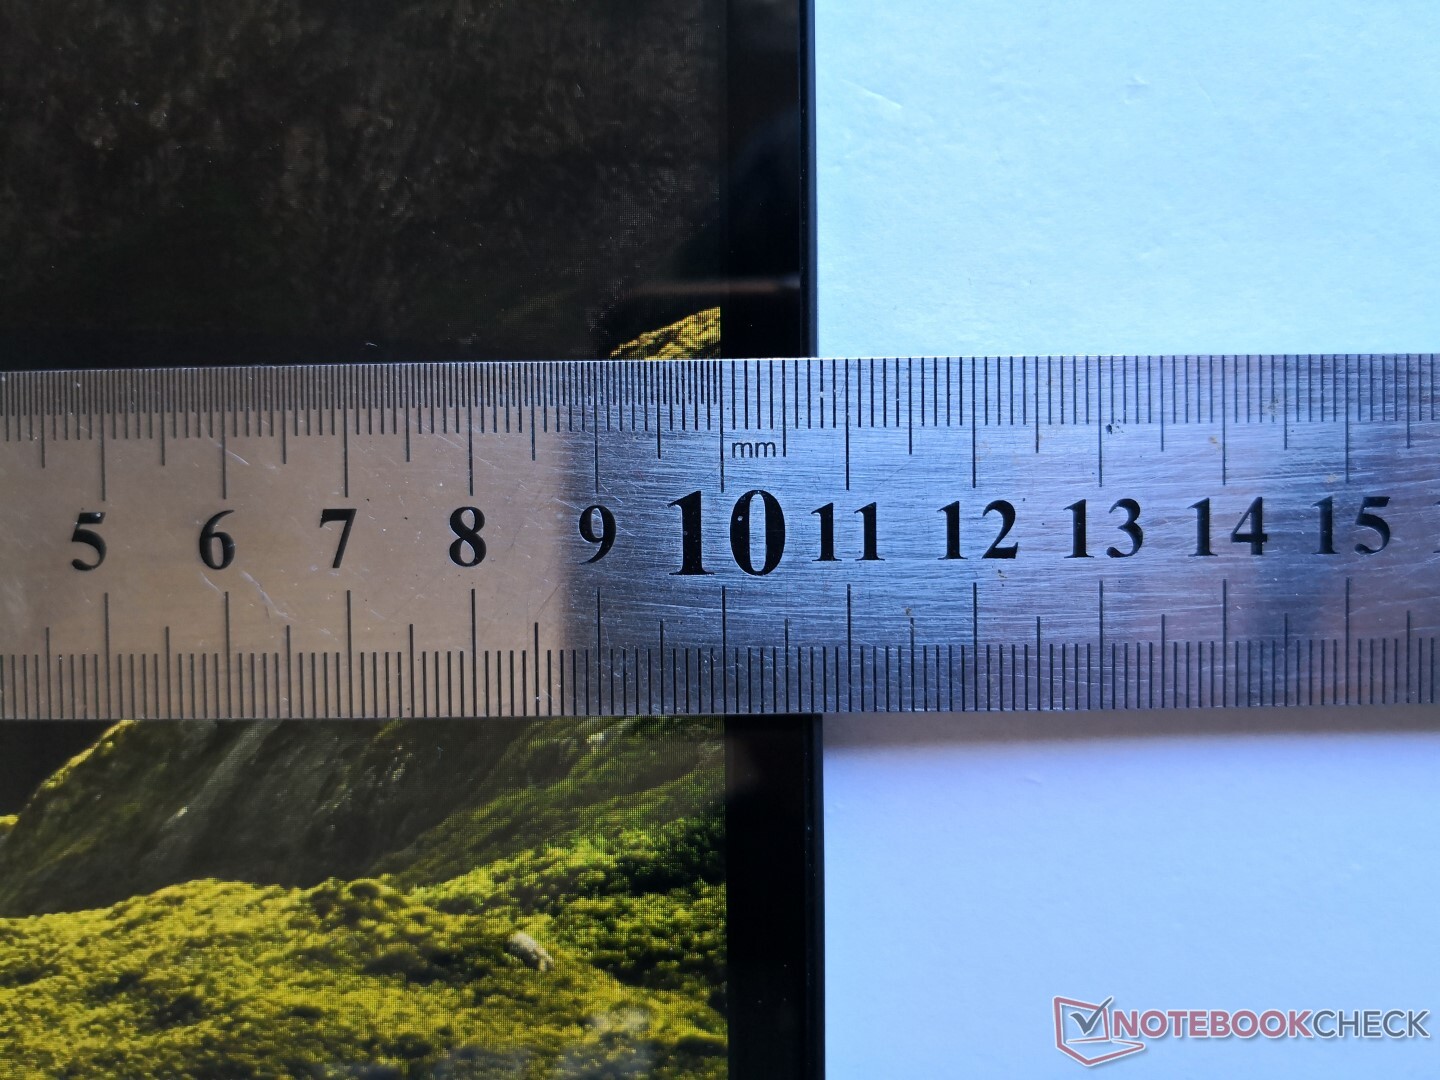
The Precision-enabled clickpad is actually slightly smaller than the clickpad on the Gram 14 clamshell (10.5 x 6.5 cm vs. 10.5 x 7 cm). Nonetheless, cursor movement is smooth, reliable and responsive with no jumping or input issues. There is some stickiness if moving at very slow speeds which is common on most clickpads.
Clicking on the trackpad surface is spongy with unsatisfying feedback. It takes a fair bit of force to input a single click meaning multiple clicks in succession can become tiring.
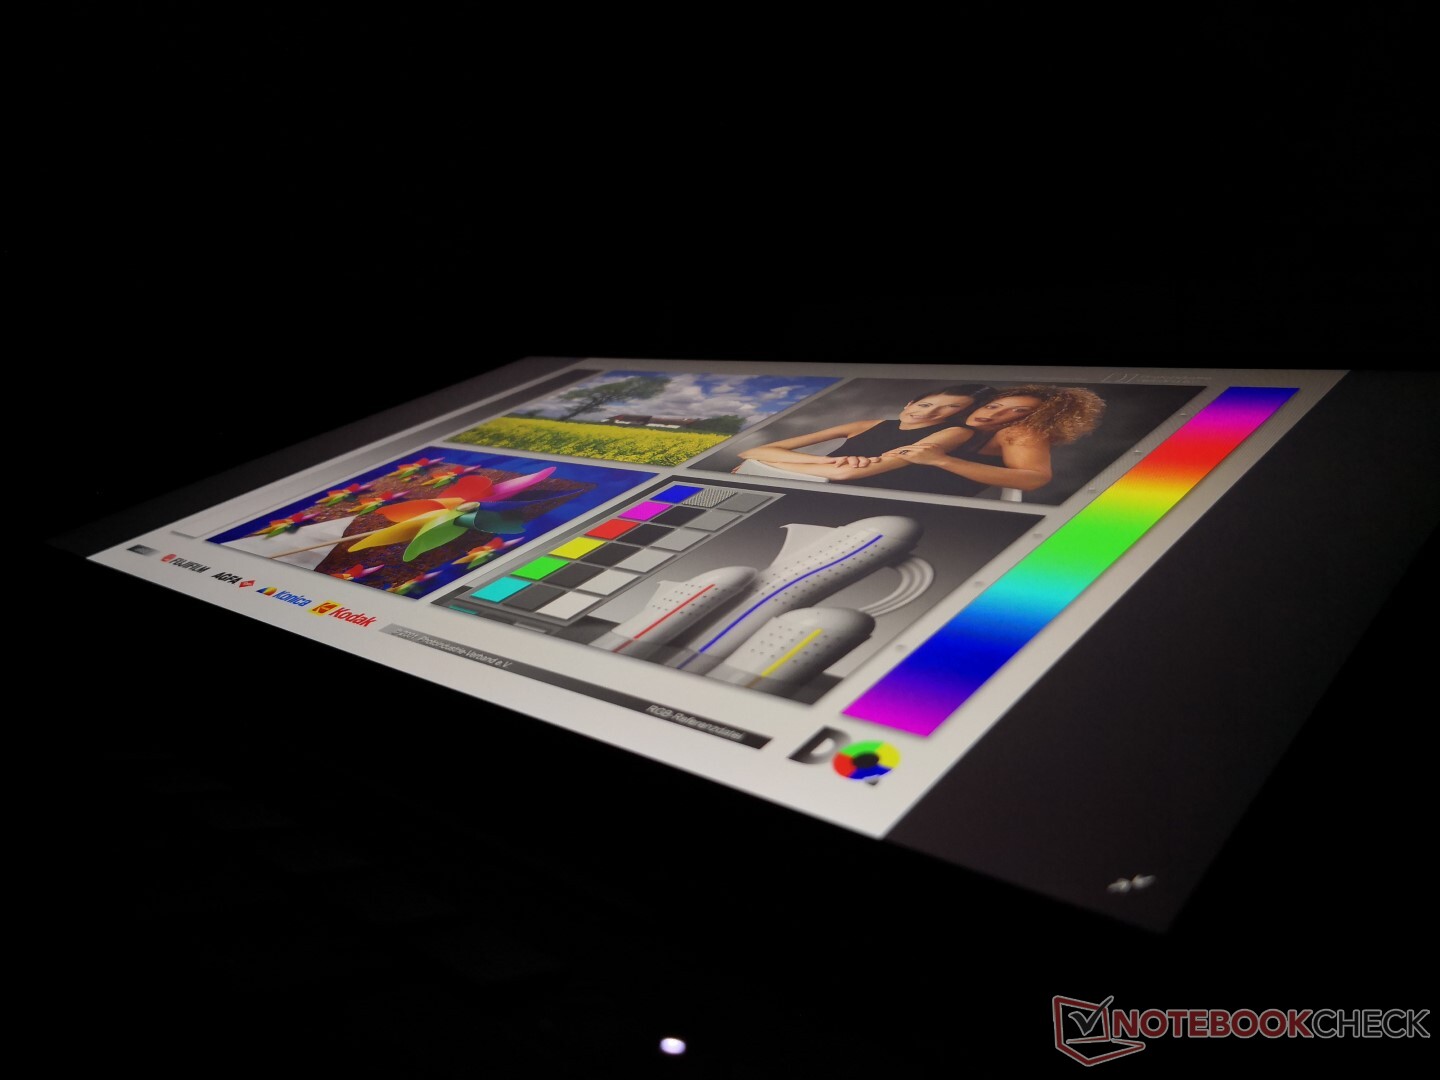
Display
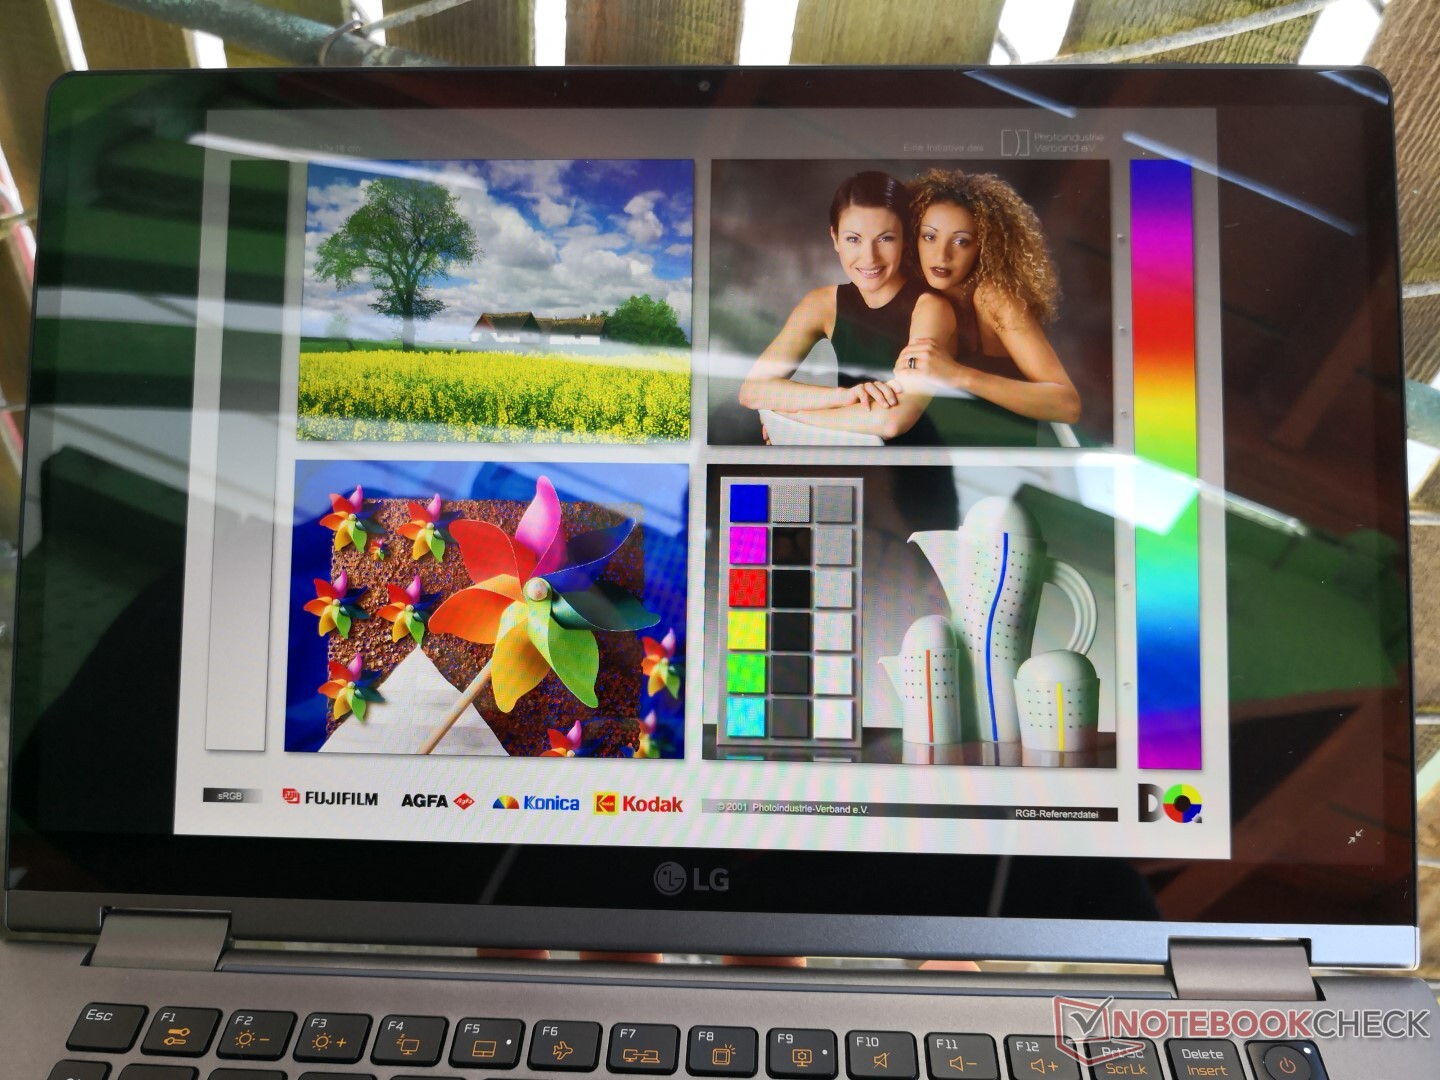
The LG Philips LP140WFA-SPY1 IPS panel on our unit can be found on no other laptop in our database. The LG LP140WFA panel series, however, appears on certain 14-inch Lenovo laptops like the IdeaPad S540 or IdeaPad S340. The high contrast ratio of ~1200:1 and glossy overlay help deliver a crisp and colorful picture as one would expect from any Ultrabook retailing for over a grand. Its biggest drawback is the slow black-white and gray-gray response times for more noticeable ghosting. This thankfully won't impact day-to-day office work or video playback all that much as super-fast response times are more applicable to gaming systems. With that said, certain 14-inch HP EliteBook systems offer 120 Hz screens for a much smoother visual experience than our LG.
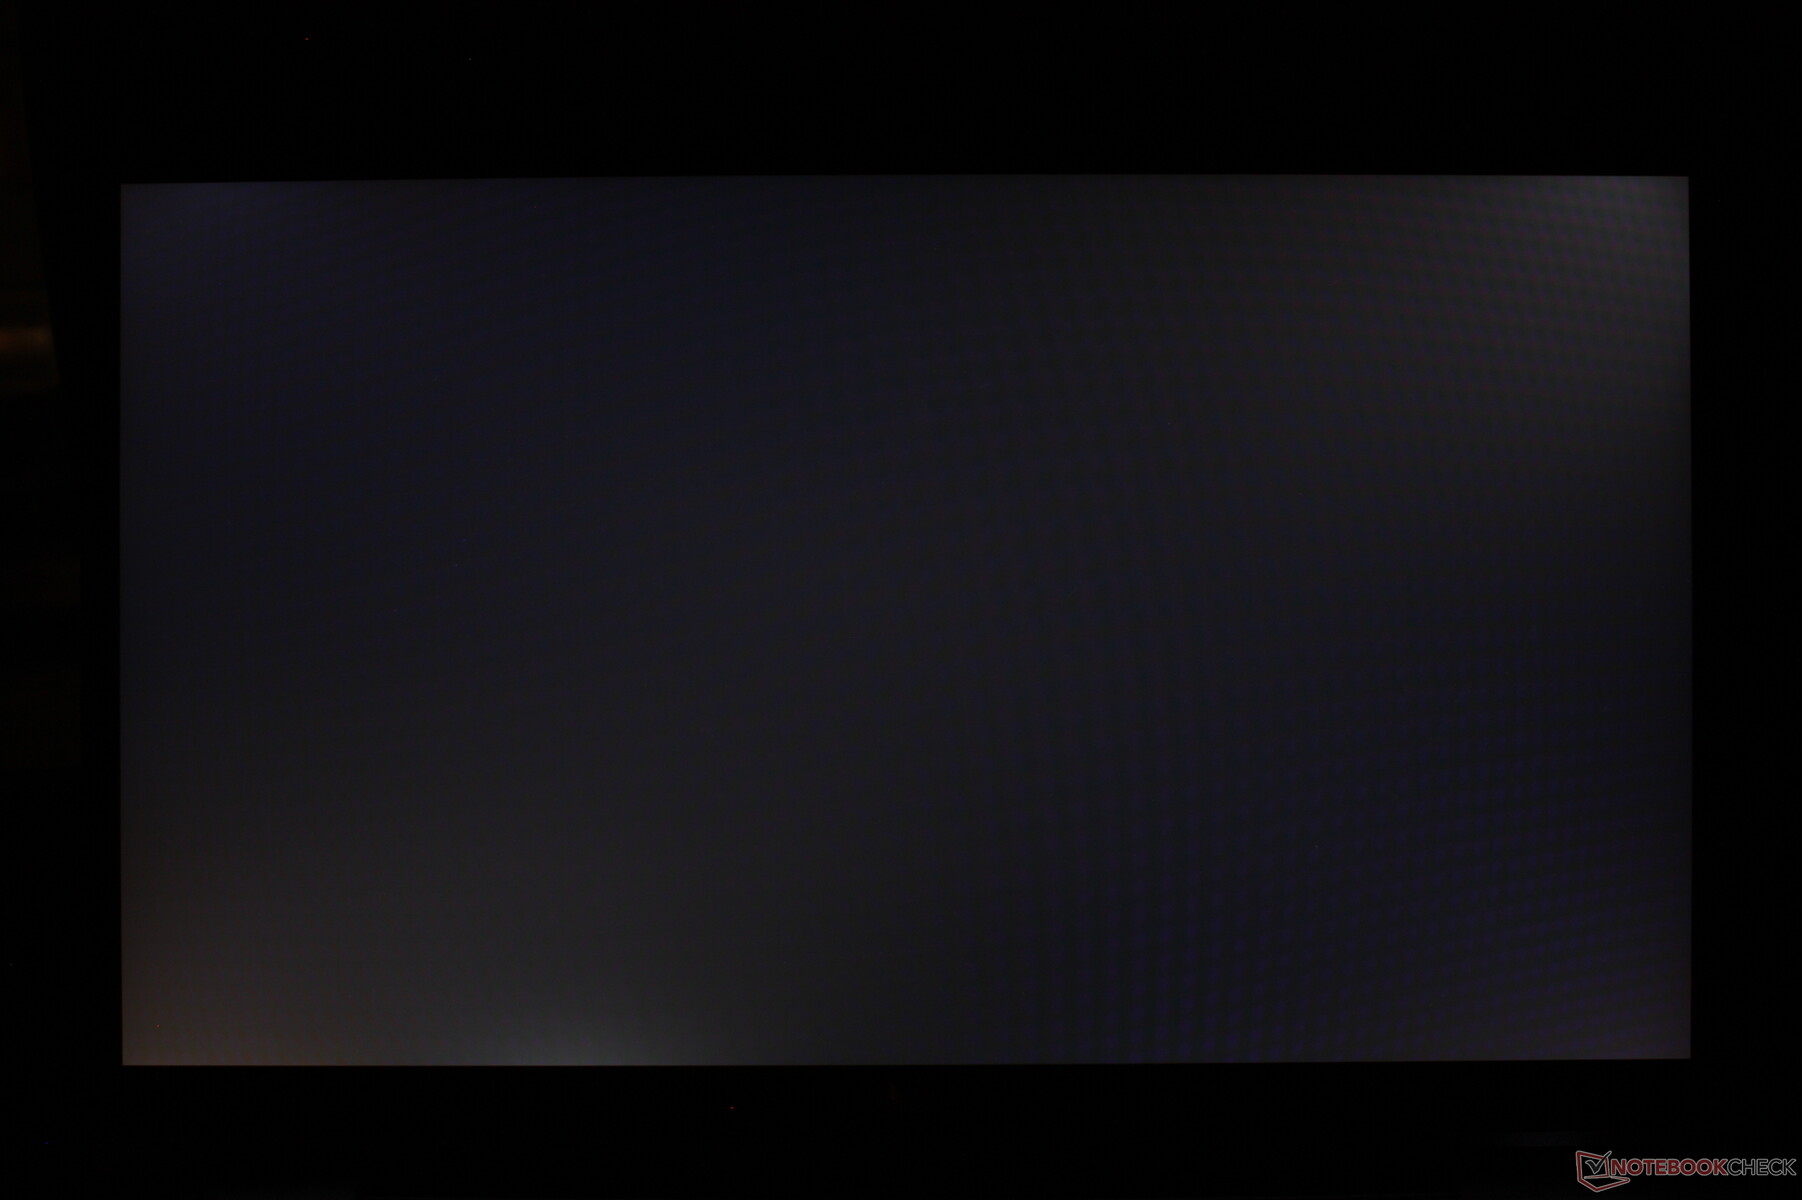
Our unit suffers from light-moderate uneven backlight bleeding along the corners as shown by the picture below.

| |||||||||||||||||||||||||
Brightness Distribution: 86 %
Center on Battery: 322.2 cd/m²
Contrast: 1289:1 (Black: 0.25 cd/m²)
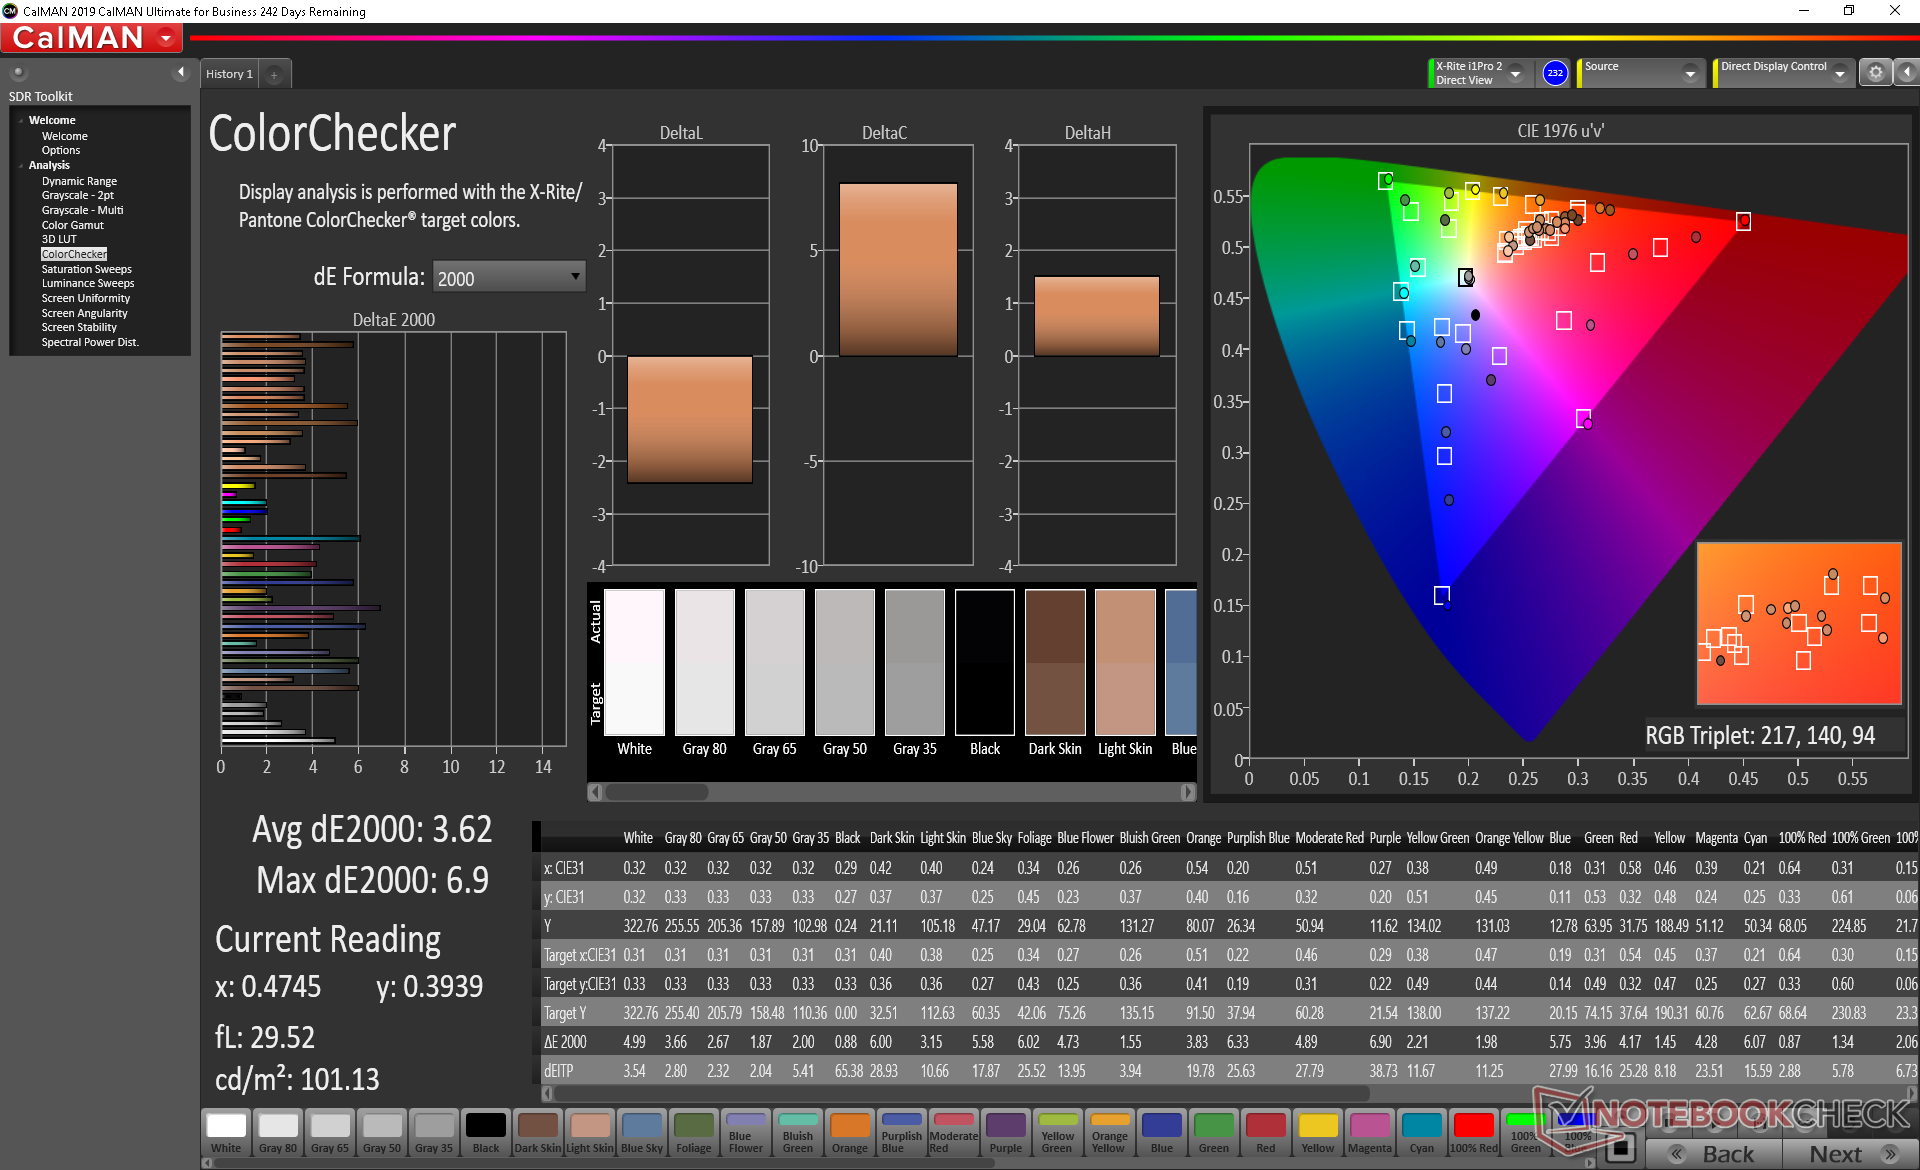
ΔE ColorChecker Calman: 3.62 | ∀{0.5-29.43 Ø4.71}
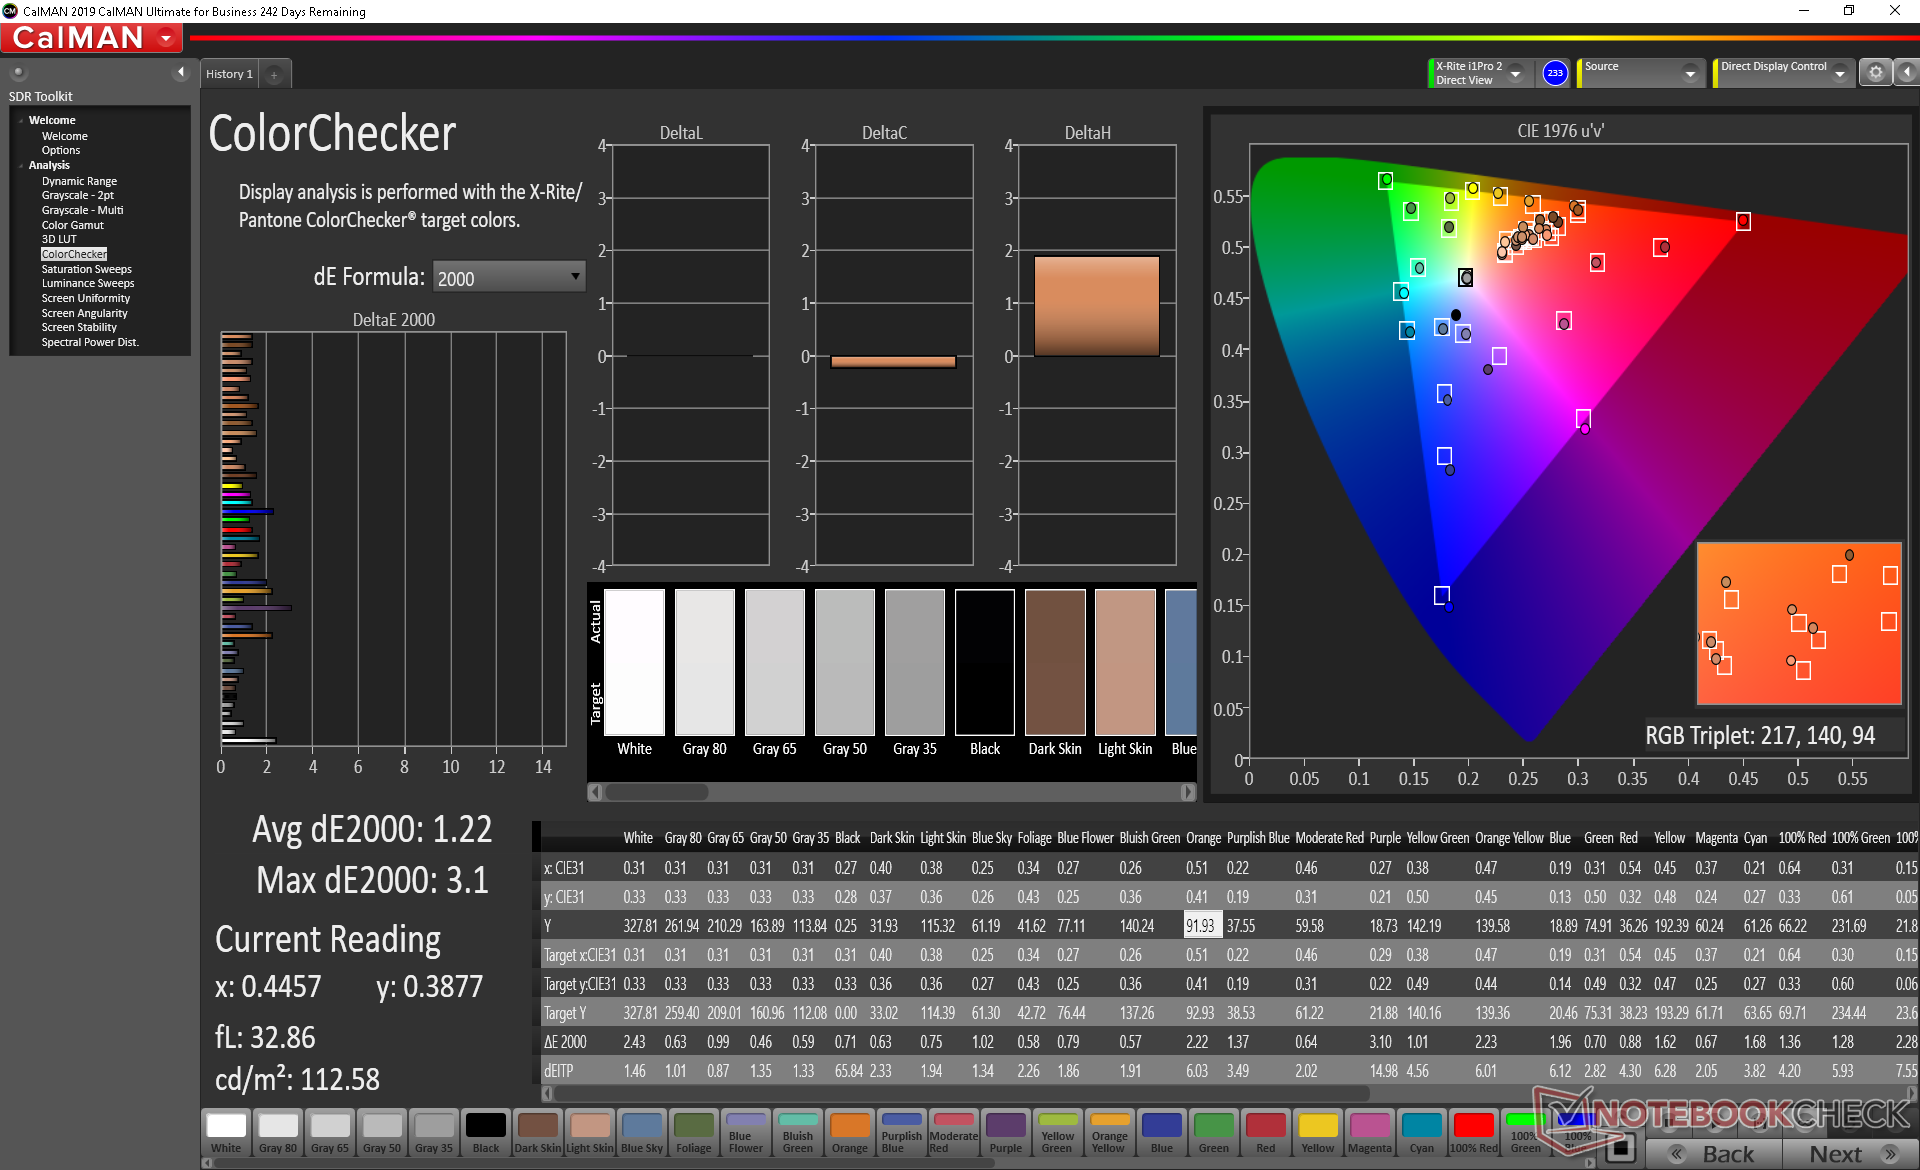
calibrated: 1.22
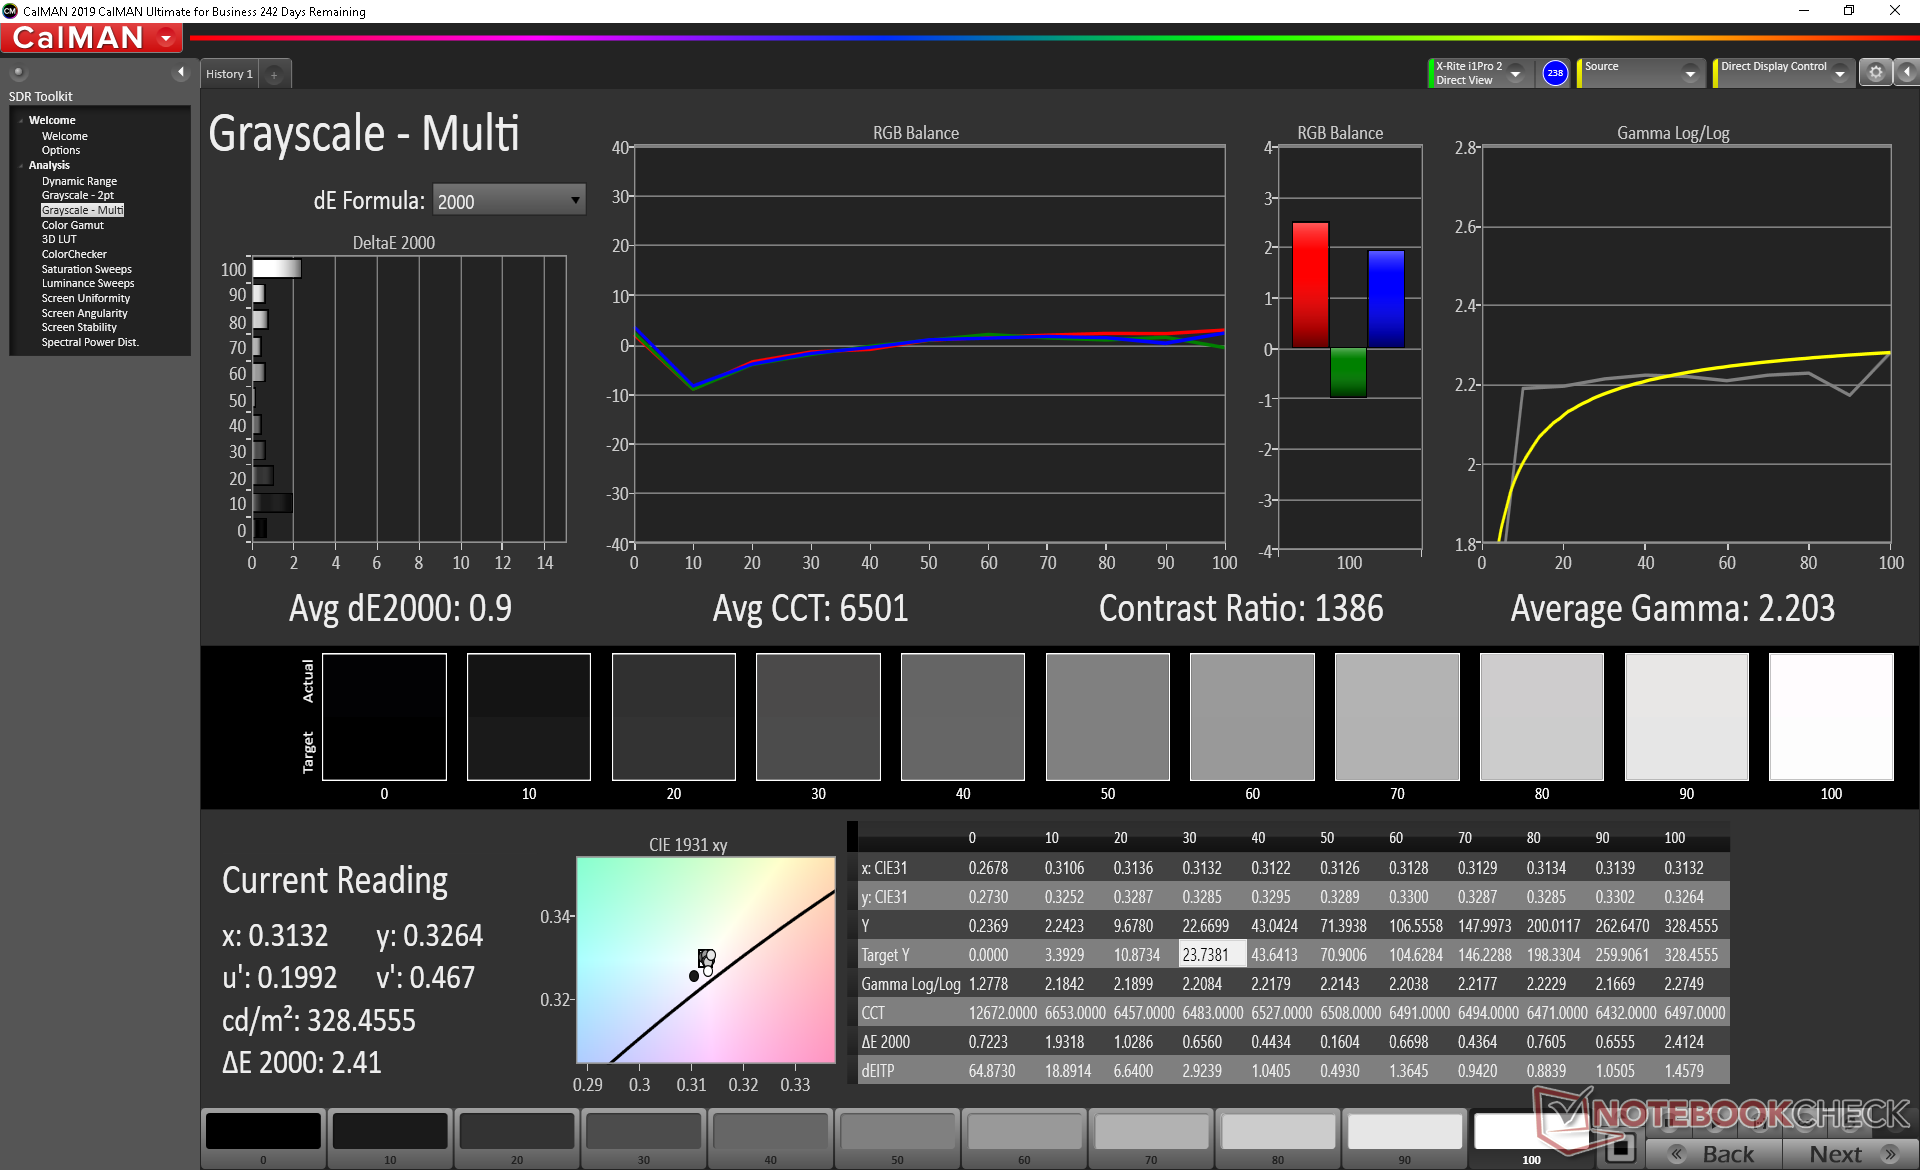
ΔE Greyscale Calman: 3.9 | ∀{0.09-98 Ø4.96}
95.6% sRGB (Argyll 1.6.3 3D)
61.3% AdobeRGB 1998 (Argyll 1.6.3 3D)
66.7% AdobeRGB 1998 (Argyll 3D)
95.7% sRGB (Argyll 3D)
65% Display P3 (Argyll 3D)
Gamma: 2.43
CCT: 6344 K
| LG Gram 14T90N LG Philips LP140WFA-SPY1, IPS, 14", 1920x1080 | LG Gram 14Z980-U.AAW5U1 LG Philips LP140WF7-SPG1, IPS, 14", 1920x1080 | Asus ZenBook 14 UM431DA-AM020T CEC PA LM140LF-3L03, IPS, 14", 1920x1080 | Dell XPS 13 7390 2-in-1 Core i7 Sharp LQ134N1, IPS, 13.4", 1920x1200 | Huawei Matebook X Pro i5 Tianma XM, IPS, 13.9", 3000x2000 | Lenovo ThinkPad X1 Carbon G7 20R1-000YUS BOE NV140QUM-N53, IPS, 14", 3840x2160 | |
|---|---|---|---|---|---|---|
| Display | -1% | 0% | 6% | 0% | 19% | |
| Display P3 Coverage (%) | 65 | 64.7 0% | 66.7 3% | 69.9 8% | 65.9 1% | 83 28% |
| sRGB Coverage (%) | 95.7 | 94.3 -1% | 92.3 -4% | 99.2 4% | 95.2 -1% | 99.7 4% |
| AdobeRGB 1998 Coverage (%) | 66.7 | 66 -1% | 67.5 1% | 71.5 7% | 67.6 1% | 83.1 25% |
| Response Times | 21% | 27% | 12% | 24% | 6% | |
| Response Time Grey 50% / Grey 80% * (ms) | 54 ? | 36.8 ? 32% | 36 ? 33% | 47.6 ? 12% | 40.4 ? 25% | 49.2 ? 9% |
| Response Time Black / White * (ms) | 32.8 ? | 30 ? 9% | 26 ? 21% | 29.2 ? 11% | 25.6 ? 22% | 32.2 ? 2% |
| PWM Frequency (Hz) | 44 ? | 2500 ? | 201.6 ? | |||
| Screen | -17% | -49% | 20% | -4% | -32% | |
| Brightness middle (cd/m²) | 322.2 | 333.8 4% | 253 -21% | 549.8 71% | 442.7 37% | 532 65% |
| Brightness (cd/m²) | 301 | 307 2% | 245 -19% | 520 73% | 428 42% | 513 70% |
| Brightness Distribution (%) | 86 | 83 -3% | 78 -9% | 86 0% | 84 -2% | 90 5% |
| Black Level * (cd/m²) | 0.25 | 0.4 -60% | 0.225 10% | 0.39 -56% | 0.31 -24% | 0.41 -64% |
| Contrast (:1) | 1289 | 835 -35% | 1124 -13% | 1410 9% | 1428 11% | 1298 1% |
| Colorchecker dE 2000 * | 3.62 | 3.54 2% | 8.89 -146% | 2.12 41% | 2.24 38% | 6.88 -90% |
| Colorchecker dE 2000 max. * | 6.9 | 5.8 16% | 4.56 34% | 3.66 47% | 7.19 -4% | 12.65 -83% |
| Colorchecker dE 2000 calibrated * | 1.22 | 2.36 -93% | 4.9 -302% | 1.37 -12% | 1.11 9% | 2.52 -107% |
| Greyscale dE 2000 * | 3.9 | 4.7 -21% | 6.33 -62% | 2.6 33% | 9.7 -149% | 10.5 -169% |
| Gamma | 2.43 91% | 2.14 103% | 2.52 87% | 2.3 96% | 1.42 155% | 1.98 111% |
| CCT | 6344 102% | 6261 104% | 6745 96% | 6884 94% | 6227 104% | 7394 88% |
| Color Space (Percent of AdobeRGB 1998) (%) | 61.3 | 61.2 0% | 60 -2% | 65.4 7% | 61.6 0% | 74.1 21% |
| Color Space (Percent of sRGB) (%) | 95.6 | 94.7 -1% | 91 -5% | 99.7 4% | 95 -1% | 99.7 4% |
| Total Average (Program / Settings) | 1% /
-9% | -7% /
-30% | 13% /
16% | 7% /
0% | -2% /
-17% |
* ... smaller is better
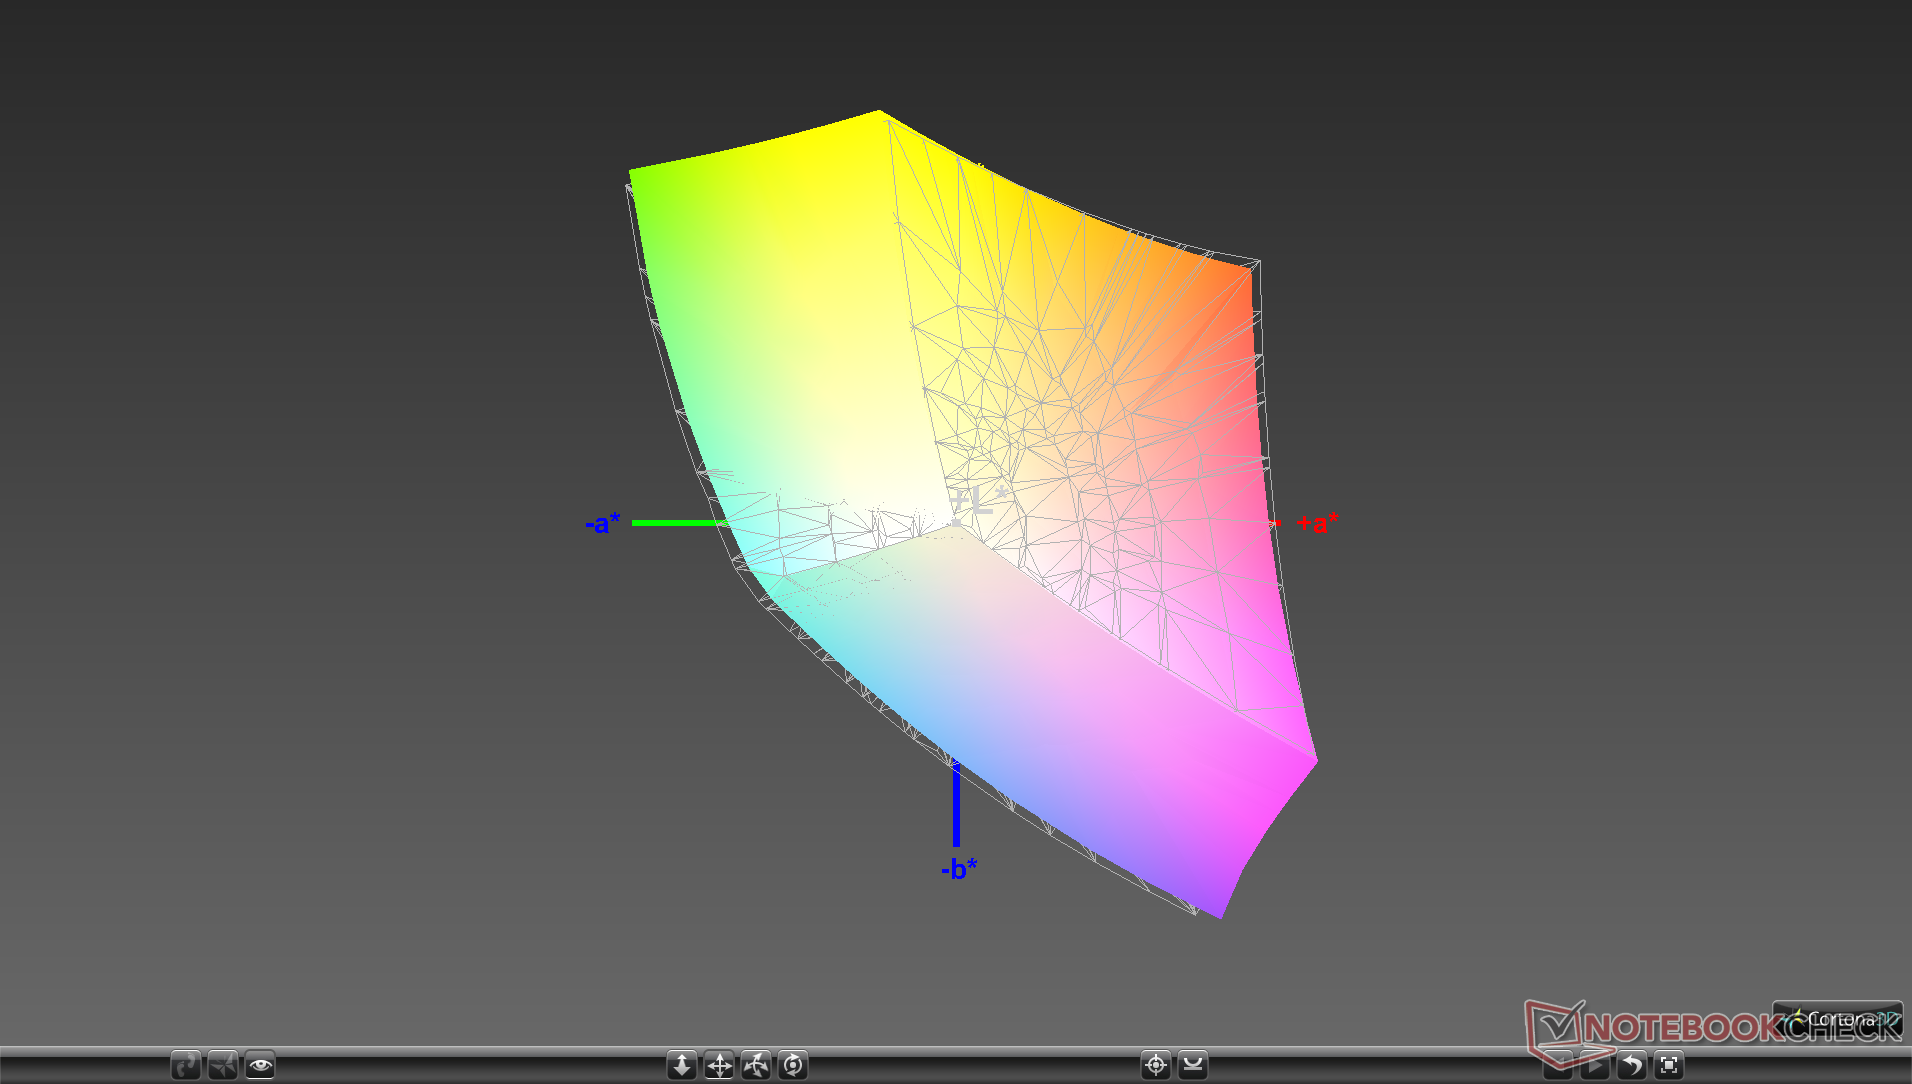
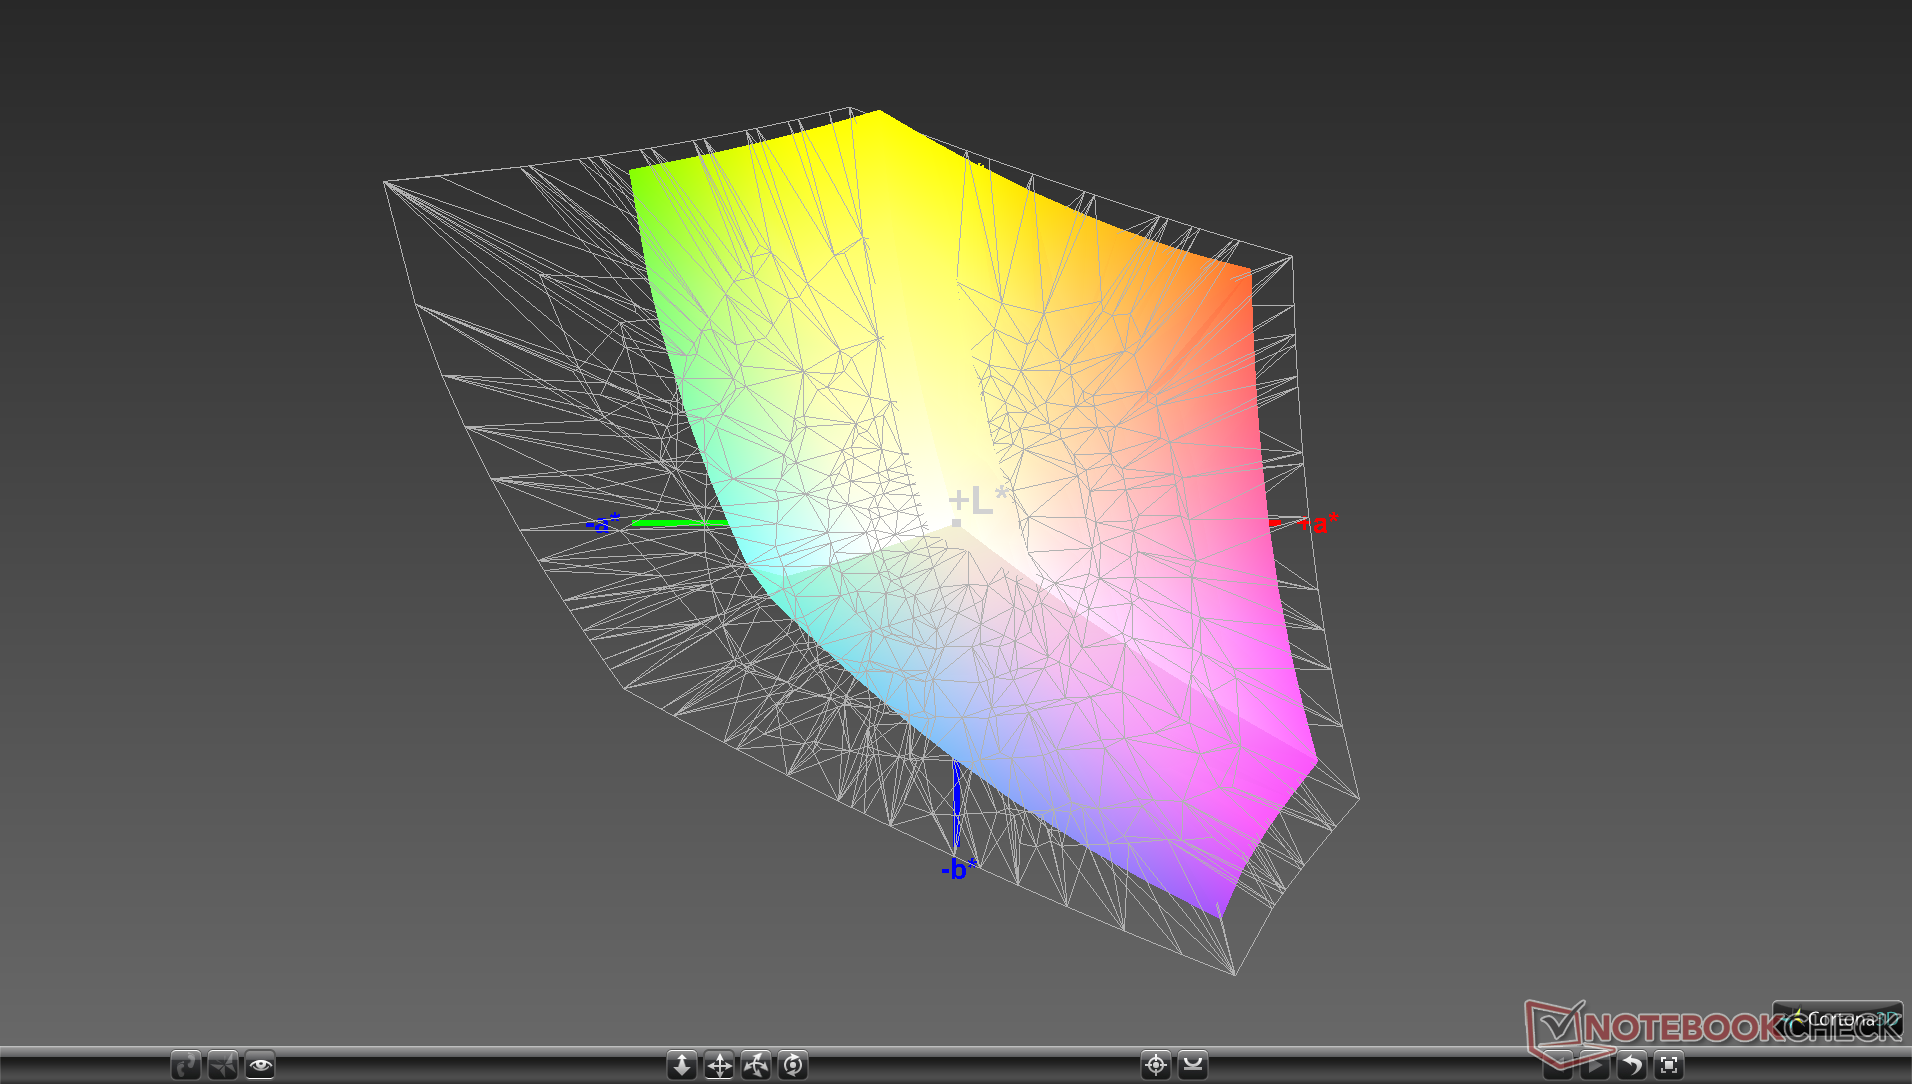
Color space covers approximately 96 percent and 61 percent of the sRGB and AdobeRGB standards, respectively, which is common amongst high-end Ultrabooks. Laptops geared more towards content creators like the XPS 15 or ZenBook Pro 15 offer even deeper and more accurate colors.
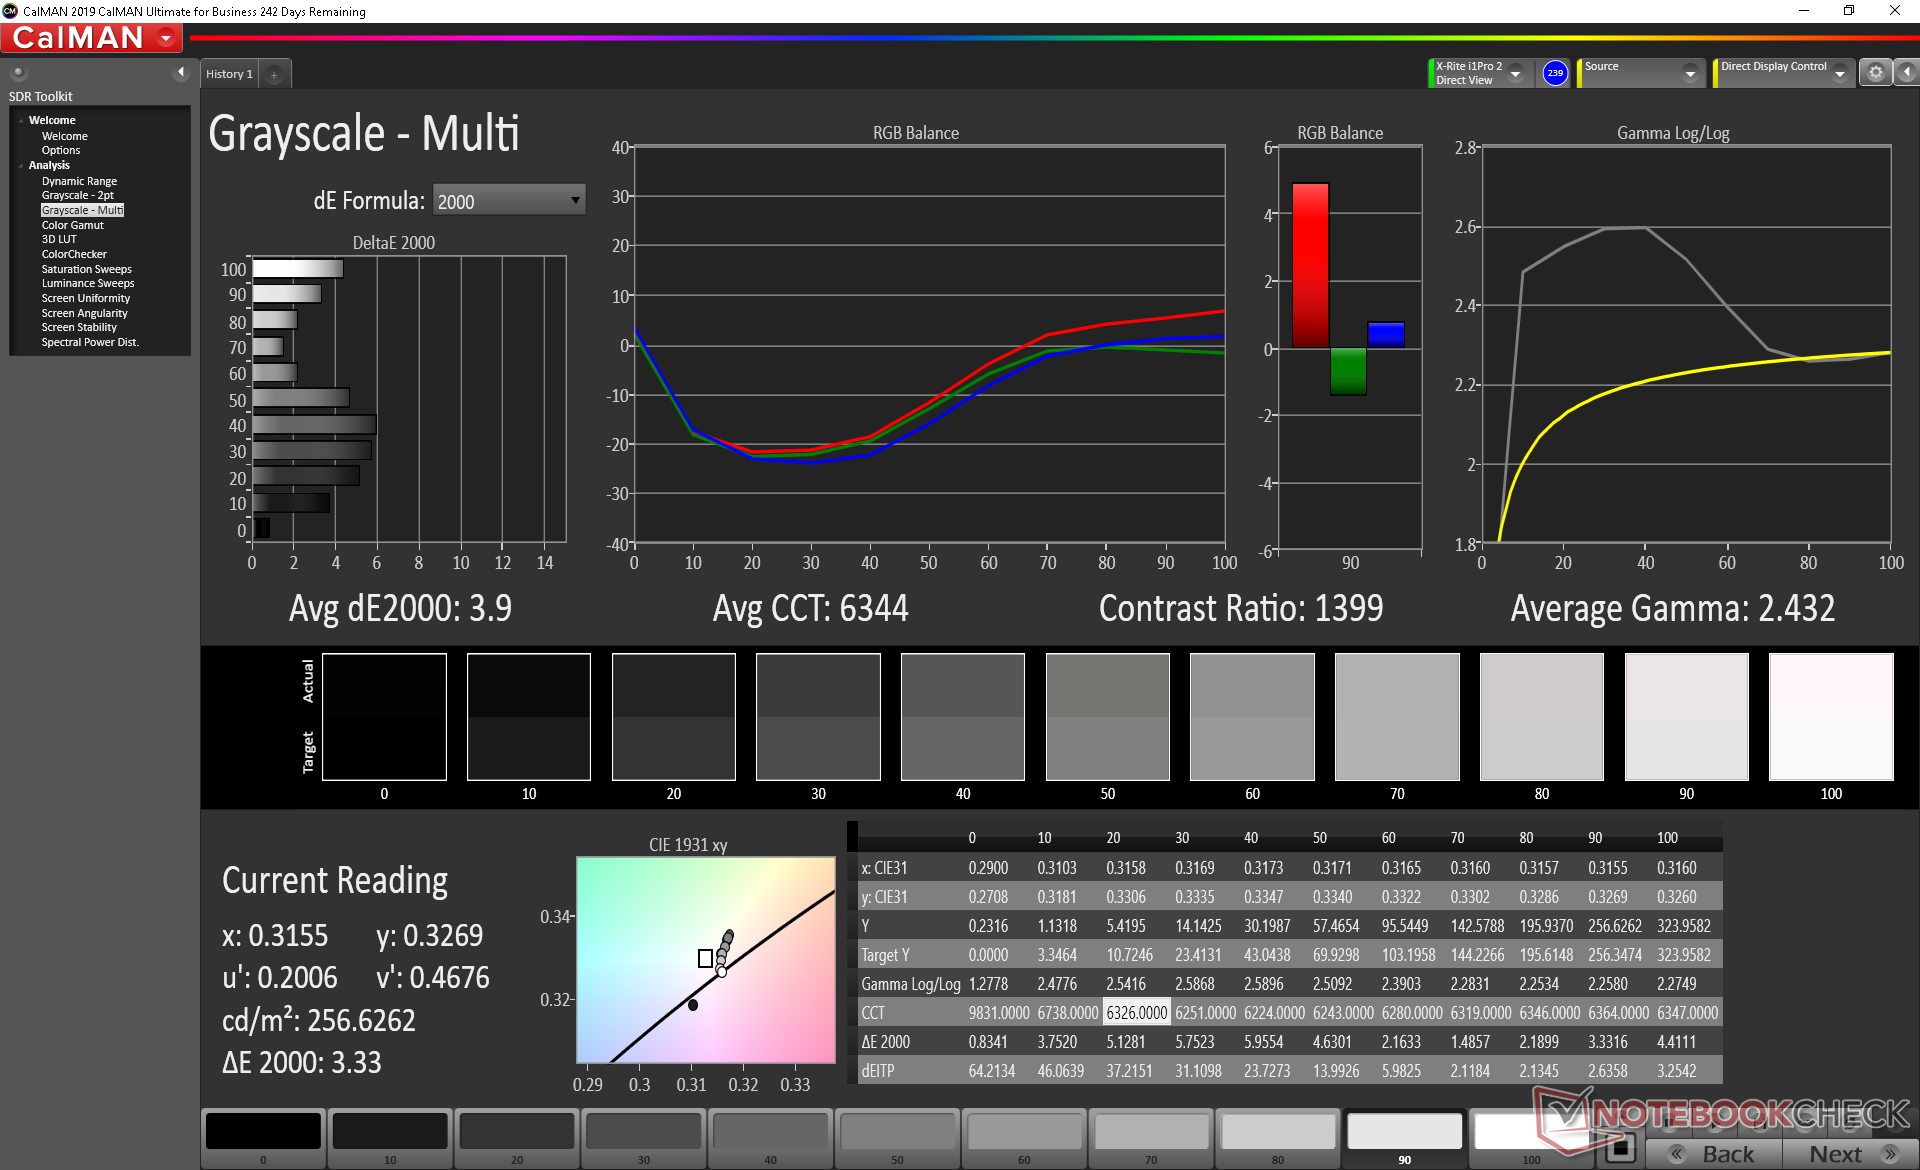
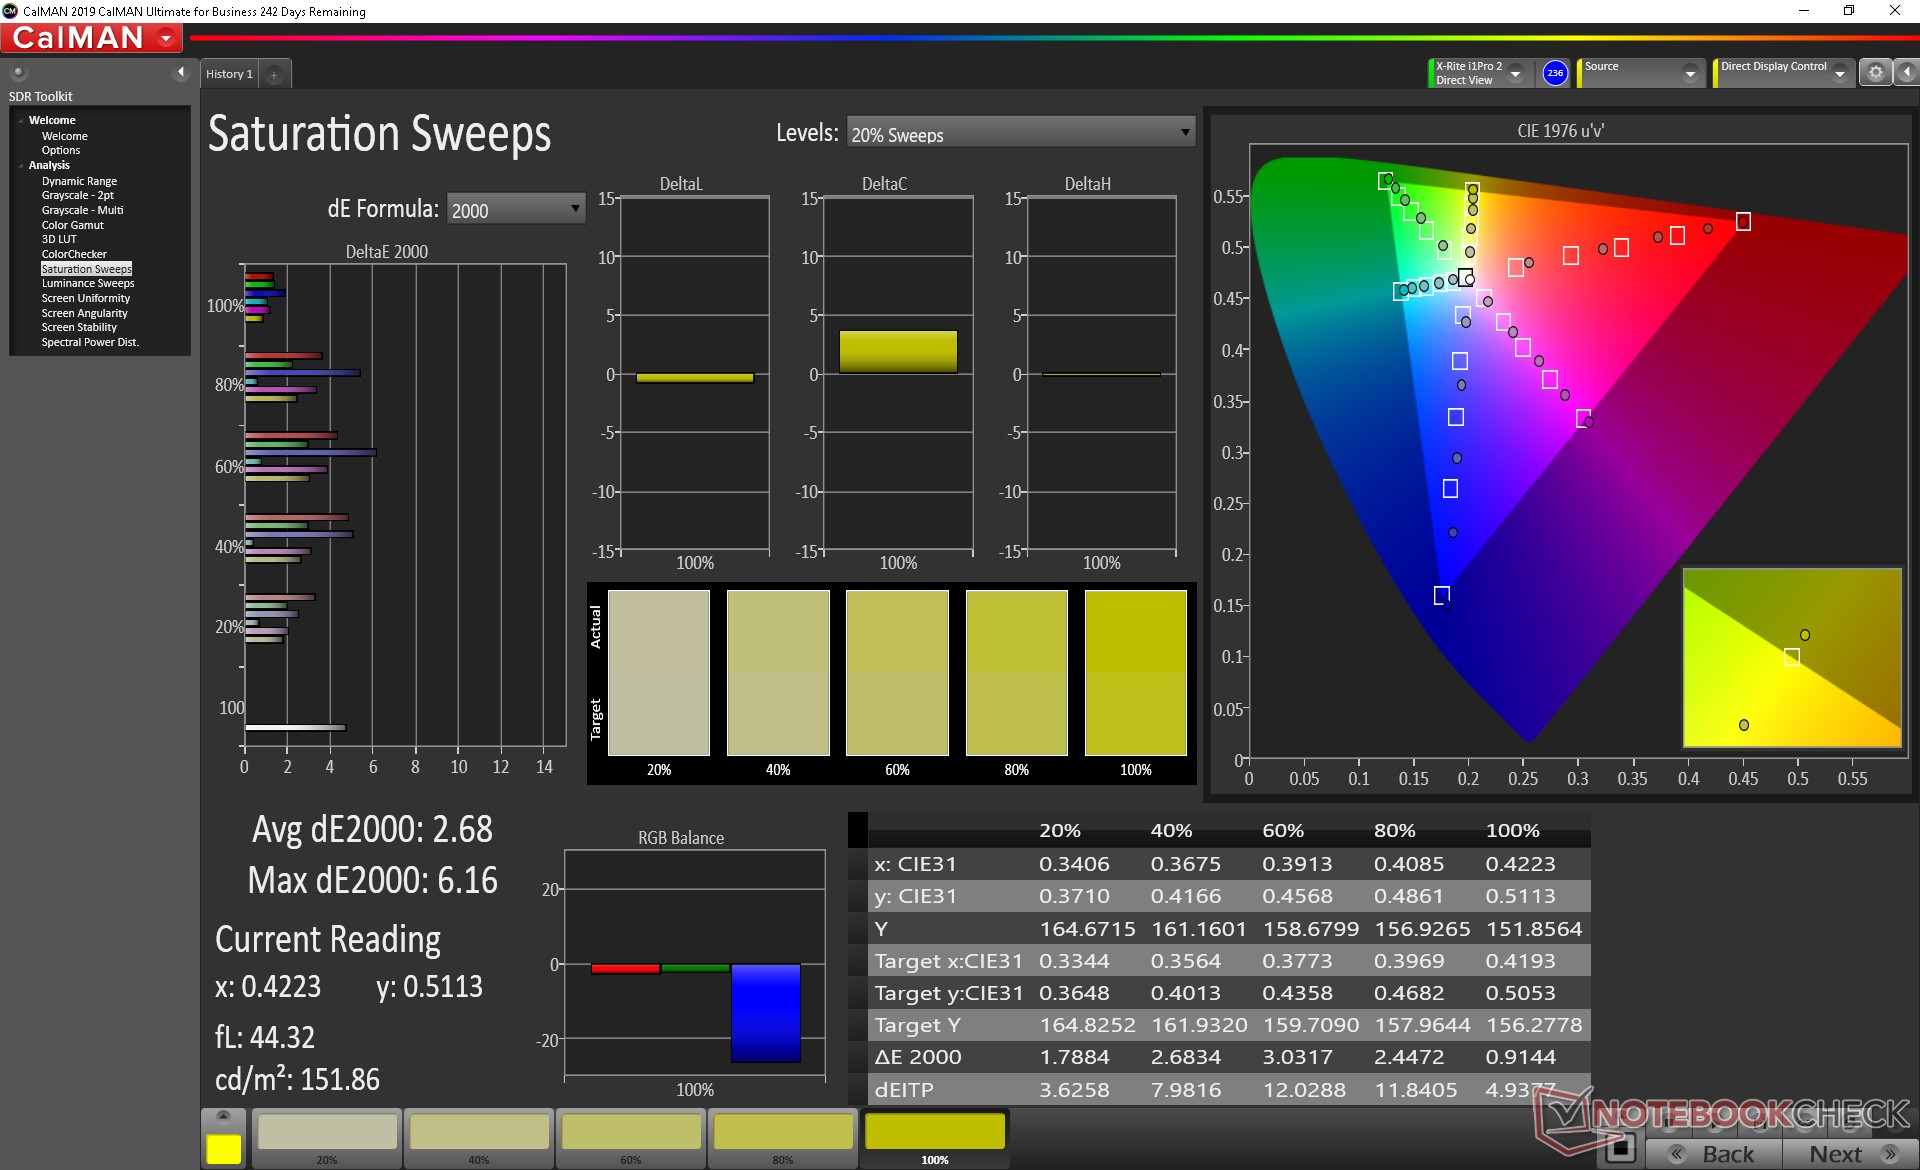
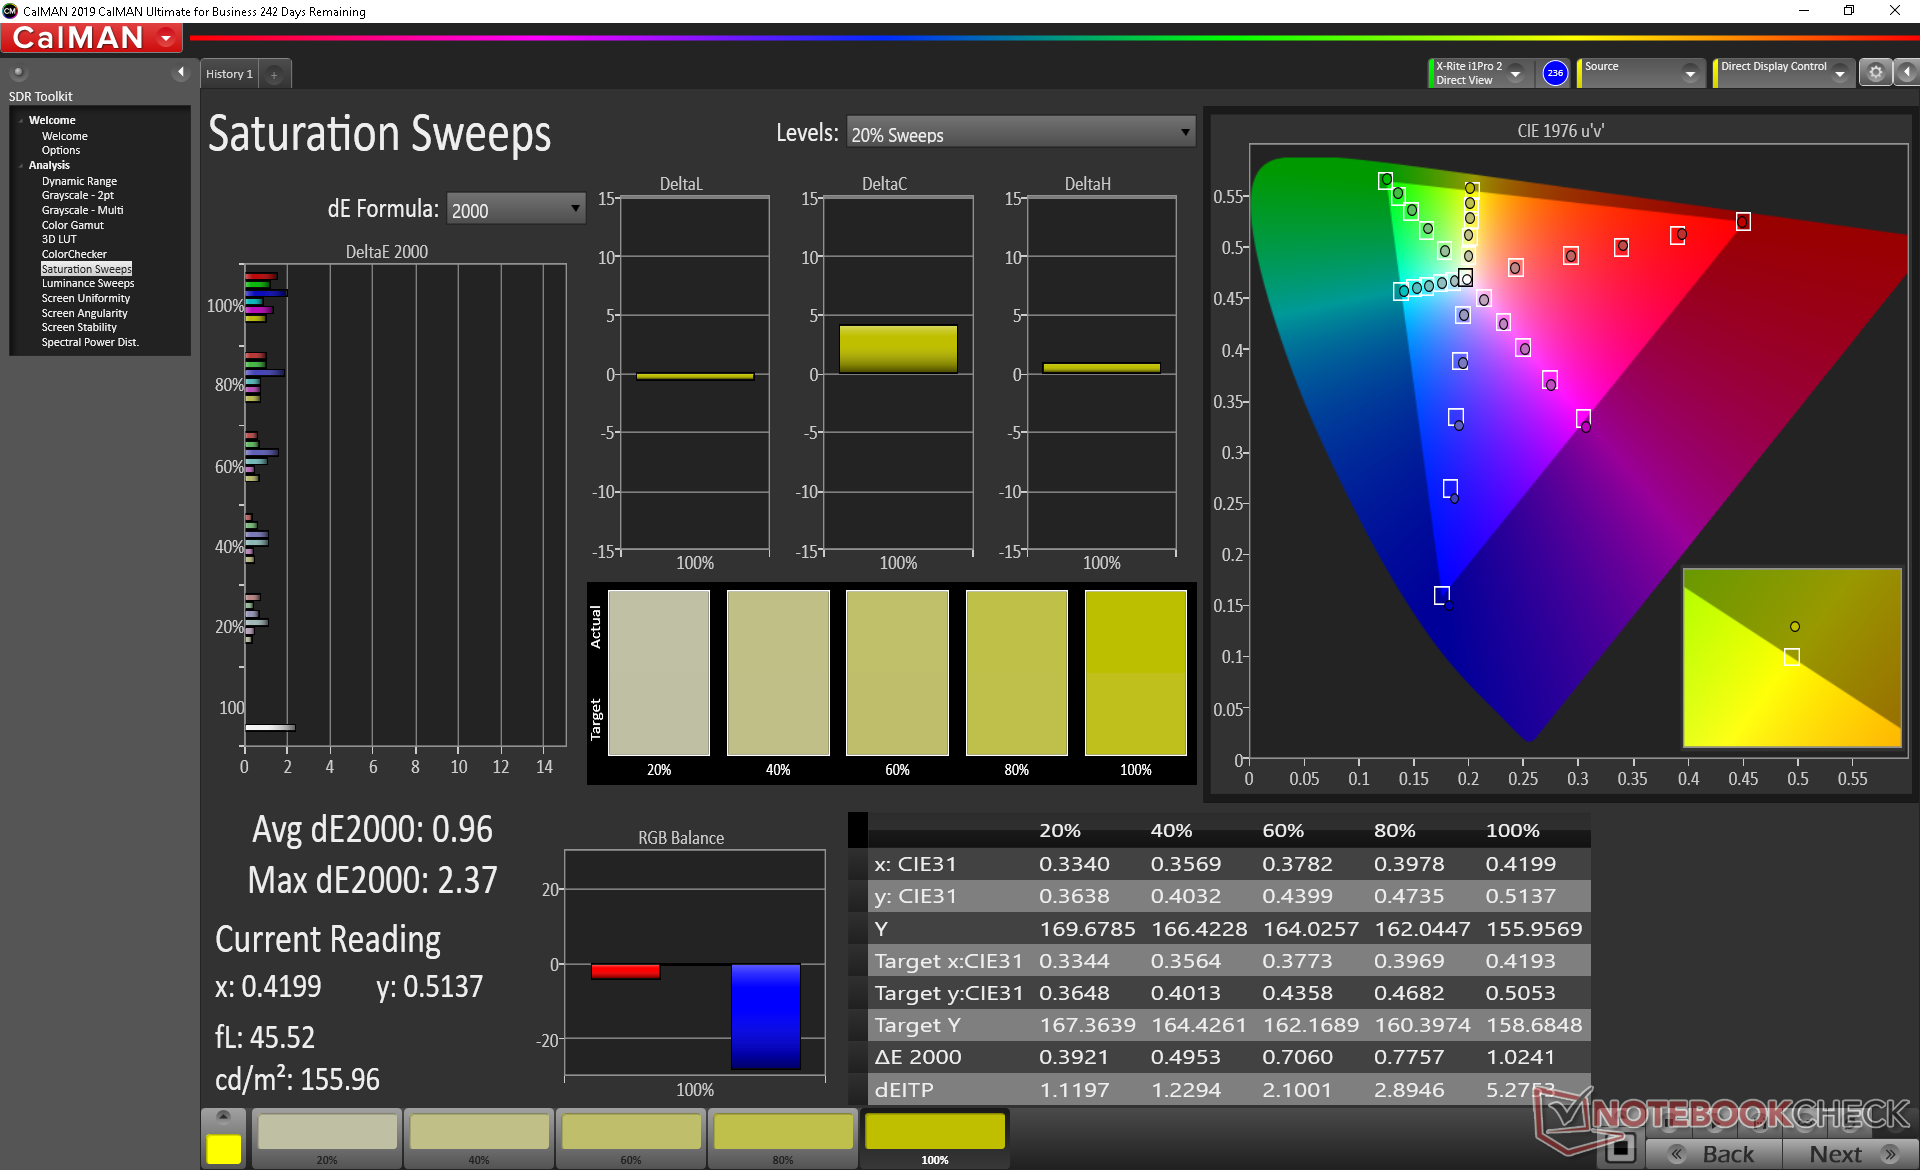
Further measurements with an X-Rite colorimeter reveal poor RGB balance on an otherwise great display. After calibrating the panel ourselves, accuracy improves across the board. Final grayscale and color average DeltaE values sit at just 0.9 and 1.22, respectively. Users can apply our calibrated ICM profile above to get the most out of the display. Note that if LG Reader Mode is enabled, color temperature will become much warmer in order to reduce blue light emissions.
Display Response Times
| ↔ Response Time Black to White | ||
|---|---|---|
| 32.8 ms ... rise ↗ and fall ↘ combined | ↗ 19.6 ms rise | 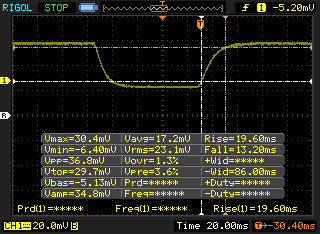 |
| ↘ 13.2 ms fall | ||
| The screen shows slow response rates in our tests and will be unsatisfactory for gamers. In comparison, all tested devices range from 0.1 (minimum) to 240 (maximum) ms. » 88 % of all devices are better. This means that the measured response time is worse than the average of all tested devices (19.8 ms). | ||
| ↔ Response Time 50% Grey to 80% Grey | ||
| 54 ms ... rise ↗ and fall ↘ combined | ↗ 28.8 ms rise | 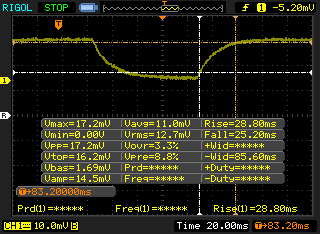 |
| ↘ 25.2 ms fall | ||
| The screen shows slow response rates in our tests and will be unsatisfactory for gamers. In comparison, all tested devices range from 0.165 (minimum) to 636 (maximum) ms. » 91 % of all devices are better. This means that the measured response time is worse than the average of all tested devices (31 ms). | ||
Screen Flickering / PWM (Pulse-Width Modulation)
| Screen flickering / PWM not detected | 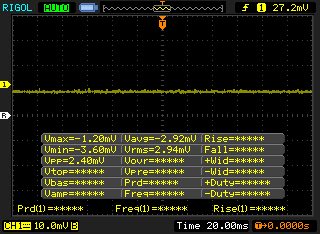 | ||
In comparison: 52 % of all tested devices do not use PWM to dim the display. If PWM was detected, an average of 7757 (minimum: 5 - maximum: 343500) Hz was measured. | |||
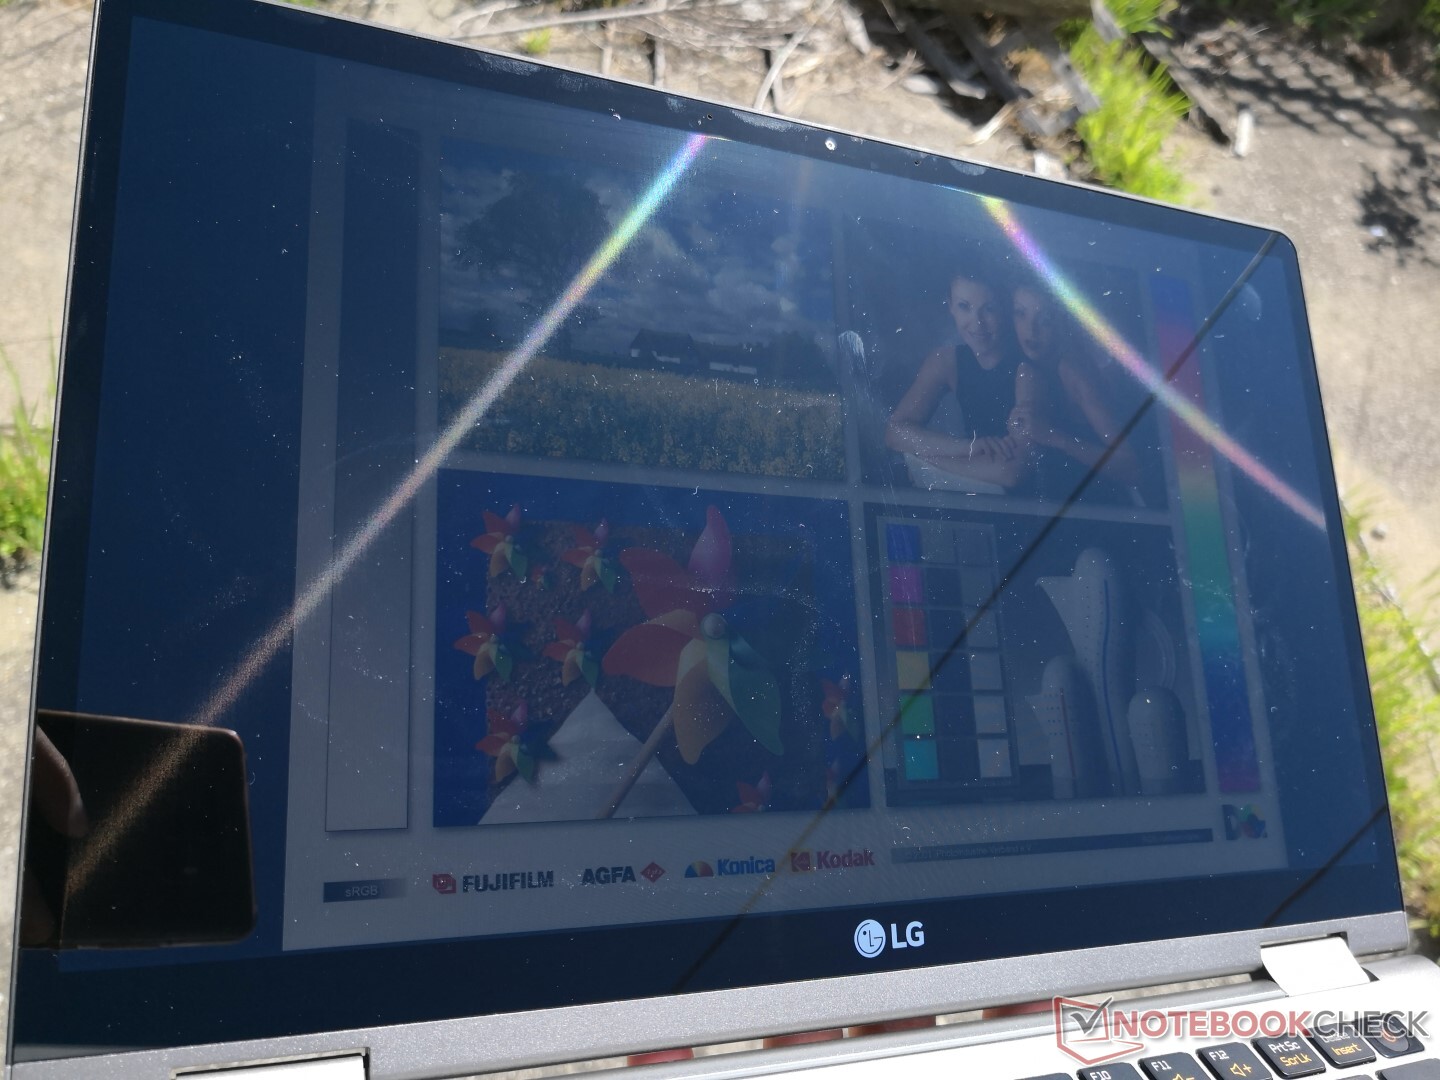
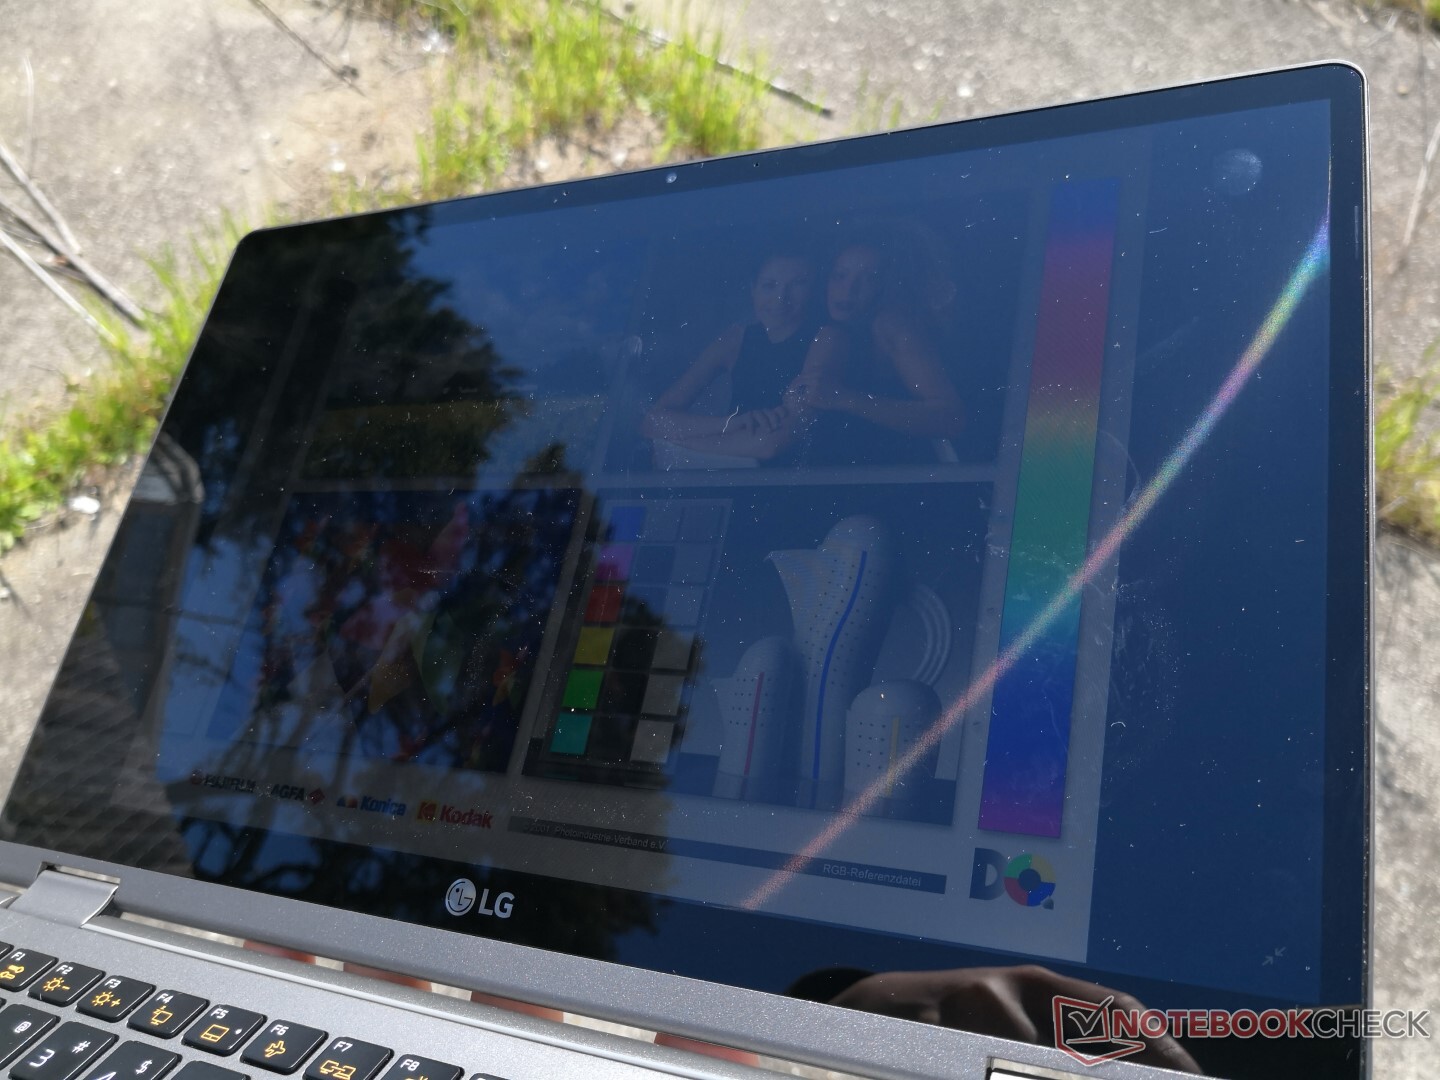
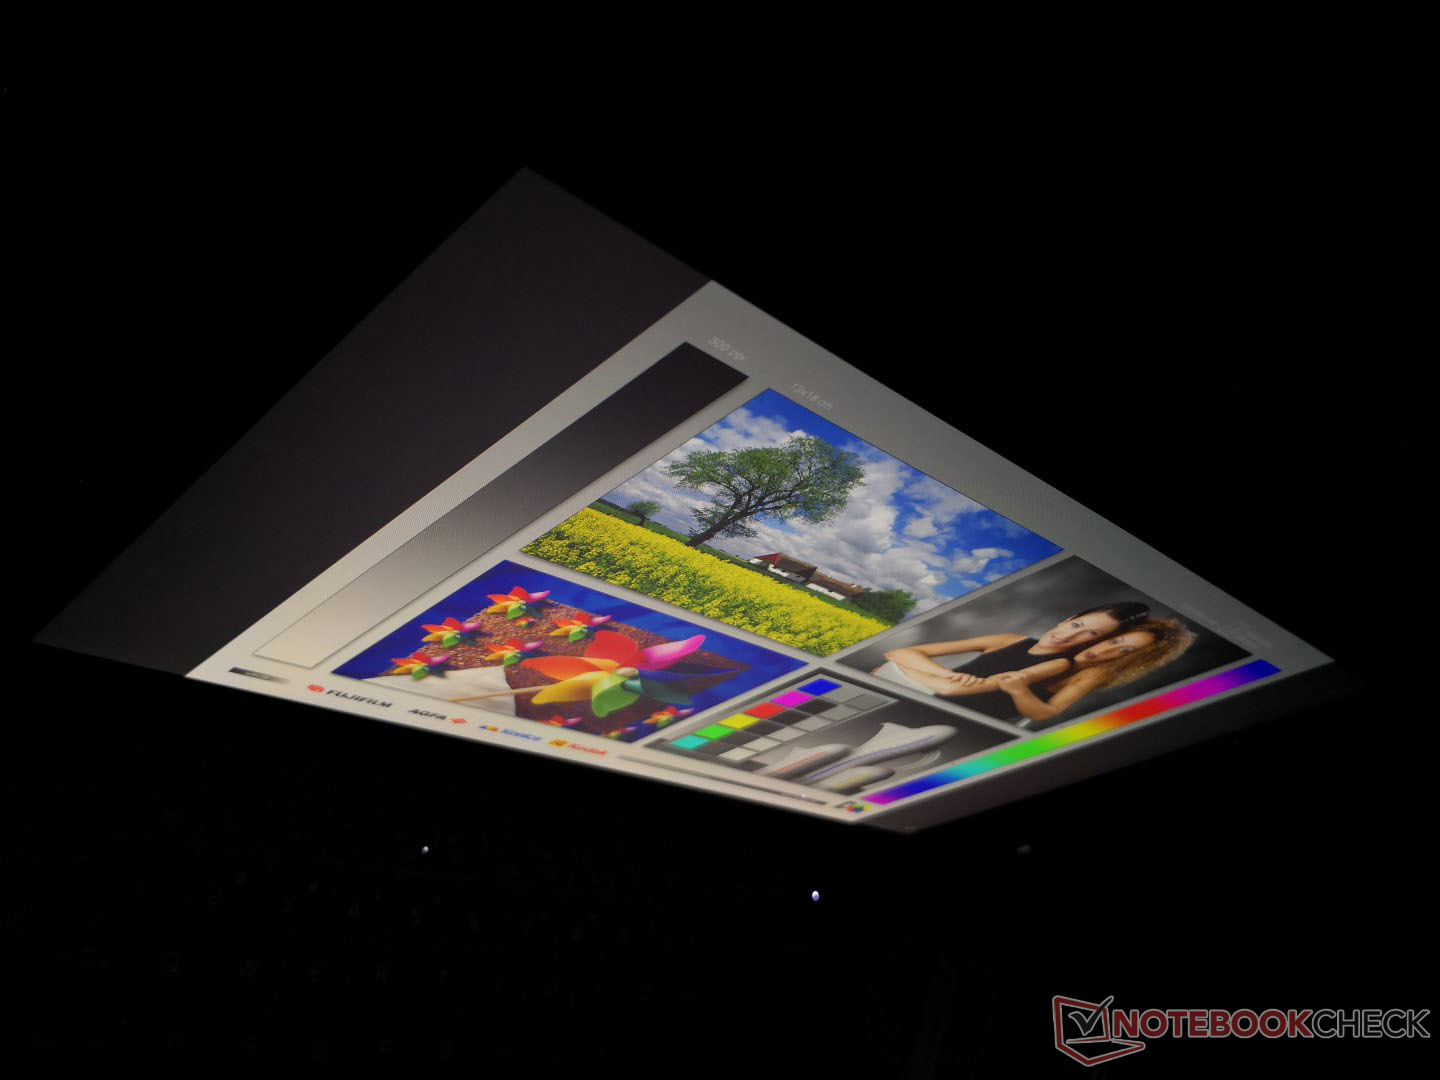
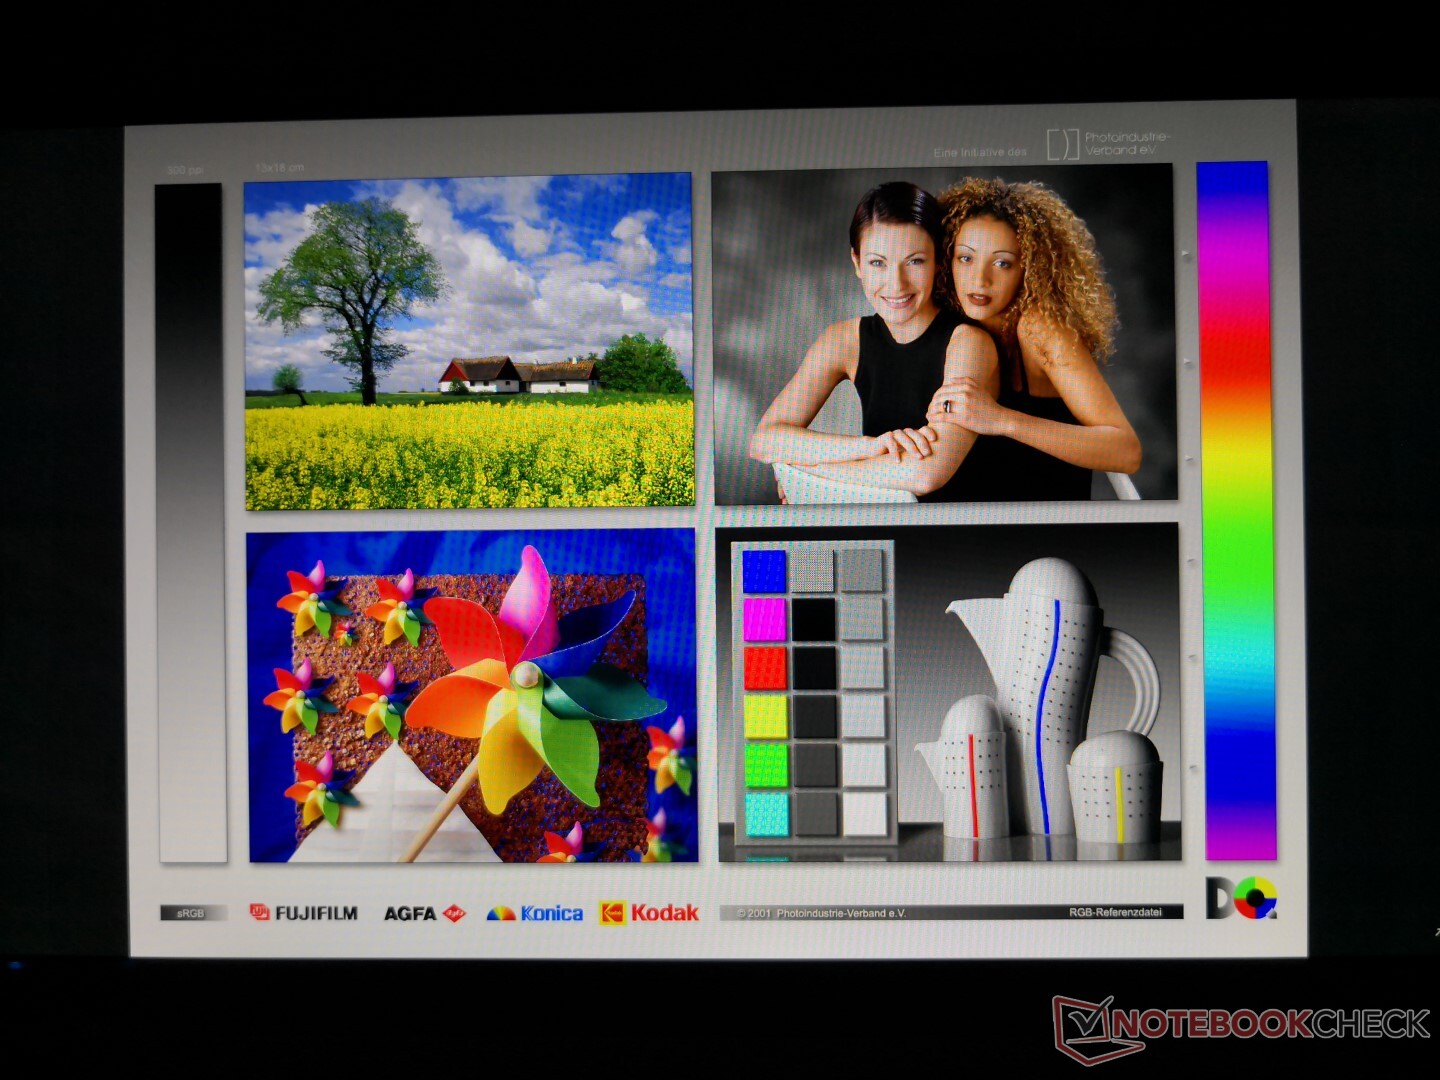
Outdoor visibility is poorer than expected especially for a convertible laptop where users are more likely to be traveling. The display is nowhere near as bright as the XPS 13 2-in-1 or Samsung Notebook 9 Pen and the glossy overlay only accentuates glare. Furthermore, users will have to disable certain settings or else the maximum brightness of the screen will automatically drop from 322 nits to about 277 nits if running on battery power. Viewing angles are otherwise excellent with no major changes to colors or contrast from practical angles.
Performance
The 10th gen Comet Lake-U Core i7-10510U directly replaces the 8th gen Whiskey Lake-U Core i7-8565U. As our benchmarks below will show, however, any performance differences between them are marginal. It's too bad that LG doesn't offer the Core i7-1065G7 Ice Lake or hexa-core Core i7-10710U which would have provided more significant performance advantages over the Core i7-8565U. Even an AMD Ryzen 3700U option would have offered faster graphics potential than the Core i7-10510U we have here.
Like all other Gram laptops thus far, there are no dedicated GPU options. The Gram 14 convertible is therefore more suited for light office, streaming, and web browsing rather than photo or media editing.
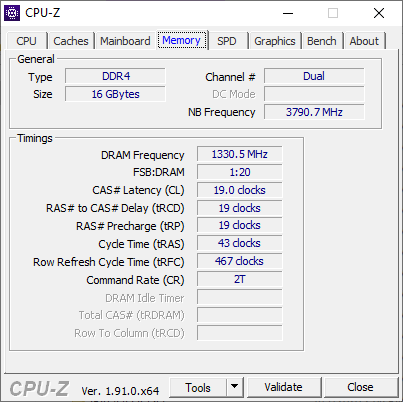
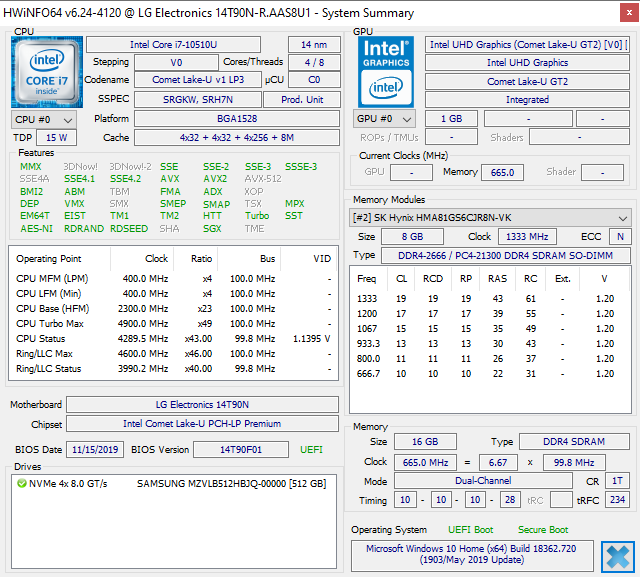
8 GB of RAM comes soldered alongside an expandable SODIMM slot. In our case, the slot is occupied by an 8 GB DDR4-2666 module from SK Hynix for a combined total of 16 GB.
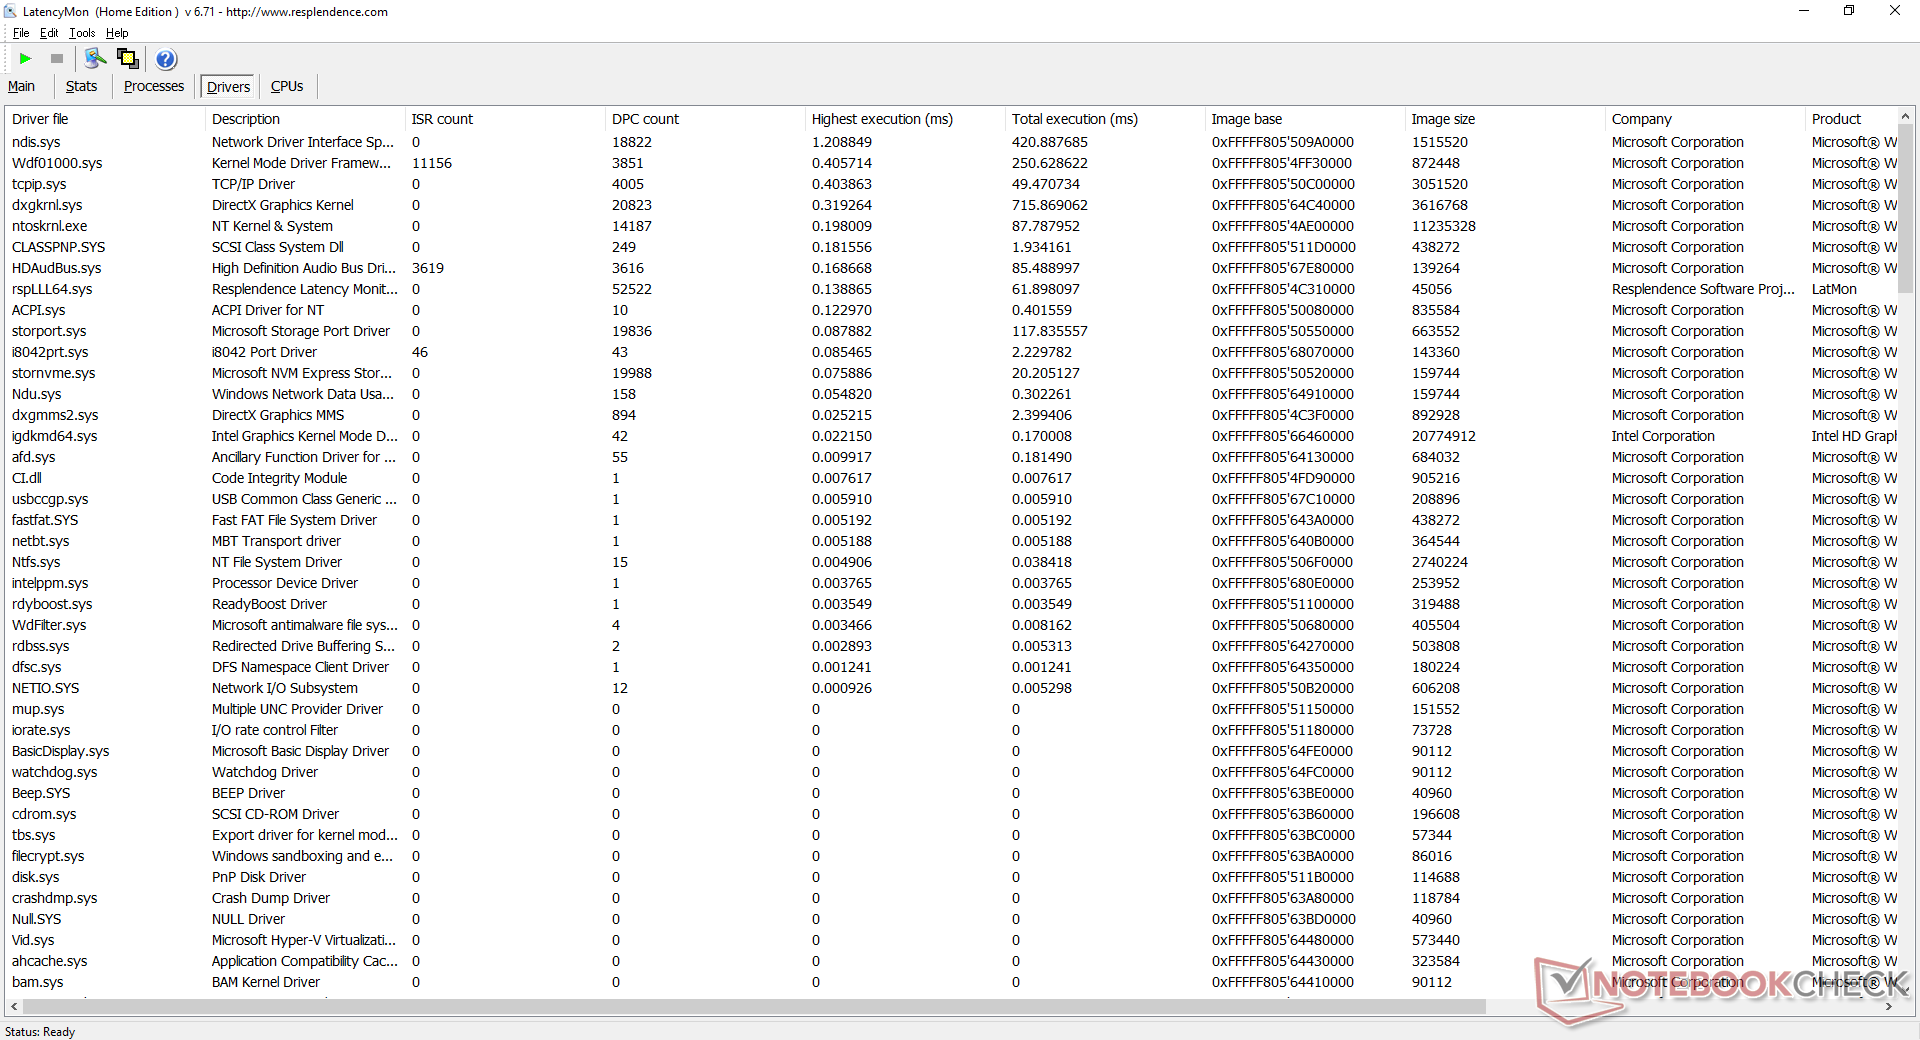
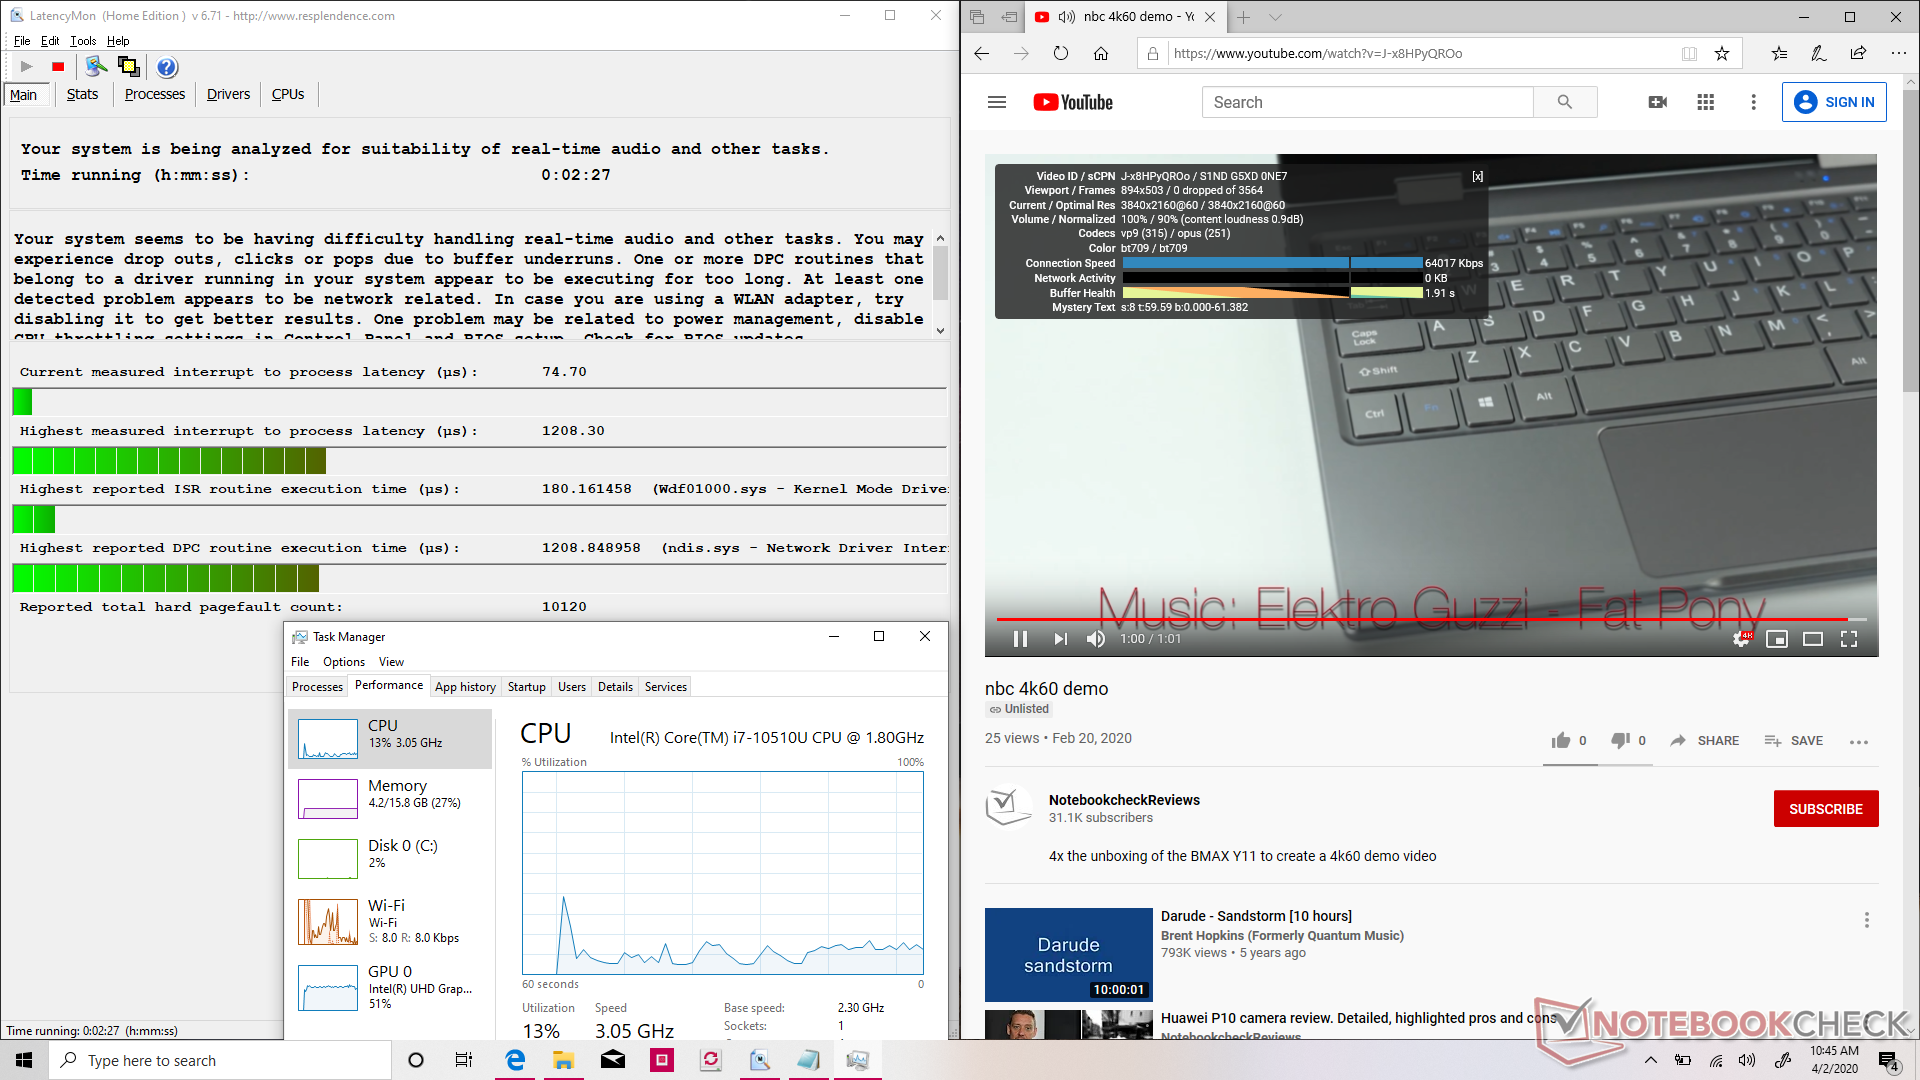
LatencyMon shows DPC latency issues when opening multiple tabs, playing 4K video, and running Prime95 in sequence.
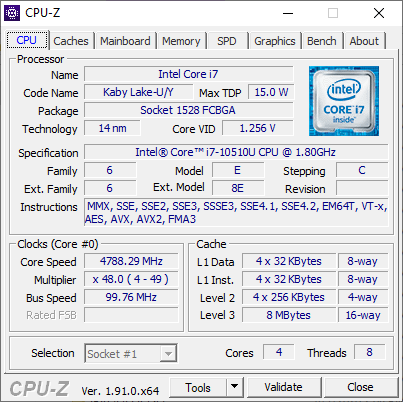

Processor
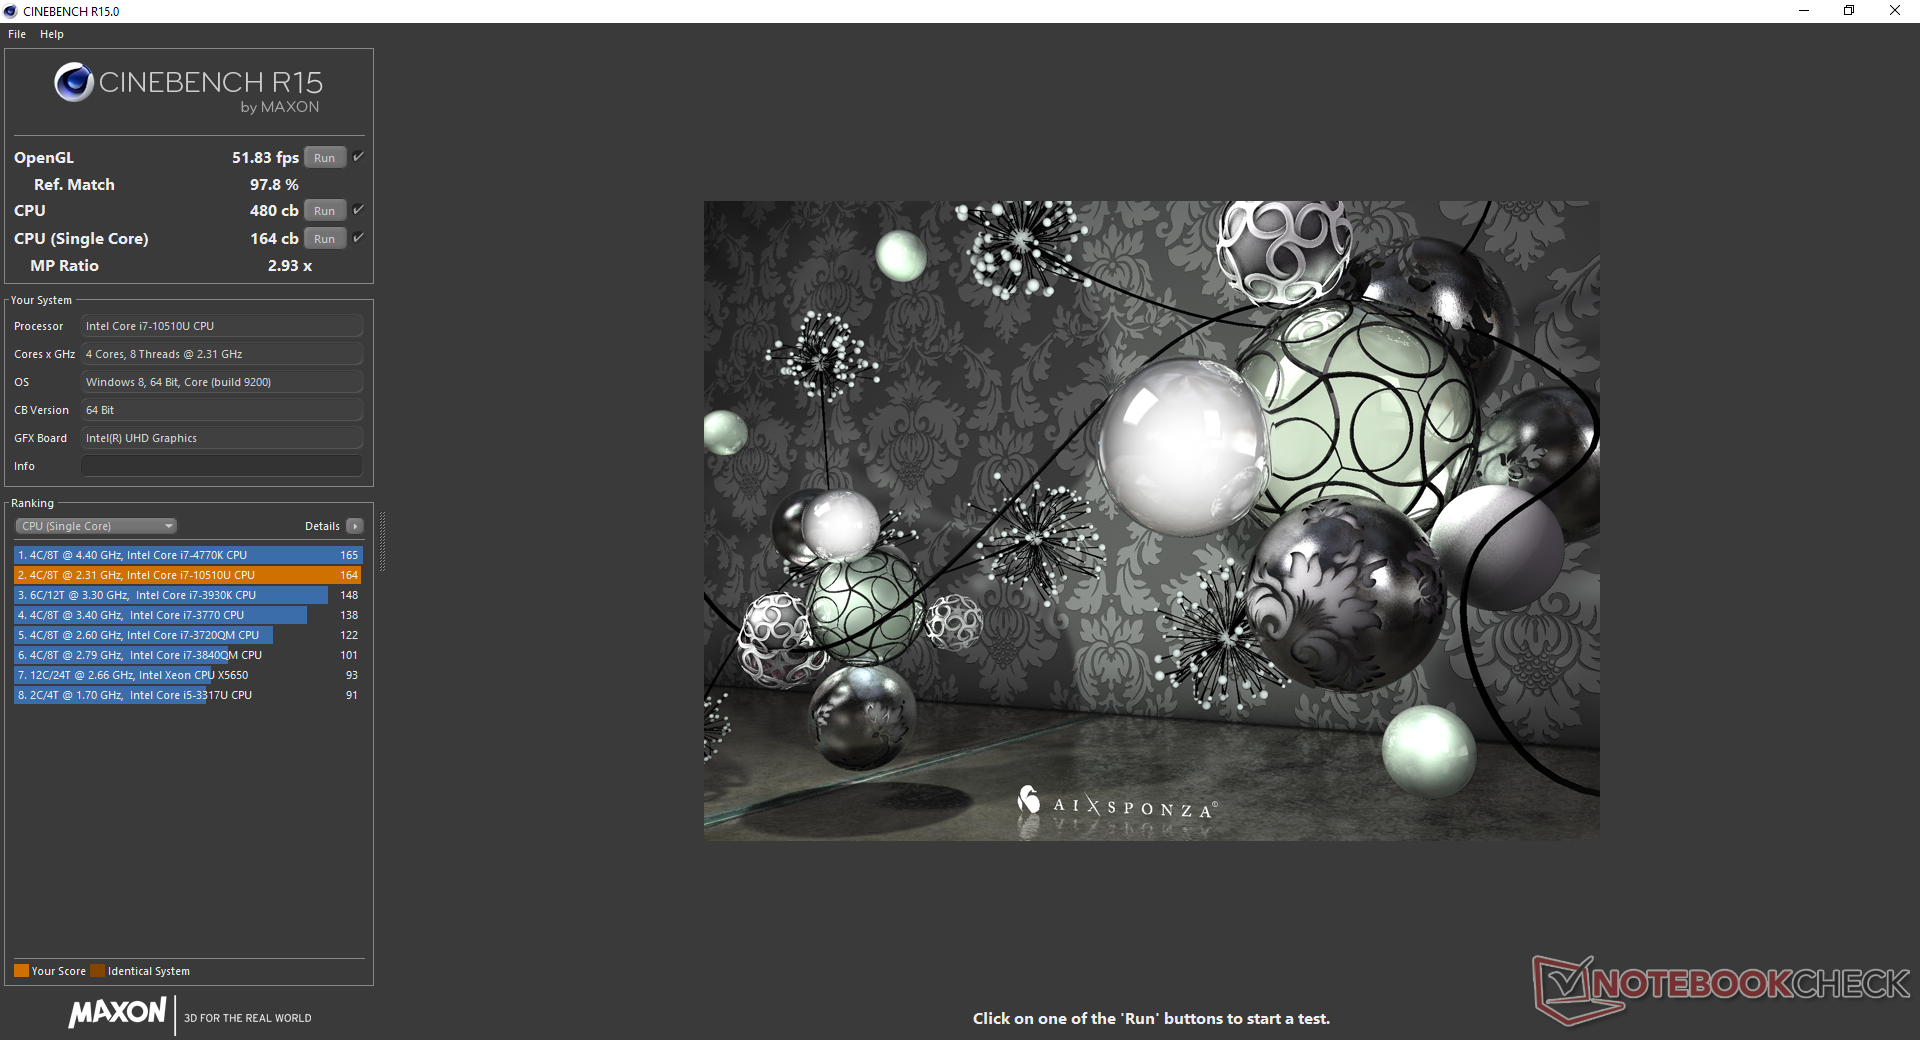
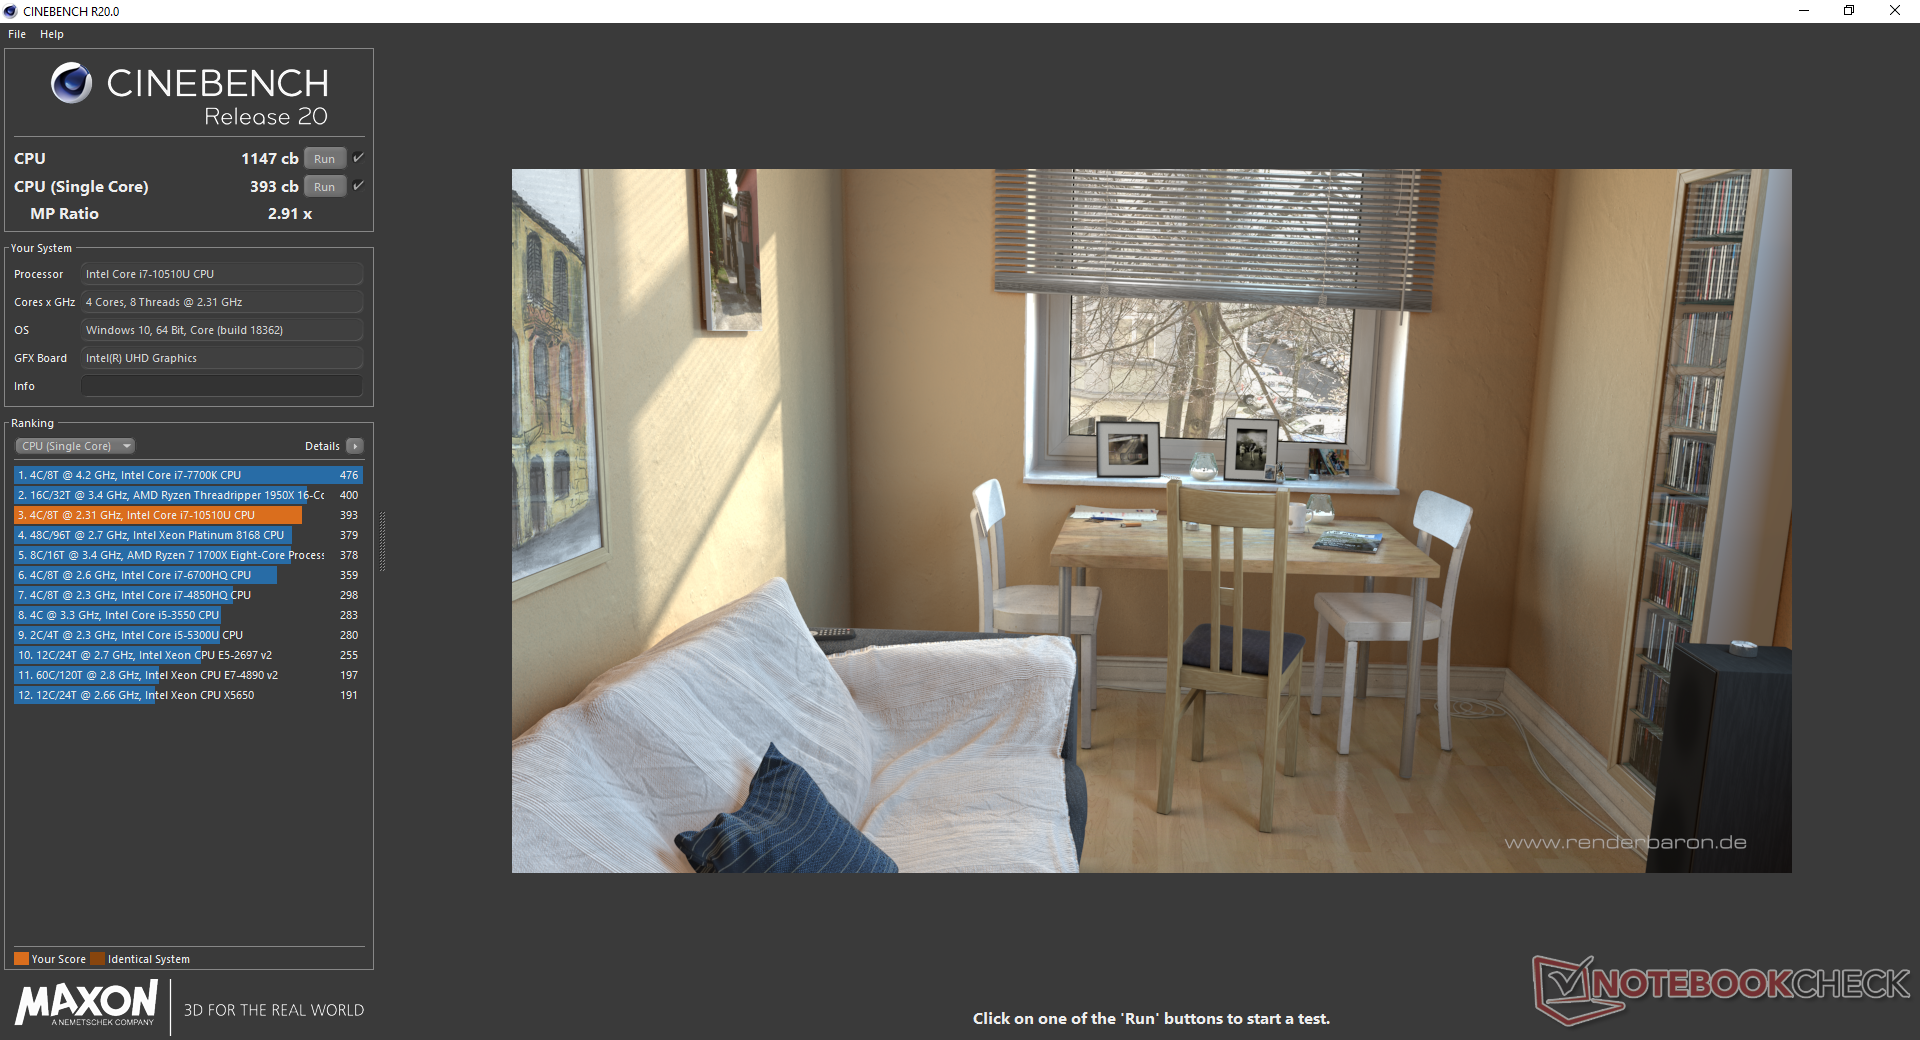
The CPUs in LG Gram laptops tend to perform slower than average. The Core i7-8565U in the Gram 17, for example, is 13 percent slower than the average Core i7-8565U taken from 50 other laptops. The Core i7-10510U in our Gram 14 is even worse at about 14 to 28 percent slower than the average Core i7-10510U. The wide margin means some Core i5-10210U laptops like the Lenovo Yoga C740-14IML can actually outperform the more expensive Gram 14. The Lenovo ThinkPad T490, which actually comes with the same i7-10510U CPU as our LG, is able to run 40 percent faster even after accounting for throttling.
See our dedicated page on the Core i7-10510U for more technical information and benchmark comparisons.
| wPrime 2.10 - 1024m | |
| Microsoft Surface Laptop 3 13 Core i5-1035G7 | |
| Dell XPS 13 7390 2-in-1 Core i7 | |
| Dell XPS 13 7390 Core i7-10710U | |
* ... smaller is better
System Performance
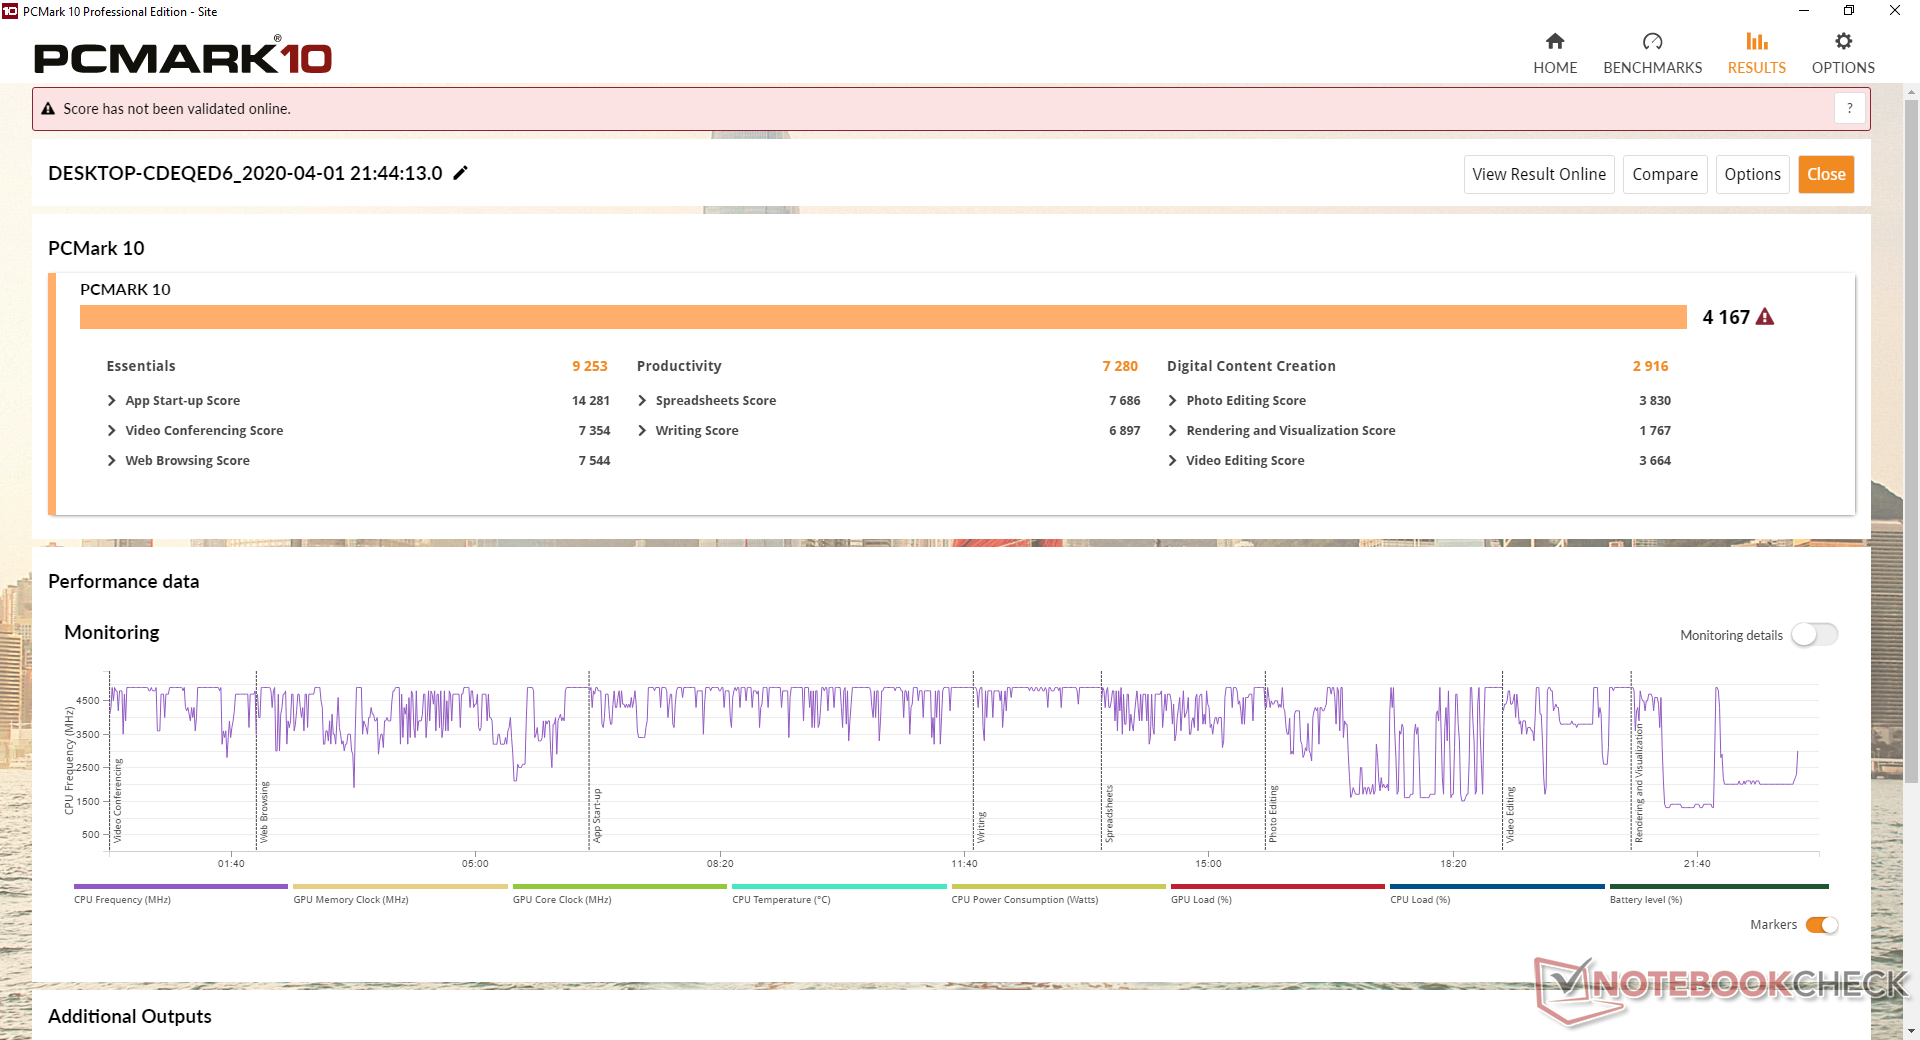
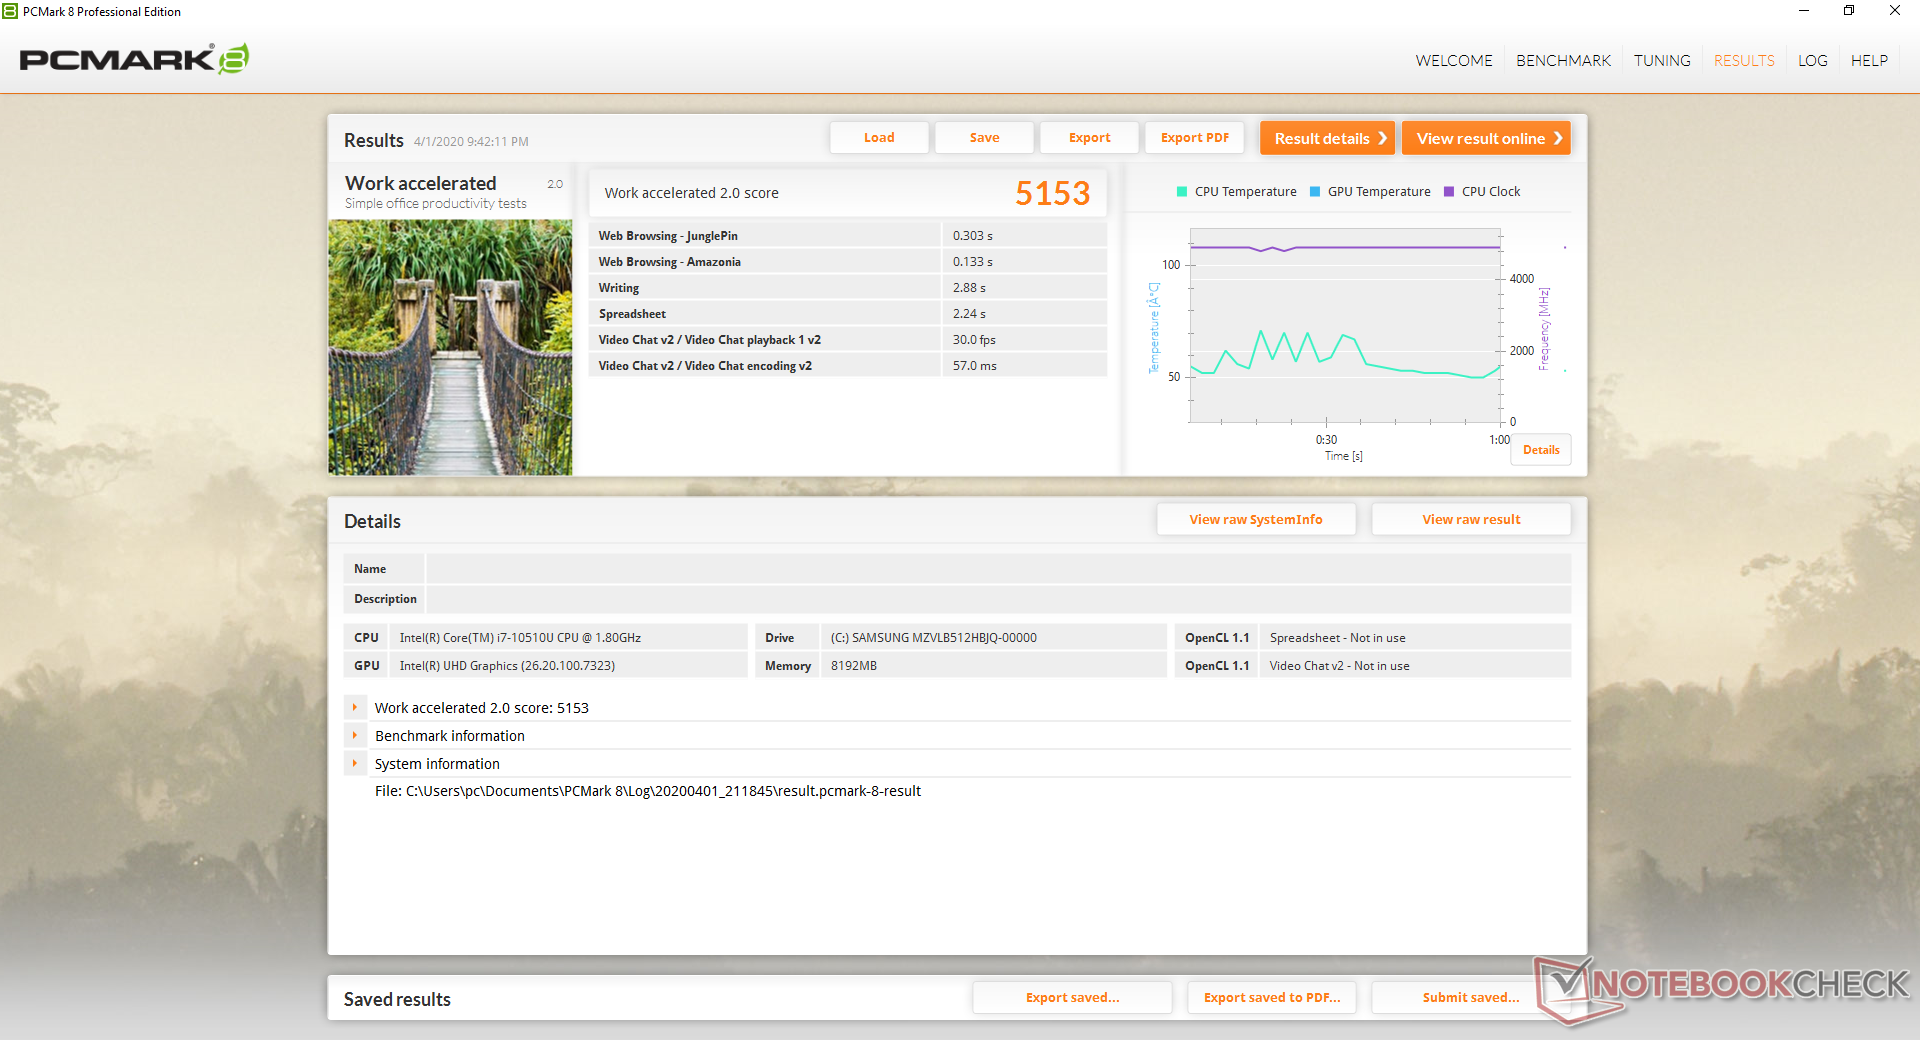
PCMark benchmarks are where we expect them to be in spite of the below average CPU performance mentioned above. This means that day-to-day activities like browsing, multi-tasking or word processing will not feel any slower than your typical Ultrabook.
We experienced no software or hardware issues during our time with the test unit.
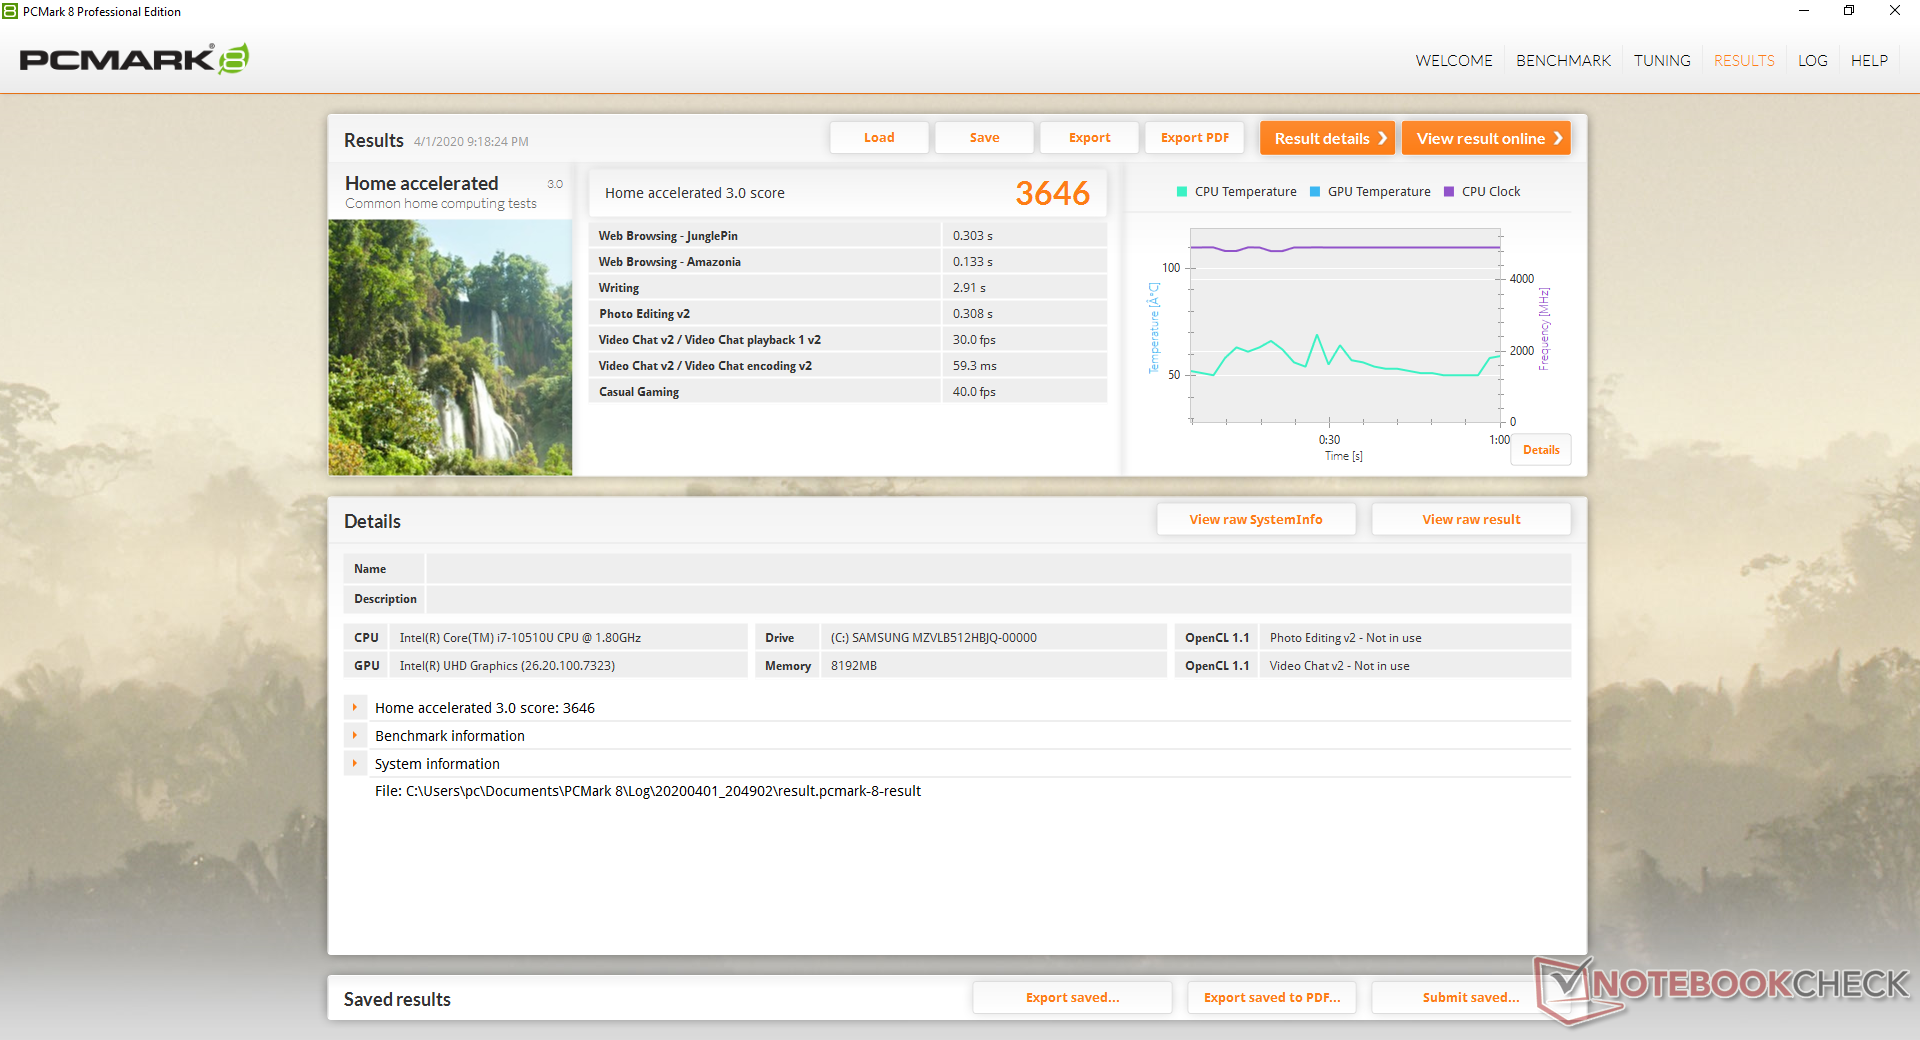
| PCMark 8 Home Score Accelerated v2 | 3646 points | |
| PCMark 8 Work Score Accelerated v2 | 5153 points | |
| PCMark 10 Score | 4167 points | |
Help | ||
Storage Devices
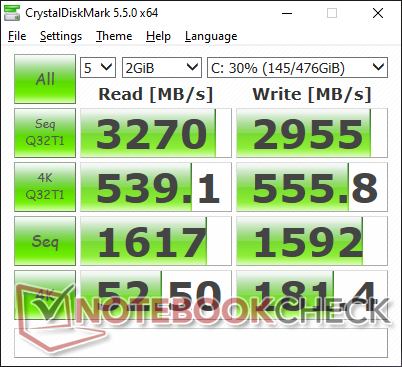
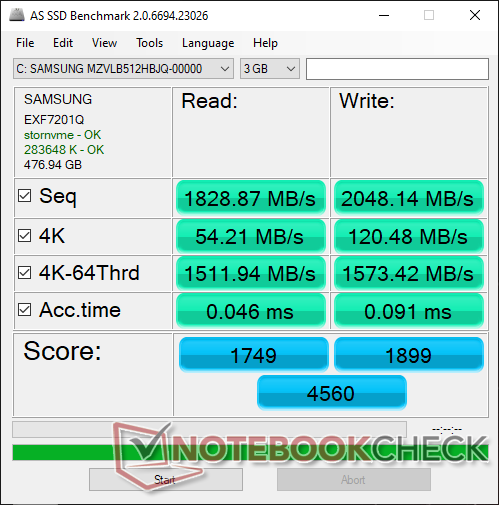
There is only one internal storage bay to keep size and weight in check. Our retail unit comes equipped with a 512 GB Samsung PM981a PCIe SSD whereas our 2019 Gram 14 clamshell came with a slower drive from SK Hynix. There's no guarantee that all retail units will have Samsung SSDs as OEMs and resellers often have multiple suppliers. Consider yourself lucky if you get a Samsung drive as they are usually faster than those from Intel, SK Hynix or Toshiba.
See our table of HDDs and SSDs for more benchmark comparisons.
| LG Gram 14T90N Samsung SSD PM981a MZVLB512HBJQ | LG Gram 14Z980-U.AAW5U1 SK Hynix SC313 HFS256G39TNF | Asus ZenBook 14 UM431DA-AM020T SK hynix BC501 HFM512GDHTNG-8310A | Dell XPS 13 7390 2-in-1 Core i7 Toshiba BG4 KBG40ZPZ512G | Lenovo ThinkPad X1 Carbon G7 20R1-000YUS WDC PC SN730 SDBPNTY-512G | |
|---|---|---|---|---|---|
| AS SSD | -63% | -32% | -76% | -21% | |
| Seq Read (MB/s) | 1829 | 476.1 -74% | 1417 -23% | 1801 -2% | 1786 -2% |
| Seq Write (MB/s) | 2048 | 487.4 -76% | 781 -62% | 1125 -45% | 1259 -39% |
| 4K Read (MB/s) | 54.2 | 30.57 -44% | 37.03 -32% | 39.7 -27% | 45.86 -15% |
| 4K Write (MB/s) | 120.5 | 66.1 -45% | 80.1 -34% | 67 -44% | 147.9 23% |
| 4K-64 Read (MB/s) | 1512 | 352.9 -77% | 740 -51% | 1253 -17% | 885 -41% |
| 4K-64 Write (MB/s) | 1573 | 263.1 -83% | 748 -52% | 209 -87% | 950 -40% |
| Access Time Read * (ms) | 0.046 | 0.092 -100% | 0.047 -2% | 0.069 -50% | 0.058 -26% |
| Access Time Write * (ms) | 0.091 | 0.055 40% | 0.045 51% | 0.625 -587% | 0.074 19% |
| Score Read (Points) | 1749 | 431 -75% | 918 -48% | 1472 -16% | 1110 -37% |
| Score Write (Points) | 1899 | 378 -80% | 906 -52% | 388 -80% | 1224 -36% |
| Score Total (Points) | 4560 | 1040 -77% | 2270 -50% | 2583 -43% | 2885 -37% |
| Copy ISO MB/s (MB/s) | 1891 | 514 -73% | 1293 -32% | 1384 -27% | |
| Copy Program MB/s (MB/s) | 569 | 259.3 -54% | 560 -2% | 525 -8% | |
| Copy Game MB/s (MB/s) | 1425 | 521 -63% | 927 -35% | 1008 -29% | |
| CrystalDiskMark 5.2 / 6 | -69% | -45% | -23% | -3% | |
| Write 4K (MB/s) | 181.4 | 74.7 -59% | 118.8 -35% | 106.7 -41% | 151.5 -16% |
| Read 4K (MB/s) | 52.5 | 14.89 -72% | 41.62 -21% | 49.94 -5% | 45.83 -13% |
| Write Seq (MB/s) | 1592 | 502 -68% | 796 -50% | 1223 -23% | 2060 29% |
| Read Seq (MB/s) | 1617 | 498.6 -69% | 1101 -32% | 1801 11% | 1973 22% |
| Write 4K Q32T1 (MB/s) | 556 | 214.3 -61% | 234.7 -58% | 325.3 -41% | 489.8 -12% |
| Read 4K Q32T1 (MB/s) | 539 | 225.5 -58% | 313.8 -42% | 551 2% | 386.2 -28% |
| Write Seq Q32T1 (MB/s) | 2955 | 505 -83% | 842 -72% | 1224 -59% | 2703 -9% |
| Read Seq Q32T1 (MB/s) | 3270 | 560 -83% | 1645 -50% | 2350 -28% | 3376 3% |
| Total Average (Program / Settings) | -66% /
-65% | -39% /
-38% | -50% /
-57% | -12% /
-15% |
* ... smaller is better

GPU Performance
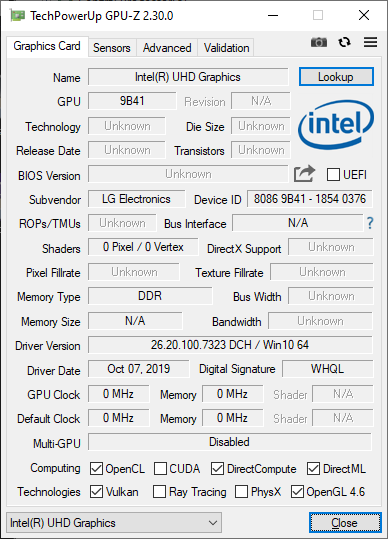
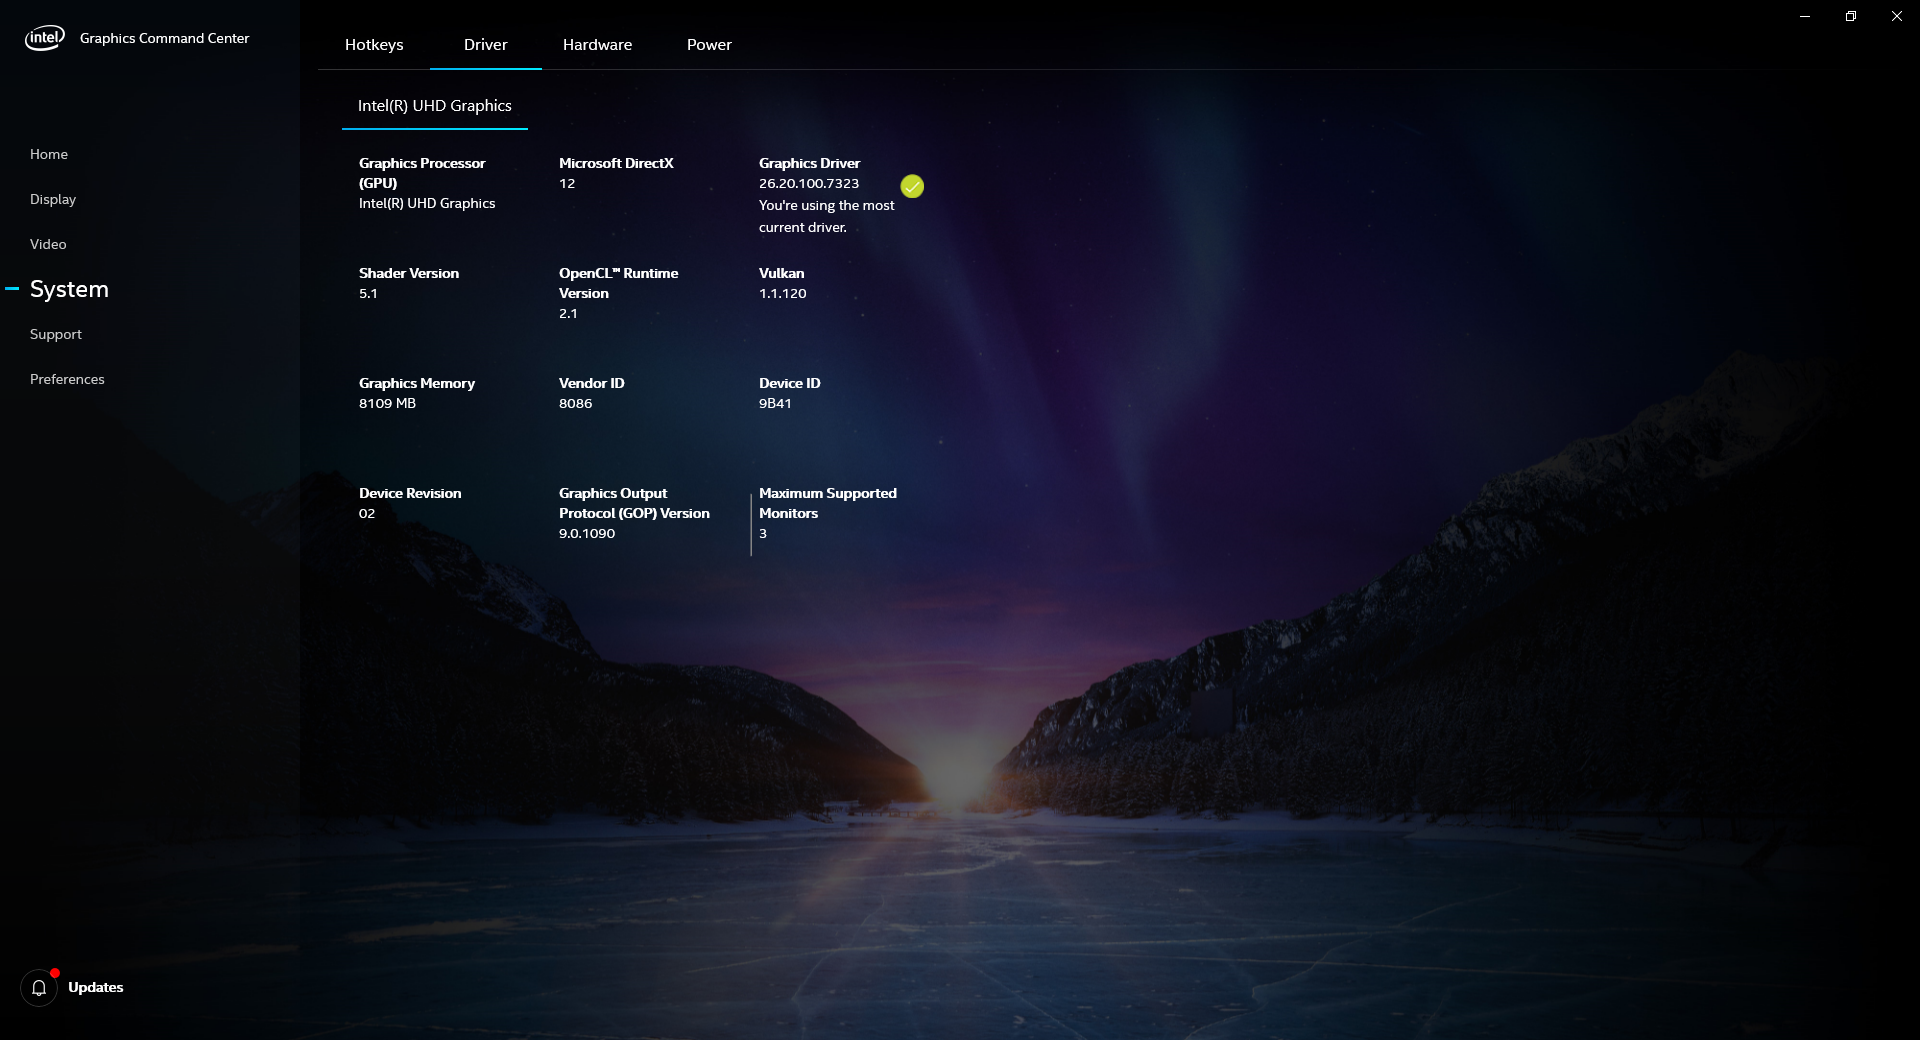
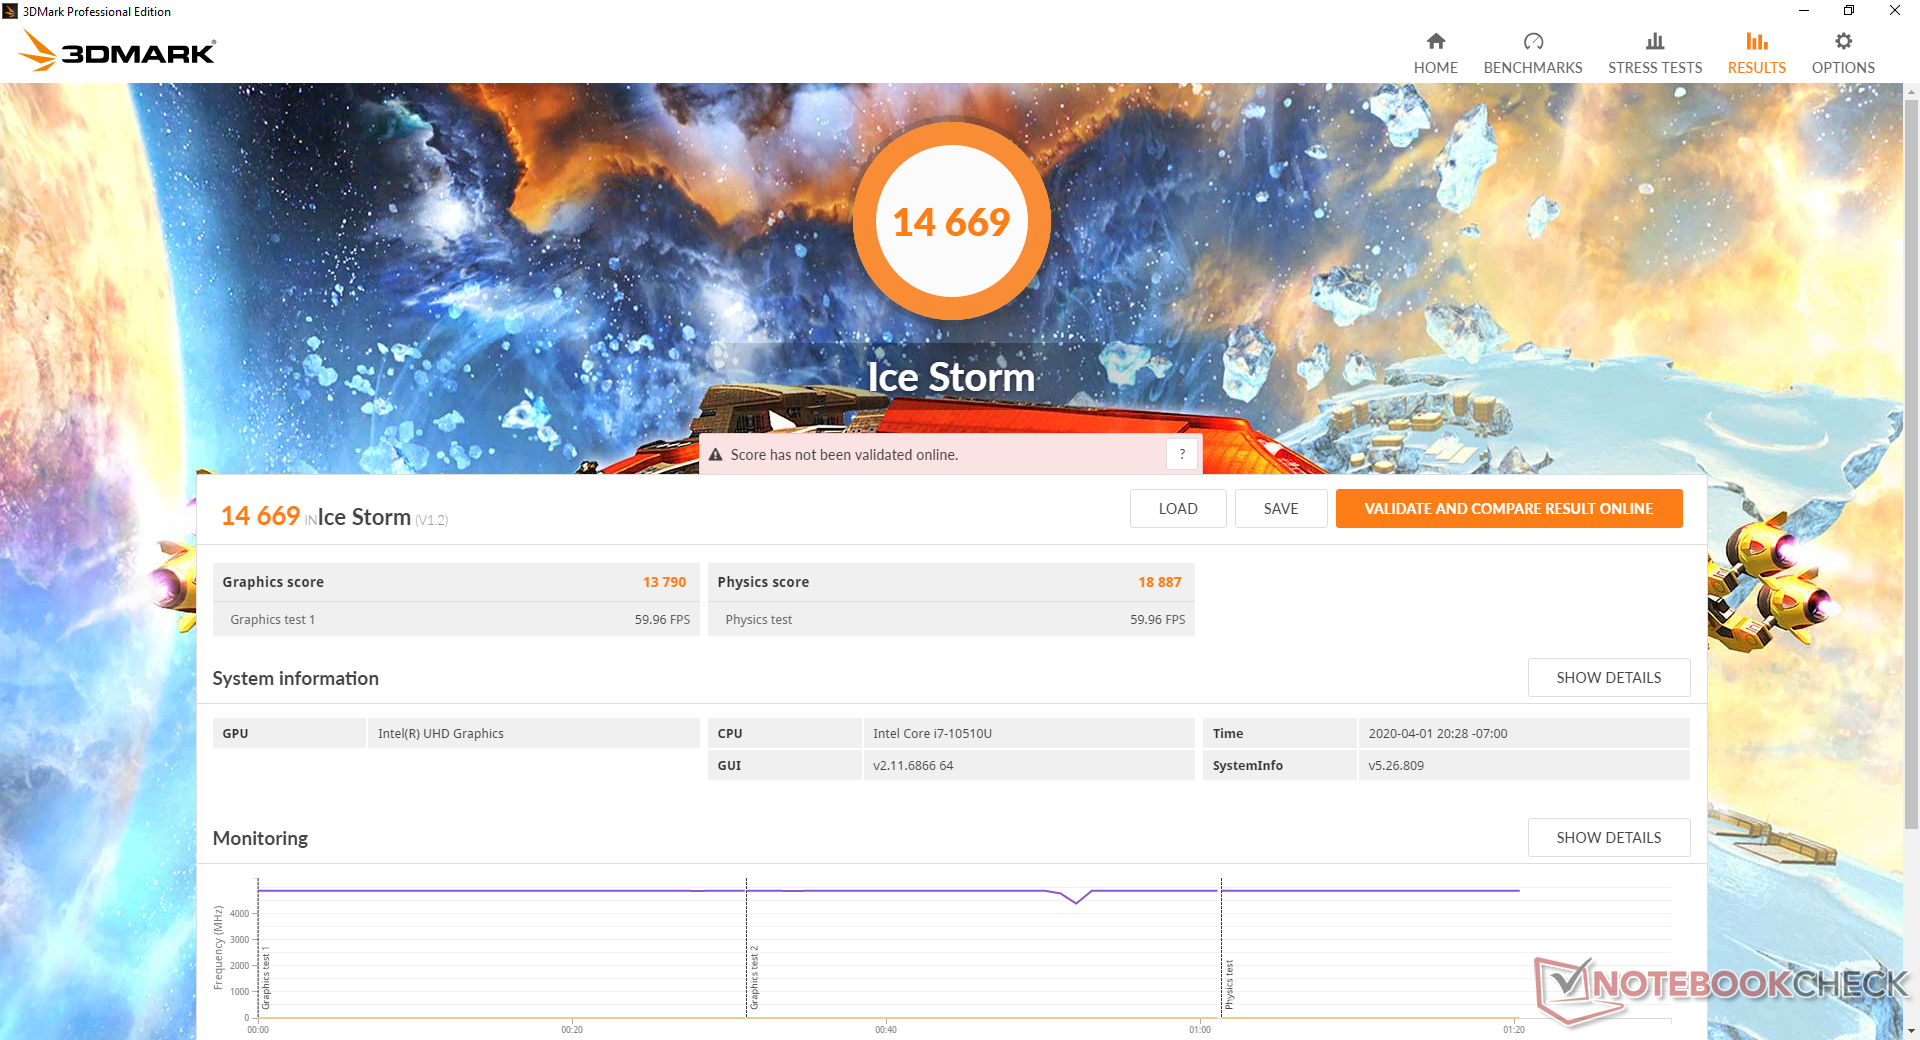
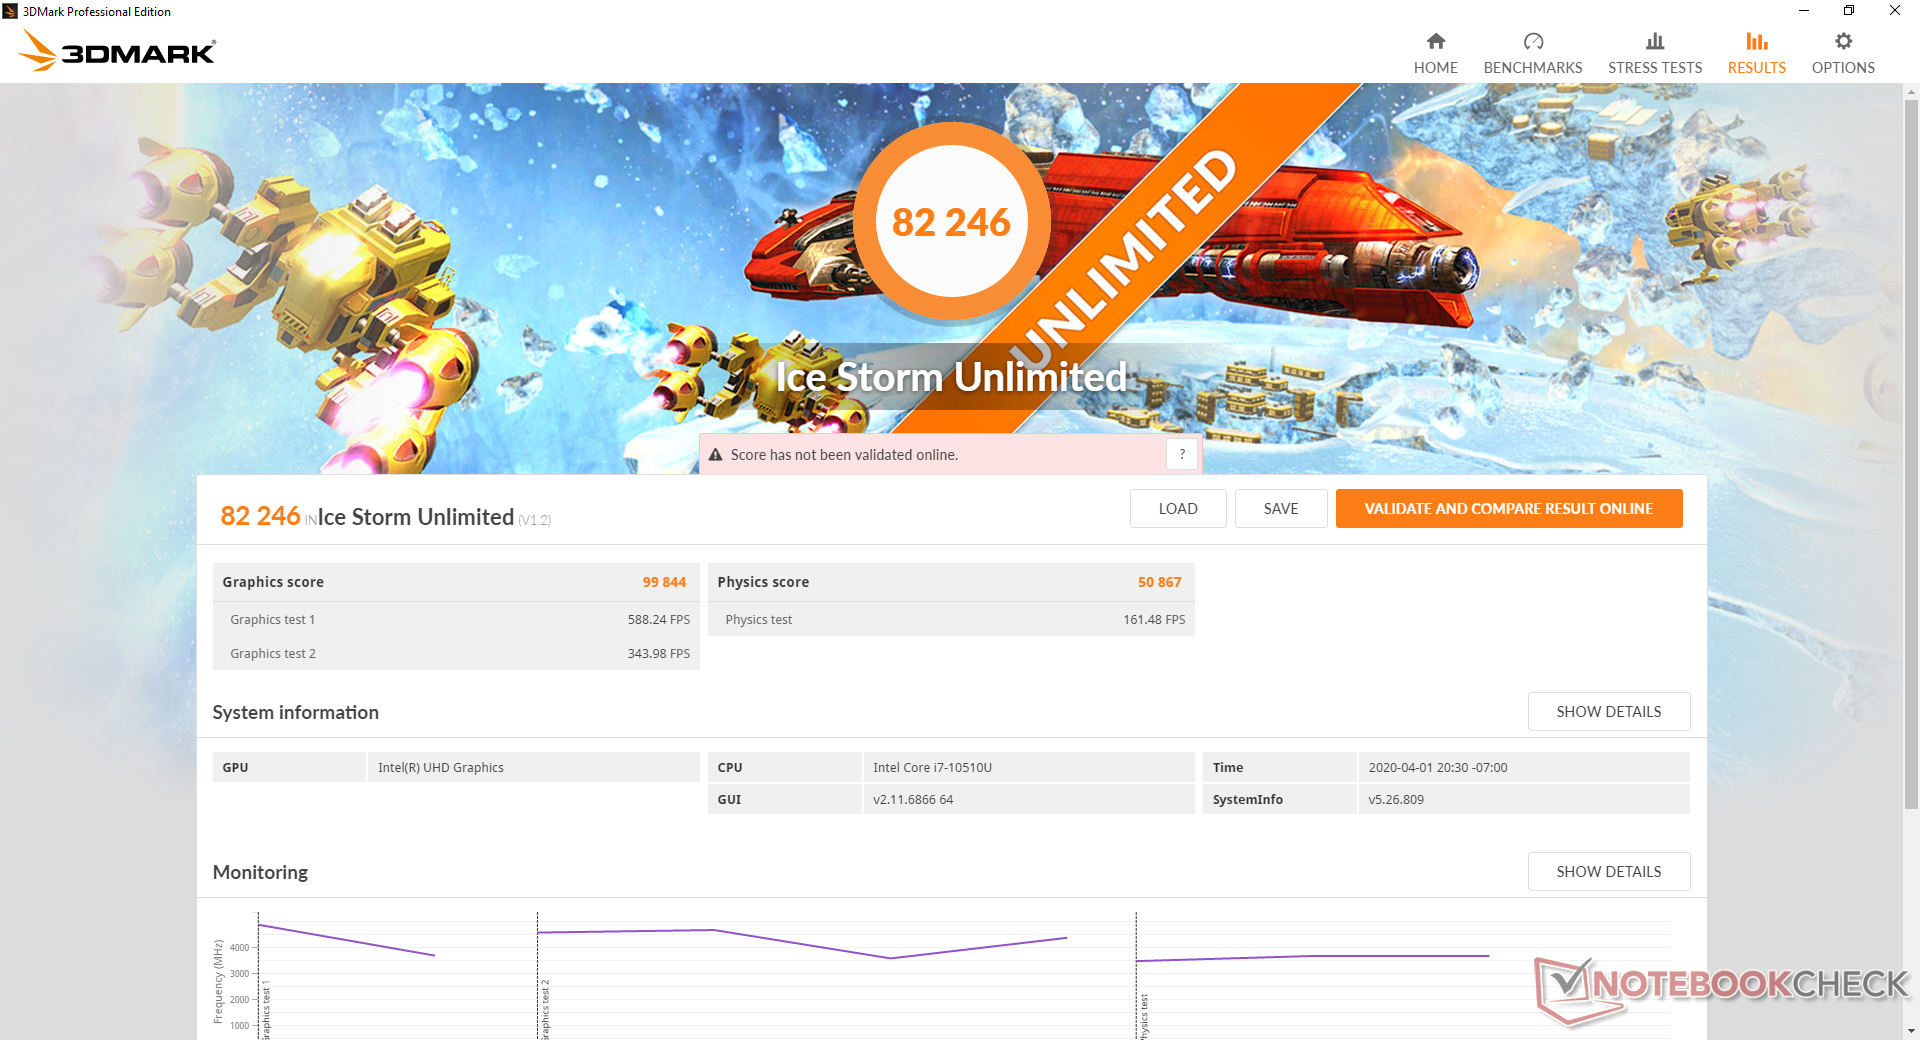
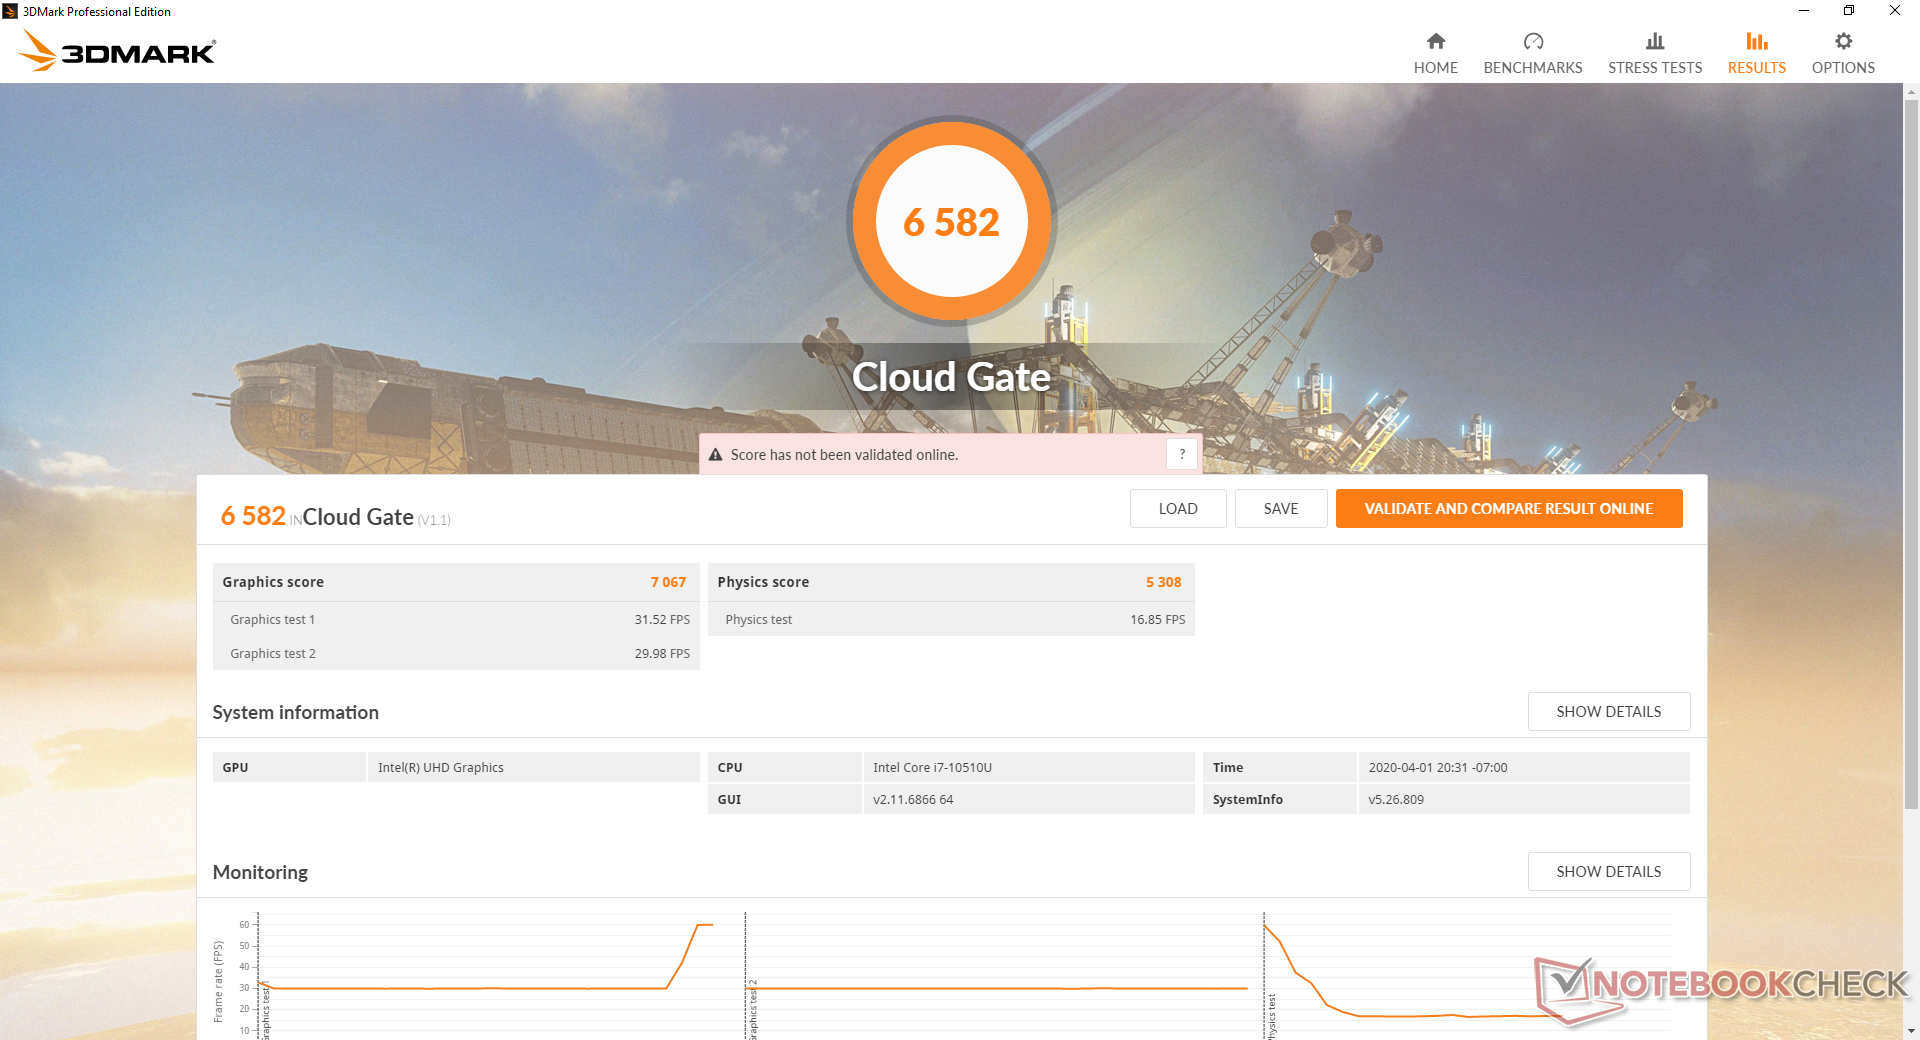
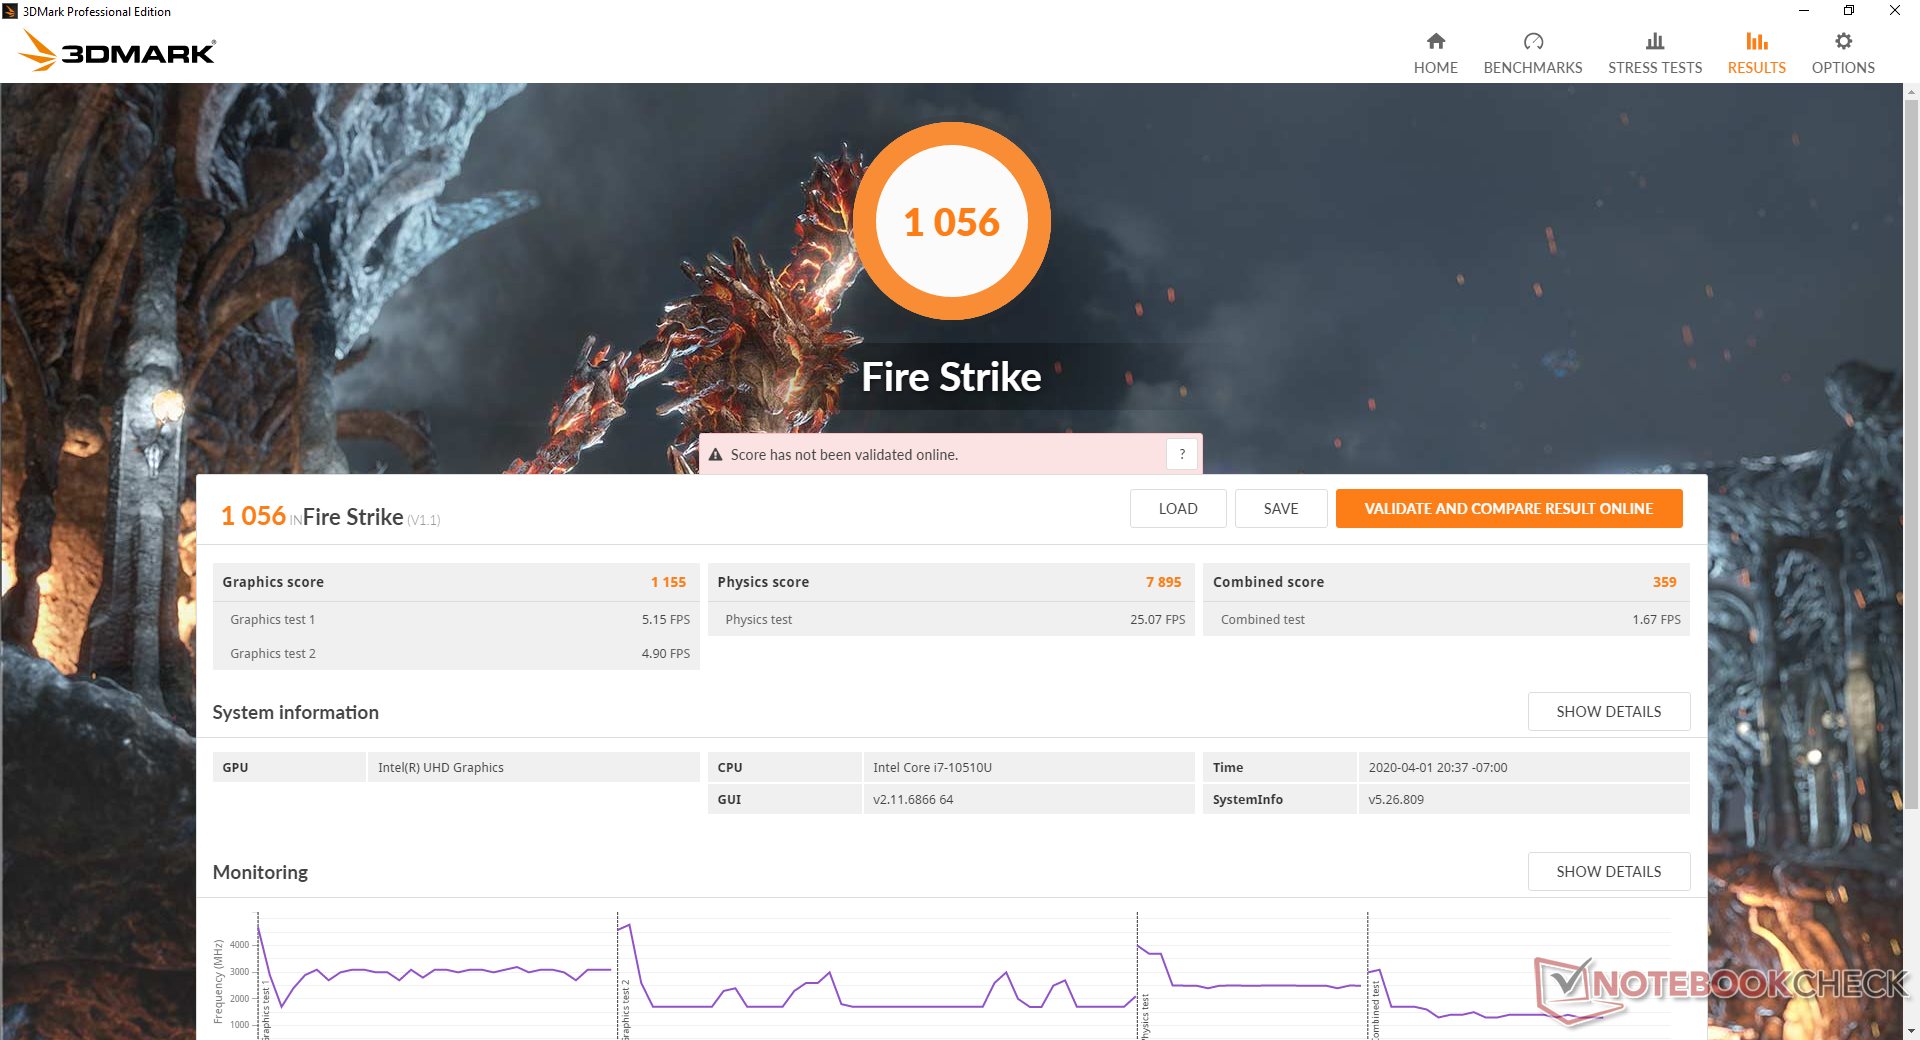
The integrated UHD Graphics 620 in our LG remains identical to the integrated GPU from the Whiskey Lake-U series. 3DMark benchmarks rank it where we expect it to be relative to other laptops with the same GPU. The Iris Plus G7 and the Radeon RX Vega 10 on Ice Lake laptops and Ryzen laptops, respectively, can each offer over two times the raw performance of the UHD Graphics 620. The system is otherwise sufficient for smooth 4K60 video playback.
See our dedicated page on the UHD Graphics 620 for more technical details and benchmark comparisons.
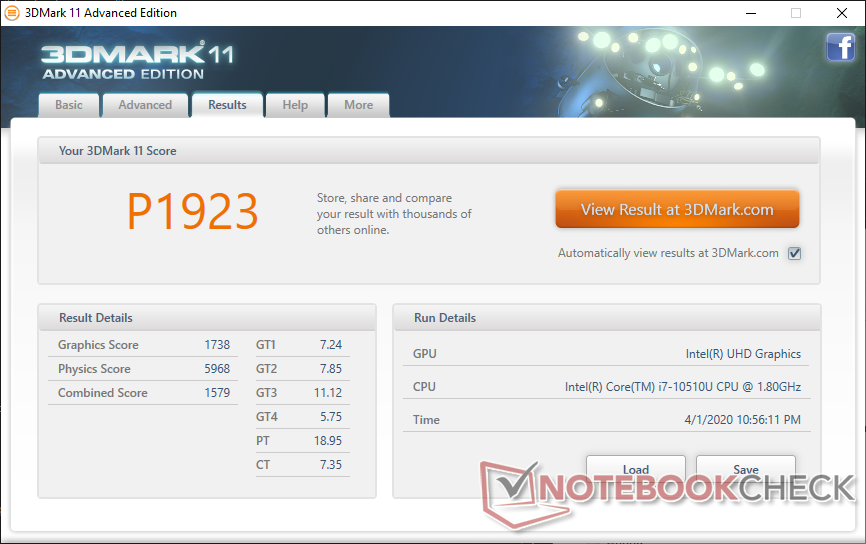

| 3DMark 11 Performance | 1923 points | |
| 3DMark Ice Storm Standard Score | 14669 points | |
| 3DMark Cloud Gate Standard Score | 6582 points | |
| 3DMark Fire Strike Score | 1056 points | |
| 3DMark Time Spy Score | 429 points | |
Help | ||
| low | med. | high | ultra | |
|---|---|---|---|---|
| BioShock Infinite (2013) | 59.8 | 38.4 | 32 | 10.2 |
| Dota 2 Reborn (2015) | 57.6 | 39.1 | 19 | 17 |
| X-Plane 11.11 (2018) | 20.5 | 13.2 | 12 |
Emissions
System Noise
The system fan will idle during low to low-medium loads when running on batteries for a silent typing experience. Otherwise, fan noise will be at 30 dB(A) against a background of 29 dB(A) when connected to an outlet. Higher loads like gaming will induce a fan noise between 35 dB(A) and 37 dB(A) which is quieter than many Ultrabooks. Perhaps a louder maximum RPM would have allowed for faster sustained CPU clock rates than what we recorded above.
We can notice no electronic noise or coil whine from our test unit.
| LG Gram 14T90N UHD Graphics 620, i7-10510U, Samsung SSD PM981a MZVLB512HBJQ | LG Gram 14Z980-U.AAW5U1 UHD Graphics 620, i5-8250U, SK Hynix SC313 HFS256G39TNF | Asus ZenBook 14 UM431DA-AM020T Vega 10, R7 3700U, SK hynix BC501 HFM512GDHTNG-8310A | Dell XPS 13 7390 2-in-1 Core i7 Iris Plus Graphics G7 (Ice Lake 64 EU), i7-1065G7, Toshiba BG4 KBG40ZPZ512G | Huawei Matebook X Pro i5 GeForce MX150, i5-8250U, Samsung PM961 MZVLW256HEHP | Lenovo Yoga C940-14IIL 81Q9 Iris Plus Graphics G7 (Ice Lake 64 EU), i7-1065G7, Samsung PM981a MZVLB1T0HBLR | |
|---|---|---|---|---|---|---|
| Noise | 4% | 1% | 2% | 0% | 2% | |
| off / environment * (dB) | 29 | 28.2 3% | 29.8 -3% | 28.1 3% | 27.9 4% | 28.5 2% |
| Idle Minimum * (dB) | 30 | 28.4 5% | 28 7% | 28.1 6% | 27.9 7% | 28.5 5% |
| Idle Average * (dB) | 30 | 28.4 5% | 28 7% | 28.1 6% | 27.9 7% | 28.5 5% |
| Idle Maximum * (dB) | 30 | 28.4 5% | 28 7% | 28.1 6% | 27.9 7% | 29 3% |
| Load Average * (dB) | 35.2 | 35.7 -1% | 36.8 -5% | 31.7 10% | 36.2 -3% | 33 6% |
| Load Maximum * (dB) | 37 | 34.2 8% | 39 -5% | 43.4 -17% | 45.2 -22% | 39.5 -7% |
| Witcher 3 ultra * (dB) | 43.4 | 45 | 40.7 |
* ... smaller is better
Noise level
| Idle |
| 30 / 30 / 30 dB(A) |
| Load |
| 35.2 / 37 dB(A) |
 | ||
30 dB silent 40 dB(A) audible 50 dB(A) loud |
||
min: | ||
Temperature
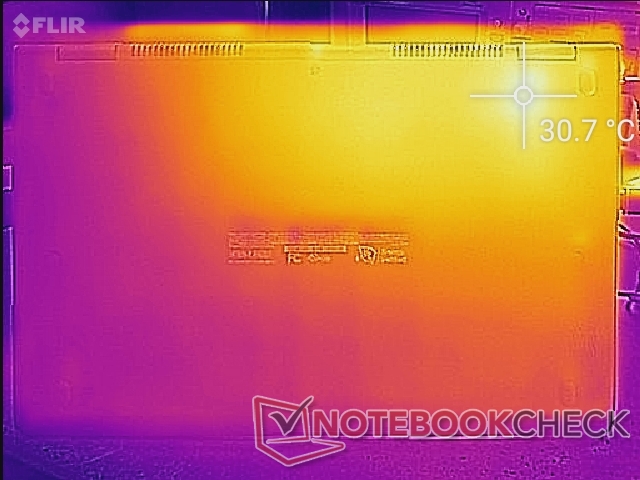
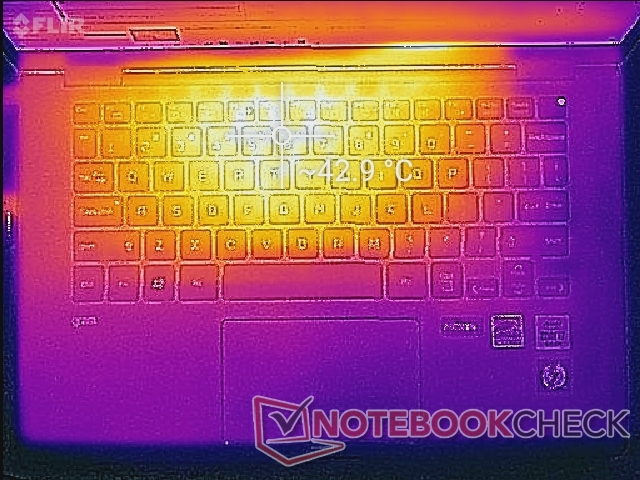
Surface temperatures range from 25 C to 29 C when idling on desktop. If under extreme loads, hot spots near the keyboard center can reach as warm as 43 C which is not unlike what we recorded on the Asus ZenBook 14 or Lenovo Yoga C940-14 when under similar conditions. These alternatives, however, offer much faster graphics performance than our LG Gram without running any warmer.
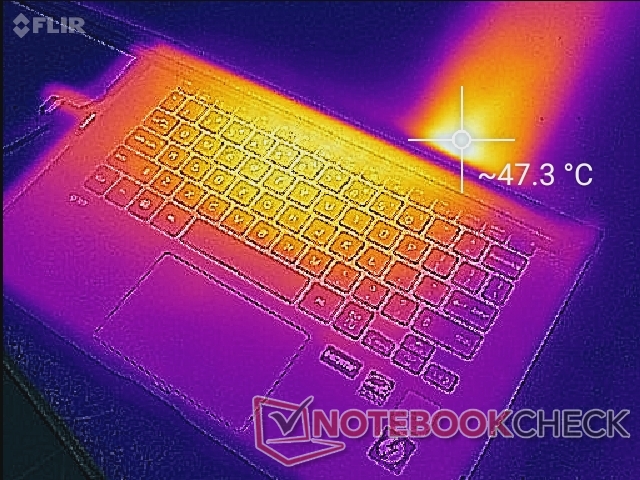

(±) The maximum temperature on the upper side is 43.2 °C / 110 F, compared to the average of 35.4 °C / 96 F, ranging from 19.6 to 60 °C for the class Convertible.
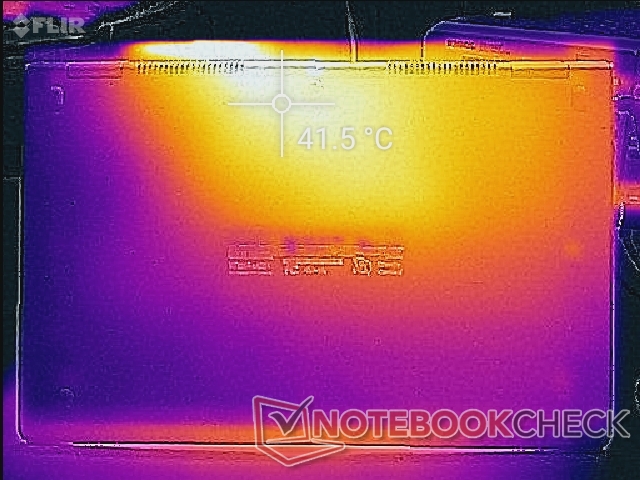
(±) The bottom heats up to a maximum of 41.6 °C / 107 F, compared to the average of 36.9 °C / 98 F
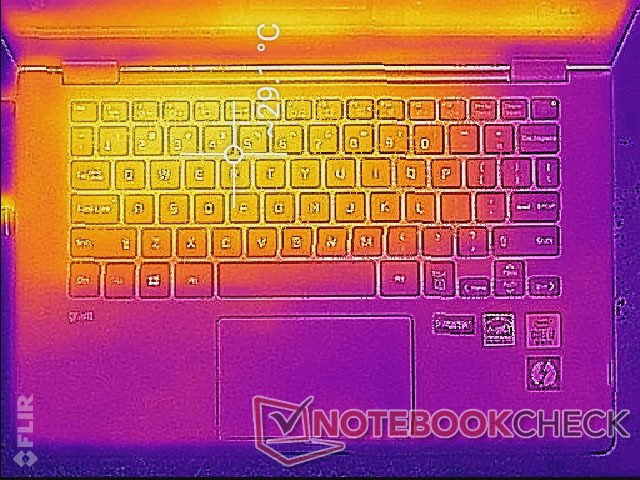
(+) In idle usage, the average temperature for the upper side is 26.7 °C / 80 F, compared to the device average of 30.3 °C / 87 F.
(+) The palmrests and touchpad are cooler than skin temperature with a maximum of 30 °C / 86 F and are therefore cool to the touch.
(±) The average temperature of the palmrest area of similar devices was 28 °C / 82.4 F (-2 °C / -3.6 F).
Stress Test
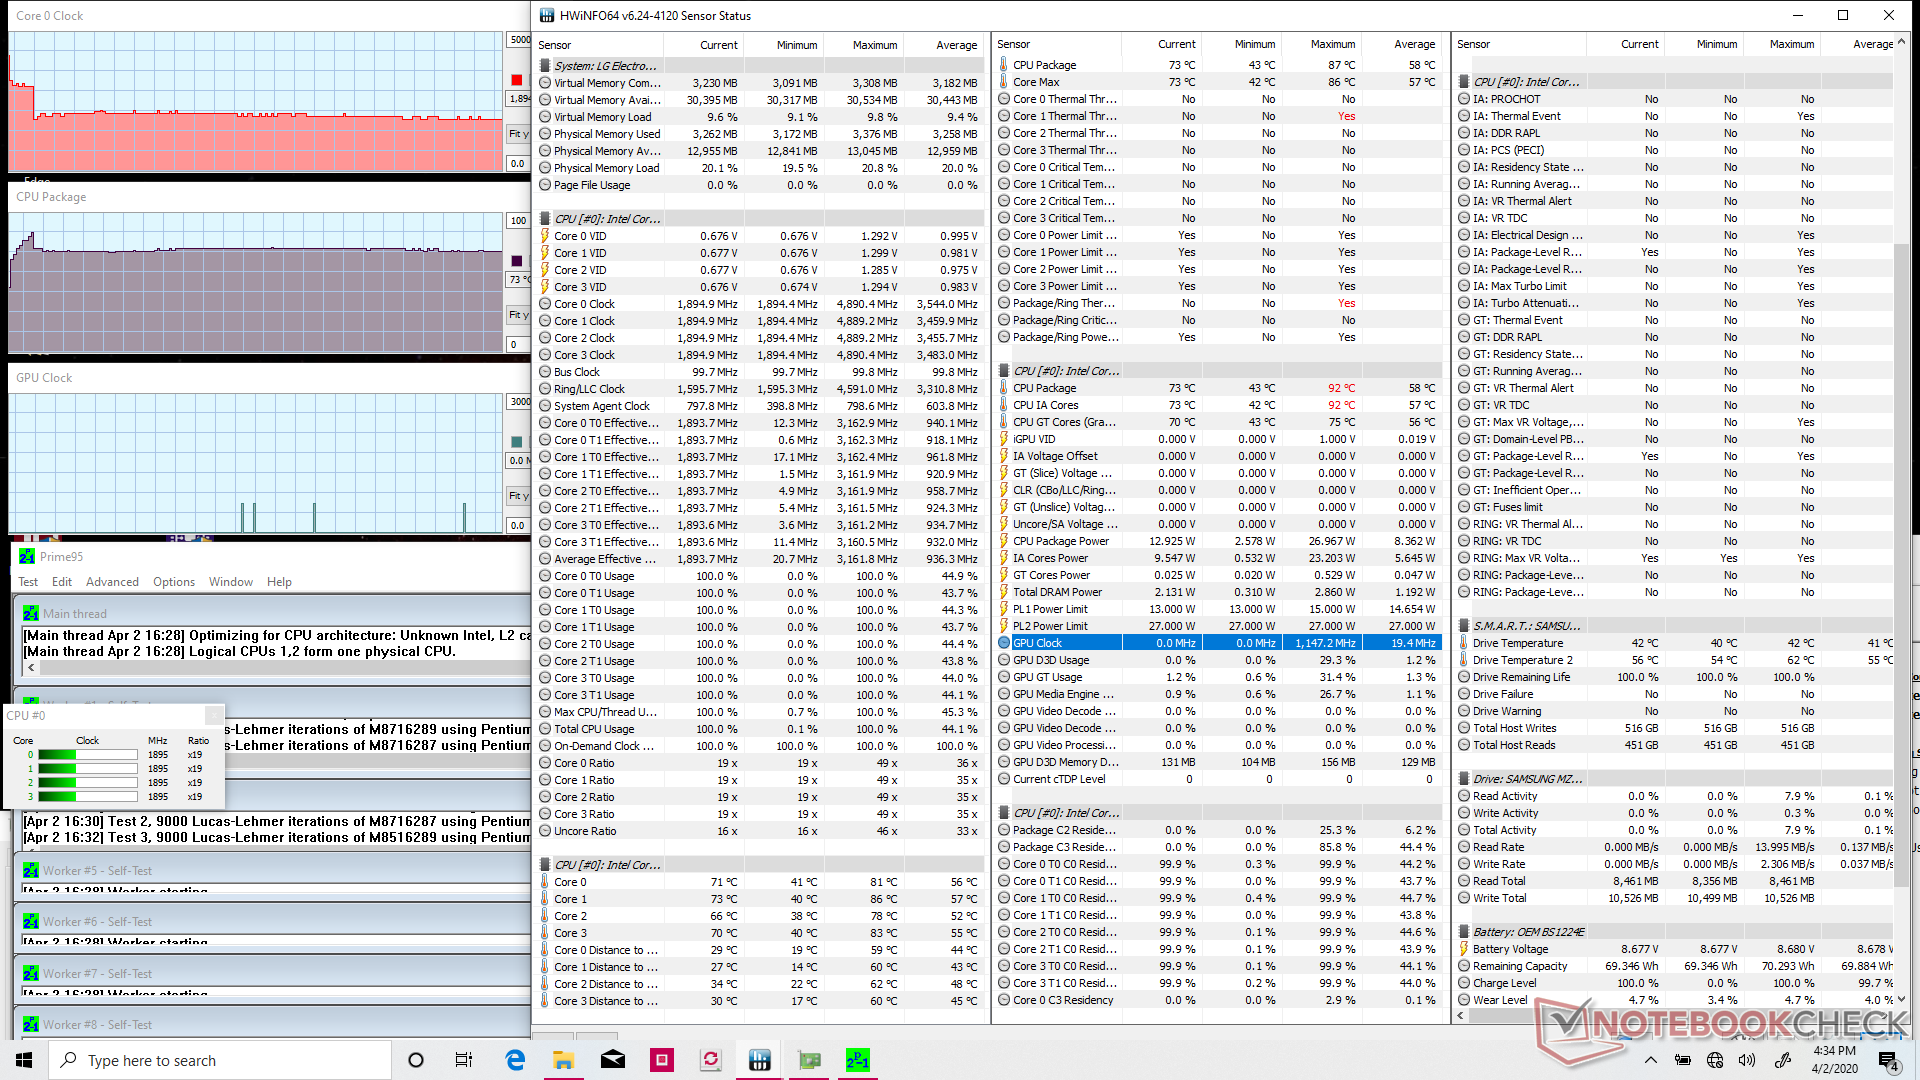
We stress the laptop with synthetic loads to identify for any potential throttling or stability issues. When running Prime95, the CPU can be observed boosting up to 3.2 GHz for the first few seconds until hitting a core a temperature of 87 C. Thereafter, clock rates drop like a rock to a stable 1.9 GHz in order to maintain a core temperature of 75 C. Since the base clock rate of the Core i7-10510U is 1.8 GHz, this suggests that the laptop is wholly incapable of maintaining high Turbo Boost frequencies for anything longer than just a few seconds. The finding corroborates with our CineBench loop test above and our power consumption measurements below.
Performance will not be reduced if running on battery power. A 3DMark 11 test on batteries returns Physics and Graphics scores of 6475 and 1836 points, respectively, compared to 5968 and 1738 points when on mains.
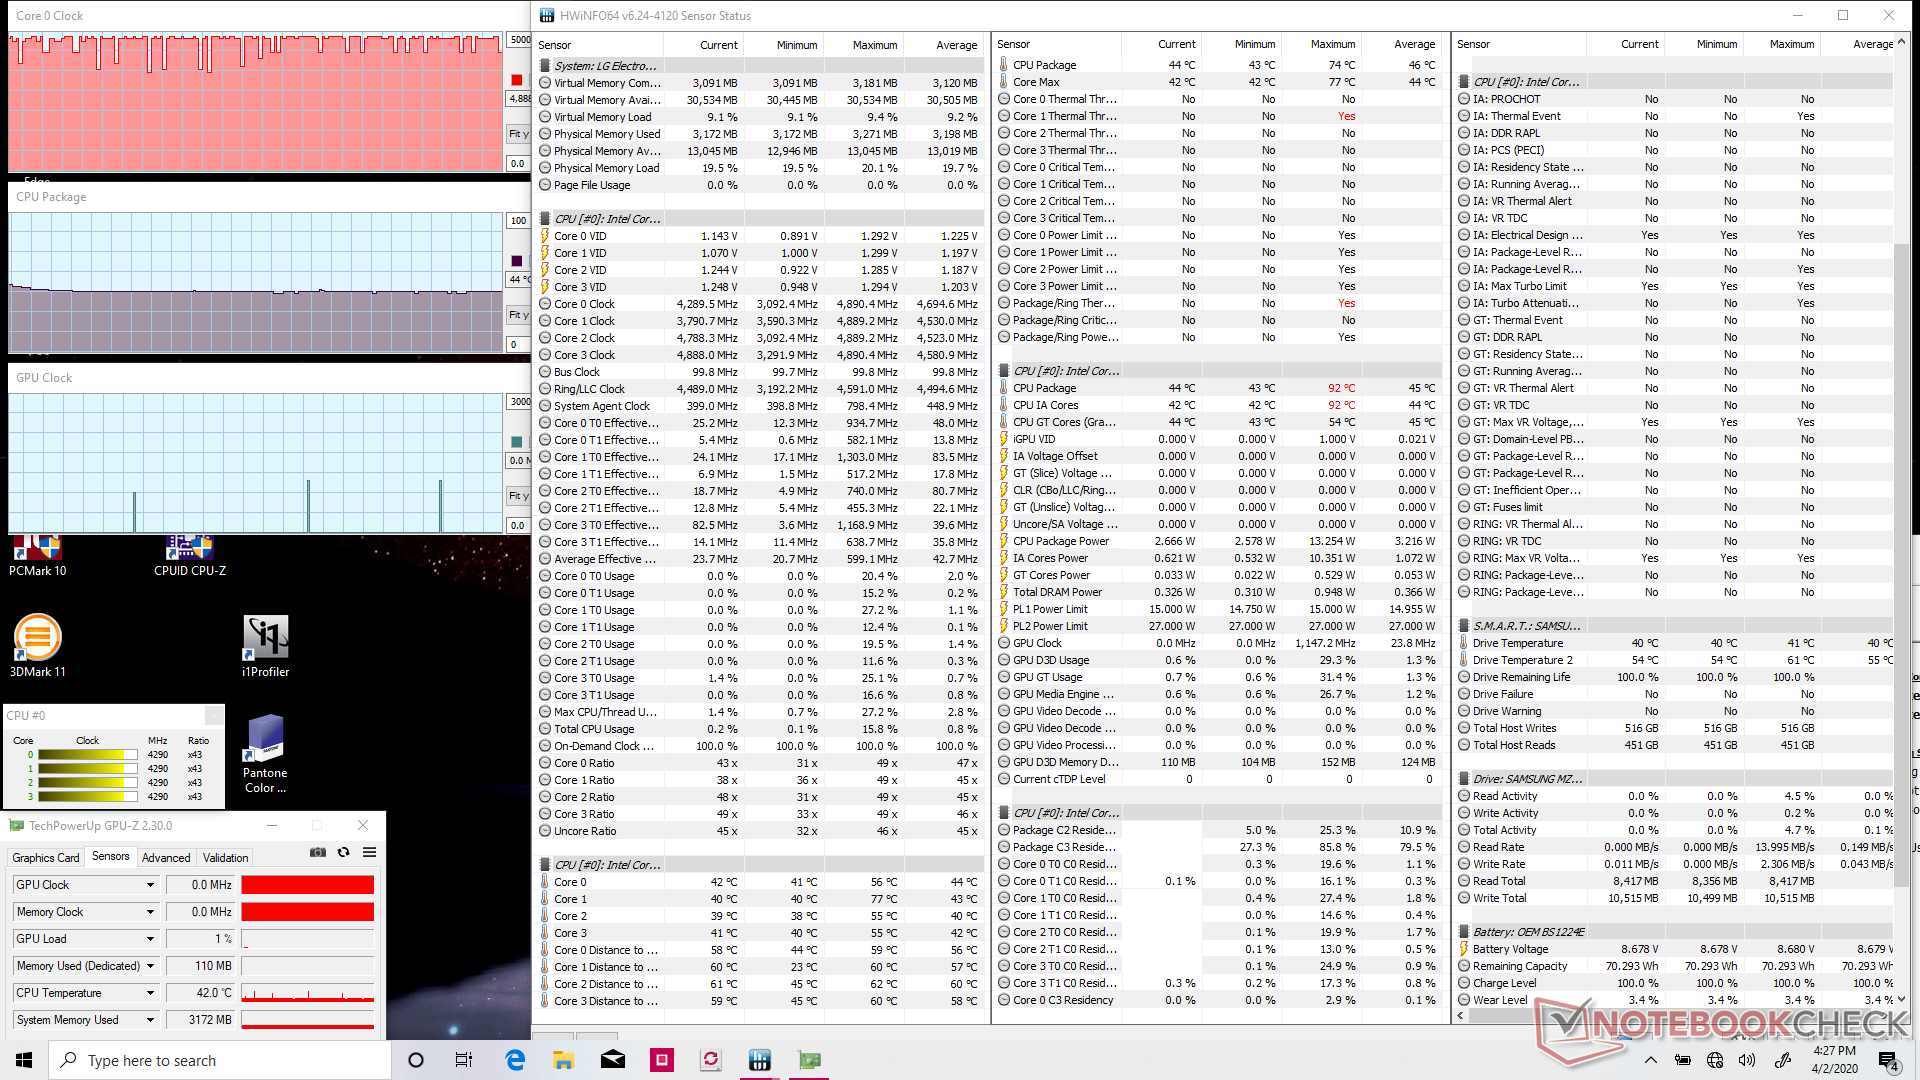
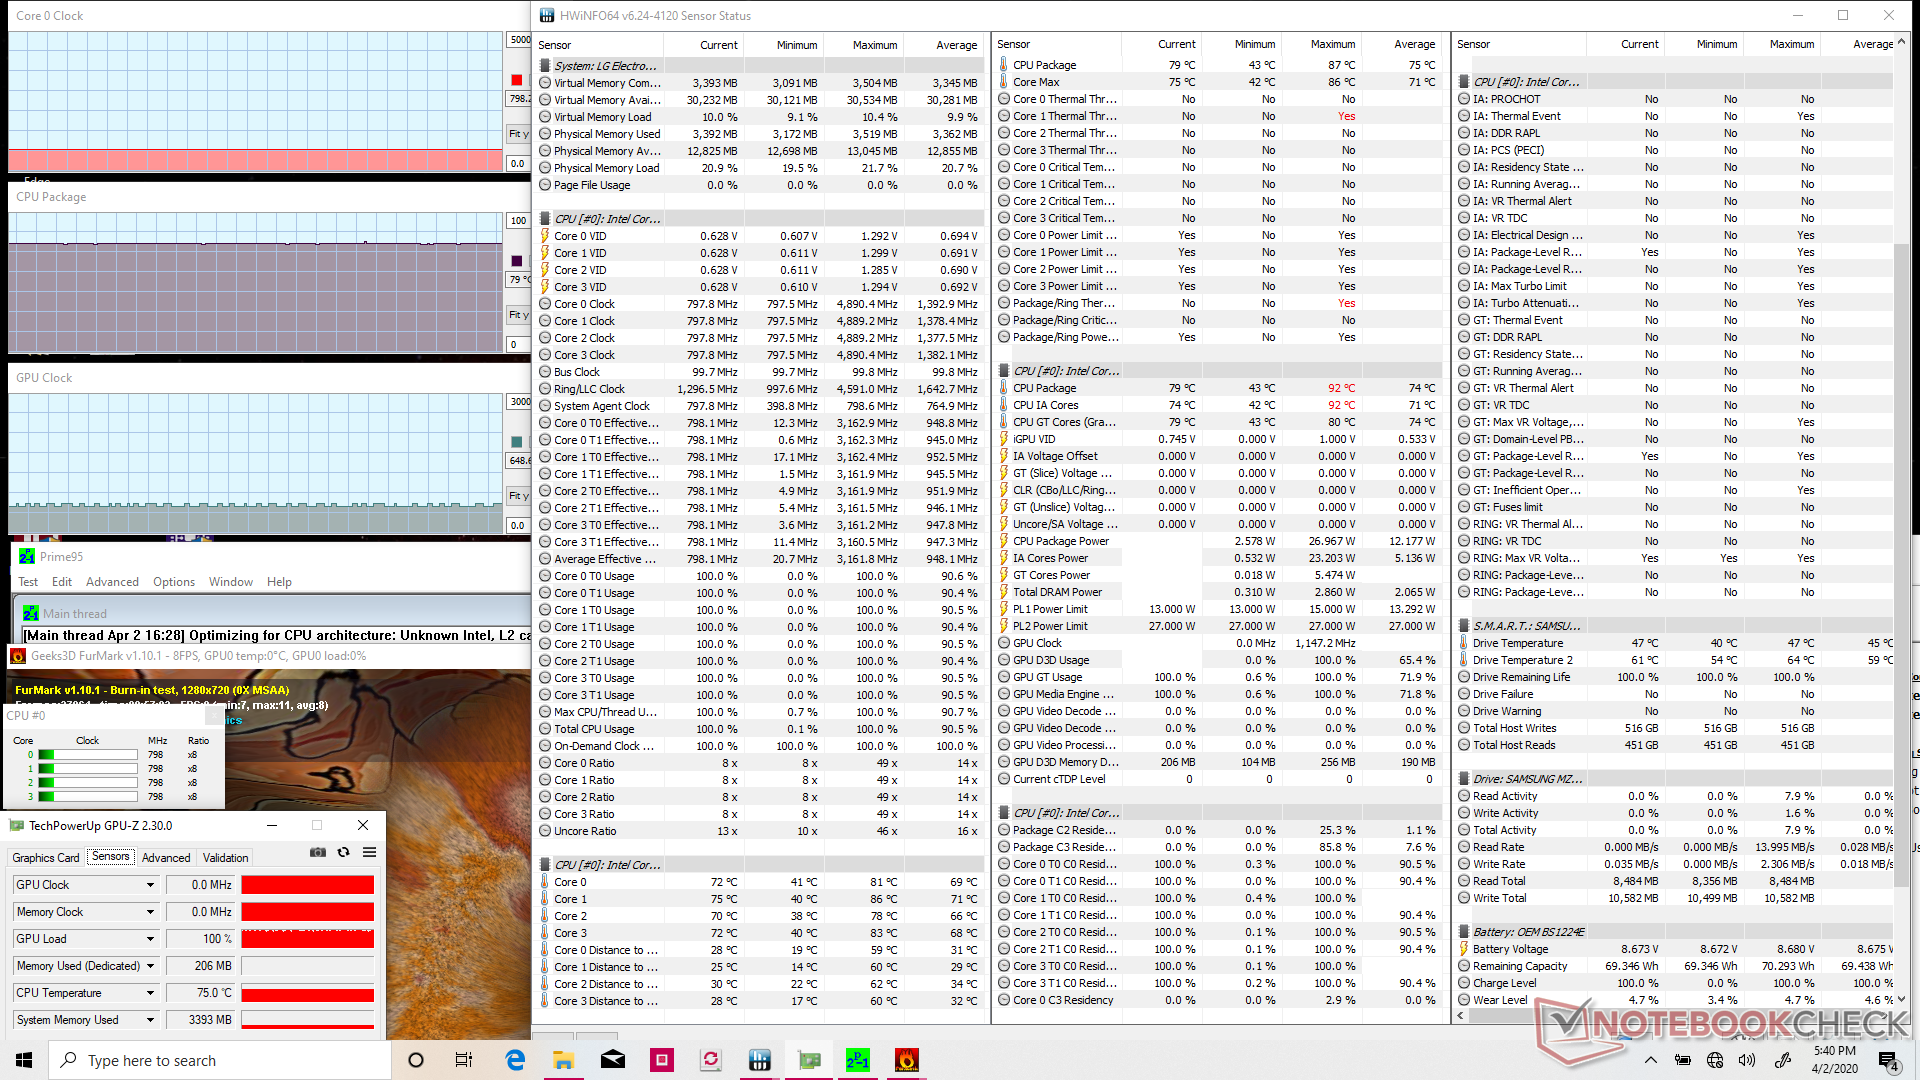

| CPU Clock (GHz) | GPU Clock (MHz) | Average CPU Temperature (°C) | |
| System Idle | -- | -- | 44 |
| Prime95 Stress | 1.9 | -- | 75 |
| Prime95 + FurMark Stress | 0.8 | 648 | 79 |
Speakers
The 1.5 W stereo speakers offer poor bass reproduction as one might expect from a subnotebook. Maximum volume is otherwise about the same as the Dell XPS 13 2-in-1 or HP Spectre to be sufficient enough for small conference rooms. Music and movie playback would be best with a pair of headphones. Higher volume settings will not introduce any static or noticeable surface vibrations.


Energy Management
Power Consumption
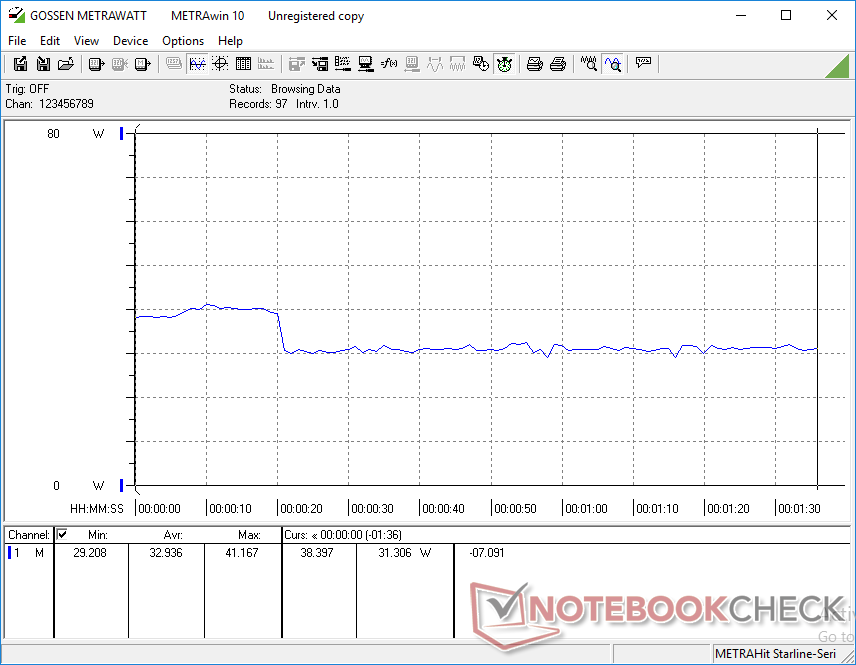
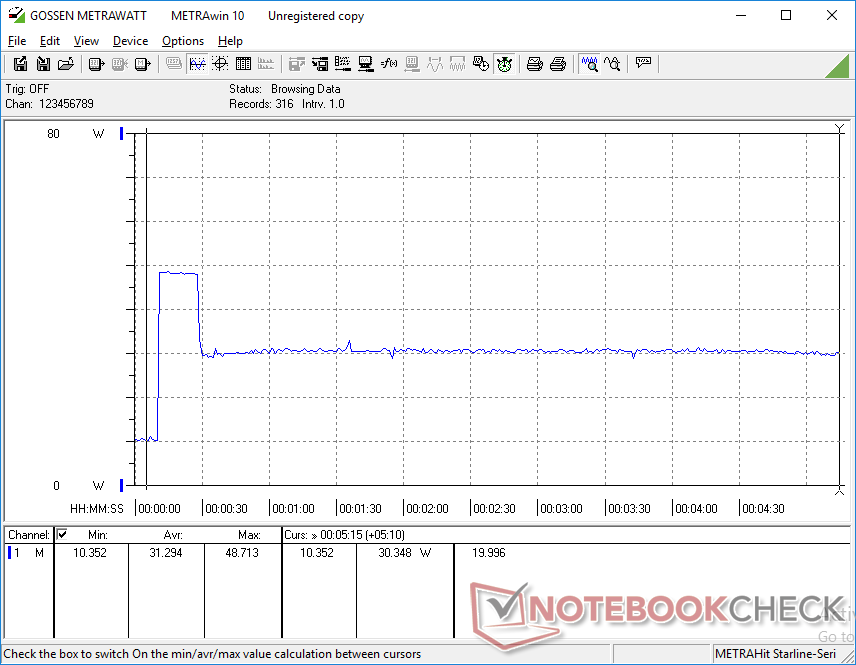
Idling on desktop demands between 3 W to 7 W which is quite close to what we recorded on the Gram 14 clamshell. Expect consumption to jump to 31 W to 38 W if running very demanding loads like gaming.
Interestingly, the maximum power consumption of the Gram 14 convertible is much higher than the maximum power consumption of the older Gram 14 clamshell equipped with a Kaby Lake-R CPU (48 W vs 35 W). This is likely due to the higher Turbo Boost potential of Comet Lake-U than Kaby Lake-R even though both are under the same 15 W TDP.
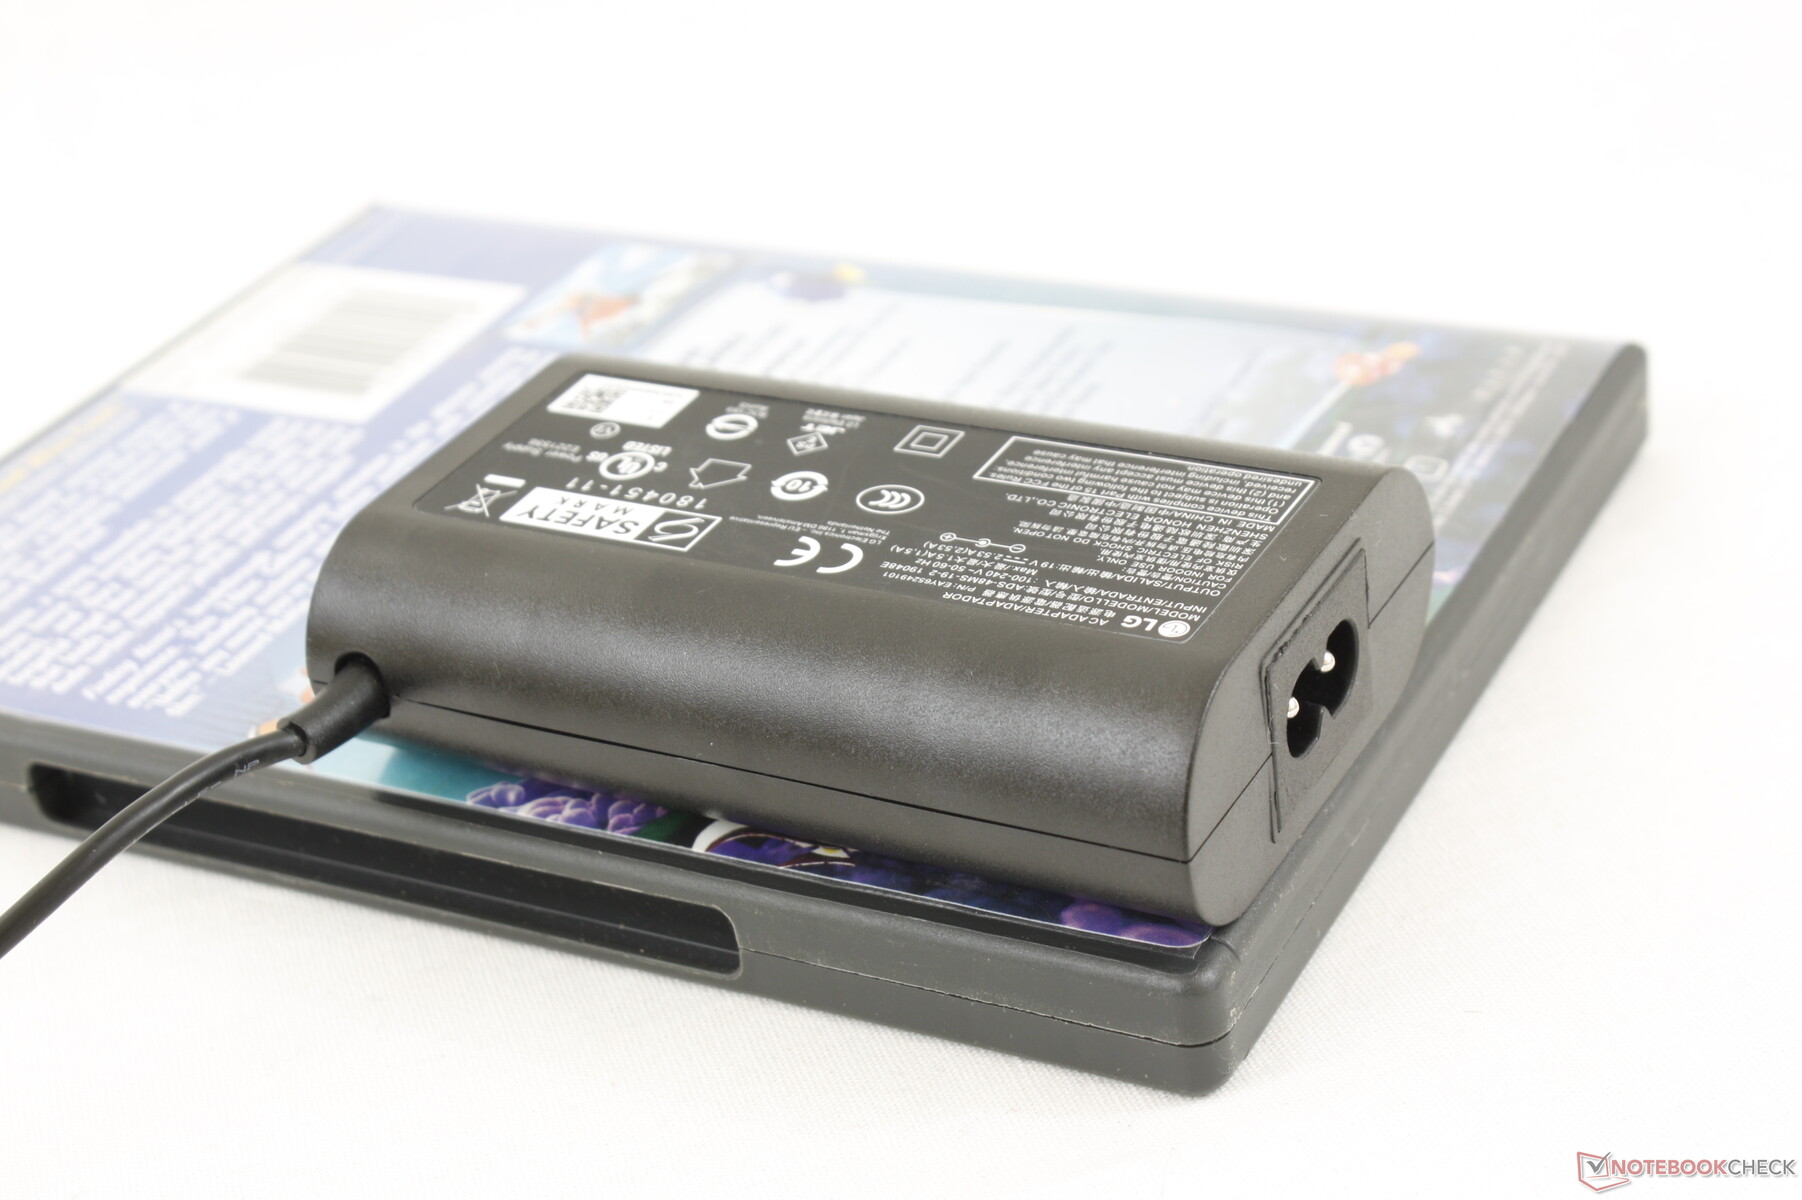
The maximum consumption of 48 W is the exact rating of the small (~9.8 x 6 x 2.7 cm) 48 W AC adapter. However, this high of a consumption rate is unsustainable over long periods as shown by our graphs below.
| Off / Standby | |
| Idle | |
| Load |
|
Key:
min: | |
| LG Gram 14T90N i7-10510U, UHD Graphics 620, Samsung SSD PM981a MZVLB512HBJQ, IPS, 1920x1080, 14" | LG Gram 14Z980-U.AAW5U1 i5-8250U, UHD Graphics 620, SK Hynix SC313 HFS256G39TNF, IPS, 1920x1080, 14" | Asus ZenBook 14 UM431DA-AM020T R7 3700U, Vega 10, SK hynix BC501 HFM512GDHTNG-8310A, IPS, 1920x1080, 14" | Dell XPS 13 7390 2-in-1 Core i7 i7-1065G7, Iris Plus Graphics G7 (Ice Lake 64 EU), Toshiba BG4 KBG40ZPZ512G, IPS, 1920x1200, 13.4" | Huawei Matebook X Pro i5 i5-8250U, GeForce MX150, Samsung PM961 MZVLW256HEHP, IPS, 3000x2000, 13.9" | Lenovo Yoga C940-14IIL 81Q9 i7-1065G7, Iris Plus Graphics G7 (Ice Lake 64 EU), Samsung PM981a MZVLB1T0HBLR, IPS, 3840x2160, 14" | |
|---|---|---|---|---|---|---|
| Power Consumption | 5% | -26% | -5% | -49% | -73% | |
| Idle Minimum * (Watt) | 2.9 | 2.7 7% | 3.6 -24% | 2.6 10% | 3.5 -21% | 5.6 -93% |
| Idle Average * (Watt) | 5.8 | 6 -3% | 7.2 -24% | 5.3 9% | 8.9 -53% | 10.5 -81% |
| Idle Maximum * (Watt) | 6.2 | 6.5 -5% | 10.8 -74% | 7 -13% | 12.3 -98% | 12 -94% |
| Load Average * (Watt) | 32.9 | 32.5 1% | 38 -16% | 43.1 -31% | 54.2 -65% | 53.3 -62% |
| Load Maximum * (Watt) | 48.5 | 35.5 27% | 45.2 7% | 49 -1% | 52.1 -7% | 64.6 -33% |
| Witcher 3 ultra * (Watt) | 43.1 | 42.4 | 46.9 |
* ... smaller is better
Battery Life
Perhaps not coincidentally, battery life results are nearly identical to what we recorded on the Gram 14 clamshell. Expect over 12 hours of real-world WLAN use to be above average for its subnotebook category. The long runtimes can be attributed to the internal 72 Wh battery which is quite large for a 14-inch convertible.
Charging from empty to full capacity takes about 2 hours. It is possible to recharge via USB Type-C, but you may need to enable the feature first by launching the pre-installed LG Command Center software.
| LG Gram 14T90N i7-10510U, UHD Graphics 620, 72 Wh | LG Gram 14Z980-U.AAW5U1 i5-8250U, UHD Graphics 620, 72 Wh | Asus ZenBook 14 UM431DA-AM020T R7 3700U, Vega 10, 47 Wh | Dell XPS 13 7390 2-in-1 Core i7 i7-1065G7, Iris Plus Graphics G7 (Ice Lake 64 EU), 51 Wh | Huawei Matebook X Pro i5 i5-8250U, GeForce MX150, 57.4 Wh | Lenovo ThinkPad X1 Carbon G7 20R1-000YUS i7-10510U, UHD Graphics 620, 51 Wh | |
|---|---|---|---|---|---|---|
| Battery runtime | 5% | -37% | -28% | -26% | -20% | |
| Reader / Idle (h) | 32.8 | 37.3 14% | 17.8 -46% | 20.7 -37% | ||
| WiFi v1.3 (h) | 12.5 | 12 -4% | 6.7 -46% | 9 -28% | 9.3 -26% | 10 -20% |
| Load (h) | 2.6 | 2.7 4% | 2.1 -19% | 2.2 -15% |
Pros
Cons
Verdict

The difference between the older LG Gram14T990 and newer LG Gram 14T90N is marginal at best. The processor update is barely noticeable which leaves Thunderbolt 3 as the main distinguishing factor between the two models. If you plan on utilizing Thunderbolt 3-based devices like docking stations and external monitors, then you'll find value in the Gram 14T90N. Otherwise, save yourself a few hundred dollars and just go with the Gram14T990 instead.
There are a few notable advantages that the LG convertible has over competitors. The low weight makes it easier to use in tablet mode than say the ZenBook 14 Flip and the dual internal storage bays are a rarity considering the category. Even so, the system feels under-powered for the price especially in terms of graphics potential while common privacy features like a webcam shutter or IR camera are not present. Perhaps a Core i7 Ice Lake CPU would have worked better considering the target audience. The display could have also been brighter for more comfortable outdoor visibility.
The Gram 14T90N is a $1400 convertible with an under-performing CPU and nothing else special. You'll have to make use of its light weight, long battery life, and Thunderbolt 3 port to get the most out of the system.
LG Gram 14T90N
- 04/06/2020 v7 (old)
Allen Ngo
Price comparison
