GMK NucBox 3 review: Fanless Windows 11 HTPC

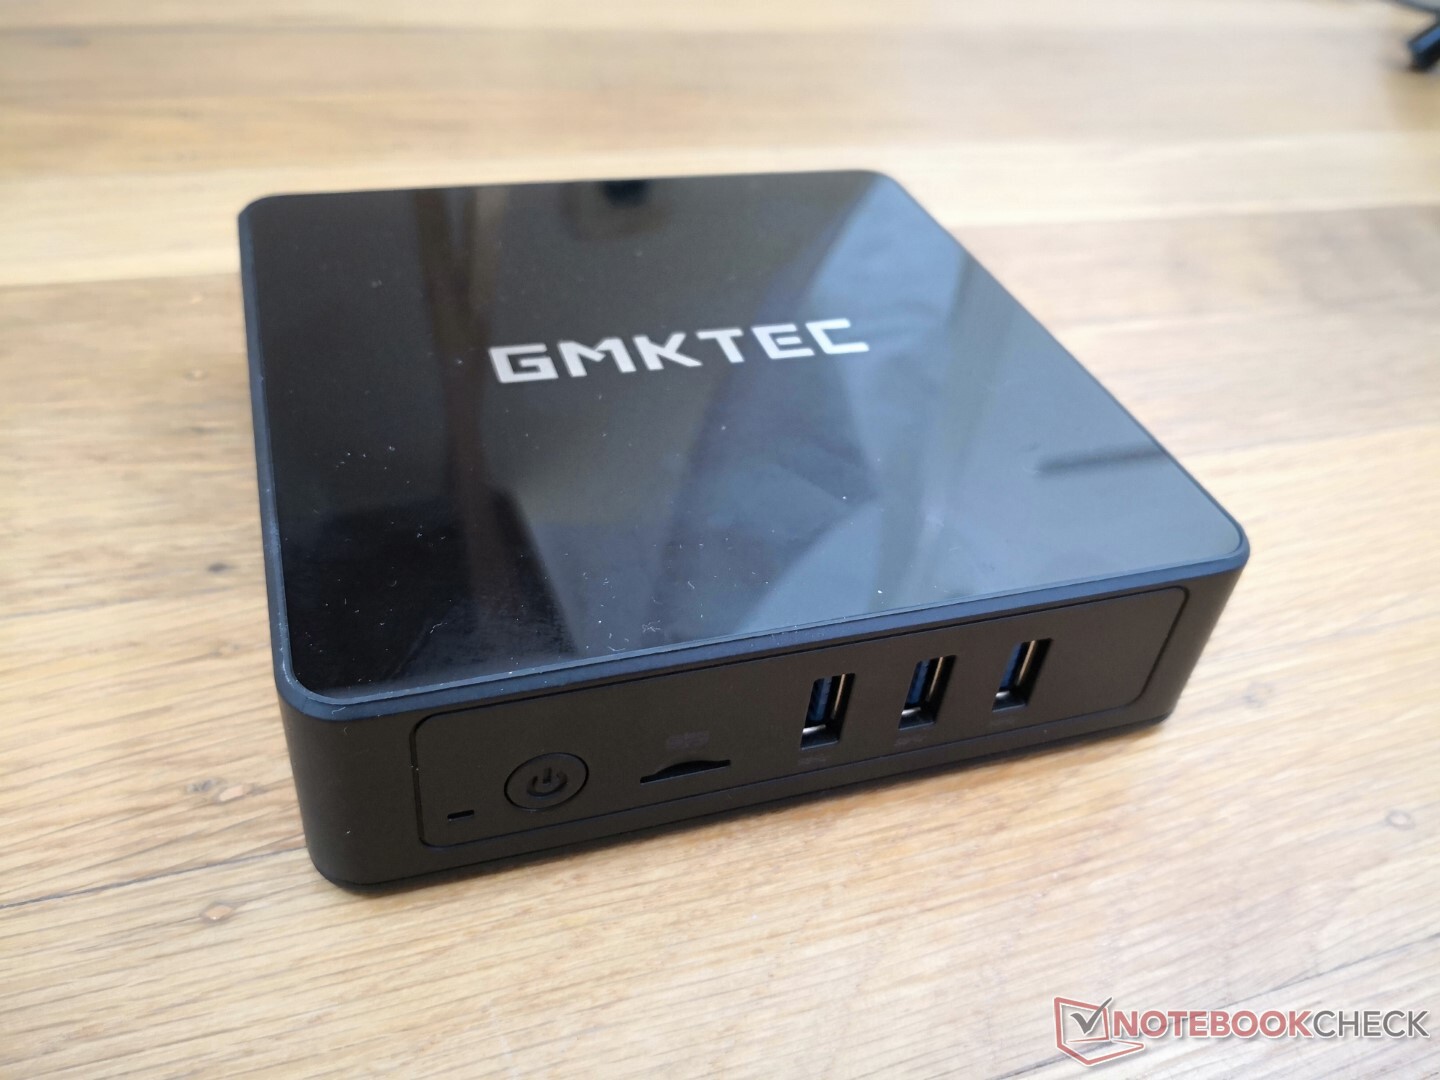
Unlike the tiny NucBox S or more traditional NucBox 2, the NucBox 3 is a fanless design utilizing the same Celeron J4125 processor that powers the original NucBox S. The system was made for HTPC environments and other low-power applications where silent operation takes precedence over raw performance.
Note that the NucBox 3 isn't necessarily better or faster than the NucBox 2 or NucBox S despite what the naming convention may suggest. Instead, the NucBox 3 has different advantages and disadvantages from its two siblings that may appeal to different users. They may, however, share similar materials.
Competitors to the NucBox 3 include other fanless mini PCs such as the Zotac CI Nano series or the Chuwi GBox. The unit with 8 GB DDR4 RAM and 256 GB SSD storage currently retails for about $269 USD on Amazon (or $219 after coupon) or $309 through the manufacturer.
More GMK reviews:
Potential Competitors in Comparison
Rating | Date | Model | Weight | Height | Size | Resolution | Price |
|---|---|---|---|---|---|---|---|
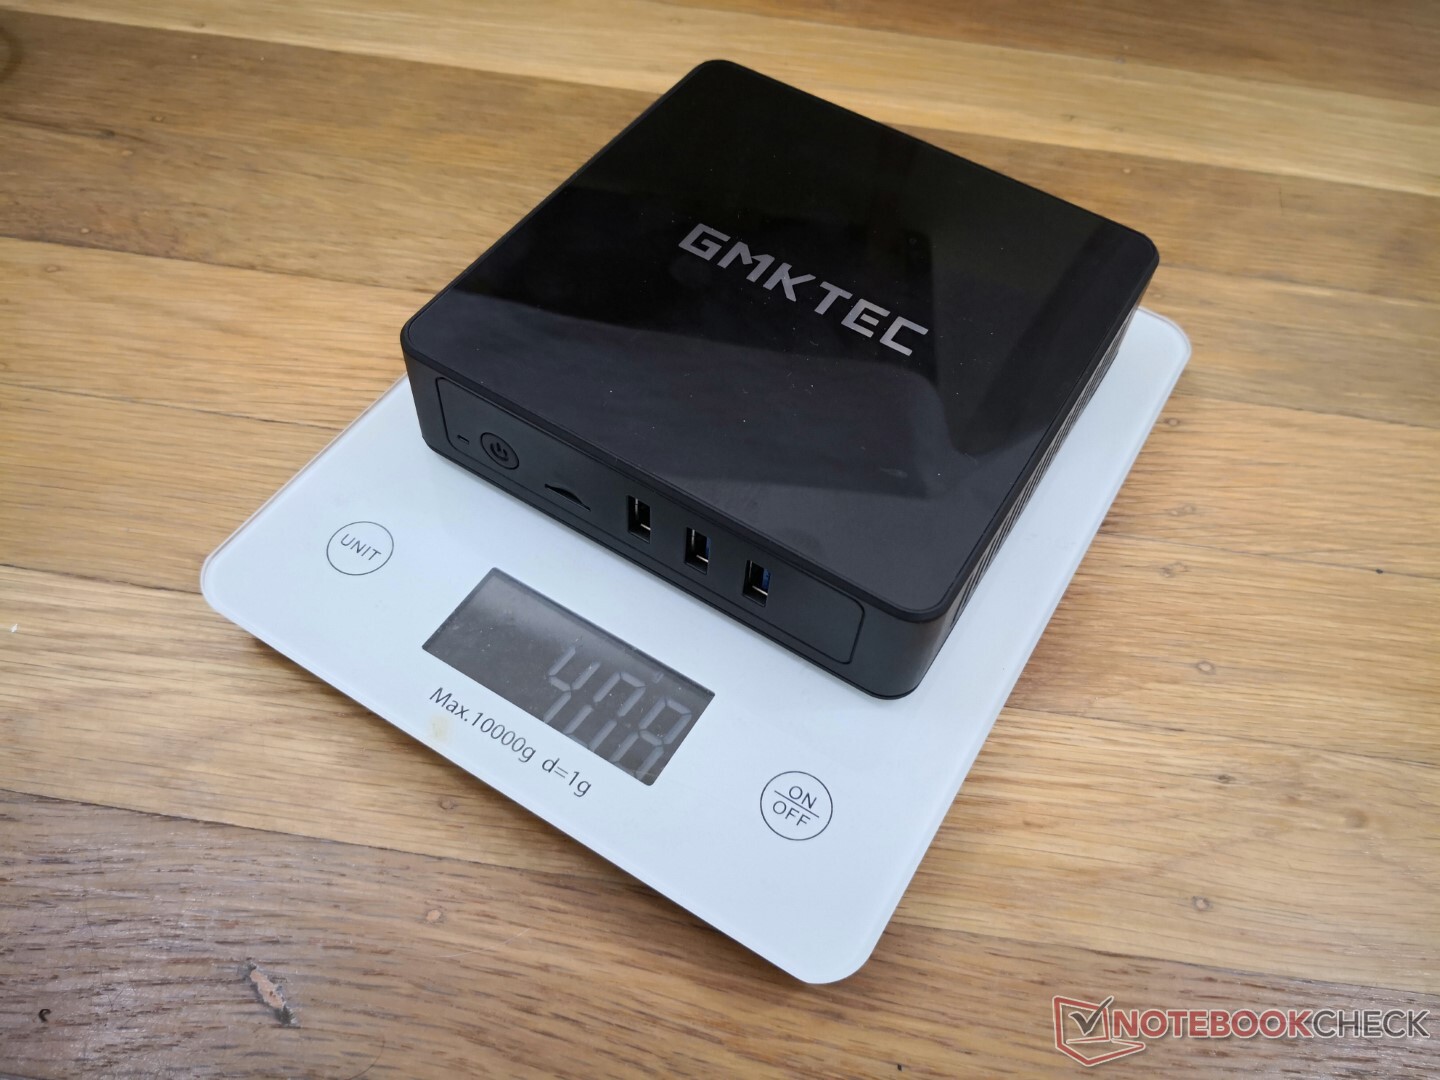
v (old) | 02 / 2022 | GMK NucBox 3 Celeron J4125, UHD Graphics 600 | 410 g | 32.5 mm | x | ||
v (old) | 07 / 2020 | Chuwi LarkBox 4K Mini PC Celeron J4115, UHD Graphics 600 | 129 g | 43 mm | x | ||
v (old) | 04 / 2021 | Intel NUC11TNKi5 i5-1135G7, Iris Xe G7 80EUs | 504 g | 37 mm | x | ||
v (old) | 11 / 2018 | Intel NUC8i7BE i7-8559U, Iris Plus Graphics 655 | 683 g | 51 mm | x | ||
v (old) | 12 / 2021 | Beelink GTI 11 i5-1135G7, Iris Xe G7 80EUs | 638 g | 39 mm | x | ||
v (old) | 11 / 2021 | Beelink U59 Celeron N5095, UHD Graphics (Jasper Lake 16 EU) | 329 g | 42 mm | x |
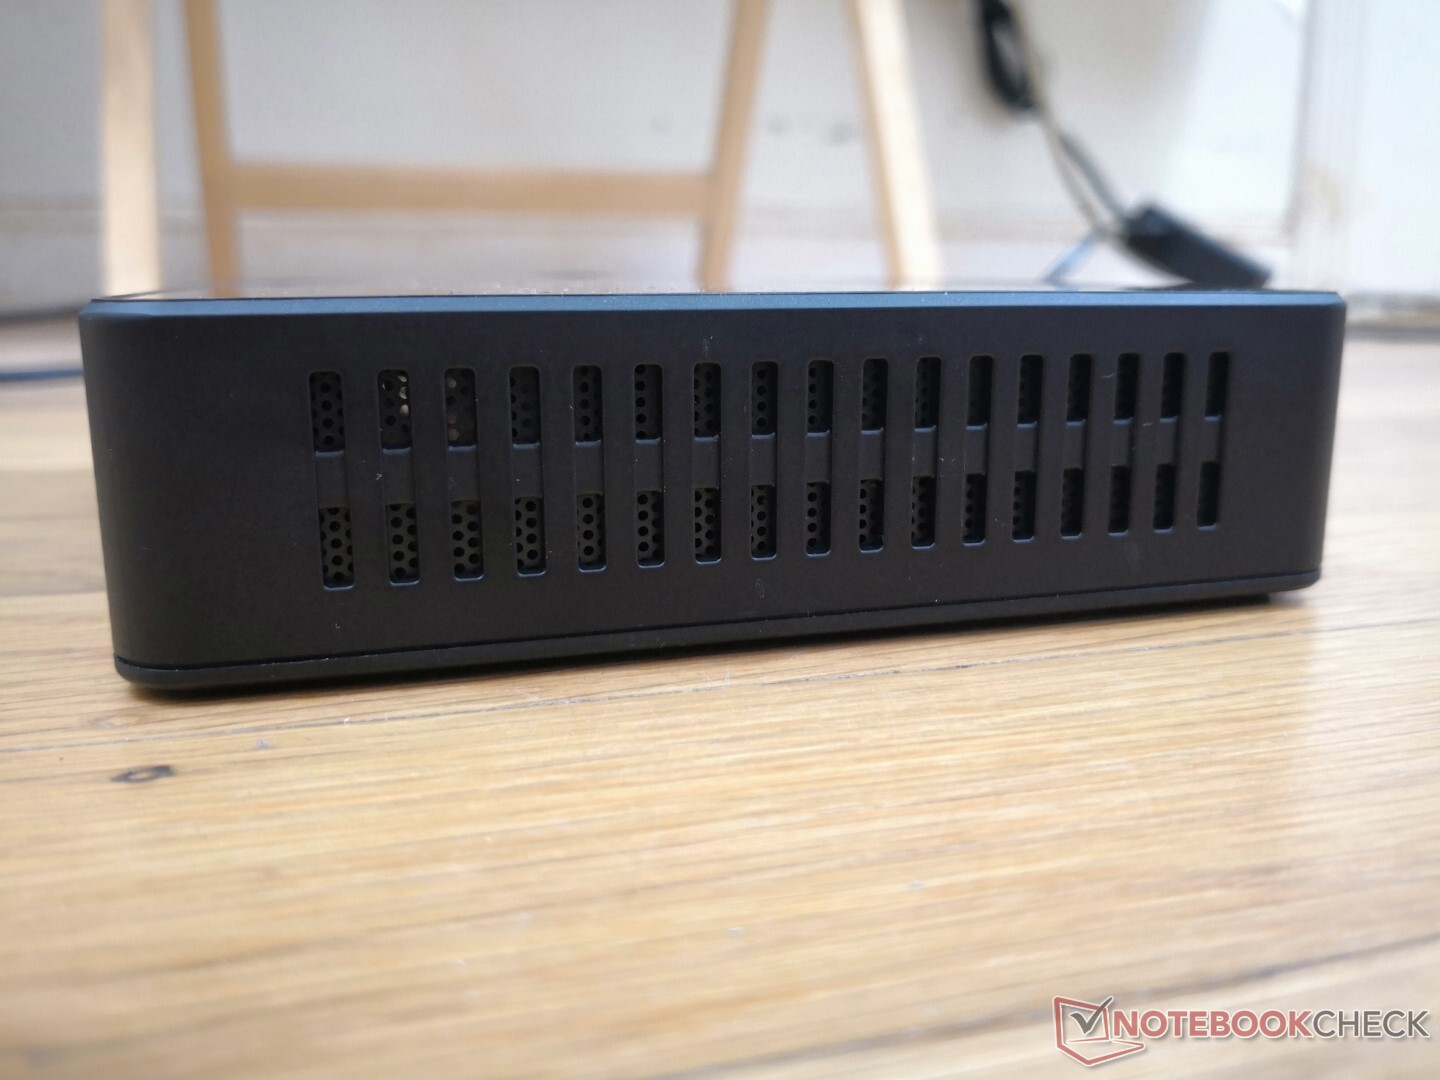
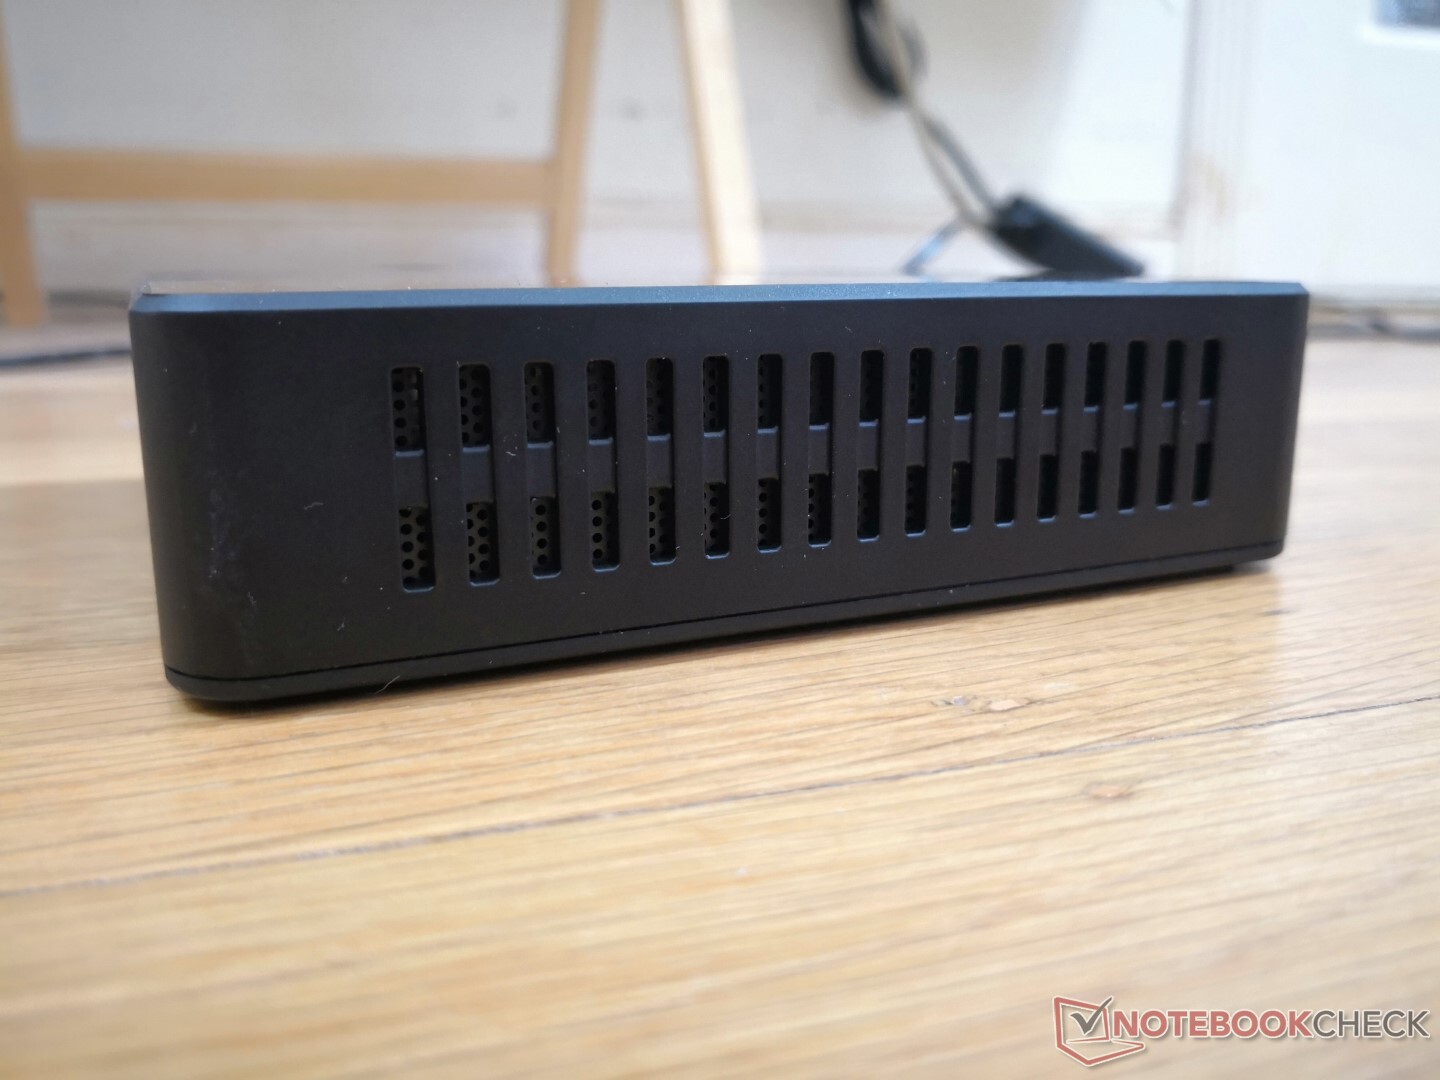
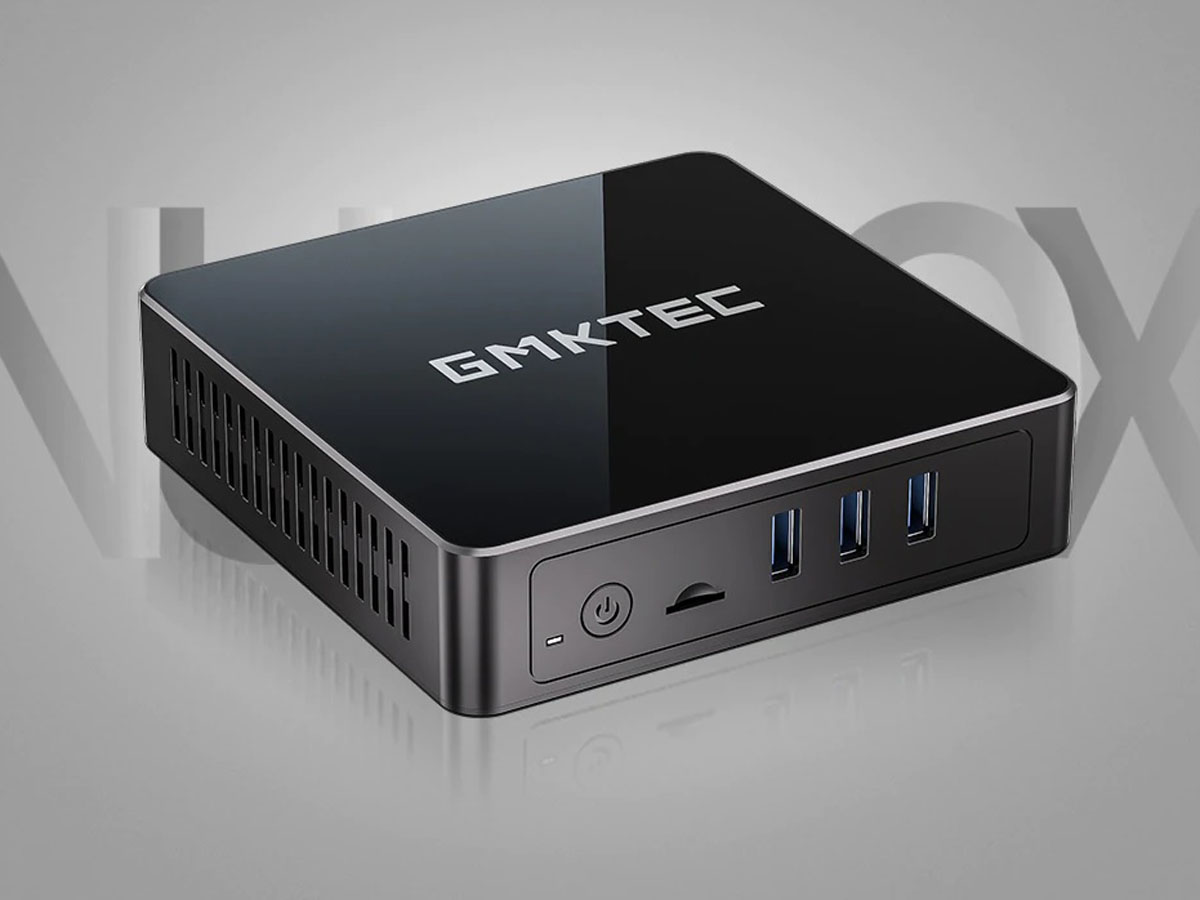
Case
The materials and overall shape of the NucBox 3 are similar to the NucBox 2 even if their dimensions are different. The top of the unit, for example, continues to be glossy fiberglass while the edges and corners are matte. Chassis rigidity is satisfactory, but expect fingerprints, dust, and scratches to build up on the glossy top very quickly.
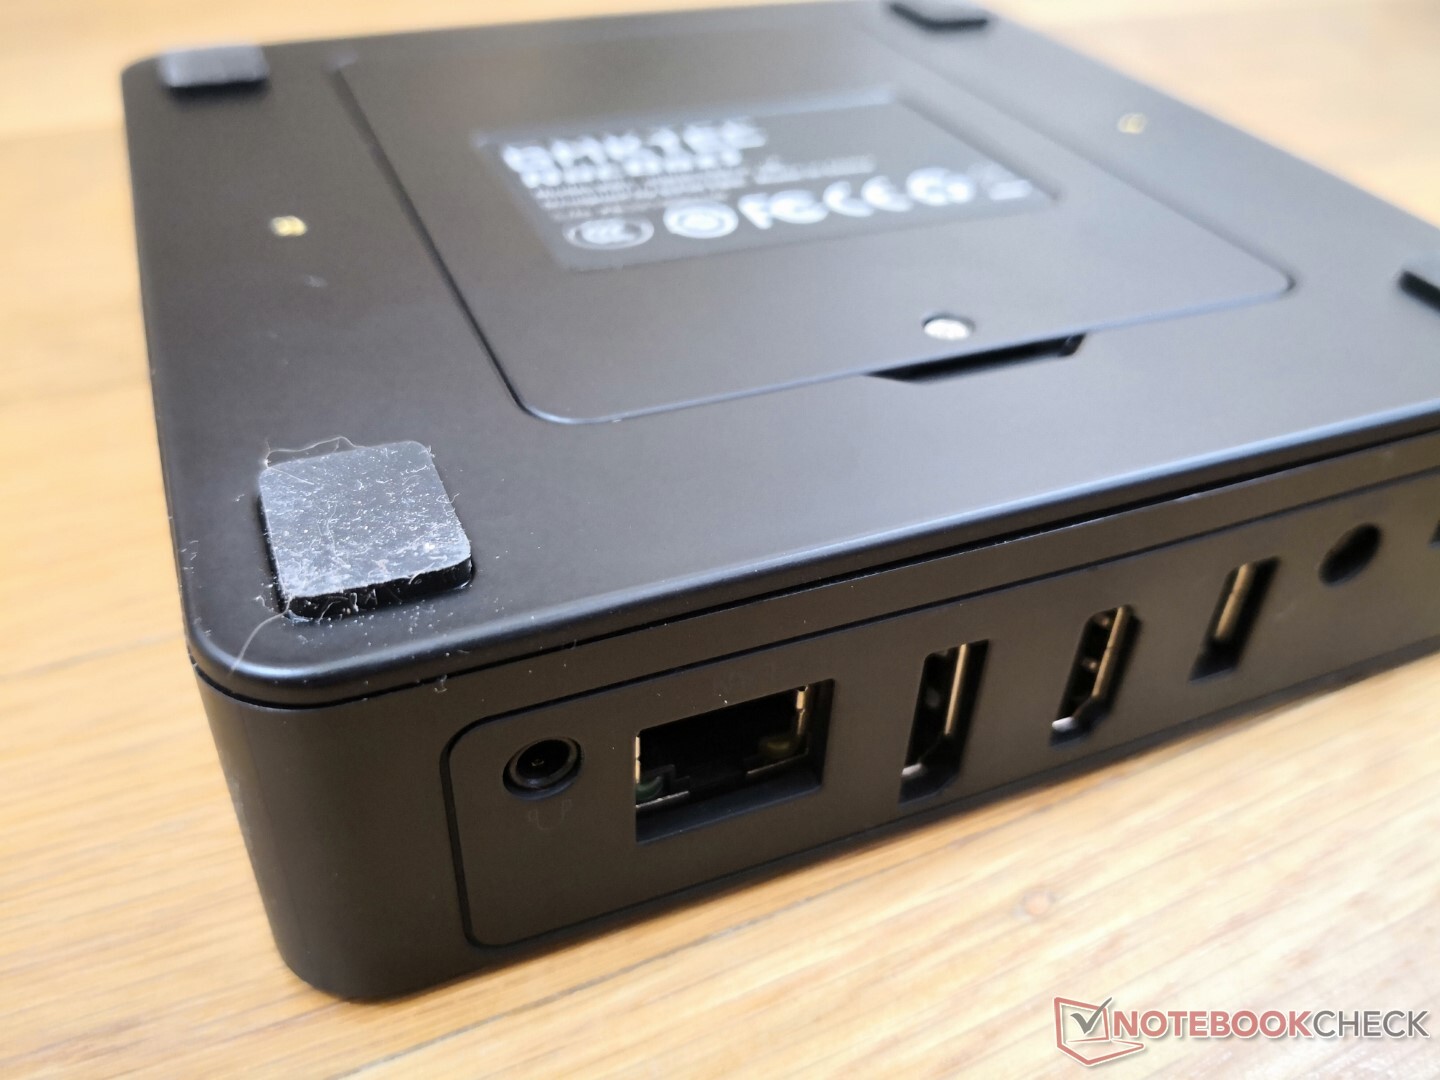
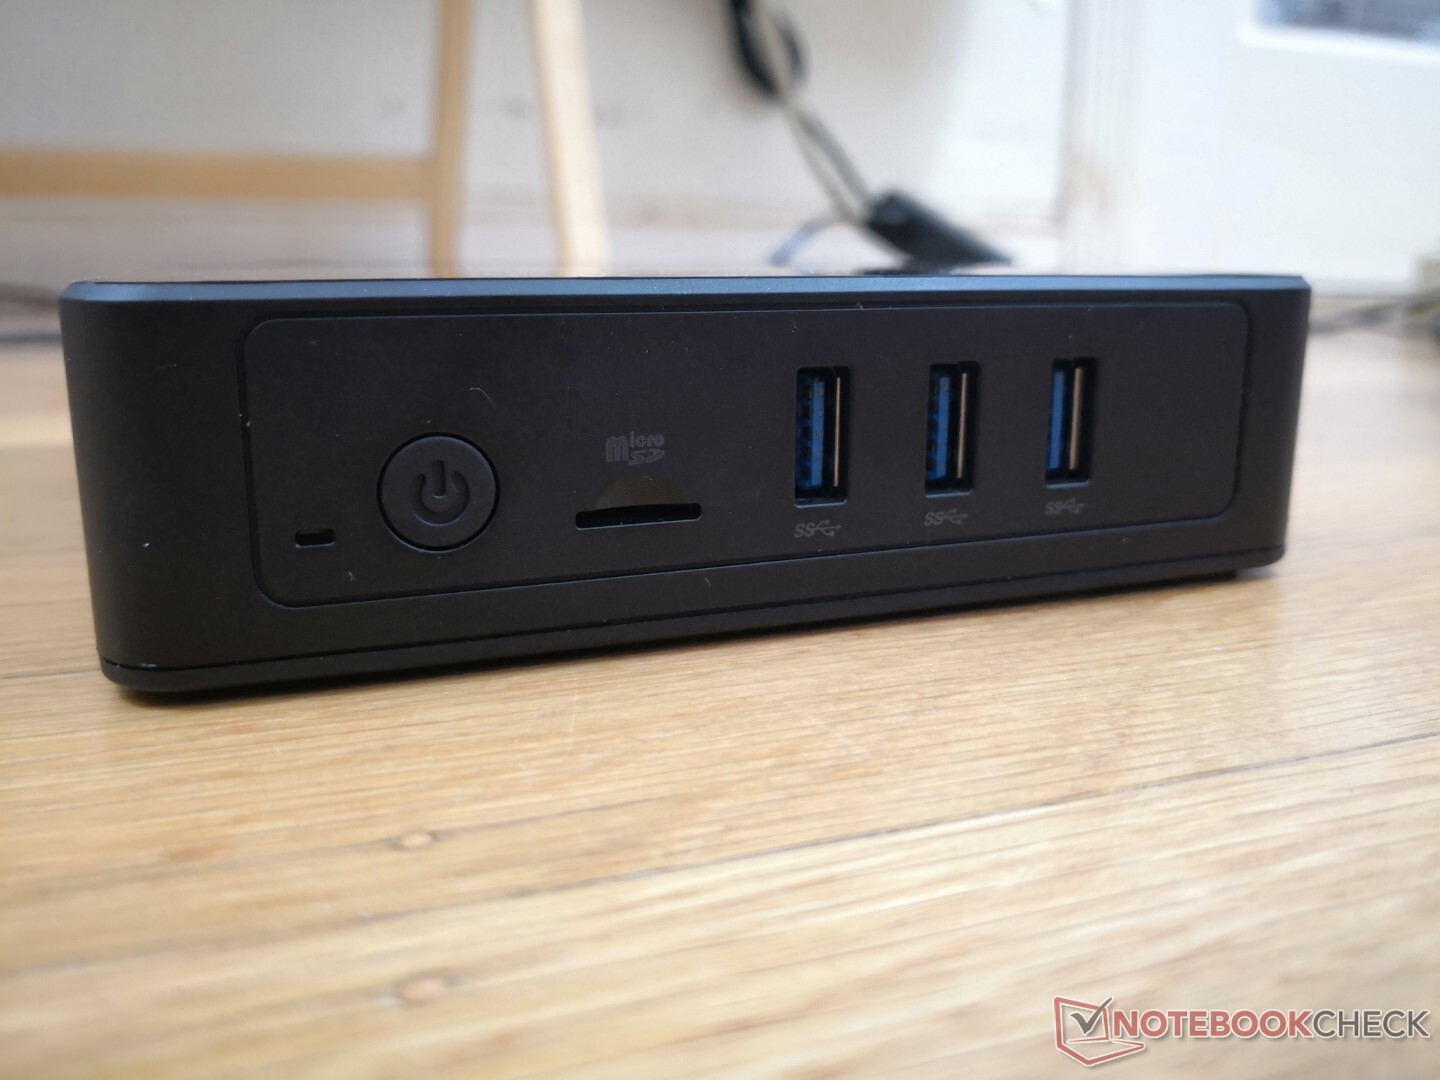
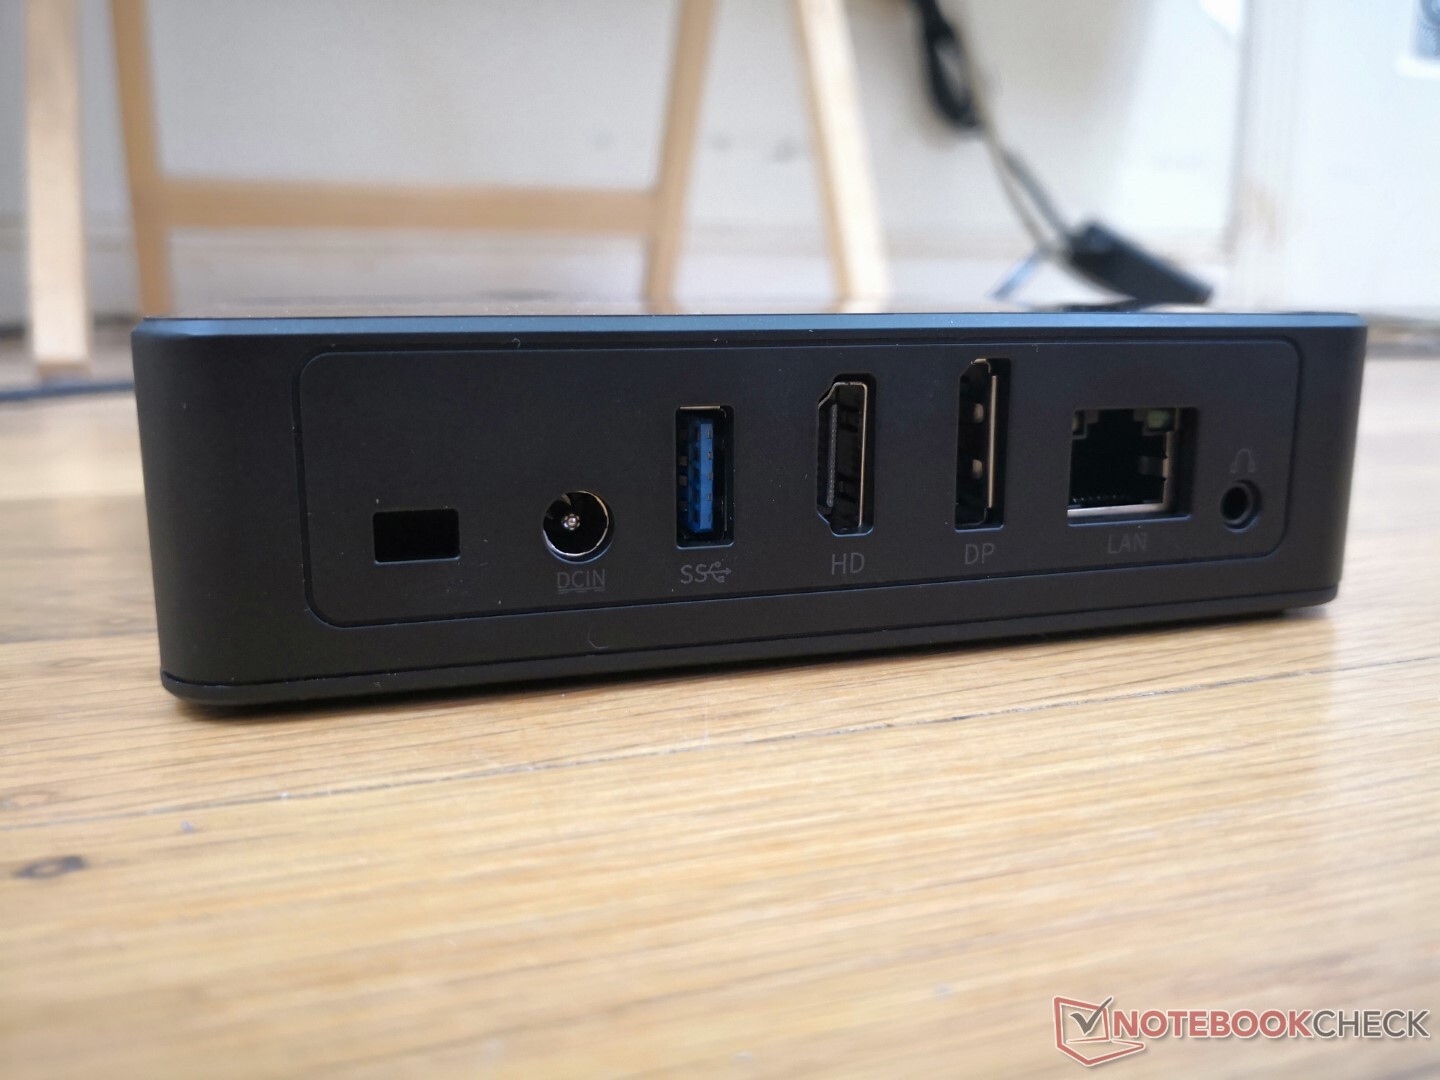
Connectivity
Port options are respectable save for the lack of a USB-C port. Additionally, the HDMI 1.4 port is limited to 4K at 30 Hz meaning it's highly recommended to use the DisplayPort instead if connecting 4K monitors.
SD Card Reader
| SD Card Reader | |
| average JPG Copy Test (av. of 3 runs) | |
| Intel NUC8i7BE (Toshiba Exceria Pro M501 UHS-II) | |
| Chuwi LarkBox 4K Mini PC (Toshiba Exceria Pro M501 UHS-II) | |
| GMK NucBox 3 (AV Pro V60) | |
| maximum AS SSD Seq Read Test (1GB) | |
| Chuwi LarkBox 4K Mini PC (Toshiba Exceria Pro M501 UHS-II) | |
| Intel NUC8i7BE (Toshiba Exceria Pro M501 UHS-II) | |
| GMK NucBox 3 (AV Pro V60) | |
Communication
Transmit speeds are slower than expected even for an older Intel 7265 WLAN module. Users will more than likely be streaming content to the unit instead of from the unit, however, and so the poor transmit speeds shouldn't be an issue for most applications. The gigabit RJ-45 port is always available for faster network performance if desired.
| Networking | |
| iperf3 transmit AX12 | |
| Intel NUC11TNKi5 | |
| Beelink GTI 11 | |
| Intel NUC8i7BE | |
| Chuwi LarkBox 4K Mini PC | |
| Beelink U59 | |
| GMK NucBox 3 | |
| iperf3 receive AX12 | |
| Intel NUC11TNKi5 | |
| Beelink GTI 11 | |
| GMK NucBox 3 | |
| Intel NUC8i7BE | |
| Chuwi LarkBox 4K Mini PC | |
| Beelink U59 | |
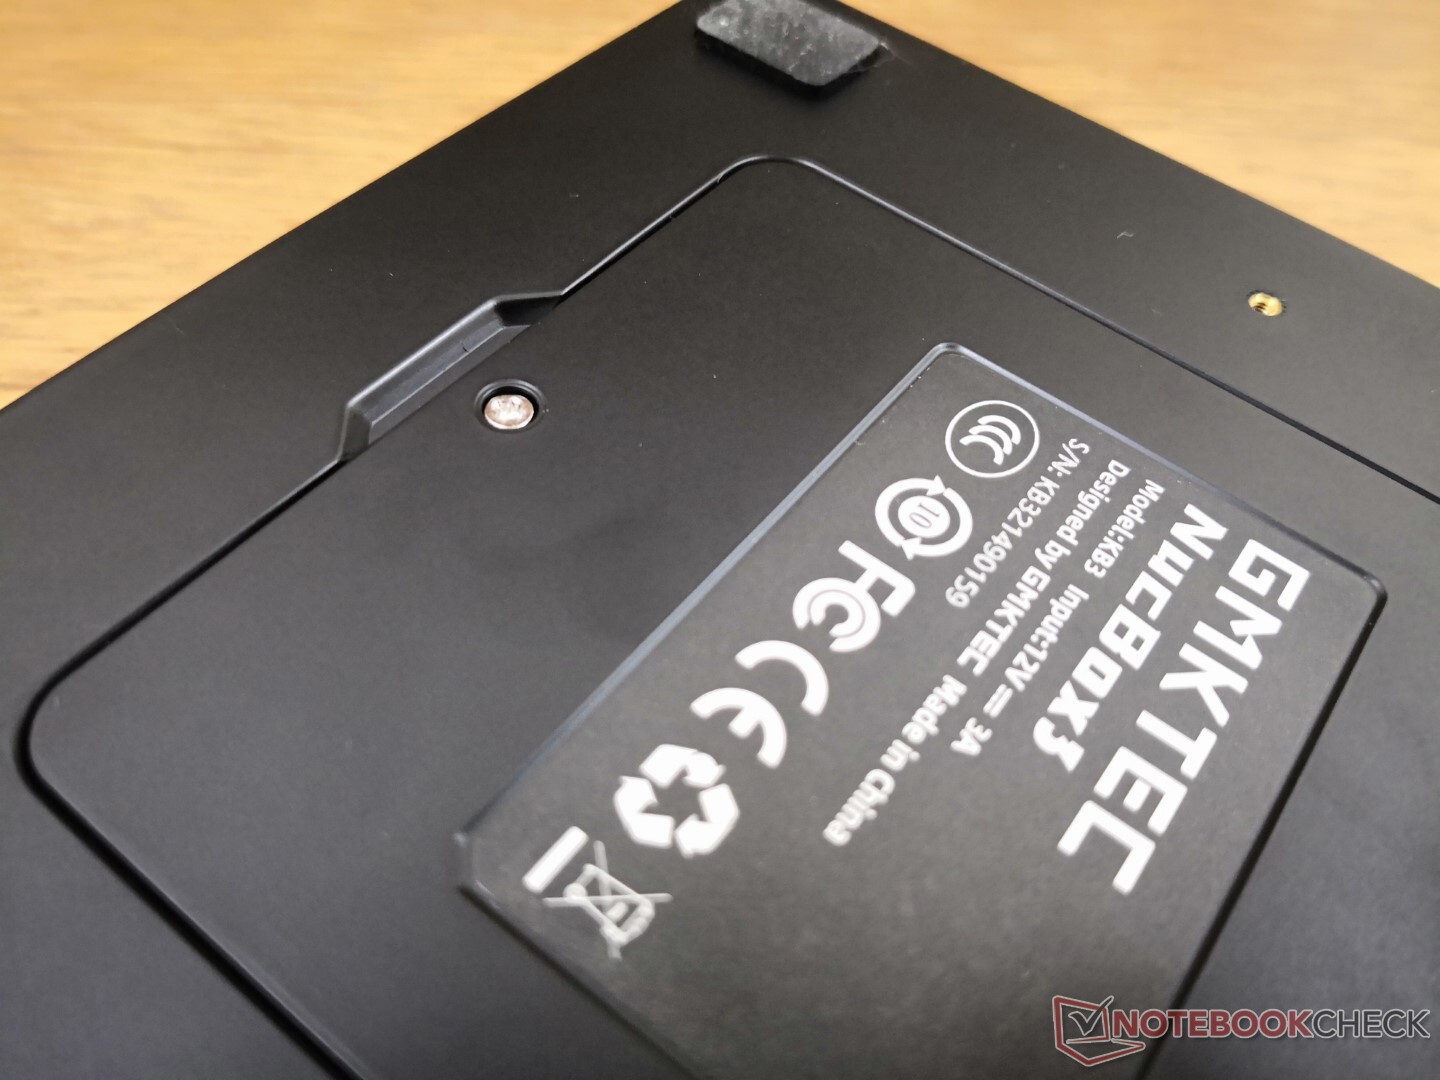
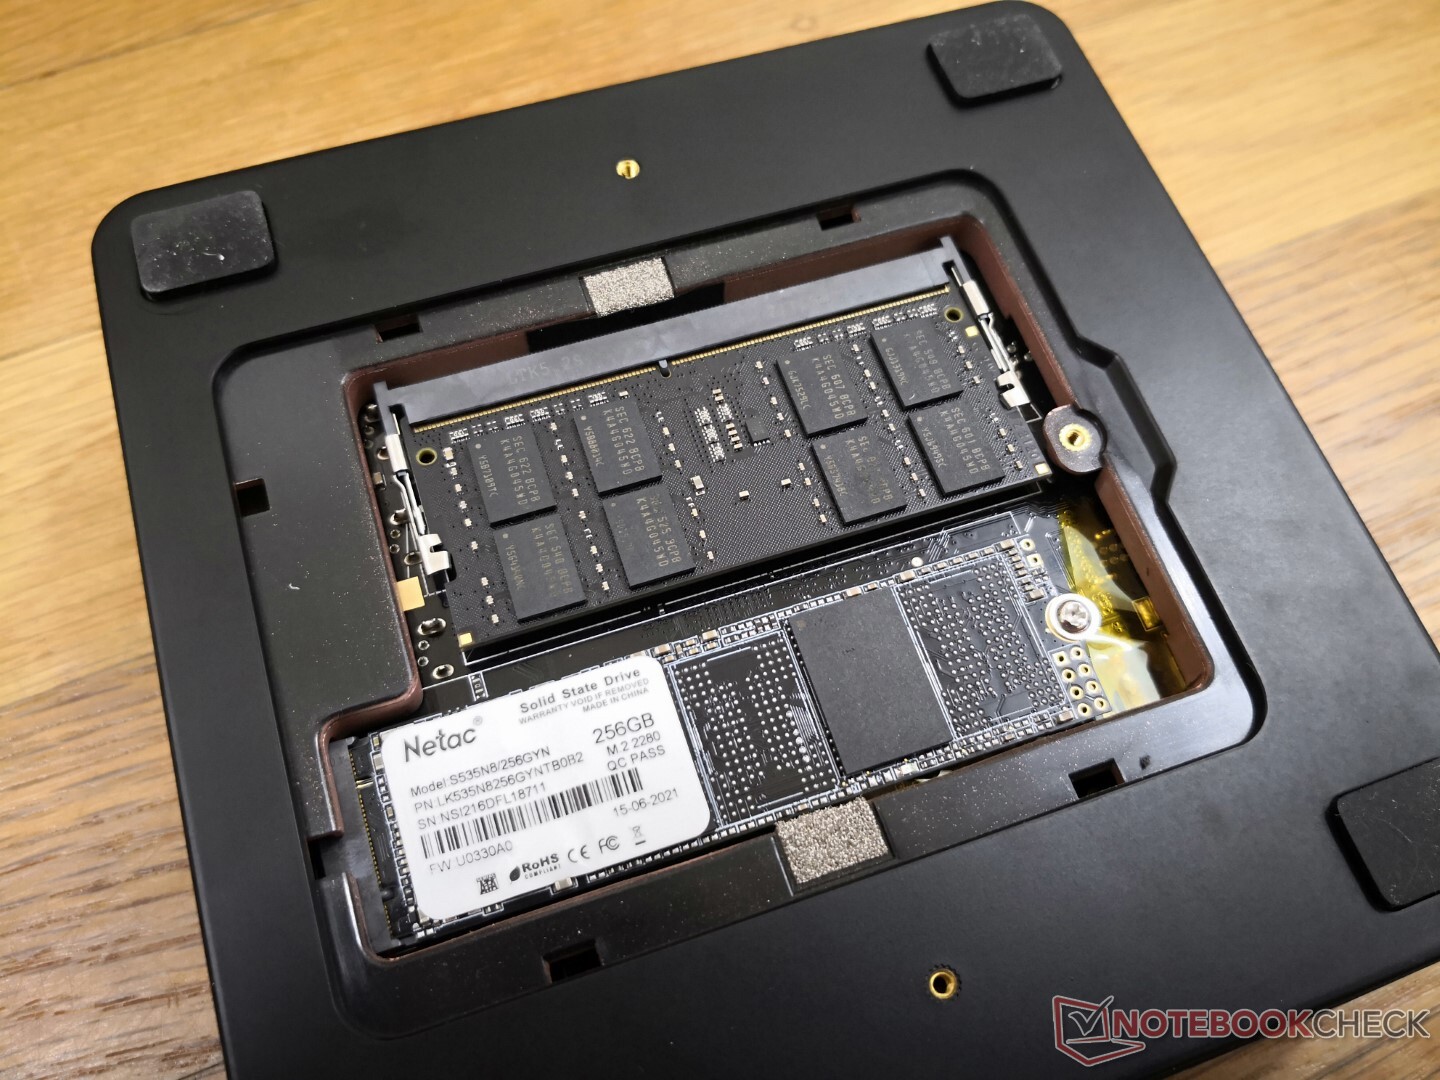
Maintenance
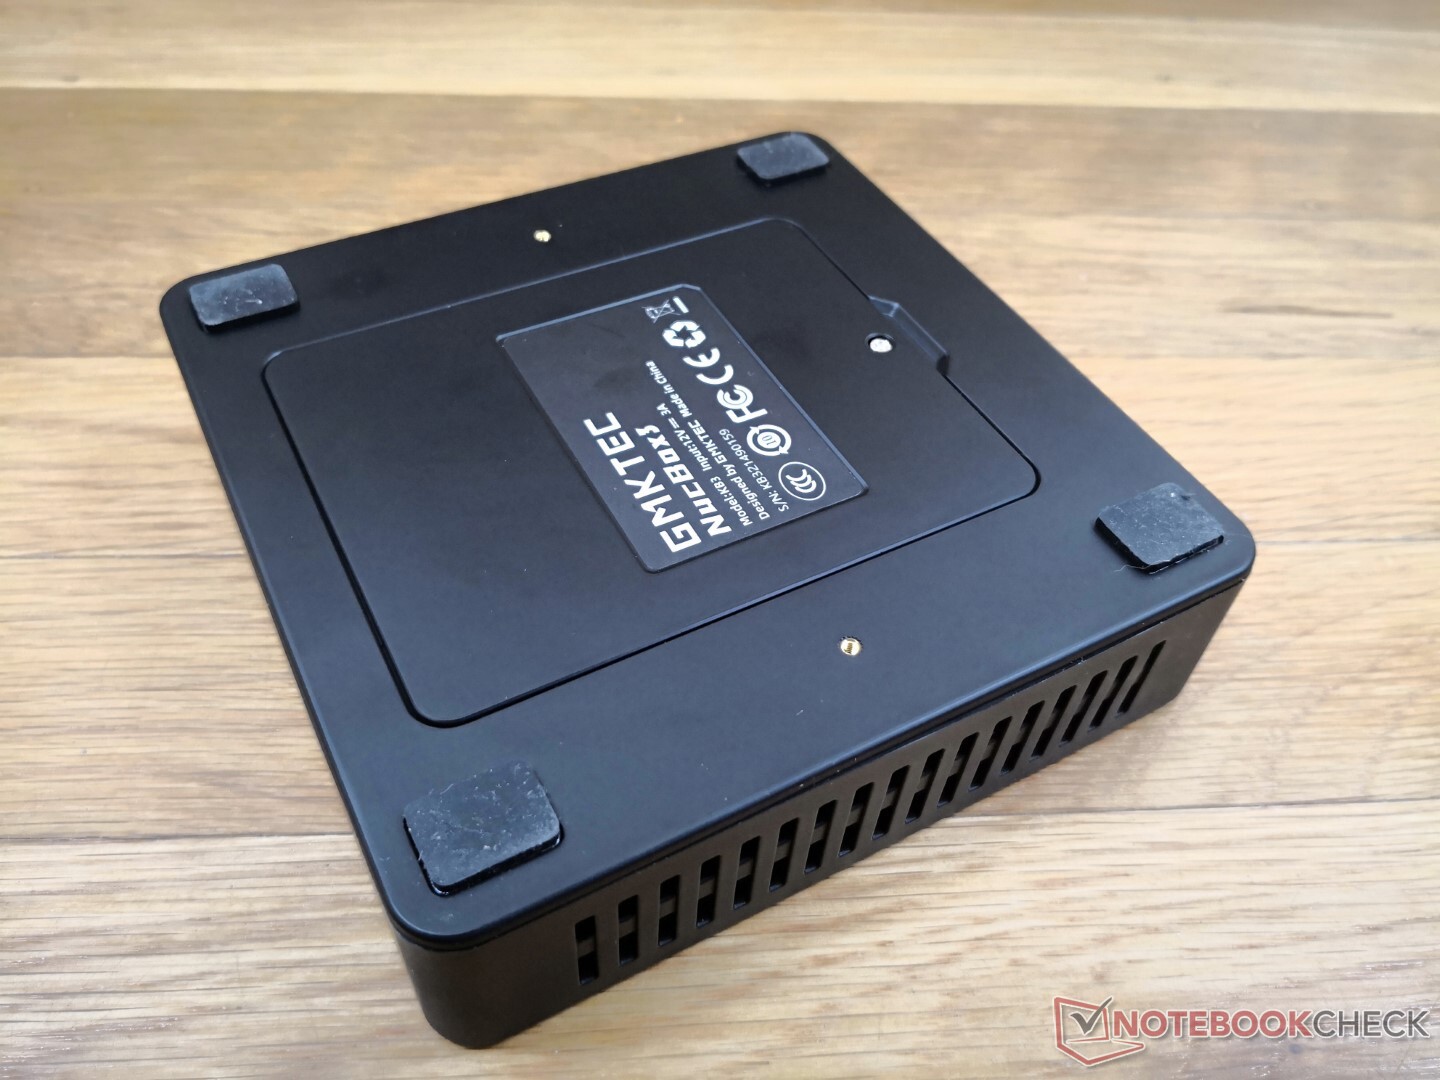
The bottom panel is secured by just one Philips screw for easy access to the single SODIMM slot and M.2 2280 SATA III bay. Dual-Channel RAM is not supported.
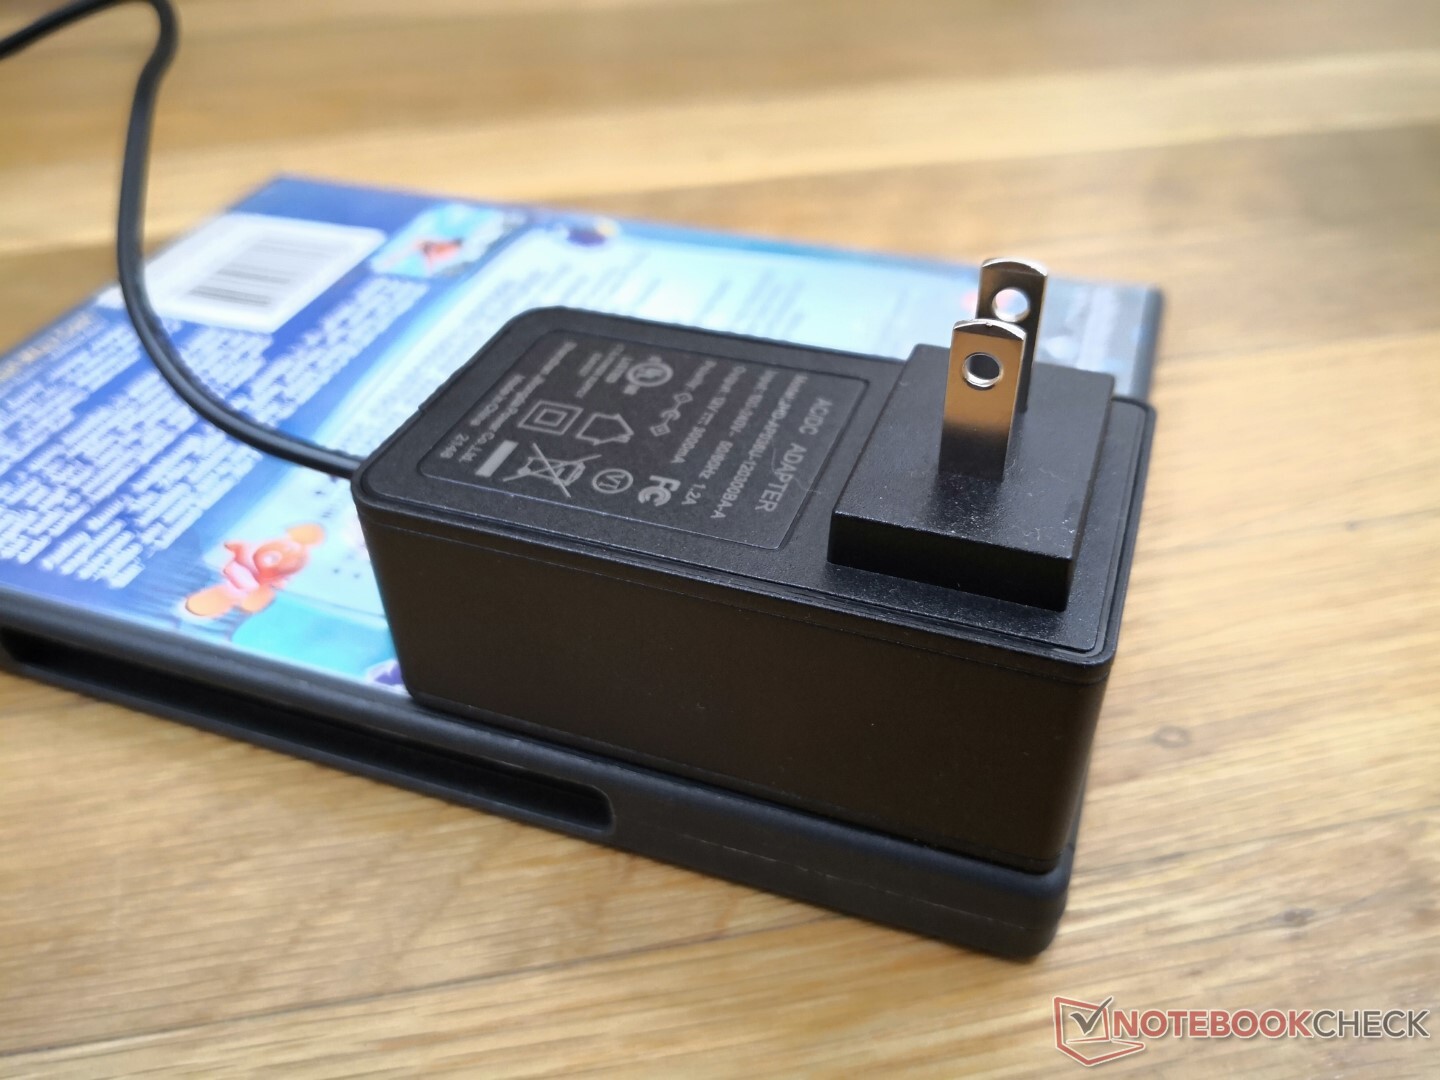
Accessories and Warranty
There are unfortunately no extras in the box other than the AC adapter and paperwork. A mounting bracket, for example, is not included whereas it is usually standard on competing mini PCs including those from Beelink.
Performance
Testing Conditions
Our unit was set to Performance mode prior to running any benchmarks below for the highest possible scores.
Processor
CPU performance is roughly 10 to 15 percent slower than the average PC in our database equipped with the exact same Celeron J4125 processor. The CPU is fortunately still ahead of any Atom CPU thus far by wide margins.
Cinebench R15 Multi Loop
Cinebench R23: Multi Core | Single Core
Cinebench R15: CPU Multi 64Bit | CPU Single 64Bit
Blender: v2.79 BMW27 CPU
7-Zip 18.03: 7z b 4 | 7z b 4 -mmt1
Geekbench 5.5: Multi-Core | Single-Core
HWBOT x265 Benchmark v2.2: 4k Preset
LibreOffice : 20 Documents To PDF
R Benchmark 2.5: Overall mean
| Cinebench R20 / CPU (Multi Core) | |
| Apple MacBook Pro 16 2021 M1 Pro | |
| Beelink GTI 11 | |
| Intel NUC8i7BE | |
| Lenovo IdeaPad 3 15ITL05 81X80074GE | |
| Beelink U59 | |
| Chuwi LarkBox 4K Mini PC | |
| Zotac ZBOX EDGE CI341 | |
| Chuwi LarkBook CWI509 | |
| Average Intel Celeron J4125 (304 - 610, n=5) | |
| GMK NucBox 3 | |
| Lenovo IdeaPad Flex 3 11IGL05 | |
| Chuwi LapBook Plus | |
| Cinebench R20 / CPU (Single Core) | |
| Beelink GTI 11 | |
| Lenovo IdeaPad 3 15ITL05 81X80074GE | |
| Intel NUC8i7BE | |
| Apple MacBook Pro 16 2021 M1 Pro | |
| Beelink U59 | |
| Lenovo IdeaPad Flex 3 11IGL05 | |
| GMK NucBox 3 | |
| Average Intel Celeron J4125 (155 - 174, n=5) | |
| Chuwi LarkBook CWI509 | |
| Chuwi LarkBox 4K Mini PC | |
| Zotac ZBOX EDGE CI341 | |
| Chuwi LapBook Plus | |
| Cinebench R23 / Multi Core | |
| Apple MacBook Pro 16 2021 M1 Pro | |
| Beelink GTI 11 | |
| Lenovo IdeaPad 3 15ITL05 81X80074GE | |
| Beelink U59 | |
| Chuwi LarkBook CWI509 | |
| Average Intel Celeron J4125 (860 - 1563, n=3) | |
| GMK NucBox 3 | |
| Cinebench R23 / Single Core | |
| Apple MacBook Pro 16 2021 M1 Pro | |
| Beelink GTI 11 | |
| Lenovo IdeaPad 3 15ITL05 81X80074GE | |
| Beelink U59 | |
| GMK NucBox 3 | |
| Average Intel Celeron J4125 (392 - 446, n=3) | |
| Cinebench R15 / CPU Multi 64Bit | |
| Apple MacBook Pro 16 2021 M1 Pro | |
| Beelink GTI 11 | |
| Intel NUC8i7BE | |
| Lenovo IdeaPad 3 15ITL05 81X80074GE | |
| Beelink U59 | |
| Chuwi LarkBox 4K Mini PC | |
| Zotac ZBOX EDGE CI341 | |
| Chuwi LarkBook CWI509 | |
| Average Intel Celeron J4125 (148 - 271, n=5) | |
| GMK NucBox 3 | |
| Lenovo IdeaPad Flex 3 11IGL05 | |
| Chuwi LapBook Plus | |
| Cinebench R15 / CPU Single 64Bit | |
| Apple MacBook Pro 16 2021 M1 Pro | |
| Beelink GTI 11 | |
| Intel NUC8i7BE | |
| Lenovo IdeaPad 3 15ITL05 81X80074GE | |
| Beelink U59 | |
| Lenovo IdeaPad Flex 3 11IGL05 | |
| Chuwi LarkBook CWI509 | |
| Average Intel Celeron J4125 (63.1 - 79.1, n=5) | |
| Chuwi LarkBox 4K Mini PC | |
| Zotac ZBOX EDGE CI341 | |
| GMK NucBox 3 | |
| Chuwi LapBook Plus | |
| HWBOT x265 Benchmark v2.2 / 4k Preset | |
| Beelink GTI 11 | |
| Intel NUC8i7BE | |
| Intel NUC8i7BE | |
| Lenovo IdeaPad 3 15ITL05 81X80074GE | |
| Beelink U59 | |
| Chuwi LarkBox 4K Mini PC | |
| Zotac ZBOX EDGE CI341 | |
| Average Intel Celeron J4125 (0.95 - 1.61, n=5) | |
| Chuwi LarkBook CWI509 | |
| GMK NucBox 3 | |
| Chuwi LapBook Plus | |
| Lenovo IdeaPad Flex 3 11IGL05 | |
| LibreOffice / 20 Documents To PDF | |
| GMK NucBox 3 | |
| Zotac ZBOX EDGE CI341 | |
| Chuwi LarkBox 4K Mini PC | |
| Average Intel Celeron J4125 (124 - 168.4, n=5) | |
| Lenovo IdeaPad Flex 3 11IGL05 | |
| Chuwi LarkBook CWI509 | |
| Beelink U59 | |
| Beelink GTI 11 | |
| Lenovo IdeaPad 3 15ITL05 81X80074GE | |
| R Benchmark 2.5 / Overall mean | |
| Zotac ZBOX EDGE CI341 | |
| Chuwi LarkBook CWI509 | |
| Average Intel Celeron J4125 (1.525 - 1.579, n=5) | |
| GMK NucBox 3 | |
| Lenovo IdeaPad Flex 3 11IGL05 | |
| Beelink U59 | |
| Lenovo IdeaPad 3 15ITL05 81X80074GE | |
| Intel NUC8i7BE | |
| Beelink GTI 11 | |
* ... smaller is better
AIDA64: FP32 Ray-Trace | FPU Julia | CPU SHA3 | CPU Queen | FPU SinJulia | FPU Mandel | CPU AES | CPU ZLib | FP64 Ray-Trace | CPU PhotoWorxx
| Performance rating | |
| Beelink GTI 11 | |
| Intel NUC11TNKi5 | |
| Intel NUC8i7BE -1! | |
| Beelink U59 | |
| Chuwi LarkBox 4K Mini PC | |
| Average Intel Celeron J4125 | |
| GMK NucBox 3 | |
| AIDA64 / FP32 Ray-Trace | |
| Beelink GTI 11 | |
| Intel NUC11TNKi5 | |
| Intel NUC8i7BE | |
| Beelink U59 | |
| Chuwi LarkBox 4K Mini PC | |
| Average Intel Celeron J4125 (726 - 1040, n=4) | |
| GMK NucBox 3 | |
| AIDA64 / FPU Julia | |
| Beelink GTI 11 | |
| Intel NUC11TNKi5 | |
| Intel NUC8i7BE | |
| Beelink U59 | |
| Chuwi LarkBox 4K Mini PC | |
| Average Intel Celeron J4125 (4191 - 6611, n=4) | |
| GMK NucBox 3 | |
| AIDA64 / CPU SHA3 | |
| Beelink GTI 11 | |
| Intel NUC11TNKi5 | |
| Beelink U59 | |
| Chuwi LarkBox 4K Mini PC | |
| Average Intel Celeron J4125 (300 - 417, n=4) | |
| GMK NucBox 3 | |
| AIDA64 / CPU Queen | |
| Intel NUC8i7BE | |
| Beelink GTI 11 | |
| Intel NUC11TNKi5 | |
| Beelink U59 | |
| Average Intel Celeron J4125 (19745 - 20042, n=4) | |
| GMK NucBox 3 | |
| Chuwi LarkBox 4K Mini PC | |
| AIDA64 / FPU SinJulia | |
| Intel NUC8i7BE | |
| Intel NUC11TNKi5 | |
| Beelink GTI 11 | |
| Chuwi LarkBox 4K Mini PC | |
| Average Intel Celeron J4125 (898 - 1263, n=4) | |
| GMK NucBox 3 | |
| Beelink U59 | |
| AIDA64 / FPU Mandel | |
| Beelink GTI 11 | |
| Intel NUC11TNKi5 | |
| Intel NUC8i7BE | |
| Beelink U59 | |
| Chuwi LarkBox 4K Mini PC | |
| Average Intel Celeron J4125 (2231 - 3614, n=4) | |
| GMK NucBox 3 | |
| AIDA64 / CPU AES | |
| Beelink GTI 11 | |
| Intel NUC11TNKi5 | |
| Beelink U59 | |
| Intel NUC8i7BE | |
| Chuwi LarkBox 4K Mini PC | |
| Average Intel Celeron J4125 (8288 - 10604, n=4) | |
| GMK NucBox 3 | |
| AIDA64 / CPU ZLib | |
| Intel NUC11TNKi5 | |
| Beelink GTI 11 | |
| Intel NUC8i7BE | |
| Beelink U59 | |
| Chuwi LarkBox 4K Mini PC | |
| Average Intel Celeron J4125 (105 - 137, n=4) | |
| GMK NucBox 3 | |
| AIDA64 / FP64 Ray-Trace | |
| Beelink GTI 11 | |
| Intel NUC11TNKi5 | |
| Intel NUC8i7BE | |
| Beelink U59 | |
| Chuwi LarkBox 4K Mini PC | |
| Average Intel Celeron J4125 (404 - 578, n=4) | |
| GMK NucBox 3 | |
| AIDA64 / CPU PhotoWorxx | |
| Beelink GTI 11 | |
| Intel NUC8i7BE | |
| Intel NUC11TNKi5 | |
| Beelink U59 | |
| Chuwi LarkBox 4K Mini PC | |
| Average Intel Celeron J4125 (6210 - 6778, n=4) | |
| GMK NucBox 3 | |
System Performance
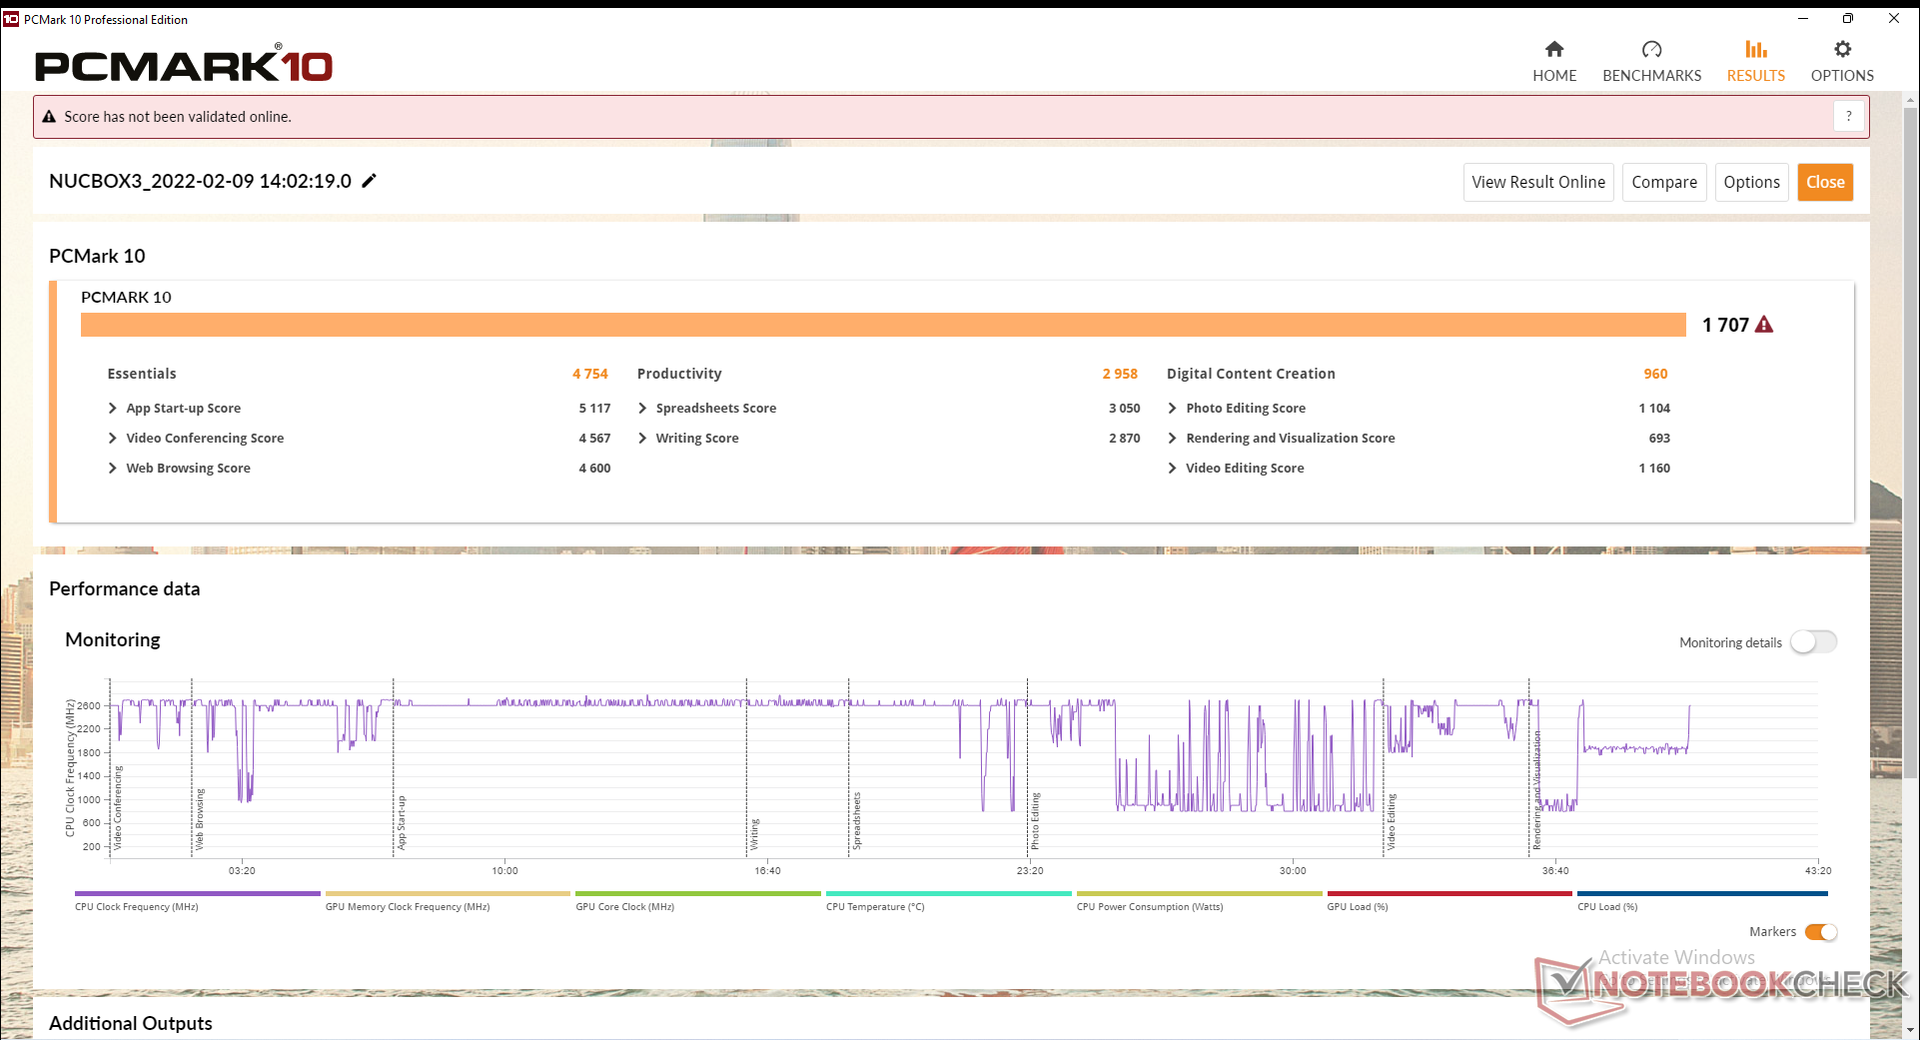
Windows 11 runs very slowly on the NucBox 3. Simple actions that are normally instantaneous on other PCs like opening file explorers, small files, or even clicking the Windows Start icon all have noticeable delays to them on the NucBox 3. We find the slow navigation to be tolerable for light browsing or word processing, but you're going to want something faster for any sort of active multitasking.
| PCMark 10 / Score | |
| Beelink GTI 11 | |
| Intel NUC8i7BE | |
| Intel NUC11TNKi5 | |
| Beelink U59 | |
| Chuwi LarkBox 4K Mini PC | |
| Average Intel Celeron J4125, Intel UHD Graphics 600 (1461 - 1898, n=5) | |
| GMK NucBox 3 | |
| PCMark 10 / Essentials | |
| Beelink GTI 11 | |
| Intel NUC11TNKi5 | |
| Intel NUC8i7BE | |
| Beelink U59 | |
| Chuwi LarkBox 4K Mini PC | |
| GMK NucBox 3 | |
| Average Intel Celeron J4125, Intel UHD Graphics 600 (3998 - 4993, n=5) | |
| PCMark 10 / Productivity | |
| Intel NUC8i7BE | |
| Beelink GTI 11 | |
| Intel NUC11TNKi5 | |
| Beelink U59 | |
| Chuwi LarkBox 4K Mini PC | |
| GMK NucBox 3 | |
| Average Intel Celeron J4125, Intel UHD Graphics 600 (2697 - 3050, n=5) | |
| PCMark 10 / Digital Content Creation | |
| Beelink GTI 11 | |
| Intel NUC11TNKi5 | |
| Intel NUC8i7BE | |
| Beelink U59 | |
| Chuwi LarkBox 4K Mini PC | |
| Average Intel Celeron J4125, Intel UHD Graphics 600 (786 - 1216, n=5) | |
| GMK NucBox 3 | |
| PCMark 10 Score | 1707 points | |
Help | ||
| AIDA64 / Memory Copy | |
| Intel NUC8i7BE | |
| Beelink GTI 11 | |
| Beelink U59 | |
| Intel NUC11TNKi5 | |
| Chuwi LarkBox 4K Mini PC | |
| Average Intel Celeron J4125 (12604 - 13833, n=4) | |
| GMK NucBox 3 | |
| AIDA64 / Memory Read | |
| Beelink GTI 11 | |
| Intel NUC8i7BE | |
| Intel NUC11TNKi5 | |
| Beelink U59 | |
| Chuwi LarkBox 4K Mini PC | |
| Average Intel Celeron J4125 (9928 - 10248, n=4) | |
| GMK NucBox 3 | |
| AIDA64 / Memory Write | |
| Intel NUC8i7BE | |
| Beelink GTI 11 | |
| Beelink U59 | |
| Intel NUC11TNKi5 | |
| Chuwi LarkBox 4K Mini PC | |
| Average Intel Celeron J4125 (10347 - 10627, n=4) | |
| GMK NucBox 3 | |
| AIDA64 / Memory Latency | |
| Chuwi LarkBox 4K Mini PC | |
| Intel NUC11TNKi5 | |
| GMK NucBox 3 | |
| Average Intel Celeron J4125 (73.2 - 93.2, n=4) | |
| Beelink GTI 11 | |
| Beelink U59 | |
| Intel NUC8i7BE | |
* ... smaller is better
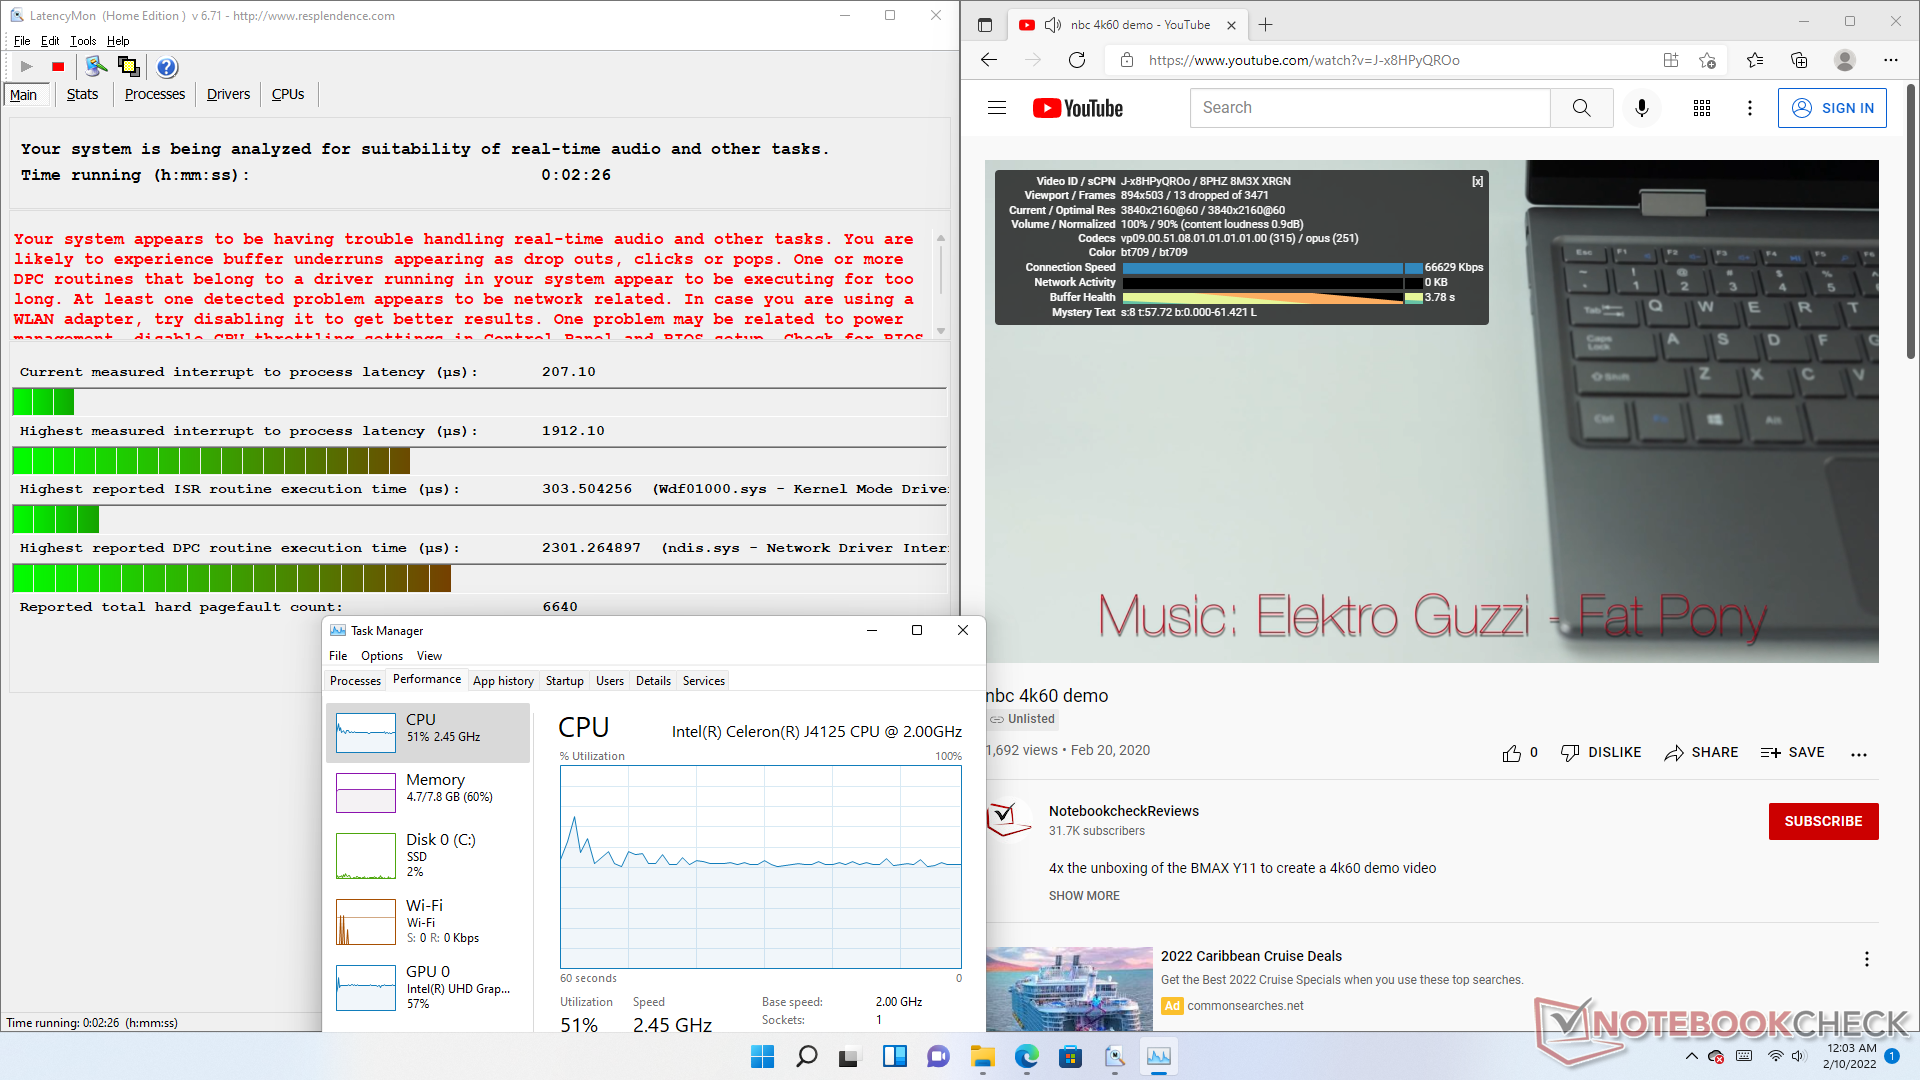
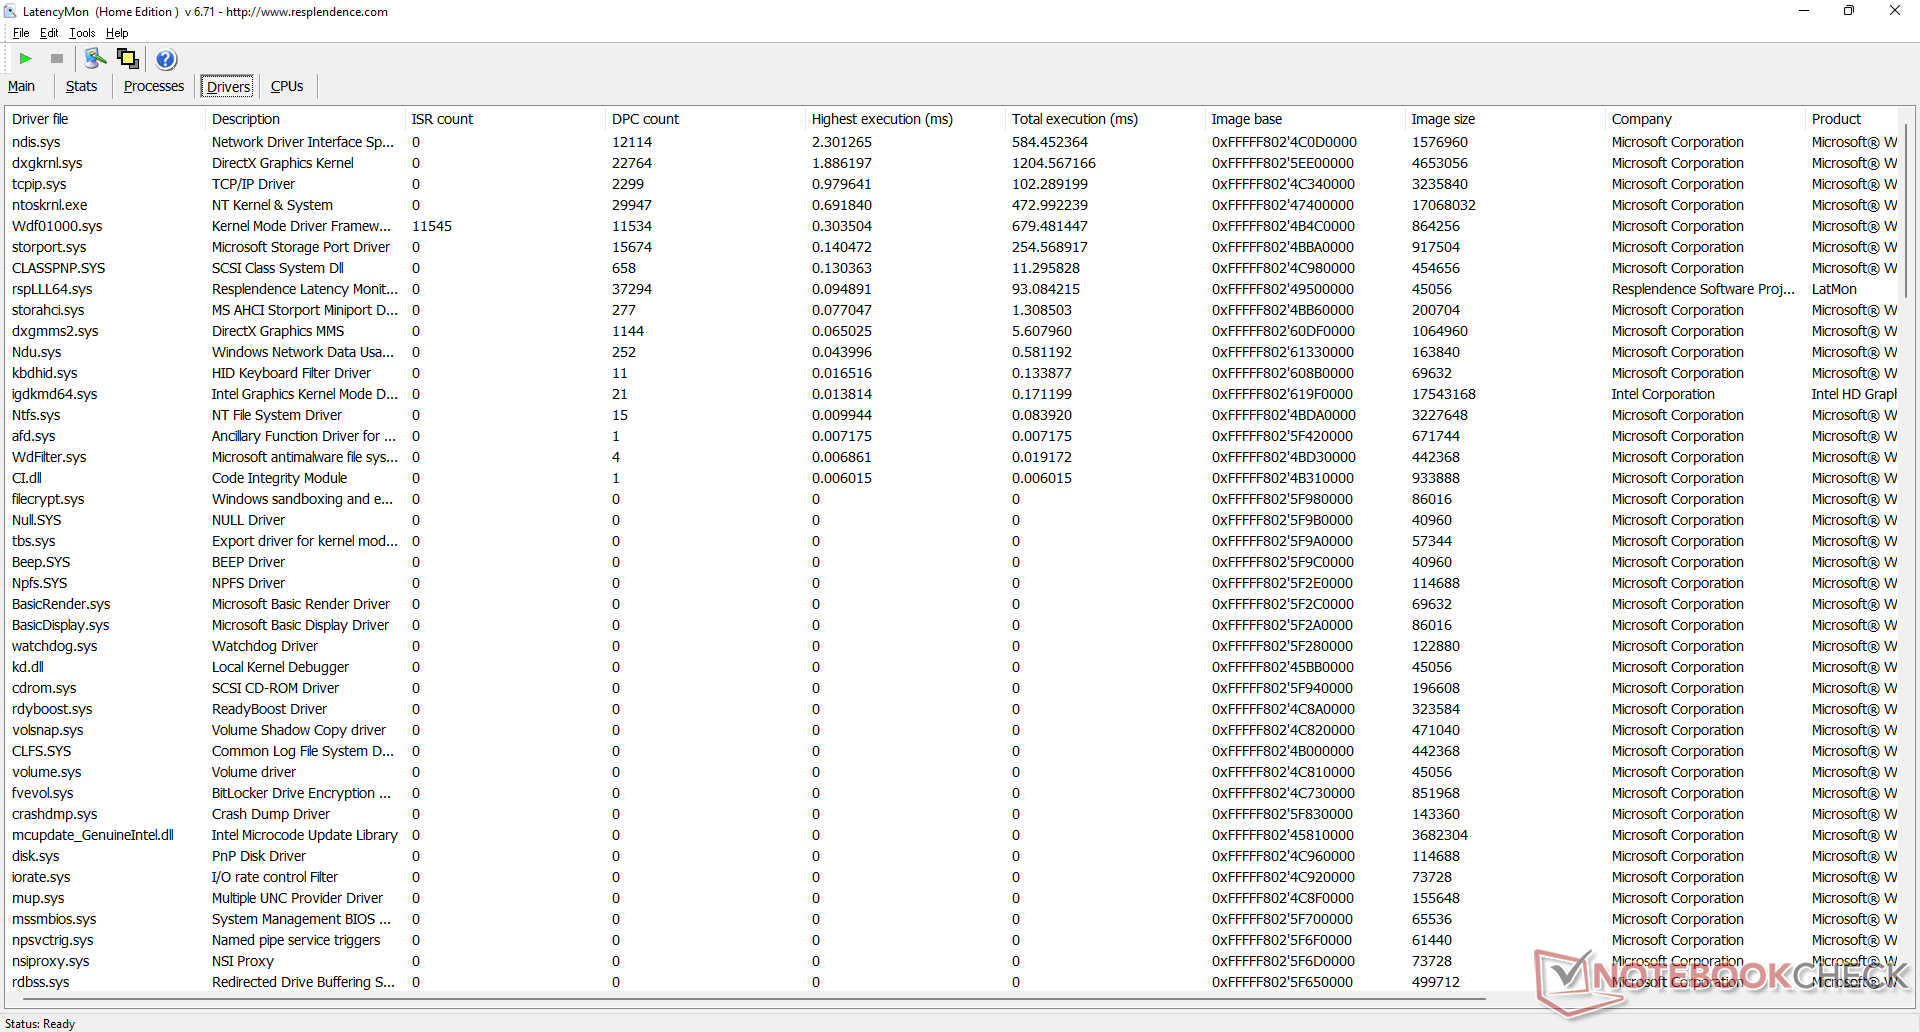
DPC Latency
LatencyMon shows DPC issues when opening multiple browser tabs on our homepage. 4K video playback at 60 FPS is generally ok but not perfect as we're able to record 13 dropped frames during our minute-long video test. CPU and GPU utilization each hover at around 50 to 60 percent when under such conditions.
| DPC Latencies / LatencyMon - interrupt to process latency (max), Web, Youtube, Prime95 | |
| Lenovo IdeaPad Flex 3 11IGL05 | |
| Chuwi LarkBook CWI509 | |
| GMK NucBox 3 | |
| Chuwi LarkBox 4K Mini PC | |
| Beelink U59 | |
| Intel NUC11TNKi5 | |
| Beelink GTI 11 | |
* ... smaller is better
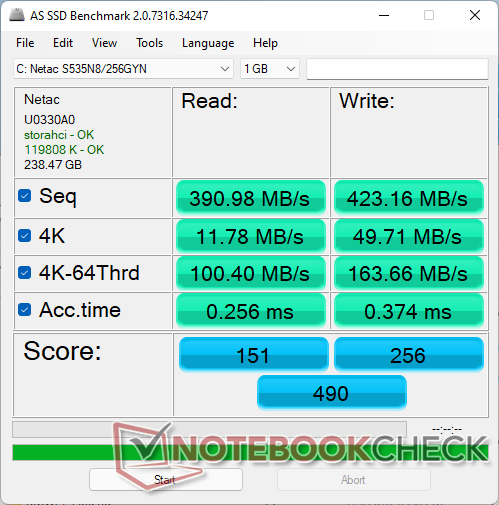
Storage Devices
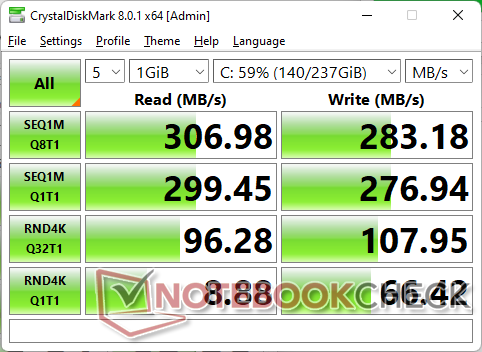
There is just one internal storage slot and it is compatible with M.2 SATA SSDs only. The 256 GB Netac drive on our unit would return mediocre read and write rates of around 300 to 500 MB/s each. The drive appears to have trouble maintaining its maximum performance for long periods when running DiskSpeed in a loop.

| Drive Performance rating - Percent | |
| Beelink GTI 11 | |
| Intel NUC11TNKi5 | |
| Beelink U59 | |
| GMK NucBox 3 | |
| Chuwi LarkBox 4K Mini PC | |
* ... smaller is better
Disk Throttling: DiskSpd Read Loop, Queue Depth 8
GPU Performance
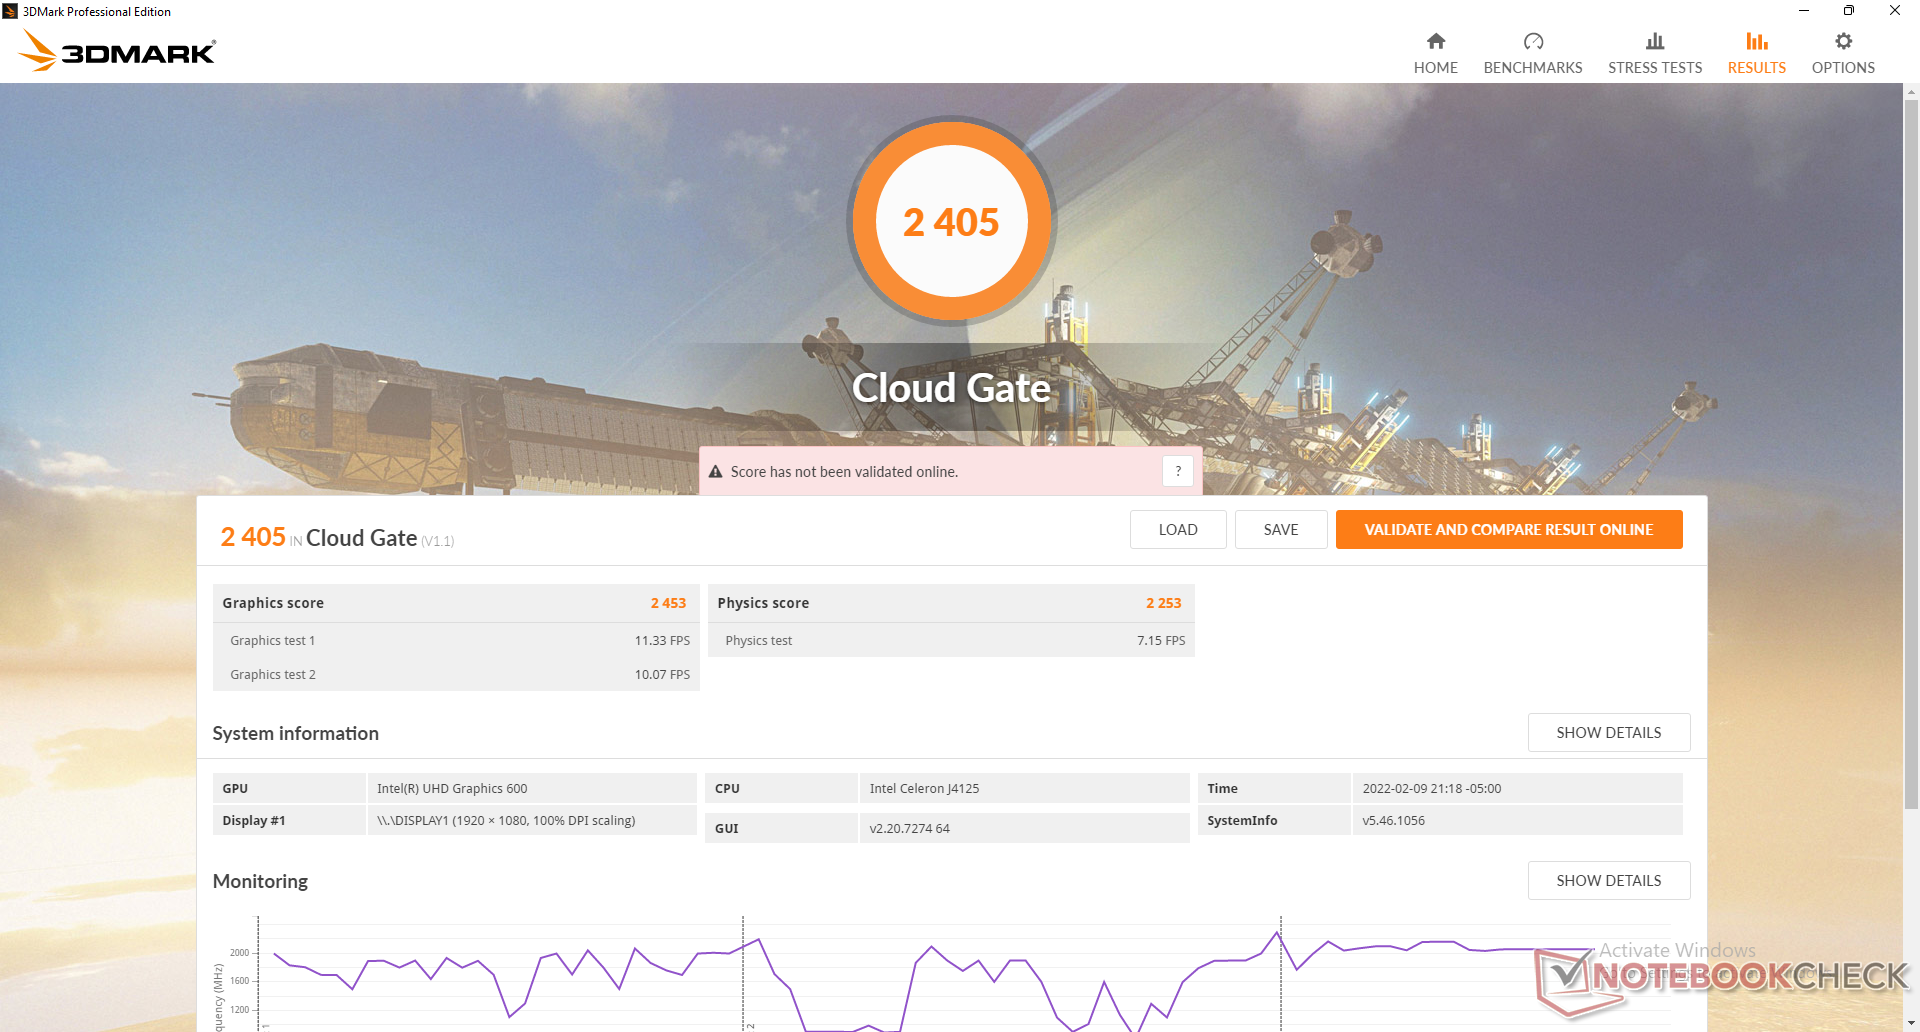
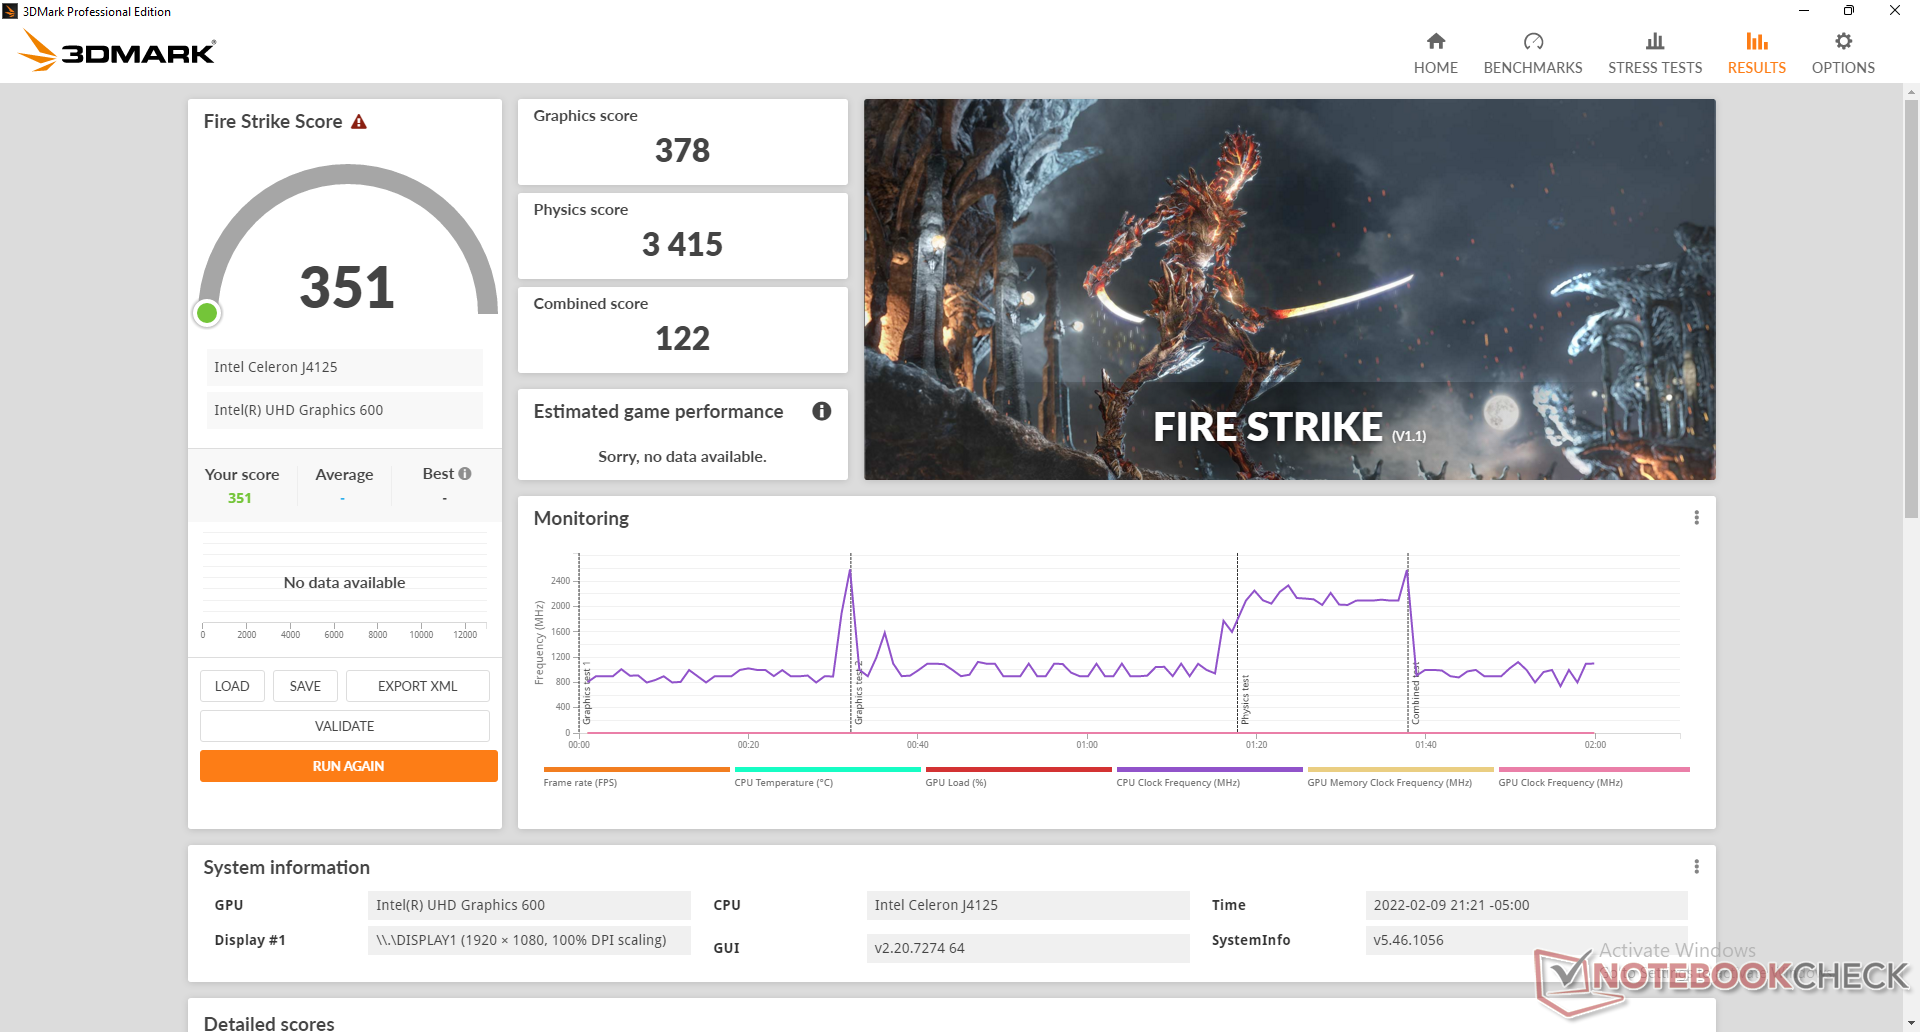
Graphics performance is poor and unfit for any sort of gaming as the UHD Graphics 600 is much slower than the common UHD Graphics 620. The NucBox 3 is instead better for streaming purposes.
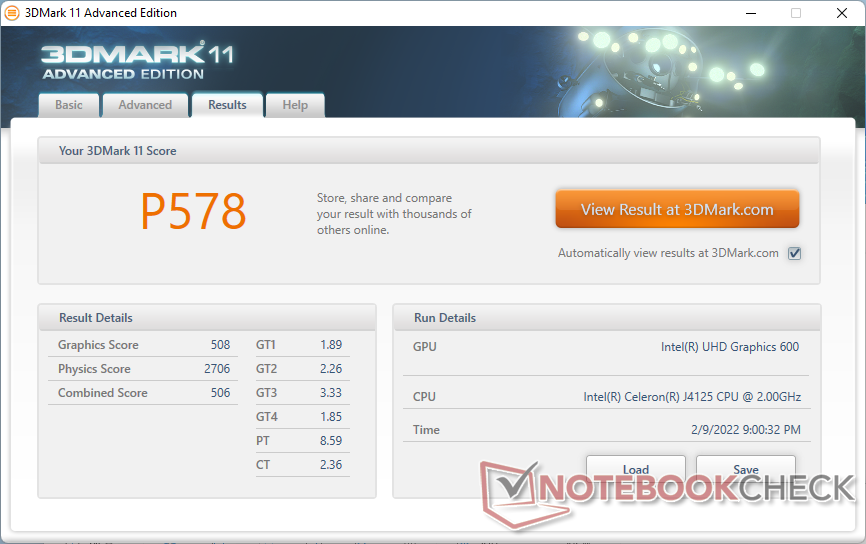
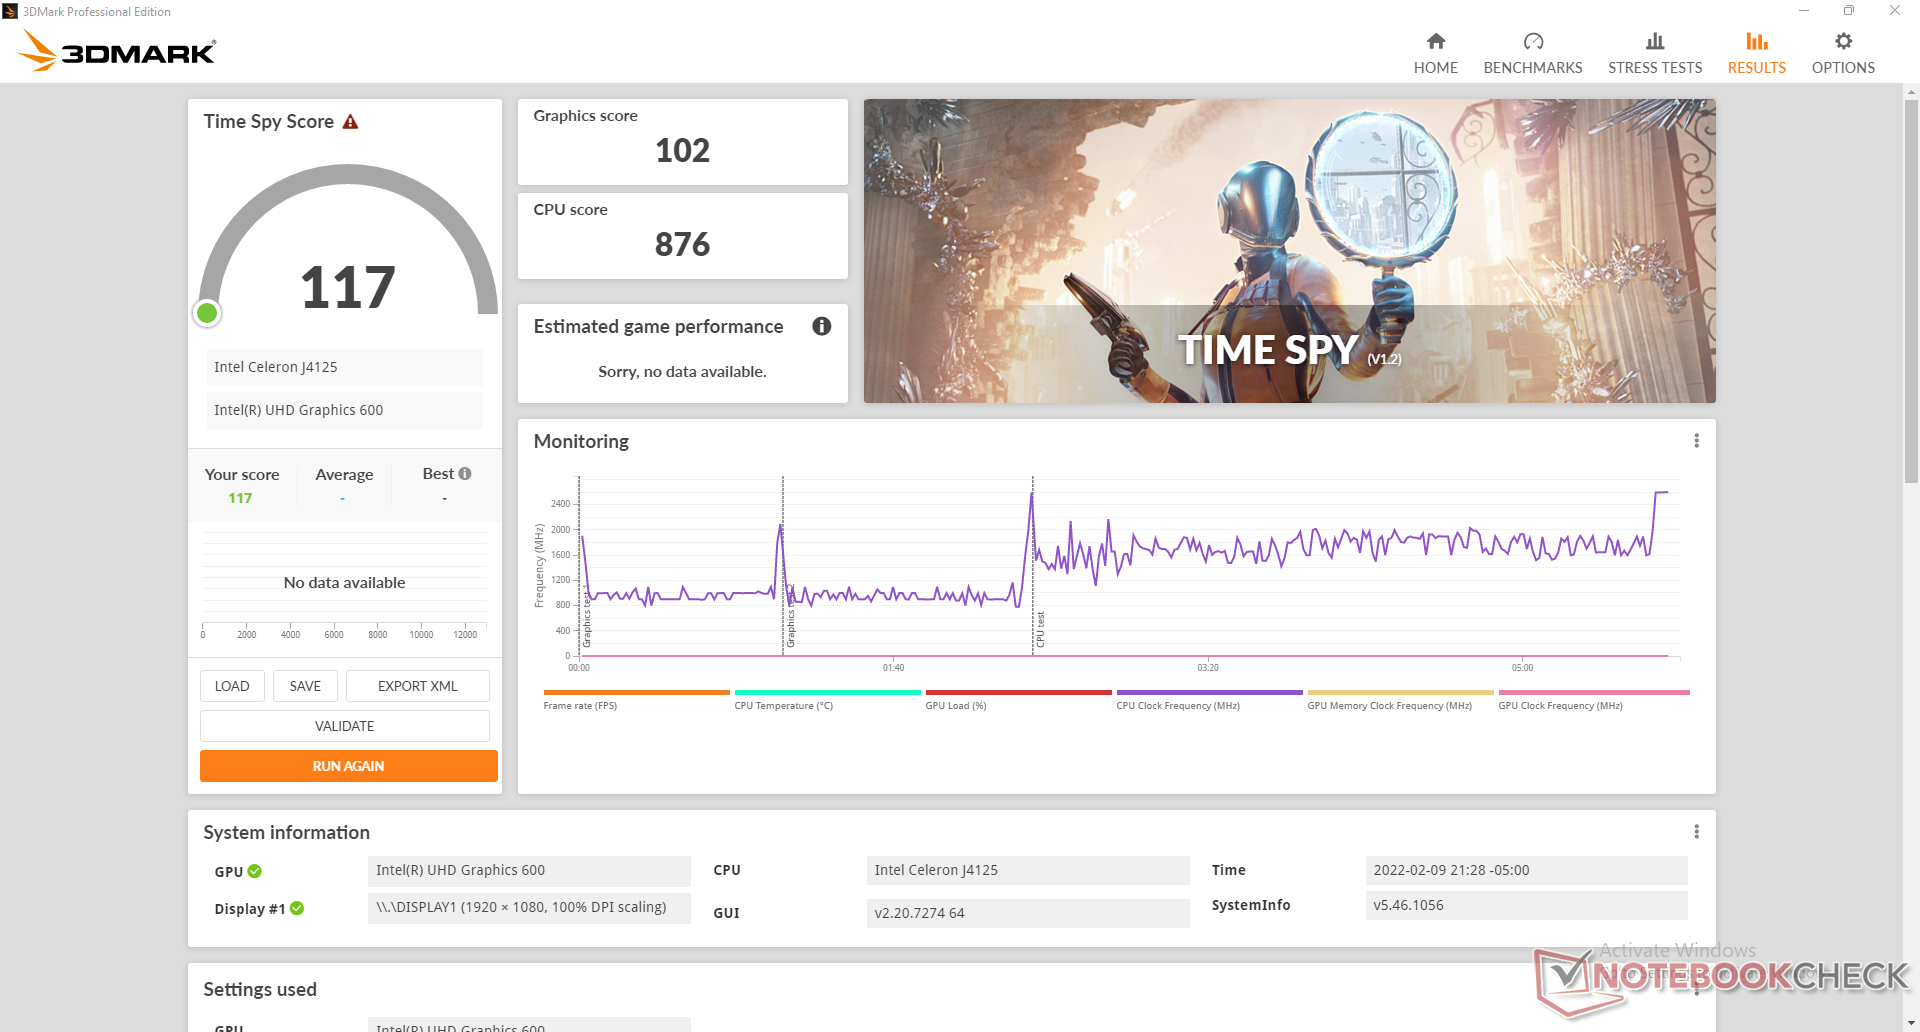
| 3DMark 11 Performance | 578 points | |
| 3DMark Cloud Gate Standard Score | 2405 points | |
| 3DMark Fire Strike Score | 351 points | |
| 3DMark Time Spy Score | 117 points | |
Help | ||
| low | med. | high | ultra | |
|---|---|---|---|---|
| Dota 2 Reborn (2015) | 34.3 | 14.2 | 6.8 | 6.3 |
| Final Fantasy XV Benchmark (2018) | 4.13 | |||
| X-Plane 11.11 (2018) | 7.67 | 4.75 | 4.5 |
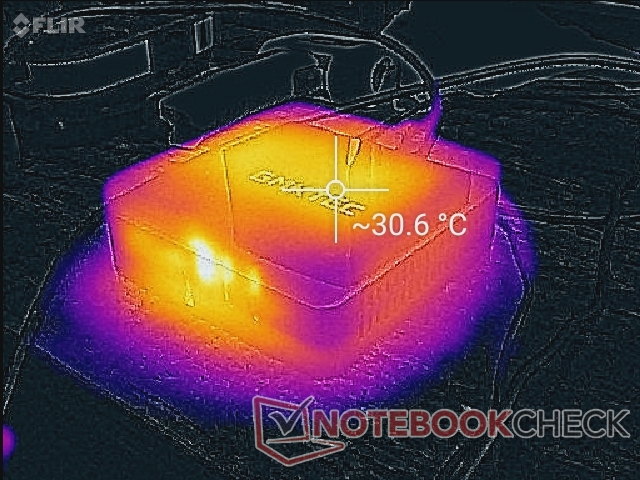
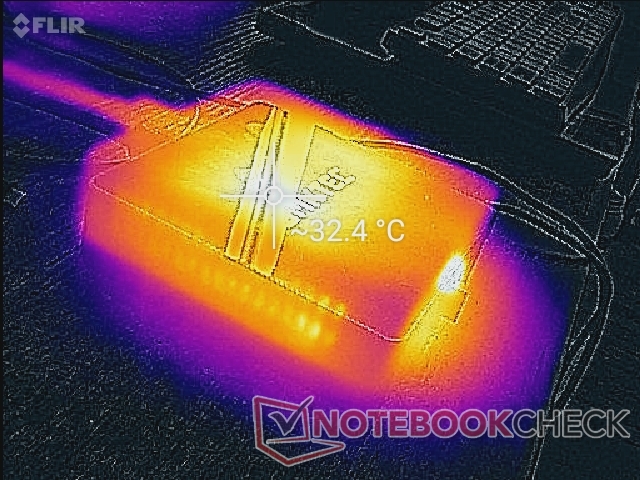
Emissions
Temperature
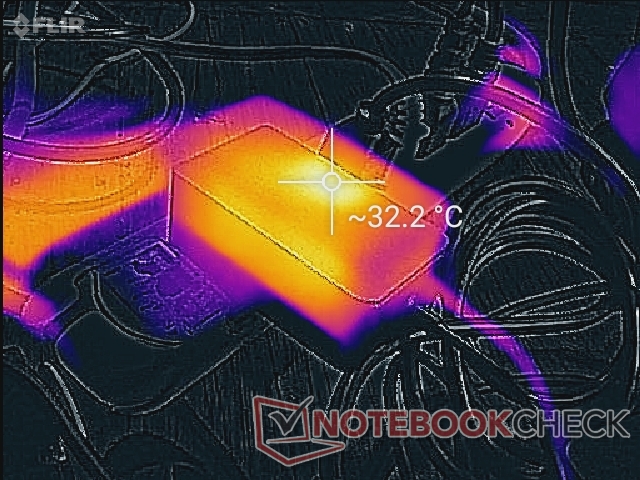
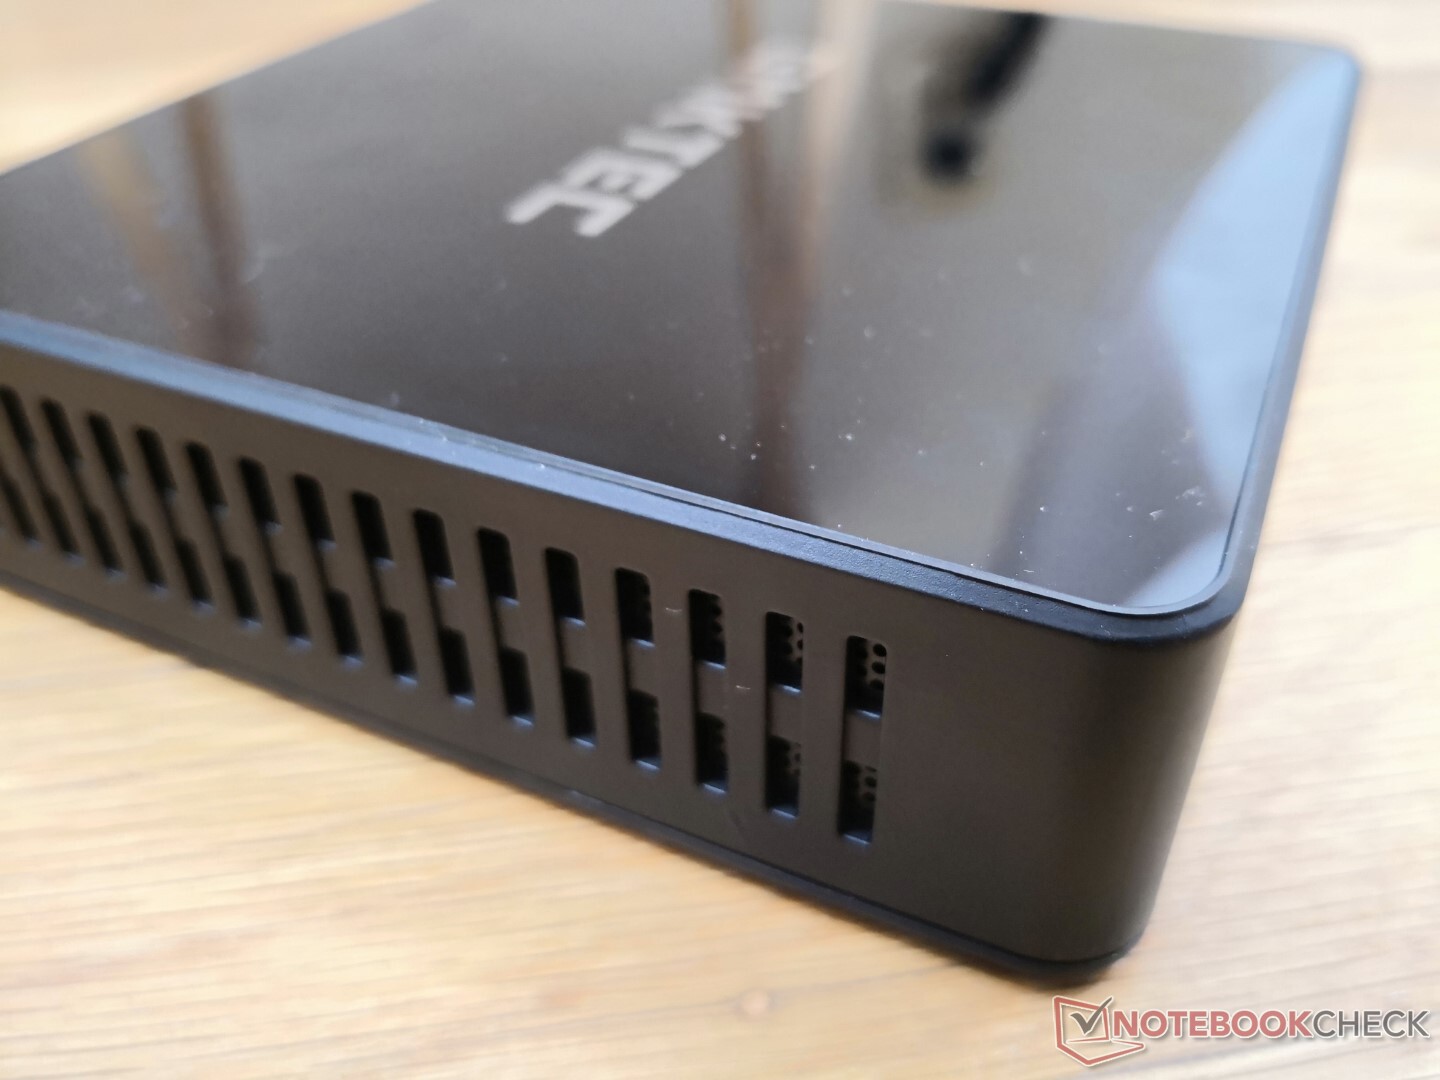
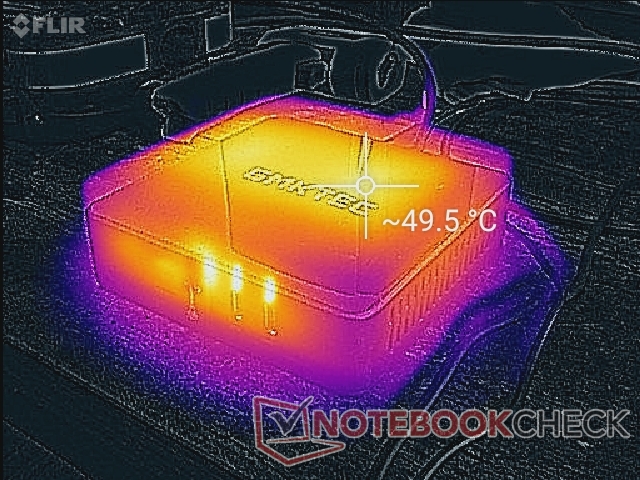
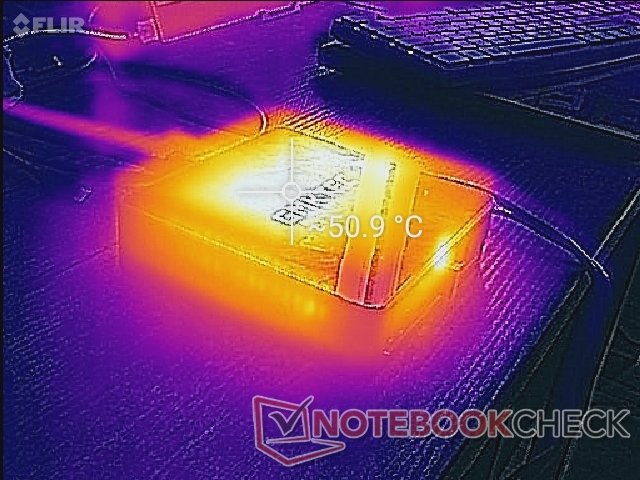
Surface temperatures are generally warmer than on most other mini PCs since the NucBox 3 has no internal fan. When running high loads for extended periods, the top surface can be as warm as 50 C compared to only 30 C on the Beelink GTR5. You'll want to be mindful of any items or books placed on top of the GMK mini PC.
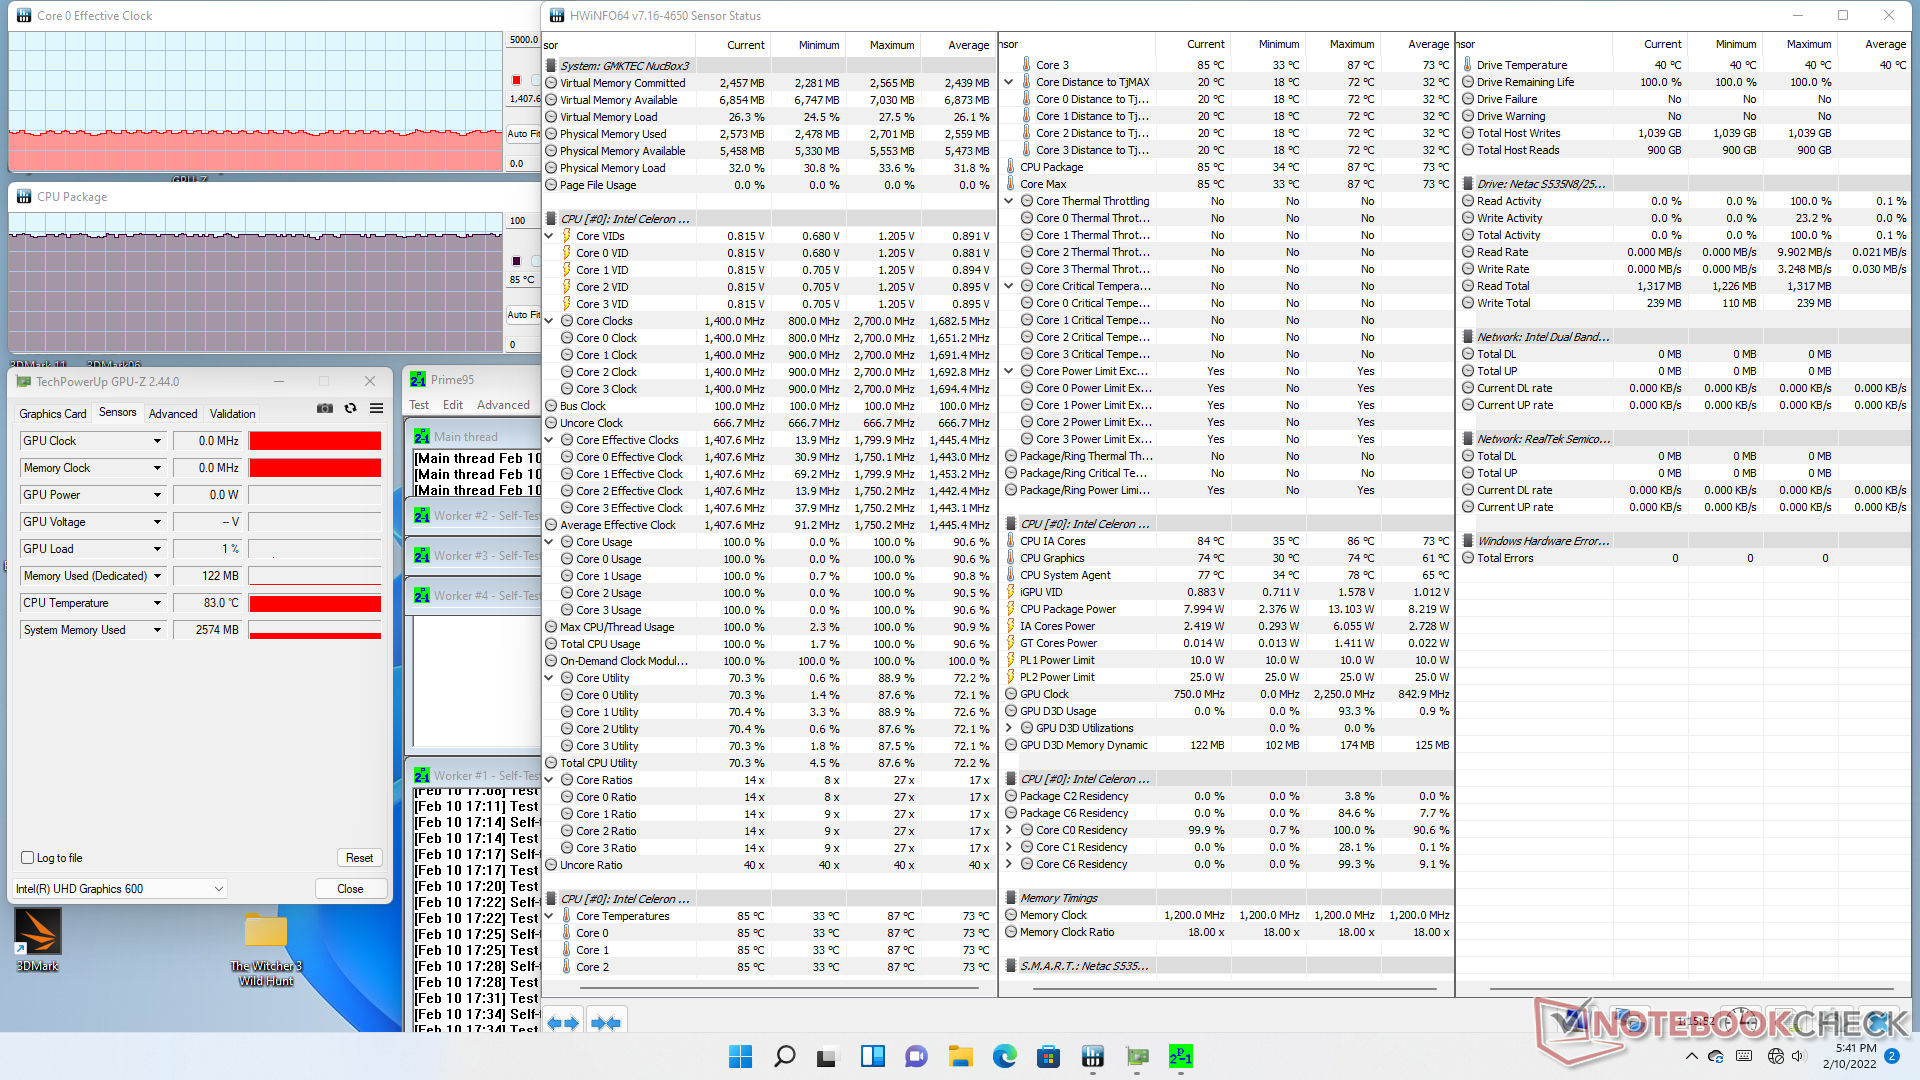
Stress Test
The CPU stabilizes at 37 C when idling on desktop with no running applications. When running Prime95, CPU clock rates would boost to 1.7 GHz for a few minutes until eventually stabilizing at 1.4 GHz and 85 C. This core temperature under load is warmer than on most other mini PCs since our NucBox 3 is fanless. The higher-than-average CPU temperature would also explain the higher-than-average surface temperature noted above.
CPU package power would boost to 13 W during the start of the test before quickly stabilizing at the 8 to 9 W range.
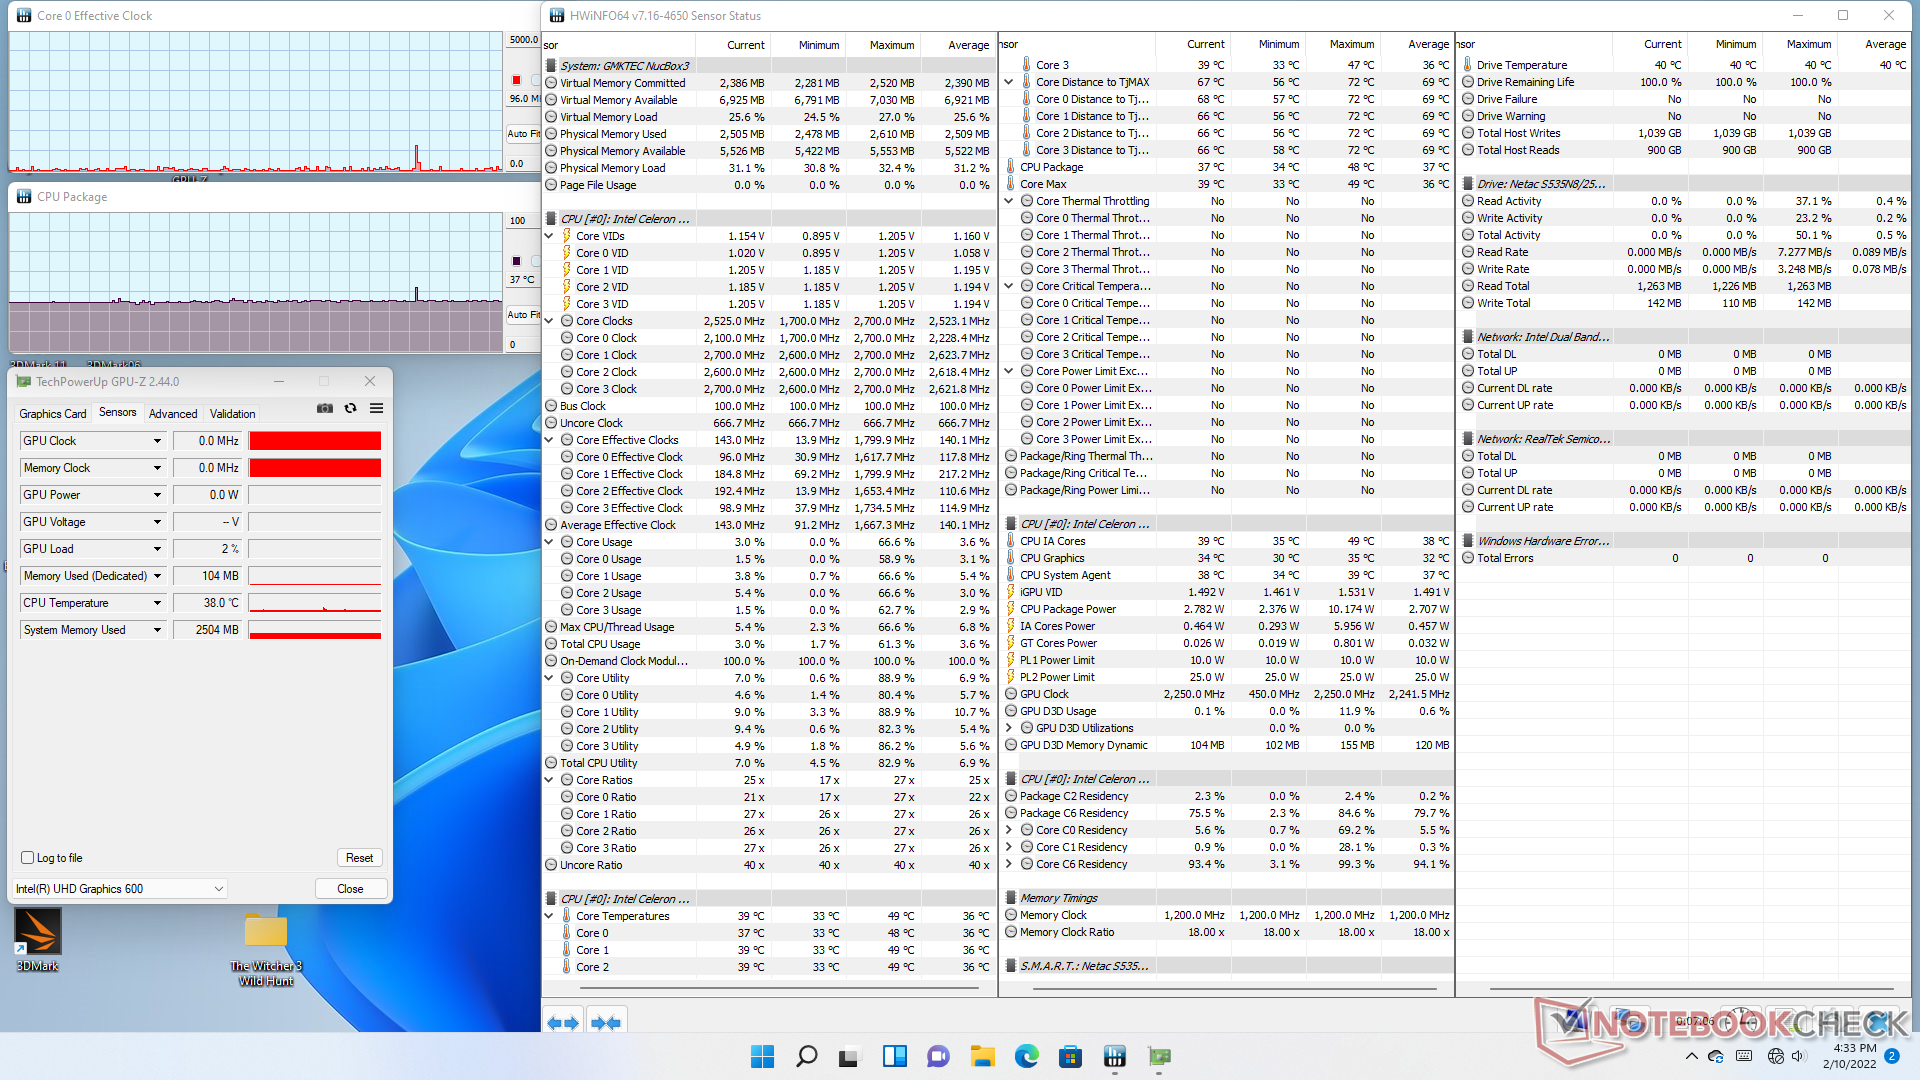
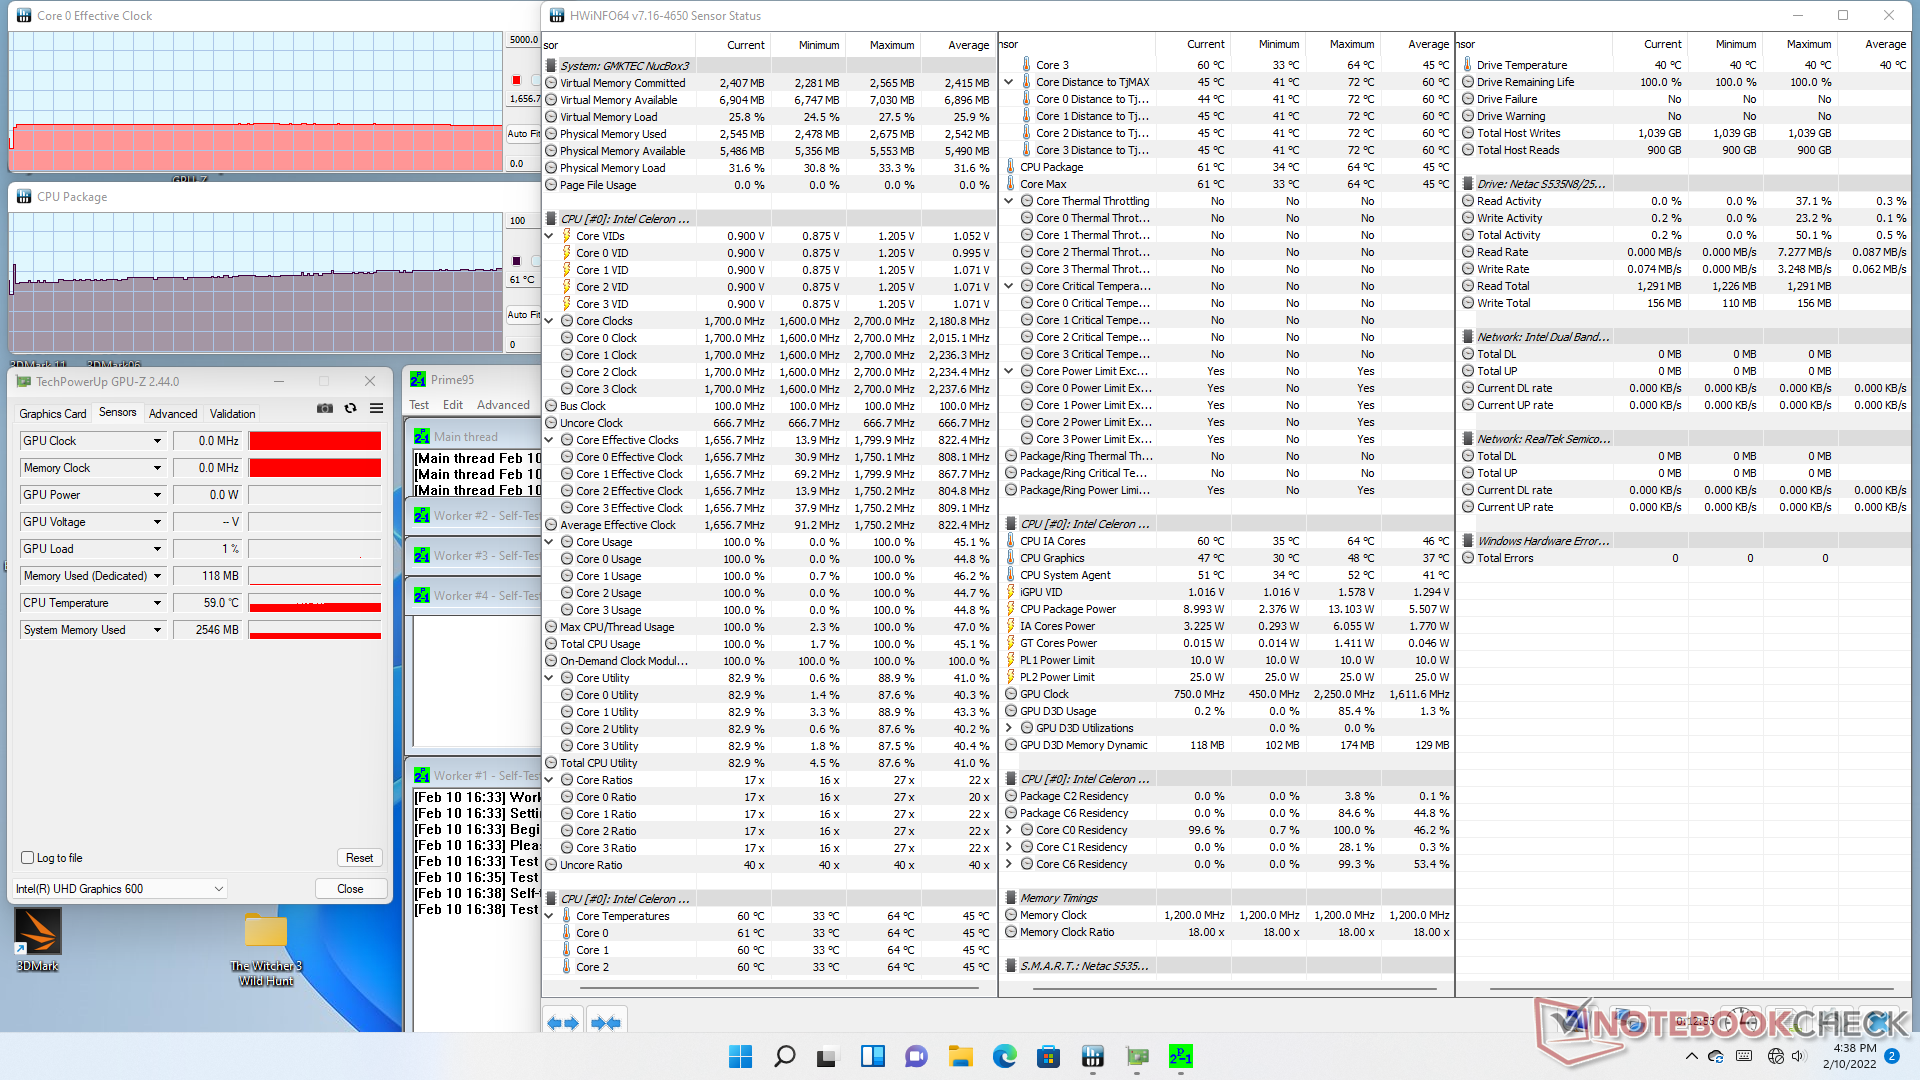
| CPU Clock (GHz) | GPU Clock (MHz) | Average CPU Temperature (°C) | |
| System Idle | -- | -- | 37 |
| Prime95 Stress | 1.4 | -- | 85 |
Energy Management
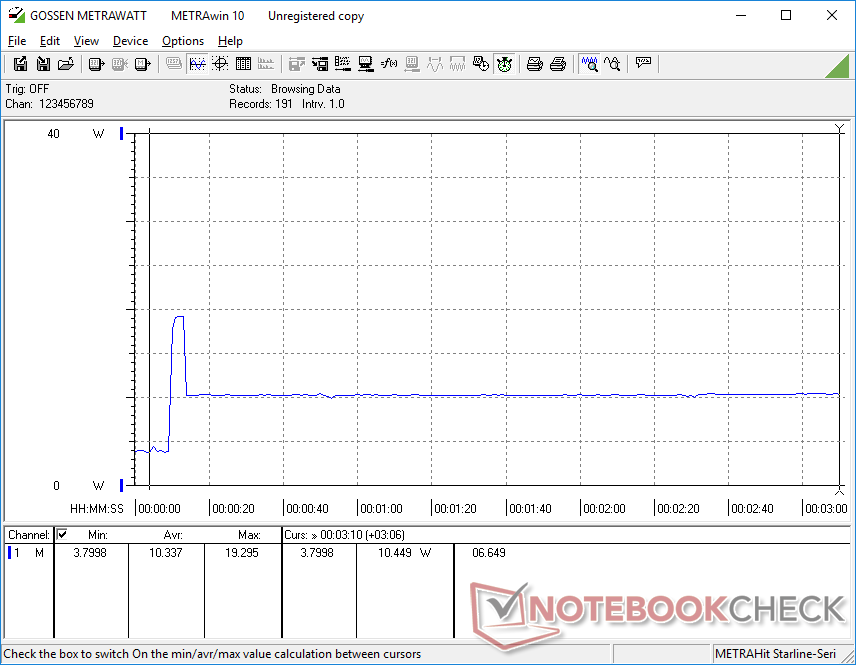
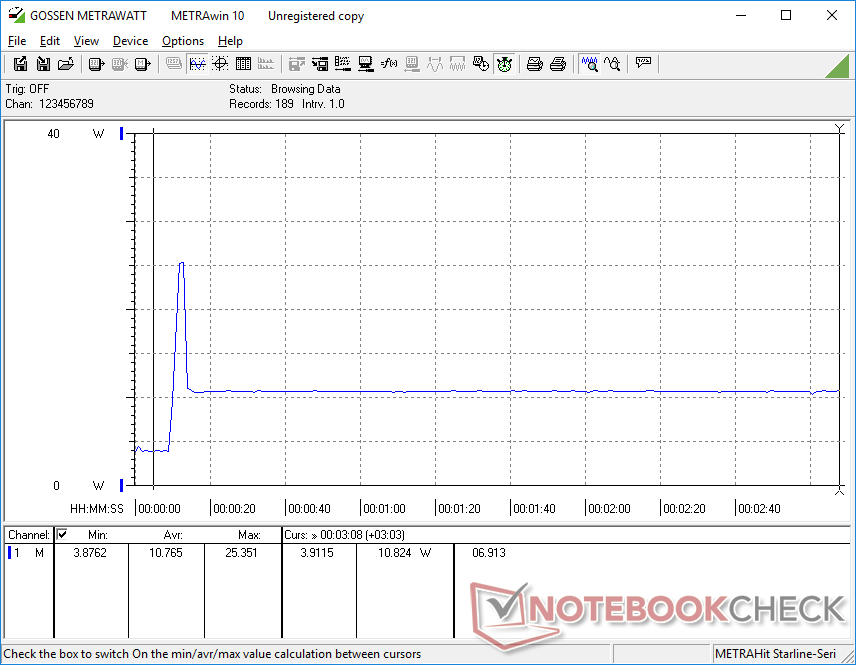
Power Consumption
As expected, the NucBox 3 is very power efficient and less demanding than many of its alternatives including the Beelink U59 or Chuwi LarkBox. Idling on desktop draws just 3 to 4 W while higher loads tend to average around 11 W. Consumption can spike up to 25 W when under extreme loads albeit for only a few seconds at most due to the limited Turbo Boost potential of the processor.
| Off / Standby | |
| Idle | |
| Load |
|
Key:
min: | |
| GMK NucBox 3 Celeron J4125, UHD Graphics 600, Netac S535N8/256GYN, , x, | Chuwi LarkBox 4K Mini PC Celeron J4115, UHD Graphics 600, 128 GB eMMC Flash, , x, | Intel NUC11TNKi5 i5-1135G7, Iris Xe G7 80EUs, Transcend M.2 SSD 430S TS512GMTS430S, , x, | Intel NUC8i7BE i7-8559U, Iris Plus Graphics 655, , , x, | Beelink GTI 11 i5-1135G7, Iris Xe G7 80EUs, Kingston SA2000M8500G, , x, | Beelink U59 Celeron N5095, UHD Graphics (Jasper Lake 16 EU), Silicon Motion AZW 512G NV428, , x, | |
|---|---|---|---|---|---|---|
| Power Consumption | 11% | -259% | -142% | -363% | -78% | |
| Idle Minimum * (Watt) | 3 | 2.2 27% | 11.5 -283% | 2.7 10% | 15.2 -407% | 6.7 -123% |
| Idle Average * (Watt) | 3.1 | 2.6 16% | 12.4 -300% | 3.1 -0% | 16 -416% | 6.7 -116% |
| Idle Maximum * (Watt) | 3.6 | 3 17% | 12.9 -258% | 6.3 -75% | 16 -344% | 7.4 -106% |
| Load Average * (Watt) | 11.1 | 13.1 -18% | 40.7 -267% | 59.7 -438% | 48.6 -338% | 16 -44% |
| Load Maximum * (Watt) | 25.4 | 21.9 14% | 73.5 -189% | 78 -207% | 104.3 -311% | 25.6 -1% |
| Witcher 3 ultra * (Watt) | 43.9 | 47.2 | 53.8 | 13.1 |
* ... smaller is better
Power Consumption Witcher 3 / Stresstest
Power Consumption external Monitor
Pros
Cons
Verdict
On paper, a slim, inexpensive, and fanless HTPC with 4K video playback capabilities should be ideal for just about any home theater setup. The silent NucBox 3 has certainly nailed the low price and inconspicuous profile, but performance is barely sufficient if not lacking even for the most basic of HTPC tasks. The latency, frame skips, and extended loading times are tough sacrifices for a fanless PC. For "set it and forget it" scenarios, however, the slow performance will be less of an issue.
Its very low price is the most attractive aspect of the NucBox 3. Potential owners should be aware of the overall slow system performance that entails.
Fanless mini PCs with faster CPUs and performance are available such as the Zotac ZBox CI622 Nano with a 10th gen Intel Core i3 CPU. It'll cost a bit more, but it may be worth considering if you plan on using your HTPC frequently.
Price and Availability
The NucBox 3 is now widely available through Amazon or directly from GMK for $310 USD or less.
Price comparison
