

AMD Ryzen AI 9 HX 370 vs AMD Ryzen AI Max+ 395
AMD Ryzen AI 9 HX 370
► remove from comparison
The AMD Ryzen AI 9 HX 370 is a powerful Strix Point family processor that debuted in June 2024. The APU comes with 12 CPU cores running at 2.0 GHz to 5.1 GHz, the 16 CU RDNA 3+ Radeon 890M graphics adapter and the 50 TOPS XDNA 2 neural engine. Other noteworthy features include PCIe 4, USB 4 and LPDDR5x-8000 RAM support.
Of the 12 CPU cores, 4 are full Zen 5 cores and 8 are smaller Zen 5c cores. The latter run at significantly lower clock speeds than the former.
Architecture and Features
Strix Point family APUs are powered by Zen 5 and Zen 5c microarchitecture cores, the latter being a slightly slower, smaller and more energy-efficient version of the former. One of the differences between Zen 5 and Zen 5c is cache size; Zen 5 cores have larger caches to work with. According to AMD, Zen 5 delivers a 16% IPC improvement over Zen 4 thanks to branch prediction improvements and other refinements.
Elsewhere, the HX 370 supports LPDDR5x-8000 and DDR5-5600 RAM, and is natively compatible with USB 4 (and therefore Thunderbolt). It has PCIe 4.0 support for a throughput of 1.9 GB/s per lane, just like its 8000 series predecessors did. The integrated XDNA 2 NPU delivers up to 50 INT8 TOPS for accelerating various AI workloads.
Performance
Given the IPC improvement, we expect 4 Zen 5 cores combined with 8 Zen 5c cores to perform about as well as 16 Zen 4 cores meaning there is a real chance of the HX 370 dethroning the Ryzen 9 7945HX3D. We'll make sure to update this section once we get our hands on a laptop powered by the HX 370.
Graphics
The Radeon 890M is the most powerful iGPU that AMD has on offer right now. It features 16 RDNA 3+ architecture CUs (1024 unified shaders) running at up to 2,900 MHz. We expect the graphics adapter to deliver gaming performance good enough for playing 2023 and 2024 games in 1080p (Low detail settings).
Naturally, the 890M is capable of driving four SUHD 4320p60 monitors. It can also efficiently encode and decode the most popular video codecs including AVC, HEVC, VP9 and AV1. The latest addition to that list, the VVC codec, is not supported unlike it is with Intel Lunar Lake chips.
Power consumption
The HX 370 is supposed to have a base TDP of 28 W, with laptop makers free to crank it up to up to 54 W. Which they will most likely do to maximize performance.
The 4 nm TSMC process that the CPU cores are built with make for decent, as of mid 2024, energy efficiency.
AMD Ryzen AI Max+ 395
► remove from comparison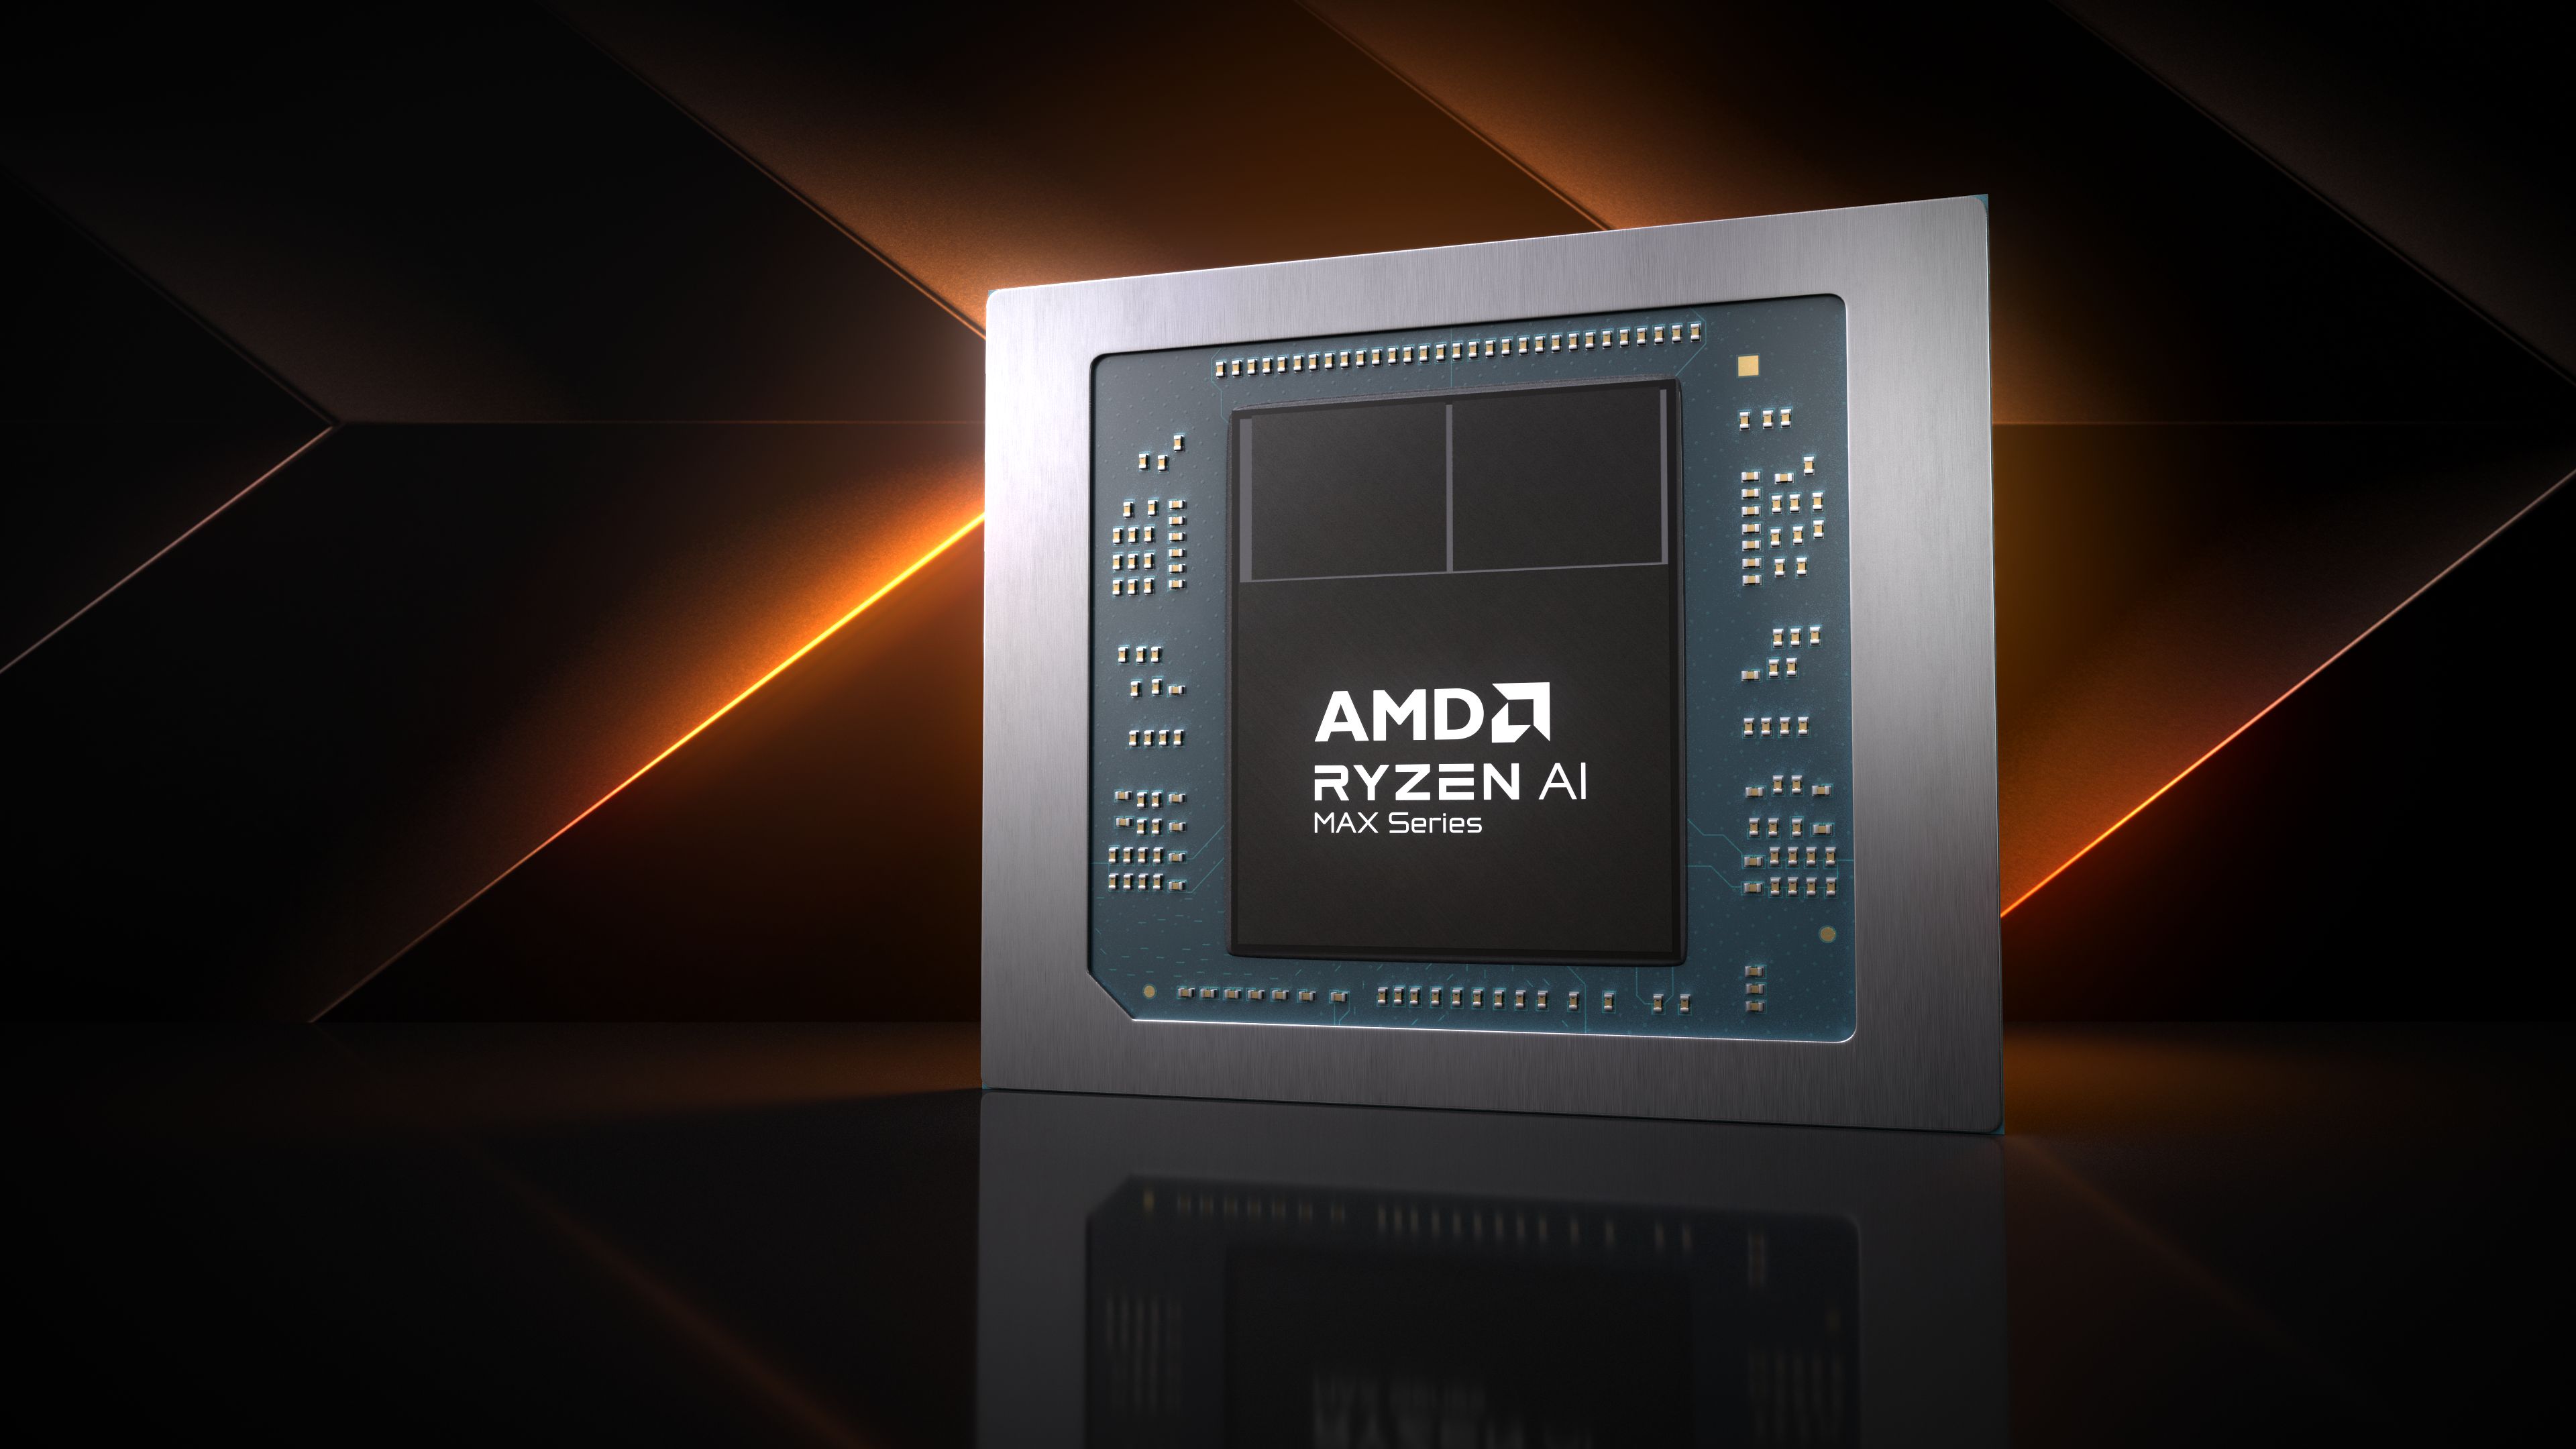
The AMD Ryzen AI Max+ 395 is a powerful Strix Halo family processor that debuted in January 2025. The APU comes with 16 Zen 5 CPU cores running at up to 5.1 GHz, the 40 CU RDNA 3+ Radeon 8060S graphics adapter and the 50 TOPS XDNA 2 neural engine. Other noteworthy features include PCIe 4, USB 4 and LPDDR5x-8000 RAM support and a whole lot of L3 cache.
Architecture and Features
Unlike Strix Point, Strix Halo parts are powered by Zen 5 cores - no Zen 5c here. It's not clear if this is the desktop Zen 5 implementation with full AVX512 throughput or the mobile one. According to AMD, Zen 5 delivers a 16% IPC improvement over Zen 4 thanks to branch prediction improvements and other refinements.
Elsewhere, the AI Max+ chip supports RAM as fast as LPDDR5x-8000, and is natively compatible with USB 4 (and therefore Thunderbolt). It has PCIe 4.0 support for a throughput of 1.9 GB/s per lane, just like its 8000 series predecessors had. The integrated XDNA 2 NPU delivers up to 50 INT8 TOPS for accelerating various AI workloads.
Performance
From leaks, we know that the Ryzen delivers around 20,700 Geekbench 6.3 Multi points, meaning it trades blow with very powerful desktop CPUs like the Ryzen 9 9900X.
Graphics
The Radeon 8060S is the most powerful iGPU that AMD has on offer, as of Jan 2025. It features 40 RDNA 3+ architecture CUs (2560 unified shaders) that could see it outcompeting lower mid-range desktop graphics cards like the GeForce RTX 4050. This GPU will undoubtedly run any game at 1080p on Ultra, however, the ultimate question is whether or not the cooling solution of the laptop will be powerful enough to let the iGPU shine.
Naturally, the Radeon is capable of driving four SUHD 4320p60 monitors. It can also efficiently encode and decode the most popular video codecs including AVC, HEVC, VP9 and AV1. The latest addition to that list, the VVC codec, is not supported unlike it is with Intel Lunar Lake chips.
Power consumption
The AI Max+ 395 can eat up to 120 W depending on the system and its TDP power targets, with 45 W named as the minimum TDP.
The 4 nm TSMC process that the CPU cores are built with make for decent, as of Jan 2025, energy efficiency.
| Model | AMD Ryzen AI 9 HX 370 | AMD Ryzen AI Max+ 395 | ||||||||||||||||
| Codename | Strix Point-HX (Zen 5/5c) | Strix Halo | ||||||||||||||||
| Series | AMD Strix Halo/Point (Zen 5/5c, Ryzen AI 300) | AMD Strix Halo/Point (Zen 5/5c, Ryzen AI 300) | ||||||||||||||||
| Clock | 2000 - 5100 MHz | 3000 - 5100 MHz | ||||||||||||||||
| L2 Cache | 12 MB | 16 MB | ||||||||||||||||
| L3 Cache | 24 MB | 64 MB | ||||||||||||||||
| Cores / Threads | 12 / 24 4 x 5.1 GHz AMD Zen 5 8 x 3.3 GHz AMD Zen 5c | 16 / 32 16 x 5.1 GHz AMD Zen 5 | ||||||||||||||||
| TDP | 28 Watt | 55 Watt | ||||||||||||||||
| TDP Turbo PL2 | 54 Watt | |||||||||||||||||
| Technology | 4 nm | 4 nm | ||||||||||||||||
| max. Temp. | 100 °C | |||||||||||||||||
| Socket | FP8 | FP11 | ||||||||||||||||
| Features | DDR5-5600/LPDDR5x-8000 RAM, PCIe 4, USB 4, XDNA 2 NPU (50 TOPS), SMT, AES, AVX, AVX2, AVX512, FMA3, MMX (+), SHA, SSE, SSE2, SSE3, SSSE3, SSE4.1, SSE4.2, SSE4A | LPDDR5x-8000 RAM, PCIe 4, USB 4, XDNA 2 NPU (50 TOPS), SMT, AES, AVX, AVX2, AVX512, FMA3, MMX (+), SHA, SSE, SSE2, SSE3, SSSE3, SSE4.1, SSE4.2, SSE4A | ||||||||||||||||
| iGPU | AMD Radeon 890M ( - 2900 MHz) | AMD Radeon 8060S ( - 2900 MHz) | ||||||||||||||||
| NPU / AI | 50 TOPS INT8 | 50 TOPS INT8 | ||||||||||||||||
| Chip AI | 80 TOPS INT8 | 126 TOPS INT8 | ||||||||||||||||
| Architecture | x86 | x86 | ||||||||||||||||
| Announced | ||||||||||||||||||
| Manufacturer | www.amd.com | www.amd.com | ||||||||||||||||
| Series: Strix Halo/Point (Zen 5/5c, Ryzen AI 300) Strix Halo |
|

Benchmarks
| CPU TDP ? | TDP 25 W | TDP 28 W | TDP 35 W | TDP 45 W | TDP 54 W | TDP 65 W | TDP 70 W | TDP 75 W | TDP 80 W |
|---|---|---|---|---|---|---|---|---|---|
| 98% | 98% | 95% | 100% | 96% | 99% | 98% | 99% | 98% | 97% |
| Model | CPU | GPU | RAM | Value |
|---|---|---|---|---|
| BOSGAME M5 | Ryzen AI Max+ 395 140 W / 120 W | Radeon 8060S 64 GB | 128 GB | 114 |
| Framework Desktop Ryzen AI Max | Ryzen AI Max+ 395 115 W / 100 W | Radeon 8060S 2900 / 1000 MHz 16 GB | 64 GB | 114.3 |
| GMK EVO-X2 | Ryzen AI Max+ 395 140 W / 120 W | Radeon 8060S | 64 GB | 115 |
| Minisforum MS-S1 Max | Ryzen AI Max+ 395 | Radeon 8060S 32 GB | 128 GB | 116 |
| Minisforum MS-S1 Max | Ryzen AI Max+ 395 110 W / 80 W | Radeon 8060S 32 GB | 128 GB | 116 |
| Minisforum MS-S1 Max | Ryzen AI Max+ 395 130 W / 110 W | Radeon 8060S | 128 GB | 116 |
| Asus ROG Flow Z13 GZ302EA-RU073W | Ryzen AI Max+ 395 86 W / 70 W | Radeon 8060S 80 W 2264 / 1000 MHz | 32 GB | 116.8 |
| CPU TDP ? | TDP 25 W | TDP 28 W | TDP 35 W | TDP 45 W | TDP 54 W | TDP 65 W | TDP 70 W | TDP 75 W | TDP 80 W | TDP 100 W | TDP 110 W | TDP 120 W |
|---|---|---|---|---|---|---|---|---|---|---|---|---|
| 97% | 98% | 95% | 100% | 96% | 99% | 98% | 98% | 98% | 97% | 95% | 97% | 95% |
| CPU TDP ? | TDP 25 W | TDP 28 W | TDP 35 W | TDP 45 W | TDP 54 W | TDP 65 W | TDP 70 W | TDP 75 W | TDP 80 W |
|---|---|---|---|---|---|---|---|---|---|
| 75% | 74% | 71% | 84% | 87% | 92% | 91% | 100% | 99% | 94% |
| Model | CPU | GPU | RAM | Value |
|---|---|---|---|---|
| Asus ROG Flow Z13 GZ302EA-RU073W | Ryzen AI Max+ 395 86 W / 70 W | Radeon 8060S 80 W 2264 / 1000 MHz | 32 GB | 1648 |
| Minisforum MS-S1 Max | Ryzen AI Max+ 395 110 W / 80 W | Radeon 8060S 32 GB | 128 GB | 1652 |
| Minisforum MS-S1 Max | Ryzen AI Max+ 395 130 W / 110 W | Radeon 8060S | 128 GB | 1823 |
| Framework Desktop Ryzen AI Max | Ryzen AI Max+ 395 115 W / 100 W | Radeon 8060S 2900 / 1000 MHz 16 GB | 64 GB | 1827 |
| GMK EVO-X2 | Ryzen AI Max+ 395 140 W / 120 W | Radeon 8060S | 64 GB | 1885 |
| BOSGAME M5 | Ryzen AI Max+ 395 140 W / 120 W | Radeon 8060S 64 GB | 128 GB | 1890 |
| Minisforum MS-S1 Max | Ryzen AI Max+ 395 | Radeon 8060S 32 GB | 128 GB | 1912 |
| CPU TDP ? | TDP 25 W | TDP 28 W | TDP 35 W | TDP 45 W | TDP 54 W | TDP 65 W | TDP 70 W | TDP 75 W | TDP 80 W | TDP 100 W | TDP 110 W | TDP 120 W |
|---|---|---|---|---|---|---|---|---|---|---|---|---|
| 55% | 51% | 49% | 58% | 60% | 63% | 63% | 78% | 68% | 68% | 97% | 97% | 100% |
| CPU TDP ? | TDP 25 W | TDP 28 W | TDP 30 W | TDP 35 W | TDP 45 W | TDP 54 W | TDP 65 W | TDP 70 W | TDP 75 W | TDP 80 W |
|---|---|---|---|---|---|---|---|---|---|---|
| 80% | 70% | 72% | 71% | 79% | 88% | 92% | 96% | 93% | 100% | 100% |
| Model | CPU | GPU | RAM | Value |
|---|---|---|---|---|
| Asus ROG Flow Z13 GZ302EA-RU073W | Ryzen AI Max+ 395 86 W / 70 W | Radeon 8060S 80 W 2264 / 1000 MHz | 32 GB | 29063 |
| Minisforum MS-S1 Max | Ryzen AI Max+ 395 110 W / 80 W | Radeon 8060S 32 GB | 128 GB | 32001 |
| Framework Desktop Ryzen AI Max | Ryzen AI Max+ 395 115 W / 100 W | Radeon 8060S 2900 / 1000 MHz 16 GB | 64 GB | 35226 |
| Minisforum MS-S1 Max | Ryzen AI Max+ 395 130 W / 110 W | Radeon 8060S | 128 GB | 35991 |
| GMK EVO-X2 | Ryzen AI Max+ 395 140 W / 120 W | Radeon 8060S | 64 GB | 36951 |
| Minisforum MS-S1 Max | Ryzen AI Max+ 395 | Radeon 8060S 32 GB | 128 GB | 37334 |
| BOSGAME M5 | Ryzen AI Max+ 395 140 W / 120 W | Radeon 8060S 64 GB | 128 GB | 37423 |
| CPU TDP ? | TDP 25 W | TDP 28 W | TDP 30 W | TDP 35 W | TDP 45 W | TDP 54 W | TDP 65 W | TDP 70 W | TDP 75 W | TDP 80 W | TDP 100 W | TDP 110 W | TDP 120 W |
|---|---|---|---|---|---|---|---|---|---|---|---|---|---|
| 55% | 44% | 46% | 45% | 51% | 56% | 59% | 61% | 69% | 64% | 68% | 95% | 97% | 100% |
| CPU TDP ? | TDP 25 W | TDP 28 W | TDP 30 W | TDP 35 W | TDP 45 W | TDP 54 W | TDP 65 W | TDP 70 W | TDP 75 W | TDP 80 W |
|---|---|---|---|---|---|---|---|---|---|---|
| 100% | 98% | 95% | 98% | 99% | 99% | 99% | 99% | 99% | 100% | 99% |
| Model | CPU | GPU | RAM | Value |
|---|---|---|---|---|
| Asus ROG Flow Z13 GZ302EA-RU073W | Ryzen AI Max+ 395 86 W / 70 W | Radeon 8060S 80 W 2264 / 1000 MHz | 32 GB | 2034 |
| BOSGAME M5 | Ryzen AI Max+ 395 140 W / 120 W | Radeon 8060S 64 GB | 128 GB | 2042 |
| GMK EVO-X2 | Ryzen AI Max+ 395 140 W / 120 W | Radeon 8060S | 64 GB | 2043 |
| Framework Desktop Ryzen AI Max | Ryzen AI Max+ 395 115 W / 100 W | Radeon 8060S 2900 / 1000 MHz 16 GB | 64 GB | 2044 |
| Minisforum MS-S1 Max | Ryzen AI Max+ 395 110 W / 80 W | Radeon 8060S 32 GB | 128 GB | 2049 |
| Minisforum MS-S1 Max | Ryzen AI Max+ 395 130 W / 110 W | Radeon 8060S | 128 GB | 2049 |
| Minisforum MS-S1 Max | Ryzen AI Max+ 395 | Radeon 8060S 32 GB | 128 GB | 2052 |
| CPU TDP ? | TDP 25 W | TDP 28 W | TDP 30 W | TDP 35 W | TDP 45 W | TDP 54 W | TDP 65 W | TDP 70 W | TDP 75 W | TDP 80 W | TDP 100 W | TDP 110 W | TDP 120 W |
|---|---|---|---|---|---|---|---|---|---|---|---|---|---|
| 100% | 98% | 95% | 97% | 99% | 98% | 98% | 99% | 99% | 100% | 98% | 100% | 100% | 100% |
| CPU TDP ? | TDP 25 W | TDP 28 W | TDP 30 W | TDP 35 W | TDP 45 W | TDP 54 W | TDP 65 W | TDP 70 W | TDP 75 W | TDP 80 W |
|---|---|---|---|---|---|---|---|---|---|---|
| 99% | 98% | 95% | 98% | 99% | 98% | 99% | 99% | 99% | 100% | 99% |
| Model | CPU | GPU | RAM | Value |
|---|---|---|---|---|
| Asus ROG Flow Z13 GZ302EA-RU073W | Ryzen AI Max+ 395 86 W / 70 W | Radeon 8060S 80 W 2264 / 1000 MHz | 32 GB | 791 |
| GMK EVO-X2 | Ryzen AI Max+ 395 140 W / 120 W | Radeon 8060S | 64 GB | 798 |
| BOSGAME M5 | Ryzen AI Max+ 395 140 W / 120 W | Radeon 8060S 64 GB | 128 GB | 800 |
| Framework Desktop Ryzen AI Max | Ryzen AI Max+ 395 115 W / 100 W | Radeon 8060S 2900 / 1000 MHz 16 GB | 64 GB | 800 |
| Minisforum MS-S1 Max | Ryzen AI Max+ 395 | Radeon 8060S 32 GB | 128 GB | 801 |
| Minisforum MS-S1 Max | Ryzen AI Max+ 395 110 W / 80 W | Radeon 8060S 32 GB | 128 GB | 803 |
| Minisforum MS-S1 Max | Ryzen AI Max+ 395 130 W / 110 W | Radeon 8060S | 128 GB | 803 |
| CPU TDP ? | TDP 25 W | TDP 28 W | TDP 30 W | TDP 35 W | TDP 45 W | TDP 54 W | TDP 65 W | TDP 70 W | TDP 75 W | TDP 80 W | TDP 100 W | TDP 110 W | TDP 120 W |
|---|---|---|---|---|---|---|---|---|---|---|---|---|---|
| 99% | 98% | 95% | 97% | 99% | 98% | 98% | 99% | 99% | 100% | 99% | 100% | 100% | 100% |
| CPU TDP ? | TDP 25 W | TDP 28 W | TDP 30 W | TDP 35 W | TDP 45 W | TDP 54 W | TDP 65 W | TDP 70 W | TDP 75 W | TDP 80 W |
|---|---|---|---|---|---|---|---|---|---|---|
| 93% | 70% | 73% | 71% | 80% | 89% | 93% | 96% | 92% | 100% | 100% |
| Model | CPU | GPU | RAM | Value |
|---|---|---|---|---|
| Asus ROG Flow Z13 GZ302EA-RU073W | Ryzen AI Max+ 395 86 W / 70 W | Radeon 8060S 80 W 2264 / 1000 MHz | 32 GB | 11357 |
| Minisforum MS-S1 Max | Ryzen AI Max+ 395 110 W / 80 W | Radeon 8060S 32 GB | 128 GB | 12514 |
| Framework Desktop Ryzen AI Max | Ryzen AI Max+ 395 115 W / 100 W | Radeon 8060S 2900 / 1000 MHz 16 GB | 64 GB | 13683 |
| GMK EVO-X2 | Ryzen AI Max+ 395 140 W / 120 W | Radeon 8060S | 64 GB | 13882 |
| Minisforum MS-S1 Max | Ryzen AI Max+ 395 130 W / 110 W | Radeon 8060S | 128 GB | 14091 |
| Minisforum MS-S1 Max | Ryzen AI Max+ 395 | Radeon 8060S 32 GB | 128 GB | 14564 |
| BOSGAME M5 | Ryzen AI Max+ 395 140 W / 120 W | Radeon 8060S 64 GB | 128 GB | 14641 |
| CPU TDP ? | TDP 25 W | TDP 28 W | TDP 30 W | TDP 35 W | TDP 45 W | TDP 54 W | TDP 65 W | TDP 70 W | TDP 75 W | TDP 80 W | TDP 100 W | TDP 110 W | TDP 120 W |
|---|---|---|---|---|---|---|---|---|---|---|---|---|---|
| 74% | 45% | 47% | 46% | 52% | 58% | 60% | 62% | 70% | 65% | 69% | 96% | 99% | 100% |
| CPU TDP ? | TDP 25 W | TDP 28 W | TDP 30 W | TDP 35 W | TDP 45 W | TDP 54 W | TDP 65 W | TDP 70 W | TDP 75 W | TDP 80 W |
|---|---|---|---|---|---|---|---|---|---|---|
| 93% | 71% | 75% | 71% | 81% | 89% | 94% | 97% | 100% | 99% | 99% |
| Model | CPU | GPU | RAM | Value |
|---|---|---|---|---|
| Minisforum MS-S1 Max | Ryzen AI Max+ 395 110 W / 80 W | Radeon 8060S 32 GB | 128 GB | 4739 |
| Asus ROG Flow Z13 GZ302EA-RU073W | Ryzen AI Max+ 395 86 W / 70 W | Radeon 8060S 80 W 2264 / 1000 MHz | 32 GB | 4830 |
| Framework Desktop Ryzen AI Max | Ryzen AI Max+ 395 115 W / 100 W | Radeon 8060S 2900 / 1000 MHz 16 GB | 64 GB | 5363 |
| Minisforum MS-S1 Max | Ryzen AI Max+ 395 130 W / 110 W | Radeon 8060S | 128 GB | 5488 |
| GMK EVO-X2 | Ryzen AI Max+ 395 140 W / 120 W | Radeon 8060S | 64 GB | 5575 |
| BOSGAME M5 | Ryzen AI Max+ 395 140 W / 120 W | Radeon 8060S 64 GB | 128 GB | 5723 |
| Minisforum MS-S1 Max | Ryzen AI Max+ 395 | Radeon 8060S 32 GB | 128 GB | 5881 |
| CPU TDP ? | TDP 25 W | TDP 28 W | TDP 30 W | TDP 35 W | TDP 45 W | TDP 54 W | TDP 65 W | TDP 70 W | TDP 75 W | TDP 80 W | TDP 100 W | TDP 110 W | TDP 120 W |
|---|---|---|---|---|---|---|---|---|---|---|---|---|---|
| 73% | 44% | 47% | 45% | 51% | 56% | 59% | 61% | 74% | 62% | 66% | 95% | 97% | 100% |
| CPU TDP ? | TDP 25 W | TDP 28 W | TDP 30 W | TDP 35 W | TDP 45 W | TDP 54 W | TDP 65 W | TDP 70 W | TDP 75 W | TDP 80 W |
|---|---|---|---|---|---|---|---|---|---|---|
| 99% | 98% | 95% | 98% | 100% | 99% | 100% | 100% | 61% | 100% | 84% |
| Model | CPU | GPU | RAM | Value |
|---|---|---|---|---|
| GMK EVO-X2 | Ryzen AI Max+ 395 140 W / 120 W | Radeon 8060S | 64 GB | 314 |
| BOSGAME M5 | Ryzen AI Max+ 395 140 W / 120 W | Radeon 8060S 64 GB | 128 GB | 316 |
| Framework Desktop Ryzen AI Max | Ryzen AI Max+ 395 115 W / 100 W | Radeon 8060S 2900 / 1000 MHz 16 GB | 64 GB | 316 |
| Asus ROG Flow Z13 GZ302EA-RU073W | Ryzen AI Max+ 395 86 W / 70 W | Radeon 8060S 80 W 2264 / 1000 MHz | 32 GB | 317 |
| Minisforum MS-S1 Max | Ryzen AI Max+ 395 | Radeon 8060S 32 GB | 128 GB | 317 |
| Minisforum MS-S1 Max | Ryzen AI Max+ 395 130 W / 110 W | Radeon 8060S | 128 GB | 317 |
| Minisforum MS-S1 Max | Ryzen AI Max+ 395 110 W / 80 W | Radeon 8060S 32 GB | 128 GB | 318 |
| CPU TDP ? | TDP 25 W | TDP 28 W | TDP 30 W | TDP 35 W | TDP 45 W | TDP 54 W | TDP 65 W | TDP 70 W | TDP 75 W | TDP 80 W | TDP 100 W | TDP 110 W | TDP 120 W |
|---|---|---|---|---|---|---|---|---|---|---|---|---|---|
| 98% | 96% | 93% | 96% | 98% | 97% | 97% | 98% | 80% | 98% | 85% | 100% | 100% | 99% |
| Model | CPU | GPU | RAM | Value |
|---|---|---|---|---|
| Sapphire Edge AI, Ryzen AI 9 HX 370 | Ryzen AI 9 HX 370 45 W / 35 W | Radeon 890M 2900 / 2800 MHz | 32 GB | 34.85 |
| Minisforum EliteMini AI370 | Ryzen AI 9 HX 370 54 W / 45 W | Radeon 890M | 32 GB | 38.84 |
| Geekom A9 Max, AI 9 HX 370 | Ryzen AI 9 HX 370 65 W / 54 W | Radeon 890M ? / 2800 MHz | 32 GB | 39.5 |
| Acemagic F3A | Ryzen AI 9 HX 370 70 W / 65 W | Radeon 890M | 32 GB | 40.69 |
| Minisforum AI X1 Pro | Ryzen AI 9 HX 370 65 W / 54 W | Radeon 890M ? / 2800 MHz | 64 GB | 41.17 |
| CPU TDP 35 W | TDP 45 W | TDP 54 W | TDP 65 W |
|---|---|---|---|
| 86% | 95% | 99% | 100% |
| Model | CPU | GPU | RAM | Value |
|---|---|---|---|---|
| Asus ROG Flow Z13 GZ302EA-RU073W | Ryzen AI Max+ 395 86 W / 70 W | Radeon 8060S 80 W 2264 / 1000 MHz | 32 GB | 55.9 |
| BOSGAME M5 | Ryzen AI Max+ 395 140 W / 120 W | Radeon 8060S 64 GB | 128 GB | 64.21 |
| GMK EVO-X2 | Ryzen AI Max+ 395 140 W / 120 W | Radeon 8060S | 64 GB | 64.36 |
| Minisforum MS-S1 Max | Ryzen AI Max+ 395 | Radeon 8060S 32 GB | 128 GB | 68.17 |
| CPU TDP ? | TDP 35 W | TDP 45 W | TDP 54 W | TDP 65 W | TDP 70 W | TDP 120 W |
|---|---|---|---|---|---|---|
| 100% | 51% | 57% | 59% | 60% | 82% | 94% |
| Model | CPU | GPU | RAM | Value |
|---|---|---|---|---|
| Geekom A9 Max, AI 9 HX 370 | Ryzen AI 9 HX 370 65 W / 54 W | Radeon 890M ? / 2800 MHz | 32 GB | 3.59 |
| Minisforum EliteMini AI370 | Ryzen AI 9 HX 370 54 W / 45 W | Radeon 890M | 32 GB | 3.68 |
| Minisforum AI X1 Pro | Ryzen AI 9 HX 370 65 W / 54 W | Radeon 890M ? / 2800 MHz | 64 GB | 3.69 |
| Sapphire Edge AI, Ryzen AI 9 HX 370 | Ryzen AI 9 HX 370 45 W / 35 W | Radeon 890M 2900 / 2800 MHz | 32 GB | 3.69 |
| Acemagic F3A | Ryzen AI 9 HX 370 70 W / 65 W | Radeon 890M | 32 GB | 3.7 |
| CPU TDP 35 W | TDP 45 W | TDP 54 W | TDP 65 W |
|---|---|---|---|
| 100% | 99% | 98% | 100% |
| Model | CPU | GPU | RAM | Value |
|---|---|---|---|---|
| GMK EVO-X2 | Ryzen AI Max+ 395 140 W / 120 W | Radeon 8060S | 64 GB | 3.72 |
| BOSGAME M5 | Ryzen AI Max+ 395 140 W / 120 W | Radeon 8060S 64 GB | 128 GB | 3.74 |
| Asus ROG Flow Z13 GZ302EA-RU073W | Ryzen AI Max+ 395 86 W / 70 W | Radeon 8060S 80 W 2264 / 1000 MHz | 32 GB | 3.75 |
| Minisforum MS-S1 Max | Ryzen AI Max+ 395 | Radeon 8060S 32 GB | 128 GB | 3.77 |
| CPU TDP ? | TDP 35 W | TDP 45 W | TDP 54 W | TDP 65 W | TDP 70 W | TDP 120 W |
|---|---|---|---|---|---|---|
| 100% | 98% | 98% | 97% | 98% | 99% | 99% |
| Model | CPU | GPU | RAM | Value |
|---|---|---|---|---|
| Geekom A9 Max, AI 9 HX 370 | Ryzen AI 9 HX 370 65 W / 54 W | Radeon 890M ? / 2800 MHz | 32 GB | 8437 |
| Minisforum AI X1 Pro | Ryzen AI 9 HX 370 65 W / 54 W | Radeon 890M ? / 2800 MHz | 64 GB | 8639 |
| Sapphire Edge AI, Ryzen AI 9 HX 370 | Ryzen AI 9 HX 370 45 W / 35 W | Radeon 890M 2900 / 2800 MHz | 32 GB | 8655 |
| Minisforum EliteMini AI370 | Ryzen AI 9 HX 370 54 W / 45 W | Radeon 890M | 32 GB | 8668 |
| Acemagic F3A | Ryzen AI 9 HX 370 70 W / 65 W | Radeon 890M | 32 GB | 8797 |
| CPU TDP 35 W | TDP 45 W | TDP 54 W | TDP 65 W |
|---|---|---|---|
| 98% | 99% | 97% | 100% |
| Model | CPU | GPU | RAM | Value |
|---|---|---|---|---|
| GMK EVO-X2 | Ryzen AI Max+ 395 140 W / 120 W | Radeon 8060S | 64 GB | 8691 |
| BOSGAME M5 | Ryzen AI Max+ 395 140 W / 120 W | Radeon 8060S 64 GB | 128 GB | 8693 |
| Minisforum MS-S1 Max | Ryzen AI Max+ 395 | Radeon 8060S 32 GB | 128 GB | 8703 |
| Asus ROG Flow Z13 GZ302EA-RU073W | Ryzen AI Max+ 395 86 W / 70 W | Radeon 8060S 80 W 2264 / 1000 MHz | 32 GB | 8728 |
| CPU TDP ? | TDP 35 W | TDP 45 W | TDP 54 W | TDP 65 W | TDP 70 W | TDP 120 W |
|---|---|---|---|---|---|---|
| 99% | 98% | 99% | 97% | 100% | 99% | 99% |
| Model | CPU | GPU | RAM | Value |
|---|---|---|---|---|
| Sapphire Edge AI, Ryzen AI 9 HX 370 | Ryzen AI 9 HX 370 45 W / 35 W | Radeon 890M 2900 / 2800 MHz | 32 GB | 48553 |
| Geekom A9 Max, AI 9 HX 370 | Ryzen AI 9 HX 370 65 W / 54 W | Radeon 890M ? / 2800 MHz | 32 GB | 52505 |
| Minisforum EliteMini AI370 | Ryzen AI 9 HX 370 54 W / 45 W | Radeon 890M | 32 GB | 53766 |
| Minisforum AI X1 Pro | Ryzen AI 9 HX 370 65 W / 54 W | Radeon 890M ? / 2800 MHz | 64 GB | 56074 |
| Acemagic F3A | Ryzen AI 9 HX 370 70 W / 65 W | Radeon 890M | 32 GB | 56689 |
| CPU TDP 35 W | TDP 45 W | TDP 54 W | TDP 65 W |
|---|---|---|---|
| 86% | 95% | 96% | 100% |
| Model | CPU | GPU | RAM | Value |
|---|---|---|---|---|
| GMK EVO-X2 | Ryzen AI Max+ 395 140 W / 120 W | Radeon 8060S | 64 GB | 62519 |
| BOSGAME M5 | Ryzen AI Max+ 395 140 W / 120 W | Radeon 8060S 64 GB | 128 GB | 63189 |
| Asus ROG Flow Z13 GZ302EA-RU073W | Ryzen AI Max+ 395 86 W / 70 W | Radeon 8060S 80 W 2264 / 1000 MHz | 32 GB | 67475 |
| Minisforum MS-S1 Max | Ryzen AI Max+ 395 | Radeon 8060S 32 GB | 128 GB | 74633 |
| CPU TDP ? | TDP 35 W | TDP 45 W | TDP 54 W | TDP 65 W | TDP 70 W | TDP 120 W |
|---|---|---|---|---|---|---|
| 100% | 65% | 72% | 73% | 76% | 90% | 84% |
| Model | CPU | GPU | RAM | Value |
|---|---|---|---|---|
| Sapphire Edge AI, Ryzen AI 9 HX 370 | Ryzen AI 9 HX 370 45 W / 35 W | Radeon 890M 2900 / 2800 MHz | 32 GB | 89081 |
| Minisforum EliteMini AI370 | Ryzen AI 9 HX 370 54 W / 45 W | Radeon 890M | 32 GB | 96857 |
| Geekom A9 Max, AI 9 HX 370 | Ryzen AI 9 HX 370 65 W / 54 W | Radeon 890M ? / 2800 MHz | 32 GB | 98125 |
| Minisforum AI X1 Pro | Ryzen AI 9 HX 370 65 W / 54 W | Radeon 890M ? / 2800 MHz | 64 GB | 100569 |
| Acemagic F3A | Ryzen AI 9 HX 370 70 W / 65 W | Radeon 890M | 32 GB | 103657 |
| CPU TDP 35 W | TDP 45 W | TDP 54 W | TDP 65 W |
|---|---|---|---|
| 86% | 93% | 96% | 100% |
| Model | CPU | GPU | RAM | Value |
|---|---|---|---|---|
| GMK EVO-X2 | Ryzen AI Max+ 395 140 W / 120 W | Radeon 8060S | 64 GB | 110924 |
| BOSGAME M5 | Ryzen AI Max+ 395 140 W / 120 W | Radeon 8060S 64 GB | 128 GB | 114175 |
| Minisforum MS-S1 Max | Ryzen AI Max+ 395 | Radeon 8060S 32 GB | 128 GB | 144699 |
| CPU TDP ? | TDP 35 W | TDP 45 W | TDP 54 W | TDP 65 W | TDP 120 W |
|---|---|---|---|---|---|
| 100% | 62% | 67% | 69% | 72% | 78% |
| Model | CPU | GPU | RAM | Value |
|---|---|---|---|---|
| Geekom A9 Max, AI 9 HX 370 | Ryzen AI 9 HX 370 65 W / 54 W | Radeon 890M ? / 2800 MHz | 32 GB | 15381 |
| Minisforum EliteMini AI370 | Ryzen AI 9 HX 370 54 W / 45 W | Radeon 890M | 32 GB | 15698 |
| Sapphire Edge AI, Ryzen AI 9 HX 370 | Ryzen AI 9 HX 370 45 W / 35 W | Radeon 890M 2900 / 2800 MHz | 32 GB | 15797 |
| Acemagic F3A | Ryzen AI 9 HX 370 70 W / 65 W | Radeon 890M | 32 GB | 15927 |
| Minisforum AI X1 Pro | Ryzen AI 9 HX 370 65 W / 54 W | Radeon 890M ? / 2800 MHz | 64 GB | 15935 |
| CPU TDP 35 W | TDP 45 W | TDP 54 W | TDP 65 W |
|---|---|---|---|
| 99% | 99% | 98% | 100% |
| Model | CPU | GPU | RAM | Value |
|---|---|---|---|---|
| GMK EVO-X2 | Ryzen AI Max+ 395 140 W / 120 W | Radeon 8060S | 64 GB | 16057 |
| BOSGAME M5 | Ryzen AI Max+ 395 140 W / 120 W | Radeon 8060S 64 GB | 128 GB | 16196 |
| Minisforum MS-S1 Max | Ryzen AI Max+ 395 | Radeon 8060S 32 GB | 128 GB | 16223 |
| CPU TDP ? | TDP 35 W | TDP 45 W | TDP 54 W | TDP 65 W | TDP 120 W |
|---|---|---|---|---|---|
| 100% | 97% | 97% | 97% | 98% | 99% |
| Model | CPU | GPU | RAM | Value |
|---|---|---|---|---|
| Minisforum AI X1 Pro | Ryzen AI 9 HX 370 65 W / 54 W | Radeon 890M ? / 2800 MHz | 64 GB | 50.536 |
| Acemagic F3A | Ryzen AI 9 HX 370 70 W / 65 W | Radeon 890M | 32 GB | 79.441 |
| Minisforum EliteMini AI370 | Ryzen AI 9 HX 370 54 W / 45 W | Radeon 890M | 32 GB | 79.442 |
| Geekom A9 Max, AI 9 HX 370 | Ryzen AI 9 HX 370 65 W / 54 W | Radeon 890M ? / 2800 MHz | 32 GB | 84.476 |
| Sapphire Edge AI, Ryzen AI 9 HX 370 | Ryzen AI 9 HX 370 45 W / 35 W | Radeon 890M 2900 / 2800 MHz | 32 GB | 84.742 |
| CPU TDP 35 W | TDP 45 W | TDP 54 W | TDP 65 W |
|---|---|---|---|
| 100% | 100% | 100% | 100% |
| Model | CPU | GPU | RAM | Value |
|---|---|---|---|---|
| Minisforum MS-S1 Max | Ryzen AI Max+ 395 | Radeon 8060S 32 GB | 128 GB | 32.773 |
| BOSGAME M5 | Ryzen AI Max+ 395 140 W / 120 W | Radeon 8060S 64 GB | 128 GB | 32.871 |
| GMK EVO-X2 | Ryzen AI Max+ 395 140 W / 120 W | Radeon 8060S | 64 GB | 33.242 |
| Asus ROG Flow Z13 GZ302EA-RU073W | Ryzen AI Max+ 395 86 W / 70 W | Radeon 8060S 80 W 2264 / 1000 MHz | 32 GB | 347.1 |
| CPU TDP ? | TDP 35 W | TDP 45 W | TDP 54 W | TDP 65 W | TDP 70 W | TDP 120 W |
|---|---|---|---|---|---|---|
| 104% | 103% | 103% | 103% | 103% | 100% | 104% |
| Model | CPU | GPU | RAM | Value |
|---|---|---|---|---|
| Minisforum AI X1 Pro | Ryzen AI 9 HX 370 65 W / 54 W | Radeon 890M ? / 2800 MHz | 64 GB | 2.701 |
| Geekom A9 Max, AI 9 HX 370 | Ryzen AI 9 HX 370 65 W / 54 W | Radeon 890M ? / 2800 MHz | 32 GB | 2.721 |
| Minisforum EliteMini AI370 | Ryzen AI 9 HX 370 54 W / 45 W | Radeon 890M | 32 GB | 2.742 |
| Sapphire Edge AI, Ryzen AI 9 HX 370 | Ryzen AI 9 HX 370 45 W / 35 W | Radeon 890M 2900 / 2800 MHz | 32 GB | 2.827 |
| Acemagic F3A | Ryzen AI 9 HX 370 70 W / 65 W | Radeon 890M | 32 GB | 3.743 |
| CPU TDP 35 W | TDP 45 W | TDP 54 W | TDP 65 W |
|---|---|---|---|
| 100% | 100% | 100% | 100% |
| Model | CPU | GPU | RAM | Value |
|---|---|---|---|---|
| Minisforum MS-S1 Max | Ryzen AI Max+ 395 | Radeon 8060S 32 GB | 128 GB | 2.361 |
| GMK EVO-X2 | Ryzen AI Max+ 395 140 W / 120 W | Radeon 8060S | 64 GB | 2.535 |
| BOSGAME M5 | Ryzen AI Max+ 395 140 W / 120 W | Radeon 8060S 64 GB | 128 GB | 2.555 |
| Asus ROG Flow Z13 GZ302EA-RU073W | Ryzen AI Max+ 395 86 W / 70 W | Radeon 8060S 80 W 2264 / 1000 MHz | 32 GB | 7.3 |
| CPU TDP ? | TDP 35 W | TDP 45 W | TDP 54 W | TDP 65 W | TDP 70 W | TDP 120 W |
|---|---|---|---|---|---|---|
| 101% | 101% | 101% | 101% | 101% | 100% | 101% |
| Model | CPU | GPU | RAM | Value |
|---|---|---|---|---|
| Minisforum EliteMini AI370 | Ryzen AI 9 HX 370 54 W / 45 W | Radeon 890M | 32 GB | 4008 |
| Acemagic F3A | Ryzen AI 9 HX 370 70 W / 65 W | Radeon 890M | 32 GB | 4090 |
| Minisforum AI X1 Pro | Ryzen AI 9 HX 370 65 W / 54 W | Radeon 890M ? / 2800 MHz | 64 GB | 4759 |
| Geekom A9 Max, AI 9 HX 370 | Ryzen AI 9 HX 370 65 W / 54 W | Radeon 890M ? / 2800 MHz | 32 GB | 4806 |
| Sapphire Edge AI, Ryzen AI 9 HX 370 | Ryzen AI 9 HX 370 45 W / 35 W | Radeon 890M 2900 / 2800 MHz | 32 GB | 4859 |
| CPU TDP 35 W | TDP 45 W | TDP 54 W | TDP 65 W |
|---|---|---|---|
| 100% | 82% | 98% | 84% |
| Model | CPU | GPU | RAM | Value |
|---|---|---|---|---|
| Minisforum MS-S1 Max | Ryzen AI Max+ 395 | Radeon 8060S 32 GB | 128 GB | 3413 |
| BOSGAME M5 | Ryzen AI Max+ 395 140 W / 120 W | Radeon 8060S 64 GB | 128 GB | 8365 |
| GMK EVO-X2 | Ryzen AI Max+ 395 140 W / 120 W | Radeon 8060S | 64 GB | 9342 |
| Asus ROG Flow Z13 GZ302EA-RU073W | Ryzen AI Max+ 395 86 W / 70 W | Radeon 8060S 80 W 2264 / 1000 MHz | 32 GB | 38410 |
| CPU TDP ? | TDP 35 W | TDP 45 W | TDP 54 W | TDP 65 W | TDP 70 W | TDP 120 W |
|---|---|---|---|---|---|---|
| 9% | 13% | 10% | 12% | 11% | 100% | 23% |
| CPU TDP ? | TDP 25 W | TDP 28 W | TDP 30 W | TDP 35 W | TDP 45 W | TDP 54 W | TDP 65 W | TDP 70 W | TDP 75 W | TDP 80 W |
|---|---|---|---|---|---|---|---|---|---|---|
| 93% | 79% | 82% | 78% | 88% | 94% | 94% | 97% | 100% | 99% | 97% |
| Model | CPU | GPU | RAM | Value |
|---|---|---|---|---|
| Framework Desktop Ryzen AI Max | Ryzen AI Max+ 395 115 W / 100 W | Radeon 8060S 2900 / 1000 MHz 16 GB | 64 GB | 116237 |
| GMK EVO-X2 | Ryzen AI Max+ 395 140 W / 120 W | Radeon 8060S | 64 GB | 119970 |
| Asus ROG Flow Z13 GZ302EA-RU073W | Ryzen AI Max+ 395 86 W / 70 W | Radeon 8060S 80 W 2264 / 1000 MHz | 32 GB | 121368 |
| BOSGAME M5 | Ryzen AI Max+ 395 140 W / 120 W | Radeon 8060S 64 GB | 128 GB | 125052 |
| Minisforum MS-S1 Max | Ryzen AI Max+ 395 | Radeon 8060S 32 GB | 128 GB | 136872 |
| CPU TDP ? | TDP 25 W | TDP 28 W | TDP 30 W | TDP 35 W | TDP 45 W | TDP 54 W | TDP 65 W | TDP 70 W | TDP 75 W | TDP 80 W | TDP 100 W | TDP 120 W |
|---|---|---|---|---|---|---|---|---|---|---|---|---|
| 80% | 54% | 56% | 54% | 61% | 65% | 65% | 67% | 84% | 68% | 67% | 95% | 100% |
| CPU TDP ? | TDP 25 W | TDP 28 W | TDP 30 W | TDP 35 W | TDP 45 W | TDP 54 W | TDP 65 W | TDP 70 W | TDP 75 W | TDP 80 W |
|---|---|---|---|---|---|---|---|---|---|---|
| 93% | 95% | 93% | 90% | 98% | 95% | 96% | 97% | 100% | 96% | 94% |
| Model | CPU | GPU | RAM | Value |
|---|---|---|---|---|
| GMK EVO-X2 | Ryzen AI Max+ 395 140 W / 120 W | Radeon 8060S | 64 GB | 6474 |
| BOSGAME M5 | Ryzen AI Max+ 395 140 W / 120 W | Radeon 8060S 64 GB | 128 GB | 6478 |
| Framework Desktop Ryzen AI Max | Ryzen AI Max+ 395 115 W / 100 W | Radeon 8060S 2900 / 1000 MHz 16 GB | 64 GB | 6499 |
| Minisforum MS-S1 Max | Ryzen AI Max+ 395 | Radeon 8060S 32 GB | 128 GB | 6515 |
| Asus ROG Flow Z13 GZ302EA-RU073W | Ryzen AI Max+ 395 86 W / 70 W | Radeon 8060S 80 W 2264 / 1000 MHz | 32 GB | 6540 |
| CPU TDP ? | TDP 25 W | TDP 28 W | TDP 30 W | TDP 35 W | TDP 45 W | TDP 54 W | TDP 65 W | TDP 70 W | TDP 75 W | TDP 80 W | TDP 100 W | TDP 120 W |
|---|---|---|---|---|---|---|---|---|---|---|---|---|
| 95% | 94% | 93% | 90% | 98% | 95% | 96% | 96% | 100% | 96% | 94% | 100% | 99% |
| Model | CPU | GPU | RAM | Value |
|---|---|---|---|---|
| Sapphire Edge AI, Ryzen AI 9 HX 370 | Ryzen AI 9 HX 370 45 W / 35 W | Radeon 890M 2900 / 2800 MHz | 32 GB | 144.9 |
| Geekom A9 Max, AI 9 HX 370 | Ryzen AI 9 HX 370 65 W / 54 W | Radeon 890M ? / 2800 MHz | 32 GB | 164.85 |
| Minisforum EliteMini AI370 | Ryzen AI 9 HX 370 54 W / 45 W | Radeon 890M | 32 GB | 169.8 |
| Acemagic F3A | Ryzen AI 9 HX 370 70 W / 65 W | Radeon 890M | 32 GB | 171.45 |
| Minisforum AI X1 Pro | Ryzen AI 9 HX 370 65 W / 54 W | Radeon 890M ? / 2800 MHz | 64 GB | 185.1 |
| CPU TDP 35 W | TDP 45 W | TDP 54 W | TDP 65 W |
|---|---|---|---|
| 83% | 97% | 100% | 98% |
| Model | CPU | GPU | RAM | Value |
|---|---|---|---|---|
| GMK EVO-X2 | Ryzen AI Max+ 395 140 W / 120 W | Radeon 8060S | 64 GB | 188.8 |
| BOSGAME M5 | Ryzen AI Max+ 395 140 W / 120 W | Radeon 8060S 64 GB | 128 GB | 189.35 |
| Minisforum MS-S1 Max | Ryzen AI Max+ 395 | Radeon 8060S 32 GB | 128 GB | 235 |
| CPU TDP ? | TDP 35 W | TDP 45 W | TDP 54 W | TDP 65 W | TDP 120 W |
|---|---|---|---|---|---|
| 100% | 62% | 72% | 74% | 73% | 80% |
| Model | CPU | GPU | RAM | Value |
|---|---|---|---|---|
| Geekom A9 Max, AI 9 HX 370 | Ryzen AI 9 HX 370 65 W / 54 W | Radeon 890M ? / 2800 MHz | 32 GB | 300 |
| Minisforum EliteMini AI370 | Ryzen AI 9 HX 370 54 W / 45 W | Radeon 890M | 32 GB | 304.5 |
| Acemagic F3A | Ryzen AI 9 HX 370 70 W / 65 W | Radeon 890M | 32 GB | 306 |
| Sapphire Edge AI, Ryzen AI 9 HX 370 | Ryzen AI 9 HX 370 45 W / 35 W | Radeon 890M 2900 / 2800 MHz | 32 GB | 306.5 |
| Minisforum AI X1 Pro | Ryzen AI 9 HX 370 65 W / 54 W | Radeon 890M ? / 2800 MHz | 64 GB | 330 |
| CPU TDP 35 W | TDP 45 W | TDP 54 W | TDP 65 W |
|---|---|---|---|
| 97% | 97% | 100% | 97% |
| Model | CPU | GPU | RAM | Value |
|---|---|---|---|---|
| Minisforum MS-S1 Max | Ryzen AI Max+ 395 | Radeon 8060S 32 GB | 128 GB | 320.5 |
| GMK EVO-X2 | Ryzen AI Max+ 395 140 W / 120 W | Radeon 8060S | 64 GB | 325.5 |
| BOSGAME M5 | Ryzen AI Max+ 395 140 W / 120 W | Radeon 8060S 64 GB | 128 GB | 327.5 |
| CPU TDP ? | TDP 35 W | TDP 45 W | TDP 54 W | TDP 65 W | TDP 120 W |
|---|---|---|---|---|---|
| 98% | 94% | 93% | 96% | 94% | 100% |
| CPU TDP ? | TDP 25 W | TDP 28 W | TDP 30 W | TDP 35 W | TDP 45 W | TDP 54 W | TDP 65 W | TDP 70 W | TDP 75 W | TDP 80 W |
|---|---|---|---|---|---|---|---|---|---|---|
| 89% | 71% | 74% | 72% | 79% | 88% | 89% | 94% | 99% | 100% | 94% |
| Model | CPU | GPU | RAM | Value |
|---|---|---|---|---|
| GMK EVO-X2 | Ryzen AI Max+ 395 140 W / 120 W | Radeon 8060S | 64 GB | 32.4 |
| Framework Desktop Ryzen AI Max | Ryzen AI Max+ 395 115 W / 100 W | Radeon 8060S 2900 / 1000 MHz 16 GB | 64 GB | 32.8 |
| BOSGAME M5 | Ryzen AI Max+ 395 140 W / 120 W | Radeon 8060S 64 GB | 128 GB | 33.7 |
| Asus ROG Flow Z13 GZ302EA-RU073W | Ryzen AI Max+ 395 86 W / 70 W | Radeon 8060S 80 W 2264 / 1000 MHz | 32 GB | 36.2 |
| Minisforum MS-S1 Max | Ryzen AI Max+ 395 | Radeon 8060S 32 GB | 128 GB | 40.3 |
| CPU TDP ? | TDP 25 W | TDP 28 W | TDP 30 W | TDP 35 W | TDP 45 W | TDP 54 W | TDP 65 W | TDP 70 W | TDP 75 W | TDP 80 W | TDP 100 W | TDP 120 W |
|---|---|---|---|---|---|---|---|---|---|---|---|---|
| 92% | 61% | 65% | 63% | 69% | 77% | 77% | 82% | 98% | 87% | 82% | 99% | 100% |
| Model | CPU | GPU | RAM | Value |
|---|---|---|---|---|
| Minisforum AI X1 Pro | Ryzen AI 9 HX 370 65 W / 54 W | Radeon 890M ? / 2800 MHz | 64 GB | 1.6 |
| Acemagic F3A | Ryzen AI 9 HX 370 70 W / 65 W | Radeon 890M | 32 GB | 1.6 |
| Geekom A9 Max, AI 9 HX 370 | Ryzen AI 9 HX 370 65 W / 54 W | Radeon 890M ? / 2800 MHz | 32 GB | 1.6 |
| Minisforum EliteMini AI370 | Ryzen AI 9 HX 370 54 W / 45 W | Radeon 890M | 32 GB | 1.7 |
| Sapphire Edge AI, Ryzen AI 9 HX 370 | Ryzen AI 9 HX 370 45 W / 35 W | Radeon 890M 2900 / 2800 MHz | 32 GB | 1.7 |
| CPU TDP 35 W | TDP 45 W | TDP 54 W | TDP 65 W |
|---|---|---|---|
| 100% | 100% | 94% | 94% |
| Model | CPU | GPU | RAM | Value |
|---|---|---|---|---|
| BOSGAME M5 | Ryzen AI Max+ 395 140 W / 120 W | Radeon 8060S 64 GB | 128 GB | 1.7 |
| GMK EVO-X2 | Ryzen AI Max+ 395 140 W / 120 W | Radeon 8060S | 64 GB | 1.7 |
| Asus ROG Flow Z13 GZ302EA-RU073W | Ryzen AI Max+ 395 86 W / 70 W | Radeon 8060S 80 W 2264 / 1000 MHz | 32 GB | 2.8 |
| Minisforum MS-S1 Max | Ryzen AI Max+ 395 | Radeon 8060S 32 GB | 128 GB | 3.1 |
| CPU TDP ? | TDP 35 W | TDP 45 W | TDP 54 W | TDP 65 W | TDP 70 W | TDP 120 W |
|---|---|---|---|---|---|---|
| 100% | 55% | 55% | 52% | 52% | 90% | 55% |
| Model | CPU | GPU | RAM | Value |
|---|---|---|---|---|
| Acemagic F3A | Ryzen AI 9 HX 370 70 W / 65 W | Radeon 890M | 32 GB | 2.5 |
| Minisforum AI X1 Pro | Ryzen AI 9 HX 370 65 W / 54 W | Radeon 890M ? / 2800 MHz | 64 GB | 2.6 |
| Minisforum EliteMini AI370 | Ryzen AI 9 HX 370 54 W / 45 W | Radeon 890M | 32 GB | 2.7 |
| Sapphire Edge AI, Ryzen AI 9 HX 370 | Ryzen AI 9 HX 370 45 W / 35 W | Radeon 890M 2900 / 2800 MHz | 32 GB | 2.7 |
| Geekom A9 Max, AI 9 HX 370 | Ryzen AI 9 HX 370 65 W / 54 W | Radeon 890M ? / 2800 MHz | 32 GB | 2.8 |
| CPU TDP 35 W | TDP 45 W | TDP 54 W | TDP 65 W |
|---|---|---|---|
| 100% | 100% | 100% | 93% |
| Model | CPU | GPU | RAM | Value |
|---|---|---|---|---|
| BOSGAME M5 | Ryzen AI Max+ 395 140 W / 120 W | Radeon 8060S 64 GB | 128 GB | 2.7 |
| GMK EVO-X2 | Ryzen AI Max+ 395 140 W / 120 W | Radeon 8060S | 64 GB | 2.8 |
| Asus ROG Flow Z13 GZ302EA-RU073W | Ryzen AI Max+ 395 86 W / 70 W | Radeon 8060S 80 W 2264 / 1000 MHz | 32 GB | 4.4 |
| Minisforum MS-S1 Max | Ryzen AI Max+ 395 | Radeon 8060S 32 GB | 128 GB | 5.1 |
| CPU TDP ? | TDP 35 W | TDP 45 W | TDP 54 W | TDP 65 W | TDP 70 W | TDP 120 W |
|---|---|---|---|---|---|---|
| 100% | 53% | 53% | 53% | 49% | 86% | 54% |
| Model | CPU | GPU | RAM | Value |
|---|---|---|---|---|
| Sapphire Edge AI, Ryzen AI 9 HX 370 | Ryzen AI 9 HX 370 45 W / 35 W | Radeon 890M 2900 / 2800 MHz | 32 GB | 15.1 |
| Minisforum AI X1 Pro | Ryzen AI 9 HX 370 65 W / 54 W | Radeon 890M ? / 2800 MHz | 64 GB | 15.3 |
| Acemagic F3A | Ryzen AI 9 HX 370 70 W / 65 W | Radeon 890M | 32 GB | 15.3 |
| Geekom A9 Max, AI 9 HX 370 | Ryzen AI 9 HX 370 65 W / 54 W | Radeon 890M ? / 2800 MHz | 32 GB | 15.3 |
| Minisforum EliteMini AI370 | Ryzen AI 9 HX 370 54 W / 45 W | Radeon 890M | 32 GB | 16.6 |
| CPU TDP 35 W | TDP 45 W | TDP 54 W | TDP 65 W |
|---|---|---|---|
| 91% | 100% | 92% | 92% |
| Model | CPU | GPU | RAM | Value |
|---|---|---|---|---|
| BOSGAME M5 | Ryzen AI Max+ 395 140 W / 120 W | Radeon 8060S 64 GB | 128 GB | 16.7 |
| GMK EVO-X2 | Ryzen AI Max+ 395 140 W / 120 W | Radeon 8060S | 64 GB | 16.9 |
| Asus ROG Flow Z13 GZ302EA-RU073W | Ryzen AI Max+ 395 86 W / 70 W | Radeon 8060S 80 W 2264 / 1000 MHz | 32 GB | 23.5 |
| Minisforum MS-S1 Max | Ryzen AI Max+ 395 | Radeon 8060S 32 GB | 128 GB | 28.9 |
| CPU TDP ? | TDP 35 W | TDP 45 W | TDP 54 W | TDP 65 W | TDP 70 W | TDP 120 W |
|---|---|---|---|---|---|---|
| 100% | 52% | 57% | 53% | 53% | 81% | 58% |
| CPU TDP ? | TDP 25 W | TDP 28 W | TDP 30 W | TDP 35 W | TDP 45 W | TDP 54 W | TDP 65 W | TDP 70 W | TDP 75 W | TDP 80 W |
|---|---|---|---|---|---|---|---|---|---|---|
| 101% | 100% | 100% | 100% | 100% | 101% | 101% | 101% | 101% | 101% | 101% |
| Model | CPU | GPU | RAM | Value |
|---|---|---|---|---|
| BOSGAME M5 3.3.3 | Ryzen AI Max+ 395 140 W / 120 W | Radeon 8060S 64 GB | 128 GB | 132 |
| Minisforum MS-S1 Max 3.3.3 | Ryzen AI Max+ 395 | Radeon 8060S 32 GB | 128 GB | 132 |
| GMK EVO-X2 3.3.3 | Ryzen AI Max+ 395 140 W / 120 W | Radeon 8060S | 64 GB | 134 |
| Framework Desktop Ryzen AI Max 3.3.3 | Ryzen AI Max+ 395 115 W / 100 W | Radeon 8060S 2900 / 1000 MHz 16 GB | 64 GB | 142 |
| Asus ROG Flow Z13 GZ302EA-RU073W 3.3.3 | Ryzen AI Max+ 395 86 W / 70 W | Radeon 8060S 80 W 2264 / 1000 MHz | 32 GB | 163 |
| CPU TDP ? | TDP 25 W | TDP 28 W | TDP 30 W | TDP 35 W | TDP 45 W | TDP 54 W | TDP 65 W | TDP 70 W | TDP 75 W | TDP 80 W | TDP 100 W | TDP 120 W |
|---|---|---|---|---|---|---|---|---|---|---|---|---|
| 101% | 100% | 100% | 100% | 100% | 101% | 101% | 101% | 102% | 101% | 101% | 102% | 102% |
| CPU TDP ? | TDP 25 W | TDP 28 W | TDP 30 W | TDP 35 W | TDP 45 W | TDP 54 W | TDP 65 W | TDP 70 W | TDP 75 W | TDP 80 W |
|---|---|---|---|---|---|---|---|---|---|---|
| 100% | 100% | 100% | 100% | 100% | 100% | 100% | 100% | 100% | 100% | 100% |
| Model | CPU | GPU | RAM | Value |
|---|---|---|---|---|
| BOSGAME M5 | Ryzen AI Max+ 395 140 W / 120 W | Radeon 8060S 64 GB | 128 GB | 86 |
| Minisforum MS-S1 Max | Ryzen AI Max+ 395 | Radeon 8060S 32 GB | 128 GB | 86 |
| GMK EVO-X2 | Ryzen AI Max+ 395 140 W / 120 W | Radeon 8060S | 64 GB | 87 |
| Framework Desktop Ryzen AI Max | Ryzen AI Max+ 395 115 W / 100 W | Radeon 8060S 2900 / 1000 MHz 16 GB | 64 GB | 92 |
| Asus ROG Flow Z13 GZ302EA-RU073W | Ryzen AI Max+ 395 86 W / 70 W | Radeon 8060S 80 W 2264 / 1000 MHz | 32 GB | 107 |
| CPU TDP ? | TDP 25 W | TDP 28 W | TDP 30 W | TDP 35 W | TDP 45 W | TDP 54 W | TDP 65 W | TDP 70 W | TDP 75 W | TDP 80 W | TDP 100 W | TDP 120 W |
|---|---|---|---|---|---|---|---|---|---|---|---|---|
| 100% | 100% | 100% | 100% | 100% | 100% | 100% | 100% | 100% | 100% | 100% | 101% | 101% |
| CPU TDP ? | TDP 25 W | TDP 28 W | TDP 30 W | TDP 35 W | TDP 45 W | TDP 54 W | TDP 65 W | TDP 70 W | TDP 75 W | TDP 80 W |
|---|---|---|---|---|---|---|---|---|---|---|
| 103% | 103% | 103% | 100% | 103% | 103% | 103% | 103% | 103% | 103% | 103% |
| Model | CPU | GPU | RAM | Value |
|---|---|---|---|---|
| Framework Desktop Ryzen AI Max | Ryzen AI Max+ 395 115 W / 100 W | Radeon 8060S 2900 / 1000 MHz 16 GB | 64 GB | 0.3984 |
| Asus ROG Flow Z13 GZ302EA-RU073W | Ryzen AI Max+ 395 86 W / 70 W | Radeon 8060S 80 W 2264 / 1000 MHz | 32 GB | 0.3985 |
| GMK EVO-X2 | Ryzen AI Max+ 395 140 W / 120 W | Radeon 8060S | 64 GB | 0.4021 |
| Minisforum MS-S1 Max | Ryzen AI Max+ 395 | Radeon 8060S 32 GB | 128 GB | 0.4091 |
| BOSGAME M5 | Ryzen AI Max+ 395 140 W / 120 W | Radeon 8060S 64 GB | 128 GB | 0.4094 |
| CPU TDP ? | TDP 25 W | TDP 28 W | TDP 30 W | TDP 35 W | TDP 45 W | TDP 54 W | TDP 65 W | TDP 70 W | TDP 75 W | TDP 80 W | TDP 100 W | TDP 120 W |
|---|---|---|---|---|---|---|---|---|---|---|---|---|
| 103% | 103% | 103% | 100% | 103% | 103% | 103% | 103% | 103% | 103% | 103% | 103% | 103% |
| Model | CPU | GPU | RAM | Value |
|---|---|---|---|---|
| Minisforum EliteMini AI370 (Nvidia GeForce RTX 4090 @USB4) | Ryzen AI 9 HX 370 54 W / 45 W | 32 GB | 13761 | |
| Minisforum EliteMini AI370 | Ryzen AI 9 HX 370 54 W / 45 W | Radeon 890M | 32 GB | 15431 |
| Sapphire Edge AI, Ryzen AI 9 HX 370 | Ryzen AI 9 HX 370 45 W / 35 W | Radeon 890M 2900 / 2800 MHz | 32 GB | 16246 |
| Asus ProArt PX13 HN7306 | Ryzen AI 9 HX 370 | Radeon 890M | 32 GB | 16380 |
| Geekom A9 Max, AI 9 HX 370 | Ryzen AI 9 HX 370 65 W / 54 W | Radeon 890M ? / 2800 MHz | 32 GB | 16563 |
| Minisforum AI X1 Pro | Ryzen AI 9 HX 370 65 W / 54 W | Radeon 890M ? / 2800 MHz | 64 GB | 16763 |
| Minisforum AI X1 Pro (Nvidia GeForce RTX 4090 @OCuLink) | Ryzen AI 9 HX 370 | 24 GB | 64 GB | 17305 |
| Razer Blade 16 2025 RTX 5090 | Ryzen AI 9 HX 370 78 W / 75 W | GeForce RTX 5090 Laptop 160 W 1515 / 1750 MHz 24 GB | 32 GB | 17466 |
| CPU TDP ? | TDP 35 W | TDP 45 W | TDP 54 W | TDP 75 W |
|---|---|---|---|---|
| 96% | 93% | 84% | 95% | 100% |
| Model | CPU | GPU | RAM | Value |
|---|---|---|---|---|
| GMK EVO-X2 | Ryzen AI Max+ 395 140 W / 120 W | Radeon 8060S | 64 GB | 16575 |
| BOSGAME M5 | Ryzen AI Max+ 395 140 W / 120 W | Radeon 8060S 64 GB | 128 GB | 16635 |
| Asus ROG Flow Z13 GZ302EA-RU073W | Ryzen AI Max+ 395 86 W / 70 W | Radeon 8060S 80 W 2264 / 1000 MHz | 32 GB | 18770 |
| Minisforum MS-S1 Max | Ryzen AI Max+ 395 | Radeon 8060S 32 GB | 128 GB | 19691 |
| CPU TDP ? | TDP 35 W | TDP 45 W | TDP 54 W | TDP 70 W | TDP 75 W | TDP 120 W |
|---|---|---|---|---|---|---|
| 95% | 87% | 78% | 89% | 100% | 93% | 88% |
| Model | CPU | GPU | RAM | Value |
|---|---|---|---|---|
| Minisforum AI X1 Pro | Ryzen AI 9 HX 370 65 W / 54 W | Radeon 890M ? / 2800 MHz | 64 GB | 8.224 |
| Sapphire Edge AI, Ryzen AI 9 HX 370 | Ryzen AI 9 HX 370 45 W / 35 W | Radeon 890M 2900 / 2800 MHz | 32 GB | 8.351 |
| Acemagic F3A | Ryzen AI 9 HX 370 70 W / 65 W | Radeon 890M | 32 GB | 8.391 |
| Minisforum EliteMini AI370 | Ryzen AI 9 HX 370 54 W / 45 W | Radeon 890M | 32 GB | 8.43 |
| Geekom A9 Max, AI 9 HX 370 | Ryzen AI 9 HX 370 65 W / 54 W | Radeon 890M ? / 2800 MHz | 32 GB | 8.482 |
| CPU TDP 35 W | TDP 45 W | TDP 54 W | TDP 65 W |
|---|---|---|---|
| 100% | 100% | 100% | 100% |
| Model | CPU | GPU | RAM | Value |
|---|---|---|---|---|
| Asus ROG Flow Z13 GZ302EA-RU073W | Ryzen AI Max+ 395 86 W / 70 W | Radeon 8060S 80 W 2264 / 1000 MHz | 32 GB | 8.2 |
| BOSGAME M5 | Ryzen AI Max+ 395 140 W / 120 W | Radeon 8060S 64 GB | 128 GB | 8.31 |
| Minisforum MS-S1 Max | Ryzen AI Max+ 395 | Radeon 8060S 32 GB | 128 GB | 8.33 |
| GMK EVO-X2 | Ryzen AI Max+ 395 140 W / 120 W | Radeon 8060S | 64 GB | 8.359 |
| CPU TDP ? | TDP 35 W | TDP 45 W | TDP 54 W | TDP 65 W | TDP 70 W | TDP 120 W |
|---|---|---|---|---|---|---|
| 100% | 100% | 100% | 100% | 100% | 100% | 100% |
| Model | CPU | GPU | RAM | Value |
|---|---|---|---|---|
| Minisforum AI X1 Pro | Ryzen AI 9 HX 370 65 W / 54 W | Radeon 890M ? / 2800 MHz | 64 GB | 17.504 |
| Acemagic F3A | Ryzen AI 9 HX 370 70 W / 65 W | Radeon 890M | 32 GB | 17.647 |
| Minisforum EliteMini AI370 | Ryzen AI 9 HX 370 54 W / 45 W | Radeon 890M | 32 GB | 17.767 |
| Geekom A9 Max, AI 9 HX 370 | Ryzen AI 9 HX 370 65 W / 54 W | Radeon 890M ? / 2800 MHz | 32 GB | 17.914 |
| Sapphire Edge AI, Ryzen AI 9 HX 370 | Ryzen AI 9 HX 370 45 W / 35 W | Radeon 890M 2900 / 2800 MHz | 32 GB | 22.248 |
| CPU TDP 35 W | TDP 45 W | TDP 54 W | TDP 65 W |
|---|---|---|---|
| 100% | 100% | 100% | 100% |
| Model | CPU | GPU | RAM | Value |
|---|---|---|---|---|
| GMK EVO-X2 | Ryzen AI Max+ 395 140 W / 120 W | Radeon 8060S | 64 GB | 17.502 |
| Asus ROG Flow Z13 GZ302EA-RU073W | Ryzen AI Max+ 395 86 W / 70 W | Radeon 8060S 80 W 2264 / 1000 MHz | 32 GB | 17.6 |
| BOSGAME M5 | Ryzen AI Max+ 395 140 W / 120 W | Radeon 8060S 64 GB | 128 GB | 17.621 |
| Minisforum MS-S1 Max | Ryzen AI Max+ 395 | Radeon 8060S 32 GB | 128 GB | 17.659 |
| CPU TDP ? | TDP 35 W | TDP 45 W | TDP 54 W | TDP 65 W | TDP 70 W | TDP 120 W |
|---|---|---|---|---|---|---|
| 100% | 100% | 100% | 100% | 100% | 100% | 100% |
| Model | CPU | GPU | RAM | Value |
|---|---|---|---|---|
| Asus ROG Flow Z13 GZ302EA-RU073W | Ryzen AI Max+ 395 86 W / 70 W | Radeon 8060S 80 W 2264 / 1000 MHz | 32 GB | 407.8 |
| Model | CPU | GPU | RAM | Value |
|---|---|---|---|---|
| Minisforum EliteMini AI370 (Nvidia GeForce RTX 4090 @USB4) | Ryzen AI 9 HX 370 54 W / 45 W | 32 GB | 66119 | |
| Sapphire Edge AI, Ryzen AI 9 HX 370 | Ryzen AI 9 HX 370 | 68435 | ||
| Sapphire Edge AI, Ryzen AI 9 HX 370 | Ryzen AI 9 HX 370 45 W / 35 W | Radeon 890M 2900 / 2800 MHz | 32 GB | 69281 |
| Minisforum EliteMini AI370 | Ryzen AI 9 HX 370 54 W / 45 W | Radeon 890M | 32 GB | 70862 |
| Asus ProArt PX13 HN7306 | Ryzen AI 9 HX 370 | Radeon 890M | 32 GB | 75346 |
| Geekom A9 Max, AI 9 HX 370 | Ryzen AI 9 HX 370 65 W / 54 W | Radeon 890M ? / 2800 MHz | 32 GB | 76054 |
| Razer Blade 16 2025 RTX 5090 | Ryzen AI 9 HX 370 78 W / 75 W | GeForce RTX 5090 Laptop 160 W 1515 / 1750 MHz 24 GB | 32 GB | 76240 |
| Minisforum AI X1 Pro | Ryzen AI 9 HX 370 65 W / 54 W | Radeon 890M ? / 2800 MHz | 64 GB | 77532 |
| Minisforum AI X1 Pro (Nvidia GeForce RTX 4090 @OCuLink) | Ryzen AI 9 HX 370 | 24 GB | 64 GB | 77565 |
| CPU TDP ? | TDP 35 W | TDP 45 W | TDP 54 W | TDP 75 W |
|---|---|---|---|---|
| 96% | 90% | 89% | 100% | 99% |
| Model | CPU | GPU | RAM | Value |
|---|---|---|---|---|
| Asus ROG Flow Z13 GZ302EA-RU073W | Ryzen AI Max+ 395 86 W / 70 W | Radeon 8060S 80 W 2264 / 1000 MHz | 32 GB | 88295 |
| GMK EVO-X2 | Ryzen AI Max+ 395 140 W / 120 W | Radeon 8060S | 64 GB | 89249 |
| BOSGAME M5 | Ryzen AI Max+ 395 140 W / 120 W | Radeon 8060S 64 GB | 128 GB | 93105 |
| Minisforum MS-S1 Max | Ryzen AI Max+ 395 | Radeon 8060S 32 GB | 128 GB | 95834 |
| CPU TDP ? | TDP 35 W | TDP 45 W | TDP 54 W | TDP 70 W | TDP 75 W | TDP 120 W |
|---|---|---|---|---|---|---|
| 87% | 76% | 75% | 84% | 97% | 84% | 100% |
| CPU TDP ? | TDP 25 W | TDP 28 W | TDP 30 W | TDP 35 W | TDP 45 W | TDP 54 W | TDP 65 W | TDP 70 W | TDP 75 W | TDP 80 W |
|---|---|---|---|---|---|---|---|---|---|---|
| 84% | 71% | 76% | 70% | 85% | 80% | 83% | 83% | 100% | 93% | 89% |
| Model | CPU | GPU | RAM | Value |
|---|---|---|---|---|
| GMK EVO-X2 | Ryzen AI Max+ 395 140 W / 120 W | Radeon 8060S | 64 GB | 22033 |
| BOSGAME M5 | Ryzen AI Max+ 395 140 W / 120 W | Radeon 8060S 64 GB | 128 GB | 22299 |
| Framework Desktop Ryzen AI Max | Ryzen AI Max+ 395 115 W / 100 W | Radeon 8060S 2900 / 1000 MHz 16 GB | 64 GB | 22436 |
| Asus ROG Flow Z13 GZ302EA-RU073W | Ryzen AI Max+ 395 86 W / 70 W | Radeon 8060S 80 W 2264 / 1000 MHz | 32 GB | 26998 |
| Minisforum MS-S1 Max | Ryzen AI Max+ 395 110 W / 80 W | Radeon 8060S 32 GB | 128 GB | 27556 |
| Minisforum MS-S1 Max | Ryzen AI Max+ 395 130 W / 110 W | Radeon 8060S | 128 GB | 28466 |
| Minisforum MS-S1 Max | Ryzen AI Max+ 395 | Radeon 8060S 32 GB | 128 GB | 28889 |
| CPU TDP ? | TDP 25 W | TDP 28 W | TDP 30 W | TDP 35 W | TDP 45 W | TDP 54 W | TDP 65 W | TDP 70 W | TDP 75 W | TDP 80 W | TDP 100 W | TDP 110 W | TDP 120 W |
|---|---|---|---|---|---|---|---|---|---|---|---|---|---|
| 76% | 61% | 66% | 60% | 73% | 69% | 71% | 71% | 91% | 81% | 80% | 79% | 100% | 78% |
| Model | CPU | GPU | RAM | Value |
|---|---|---|---|---|
| Acemagic F3A | Ryzen AI 9 HX 370 70 W / 65 W | Radeon 890M | 32 GB | 50952 |
| ONEXPLAYER X1 Pro GA15H-HX370-32GB-1TB-H | Ryzen AI 9 HX 370 0 W / 30 W | Radeon 890M | 32 GB | 53586 |
| Minisforum EliteMini AI370 (Nvidia GeForce RTX 4090 @USB4) | Ryzen AI 9 HX 370 54 W / 45 W | 32 GB | 55168 | |
| Asus VivoBook S 14 OLED M5406WA | Ryzen AI 9 HX 370 65 W / 54 W | Radeon 890M 0.5 GB | 24 GB | 61220 |
| Minisforum AI X1 Pro | Ryzen AI 9 HX 370 65 W / 54 W | Radeon 890M ? / 2800 MHz | 64 GB | 61493 |
| Geekom A9 Max, AI 9 HX 370 | Ryzen AI 9 HX 370 65 W / 54 W | Radeon 890M ? / 2800 MHz | 32 GB | 65954 |
| Minisforum EliteMini AI370 | Ryzen AI 9 HX 370 54 W / 45 W | Radeon 890M | 32 GB | 66496 |
| Minisforum AI X1 Pro (Nvidia GeForce RTX 4090 @OCuLink) | Ryzen AI 9 HX 370 | 24 GB | 64 GB | 67655 |
| Sapphire Edge AI, Ryzen AI 9 HX 370 | Ryzen AI 9 HX 370 | 68567 | ||
| Sapphire Edge AI, Ryzen AI 9 HX 370 | Ryzen AI 9 HX 370 45 W / 35 W | Radeon 890M 2900 / 2800 MHz | 32 GB | 76578 |
| CPU TDP ? | TDP 30 W | TDP 35 W | TDP 45 W | TDP 54 W | TDP 65 W |
|---|---|---|---|---|---|
| 89% | 70% | 100% | 79% | 82% | 67% |
| Model | CPU | GPU | RAM | Value |
|---|---|---|---|---|
| Minisforum MS-S1 Max | Ryzen AI Max+ 395 130 W / 110 W | Radeon 8060S | 128 GB | 75830 |
| Minisforum MS-S1 Max | Ryzen AI Max+ 395 110 W / 80 W | Radeon 8060S 32 GB | 128 GB | 76051 |
| Minisforum MS-S1 Max | Ryzen AI Max+ 395 | Radeon 8060S 32 GB | 128 GB | 77087 |
| GMK EVO-X2 | Ryzen AI Max+ 395 140 W / 120 W | Radeon 8060S | 64 GB | 82801 |
| BOSGAME M5 | Ryzen AI Max+ 395 140 W / 120 W | Radeon 8060S 64 GB | 128 GB | 84504 |
| CPU TDP ? | TDP 30 W | TDP 35 W | TDP 45 W | TDP 54 W | TDP 65 W | TDP 80 W | TDP 110 W | TDP 120 W |
|---|---|---|---|---|---|---|---|---|
| 85% | 64% | 92% | 73% | 75% | 61% | 91% | 91% | 100% |
| Model | CPU | GPU | RAM | Value |
|---|---|---|---|---|
| Acemagic F3A | Ryzen AI 9 HX 370 70 W / 65 W | Radeon 890M | 32 GB | 50955 |
| Minisforum EliteMini AI370 (Nvidia GeForce RTX 4090 @USB4) | Ryzen AI 9 HX 370 54 W / 45 W | 32 GB | 55268 | |
| Minisforum AI X1 Pro | Ryzen AI 9 HX 370 65 W / 54 W | Radeon 890M ? / 2800 MHz | 64 GB | 61072 |
| Minisforum EliteMini AI370 | Ryzen AI 9 HX 370 54 W / 45 W | Radeon 890M | 32 GB | 66511 |
| Geekom A9 Max, AI 9 HX 370 | Ryzen AI 9 HX 370 65 W / 54 W | Radeon 890M ? / 2800 MHz | 32 GB | 66516 |
| Minisforum AI X1 Pro (Nvidia GeForce RTX 4090 @OCuLink) | Ryzen AI 9 HX 370 | 24 GB | 64 GB | 67802 |
| Sapphire Edge AI, Ryzen AI 9 HX 370 | Ryzen AI 9 HX 370 | 68664 | ||
| Sapphire Edge AI, Ryzen AI 9 HX 370 | Ryzen AI 9 HX 370 45 W / 35 W | Radeon 890M 2900 / 2800 MHz | 32 GB | 77375 |
| CPU TDP ? | TDP 35 W | TDP 45 W | TDP 54 W | TDP 65 W |
|---|---|---|---|---|
| 88% | 100% | 79% | 82% | 66% |
| Model | CPU | GPU | RAM | Value |
|---|---|---|---|---|
| Minisforum MS-S1 Max | Ryzen AI Max+ 395 110 W / 80 W | Radeon 8060S 32 GB | 128 GB | 75621 |
| Minisforum MS-S1 Max | Ryzen AI Max+ 395 130 W / 110 W | Radeon 8060S | 128 GB | 76015 |
| Minisforum MS-S1 Max | Ryzen AI Max+ 395 | Radeon 8060S 32 GB | 128 GB | 77354 |
| GMK EVO-X2 | Ryzen AI Max+ 395 140 W / 120 W | Radeon 8060S | 64 GB | 81309 |
| BOSGAME M5 | Ryzen AI Max+ 395 140 W / 120 W | Radeon 8060S 64 GB | 128 GB | 83969 |
| CPU TDP ? | TDP 35 W | TDP 45 W | TDP 54 W | TDP 65 W | TDP 80 W | TDP 110 W | TDP 120 W |
|---|---|---|---|---|---|---|---|
| 86% | 94% | 74% | 77% | 62% | 92% | 92% | 100% |
| Model | CPU | GPU | RAM | Value |
|---|---|---|---|---|
| Acemagic F3A | Ryzen AI 9 HX 370 70 W / 65 W | Radeon 890M | 32 GB | 48351 |
| Minisforum EliteMini AI370 (Nvidia GeForce RTX 4090 @USB4) | Ryzen AI 9 HX 370 54 W / 45 W | 32 GB | 55697 | |
| Minisforum AI X1 Pro | Ryzen AI 9 HX 370 65 W / 54 W | Radeon 890M ? / 2800 MHz | 64 GB | 62930 |
| Minisforum AI X1 Pro (Nvidia GeForce RTX 4090 @OCuLink) | Ryzen AI 9 HX 370 | 24 GB | 64 GB | 66810 |
| Sapphire Edge AI, Ryzen AI 9 HX 370 | Ryzen AI 9 HX 370 | 69258 | ||
| Sapphire Edge AI, Ryzen AI 9 HX 370 | Ryzen AI 9 HX 370 45 W / 35 W | Radeon 890M 2900 / 2800 MHz | 32 GB | 76518 |
| CPU TDP ? | TDP 35 W | TDP 45 W | TDP 54 W | TDP 65 W |
|---|---|---|---|---|
| 89% | 100% | 73% | 82% | 63% |
| Model | CPU | GPU | RAM | Value |
|---|---|---|---|---|
| Minisforum MS-S1 Max | Ryzen AI Max+ 395 | Radeon 8060S 32 GB | 128 GB | 76968 |
| Minisforum MS-S1 Max | Ryzen AI Max+ 395 130 W / 110 W | Radeon 8060S | 128 GB | 77212 |
| GMK EVO-X2 | Ryzen AI Max+ 395 140 W / 120 W | Radeon 8060S | 64 GB | 81309 |
| BOSGAME M5 | Ryzen AI Max+ 395 140 W / 120 W | Radeon 8060S 64 GB | 128 GB | 82293 |
| CPU TDP ? | TDP 35 W | TDP 45 W | TDP 54 W | TDP 65 W | TDP 110 W | TDP 120 W |
|---|---|---|---|---|---|---|
| 87% | 94% | 68% | 77% | 59% | 94% | 100% |
| CPU TDP ? | TDP 25 W | TDP 30 W | TDP 35 W | TDP 45 W | TDP 54 W | TDP 65 W | TDP 80 W |
|---|---|---|---|---|---|---|---|
| 100% | 84% | 87% | 94% | 93% | 98% | 96% | 100% |
| Model | CPU | GPU | RAM | Value |
|---|---|---|---|---|
| Framework Desktop Ryzen AI Max | Ryzen AI Max+ 395 115 W / 100 W | Radeon 8060S 2900 / 1000 MHz 16 GB | 64 GB | 21608 |
| GMK EVO-X2 | Ryzen AI Max+ 395 140 W / 120 W | Radeon 8060S | 64 GB | 21973 |
| BOSGAME M5 | Ryzen AI Max+ 395 140 W / 120 W | Radeon 8060S 64 GB | 128 GB | 23592 |
| Minisforum MS-S1 Max | Ryzen AI Max+ 395 110 W / 80 W | Radeon 8060S 32 GB | 128 GB | 24263 |
| Minisforum MS-S1 Max | Ryzen AI Max+ 395 130 W / 110 W | Radeon 8060S | 128 GB | 24937 |
| Minisforum MS-S1 Max | Ryzen AI Max+ 395 | Radeon 8060S 32 GB | 128 GB | 25765 |
| CPU TDP ? | TDP 25 W | TDP 30 W | TDP 35 W | TDP 45 W | TDP 54 W | TDP 65 W | TDP 80 W | TDP 100 W | TDP 110 W | TDP 120 W |
|---|---|---|---|---|---|---|---|---|---|---|
| 85% | 68% | 70% | 77% | 76% | 80% | 78% | 89% | 87% | 100% | 91% |
| CPU TDP ? | TDP 25 W | TDP 28 W | TDP 30 W | TDP 35 W | TDP 45 W | TDP 54 W | TDP 65 W | TDP 70 W | TDP 75 W | TDP 80 W |
|---|---|---|---|---|---|---|---|---|---|---|
| 91% | 74% | 76% | 77% | 85% | 84% | 87% | 90% | 100% | 95% | 97% |
| Model | CPU | GPU | RAM | Value |
|---|---|---|---|---|
| GMK EVO-X2 | Ryzen AI Max+ 395 140 W / 120 W | Radeon 8060S | 64 GB | 30555 |
| Framework Desktop Ryzen AI Max | Ryzen AI Max+ 395 115 W / 100 W | Radeon 8060S 2900 / 1000 MHz 16 GB | 64 GB | 31235 |
| BOSGAME M5 | Ryzen AI Max+ 395 140 W / 120 W | Radeon 8060S 64 GB | 128 GB | 32060 |
| Minisforum MS-S1 Max | Ryzen AI Max+ 395 110 W / 80 W | Radeon 8060S 32 GB | 128 GB | 37386 |
| Asus ROG Flow Z13 GZ302EA-RU073W | Ryzen AI Max+ 395 86 W / 70 W | Radeon 8060S 80 W 2264 / 1000 MHz | 32 GB | 38075 |
| Minisforum MS-S1 Max | Ryzen AI Max+ 395 | Radeon 8060S 32 GB | 128 GB | 39423 |
| Minisforum MS-S1 Max | Ryzen AI Max+ 395 130 W / 110 W | Radeon 8060S | 128 GB | 39630 |
| CPU TDP ? | TDP 25 W | TDP 28 W | TDP 30 W | TDP 35 W | TDP 45 W | TDP 54 W | TDP 65 W | TDP 70 W | TDP 75 W | TDP 80 W | TDP 100 W | TDP 110 W | TDP 120 W |
|---|---|---|---|---|---|---|---|---|---|---|---|---|---|
| 79% | 63% | 65% | 66% | 73% | 72% | 74% | 77% | 91% | 81% | 84% | 79% | 100% | 79% |
| CPU TDP ? | TDP 25 W | TDP 28 W | TDP 30 W | TDP 35 W | TDP 45 W | TDP 54 W | TDP 65 W | TDP 70 W | TDP 75 W | TDP 80 W |
|---|---|---|---|---|---|---|---|---|---|---|
| 94% | 82% | 81% | 84% | 91% | 91% | 91% | 95% | 100% | 90% | 88% |
| Model | CPU | GPU | RAM | Value |
|---|---|---|---|---|
| GMK EVO-X2 | Ryzen AI Max+ 395 140 W / 120 W | Radeon 8060S | 64 GB | 9451 |
| BOSGAME M5 | Ryzen AI Max+ 395 140 W / 120 W | Radeon 8060S 64 GB | 128 GB | 9860 |
| Framework Desktop Ryzen AI Max | Ryzen AI Max+ 395 115 W / 100 W | Radeon 8060S 2900 / 1000 MHz 16 GB | 64 GB | 10355 |
| Minisforum MS-S1 Max | Ryzen AI Max+ 395 110 W / 80 W | Radeon 8060S 32 GB | 128 GB | 10837 |
| Minisforum MS-S1 Max | Ryzen AI Max+ 395 130 W / 110 W | Radeon 8060S | 128 GB | 10973 |
| Minisforum MS-S1 Max | Ryzen AI Max+ 395 | Radeon 8060S 32 GB | 128 GB | 10980 |
| Asus ROG Flow Z13 GZ302EA-RU073W | Ryzen AI Max+ 395 86 W / 70 W | Radeon 8060S 80 W 2264 / 1000 MHz | 32 GB | 11285 |
| CPU TDP ? | TDP 25 W | TDP 28 W | TDP 30 W | TDP 35 W | TDP 45 W | TDP 54 W | TDP 65 W | TDP 70 W | TDP 75 W | TDP 80 W | TDP 100 W | TDP 110 W | TDP 120 W |
|---|---|---|---|---|---|---|---|---|---|---|---|---|---|
| 95% | 83% | 82% | 85% | 92% | 92% | 92% | 96% | 100% | 91% | 90% | 91% | 96% | 85% |
| CPU TDP ? | TDP 25 W | TDP 28 W | TDP 30 W | TDP 35 W | TDP 45 W | TDP 54 W | TDP 65 W | TDP 70 W | TDP 75 W | TDP 80 W |
|---|---|---|---|---|---|---|---|---|---|---|
| 98% | 99% | 96% | 97% | 99% | 94% | 98% | 99% | 100% | 100% | 98% |
| Model | CPU | GPU | RAM | Value |
|---|---|---|---|---|
| BOSGAME M5 6.4.0 Pro | Ryzen AI Max+ 395 140 W / 120 W | Radeon 8060S 64 GB | 128 GB | 2791 |
| GMK EVO-X2 6.4.0 Pro | Ryzen AI Max+ 395 140 W / 120 W | Radeon 8060S | 64 GB | 2881 |
| Minisforum MS-S1 Max 6.4.0 Pro | Ryzen AI Max+ 395 | Radeon 8060S 32 GB | 128 GB | 2929 |
| Framework Desktop Ryzen AI Max 6.4.0 Pro | Ryzen AI Max+ 395 115 W / 100 W | Radeon 8060S 2900 / 1000 MHz 16 GB | 64 GB | 2965 |
| Asus ROG Flow Z13 GZ302EA-RU073W 6.4.0 Pro | Ryzen AI Max+ 395 86 W / 70 W | Radeon 8060S 80 W 2264 / 1000 MHz | 32 GB | 2978 |
| CPU TDP ? | TDP 25 W | TDP 28 W | TDP 30 W | TDP 35 W | TDP 45 W | TDP 54 W | TDP 65 W | TDP 70 W | TDP 75 W | TDP 80 W | TDP 100 W | TDP 120 W |
|---|---|---|---|---|---|---|---|---|---|---|---|---|
| 98% | 98% | 95% | 97% | 98% | 94% | 97% | 98% | 100% | 99% | 98% | 100% | 96% |
| CPU TDP ? | TDP 25 W | TDP 28 W | TDP 30 W | TDP 35 W | TDP 45 W | TDP 54 W | TDP 65 W | TDP 70 W | TDP 75 W | TDP 80 W |
|---|---|---|---|---|---|---|---|---|---|---|
| 86% | 82% | 86% | 73% | 87% | 90% | 93% | 91% | 100% | 96% | 94% |
| Model | CPU | GPU | RAM | Value |
|---|---|---|---|---|
| GMK EVO-X2 6.4.0 Pro | Ryzen AI Max+ 395 140 W / 120 W | Radeon 8060S | 64 GB | 16510 |
| Framework Desktop Ryzen AI Max 6.4.0 Pro | Ryzen AI Max+ 395 115 W / 100 W | Radeon 8060S 2900 / 1000 MHz 16 GB | 64 GB | 17464 |
| BOSGAME M5 6.4.0 Pro | Ryzen AI Max+ 395 140 W / 120 W | Radeon 8060S 64 GB | 128 GB | 17599 |
| Asus ROG Flow Z13 GZ302EA-RU073W 6.4.0 Pro | Ryzen AI Max+ 395 86 W / 70 W | Radeon 8060S 80 W 2264 / 1000 MHz | 32 GB | 21269 |
| Minisforum MS-S1 Max 6.4.0 Pro | Ryzen AI Max+ 395 | Radeon 8060S 32 GB | 128 GB | 22157 |
| CPU TDP ? | TDP 25 W | TDP 28 W | TDP 30 W | TDP 35 W | TDP 45 W | TDP 54 W | TDP 65 W | TDP 70 W | TDP 75 W | TDP 80 W | TDP 100 W | TDP 120 W |
|---|---|---|---|---|---|---|---|---|---|---|---|---|
| 84% | 71% | 75% | 64% | 76% | 78% | 80% | 79% | 100% | 83% | 81% | 93% | 91% |
| Model | CPU | GPU | RAM | Value |
|---|---|---|---|---|
| Asus Zenbook S 16 UM5606-RK333W | Ryzen AI 9 HX 370 33 W / 28 W | Radeon 890M 2500 / 937 MHz | 32 GB | 2645 |
| Asus ProArt PX13 HN7306 | Ryzen AI 9 HX 370 80 W / 65 W | GeForce RTX 4070 Laptop GPU 75 W 1655 / 2025 MHz | 32 GB | 2647 |
| Geekom A9 Max, AI 9 HX 370 | Ryzen AI 9 HX 370 65 W / 54 W | Radeon 890M ? / 2800 MHz | 32 GB | 2716 |
| Sapphire Edge AI, Ryzen AI 9 HX 370 | Ryzen AI 9 HX 370 45 W / 35 W | Radeon 890M 2900 / 2800 MHz | 32 GB | 2764 |
| Acemagic F3A | Ryzen AI 9 HX 370 70 W / 65 W | Radeon 890M | 32 GB | 2816 |
| Minisforum EliteMini AI370 | Ryzen AI 9 HX 370 54 W / 45 W | Radeon 890M | 32 GB | 2822 |
| Minisforum AI X1 Pro | Ryzen AI 9 HX 370 65 W / 54 W | Radeon 890M ? / 2800 MHz | 64 GB | 2844 |
| CPU TDP 28 W | TDP 35 W | TDP 45 W | TDP 54 W | TDP 65 W |
|---|---|---|---|---|
| 94% | 98% | 100% | 99% | 97% |
| Model | CPU | GPU | RAM | Value |
|---|---|---|---|---|
| GMK EVO-X2 | Ryzen AI Max+ 395 140 W / 120 W | Radeon 8060S | 64 GB | 2819 |
| BOSGAME M5 | Ryzen AI Max+ 395 140 W / 120 W | Radeon 8060S 64 GB | 128 GB | 2820 |
| CPU TDP 28 W | TDP 35 W | TDP 45 W | TDP 54 W | TDP 65 W | TDP 120 W |
|---|---|---|---|---|---|
| 94% | 98% | 100% | 99% | 97% | 100% |
| Model | CPU | GPU | RAM | Value |
|---|---|---|---|---|
| Acemagic F3A | Ryzen AI 9 HX 370 70 W / 65 W | Radeon 890M | 32 GB | 12289 |
| Asus Zenbook S 16 UM5606-RK333W | Ryzen AI 9 HX 370 33 W / 28 W | Radeon 890M 2500 / 937 MHz | 32 GB | 12664 |
| Sapphire Edge AI, Ryzen AI 9 HX 370 | Ryzen AI 9 HX 370 45 W / 35 W | Radeon 890M 2900 / 2800 MHz | 32 GB | 13602 |
| Asus ProArt PX13 HN7306 | Ryzen AI 9 HX 370 80 W / 65 W | GeForce RTX 4070 Laptop GPU 75 W 1655 / 2025 MHz | 32 GB | 14161 |
| Minisforum EliteMini AI370 | Ryzen AI 9 HX 370 54 W / 45 W | Radeon 890M | 32 GB | 14465 |
| Geekom A9 Max, AI 9 HX 370 | Ryzen AI 9 HX 370 65 W / 54 W | Radeon 890M ? / 2800 MHz | 32 GB | 14797 |
| Minisforum AI X1 Pro | Ryzen AI 9 HX 370 65 W / 54 W | Radeon 890M ? / 2800 MHz | 64 GB | 15017 |
| CPU TDP 28 W | TDP 35 W | TDP 45 W | TDP 54 W | TDP 65 W |
|---|---|---|---|---|
| 85% | 91% | 97% | 100% | 89% |
| Model | CPU | GPU | RAM | Value |
|---|---|---|---|---|
| GMK EVO-X2 | Ryzen AI Max+ 395 140 W / 120 W | Radeon 8060S | 64 GB | 16420 |
| BOSGAME M5 | Ryzen AI Max+ 395 140 W / 120 W | Radeon 8060S 64 GB | 128 GB | 16436 |
| CPU TDP 28 W | TDP 35 W | TDP 45 W | TDP 54 W | TDP 65 W | TDP 120 W |
|---|---|---|---|---|---|
| 77% | 83% | 88% | 91% | 81% | 100% |
| CPU TDP ? | TDP 25 W | TDP 28 W | TDP 30 W | TDP 35 W | TDP 45 W | TDP 54 W | TDP 65 W | TDP 70 W | TDP 75 W | TDP 80 W |
|---|---|---|---|---|---|---|---|---|---|---|
| 99% | 100% | 98% | 99% | 97% | 92% | 96% | 98% | 97% | 100% | 99% |
| Model | CPU | GPU | RAM | Value |
|---|---|---|---|---|
| BOSGAME M5 | Ryzen AI Max+ 395 140 W / 120 W | Radeon 8060S 64 GB | 128 GB | 2184 |
| Framework Desktop Ryzen AI Max | Ryzen AI Max+ 395 115 W / 100 W | Radeon 8060S 2900 / 1000 MHz 16 GB | 64 GB | 2194 |
| GMK EVO-X2 | Ryzen AI Max+ 395 140 W / 120 W | Radeon 8060S | 64 GB | 2228 |
| Minisforum MS-S1 Max | Ryzen AI Max+ 395 | Radeon 8060S 32 GB | 128 GB | 2240 |
| Asus ROG Flow Z13 GZ302EA-RU073W | Ryzen AI Max+ 395 86 W / 70 W | Radeon 8060S 80 W 2264 / 1000 MHz | 32 GB | 2275 |
| CPU TDP ? | TDP 25 W | TDP 28 W | TDP 30 W | TDP 35 W | TDP 45 W | TDP 54 W | TDP 65 W | TDP 70 W | TDP 75 W | TDP 80 W | TDP 100 W | TDP 120 W |
|---|---|---|---|---|---|---|---|---|---|---|---|---|
| 97% | 97% | 95% | 95% | 94% | 89% | 93% | 95% | 99% | 97% | 95% | 99% | 100% |
| CPU TDP ? | TDP 25 W | TDP 28 W | TDP 30 W | TDP 35 W | TDP 45 W | TDP 54 W | TDP 65 W | TDP 70 W | TDP 75 W | TDP 80 W |
|---|---|---|---|---|---|---|---|---|---|---|
| 83% | 73% | 82% | 70% | 87% | 88% | 90% | 89% | 100% | 94% | 93% |
| Model | CPU | GPU | RAM | Value |
|---|---|---|---|---|
| GMK EVO-X2 | Ryzen AI Max+ 395 140 W / 120 W | Radeon 8060S | 64 GB | 16535 |
| Framework Desktop Ryzen AI Max | Ryzen AI Max+ 395 115 W / 100 W | Radeon 8060S 2900 / 1000 MHz 16 GB | 64 GB | 16632 |
| BOSGAME M5 | Ryzen AI Max+ 395 140 W / 120 W | Radeon 8060S 64 GB | 128 GB | 17552 |
| Asus ROG Flow Z13 GZ302EA-RU073W | Ryzen AI Max+ 395 86 W / 70 W | Radeon 8060S 80 W 2264 / 1000 MHz | 32 GB | 22023 |
| Minisforum MS-S1 Max | Ryzen AI Max+ 395 | Radeon 8060S 32 GB | 128 GB | 24593 |
| CPU TDP ? | TDP 25 W | TDP 28 W | TDP 30 W | TDP 35 W | TDP 45 W | TDP 54 W | TDP 65 W | TDP 70 W | TDP 75 W | TDP 80 W | TDP 100 W | TDP 120 W |
|---|---|---|---|---|---|---|---|---|---|---|---|---|
| 85% | 62% | 70% | 59% | 74% | 75% | 77% | 76% | 100% | 80% | 79% | 87% | 89% |
| Model | CPU | GPU | RAM | Value |
|---|---|---|---|---|
| Minisforum EliteMini AI370 | Ryzen AI 9 HX 370 54 W / 45 W | Radeon 890M | 32 GB | 1827 |
| Geekom A9 Max, AI 9 HX 370 | Ryzen AI 9 HX 370 65 W / 54 W | Radeon 890M ? / 2800 MHz | 32 GB | 1918 |
| Sapphire Edge AI, Ryzen AI 9 HX 370 | Ryzen AI 9 HX 370 45 W / 35 W | Radeon 890M 2900 / 2800 MHz | 32 GB | 1927 |
| Acemagic F3A | Ryzen AI 9 HX 370 70 W / 65 W | Radeon 890M | 32 GB | 1942 |
| Minisforum AI X1 Pro | Ryzen AI 9 HX 370 65 W / 54 W | Radeon 890M ? / 2800 MHz | 64 GB | 1952 |
| Minisforum AI X1 Pro (Nvidia GeForce RTX 4090 @OCuLink) | Ryzen AI 9 HX 370 | 24 GB | 64 GB | 2041 |
| CPU TDP ? | TDP 35 W | TDP 45 W | TDP 54 W | TDP 65 W |
|---|---|---|---|---|
| 100% | 94% | 90% | 95% | 95% |
| Model | CPU | GPU | RAM | Value |
|---|---|---|---|---|
| BOSGAME M5 | Ryzen AI Max+ 395 140 W / 120 W | Radeon 8060S 64 GB | 128 GB | 1991 |
| Minisforum MS-S1 Max | Ryzen AI Max+ 395 | Radeon 8060S 32 GB | 128 GB | 2091 |
| GMK EVO-X2 | Ryzen AI Max+ 395 140 W / 120 W | Radeon 8060S | 64 GB | 2097 |
| CPU TDP ? | TDP 35 W | TDP 45 W | TDP 54 W | TDP 65 W | TDP 120 W |
|---|---|---|---|---|---|
| 100% | 93% | 88% | 94% | 94% | 99% |
| Model | CPU | GPU | RAM | Value |
|---|---|---|---|---|
| Acemagic F3A | Ryzen AI 9 HX 370 70 W / 65 W | Radeon 890M | 32 GB | 12962 |
| Minisforum AI X1 Pro (Nvidia GeForce RTX 4090 @OCuLink) | Ryzen AI 9 HX 370 | 24 GB | 64 GB | 14135 |
| Sapphire Edge AI, Ryzen AI 9 HX 370 | Ryzen AI 9 HX 370 45 W / 35 W | Radeon 890M 2900 / 2800 MHz | 32 GB | 14211 |
| Minisforum EliteMini AI370 | Ryzen AI 9 HX 370 54 W / 45 W | Radeon 890M | 32 GB | 14353 |
| Minisforum AI X1 Pro | Ryzen AI 9 HX 370 65 W / 54 W | Radeon 890M ? / 2800 MHz | 64 GB | 14828 |
| Geekom A9 Max, AI 9 HX 370 | Ryzen AI 9 HX 370 65 W / 54 W | Radeon 890M ? / 2800 MHz | 32 GB | 15009 |
| CPU TDP ? | TDP 35 W | TDP 45 W | TDP 54 W | TDP 65 W |
|---|---|---|---|---|
| 95% | 95% | 96% | 100% | 87% |
| Model | CPU | GPU | RAM | Value |
|---|---|---|---|---|
| GMK EVO-X2 | Ryzen AI Max+ 395 140 W / 120 W | Radeon 8060S | 64 GB | 16628 |
| BOSGAME M5 | Ryzen AI Max+ 395 140 W / 120 W | Radeon 8060S 64 GB | 128 GB | 17929 |
| Minisforum MS-S1 Max | Ryzen AI Max+ 395 | Radeon 8060S 32 GB | 128 GB | 24621 |
| CPU TDP ? | TDP 35 W | TDP 45 W | TDP 54 W | TDP 65 W | TDP 120 W |
|---|---|---|---|---|---|
| 100% | 73% | 74% | 77% | 67% | 89% |
| Model | CPU | GPU | RAM | Value |
|---|---|---|---|---|
| Minisforum EliteMini AI370 | Ryzen AI 9 HX 370 54 W / 45 W | Radeon 890M | 32 GB | 7480 |
| Acemagic F3A | Ryzen AI 9 HX 370 70 W / 65 W | Radeon 890M | 32 GB | 7790 |
| Geekom A9 Max, AI 9 HX 370 | Ryzen AI 9 HX 370 65 W / 54 W | Radeon 890M ? / 2800 MHz | 32 GB | 7804 |
| Sapphire Edge AI, Ryzen AI 9 HX 370 | Ryzen AI 9 HX 370 45 W / 35 W | Radeon 890M 2900 / 2800 MHz | 32 GB | 7832 |
| Minisforum AI X1 Pro | Ryzen AI 9 HX 370 65 W / 54 W | Radeon 890M ? / 2800 MHz | 64 GB | 8277 |
| Minisforum AI X1 Pro (Nvidia GeForce RTX 4090 @OCuLink) | Ryzen AI 9 HX 370 | 24 GB | 64 GB | 8628 |
| CPU TDP ? | TDP 35 W | TDP 45 W | TDP 54 W | TDP 65 W |
|---|---|---|---|---|
| 100% | 91% | 87% | 93% | 90% |
| Model | CPU | GPU | RAM | Value |
|---|---|---|---|---|
| BOSGAME M5 | Ryzen AI Max+ 395 140 W / 120 W | Radeon 8060S 64 GB | 128 GB | 8054 |
| Minisforum MS-S1 Max | Ryzen AI Max+ 395 | Radeon 8060S 32 GB | 128 GB | 8220 |
| GMK EVO-X2 | Ryzen AI Max+ 395 140 W / 120 W | Radeon 8060S | 64 GB | 8295 |
| CPU TDP ? | TDP 35 W | TDP 45 W | TDP 54 W | TDP 65 W | TDP 120 W |
|---|---|---|---|---|---|
| 100% | 93% | 89% | 95% | 92% | 97% |
| Model | CPU | GPU | RAM | Value |
|---|---|---|---|---|
| Acemagic F3A | Ryzen AI 9 HX 370 70 W / 65 W | Radeon 890M | 32 GB | 42842 |
| Sapphire Edge AI, Ryzen AI 9 HX 370 | Ryzen AI 9 HX 370 45 W / 35 W | Radeon 890M 2900 / 2800 MHz | 32 GB | 52747 |
| Minisforum AI X1 Pro (Nvidia GeForce RTX 4090 @OCuLink) | Ryzen AI 9 HX 370 | 24 GB | 64 GB | 54386 |
| Minisforum EliteMini AI370 | Ryzen AI 9 HX 370 54 W / 45 W | Radeon 890M | 32 GB | 54787 |
| Geekom A9 Max, AI 9 HX 370 | Ryzen AI 9 HX 370 65 W / 54 W | Radeon 890M ? / 2800 MHz | 32 GB | 55688 |
| Minisforum AI X1 Pro | Ryzen AI 9 HX 370 65 W / 54 W | Radeon 890M ? / 2800 MHz | 64 GB | 57060 |
| CPU TDP ? | TDP 35 W | TDP 45 W | TDP 54 W | TDP 65 W |
|---|---|---|---|---|
| 96% | 94% | 97% | 100% | 76% |
| Model | CPU | GPU | RAM | Value |
|---|---|---|---|---|
| GMK EVO-X2 | Ryzen AI Max+ 395 140 W / 120 W | Radeon 8060S | 64 GB | 66187 |
| BOSGAME M5 | Ryzen AI Max+ 395 140 W / 120 W | Radeon 8060S 64 GB | 128 GB | 66840 |
| Minisforum MS-S1 Max | Ryzen AI Max+ 395 | Radeon 8060S 32 GB | 128 GB | 102029 |
| CPU TDP ? | TDP 35 W | TDP 45 W | TDP 54 W | TDP 65 W | TDP 120 W |
|---|---|---|---|---|---|
| 100% | 67% | 70% | 72% | 55% | 85% |
| CPU TDP ? | TDP 25 W | TDP 28 W | TDP 30 W | TDP 35 W | TDP 45 W | TDP 54 W | TDP 65 W | TDP 70 W | TDP 75 W | TDP 80 W |
|---|---|---|---|---|---|---|---|---|---|---|
| 100% | 100% | 100% | 100% | 100% | 100% | 100% | 100% | 100% | 100% | 100% |
| Model | CPU | GPU | RAM | Value |
|---|---|---|---|---|
| Framework Desktop Ryzen AI Max Chrome 82 | Ryzen AI Max+ 395 115 W / 100 W | Radeon 8060S 2900 / 1000 MHz 16 GB | 64 GB | 424 |
| Asus ROG Flow Z13 GZ302EA-RU073W Chrome 82 | Ryzen AI Max+ 395 86 W / 70 W | Radeon 8060S 80 W 2264 / 1000 MHz | 32 GB | 425 |
| BOSGAME M5 Chrome 82 | Ryzen AI Max+ 395 140 W / 120 W | Radeon 8060S 64 GB | 128 GB | 427 |
| Minisforum MS-S1 Max Chrome 82 | Ryzen AI Max+ 395 | Radeon 8060S 32 GB | 128 GB | 430 |
| GMK EVO-X2 Chrome 82 | Ryzen AI Max+ 395 140 W / 120 W | Radeon 8060S | 64 GB | 453 |
| CPU TDP ? | TDP 25 W | TDP 28 W | TDP 30 W | TDP 35 W | TDP 45 W | TDP 54 W | TDP 65 W | TDP 70 W | TDP 75 W | TDP 80 W | TDP 100 W | TDP 120 W |
|---|---|---|---|---|---|---|---|---|---|---|---|---|
| 100% | 100% | 100% | 100% | 100% | 100% | 100% | 100% | 100% | 100% | 100% | 100% | 100% |
| CPU TDP 28 W | TDP 65 W | TDP 70 W | TDP 75 W | TDP 80 W |
|---|---|---|---|---|
| 83% | 89% | 100% | 98% | 86% |
| Model | CPU | GPU | RAM | Value |
|---|---|---|---|---|
| Asus ROG Flow Z13 GZ302EA-RU073W | Ryzen AI Max+ 395 86 W / 70 W | Radeon 8060S 80 W 2264 / 1000 MHz | 32 GB | 123023 |
| CPU TDP 28 W | TDP 65 W | TDP 70 W | TDP 75 W | TDP 80 W |
|---|---|---|---|---|
| 84% | 90% | 100% | 99% | 87% |
| CPU TDP ? | TDP 25 W | TDP 28 W | TDP 30 W | TDP 35 W | TDP 45 W | TDP 54 W | TDP 65 W | TDP 70 W | TDP 75 W | TDP 80 W |
|---|---|---|---|---|---|---|---|---|---|---|
| 78% | 77% | 79% | 74% | 67% | 65% | 71% | 70% | 100% | 78% | 75% |
| Model | CPU | GPU | RAM | Value |
|---|---|---|---|---|
| GMK EVO-X2 Chrome 105.0.0.0 | Ryzen AI Max+ 395 140 W / 120 W | Radeon 8060S | 64 GB | 252 |
| BOSGAME M5 Chrome 105.0.0.0 | Ryzen AI Max+ 395 140 W / 120 W | Radeon 8060S 64 GB | 128 GB | 253 |
| Framework Desktop Ryzen AI Max Chrome 105.0.0.0 | Ryzen AI Max+ 395 115 W / 100 W | Radeon 8060S 2900 / 1000 MHz 16 GB | 64 GB | 273 |
| Minisforum MS-S1 Max Chrome 105.0.0.0 | Ryzen AI Max+ 395 | Radeon 8060S 32 GB | 128 GB | 276 |
| Asus ROG Flow Z13 GZ302EA-RU073W Chrome 105.0.0.0 | Ryzen AI Max+ 395 86 W / 70 W | Radeon 8060S 80 W 2264 / 1000 MHz | 32 GB | 317 |
| CPU TDP ? | TDP 25 W | TDP 28 W | TDP 30 W | TDP 35 W | TDP 45 W | TDP 54 W | TDP 65 W | TDP 70 W | TDP 75 W | TDP 80 W | TDP 100 W | TDP 120 W |
|---|---|---|---|---|---|---|---|---|---|---|---|---|
| 82% | 80% | 82% | 77% | 70% | 68% | 74% | 73% | 100% | 81% | 78% | 82% | 76% |
| CPU TDP ? | TDP 25 W | TDP 28 W | TDP 30 W | TDP 35 W | TDP 45 W | TDP 54 W | TDP 65 W | TDP 70 W | TDP 75 W | TDP 80 W |
|---|---|---|---|---|---|---|---|---|---|---|
| 86% | 92% | 94% | 90% | 75% | 76% | 86% | 85% | 100% | 91% | 88% |
| Model | CPU | GPU | RAM | Value |
|---|---|---|---|---|
| GMK EVO-X2 Chrome 82 | Ryzen AI Max+ 395 140 W / 120 W | Radeon 8060S | 64 GB | 302 |
| BOSGAME M5 Chrome 82 | Ryzen AI Max+ 395 140 W / 120 W | Radeon 8060S 64 GB | 128 GB | 317 |
| Minisforum MS-S1 Max Chrome 82 | Ryzen AI Max+ 395 | Radeon 8060S 32 GB | 128 GB | 320 |
| Framework Desktop Ryzen AI Max Chrome 82 | Ryzen AI Max+ 395 115 W / 100 W | Radeon 8060S 2900 / 1000 MHz 16 GB | 64 GB | 329 |
| Asus ROG Flow Z13 GZ302EA-RU073W Chrome 82 | Ryzen AI Max+ 395 86 W / 70 W | Radeon 8060S 80 W 2264 / 1000 MHz | 32 GB | 358 |
| CPU TDP ? | TDP 25 W | TDP 28 W | TDP 30 W | TDP 35 W | TDP 45 W | TDP 54 W | TDP 65 W | TDP 70 W | TDP 75 W | TDP 80 W | TDP 100 W | TDP 120 W |
|---|---|---|---|---|---|---|---|---|---|---|---|---|
| 87% | 91% | 93% | 89% | 74% | 75% | 85% | 84% | 100% | 90% | 88% | 93% | 87% |
| CPU TDP ? | TDP 25 W | TDP 28 W | TDP 30 W | TDP 35 W | TDP 45 W | TDP 54 W | TDP 65 W | TDP 70 W | TDP 80 W |
|---|---|---|---|---|---|---|---|---|---|
| 85% | 91% | 88% | 86% | 66% | 88% | 86% | 87% | 100% | 92% |
| Model | CPU | GPU | RAM | Value |
|---|---|---|---|---|
| GMK EVO-X2 | Ryzen AI Max+ 395 140 W / 120 W | Radeon 8060S | 64 GB | 1948 |
| Framework Desktop Ryzen AI Max | Ryzen AI Max+ 395 115 W / 100 W | Radeon 8060S 2900 / 1000 MHz 16 GB | 64 GB | 1956 |
| BOSGAME M5 | Ryzen AI Max+ 395 140 W / 120 W | Radeon 8060S 64 GB | 128 GB | 2069 |
| Minisforum MS-S1 Max | Ryzen AI Max+ 395 | Radeon 8060S 32 GB | 128 GB | 2198 |
| Asus ROG Flow Z13 GZ302EA-RU073W | Ryzen AI Max+ 395 86 W / 70 W | Radeon 8060S 80 W 2264 / 1000 MHz | 32 GB | 2274 |
| CPU TDP ? | TDP 25 W | TDP 28 W | TDP 30 W | TDP 35 W | TDP 45 W | TDP 54 W | TDP 65 W | TDP 70 W | TDP 80 W | TDP 100 W | TDP 120 W |
|---|---|---|---|---|---|---|---|---|---|---|---|
| 88% | 86% | 83% | 81% | 62% | 83% | 81% | 82% | 100% | 87% | 91% | 93% |
| CPU TDP ? | TDP 25 W | TDP 28 W | TDP 35 W | TDP 45 W | TDP 54 W | TDP 65 W | TDP 70 W | TDP 75 W | TDP 80 W |
|---|---|---|---|---|---|---|---|---|---|
| 107% | 116% | 116% | 115% | 112% | 111% | 106% | 106% | 105% | 100% |
| Model | CPU | GPU | RAM | Value |
|---|---|---|---|---|
| Asus ROG Flow Z13 GZ302EA-RU073W | Ryzen AI Max+ 395 86 W / 70 W | Radeon 8060S 80 W 2264 / 1000 MHz | 32 GB | 111.2 |
| Framework Desktop Ryzen AI Max | Ryzen AI Max+ 395 115 W / 100 W | Radeon 8060S 2900 / 1000 MHz 16 GB | 64 GB | 144.5 |
| Minisforum MS-S1 Max | Ryzen AI Max+ 395 | Radeon 8060S 32 GB | 128 GB | 169.9 |
| BOSGAME M5 | Ryzen AI Max+ 395 140 W / 120 W | Radeon 8060S 64 GB | 128 GB | 177.2 |
| GMK EVO-X2 | Ryzen AI Max+ 395 140 W / 120 W | Radeon 8060S | 64 GB | 184.7 |
| CPU TDP ? | TDP 25 W | TDP 28 W | TDP 35 W | TDP 45 W | TDP 54 W | TDP 65 W | TDP 70 W | TDP 75 W | TDP 80 W | TDP 100 W | TDP 120 W |
|---|---|---|---|---|---|---|---|---|---|---|---|
| 115% | 133% | 133% | 131% | 127% | 127% | 121% | 119% | 120% | 114% | 109% | 100% |
| CPU TDP ? | TDP 25 W | TDP 28 W | TDP 35 W | TDP 45 W | TDP 54 W | TDP 65 W | TDP 70 W | TDP 75 W | TDP 80 W |
|---|---|---|---|---|---|---|---|---|---|
| 114% | 120% | 118% | 117% | 114% | 111% | 106% | 103% | 100% | 102% |
| Model | CPU | GPU | RAM | Value |
|---|---|---|---|---|
| Asus ROG Flow Z13 GZ302EA-RU073W | Ryzen AI Max+ 395 86 W / 70 W | Radeon 8060S 80 W 2264 / 1000 MHz | 32 GB | 133.2 |
| Framework Desktop Ryzen AI Max | Ryzen AI Max+ 395 115 W / 100 W | Radeon 8060S 2900 / 1000 MHz 16 GB | 64 GB | 159.5 |
| BOSGAME M5 | Ryzen AI Max+ 395 140 W / 120 W | Radeon 8060S 64 GB | 128 GB | 192.8 |
| Minisforum MS-S1 Max | Ryzen AI Max+ 395 | Radeon 8060S 32 GB | 128 GB | 199.6 |
| GMK EVO-X2 | Ryzen AI Max+ 395 140 W / 120 W | Radeon 8060S | 64 GB | 200 |
| CPU TDP ? | TDP 25 W | TDP 28 W | TDP 35 W | TDP 45 W | TDP 54 W | TDP 65 W | TDP 70 W | TDP 75 W | TDP 80 W | TDP 100 W | TDP 120 W |
|---|---|---|---|---|---|---|---|---|---|---|---|
| 118% | 143% | 141% | 139% | 135% | 132% | 126% | 120% | 119% | 121% | 110% | 100% |
| CPU TDP ? | TDP 25 W | TDP 28 W | TDP 30 W | TDP 35 W | TDP 45 W | TDP 54 W | TDP 65 W | TDP 70 W | TDP 75 W | TDP 80 W |
|---|---|---|---|---|---|---|---|---|---|---|
| 100% | 105% | 104% | 103% | 106% | 105% | 104% | 101% | 102% | 103% | 101% |
| Model | CPU | GPU | RAM | Value |
|---|---|---|---|---|
| GMK EVO-X2 | Ryzen AI Max+ 395 140 W / 120 W | Radeon 8060S | 64 GB | 8.18 |
| Minisforum MS-S1 Max | Ryzen AI Max+ 395 | Radeon 8060S 32 GB | 128 GB | 8.3 |
| Framework Desktop Ryzen AI Max | Ryzen AI Max+ 395 115 W / 100 W | Radeon 8060S 2900 / 1000 MHz 16 GB | 64 GB | 10.5 |
| Asus ROG Flow Z13 GZ302EA-RU073W | Ryzen AI Max+ 395 86 W / 70 W | Radeon 8060S 80 W 2264 / 1000 MHz | 32 GB | 11.2 |
| BOSGAME M5 | Ryzen AI Max+ 395 140 W / 120 W | Radeon 8060S 64 GB | 128 GB | 11.5 |
| CPU TDP ? | TDP 25 W | TDP 28 W | TDP 30 W | TDP 35 W | TDP 45 W | TDP 54 W | TDP 65 W | TDP 70 W | TDP 75 W | TDP 80 W | TDP 100 W | TDP 120 W |
|---|---|---|---|---|---|---|---|---|---|---|---|---|
| 100% | 103% | 103% | 102% | 105% | 104% | 103% | 100% | 100% | 102% | 100% | 100% | 101% |
| CPU TDP ? | TDP 25 W | TDP 28 W | TDP 30 W | TDP 54 W | TDP 65 W | TDP 70 W | TDP 75 W | TDP 80 W |
|---|---|---|---|---|---|---|---|---|
| 101% | 105% | 104% | 102% | 104% | 103% | 103% | 100% | 102% |
| Model | CPU | GPU | RAM | Value |
|---|---|---|---|---|
| Asus ROG Flow Z13 GZ302EA-RU073W | Ryzen AI Max+ 395 86 W / 70 W | Radeon 8060S 80 W 2264 / 1000 MHz | 32 GB | 13.8 |
| CPU TDP ? | TDP 25 W | TDP 28 W | TDP 30 W | TDP 54 W | TDP 65 W | TDP 70 W | TDP 75 W | TDP 80 W |
|---|---|---|---|---|---|---|---|---|
| 101% | 105% | 104% | 102% | 104% | 103% | 101% | 100% | 102% |
| CPU TDP ? | TDP 25 W | TDP 28 W | TDP 35 W | TDP 45 W | TDP 54 W | TDP 65 W | TDP 70 W | TDP 75 W | TDP 80 W |
|---|---|---|---|---|---|---|---|---|---|
| 80% | 98% | 100% | 88% | 79% | 70% | 59% | 55% | 49% | 52% |
| Model | CPU | GPU | RAM | Value |
|---|---|---|---|---|
| GMK EVO-X2 | Ryzen AI Max+ 395 140 W / 120 W | Radeon 8060S | 64 GB | 27.9 |
| Minisforum MS-S1 Max | Ryzen AI Max+ 395 | Radeon 8060S 32 GB | 128 GB | 29.5 |
| BOSGAME M5 | Ryzen AI Max+ 395 140 W / 120 W | Radeon 8060S 64 GB | 128 GB | 29.7 |
| Framework Desktop Ryzen AI Max | Ryzen AI Max+ 395 115 W / 100 W | Radeon 8060S 2900 / 1000 MHz 16 GB | 64 GB | 33.6 |
| Asus ROG Flow Z13 GZ302EA-RU073W | Ryzen AI Max+ 395 86 W / 70 W | Radeon 8060S 80 W 2264 / 1000 MHz | 32 GB | 36.3 |
| CPU TDP ? | TDP 25 W | TDP 28 W | TDP 35 W | TDP 45 W | TDP 54 W | TDP 65 W | TDP 70 W | TDP 75 W | TDP 80 W | TDP 100 W | TDP 120 W |
|---|---|---|---|---|---|---|---|---|---|---|---|
| 67% | 98% | 100% | 88% | 79% | 70% | 59% | 60% | 49% | 52% | 61% | 52% |
Average Benchmarks AMD Ryzen AI 9 HX 370 → 100% n=54
Average Benchmarks AMD Ryzen AI Max+ 395 → 123% n=54
* Smaller numbers mean a higher performance
1 This benchmark is not used for the average calculation
#0 ran 0s before starting gpusingle class +0s ... 0s
#1 checking url part for id 17543 +0s ... 0s
#2 checking url part for id 18628 +0s ... 0s
#3 redirected to Ajax server, took 1766279098s time from redirect:0 +0s ... 0s
#4 did not recreate cache, as it is less than 5 days old! Created at Fri, 19 Dec 2025 14:52:30 +0100 +0s ... 0s
#5 composed specs +0.006s ... 0.006s
#6 did output specs +0s ... 0.007s
#7 getting avg benchmarks for device 17543 +0.006s ... 0.013s
#8 got single benchmarks 17543 +0.056s ... 0.069s
#9 getting avg benchmarks for device 18628 +0.005s ... 0.074s
#10 got single benchmarks 18628 +0.016s ... 0.09s
#11 got avg benchmarks for devices +0s ... 0.09s
#12 min, max, avg, median took s +0.083s ... 0.172s
#13 return log +0.002s ... 0.174s