


Crucial P5 Plus 1TB CT1000P5PSSD8 vs Intel Optane Memory H10 with Solid State Storage 32GB + 512GB HBRPEKNX0202A(L/H)
Crucial P5 Plus 1TB CT1000P5PSSD8
► remove from comparison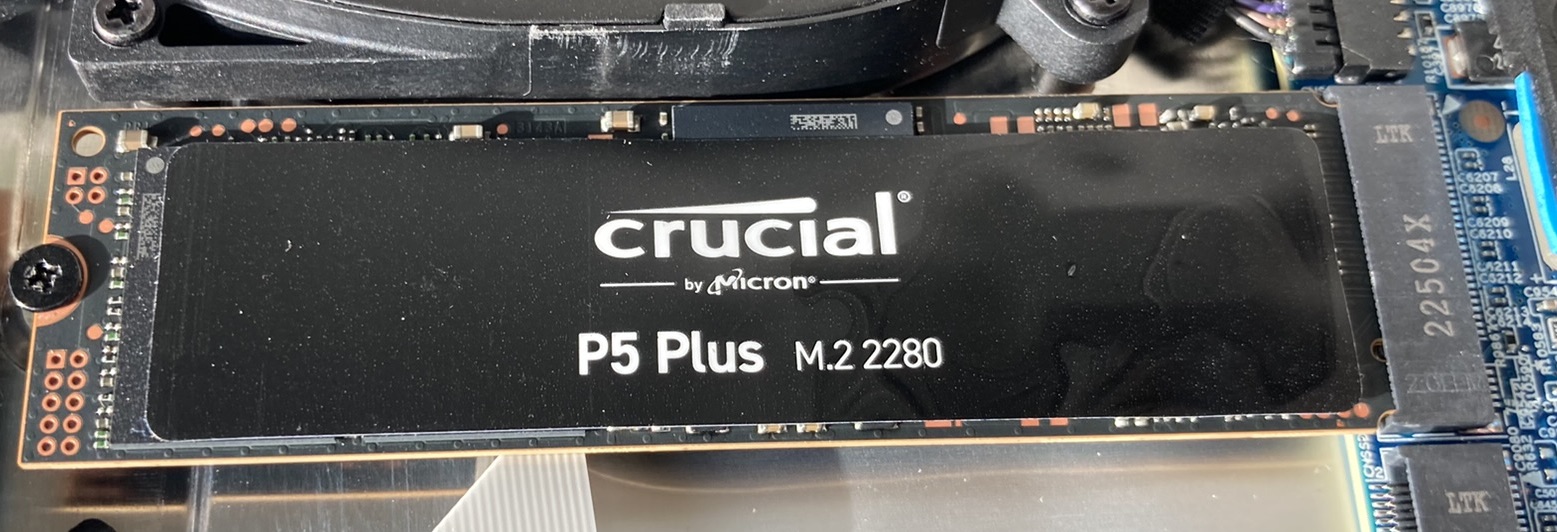
The Crucial P5 Plus 1TB CT1000P5PSSD8 is a fast NVMe SSD in the M.2 2280 form factor. It is certified to work with the Playstation 5 and uses Micron Advanced 3D NAND. The read speeds are specified with up to 6600 MB/s, writes at up to 5000 MB/s (both sequential).
Intel Optane Memory H10 with Solid State Storage 32GB + 512GB HBRPEKNX0202A(L/H)
► remove from comparison
The Intel Optane Memory H10 with Solid State Storage 32GB + 512GB (HBRPEKNX0202A, HBRPEKNX0202AL, HBRPEKNX0202AH) is an M.2 card with 32 GB 3d XPoint SLC (Optane) Cache and 512 GB QLC 3D-NAND. It is specified with 2300 MB/s read and 1300 MB/s write speeds and 320k / 250k IOPS (read / write). It uses the Intel SLL3D controller for the Optane cache and a Silicon Motion SM2264 controller for the SSD part.
| Crucial P5 Plus 1TB CT1000P5PSSD8 | Intel Optane Memory H10 with Solid State Storage 32GB + 512GB HBRPEKNX0202A(L/H) | |
| Type | SSD | SSD |
| Size | M.2 2280 | M.2 2280 |
| Capacity | 1024 GB | 512 GB |
| Interface | NVMe | NVMe |
| Announced | 23.03.2023 | 28.08.2019 |
Benchmarks
Performance Rating - DiskSpd - P5 Plus 1TB
41.3 pt (48%)
Seagate ST1000LM014 Solid State Hybrid Drive
...
Fikwot FN955
Kioxia KBG80ZNV1T02
Lexar NQ7A1
Kingston OM3PGP41024P-A0
BIWIN CE980Y28900-1TB
Crucial P5 Plus 1TB CT1000P5PSSD8
Kingston OM8PGP4512Q-A0
TeamGroup T-Create CLASSIC PCIe 4.0 DL
Samsung 9100 Pro 1 TB
Micron 3400 2TB MTFDKBA2T0TFH
...
Kingston Fury Renegade G5 4TB
0%
100%
Performance Rating - DiskSpd - Optane Memory H10 with Solid State Storage 32GB + 512GB
19.8 pt (23%)
Seagate ST1000LM014 Solid State Hybrid Drive
...
Micron 2550 1TB MTFDKCD1T0TGE
2x Intel SSD 660p 1TB SSDPEKNW010T8 (RAID 0)
Intel Optane Memory H10 with Solid State Storage 32GB + 512GB HBRPEKNX0202A(L/H)
256 GB UFS 4.0 Flash
Samsung SSD PM981a MZVLB256HBHQ
Rayson RS512GSSD510 512 GB PCIe 4.0 NVMe
2x Micron 2200S 512 GB (RAID 0)
Kioxia THGJFJT2T85BAT01
...
Kingston Fury Renegade G5 4TB
0%
100%
min: 294.8 avg: 722 median: 741.5 (12%) max: 1045 MB/s
min: 170.4 avg: 463.7 median: 460.8 (17%) max: 769 MB/s
min: 504 avg: 782 median: 801.5 (3%) max: 1173 MB/s

min: 910 avg: 1732 median: 1604.5 (10%) max: 2594 Points
min: 338 avg: 792 median: 798 (11%) max: 1117 Points
min: 389 avg: 627 median: 586 (9%) max: 975 Points
min: 0.044 avg: 0.1 median: 0 (0%) max: 0.249 ms
min: 0.065 avg: 0.1 median: 0.1 (0%) max: 0.23 ms
min: 270.2 avg: 644 median: 639 (11%) max: 948 MB/s
min: 276.2 avg: 459.2 median: 405.3 (8%) max: 789 MB/s
min: 17.96 avg: 105 median: 112.8 (22%) max: 129.66 MB/s
min: 19.99 avg: 61.9 median: 65.6 (21%) max: 76 MB/s
AS SSD - Sequential Write
100%
P5 Plus 1TB +min: 2496 avg: 3507 median: 3942.4 (35%) max: 4286.27 MB/s
min: 305 avg: 429.4 median: 362.8 (3%) max: 836 MB/s
AS SSD - Sequential Read
100%
P5 Plus 1TB +min: 3333.37 avg: 4055 median: 3889 (30%) max: 4887.18 MB/s
min: 769 avg: 1056 median: 1022 (8%) max: 1337 MB/s
CrystalDiskMark 3.0 - 4K QD32 Write
340.2 MB/s (32%)
CrystalDiskMark 3.0 - 4K QD32 Read
379.7 MB/s (29%)
CrystalDiskMark 3.0 - 4K Write
134.4 MB/s (4%)
CrystalDiskMark 3.0 - 4K Read
143.7 MB/s (2%)
CrystalDiskMark 3.0 - 512K Write
537 MB/s (6%)
CrystalDiskMark 3.0 - 512K Read
1117 MB/s (24%)
CrystalDiskMark 3.0 - Sequential Write
433.7 MB/s (4%)
CrystalDiskMark 3.0 - Sequential Read
1579 MB/s (18%)
min: 64.8 avg: 110.3 median: 104.9 (9%) max: 162.7 MB/s
min: 98 avg: 131.9 median: 131 (4%) max: 190.5 MB/s
min: 450.1 avg: 569 median: 509 (3%) max: 994 MB/s
min: 1223 avg: 1372 median: 1352 (14%) max: 1624 MB/s
min: 237.3 avg: 387.3 median: 362.4 (8%) max: 556 MB/s
min: 287.4 avg: 374.5 median: 364.9 (5%) max: 531 MB/s
min: 686 avg: 1141 median: 1224 (8%) max: 1320 MB/s
min: 2092 avg: 2439 median: 2489 (13%) max: 2738 MB/s
DiskSpd - DiskSpd 4k_q1t1_write
100%
P5 Plus 1TB +min: 119.3 avg: 218.3 median: 201 (46%) max: 366 MB/s
min: 64.8 avg: 107 median: 108.5 (25%) max: 128 MB/s
DiskSpd - DiskSpd 4k_q1t1_read
100%
P5 Plus 1TB +min: 49.8 avg: 63.7 median: 63.2 (18%) max: 87.3 MB/s
min: 79.9 avg: 120.4 median: 125 (36%) max: 149.1 MB/s
DiskSpd - DiskSpd 4k_q32t16_write
100%
P5 Plus 1TB +min: 601 avg: 2302 median: 2659 (39%) max: 2932 MB/s
min: 298 avg: 540 median: 418.5 (6%) max: 1043 MB/s
DiskSpd - DiskSpd 4k_q32t16_read
100%
P5 Plus 1TB +min: 1350 avg: 2446 median: 2835 (35%) max: 3228 MB/s
min: 415 avg: 824 median: 645.5 (8%) max: 1548 MB/s
min: 334.3 avg: 714 median: 703 (7%) max: 1197 MB/s
min: 1241 avg: 1356 median: 1366 (14%) max: 1506 MB/s
DiskSpd - DiskSpd seq_q8t1_write
100%
P5 Plus 1TB +min: 4562 avg: 4827 median: 4907 (34%) max: 5004 MB/s
min: 359.7 avg: 892 median: 1025 (7%) max: 1313 MB/s
DiskSpd - DiskSpd seq_q8t1_read
100%
P5 Plus 1TB +min: 5202 avg: 6318 median: 6551 (38%) max: 6677 MB/s
min: 1436 avg: 2184 median: 2123.5 (12%) max: 2926 MB/s
DiskSpd - DiskSpd Loop seq_q8t1_read
100%
P5 Plus 1TB +min: 5076 avg: 5967 median: 6442 (38%) max: 6581 MB/s
min: 1306 avg: 2008 median: 2013.5 (12%) max: 2849 MB/s
- Range of benchmark values for this graphics card
 - Average benchmark values for this graphics card
* Smaller numbers mean a higher performance
- Average benchmark values for this graphics card* Smaller numbers mean a higher performance
Average Benchmarks
Crucial P5 Plus 1TB CT1000P5PSSD8 → 100% n=31
Intel Optane Memory H10 with Solid State Storage 32GB + 512GB HBRPEKNX0202A(L/H) → 48% n=31
Average of the median scores above. 1 ... This benchmark is not used for the average calculation

- 159,99 € Stand 2026-11-20 01:58.Crucial P310 SSD 1TB M.2 2280 PCIe Gen4 NVMe, bis 7.100 MB/s, für Laptop, Desktop PC & Handheld Spielekonsolen, Interne Festplatte - CT1000P310SSD801
- 154,90 € Stand 2026-11-20 01:58.Samsung SSD 990, Interne M.2 NVMe SSD Festplatte, 1TB, PCIe 4.0 x4 | Datenspeicher, NVMe 2.0, Bis zu 7.150/6.450 MB/s Lese-/Schreibgeschwindigkeit, Für Arbeit, Gaming & Kreatives, MZ-V9V1T0BW
- 166,24 € Stand 2026-11-20 01:58.Crucial P510 SSD 1TB M.2 NVMe PCIe 5.0 x4 Gen5, bis zu 11.000 MB/s Lesen, 9.500 MB/s Schreiben, für Laptop und Desktop PC, TLC NAND, Interne Festplatte - CT1000P510SSD8-01
- 162,60 € Stand 2026-11-20 01:58.Crucial E100 1TB M.2 PCIe Gen4 NVMe Interne SSD, bis 5.000 MB/s, Laptop und Desktop kompatibel - CT1000E100SSD8
- 213,90 € Stand 2026-11-20 01:58.Samsung 9100 PRO NVMe M.2 SSD, 1 TB, MZ-VAP1T0BW | PCIe 5.0, 14.700 MB/s Lesen, 13.300 MB/s Schreiben, Interne Festplatte für Gaming, Videobearbeitung und AI PCs
v1.35
 Add as a preferred source on Google


