

Intel HD Graphics 510 vs NVIDIA Quadro FX 1600M
Intel HD Graphics 510
► remove from comparison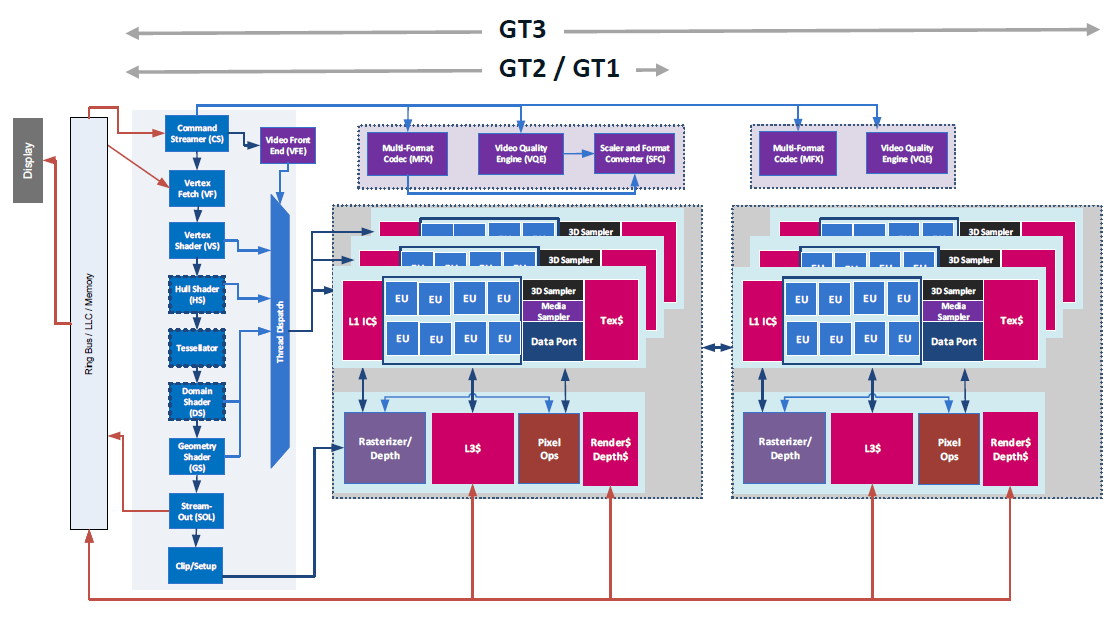
The Intel HD Graphics 510 (GT1) is an integrated graphics unit, which can be found in low-end ULV (Ultra Low Voltage) processors of the Skylake generation. This "GT1" version of the Skylake GPU offers 12 Execution Units (EUs) clocked at up to 950 MHz (depending on the CPU model). Due to its lack of dedicated graphics memory or eDRAM cache, the HD 510 has to access the main memory (2x 64bit DDR3L-1600 / DDR4-2133).
Performance
Depending on various factors like memory configuration, the HD Graphics 510 should perform sligthly below the older HD Graphics 4400 and will handle modern games (as of 2015) only in lowest settings (if it does at all).
Features
The revised video engine now decodes H.265/HEVC completely in hardware and thereby much more efficiently than before. Displays can be connected via DP 1.2 / eDP 1.3 (max. 3840 x 2160 @ 60 Hz), whereas HDMI is limited to the older version 1.4a (max. 3840 x 2160 @ 30 Hz). However, HDMI 2.0 can be added using a DisplayPort converter. Up to three displays can be controlled simultaneously.
Power Consumption
The HD Graphics 510 can be found in mobile processors specified at 15 W TDP and is therefore suited for compact laptops and ultrabooks.
NVIDIA Quadro FX 1600M
► remove from comparisonThis is a highend workstation graphic chip (for CAD and 3D programs optimized) with DirectX 10 and good OpenGL support - probably based on the GeForce 8700M GT graphic card. It is intended for digital content creators, engineers, earthscientists and other professional 3D applications. Certified drivers grant thecorrect and faster (compared to 8700M) representation of professional programs (CAD, CCD, visualisation software).
| Intel HD Graphics 510 | NVIDIA Quadro FX 1600M | |||||||||||||||||||||||||||||||||||||||||||||||||||||||||||||||||||||||||||||||||||||||||||||||||
| Quadro FX Series |
|
| ||||||||||||||||||||||||||||||||||||||||||||||||||||||||||||||||||||||||||||||||||||||||||||||||
| Codename | Skylake GT1 | NB8P-GLM | ||||||||||||||||||||||||||||||||||||||||||||||||||||||||||||||||||||||||||||||||||||||||||||||||
| Architecture | Gen. 9 Skylake | G8x | ||||||||||||||||||||||||||||||||||||||||||||||||||||||||||||||||||||||||||||||||||||||||||||||||
| Pipelines | 12 - unified | 32 - unified | ||||||||||||||||||||||||||||||||||||||||||||||||||||||||||||||||||||||||||||||||||||||||||||||||
| Core Speed | 300 - 950 (Boost) MHz | 625 MHz | ||||||||||||||||||||||||||||||||||||||||||||||||||||||||||||||||||||||||||||||||||||||||||||||||
| Memory Bus Width | 64/128 Bit | 128 Bit | ||||||||||||||||||||||||||||||||||||||||||||||||||||||||||||||||||||||||||||||||||||||||||||||||
| Memory Type | DDR3/DDR4 | GDDR3 | ||||||||||||||||||||||||||||||||||||||||||||||||||||||||||||||||||||||||||||||||||||||||||||||||
| Shared Memory | yes | no | ||||||||||||||||||||||||||||||||||||||||||||||||||||||||||||||||||||||||||||||||||||||||||||||||
| API | DirectX 12_1, OpenGL 4.4 | DirectX 10, Shader 4.0 | ||||||||||||||||||||||||||||||||||||||||||||||||||||||||||||||||||||||||||||||||||||||||||||||||
| technology | 14 nm | 80 nm | ||||||||||||||||||||||||||||||||||||||||||||||||||||||||||||||||||||||||||||||||||||||||||||||||
| Features | QuickSync | PureVideo, video scaling, LCDs with 1920x1200 pixel, PCI-Express, connection for ext. graphic card | ||||||||||||||||||||||||||||||||||||||||||||||||||||||||||||||||||||||||||||||||||||||||||||||||
| Date of Announcement | 01.09.2015 | 01.06.2007 | ||||||||||||||||||||||||||||||||||||||||||||||||||||||||||||||||||||||||||||||||||||||||||||||||
| Shader Speed | 1250 MHz | |||||||||||||||||||||||||||||||||||||||||||||||||||||||||||||||||||||||||||||||||||||||||||||||||
| Memory Speed | 800 MHz | |||||||||||||||||||||||||||||||||||||||||||||||||||||||||||||||||||||||||||||||||||||||||||||||||
| Max. Amount of Memory | 512 MB | |||||||||||||||||||||||||||||||||||||||||||||||||||||||||||||||||||||||||||||||||||||||||||||||||
| Power Consumption | 50 Watt | |||||||||||||||||||||||||||||||||||||||||||||||||||||||||||||||||||||||||||||||||||||||||||||||||
| Transistors | 289 Million | |||||||||||||||||||||||||||||||||||||||||||||||||||||||||||||||||||||||||||||||||||||||||||||||||
| Notebook Size | large | |||||||||||||||||||||||||||||||||||||||||||||||||||||||||||||||||||||||||||||||||||||||||||||||||
| Information | CG shading language, 32 bit floating point precision, 12 bit subpixel precision, 128 bit precision of the graphic pipeline, vertex and pixelshader programmability, PCI-E inferface, FSAA with turned grid, nView multidisplay support, high-precision dynamic-range (HPDR) technology, hardware 3D clipping, full screen antialiasing | |||||||||||||||||||||||||||||||||||||||||||||||||||||||||||||||||||||||||||||||||||||||||||||||||
| Link to Manufacturer Page | www.nvidia.com |
| |||||||||||||||||
Benchmarks
3DM Vant. Perf. total + Intel HD Graphics 510
Cinebench R15 OpenGL 64 Bit + Intel HD Graphics 510
GFXBench T-Rex HD Offscreen C24Z16 + Intel HD Graphics 510
Average Benchmarks Intel HD Graphics 510 → 100% n=2
Average Benchmarks NVIDIA Quadro FX 1600M → 67% n=2
* Smaller numbers mean a higher performance
1 This benchmark is not used for the average calculation
Game Benchmarks
The following benchmarks stem from our benchmarks of review laptops. The performance depends on the used graphics memory, clock rate, processor, system settings, drivers, and operating systems. So the results don't have to be representative for all laptops with this GPU. For detailed information on the benchmark results, click on the fps number.

Resident Evil 7
2017
Titanfall 2
2016Farming Simulator 17
2016
Civilization 6
2016
The Division
2016

Rainbow Six Siege
2015

World of Warships
2015
Metal Gear Solid V
2015Dota 2 Reborn
2015
Dirt Rally
2015

Battlefield Hardline
2015


GRID: Autosport
2014
Battlefield 4
2013BioShock Infinite
2013
Tomb Raider
2013
Crysis - GPU Benchmark
2007
Crysis - CPU Benchmark
2007
World in Conflict - Benchmark
2007
F.E.A.R.
2005
Doom 3
2004
Quake 3 Arena - Timedemo
1999Average Gaming Intel HD Graphics 510 → 100%
Average Gaming 30-70 fps → 100%
| Intel HD Graphics 510 | NVIDIA Quadro FX 1600M | |||||||||||||
|---|---|---|---|---|---|---|---|---|---|---|---|---|---|---|
| low | med. | high | ultra | QHD | 4K | low | med. | high | ultra | QHD | 4K | |||
| Resident Evil 7 | 18.3 | |||||||||||||
| Titanfall 2 | 19.9 | 15.4 | ||||||||||||
| Farming Simulator 17 | 70.6 | 41.3 | ||||||||||||
| Civilization 6 | 24.5 | 9.4 | ||||||||||||
| The Division | 13.4 | 7.7 | ||||||||||||
| Rise of the Tomb Raider | 11.1 | 7 | ||||||||||||
| Rainbow Six Siege | 25 | 15.9 | ||||||||||||
| Anno 2205 | 19.9 | 11 | ||||||||||||
| World of Warships | 48.7 | 29.2 | ||||||||||||
| Metal Gear Solid V | 38.9 | 25.2 | ||||||||||||
| Dota 2 Reborn | 66.2 | 41.8 | ||||||||||||
| Dirt Rally | 110.4 | 19.3 | ||||||||||||
| GTA V | 30.9 | 26.8 | ||||||||||||
| Battlefield Hardline | 31.5 | 22.2 | ||||||||||||
| F1 2014 | 72 | 47 | ||||||||||||
| Sims 4 | 173.7 | 32.2 | ||||||||||||
| GRID: Autosport | 135.5 | 32.8 | ||||||||||||
| Battlefield 4 | 33.4 | 22.5 | 15.9 | |||||||||||
| BioShock Infinite | 39 | 20.1 | 17.7 | |||||||||||
| Tomb Raider | 52.7 | 23.9 | 16.2 | |||||||||||
| Intel HD Graphics 510 | NVIDIA Quadro FX 1600M | |||||||||||||
| low | med. | high | ultra | QHD | 4K | low | med. | high | ultra | QHD | 4K | < 30 fps < 60 fps < 120 fps ≥ 120 fps | 7 7 4 2 | 14 5 | 3 | | | | < 30 fps < 60 fps < 120 fps ≥ 120 fps | | | | | | |
For more games that might be playable and a list of all games and graphics cards visit our Gaming List