Notebookcheck Logo
Teaser

For bargain hunters? Asus TUF Gaming 16 laptop with RTX 5050 review

A well-rounded package.

Finding a suitable gaming laptop is particularly difficult right now for anyone on a tight budget. The Asus TUF Gaming 16 is one of the more affordable options and delivers solid performance. Read our review to find out how it fares in other areas and against the competition.
Florian Glaser, 👁 Florian Glaser, ✓ Brian Burriston (translated by DeepL / Ninh Duy) Published 🇩🇪
Intel Raptor Lake Nvidia Geforce Gaming Laptop

Verdict

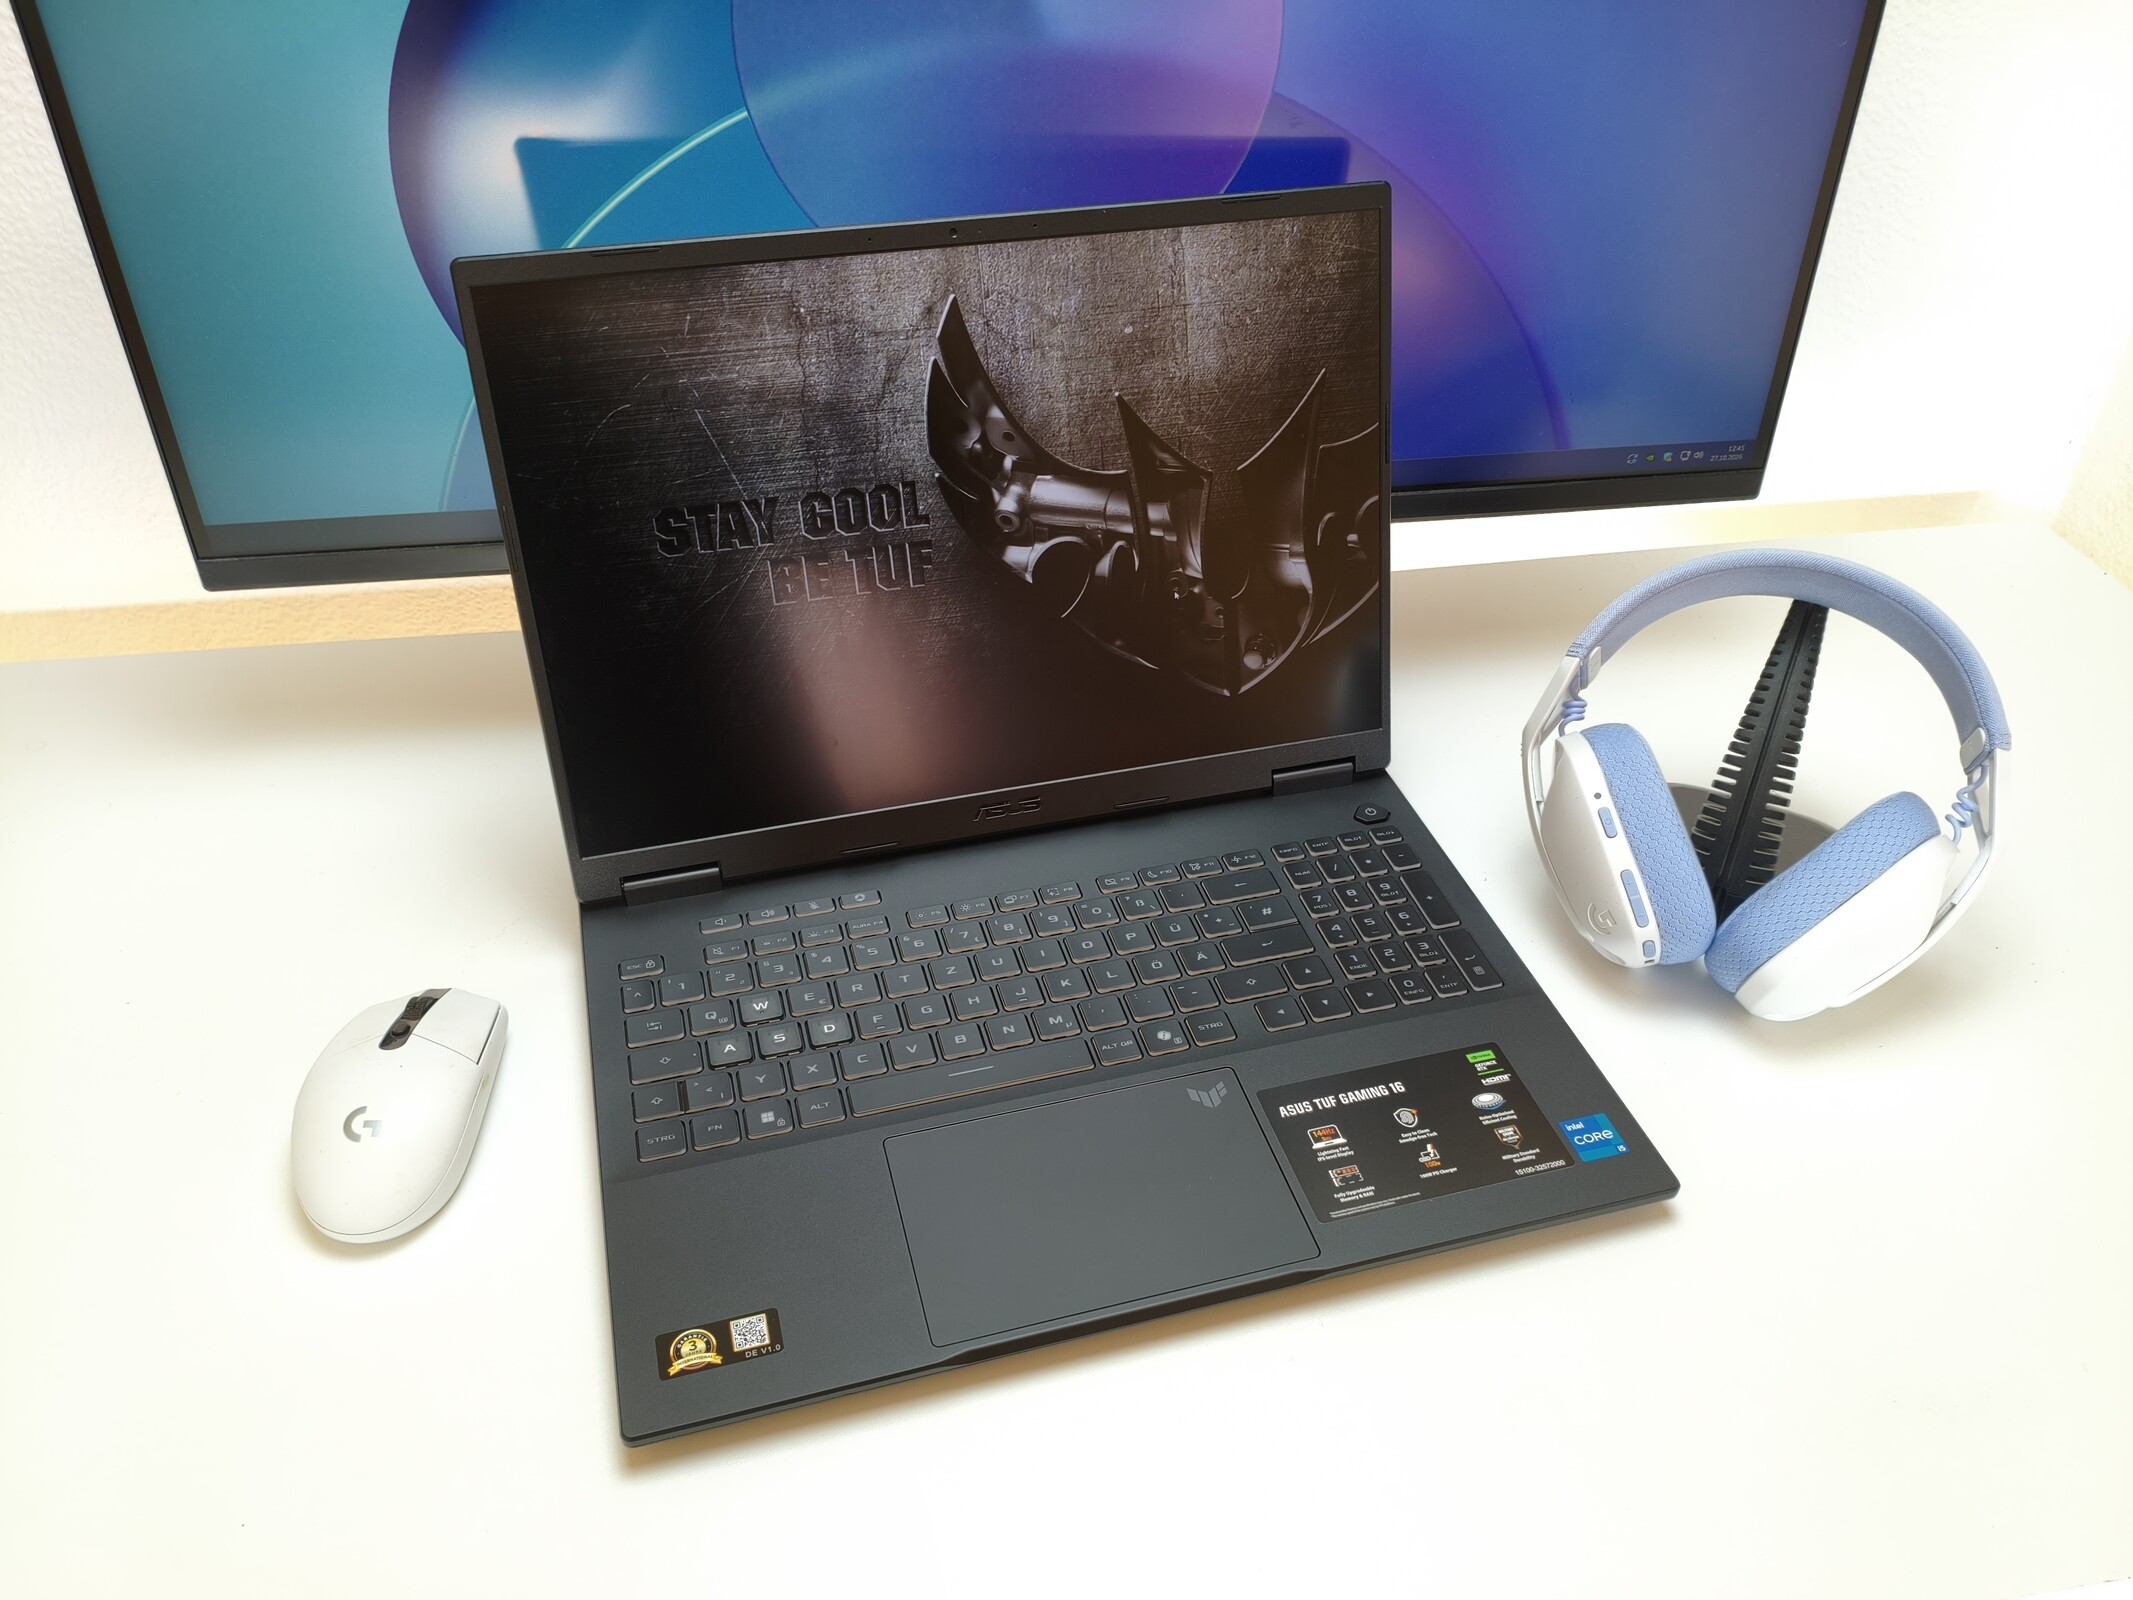
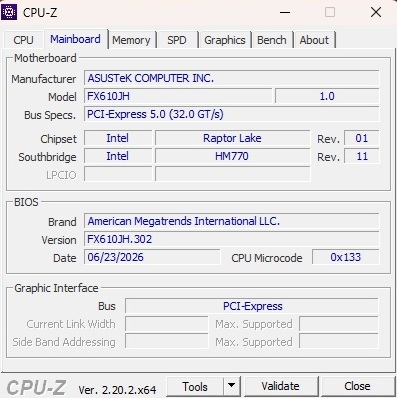
With the TUF Gaming 16, Asus offers an entry point into the world of mobile gaming. Alongside a decent Intel processor from the Raptor Lake generation (Core i5-14450HX), our review unit, bearing the FX610JH suffix, also comes with 16 GB of RAM and a 512 GB NVMe SSD. Nvidia's GeForce RTX 5050 with 8 GB of VRAM handles demanding graphics tasks. This chip sits roughly in the lower midrange of dedicated GPUs. For the display, the manufacturer uses a 144 Hz IPS panel, which we will also examine more closely later.

The 16-inch laptop delivers an unremarkable showing in most categories: neither poor nor particularly impressive, but generally solid to good. Positive features include the two RAM slots and two M.2 slots, which allow or facilitate future upgrades. Areas where Asus could improve include the webcam resolution and wireless module speed. Overall, the TUF Gaming 16 earns a rating in the same range as RTX 5050 competitors such as the Acer Nitro V 16 AI, MSI Cyborg 15, and HP Victus 15, although the Asus device manages to secure a slight lead.

Pros

+ two RAM slots and two SSD slots
+ moderate emissions
+ decent display

Cons

- Wi-Fi could be faster
- no card reader
- poor webcam

Price and availability

The review configuration is currently available starting at around €1,200 (~$1340, for example, from Playox).

Amazon Logo
  • $1,899.99 price as of 2026-11-09 07:42 UTC.
    ASUS TUF F16 (2025) Gaming Laptop, 16" 165Hz FHD+ Display, 115W Max TGP RTX 5060, Intel Core i7-14650HX, 32GB DDR5, 1TB SSD, Intelligent Cooling, Win11 Home - with 1TB External HDD
  • $1,050.25 price as of 2026-11-09 07:42 UTC.
    ASUS TUF Gaming F16 (2025) Gaming Laptop, 16” FHD+ 165Hz 16:10 Display, Intel® Core™ i5 Processor 13450HX, NVIDIA® GeForce RTX™ 5050, 16GB DDR5, 512GB PCIe Gen4 SSD, Wi-Fi 6E, Win 11 Home
  • $1,759.95 price as of 2026-11-09 07:42 UTC.
    ASUS TUF Gaming F16 Laptop 16" WUXGA IPS 165Hz (100% sRGB, GSYNC) Intel 16-core i7-14650HX 32GB DDR5 1TB SSD GeForce RTX 5060 (Up to 572 AI Tops) RGB Backlit Thunderbolt Hi-Res Wi-Fi6E Win11 ICP Acc

Specifications

Asus TUF Gaming 16 FX610J
Processor
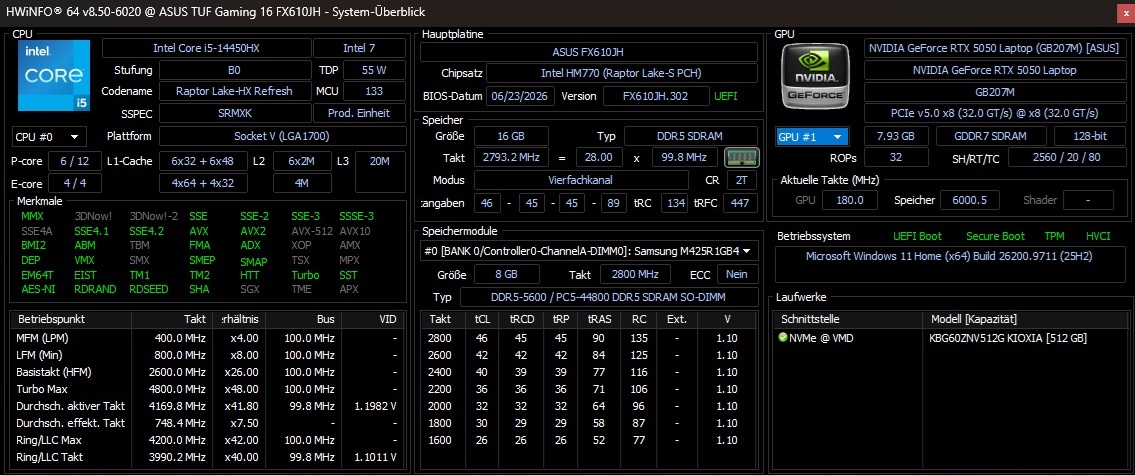
Intel Core i5-14450HX 10c/16t, 6 x 4.8 GHz Intel Raptor Cove P-Core, 4 x 3.5 GHz Intel Gracemont E-Core, 65 W PL2 / Short Burst, 65 W PL1 / Sustained, Raptor Lake-HX Refresh
Graphics adapter
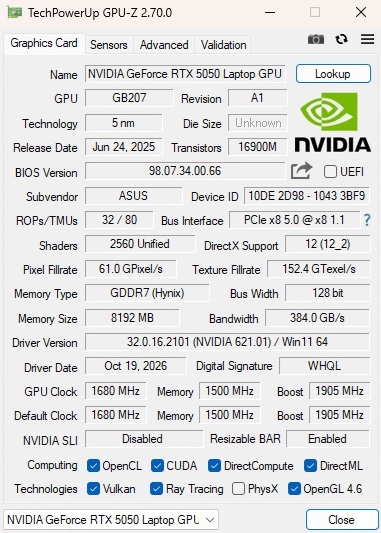
NVIDIA GeForce RTX 5050 Laptop - 8 GB VRAM, Core: 1905 MHz, RAM: 1500 MHz, 85 W TDP ( including 15 W Dynamic Boost), GDDR7, ForceWare 621.01, Optimus
Memory
16 GB 
, 2x 8 GB SO-DIMM DDR5-5600, two slots (both in use)
Display
16.00 inch 16:10, 1920 x 1200 pixel 142 PPI, NE160WU1-MY2, IPS, glossy: no, 144 Hz
Mainboard
Intel HM770 (Raptor Lake-S PCH)
Storage
Kioxia BG6 KBG60ZNS512G, 512 GB 
, NVMe-SSD, two M.2 2280 slots (one empty)
Soundcard
Intel Raptor Point-S PCH - HD Audio (Audio, Voice, Speech)
Connections
1 USB 2.0, 2 USB 3.0 / 3.1 Gen1, 1 USB 3.1 Gen2, USB-C Power Delivery (PD), 1 HDMI, Audio Connections: Line-In/Out
Networking
Realtek PCIe GBE Family Controller (10/100/1000MBit/s), MediaTek Wi-Fi 6 MT7920 Wireless LAN Card (), Bluetooth 5.4
Size
height x width x depth (in mm): 27 x 357 x 259 ( = 1.06 x 14.06 x 10.2 in)
Battery
63 Wh Lithium-Ion, 4 Cells
Operating System
Microsoft Windows 11 Home
Camera
Webcam: HD 720p
Primary Camera: 0.9 MPix
Additional features
Speakers: 2x 2W, Keyboard: Chiclet RGB, Keyboard Light: yes, 150 W Power Supply, Armoury Crate, 36 Months Warranty
Weight
2.15 kg ( = 75.84 oz / 4.74 pounds), Power Supply: 482 g ( = 17 oz / 1.06 pounds)
Price
1200 EUR
Note: The manufacturer may use components from different suppliers including display panels, drives or memory sticks with similar specifications.


Case, connectivity, and input devices

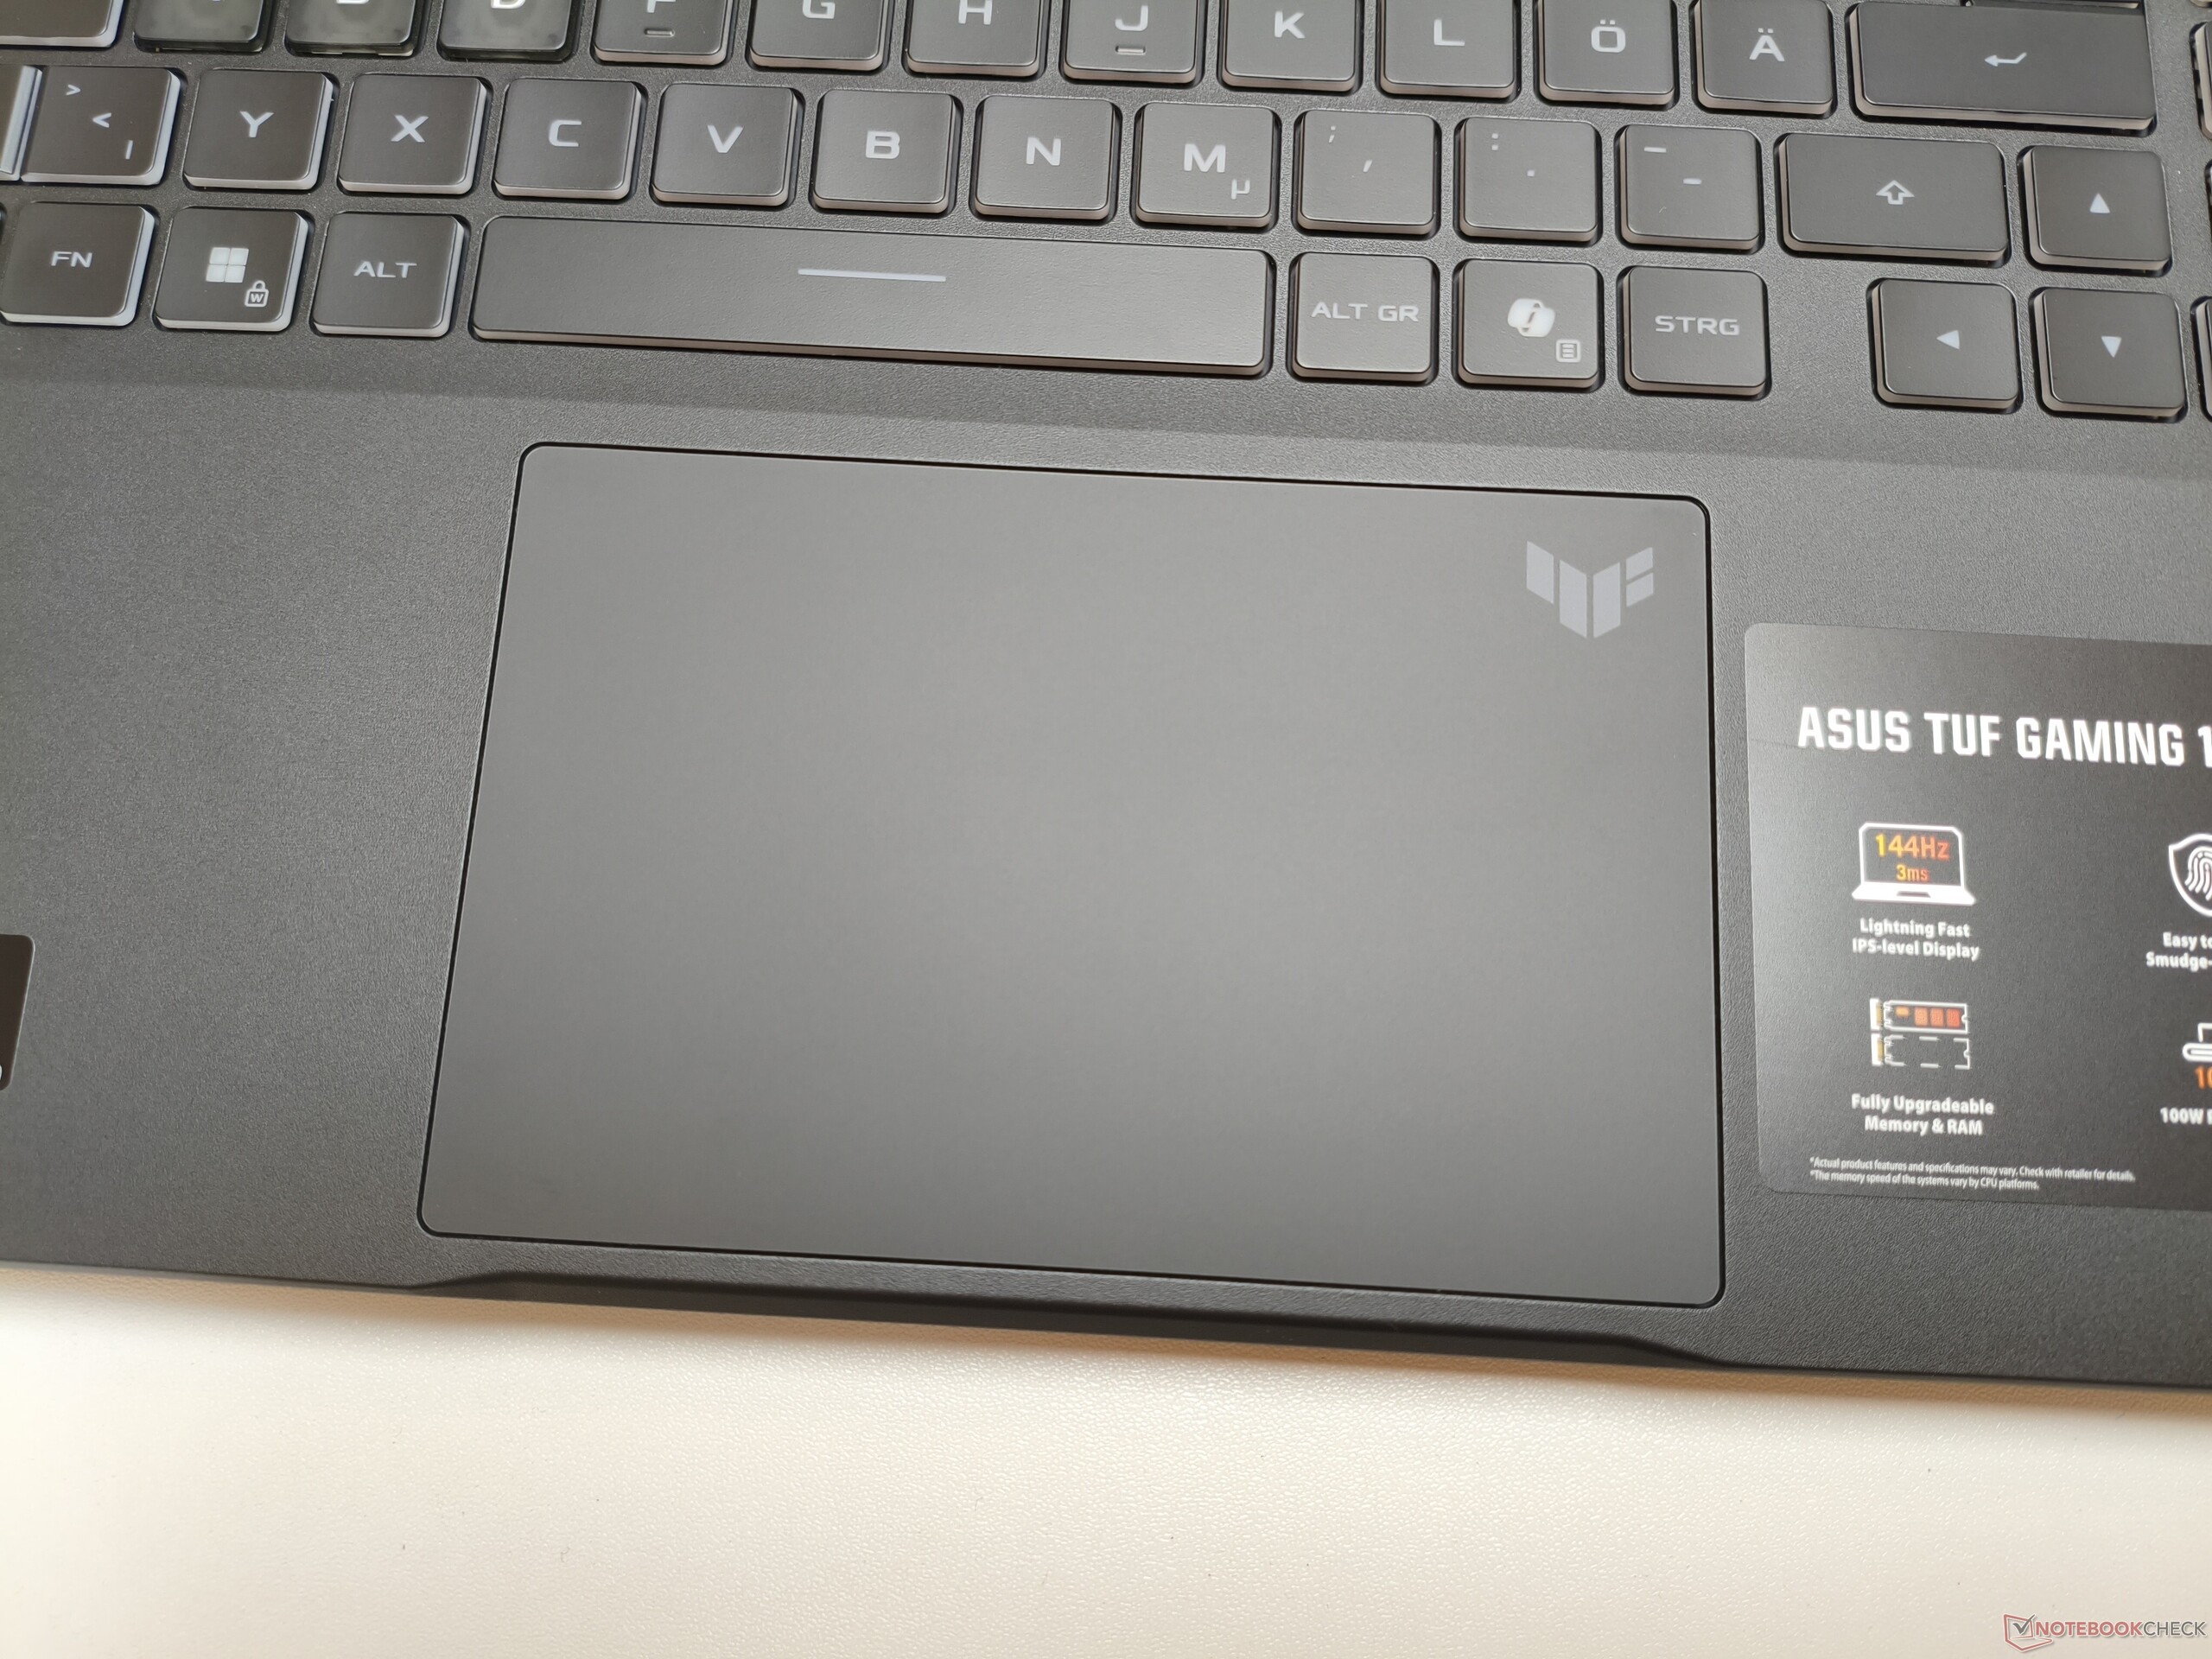
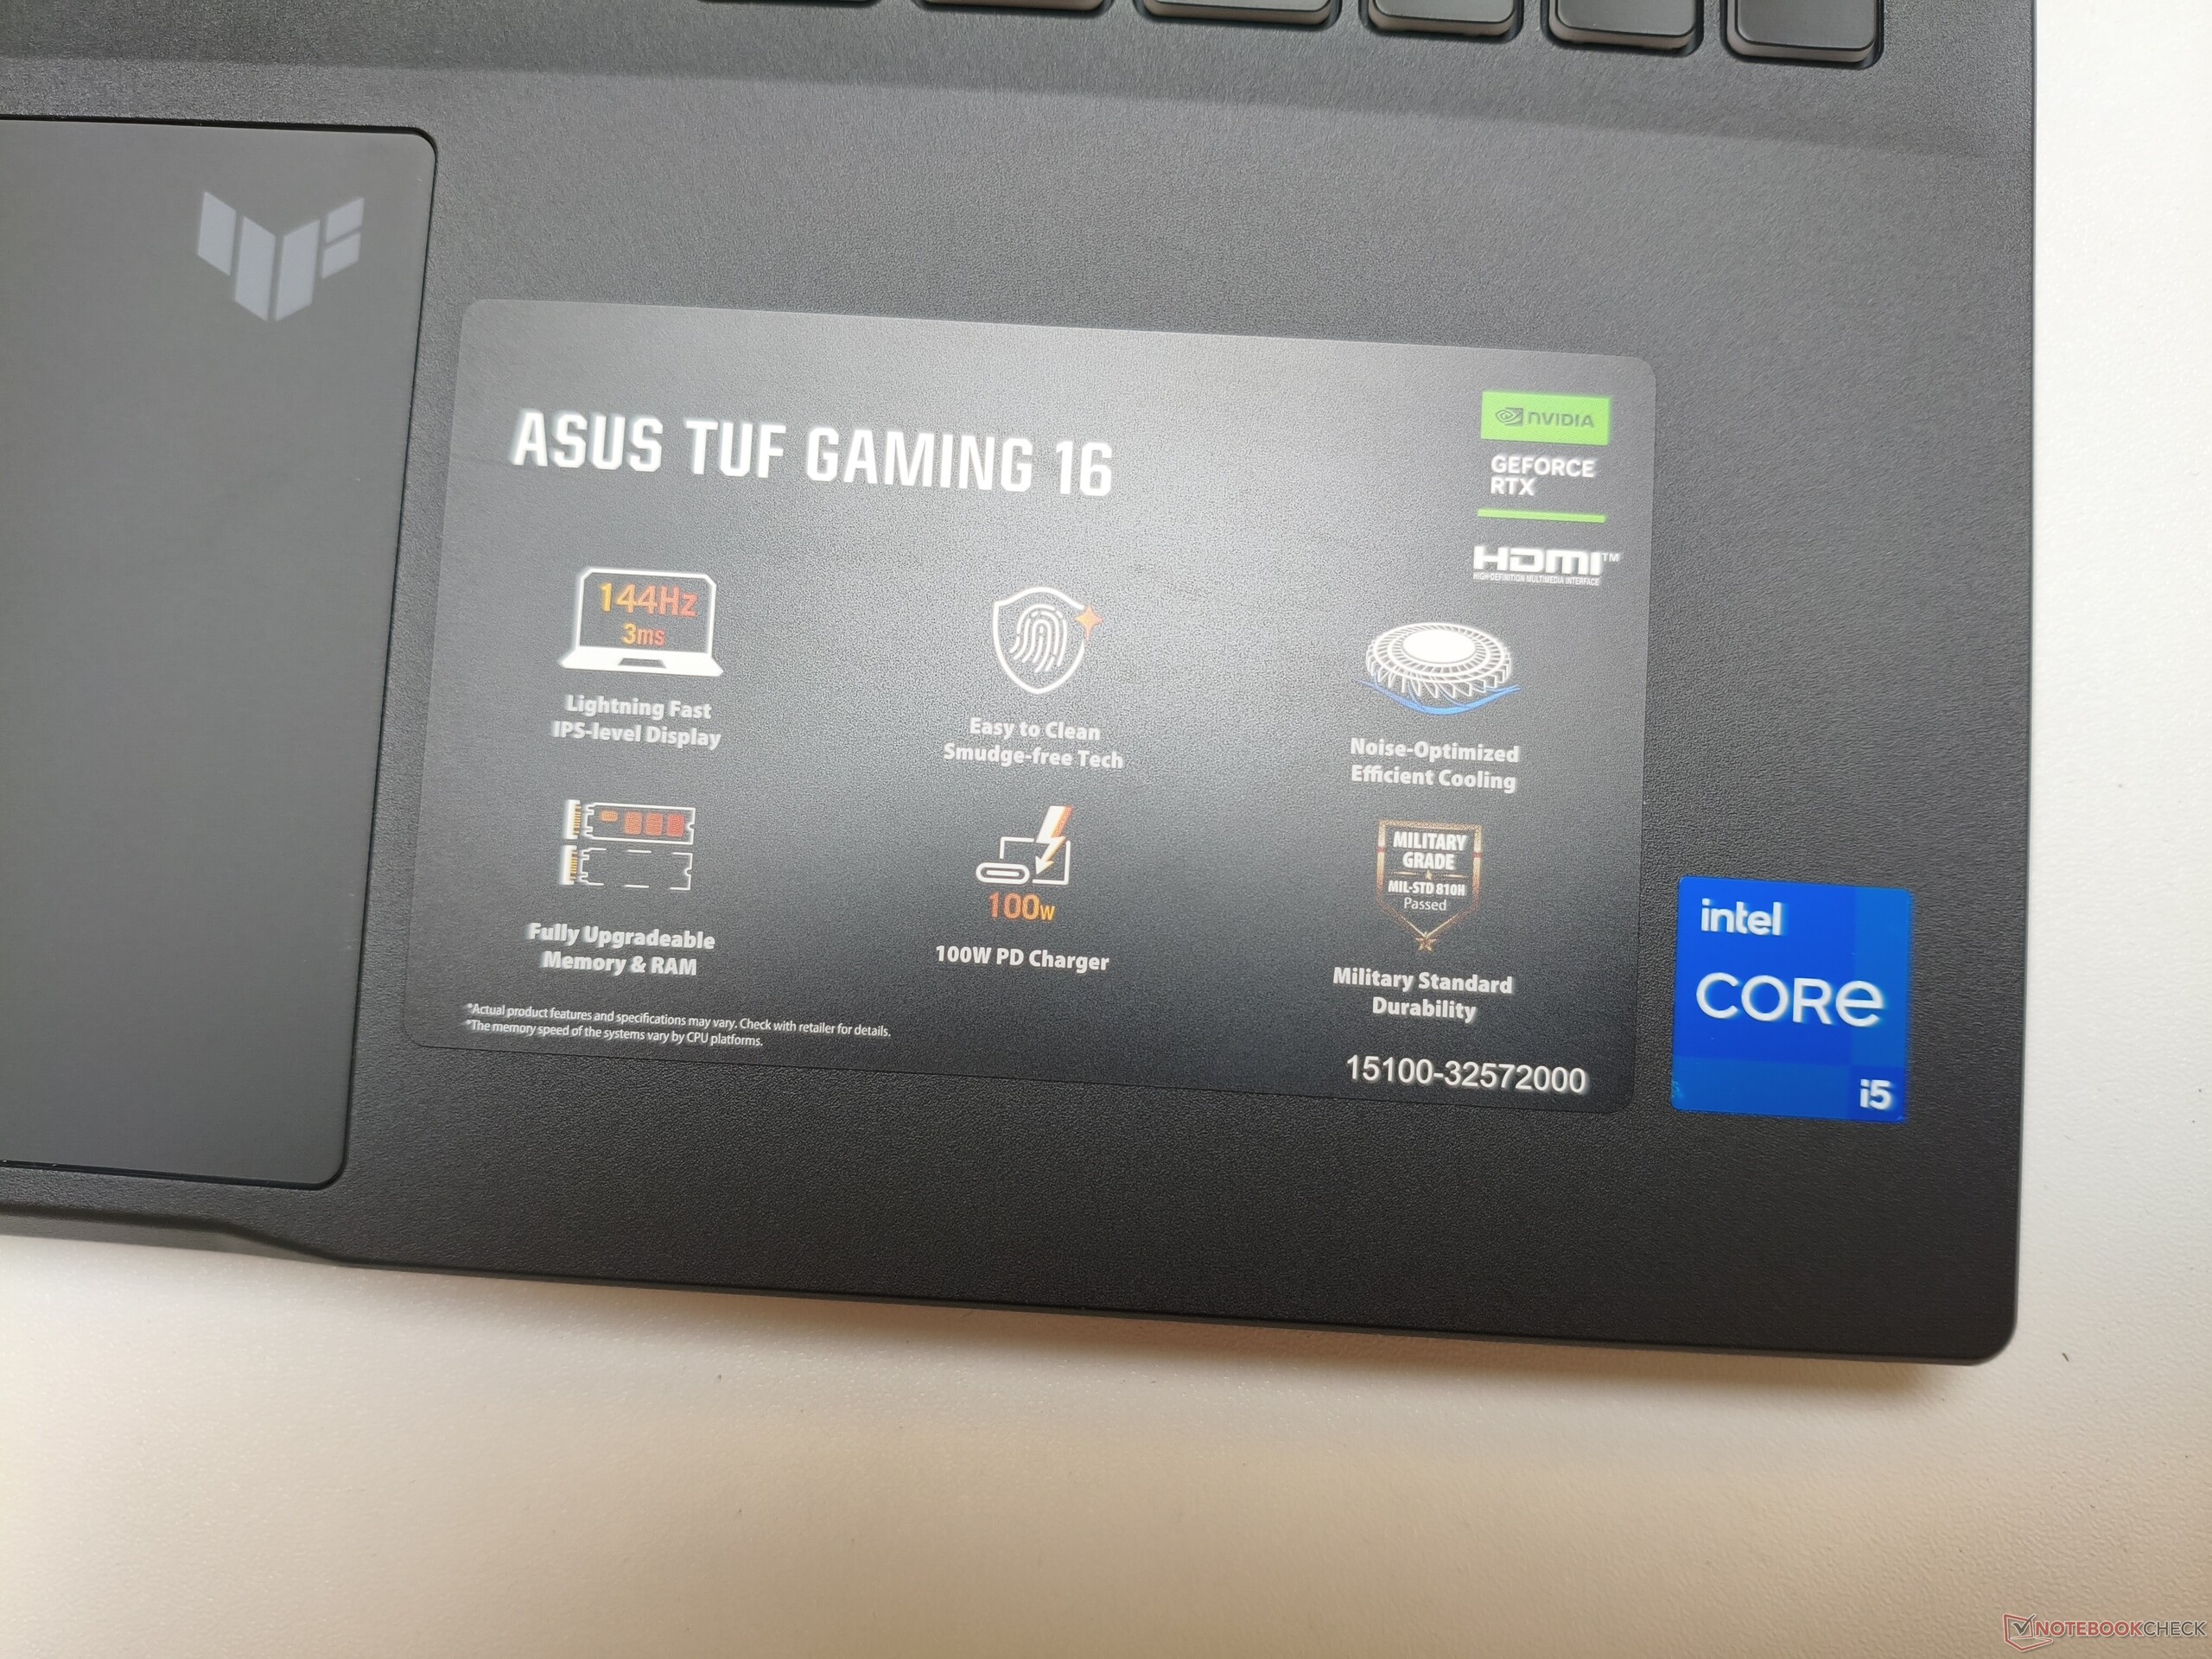
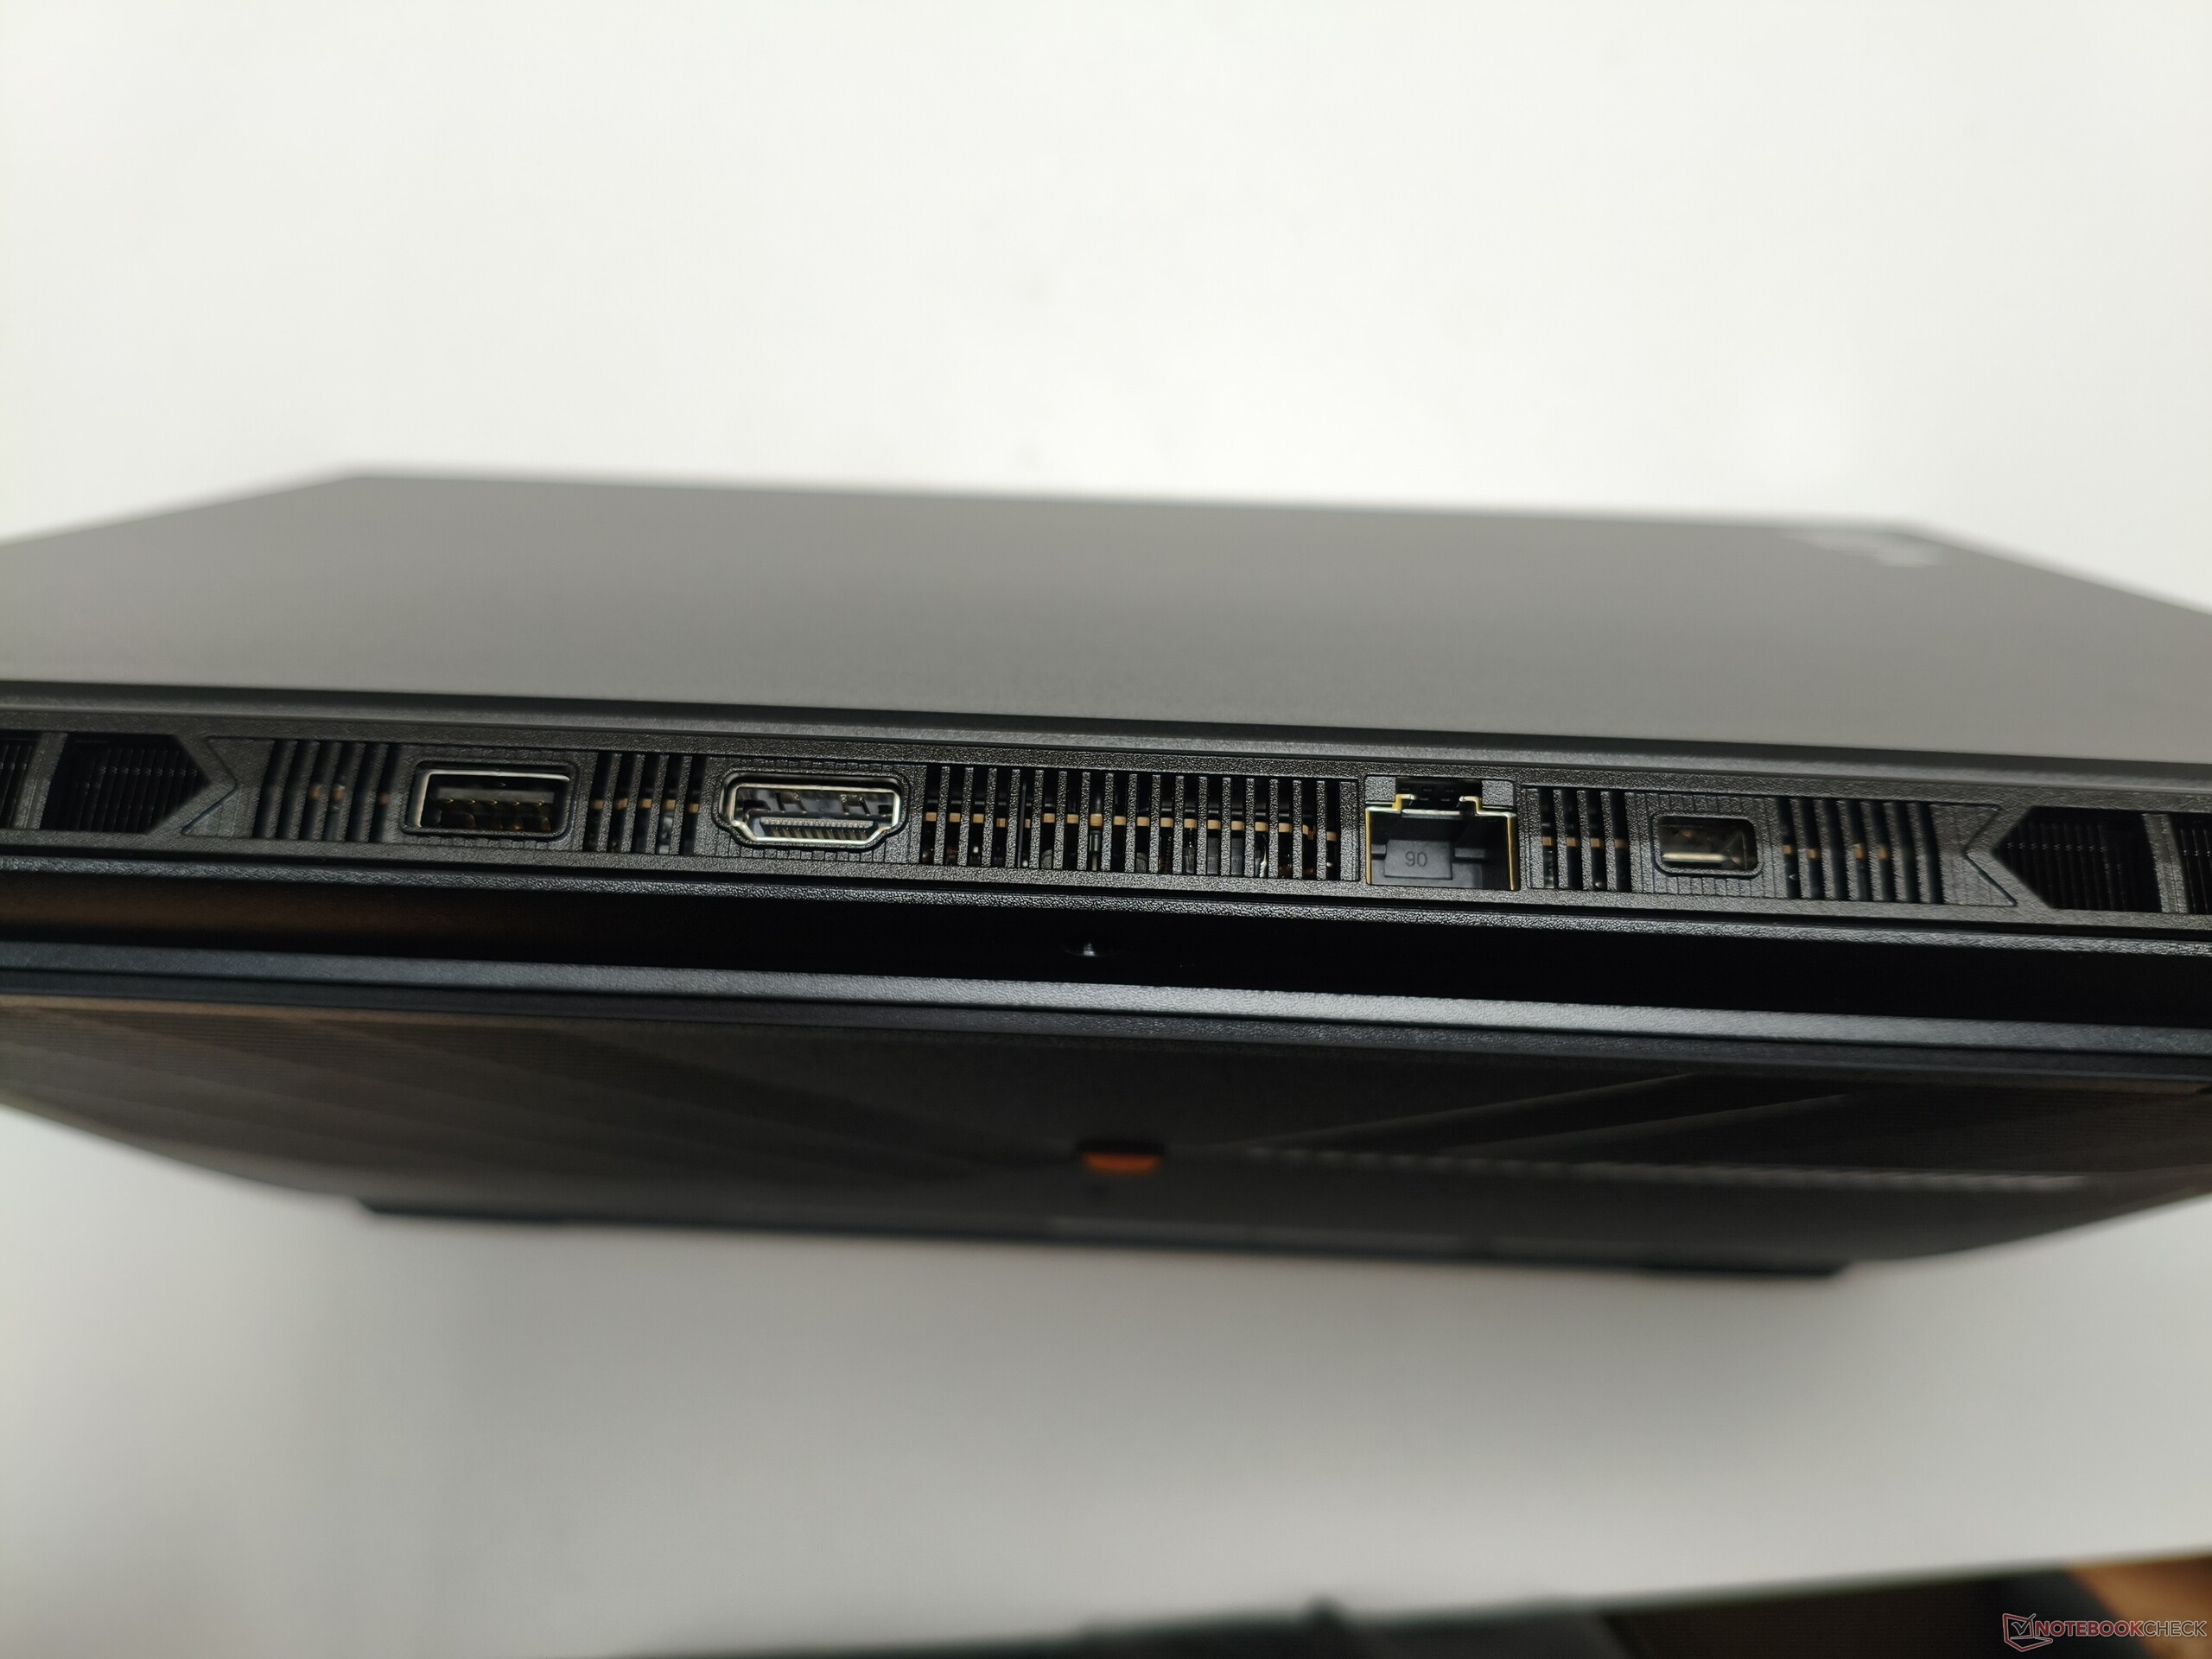
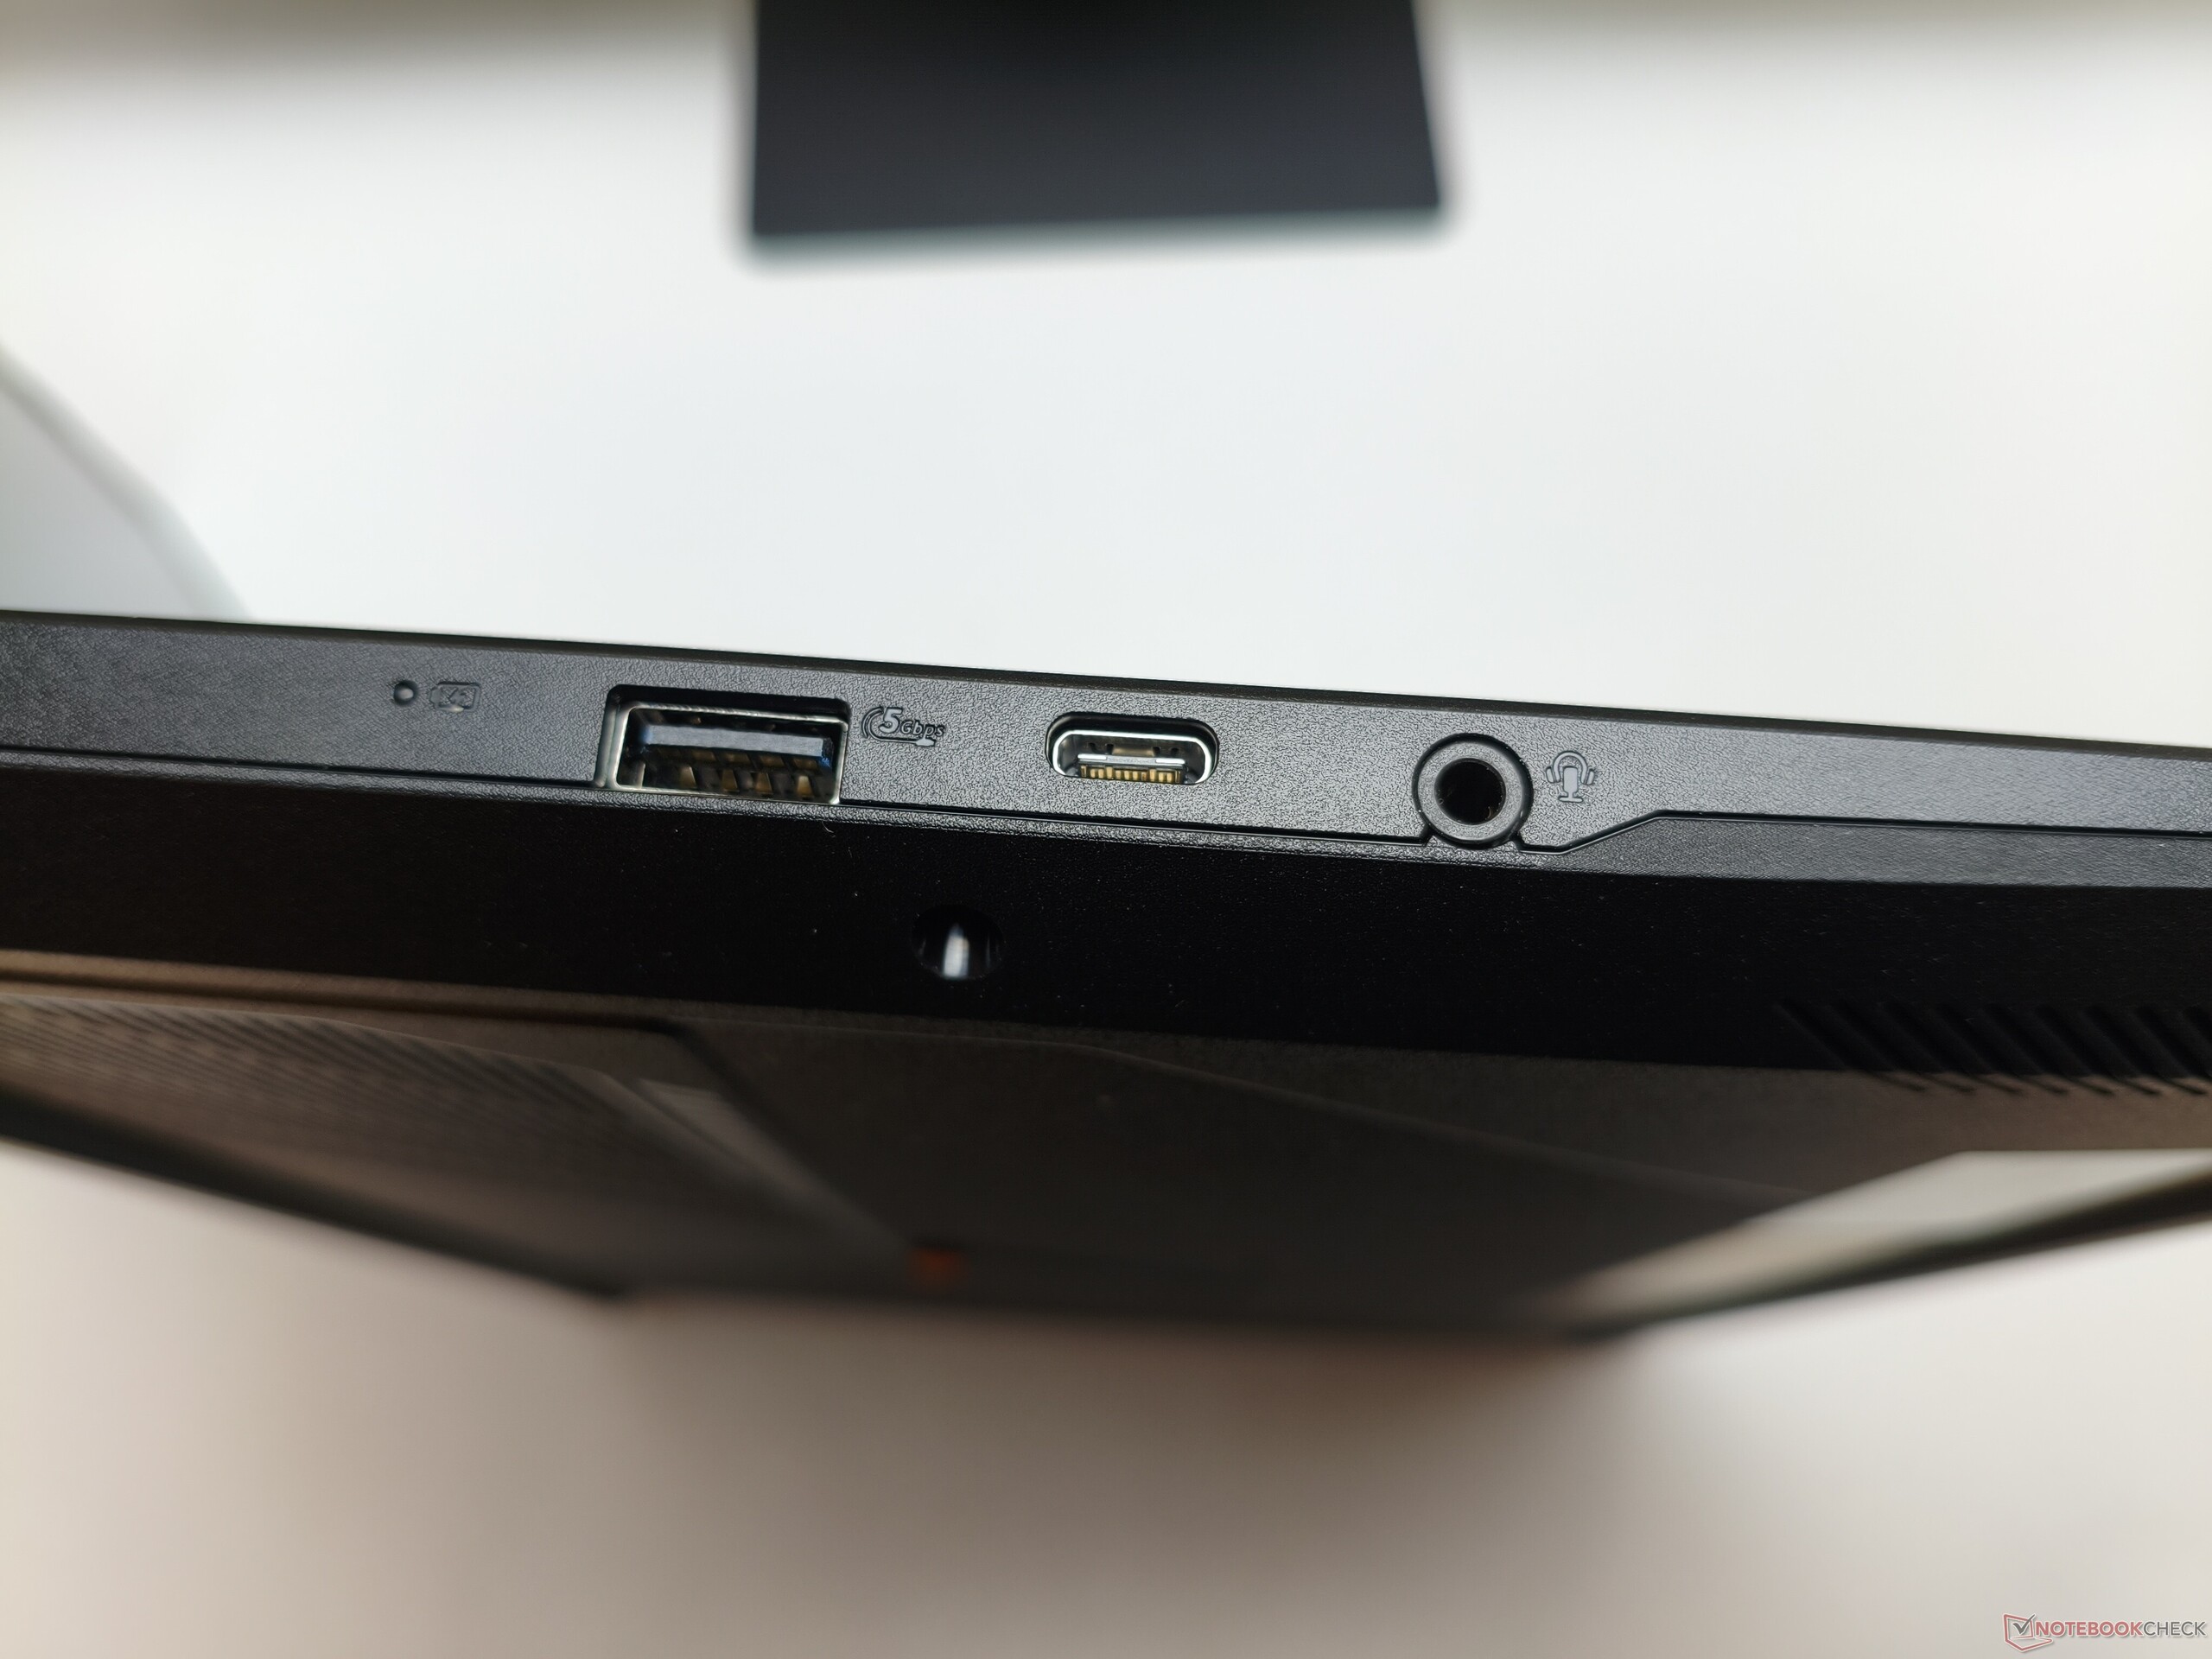
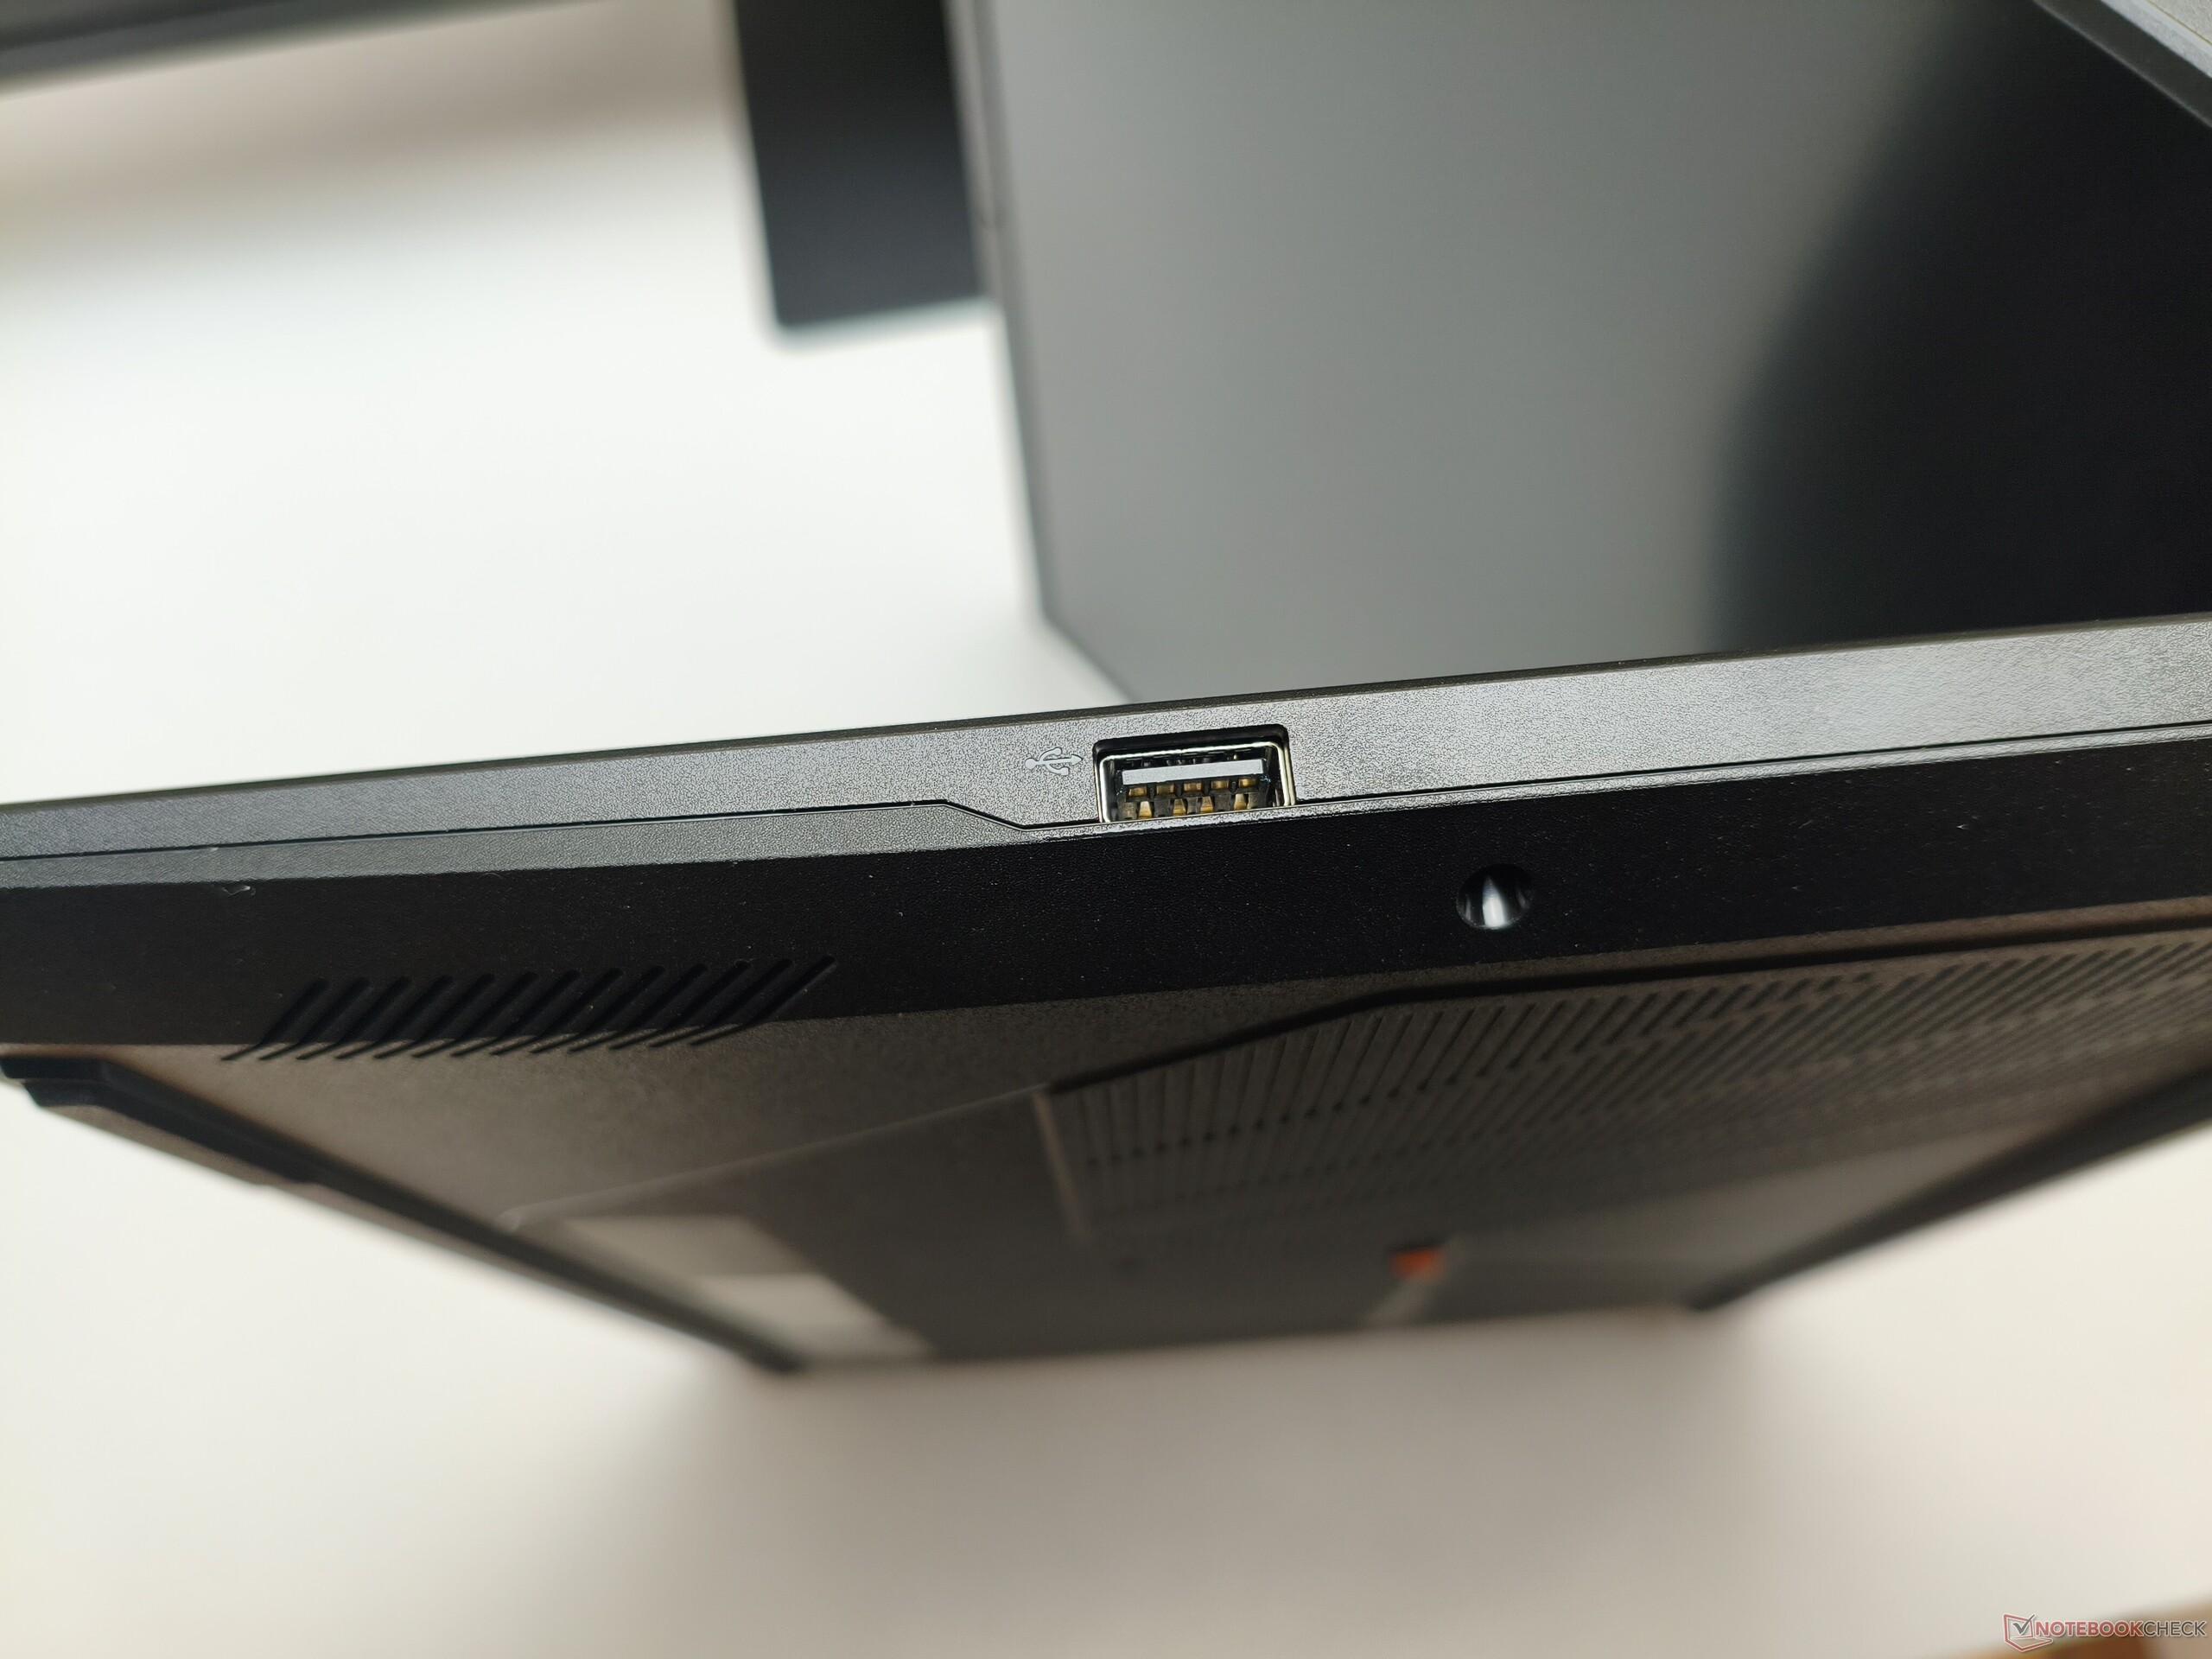
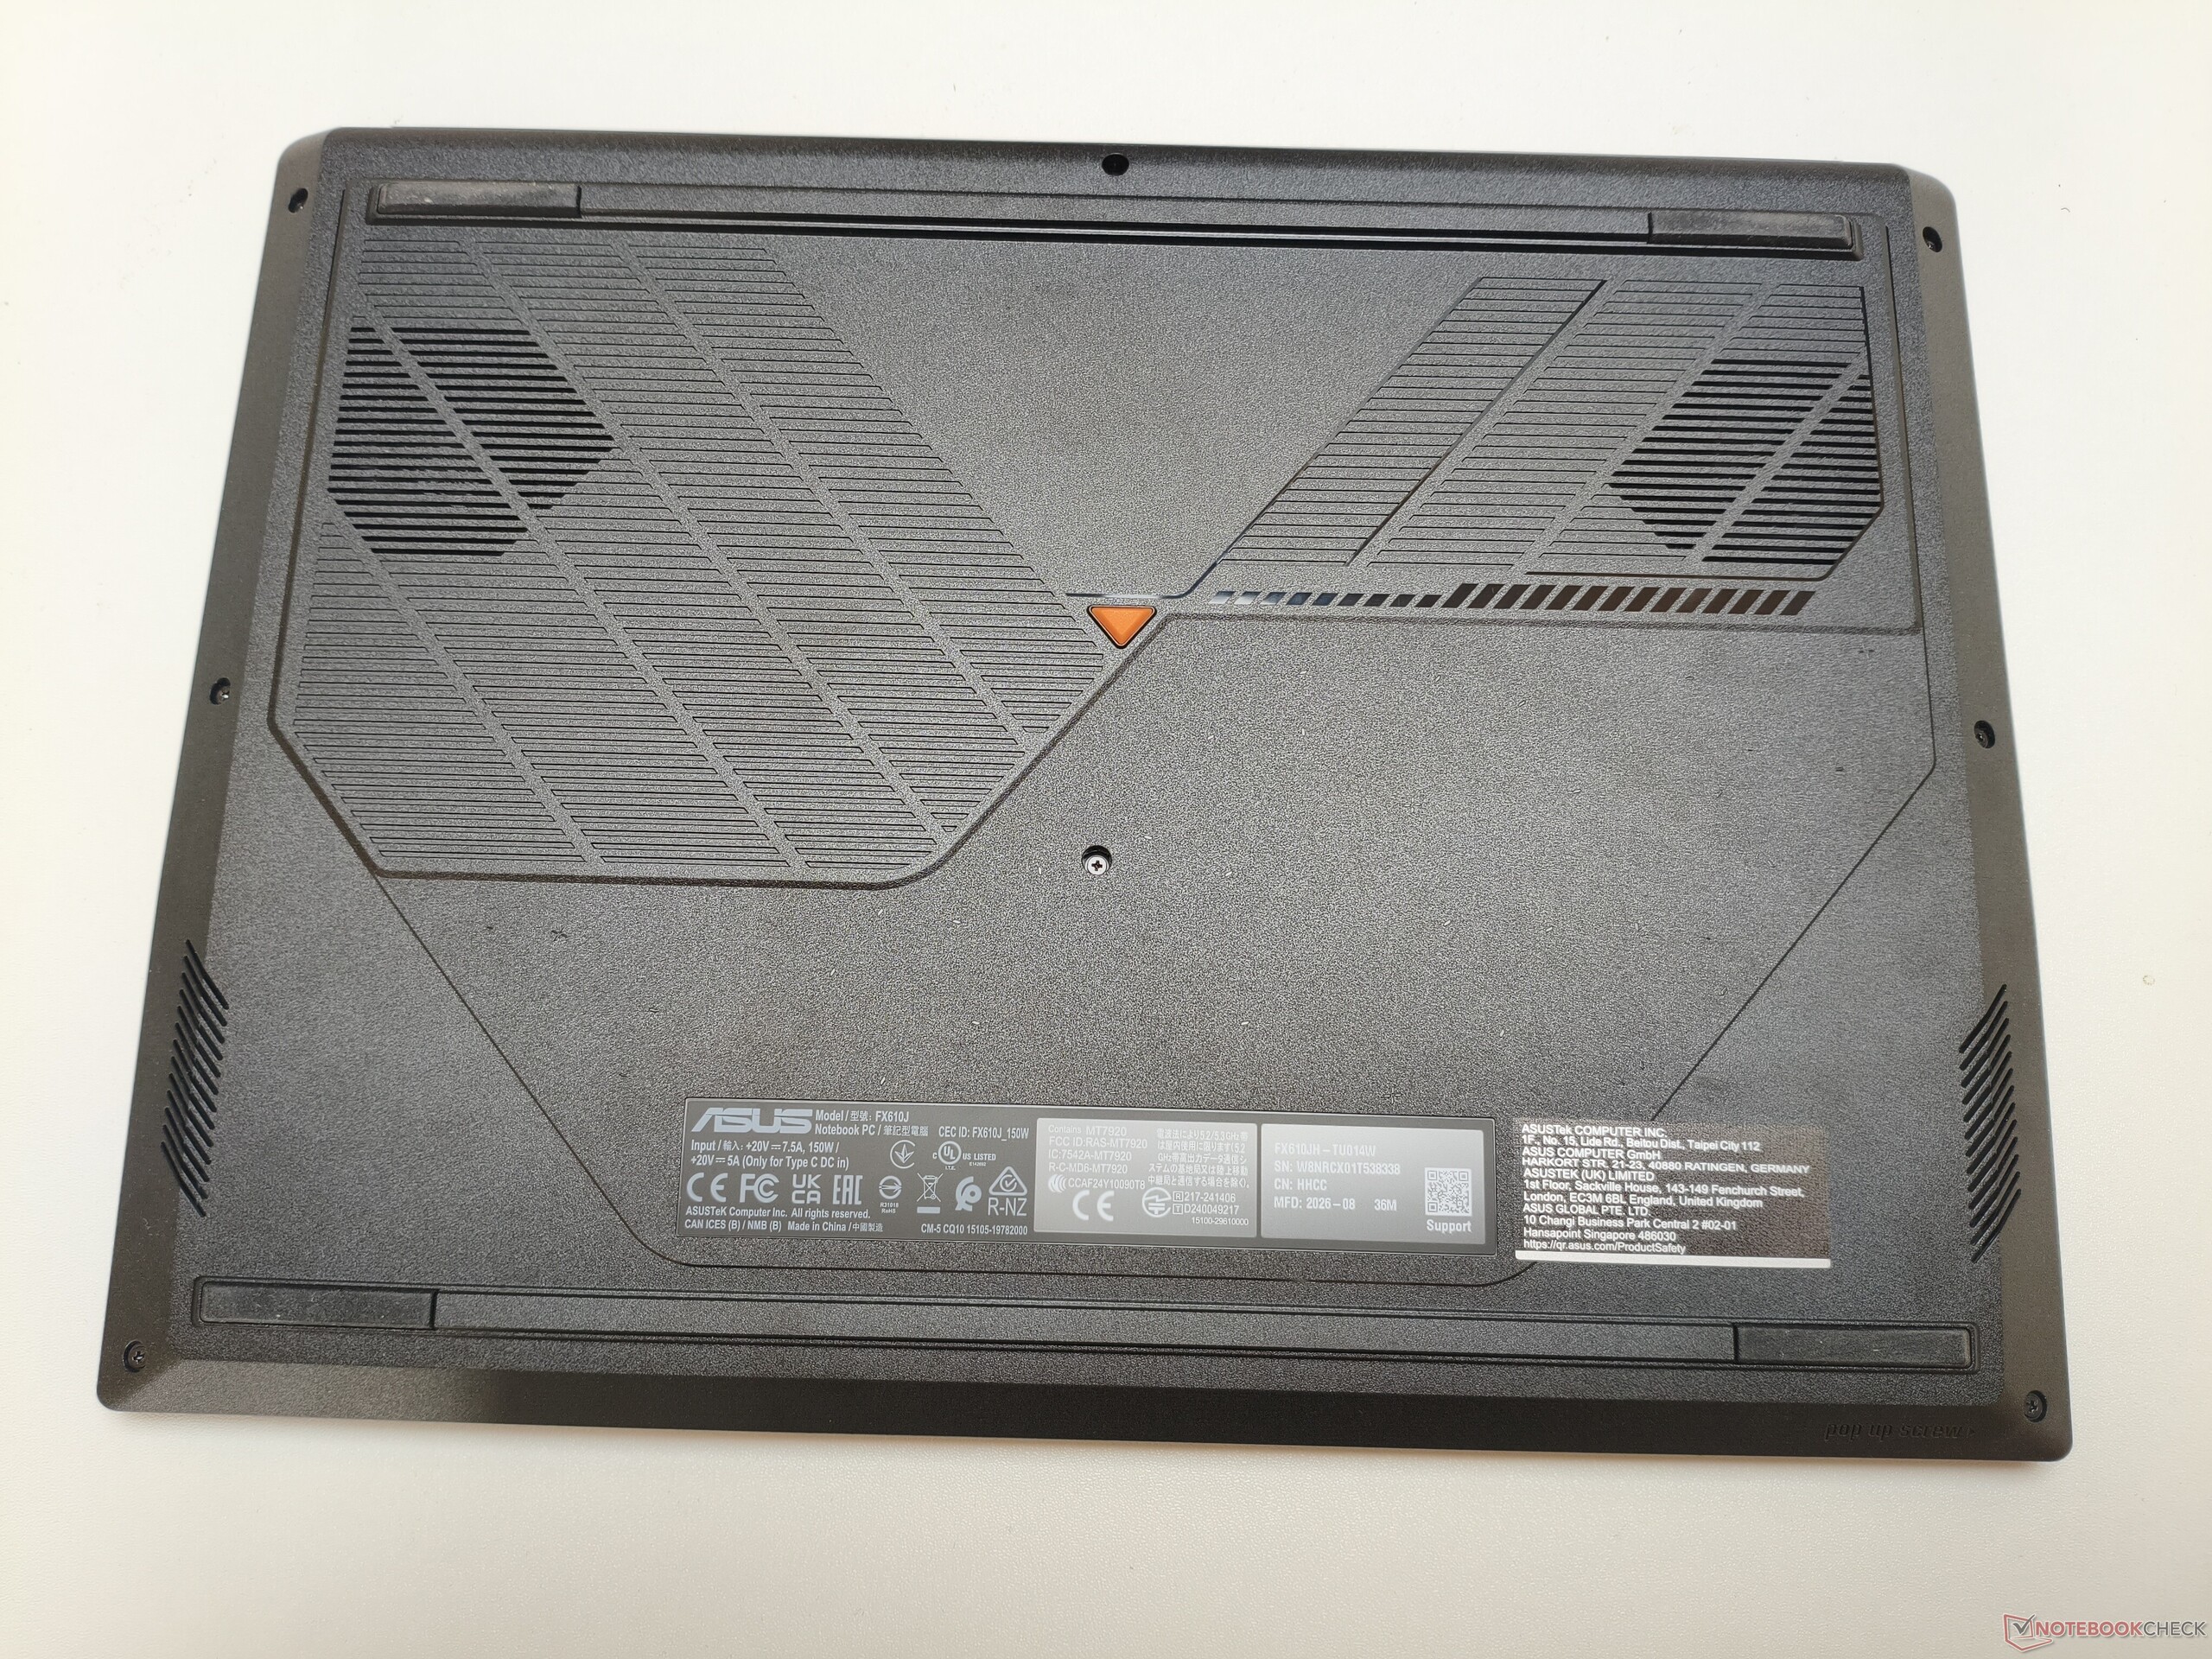
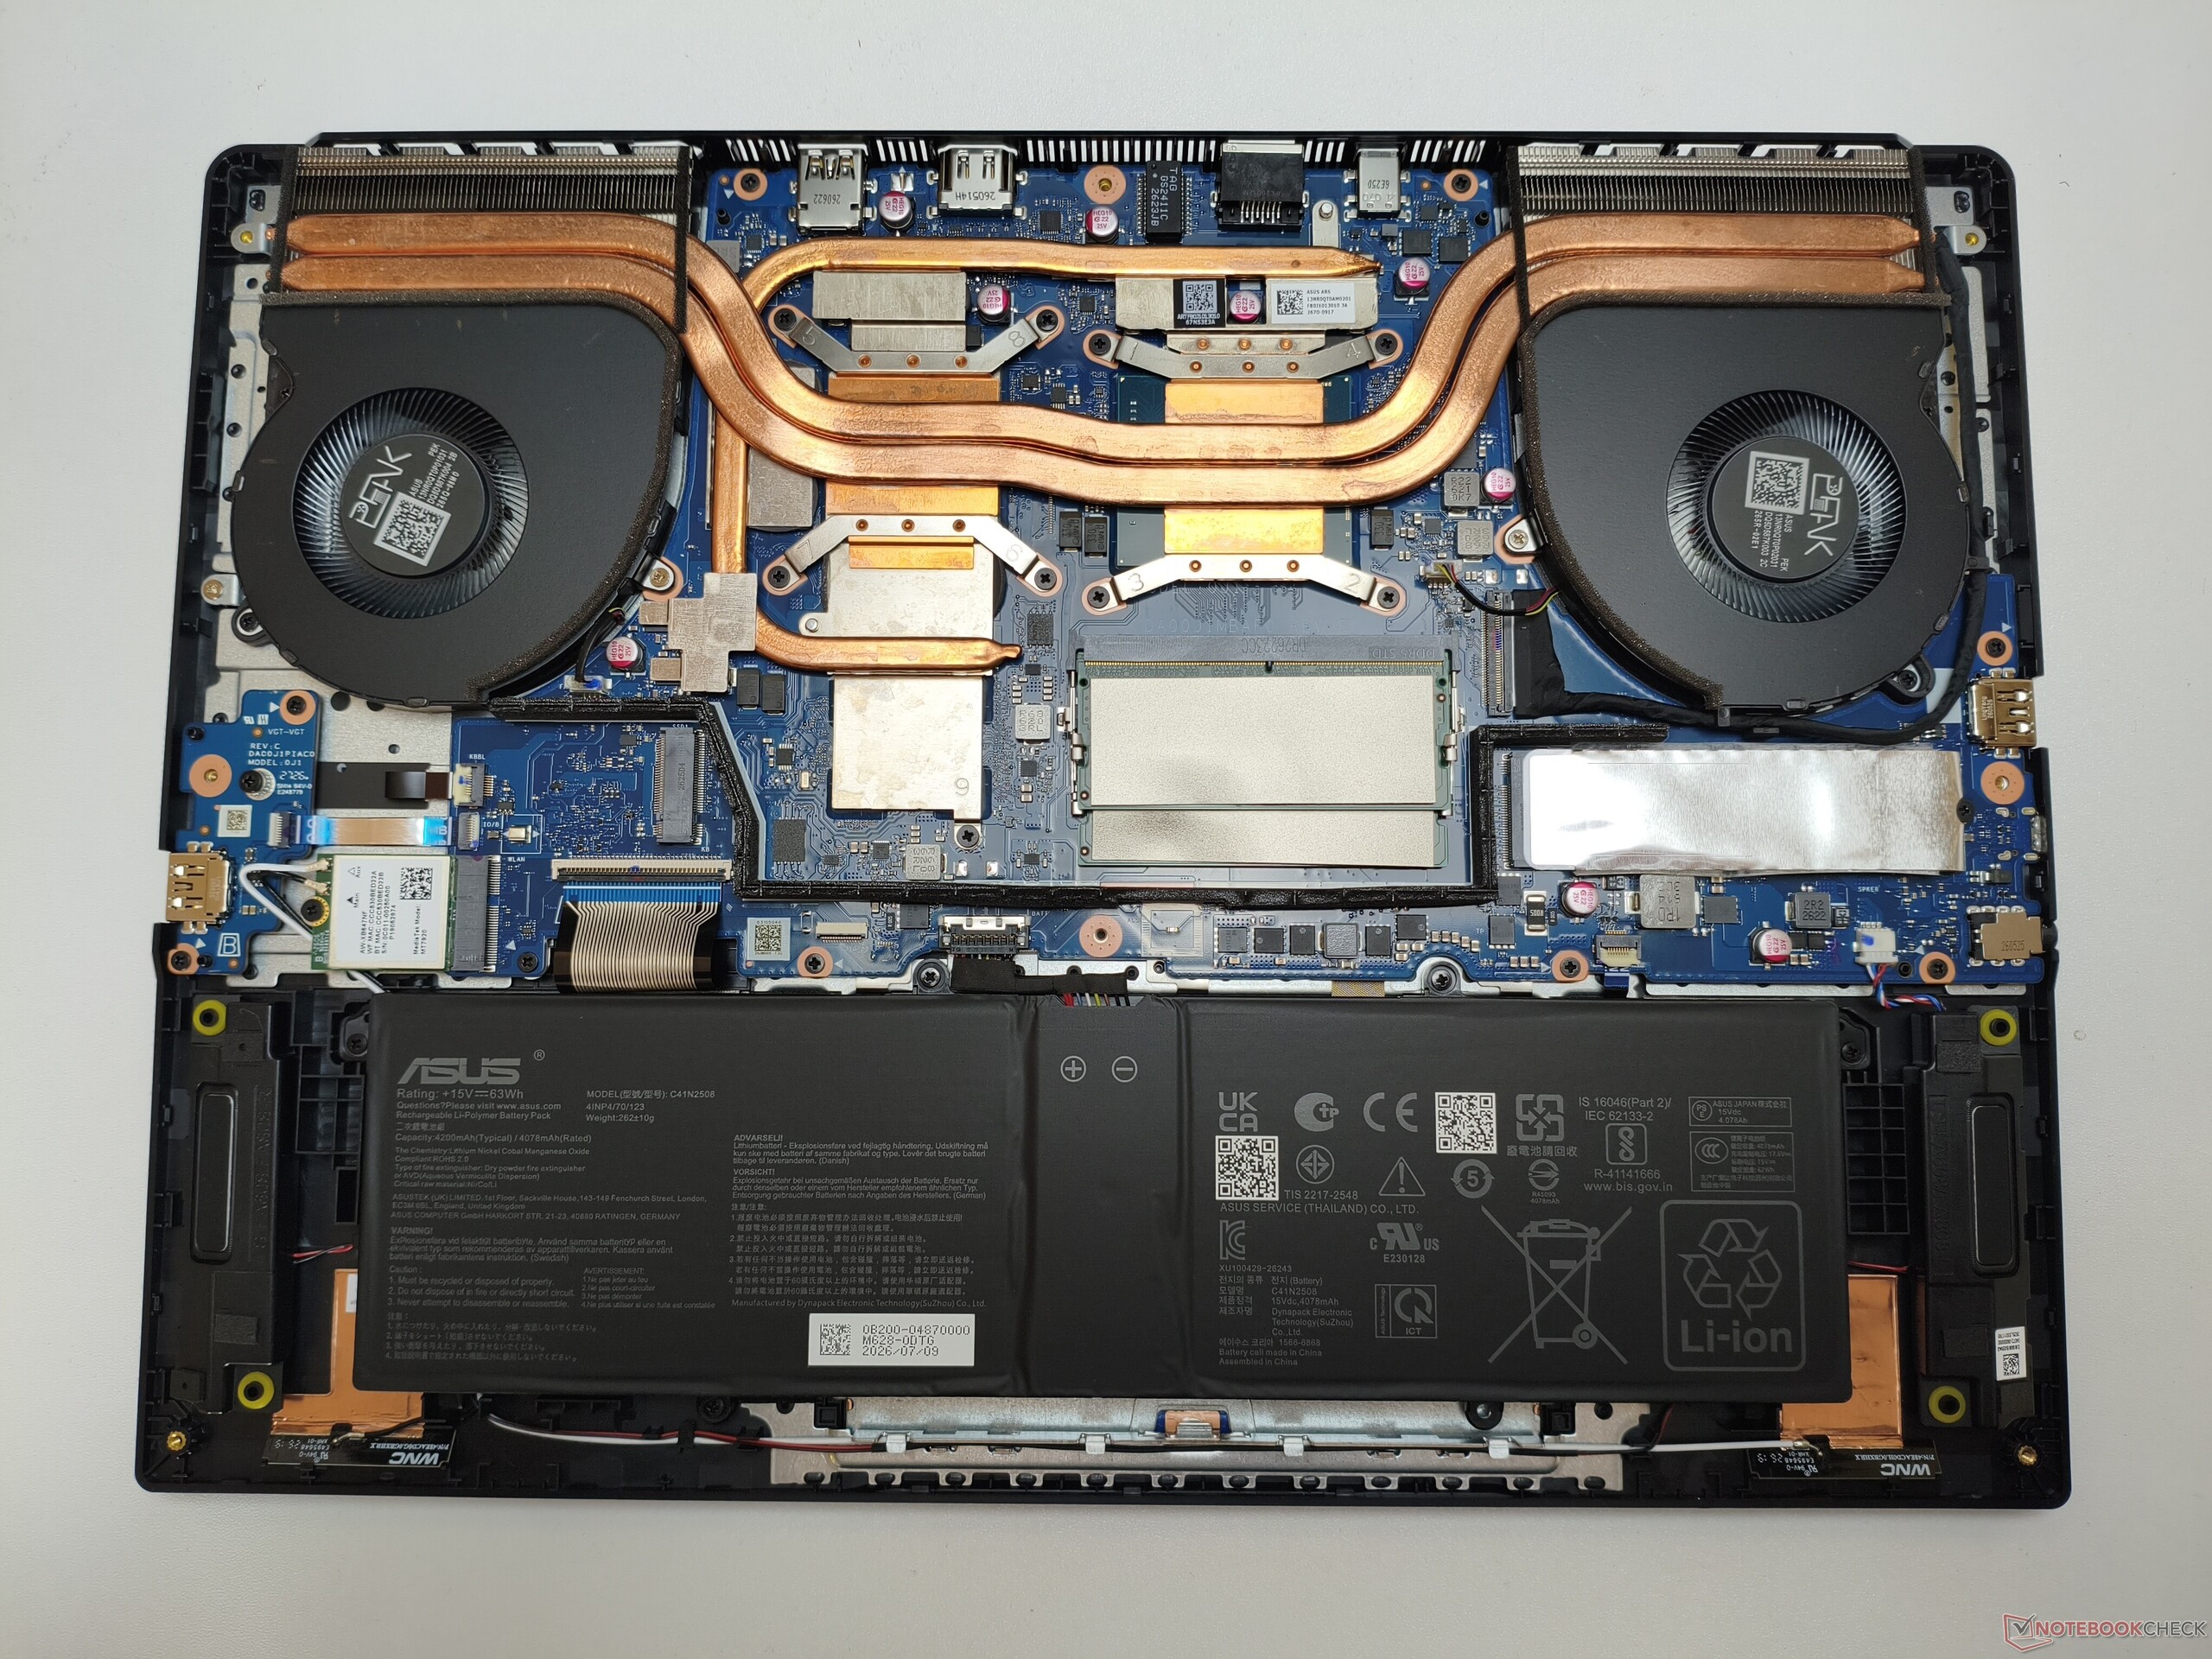
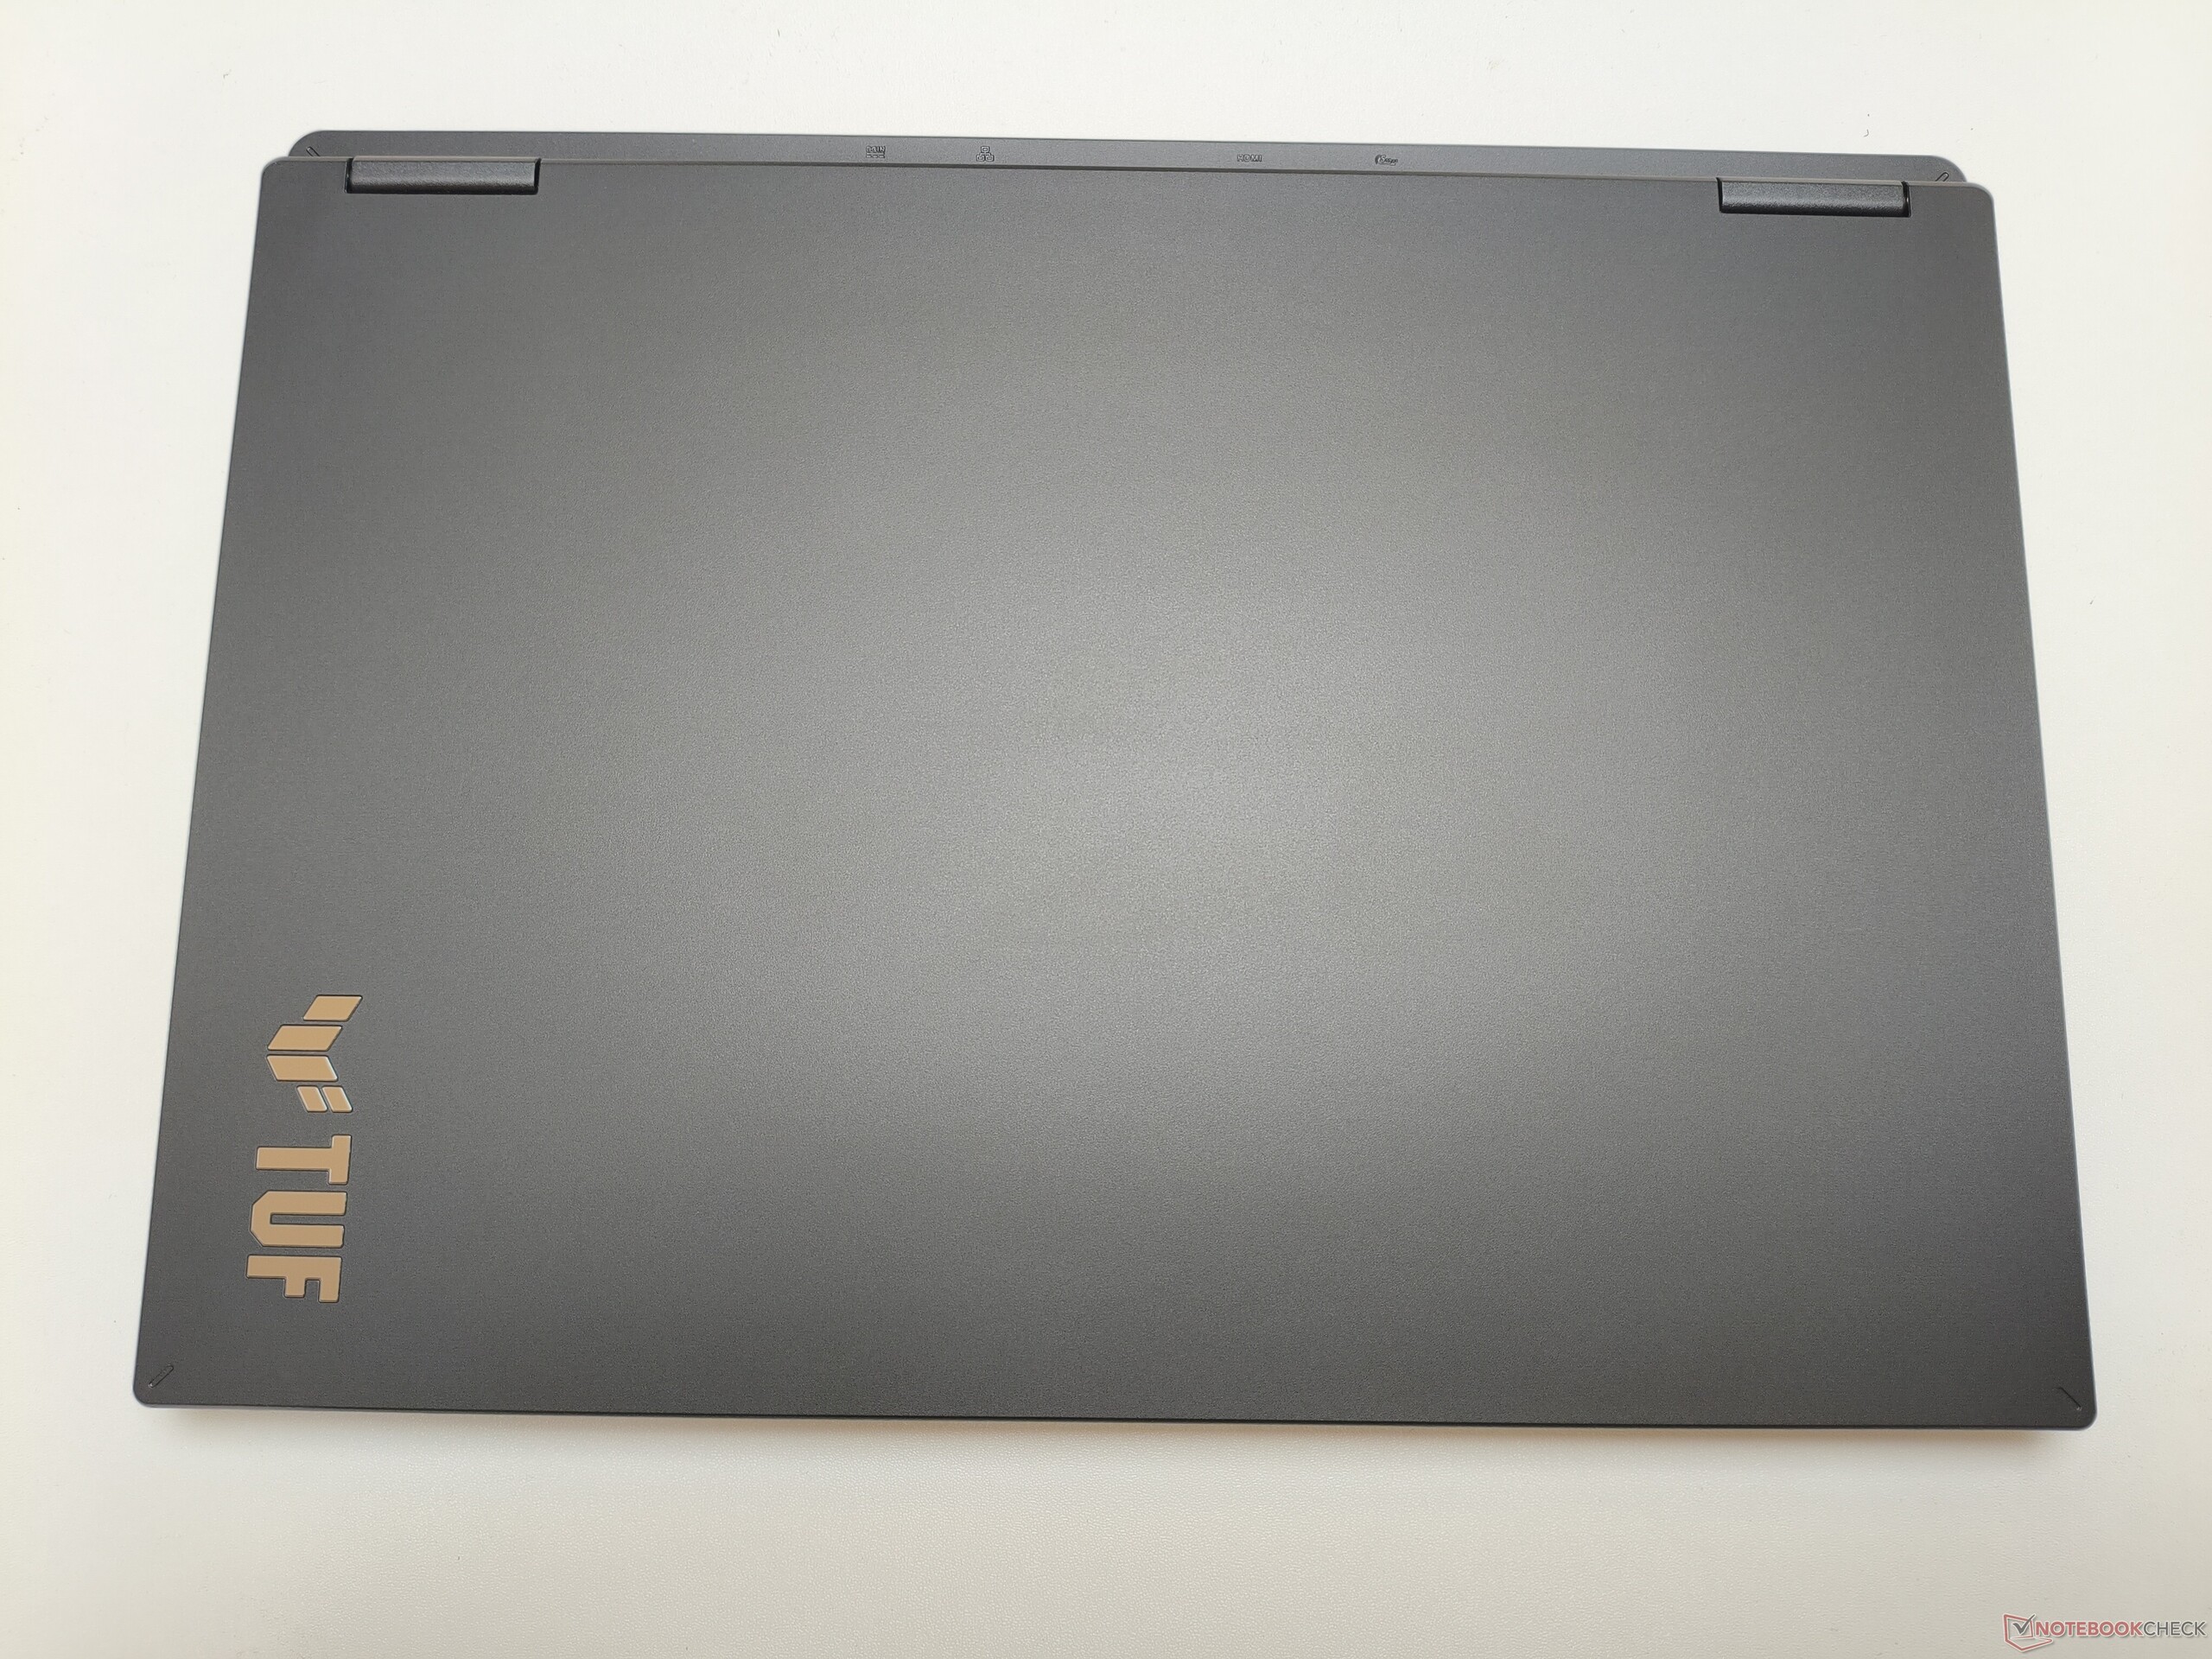
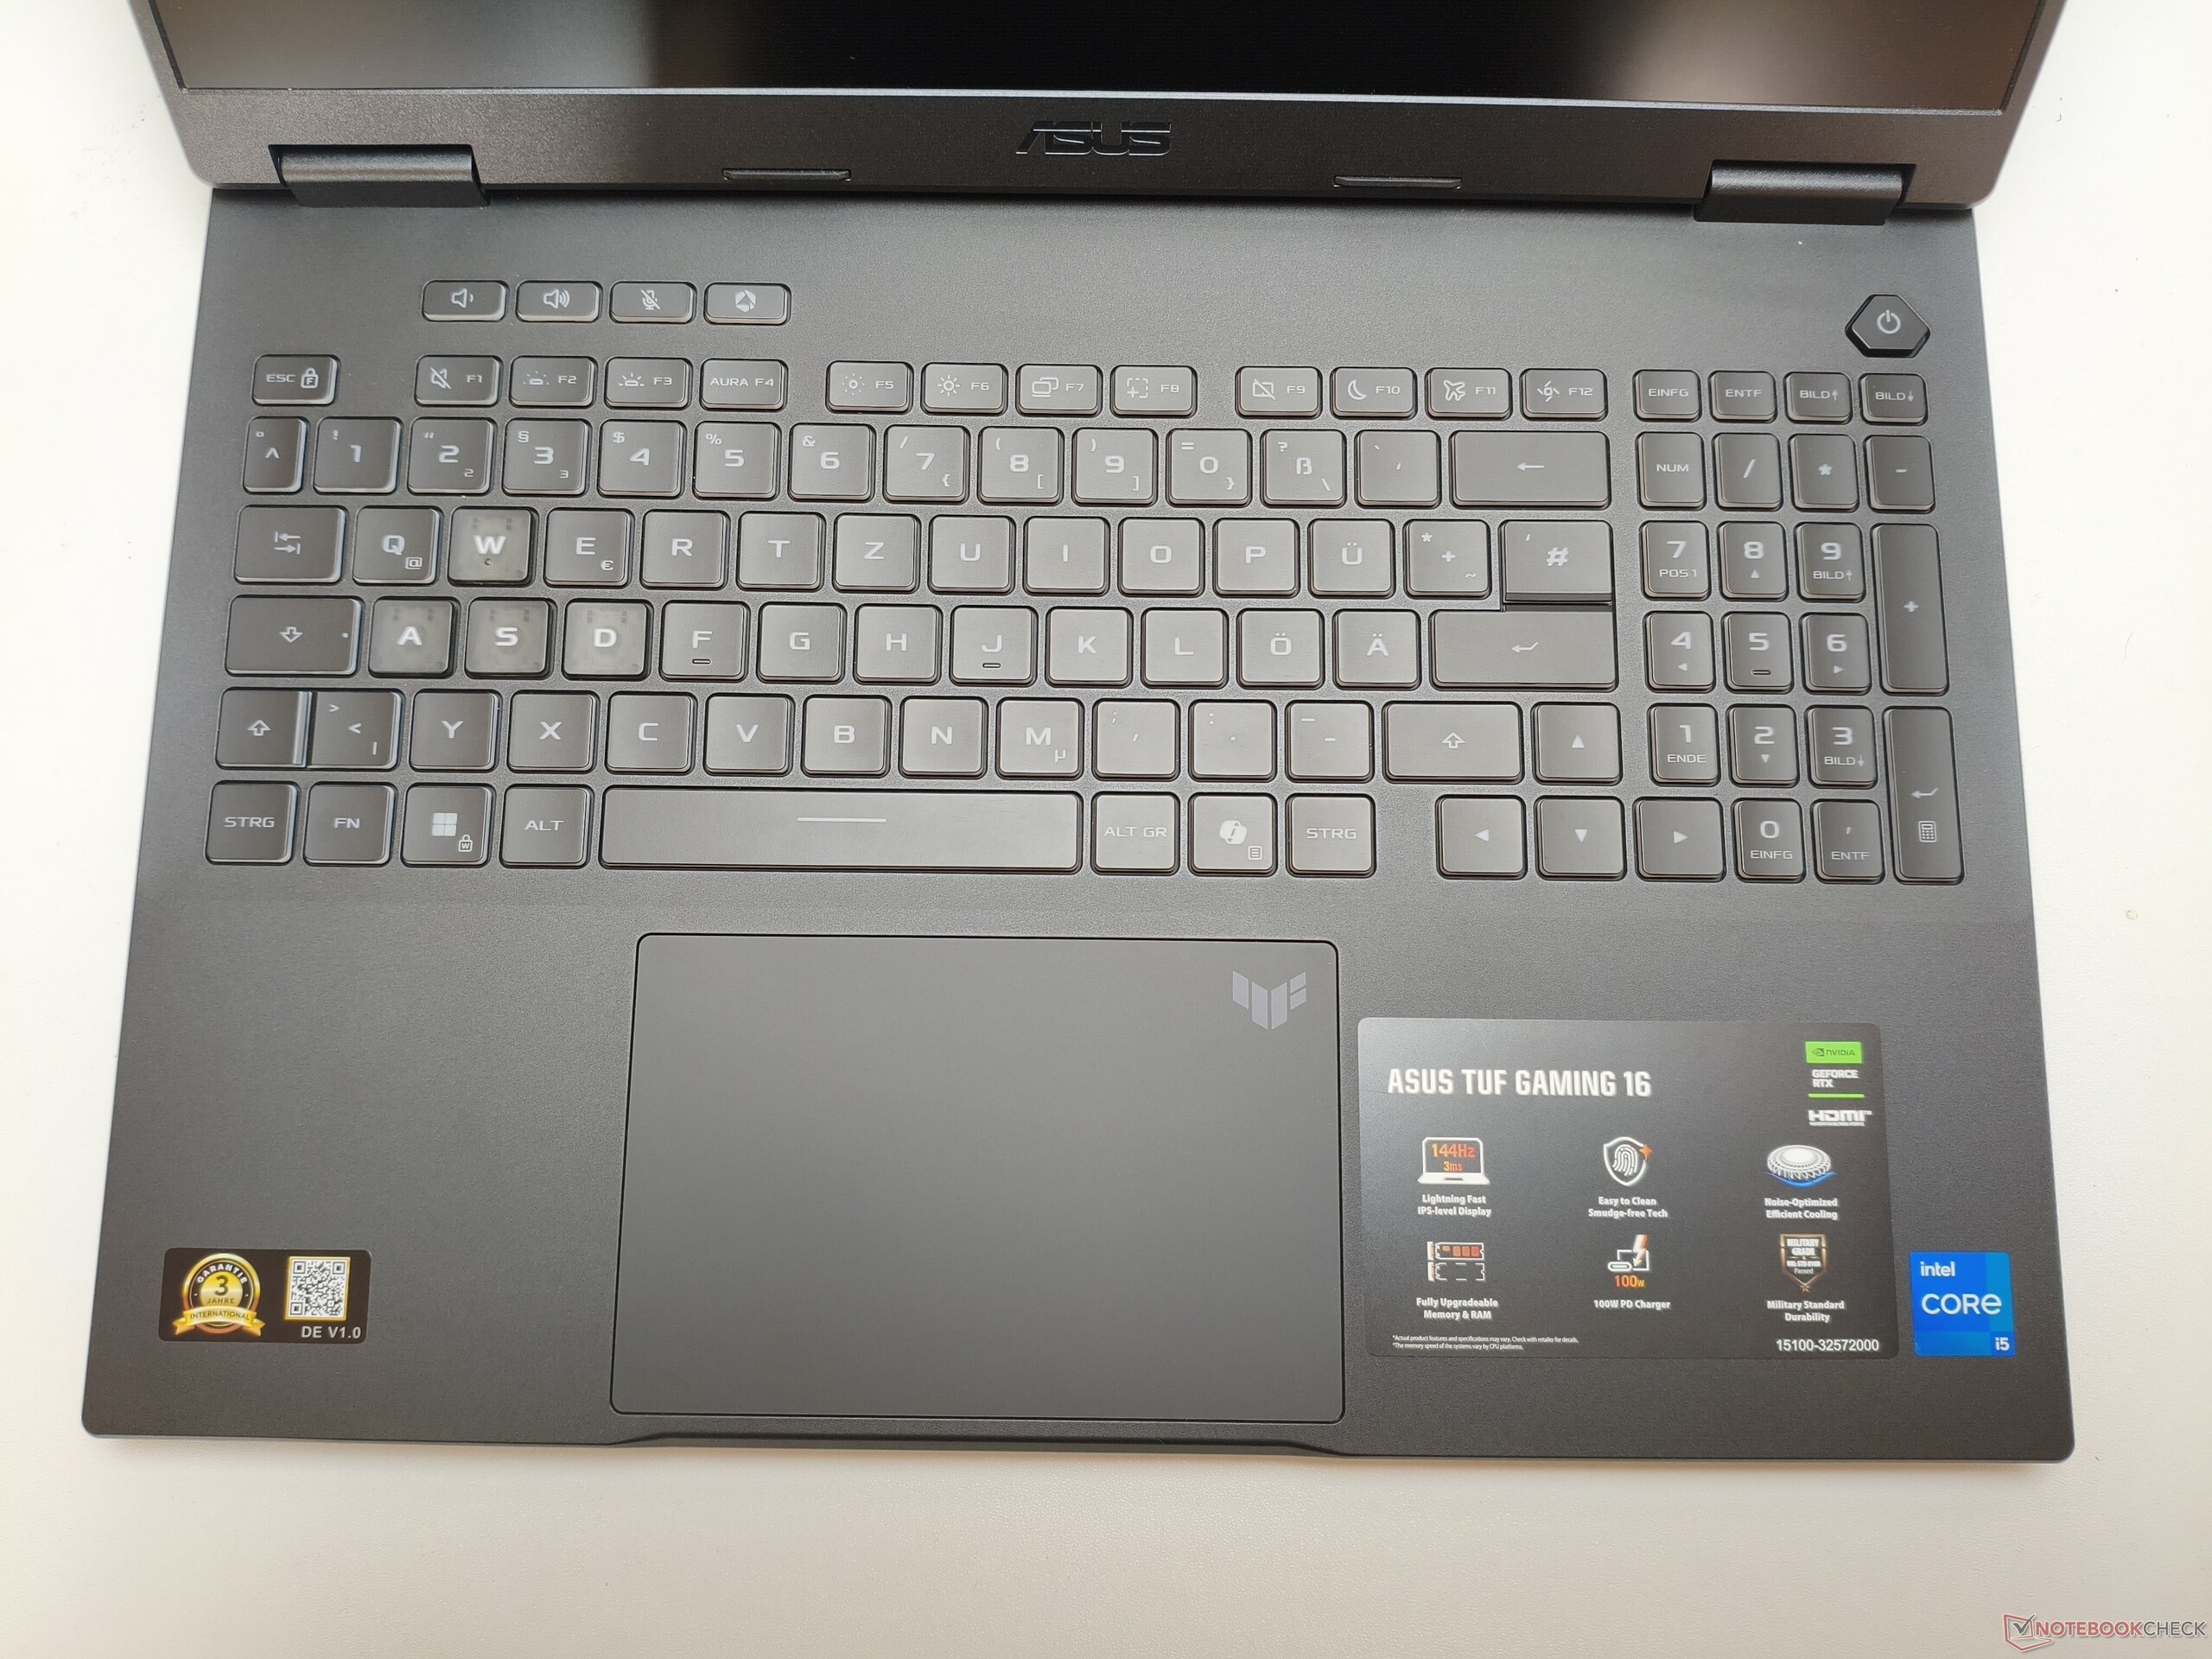
The dark plastic chassis weighs around 2.2 kg (~4.85 lb), offers adequate rigidity, and leaves no cause for criticism regarding build quality. We particularly liked the generous 180° opening angle, which is not a given on laptops. The input devices do their jobs reliably, although you should not expect exceptional performance here. The touchpad measures approximately 13 x 8.5 cm (~5.1 x 3.4 in), while the keyboard stands out mainly for its RGB backlighting and convenient dedicated keys for volume and other functions. Although the port selection lacks a card reader, Thunderbolt, and modern USB connectivity, the number of ports is generally appropriate for this price range. To access the internals, you need to remove several Phillips screws. All relevant components are then accessible. A photo of the internal layout can be found in the gallery.
TUF Gaming 16
TUF Gaming 16
TUF Gaming 16
TUF Gaming 16
TUF Gaming 16
TUF Gaming 16
TUF Gaming 16
TUF Gaming 16
TUF Gaming 16

Size comparison

❌
360 mm / 14.2 in 240 mm / 9.45 in 29 mm / 1.142 in 2.2 kg4.94 lbs360 mm / 14.2 in 276 mm / 10.9 in 24.5 mm / 0.965 in 2.4 kg5.4 lbs357 mm / 14.1 in 259 mm / 10.2 in 27 mm / 1.063 in 2.2 kg4.74 lbs359 mm / 14.1 in 245 mm / 9.65 in 23.2 mm / 0.913 in 2.2 kg4.89 lbs358 mm / 14.1 in 255 mm / 10 in 23.5 mm / 0.925 in 2.4 kg5.19 lbs345 mm / 13.6 in 255.4 mm / 10.1 in 21.5 mm / 0.846 in 1.9 kg4.27 lbs297 mm / 11.7 in 210 mm / 8.27 in 1 mm / 0.03937 in 5.7 g0.01257 lbs
Networking
iperf3 transmit Wi-Fi6/7 RT-BE96U
Average of class Gaming
  (718 - 4473, n=14, last 2 years)
2141 MBit/s +124%
Asus TUF Gaming 16 FX610J
MediaTek Wi-Fi 6 MT7920 Wireless LAN Card
957 (771min - 1127max) MBit/s
Average MediaTek Wi-Fi 6 MT7920 Wireless LAN Card
  (n=1)
957 MBit/s 0%
Lenovo LOQ 15AHP11
Realtek RTL8852BE
872 (596min - 959max) MBit/s -9%
iperf3 receive Wi-Fi6/7 RT-BE96U
Average of class Gaming
  (788 - 3208, n=14, last 2 years)
1982 MBit/s +108%
Asus TUF Gaming 16 FX610J
MediaTek Wi-Fi 6 MT7920 Wireless LAN Card
953 (501min - 1006max) MBit/s
Average MediaTek Wi-Fi 6 MT7920 Wireless LAN Card
  (n=1)
953 MBit/s 0%
Lenovo LOQ 15AHP11
Realtek RTL8852BE
788 (577min - 879max) MBit/s -17%
010020030040050060070080090010001100Tooltip
Asus TUF Gaming 16 FX610J MediaTek Wi-Fi 6 MT7920 Wireless LAN Card; iperf3 transmit Wi-Fi6/7 RT-BE96U; iperf 3.21: Ø957 (771-1127) MBit/s
Lenovo LOQ 15AHP11 Realtek RTL8852BE; iperf3 transmit Wi-Fi6/7 RT-BE96U; iperf 3.21: Ø872 (596-959) MBit/s
Asus TUF Gaming 16 FX610J MediaTek Wi-Fi 6 MT7920 Wireless LAN Card; iperf3 receive Wi-Fi6/7 RT-BE96U; iperf 3.21: Ø936 (501-1006) MBit/s
Lenovo LOQ 15AHP11 Realtek RTL8852BE; iperf3 receive Wi-Fi6/7 RT-BE96U; iperf 3.21: Ø788 (577-879) MBit/s
ColorChecker
8.2 ∆E
12.7 ∆E
15.5 ∆E
7.6 ∆E
13.9 ∆E
9.9 ∆E
10.7 ∆E
20.9 ∆E
12.4 ∆E
6.2 ∆E
6.2 ∆E
7.3 ∆E
17.3 ∆E
5 ∆E
6 ∆E
8 ∆E
6.2 ∆E
9.5 ∆E
2.3 ∆E
12.6 ∆E
9.8 ∆E
8.2 ∆E
7.3 ∆E
9.2 ∆E
ColorChecker Asus TUF Gaming 16 FX610J: 9.71 ∆E min: 2.33 - max: 20.86 ∆E

Display

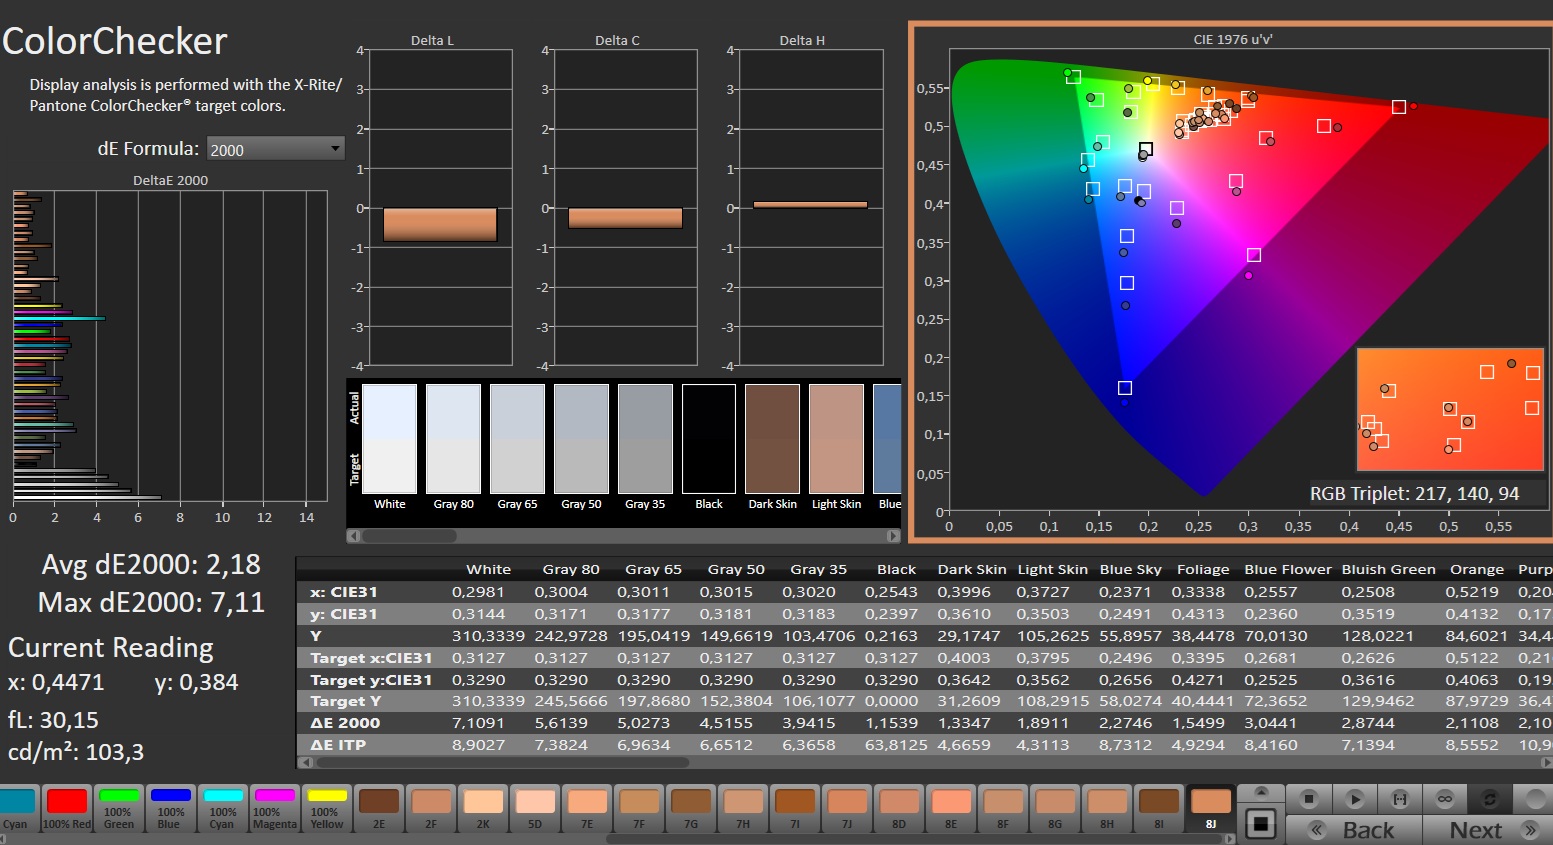
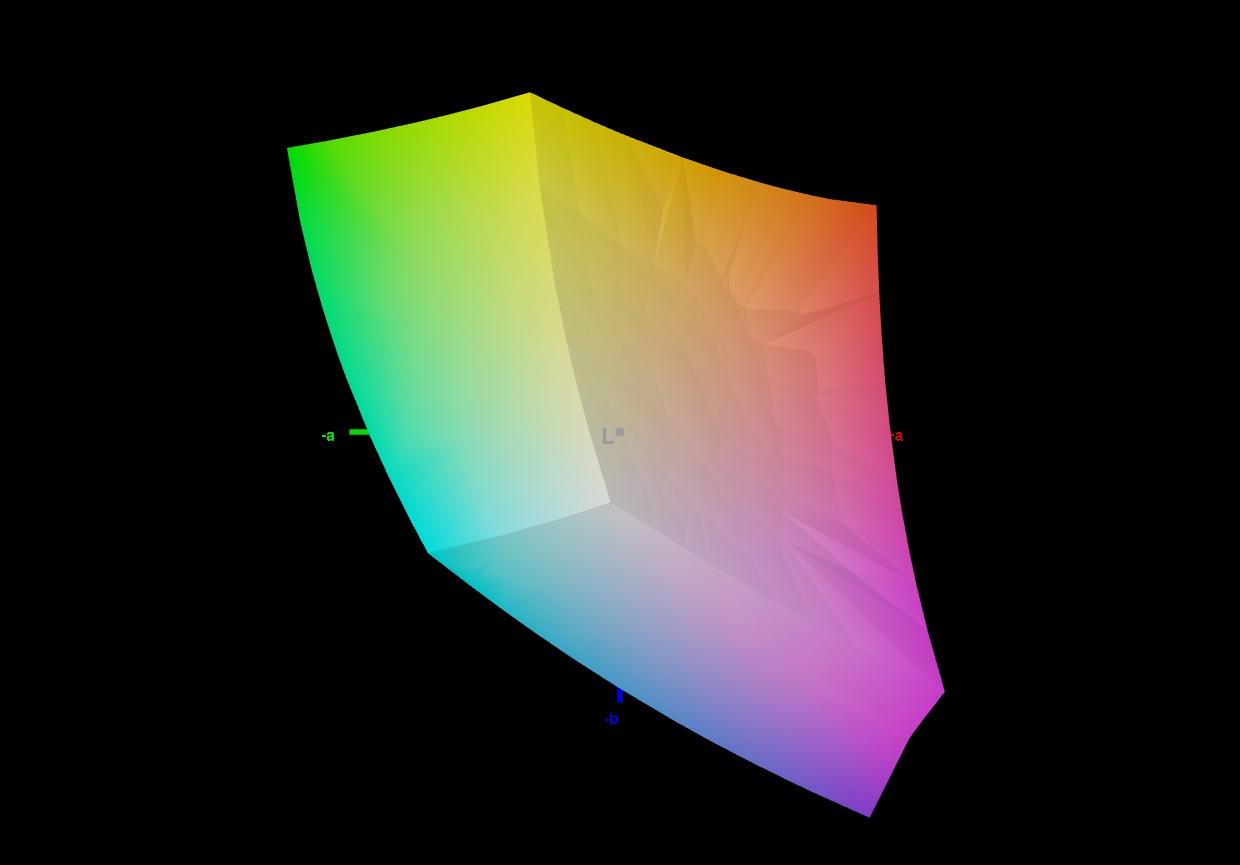
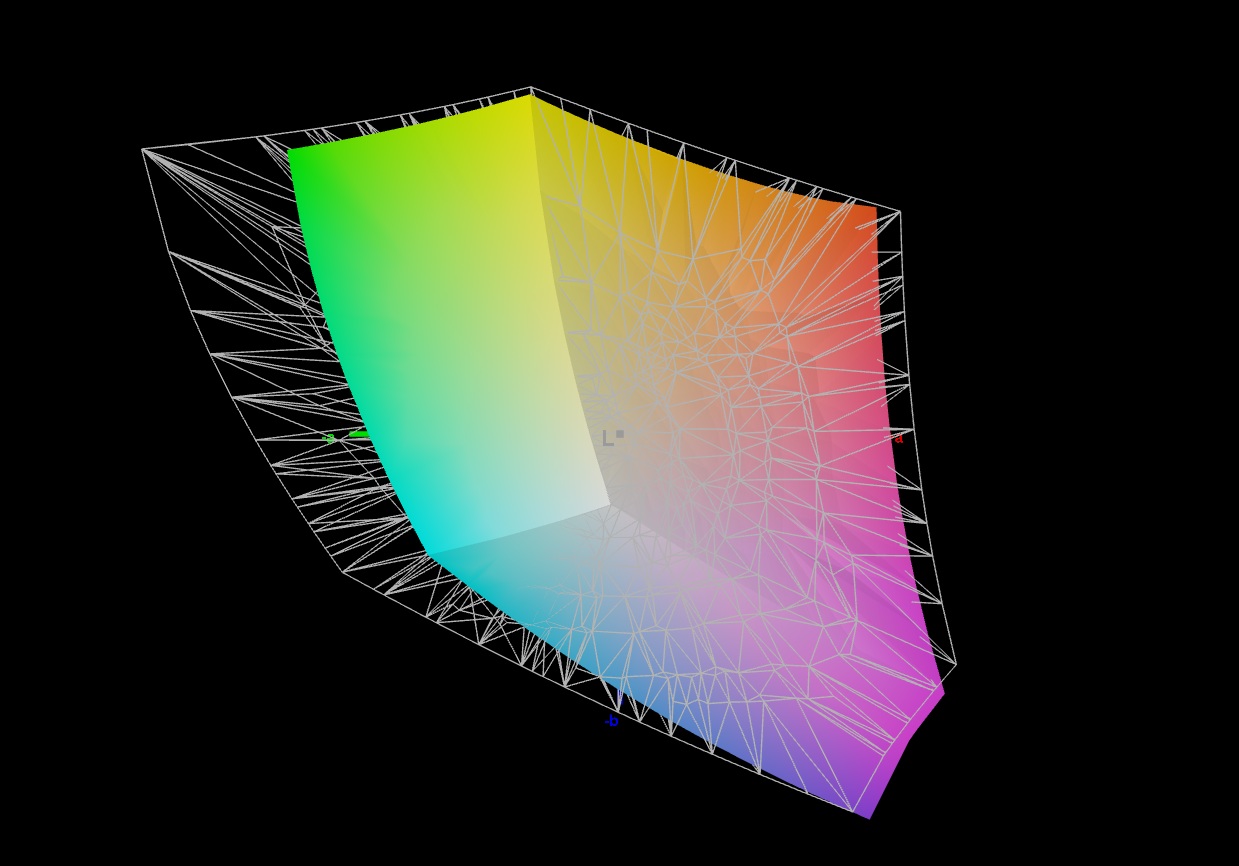
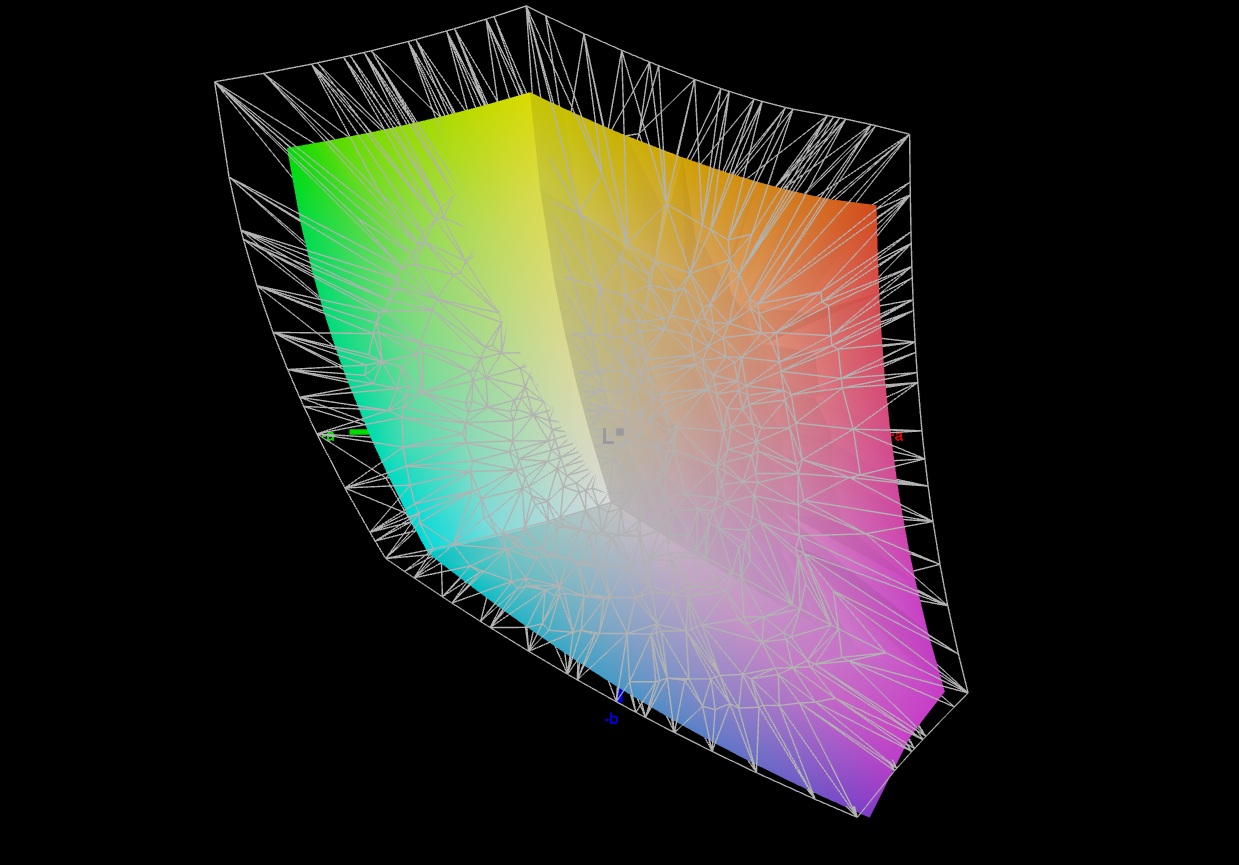
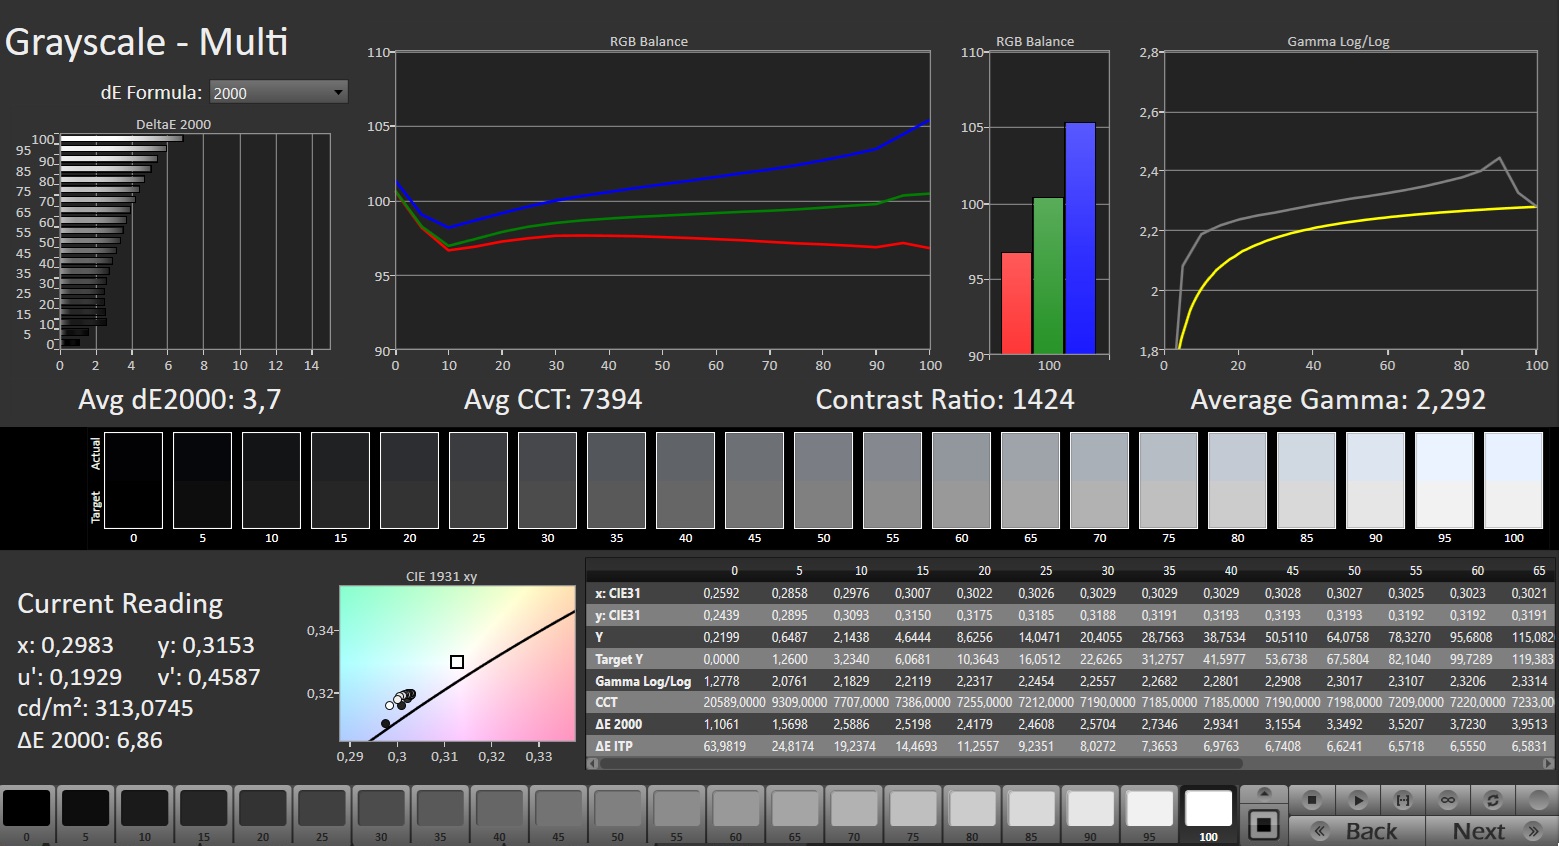
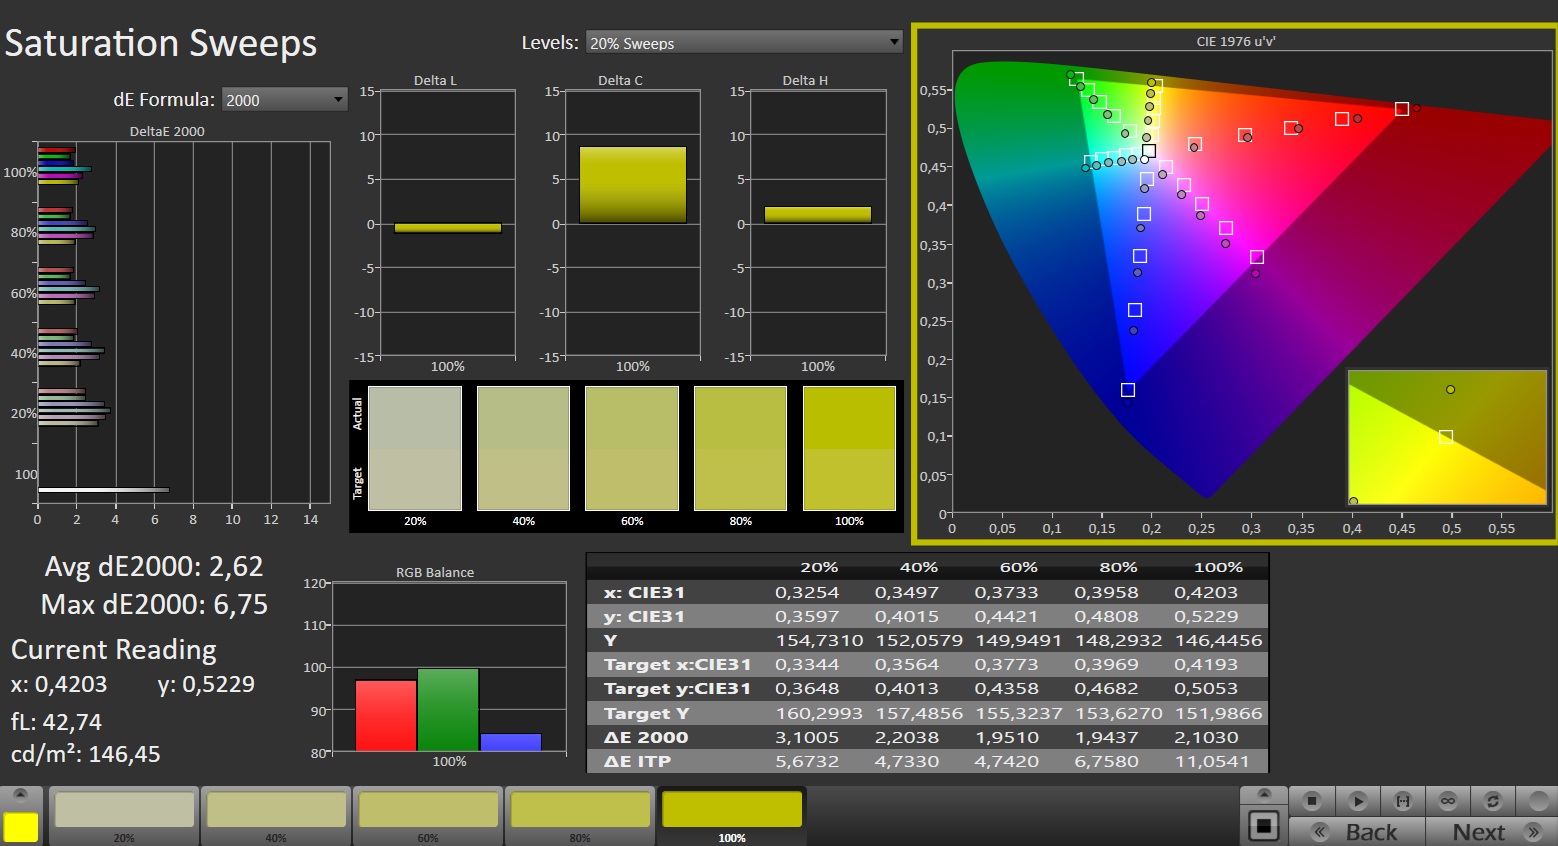
While many budget laptops have to make do with displays offering limited color coverage, the TUF Gaming 16 impresses in this area. It covers 100% of the sRGB color space, which cannot be said of most competitors. The situation is similar when it comes to response times: here, too, the Asus device outperforms several rivals. Average brightness reaches the manufacturer's specification at 306 cd/m², while contrast comes in at 1,377:1—also typical of an IPS panel. Buyers get a resolution of 1,920 x 1,200 pixels, which is just right for the graphics performance on offer.
Calman: grayscale
Calman: grayscale
Calman: color saturation
Calman: ColorChecker
Asus TUF Gaming 16 vs sRGB
Asus TUF Gaming 16 vs AdobeRGB
Asus TUF Gaming 16 vs DCI-P3
328
cd/m²
320
cd/m²
292
cd/m²
301
cd/m²
303
cd/m²
293
cd/m²
312
cd/m²
310
cd/m²
294
cd/m²
Distribution of brightness
NE160WU1-MY2 tested with X-Rite i1Pro 3
Maximum: 328 cd/m² (Nits) Average: 305.9 cd/m² Minimum: 3 cd/m²
Brightness Distribution: 89 %
Center on Battery: 303 cd/m²
Contrast: 1377:1 (Black: 0.22 cd/m²)
ΔE ColorChecker Calman: 2.18 | ∀{0.5-29.43 Ø4.68}
ΔE Greyscale Calman: 3.7 | ∀{0.09-98 Ø4.93}
76.2% AdobeRGB 1998 (Argyll 3D)
100% sRGB (Argyll 3D)
76.1% Display P3 (Argyll 3D)
Gamma: 2.292
CCT: 7394 K
Asus TUF Gaming 16 FX610J
NE160WU1-MY2, IPS, 1920x1200, 16", 144 Hz
Acer Nitro V 16 AI ANV16-42-R860
B160UAN08.3 (AUO2CB8), IPS, 1920x1200, 16", 180 Hz
MSI Cyborg 15 B2RWEKG
CMN N156HRA-EA1, IPS, 1920x1080, 15.6", 144 Hz
HP Victus 15-fa2160ng
CMN1560, IPS, 1920x1080, 15.6", 144 Hz
Medion Erazer Deputy 15 P1 MD62761
CMN N156HRA-EA1, IPS, 1920x1080, 15.6", 144 Hz
Lenovo Legion 5 15AHP G10
LEN151WQXGA, OLED, 2560x1600, 15.1", 165 Hz
Display
-46%
-40%
-44%
-46%
20%
Display P3 Coverage (%)
76.1
39.2
-48%
43.4
-43%
43
-43%
38.8
-49%
99.9
31%
sRGB Coverage (%)
100
58.2
-42%
64.8
-35%
64.3
-36%
58.4
-42%
100
0%
AdobeRGB 1998 Coverage (%)
76.2
40.5
-47%
44.9
-41%
34.7
-54%
40.1
-47%
98.3
29%
Response Times
-22%
-206%
-213%
-213%
95%
Response Time Grey 50% / Grey 80% * (ms)
7.9 ?(3.8, 4.1)
11.6 ?(5.5, 6.1)
-47%
27.6 ?(12.9, 14.7)
-249%
28.6 ?(13.4, 15.2)
-262%
29.3 ?(13.2, 16.1)
-271%
0.42 ?(0.21, 0.21)
95%
Response Time Black / White * (ms)
7.6 ?(4, 3.6)
7.4 ?(3.8, 3.6)
3%
20 ?(10.6, 9.4)
-163%
20 ?(10.7, 9.3)
-163%
19.4 ?(10.1, 9.3)
-155%
0.4 ?(0.22, 0.18)
95%
PWM Frequency (Hz)
1152 ?(44)
PWM Amplitude * (%)
11
Screen
-54%
-33%
-38%
-21%
55%
Brightness middle (cd/m²)
303
384
27%
286
-6%
324
7%
332
10%
492
62%
Brightness (cd/m²)
306
372
22%
272
-11%
303
-1%
314
3%
495
62%
Brightness Distribution (%)
89
92
3%
87
-2%
87
-2%
82
-8%
92
3%
Black Level * (cd/m²)
0.22
0.36
-64%
0.17
23%
0.26
-18%
0.2
9%
Contrast (:1)
1377
1067
-23%
1682
22%
1246
-10%
1660
21%
Colorchecker dE 2000 *
2.18
5.82
-167%
4.61
-111%
4.7
-116%
4.57
-110%
0.9
59%
Colorchecker dE 2000 max. *
7.11
20.34
-186%
19.59
-176%
18.19
-156%
12.82
-80%
1.8
75%
Greyscale dE 2000 *
3.7
5.4
-46%
3.9
-5%
3.9
-5%
4.1
-11%
1.2
68%
Gamma
2.292 96%
2.174 101%
2.236 98%
2.21 100%
2.023 109%
2.16 102%
CCT
7394 88%
6067 107%
6792 96%
7541 86%
6838 95%
6291 103%
Colorchecker dE 2000 calibrated *
3.95
2.99
2.93
3.95
Total Average (Program / Settings)
-41% / -47%
-93% / -61%
-98% / -66%
-93% / -56%
57% / 53%

* ... smaller is better

Display Response Times

ℹ
Display response times show how fast the screen is able to change from one color to the next. Slow response times can lead to afterimages and can cause moving objects to appear blurry (ghosting). Gamers of fast-paced 3D titles should pay special attention to fast response times.
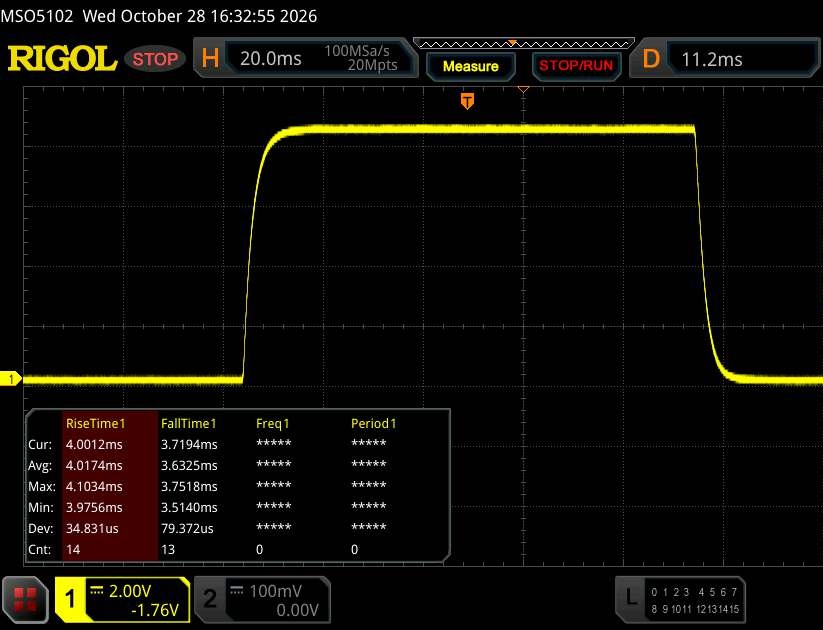
   ↔    Response Time Black to White
7.6 ms ... rise ↗ and fall ↘ combined↗ 4 ms rise
↘ 3.6 ms fall
The screen shows very fast response rates in our tests and should be very well suited for fast-paced gaming.
In comparison, all tested devices range from 0.1 (minimum) to 240 (maximum) ms. » 23 % of all devices are better.
This means that the measured response time is better than the average of all tested devices (19.6 ms).
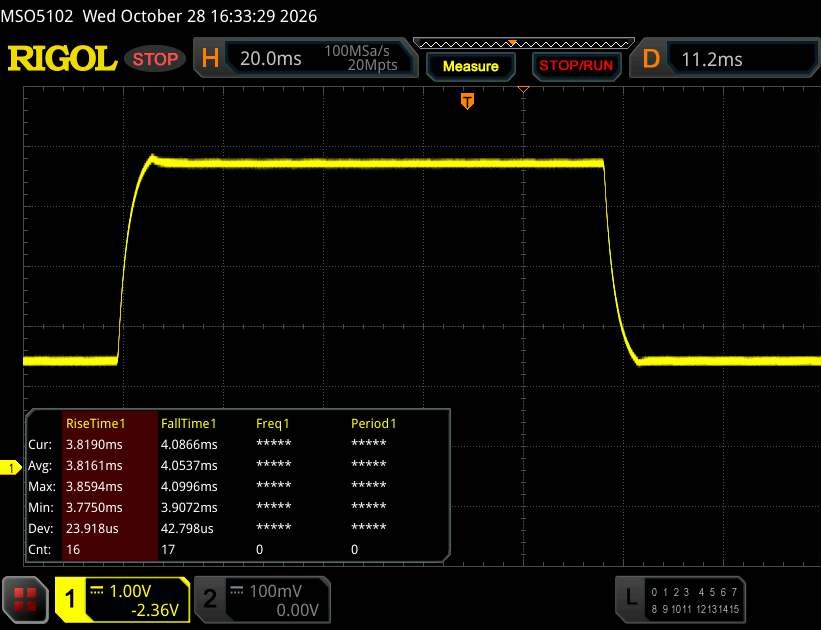
   ↔    Response Time 50% Grey to 80% Grey
7.9 ms ... rise ↗ and fall ↘ combined↗ 3.8 ms rise
↘ 4.1 ms fall
The screen shows very fast response rates in our tests and should be very well suited for fast-paced gaming.
In comparison, all tested devices range from 0.13 (minimum) to 636 (maximum) ms. » 22 % of all devices are better.
This means that the measured response time is better than the average of all tested devices (30.6 ms).

Screen Flickering / PWM (Pulse-Width Modulation)

ℹ
To dim the screen, some notebooks will simply cycle the backlight on and off in rapid succession - a method called Pulse Width Modulation (PWM) . This cycling frequency should ideally be undetectable to the human eye. If said frequency is too low, users with sensitive eyes may experience strain or headaches or even notice the flickering altogether.
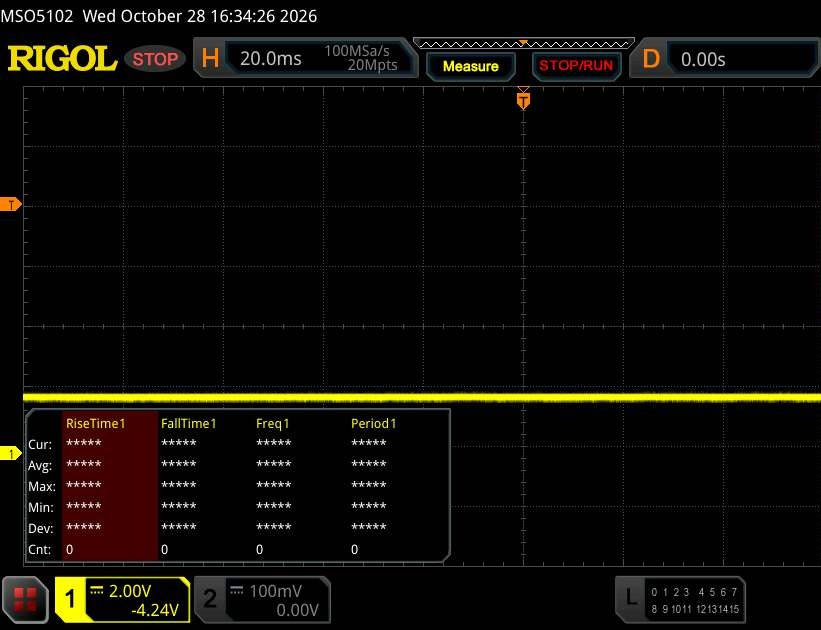
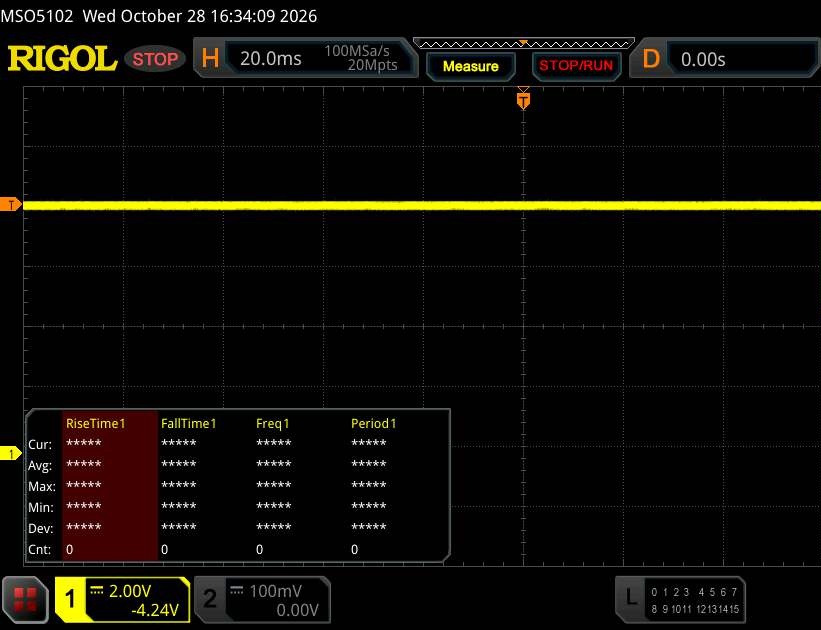
Screen flickering / PWM not detected

In comparison: 52 % of all tested devices do not use PWM to dim the display. If PWM was detected, an average of 7550 (minimum: 5 - maximum: 343500) Hz was measured.

100% brightness
100% brightness
50% brightness
50% brightness
0% brightness
0% brightness

Performance

Anyone who does not need to play every new title at maximum detail settings with full ray tracing, and is happy to use features such as DLSS and Frame Generation, will find the TUF Gaming 16 a suitable companion, as we will explore in more detail below.
Test conditions

Asus's own Armoury Crate software offers a choice of performance profiles. All our measurements were taken in Performance mode, which is enabled by default (we used Silent mode only for the battery test).
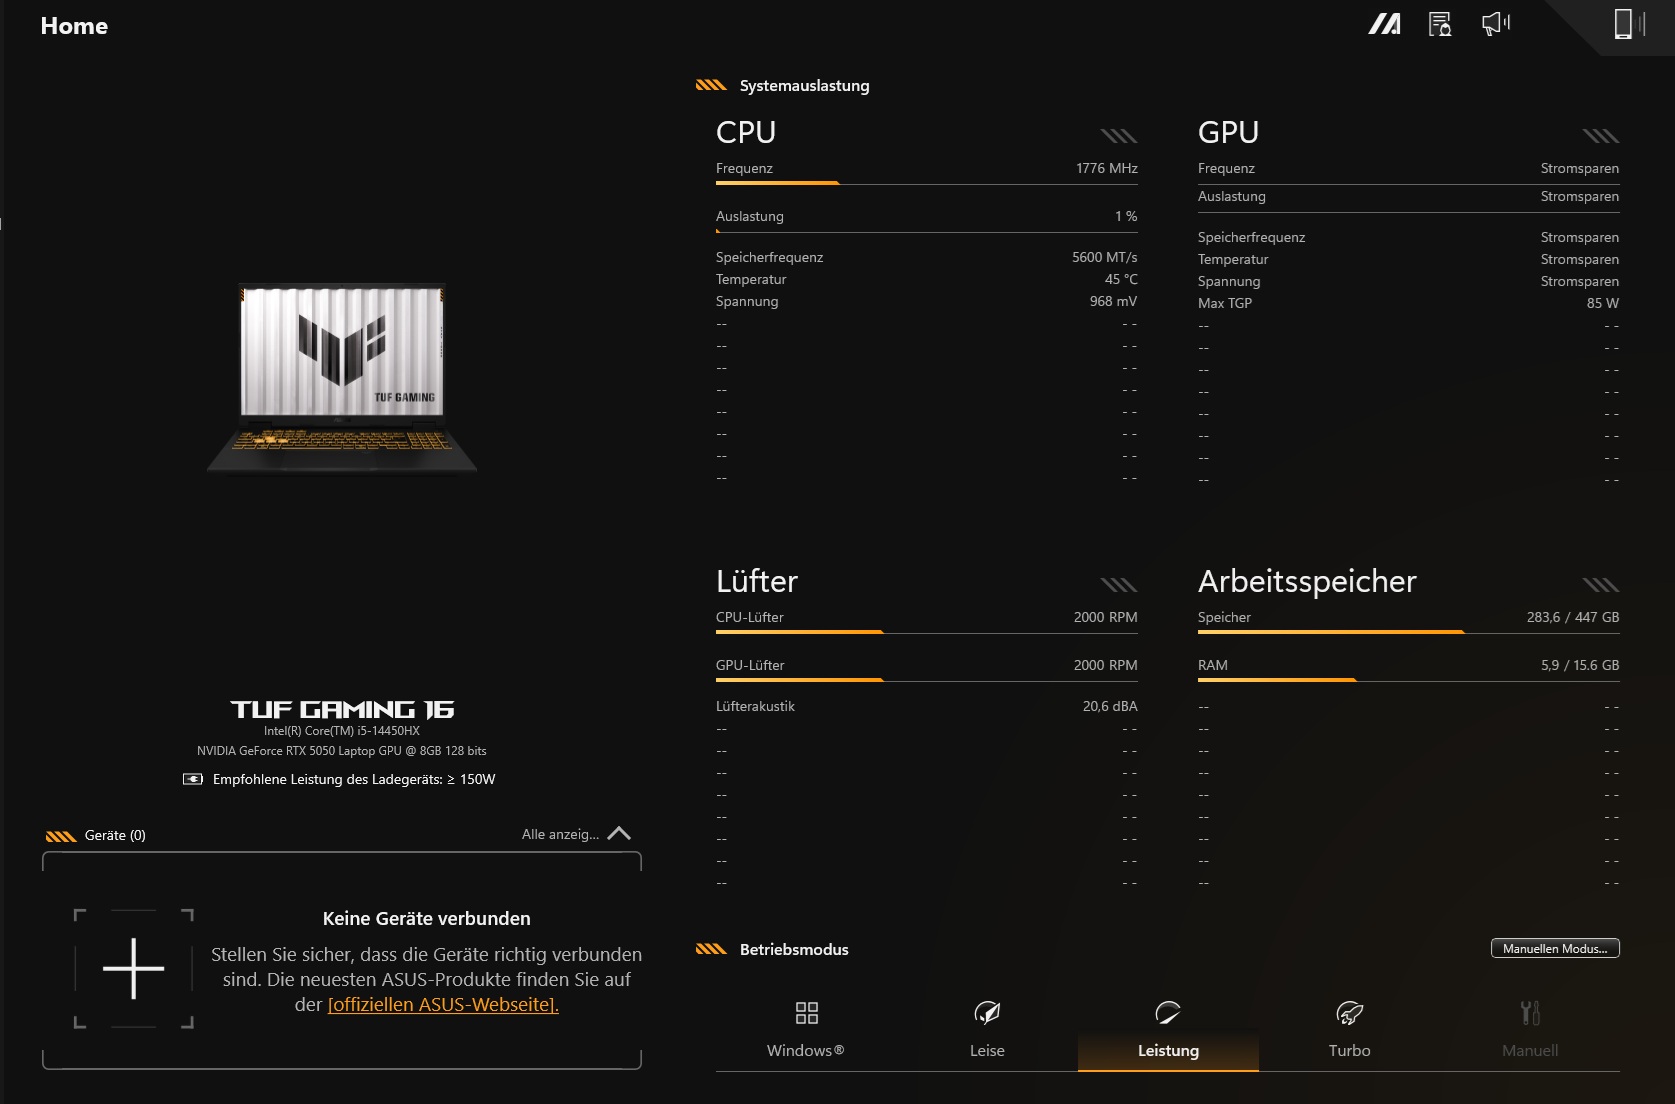
Armoury Crate
Mode Silent Performance Turbo
Cyberpunk 2077 noise 40 dB(A) 44 dB(A) 46 dB(A)
Cyberpunk 2077 frame rate (FHD/Ultra) 62.4 fps 68.9 fps 73.8 fps
GPU power draw ~50 W ~60 W ~80 W
CPU PL1 55 W 65 W 85 W
CPU PL2 65 W 65 W 85 W
Cinebench R15 multi-core score 2021 points 2058 points 2336 points

Processor performance

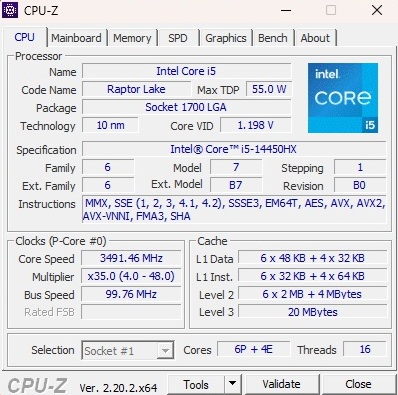
Intel's Core i5-14450HX consists of six P-cores with Hyper-Threading support and four E-cores without HT, allowing a total of 16 threads to run simultaneously. In our CPU benchmarks, the processor performs roughly on par with AMD's Ryzen 5 240. It outperforms the older Core i5-13420H and the newer Core 7 240H, while the Ryzen 7 260 and Core 7 250H are faster.

Cinebench R15 multi-core loop test

065130195260325390455520585650715780845910975104011051170123513001365143014951560162516901755182018851950201520802145221022752340240524702535260026652730279528602925299030553120Tooltip
Asus TUF Gaming 16 FX610J Intel Core i5-14450HX: Ø2000 (1913.97-2114.84) Points
Acer Nitro V 16 AI ANV16-42-R860 AMD Ryzen 5 240: Ø2062 (2047.5-2078.25) Points
MSI Cyborg 15 B2RWEKG Intel Core 7 240H: Ø1654 (1417.03-1799.86) Points
HP Victus 15-fa2160ng Intel Core i5-13420H: Ø1493 (1461.13-1737.69) Points
Medion Erazer Deputy 15 P1 MD62761 Intel Core 7 250H: Ø2774 (2639.92-3146.88) Points
Lenovo Legion 5 15AHP G10 AMD Ryzen 7 260: Ø2777 (2734.48-2831.06) Points
CPU Performance rating - Percent
Average of class Gaming
 
86.6 pt
Medion Erazer Deputy 15 P1 MD62761
Intel Core 7 250H
72.7 pt
Lenovo Legion 5 15AHP G10
AMD Ryzen 7 260
71.2 pt
Acer Nitro V 16 AI ANV16-42-R860
AMD Ryzen 5 240
59.2 pt
Asus TUF Gaming 16 FX610J
Intel Core i5-14450HX
59.1 pt
Average Intel Core i5-14450HX
 
59.1 pt
MSI Cyborg 15 B2RWEKG
Intel Core 7 240H
51.4 pt
HP Victus 15-fa2160ng
Intel Core i5-13420H
47.7 pt
Cinebench R23
Multi Core
Average of class Gaming
  (10488 - 42661, n=107, last 2 years)
27146 Points +96%
Lenovo Legion 5 15AHP G10
AMD Ryzen 7 260
17712 Points +28%
Medion Erazer Deputy 15 P1 MD62761
Intel Core 7 250H
16561 Points +19%
Asus TUF Gaming 16 FX610J
Intel Core i5-14450HX
13881 Points
Average Intel Core i5-14450HX
  (n=1)
13881 Points 0%
Acer Nitro V 16 AI ANV16-42-R860
AMD Ryzen 5 240
13013 Points -6%
HP Victus 15-fa2160ng
Intel Core i5-13420H
11084 Points -20%
MSI Cyborg 15 B2RWEKG
Intel Core 7 240H
10488 Points -24%
Single Core
Average of class Gaming
  (1601 - 2418, n=107, last 2 years)
2037 Points +11%
Medion Erazer Deputy 15 P1 MD62761
Intel Core 7 250H
1931 Points +5%
Asus TUF Gaming 16 FX610J
Intel Core i5-14450HX
1838 Points
Average Intel Core i5-14450HX
  (n=1)
1838 Points 0%
Lenovo Legion 5 15AHP G10
AMD Ryzen 7 260
1801 Points -2%
Acer Nitro V 16 AI ANV16-42-R860
AMD Ryzen 5 240
1742 Points -5%
MSI Cyborg 15 B2RWEKG
Intel Core 7 240H
1719 Points -6%
HP Victus 15-fa2160ng
Intel Core i5-13420H
1689 Points -8%
Cinebench R20
CPU (Multi Core)
Average of class Gaming
  (4029 - 16433, n=106, last 2 years)
10553 Points +98%
Medion Erazer Deputy 15 P1 MD62761
Intel Core 7 250H
7157 Points +34%
Lenovo Legion 5 15AHP G10
AMD Ryzen 7 260
6969 Points +31%
Asus TUF Gaming 16 FX610J
Intel Core i5-14450HX
5331 Points
Average Intel Core i5-14450HX
  (n=1)
5331 Points 0%
Acer Nitro V 16 AI ANV16-42-R860
AMD Ryzen 5 240
5096 Points -4%
MSI Cyborg 15 B2RWEKG
Intel Core 7 240H
4535 Points -15%
HP Victus 15-fa2160ng
Intel Core i5-13420H
4252 Points -20%
CPU (Single Core)
Average of class Gaming
  (622 - 916, n=106, last 2 years)
788 Points +12%
Medion Erazer Deputy 15 P1 MD62761
Intel Core 7 250H
744 Points +6%
Asus TUF Gaming 16 FX610J
Intel Core i5-14450HX
704 Points
Average Intel Core i5-14450HX
  (n=1)
704 Points 0%
Lenovo Legion 5 15AHP G10
AMD Ryzen 7 260
697 Points -1%
Acer Nitro V 16 AI ANV16-42-R860
AMD Ryzen 5 240
674 Points -4%
MSI Cyborg 15 B2RWEKG
Intel Core 7 240H
665 Points -6%
HP Victus 15-fa2160ng
Intel Core i5-13420H
647 Points -8%
Cinebench R15
CPU Multi 64Bit
Average of class Gaming
  (1578 - 6330, n=105, last 2 years)
4197 Points +98%
Medion Erazer Deputy 15 P1 MD62761
Intel Core 7 250H
3147 (2639.92min - 3146.88max) Points +49%
Lenovo Legion 5 15AHP G10
AMD Ryzen 7 260
2831 (2734.48min - 2831.06max) Points +34%
Asus TUF Gaming 16 FX610J
Intel Core i5-14450HX
2115 (1913.97min - 2114.84max) Points
Average Intel Core i5-14450HX
  (n=1)
2115 Points 0%
Acer Nitro V 16 AI ANV16-42-R860
AMD Ryzen 5 240
2078 (2047.5min - 2078.25max) Points -2%
MSI Cyborg 15 B2RWEKG
Intel Core 7 240H
1800 (1417.03min - 1799.86max) Points -15%
HP Victus 15-fa2160ng
Intel Core i5-13420H
1738 (1461.13min - 1737.69max) Points -18%
CPU Single 64Bit
Average of class Gaming
  (188.8 - 350, n=106, last 2 years)
300 Points +14%
Medion Erazer Deputy 15 P1 MD62761
Intel Core 7 250H
298 Points +13%
Lenovo Legion 5 15AHP G10
AMD Ryzen 7 260
283 Points +7%
Acer Nitro V 16 AI ANV16-42-R860
AMD Ryzen 5 240
270 Points +2%
Asus TUF Gaming 16 FX610J
Intel Core i5-14450HX
264 Points
Average Intel Core i5-14450HX
  (n=1)
264 Points 0%
MSI Cyborg 15 B2RWEKG
Intel Core 7 240H
249 Points -6%
HP Victus 15-fa2160ng
Intel Core i5-13420H
235 Points -11%
Blender - v2.79 BMW27 CPU
HP Victus 15-fa2160ng
Intel Core i5-13420H
319 Seconds * -38%
MSI Cyborg 15 B2RWEKG
Intel Core 7 240H
281 Seconds * -21%
Acer Nitro V 16 AI ANV16-42-R860
AMD Ryzen 5 240
245 Seconds * -6%
Asus TUF Gaming 16 FX610J
Intel Core i5-14450HX
232 Seconds *
Average Intel Core i5-14450HX
  (n=1)
232 Seconds * -0%
Lenovo Legion 5 15AHP G10
AMD Ryzen 7 260
183 Seconds * +21%
Medion Erazer Deputy 15 P1 MD62761
Intel Core 7 250H
167 Seconds * +28%
Average of class Gaming
  (79 - 330, n=104, last 2 years)
144.8 Seconds * +38%
7-Zip 18.03
7z b 4
Average of class Gaming
  (33491 - 148086, n=104, last 2 years)
92570 MIPS +60%
Medion Erazer Deputy 15 P1 MD62761
Intel Core 7 250H
75588 MIPS +31%
Lenovo Legion 5 15AHP G10
AMD Ryzen 7 260
72888 MIPS +26%
Asus TUF Gaming 16 FX610J
Intel Core i5-14450HX
57711 MIPS
Average Intel Core i5-14450HX
  (n=1)
57711 MIPS 0%
Acer Nitro V 16 AI ANV16-42-R860
AMD Ryzen 5 240
55807 MIPS -3%
MSI Cyborg 15 B2RWEKG
Intel Core 7 240H
45123 MIPS -22%
HP Victus 15-fa2160ng
Intel Core i5-13420H
40421 MIPS -30%
7z b 4 -mmt1
Medion Erazer Deputy 15 P1 MD62761
Intel Core 7 250H
6544 MIPS +8%
Lenovo Legion 5 15AHP G10
AMD Ryzen 7 260
6497 MIPS +8%
Average of class Gaming
  (4824 - 7436, n=105, last 2 years)
6477 MIPS +7%
Acer Nitro V 16 AI ANV16-42-R860
AMD Ryzen 5 240
6465 MIPS +7%
Asus TUF Gaming 16 FX610J
Intel Core i5-14450HX
6043 MIPS
Average Intel Core i5-14450HX
  (n=1)
6043 MIPS 0%
MSI Cyborg 15 B2RWEKG
Intel Core 7 240H
5061 MIPS -16%
HP Victus 15-fa2160ng
Intel Core i5-13420H
5003 MIPS -17%
Geekbench 6.7
Multi-Core
Average of class Gaming
  (6625 - 22850, n=105, last 2 years)
16375 Points +36%
Medion Erazer Deputy 15 P1 MD62761
Intel Core 7 250H
14292 Points +18%
Lenovo Legion 5 15AHP G10
AMD Ryzen 7 260
13349 Points +11%
Average Intel Core i5-14450HX
  (12068 - 12778, n=2)
12423 Points +3%
Asus TUF Gaming 16 FX610J
Intel Core i5-14450HX
12068 Points
Acer Nitro V 16 AI ANV16-42-R860
AMD Ryzen 5 240
10754 Points -11%
MSI Cyborg 15 B2RWEKG
Intel Core 7 240H
9713 Points -20%
HP Victus 15-fa2160ng
Intel Core i5-13420H
8444 Points -30%
Single-Core
Average of class Gaming
  (1982 - 3259, n=105, last 2 years)
2882 Points +13%
Medion Erazer Deputy 15 P1 MD62761
Intel Core 7 250H
2722 Points +7%
Lenovo Legion 5 15AHP G10
AMD Ryzen 7 260
2683 Points +5%
Acer Nitro V 16 AI ANV16-42-R860
AMD Ryzen 5 240
2615 Points +3%
Asus TUF Gaming 16 FX610J
Intel Core i5-14450HX
2546 Points
Average Intel Core i5-14450HX
  (2399 - 2546, n=2)
2473 Points -3%
MSI Cyborg 15 B2RWEKG
Intel Core 7 240H
2394 Points -6%
HP Victus 15-fa2160ng
Intel Core i5-13420H
2231 Points -12%
HWBOT x265 Benchmark v2.2 - 4k Preset
Average of class Gaming
  (11.5 - 44.4, n=105, last 2 years)
29.6 fps +82%
Lenovo Legion 5 15AHP G10
AMD Ryzen 7 260
22.4 fps +37%
Medion Erazer Deputy 15 P1 MD62761
Intel Core 7 250H
21.2 fps +30%
Acer Nitro V 16 AI ANV16-42-R860
AMD Ryzen 5 240
16.6 fps +2%
Asus TUF Gaming 16 FX610J
Intel Core i5-14450HX
16.3 fps
Average Intel Core i5-14450HX
  (n=1)
16.3 fps 0%
MSI Cyborg 15 B2RWEKG
Intel Core 7 240H
12.7 fps -22%
HP Victus 15-fa2160ng
Intel Core i5-13420H
12.1 fps -26%
LibreOffice - 20 Documents To PDF
Asus TUF Gaming 16 FX610J
Intel Core i5-14450HX
79.7 s *
Average Intel Core i5-14450HX
  (n=1)
79.7 s * -0%
MSI Cyborg 15 B2RWEKG
Intel Core 7 240H
72.4 s * +9%
HP Victus 15-fa2160ng
Intel Core i5-13420H
69.8 s * +12%
Acer Nitro V 16 AI ANV16-42-R860
AMD Ryzen 5 240
65.3 s * +18%
Medion Erazer Deputy 15 P1 MD62761
Intel Core 7 250H
62.7 s * +21%
Average of class Gaming
  (33.2 - 88.8, n=106, last 2 years)
50.7 s * +36%
Lenovo Legion 5 15AHP G10
AMD Ryzen 7 260
49.6 s * +38%
R Benchmark 2.5 - Overall mean
HP Victus 15-fa2160ng
Intel Core i5-13420H
0.545 sec * -10%
Acer Nitro V 16 AI ANV16-42-R860
AMD Ryzen 5 240
0.4977 sec * -0%
Asus TUF Gaming 16 FX610J
Intel Core i5-14450HX
0.4966 sec *
Average Intel Core i5-14450HX
  (n=1)
0.4966 sec * -0%
MSI Cyborg 15 B2RWEKG
Intel Core 7 240H
0.4853 sec * +2%
Lenovo Legion 5 15AHP G10
AMD Ryzen 7 260
0.4454 sec * +10%
Medion Erazer Deputy 15 P1 MD62761
Intel Core 7 250H
0.4278 sec * +14%
Average of class Gaming
  (0.3439 - 0.59, n=105, last 2 years)
0.4234 sec * +15%

* ... smaller is better

Cinebench R15 CPU Multi 64Bit
2115 Points
Cinebench R15 OpenGL 64Bit
200 fps
Cinebench R15 Ref. Match 64Bit
99.6 %
Cinebench R15 CPU Single 64Bit
264 Points
Cinebench R20 CPU (Single Core)
704 Points
Cinebench R20 CPU (Multi Core)
5331 Points
Cinebench R23 Single Core
1838 Points
Cinebench R23 Multi Core
13881 Points
Cinebench 2024 CPU Multi Core
719 Points
Cinebench 2024 CPU Single Core
108 Points
Help
Performance rating
Average of class Gaming
 
99.7 pt
Lenovo Legion 5 15AHP G10 -1!
AMD Ryzen 7 260, GeForce RTX 5060 Laptop
82.2 pt
Medion Erazer Deputy 15 P1 MD62761 -1!
Intel Core 7 250H, GeForce RTX 5060 Laptop
66.2 pt
Acer Nitro V 16 AI ANV16-42-R860 -1!
AMD Ryzen 5 240, GeForce RTX 5050 Laptop
62.8 pt
Asus TUF Gaming 16 FX610J
Intel Core i5-14450HX, GeForce RTX 5050 Laptop
50.8 pt
Average Intel Core i5-14450HX
 
50.8 pt
MSI Cyborg 15 B2RWEKG -1!
Intel Core 7 240H, GeForce RTX 5050 Laptop
45.4 pt
HP Victus 15-fa2160ng -1!
Intel Core i5-13420H, GeForce RTX 5050 Laptop
38.8 pt
AIDA64 / FP32 Ray-Trace
Average of class Gaming
  (10227 - 85542, n=105, last 2 years)
33720 KRay/s +141%
Lenovo Legion 5 15AHP G10
AMD Ryzen 7 260, GeForce RTX 5060 Laptop (v6.92.6600)
29330 KRay/s +110%
Acer Nitro V 16 AI ANV16-42-R860
AMD Ryzen 5 240, GeForce RTX 5050 Laptop (v6.92.6600)
21169 KRay/s +52%
Medion Erazer Deputy 15 P1 MD62761
Intel Core 7 250H, GeForce RTX 5060 Laptop (v6.92.6600)
17518 KRay/s +25%
Asus TUF Gaming 16 FX610J
Intel Core i5-14450HX, GeForce RTX 5050 Laptop (v8.20.8100)
13972 KRay/s
Average Intel Core i5-14450HX
  (n=1)
13972 KRay/s 0%
MSI Cyborg 15 B2RWEKG
Intel Core 7 240H, GeForce RTX 5050 Laptop (v6.92.6600)
11867 KRay/s -15%
HP Victus 15-fa2160ng
Intel Core i5-13420H, GeForce RTX 5050 Laptop (v6.92.6600)
10227 KRay/s -27%
AIDA64 / FPU Julia
Average of class Gaming
  (51376 - 372155, n=105, last 2 years)
147600 Points +111%
Lenovo Legion 5 15AHP G10
AMD Ryzen 7 260, GeForce RTX 5060 Laptop (v6.92.6600)
121427 Points +74%
Medion Erazer Deputy 15 P1 MD62761
Intel Core 7 250H, GeForce RTX 5060 Laptop (v6.92.6600)
90084 Points +29%
Acer Nitro V 16 AI ANV16-42-R860
AMD Ryzen 5 240, GeForce RTX 5050 Laptop (v6.92.6600)
87317 Points +25%
Asus TUF Gaming 16 FX610J
Intel Core i5-14450HX, GeForce RTX 5050 Laptop (v8.20.8100)
69946 Points
Average Intel Core i5-14450HX
  (n=1)
69946 Points 0%
MSI Cyborg 15 B2RWEKG
Intel Core 7 240H, GeForce RTX 5050 Laptop (v6.92.6600)
59260 Points -15%
HP Victus 15-fa2160ng
Intel Core i5-13420H, GeForce RTX 5050 Laptop (v6.92.6600)
51376 Points -27%
AIDA64 / CPU SHA3
Average of class Gaming
  (2180 - 10115, n=105, last 2 years)
6580 MB/s +124%
Lenovo Legion 5 15AHP G10
AMD Ryzen 7 260, GeForce RTX 5060 Laptop (v6.92.6600)
4980 MB/s +70%
Medion Erazer Deputy 15 P1 MD62761
Intel Core 7 250H, GeForce RTX 5060 Laptop (v6.92.6600)
4082 MB/s +39%
Acer Nitro V 16 AI ANV16-42-R860
AMD Ryzen 5 240, GeForce RTX 5050 Laptop (v6.92.6600)
3714 MB/s +27%
Asus TUF Gaming 16 FX610J
Intel Core i5-14450HX, GeForce RTX 5050 Laptop (v8.20.8100)
2932 MB/s
Average Intel Core i5-14450HX
  (n=1)
2932 MB/s 0%
HP Victus 15-fa2160ng
Intel Core i5-13420H, GeForce RTX 5050 Laptop (v6.92.6600)
2468 MB/s -16%
MSI Cyborg 15 B2RWEKG
Intel Core 7 240H, GeForce RTX 5050 Laptop (v6.92.6600)
2455 MB/s -16%
AIDA64 / FPU SinJulia
Lenovo Legion 5 15AHP G10
AMD Ryzen 7 260, GeForce RTX 5060 Laptop (v6.92.6600)
15328 Points +67%
Average of class Gaming
  (4424 - 33636, n=105, last 2 years)
14842 Points +62%
Acer Nitro V 16 AI ANV16-42-R860
AMD Ryzen 5 240, GeForce RTX 5050 Laptop (v6.92.6600)
11443 Points +25%
Medion Erazer Deputy 15 P1 MD62761
Intel Core 7 250H, GeForce RTX 5060 Laptop (v6.92.6600)
11031 Points +20%
Asus TUF Gaming 16 FX610J
Intel Core i5-14450HX, GeForce RTX 5050 Laptop (v8.20.8100)
9187 Points
Average Intel Core i5-14450HX
  (n=1)
9187 Points 0%
MSI Cyborg 15 B2RWEKG
Intel Core 7 240H, GeForce RTX 5050 Laptop (v6.92.6600)
7777 Points -15%
HP Victus 15-fa2160ng
Intel Core i5-13420H, GeForce RTX 5050 Laptop (v6.92.6600)
6589 Points -28%
AIDA64 / FPU Mandel
Average of class Gaming
  (25115 - 196829, n=105, last 2 years)
77674 Points +126%
Lenovo Legion 5 15AHP G10
AMD Ryzen 7 260, GeForce RTX 5060 Laptop (v6.92.6600)
65308 Points +90%
Acer Nitro V 16 AI ANV16-42-R860
AMD Ryzen 5 240, GeForce RTX 5050 Laptop (v6.92.6600)
47048 Points +37%
Medion Erazer Deputy 15 P1 MD62761
Intel Core 7 250H, GeForce RTX 5060 Laptop (v6.92.6600)
43385 Points +26%
Asus TUF Gaming 16 FX610J
Intel Core i5-14450HX, GeForce RTX 5050 Laptop (v8.20.8100)
34329 Points
Average Intel Core i5-14450HX
  (n=1)
34329 Points 0%
MSI Cyborg 15 B2RWEKG
Intel Core 7 240H, GeForce RTX 5050 Laptop (v6.92.6600)
29381 Points -14%
HP Victus 15-fa2160ng
Intel Core i5-13420H, GeForce RTX 5050 Laptop (v6.92.6600)
25553 Points -26%
AIDA64 / CPU AES
Average of class Gaming
  (39258 - 247074, n=105, last 2 years)
107753 MB/s +84%
Medion Erazer Deputy 15 P1 MD62761
Intel Core 7 250H, GeForce RTX 5060 Laptop (v6.92.6600)
81174 MB/s +38%
Lenovo Legion 5 15AHP G10
AMD Ryzen 7 260, GeForce RTX 5060 Laptop (v6.92.6600)
68595 MB/s +17%
Acer Nitro V 16 AI ANV16-42-R860
AMD Ryzen 5 240, GeForce RTX 5050 Laptop (v6.92.6600)
67048 MB/s +14%
Asus TUF Gaming 16 FX610J
Intel Core i5-14450HX, GeForce RTX 5050 Laptop (v8.20.8100)
58634 MB/s
Average Intel Core i5-14450HX
  (n=1)
58634 MB/s 0%
MSI Cyborg 15 B2RWEKG
Intel Core 7 240H, GeForce RTX 5050 Laptop (v6.92.6600)
50528 MB/s -14%
HP Victus 15-fa2160ng
Intel Core i5-13420H, GeForce RTX 5050 Laptop (v6.92.6600)
49420 MB/s -16%
AIDA64 / CPU ZLib
Average of class Gaming
  (574 - 2531, n=105, last 2 years)
1602 MB/s +92%
Medion Erazer Deputy 15 P1 MD62761
Intel Core 7 250H, GeForce RTX 5060 Laptop (v6.92.6600)
1236 MB/s +48%
Lenovo Legion 5 15AHP G10
AMD Ryzen 7 260, GeForce RTX 5060 Laptop (v6.92.6600)
1131 MB/s +35%
Acer Nitro V 16 AI ANV16-42-R860
AMD Ryzen 5 240, GeForce RTX 5050 Laptop (v6.92.6600)
843 MB/s +1%
Asus TUF Gaming 16 FX610J
Intel Core i5-14450HX, GeForce RTX 5050 Laptop (v8.20.8100)
835 MB/s
Average Intel Core i5-14450HX
  (n=1)
835 MB/s 0%
HP Victus 15-fa2160ng
Intel Core i5-13420H, GeForce RTX 5050 Laptop (v6.92.6600)
728 MB/s -13%
MSI Cyborg 15 B2RWEKG
Intel Core 7 240H, GeForce RTX 5050 Laptop (v6.92.6600)
725 MB/s -13%
AIDA64 / FP64 Ray-Trace
Average of class Gaming
  (5509 - 45446, n=105, last 2 years)
18109 KRay/s +137%
Lenovo Legion 5 15AHP G10
AMD Ryzen 7 260, GeForce RTX 5060 Laptop (v6.92.6600)
15751 KRay/s +106%
Acer Nitro V 16 AI ANV16-42-R860
AMD Ryzen 5 240, GeForce RTX 5050 Laptop (v6.92.6600)
11291 KRay/s +48%
Medion Erazer Deputy 15 P1 MD62761
Intel Core 7 250H, GeForce RTX 5060 Laptop (v6.92.6600)
9511 KRay/s +25%
Asus TUF Gaming 16 FX610J
Intel Core i5-14450HX, GeForce RTX 5050 Laptop (v8.20.8100)
7635 KRay/s
Average Intel Core i5-14450HX
  (n=1)
7635 KRay/s 0%
MSI Cyborg 15 B2RWEKG
Intel Core 7 240H, GeForce RTX 5050 Laptop (v6.92.6600)
6389 KRay/s -16%
HP Victus 15-fa2160ng
Intel Core i5-13420H, GeForce RTX 5050 Laptop (v6.92.6600)
5577 KRay/s -27%
AIDA64 / CPU PhotoWorxx
Average of class Gaming
  (12271 - 89891, n=105, last 2 years)
45649 MPixel/s +16%
Lenovo Legion 5 15AHP G10
AMD Ryzen 7 260, GeForce RTX 5060 Laptop (v6.92.6600)
40796 MPixel/s +4%
Medion Erazer Deputy 15 P1 MD62761
Intel Core 7 250H, GeForce RTX 5060 Laptop (v6.92.6600)
40113 MPixel/s +2%
Asus TUF Gaming 16 FX610J
Intel Core i5-14450HX, GeForce RTX 5050 Laptop (v8.20.8100)
39193 MPixel/s
Average Intel Core i5-14450HX
  (n=1)
39193 MPixel/s 0%
MSI Cyborg 15 B2RWEKG
Intel Core 7 240H, GeForce RTX 5050 Laptop (v6.92.6600)
36652 MPixel/s -6%
Acer Nitro V 16 AI ANV16-42-R860
AMD Ryzen 5 240, GeForce RTX 5050 Laptop (v6.92.6600)
33922 MPixel/s -13%
HP Victus 15-fa2160ng
Intel Core i5-13420H, GeForce RTX 5050 Laptop (v6.92.6600)
22348 MPixel/s -43%
AIDA64 / CPU CheckMate
Average of class Gaming
  (2559 - 20751, n=25, last 2 years)
7088 MP/s +177%
Asus TUF Gaming 16 FX610J
Intel Core i5-14450HX, GeForce RTX 5050 Laptop (v8.20.8100)
2559 MP/s
Average Intel Core i5-14450HX
  (n=1)
2559 MP/s 0%

System and storage performance

In the system tests, the 16-inch laptop pulls ahead of the other RTX 5050 laptops, although the selected RTX 5060 notebooks in the table perform even better. The installed Kioxia SSD also finishes in the middle of the pack.

Performance rating
Medion Erazer Deputy 15 P1 MD62761
GeForce RTX 5060 Laptop, Core 7 250H, Phison C-E80T001T2-P03D54E27T
88.4 pt
Average of class Gaming
 
88.4 pt
Lenovo Legion 5 15AHP G10
GeForce RTX 5060 Laptop, R7 260, SK hynix PVC10 HFS001TEM4X182N
81.1 pt
Asus TUF Gaming 16 FX610J
GeForce RTX 5050 Laptop, i5-14450HX, Kioxia BG6 KBG60ZNS512G
75.3 pt
Average Intel Core i5-14450HX, NVIDIA GeForce RTX 5050 Laptop
 
75.3 pt
Acer Nitro V 16 AI ANV16-42-R860
GeForce RTX 5050 Laptop, R5 240, Western Digital PC SN5000S SDEQNSJ-1T00
68.8 pt
MSI Cyborg 15 B2RWEKG -2!
GeForce RTX 5050 Laptop, Core 7 240H, Western Digital PC SN5000S SDEPMSJ-512G
66 pt
HP Victus 15-fa2160ng
GeForce RTX 5050 Laptop, i5-13420H, Samsung PM9C1 MZVL8512HELU
58.9 pt
PCMark 10 / Score
Medion Erazer Deputy 15 P1 MD62761
GeForce RTX 5060 Laptop, Core 7 250H, Phison C-E80T001T2-P03D54E27T
8844 Points +21%
Average of class Gaming
  (5828 - 12414, n=95, last 2 years)
8718 Points +20%
Lenovo Legion 5 15AHP G10
GeForce RTX 5060 Laptop, R7 260, SK hynix PVC10 HFS001TEM4X182N
8241 Points +13%
Asus TUF Gaming 16 FX610J
GeForce RTX 5050 Laptop, i5-14450HX, Kioxia BG6 KBG60ZNS512G
7292 Points
Average Intel Core i5-14450HX, NVIDIA GeForce RTX 5050 Laptop
  (n=1)
7292 Points 0%
Acer Nitro V 16 AI ANV16-42-R860
GeForce RTX 5050 Laptop, R5 240, Western Digital PC SN5000S SDEQNSJ-1T00
6901 Points -5%
HP Victus 15-fa2160ng
GeForce RTX 5050 Laptop, i5-13420H, Samsung PM9C1 MZVL8512HELU
5828 Points -20%
PCMark 10 / Essentials
Lenovo Legion 5 15AHP G10
GeForce RTX 5060 Laptop, R7 260, SK hynix PVC10 HFS001TEM4X182N
10806 Points +9%
Average of class Gaming
  (8810 - 12187, n=99, last 2 years)
10697 Points +8%
Medion Erazer Deputy 15 P1 MD62761
GeForce RTX 5060 Laptop, Core 7 250H, Phison C-E80T001T2-P03D54E27T
10007 Points +1%
Asus TUF Gaming 16 FX610J
GeForce RTX 5050 Laptop, i5-14450HX, Kioxia BG6 KBG60ZNS512G
9935 Points
Average Intel Core i5-14450HX, NVIDIA GeForce RTX 5050 Laptop
  (n=1)
9935 Points 0%
Acer Nitro V 16 AI ANV16-42-R860
GeForce RTX 5050 Laptop, R5 240, Western Digital PC SN5000S SDEQNSJ-1T00
9918 Points 0%
HP Victus 15-fa2160ng
GeForce RTX 5050 Laptop, i5-13420H, Samsung PM9C1 MZVL8512HELU
8840 Points -11%
PCMark 10 / Productivity
Medion Erazer Deputy 15 P1 MD62761
GeForce RTX 5060 Laptop, Core 7 250H, Phison C-E80T001T2-P03D54E27T
15389 Points +46%
Average of class Gaming
  (6845 - 25323, n=97, last 2 years)
12137 Points +15%
MSI Cyborg 15 B2RWEKG
GeForce RTX 5050 Laptop, Core 7 240H, Western Digital PC SN5000S SDEPMSJ-512G
11156 Points +6%
Asus TUF Gaming 16 FX610J
GeForce RTX 5050 Laptop, i5-14450HX, Kioxia BG6 KBG60ZNS512G
10540 Points
Average Intel Core i5-14450HX, NVIDIA GeForce RTX 5050 Laptop
  (n=1)
10540 Points 0%
Lenovo Legion 5 15AHP G10
GeForce RTX 5060 Laptop, R7 260, SK hynix PVC10 HFS001TEM4X182N
10163 Points -4%
Acer Nitro V 16 AI ANV16-42-R860
GeForce RTX 5050 Laptop, R5 240, Western Digital PC SN5000S SDEQNSJ-1T00
9135 Points -13%
HP Victus 15-fa2160ng
GeForce RTX 5050 Laptop, i5-13420H, Samsung PM9C1 MZVL8512HELU
6845 Points -35%
PCMark 10 / Digital Content Creation
Average of class Gaming
  (7602 - 19954, n=97, last 2 years)
14224 Points +42%
Lenovo Legion 5 15AHP G10
GeForce RTX 5060 Laptop, R7 260, SK hynix PVC10 HFS001TEM4X182N
13832 Points +38%
Medion Erazer Deputy 15 P1 MD62761
GeForce RTX 5060 Laptop, Core 7 250H, Phison C-E80T001T2-P03D54E27T
12191 Points +21%
Asus TUF Gaming 16 FX610J
GeForce RTX 5050 Laptop, i5-14450HX, Kioxia BG6 KBG60ZNS512G
10049 Points
Average Intel Core i5-14450HX, NVIDIA GeForce RTX 5050 Laptop
  (n=1)
10049 Points 0%
Acer Nitro V 16 AI ANV16-42-R860
GeForce RTX 5050 Laptop, R5 240, Western Digital PC SN5000S SDEQNSJ-1T00
9843 Points -2%
HP Victus 15-fa2160ng
GeForce RTX 5050 Laptop, i5-13420H, Samsung PM9C1 MZVL8512HELU
8879 Points -12%
MSI Cyborg 15 B2RWEKG
GeForce RTX 5050 Laptop, Core 7 240H, Western Digital PC SN5000S SDEPMSJ-512G
7602 Points -24%
CrossMark / Overall
Average of class Gaming
  (1366 - 2409, n=98, last 2 years)
1996 Points +13%
Medion Erazer Deputy 15 P1 MD62761
GeForce RTX 5060 Laptop, Core 7 250H, Phison C-E80T001T2-P03D54E27T
1995 Points +13%
Lenovo Legion 5 15AHP G10
GeForce RTX 5060 Laptop, R7 260, SK hynix PVC10 HFS001TEM4X182N
1792 Points +1%
Asus TUF Gaming 16 FX610J
GeForce RTX 5050 Laptop, i5-14450HX, Kioxia BG6 KBG60ZNS512G
1769 Points
Average Intel Core i5-14450HX, NVIDIA GeForce RTX 5050 Laptop
  (n=1)
1769 Points 0%
MSI Cyborg 15 B2RWEKG
GeForce RTX 5050 Laptop, Core 7 240H, Western Digital PC SN5000S SDEPMSJ-512G
1666 Points -6%
Acer Nitro V 16 AI ANV16-42-R860
GeForce RTX 5050 Laptop, R5 240, Western Digital PC SN5000S SDEQNSJ-1T00
1591 Points -10%
HP Victus 15-fa2160ng
GeForce RTX 5050 Laptop, i5-13420H, Samsung PM9C1 MZVL8512HELU
1366 Points -23%
CrossMark / Productivity
Medion Erazer Deputy 15 P1 MD62761
GeForce RTX 5060 Laptop, Core 7 250H, Phison C-E80T001T2-P03D54E27T
1894 Points +14%
Average of class Gaming
  (1386 - 2254, n=98, last 2 years)
1862 Points +12%
Lenovo Legion 5 15AHP G10
GeForce RTX 5060 Laptop, R7 260, SK hynix PVC10 HFS001TEM4X182N
1712 Points +3%
Asus TUF Gaming 16 FX610J
GeForce RTX 5050 Laptop, i5-14450HX, Kioxia BG6 KBG60ZNS512G
1666 Points
Average Intel Core i5-14450HX, NVIDIA GeForce RTX 5050 Laptop
  (n=1)
1666 Points 0%
MSI Cyborg 15 B2RWEKG
GeForce RTX 5050 Laptop, Core 7 240H, Western Digital PC SN5000S SDEPMSJ-512G
1577 Points -5%
Acer Nitro V 16 AI ANV16-42-R860
GeForce RTX 5050 Laptop, R5 240, Western Digital PC SN5000S SDEQNSJ-1T00
1523 Points -9%
HP Victus 15-fa2160ng
GeForce RTX 5050 Laptop, i5-13420H, Samsung PM9C1 MZVL8512HELU
1386 Points -17%
CrossMark / Creativity
Average of class Gaming
  (1343 - 2786, n=98, last 2 years)
2258 Points +15%
Medion Erazer Deputy 15 P1 MD62761
GeForce RTX 5060 Laptop, Core 7 250H, Phison C-E80T001T2-P03D54E27T
2209 Points +12%
Asus TUF Gaming 16 FX610J
GeForce RTX 5050 Laptop, i5-14450HX, Kioxia BG6 KBG60ZNS512G
1972 Points
Average Intel Core i5-14450HX, NVIDIA GeForce RTX 5050 Laptop
  (n=1)
1972 Points 0%
Lenovo Legion 5 15AHP G10
GeForce RTX 5060 Laptop, R7 260, SK hynix PVC10 HFS001TEM4X182N
1957 Points -1%
MSI Cyborg 15 B2RWEKG
GeForce RTX 5050 Laptop, Core 7 240H, Western Digital PC SN5000S SDEPMSJ-512G
1865 Points -5%
Acer Nitro V 16 AI ANV16-42-R860
GeForce RTX 5050 Laptop, R5 240, Western Digital PC SN5000S SDEQNSJ-1T00
1773 Points -10%
HP Victus 15-fa2160ng
GeForce RTX 5050 Laptop, i5-13420H, Samsung PM9C1 MZVL8512HELU
1387 Points -30%
CrossMark / Responsiveness
Medion Erazer Deputy 15 P1 MD62761
GeForce RTX 5060 Laptop, Core 7 250H, Phison C-E80T001T2-P03D54E27T
1715 Points +12%
Average of class Gaming
  (1241 - 2334, n=98, last 2 years)
1711 Points +12%
Lenovo Legion 5 15AHP G10
GeForce RTX 5060 Laptop, R7 260, SK hynix PVC10 HFS001TEM4X182N
1580 Points +3%
Asus TUF Gaming 16 FX610J
GeForce RTX 5050 Laptop, i5-14450HX, Kioxia BG6 KBG60ZNS512G
1530 Points
Average Intel Core i5-14450HX, NVIDIA GeForce RTX 5050 Laptop
  (n=1)
1530 Points 0%
MSI Cyborg 15 B2RWEKG
GeForce RTX 5050 Laptop, Core 7 240H, Western Digital PC SN5000S SDEPMSJ-512G
1403 Points -8%
Acer Nitro V 16 AI ANV16-42-R860
GeForce RTX 5050 Laptop, R5 240, Western Digital PC SN5000S SDEQNSJ-1T00
1313 Points -14%
HP Victus 15-fa2160ng
GeForce RTX 5050 Laptop, i5-13420H, Samsung PM9C1 MZVL8512HELU
1249 Points -18%
Mozilla Kraken 1.1 / Total
HP Victus 15-fa2160ng
GeForce RTX 5050 Laptop, i5-13420H, Samsung PM9C1 MZVL8512HELU
577 ms * -13%
MSI Cyborg 15 B2RWEKG
GeForce RTX 5050 Laptop, Core 7 240H, Western Digital PC SN5000S SDEPMSJ-512G
550 ms * -8%
Acer Nitro V 16 AI ANV16-42-R860
GeForce RTX 5050 Laptop, R5 240, Western Digital PC SN5000S SDEQNSJ-1T00
546 ms * -7%
Asus TUF Gaming 16 FX610J
GeForce RTX 5050 Laptop, i5-14450HX, Kioxia BG6 KBG60ZNS512G
511 ms *
Average Intel Core i5-14450HX, NVIDIA GeForce RTX 5050 Laptop
  (n=1)
511 ms * -0%
Lenovo Legion 5 15AHP G10
GeForce RTX 5060 Laptop, R7 260, SK hynix PVC10 HFS001TEM4X182N
494 ms * +3%
Medion Erazer Deputy 15 P1 MD62761
GeForce RTX 5060 Laptop, Core 7 250H, Phison C-E80T001T2-P03D54E27T
466 ms * +9%
Average of class Gaming
  (391 - 590, n=105, last 2 years)
455 ms * +11%

* ... smaller is better

PCMark 10 Score
7292 points
Help
AIDA64 / Memory Copy
Average of class Gaming
  (21750 - 129946, n=105, last 2 years)
72757 MB/s +10%
Lenovo Legion 5 15AHP G10
AMD Ryzen 7 260, GeForce RTX 5060 Laptop
69413 MB/s +5%
Medion Erazer Deputy 15 P1 MD62761
Intel Core 7 250H, GeForce RTX 5060 Laptop
66439 MB/s +1%
Asus TUF Gaming 16 FX610J
Intel Core i5-14450HX, GeForce RTX 5050 Laptop
65883 MB/s
Average Intel Core i5-14450HX
  (n=1)
65883 MB/s 0%
Acer Nitro V 16 AI ANV16-42-R860
AMD Ryzen 5 240, GeForce RTX 5050 Laptop
62035 MB/s -6%
MSI Cyborg 15 B2RWEKG
Intel Core 7 240H, GeForce RTX 5050 Laptop
60267 MB/s -9%
HP Victus 15-fa2160ng
Intel Core i5-13420H, GeForce RTX 5050 Laptop
33849 MB/s -49%
AIDA64 / Memory Read
Medion Erazer Deputy 15 P1 MD62761
Intel Core 7 250H, GeForce RTX 5060 Laptop
82104 MB/s +9%
Average of class Gaming
  (22956 - 118858, n=105, last 2 years)
75344 MB/s 0%
Asus TUF Gaming 16 FX610J
Intel Core i5-14450HX, GeForce RTX 5050 Laptop
74994 MB/s
Average Intel Core i5-14450HX
  (n=1)
74994 MB/s 0%
MSI Cyborg 15 B2RWEKG
Intel Core 7 240H, GeForce RTX 5050 Laptop
71870 MB/s -4%
Acer Nitro V 16 AI ANV16-42-R860
AMD Ryzen 5 240, GeForce RTX 5050 Laptop
61578 MB/s -18%
Lenovo Legion 5 15AHP G10
AMD Ryzen 7 260, GeForce RTX 5060 Laptop
60748 MB/s -19%
HP Victus 15-fa2160ng
Intel Core i5-13420H, GeForce RTX 5050 Laptop
37325 MB/s -50%
AIDA64 / Memory Write
Lenovo Legion 5 15AHP G10
AMD Ryzen 7 260, GeForce RTX 5060 Laptop
87114 MB/s +37%
Acer Nitro V 16 AI ANV16-42-R860
AMD Ryzen 5 240, GeForce RTX 5050 Laptop
78724 MB/s +24%
Average of class Gaming
  (22297 - 135096, n=105, last 2 years)
77034 MB/s +21%
Asus TUF Gaming 16 FX610J
Intel Core i5-14450HX, GeForce RTX 5050 Laptop
63584 MB/s
Average Intel Core i5-14450HX
  (n=1)
63584 MB/s 0%
Medion Erazer Deputy 15 P1 MD62761
Intel Core 7 250H, GeForce RTX 5060 Laptop
59452 MB/s -6%
MSI Cyborg 15 B2RWEKG
Intel Core 7 240H, GeForce RTX 5050 Laptop
59408 MB/s -7%
HP Victus 15-fa2160ng
Intel Core i5-13420H, GeForce RTX 5050 Laptop
35568 MB/s -44%
AIDA64 / Memory Latency
Average of class Gaming
  (75.3 - 151.7, n=105, last 2 years)
103.7 ns * -26%
HP Victus 15-fa2160ng
Intel Core i5-13420H, GeForce RTX 5050 Laptop
103.6 ns * -26%
MSI Cyborg 15 B2RWEKG
Intel Core 7 240H, GeForce RTX 5050 Laptop
103.3 ns * -26%
Medion Erazer Deputy 15 P1 MD62761
Intel Core 7 250H, GeForce RTX 5060 Laptop
99.2 ns * -21%
Acer Nitro V 16 AI ANV16-42-R860
AMD Ryzen 5 240, GeForce RTX 5050 Laptop
93.1 ns * -14%
Lenovo Legion 5 15AHP G10
AMD Ryzen 7 260, GeForce RTX 5060 Laptop
91.5 ns * -12%
Asus TUF Gaming 16 FX610J
Intel Core i5-14450HX, GeForce RTX 5050 Laptop
82 ns *
Average Intel Core i5-14450HX
  (n=1)
82 ns * -0%

* ... smaller is better

Kioxia BG6 KBG60ZNS512G
Sequential Read: 4068.88MB/s
Sequential Write: 2163MB/s
4K Read: 54.94MB/s
4K Write: 214.79MB/s
4K-64 Read: 1912.98MB/s
4K-64 Write: 1924.85MB/s
Access Time Read: 0.084ms
Access Time Write: 0.076ms
Score Read: 2375Points
Score Write: 2356Points
Score Total: 5850Points
Drive Performance rating - Percent
Lenovo Legion 5 15AHP G10
SK hynix PVC10 HFS001TEM4X182N
97.1 pt
Average of class Gaming
 
78.8 pt
Medion Erazer Deputy 15 P1 MD62761
Phison C-E80T001T2-P03D54E27T
72.7 pt
Asus TUF Gaming 16 FX610J
Kioxia BG6 KBG60ZNS512G
64.4 pt
Acer Nitro V 16 AI ANV16-42-R860
Western Digital PC SN5000S SDEQNSJ-1T00
58.4 pt
Average Kioxia BG6 KBG60ZNS512G
 
55.4 pt
MSI Cyborg 15 B2RWEKG
Western Digital PC SN5000S SDEPMSJ-512G
54.2 pt
HP Victus 15-fa2160ng
Samsung PM9C1 MZVL8512HELU
53 pt
DiskSpd
seq read
Lenovo Legion 5 15AHP G10
SK hynix PVC10 HFS001TEM4X182N
4177 (4138.62min - 4177.35max) MB/s +64%
Average of class Gaming
  (281 - 9494, n=103, last 2 years)
3493 MB/s +37%
Medion Erazer Deputy 15 P1 MD62761
Phison C-E80T001T2-P03D54E27T
2952 (2926.37min - 2952.37max) MB/s +16%
Acer Nitro V 16 AI ANV16-42-R860
Western Digital PC SN5000S SDEQNSJ-1T00
2660 (2570.79min - 2660.03max) MB/s +4%
Average Kioxia BG6 KBG60ZNS512G
  (2481 - 2720, n=3)
2584 MB/s +1%
Asus TUF Gaming 16 FX610J
Kioxia BG6 KBG60ZNS512G
2550 (2533.99min - 2549.72max) MB/s
MSI Cyborg 15 B2RWEKG
Western Digital PC SN5000S SDEPMSJ-512G
2509 (2410.89min - 2509.44max) MB/s -2%
HP Victus 15-fa2160ng
Samsung PM9C1 MZVL8512HELU
2348 (1978.66min - 2347.68max) MB/s -8%
seq write
Medion Erazer Deputy 15 P1 MD62761
Phison C-E80T001T2-P03D54E27T
4529 (3998.19min - 4529.18max) MB/s +52%
Lenovo Legion 5 15AHP G10
SK hynix PVC10 HFS001TEM4X182N
4263 (4214.65min - 4263.16max) MB/s +43%
Average of class Gaming
  (1057 - 9832, n=103, last 2 years)
3795 MB/s +27%
Acer Nitro V 16 AI ANV16-42-R860
Western Digital PC SN5000S SDEQNSJ-1T00
3155 (2260.73min - 3154.75max) MB/s +6%
Asus TUF Gaming 16 FX610J
Kioxia BG6 KBG60ZNS512G
2983 (2922.2min - 2982.9max) MB/s
Average Kioxia BG6 KBG60ZNS512G
  (2574 - 3273, n=3)
2943 MB/s -1%
HP Victus 15-fa2160ng
Samsung PM9C1 MZVL8512HELU
2853 (2754.08min - 2853.34max) MB/s -4%
MSI Cyborg 15 B2RWEKG
Western Digital PC SN5000S SDEPMSJ-512G
2243 (119.3min - 2243.2max) MB/s -25%
seq q8 t1 read
Average of class Gaming
  (3772 - 17459, n=103, last 2 years)
7632 MB/s +63%
Lenovo Legion 5 15AHP G10
SK hynix PVC10 HFS001TEM4X182N
6596 (6074.64min - 6596.19max) MB/s +41%
Acer Nitro V 16 AI ANV16-42-R860
Western Digital PC SN5000S SDEQNSJ-1T00
6262 (5889.43min - 6261.68max) MB/s +34%
MSI Cyborg 15 B2RWEKG
Western Digital PC SN5000S SDEPMSJ-512G
6129 (5352.13min - 6128.51max) MB/s +31%
Medion Erazer Deputy 15 P1 MD62761
Phison C-E80T001T2-P03D54E27T
5833 (4836.66min - 5833.15max) MB/s +25%
HP Victus 15-fa2160ng
Samsung PM9C1 MZVL8512HELU
5029 (4142.71min - 5029.17max) MB/s +8%
Asus TUF Gaming 16 FX610J
Kioxia BG6 KBG60ZNS512G
4674 (4240.86min - 4673.92max) MB/s
Average Kioxia BG6 KBG60ZNS512G
  (4144 - 5022, n=3)
4613 MB/s -1%
seq q8 t1 write
Average of class Gaming
  (1218 - 13519, n=103, last 2 years)
6031 MB/s +44%
Lenovo Legion 5 15AHP G10
SK hynix PVC10 HFS001TEM4X182N
5708 (5613.35min - 5708.24max) MB/s +36%
Medion Erazer Deputy 15 P1 MD62761
Phison C-E80T001T2-P03D54E27T
5415 (4922.23min - 5415.48max) MB/s +29%
Acer Nitro V 16 AI ANV16-42-R860
Western Digital PC SN5000S SDEQNSJ-1T00
4736 (2327.59min - 4735.96max) MB/s +13%
Average Kioxia BG6 KBG60ZNS512G
  (4200 - 4413, n=3)
4307 MB/s +3%
Asus TUF Gaming 16 FX610J
Kioxia BG6 KBG60ZNS512G
4200 (2919.45min - 4199.98max) MB/s
HP Victus 15-fa2160ng
Samsung PM9C1 MZVL8512HELU
2801 (2775.9min - 2801.17max) MB/s -33%
MSI Cyborg 15 B2RWEKG
Western Digital PC SN5000S SDEPMSJ-512G
2664 (120.38min - 2663.51max) MB/s -37%
4k q1 t1 read
Lenovo Legion 5 15AHP G10
SK hynix PVC10 HFS001TEM4X182N
96.1 (95.58min - 96.05max) MB/s +60%
MSI Cyborg 15 B2RWEKG
Western Digital PC SN5000S SDEPMSJ-512G
72.4 (70.14min - 72.42max) MB/s +21%
Average of class Gaming
  (32.2 - 111.2, n=103, last 2 years)
70.2 MB/s +17%
Medion Erazer Deputy 15 P1 MD62761
Phison C-E80T001T2-P03D54E27T
67.5 (56.49min - 67.52max) MB/s +13%
HP Victus 15-fa2160ng
Samsung PM9C1 MZVL8512HELU
61.8 (60.32min - 61.82max) MB/s +3%
Asus TUF Gaming 16 FX610J
Kioxia BG6 KBG60ZNS512G
59.9 (59.26min - 59.93max) MB/s
Acer Nitro V 16 AI ANV16-42-R860
Western Digital PC SN5000S SDEQNSJ-1T00
58.7 (57.59min - 58.72max) MB/s -2%
Average Kioxia BG6 KBG60ZNS512G
  (42.5 - 59.9, n=3)
50.4 MB/s -16%
4k q1 t1 write
Lenovo Legion 5 15AHP G10
SK hynix PVC10 HFS001TEM4X182N
234 (218.15min - 234.21max) MB/s +17%
Asus TUF Gaming 16 FX610J
Kioxia BG6 KBG60ZNS512G
199.7 (195.7min - 199.66max) MB/s
Medion Erazer Deputy 15 P1 MD62761
Phison C-E80T001T2-P03D54E27T
195.2 (161.99min - 195.15max) MB/s -2%
Average of class Gaming
  (96.7 - 345, n=103, last 2 years)
192.9 MB/s -3%
MSI Cyborg 15 B2RWEKG
Western Digital PC SN5000S SDEPMSJ-512G
165.7 (163.06min - 165.66max) MB/s -17%
Average Kioxia BG6 KBG60ZNS512G
  (122.9 - 199.7, n=3)
162.7 MB/s -19%
HP Victus 15-fa2160ng
Samsung PM9C1 MZVL8512HELU
152 (148.54min - 152max) MB/s -24%
Acer Nitro V 16 AI ANV16-42-R860
Western Digital PC SN5000S SDEQNSJ-1T00
133.8 (132.97min - 133.79max) MB/s -33%
4k q32 t16 read
Lenovo Legion 5 15AHP G10
SK hynix PVC10 HFS001TEM4X182N
4170 (4166.07min - 4169.94max) MB/s +58%
Asus TUF Gaming 16 FX610J
Kioxia BG6 KBG60ZNS512G
2641 (2606.73min - 2641.25max) MB/s
Medion Erazer Deputy 15 P1 MD62761
Phison C-E80T001T2-P03D54E27T
2442 (2436.68min - 2441.69max) MB/s -8%
Average of class Gaming
  (539 - 8067, n=103, last 2 years)
2305 MB/s -13%
Average Kioxia BG6 KBG60ZNS512G
  (446 - 2641, n=3)
1379 MB/s -48%
Acer Nitro V 16 AI ANV16-42-R860
Western Digital PC SN5000S SDEQNSJ-1T00
1252 (1202.88min - 1251.85max) MB/s -53%
HP Victus 15-fa2160ng
Samsung PM9C1 MZVL8512HELU
939 (881.99min - 939.36max) MB/s -64%
MSI Cyborg 15 B2RWEKG
Western Digital PC SN5000S SDEPMSJ-512G
712 (616.96min - 712.11max) MB/s -73%
4k q32 t16 write
Lenovo Legion 5 15AHP G10
SK hynix PVC10 HFS001TEM4X182N
4946 (4602min - 4946.25max) MB/s +126%
Medion Erazer Deputy 15 P1 MD62761
Phison C-E80T001T2-P03D54E27T
3313 (3213.5min - 3312.67max) MB/s +51%
Asus TUF Gaming 16 FX610J
Kioxia BG6 KBG60ZNS512G
2193 (1151.63min - 2193.05max) MB/s
Average of class Gaming
  (284 - 5653, n=103, last 2 years)
1860 MB/s -15%
Average Kioxia BG6 KBG60ZNS512G
  (341 - 2193, n=3)
1021 MB/s -53%
HP Victus 15-fa2160ng
Samsung PM9C1 MZVL8512HELU
514 (503.15min - 513.84max) MB/s -77%
MSI Cyborg 15 B2RWEKG
Western Digital PC SN5000S SDEPMSJ-512G
501 (496.59min - 500.95max) MB/s -77%
Acer Nitro V 16 AI ANV16-42-R860
Western Digital PC SN5000S SDEQNSJ-1T00
447 (433.2min - 447.25max) MB/s -80%
AS SSD
Score Total
Lenovo Legion 5 15AHP G10
SK hynix PVC10 HFS001TEM4X182N
9856 Points +68%
Average of class Gaming
  (2660 - 14159, n=101, last 2 years)
6856 Points +17%
Asus TUF Gaming 16 FX610J
Kioxia BG6 KBG60ZNS512G
5850 Points
Medion Erazer Deputy 15 P1 MD62761
Phison C-E80T001T2-P03D54E27T
5809 Points -1%
Average Kioxia BG6 KBG60ZNS512G
  (3466 - 5850, n=3)
4932 Points -16%
Acer Nitro V 16 AI ANV16-42-R860
Western Digital PC SN5000S SDEQNSJ-1T00
4227 Points -28%
MSI Cyborg 15 B2RWEKG
Western Digital PC SN5000S SDEPMSJ-512G
4035 Points -31%
HP Victus 15-fa2160ng
Samsung PM9C1 MZVL8512HELU
3745 Points -36%
Score Read
Lenovo Legion 5 15AHP G10
SK hynix PVC10 HFS001TEM4X182N
4113 Points +73%
Asus TUF Gaming 16 FX610J
Kioxia BG6 KBG60ZNS512G
2375 Points
Average of class Gaming
  (953 - 5082, n=101, last 2 years)
2277 Points -4%
Average Kioxia BG6 KBG60ZNS512G
  (1088 - 2375, n=3)
1682 Points -29%
Medion Erazer Deputy 15 P1 MD62761
Phison C-E80T001T2-P03D54E27T
1636 Points -31%
MSI Cyborg 15 B2RWEKG
Western Digital PC SN5000S SDEPMSJ-512G
1323 Points -44%
Acer Nitro V 16 AI ANV16-42-R860
Western Digital PC SN5000S SDEQNSJ-1T00
1185 Points -50%
HP Victus 15-fa2160ng
Samsung PM9C1 MZVL8512HELU
1148 Points -52%
Score Write
Lenovo Legion 5 15AHP G10
SK hynix PVC10 HFS001TEM4X182N
3687 Points +56%
Average of class Gaming
  (460 - 6457, n=101, last 2 years)
3494 Points +48%
Medion Erazer Deputy 15 P1 MD62761
Phison C-E80T001T2-P03D54E27T
3451 Points +46%
Acer Nitro V 16 AI ANV16-42-R860
Western Digital PC SN5000S SDEQNSJ-1T00
2488 Points +6%
Average Kioxia BG6 KBG60ZNS512G
  (1903 - 3132, n=3)
2464 Points +5%
Asus TUF Gaming 16 FX610J
Kioxia BG6 KBG60ZNS512G
2356 Points
MSI Cyborg 15 B2RWEKG
Western Digital PC SN5000S SDEPMSJ-512G
2125 Points -10%
HP Victus 15-fa2160ng
Samsung PM9C1 MZVL8512HELU
2059 Points -13%
Seq Read
Average of class Gaming
  (2346 - 10238, n=101, last 2 years)
5648 MB/s +39%
Lenovo Legion 5 15AHP G10
SK hynix PVC10 HFS001TEM4X182N
5639 MB/s +39%
MSI Cyborg 15 B2RWEKG
Western Digital PC SN5000S SDEPMSJ-512G
4919.02 MB/s +21%
Medion Erazer Deputy 15 P1 MD62761
Phison C-E80T001T2-P03D54E27T
4658.9 MB/s +15%
Asus TUF Gaming 16 FX610J
Kioxia BG6 KBG60ZNS512G
4068.88 MB/s
Acer Nitro V 16 AI ANV16-42-R860
Western Digital PC SN5000S SDEQNSJ-1T00
4020.55 MB/s -1%
Average Kioxia BG6 KBG60ZNS512G
  (3932 - 4069, n=3)
4008 MB/s -1%
HP Victus 15-fa2160ng
Samsung PM9C1 MZVL8512HELU
3244.89 MB/s -20%
Seq Write
Lenovo Legion 5 15AHP G10
SK hynix PVC10 HFS001TEM4X182N
4751 MB/s +120%
Average of class Gaming
  (114.5 - 10726, n=101, last 2 years)
3878 MB/s +79%
Acer Nitro V 16 AI ANV16-42-R860
Western Digital PC SN5000S SDEQNSJ-1T00
2714.59 MB/s +26%
MSI Cyborg 15 B2RWEKG
Western Digital PC SN5000S SDEPMSJ-512G
2623.25 MB/s +21%
Average Kioxia BG6 KBG60ZNS512G
  (2084 - 2944, n=3)
2397 MB/s +11%
Medion Erazer Deputy 15 P1 MD62761
Phison C-E80T001T2-P03D54E27T
2297.25 MB/s +6%
Asus TUF Gaming 16 FX610J
Kioxia BG6 KBG60ZNS512G
2163 MB/s
HP Victus 15-fa2160ng
Samsung PM9C1 MZVL8512HELU
1896.49 MB/s -12%
4K Read
Lenovo Legion 5 15AHP G10
SK hynix PVC10 HFS001TEM4X182N
88 MB/s +60%
MSI Cyborg 15 B2RWEKG
Western Digital PC SN5000S SDEPMSJ-512G
80.41 MB/s +46%
Average of class Gaming
  (36.4 - 108.4, n=101, last 2 years)
70.4 MB/s +28%
HP Victus 15-fa2160ng
Samsung PM9C1 MZVL8512HELU
61.02 MB/s +11%
Asus TUF Gaming 16 FX610J
Kioxia BG6 KBG60ZNS512G
54.94 MB/s
Acer Nitro V 16 AI ANV16-42-R860
Western Digital PC SN5000S SDEQNSJ-1T00
53.85 MB/s -2%
Average Kioxia BG6 KBG60ZNS512G
  (48.1 - 54.9, n=3)
51.1 MB/s -7%
Medion Erazer Deputy 15 P1 MD62761
Phison C-E80T001T2-P03D54E27T
46.19 MB/s -16%
4K Write
MSI Cyborg 15 B2RWEKG
Western Digital PC SN5000S SDEPMSJ-512G
217.62 MB/s +1%
Asus TUF Gaming 16 FX610J
Kioxia BG6 KBG60ZNS512G
214.79 MB/s
Average of class Gaming
  (75.6 - 307, n=101, last 2 years)
213 MB/s -1%
Lenovo Legion 5 15AHP G10
SK hynix PVC10 HFS001TEM4X182N
198.4 MB/s -8%
Medion Erazer Deputy 15 P1 MD62761
Phison C-E80T001T2-P03D54E27T
197.94 MB/s -8%
Average Kioxia BG6 KBG60ZNS512G
  (165.6 - 215, n=3)
192.3 MB/s -10%
HP Victus 15-fa2160ng
Samsung PM9C1 MZVL8512HELU
185.71 MB/s -14%
Acer Nitro V 16 AI ANV16-42-R860
Western Digital PC SN5000S SDEQNSJ-1T00
152.41 MB/s -29%
4K-64 Read
Lenovo Legion 5 15AHP G10
SK hynix PVC10 HFS001TEM4X182N
3461 MB/s +81%
Asus TUF Gaming 16 FX610J
Kioxia BG6 KBG60ZNS512G
1912.98 MB/s
Average of class Gaming
  (517 - 3977, n=101, last 2 years)
1642 MB/s -14%
Average Kioxia BG6 KBG60ZNS512G
  (647 - 1913, n=3)
1231 MB/s -36%
Medion Erazer Deputy 15 P1 MD62761
Phison C-E80T001T2-P03D54E27T
1123.43 MB/s -41%
HP Victus 15-fa2160ng
Samsung PM9C1 MZVL8512HELU
762.74 MB/s -60%
MSI Cyborg 15 B2RWEKG
Western Digital PC SN5000S SDEPMSJ-512G
750.53 MB/s -61%
Acer Nitro V 16 AI ANV16-42-R860
Western Digital PC SN5000S SDEQNSJ-1T00
729.31 MB/s -62%
4K-64 Write
Medion Erazer Deputy 15 P1 MD62761
Phison C-E80T001T2-P03D54E27T
3023.1 MB/s +57%
Lenovo Legion 5 15AHP G10
SK hynix PVC10 HFS001TEM4X182N
3013 MB/s +57%
Average of class Gaming
  (90.2 - 5356, n=101, last 2 years)
2895 MB/s +50%
Acer Nitro V 16 AI ANV16-42-R860
Western Digital PC SN5000S SDEQNSJ-1T00
2063.86 MB/s +7%
Average Kioxia BG6 KBG60ZNS512G
  (1529 - 2641, n=3)
2031 MB/s +6%
Asus TUF Gaming 16 FX610J
Kioxia BG6 KBG60ZNS512G
1924.85 MB/s
HP Victus 15-fa2160ng
Samsung PM9C1 MZVL8512HELU
1683.79 MB/s -13%
MSI Cyborg 15 B2RWEKG
Western Digital PC SN5000S SDEPMSJ-512G
1645 MB/s -15%
Access Time Read
MSI Cyborg 15 B2RWEKG
Western Digital PC SN5000S SDEPMSJ-512G
0.623 ms * -642%
HP Victus 15-fa2160ng
Samsung PM9C1 MZVL8512HELU
0.146 ms * -74%
Medion Erazer Deputy 15 P1 MD62761
Phison C-E80T001T2-P03D54E27T
0.126 ms * -50%
Asus TUF Gaming 16 FX610J
Kioxia BG6 KBG60ZNS512G
0.084 ms *
Acer Nitro V 16 AI ANV16-42-R860
Western Digital PC SN5000S SDEQNSJ-1T00
0.072 ms * +14%
Average of class Gaming
  (0.017 - 0.623, n=101, last 2 years)
0.06792 ms * +19%
Average Kioxia BG6 KBG60ZNS512G
  (0.041 - 0.084, n=3)
0.06533 ms * +22%
Lenovo Legion 5 15AHP G10
SK hynix PVC10 HFS001TEM4X182N
0.041 ms * +51%
Access Time Write
Average Kioxia BG6 KBG60ZNS512G
  (0.076 - 0.261, n=3)
0.14 ms * -84%
Asus TUF Gaming 16 FX610J
Kioxia BG6 KBG60ZNS512G
0.076 ms *
Average of class Gaming
  (0.012 - 0.277, n=101, last 2 years)
0.04219 ms * +44%
Acer Nitro V 16 AI ANV16-42-R860
Western Digital PC SN5000S SDEQNSJ-1T00
0.026 ms * +66%
MSI Cyborg 15 B2RWEKG
Western Digital PC SN5000S SDEPMSJ-512G
0.026 ms * +66%
Lenovo Legion 5 15AHP G10
SK hynix PVC10 HFS001TEM4X182N
0.021 ms * +72%
HP Victus 15-fa2160ng
Samsung PM9C1 MZVL8512HELU
0.02 ms * +74%
Medion Erazer Deputy 15 P1 MD62761
Phison C-E80T001T2-P03D54E27T
0.018 ms * +76%

* ... smaller is better

Sustained read performance: DiskSpd read loop, queue depth 8

013527040554067581094510801215135014851620175518902025216022952430256527002835297031053240337535103645378039154050418543204455459047254860499551305265540055355670580559406075621063456480Tooltip
Asus TUF Gaming 16 FX610J Kioxia BG6 KBG60ZNS512G; diskspd 2.0.17 f: Ø4758 (4222.04-4807.51) MB/s
Acer Nitro V 16 AI ANV16-42-R860 Western Digital PC SN5000S SDEQNSJ-1T00; diskspd 2.0.17 f: Ø5912 (4947.56-6263.77) MB/s
MSI Cyborg 15 B2RWEKG Western Digital PC SN5000S SDEPMSJ-512G; diskspd 2.0.17 f: Ø6023 (4921.16-6071.9) MB/s
HP Victus 15-fa2160ng Samsung PM9C1 MZVL8512HELU; diskspd 2.0.17 f: Ø4980 (2883.06-5021.63) MB/s
Medion Erazer Deputy 15 P1 MD62761 Phison C-E80T001T2-P03D54E27T; diskspd 2.0.17 f: Ø5801 (4932.28-5826.01) MB/s
Lenovo Legion 5 15AHP G10 SK hynix PVC10 HFS001TEM4X182N; diskspd 2.0.17 f: Ø6573 (6108.16-6593.26) MB/s

GPU and gaming performance

The RTX 5060's smaller sibling also comes with 8 GB of GDDR7 VRAM, but the number of shader units has been reduced from 3,328 to just 2,560. In the 3DMark tests, the TUF Gaming 16 performs in line with the average we have measured so far for the RTX 5050, delivering an unremarkable showing. The same applies to our gaming benchmarks. If you stick to high detail settings and disable ray tracing, most games run smoothly at Full HD even without DLSS and similar features, although 8 GB will, of course, remain a limitation in the long term.

3DMark Performance rating - Percent
Average of class Gaming
 
97.7 pt
Lenovo Legion 5 15AHP G10 -1!
NVIDIA GeForce RTX 5060 Laptop, AMD Ryzen 7 260
80.6 pt
Medion Erazer Deputy 15 P1 MD62761
NVIDIA GeForce RTX 5060 Laptop, Intel Core 7 250H
80.1 pt
HP Victus 15-fa2160ng
NVIDIA GeForce RTX 5050 Laptop, Intel Core i5-13420H
68.3 pt
Acer Nitro V 16 AI ANV16-42-R860
NVIDIA GeForce RTX 5050 Laptop, AMD Ryzen 5 240
67 pt
Average NVIDIA GeForce RTX 5050 Laptop
 
63.5 pt
Asus TUF Gaming 16 FX610J
NVIDIA GeForce RTX 5050 Laptop, Intel Core i5-14450HX
62 pt
MSI Cyborg 15 B2RWEKG
NVIDIA GeForce RTX 5050 Laptop, Intel Core 7 240H
50.2 pt
3DMark 11 - 1280x720 Performance GPU
Average of class Gaming
  (21841 - 80022, n=106, last 2 years)
50162 Points +70%
Lenovo Legion 5 15AHP G10
NVIDIA GeForce RTX 5060 Laptop, AMD Ryzen 7 260
41490 Points +41%
Medion Erazer Deputy 15 P1 MD62761
NVIDIA GeForce RTX 5060 Laptop, Intel Core 7 250H
37230 Points +26%
Acer Nitro V 16 AI ANV16-42-R860
NVIDIA GeForce RTX 5050 Laptop, AMD Ryzen 5 240
32220 Points +9%
HP Victus 15-fa2160ng
NVIDIA GeForce RTX 5050 Laptop, Intel Core i5-13420H
32115 Points +9%
Average NVIDIA GeForce RTX 5050 Laptop
  (21841 - 33119, n=8)
29918 Points +1%
Asus TUF Gaming 16 FX610J
NVIDIA GeForce RTX 5050 Laptop, Intel Core i5-14450HX
29519 Points
MSI Cyborg 15 B2RWEKG
NVIDIA GeForce RTX 5050 Laptop, Intel Core 7 240H
21841 Points -26%
3DMark
1280x720 Cloud Gate Standard Graphics
Medion Erazer Deputy 15 P1 MD62761
NVIDIA GeForce RTX 5060 Laptop, Intel Core 7 250H
164073 Points +31%
Average of class Gaming
  (86886 - 223650, n=66, last 2 years)
149072 Points +19%
HP Victus 15-fa2160ng
NVIDIA GeForce RTX 5050 Laptop, Intel Core i5-13420H
138945 Points +11%
Average NVIDIA GeForce RTX 5050 Laptop
  (100222 - 149542, n=8)
126741 Points +1%
Asus TUF Gaming 16 FX610J
NVIDIA GeForce RTX 5050 Laptop, Intel Core i5-14450HX
125573 Points
Acer Nitro V 16 AI ANV16-42-R860
NVIDIA GeForce RTX 5050 Laptop, AMD Ryzen 5 240
124650 Points -1%
MSI Cyborg 15 B2RWEKG
NVIDIA GeForce RTX 5050 Laptop, Intel Core 7 240H
100222 Points -20%
1920x1080 Fire Strike Graphics
Average of class Gaming
  (18629 - 62849, n=114, last 2 years)
39864 Points +63%
Lenovo Legion 5 15AHP G10
NVIDIA GeForce RTX 5060 Laptop, AMD Ryzen 7 260
33193 Points +36%
Medion Erazer Deputy 15 P1 MD62761
NVIDIA GeForce RTX 5060 Laptop, Intel Core 7 250H
31012 Points +27%
HP Victus 15-fa2160ng
NVIDIA GeForce RTX 5050 Laptop, Intel Core i5-13420H
27025 Points +10%
Acer Nitro V 16 AI ANV16-42-R860
NVIDIA GeForce RTX 5050 Laptop, AMD Ryzen 5 240
26850 Points +10%
Average NVIDIA GeForce RTX 5050 Laptop
  (20726 - 28040, n=11)
24797 Points +1%
Asus TUF Gaming 16 FX610J
NVIDIA GeForce RTX 5050 Laptop, Intel Core i5-14450HX
24488 Points
MSI Cyborg 15 B2RWEKG
NVIDIA GeForce RTX 5050 Laptop, Intel Core 7 240H
20726 Points -15%
2560x1440 Time Spy Graphics
Average of class Gaming
  (6387 - 26212, n=114, last 2 years)
16221 Points +95%
Lenovo Legion 5 15AHP G10
NVIDIA GeForce RTX 5060 Laptop, AMD Ryzen 7 260
12306 Points +48%
Medion Erazer Deputy 15 P1 MD62761
NVIDIA GeForce RTX 5060 Laptop, Intel Core 7 250H
11067 Points +33%
Acer Nitro V 16 AI ANV16-42-R860
NVIDIA GeForce RTX 5050 Laptop, AMD Ryzen 5 240
9814 Points +18%
HP Victus 15-fa2160ng
NVIDIA GeForce RTX 5050 Laptop, Intel Core i5-13420H
9202 Points +11%
Average NVIDIA GeForce RTX 5050 Laptop
  (7166 - 9828, n=10)
8892 Points +7%
Asus TUF Gaming 16 FX610J
NVIDIA GeForce RTX 5050 Laptop, Intel Core i5-14450HX
8301 Points
MSI Cyborg 15 B2RWEKG
NVIDIA GeForce RTX 5050 Laptop, Intel Core 7 240H
7166 Points -14%
3DMark 06 Standard Score
50645 points
3DMark 11 Performance
25795 points
3DMark Cloud Gate Standard Score
54116 points
3DMark Fire Strike Score
20110 points
3DMark Time Spy Score
8648 points
Help
Blender
v3.3 Classroom OPTIX/RTX
Average NVIDIA GeForce RTX 5050 Laptop
  (24 - 242, n=11)
46.9 Seconds * -74%
MSI Cyborg 15 B2RWEKG
NVIDIA GeForce RTX 5050 Laptop, Intel Core 7 240H
31 Seconds * -15%
HP Victus 15-fa2160ng
NVIDIA GeForce RTX 5050 Laptop, Intel Core i5-13420H
28 Seconds * -4%
Medion Erazer Deputy 15 P1 MD62761
NVIDIA GeForce RTX 5060 Laptop, Intel Core 7 250H
28 Seconds * -4%
Asus TUF Gaming 16 FX610J
NVIDIA GeForce RTX 5050 Laptop, Intel Core i5-14450HX
27 Seconds *
Acer Nitro V 16 AI ANV16-42-R860
NVIDIA GeForce RTX 5050 Laptop, AMD Ryzen 5 240
26 Seconds * +4%
Lenovo Legion 5 15AHP G10
NVIDIA GeForce RTX 5060 Laptop, AMD Ryzen 7 260
21 Seconds * +22%
Average of class Gaming
  (9 - 32, n=105, last 2 years)
17.9 Seconds * +34%
v3.3 Classroom CUDA
Average NVIDIA GeForce RTX 5050 Laptop
  (49 - 214, n=11)
66 Seconds * -35%
MSI Cyborg 15 B2RWEKG
NVIDIA GeForce RTX 5050 Laptop, Intel Core 7 240H
59 Seconds * -20%
HP Victus 15-fa2160ng
NVIDIA GeForce RTX 5050 Laptop, Intel Core i5-13420H
50 Seconds * -2%
Acer Nitro V 16 AI ANV16-42-R860
NVIDIA GeForce RTX 5050 Laptop, AMD Ryzen 5 240
49 Seconds * -0%
Asus TUF Gaming 16 FX610J
NVIDIA GeForce RTX 5050 Laptop, Intel Core i5-14450HX
49 Seconds *
Medion Erazer Deputy 15 P1 MD62761
NVIDIA GeForce RTX 5060 Laptop, Intel Core 7 250H
41 Seconds * +16%
Lenovo Legion 5 15AHP G10
NVIDIA GeForce RTX 5060 Laptop, AMD Ryzen 7 260
38 Seconds * +22%
Average of class Gaming
  (15 - 228, n=106, last 2 years)
31.6 Seconds * +36%

* ... smaller is better

Performance rating - Percent
Average of class Gaming
 
100 pt
Lenovo Legion 5 15AHP G10
AMD Ryzen 7 260, NVIDIA GeForce RTX 5060 Laptop
83.8 pt
Medion Erazer Deputy 15 P1 MD62761
Intel Core 7 250H, NVIDIA GeForce RTX 5060 Laptop
79.7 pt
Acer Nitro V 16 AI ANV16-42-R860
AMD Ryzen 5 240, NVIDIA GeForce RTX 5050 Laptop
67.3 pt
Asus TUF Gaming 16 FX610J
Intel Core i5-14450HX, NVIDIA GeForce RTX 5050 Laptop
67.2 pt
HP Victus 15-fa2160ng
Intel Core i5-13420H, NVIDIA GeForce RTX 5050 Laptop
61.8 pt
MSI Cyborg 15 B2RWEKG
Intel Core 7 240H, NVIDIA GeForce RTX 5050 Laptop
52.7 pt
Cyberpunk 2077 - 1920x1080 Ultra Preset (FSR off)
Average of class Gaming
  (47.3 - 169.9, n=114, last 2 years)
112.5 fps +63%
Lenovo Legion 5 15AHP G10
AMD Ryzen 7 260, NVIDIA GeForce RTX 5060 Laptop
90.8 (73.9min) fps +32%
Medion Erazer Deputy 15 P1 MD62761
Intel Core 7 250H, NVIDIA GeForce RTX 5060 Laptop
83.3 (69min) fps +21%
Acer Nitro V 16 AI ANV16-42-R860
AMD Ryzen 5 240, NVIDIA GeForce RTX 5050 Laptop
75.2 (62min) fps +9%
HP Victus 15-fa2160ng
Intel Core i5-13420H, NVIDIA GeForce RTX 5050 Laptop
71 (56min) fps +3%
Asus TUF Gaming 16 FX610J
Intel Core i5-14450HX, NVIDIA GeForce RTX 5050 Laptop
68.9 (55min) fps
MSI Cyborg 15 B2RWEKG
Intel Core 7 240H, NVIDIA GeForce RTX 5050 Laptop
55.3 (45min) fps -20%
Baldur's Gate 3 - 1920x1080 Ultra Preset AA:T
Average of class Gaming
  (59.4 - 246, n=110, last 2 years)
142.2 fps +101%
Lenovo Legion 5 15AHP G10
AMD Ryzen 7 260, NVIDIA GeForce RTX 5060 Laptop
110.7 fps +57%
Medion Erazer Deputy 15 P1 MD62761
Intel Core 7 250H, NVIDIA GeForce RTX 5060 Laptop
95.6 (82.3min, 83.8P0.1, 87P1) fps +35%
Acer Nitro V 16 AI ANV16-42-R860
AMD Ryzen 5 240, NVIDIA GeForce RTX 5050 Laptop
80.7 (41.5min, 52P0.1, 73.2P1) fps +14%
HP Victus 15-fa2160ng
Intel Core i5-13420H, NVIDIA GeForce RTX 5050 Laptop
80.4 (32.8min, 47.1P0.1, 69.4P1) fps +14%
Asus TUF Gaming 16 FX610J
Intel Core i5-14450HX, NVIDIA GeForce RTX 5050 Laptop
70.7 (62.1min, 62.5P0.1, 64.6P1) fps
MSI Cyborg 15 B2RWEKG
Intel Core 7 240H, NVIDIA GeForce RTX 5050 Laptop
59.4 (43.6min, 44.7P0.1, 48.8P1) fps -16%
X-Plane 11.11 - 1920x1080 high (fps_test=3)
Average of class Gaming
  (55.5 - 148.5, n=109, last 2 years)
99.5 fps +10%
Medion Erazer Deputy 15 P1 MD62761
Intel Core 7 250H, NVIDIA GeForce RTX 5060 Laptop
97.3 fps +8%
Lenovo Legion 5 15AHP G10
AMD Ryzen 7 260, NVIDIA GeForce RTX 5060 Laptop
92.4 fps +2%
Asus TUF Gaming 16 FX610J
Intel Core i5-14450HX, NVIDIA GeForce RTX 5050 Laptop
90.3 fps
Acer Nitro V 16 AI ANV16-42-R860
AMD Ryzen 5 240, NVIDIA GeForce RTX 5050 Laptop
78 fps -14%
MSI Cyborg 15 B2RWEKG
Intel Core 7 240H, NVIDIA GeForce RTX 5050 Laptop
66.9 fps -26%
HP Victus 15-fa2160ng
Intel Core i5-13420H, NVIDIA GeForce RTX 5050 Laptop
65.5 fps -27%
lowmed.highultra
Dota 2 Reborn (2015) 185.9 166.5 159 152
X-Plane 11.11 (2018) 114.6 100.8 90.3
Baldur's Gate 3 (2023) 90.3 74.4 70.7
Cyberpunk 2077 (2023) 90.3 77 68.9
Resident Evil Requiem (2026) 75.7 71.5 32.9
Death Stranding 2 (2026) 56.5 50.1 38.4
Crimson Desert (2026) 46.8 46.4 39.1
Pragmata (2026) 81.8 64.7
007 First Light (2026) 56 47.6 45.5
Assassin's Creed Black Flag Resynced (2026) 57 50 32
Control Resonant (2026) 42.2 35.4 11.4

Cyberpunk 2077 Ultra FPS chart

05101520253035404550556065707580Tooltip
Asus TUF Gaming 16 FX610J i5-14450HX, GeForce RTX 5050 Laptop: Ø61.6 (59.1-62.3) fps
Acer Nitro V 16 AI ANV16-42-R860 R5 240, GeForce RTX 5050 Laptop: Ø66.3 (63-67) fps
MSI Cyborg 15 B2RWEKG Core 7 240H, GeForce RTX 5050 Laptop: Ø53 (50.4-53.6) fps
HP Victus 15-fa2160ng i5-13420H, GeForce RTX 5050 Laptop: Ø65.9 (61.8-66.6) fps
Medion Erazer Deputy 15 P1 MD62761 Core 7 250H, GeForce RTX 5060 Laptop: Ø75.2 (72.3-76.4) fps
Lenovo Legion 5 15AHP G10 R7 260, GeForce RTX 5060 Laptop: Ø82.5 (77.1-83.6) fps

Emissions & energy

Noise emissions

The TUF Gaming 16 generally remains pleasantly quiet at idle, although the fans occasionally ramp up slightly. Under load in Performance mode, our meter recorded between 41 and 46 dB(A), which is less than most competitors.

Noise level

Idle
24 / 25 / 26 dB(A)
Load
41 / 46 dB(A)
  red to green bar
 
 
30 dB
silent
40 dB(A)
audible
50 dB(A)
loud
 
min: dark, med: mid, max: light   Earthworks M23R, Arta (15 cm distance)   environment noise: 24 dB(A)
Asus TUF Gaming 16 FX610J
i5-14450HX, GeForce RTX 5050 Laptop
Acer Nitro V 16 AI ANV16-42-R860
R5 240, GeForce RTX 5050 Laptop
MSI Cyborg 15 B2RWEKG
Core 7 240H, GeForce RTX 5050 Laptop
HP Victus 15-fa2160ng
i5-13420H, GeForce RTX 5050 Laptop
Medion Erazer Deputy 15 P1 MD62761
Core 7 250H, GeForce RTX 5060 Laptop
Lenovo Legion 5 15AHP G10
R7 260, GeForce RTX 5060 Laptop
Noise
-10%
-9%
-8%
-18%
-3%
off / environment * (dB)
24
25
-4%
24
-0%
24
-0%
25
-4%
25.5
-6%
Idle Minimum * (dB)
24
25
-4%
25
-4%
28
-17%
27
-13%
25.5
-6%
Idle Average * (dB)
25
30
-20%
28
-12%
29
-16%
29
-16%
25.5
-2%
Idle Maximum * (dB)
26
33
-27%
33
-27%
30
-15%
32
-23%
26.9
-3%
Load Average * (dB)
41
38
7%
44
-7%
40
2%
50
-22%
34.6
16%
Cyberpunk 2077 ultra * (dB)
44
49
-11%
45
-2%
46
-5%
55
-25%
50.1
-14%
Load Maximum * (dB)
46
50
-9%
50
-9%
48
-4%
56
-22%
50.1
-9%

* ... smaller is better

Temperature

Temperatures also remain within reasonable limits. In our stress test using FurMark and Prime95, the device reached a maximum of 44 °C (111.2 °F) on the top and 42 °C (107.6 °F) on the bottom. These figures could just as easily have come from the HP Victus 15. CPU and GPU temperatures settled at just under 70 °C (158 °F) during the stress test—also moderate results.
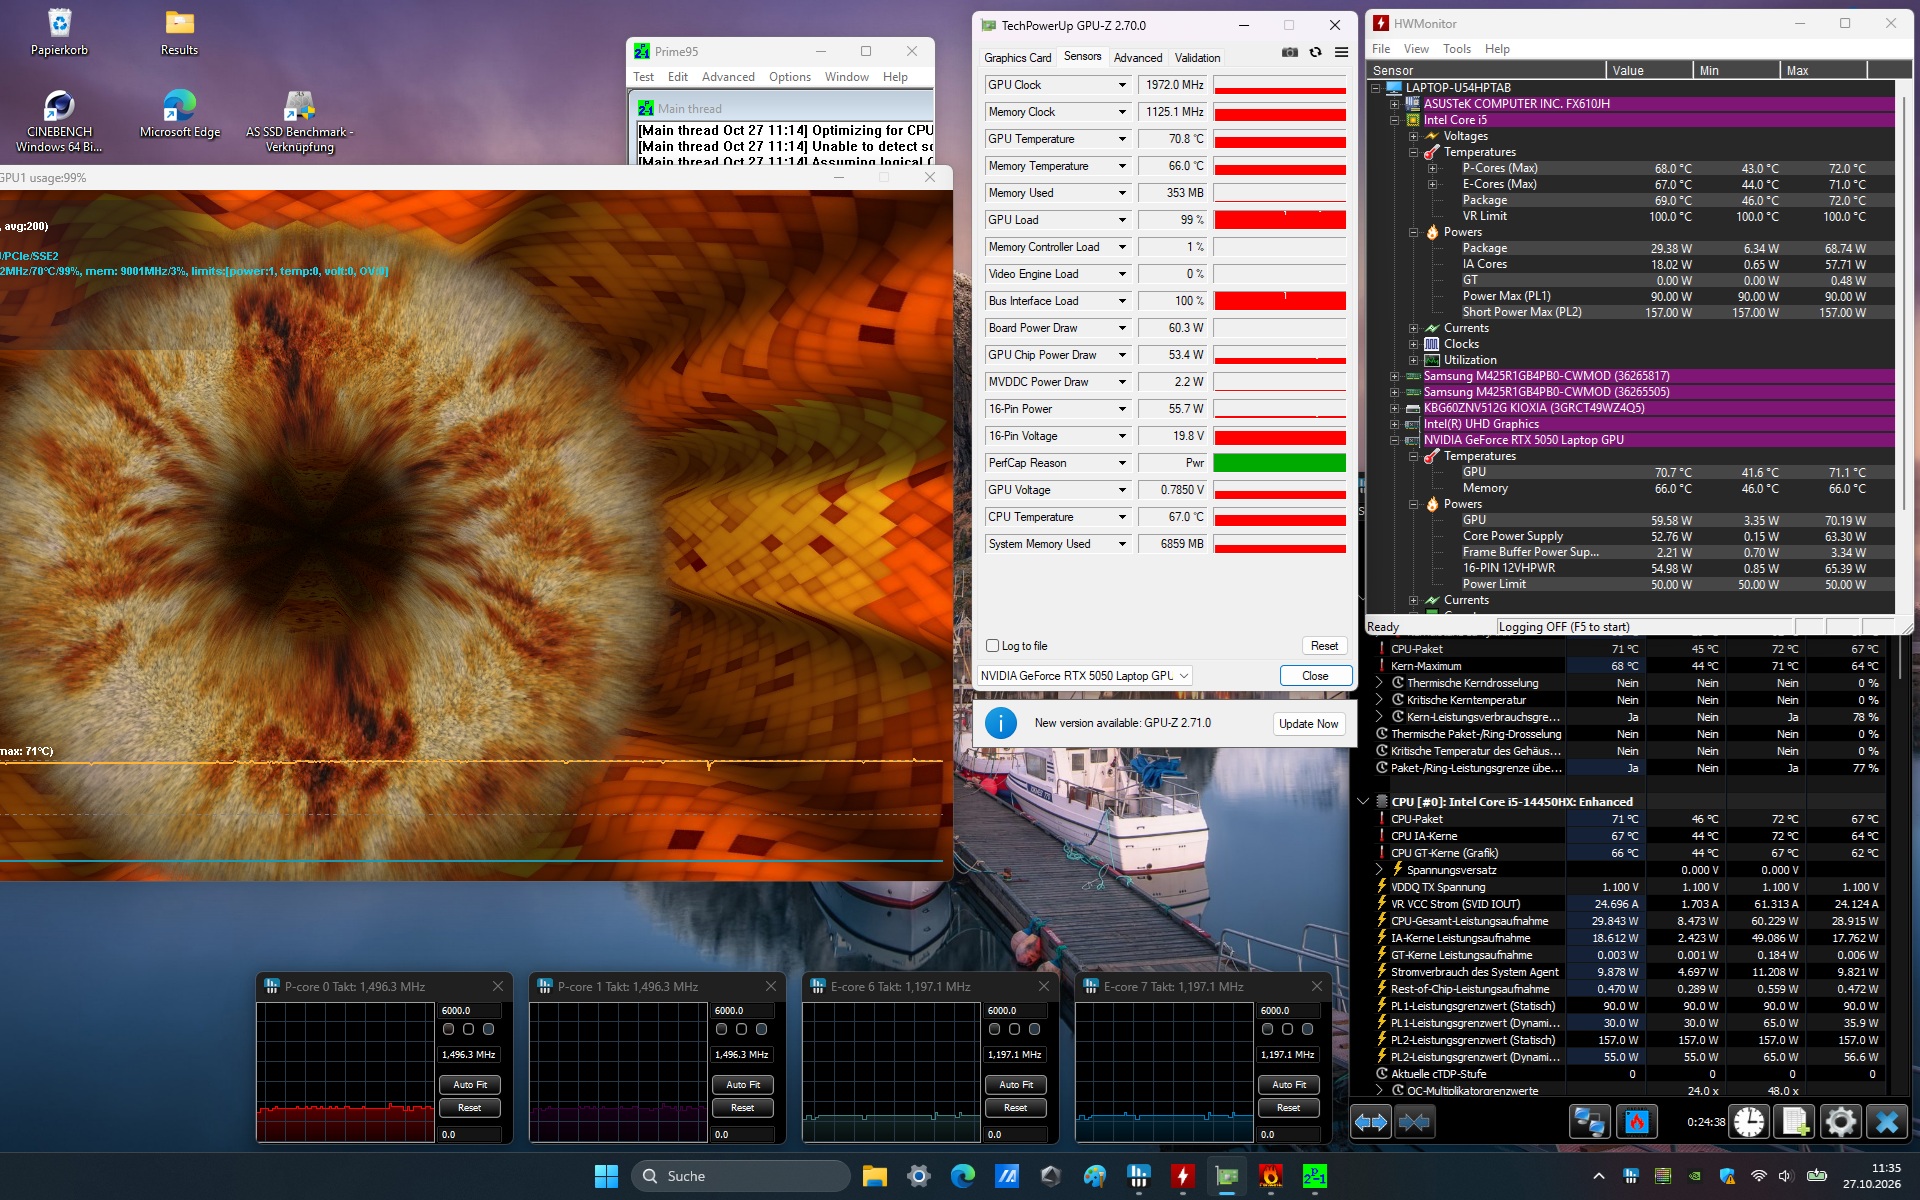
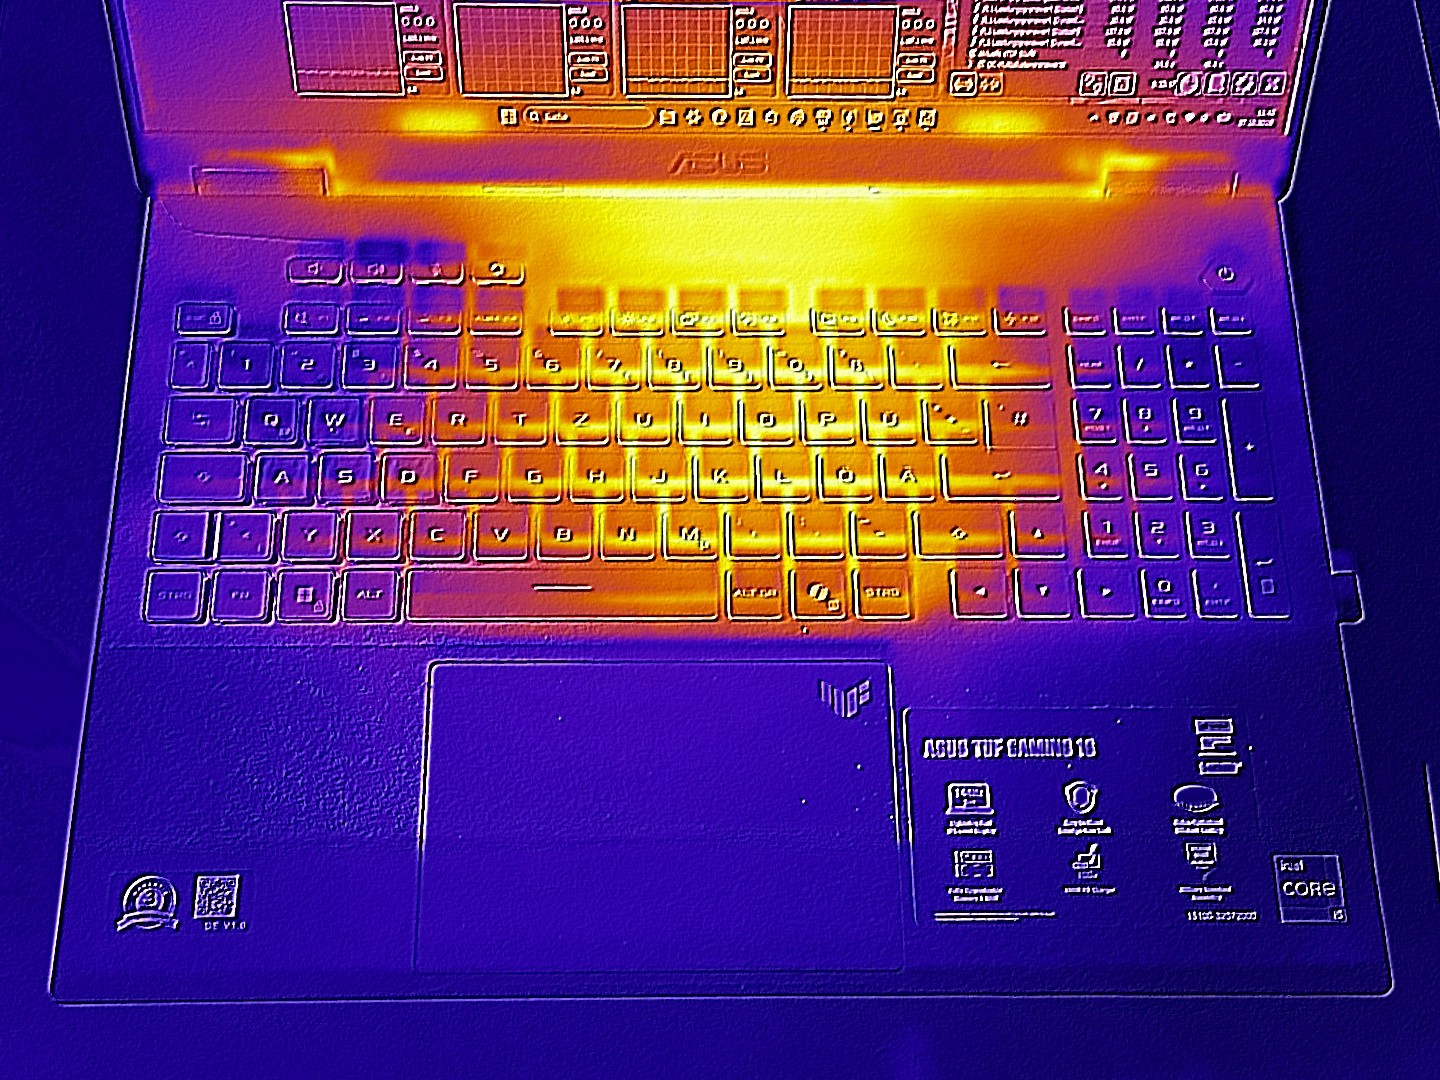
FurMark & Prime95
FurMark & Prime95
FurMark & Prime95
Max. Load
39 °C
102 F
44 °C
111 F
39 °C
102 F
35 °C
95 F
40 °C
104 F
38 °C
100 F
25 °C
77 F
25 °C
77 F
24 °C
75 F
Maximum: 44 °C = 111 F
Average: 34.3 °C = 94 F
42 °C
108 F
39 °C
102 F
42 °C
108 F
33 °C
91 F
35 °C
95 F
29 °C
84 F
26 °C
79 F
27 °C
81 F
25 °C
77 F
Maximum: 42 °C = 108 F
Average: 33.1 °C = 92 F
Power Supply (max.)  41 °C = 106 F | Room Temperature 21 °C = 70 F | Fluke t3000FC (calibrated), Voltcraft IR-900
(±) The average temperature for the upper side under maximal load is 34.3 °C / 94 F, compared to the average of 33.9 °C / 93 F for the devices in the class Gaming.
(±) The maximum temperature on the upper side is 44 °C / 111 F, compared to the average of 40.4 °C / 105 F, ranging from 21.2 to 68.8 °C for the class Gaming.
(±) The bottom heats up to a maximum of 42 °C / 108 F, compared to the average of 43.2 °C / 110 F
(+) The palmrests and touchpad are cooler than skin temperature with a maximum of 25 °C / 77 F and are therefore cool to the touch.
(+) The average temperature of the palmrest area of similar devices was 28.8 °C / 83.8 F (+3.8 °C / 6.8 F).
Asus TUF Gaming 16 FX610J
i5-14450HX, GeForce RTX 5050 Laptop
Acer Nitro V 16 AI ANV16-42-R860
R5 240, GeForce RTX 5050 Laptop
MSI Cyborg 15 B2RWEKG
Core 7 240H, GeForce RTX 5050 Laptop
HP Victus 15-fa2160ng
i5-13420H, GeForce RTX 5050 Laptop
Medion Erazer Deputy 15 P1 MD62761
Core 7 250H, GeForce RTX 5060 Laptop
Lenovo Legion 5 15AHP G10
R7 260, GeForce RTX 5060 Laptop
Heat
-21%
-6%
0%
-11%
-10%
Maximum Upper Side * (°C)
44
45
-2%
46
-5%
43
2%
43
2%
42.2
4%
Maximum Bottom * (°C)
42
59
-40%
45
-7%
43
-2%
52
-24%
51.7
-23%
Idle Upper Side * (°C)
29
36
37
31
28.5
Idle Bottom * (°C)
36
38
28
32
29.2

* ... smaller is better

Speakers

We would describe the sound quality as decent. It is roughly on par with the Acer Nitro V 16 AI and Lenovo Legion 5.

dB(A) 0102030405060708090Deep BassMiddle BassHigh BassLower RangeMidsHigher MidsLower HighsMid HighsUpper HighsSuper Highs2042.941.4253738.93143.446.94031.334.95042.529.36326.332.78027.232.310019.840.612527.65016027.550.320022.853.625021.558.131517.56140014.764.55001365.163014.368.680011.873.910001271.3125011.270.9160011.672.8200011.468.6250011.966315012.561.1400012.657.4500012.952.863001361.980001360.5100001359.71250012.754.71600012.751.2SPL25.880.1N0.844.8median 13median 61Delta37.639.541.735.438.143.147.732.343.634.534.523.325.515.721.216.418.817.230.218.540.124.551.317.65817.558.21563.914.664.113.169.312.473.213.375.711.872.611.868.511.566.612.363.812.368.912.665.512.662.712.864.512.866.412.76412.461.611.963.125.281.10.749.6median 12.8median 641.85.643.946.138.84144.44933.437.129.537.123.636.618.623.112.226.11538.617.743.223.451.917.961.615.267.615.868.214.365.112.669.511.372.710.875.110.971.810.970.211.476.611.574.512.571.912.670.912.680.212.780.612.874.812.774.812.77312.571.524.887.30.671.9median 12.6median 71.81.66.438.448.935.941.843.448.931.532.428.828.324.127.215.620.615.820.91632.117.139.422.247.816.155.913.159.611.965.511.365.910.767.71165.911.266.410.568.81171.111.573.111.869.512.467.812.470.912.674.912.772.412.973.412.774.512.360.911.755.724.3830.656.6median 12.4median 66.41.77.539.944.337.340.9475131.533.824.931.923.433.316.72514.517.114.924.717.5302440.216.753.814.76120.460.414.764.513.565.112.375.211.675.811.670.511.464.111.966.212.261.912.265.312.163.112.266.512.361.412.657.61354.31351.412.953.125.380.30.744.4median 12.9median 61.41.88.139.840.43133.627.229.228.330.929.130.724.829.122.630.121.933.421.338.721.14120.648.721.55018.556.116.959.713.865.112.770.712.173.411.872.211.871.512.169.81267.712.661.51365.612.865.713.269.413.272.81371.213.166.712.866.912.362.425.581.50.752median 13median 65.72.98.7hearing rangehide median Pink NoiseAsus TUF Gaming 16 FX610JAcer Nitro V 16 AI ANV16-42-R860MSI Cyborg 15 B2RWEKGHP Victus 15-fa2160ngMedion Erazer Deputy 15 P1 MD62761Lenovo Legion 5 15AHP G10
Frequency diagram (checkboxes can be checked and unchecked to compare devices)
Asus TUF Gaming 16 FX610J audio analysis

(±) | speaker loudness is average but good (80 dB)
Bass 100 - 315 Hz
(±) | reduced bass - on average 8.8% lower than median
(±) | linearity of bass is average (10% delta to prev. frequency)
Mids 400 - 2000 Hz
(±) | higher mids - on average 8.4% higher than median
(+) | mids are linear (5.7% delta to prev. frequency)
Highs 2 - 16 kHz
(+) | balanced highs - only 2.8% away from median
(±) | linearity of highs is average (8.1% delta to prev. frequency)
Overall 100 - 16.000 Hz
(±) | linearity of overall sound is average (15.9% difference to median)
Compared to same class
» 38% of all tested devices in this class were better, 7% similar, 55% worse
» The best had a delta of 6%, average was 18%, worst was 132%
Compared to all devices tested
» 25% of all tested devices were better, 5% similar, 69% worse
» The best had a delta of 4%, average was 23%, worst was 136%

Acer Nitro V 16 AI ANV16-42-R860 audio analysis

(±) | speaker loudness is average but good (81 dB)
Bass 100 - 315 Hz
(-) | nearly no bass - on average 21.2% lower than median
(±) | linearity of bass is average (13.6% delta to prev. frequency)
Mids 400 - 2000 Hz
(±) | higher mids - on average 5.2% higher than median
(+) | mids are linear (6.5% delta to prev. frequency)
Highs 2 - 16 kHz
(+) | balanced highs - only 1.5% away from median
(+) | highs are linear (5.6% delta to prev. frequency)
Overall 100 - 16.000 Hz
(±) | linearity of overall sound is average (16.8% difference to median)
Compared to same class
» 45% of all tested devices in this class were better, 11% similar, 45% worse
» The best had a delta of 6%, average was 18%, worst was 132%
Compared to all devices tested
» 30% of all tested devices were better, 8% similar, 62% worse
» The best had a delta of 4%, average was 23%, worst was 136%

MSI Cyborg 15 B2RWEKG audio analysis

(+) | speakers can play relatively loud (87 dB)
Bass 100 - 315 Hz
(-) | nearly no bass - on average 23.6% lower than median
(±) | linearity of bass is average (12.5% delta to prev. frequency)
Mids 400 - 2000 Hz
(+) | balanced mids - only 2.9% away from median
(+) | mids are linear (5.3% delta to prev. frequency)
Highs 2 - 16 kHz
(+) | balanced highs - only 3.8% away from median
(+) | highs are linear (5.1% delta to prev. frequency)
Overall 100 - 16.000 Hz
(+) | overall sound is linear (14.1% difference to median)
Compared to same class
» 24% of all tested devices in this class were better, 8% similar, 68% worse
» The best had a delta of 6%, average was 18%, worst was 132%
Compared to all devices tested
» 17% of all tested devices were better, 4% similar, 79% worse
» The best had a delta of 4%, average was 23%, worst was 136%

HP Victus 15-fa2160ng audio analysis

(+) | speakers can play relatively loud (83 dB)
Bass 100 - 315 Hz
(-) | nearly no bass - on average 23.8% lower than median
(±) | linearity of bass is average (12% delta to prev. frequency)
Mids 400 - 2000 Hz
(+) | balanced mids - only 2.1% away from median
(+) | mids are linear (4% delta to prev. frequency)
Highs 2 - 16 kHz
(±) | higher highs - on average 5.5% higher than median
(+) | highs are linear (4.5% delta to prev. frequency)
Overall 100 - 16.000 Hz
(±) | linearity of overall sound is average (17.8% difference to median)
Compared to same class
» 54% of all tested devices in this class were better, 10% similar, 37% worse
» The best had a delta of 6%, average was 18%, worst was 132%
Compared to all devices tested
» 37% of all tested devices were better, 8% similar, 55% worse
» The best had a delta of 4%, average was 23%, worst was 136%

Medion Erazer Deputy 15 P1 MD62761 audio analysis

(±) | speaker loudness is average but good (80 dB)
Bass 100 - 315 Hz
(-) | nearly no bass - on average 23.6% lower than median
(-) | bass is not linear (17.8% delta to prev. frequency)
Mids 400 - 2000 Hz
(±) | higher mids - on average 6.6% higher than median
(±) | linearity of mids is average (7.6% delta to prev. frequency)
Highs 2 - 16 kHz
(+) | balanced highs - only 3.2% away from median
(±) | linearity of highs is average (7.5% delta to prev. frequency)
Overall 100 - 16.000 Hz
(±) | linearity of overall sound is average (22.3% difference to median)
Compared to same class
» 80% of all tested devices in this class were better, 6% similar, 14% worse
» The best had a delta of 6%, average was 18%, worst was 132%
Compared to all devices tested
» 65% of all tested devices were better, 6% similar, 29% worse
» The best had a delta of 4%, average was 23%, worst was 136%

Lenovo Legion 5 15AHP G10 audio analysis

(±) | speaker loudness is average but good (81.5 dB)
Bass 100 - 315 Hz
(-) | nearly no bass - on average 21% lower than median
(±) | linearity of bass is average (8.2% delta to prev. frequency)
Mids 400 - 2000 Hz
(+) | balanced mids - only 4.7% away from median
(+) | mids are linear (5.4% delta to prev. frequency)
Highs 2 - 16 kHz
(+) | balanced highs - only 3.1% away from median
(+) | highs are linear (6.4% delta to prev. frequency)
Overall 100 - 16.000 Hz
(±) | linearity of overall sound is average (16.7% difference to median)
Compared to same class
» 44% of all tested devices in this class were better, 10% similar, 46% worse
» The best had a delta of 6%, average was 18%, worst was 132%
Compared to all devices tested
» 30% of all tested devices were better, 7% similar, 63% worse
» The best had a delta of 4%, average was 23%, worst was 136%

Power consumption and battery life

At roughly 8 to 14 watts at idle and 71 to 150 watts under load, power consumption is within the expected range for a device in this performance class. The manufacturer installs a 63 Wh battery, which lasted nearly 6.5 hours in our Wi-Fi test—a result that is neither particularly high nor low.

Power Consumption
Off / Standbydarklight 0.1 /  Watt
Idledarkmidlight 7.9 / 11.1 / 14.5 Watt
Load midlight 71 / 150 Watt
 color bar
Key: min: dark, med: mid, max: light        Metrahit Energy
Asus TUF Gaming 16 FX610J
i5-14450HX, GeForce RTX 5050 Laptop
Acer Nitro V 16 AI ANV16-42-R860
R5 240, GeForce RTX 5050 Laptop
MSI Cyborg 15 B2RWEKG
Core 7 240H, GeForce RTX 5050 Laptop
HP Victus 15-fa2160ng
i5-13420H, GeForce RTX 5050 Laptop
Medion Erazer Deputy 15 P1 MD62761
Core 7 250H, GeForce RTX 5060 Laptop
Lenovo Legion 5 15AHP G10
R7 260, GeForce RTX 5060 Laptop
Average of class Gaming
 
Power Consumption
22%
-24%
-3%
-43%
-9%
-66%
Idle Minimum * (Watt)
7.9
4.2
47%
14.9
-89%
7.9
-0%
13.7
-73%
6.9
13%
Idle Average * (Watt)
11.1
6.8
39%
16.3
-47%
9.2
17%
14.7
-32%
10.7
4%
Idle Maximum * (Watt)
14.5
9.8
32%
22.2
-53%
13.5
7%
17.9
-23%
11.3
22%
Load Average * (Watt)
71
62
13%
72
-1%
78
-10%
110
-55%
69.7
2%
Cyberpunk 2077 ultra * (Watt)
119
130.3
-9%
90.3
24%
128.4
-8%
177.9
-49%
162.6
-37%
Load Maximum * (Watt)
150
135
10%
117
22%
187
-25%
191
-27%
233.6
-56%
Cyberpunk 2077 ultra external monitor * (Watt)
129.6
89.6
126.7
177.2
165

* ... smaller is better

Battery Runtime
WiFi Websurfing
6h 20min
Asus TUF Gaming 16 FX610J
i5-14450HX, GeForce RTX 5050 Laptop, 63 Wh
Acer Nitro V 16 AI ANV16-42-R860
R5 240, GeForce RTX 5050 Laptop, 76 Wh
MSI Cyborg 15 B2RWEKG
Core 7 240H, GeForce RTX 5050 Laptop, 55.2 Wh
HP Victus 15-fa2160ng
i5-13420H, GeForce RTX 5050 Laptop, 70 Wh
Medion Erazer Deputy 15 P1 MD62761
Core 7 250H, GeForce RTX 5060 Laptop, 53 Wh
Lenovo Legion 5 15AHP G10
R7 260, GeForce RTX 5060 Laptop, 80 Wh
Average of class Gaming
 
Battery runtime
78%
-14%
-32%
-17%
54%
15%
WiFi v1.3 (h)
6.3
11.2
78%
5.4
-14%
4.3
-32%
5.2
-17%
9.7
54%
H.264 (h)
11.5
Cyberpunk 2077 ultra 150cd (h)
0.9
Load (h)
1.2

Notebookcheck overall rating

The TUF Gaming 16 is a budget laptop that gets almost everything right, making it a fairly safe choice. However, faster laptops with an RTX 5060 are sometimes available at a similar price.

Asus TUF Gaming 16 FX610J - 11/02/2026 v8
Florian Glaser

Chassis
76 / 98 → 78%
Keyboard
85%
Pointing Device
86%
Connectivity
49 / 80 → 61%
Weight
62 / 10-68 → 90%
Battery
71 / 95 → 74%
Display
80%
Games Performance
75%
Application Performance
83%
AI Performance
88%
Temperature
92 / 95 → 96%
Noise
84 / 90 → 93%
Audio
75%
Camera
33 / 75 → 44%
Average
61%
78%
Gaming - Weighted Average
CO2 Emissions
No Data
Materials
0%
Packaging
50%
Power Use
94%
Repairability
50%
Software Updates
22.3%
Recycle Logo Total Sustainability Score: 36.1%

Potential alternatives compared

Image
Model / Review
Price
Weight
Height
Display
1.
78.4%
Asus TUF Gaming 16 FX610J
Intel Core i5-14450HX ⎘
NVIDIA GeForce RTX 5050 Laptop ⎘
16 GB Memory, 512 GB SSD
Amazon:
1. $1,899.99
ASUS TUF F16 (2025) Gaming L...
2. $1,050.25
ASUS TUF Gaming F16 (2025) G...
3. $1,759.95
ASUS TUF Gaming F16 Laptop 1...
List Price: 1200 EUR
2.2 kg27 mm16.00"
1920x1200
142 PPI
IPS
2.
77.5%
Acer Nitro V 16 AI ANV16-42-R860
AMD Ryzen 5 240 ⎘
NVIDIA GeForce RTX 5050 Laptop ⎘
16 GB Memory, 1024 GB SSD
Amazon:
1. $104.00
SCREENARAMA New Screen Repla...
2. $1,080.00
Acer Nitro V 16 AI WUXGA (19...
3. $1,249.00
Acer Nitro V 16 AI Gaming La...
List Price: 1100 EUR
2.4 kg24.5 mm16.00"
1920x1200
142 PPI
IPS
3.
75.2%
MSI Cyborg 15 B2RWEKG
Intel Core 7 240H ⎘
NVIDIA GeForce RTX 5050 Laptop ⎘
16 GB Memory, 512 GB SSD
List Price: 1099 EUR2.2 kg23.2 mm15.60"
1920x1080
141 PPI
IPS
4.
75.8%
HP Victus 15-fa2160ng
Intel Core i5-13420H ⎘
NVIDIA GeForce RTX 5050 Laptop ⎘
24 GB Memory, 512 GB SSD
List Price: 1000 EUR2.4 kg23.5 mm15.60"
1920x1080
141 PPI
IPS
5.
78.6%
Medion Erazer Deputy 15 P1 MD62761
Intel Core 7 250H ⎘
NVIDIA GeForce RTX 5060 Laptop ⎘
16 GB Memory, 1024 GB
List Price: 1300 EUR2.2 kg29 mm15.60"
1920x1080
141 PPI
IPS
6.
87.2%
Lenovo Legion 5 15AHP G10
AMD Ryzen 7 260 ⎘
NVIDIA GeForce RTX 5060 Laptop ⎘
32 GB Memory, 1024 GB SSD
List Price: 1449€1.9 kg21.5 mm15.10"
2560x1600
200 PPI
OLED

Transparency

The selection of devices to be reviewed is made by our editorial team. The test sample was provided to the author as a loan by the manufacturer or retailer for the purpose of this review. The lender had no influence on this review, nor did the manufacturer receive a copy of this review before publication. There was no obligation to publish this review. As an independent media company, Notebookcheck is not subjected to the authority of manufacturers, retailers or publishers.

This is how Notebookcheck is testing

Every year, Notebookcheck independently reviews hundreds of laptops and smartphones using standardized procedures to ensure that all results are comparable. We have continuously developed our test methods for around 20 years and set industry standards in the process. In our test labs, high-quality measuring equipment is utilized by experienced technicians and editors. These tests involve a multi-stage validation process. Our complex rating system is based on hundreds of well-founded measurements and benchmarks, which maintains objectivity. Further information on our test methods can be found here.

Google LogoAdd as a preferred source on Google
Mail Logo
static version load dynamic
Loading Comments
> Expert reviews and news on laptops, smartphones and tech innovations > Reviews > Budget laptop with RTX 5050: Asus TUF Gaming 16 review
Florian Glaser, 2026-11- 9 (Update: 2026-11- 9)