 Deutsch
 English
 Español
 Français
 Italiano
 Nederlands
 Polski
 Português
 Русский
 Türkçe
 Svenska
 Chinese
 Magyar
No Intel or Nvidia required: Lenovo Legion Slim 7 16ARHA7 Gen 7 laptop review
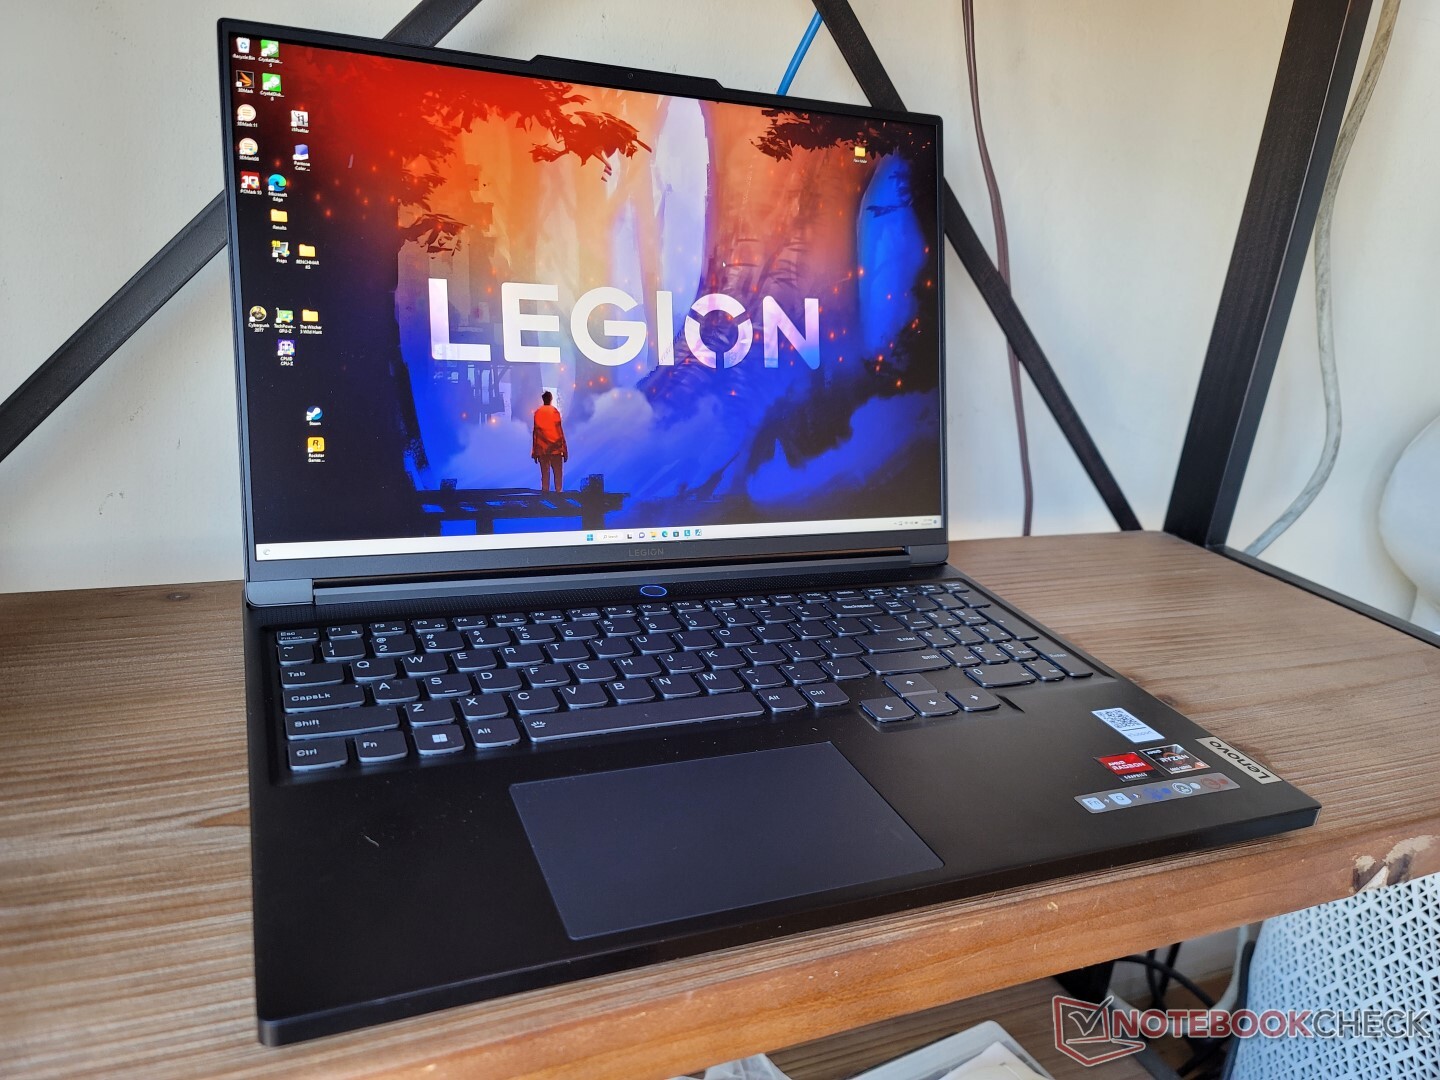
The Legion Slim 7 16 (also marketed as Legion S7 16) is the slimmer version of Lenovo's standard-size Legion 7 16 model. It competes directly with other high-end ultrathin gaming laptops such as the MSI GS series, Razer Blade series, Asus Zephyrus S series, or the Dell Alienware X series. Unlike many of these alternatives, however, the Legion Slim 7 16 utilizes a 16-inch 16:10 form factor instead of the more common 15.6-inch 16:9 aspect ratio.
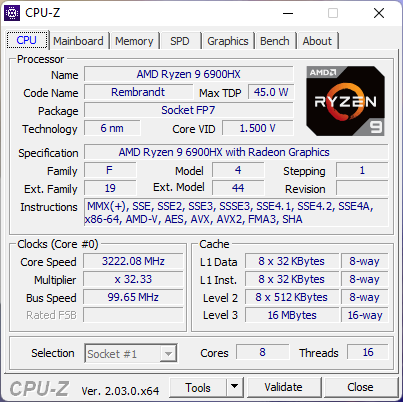
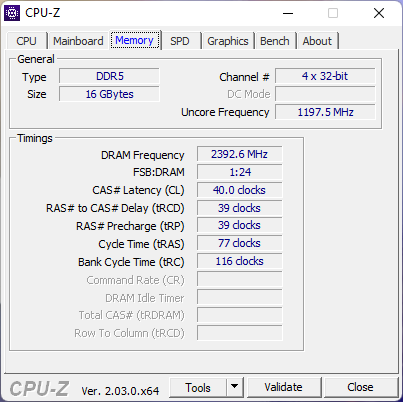
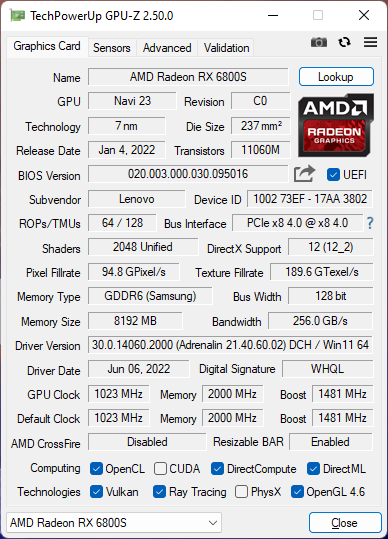
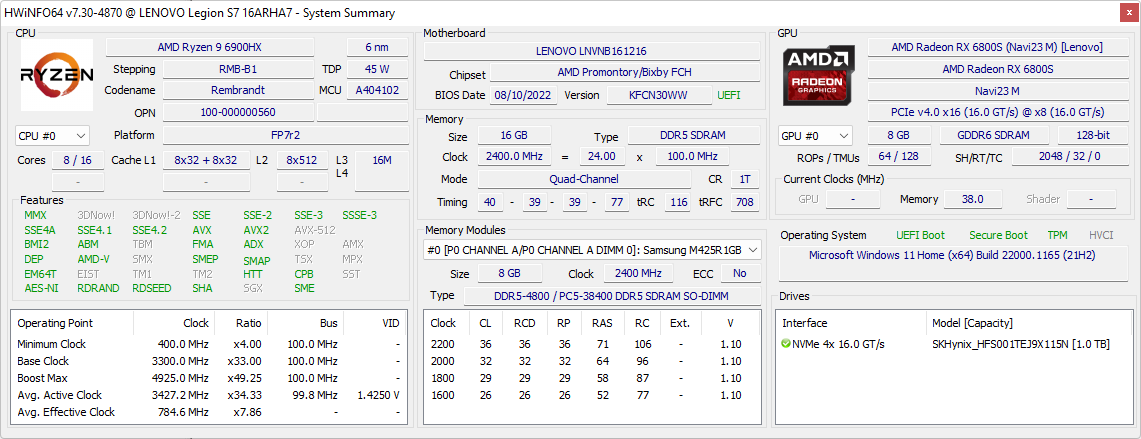
Our configuration in review comes equipped with the Zen 3+ Ryzen 9 6900HX CPU, 8 GB RDNA 2 Radeon RX 6900S GPU, and 500-nit 1600p IPS display for approximately $1950 USD. Lesser SKUs with the Ryzen 7 6800H, 4 GB Radeon RX 6600S, and 300-nit 1200p IPS display are also available for much lower prices starting at $1300.
Our AMD-powered test unit shares the exact same chassis as the Intel-powered Legion Slim 7i 16. Expect our full review on the Intel version in the coming weeks.
More Lenovo reviews:
Potential Competitors in Comparison
Rating | Date | Model | Weight | Height | Size | Resolution | Best Price |
|---|---|---|---|---|---|---|---|
| 89.3 % | 11/2022 | Lenovo Legion S7 16ARHA7 R9 6900HX, Radeon RX 6800S | 2.2 kg | 16.9 mm | 16.00" | 2560x1600 | |
| 87.9 % | 11/2022 | Lenovo Legion Slim 7-16IAH 82TF004YGE i7-12700H, GeForce RTX 3060 Laptop GPU | 2.2 kg | 16.9 mm | 16.00" | 2560x1600 | |
| 88.9 % | 09/2022 | Lenovo Legion 7 16IAX7-82TD004SGE i9-12900HX, GeForce RTX 3080 Ti Laptop GPU | 2.6 kg | 20 mm | 16.00" | 2560x1600 | |
| 86.1 % | 10/2022 | Dell G16 7620 i7-12700H, GeForce RTX 3060 Laptop GPU | 2.6 kg | 26.9 mm | 16.00" | 2560x1600 | |
| 86 % | 04/2022 | HP Omen 16-c0077ng R7 5800H, Radeon RX 6600M | 2.3 kg | 26 mm | 16.10" | 2560x1440 | |
| 85.6 % | 07/2021 | Asus ROG Zephyrus M16 GU603H i9-11900H, GeForce RTX 3070 Laptop GPU | 2 kg | 20 mm | 16.00" | 2560x1600 |
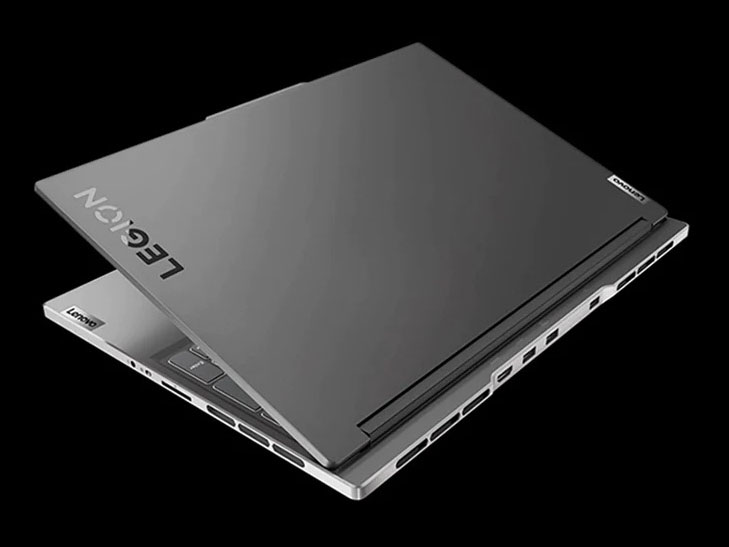
Case — Slim Is In
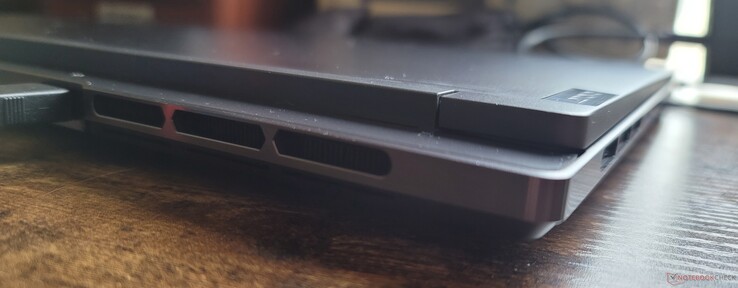
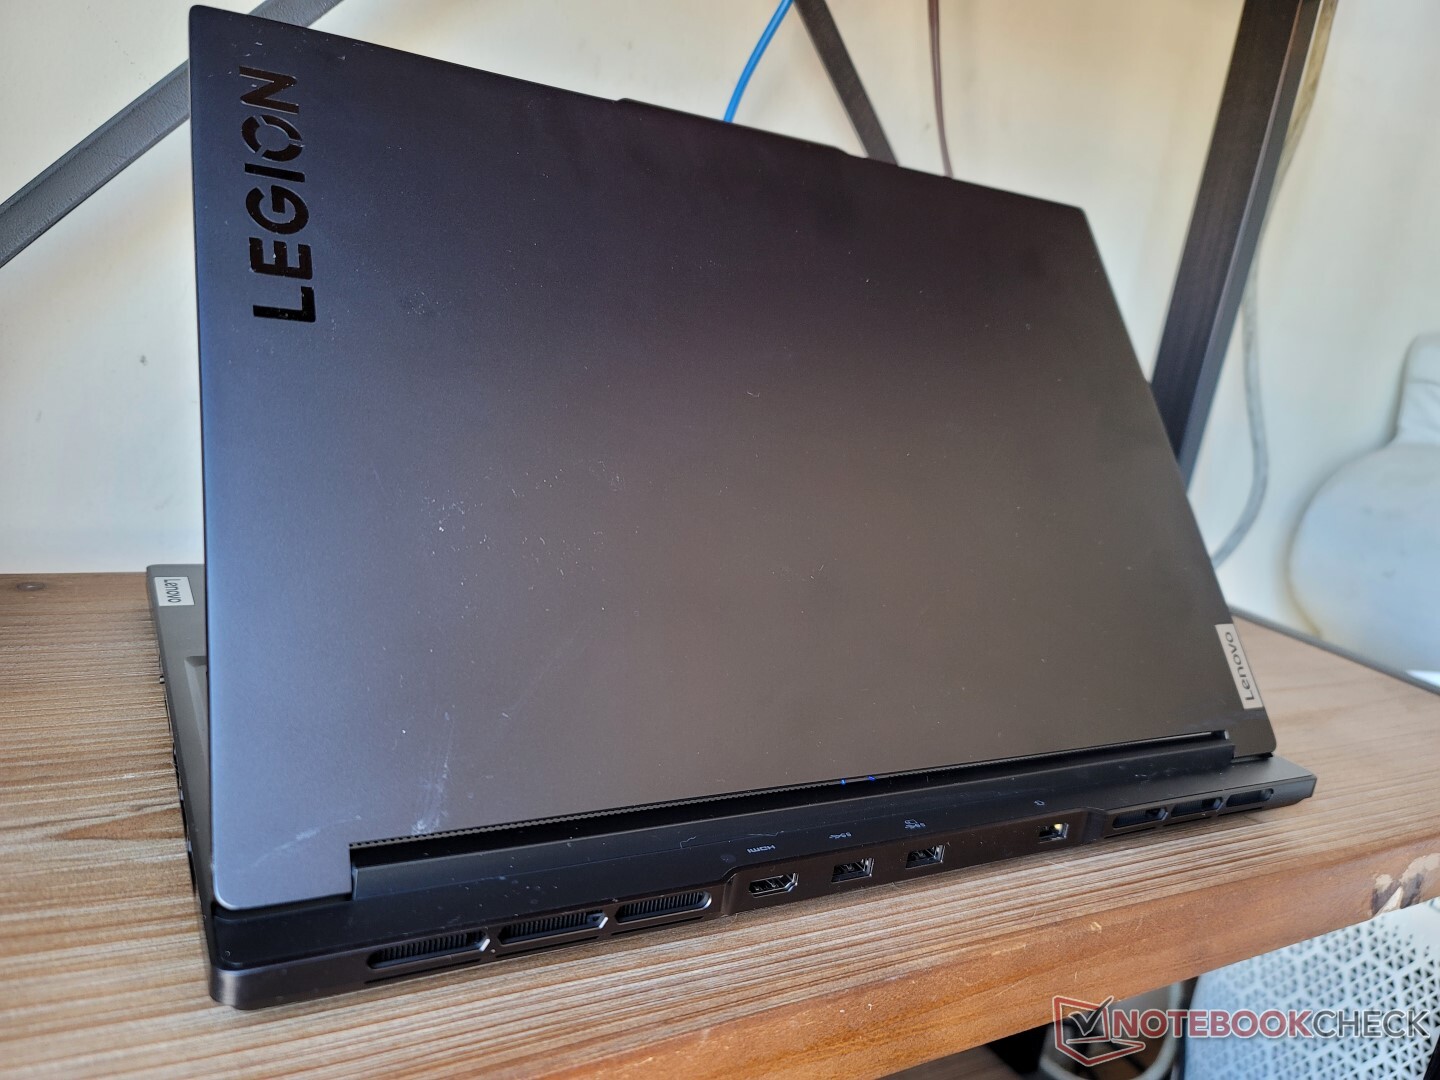
An easy way to differentiate the between the AMD Legion Slim 7 16 and Intel Legion Slim 7i 16 is to look at their ports as the Intel version has three USB-A ports along the rear instead of only two. Otherwise, it's the same smooth aluminum skeleton from top to bottom.
Keep in mind that only one of the two USB-C ports along the left edge of the AMD model is capable of DisplayPort.
SD Card Reader
| SD Card Reader | |
| average JPG Copy Test (av. of 3 runs) | |
| Asus ROG Zephyrus M16 GU603H (AV PRO microSD 128 GB V60) | |
| Lenovo Legion S7 16ARHA7 (AV PRO microSD 128 GB V60) | |
| Lenovo Legion Slim 7-16IAH 82TF004YGE | |
| HP Omen 16-c0077ng (AV Pro SD microSD 128 GB V60Exceria Pro SDXC 64 GB UHS-II) | |
| maximum AS SSD Seq Read Test (1GB) | |
| Asus ROG Zephyrus M16 GU603H (AV PRO microSD 128 GB V60) | |
| Lenovo Legion S7 16ARHA7 (AV PRO microSD 128 GB V60) | |
| Lenovo Legion Slim 7-16IAH 82TF004YGE | |
| HP Omen 16-c0077ng (AV Pro SD microSD 128 GB V60Exceria Pro SDXC 64 GB UHS-II) | |
Communication
| Networking | |
| iperf3 transmit AX12 | |
| HP Omen 16-c0077ng | |
| Asus ROG Zephyrus M16 GU603H | |
| iperf3 receive AX12 | |
| HP Omen 16-c0077ng | |
| Asus ROG Zephyrus M16 GU603H | |
| iperf3 receive AXE11000 6GHz | |
| Lenovo Legion 7 16IAX7-82TD004SGE | |
| Lenovo Legion S7 16ARHA7 | |
| iperf3 receive AXE11000 | |
| Lenovo Legion Slim 7-16IAH 82TF004YGE | |
| Dell G16 7620 | |
| iperf3 transmit AXE11000 6GHz | |
| Lenovo Legion S7 16ARHA7 | |
| Lenovo Legion 7 16IAX7-82TD004SGE | |
| iperf3 transmit AXE11000 | |
| Lenovo Legion Slim 7-16IAH 82TF004YGE | |
| Dell G16 7620 | |
Webcam
The 2 MP camera includes a shutter for privacy, but there is no IR or Hello support.


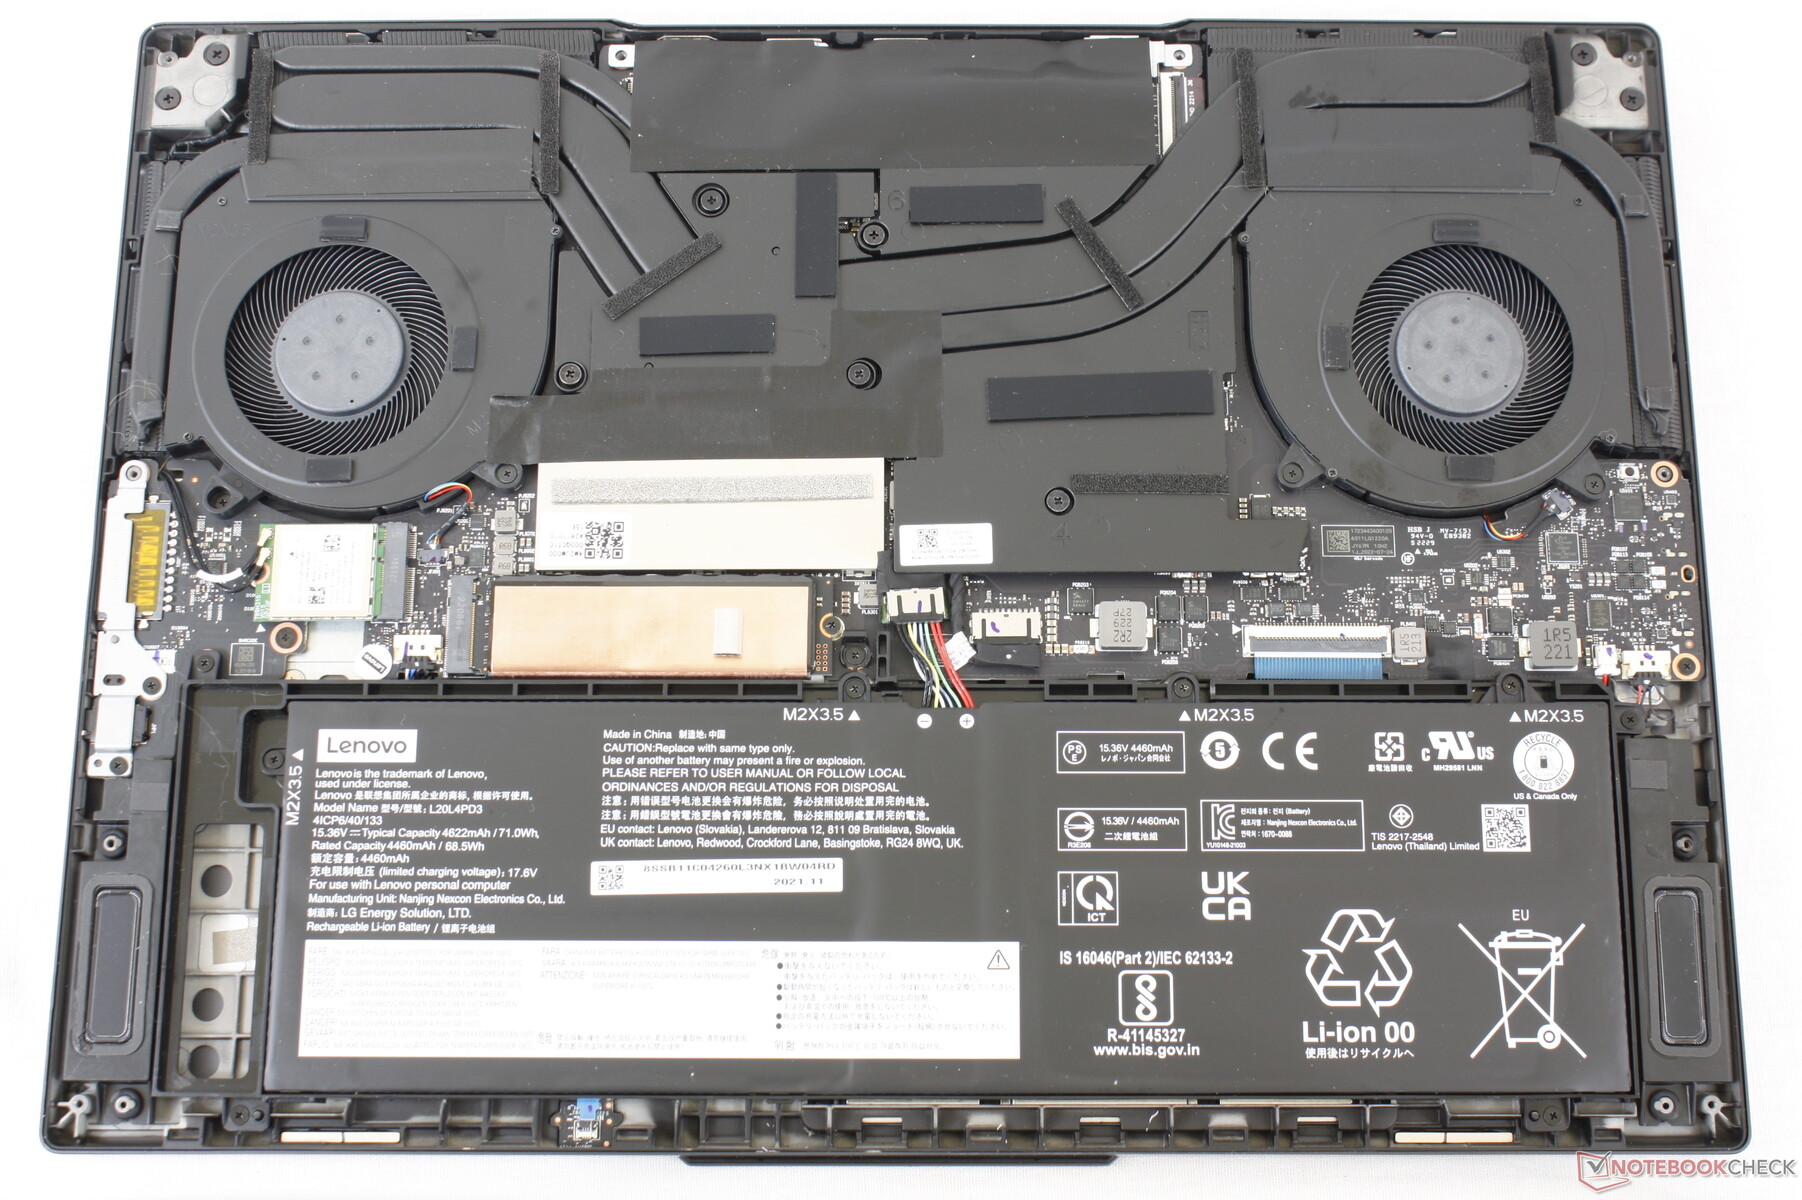
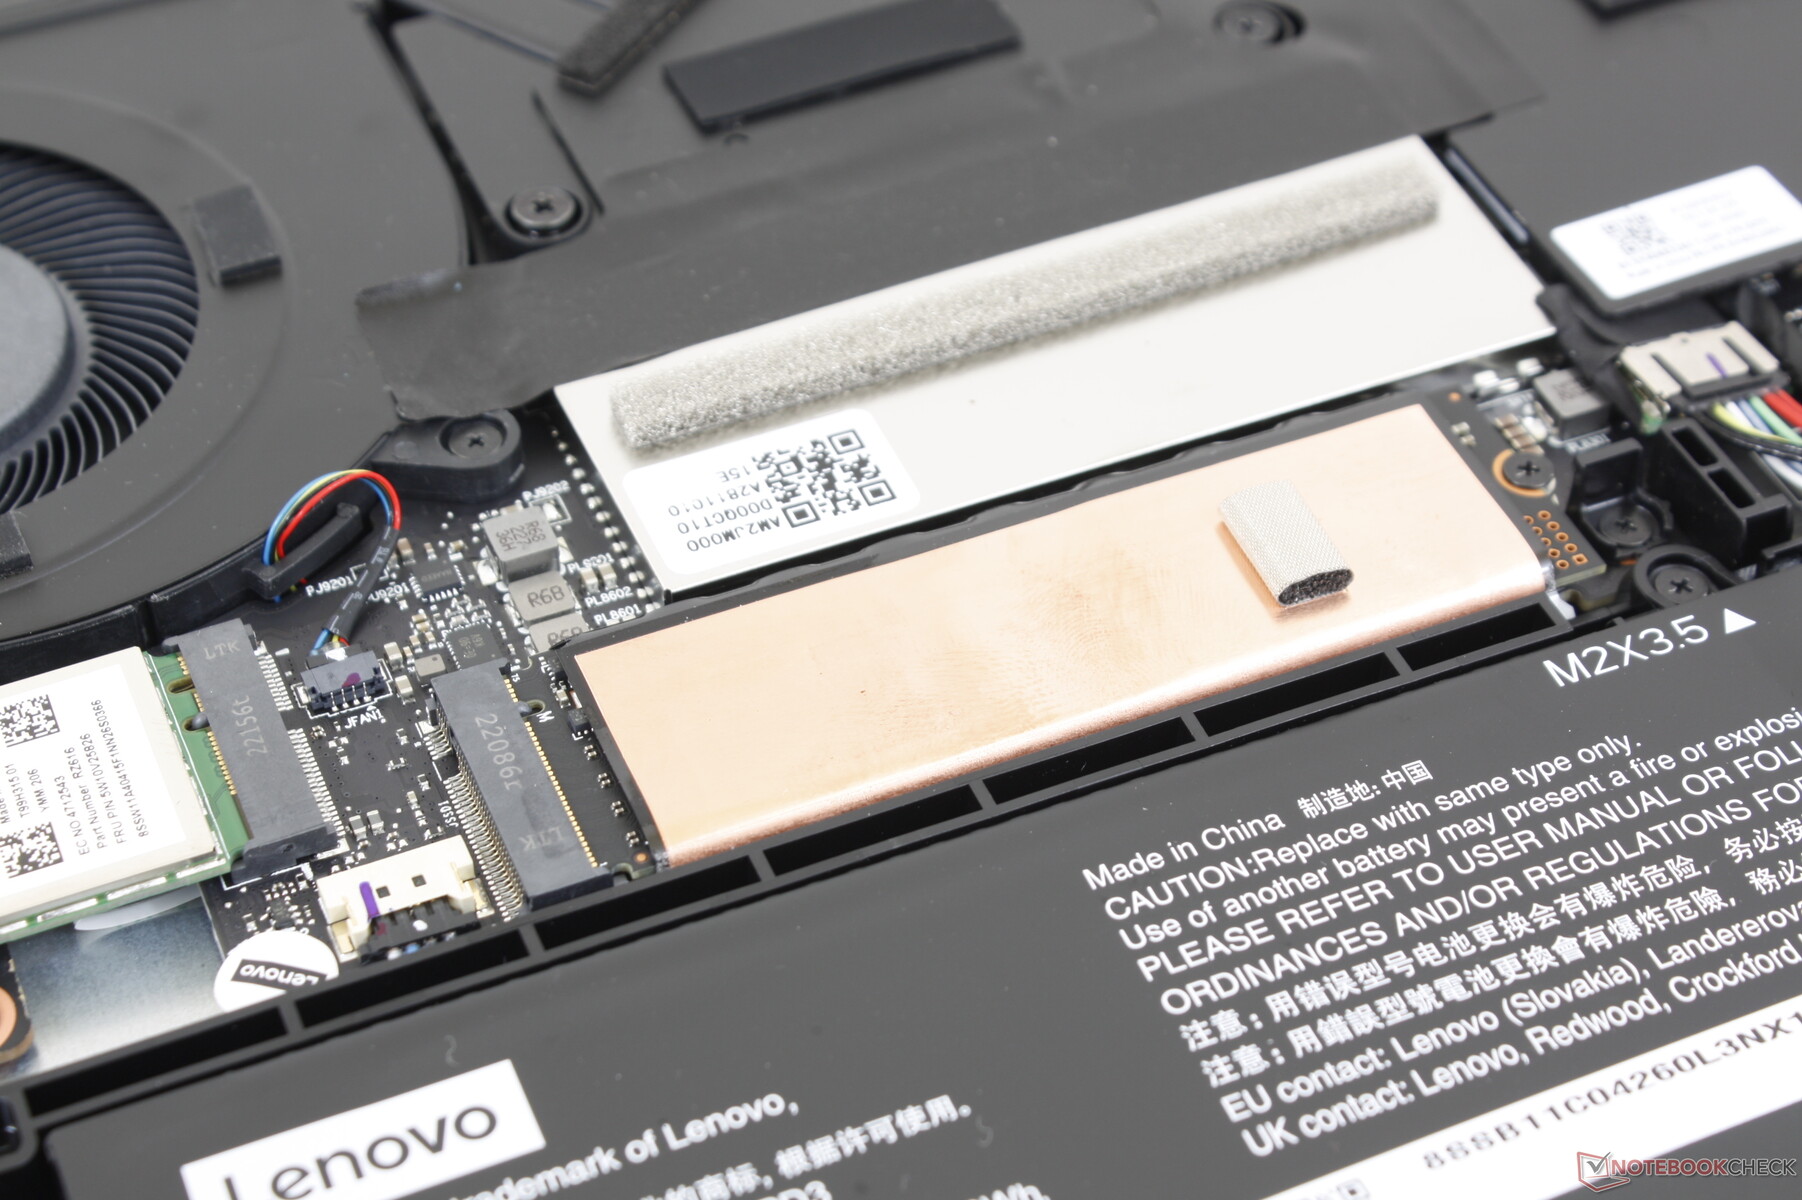
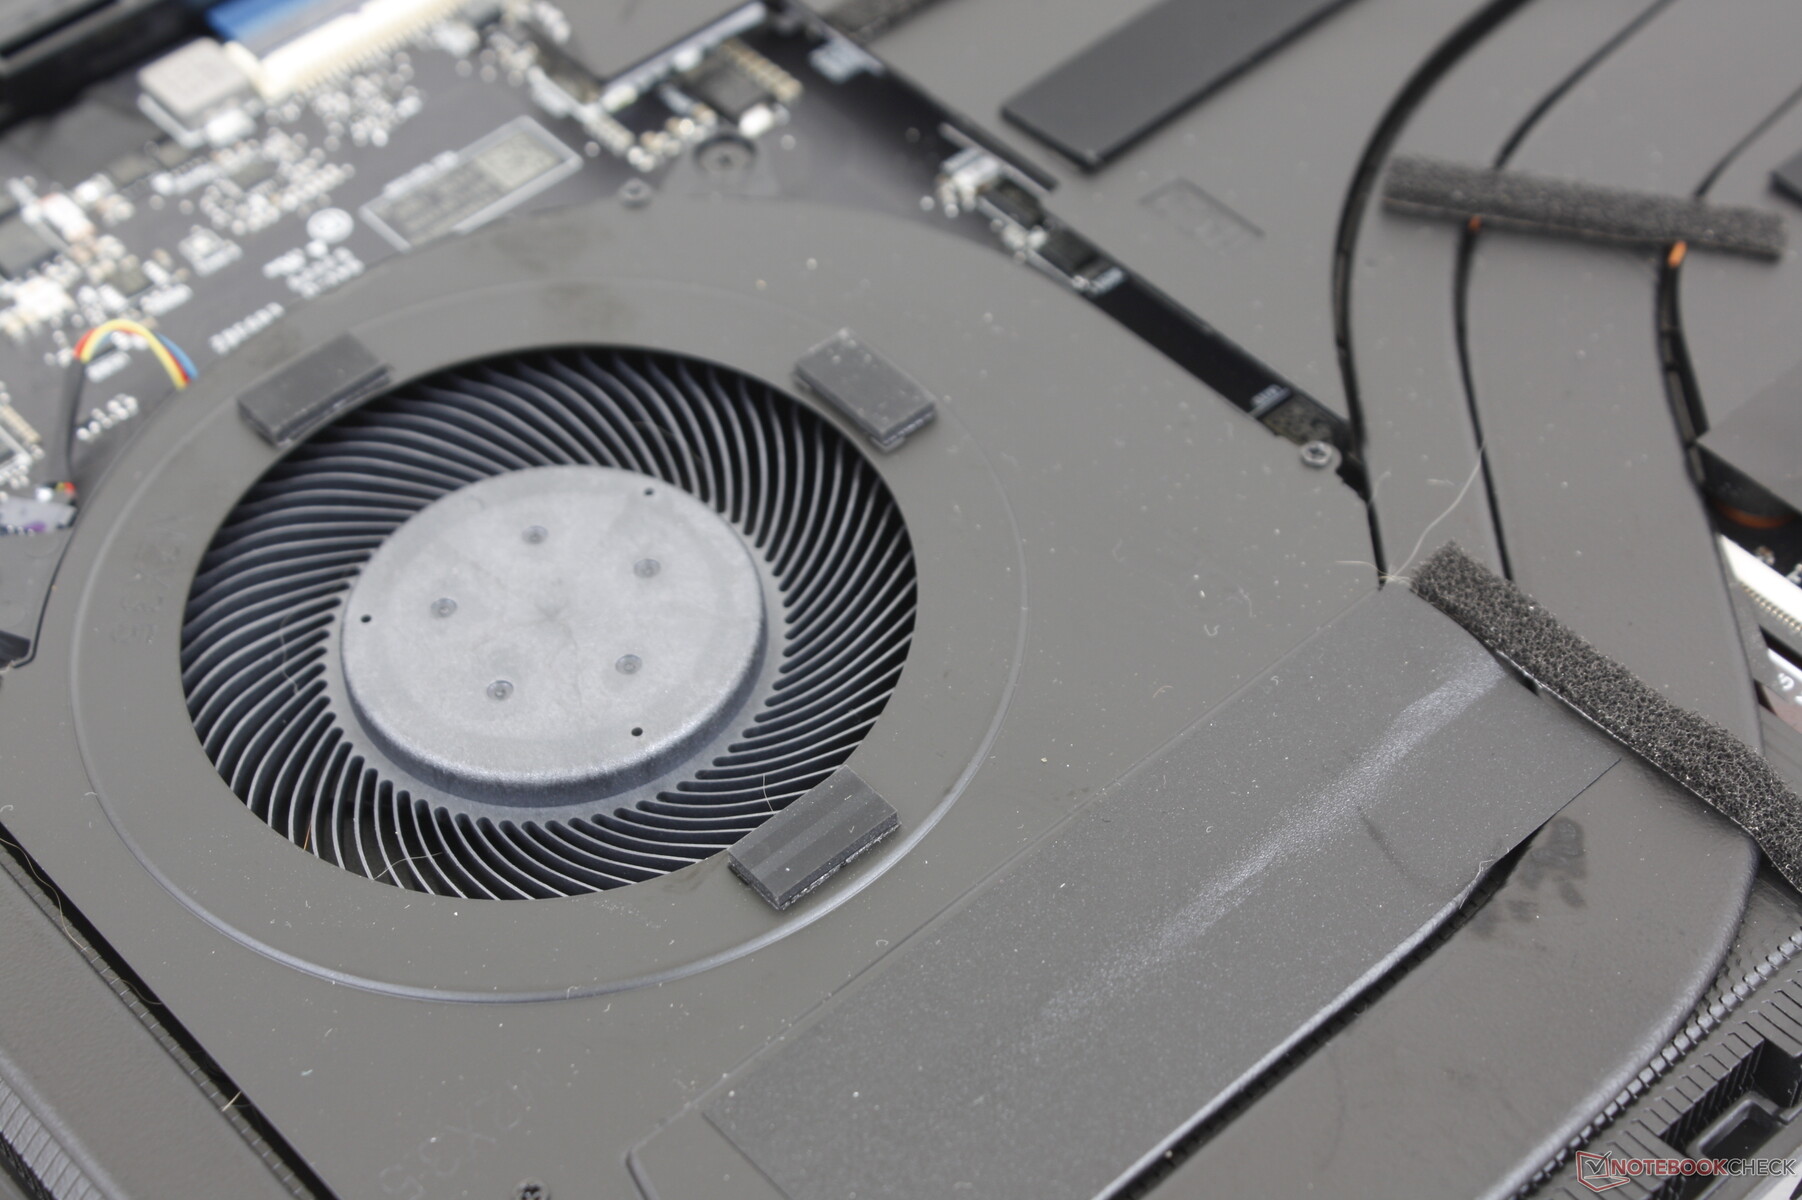
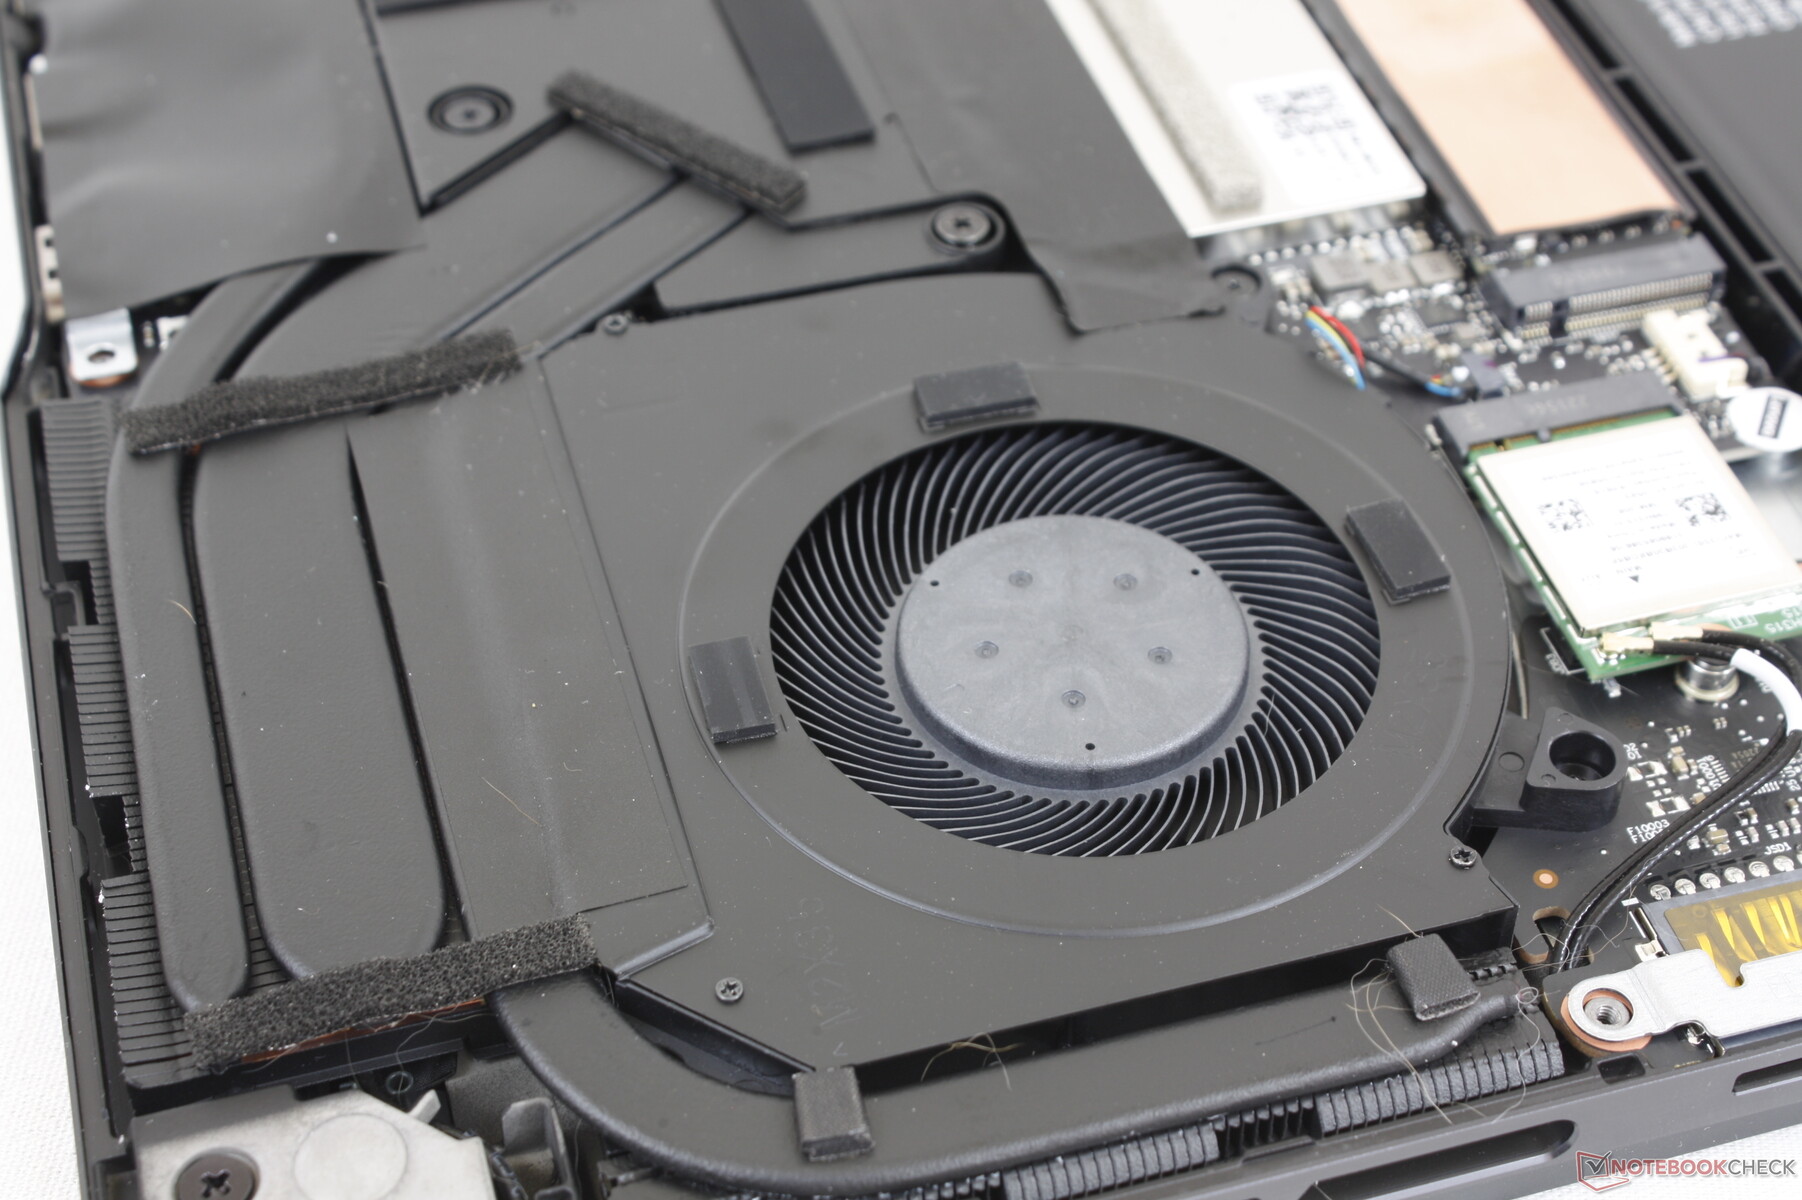
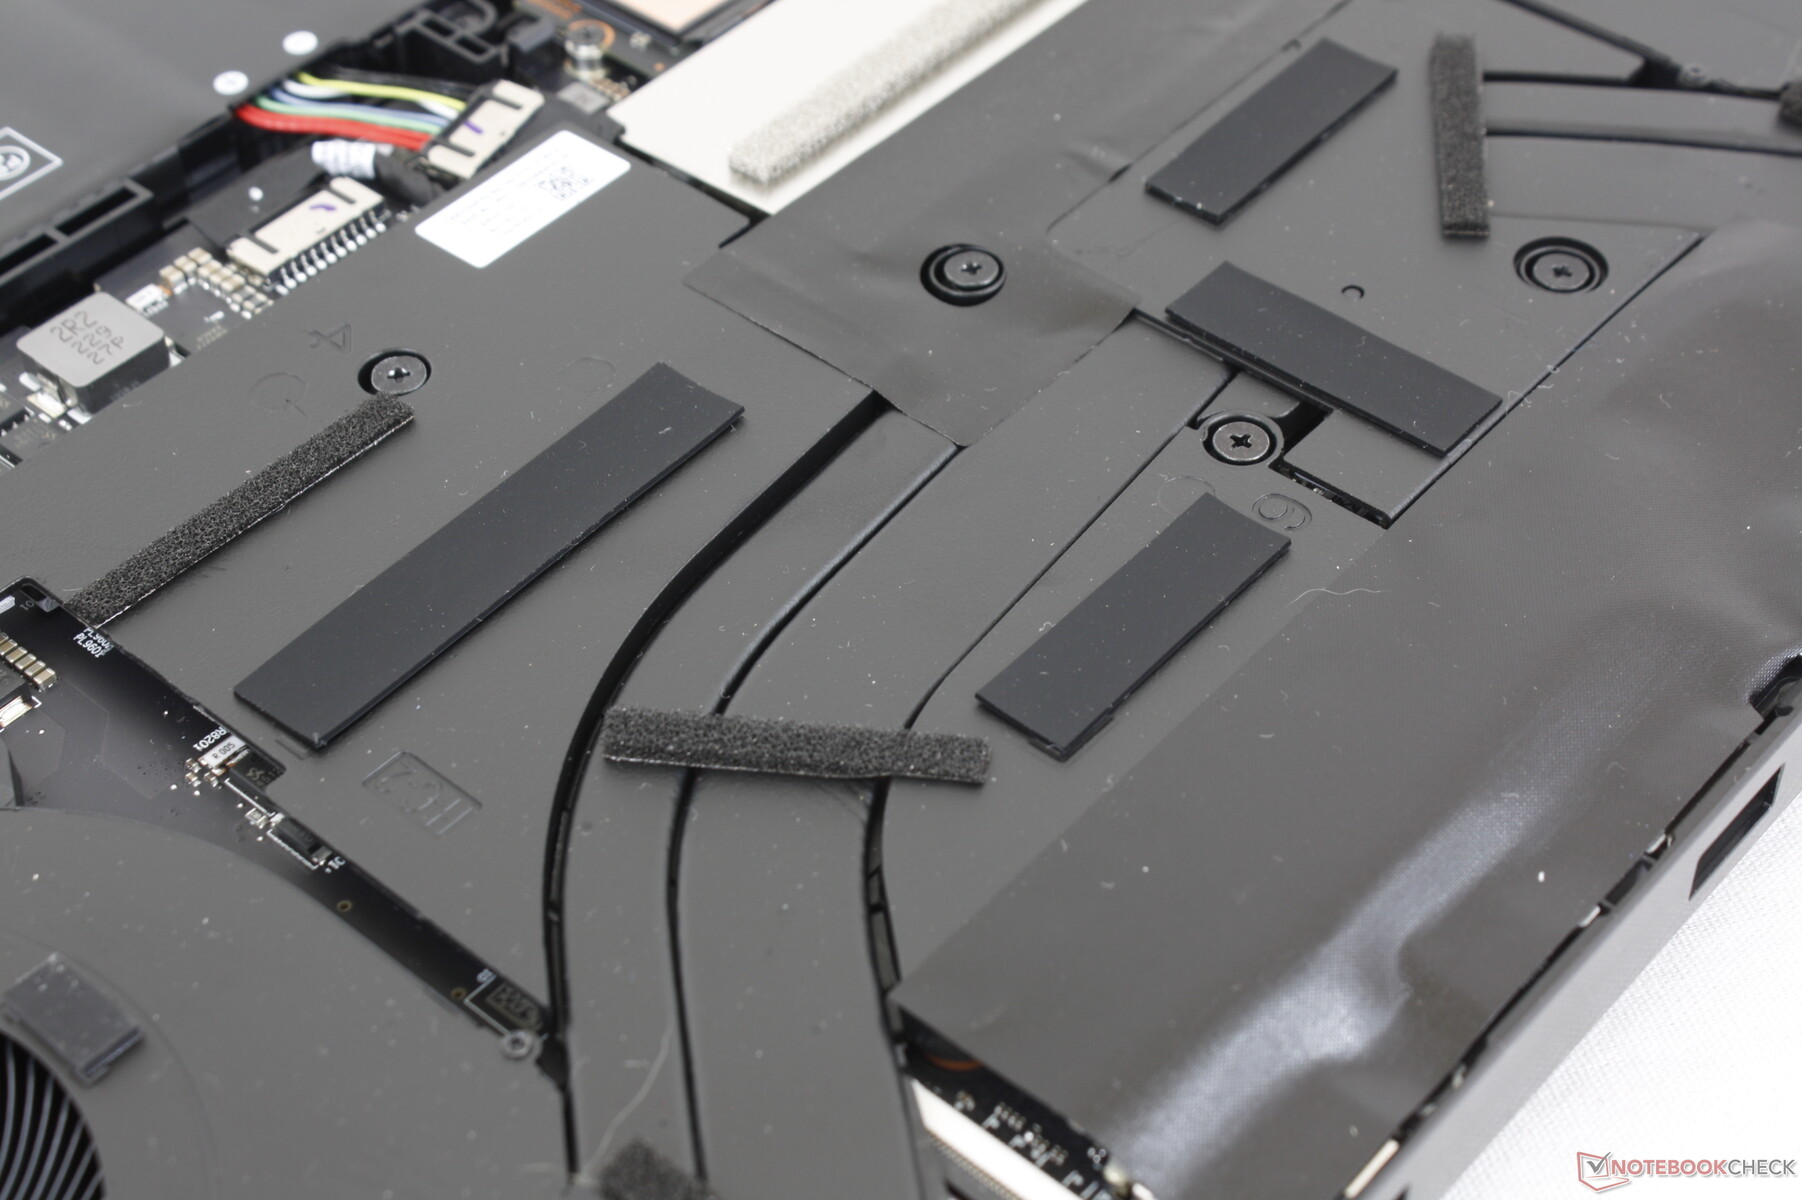
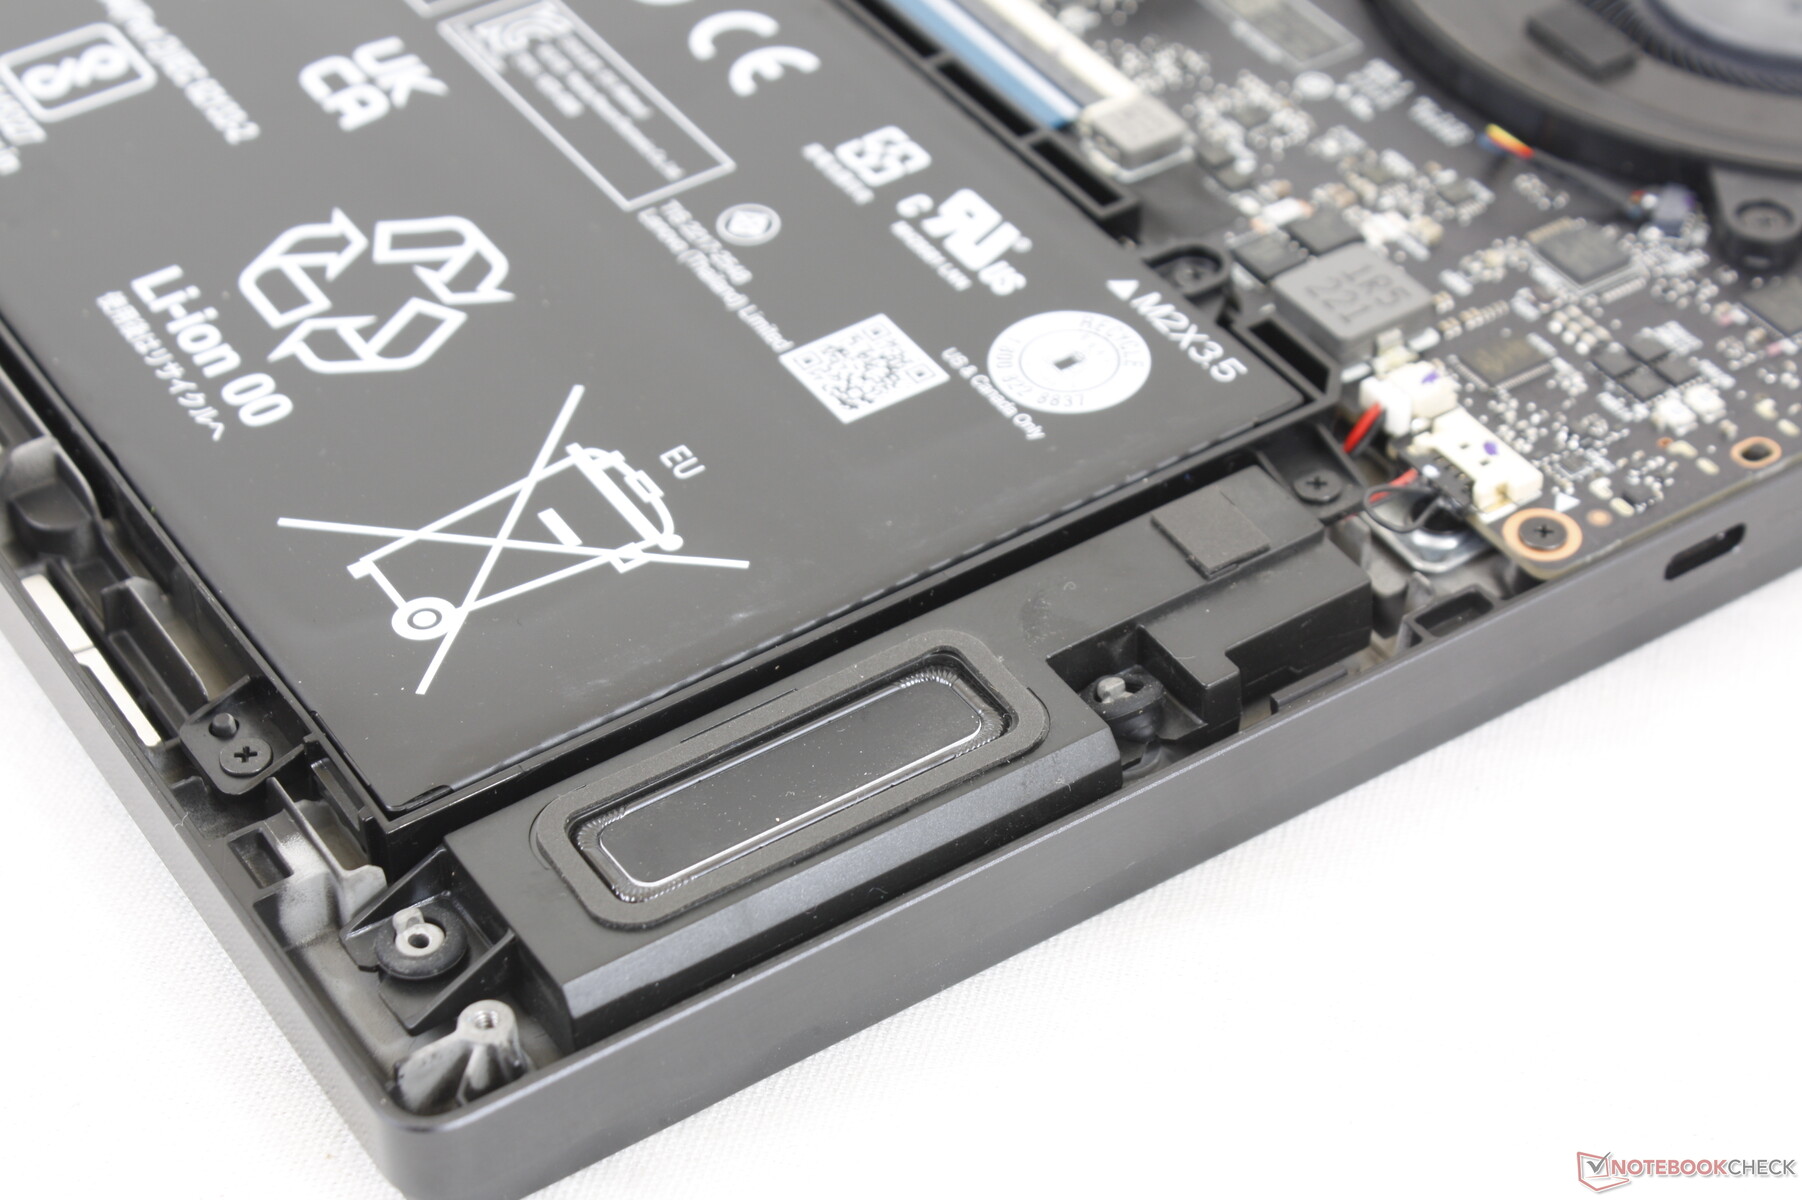
Maintenance
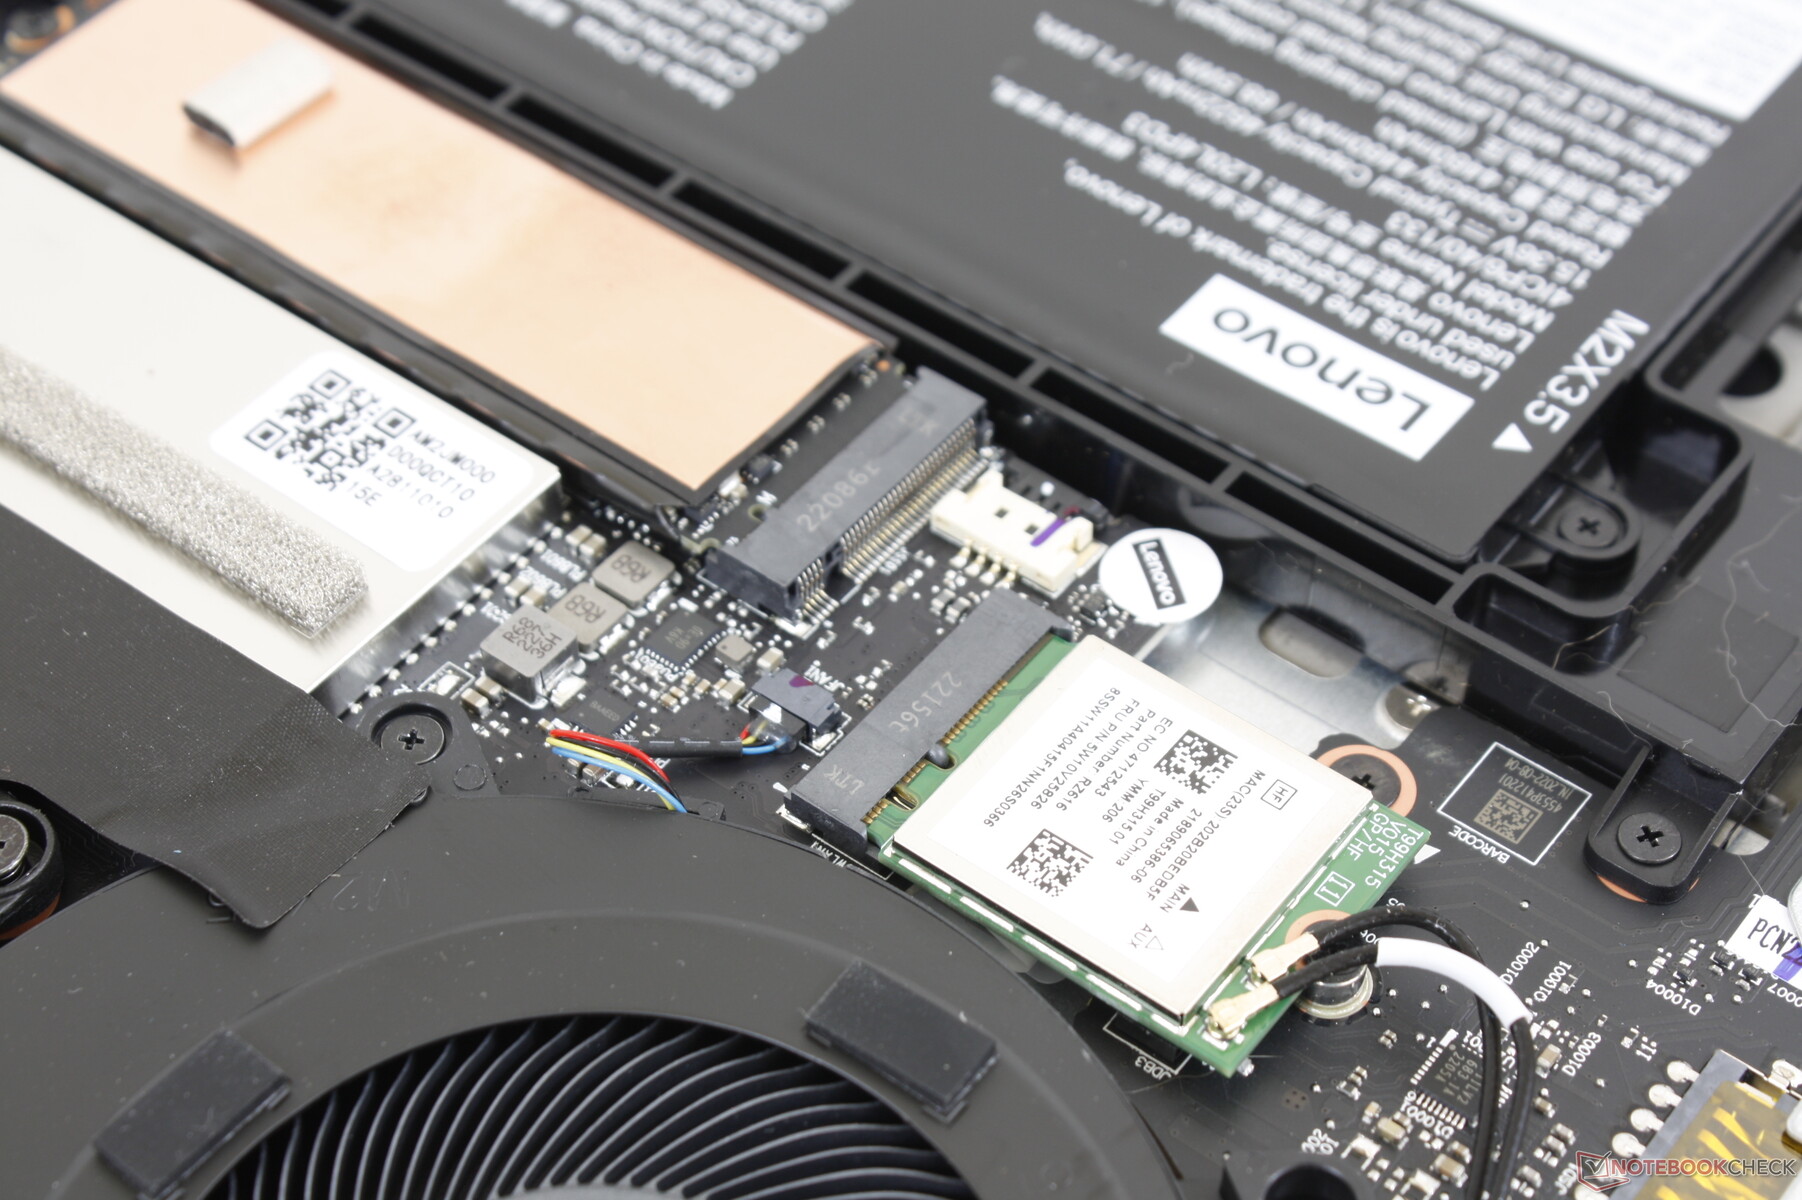
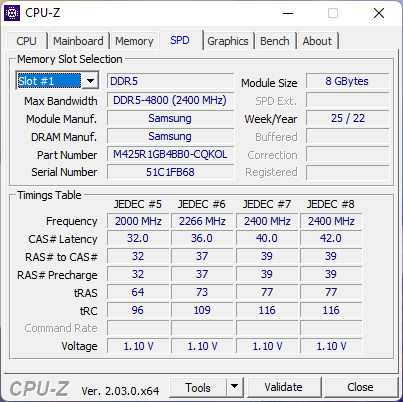
The bottom panel is secured by eight Philips screws. There is only a single M.2 storage bay and a single DDR5 SODIMM slot.
Accessories and Warranty
There are no extras in the box other than the AC adapter and paperwork. The usual one-year limited warranty applies if purchased in the US.
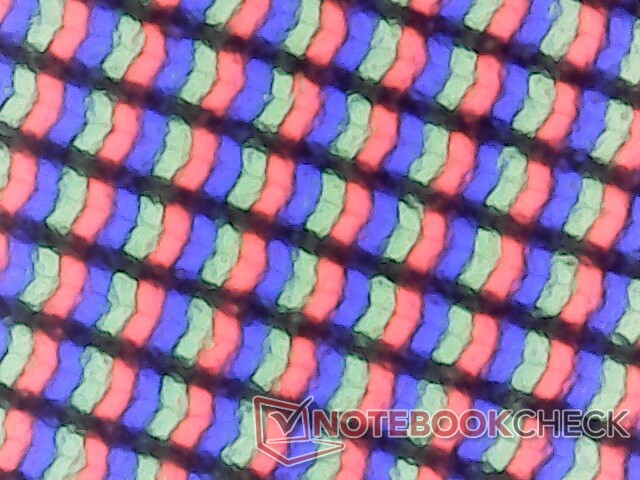
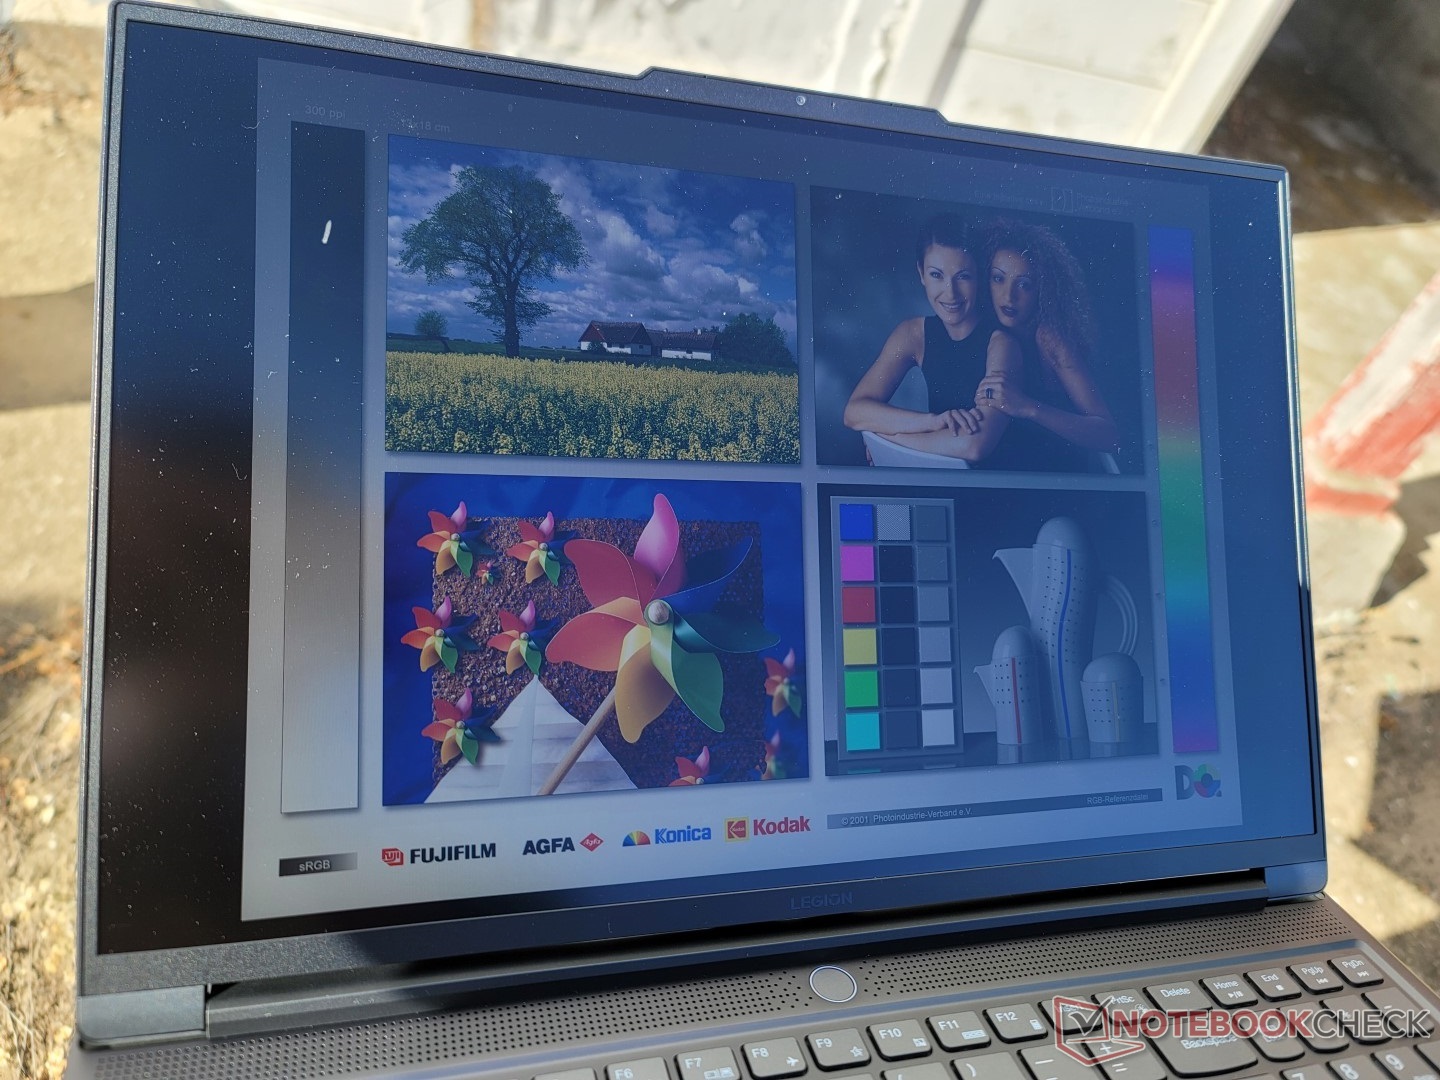
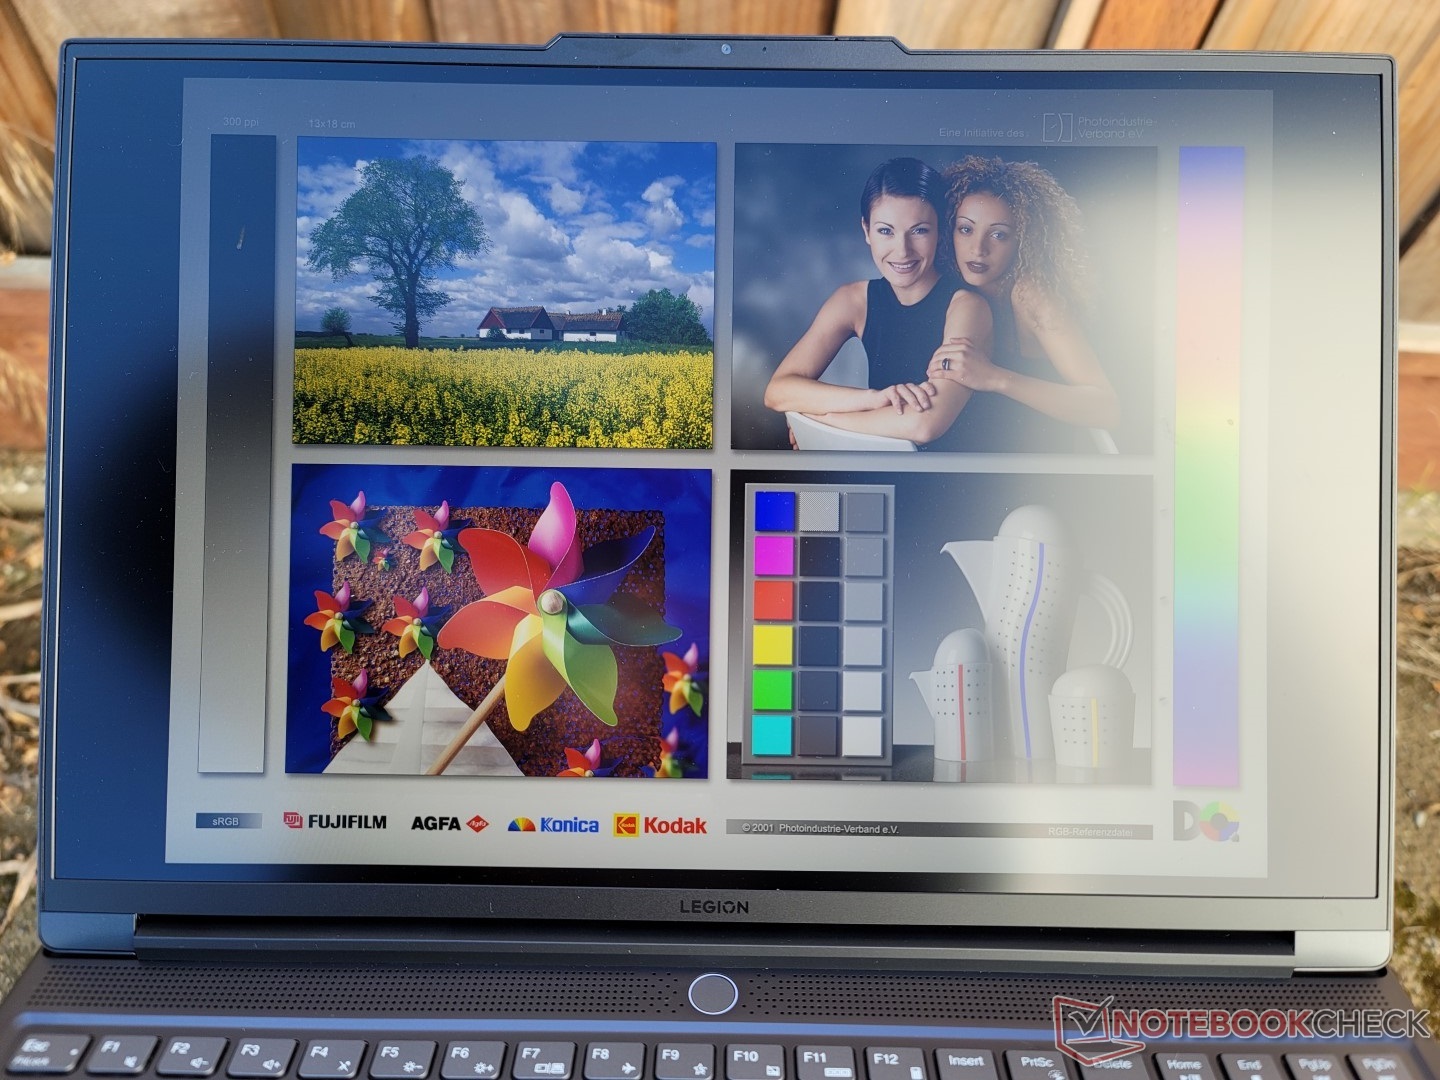
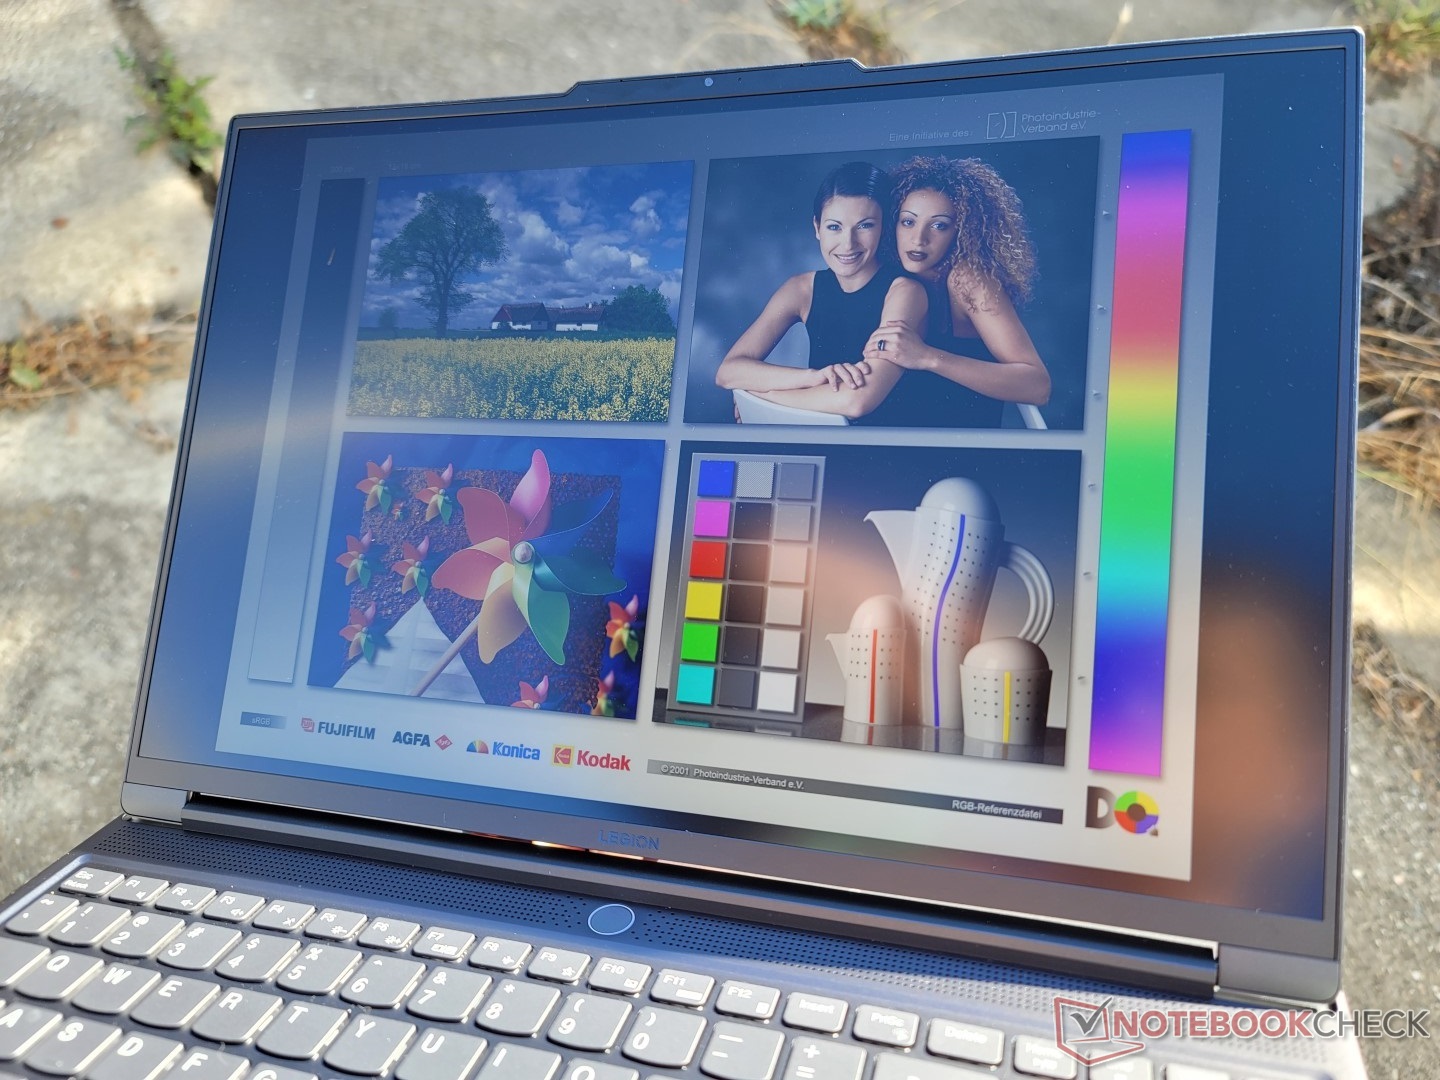
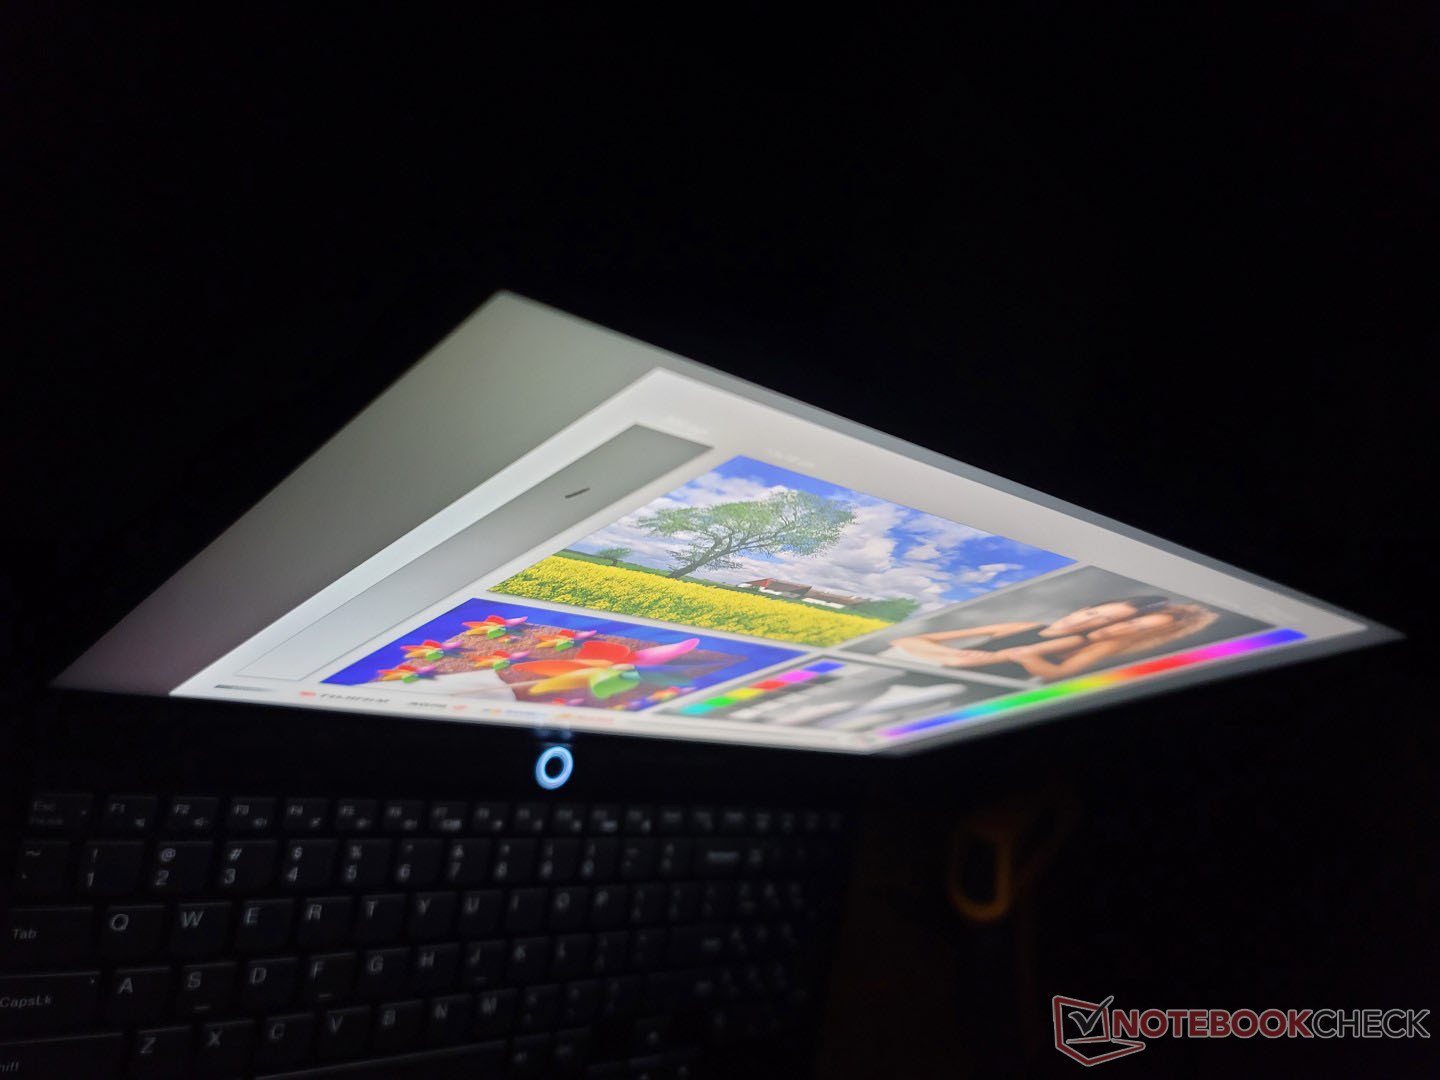
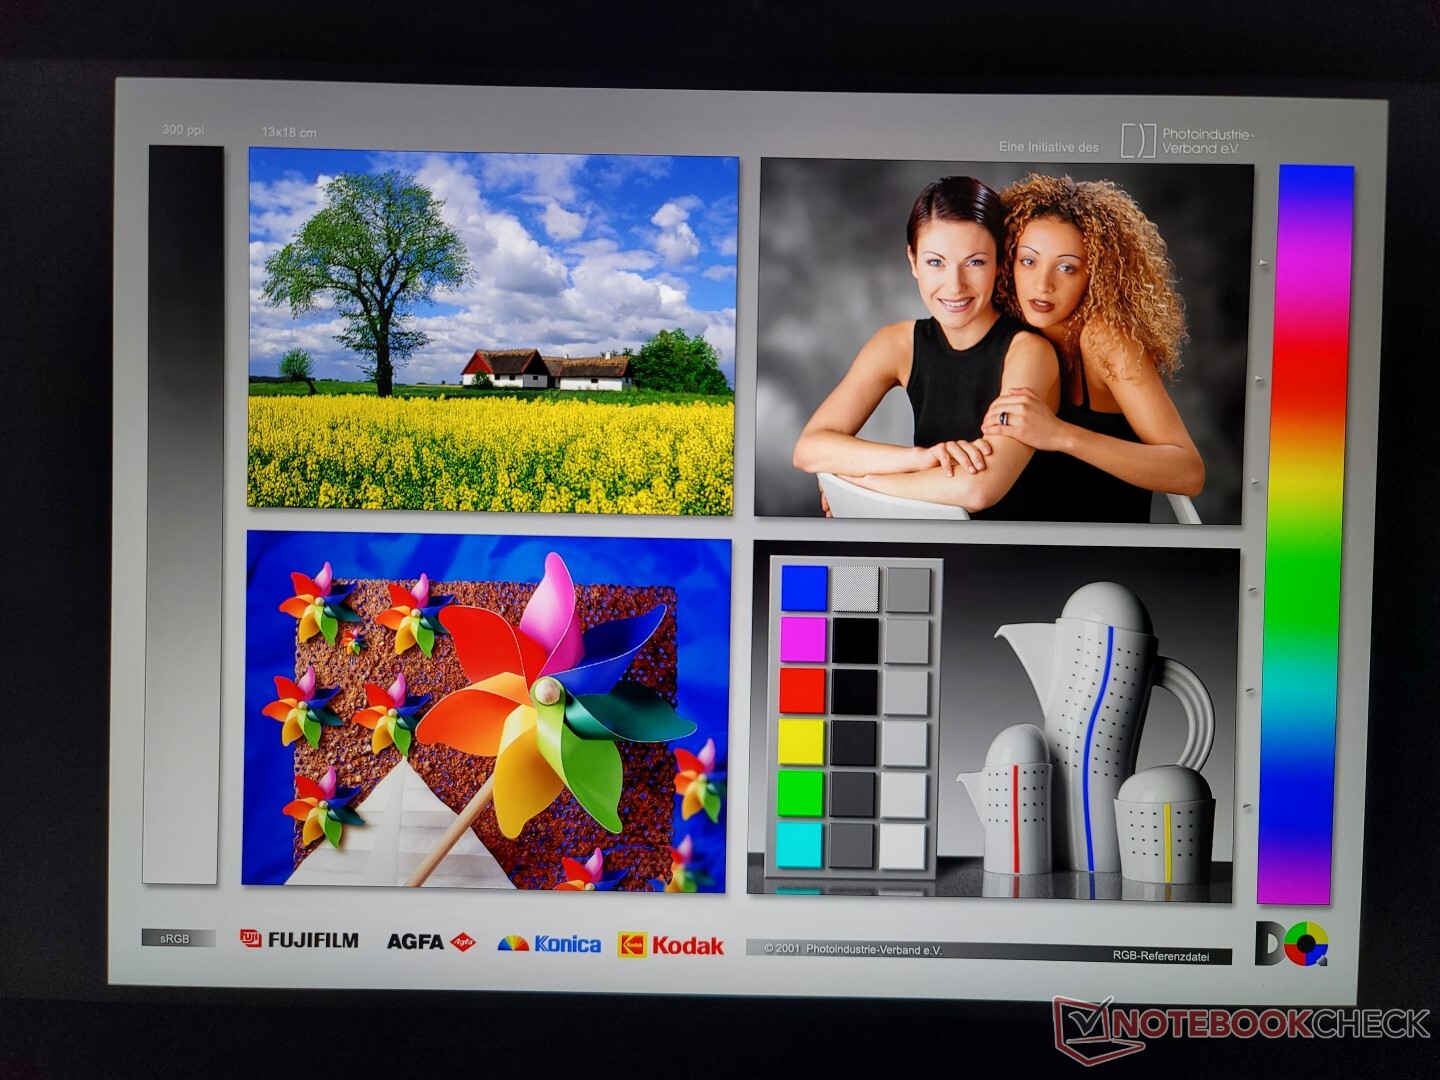
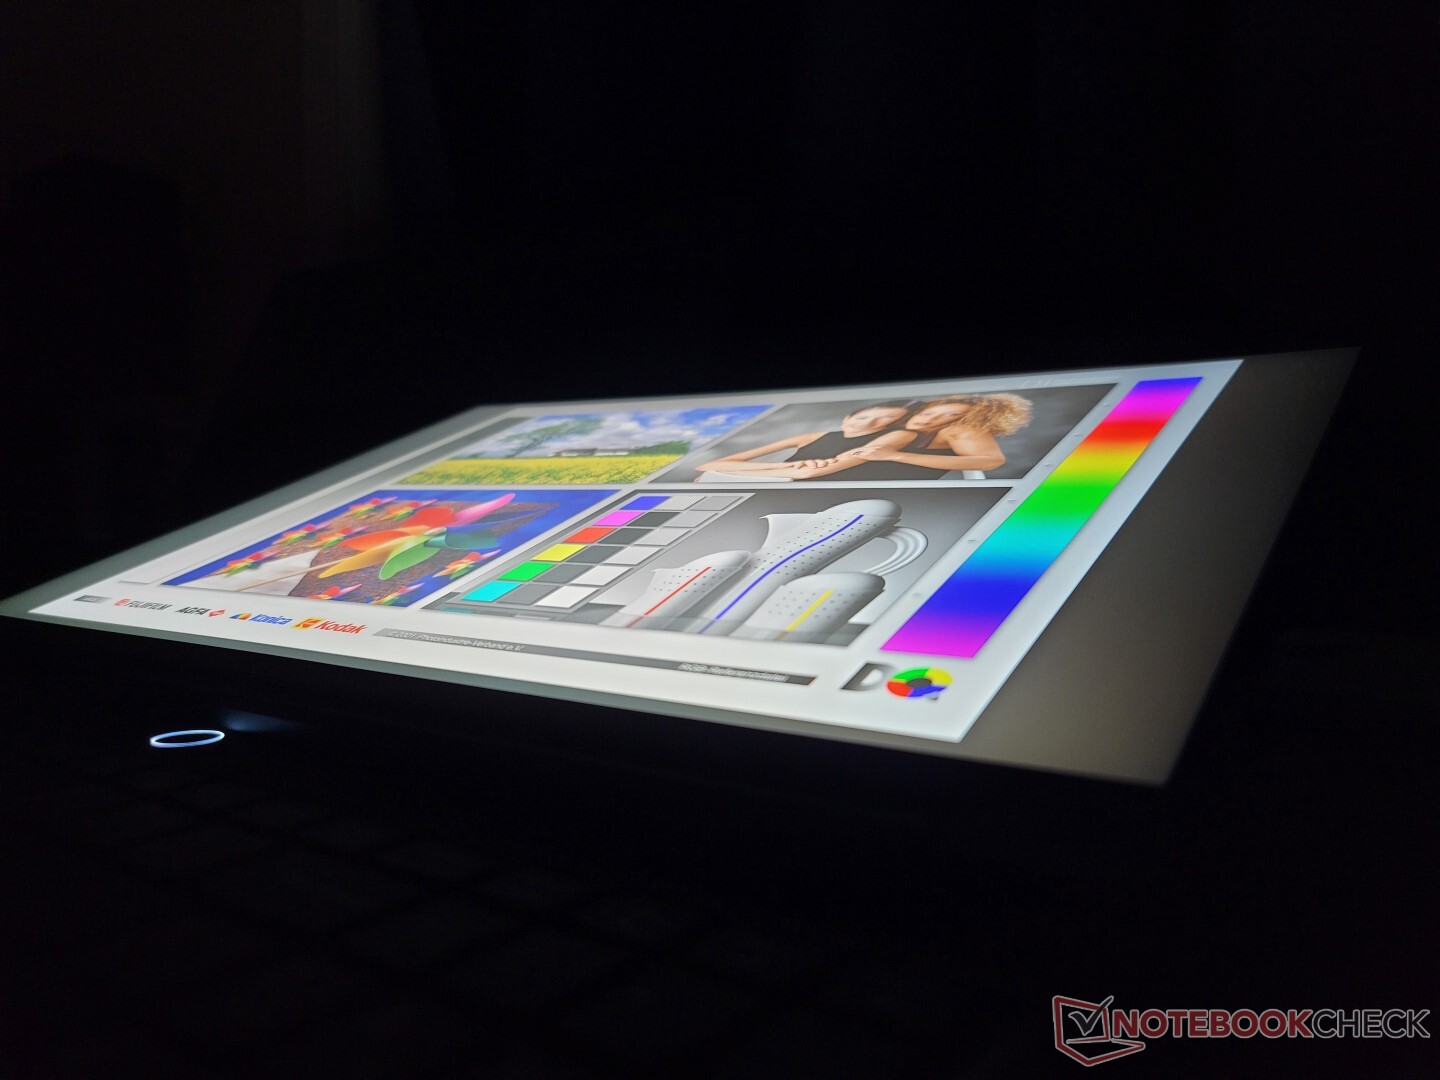
Display — 165 Hz, 500 nits, 100% sRGB, FreeSync, IPS, Oh My!
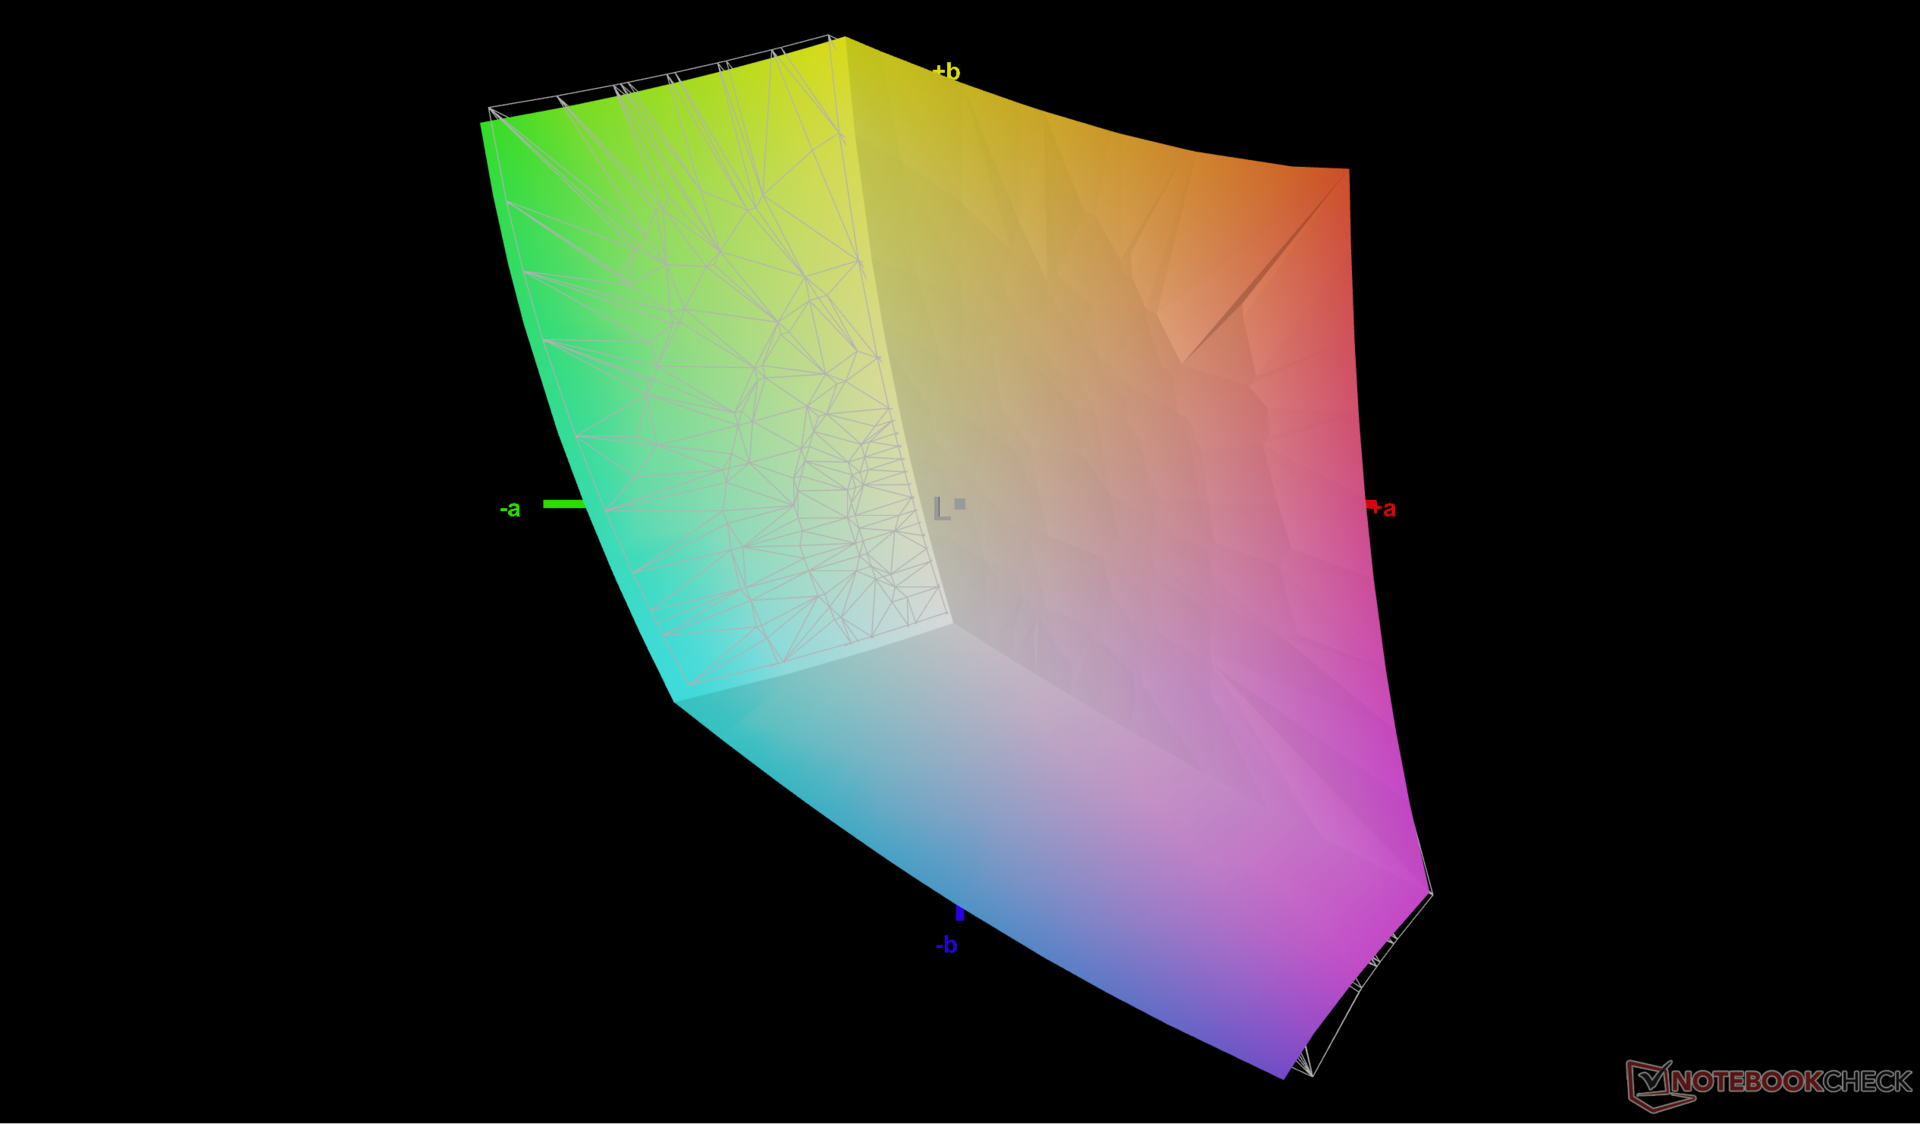
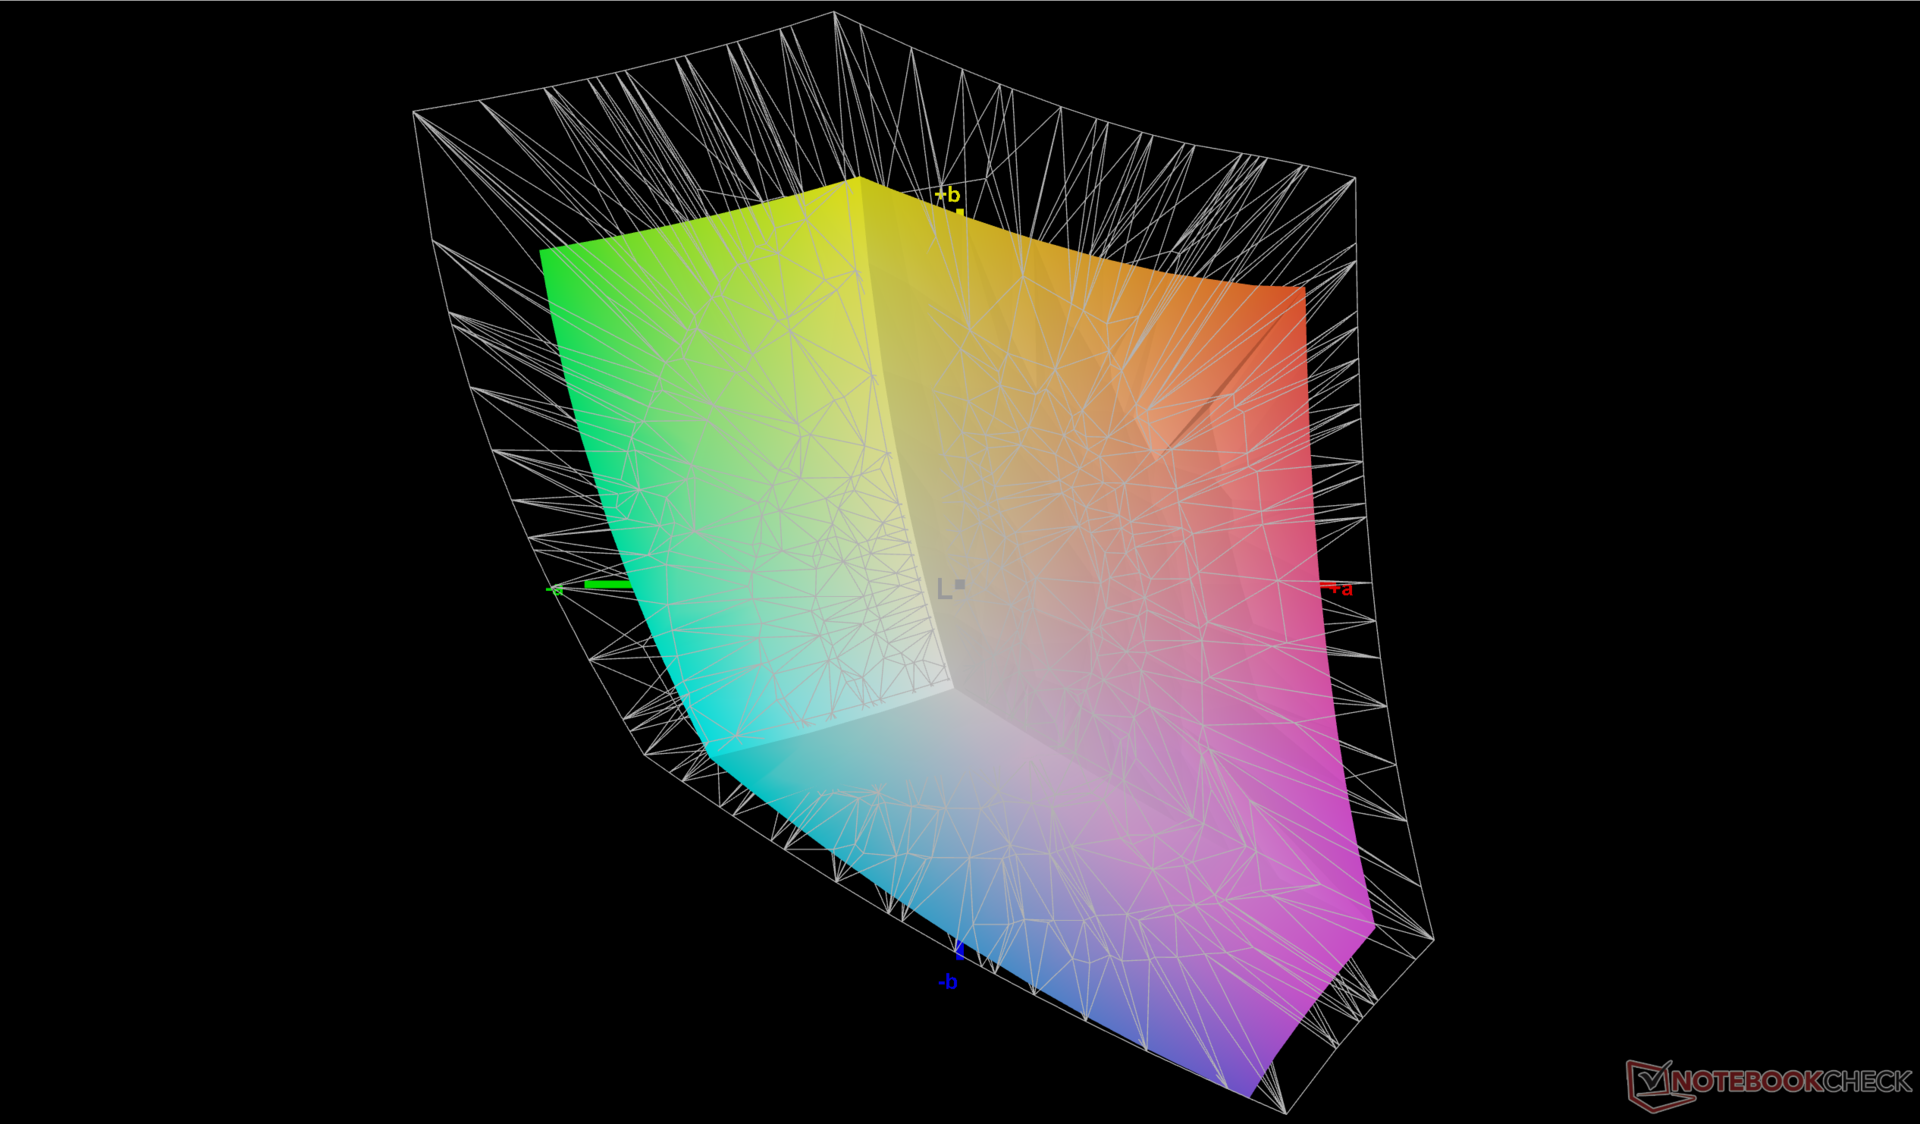
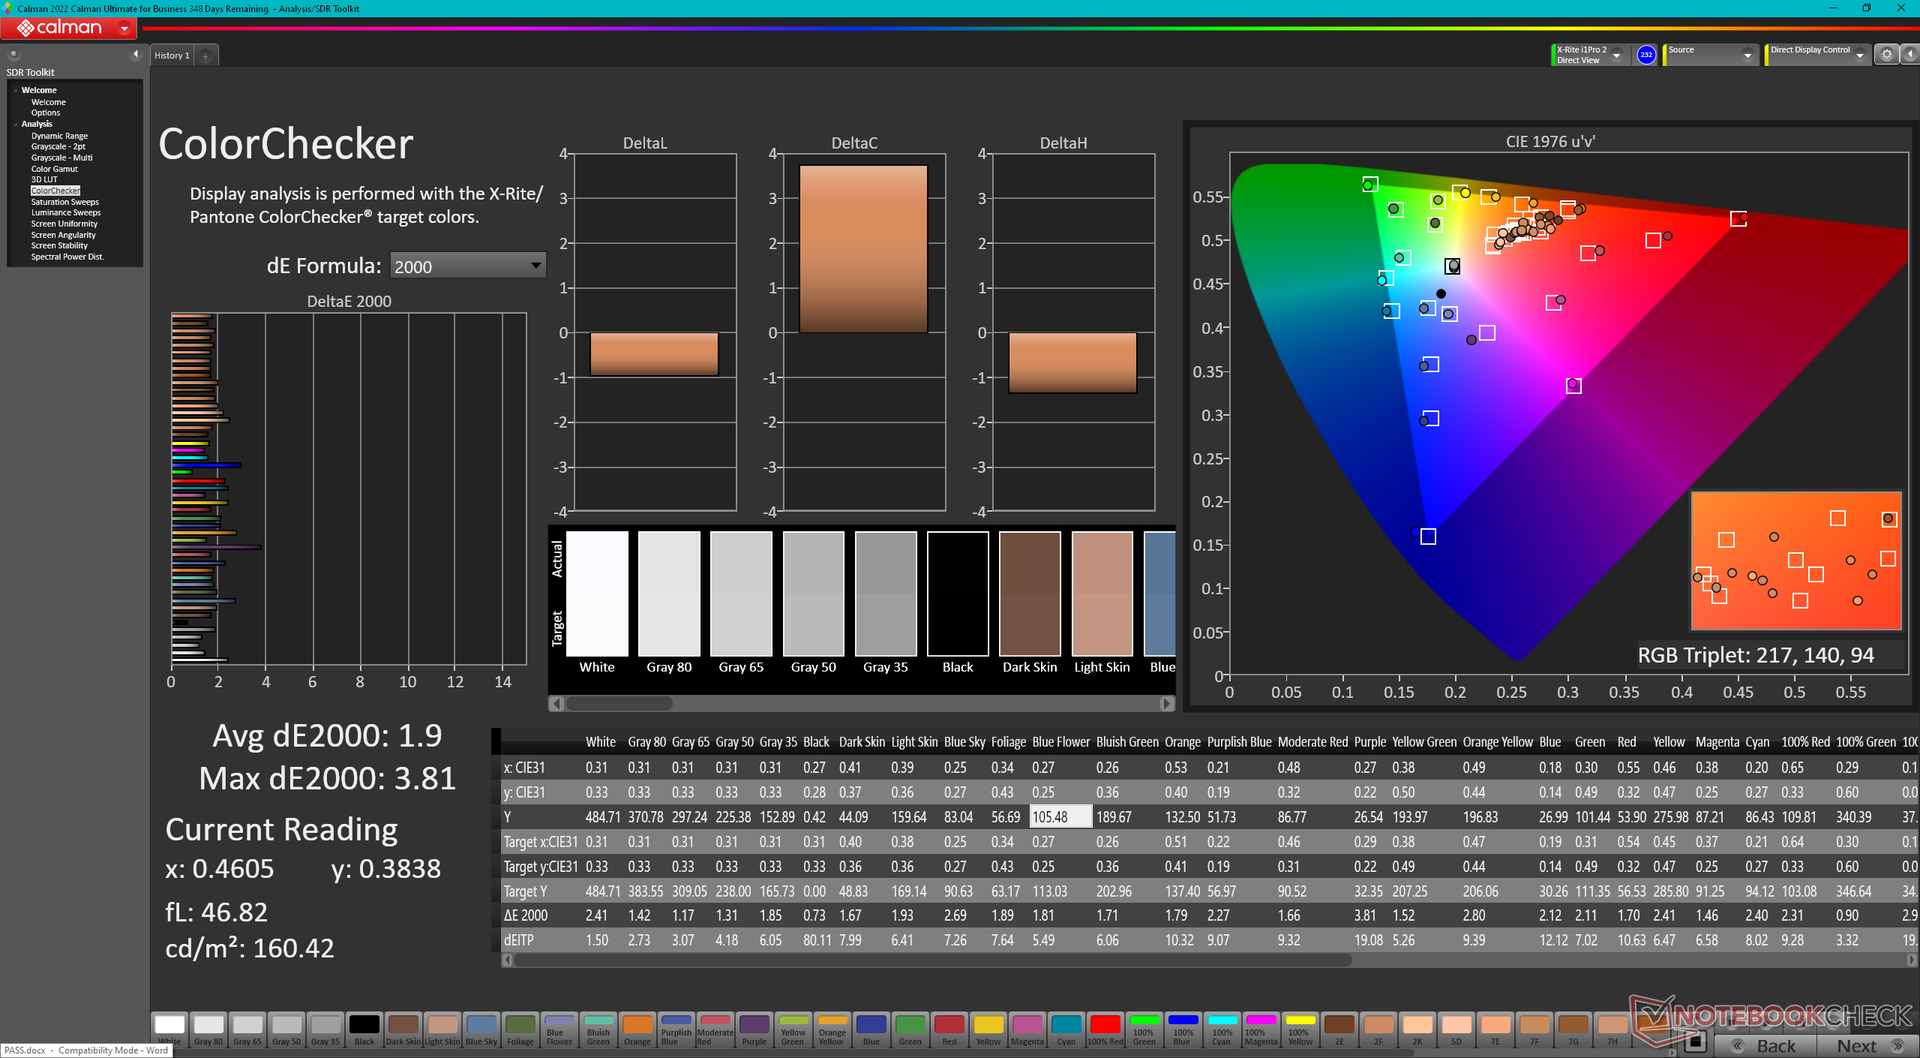
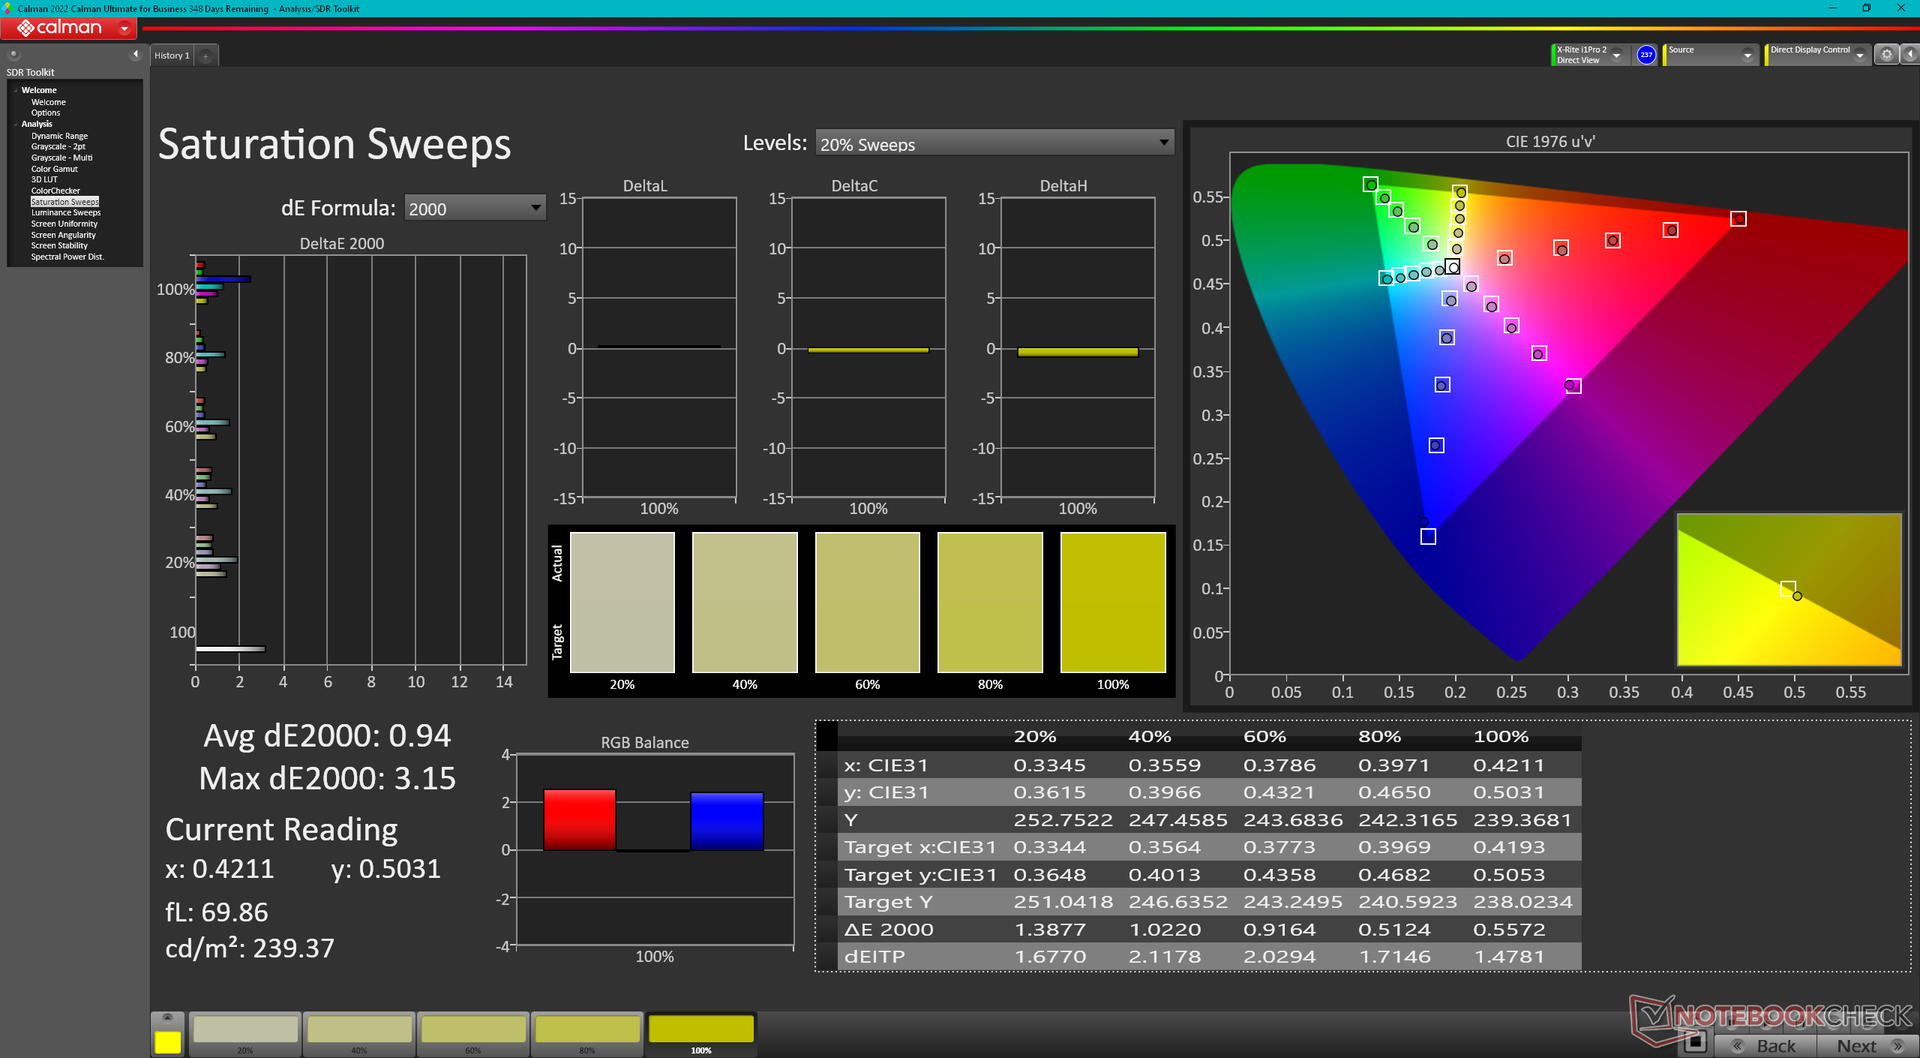
The Legion S7 16 utilizes the exact same BOE CQ NE160QDM-NY1 panel as found on the thicker Legion 7 16. This particular IPS panel offers fast response times, a fast 165 Hz refresh rate, full sRGB coverage, and FreeSync to be a high quality panel fit for high-end gaming laptops. P3 colors are limited, however, and Lenovo doesn't offer any OLED options at the moment. It's still one of the best 16-inch panels for gaming purposes nonetheless.


| |||||||||||||||||||||||||
Brightness Distribution: 90 %
Center on Battery: 492.4 cd/m²
Contrast: 1231:1 (Black: 0.4 cd/m²)
ΔE Color 1.9 | 0.5-29.43 Ø5, calibrated: 0.99
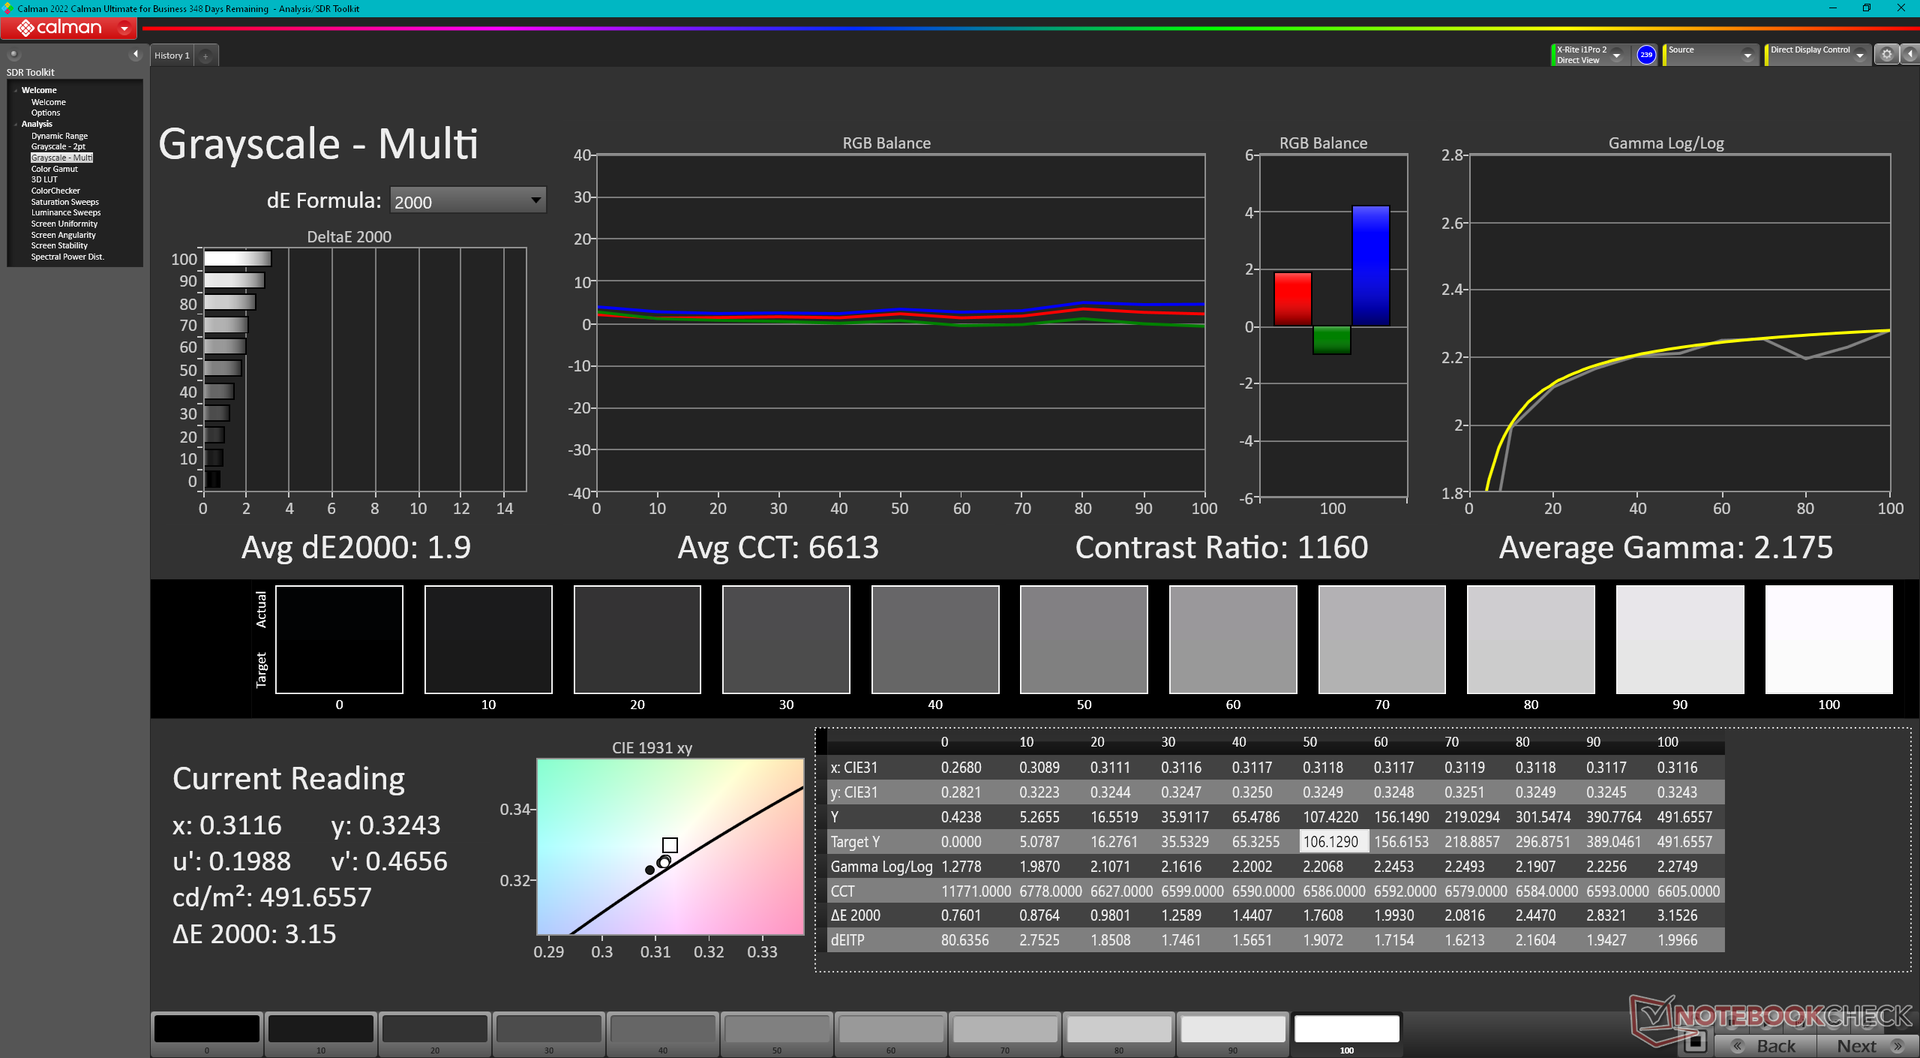
ΔE Greyscale 1.7 | 0.57-98 Ø5.3
71.9% AdobeRGB 1998 (Argyll 2.2.0 3D)
98.1% sRGB (Argyll 2.2.0 3D)
69.8% Display P3 (Argyll 2.2.0 3D)
Gamma: 2.36
| Lenovo Legion S7 16ARHA7 BOE CQ NE160QDM-NY1, IPS, 2560x1600, 16.00 | Lenovo Legion Slim 7-16IAH 82TF004YGE MNG007DA1-G , IPS LED, 2560x1600, 16.00 | Lenovo Legion 7 16IAX7-82TD004SGE NE160QDM-NY1, IPS, 2560x1600, 16.00 | Dell G16 7620 BOE NE16QDM, IPS, 2560x1600, 16.00 | HP Omen 16-c0077ng BOE09E5, IPS, 2560x1440, 16.10 | Asus ROG Zephyrus M16 GU603H AU Optronics AUOC199, IPS, 2560x1600, 16.00 | |
|---|---|---|---|---|---|---|
| Display | 1% | -1% | -1% | -1% | ||
| Display P3 Coverage | 69.8 | 70.5 1% | 69.3 -1% | 68.3 -2% | 68.8 -1% | |
| sRGB Coverage | 98.1 | 99.1 1% | 98.2 0% | 98 0% | 96.9 -1% | |
| AdobeRGB 1998 Coverage | 71.9 | 72.8 1% | 70.8 -2% | 70.5 -2% | 71.1 -1% | |
| Response Times | 13% | 15% | 17% | -4% | 53% | |
| Response Time Grey 50% / Grey 80% * | 10 ? | 12 ? -20% | 12.6 ? -26% | 8.6 ? 14% | 13 ? -30% | 4.8 ? 52% |
| Response Time Black / White * | 12.8 ? | 7 ? 45% | 5.6 ? 56% | 10.4 ? 19% | 10 ? 22% | 6 ? 53% |
| PWM Frequency | ||||||
| Screen | -16% | -18% | -18% | -54% | -52% | |
| Brightness middle | 492.4 | 523 6% | 547 11% | 369.4 -25% | 297 -40% | 448 -9% |
| Brightness | 471 | 494 5% | 523 11% | 348 -26% | 283 -40% | 446 -5% |
| Brightness Distribution | 90 | 90 0% | 88 -2% | 83 -8% | 91 1% | 86 -4% |
| Black Level * | 0.4 | 0.4 -0% | 0.44 -10% | 0.32 20% | 0.22 45% | 0.48 -20% |
| Contrast | 1231 | 1308 6% | 1243 1% | 1154 -6% | 1350 10% | 933 -24% |
| Colorchecker dE 2000 * | 1.9 | 2.6 -37% | 2.1 -11% | 1.78 6% | 3.25 -71% | 2.76 -45% |
| Colorchecker dE 2000 max. * | 3.81 | 5 -31% | 7 -84% | 4.41 -16% | 6.33 -66% | 7.09 -86% |
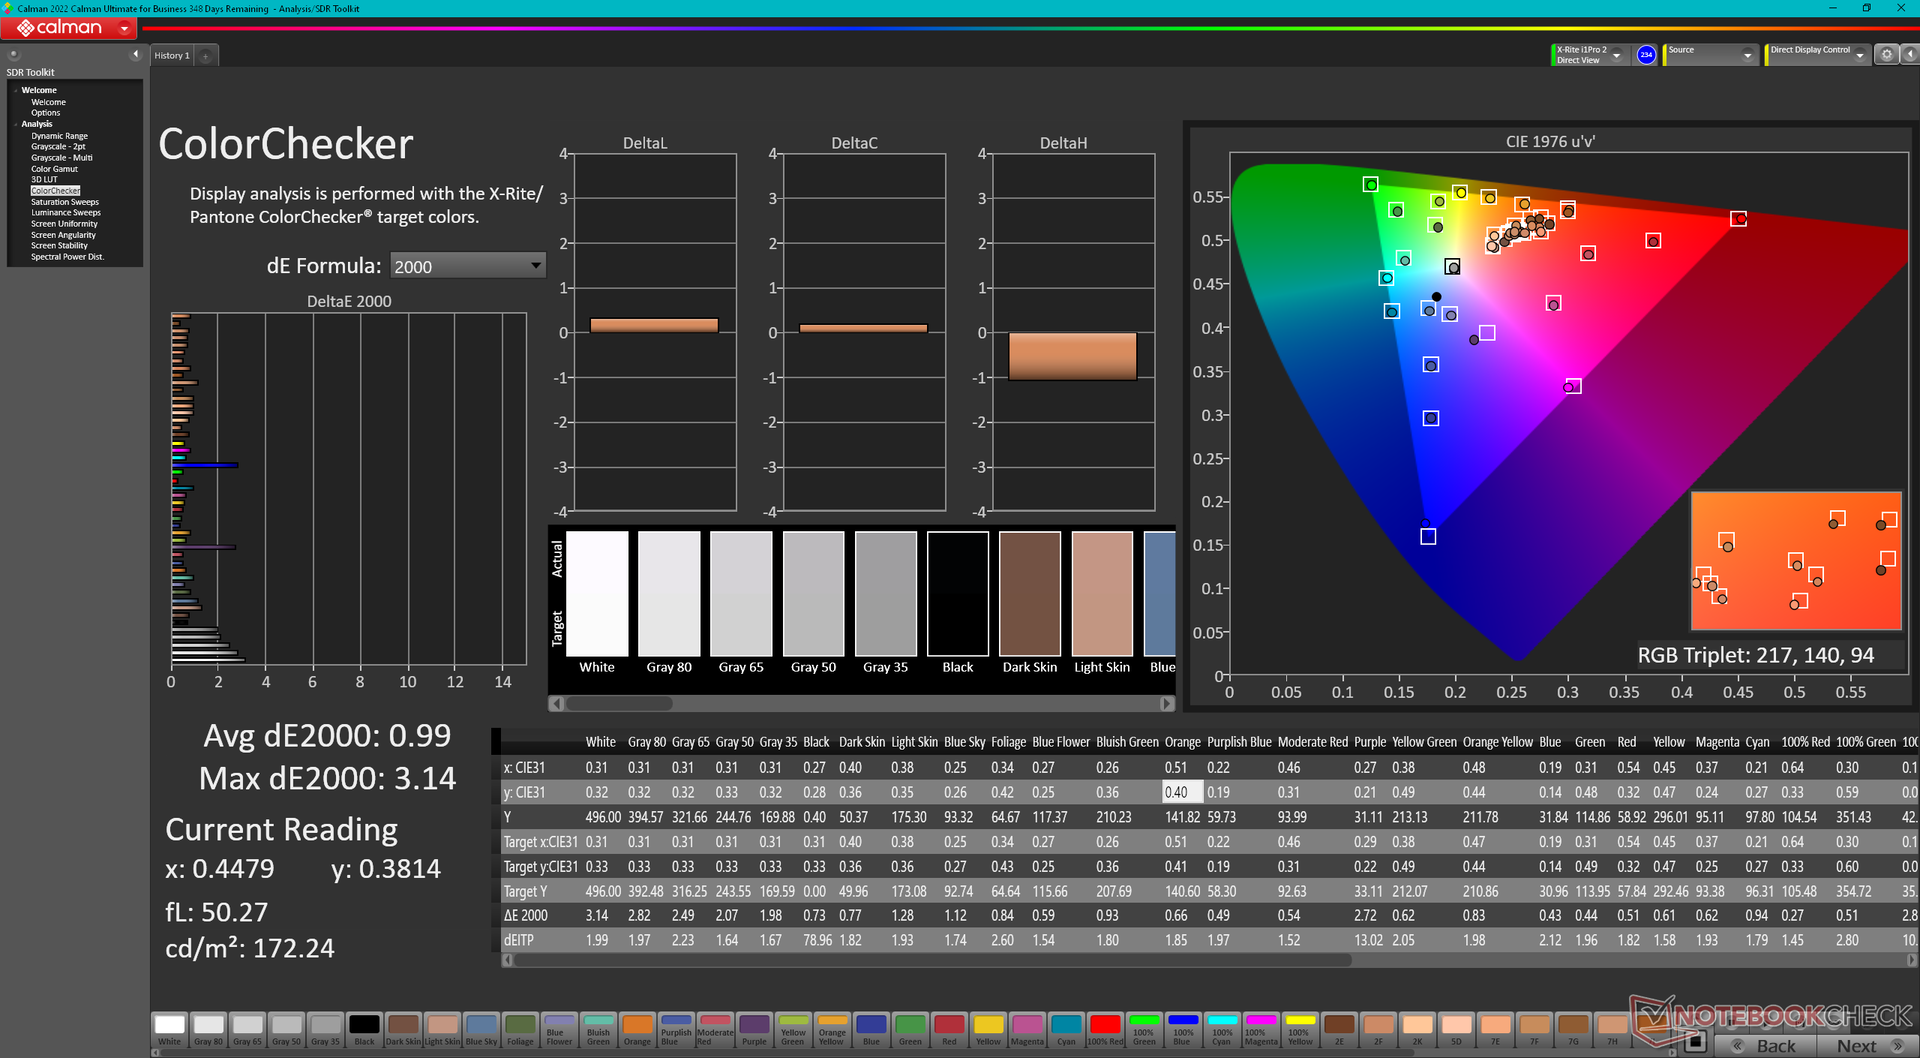
| Colorchecker dE 2000 calibrated * | 0.99 | 1 -1% | 0.9 9% | 1.22 -23% | 1.11 -12% | 2.86 -189% |
| Greyscale dE 2000 * | 1.7 | 3.3 -94% | 3.2 -88% | 3.2 -88% | 6.97 -310% | 3.1 -82% |
| Gamma | 2.36 93% | 2.17 101% | 2.23 99% | 2.2 100% | 2.3 96% | 2.153 102% |
| CCT | 6497 100% | 6013 108% | 6979 93% | 6750 96% | 6050 107% | 6826 95% |
| Color Space (Percent of AdobeRGB 1998) | 87 | |||||
| Color Space (Percent of sRGB) | 100 | |||||
| Total Average (Program / Settings) | -1% /
-8% | -1% /
-10% | -1% /
-10% | -20% /
-35% | 1% /
-33% |
* ... smaller is better
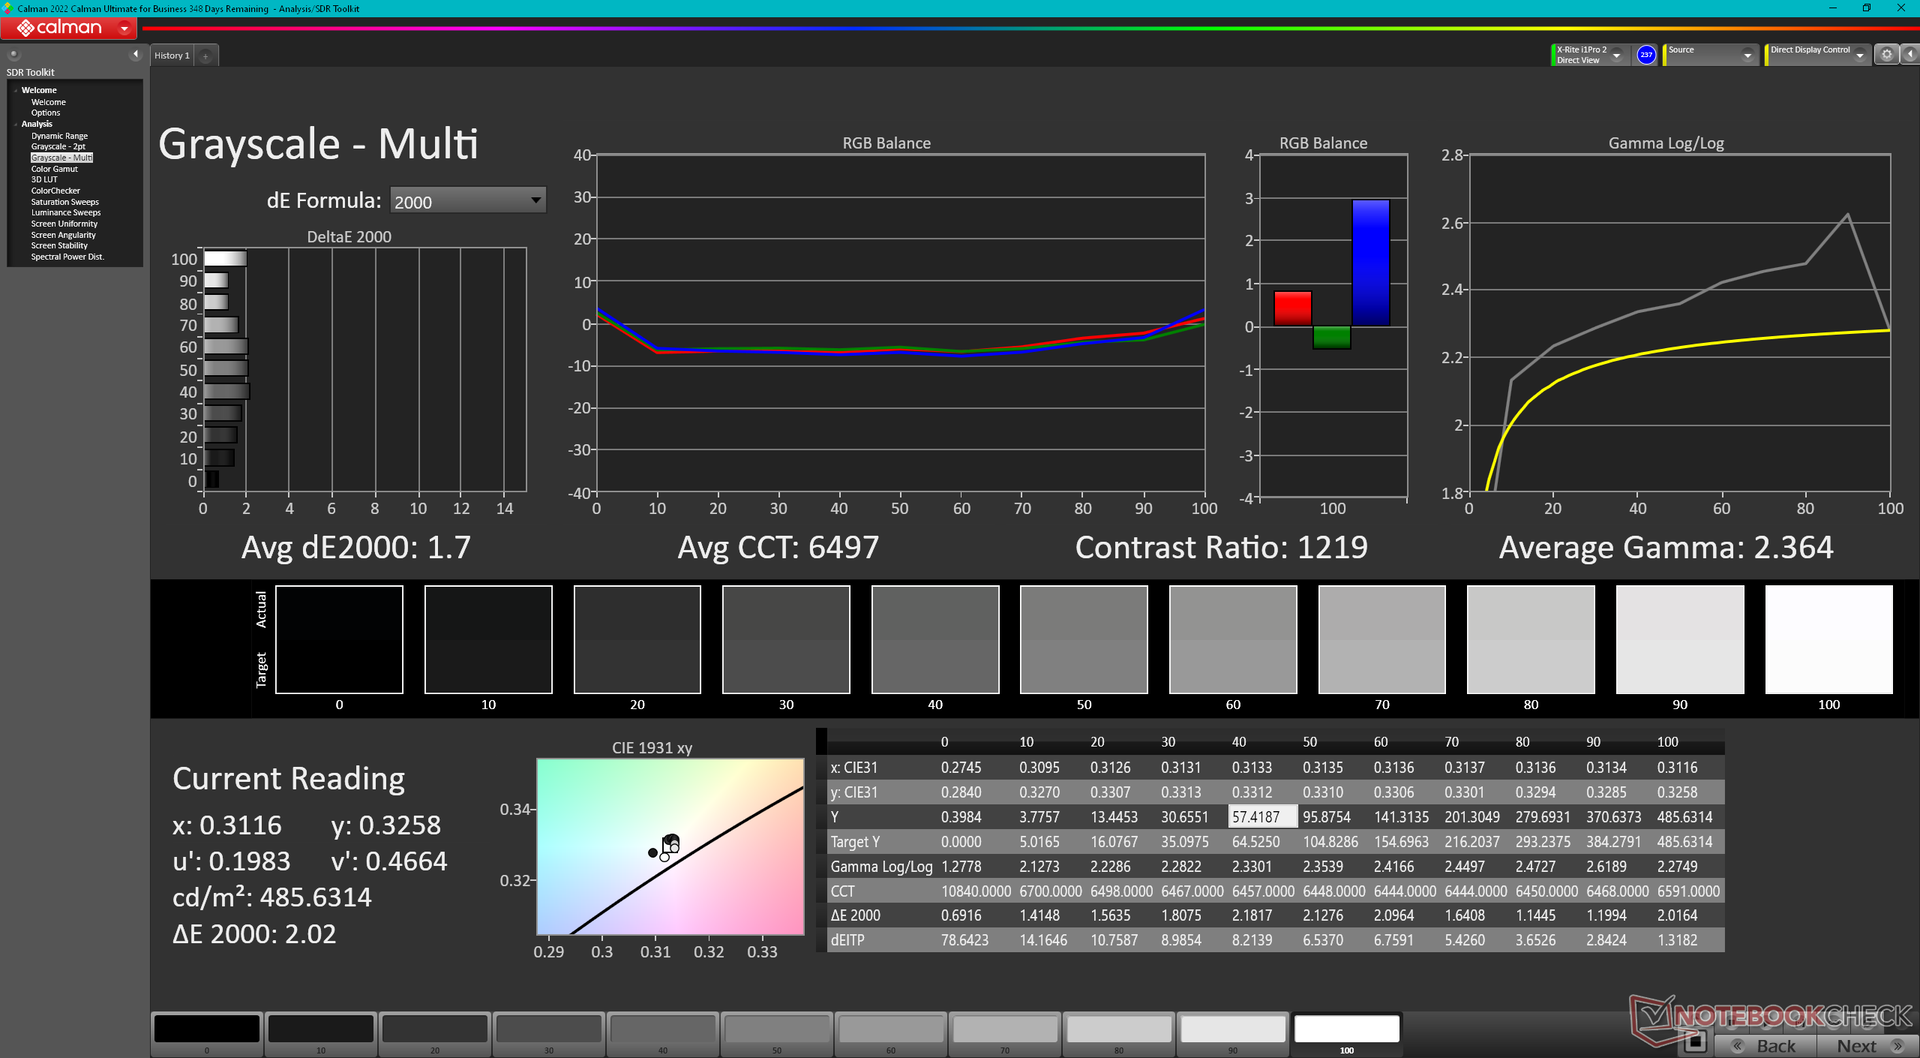
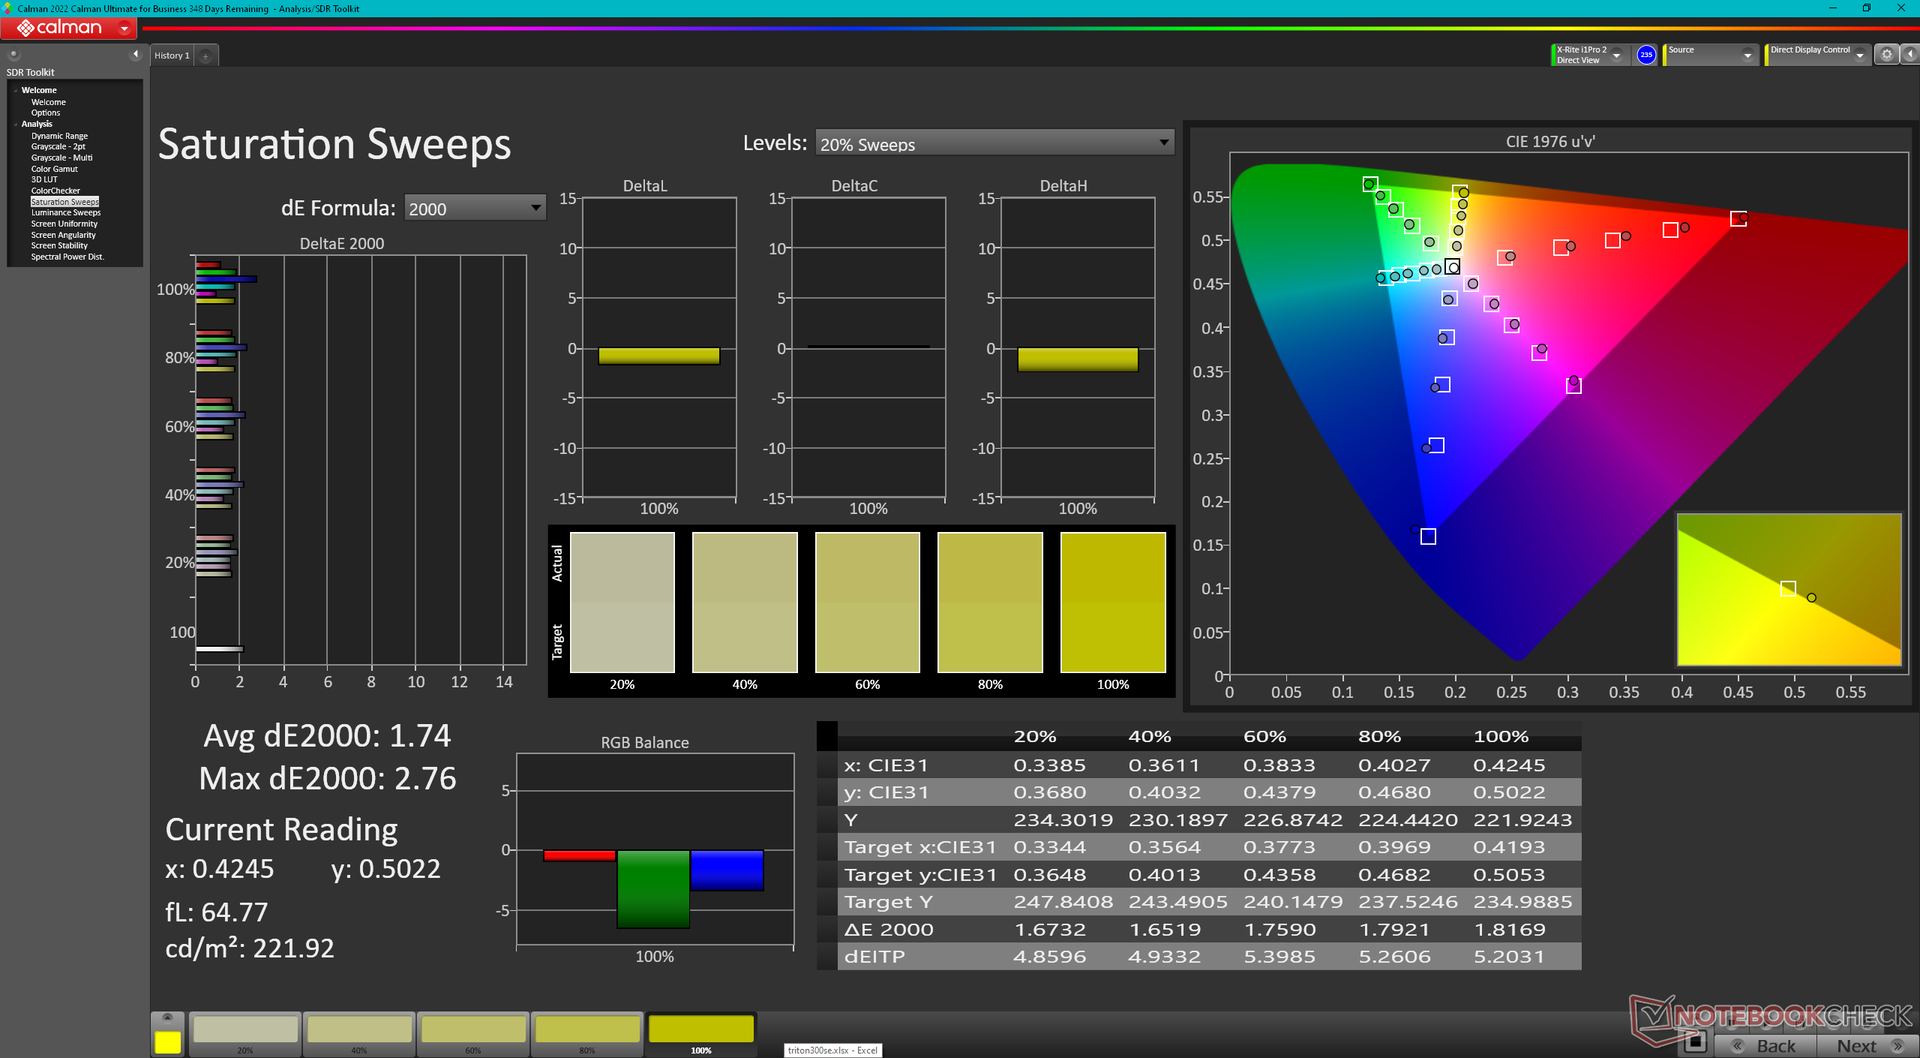
The display is already calibrated out of the box with average grayscale and color DeltaE values of <2 each. Calibrating it even further ourselves would improve the average color DeltaE to <1, but this isn't wholly necessary.
Display Response Times
| ↔ Response Time Black to White | ||
|---|---|---|
| 12.8 ms ... rise ↗ and fall ↘ combined | ↗ 6.8 ms rise | 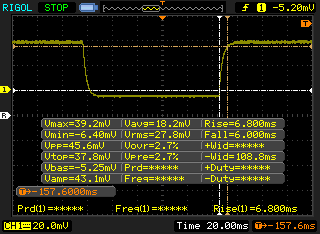 |
| ↘ 6 ms fall | ||
| The screen shows good response rates in our tests, but may be too slow for competitive gamers. In comparison, all tested devices range from 0.1 (minimum) to 240 (maximum) ms. » 28 % of all devices are better. This means that the measured response time is better than the average of all tested devices (21.5 ms). | ||
| ↔ Response Time 50% Grey to 80% Grey | ||
| 10 ms ... rise ↗ and fall ↘ combined | ↗ 4.8 ms rise | 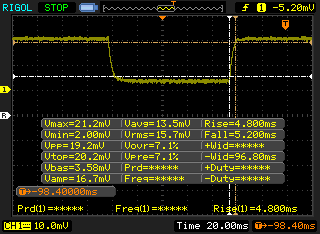 |
| ↘ 5.2 ms fall | ||
| The screen shows good response rates in our tests, but may be too slow for competitive gamers. In comparison, all tested devices range from 0.2 (minimum) to 636 (maximum) ms. » 18 % of all devices are better. This means that the measured response time is better than the average of all tested devices (33.7 ms). | ||
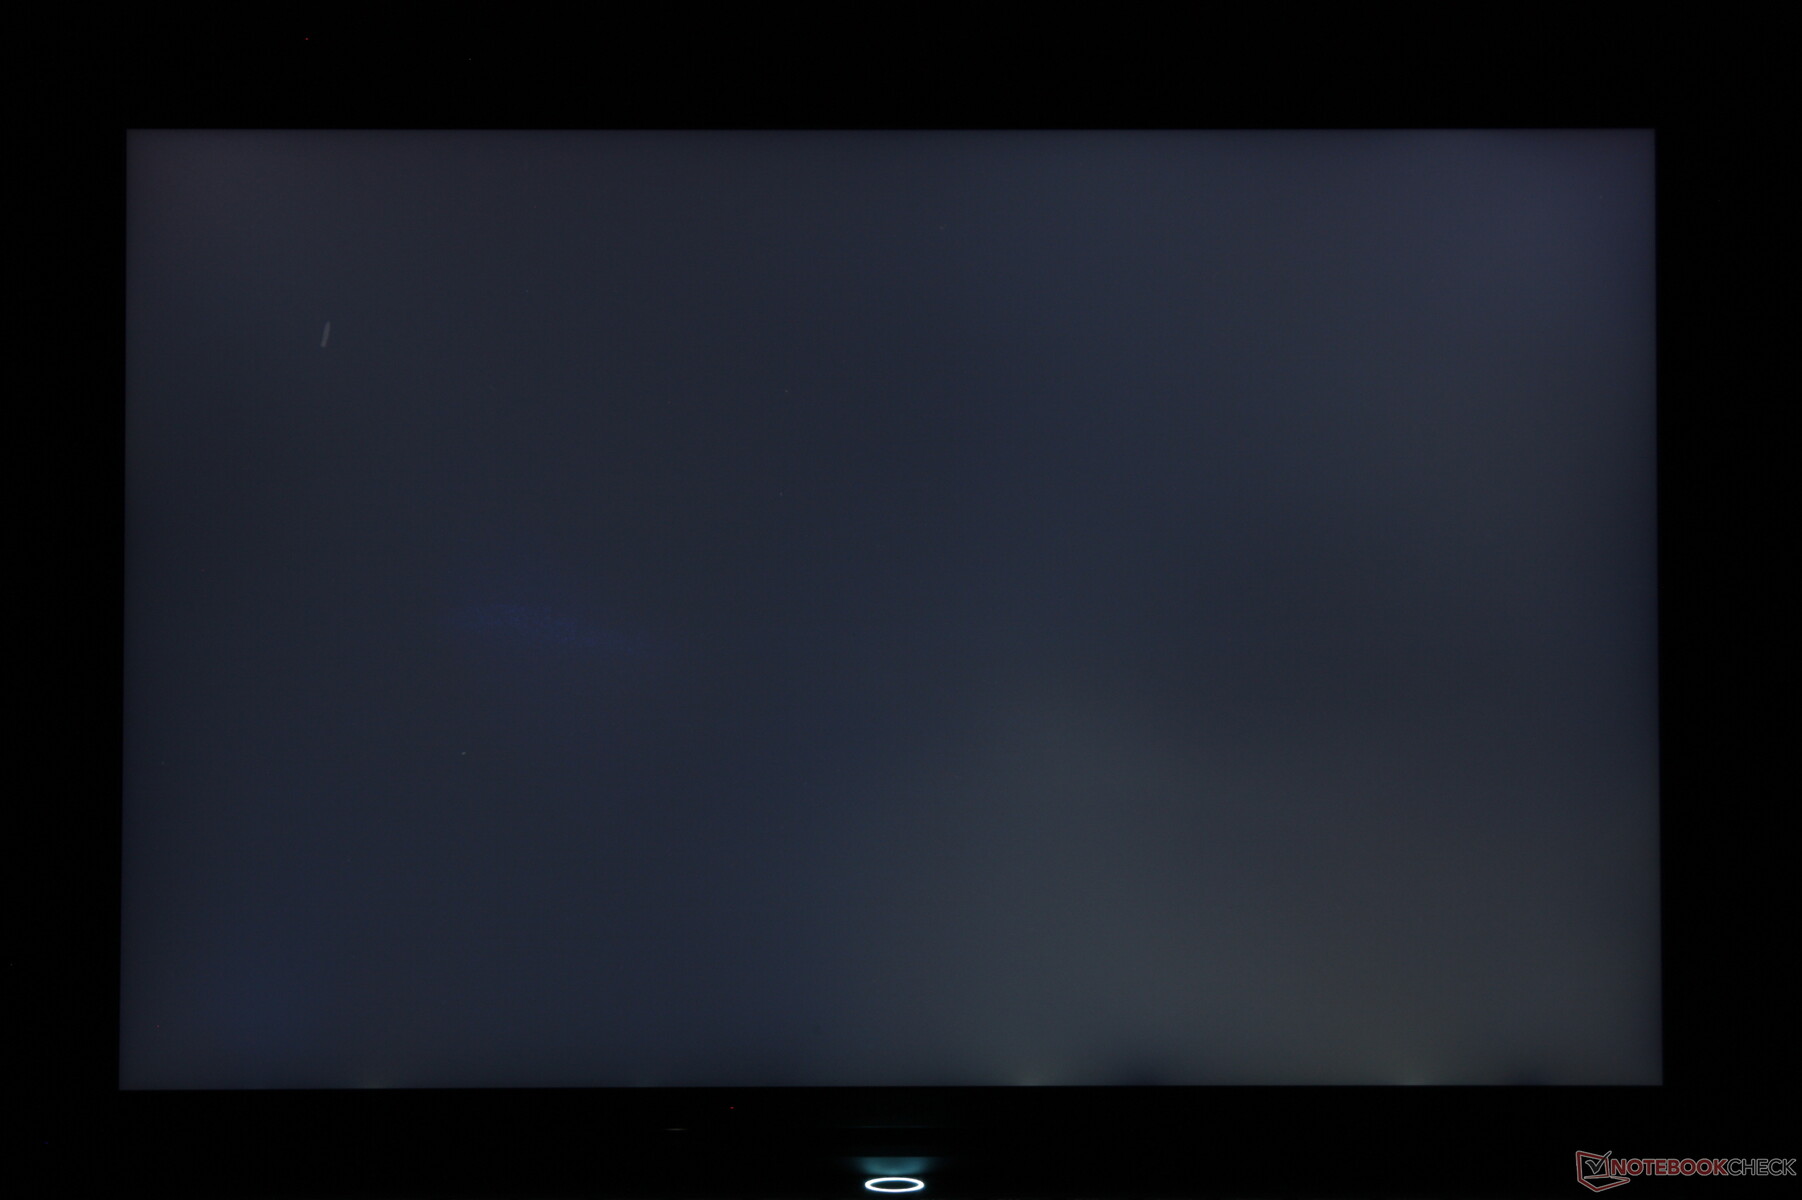
Screen Flickering / PWM (Pulse-Width Modulation)
| Screen flickering / PWM not detected | 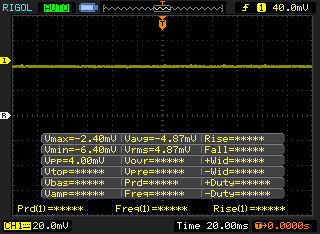 | ||
In comparison: 53 % of all tested devices do not use PWM to dim the display. If PWM was detected, an average of 17900 (minimum: 5 - maximum: 3846000) Hz was measured. | |||
At about 500 nits, the display is brighter than on most other gaming laptops for easier readability when outdoors. Remember to disable AMD Vari-Bright in the Radeon menu or else maximum brightness will drop to just 420 nits when running on battery power.
Performance — Zen 3+ with RDNA 2
Testing Conditions
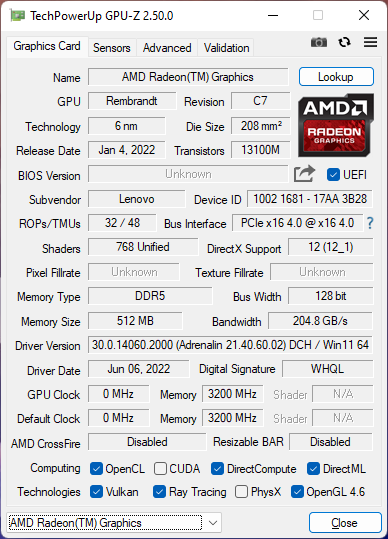
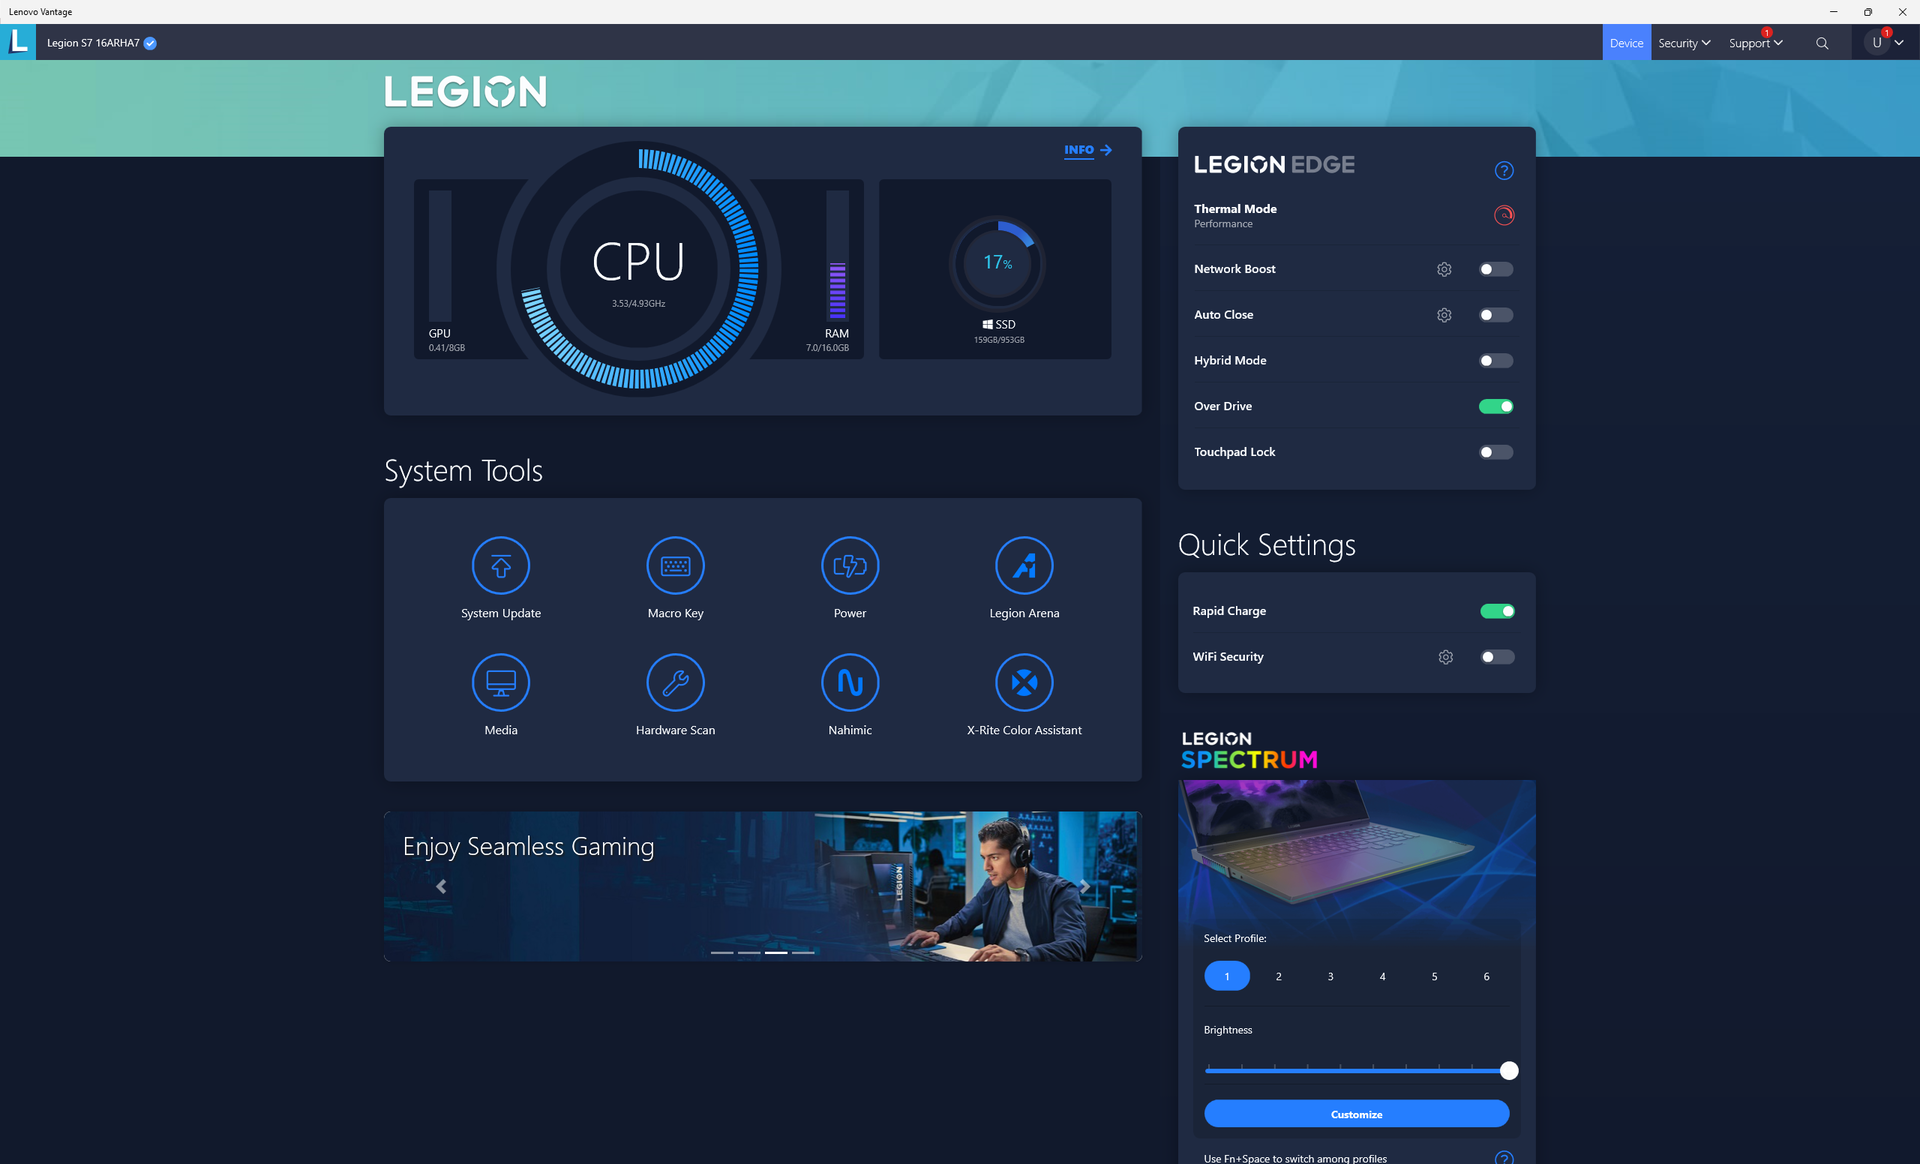
We set our unit to Performance mode via Lenovo Vantage and Windows prior to running any benchmarks below for the highest possible scores. We also made sure to disable 'Hybrid Mode' in order to fully exploit the discrete Radeon RX 6900S GPU. It's highly recommended that users become familiar with the pre-installed Vantage software as it is the control hub for the system.
Processor
Single-thread and multi-thread CPU performance is approximately 10 percent and 20 percent slower, respectively, than the competing Core i7-12700H. There is almost no difference between the Ryzen 7 6800H and Ryzen 9 6900HX as previously discussed and so the lower-end 6800H configuration can offer essentially the same processor performance as our Ryzen 9 test unit.
Cinebench R15 Multi Loop
Cinebench R23: Multi Core | Single Core
Cinebench R15: CPU Multi 64Bit | CPU Single 64Bit
Blender: v2.79 BMW27 CPU
7-Zip 18.03: 7z b 4 | 7z b 4 -mmt1
Geekbench 5.5: Multi-Core | Single-Core
HWBOT x265 Benchmark v2.2: 4k Preset
LibreOffice : 20 Documents To PDF
R Benchmark 2.5: Overall mean
* ... smaller is better
AIDA64: FP32 Ray-Trace | FPU Julia | CPU SHA3 | CPU Queen | FPU SinJulia | FPU Mandel | CPU AES | CPU ZLib | FP64 Ray-Trace | CPU PhotoWorxx
| Performance Rating | |
| Lenovo Legion S7 16ARHA7 | |
| Lenovo Legion Slim 7-16IAH 82TF004YGE | |
| Average AMD Ryzen 9 6900HX | |
| Lenovo Legion 7 16IAX7-82TD004SGE | |
| HP Omen 16-c0077ng | |
| Dell G16 7620 | |
| AIDA64 / FP32 Ray-Trace | |
| Lenovo Legion Slim 7-16IAH 82TF004YGE | |
| Lenovo Legion S7 16ARHA7 | |
| Average AMD Ryzen 9 6900HX (10950 - 17963, n=20) | |
| Dell G16 7620 | |
| HP Omen 16-c0077ng | |
| Lenovo Legion 7 16IAX7-82TD004SGE | |
| AIDA64 / FPU Julia | |
| Lenovo Legion S7 16ARHA7 | |
| Average AMD Ryzen 9 6900HX (71414 - 110797, n=20) | |
| HP Omen 16-c0077ng | |
| Lenovo Legion Slim 7-16IAH 82TF004YGE | |
| Dell G16 7620 | |
| Lenovo Legion 7 16IAX7-82TD004SGE | |
| AIDA64 / CPU SHA3 | |
| Lenovo Legion 7 16IAX7-82TD004SGE | |
| Lenovo Legion Slim 7-16IAH 82TF004YGE | |
| Dell G16 7620 | |
| Lenovo Legion S7 16ARHA7 | |
| Average AMD Ryzen 9 6900HX (2471 - 3804, n=20) | |
| HP Omen 16-c0077ng | |
| AIDA64 / CPU Queen | |
| Lenovo Legion S7 16ARHA7 | |
| Lenovo Legion Slim 7-16IAH 82TF004YGE | |
| Dell G16 7620 | |
| Lenovo Legion 7 16IAX7-82TD004SGE | |
| Average AMD Ryzen 9 6900HX (84185 - 107544, n=20) | |
| HP Omen 16-c0077ng | |
| AIDA64 / FPU SinJulia | |
| Lenovo Legion 7 16IAX7-82TD004SGE | |
| Lenovo Legion S7 16ARHA7 | |
| Average AMD Ryzen 9 6900HX (10970 - 13205, n=20) | |
| HP Omen 16-c0077ng | |
| Dell G16 7620 | |
| Lenovo Legion Slim 7-16IAH 82TF004YGE | |
| AIDA64 / FPU Mandel | |
| Lenovo Legion S7 16ARHA7 | |
| Average AMD Ryzen 9 6900HX (39164 - 61370, n=20) | |
| HP Omen 16-c0077ng | |
| Lenovo Legion Slim 7-16IAH 82TF004YGE | |
| Dell G16 7620 | |
| Lenovo Legion 7 16IAX7-82TD004SGE | |
| AIDA64 / CPU AES | |
| Lenovo Legion Slim 7-16IAH 82TF004YGE | |
| Lenovo Legion S7 16ARHA7 | |
| Lenovo Legion 7 16IAX7-82TD004SGE | |
| HP Omen 16-c0077ng | |
| Average AMD Ryzen 9 6900HX (54613 - 142360, n=20) | |
| Dell G16 7620 | |
| AIDA64 / CPU ZLib | |
| Lenovo Legion 7 16IAX7-82TD004SGE | |
| Dell G16 7620 | |
| Lenovo Legion Slim 7-16IAH 82TF004YGE | |
| Lenovo Legion S7 16ARHA7 | |
| HP Omen 16-c0077ng | |
| Average AMD Ryzen 9 6900HX (578 - 911, n=20) | |
| AIDA64 / FP64 Ray-Trace | |
| Lenovo Legion S7 16ARHA7 | |
| Lenovo Legion Slim 7-16IAH 82TF004YGE | |
| Average AMD Ryzen 9 6900HX (5798 - 9540, n=20) | |
| Dell G16 7620 | |
| HP Omen 16-c0077ng | |
| Lenovo Legion 7 16IAX7-82TD004SGE | |
| AIDA64 / CPU PhotoWorxx | |
| Lenovo Legion 7 16IAX7-82TD004SGE | |
| Lenovo Legion Slim 7-16IAH 82TF004YGE | |
| Dell G16 7620 | |
| Average AMD Ryzen 9 6900HX (26873 - 30604, n=20) | |
| Lenovo Legion S7 16ARHA7 | |
| HP Omen 16-c0077ng | |
System Performance
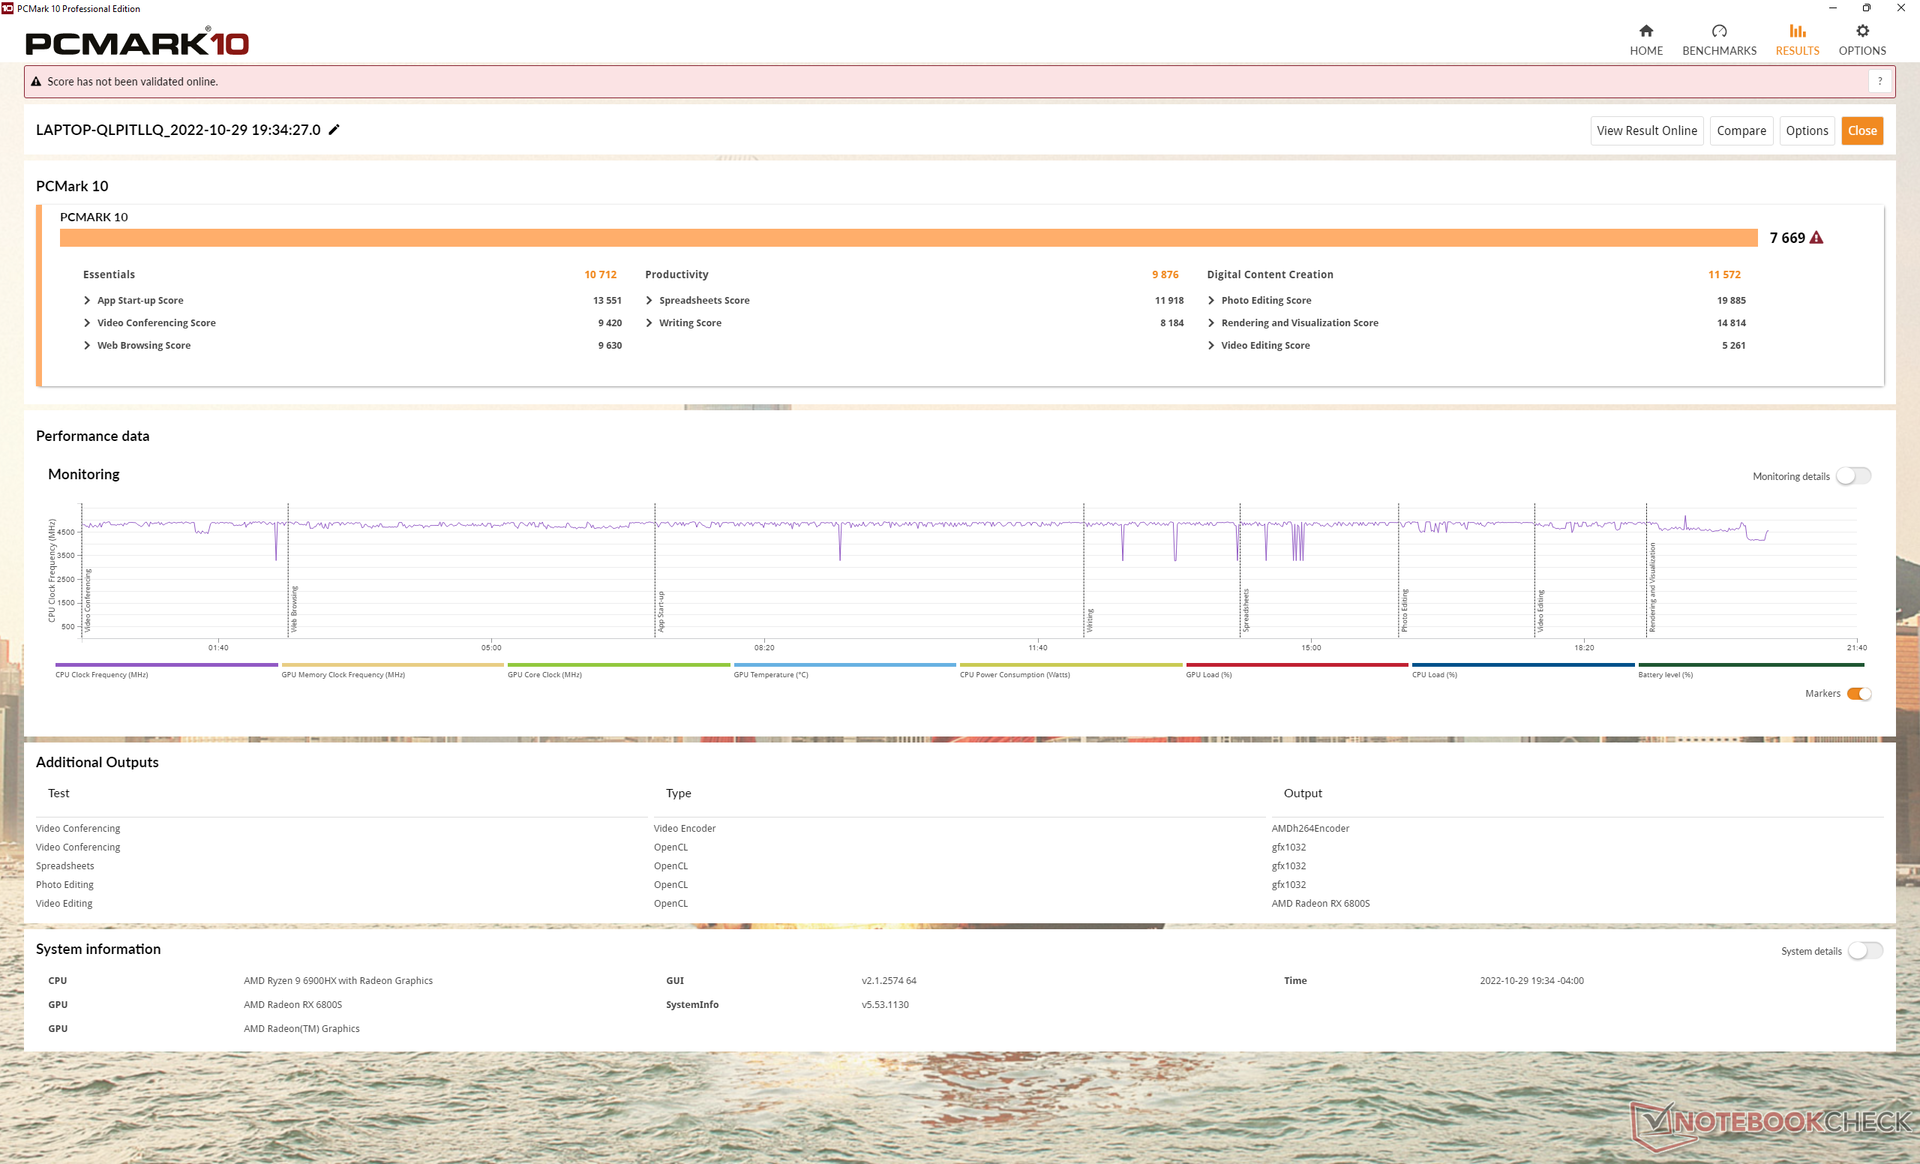
PCMark results are comparable to other upper midrange gaming laptops powered by GeForce RTX 3060 graphics including the Acer Predator Triton 300 SE or HP Envy 16.
CrossMark: Overall | Productivity | Creativity | Responsiveness
| PCMark 10 / Score | |
| Lenovo Legion 7 16IAX7-82TD004SGE | |
| Lenovo Legion S7 16ARHA7 | |
| Average AMD Ryzen 9 6900HX, AMD Radeon RX 6800S () | |
| Lenovo Legion Slim 7-16IAH 82TF004YGE | |
| Dell G16 7620 | |
| HP Omen 16-c0077ng | |
| Asus ROG Zephyrus M16 GU603H | |
| PCMark 10 / Essentials | |
| Lenovo Legion 7 16IAX7-82TD004SGE | |
| Lenovo Legion Slim 7-16IAH 82TF004YGE | |
| Lenovo Legion S7 16ARHA7 | |
| Average AMD Ryzen 9 6900HX, AMD Radeon RX 6800S () | |
| Asus ROG Zephyrus M16 GU603H | |
| HP Omen 16-c0077ng | |
| Dell G16 7620 | |
| PCMark 10 / Productivity | |
| Lenovo Legion 7 16IAX7-82TD004SGE | |
| Lenovo Legion S7 16ARHA7 | |
| Average AMD Ryzen 9 6900HX, AMD Radeon RX 6800S () | |
| Lenovo Legion Slim 7-16IAH 82TF004YGE | |
| HP Omen 16-c0077ng | |
| Asus ROG Zephyrus M16 GU603H | |
| Dell G16 7620 | |
| PCMark 10 / Digital Content Creation | |
| Lenovo Legion 7 16IAX7-82TD004SGE | |
| Lenovo Legion S7 16ARHA7 | |
| Average AMD Ryzen 9 6900HX, AMD Radeon RX 6800S () | |
| Dell G16 7620 | |
| Lenovo Legion Slim 7-16IAH 82TF004YGE | |
| HP Omen 16-c0077ng | |
| Asus ROG Zephyrus M16 GU603H | |
| CrossMark / Overall | |
| Lenovo Legion 7 16IAX7-82TD004SGE | |
| Lenovo Legion Slim 7-16IAH 82TF004YGE | |
| Dell G16 7620 | |
| Lenovo Legion S7 16ARHA7 | |
| Average AMD Ryzen 9 6900HX, AMD Radeon RX 6800S () | |
| CrossMark / Productivity | |
| Lenovo Legion 7 16IAX7-82TD004SGE | |
| Lenovo Legion Slim 7-16IAH 82TF004YGE | |
| Dell G16 7620 | |
| Lenovo Legion S7 16ARHA7 | |
| Average AMD Ryzen 9 6900HX, AMD Radeon RX 6800S () | |
| CrossMark / Creativity | |
| Lenovo Legion 7 16IAX7-82TD004SGE | |
| Lenovo Legion Slim 7-16IAH 82TF004YGE | |
| Dell G16 7620 | |
| Lenovo Legion S7 16ARHA7 | |
| Average AMD Ryzen 9 6900HX, AMD Radeon RX 6800S () | |
| CrossMark / Responsiveness | |
| Lenovo Legion 7 16IAX7-82TD004SGE | |
| Lenovo Legion Slim 7-16IAH 82TF004YGE | |
| Dell G16 7620 | |
| Lenovo Legion S7 16ARHA7 | |
| Average AMD Ryzen 9 6900HX, AMD Radeon RX 6800S () | |
| PCMark 10 Score | 7669 points | |
Help | ||
| AIDA64 / Memory Copy | |
| Lenovo Legion 7 16IAX7-82TD004SGE | |
| Dell G16 7620 | |
| Average AMD Ryzen 9 6900HX (47938 - 53345, n=20) | |
| Lenovo Legion Slim 7-16IAH 82TF004YGE | |
| Lenovo Legion S7 16ARHA7 | |
| HP Omen 16-c0077ng | |
| AIDA64 / Memory Read | |
| Lenovo Legion 7 16IAX7-82TD004SGE | |
| Dell G16 7620 | |
| Lenovo Legion Slim 7-16IAH 82TF004YGE | |
| Average AMD Ryzen 9 6900HX (43892 - 53321, n=20) | |
| Lenovo Legion S7 16ARHA7 | |
| HP Omen 16-c0077ng | |
| AIDA64 / Memory Write | |
| Lenovo Legion 7 16IAX7-82TD004SGE | |
| Lenovo Legion Slim 7-16IAH 82TF004YGE | |
| Dell G16 7620 | |
| Average AMD Ryzen 9 6900HX (51085 - 57202, n=20) | |
| Lenovo Legion S7 16ARHA7 | |
| HP Omen 16-c0077ng | |
| AIDA64 / Memory Latency | |
| Dell G16 7620 | |
| Lenovo Legion Slim 7-16IAH 82TF004YGE | |
| Average AMD Ryzen 9 6900HX (80.7 - 120.6, n=20) | |
| HP Omen 16-c0077ng | |
| Lenovo Legion 7 16IAX7-82TD004SGE | |
| Lenovo Legion S7 16ARHA7 | |
| Asus ROG Zephyrus M16 GU603H | |
* ... smaller is better
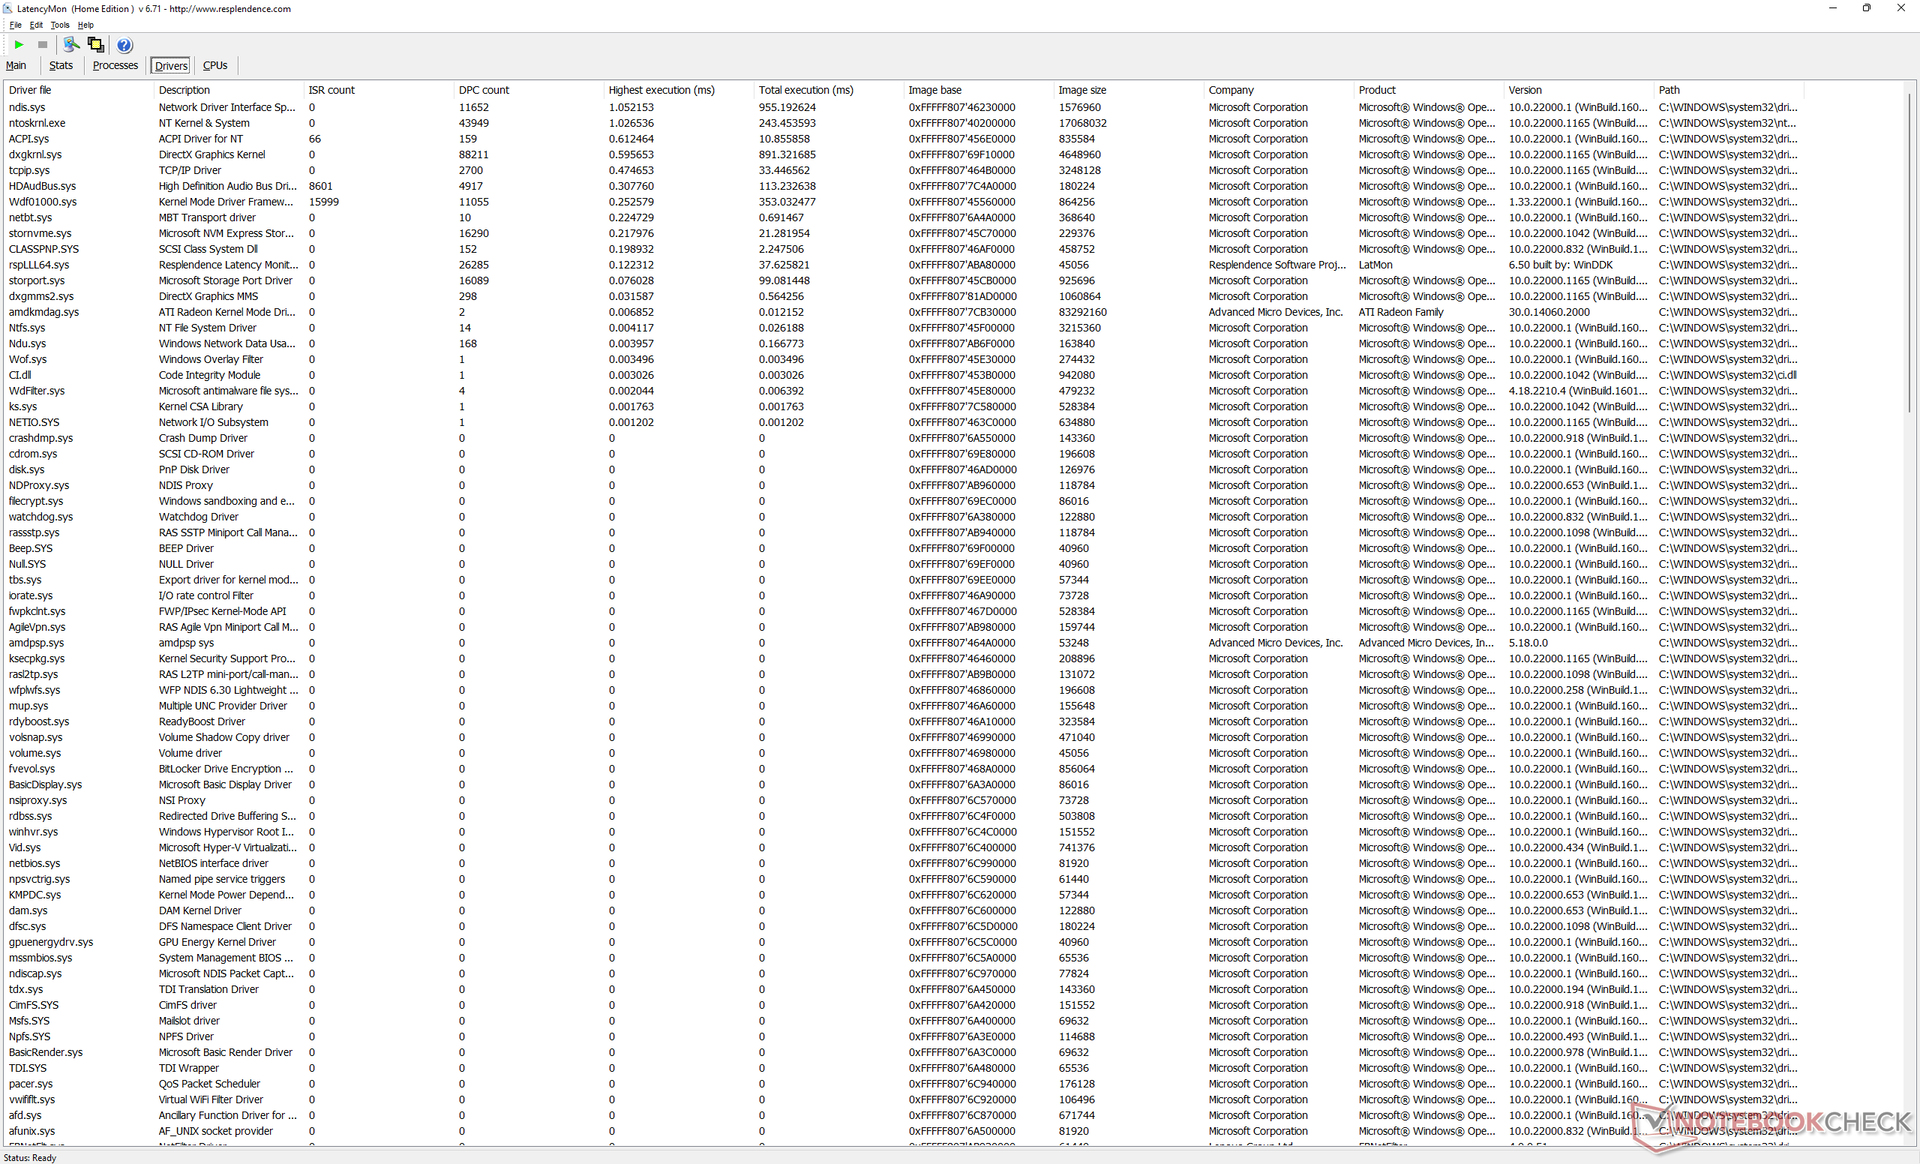
DPC Latency
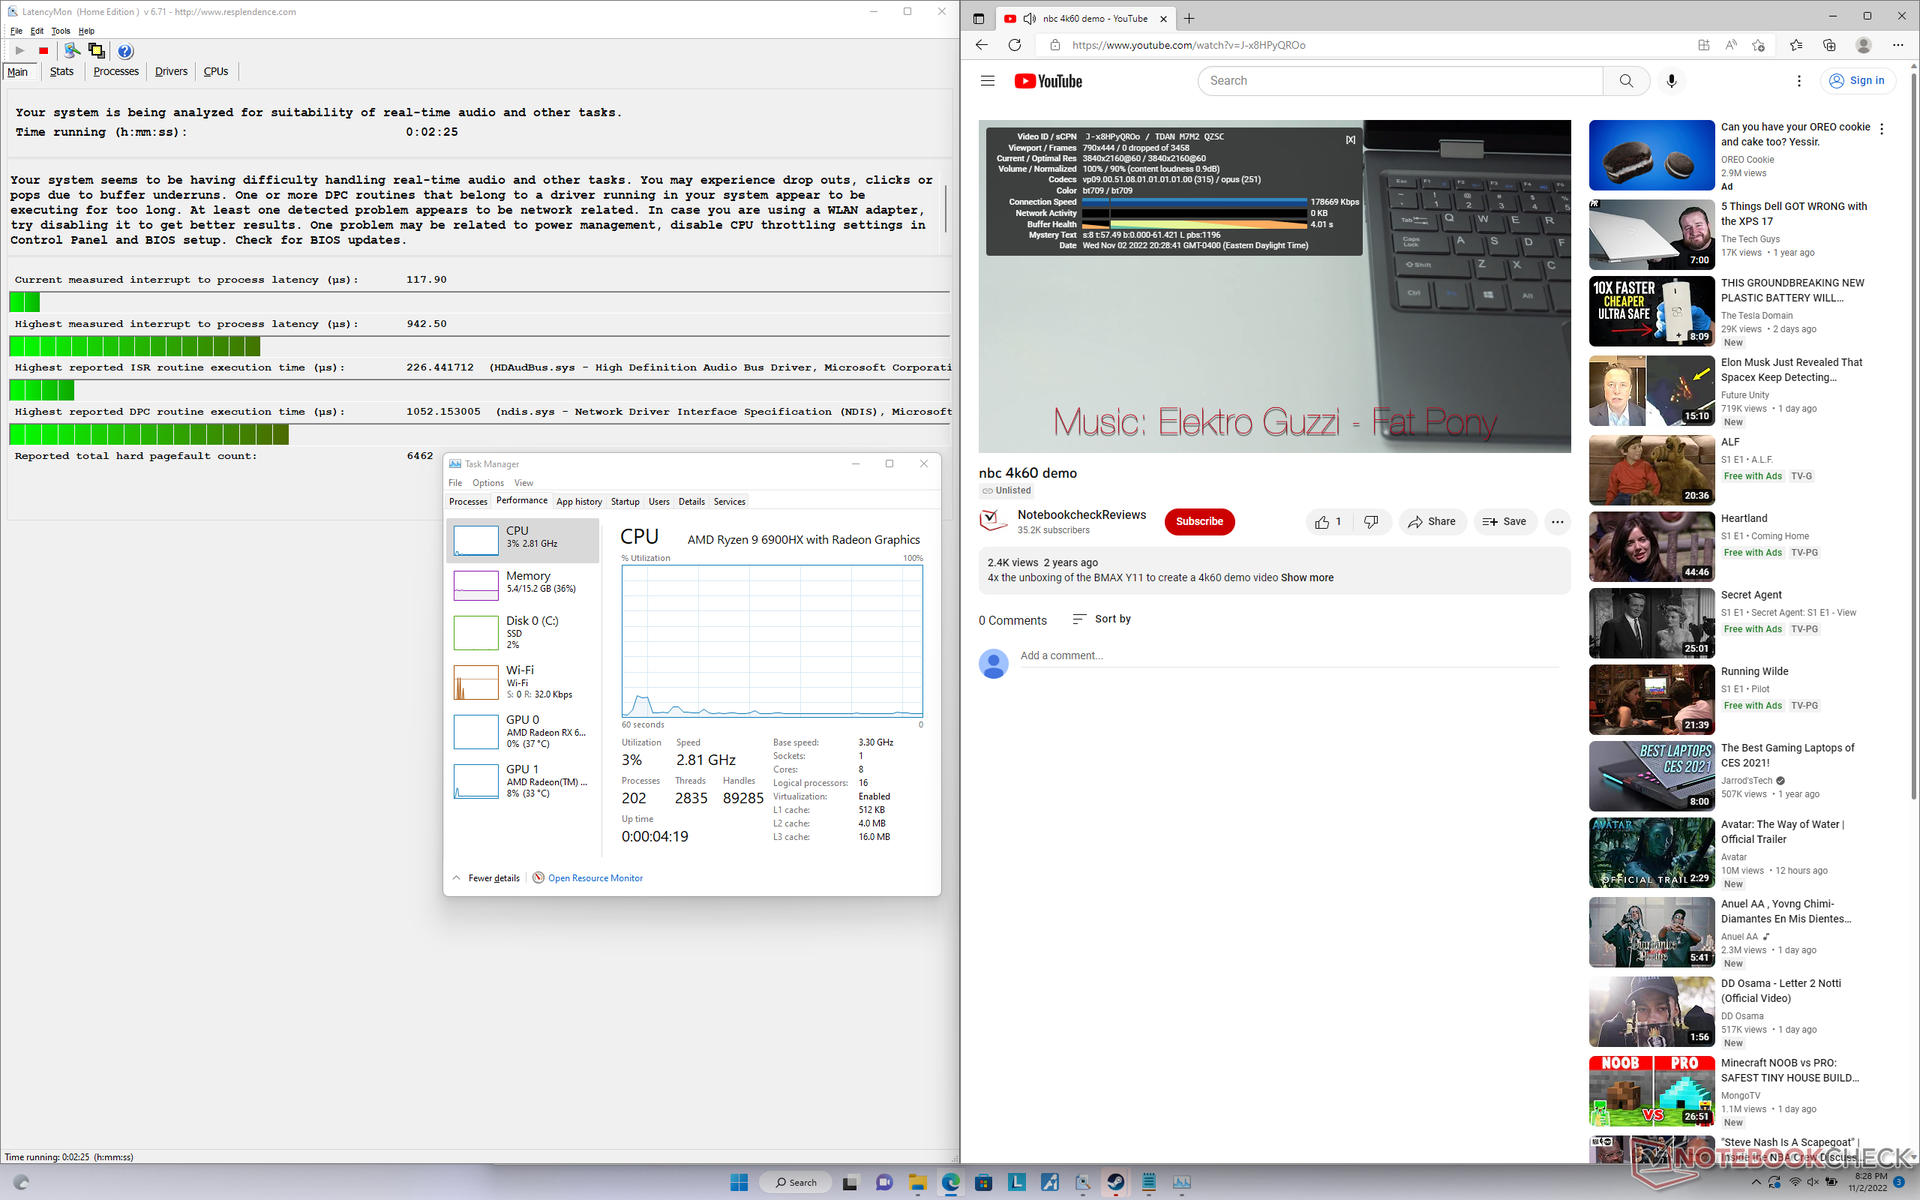
LatencyMon reveals minor DPC issues when opening multiple browser tabs of our homepage. 4K video playback at 60 FPS is otherwise perfect and with no dropped frames.
| DPC Latencies / LatencyMon - interrupt to process latency (max), Web, Youtube, Prime95 | |
| HP Omen 16-c0077ng | |
| Lenovo Legion 7 16IAX7-82TD004SGE | |
| Asus ROG Zephyrus M16 GU603H | |
| Lenovo Legion S7 16ARHA7 | |
| Dell G16 7620 | |
| Lenovo Legion Slim 7-16IAH 82TF004YGE | |
* ... smaller is better
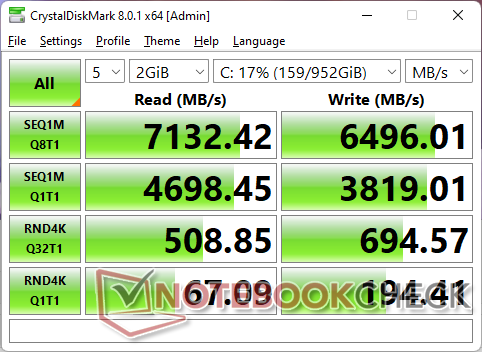
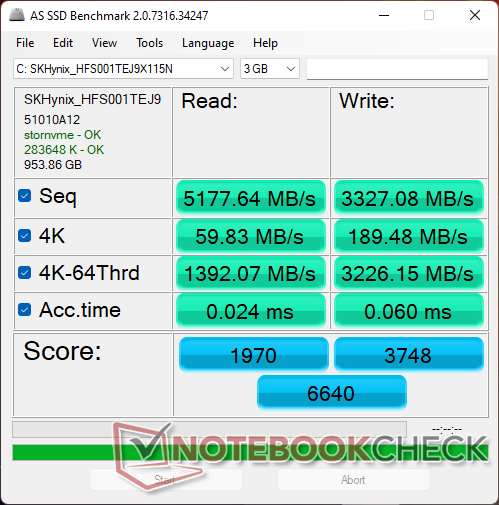
Storage Devices — Just One Drive Only
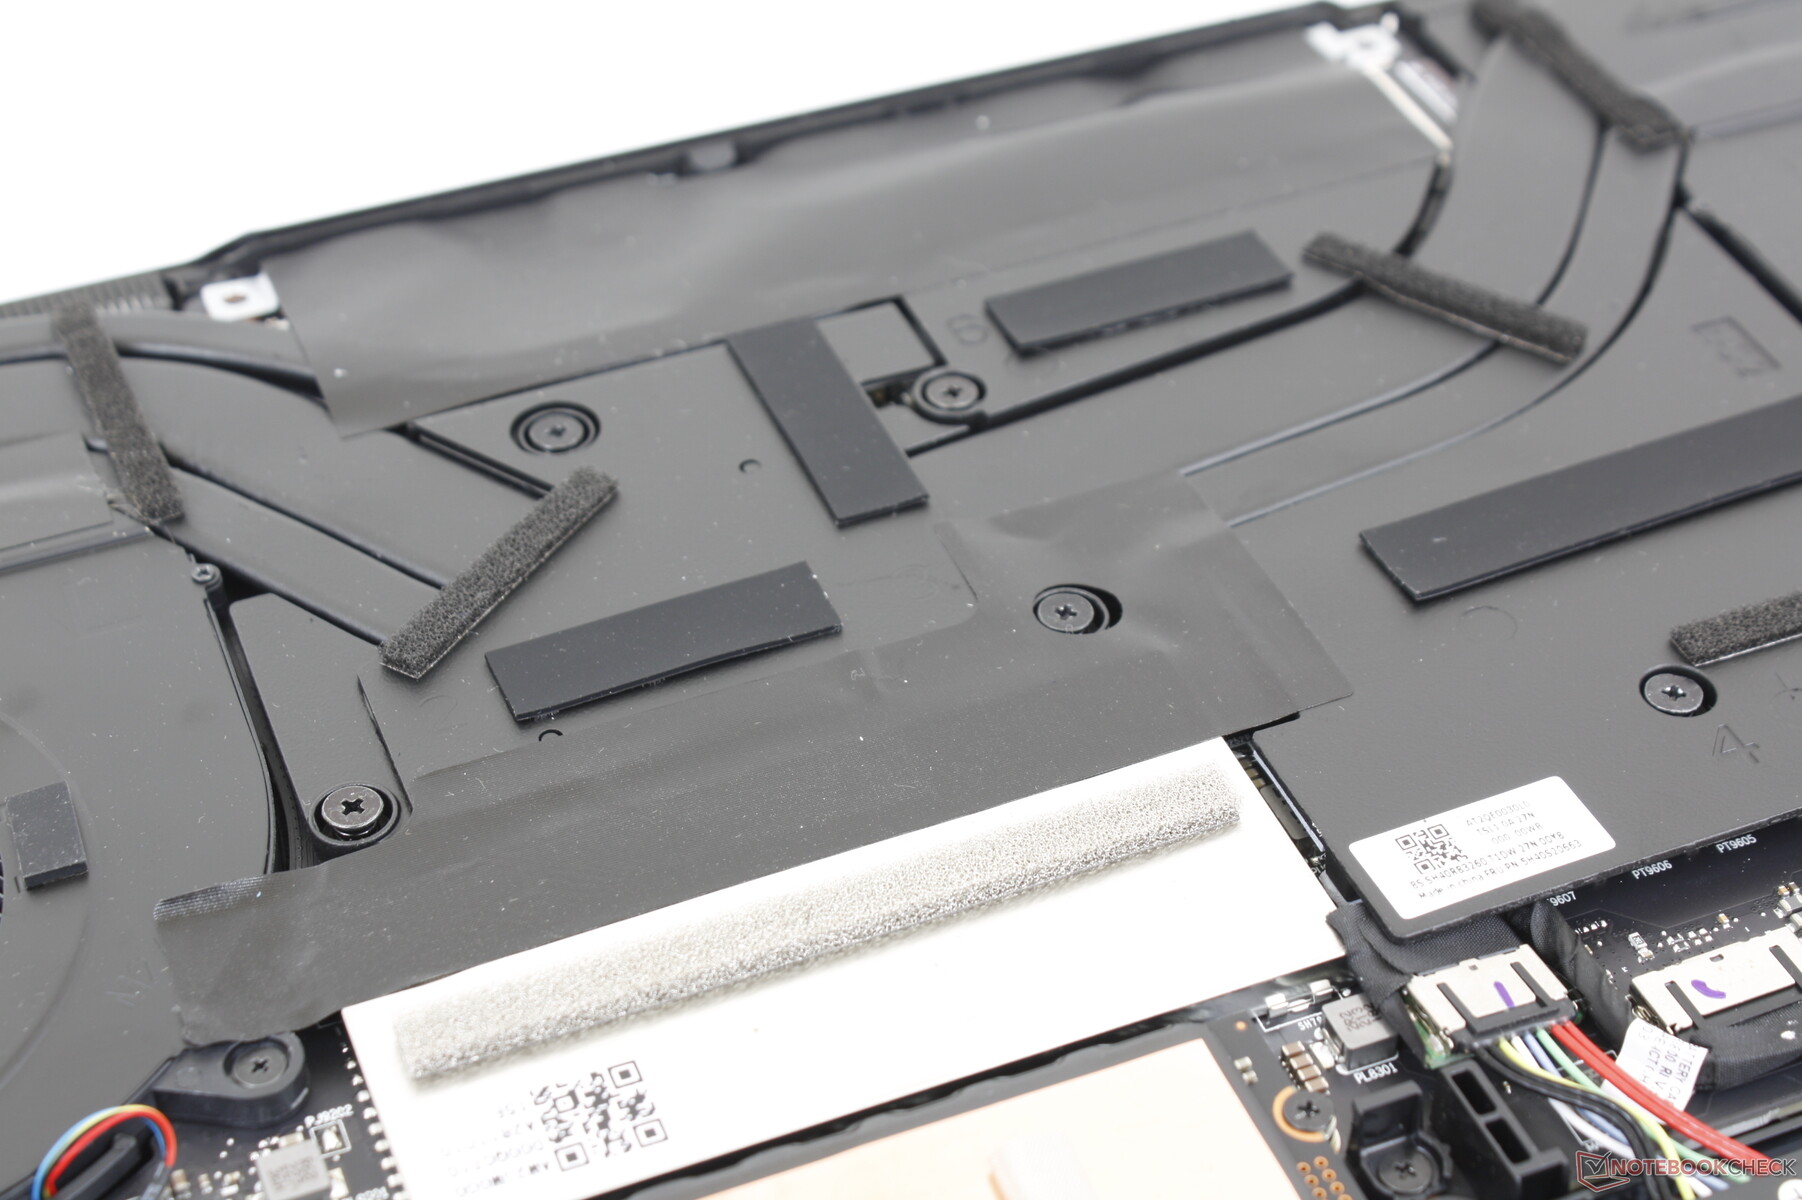
Our test unit shipped with a 1 TB SK Hynix PCIe4 x4 NVMe SSD with sequential read and write rates of approximately 6900 MB/s and 6500 MB/s, respectively. The drive would have no issues maintaining such fast speeds even when stressed as demonstrated by our DiskSpd loop test results below. There is a thermal pad between the SSD and bottom plate of the laptop and so the entire metal bottom of the laptop aids in heat dissipation.

| Drive Performance Rating - Percent | |
| Asus ROG Zephyrus M16 GU603H | |
| Lenovo Legion 7 16IAX7-82TD004SGE | |
| Lenovo Legion Slim 7-16IAH 82TF004YGE | |
| Dell G16 7620 | |
| Lenovo Legion S7 16ARHA7 | |
| HP Omen 16-c0077ng | |
* ... smaller is better
Disk Throttling: DiskSpd Read Loop, Queue Depth 8
GPU Performance
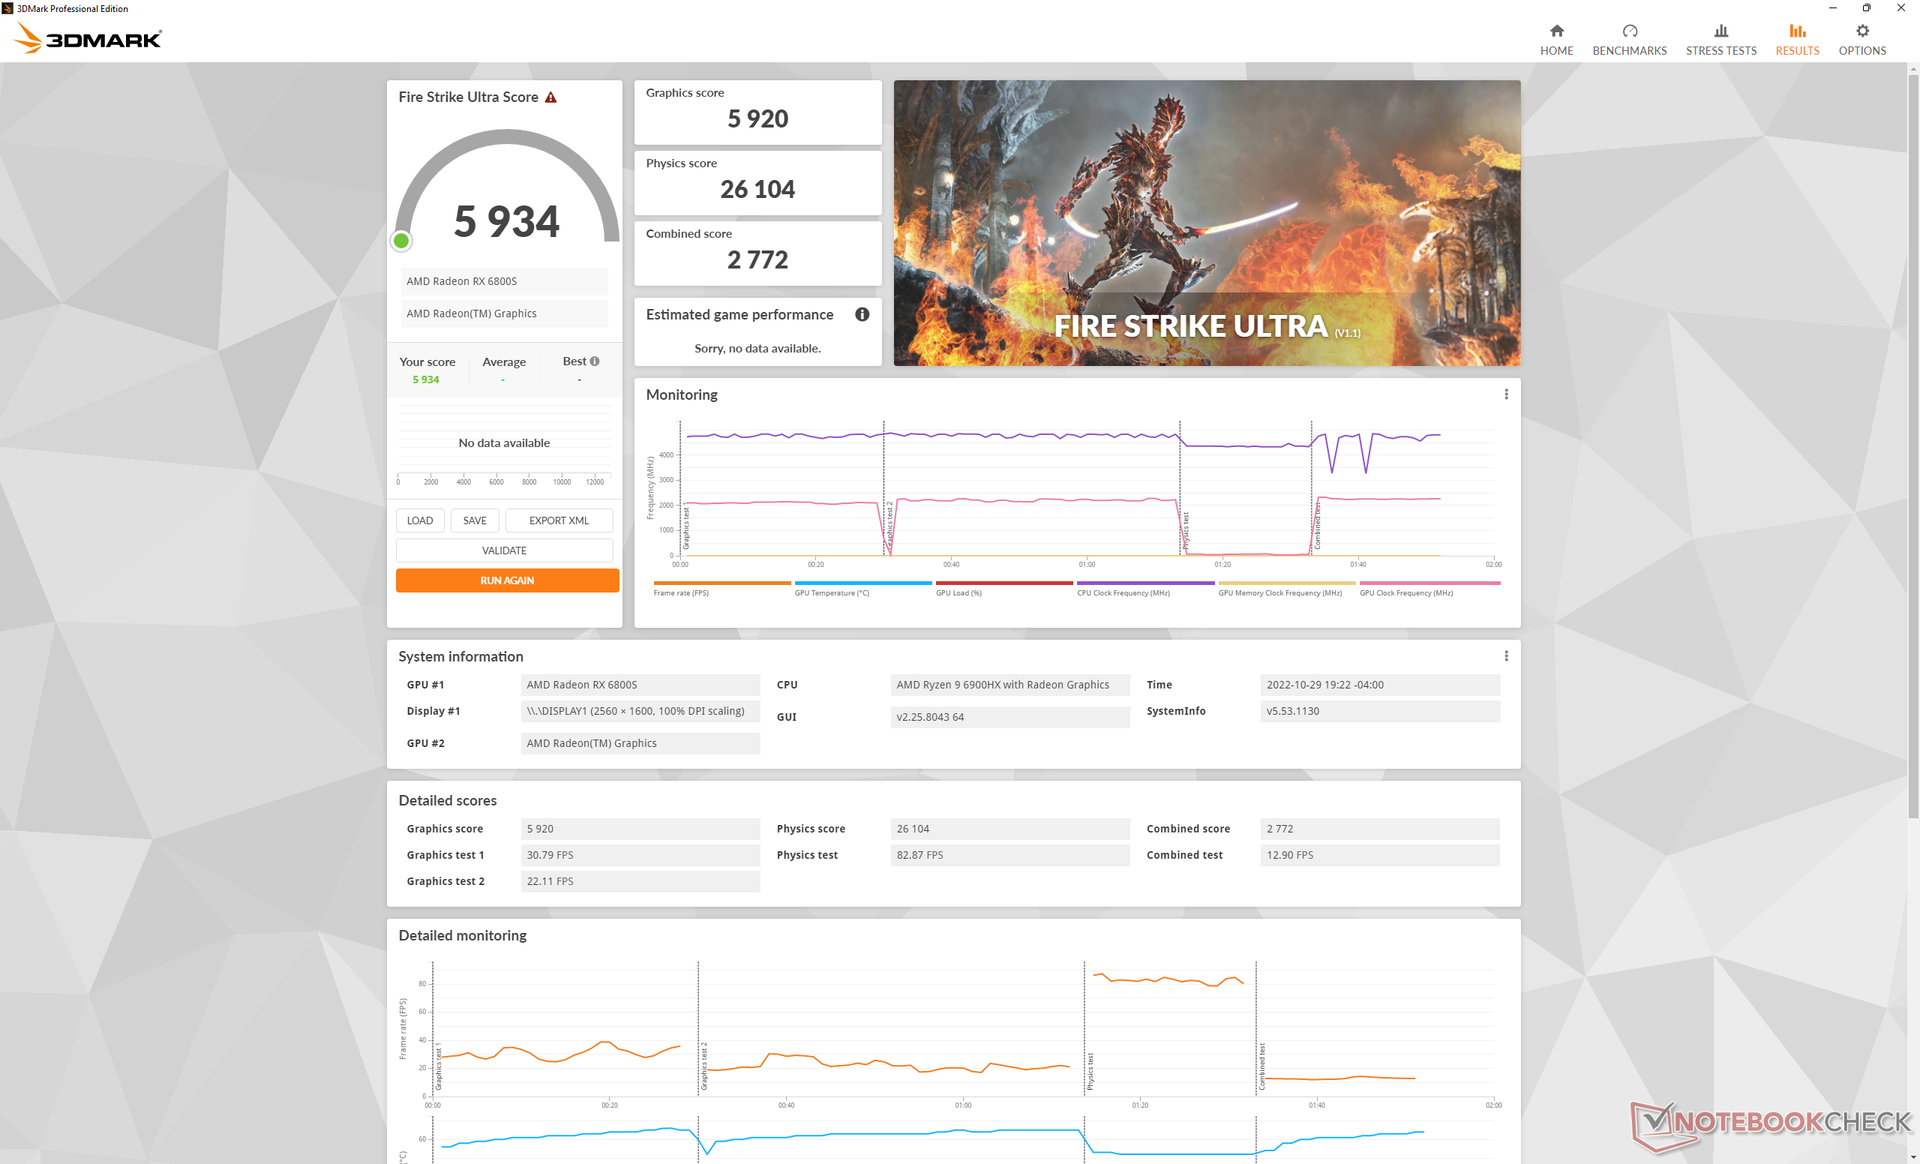
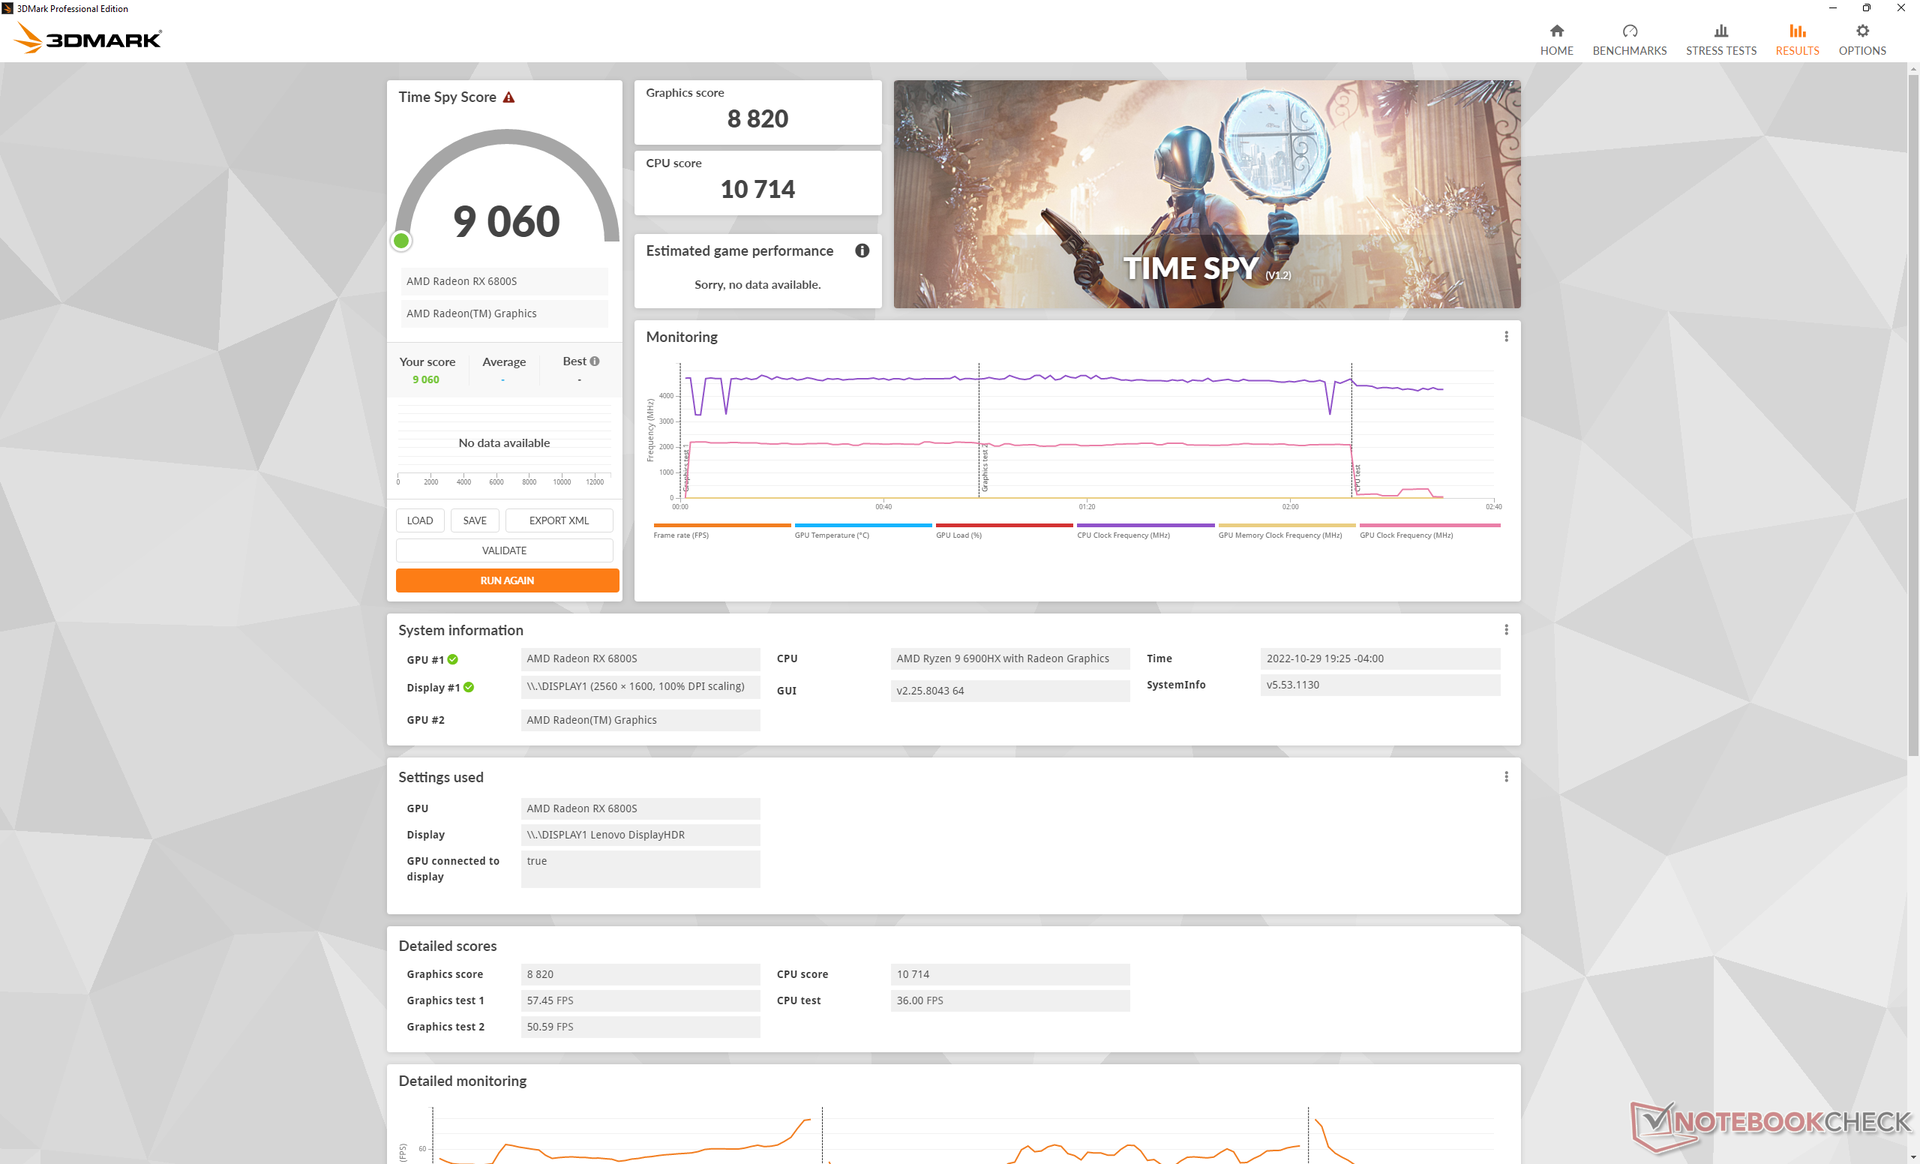
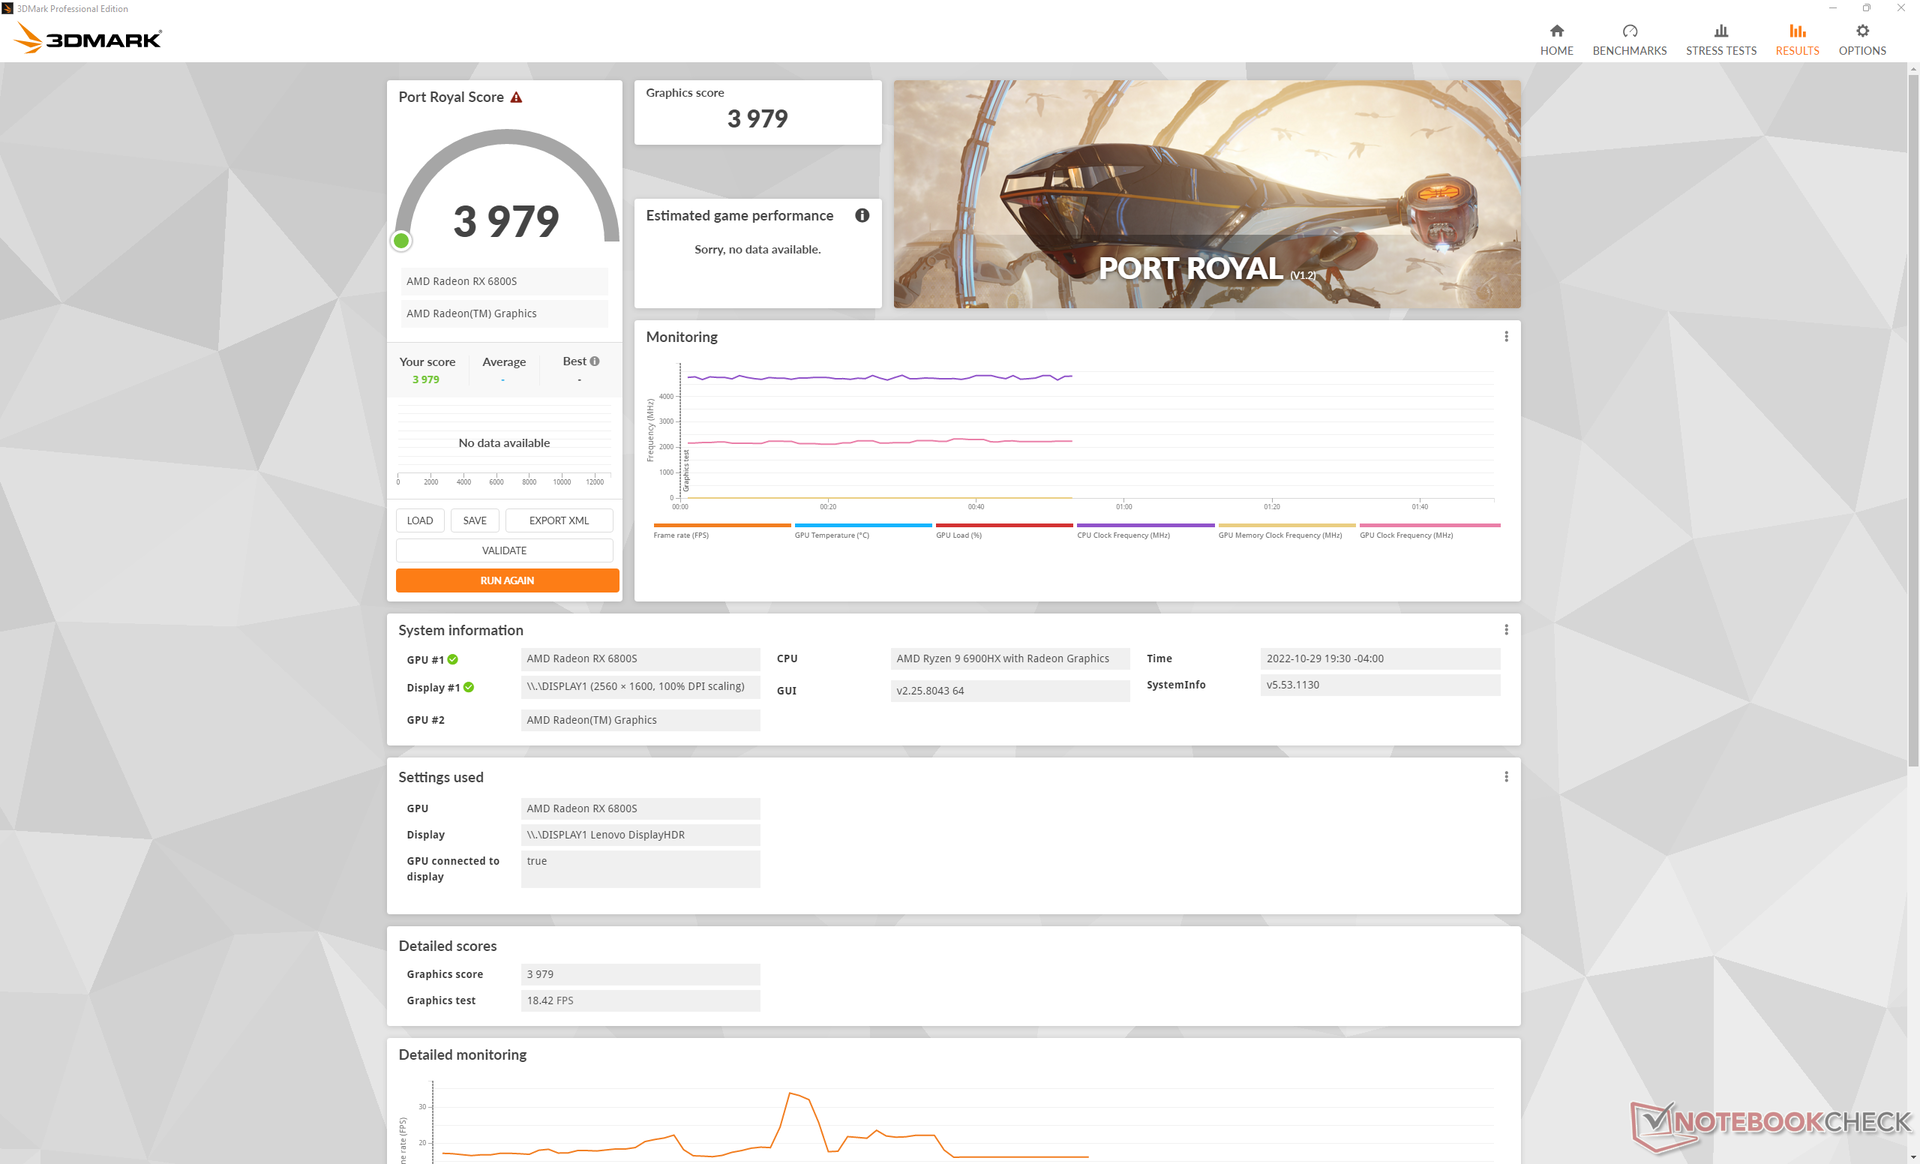
Graphics performance is most comparable to laptops running on the GeForce RTX 3060 such as on the Dell G16. However, keep in mind that AMD cards are still lagging behind Nvidia when it comes to real-time ray tracing performance. Our Port Royal score, for example, is almost 25 percent slower than on the aforementioned Dell laptop. Thus, you'll want to disable RT when gaming or else frame rates will take a major hit.
The Radeon RX 6800S is still good enough to play modern games at 1080p with medium-to-high graphical settings, but don't expect to reach a stable 165 FPS in most scenarios. Be sure to enable FreeSync via the Radeon menu to reduce screen tearing.
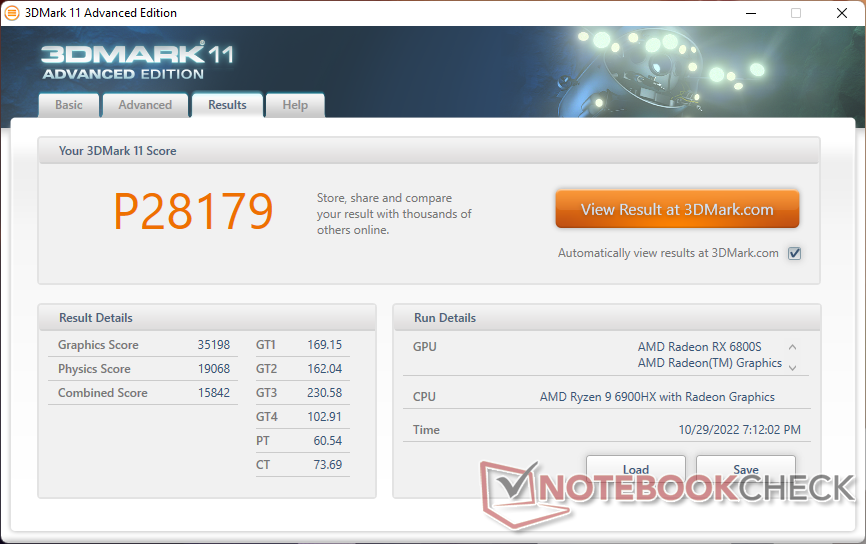
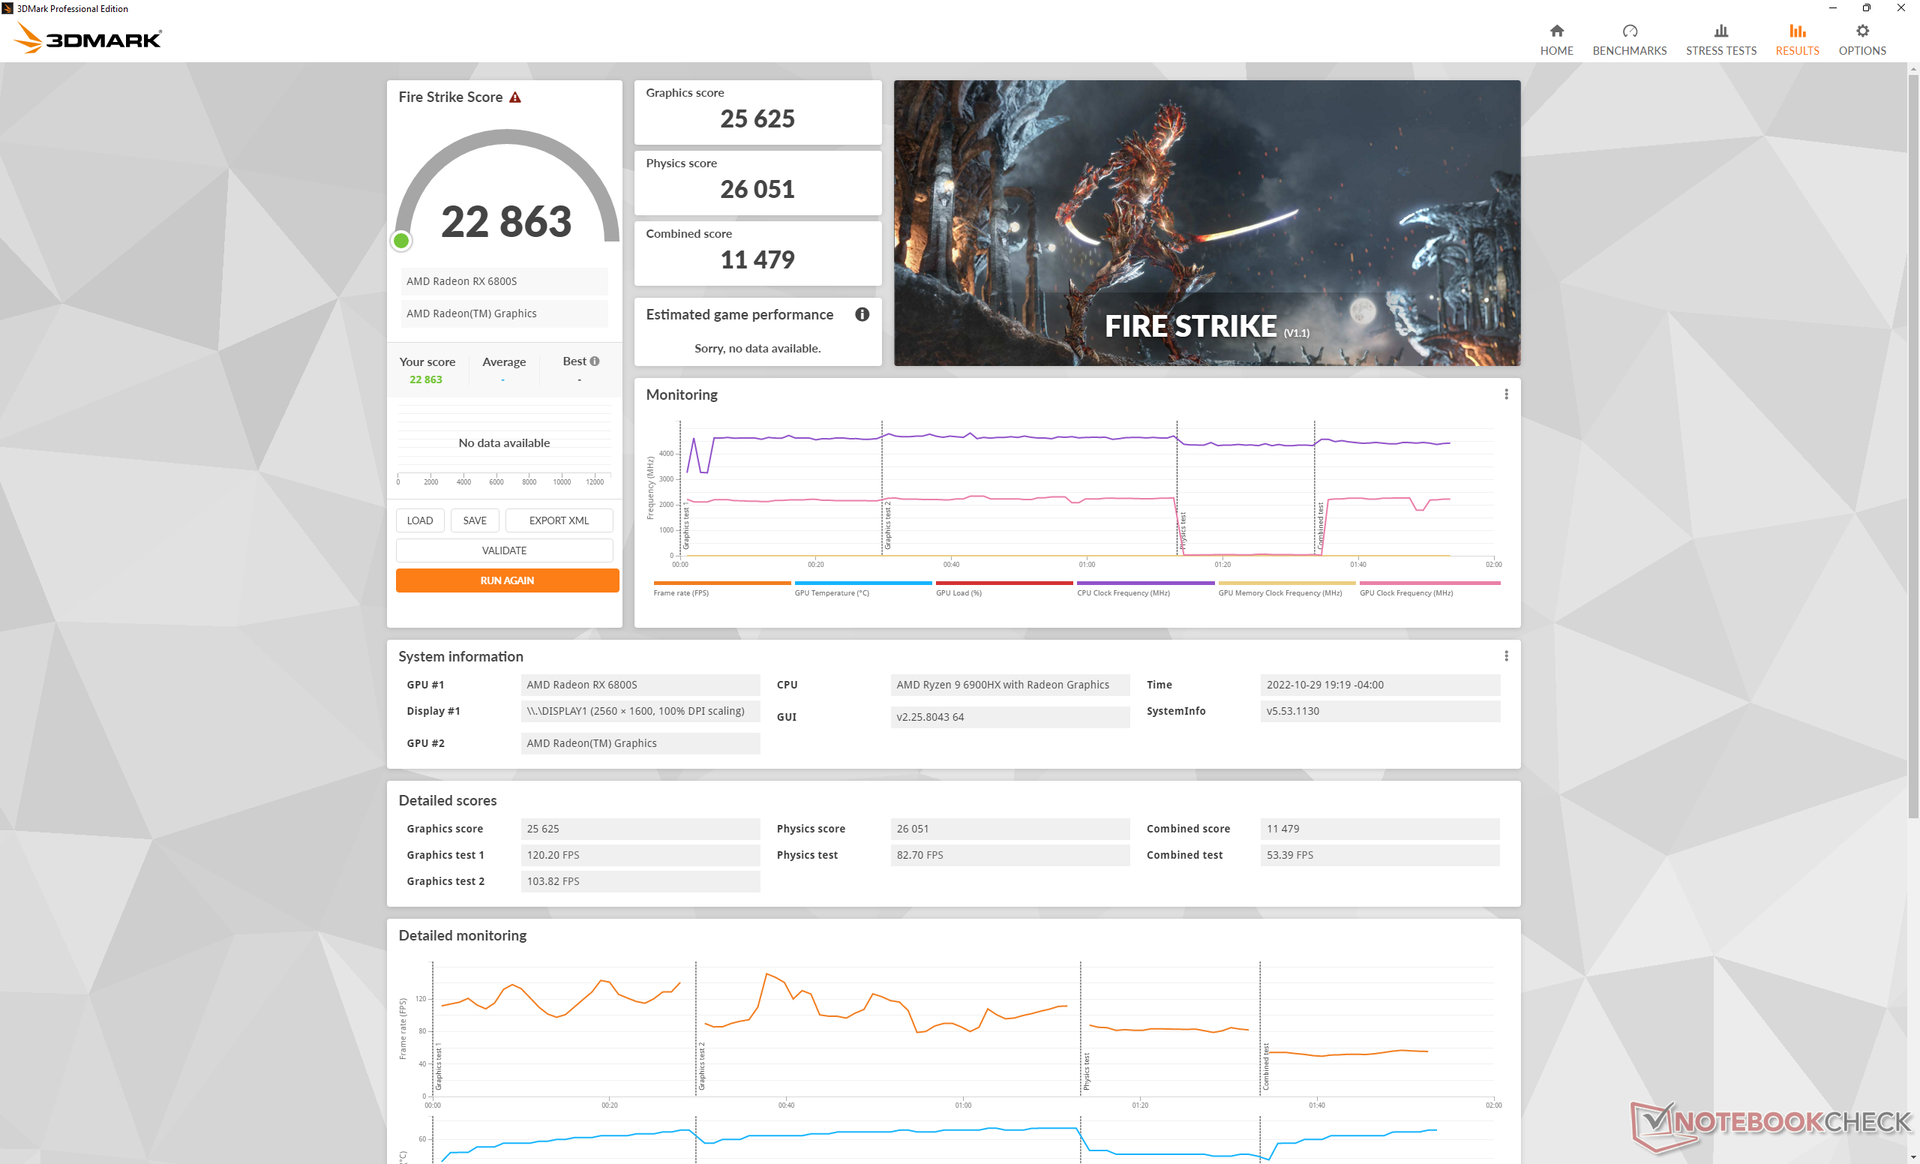
| 3DMark 11 Performance | 28179 points | |
| 3DMark Cloud Gate Standard Score | 60463 points | |
| 3DMark Fire Strike Score | 22863 points | |
| 3DMark Time Spy Score | 9060 points | |
Help | ||
* ... smaller is better
Idling on Witcher 3 for an hour reveals steady frame rates and thus performance throughout except for a single blip where frame rates fluctuated between 65 and 99 FPS. This thankfully did not occur a second time and so it shouldn't be a problem when gaming.
Witcher 3 FPS Chart
| low | med. | high | ultra | QHD | |
| GTA V (2015) | 178.7 | 173.6 | 159.8 | 88.7 | 66.1 |
| The Witcher 3 (2015) | 338.9 | 223 | 164 | 90.7 | |
| Dota 2 Reborn (2015) | 150 | 128.4 | 134.7 | 99.4 | |
| Final Fantasy XV Benchmark (2018) | 177.9 | 120.1 | 87.6 | 62.1 | |
| X-Plane 11.11 (2018) | 75.2 | 61.5 | 52.3 | ||
| Strange Brigade (2018) | 363 | 243 | 195.7 | 171.1 | 111.4 |
| Cyberpunk 2077 1.6 (2022) | 140.8 | 113 | 82.5 | 66.3 | 38.7 |
Emissions
System Noise — Not That Loud For The Category
The internal fans are more lethargic than on other laptops meaning they tend to be inactive for longer periods until absolutely necessary. When running 3DMark 06, for example, fan noise would top out at 31 dB(A) compared to 44 dB(A) or even 48 dB(A) on the Legion 7 16 or Asus ROG Zephyrus M16, respectively. Users can browse or video stream more quietly for longer before the fans need to ramp up.
Three fan modes are available on the Vantage software: Quiet, Balanced, and Performance. Fan noise would top out at 47.7 dB(A) and 51.4 dB(A) when running Witcher 3 on Balanced mode and Performance mode, respectively. Performance mode is necessary for exploiting the GPU to its fullest as our Stress Test section below will show. Though Performance mode is the loudest fan setting on the Legion Slim 7, it is still quieter than on many other gaming laptops where the mid 50 dB(A) range is more common as shown by the table below.
Noise Level
| Idle |
| 23.1 / 23.1 / 23.1 dB(A) |
| Load |
| 31.4 / 51.2 dB(A) |
 | ||
30 dB silent 40 dB(A) audible 50 dB(A) loud |
||
min: | ||
| Lenovo Legion S7 16ARHA7 Radeon RX 6800S, R9 6900HX, SK Hynix HFS001TEJ9X115N | Lenovo Legion Slim 7-16IAH 82TF004YGE GeForce RTX 3060 Laptop GPU, i7-12700H, SK Hynix HFS001TEJ9X115N | Lenovo Legion 7 16IAX7-82TD004SGE GeForce RTX 3080 Ti Laptop GPU, i9-12900HX, Micron 3400 1TB MTFDKBA1T0TFH | Dell G16 7620 GeForce RTX 3060 Laptop GPU, i7-12700H, WDC PC SN810 512GB | HP Omen 16-c0077ng Radeon RX 6600M, R7 5800H, Samsung PM981a MZVLB1T0HBLR | Asus ROG Zephyrus M16 GU603H GeForce RTX 3070 Laptop GPU, i9-11900H, Samsung PM9A1 MZVL22T0HBLB | |
|---|---|---|---|---|---|---|
| Noise | -6% | -18% | -9% | -30% | -28% | |
| off / environment * | 23.1 | 23 -0% | 24.5 -6% | 23.2 -0% | 25 -8% | 25 -8% |
| Idle Minimum * | 23.1 | 23 -0% | 24.5 -6% | 28.3 -23% | 25 -8% | 25 -8% |
| Idle Average * | 23.1 | 23 -0% | 30 -30% | 28.8 -25% | 31.2 -35% | 31 -34% |
| Idle Maximum * | 23.1 | 23 -0% | 32.5 -41% | 28.9 -25% | 33.8 -46% | 42 -82% |
| Load Average * | 31.4 | 43.7 -39% | 43.9 -40% | 32.4 -3% | 55.4 -76% | 48 -53% |
| Witcher 3 ultra * | 51.4 | 51.7 -1% | 48.8 5% | 48.3 6% | 52 -1% | |
| Load Maximum * | 51.2 | 52 -2% | 54.2 -6% | 48.1 6% | 56 -9% | 56 -9% |
* ... smaller is better
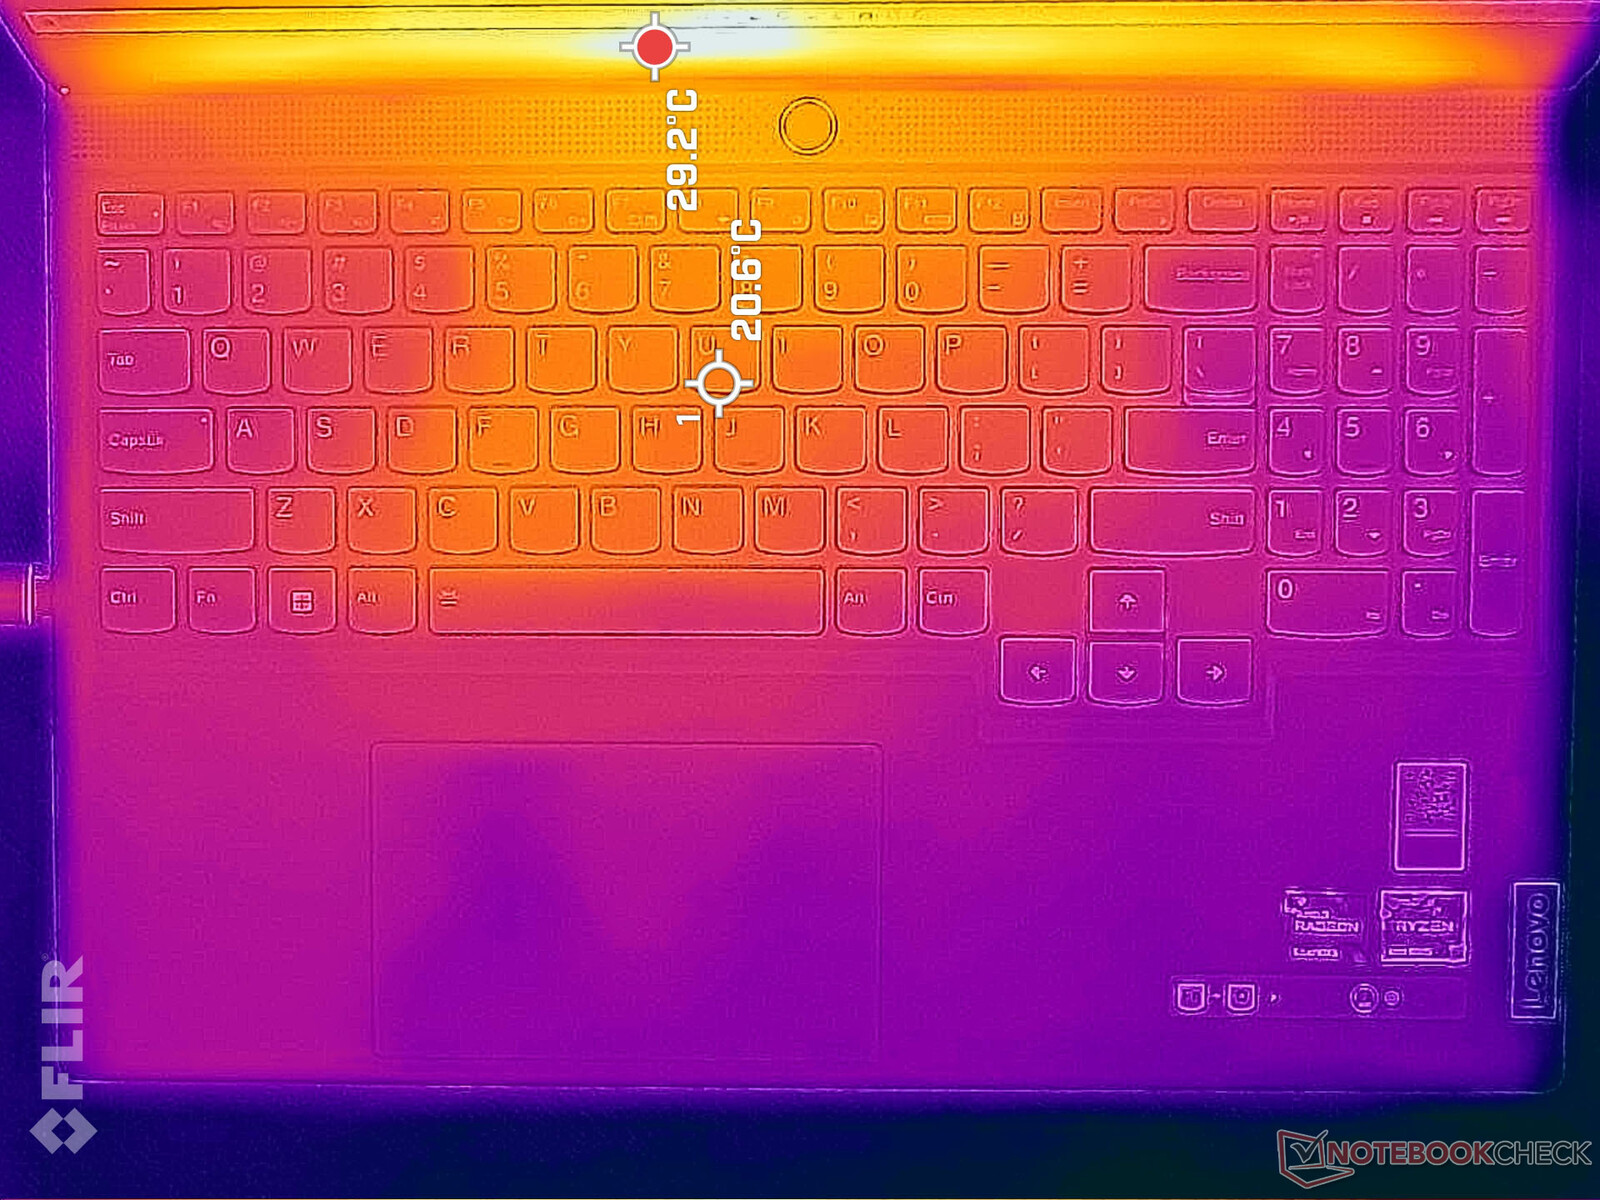
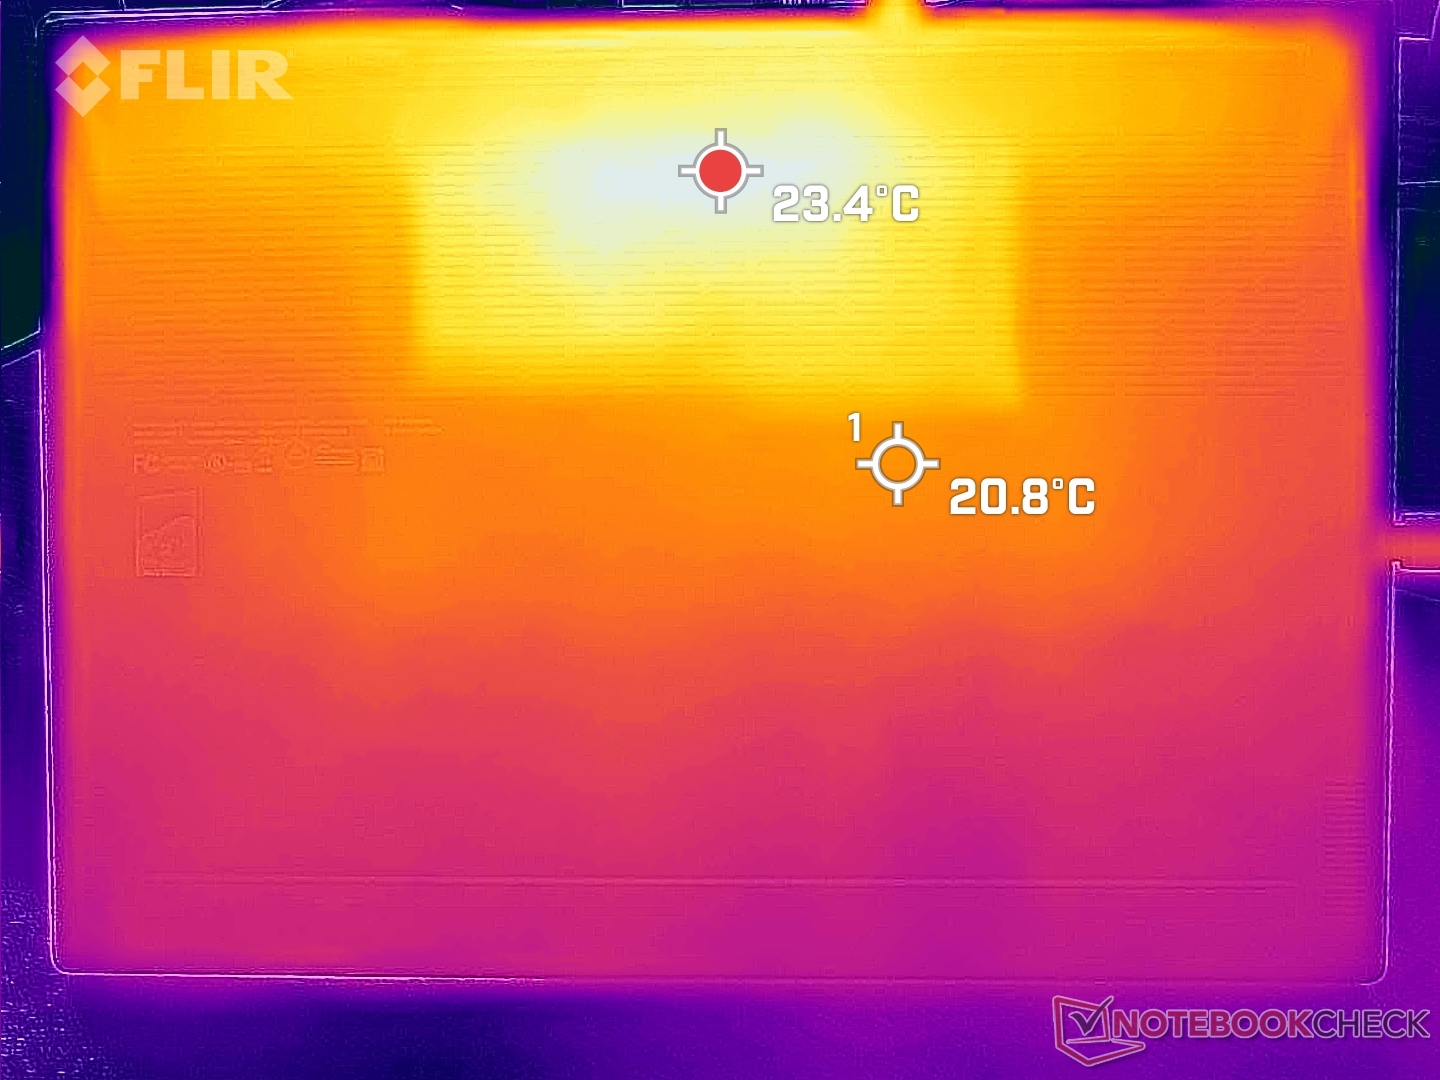
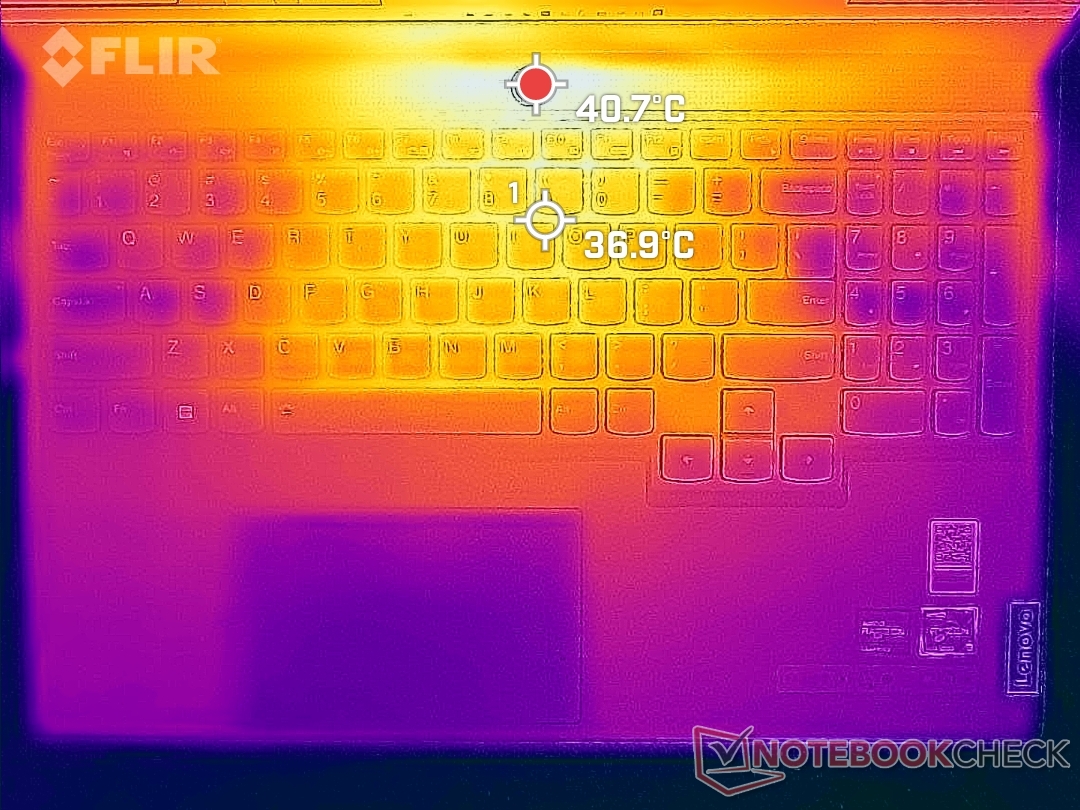
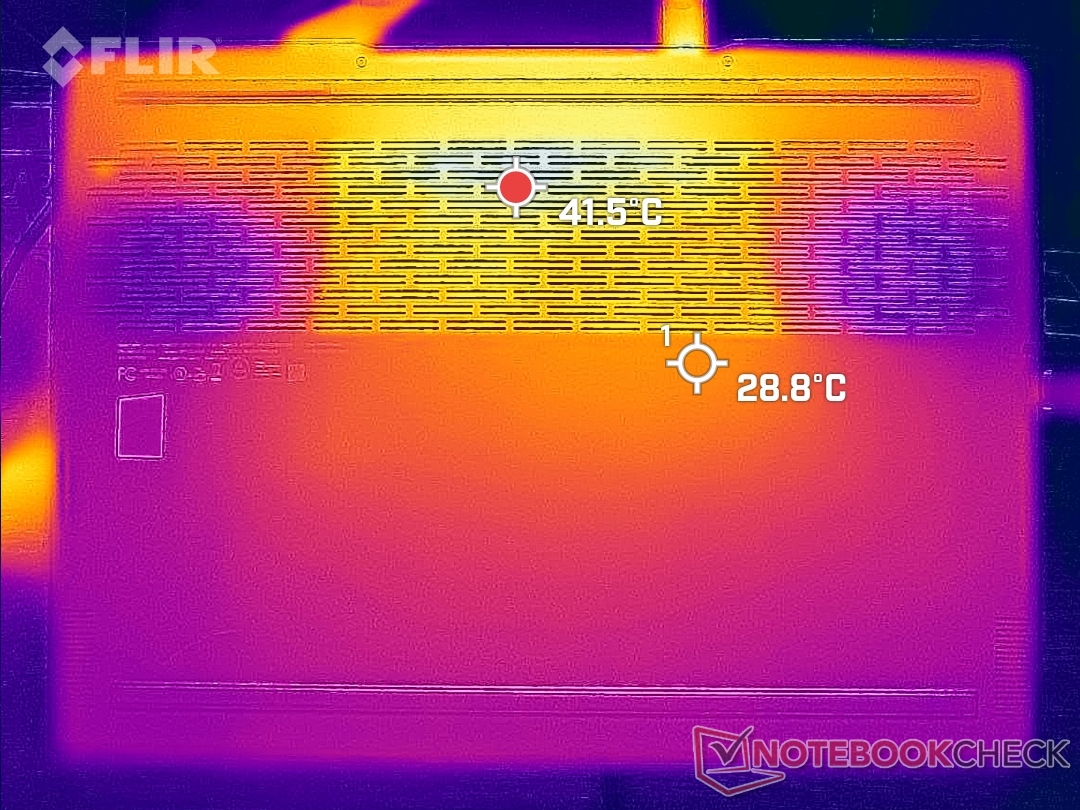
Temperature
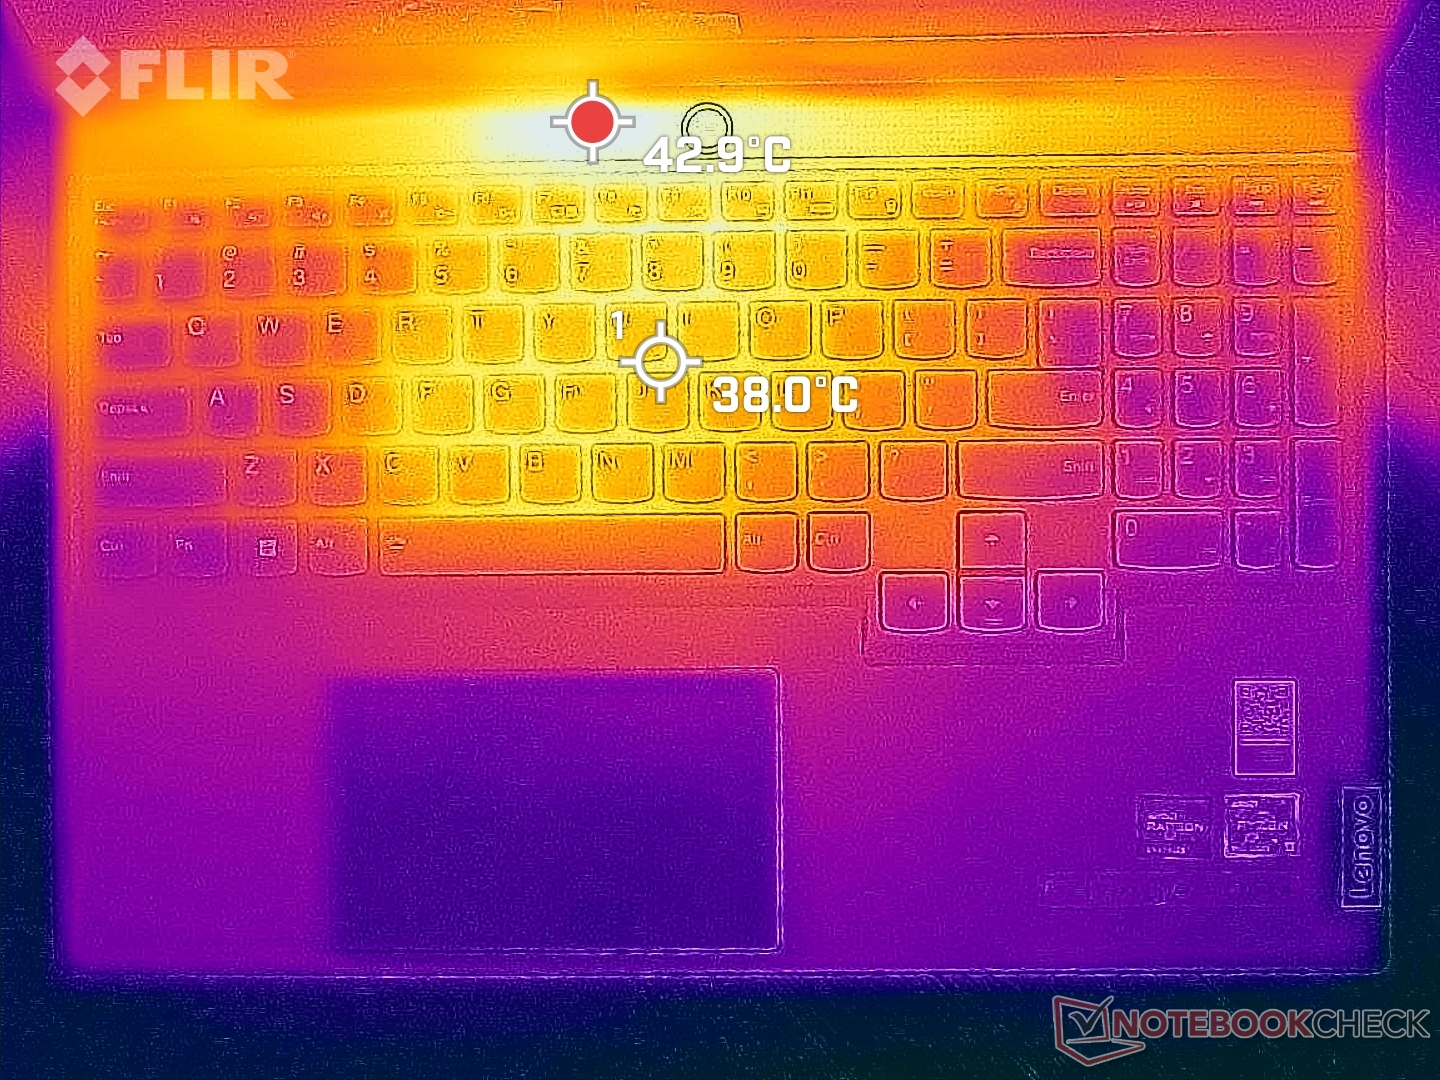
Surface temperatures are warmest toward the rear and center of the keyboard. The hot spot on the keyboard can reach over 37 C compared to only 33 C on the Dell G16. The keyboard on the Dell is closer to the front edge and thus further from the processors when compared to the Lenovo which can explain some of the temperature differences.
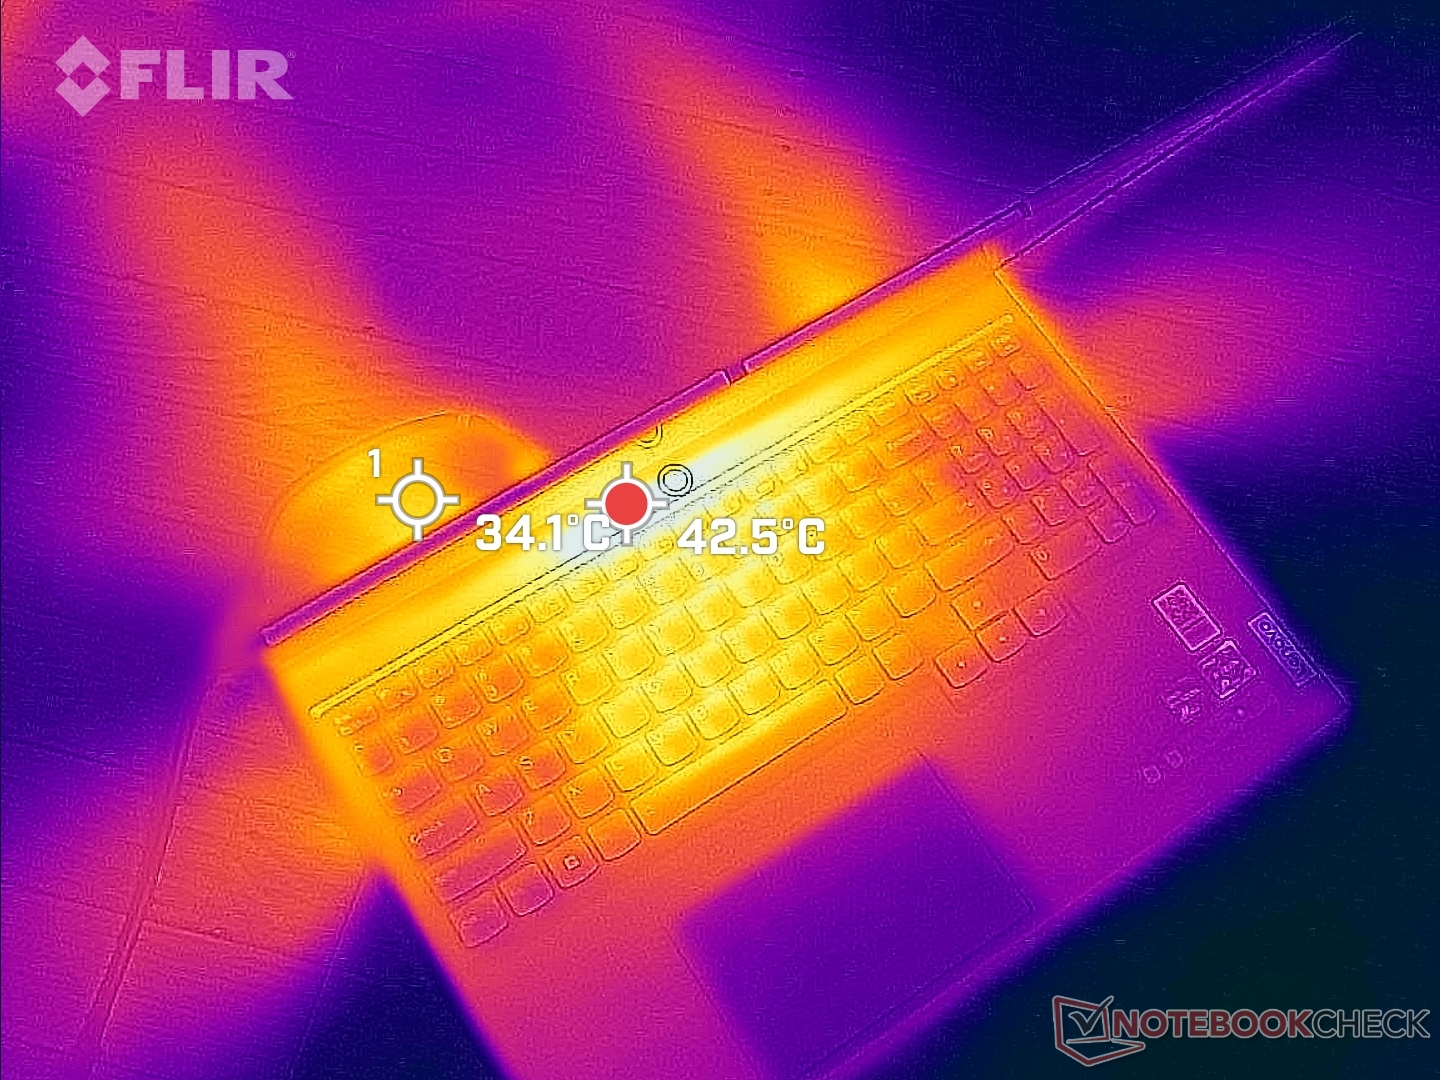
(-) The maximum temperature on the upper side is 46.6 °C / 116 F, compared to the average of 40.4 °C / 105 F, ranging from 21.2 to 68.8 °C for the class Gaming.
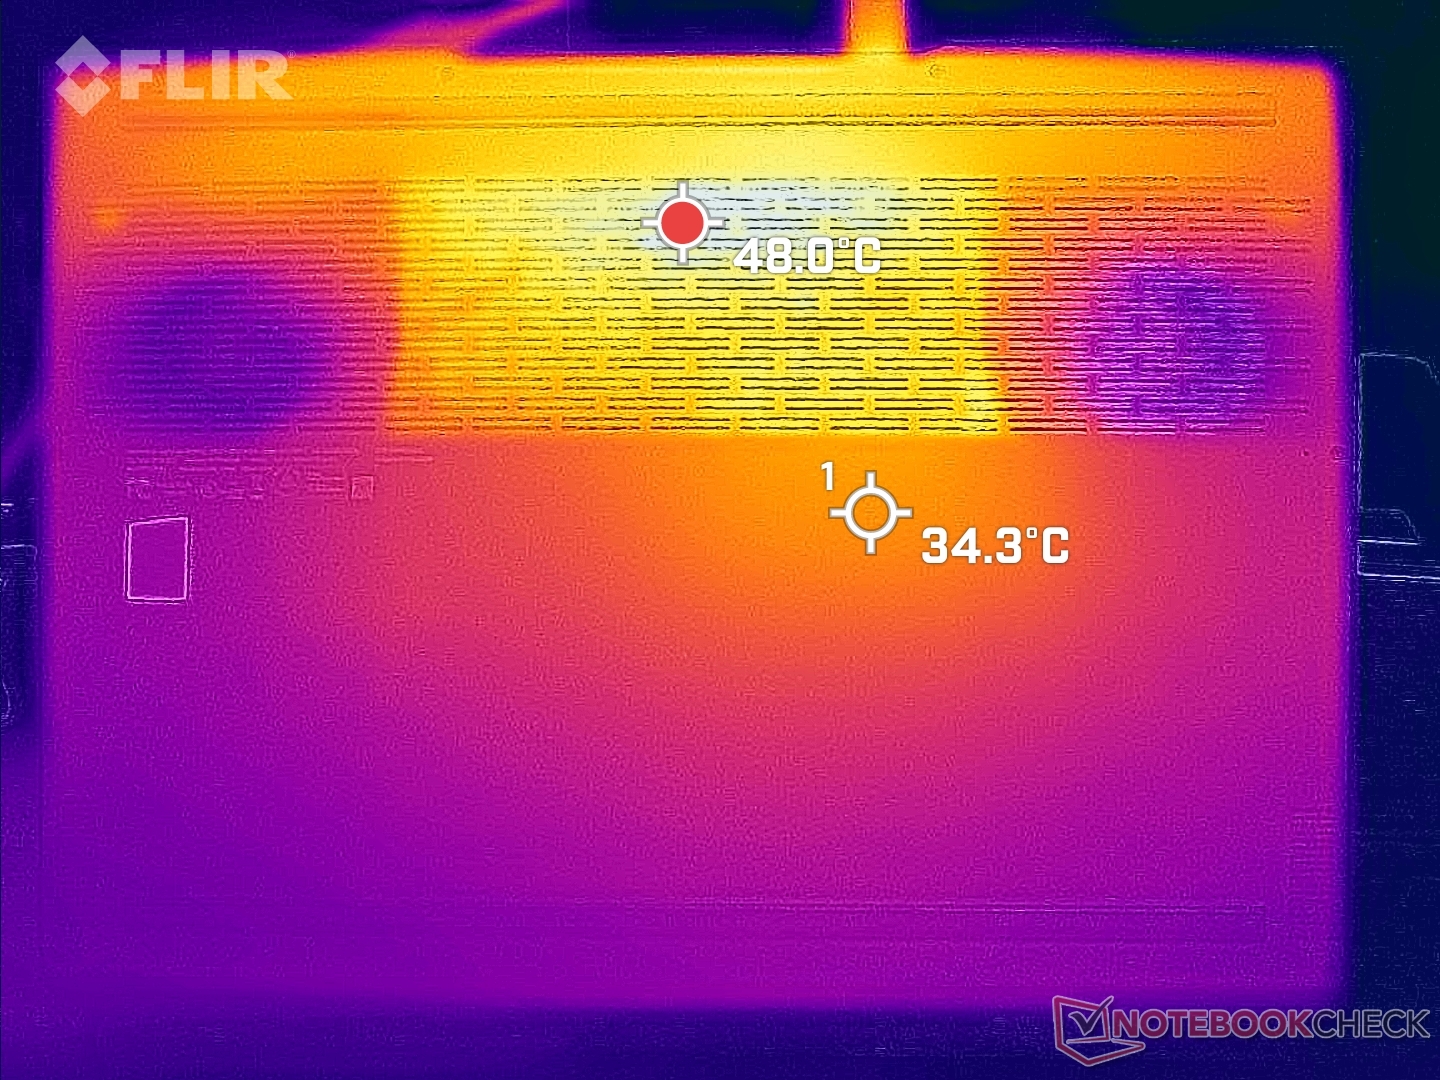
(-) The bottom heats up to a maximum of 50.8 °C / 123 F, compared to the average of 43.2 °C / 110 F
(+) In idle usage, the average temperature for the upper side is 24.5 °C / 76 F, compared to the device average of 33.8 °C / 93 F.
(±) Playing The Witcher 3, the average temperature for the upper side is 35.8 °C / 96 F, compared to the device average of 33.8 °C / 93 F.
(+) The palmrests and touchpad are cooler than skin temperature with a maximum of 28.4 °C / 83.1 F and are therefore cool to the touch.
(±) The average temperature of the palmrest area of similar devices was 28.9 °C / 84 F (+0.5 °C / 0.9 F).
| Lenovo Legion S7 16ARHA7 AMD Ryzen 9 6900HX, AMD Radeon RX 6800S | Lenovo Legion Slim 7-16IAH 82TF004YGE Intel Core i7-12700H, NVIDIA GeForce RTX 3060 Laptop GPU | Lenovo Legion 7 16IAX7-82TD004SGE Intel Core i9-12900HX, NVIDIA GeForce RTX 3080 Ti Laptop GPU | Dell G16 7620 Intel Core i7-12700H, NVIDIA GeForce RTX 3060 Laptop GPU | HP Omen 16-c0077ng AMD Ryzen 7 5800H, AMD Radeon RX 6600M | Asus ROG Zephyrus M16 GU603H Intel Core i9-11900H, NVIDIA GeForce RTX 3070 Laptop GPU | |
|---|---|---|---|---|---|---|
| Heat | -22% | -22% | 4% | -2% | -28% | |
| Maximum Upper Side * | 46.6 | 48.3 -4% | 44.4 5% | 47.6 -2% | 40.6 13% | 52 -12% |
| Maximum Bottom * | 50.8 | 55.3 -9% | 60.8 -20% | 54 -6% | 36 29% | 53 -4% |
| Idle Upper Side * | 26.4 | 35.7 -35% | 33.8 -28% | 23 13% | 31.3 -19% | 38 -44% |
| Idle Bottom * | 27.2 | 37.6 -38% | 38.8 -43% | 24.6 10% | 36 -32% | 41 -51% |
* ... smaller is better
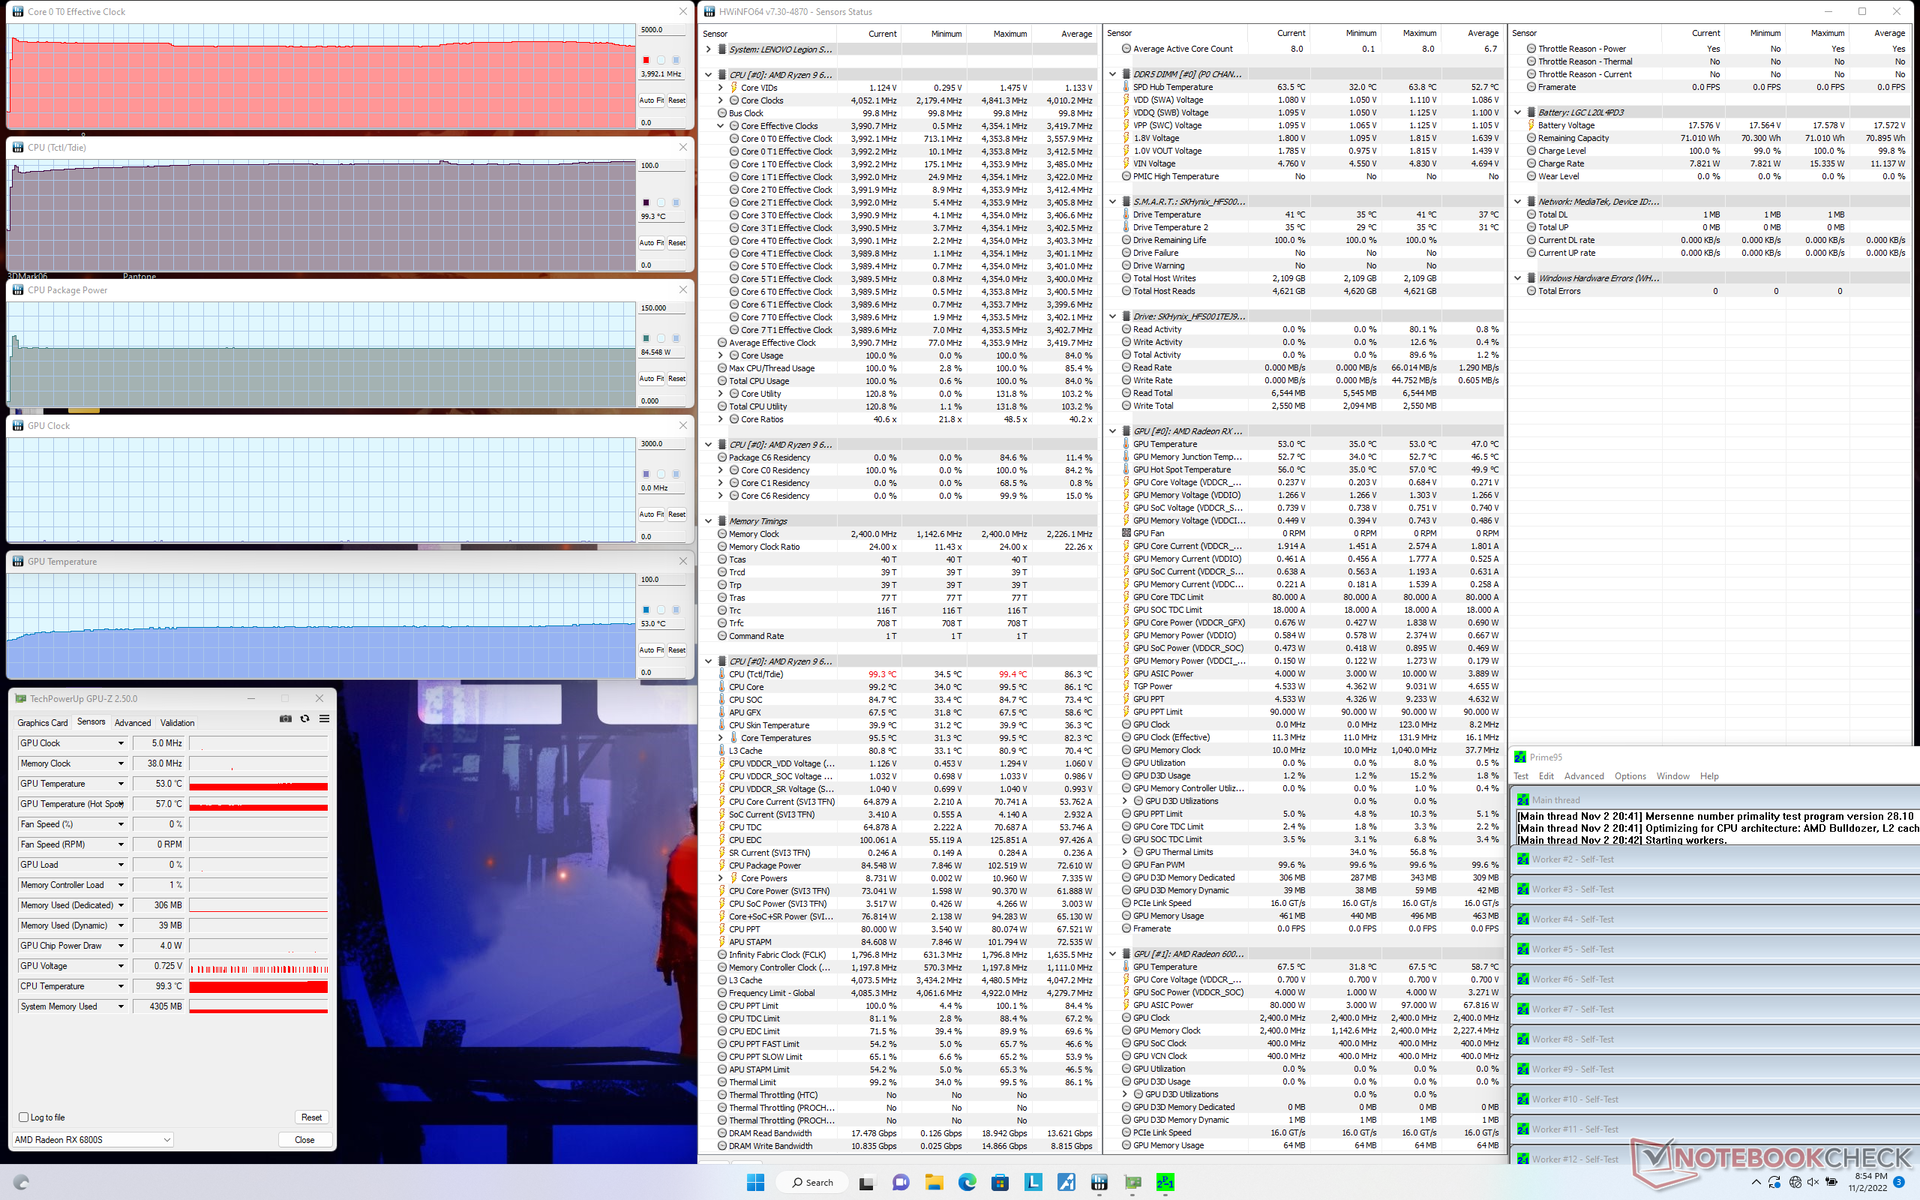
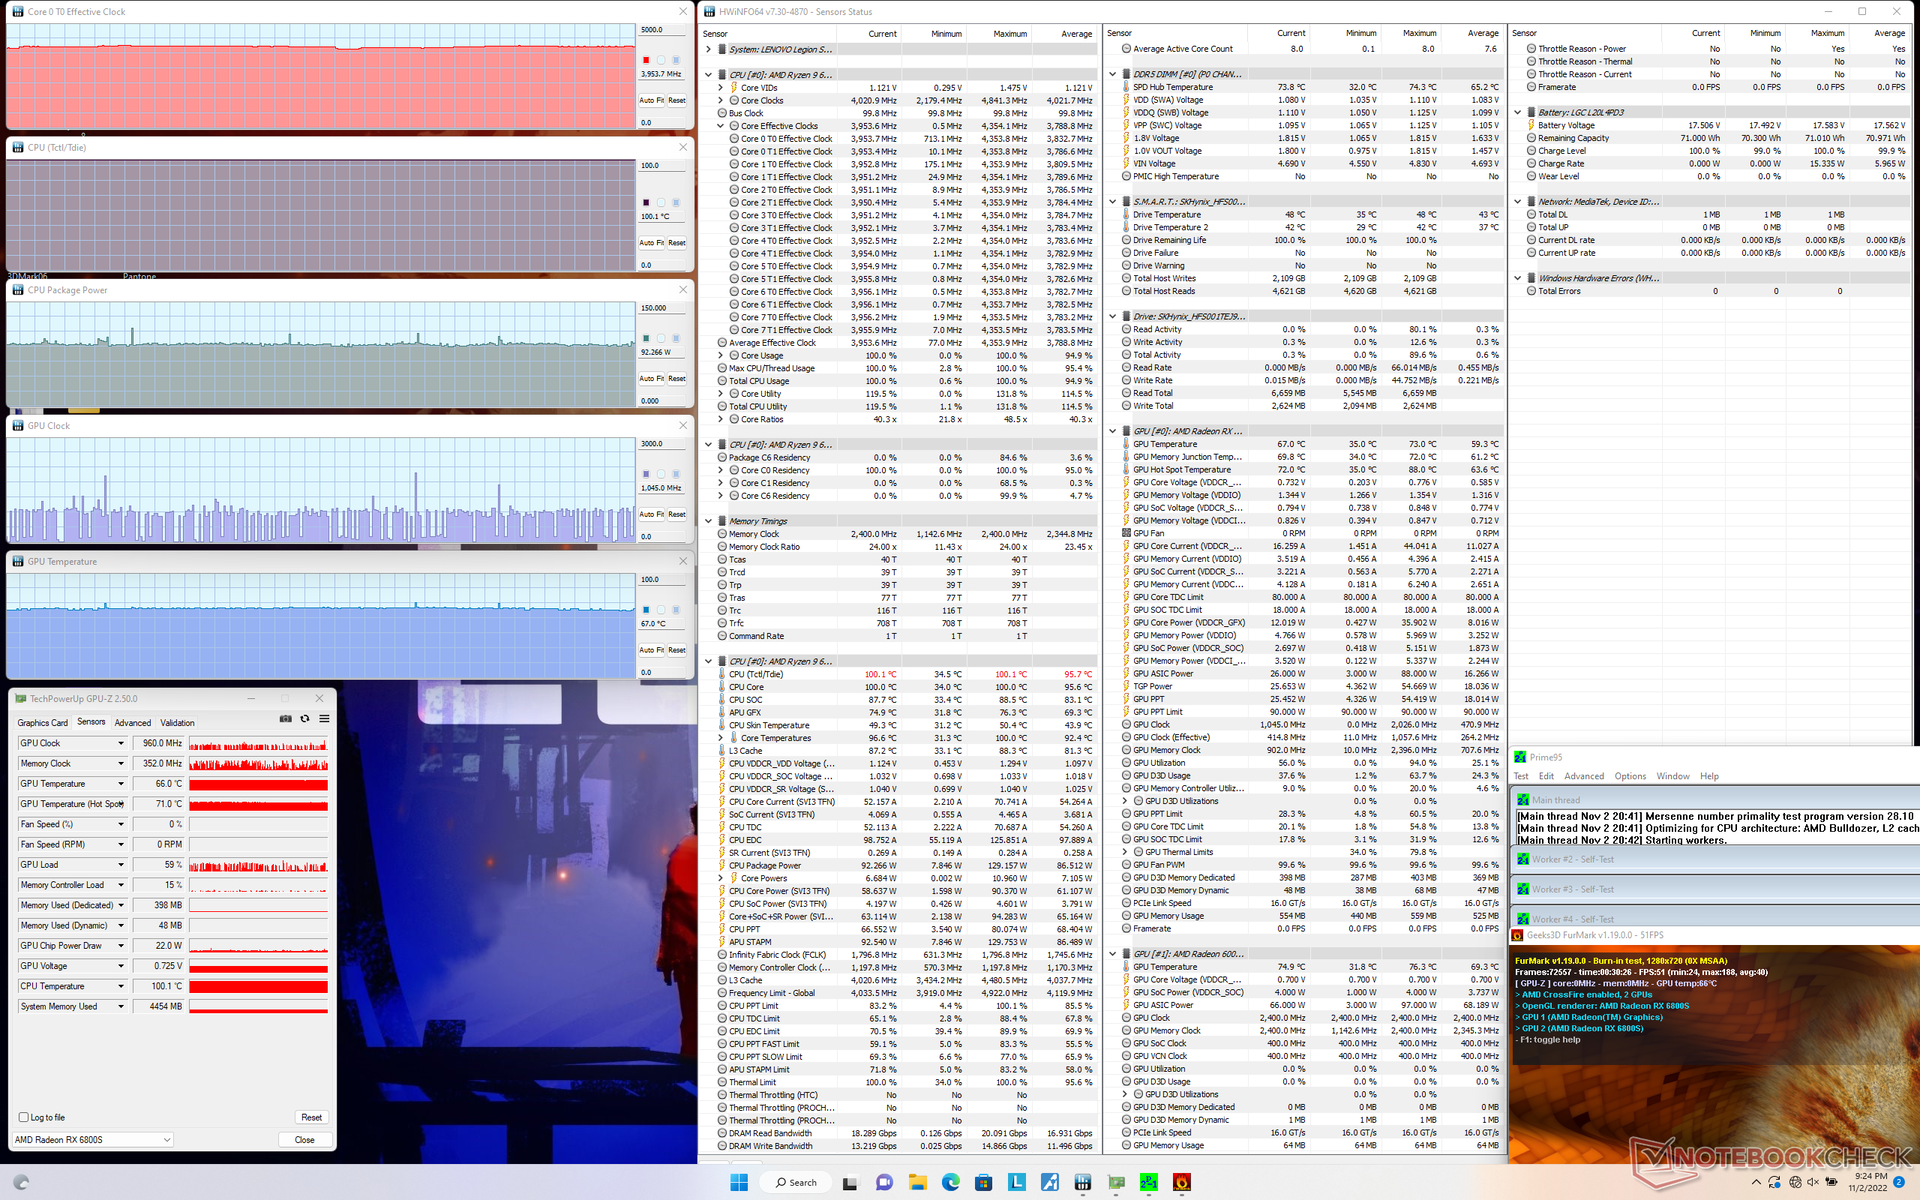
Stress Test — Very Warm
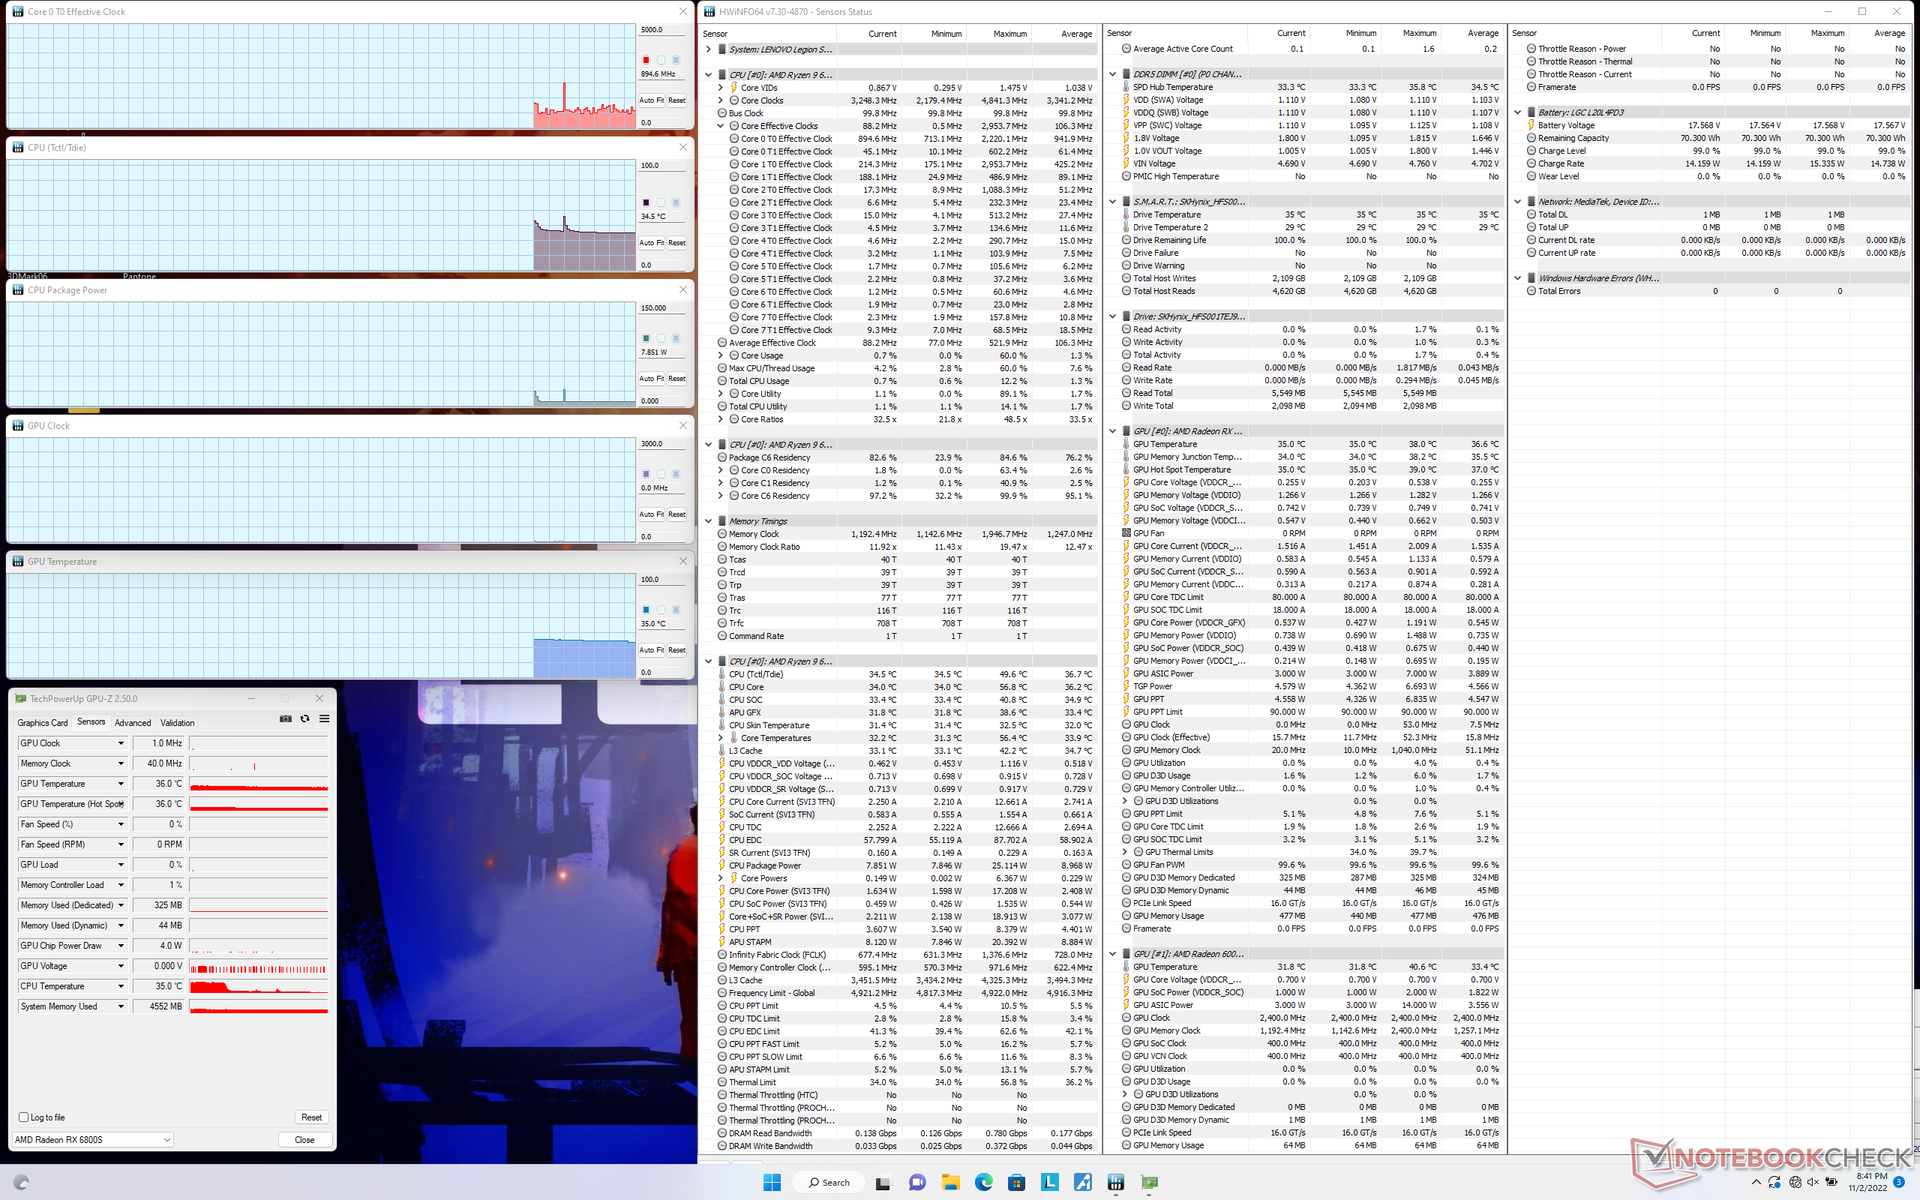
When stressed with Prime95, the CPU can be observed boosting to 4.4 GHz and 103 W albeit at a very high core temperature approaching 96 C. Clock rates and board power draw would then drop to 4.0 GHz and 85 W, respectively, in order to maintain a core temperature just below 100 C. Repeating this test on the larger Legion 7 16 with the Ryzen 7 6800H would see a slightly cooler stable core temperature of 93 C.
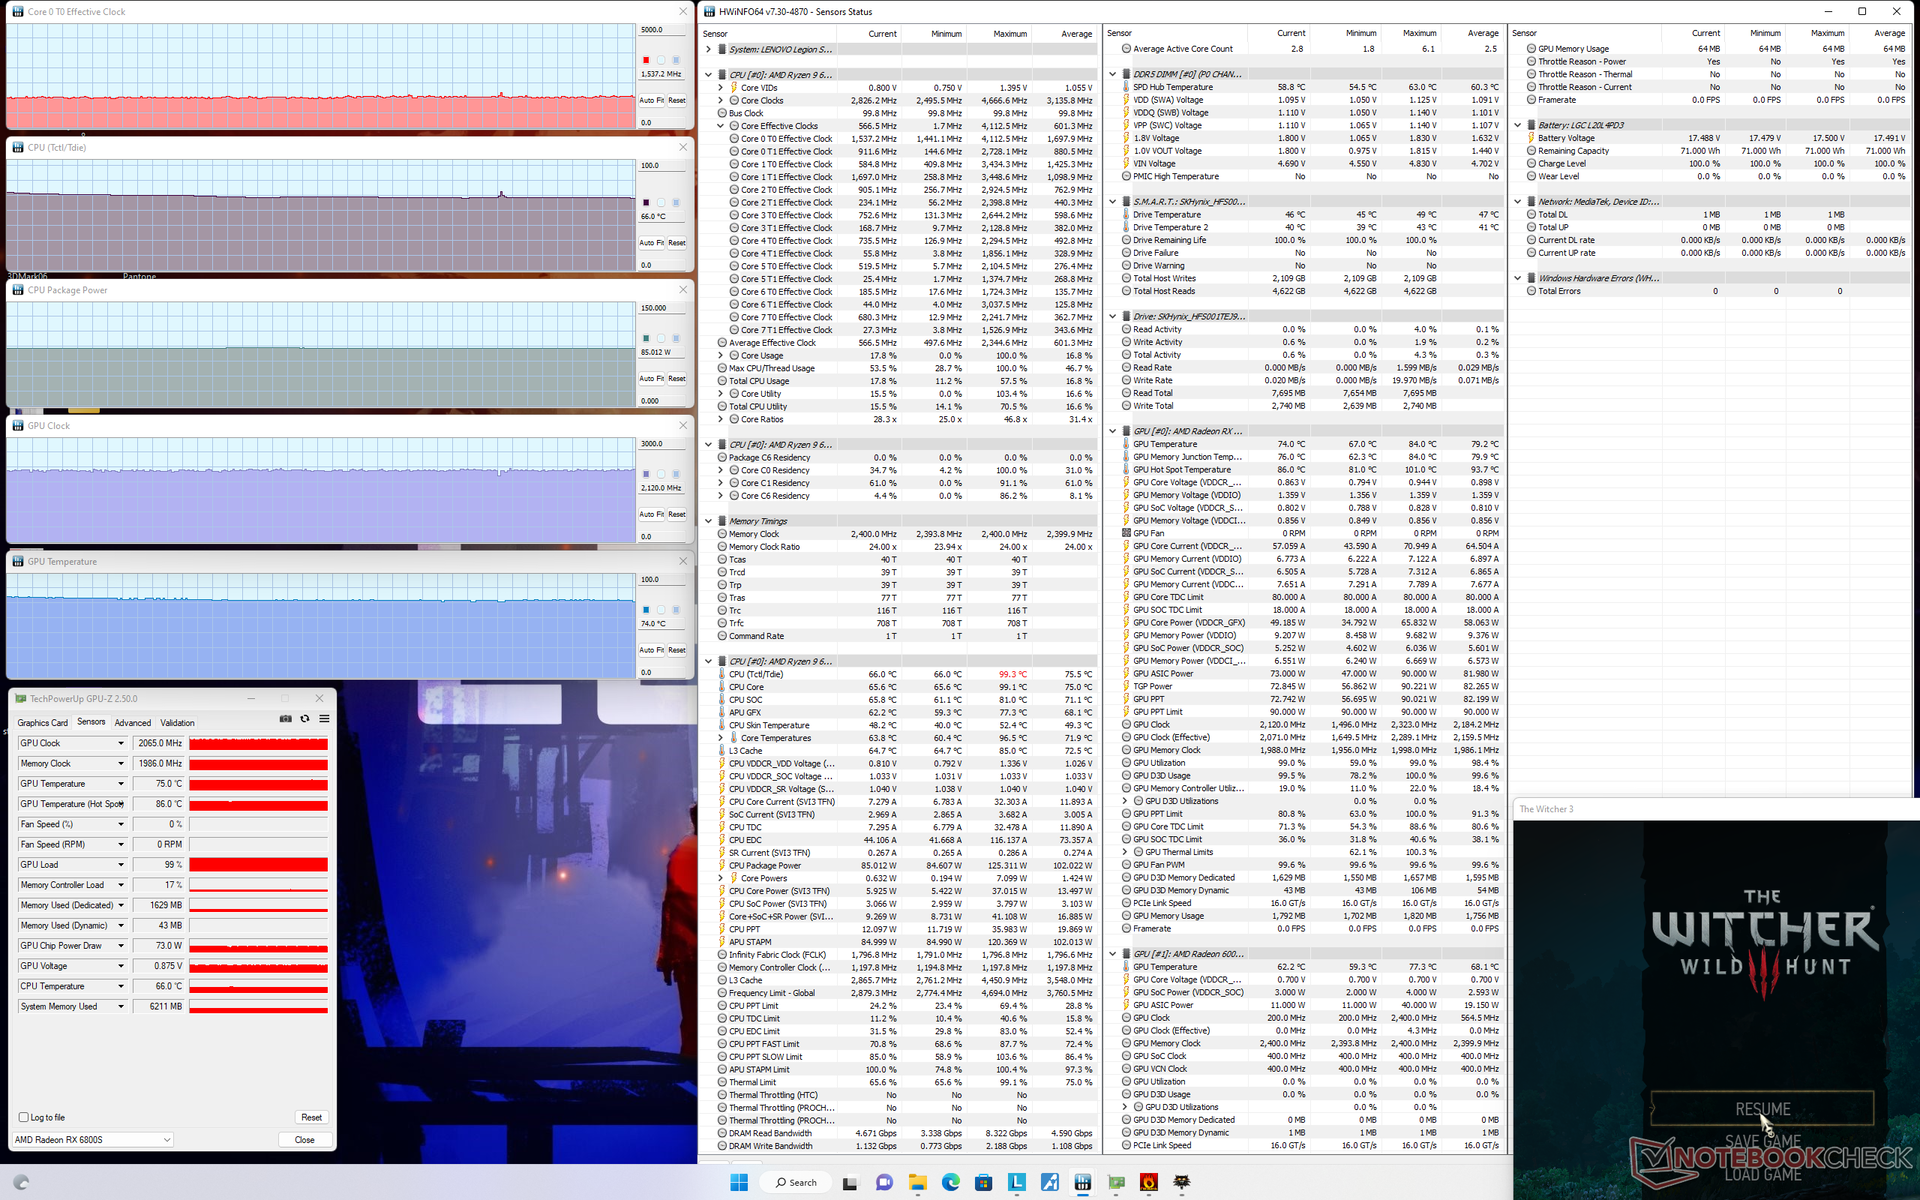
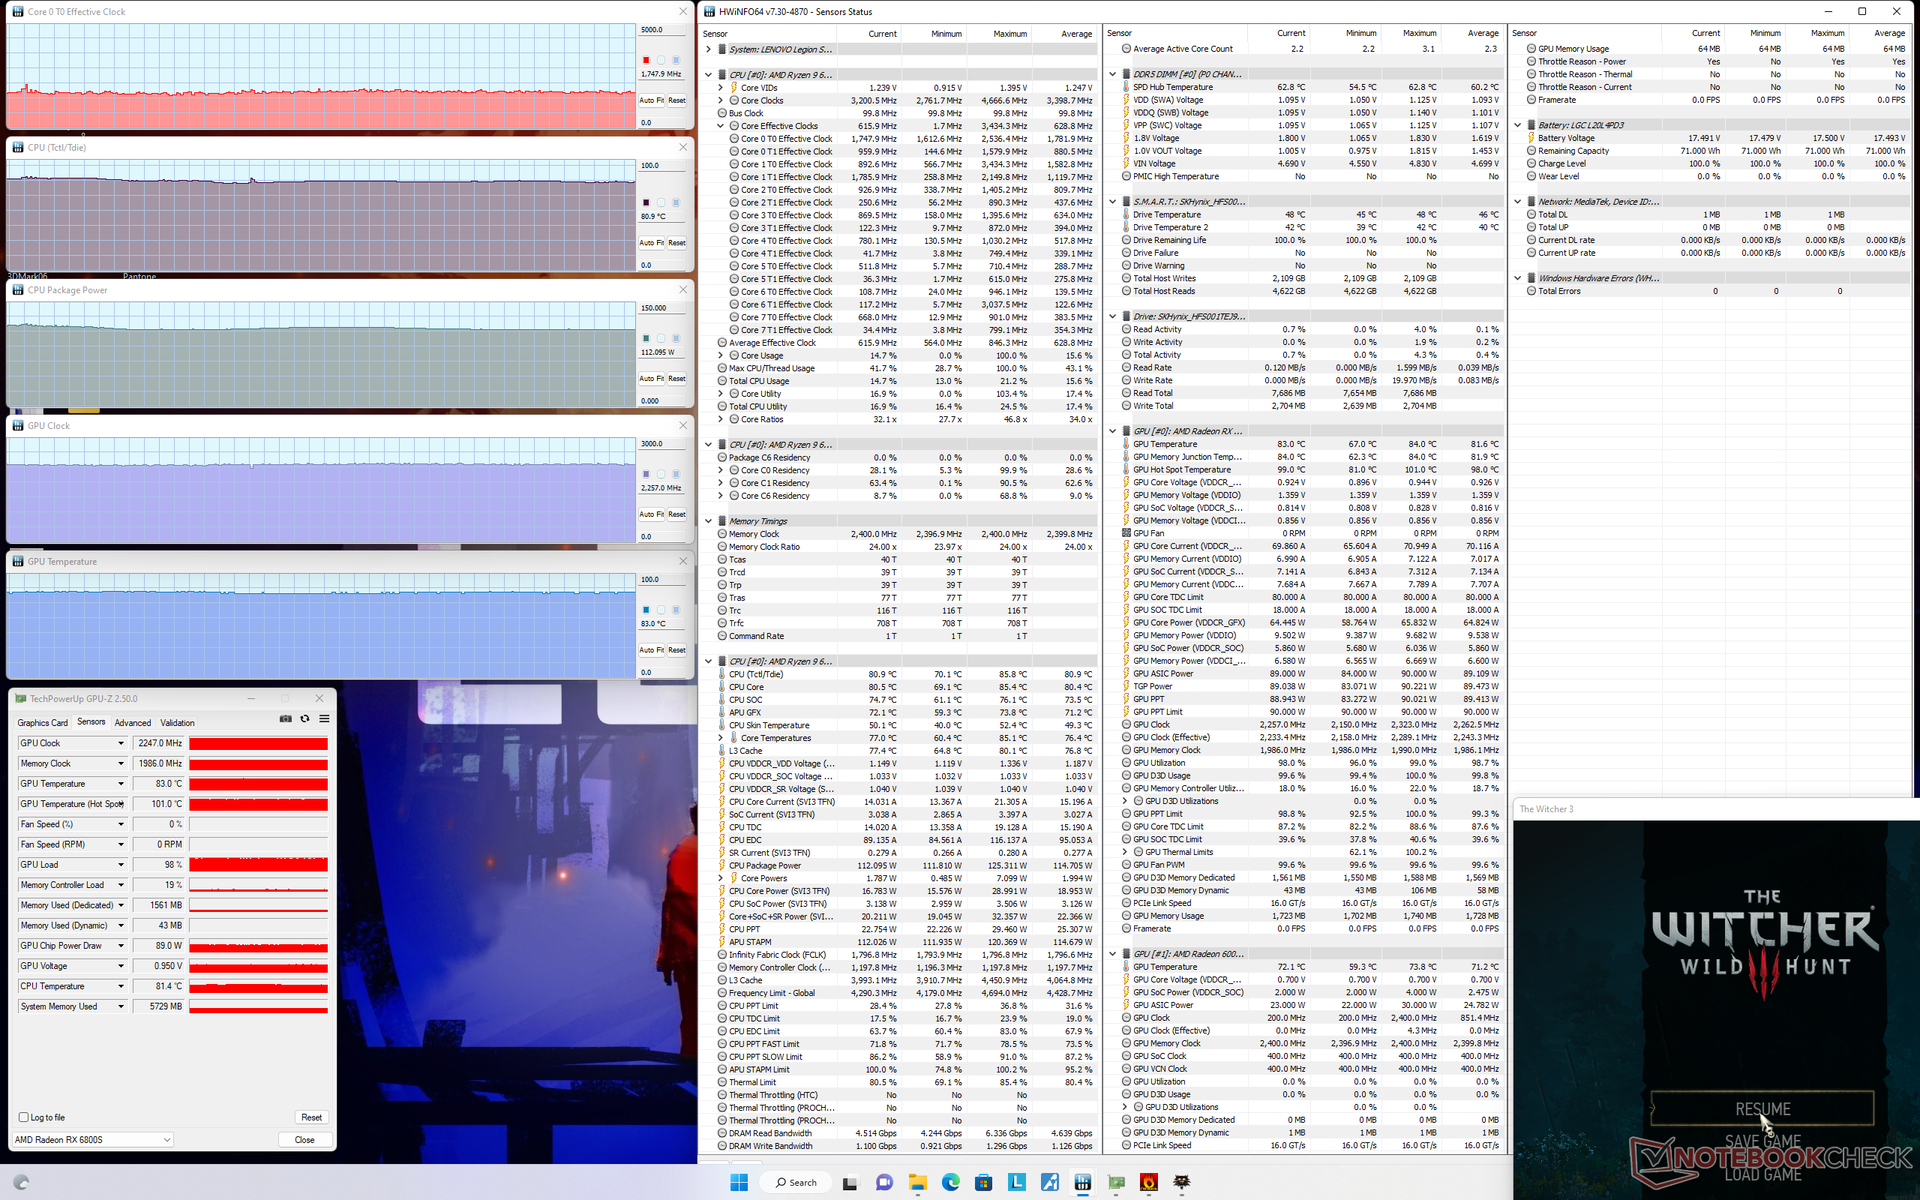
Running Witcher 3 on Performance mode would result in a steady GPU clock rate, temperature, and power draw of 2247 MHz, 83 C, and 89 W, respectively, versus 2065 MHz, 75 C, and 73 W when on Balanced mode. Running on Balanced mode may be quieter and cooler, but you'll lose out on some performance along the way.
Running on battery limits performance. A Fire Strike test on batteries would return Physics and Graphics scores of 7993 and 18377 points, respectively, compared to 26051 and 25625 points when on mains.
| CPU Clock (GHz) | GPU Clock (MHz) | Average CPU Temperature (°C) | Average GPU Temperature (°C) | |
| System Idle | -- | -- | 35 | 35 |
| Prime95 Stress | 4.0 - 4.1 | -- | 99 | 53 |
| Prime95 + FurMark Stress | 4.0 | ~1045 | 100 | 67 |
| Witcher 3 Stress (Balanced mode) | 1.5 | 2120 | 66 | 74 |
| Witcher 3 Stress (Performance mode) | 1.8 | 2257 | 81 | 83 |
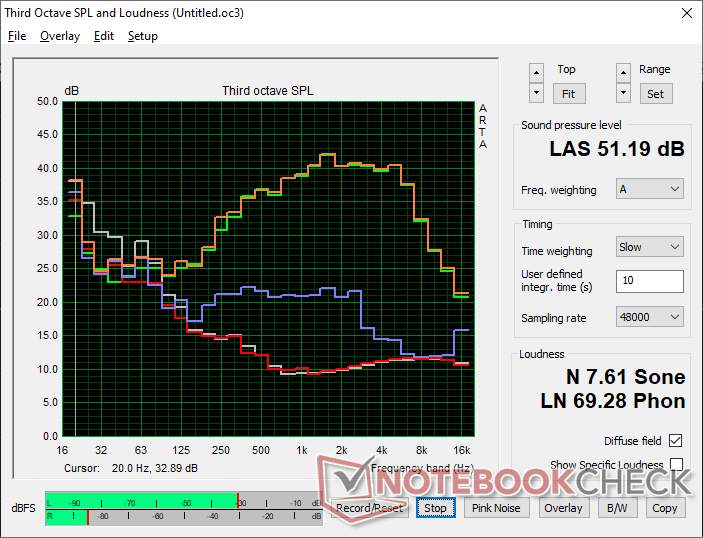
Speakers
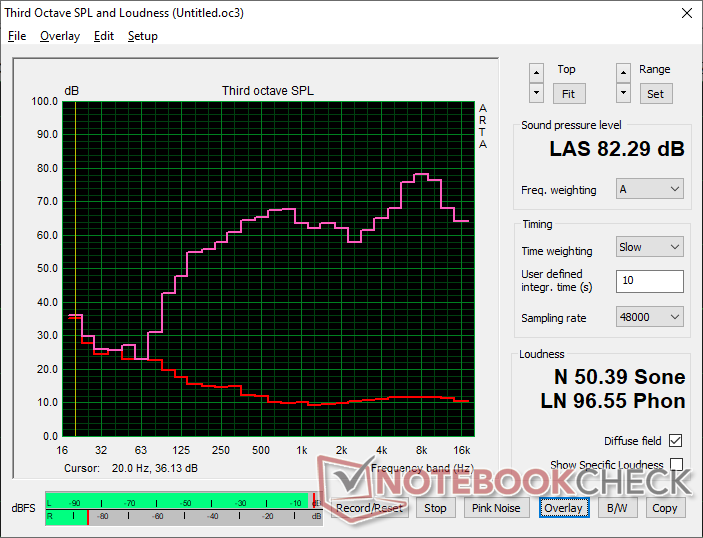
Lenovo Legion S7 16ARHA7 audio analysis
(+) | speakers can play relatively loud (82.2 dB)
Bass 100 - 315 Hz
(±) | reduced bass - on average 10.2% lower than median
(±) | linearity of bass is average (8.8% delta to prev. frequency)
Mids 400 - 2000 Hz
(+) | balanced mids - only 1.9% away from median
(+) | mids are linear (3.8% delta to prev. frequency)
Highs 2 - 16 kHz
(±) | higher highs - on average 7.6% higher than median
(±) | linearity of highs is average (7.1% delta to prev. frequency)
Overall 100 - 16.000 Hz
(+) | overall sound is linear (12.8% difference to median)
Compared to same class
» 15% of all tested devices in this class were better, 4% similar, 81% worse
» The best had a delta of 6%, average was 18%, worst was 132%
Compared to all devices tested
» 9% of all tested devices were better, 2% similar, 89% worse
» The best had a delta of 4%, average was 25%, worst was 134%
Apple MacBook Pro 16 2021 M1 Pro audio analysis
(+) | speakers can play relatively loud (84.7 dB)
Bass 100 - 315 Hz
(+) | good bass - only 3.8% away from median
(+) | bass is linear (5.2% delta to prev. frequency)
Mids 400 - 2000 Hz
(+) | balanced mids - only 1.3% away from median
(+) | mids are linear (2.1% delta to prev. frequency)
Highs 2 - 16 kHz
(+) | balanced highs - only 1.9% away from median
(+) | highs are linear (2.7% delta to prev. frequency)
Overall 100 - 16.000 Hz
(+) | overall sound is linear (4.6% difference to median)
Compared to same class
» 0% of all tested devices in this class were better, 0% similar, 100% worse
» The best had a delta of 5%, average was 18%, worst was 45%
Compared to all devices tested
» 0% of all tested devices were better, 0% similar, 100% worse
» The best had a delta of 4%, average was 25%, worst was 134%
Energy Management — Comparable To GeForce RTX 3060
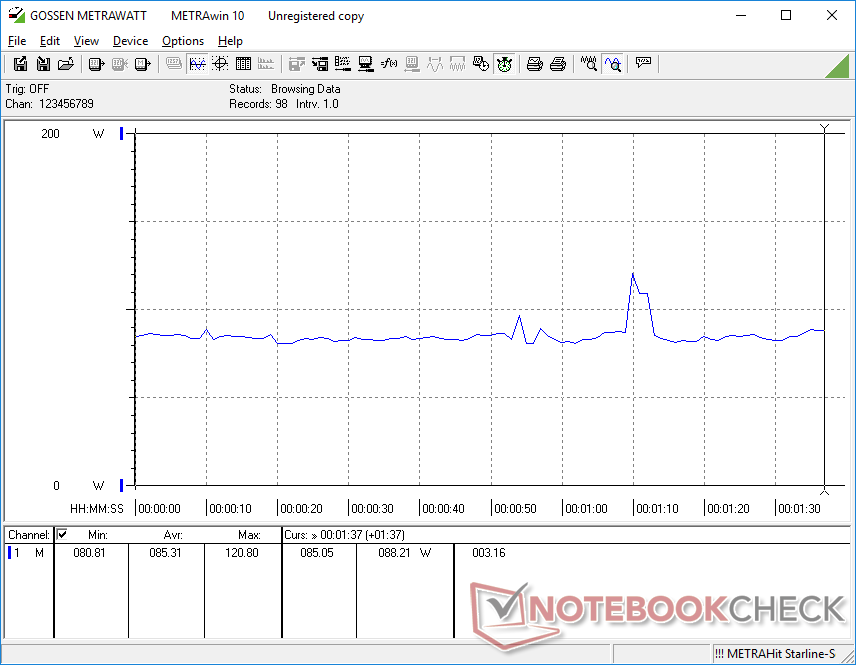
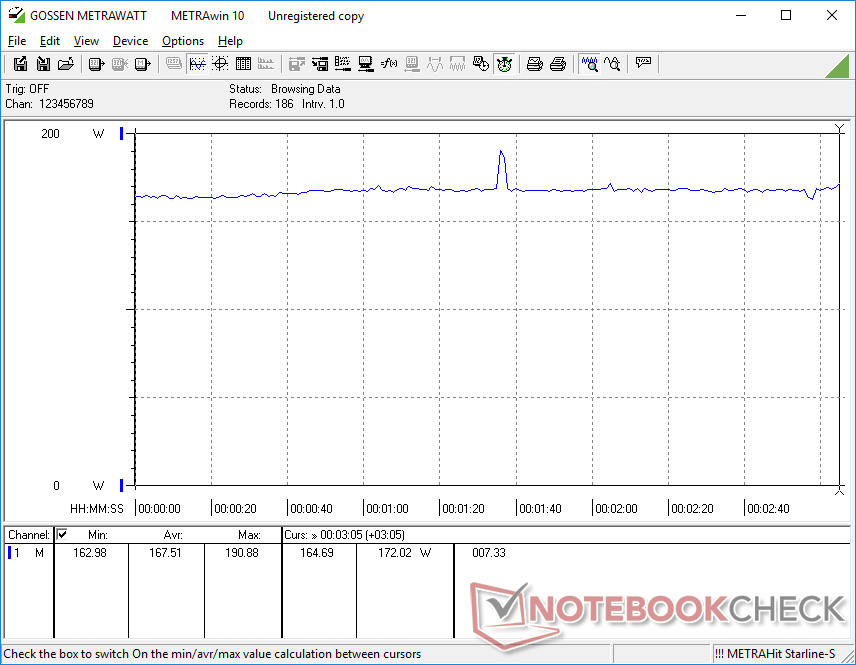
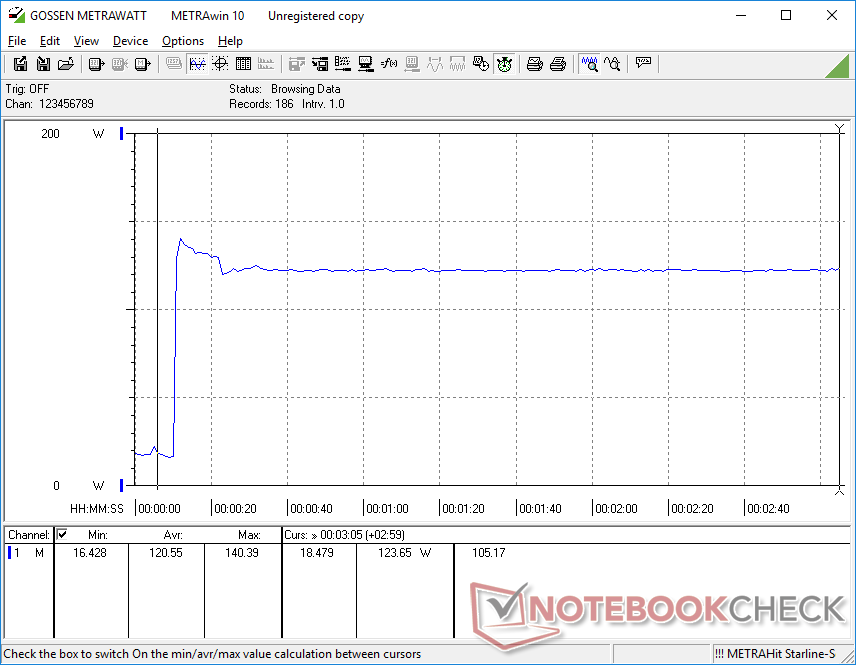
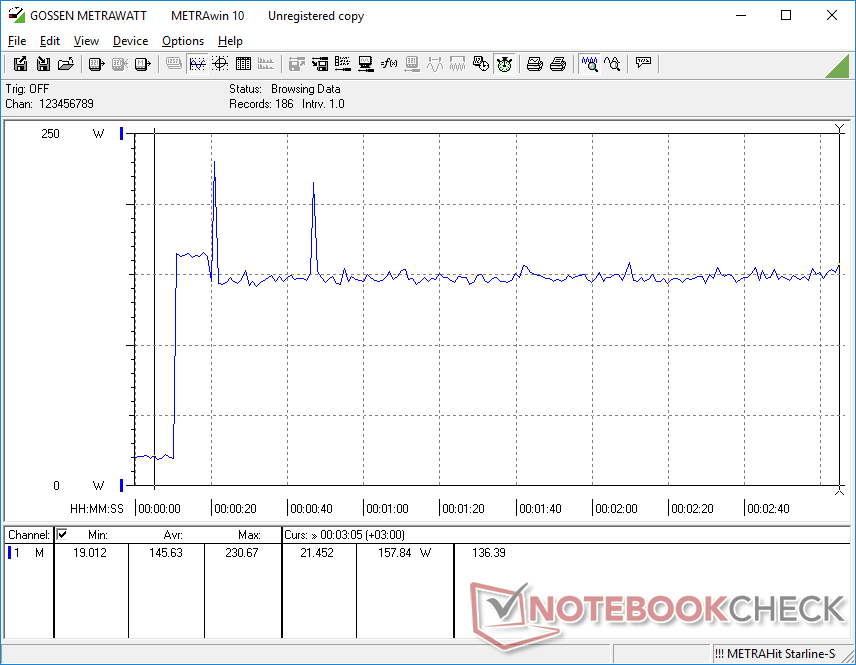
Power Consumption
Power consumption is an improvement over laptops with last generation AMD parts. The HP Omen 16 with the Zen 3 Ryzen 7 5800H and Radeon RX 6600M, for example, would consume 15 percent more power than our Lenovo when gaming even though it offers 5 to 10 percent slower gaming performance. Overall consumption is generally comparable to many RTX 3060 laptops such as the Dell G16.
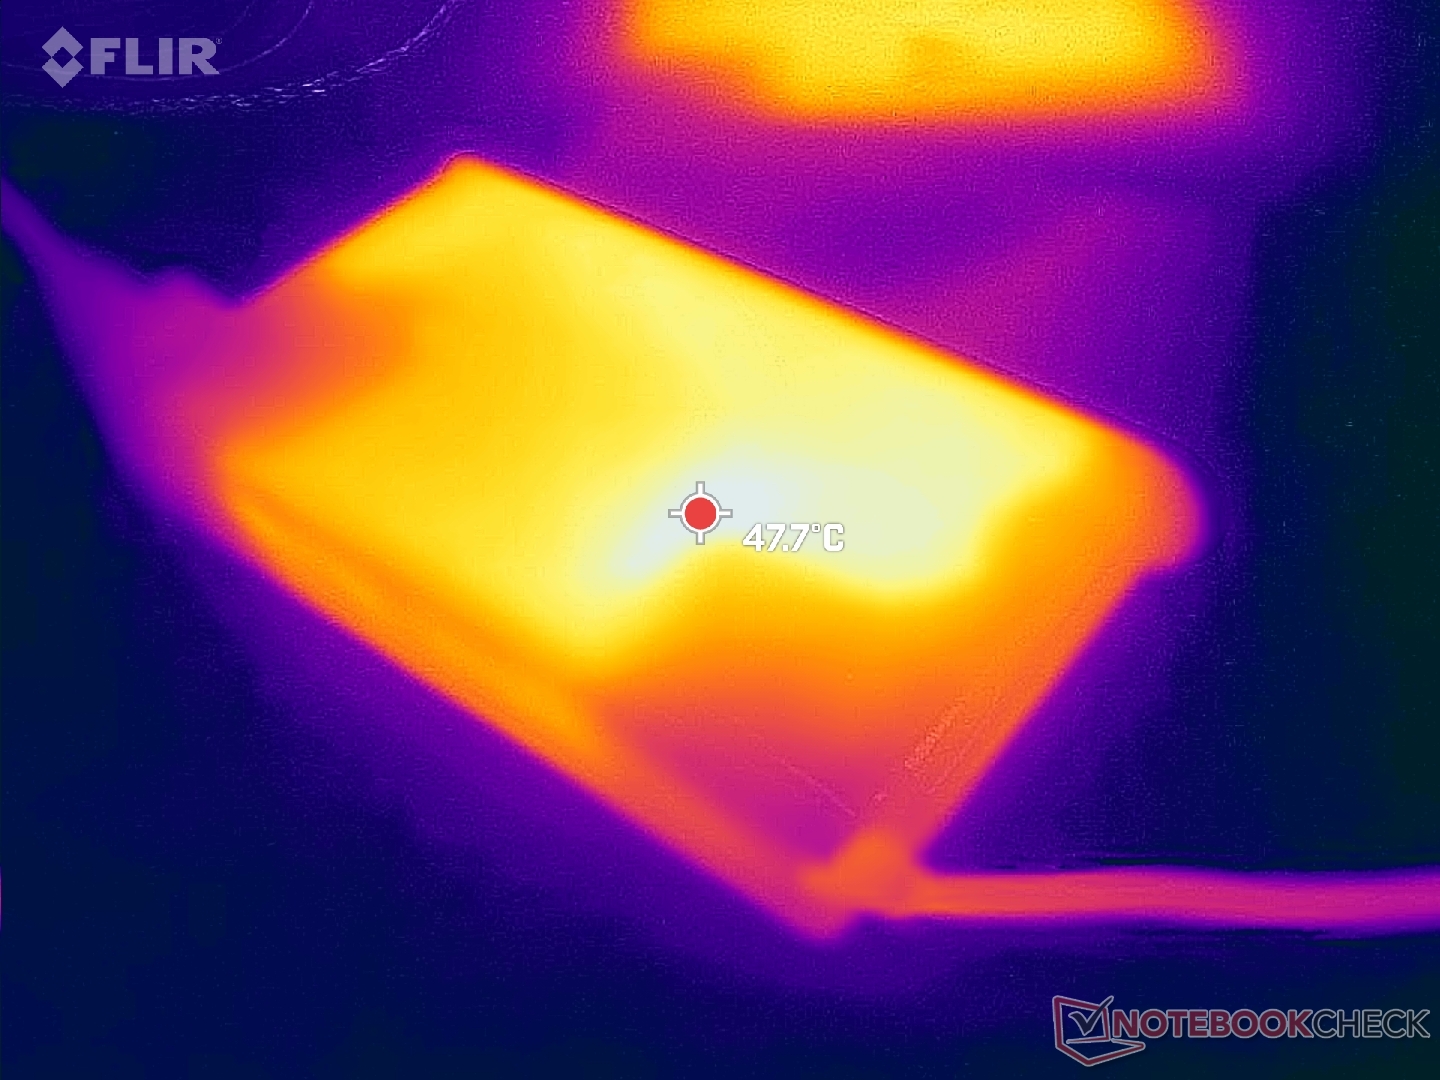
We're able to record a temporary maximum draw of 231 W from the medium-sized (~17 x 8.8 x 2.6 cm) 230 W AC adapter when both the CPU and GPU are at 100 percent utilization. Consumption would stabilize at around 157 W after just a few seconds due to thermal limitations.
| Off / Standby | |
| Idle | |
| Load |
|
| Lenovo Legion S7 16ARHA7 R9 6900HX, Radeon RX 6800S, SK Hynix HFS001TEJ9X115N, IPS, 2560x1600, 16.00 | Lenovo Legion Slim 7-16IAH 82TF004YGE i7-12700H, GeForce RTX 3060 Laptop GPU, SK Hynix HFS001TEJ9X115N, IPS LED, 2560x1600, 16.00 | Lenovo Legion 7 16IAX7-82TD004SGE i9-12900HX, GeForce RTX 3080 Ti Laptop GPU, Micron 3400 1TB MTFDKBA1T0TFH, IPS, 2560x1600, 16.00 | Dell G16 7620 i7-12700H, GeForce RTX 3060 Laptop GPU, WDC PC SN810 512GB, IPS, 2560x1600, 16.00 | HP Omen 16-c0077ng R7 5800H, Radeon RX 6600M, Samsung PM981a MZVLB1T0HBLR, IPS, 2560x1440, 16.10 | Asus ROG Zephyrus M16 GU603H i9-11900H, GeForce RTX 3070 Laptop GPU, Samsung PM9A1 MZVL22T0HBLB, IPS, 2560x1600, 16.00 | |
|---|---|---|---|---|---|---|
| Power Consumption | -17% | -61% | -29% | -24% | -20% | |
| Idle Minimum * | 8.8 | 13.3 -51% | 19.2 -118% | 14.4 -64% | 12 -36% | 11 -25% |
| Idle Average * | 14.7 | 17.5 -19% | 25.1 -71% | 17.8 -21% | 12.8 13% | 20 -36% |
| Idle Maximum * | 19.8 | 18.4 7% | 27.1 -37% | 31.5 -59% | 18.5 7% | 30 -52% |
| Load Average * | 85.3 | 122.8 -44% | 132 -55% | 101.2 -19% | 190 -123% | 111 -30% |
| Witcher 3 ultra * | 167.5 | 154.7 8% | 253 -51% | 176.9 -6% | 194 -16% | 156 7% |
| Load Maximum * | 230.7 | 232.6 -1% | 308.9 -34% | 242.9 -5% | 200 13% | 197 15% |
* ... smaller is better
Power Consumption Witcher 3 / Stresstest
Power Consumption external Monitor
Battery Life
WLAN runtime is comparable to the MSI GS77 which sports a larger 99 Wh internal battery. Expect just over 6 hours of real-world browsing usage.
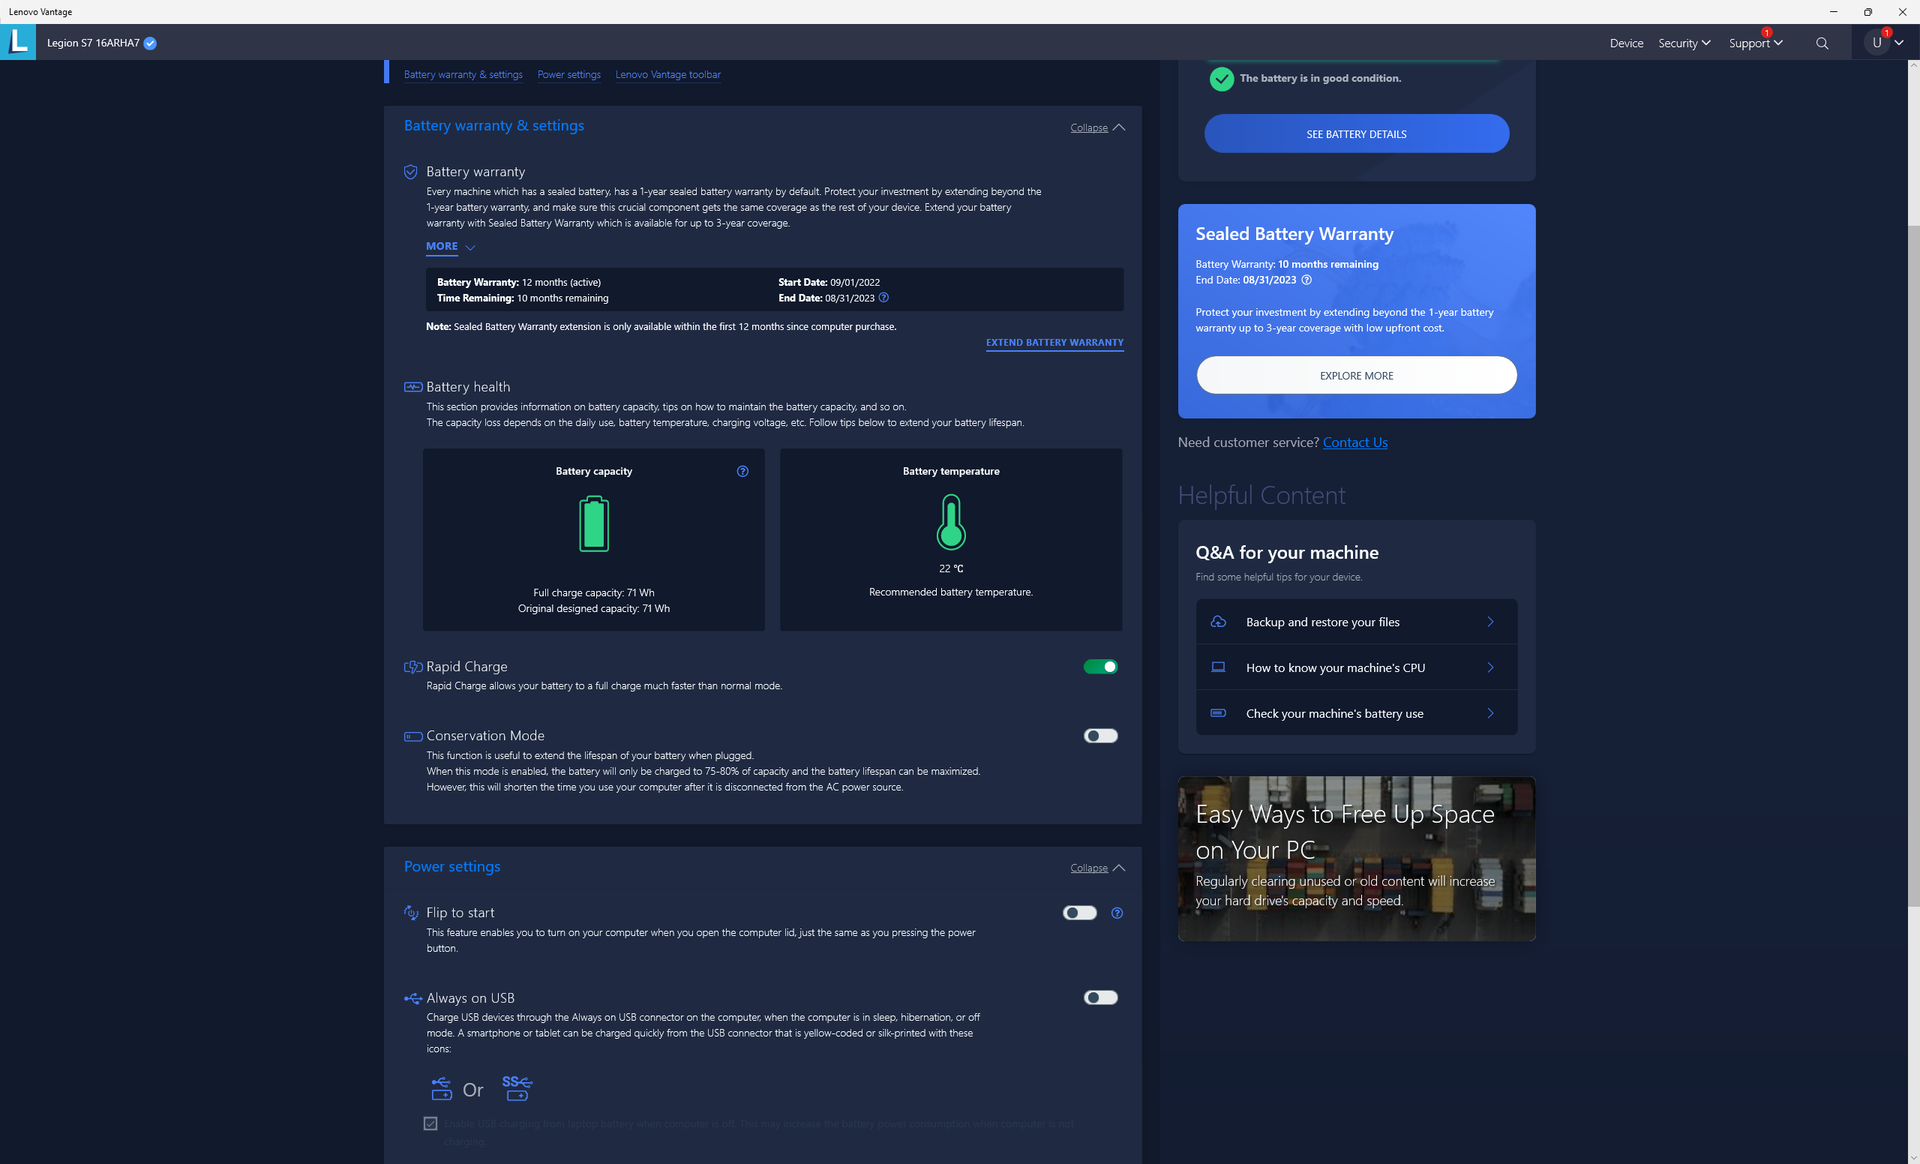
Charging from empty to full capacity takes about 2 hours. Unfortunately, the system cannot be recharged via USB-C. We tried two different USB-C adapters — one 130 W AC adapter from Dell and one general 65 W AC adapter — and neither would charge our unit.
| Lenovo Legion S7 16ARHA7 R9 6900HX, Radeon RX 6800S, 71 Wh | Lenovo Legion Slim 7-16IAH 82TF004YGE i7-12700H, GeForce RTX 3060 Laptop GPU, 99.99 Wh | Lenovo Legion 7 16IAX7-82TD004SGE i9-12900HX, GeForce RTX 3080 Ti Laptop GPU, 99 Wh | Dell G16 7620 i7-12700H, GeForce RTX 3060 Laptop GPU, 84 Wh | HP Omen 16-c0077ng R7 5800H, Radeon RX 6600M, 70 Wh | Asus ROG Zephyrus M16 GU603H i9-11900H, GeForce RTX 3070 Laptop GPU, 90 Wh | |
|---|---|---|---|---|---|---|
| Battery Runtime | -17% | -29% | -21% | -3% | 24% | |
| WiFi v1.3 | 374 | 309 -17% | 267 -29% | 297 -21% | 363 -3% | 463 24% |
| H.264 | 570 | 306 | 419 | |||
| Witcher 3 ultra | 91 | 55 | 83 | |||
| Load | 76 | 40 | 43 | 97 | ||
| Reader / Idle | 426 | 799 |
Pros
Cons
Verdict — Well-Balanced Ultrathin Gamer
When someone hears "Lenovo", gaming is unlikely to be the first thing they would associate with the brand. Nonetheless, the Legion series of gaming laptops has been steadily improving over the years and the 2022 Legion Slim 7 16 is amongst the best that Lenovo has to offer in the category. The model is quieter than expected and with excellent SSD performance in spite of the ultra-thin profile. Some other ultrathin gaming laptops, like the Acer Predator Triton 300 SE, are much louder and have inferior SSD performance. Even the design of the Legion Slim 7 is more rigid than it looks to be a good reflection of its ~$1500 USD asking price.
The Lenovo Legion Slim 7 16 offers comparable performance to a GeForce RTX 3060 laptop. Its slim profile and AMD hardware balance portability, price, midrange gaming performance, and quality better than most RTX 3060 laptops out there.
There are still plenty of drawbacks to keep in mind. CPU and GPU temperatures in particular are very warm at over 80 C each when gaming and the CPU can be even warmer if at higher utilization. Storage is limited to just one M.2 drive and the keyboard backlight is white only whereas most gaming laptops like the Razer Blade 15 have room for two M.2 storage drives and either multi-zone or per-key RGB lighting. We recommend skipping the Ryzen 9 6900HX SKU if possible as the Ryzen 7 6800H SKU will more than likely offer essentially the same processor performance for less.
Price and Availability
Lenovo Legion S7 16ARHA7
-
11/04/2022 v7
Allen Ngo


Pricecompare
