

Lenovo Legion 7 16IAX7 laptop review: Fast 16-inch gamer with 165 Hz display
The Legion 7 16 is Lenovo's gaming flagship in a 16-inch format and offers everything that is currently available on the market: an Intel HX CPU, a GeForce RTX 3080 Ti, a WQHD panel with 165 Hz, and up-to-date PCIe 4.0 SSDs. However, this also comes at a price, as Lenovo charges the hefty sum of 4,500 Euros (~US$4,500) for the high-end gamer. In this review, we compare the new Legion 7 16 to the gaming competition, which mainly consists of 17-inch models, and also to the Legion 7 16 with AMD hardware.
Possible Competitors in Comparison
Rating | Date | Model | Weight | Height | Size | Resolution | Price |
|---|---|---|---|---|---|---|---|
| 88.9 % v7 (old) | 09 / 2022 | Lenovo Legion 7 16IAX7-82TD004SGE i9-12900HX, GeForce RTX 3080 Ti Laptop GPU | 2.6 kg | 20 mm | 16.00" | 2560x1600 | |
| 87.6 % v7 (old) | 08 / 2022 | SCHENKER XMG Neo 17 M22 R9 6900HX, GeForce RTX 3080 Ti Laptop GPU | 2.8 kg | 27 mm | 17.00" | 2560x1600 | |
| 88.3 % v7 (old) | 08 / 2022 | MSI Titan GT77 12UHS i9-12900HX, GeForce RTX 3080 Ti Laptop GPU | 3.3 kg | 23 mm | 17.30" | 1920x1080 | |
| 83.7 % v7 (old) | 08 / 2022 | Aorus 17X XES i9-12900HX, GeForce RTX 3070 Ti Laptop GPU | 2.7 kg | 30 mm | 17.30" | 1920x1080 | |
| 89.5 % v7 (old) | 08 / 2022 | Asus ROG Flow X16 GV601RW-M5082W R9 6900HS, GeForce RTX 3070 Ti Laptop GPU | 2.1 kg | 19.4 mm | 16.10" | 2560x1600 | |
| 89.9 % v7 (old) | 07 / 2022 | Razer Blade 17 Early 2022 i9-12900H, GeForce RTX 3080 Ti Laptop GPU | 2.8 kg | 19.9 mm | 17.30" | 3840x2160 | |
| 88.2 % v7 (old) | 05 / 2022 | Asus ROG Zephyrus Duo 16 GX650RX R9 6900HX, GeForce RTX 3080 Ti Laptop GPU | 2.6 kg | 20.5 mm | 16.00" | 3840x2400 |
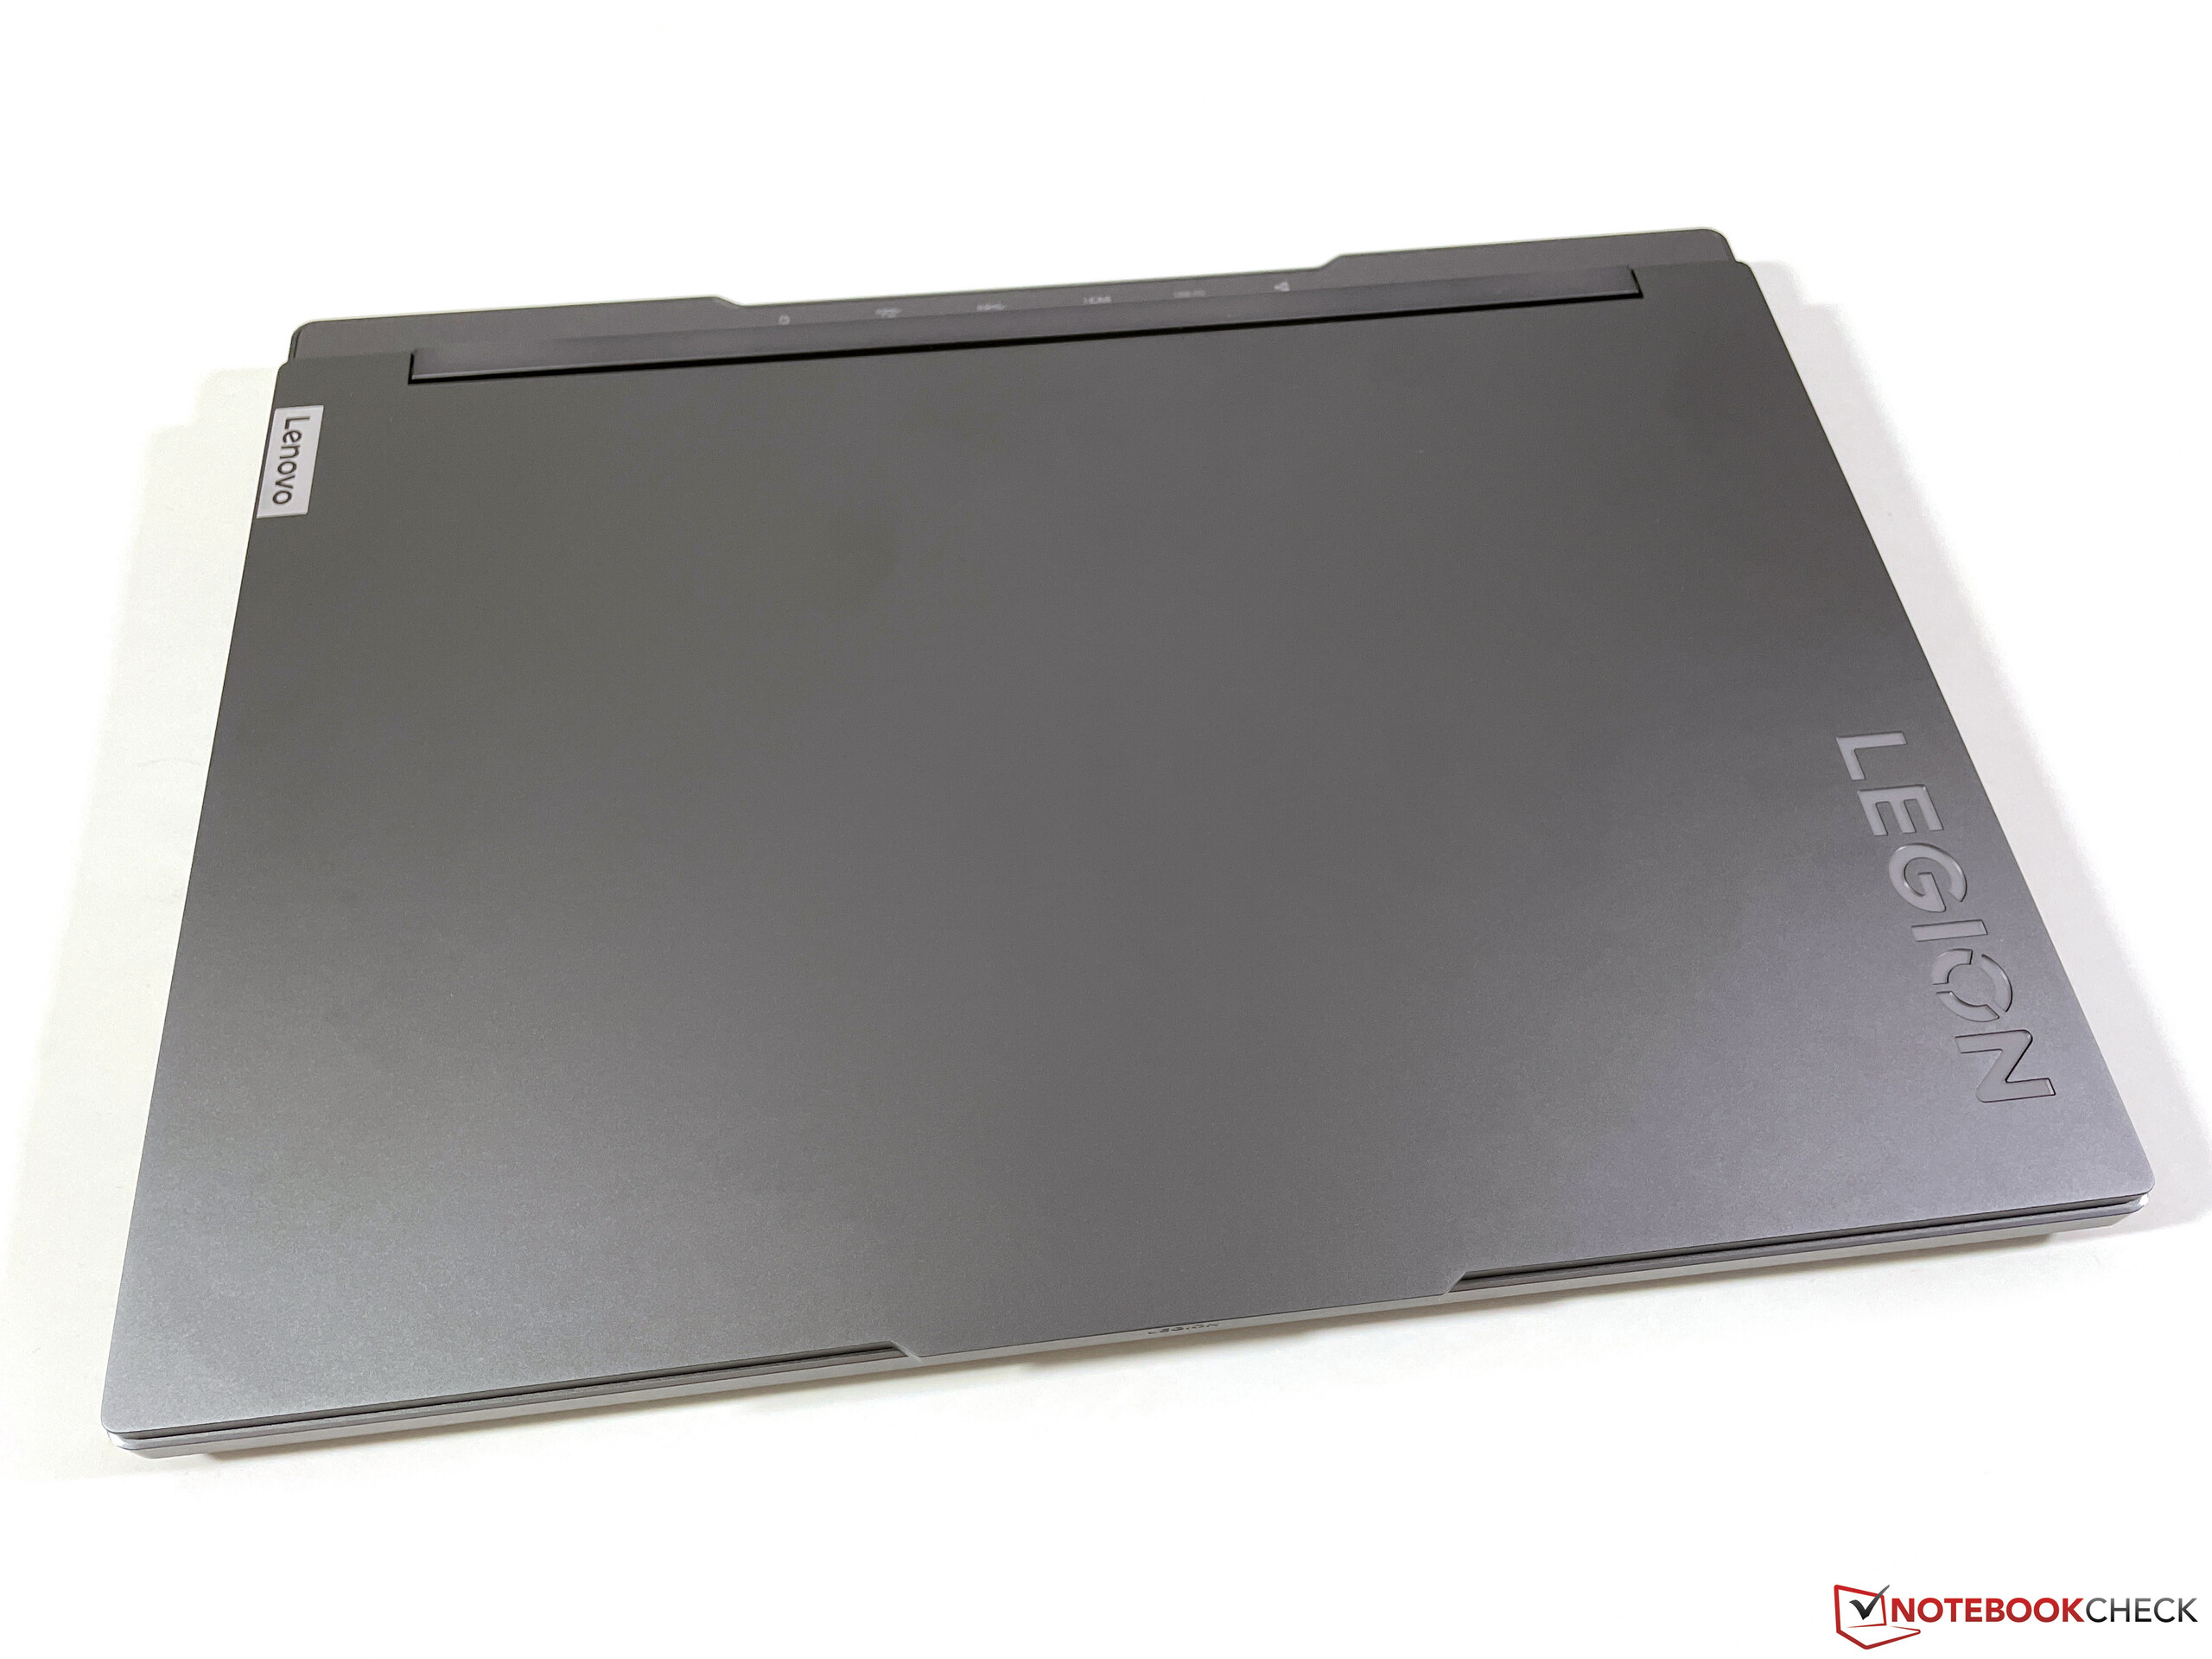
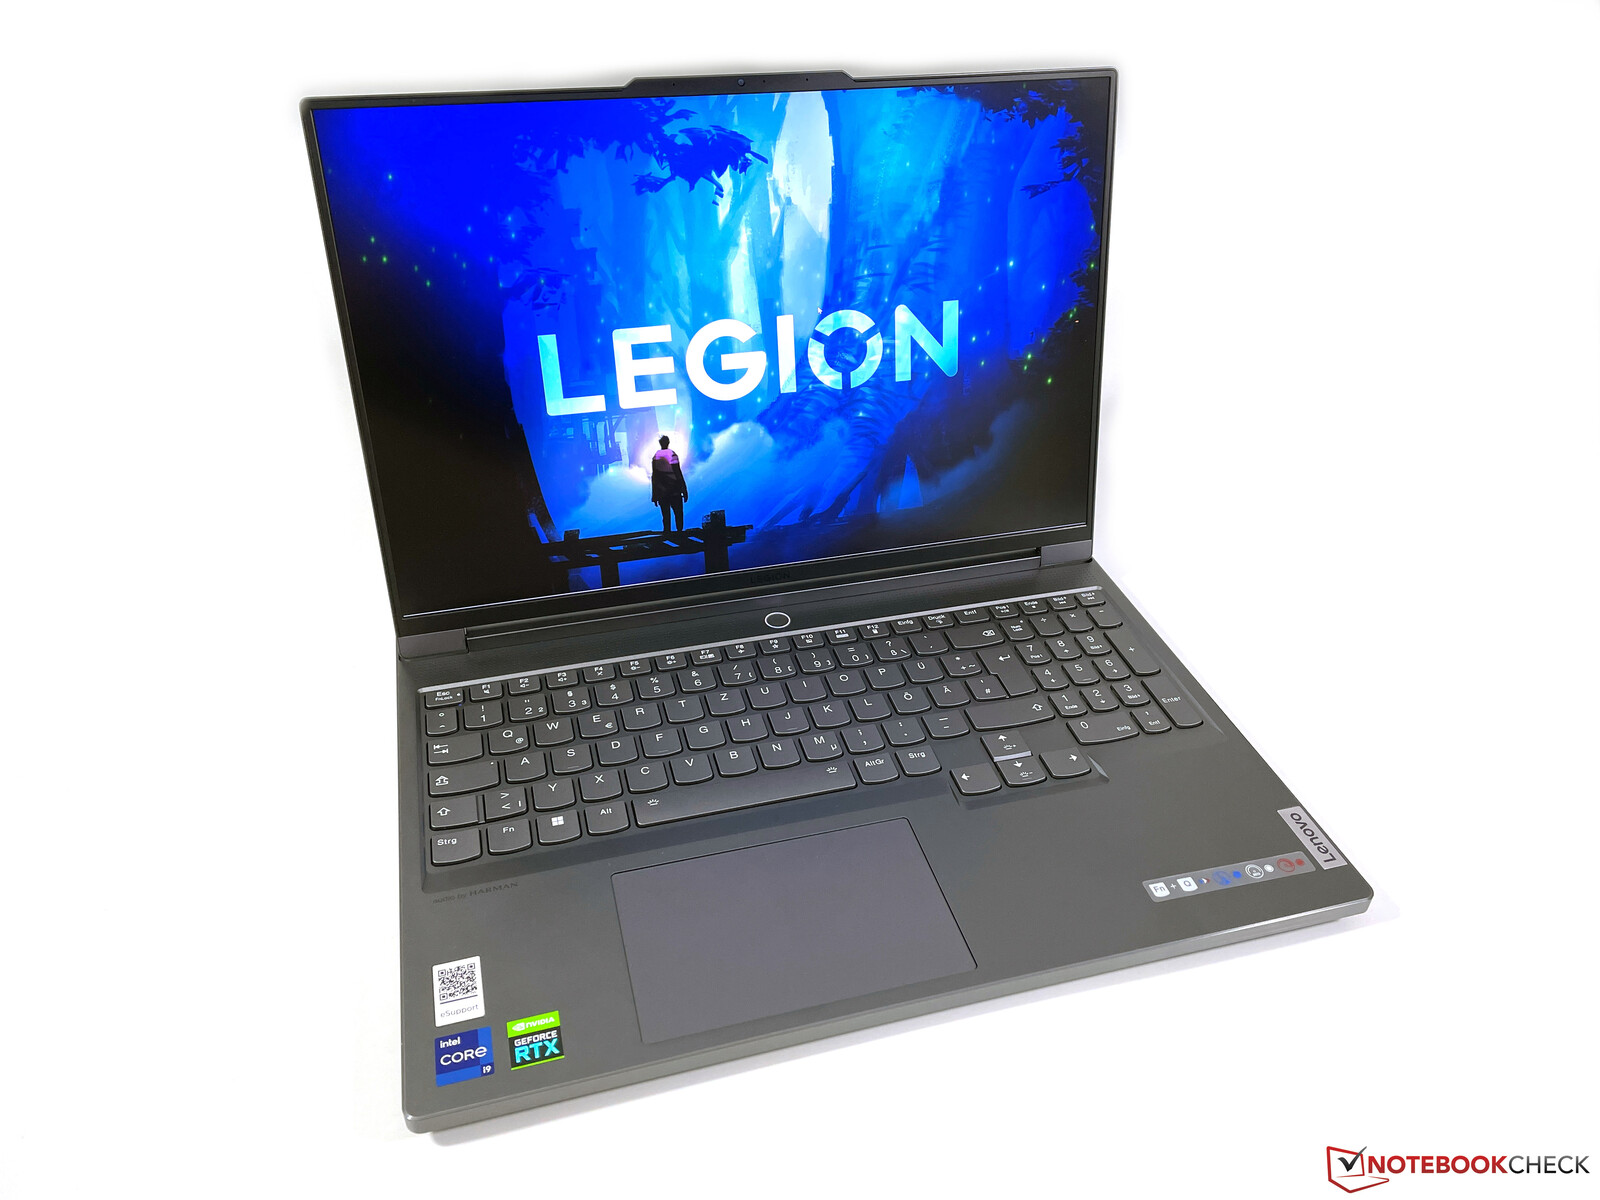
Case - Legion 7 with aluminum chassis
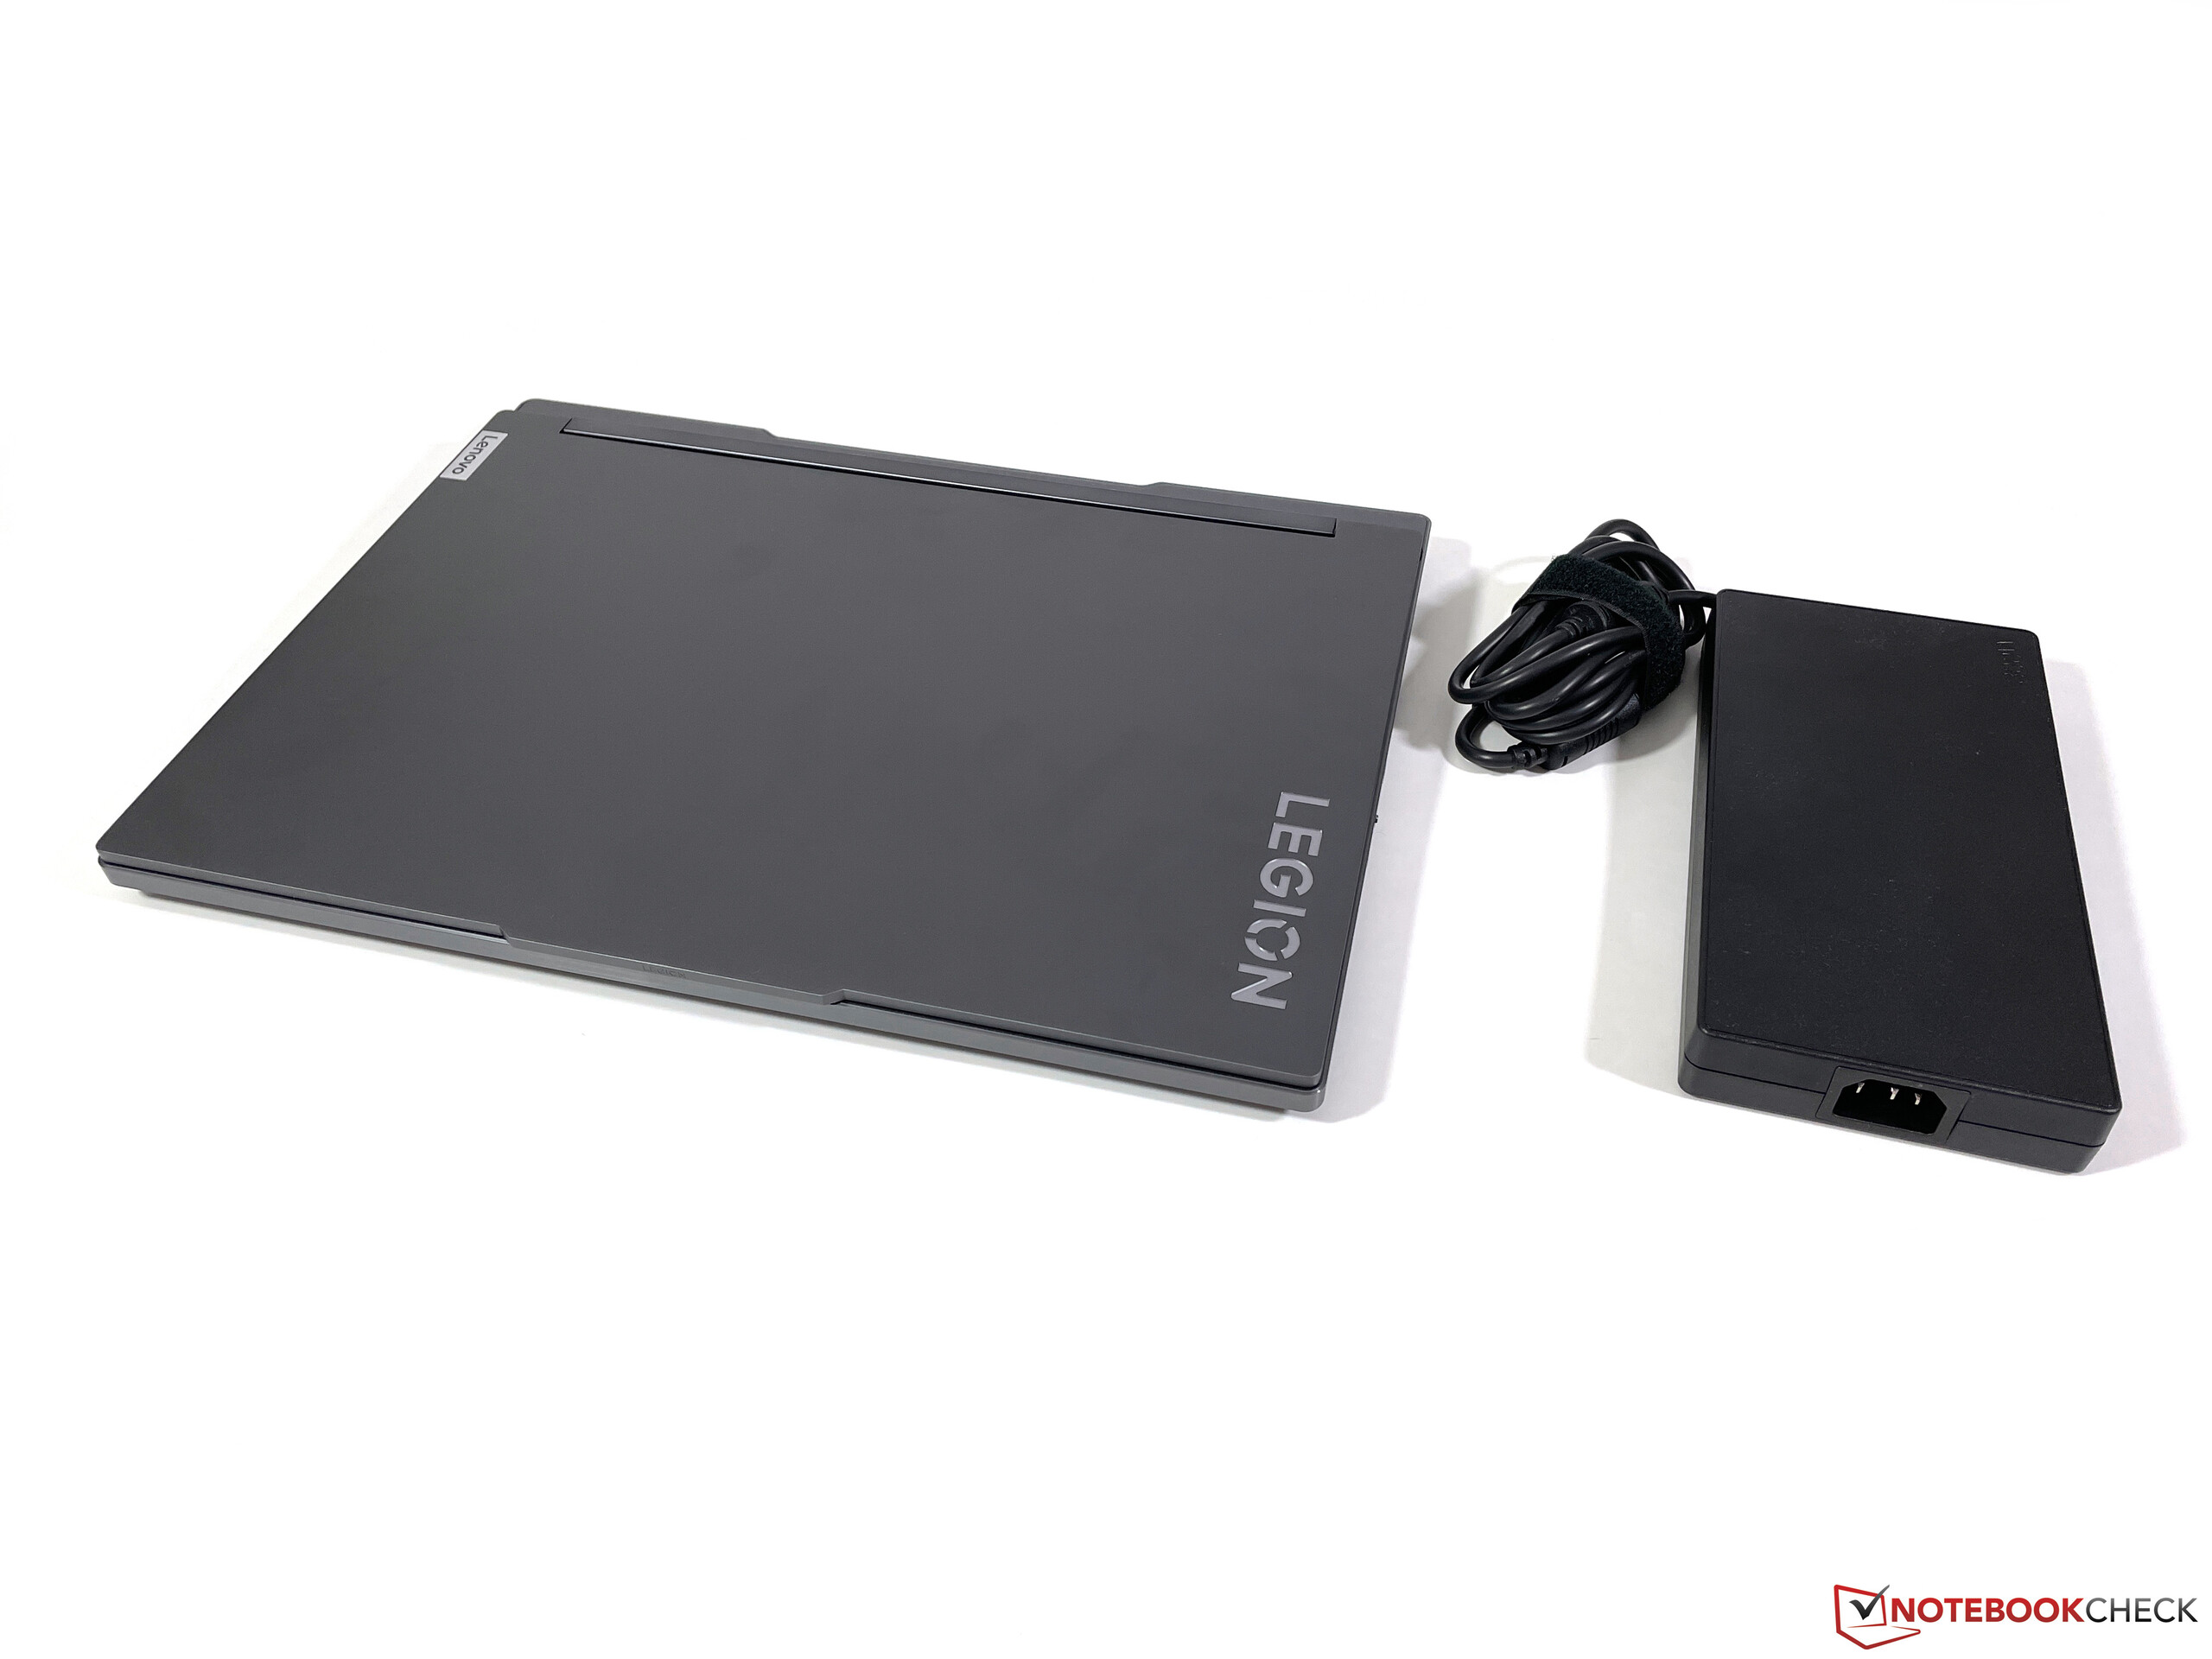
With its silver-gray aluminum chassis, the Legion 7 16 is visually rather discreet for such a powerful gaming laptop. We really like the restrained design and the stability is excellent. Neither the base unit nor the display lid can be dented or twisted, and creaking noises are completely absent. The screen's edges are very thin and the device looks very modern.
Although the screen hinge is slightly offset at the front, it allows for a maximum opening angle of 180 degrees. The display can also be easily opened with one hand and teetering is not an issue. Selective applications of pressure did not result in any image distortions.

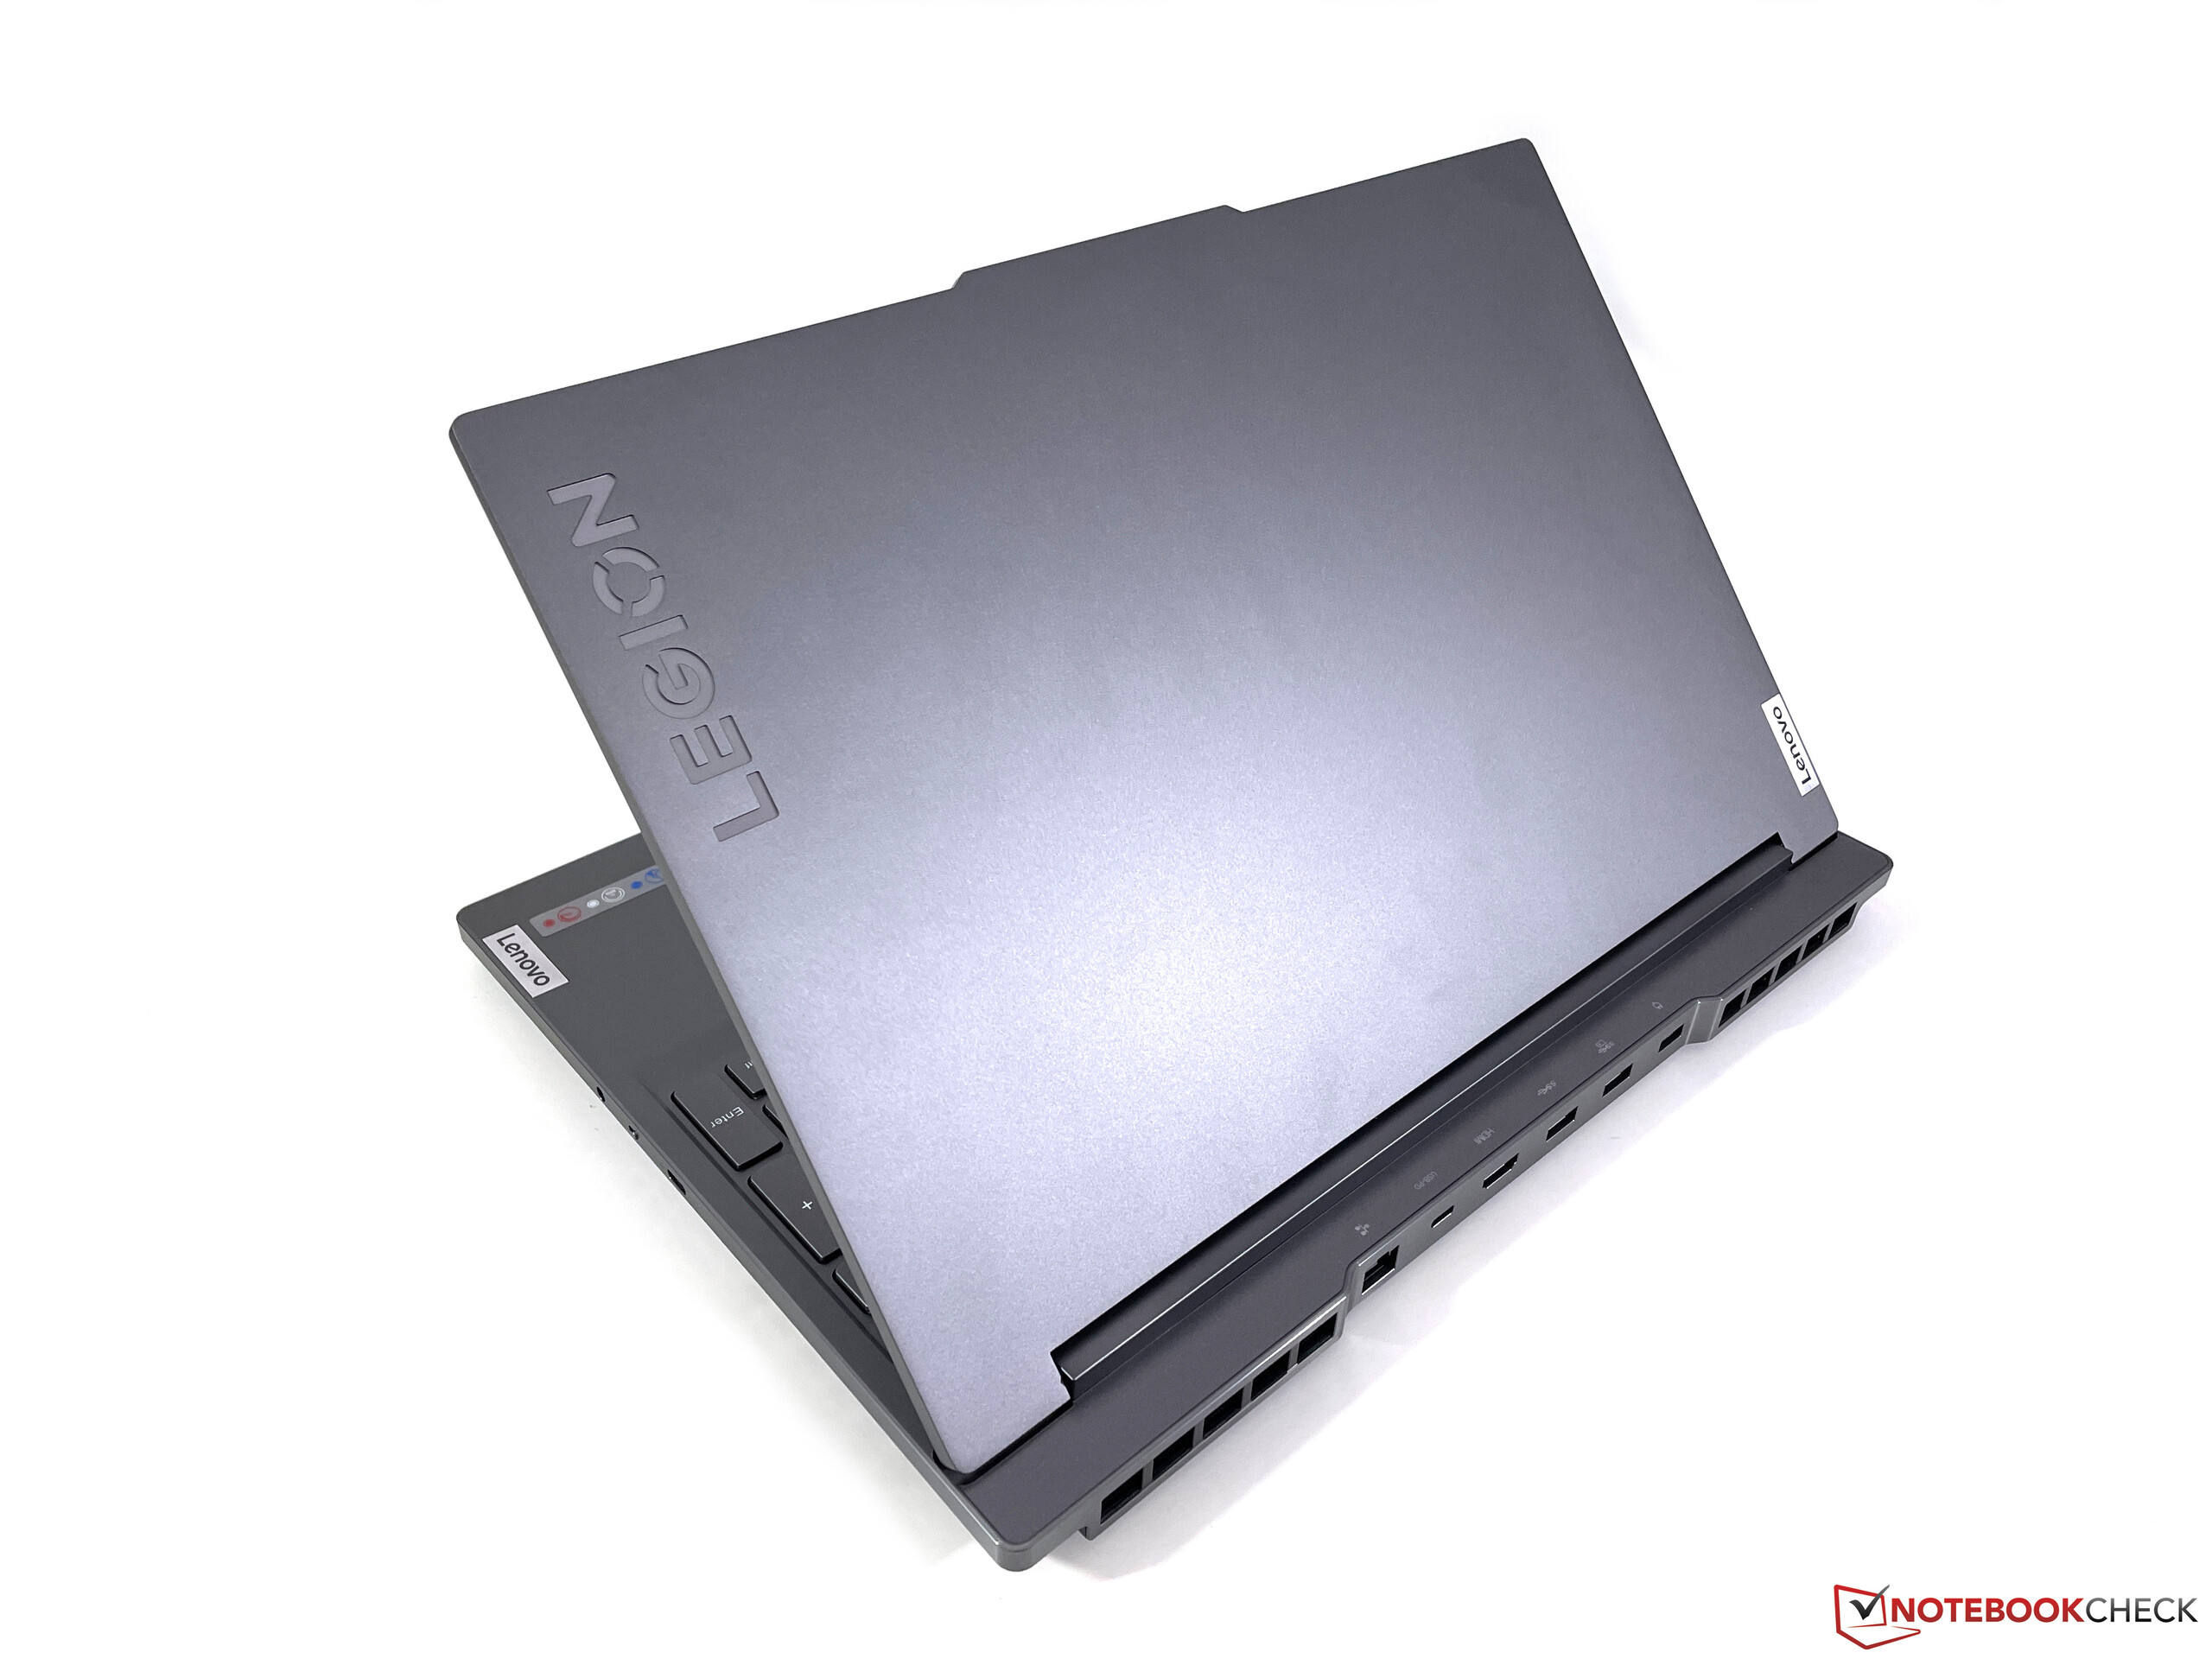
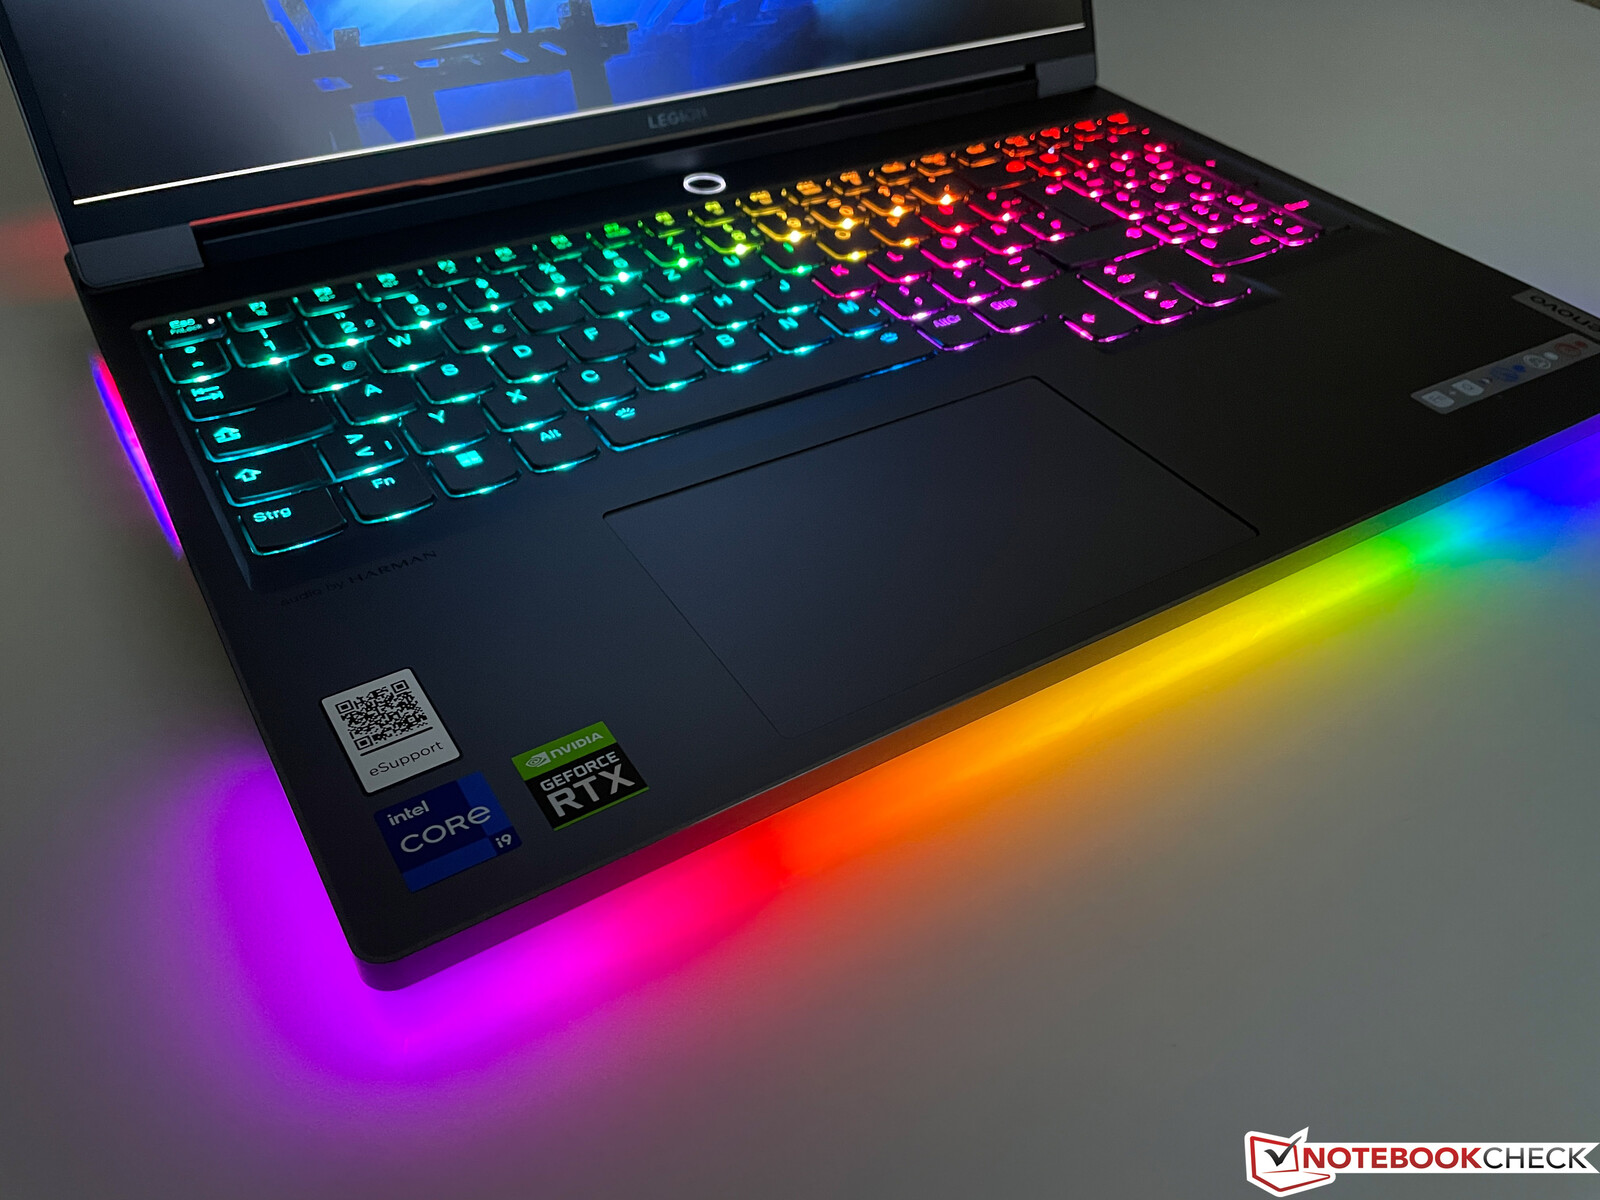
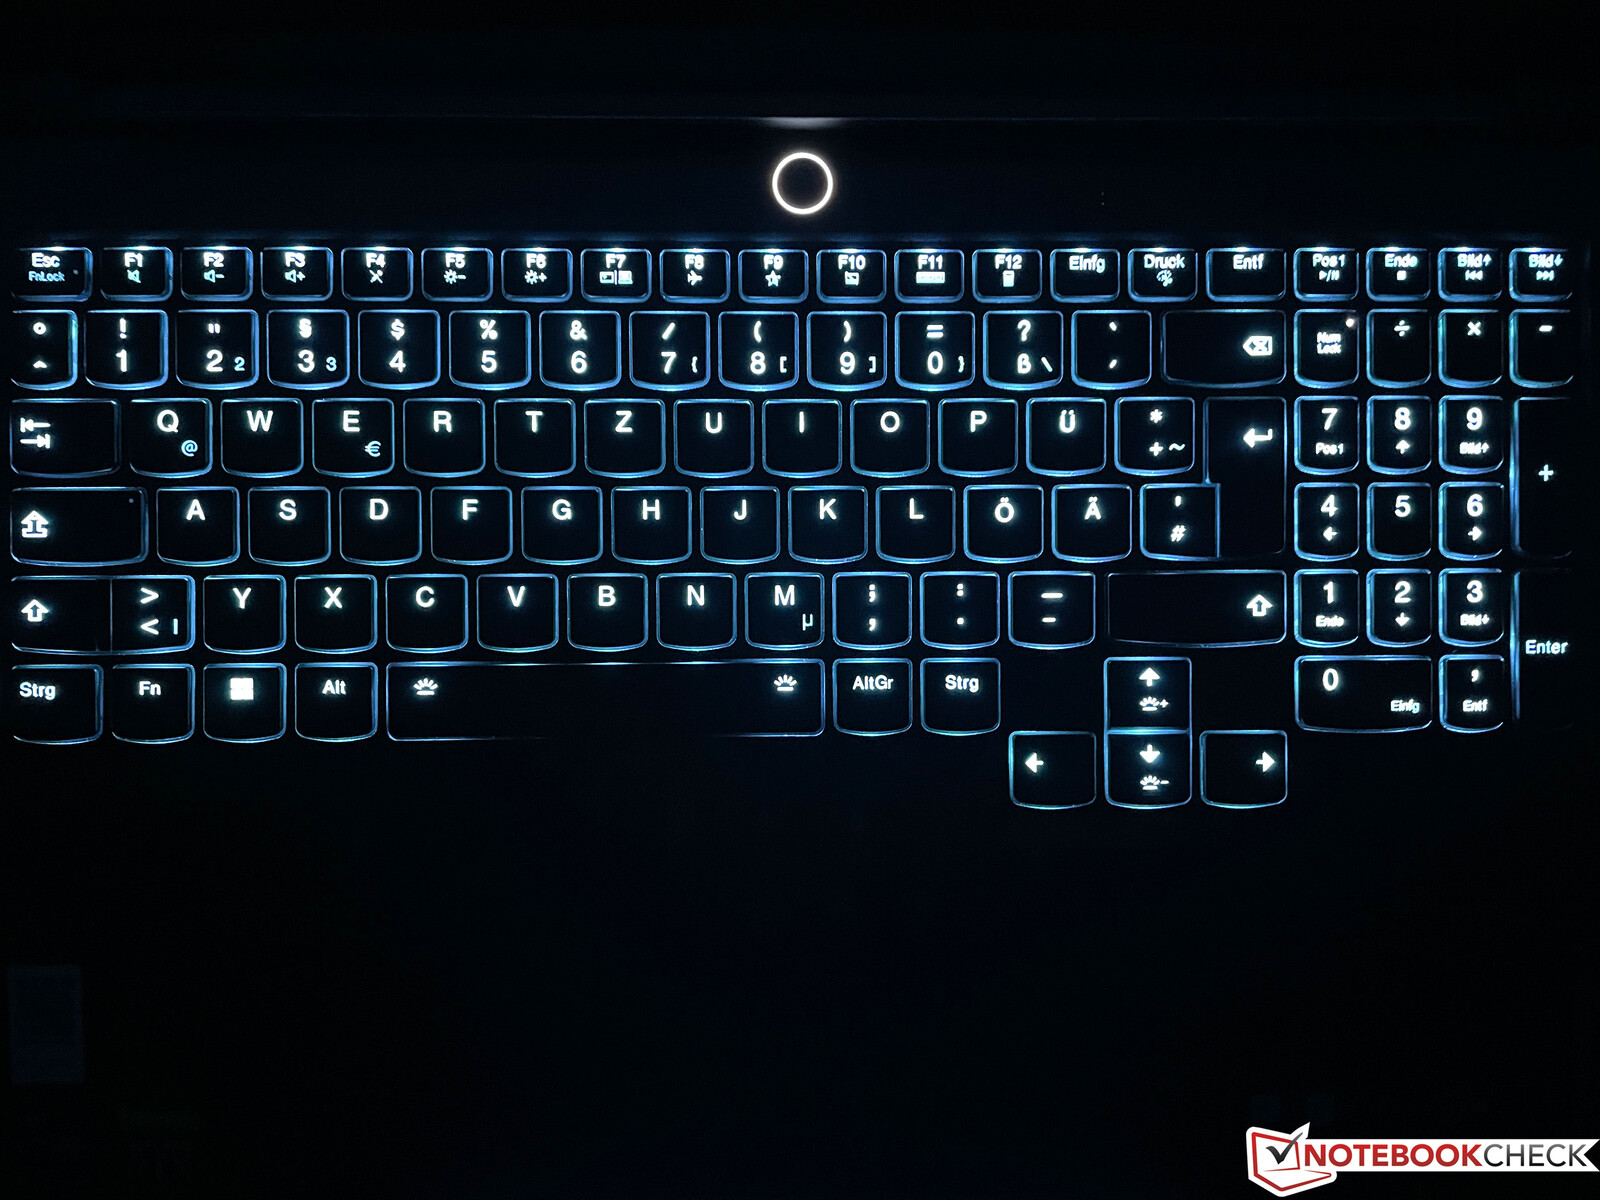
The discreet appearance quickly becomes a thing of the past as soon as the extensive case lighting comes on. In addition to a circumferential light bar in the front area of the base unit, light effects also come out of all fan grills and the Legion logo on the lid is also illuminated. A total of seven different profiles are available, but you can also adjust everything manually.
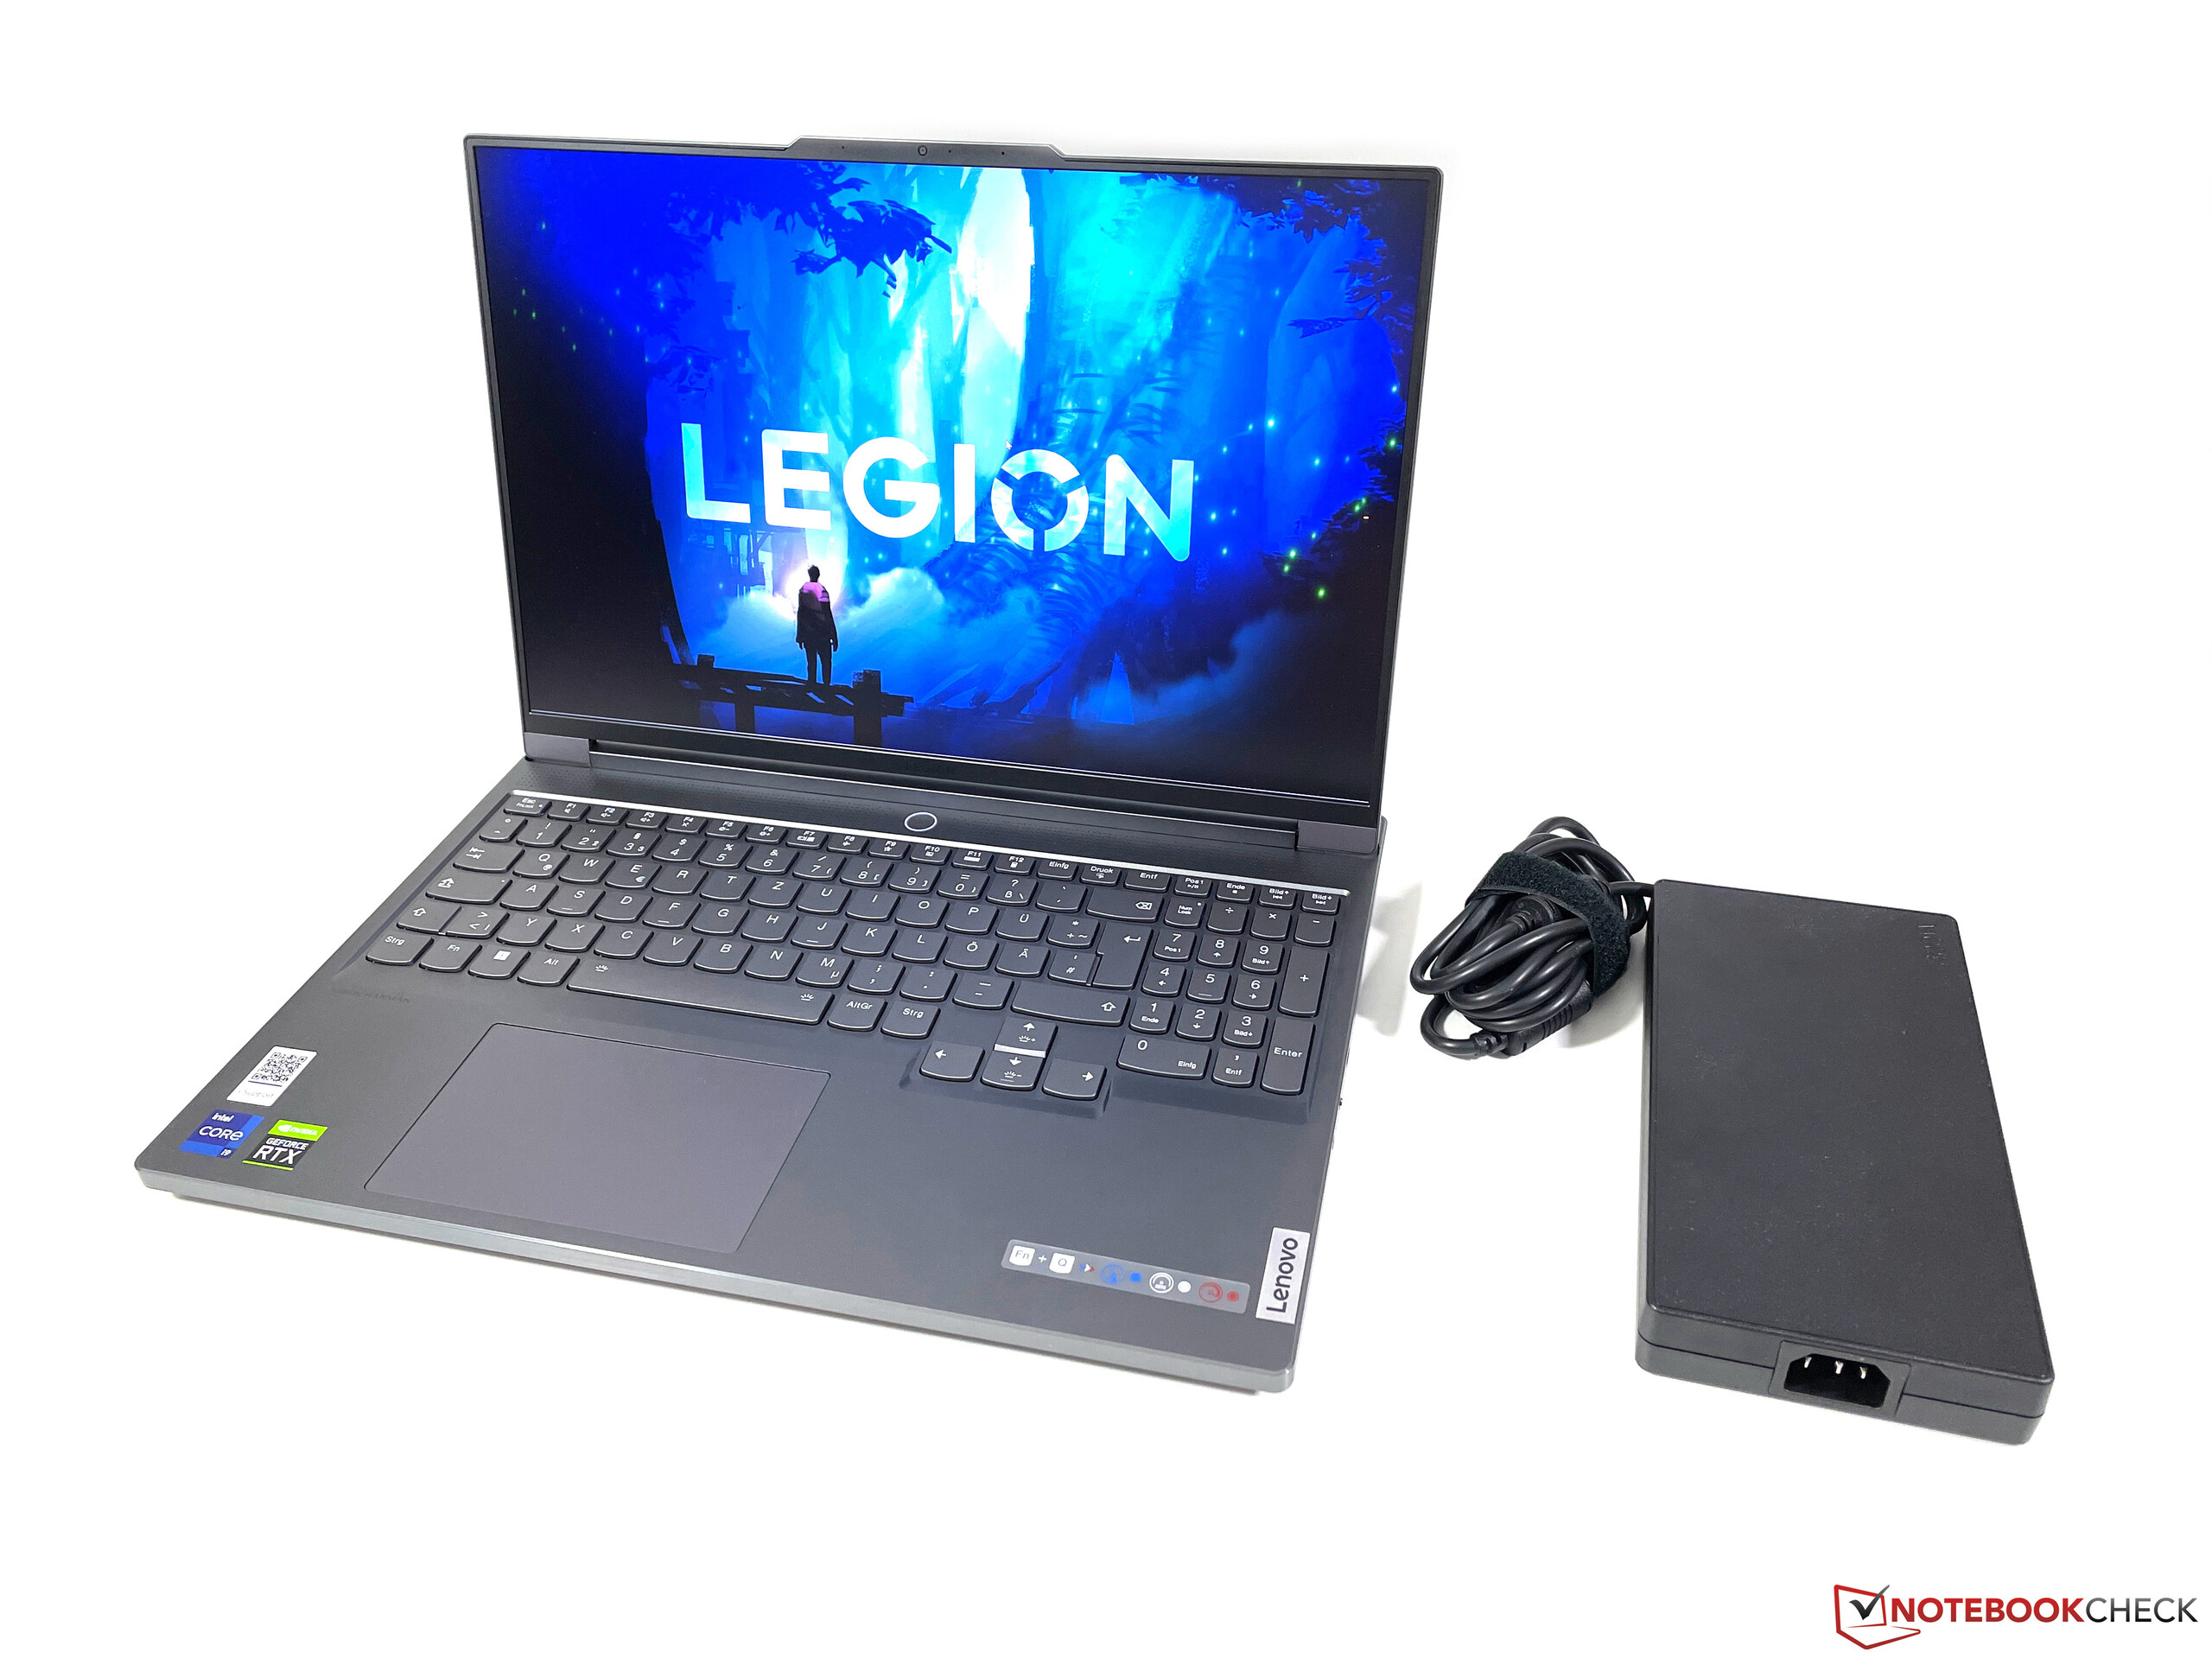
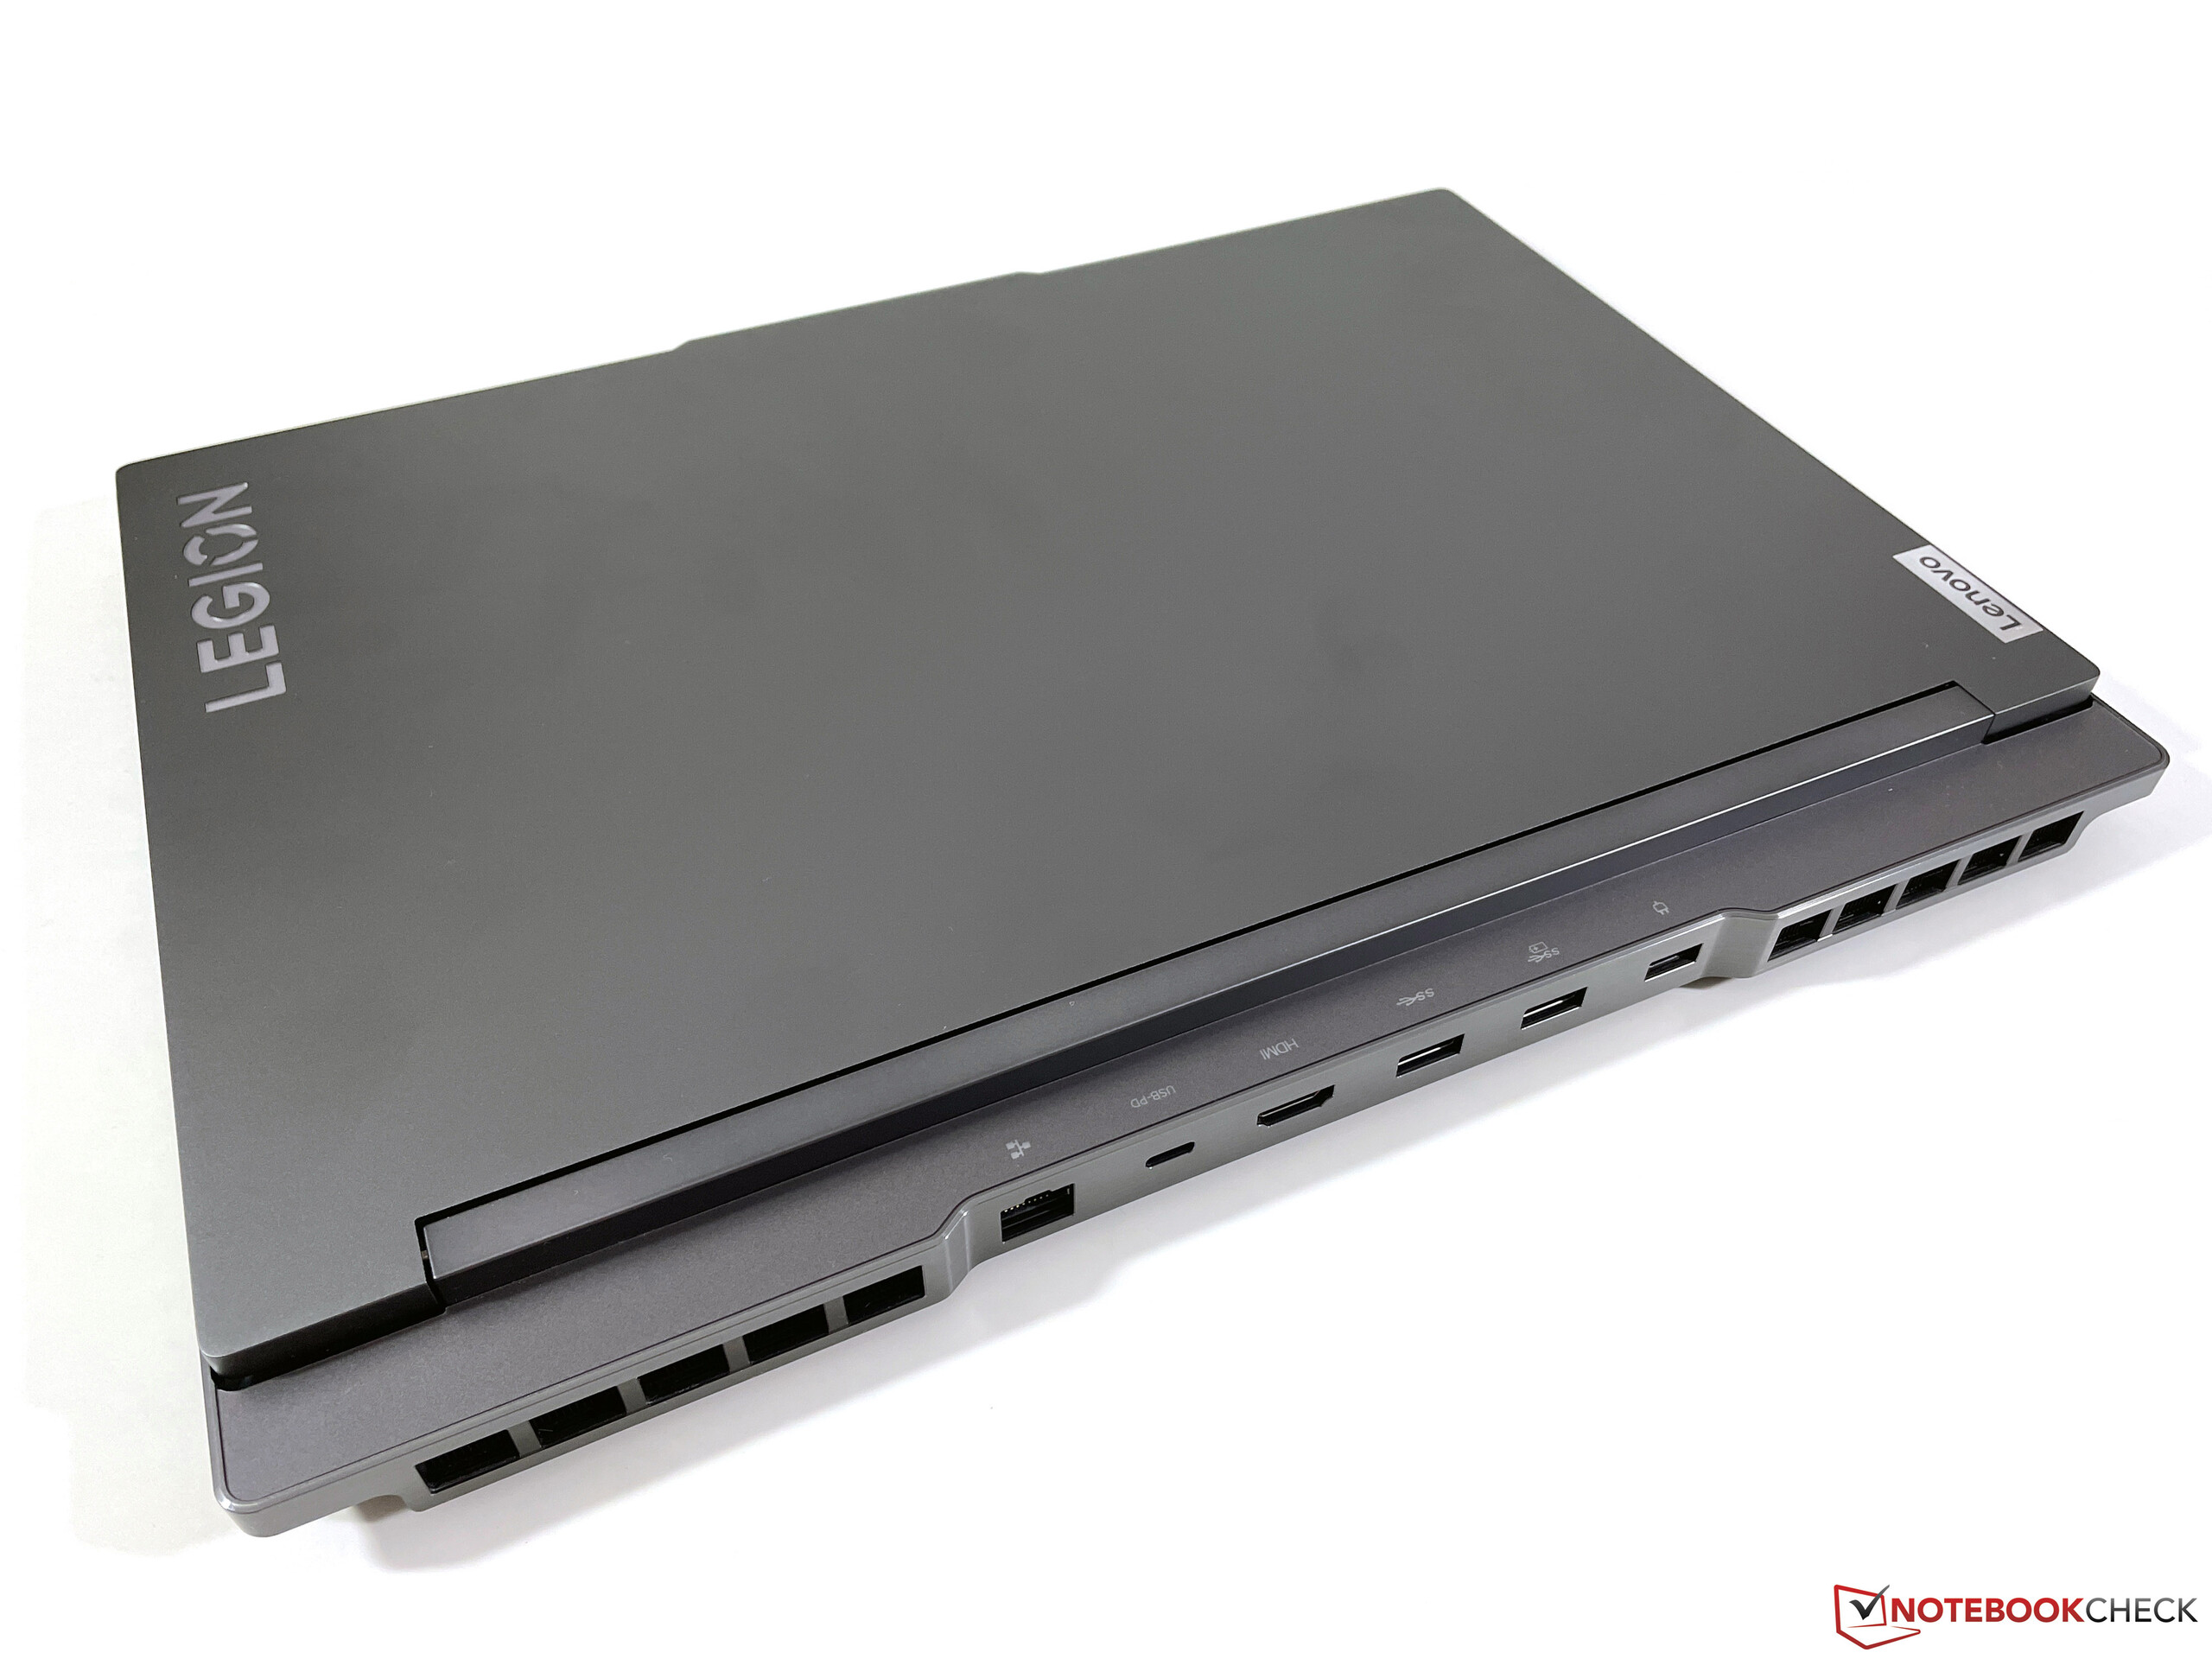
Together with the two 16-inch models from Asus, the Legion 7 16 is one of the most compact models in the comparison field. At 2.6 kg, it is not a lightweight in itself, but most competitors are a little heavier here as well. However, you shouldn't forget the bulky 300-watt power adapter, which is heavier than some ultrabooks at more than one kilogram.
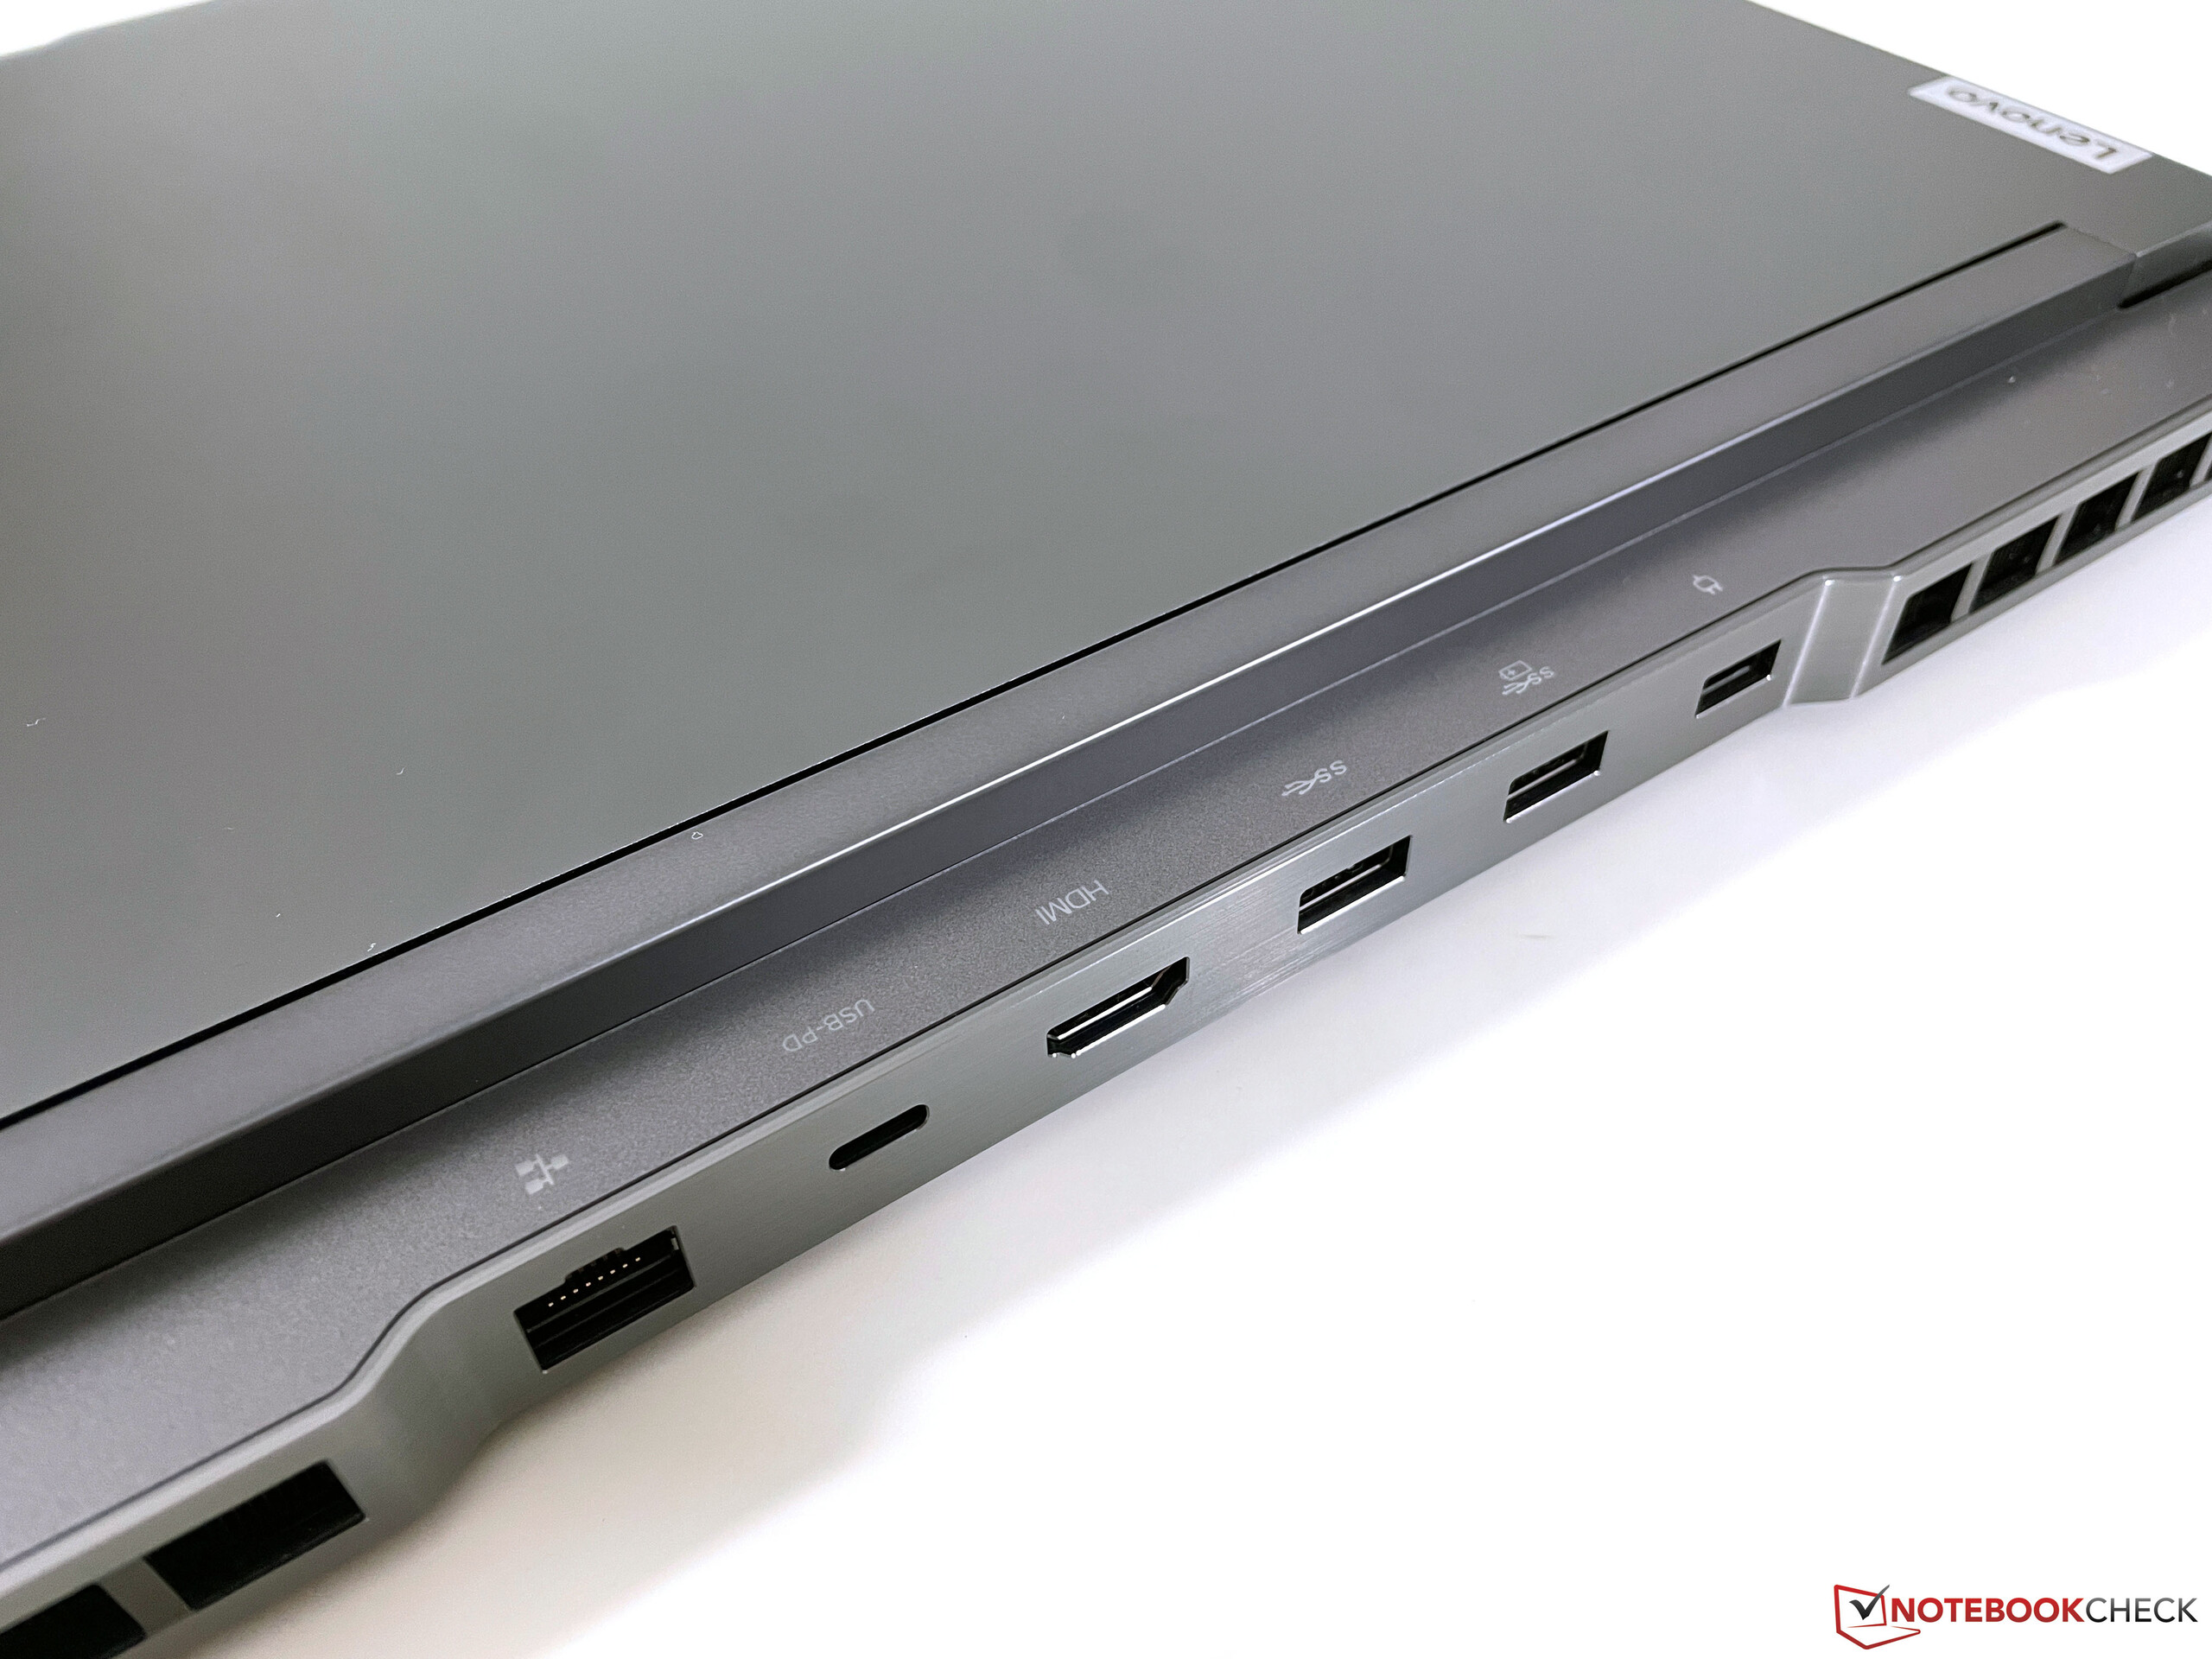
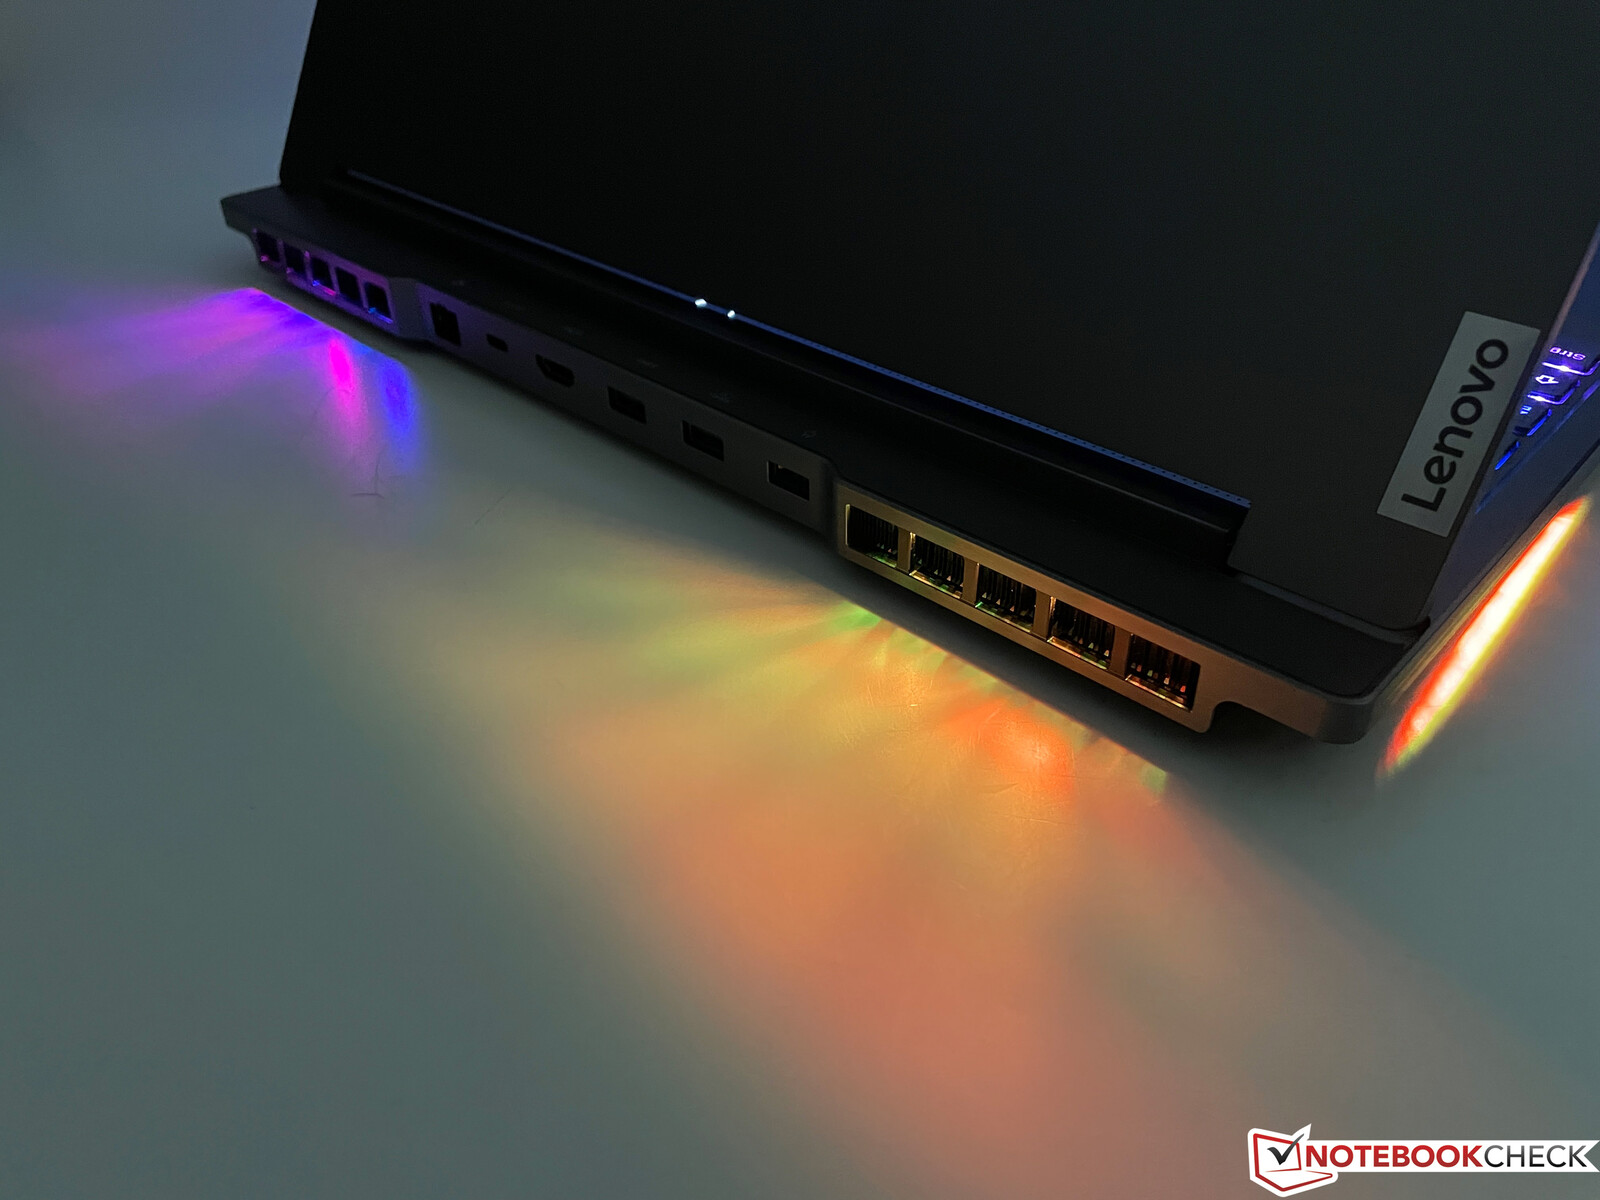
Equipment - Gamer with 2.5 GBit/s Ethernet and Thunderbolt 4
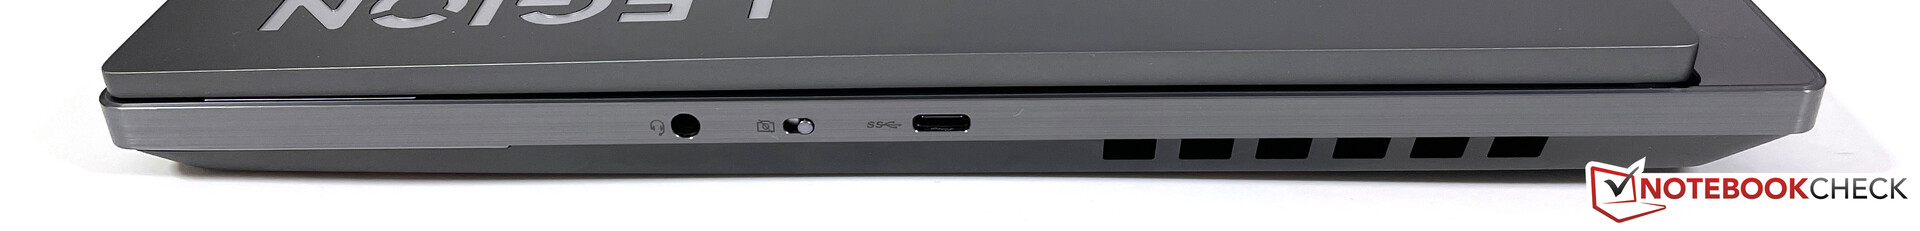
The Legion offers plenty of up-to-date interfaces, most of which are located on the back. On the base unit's upper side are helpful labels that make plugging in cables much easier. We would have liked a standard USB-A port on the sides (e.g. for USB sticks) as well as a card reader, for which there is actually plenty of space.


Communication
In addition to the fast 2.5 Gbit/s Ethernet port, the Legion 7 16 also offers a very modern WLAN module (Wi-Fi 6E) which includes support for modern 6 GHz networks as well as Bluetooth 5.2. In our standardized WLAN test with our Asus reference router, the Killer AX1675i achieves very high and stable transfer rates, and we were able to connect to the 6 GHz network without any problems.
Webcam
Lenovo installs a 1080p webcam in the upper display frame, which can be deactivated with a switch on the right side of the case. Image quality is slightly better than the 720p modules. Overall, the webcam serves its purpose. There is no IR sensor for facial recognition via Windows Hello.


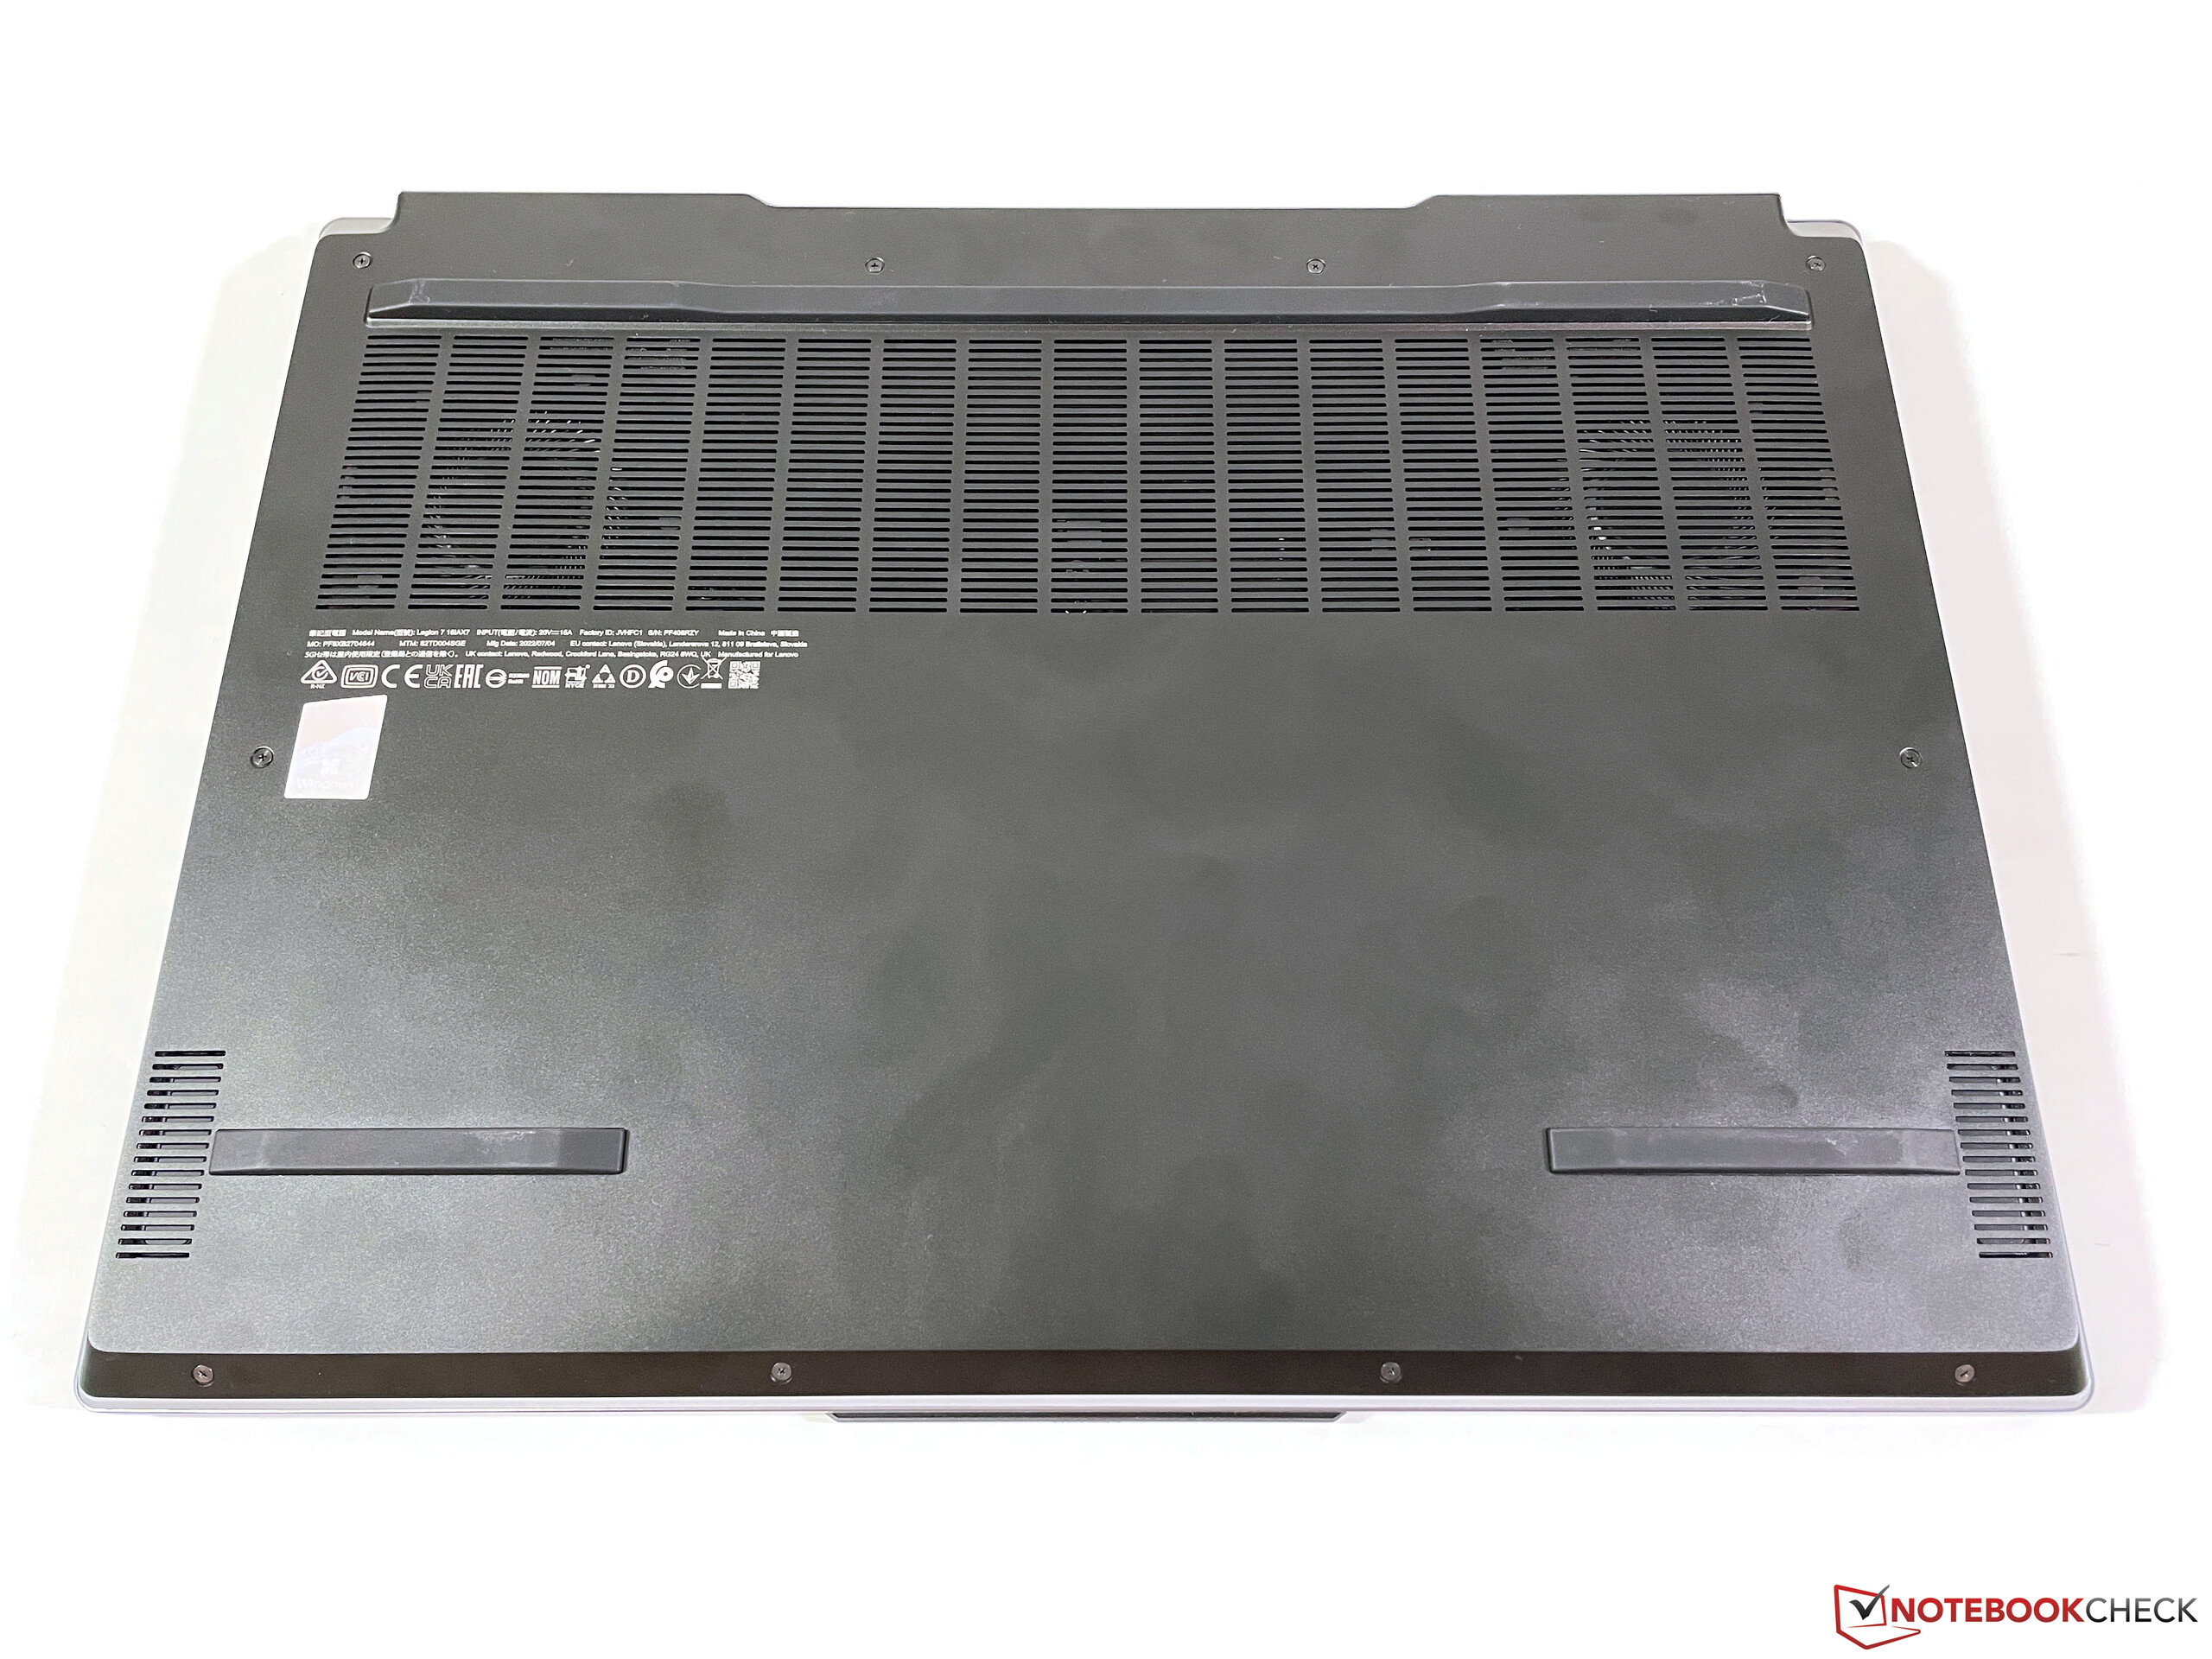
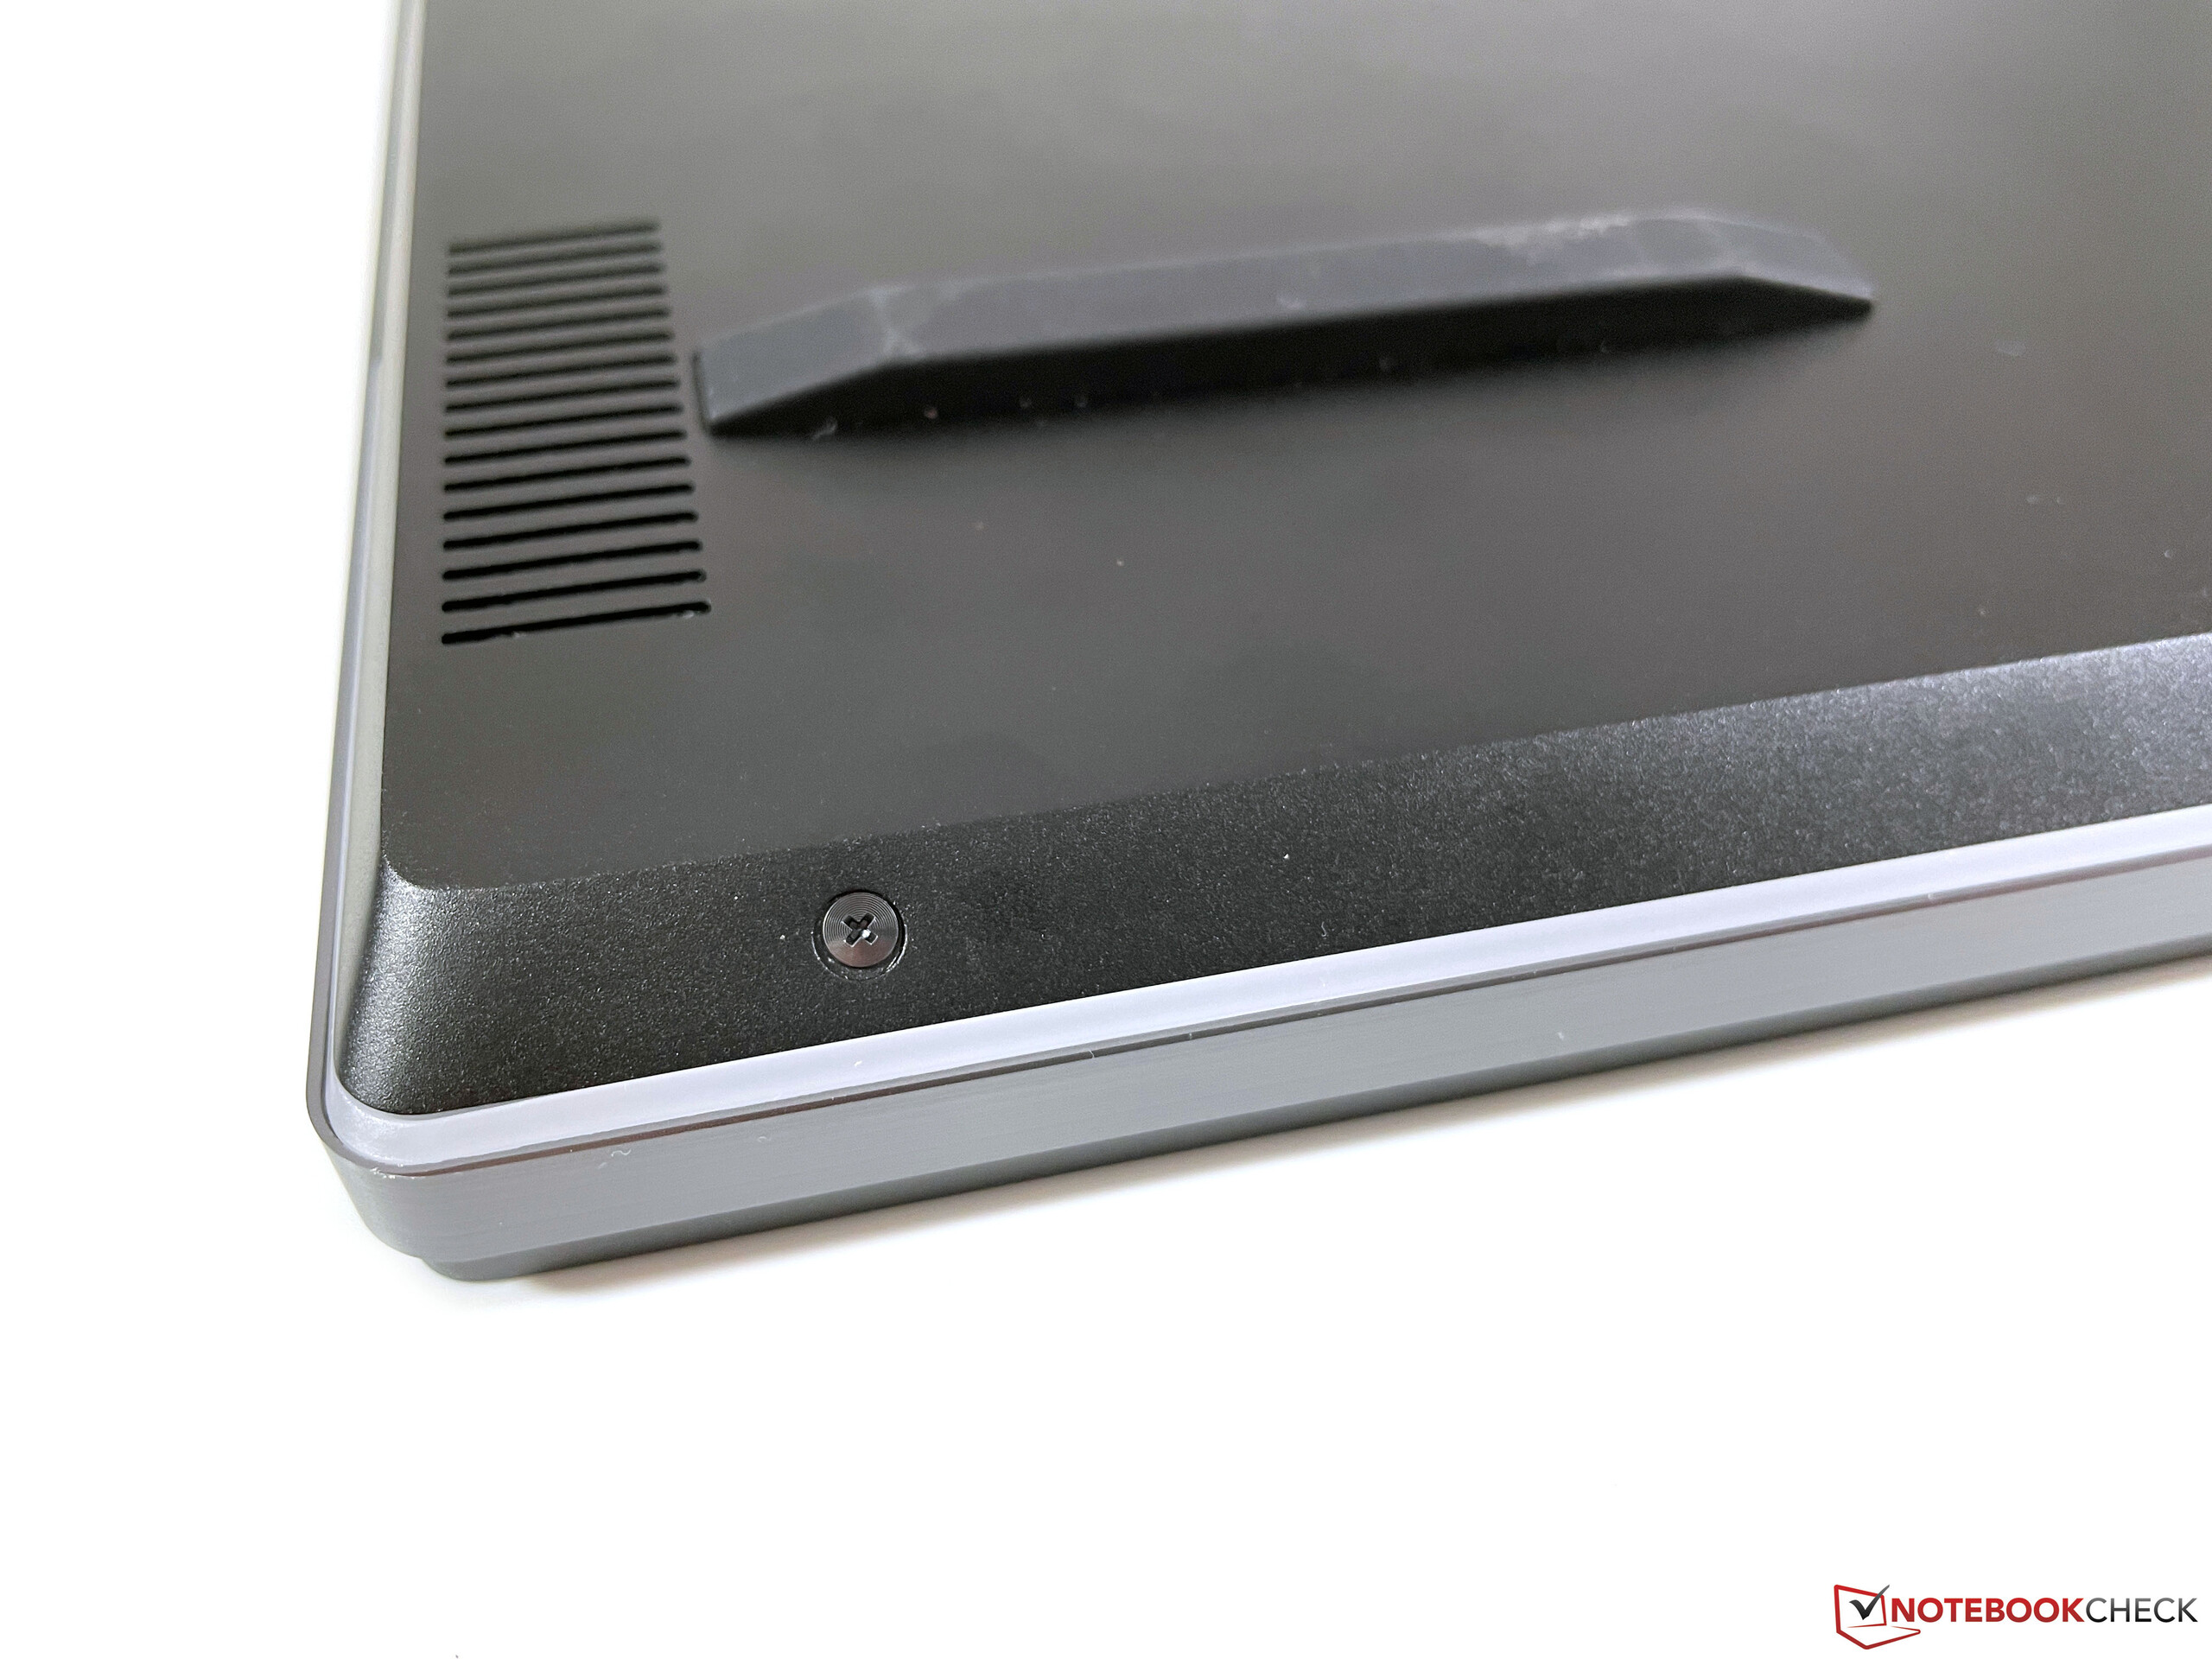
Maintenance
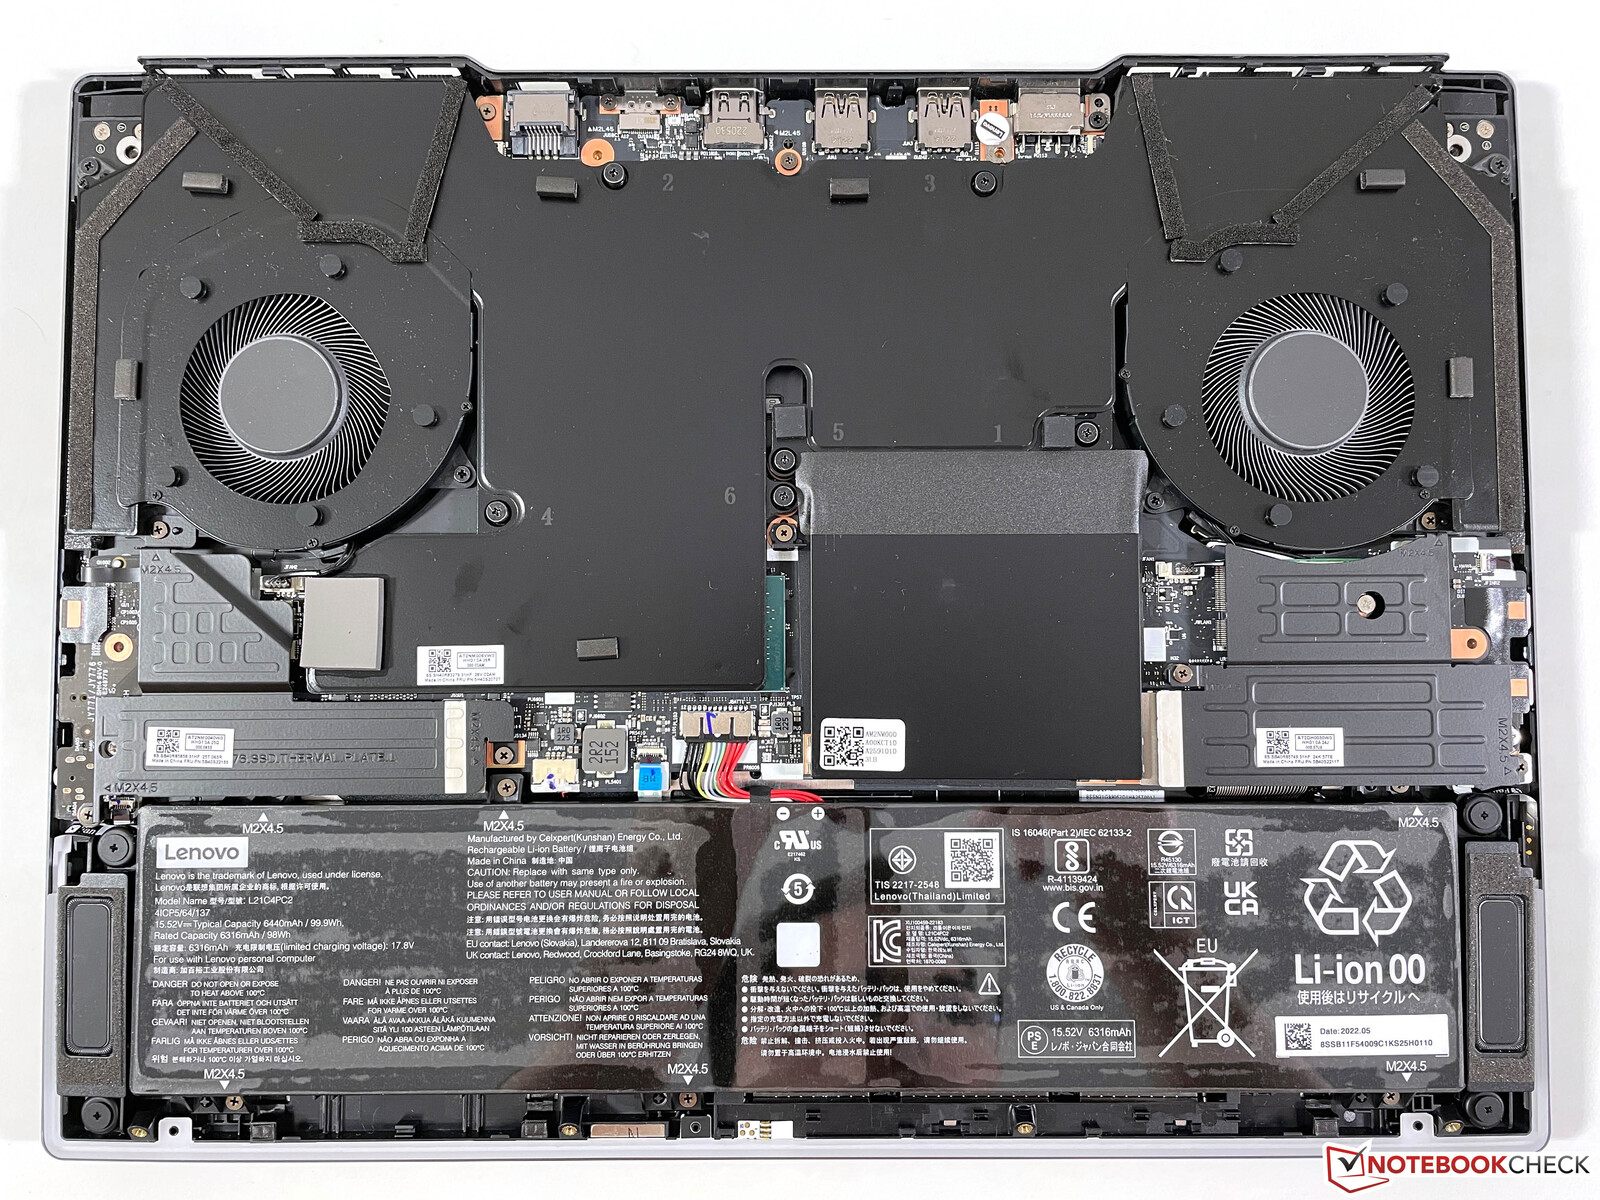
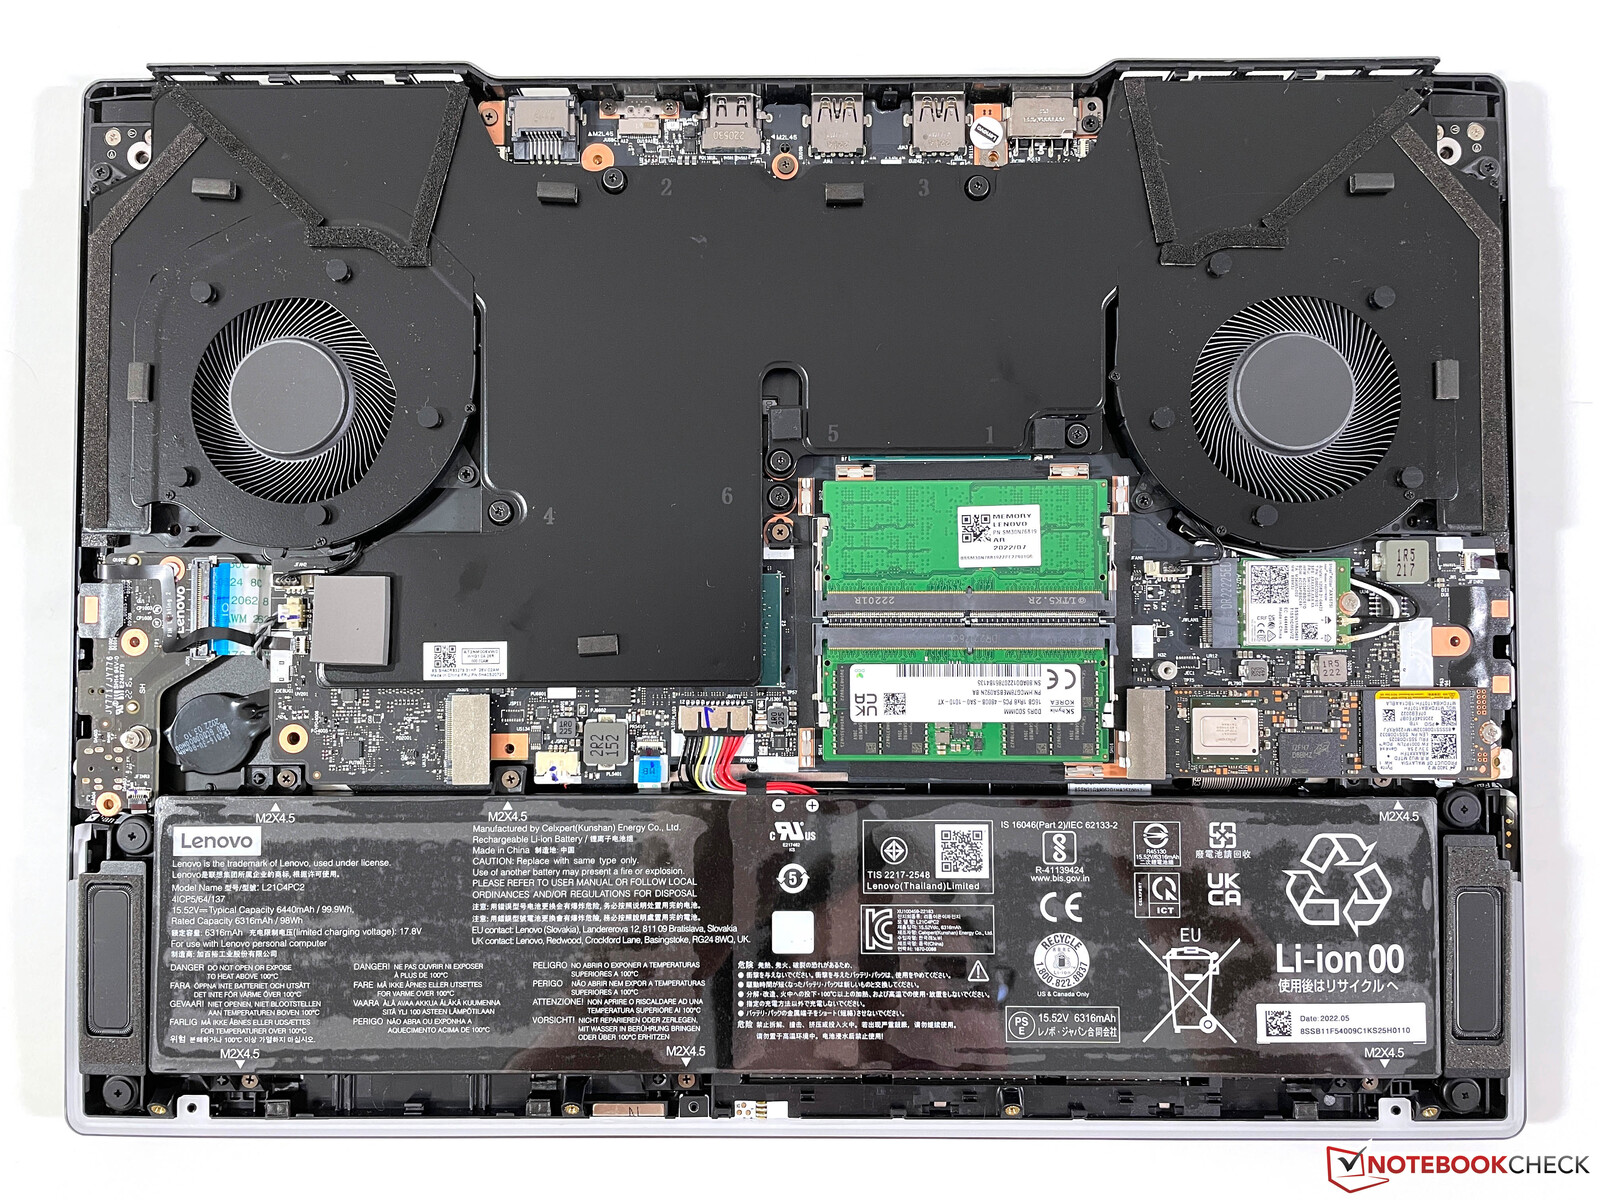
The baseplate is fastened with six Phillips screws and still remains very tight after loosening the screws, which is why it is best to use a suction cup to loosen the baseplate. Inside, the fans can be cleaned and you have access to the two RAM slots, the WLAN module and the two M.2-2280 SSD slots. However, additional covers have to be removed for this, some of which are also screwed.
Input Devices - Lenovo installs single key illumination
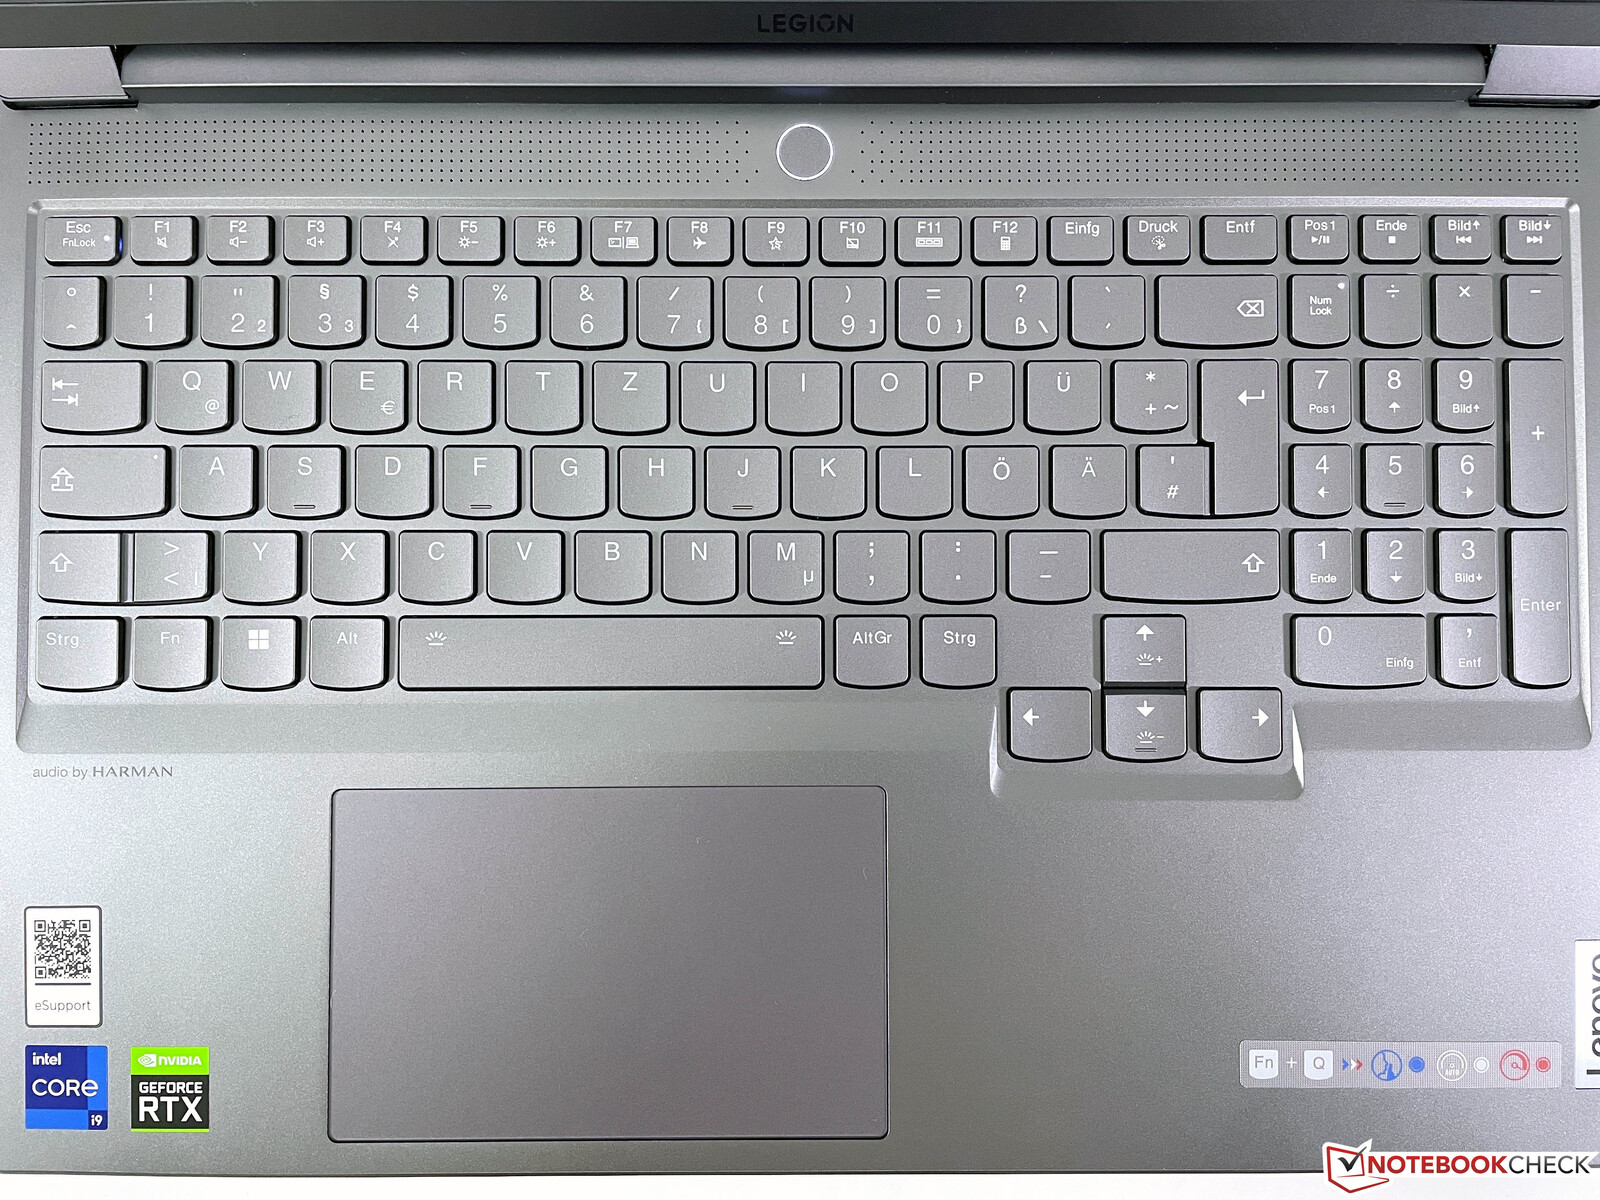
The keyboard with the dedicated numeric keypad offers decent quality overall with sufficient key travel, but there is still room for improvement. The keys sometimes seem a little rickety, while the space bar and Enter key are relatively loud. Other gaming laptops are slightly better here. There is no criticism for the keyboard illumination, which can be configured individually for each key and you can let your creativity run wild here.
The large ClickPad (12 x 7.5 cm) is slightly offset to the left in the base unit and the normal pointer control works perfectly. The noise is only quite loud when clicking the lower area. Most users will use an external mouse for gaming anyway.
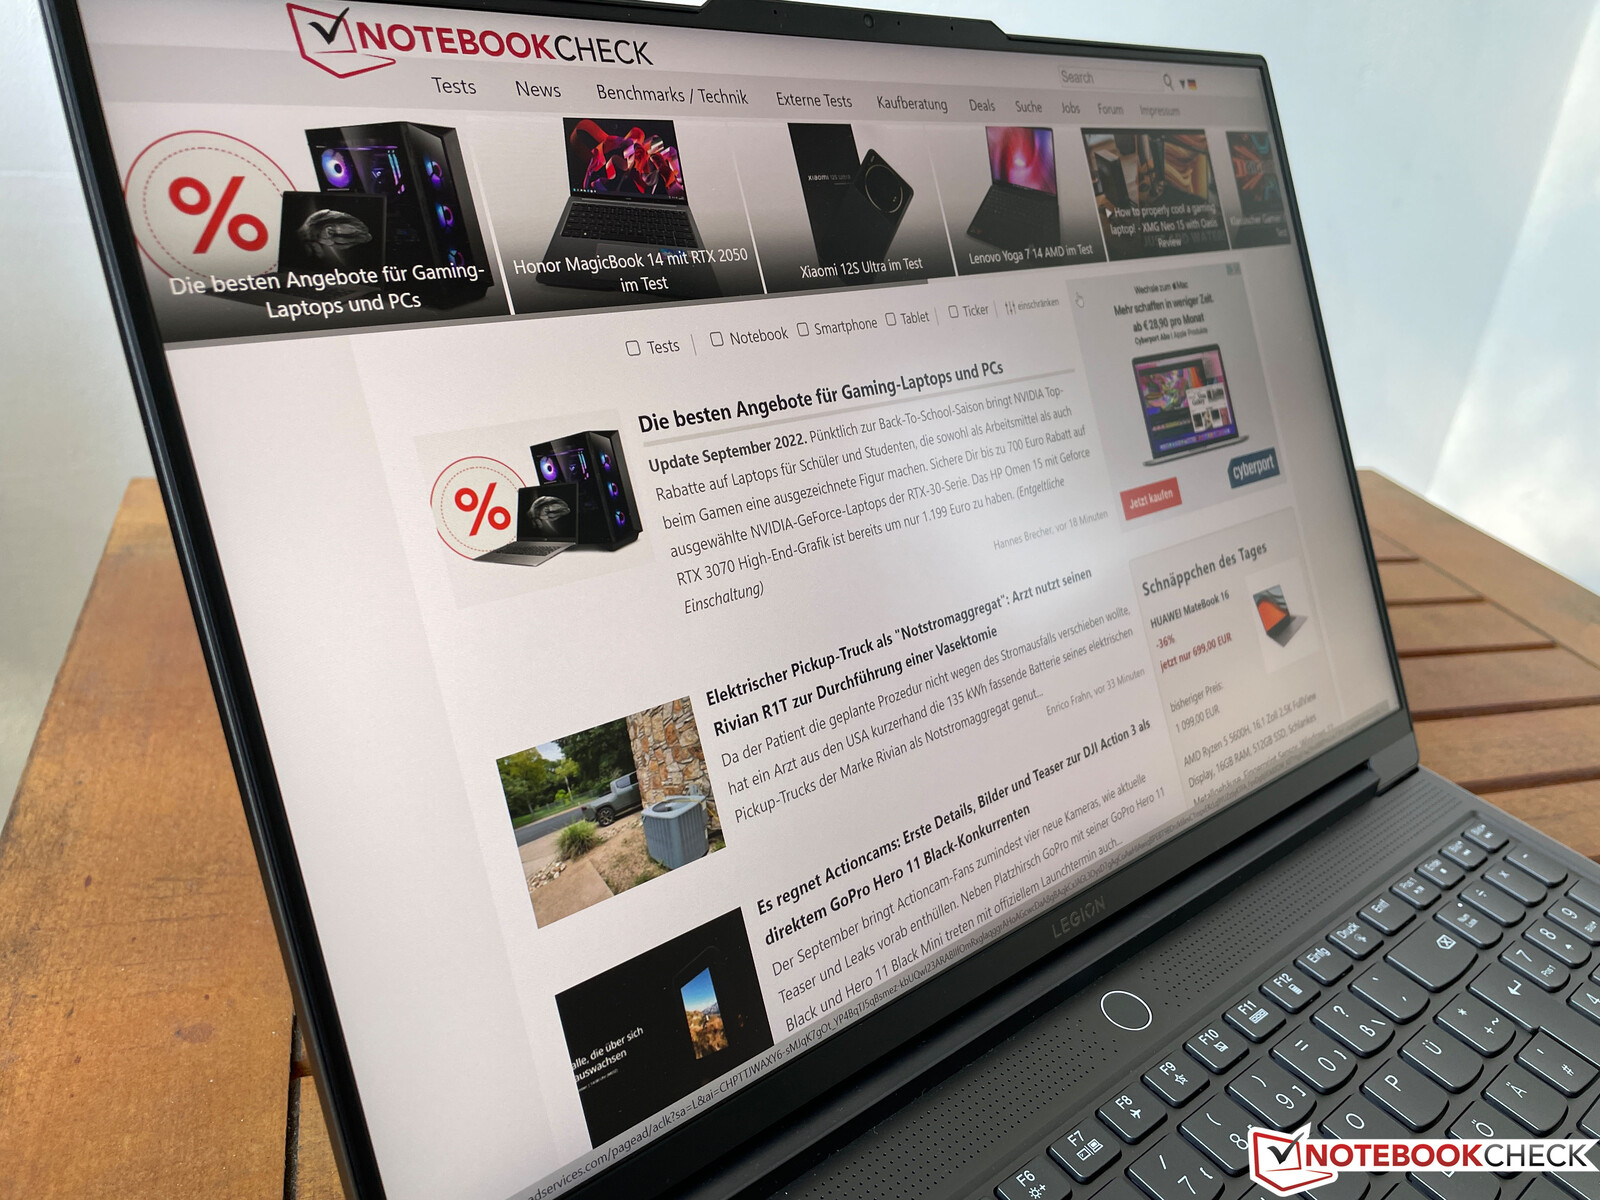
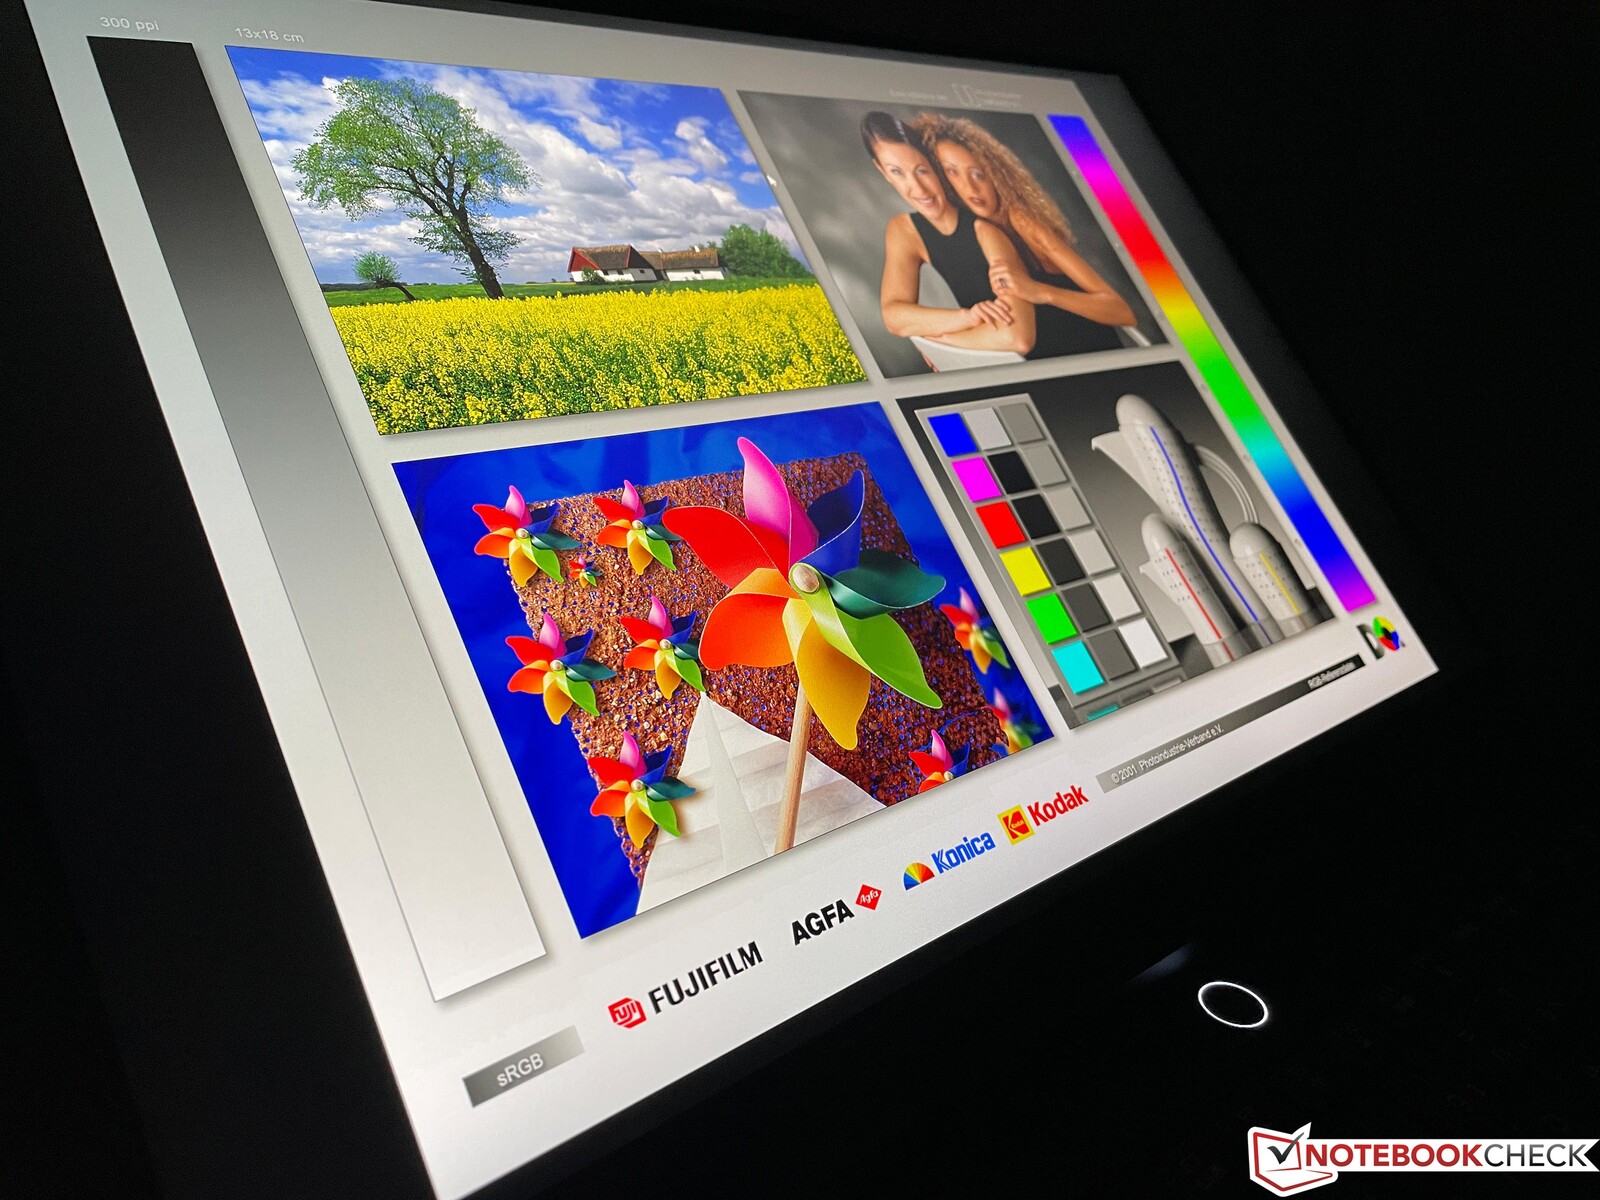
Display - Lenovo installs a fast 165 Hz panel

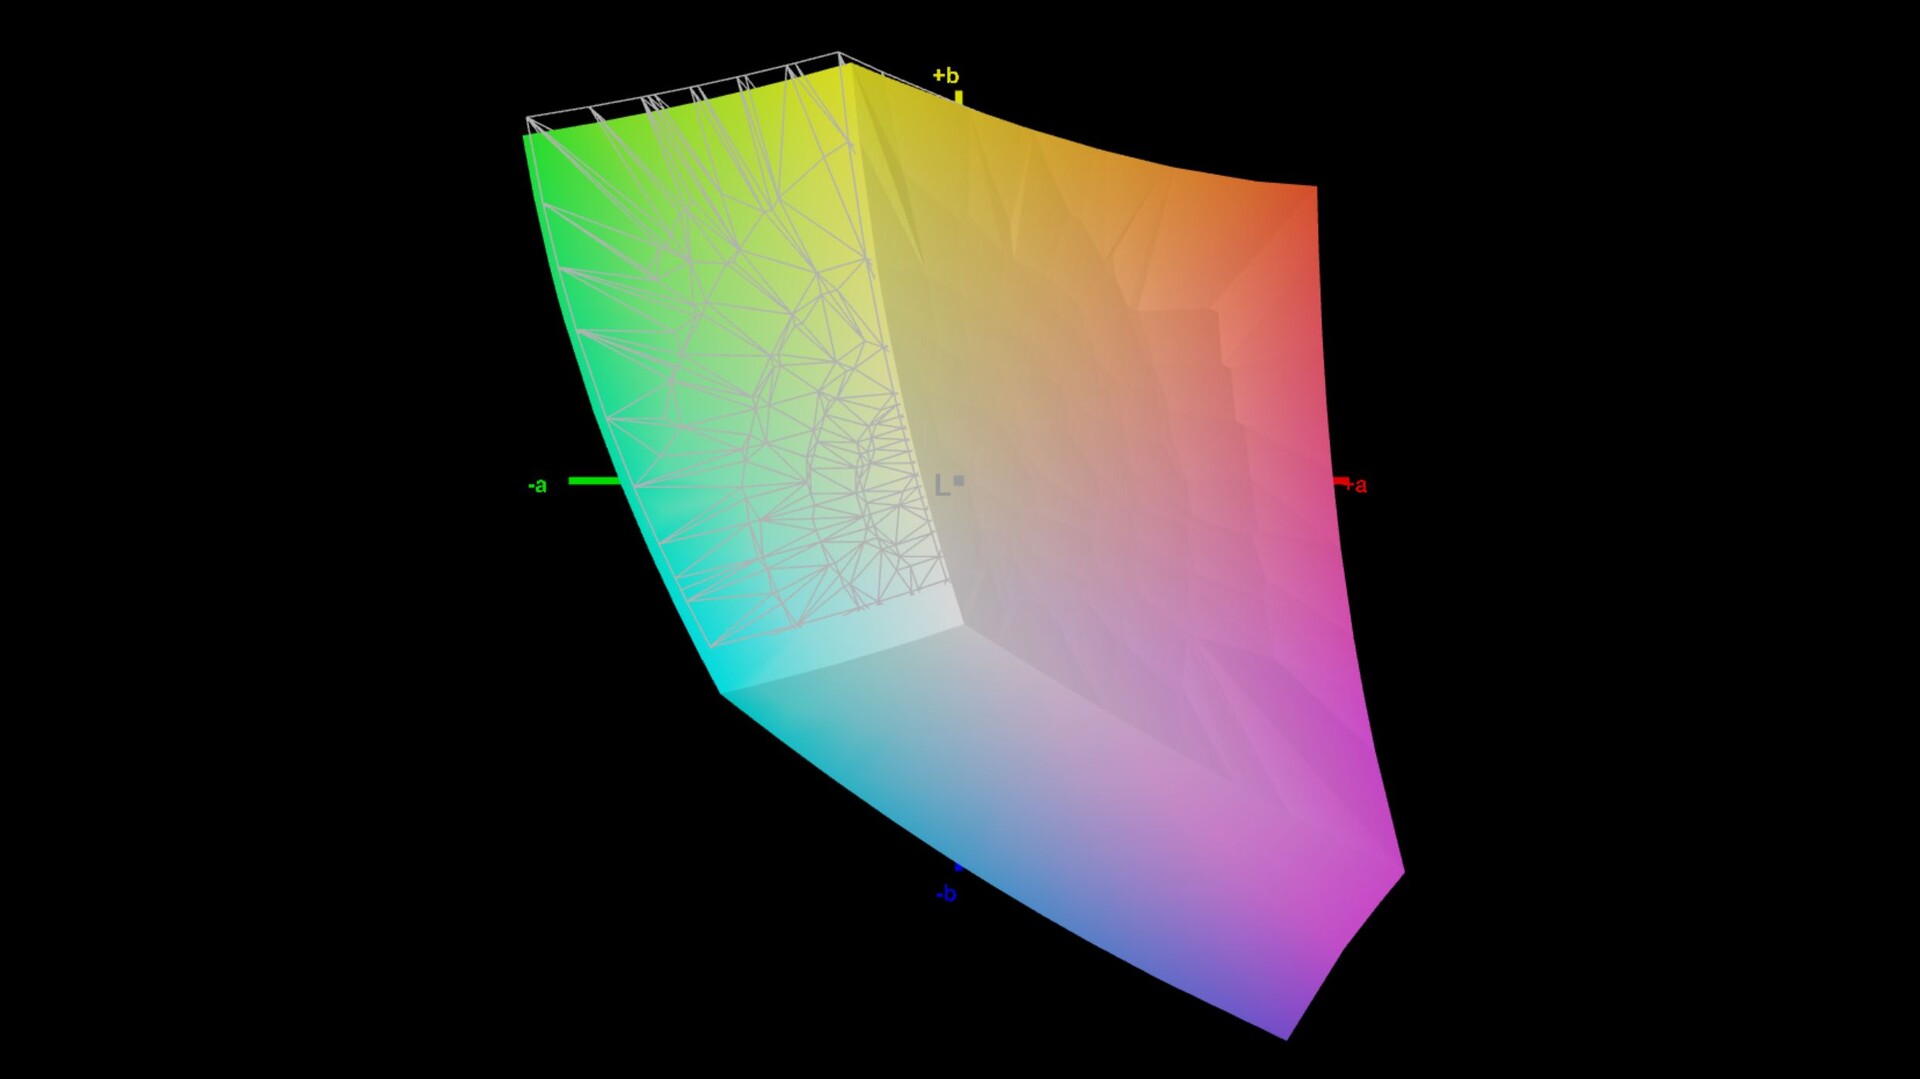
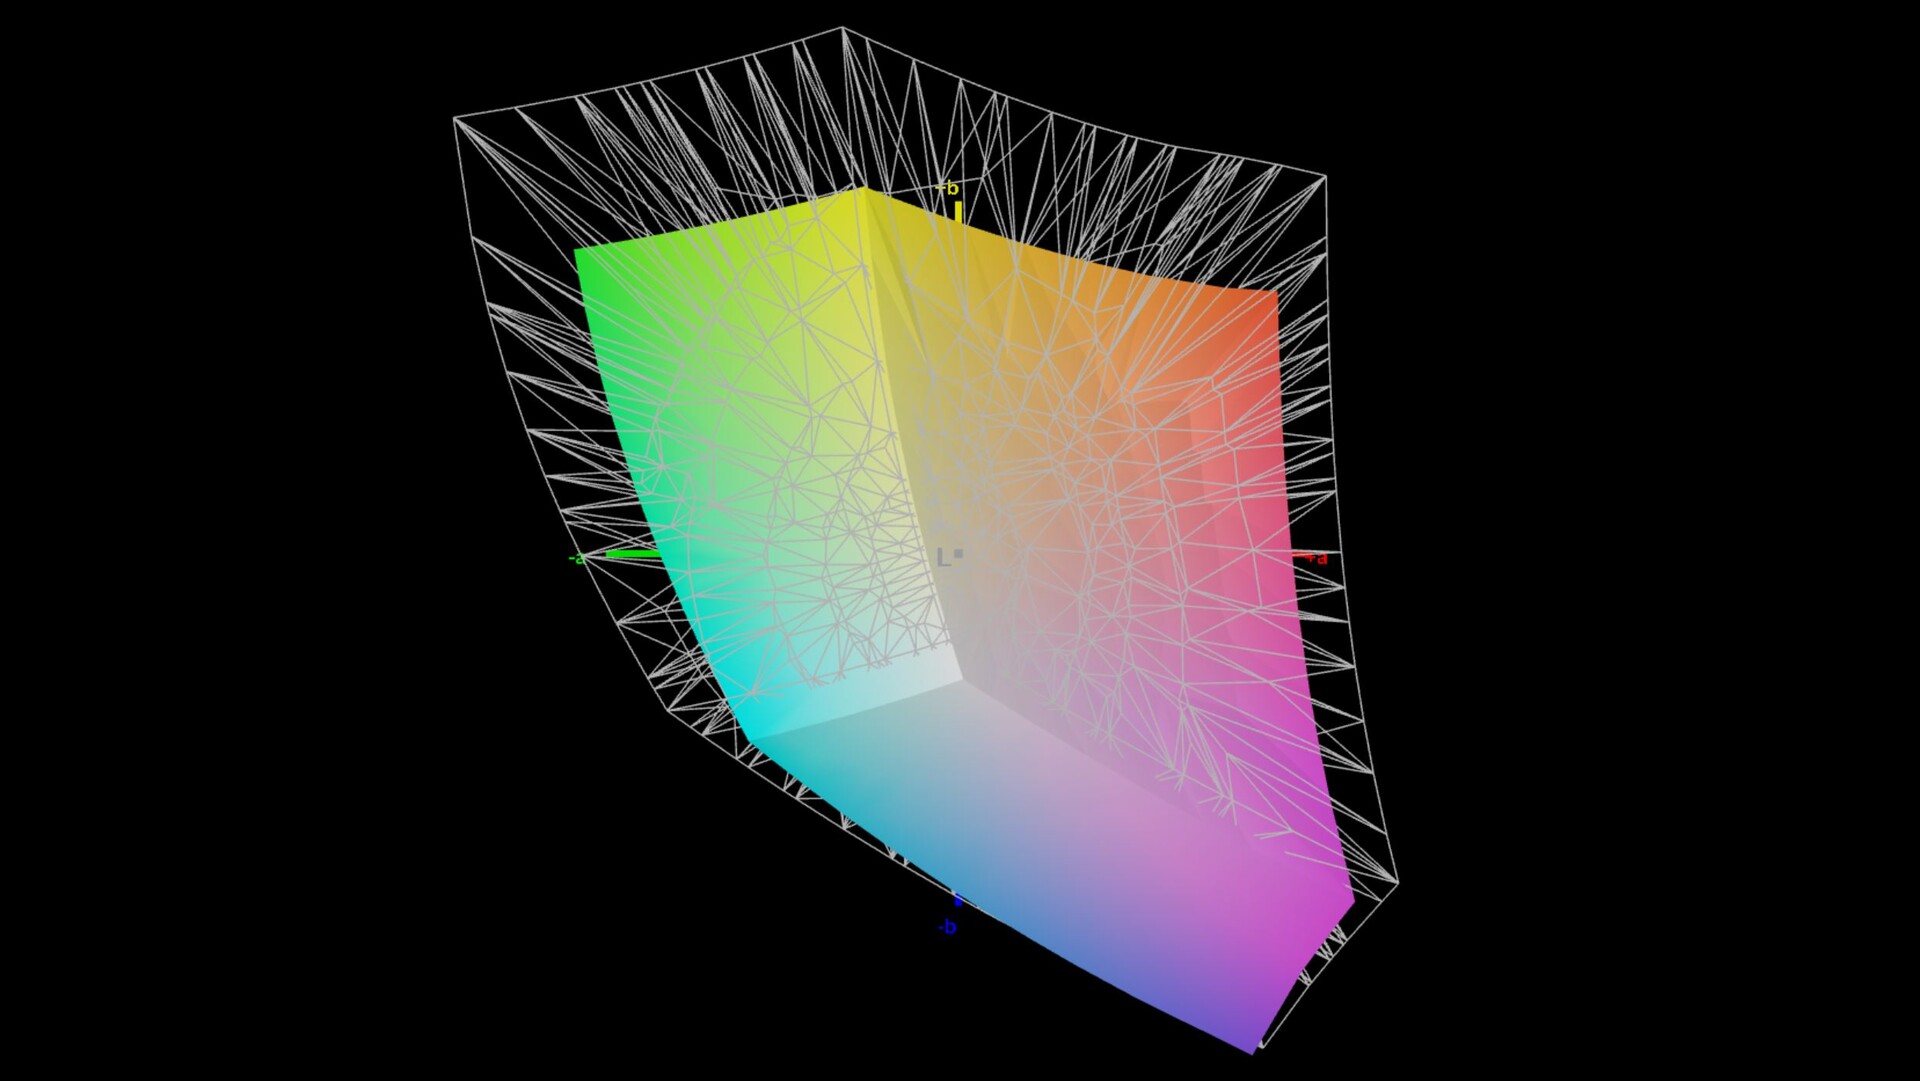
Lenovo installs a 16-inch IPS display with a resolution of 2560x1600 and a matte surface, which offers very good subjective picture quality. Movements are very smooth thanks to the high refresh rate, all content is displayed very sharply and even bright surfaces do not look grainy at all. The panel also offers very fast response times and we did not detect any PWM flickering. HDR content and G-Sync are also supported.
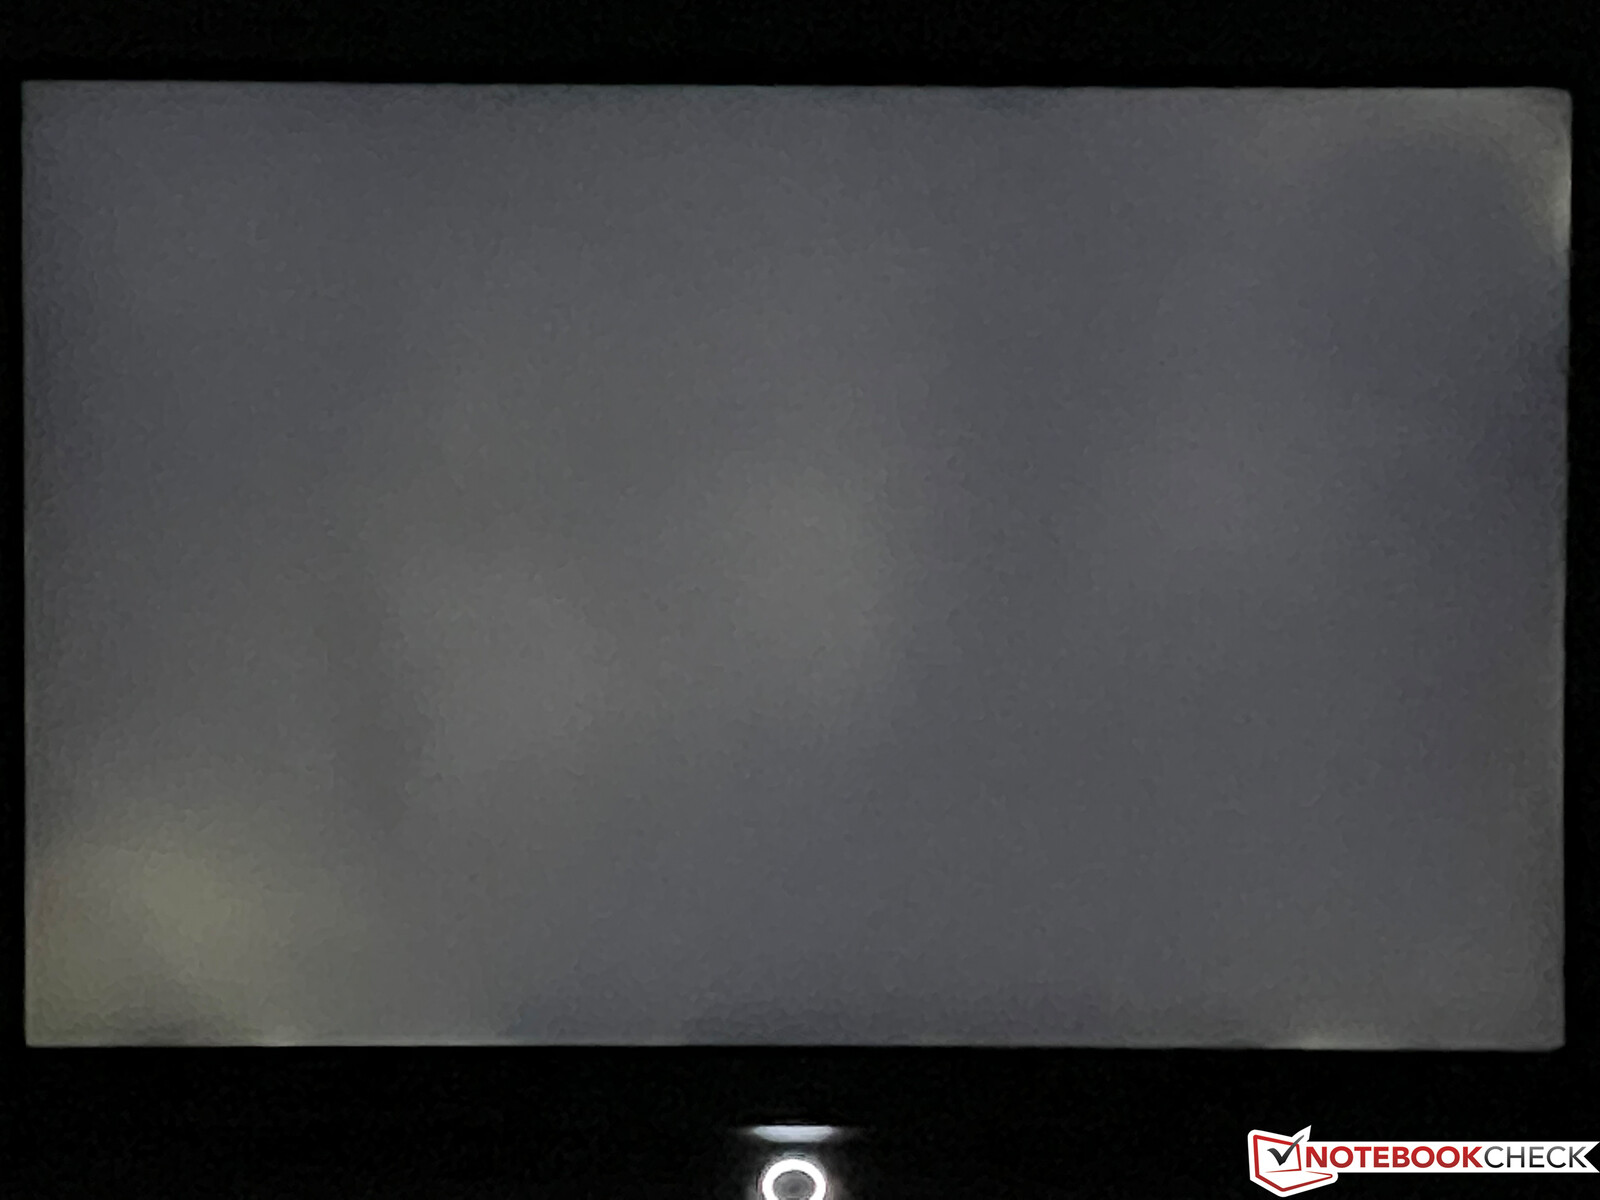
Lenovo specifies a brightness of 500 cd/m², which is even exceeded by our review sample with an average of 523 cd/m². However, the black value of 0.44 is comparatively high, which is why the contrast ratio is "only" ~1,200:1. Of course, other display technologies such as OLED or mini-LED have an advantage here. You can also see slight halos on a dark background at full brightness, but this should not be a problem in practice.
| |||||||||||||||||||||||||
Brightness Distribution: 88 %
Center on Battery: 546 cd/m²
Contrast: 1243:1 (Black: 0.44 cd/m²)
ΔE ColorChecker Calman: 2.1 | ∀{0.5-29.43 Ø4.81}
calibrated: 0.9
ΔE Greyscale Calman: 3.2 | ∀{0.09-98 Ø5.1}
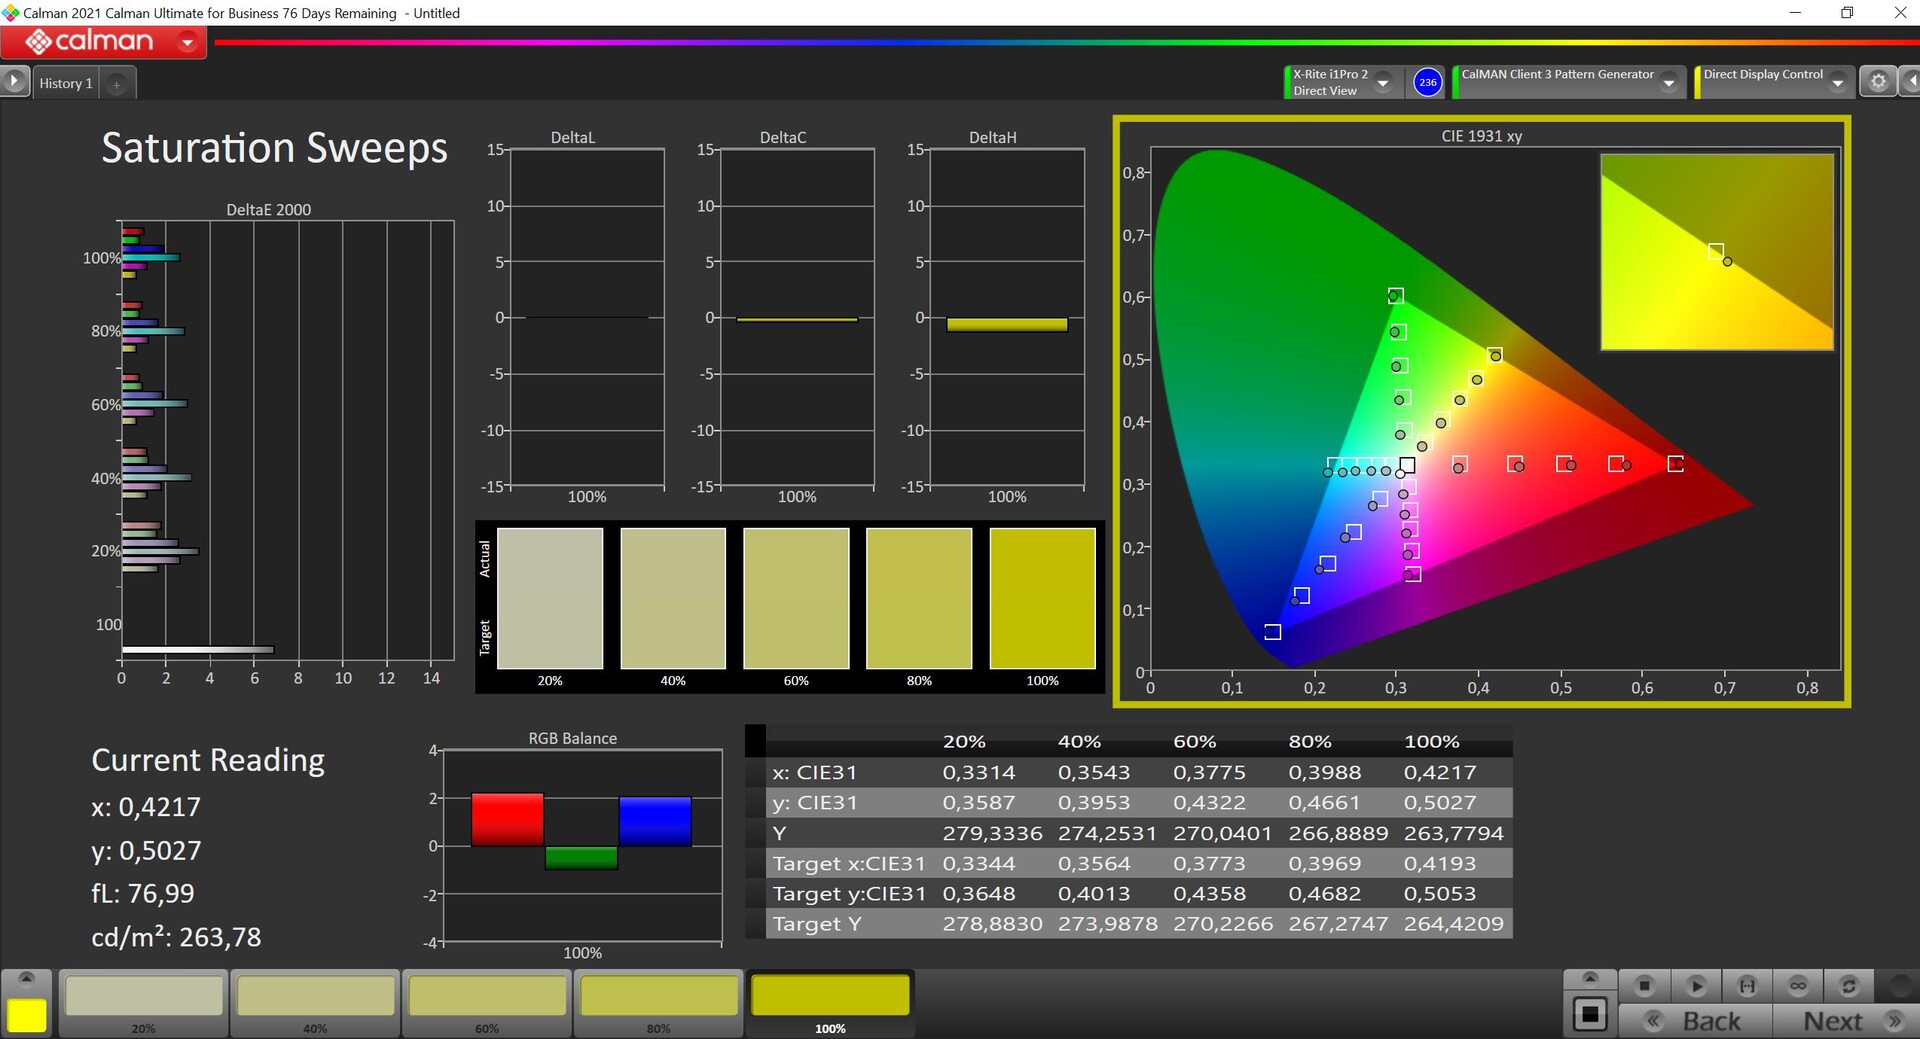
70.8% AdobeRGB 1998 (Argyll 3D)
98.2% sRGB (Argyll 3D)
69.3% Display P3 (Argyll 3D)
Gamma: 2.23
CCT: 6979 K
| Lenovo Legion 7 16IAX7-82TD004SGE NE160QDM-NY1, IPS, 2560x1600, 16" | SCHENKER XMG Neo 17 M22 BOE0A99, IPS, 2560x1600, 17" | MSI Titan GT77 12UHS Sharp SHP1544 LQ173M1JW08, IPS-Level, 1920x1080, 17.3" | Aorus 17X XES Sharp SHP1563, IPS, 1920x1080, 17.3" | Asus ROG Flow X16 GV601RW-M5082W AUO B160QAN02.S, Mini LED, 2560x1600, 16.1" | Razer Blade 17 Early 2022 AU Optronics B173ZAN06.9, IPS, 3840x2160, 17.3" | Asus ROG Zephyrus Duo 16 GX650RX BOE NE160QAM-NX1, IPS-Level, 3840x2400, 16" | |
|---|---|---|---|---|---|---|---|
| Display | 0% | 2% | 2% | 24% | 23% | 22% | |
| Display P3 Coverage (%) | 69.3 | 69 0% | 70.8 2% | 70.1 1% | 99.82 44% | 99.4 43% | 98 41% |
| sRGB Coverage (%) | 98.2 | 99.8 2% | 98.9 1% | 99.9 2% | 99.99 2% | 100 2% | 99.9 2% |
| AdobeRGB 1998 Coverage (%) | 70.8 | 69.6 -2% | 73 3% | 71.9 2% | 90.21 27% | 87.3 23% | 86.3 22% |
| Response Times | 3% | 41% | 35% | -42% | 20% | -8% | |
| Response Time Grey 50% / Grey 80% * (ms) | 12.6 ? | 10.8 ? 14% | 3.03 ? 76% | 3.4 ? 73% | 11 ? 13% | 7.5 ? 40% | 14.6 ? -16% |
| Response Time Black / White * (ms) | 5.6 ? | 6.1 ? -9% | 5.28 ? 6% | 5.8 ? -4% | 11 ? -96% | 5.6 ? -0% | 5.6 ? -0% |
| PWM Frequency (Hz) | 7400 ? | ||||||
| Screen | 9% | -23% | -39% | 27% | 16% | -19% | |
| Brightness middle (cd/m²) | 547 | 415 -24% | 280 -49% | 278 -49% | 498 -9% | 503 -8% | 459 -16% |
| Brightness (cd/m²) | 523 | 399 -24% | 275 -47% | 273 -48% | 502 -4% | 486 -7% | 434 -17% |
| Brightness Distribution (%) | 88 | 90 2% | 79 -10% | 79 -10% | 94 7% | 84 -5% | 88 0% |
| Black Level * (cd/m²) | 0.44 | 0.43 2% | 0.4 9% | 0.26 41% | 0.11 75% | 0.44 -0% | 0.44 -0% |
| Contrast (:1) | 1243 | 965 -22% | 700 -44% | 1069 -14% | 4527 264% | 1143 -8% | 1043 -16% |
| Colorchecker dE 2000 * | 2.1 | 1.44 31% | 2.1 -0% | 3.96 -89% | 1.87 11% | 1.08 49% | 2.97 -41% |
| Colorchecker dE 2000 max. * | 7 | 2.33 67% | 5.83 17% | 10.78 -54% | 6.15 12% | 4.54 35% | 8.13 -16% |
| Colorchecker dE 2000 calibrated * | 0.9 | 0.89 1% | 1.58 -76% | 1.07 -19% | 1.94 -116% | 0.6 33% | 1.03 -14% |
| Greyscale dE 2000 * | 3.2 | 1.8 44% | 3.3 -3% | 6.8 -113% | 3.15 2% | 1.3 59% | 4.9 -53% |
| Gamma | 2.23 99% | 2.132 103% | 2.13 103% | 2.224 99% | 330.95 1% | 2.151 102% | 2.235 98% |
| CCT | 6979 93% | 6327 103% | 7060 92% | 7651 85% | 7294 89% | 6541 99% | 6775 96% |
| Total Average (Program / Settings) | 4% /
6% | 7% /
-8% | -1% /
-20% | 3% /
17% | 20% /
18% | -2% /
-9% |
* ... smaller is better
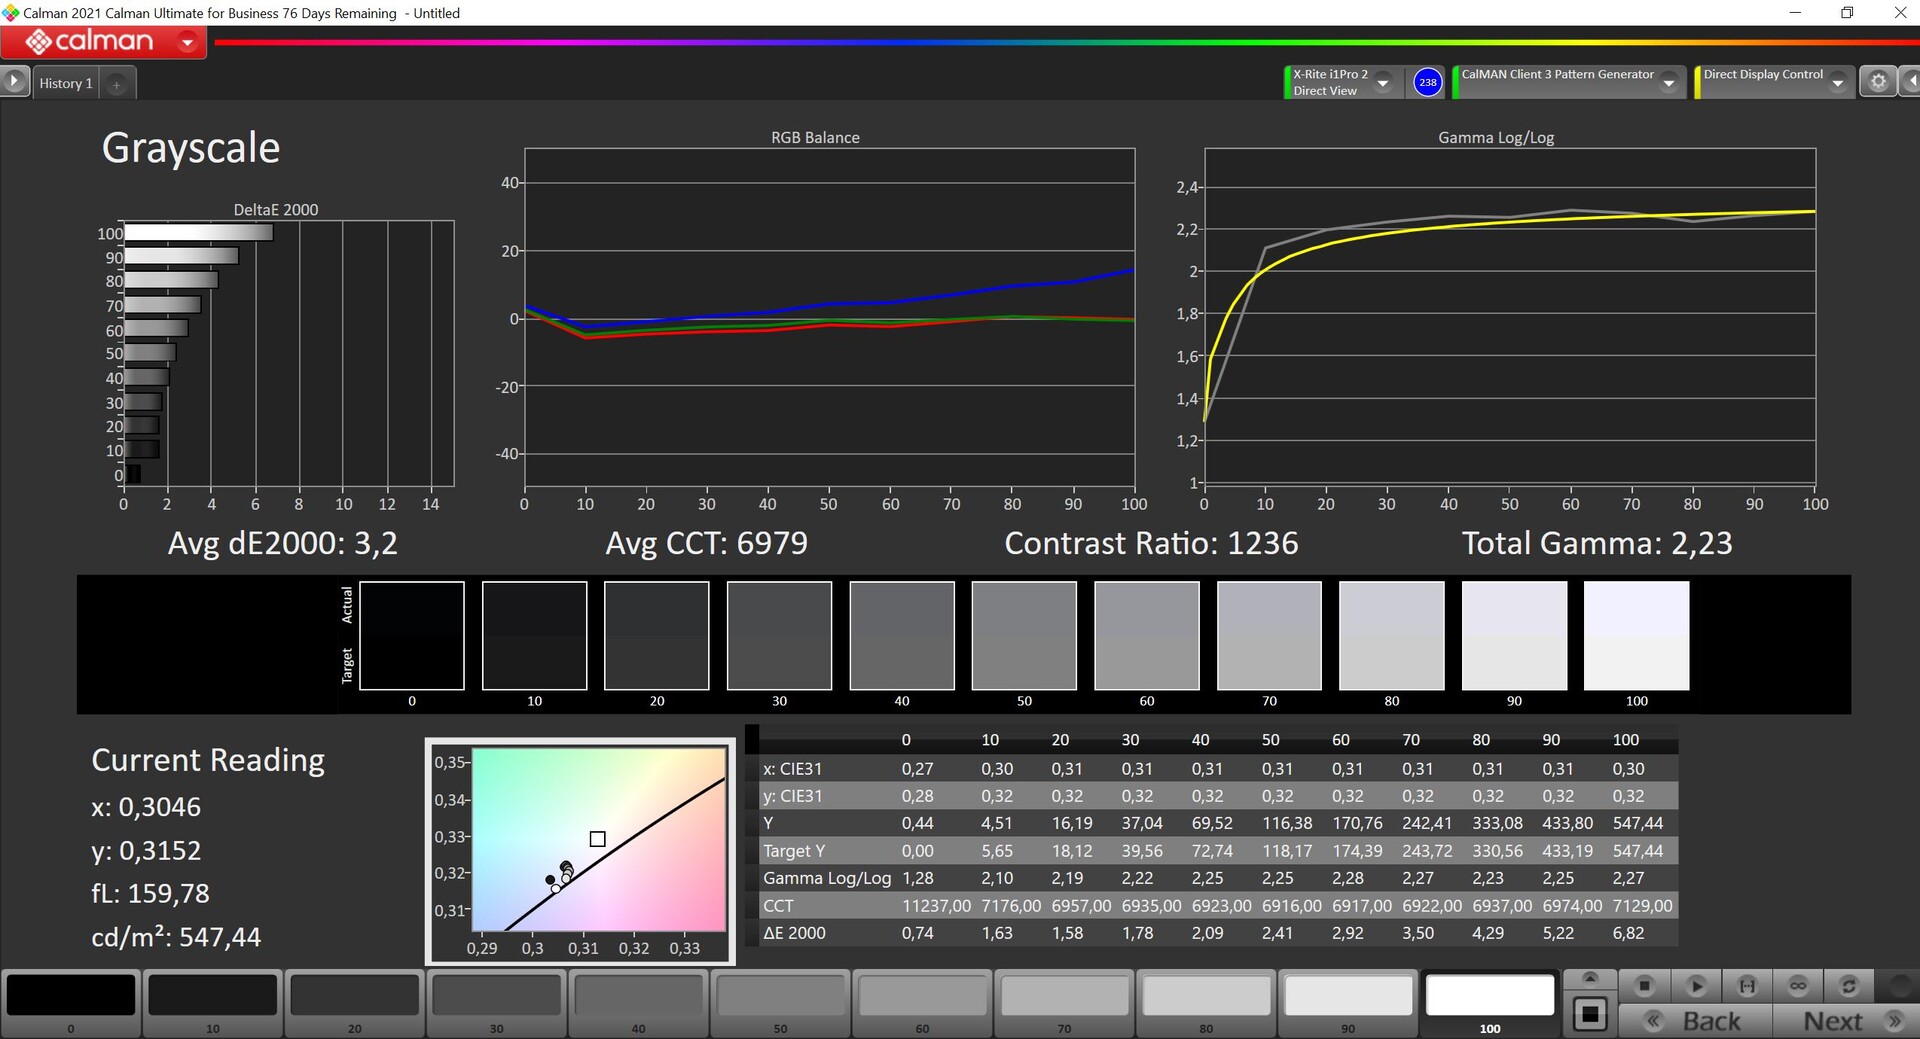
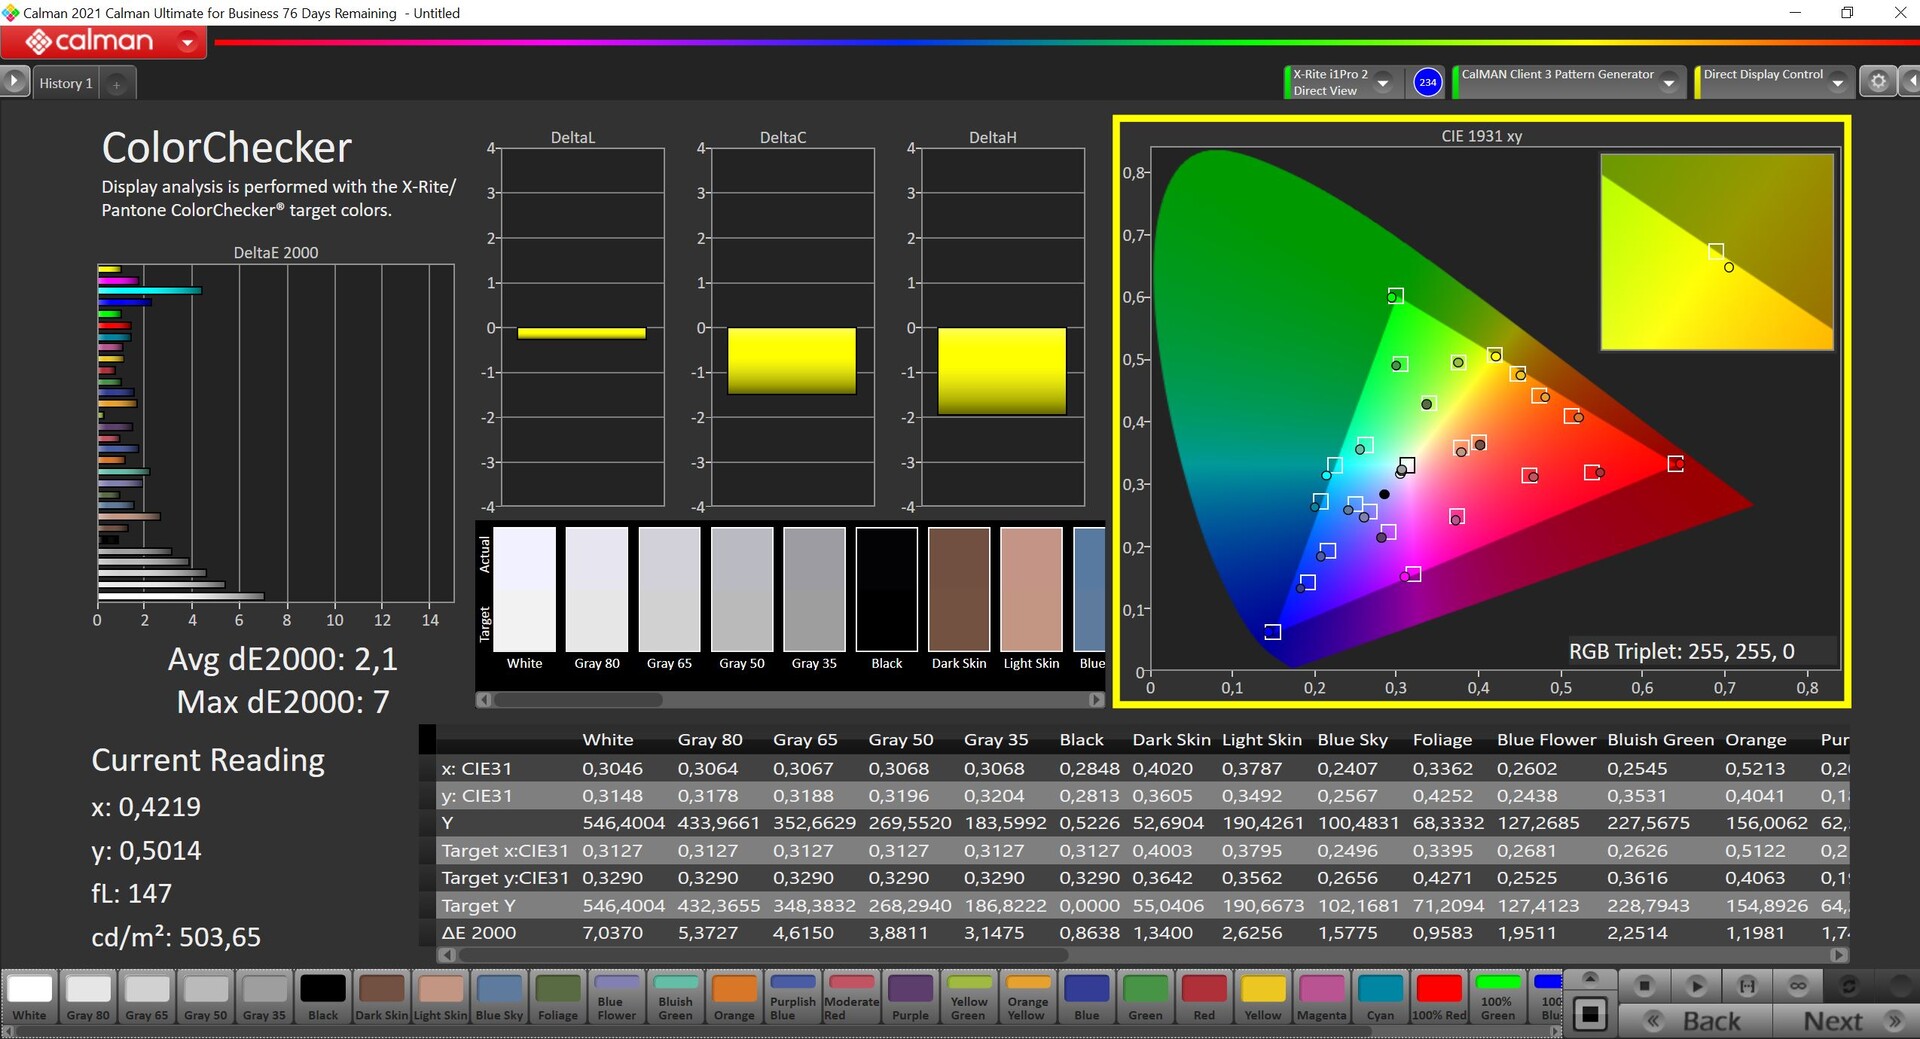
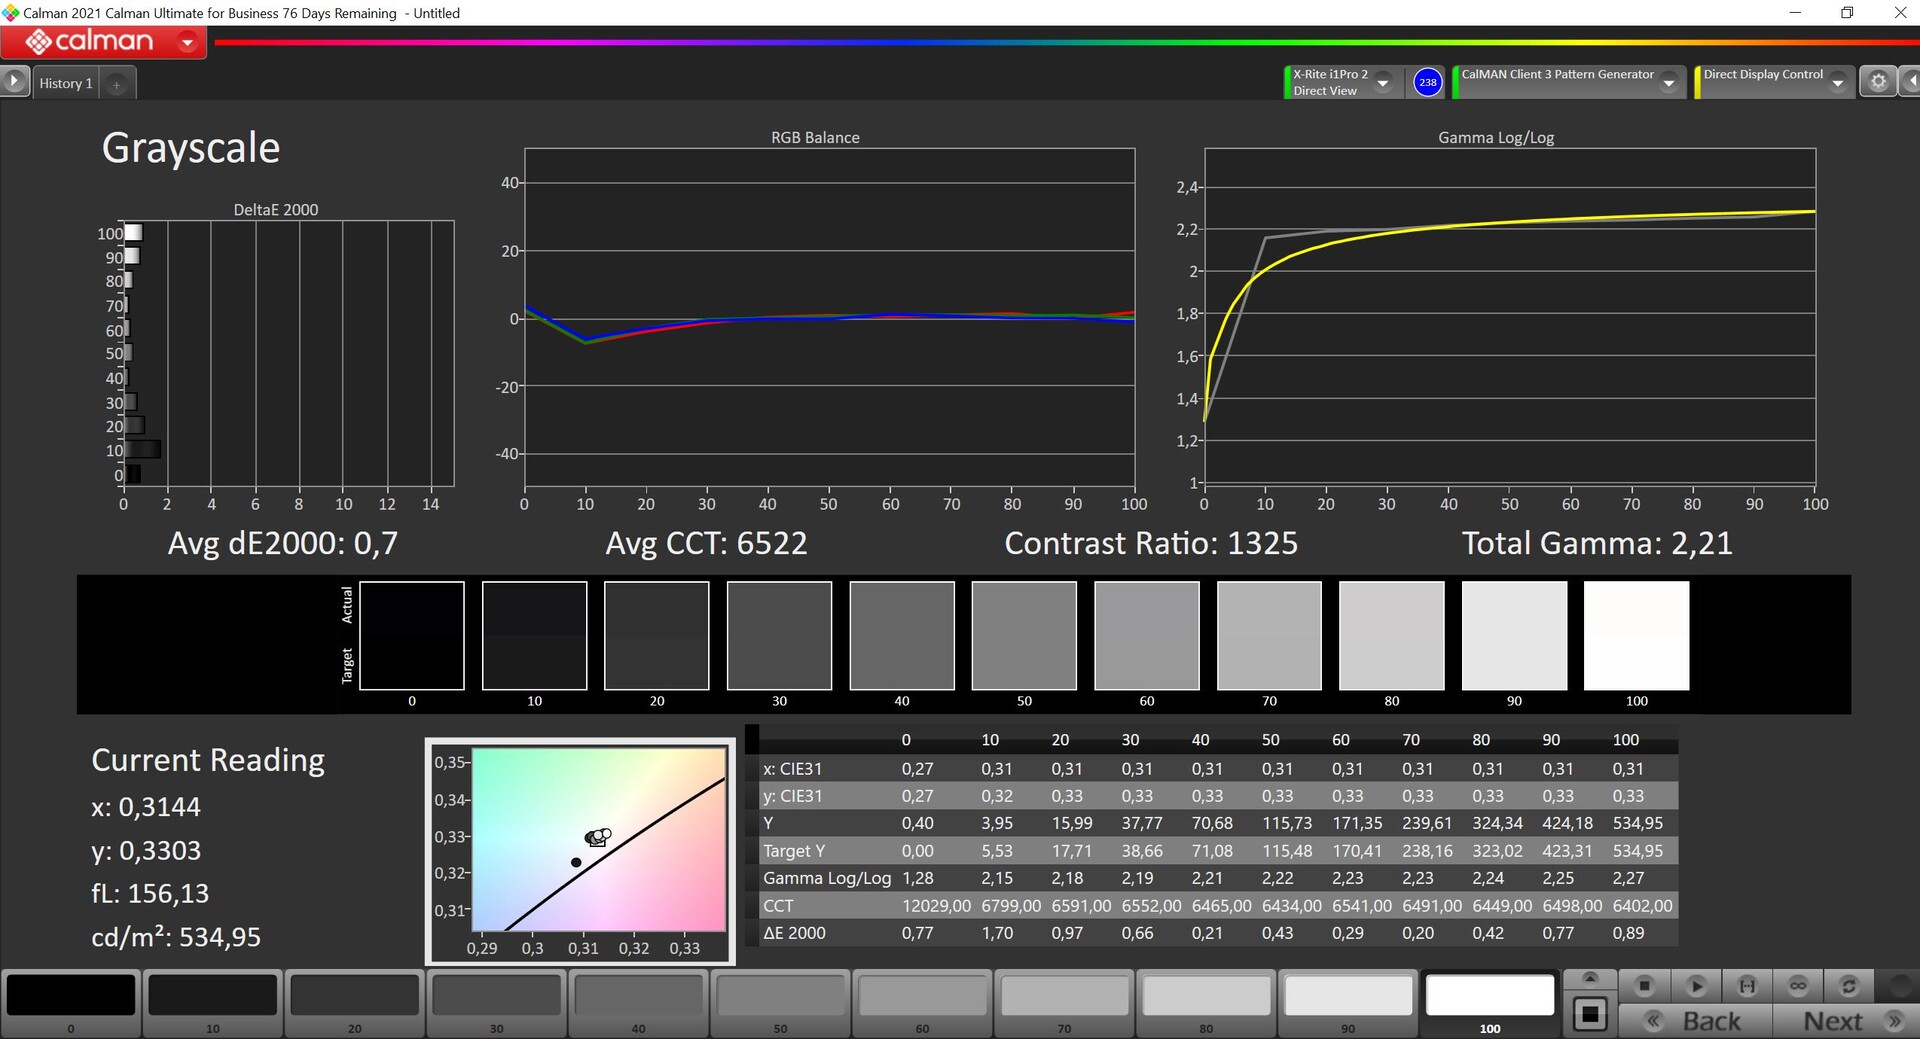
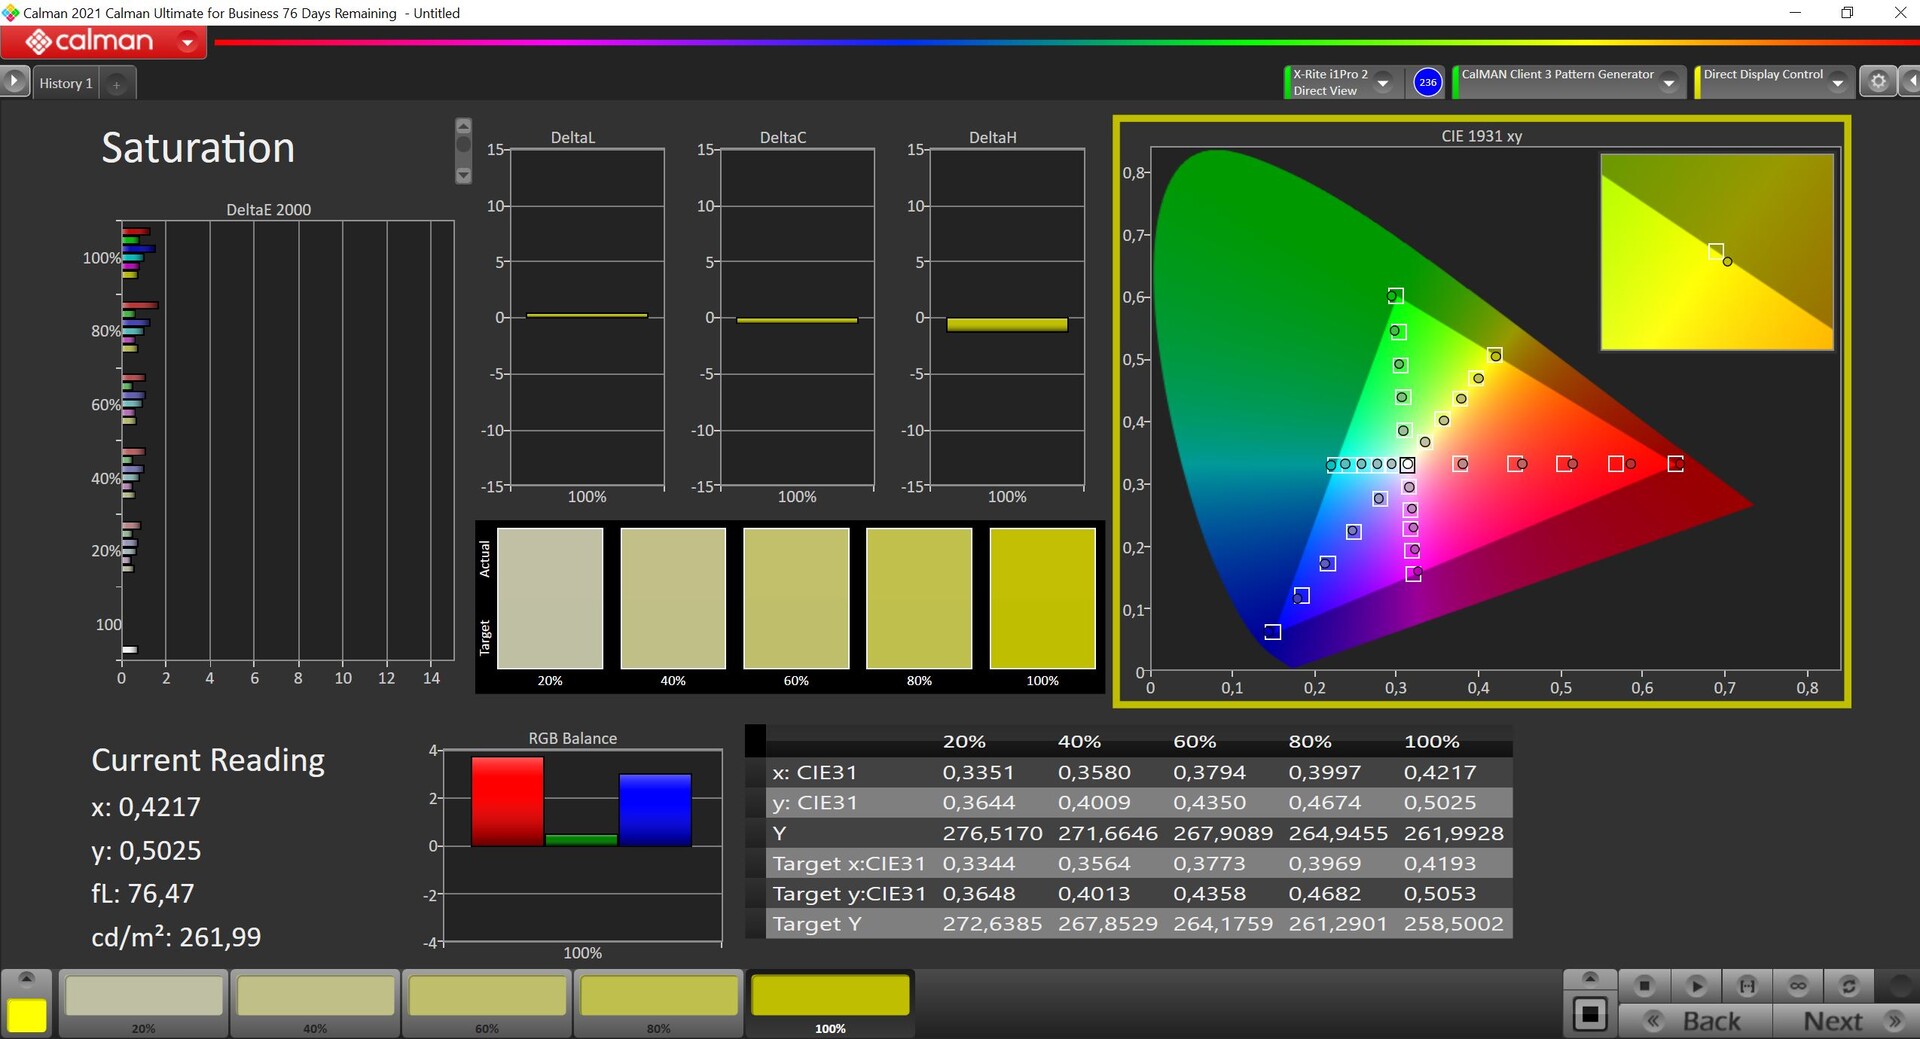
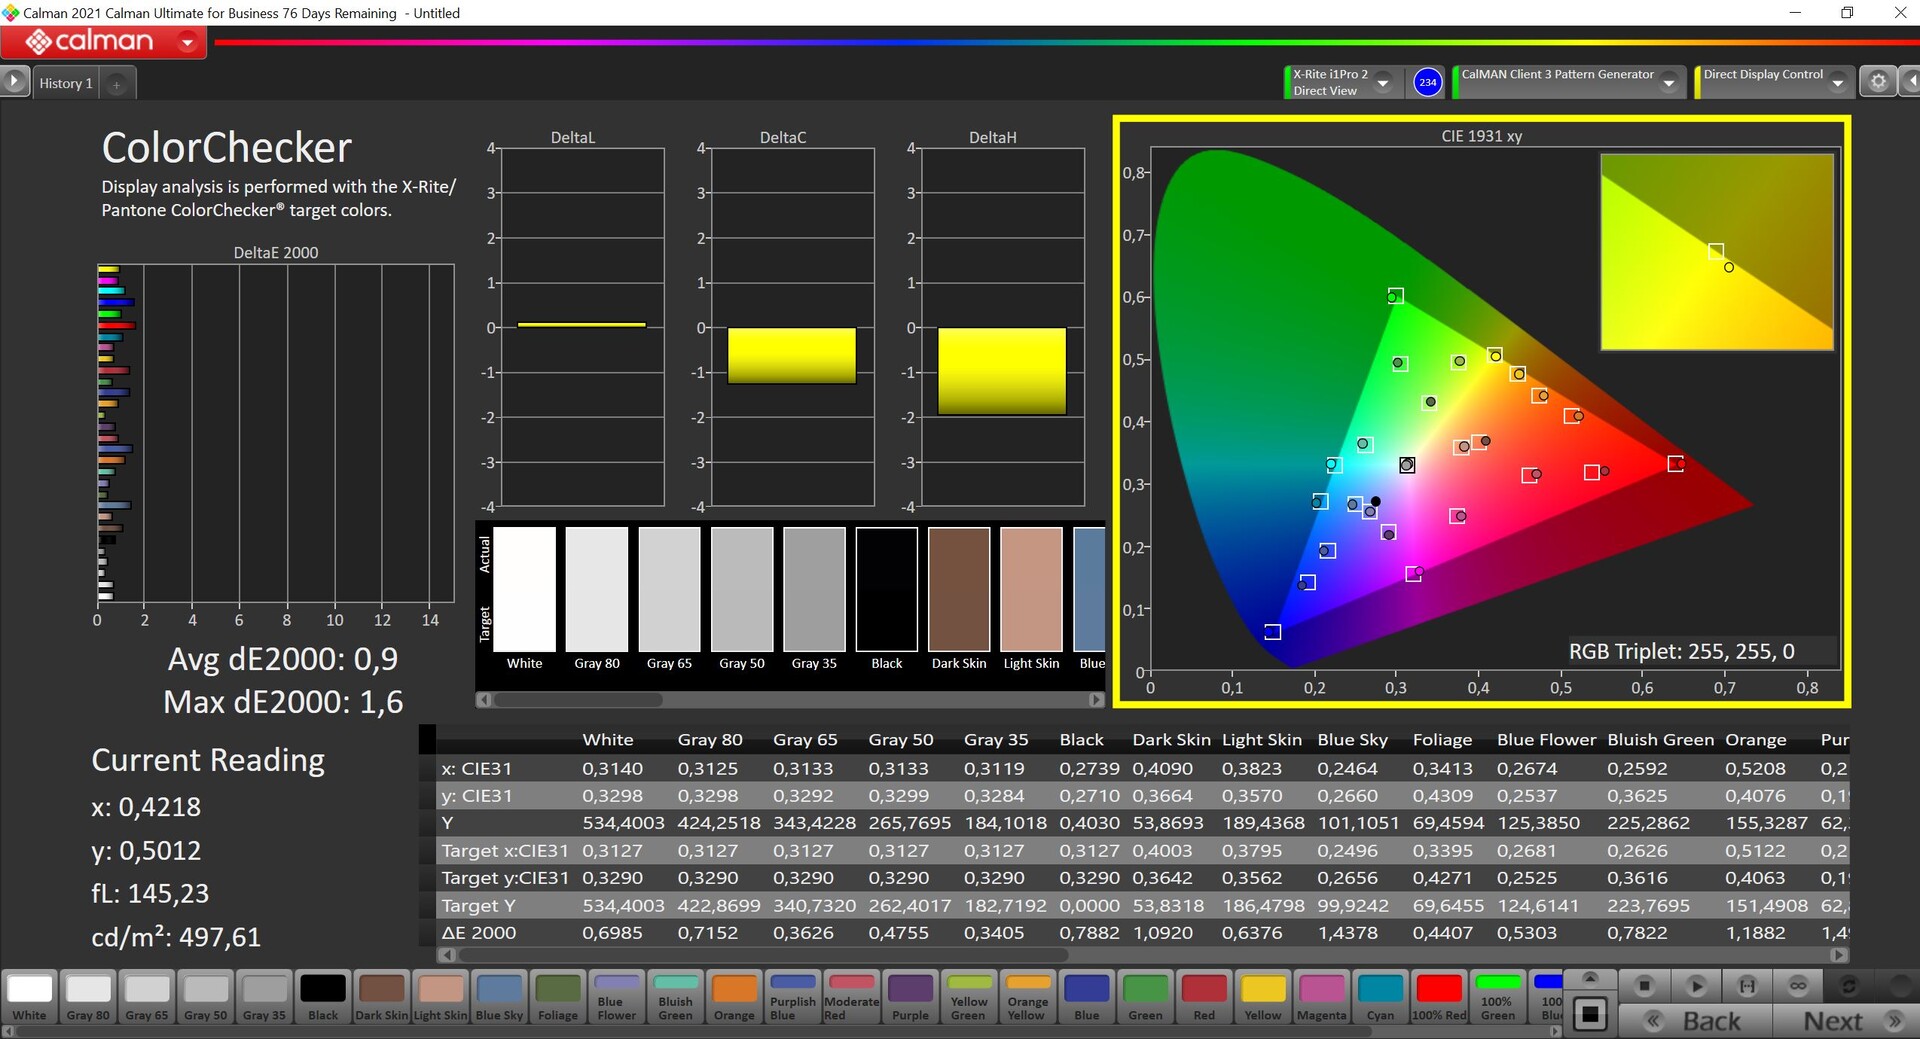
In delivery state, our analysis with the professional CalMAN software (X-Rite i1 Pro 2) reveals a blue cast in the grayscale and a color temperature that is slightly too cool, but colors are very accurate. With our own calibration (profile is available for free download above), we were able to get the blue cast under control and signficantly improve the color accuracy.
Although the panel only covers the small sRGB color space, this laptop is primarily intended for gaming and so the display is very well suited for this purpose.

Display Response Times
| ↔ Response Time Black to White | ||
|---|---|---|
| 5.6 ms ... rise ↗ and fall ↘ combined | ↗ 1.5 ms rise | 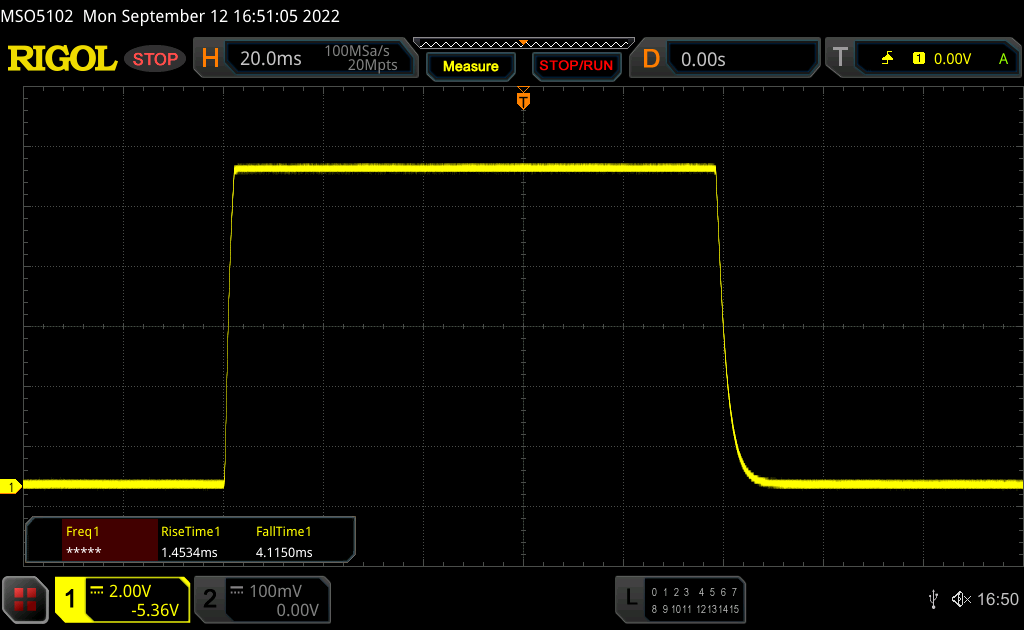 |
| ↘ 4.1 ms fall | ||
| The screen shows very fast response rates in our tests and should be very well suited for fast-paced gaming. In comparison, all tested devices range from 0.1 (minimum) to 240 (maximum) ms. » 16 % of all devices are better. This means that the measured response time is better than the average of all tested devices (20.4 ms). | ||
| ↔ Response Time 50% Grey to 80% Grey | ||
| 12.6 ms ... rise ↗ and fall ↘ combined | ↗ 5.9 ms rise | 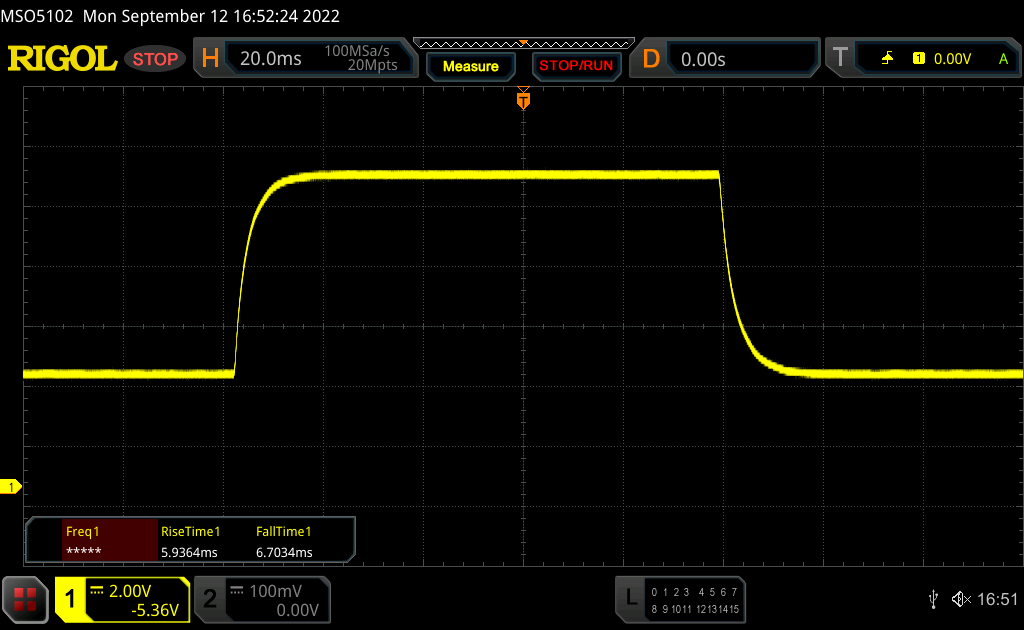 |
| ↘ 6.7 ms fall | ||
| The screen shows good response rates in our tests, but may be too slow for competitive gamers. In comparison, all tested devices range from 0.165 (minimum) to 636 (maximum) ms. » 24 % of all devices are better. This means that the measured response time is better than the average of all tested devices (31.9 ms). | ||
Screen Flickering / PWM (Pulse-Width Modulation)
| Screen flickering / PWM not detected | 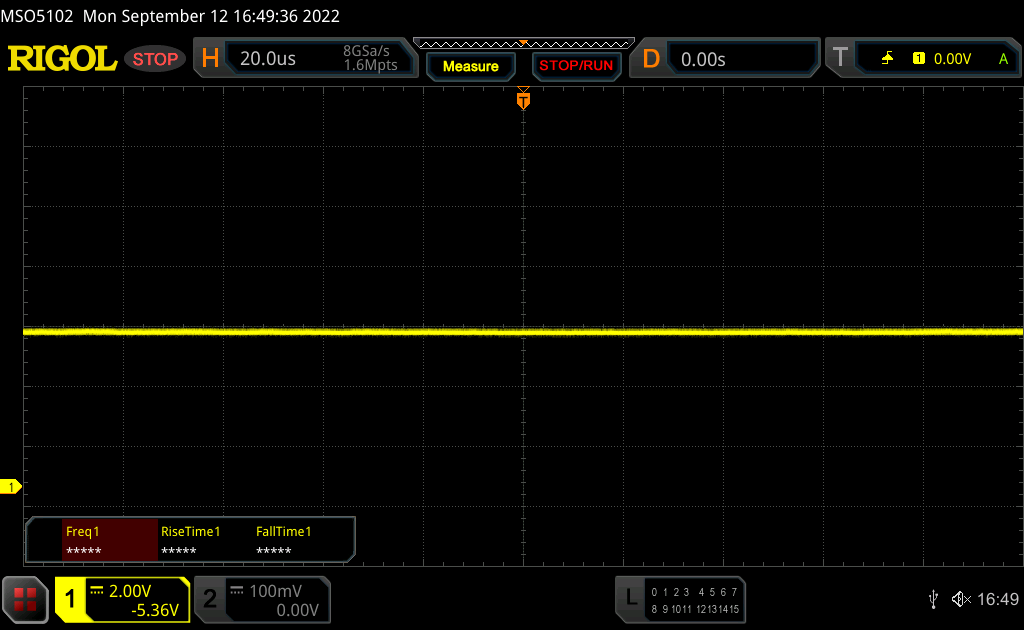 | ||
In comparison: 53 % of all tested devices do not use PWM to dim the display. If PWM was detected, an average of 8260 (minimum: 5 - maximum: 343500) Hz was measured. | |||
You probably won't use a heavy 16-inch notebook outdoors very often, but thanks to the good brightness and matte screen, the Legion 7 16 can nonetheless be used in bright environments. The viewing angle stability of the IPS panel is very good.

Performance - Intel HX CPU & GeForce RTX 3080 Ti
Testing Conditions
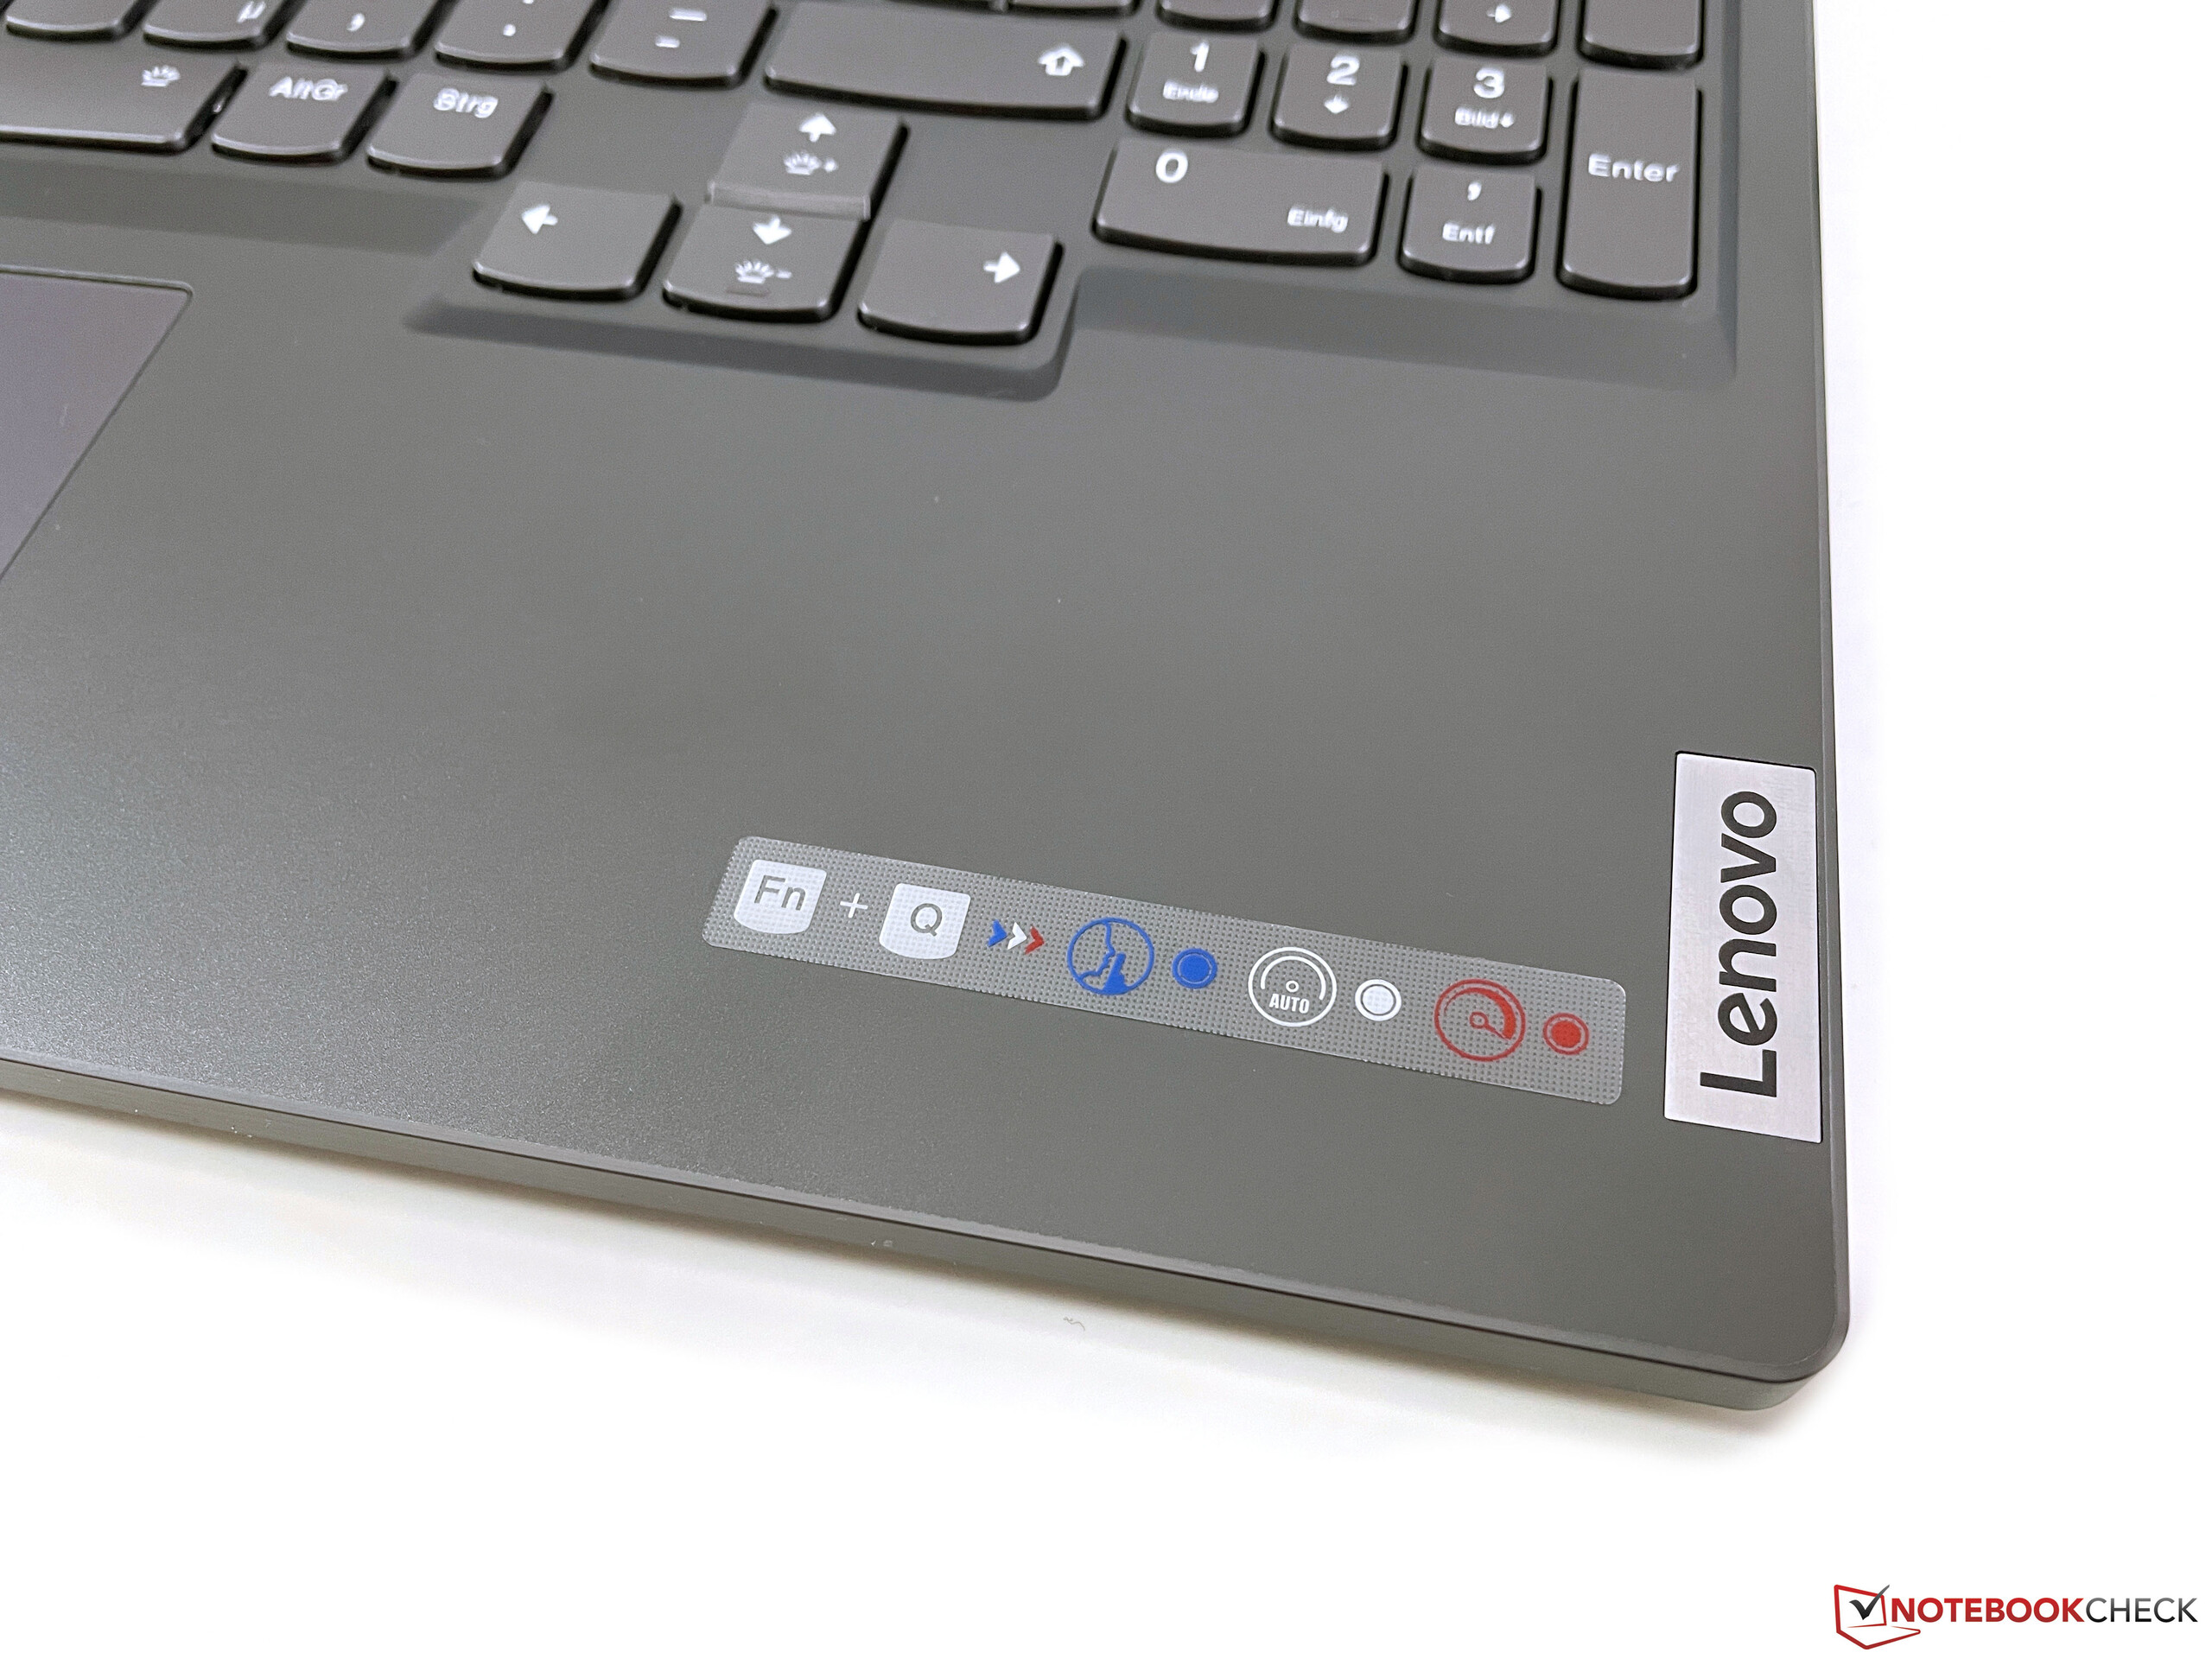
Lenovo offers three different performance profiles with the preinstalled Vantage software, which can be switched either via software or the Fn+Q key combination. The activated mode is very conveniently indicated by the illumination of the power button (white = Balanced, blue = Quiet, red = Performance). We have listed the respective TDP/TGP settings in the following table.
| Mode | CPU load | GPU load | Stress test | Max. fan noise |
|---|---|---|---|---|
| Quiet | 113 watts | 64 watts | CPU: 86 watts GPU: 42 watts |
39 dB(A) |
| Balanced | 121 watts | 115 watts | CPU: 86 watts GPU: 115 watts |
48,8 dB(A) |
| Performance | 165 -> 136 watts | 115 watts | CPU: 94 watts GPU: 150 watts |
54,2 dB(A) |
Additionally, the graphics mode can be switched in the Vantage software and you can set it so that only the dedicated graphics card should be used. This did not have a major impact in our random tests, which is why we carried out the measurements and benchmarks with the preset hybrid GPU mode in combination with Performance mode. However, Performance mode is not available in battery mode.
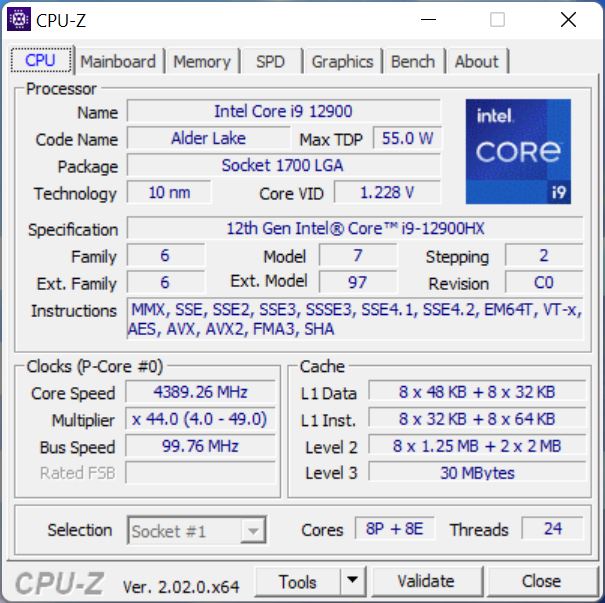
Processor - Core i9-12900HX
The Core i9-12900HX is currently Intel's fastest mobile processor, based on the desktop chips of the Alder Lake S class. There are 8 performance cores, including hyperthreading and 8 efficiency cores, so the chip can process a total of 24 threads simultaneously. Consumption peaks at up to 165 watts and then quickly levels off at 136 watts, which enables excellent results in the benchmarks. The Core i9 is not particularly efficient, but the advantage over the AMD Ryzen 9 6900HX in the Legion 7 16 of the same build is an average of 39 percent in all our CPU tests. In addition, the review device is on a par with larger 17-inch models that are also equipped with the Core i9-12900HX.
Performance remains completely stable even under prolonged load, but consumption quickly levels off at around 40 watts in battery mode, which corresponds to a performance loss of a whopping 75% in the multi-core tests. More CPU benchmarks are available here.
Cinebench R15 Multi Sustained Load
Cinebench R23: Multi Core | Single Core
Cinebench R20: CPU (Multi Core) | CPU (Single Core)
Cinebench R15: CPU Multi 64Bit | CPU Single 64Bit
Blender: v2.79 BMW27 CPU
7-Zip 18.03: 7z b 4 | 7z b 4 -mmt1
Geekbench 5.5: Multi-Core | Single-Core
HWBOT x265 Benchmark v2.2: 4k Preset
LibreOffice : 20 Documents To PDF
R Benchmark 2.5: Overall mean
| CPU Performance Rating | |
| Average of class Gaming | |
| Lenovo Legion 7 16IAX7-82TD004SGE | |
| MSI Titan GT77 12UHS | |
| Average Intel Core i9-12900HX | |
| Aorus 17X XES | |
| Asus ROG Zephyrus Duo 16 GX650RX | |
| Lenovo Legion 7 16ARHA7 | |
| SCHENKER XMG Neo 17 M22 | |
| Asus ROG Flow X16 GV601RW-M5082W | |
| Razer Blade 17 Early 2022 | |
| Cinebench R23 / Multi Core | |
| Average of class Gaming (5668 - 40970, n=140, last 2 years) | |
| MSI Titan GT77 12UHS | |
| Average Intel Core i9-12900HX (18337 - 23482, n=8) | |
| Lenovo Legion 7 16IAX7-82TD004SGE | |
| Aorus 17X XES | |
| Lenovo Legion 7 16ARHA7 | |
| Asus ROG Flow X16 GV601RW-M5082W | |
| SCHENKER XMG Neo 17 M22 | |
| Asus ROG Zephyrus Duo 16 GX650RX | |
| Razer Blade 17 Early 2022 | |
| Cinebench R23 / Single Core | |
| Average of class Gaming (1136 - 2267, n=140, last 2 years) | |
| Lenovo Legion 7 16IAX7-82TD004SGE | |
| Aorus 17X XES | |
| Average Intel Core i9-12900HX (1897 - 1936, n=8) | |
| MSI Titan GT77 12UHS | |
| Razer Blade 17 Early 2022 | |
| Asus ROG Zephyrus Duo 16 GX650RX | |
| Lenovo Legion 7 16ARHA7 | |
| SCHENKER XMG Neo 17 M22 | |
| Asus ROG Flow X16 GV601RW-M5082W | |
| Cinebench R20 / CPU (Multi Core) | |
| Average of class Gaming (2179 - 16108, n=139, last 2 years) | |
| MSI Titan GT77 12UHS | |
| Average Intel Core i9-12900HX (7037 - 9042, n=8) | |
| Lenovo Legion 7 16IAX7-82TD004SGE | |
| Aorus 17X XES | |
| Lenovo Legion 7 16ARHA7 | |
| Asus ROG Flow X16 GV601RW-M5082W | |
| SCHENKER XMG Neo 17 M22 | |
| Asus ROG Zephyrus Duo 16 GX650RX | |
| Razer Blade 17 Early 2022 | |
| Cinebench R20 / CPU (Single Core) | |
| Average of class Gaming (439 - 870, n=139, last 2 years) | |
| Lenovo Legion 7 16IAX7-82TD004SGE | |
| Aorus 17X XES | |
| MSI Titan GT77 12UHS | |
| Average Intel Core i9-12900HX (728 - 745, n=8) | |
| Razer Blade 17 Early 2022 | |
| Lenovo Legion 7 16ARHA7 | |
| SCHENKER XMG Neo 17 M22 | |
| Asus ROG Flow X16 GV601RW-M5082W | |
| Asus ROG Zephyrus Duo 16 GX650RX | |
| Cinebench R15 / CPU Multi 64Bit | |
| Average of class Gaming (1537 - 6271, n=139, last 2 years) | |
| MSI Titan GT77 12UHS | |
| Lenovo Legion 7 16IAX7-82TD004SGE | |
| Average Intel Core i9-12900HX (2830 - 3652, n=8) | |
| Aorus 17X XES | |
| Lenovo Legion 7 16ARHA7 | |
| Asus ROG Flow X16 GV601RW-M5082W | |
| SCHENKER XMG Neo 17 M22 | |
| Asus ROG Zephyrus Duo 16 GX650RX | |
| Razer Blade 17 Early 2022 | |
| Cinebench R15 / CPU Single 64Bit | |
| Average of class Gaming (191.9 - 343, n=138, last 2 years) | |
| Lenovo Legion 7 16IAX7-82TD004SGE | |
| MSI Titan GT77 12UHS | |
| Average Intel Core i9-12900HX (274 - 282, n=8) | |
| Aorus 17X XES | |
| Razer Blade 17 Early 2022 | |
| Lenovo Legion 7 16ARHA7 | |
| Asus ROG Zephyrus Duo 16 GX650RX | |
| SCHENKER XMG Neo 17 M22 | |
| Asus ROG Flow X16 GV601RW-M5082W | |
| Blender / v2.79 BMW27 CPU | |
| Razer Blade 17 Early 2022 | |
| Asus ROG Flow X16 GV601RW-M5082W | |
| Asus ROG Zephyrus Duo 16 GX650RX | |
| SCHENKER XMG Neo 17 M22 | |
| Lenovo Legion 7 16ARHA7 | |
| Aorus 17X XES | |
| Average Intel Core i9-12900HX (144 - 201, n=8) | |
| Average of class Gaming (80 - 517, n=135, last 2 years) | |
| Lenovo Legion 7 16IAX7-82TD004SGE | |
| MSI Titan GT77 12UHS | |
| 7-Zip 18.03 / 7z b 4 | |
| Average of class Gaming (23795 - 148086, n=137, last 2 years) | |
| Lenovo Legion 7 16IAX7-82TD004SGE | |
| MSI Titan GT77 12UHS | |
| Average Intel Core i9-12900HX (69778 - 88128, n=7) | |
| Aorus 17X XES | |
| Asus ROG Zephyrus Duo 16 GX650RX | |
| SCHENKER XMG Neo 17 M22 | |
| Lenovo Legion 7 16ARHA7 | |
| Asus ROG Flow X16 GV601RW-M5082W | |
| Razer Blade 17 Early 2022 | |
| 7-Zip 18.03 / 7z b 4 -mmt1 | |
| Average of class Gaming (4199 - 7508, n=137, last 2 years) | |
| Lenovo Legion 7 16IAX7-82TD004SGE | |
| Aorus 17X XES | |
| Average Intel Core i9-12900HX (6165 - 6358, n=7) | |
| MSI Titan GT77 12UHS | |
| Razer Blade 17 Early 2022 | |
| SCHENKER XMG Neo 17 M22 | |
| Asus ROG Zephyrus Duo 16 GX650RX | |
| Asus ROG Flow X16 GV601RW-M5082W | |
| Lenovo Legion 7 16ARHA7 | |
| Geekbench 5.5 / Multi-Core | |
| Average of class Gaming (4557 - 27010, n=136, last 2 years) | |
| Lenovo Legion 7 16IAX7-82TD004SGE | |
| MSI Titan GT77 12UHS | |
| Average Intel Core i9-12900HX (15116 - 16925, n=8) | |
| Aorus 17X XES | |
| Asus ROG Zephyrus Duo 16 GX650RX | |
| SCHENKER XMG Neo 17 M22 | |
| Lenovo Legion 7 16ARHA7 | |
| Razer Blade 17 Early 2022 | |
| Asus ROG Flow X16 GV601RW-M5082W | |
| Geekbench 5.5 / Single-Core | |
| Average of class Gaming (986 - 2423, n=136, last 2 years) | |
| MSI Titan GT77 12UHS | |
| Average Intel Core i9-12900HX (1874 - 1949, n=8) | |
| Aorus 17X XES | |
| Lenovo Legion 7 16IAX7-82TD004SGE | |
| Razer Blade 17 Early 2022 | |
| Asus ROG Zephyrus Duo 16 GX650RX | |
| SCHENKER XMG Neo 17 M22 | |
| Lenovo Legion 7 16ARHA7 | |
| Asus ROG Flow X16 GV601RW-M5082W | |
| HWBOT x265 Benchmark v2.2 / 4k Preset | |
| Average of class Gaming (7.7 - 44.3, n=137, last 2 years) | |
| MSI Titan GT77 12UHS | |
| Lenovo Legion 7 16IAX7-82TD004SGE | |
| Average Intel Core i9-12900HX (19.6 - 26.6, n=7) | |
| Aorus 17X XES | |
| Lenovo Legion 7 16ARHA7 | |
| Asus ROG Zephyrus Duo 16 GX650RX | |
| SCHENKER XMG Neo 17 M22 | |
| Asus ROG Flow X16 GV601RW-M5082W | |
| Razer Blade 17 Early 2022 | |
| LibreOffice / 20 Documents To PDF | |
| Asus ROG Flow X16 GV601RW-M5082W | |
| SCHENKER XMG Neo 17 M22 | |
| Lenovo Legion 7 16ARHA7 | |
| Average of class Gaming (19 - 88.8, n=136, last 2 years) | |
| Asus ROG Zephyrus Duo 16 GX650RX | |
| Razer Blade 17 Early 2022 | |
| MSI Titan GT77 12UHS | |
| Aorus 17X XES | |
| Average Intel Core i9-12900HX (33.6 - 42.4, n=7) | |
| Lenovo Legion 7 16IAX7-82TD004SGE | |
| R Benchmark 2.5 / Overall mean | |
| Asus ROG Flow X16 GV601RW-M5082W | |
| Lenovo Legion 7 16ARHA7 | |
| SCHENKER XMG Neo 17 M22 | |
| Asus ROG Zephyrus Duo 16 GX650RX | |
| Razer Blade 17 Early 2022 | |
| Average of class Gaming (0.3551 - 0.759, n=138, last 2 years) | |
| Average Intel Core i9-12900HX (0.4159 - 0.4242, n=7) | |
| Lenovo Legion 7 16IAX7-82TD004SGE | |
| MSI Titan GT77 12UHS | |
| Aorus 17X XES | |
* ... smaller is better
AIDA64: FP32 Ray-Trace | FPU Julia | CPU SHA3 | CPU Queen | FPU SinJulia | FPU Mandel | CPU AES | CPU ZLib | FP64 Ray-Trace | CPU PhotoWorxx
| Performance Rating | |
| Average of class Gaming | |
| MSI Titan GT77 12UHS | |
| Average Intel Core i9-12900HX | |
| Lenovo Legion 7 16ARHA7 | |
| Asus ROG Zephyrus Duo 16 GX650RX | |
| Asus ROG Flow X16 GV601RW-M5082W | |
| SCHENKER XMG Neo 17 M22 | |
| Aorus 17X XES | |
| Lenovo Legion 7 16IAX7-82TD004SGE | |
| Razer Blade 17 Early 2022 | |
| AIDA64 / FP32 Ray-Trace | |
| Average of class Gaming (7192 - 85542, n=136, last 2 years) | |
| MSI Titan GT77 12UHS | |
| Average Intel Core i9-12900HX (11535 - 22183, n=7) | |
| Lenovo Legion 7 16ARHA7 | |
| Asus ROG Zephyrus Duo 16 GX650RX | |
| SCHENKER XMG Neo 17 M22 | |
| Asus ROG Flow X16 GV601RW-M5082W | |
| Aorus 17X XES | |
| Lenovo Legion 7 16IAX7-82TD004SGE | |
| Razer Blade 17 Early 2022 | |
| AIDA64 / FPU Julia | |
| Average of class Gaming (35040 - 252486, n=136, last 2 years) | |
| MSI Titan GT77 12UHS | |
| Lenovo Legion 7 16ARHA7 | |
| Asus ROG Zephyrus Duo 16 GX650RX | |
| Asus ROG Flow X16 GV601RW-M5082W | |
| SCHENKER XMG Neo 17 M22 | |
| Average Intel Core i9-12900HX (52916 - 110093, n=7) | |
| Aorus 17X XES | |
| Lenovo Legion 7 16IAX7-82TD004SGE | |
| Razer Blade 17 Early 2022 | |
| AIDA64 / CPU SHA3 | |
| Average of class Gaming (1728 - 10389, n=136, last 2 years) | |
| MSI Titan GT77 12UHS | |
| Average Intel Core i9-12900HX (3559 - 5123, n=7) | |
| Lenovo Legion 7 16IAX7-82TD004SGE | |
| Lenovo Legion 7 16ARHA7 | |
| Asus ROG Flow X16 GV601RW-M5082W | |
| Aorus 17X XES | |
| Asus ROG Zephyrus Duo 16 GX650RX | |
| SCHENKER XMG Neo 17 M22 | |
| Razer Blade 17 Early 2022 | |
| AIDA64 / CPU Queen | |
| Average of class Gaming (50699 - 200651, n=136, last 2 years) | |
| Lenovo Legion 7 16ARHA7 | |
| Asus ROG Zephyrus Duo 16 GX650RX | |
| Aorus 17X XES | |
| Asus ROG Flow X16 GV601RW-M5082W | |
| MSI Titan GT77 12UHS | |
| Average Intel Core i9-12900HX (101029 - 104457, n=7) | |
| SCHENKER XMG Neo 17 M22 | |
| Lenovo Legion 7 16IAX7-82TD004SGE | |
| Razer Blade 17 Early 2022 | |
| AIDA64 / FPU SinJulia | |
| Average of class Gaming (5020 - 33636, n=136, last 2 years) | |
| Lenovo Legion 7 16IAX7-82TD004SGE | |
| Lenovo Legion 7 16ARHA7 | |
| MSI Titan GT77 12UHS | |
| Asus ROG Zephyrus Duo 16 GX650RX | |
| Asus ROG Flow X16 GV601RW-M5082W | |
| SCHENKER XMG Neo 17 M22 | |
| Average Intel Core i9-12900HX (10475 - 13062, n=7) | |
| Aorus 17X XES | |
| Razer Blade 17 Early 2022 | |
| AIDA64 / FPU Mandel | |
| Average of class Gaming (17585 - 134044, n=136, last 2 years) | |
| Lenovo Legion 7 16ARHA7 | |
| Asus ROG Zephyrus Duo 16 GX650RX | |
| Asus ROG Flow X16 GV601RW-M5082W | |
| SCHENKER XMG Neo 17 M22 | |
| MSI Titan GT77 12UHS | |
| Average Intel Core i9-12900HX (31779 - 53628, n=7) | |
| Aorus 17X XES | |
| Lenovo Legion 7 16IAX7-82TD004SGE | |
| Razer Blade 17 Early 2022 | |
| AIDA64 / CPU AES | |
| MSI Titan GT77 12UHS | |
| Average Intel Core i9-12900HX (125268 - 183146, n=7) | |
| Asus ROG Flow X16 GV601RW-M5082W | |
| Lenovo Legion 7 16ARHA7 | |
| Asus ROG Zephyrus Duo 16 GX650RX | |
| SCHENKER XMG Neo 17 M22 | |
| Aorus 17X XES | |
| Lenovo Legion 7 16IAX7-82TD004SGE | |
| Average of class Gaming (19065 - 247074, n=136, last 2 years) | |
| Razer Blade 17 Early 2022 | |
| AIDA64 / CPU ZLib | |
| Average of class Gaming (373 - 2531, n=136, last 2 years) | |
| Lenovo Legion 7 16IAX7-82TD004SGE | |
| MSI Titan GT77 12UHS | |
| Average Intel Core i9-12900HX (990 - 1408, n=7) | |
| Aorus 17X XES | |
| Lenovo Legion 7 16ARHA7 | |
| Asus ROG Zephyrus Duo 16 GX650RX | |
| Asus ROG Flow X16 GV601RW-M5082W | |
| SCHENKER XMG Neo 17 M22 | |
| Razer Blade 17 Early 2022 | |
| AIDA64 / FP64 Ray-Trace | |
| Average of class Gaming (3856 - 45446, n=136, last 2 years) | |
| MSI Titan GT77 12UHS | |
| Average Intel Core i9-12900HX (6663 - 11913, n=7) | |
| Lenovo Legion 7 16ARHA7 | |
| Asus ROG Zephyrus Duo 16 GX650RX | |
| Asus ROG Flow X16 GV601RW-M5082W | |
| SCHENKER XMG Neo 17 M22 | |
| Aorus 17X XES | |
| Lenovo Legion 7 16IAX7-82TD004SGE | |
| Razer Blade 17 Early 2022 | |
| AIDA64 / CPU PhotoWorxx | |
| Average of class Gaming (10805 - 62916, n=136, last 2 years) | |
| Average Intel Core i9-12900HX (40239 - 47710, n=7) | |
| MSI Titan GT77 12UHS | |
| Aorus 17X XES | |
| Lenovo Legion 7 16IAX7-82TD004SGE | |
| Razer Blade 17 Early 2022 | |
| Lenovo Legion 7 16ARHA7 | |
| SCHENKER XMG Neo 17 M22 | |
| Asus ROG Zephyrus Duo 16 GX650RX | |
| Asus ROG Flow X16 GV601RW-M5082W | |
System Performance
Our subjective performance impression of the Legion 7 16 is excellent, which is hardly surprising given the components. The good results in the synthetic tests confirm this impression: The review device is one of the fastest devices on the market. No problems occurred during testing either.
CrossMark: Overall | Productivity | Creativity | Responsiveness
| PCMark 10 / Score | |
| Lenovo Legion 7 16IAX7-82TD004SGE | |
| MSI Titan GT77 12UHS | |
| Average of class Gaming (5776 - 9852, n=119, last 2 years) | |
| Average Intel Core i9-12900HX, NVIDIA GeForce RTX 3080 Ti Laptop GPU (6812 - 8636, n=6) | |
| Aorus 17X XES | |
| Lenovo Legion 7 16ARHA7 | |
| Razer Blade 17 Early 2022 | |
| SCHENKER XMG Neo 17 M22 | |
| Asus ROG Flow X16 GV601RW-M5082W | |
| Asus ROG Zephyrus Duo 16 GX650RX | |
| PCMark 10 / Essentials | |
| Lenovo Legion 7 16IAX7-82TD004SGE | |
| MSI Titan GT77 12UHS | |
| Average of class Gaming (9057 - 12600, n=121, last 2 years) | |
| Average Intel Core i9-12900HX, NVIDIA GeForce RTX 3080 Ti Laptop GPU (9598 - 11192, n=6) | |
| Aorus 17X XES | |
| Lenovo Legion 7 16ARHA7 | |
| Razer Blade 17 Early 2022 | |
| Asus ROG Flow X16 GV601RW-M5082W | |
| SCHENKER XMG Neo 17 M22 | |
| Asus ROG Zephyrus Duo 16 GX650RX | |
| PCMark 10 / Productivity | |
| Lenovo Legion 7 16IAX7-82TD004SGE | |
| Average Intel Core i9-12900HX, NVIDIA GeForce RTX 3080 Ti Laptop GPU (9365 - 10932, n=6) | |
| Aorus 17X XES | |
| MSI Titan GT77 12UHS | |
| Average of class Gaming (6662 - 14612, n=119, last 2 years) | |
| Asus ROG Flow X16 GV601RW-M5082W | |
| SCHENKER XMG Neo 17 M22 | |
| Razer Blade 17 Early 2022 | |
| Lenovo Legion 7 16ARHA7 | |
| Asus ROG Zephyrus Duo 16 GX650RX | |
| PCMark 10 / Digital Content Creation | |
| Lenovo Legion 7 16IAX7-82TD004SGE | |
| Average of class Gaming (7440 - 19351, n=119, last 2 years) | |
| MSI Titan GT77 12UHS | |
| Average Intel Core i9-12900HX, NVIDIA GeForce RTX 3080 Ti Laptop GPU (9543 - 14291, n=6) | |
| Aorus 17X XES | |
| Lenovo Legion 7 16ARHA7 | |
| Razer Blade 17 Early 2022 | |
| SCHENKER XMG Neo 17 M22 | |
| Asus ROG Zephyrus Duo 16 GX650RX | |
| Asus ROG Flow X16 GV601RW-M5082W | |
| CrossMark / Overall | |
| Aorus 17X XES | |
| Average Intel Core i9-12900HX, NVIDIA GeForce RTX 3080 Ti Laptop GPU (2108 - 2170, n=5) | |
| Lenovo Legion 7 16IAX7-82TD004SGE | |
| MSI Titan GT77 12UHS | |
| Average of class Gaming (1247 - 2344, n=109, last 2 years) | |
| Razer Blade 17 Early 2022 | |
| Asus ROG Zephyrus Duo 16 GX650RX | |
| SCHENKER XMG Neo 17 M22 | |
| Asus ROG Flow X16 GV601RW-M5082W | |
| Lenovo Legion 7 16ARHA7 | |
| CrossMark / Productivity | |
| Aorus 17X XES | |
| Average Intel Core i9-12900HX, NVIDIA GeForce RTX 3080 Ti Laptop GPU (1978 - 2047, n=5) | |
| Lenovo Legion 7 16IAX7-82TD004SGE | |
| MSI Titan GT77 12UHS | |
| Average of class Gaming (1299 - 2211, n=109, last 2 years) | |
| Razer Blade 17 Early 2022 | |
| Asus ROG Zephyrus Duo 16 GX650RX | |
| SCHENKER XMG Neo 17 M22 | |
| Asus ROG Flow X16 GV601RW-M5082W | |
| Lenovo Legion 7 16ARHA7 | |
| CrossMark / Creativity | |
| Average Intel Core i9-12900HX, NVIDIA GeForce RTX 3080 Ti Laptop GPU (2288 - 2366, n=5) | |
| Lenovo Legion 7 16IAX7-82TD004SGE | |
| Aorus 17X XES | |
| MSI Titan GT77 12UHS | |
| Average of class Gaming (1275 - 2729, n=109, last 2 years) | |
| Razer Blade 17 Early 2022 | |
| SCHENKER XMG Neo 17 M22 | |
| Asus ROG Flow X16 GV601RW-M5082W | |
| Lenovo Legion 7 16ARHA7 | |
| Asus ROG Zephyrus Duo 16 GX650RX | |
| CrossMark / Responsiveness | |
| Aorus 17X XES | |
| Average Intel Core i9-12900HX, NVIDIA GeForce RTX 3080 Ti Laptop GPU (1991 - 2090, n=5) | |
| Lenovo Legion 7 16IAX7-82TD004SGE | |
| MSI Titan GT77 12UHS | |
| Average of class Gaming (1030 - 2330, n=109, last 2 years) | |
| Asus ROG Zephyrus Duo 16 GX650RX | |
| Razer Blade 17 Early 2022 | |
| Asus ROG Flow X16 GV601RW-M5082W | |
| SCHENKER XMG Neo 17 M22 | |
| Lenovo Legion 7 16ARHA7 | |
| PCMark 10 Score | 8636 points | |
Help | ||
| AIDA64 / Memory Copy | |
| Average of class Gaming (21750 - 97515, n=136, last 2 years) | |
| Average Intel Core i9-12900HX (62852 - 70863, n=7) | |
| MSI Titan GT77 12UHS | |
| Lenovo Legion 7 16IAX7-82TD004SGE | |
| Aorus 17X XES | |
| Razer Blade 17 Early 2022 | |
| Asus ROG Zephyrus Duo 16 GX650RX | |
| Lenovo Legion 7 16ARHA7 | |
| SCHENKER XMG Neo 17 M22 | |
| Asus ROG Flow X16 GV601RW-M5082W | |
| AIDA64 / Memory Read | |
| Average of class Gaming (22956 - 104349, n=136, last 2 years) | |
| Lenovo Legion 7 16IAX7-82TD004SGE | |
| Aorus 17X XES | |
| Average Intel Core i9-12900HX (62140 - 72930, n=7) | |
| Razer Blade 17 Early 2022 | |
| MSI Titan GT77 12UHS | |
| Asus ROG Zephyrus Duo 16 GX650RX | |
| Lenovo Legion 7 16ARHA7 | |
| SCHENKER XMG Neo 17 M22 | |
| Asus ROG Flow X16 GV601RW-M5082W | |
| AIDA64 / Memory Write | |
| Average of class Gaming (22297 - 133486, n=136, last 2 years) | |
| Lenovo Legion 7 16IAX7-82TD004SGE | |
| Average Intel Core i9-12900HX (60001 - 68782, n=7) | |
| MSI Titan GT77 12UHS | |
| Aorus 17X XES | |
| Razer Blade 17 Early 2022 | |
| Asus ROG Zephyrus Duo 16 GX650RX | |
| SCHENKER XMG Neo 17 M22 | |
| Lenovo Legion 7 16ARHA7 | |
| Asus ROG Flow X16 GV601RW-M5082W | |
| AIDA64 / Memory Latency | |
| Average of class Gaming (59.5 - 259, n=136, last 2 years) | |
| Asus ROG Flow X16 GV601RW-M5082W | |
| Asus ROG Zephyrus Duo 16 GX650RX | |
| SCHENKER XMG Neo 17 M22 | |
| MSI Titan GT77 12UHS | |
| Average Intel Core i9-12900HX (83.9 - 93.4, n=7) | |
| Aorus 17X XES | |
| Lenovo Legion 7 16IAX7-82TD004SGE | |
| Lenovo Legion 7 16ARHA7 | |
* ... smaller is better
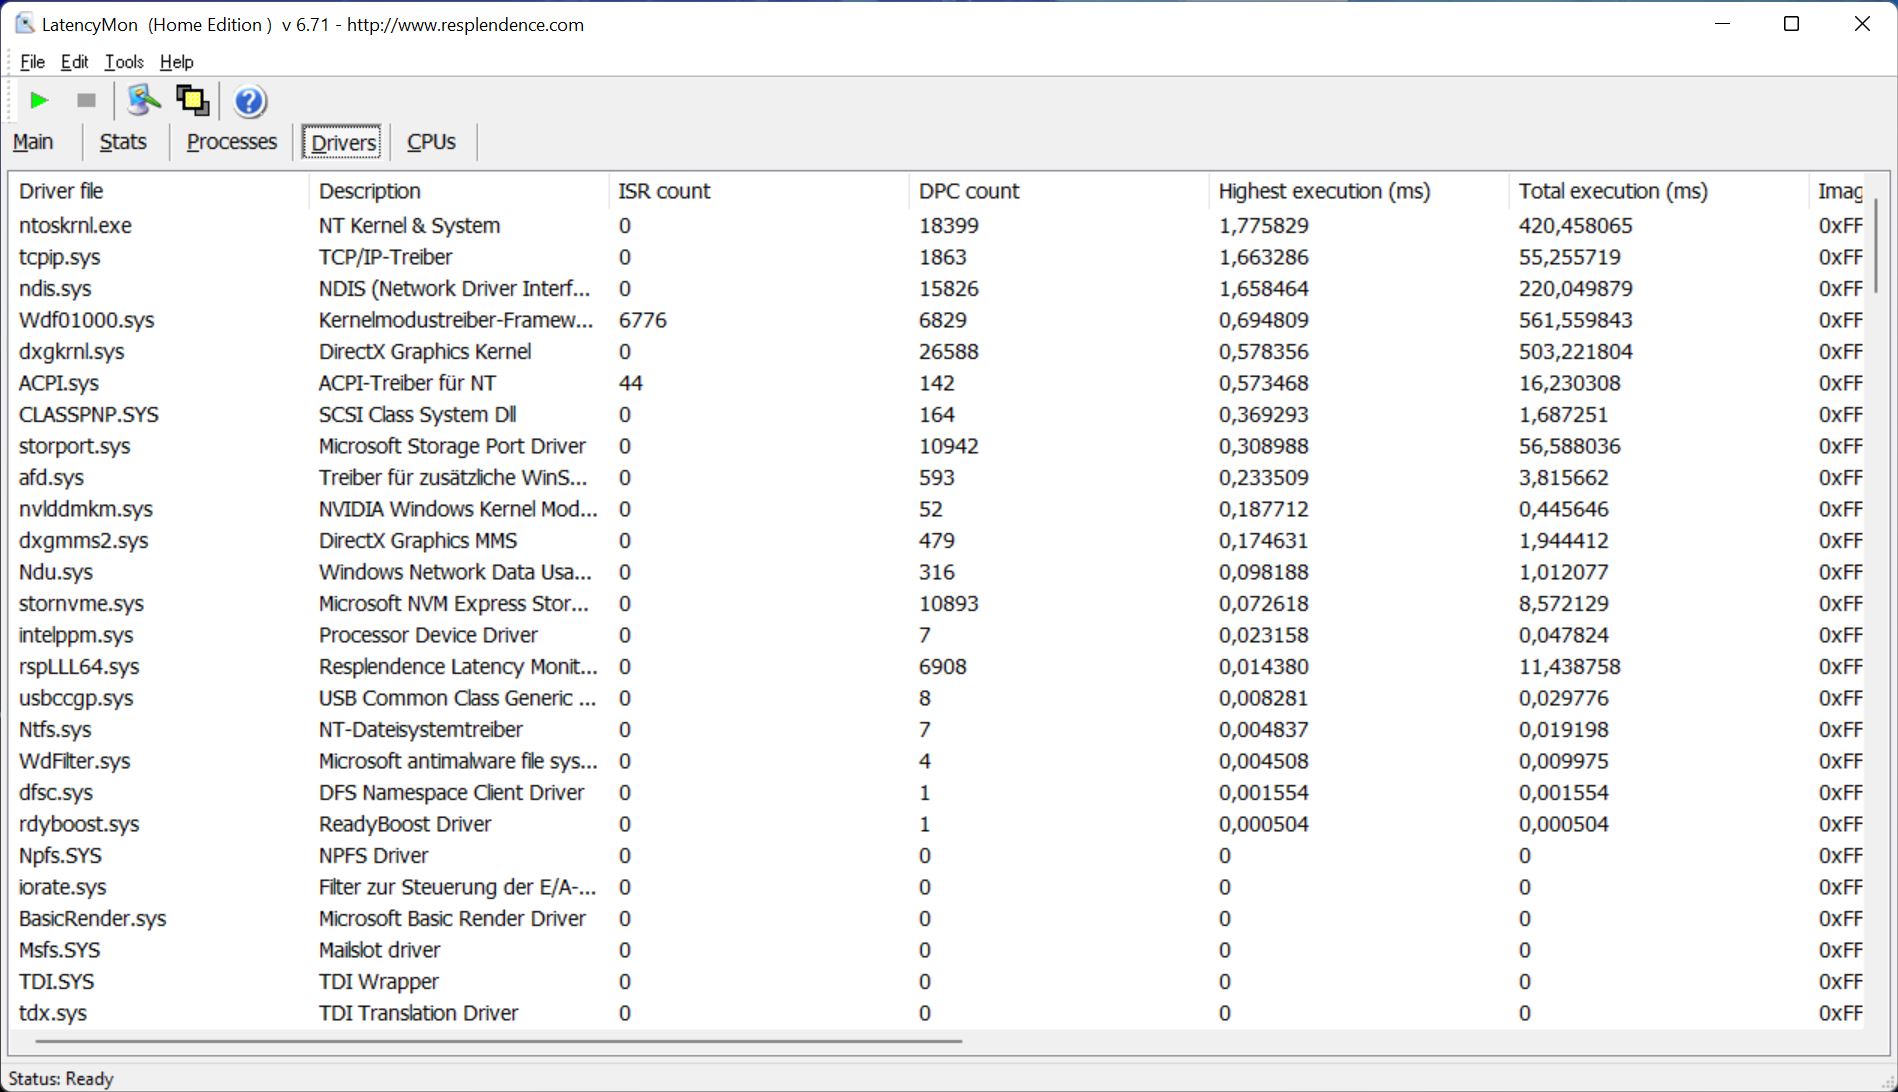
DPC Latency
In our standardized latency test (web browsing, 4K YouTube playback, CPU load), the review device shows slight limitations with the present BIOS version and is therefore not optimally suited to the use of real-time audio applications.

| DPC Latencies / LatencyMon - interrupt to process latency (max), Web, Youtube, Prime95 | |
| SCHENKER XMG Neo 17 M22 | |
| MSI Titan GT77 12UHS | |
| MSI Titan GT77 12UHS | |
| Lenovo Legion 7 16ARHA7 | |
| Asus ROG Flow X16 GV601RW-M5082W | |
| Lenovo Legion 7 16IAX7-82TD004SGE | |
| Aorus 17X XES | |
| Asus ROG Zephyrus Duo 16 GX650RX | |
| Razer Blade 17 Early 2022 | |
* ... smaller is better
Storage Devices
The Legion offers two modern PCIe 4.0 slots for M.2-2280 SSDs, which are also equipped with a heat sink. In our review configuration, one of the slots is unoccupied, the other is equipped with a fast Micron 3400-SSD that offers a storage capacity of 1 TB (886 GB is available after the first start-up). Transfer rates are excellent at over 6 GB/s and there is only a minimal drop in performance during prolonged load. No temperature problems were registered. More SSD benchmarks are available here.

* ... smaller is better
Sustained Read Performance: DiskSpd Read Loop, Queue Depth 8
Graphics Card
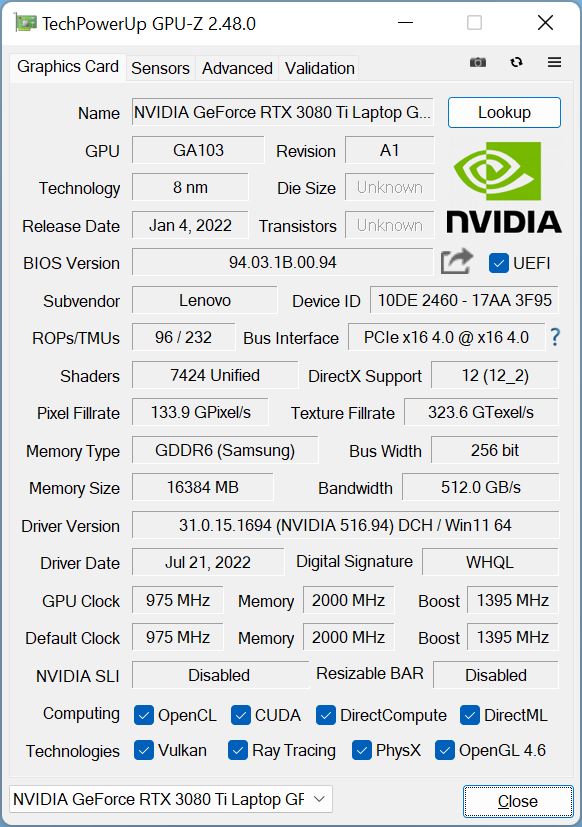
The Nvidia GeForce RTX 3080 Ti is currently the fastest mobile graphics card and runs with a TGP of up to 180 watts in the Legion 7 16. The maximum core clock is 1,590 MHz and the graphics memory is 16 GB. Performance is excellent in the synthetic benchmarks and overall just under 10% ahead of the average results for the RTX 3080 Ti in our database. However, the Radeon RX 6850M XT is only marginally slower in the synthetic tests.
In addition to hybrid mode, which automatically activates the Nvidia GPU under load, you can also completely disable the integrated graphics card for slightly more performance, although this requires a restart.
Graphics performance remains stable even during longer load. However, the GPU is only allowed to consume a maximum of 45 watts on battery power, which is why GPU performance drops by 75% when disconnected from the power supply. More GPU benchmarks are available here.
| 3DMark 11 Performance | 37061 points | |
| 3DMark Fire Strike Score | 30432 points | |
| 3DMark Time Spy Score | 12751 points | |
Help | ||
| Blender | |
| Lenovo Legion 7 16IAX7-82TD004SGE | |
| v3.3 Classroom CPU * | |
| v3.3 Classroom CUDA * | |
| v3.3 Classroom OPTIX/RTX * | |
| MSI Titan GT77 12UHS | |
| v3.3 Classroom CPU * | |
| v3.3 Classroom CUDA * | |
| v3.3 Classroom OPTIX/RTX * | |
| Aorus 17X XES | |
| v3.3 Classroom CPU * | |
| v3.3 Classroom CUDA * | |
| v3.3 Classroom OPTIX/RTX * | |
| Asus ROG Flow X16 GV601RW-M5082W | |
| v3.3 Classroom CPU * | |
| v3.3 Classroom CUDA * | |
| Lenovo Legion 7 16ARHA7 | |
| v3.3 Classroom CPU * | |
| v3.3 Classroom HIP/AMD * | |
| Average of class Gaming | |
| v3.3 Classroom CPU * | |
| v3.3 Classroom CUDA * | |
| v3.3 Classroom OPTIX/RTX * | |
| v3.3 Classroom HIP/AMD * | |
* ... smaller is better | |
Gaming Performance
The gaming performance of the Legion 7 16 is very good, as expected. Even demanding titles such as Cyberpunk 2077 still run smoothly in native QHD resolution. Overall, the results are very good, but in many cases the Radeon RX 6850M XT is not far behind and is considerably cheaper. On the other hand, gaming performance takes a massive drop when the Legion is disconnected from the power socket. Witcher 3, for example, only ran at 30 FPS for 55 minutes in ultra settings.
Witcher 3 FPS Chart
| low | med. | high | ultra | QHD | |
|---|---|---|---|---|---|
| GTA V (2015) | 187.1 | 186.5 | 183.4 | 111.4 | 82.4 |
| The Witcher 3 (2015) | 279 | 251 | 114.4 | ||
| Dota 2 Reborn (2015) | 206 | 185.1 | 177.8 | 168 | |
| Final Fantasy XV Benchmark (2018) | 223 | 163.9 | 121.2 | 92.8 | |
| X-Plane 11.11 (2018) | 170.5 | 150.5 | 120.2 | ||
| Far Cry 5 (2018) | 192 | 176 | 166 | 153 | 129 |
| Strange Brigade (2018) | 361 | 194 | 156 | 137.6 | 107 |
| F1 2021 (2021) | 337 | 207 | 182.1 | 97.5 | 74.9 |
| Cyberpunk 2077 1.6 (2022) | 89 | 78 | 64 | 54 | 36 |
Emissions - Legion with loud fans
Noise
The cooling system of the Legion 7 16 consists of a vapor chamber and two fans. The two fans are often inactive when the laptop is idle, but they also start up from time to time and you can hear a slight hissing noise. As soon as the processor or the GPU is placed under stress, the laptop becomes quickly and noticeably loud. Depending on the game, you can use Quiet mode to test whether the game still runs smoothly on the desired settings. Users can play without headphones up to around 40 dB(A), but not in the other two modes. Here we measured between 46 and 49 dB(A) in Witcher 3 and even up to 54 dB(A) in the stress test. The fans continue to run for a few minutes at around 32 dB(A) after the load is stopped. No other electronic noises were registered.
Noise Level
| Idle |
| 24.5 / 30 / 32.5 dB(A) |
| Load |
| 43.9 / 54.2 dB(A) |
 | ||
30 dB silent 40 dB(A) audible 50 dB(A) loud |
||
min: | ||
| Lenovo Legion 7 16IAX7-82TD004SGE GeForce RTX 3080 Ti Laptop GPU, i9-12900HX, Micron 3400 1TB MTFDKBA1T0TFH | SCHENKER XMG Neo 17 M22 GeForce RTX 3080 Ti Laptop GPU, R9 6900HX, Samsung SSD 980 Pro 1TB MZ-V8P1T0BW | MSI Titan GT77 12UHS GeForce RTX 3080 Ti Laptop GPU, i9-12900HX, Samsung PM9A1 MZVL21T0HCLR | Aorus 17X XES GeForce RTX 3070 Ti Laptop GPU, i9-12900HX, Gigabyte AG470S1TB-SI B10 | Asus ROG Flow X16 GV601RW-M5082W GeForce RTX 3070 Ti Laptop GPU, R9 6900HS, Micron 3400 1TB MTFDKBA1T0TFH | Razer Blade 17 Early 2022 GeForce RTX 3080 Ti Laptop GPU, i9-12900H, Samsung PM9A1 MZVL21T0HCLR | Asus ROG Zephyrus Duo 16 GX650RX GeForce RTX 3080 Ti Laptop GPU, R9 6900HX, 2x Samsung SSD 980 Pro 2TB MZ-V8P2T0 (RAID 0) | Lenovo Legion 7 16ARHA7 Radeon RX 6850M XT, R9 6900HX, Samsung PM9A1 MZVL22T0HBLB | |
|---|---|---|---|---|---|---|---|---|
| Noise | -7% | 5% | -11% | 1% | -2% | 4% | 13% | |
| off / environment * (dB) | 24.5 | 26 -6% | 21.9 11% | 26 -6% | 25.5 -4% | 26 -6% | 26 -6% | 22.8 7% |
| Idle Minimum * (dB) | 24.5 | 26 -6% | 24.53 -0% | 28 -14% | 25.5 -4% | 26 -6% | 26 -6% | 23 6% |
| Idle Average * (dB) | 30 | 29 3% | 24.53 18% | 32 -7% | 25.5 15% | 27 10% | 27 10% | 23 23% |
| Idle Maximum * (dB) | 32.5 | 40 -23% | 24.53 25% | 38 -17% | 27.4 16% | 32 2% | 29 11% | 23 29% |
| Load Average * (dB) | 43.9 | 47 -7% | 46.25 -5% | 53 -21% | 49.9 -14% | 50 -14% | 41 7% | 26.8 39% |
| Witcher 3 ultra * (dB) | 48.8 | 52 -7% | 56.86 -17% | 54 -11% | 51 -5% | 48 2% | 54.3 -11% | |
| Load Maximum * (dB) | 54.2 | 54 -0% | 54.25 -0% | 55 -1% | 55 -1% | 51 6% | 50 8% | 54.2 -0% |
* ... smaller is better
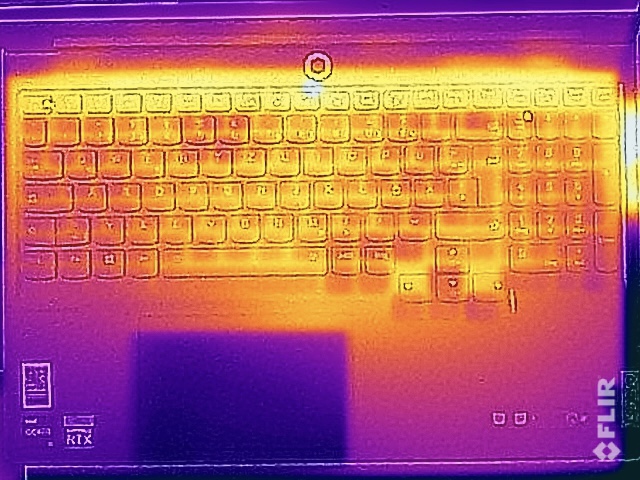
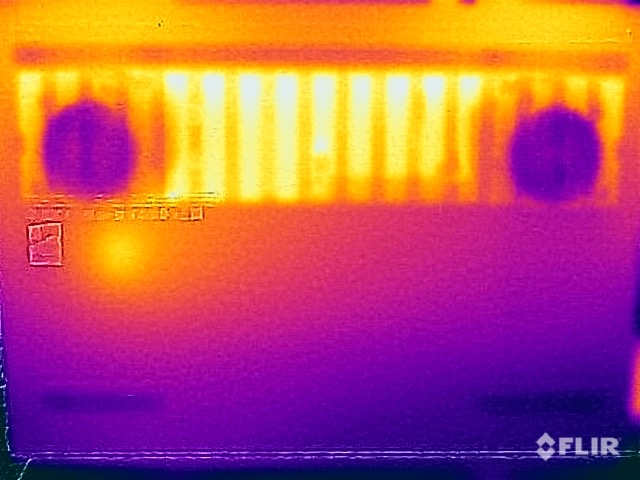
Temperature
Since the fans are deactivated when the laptop is idle, the surfaces in the rear area heat up noticeably, but this does not result in any limitations. However, you should not place the device on your thighs when gaming, for we measured temperatures of up to 60 °C on the underside. The keyboard area also heats up considerably at 45 °C, which is also noticeable, but apart from slightly warmer fingers, continued typing poses no issue.
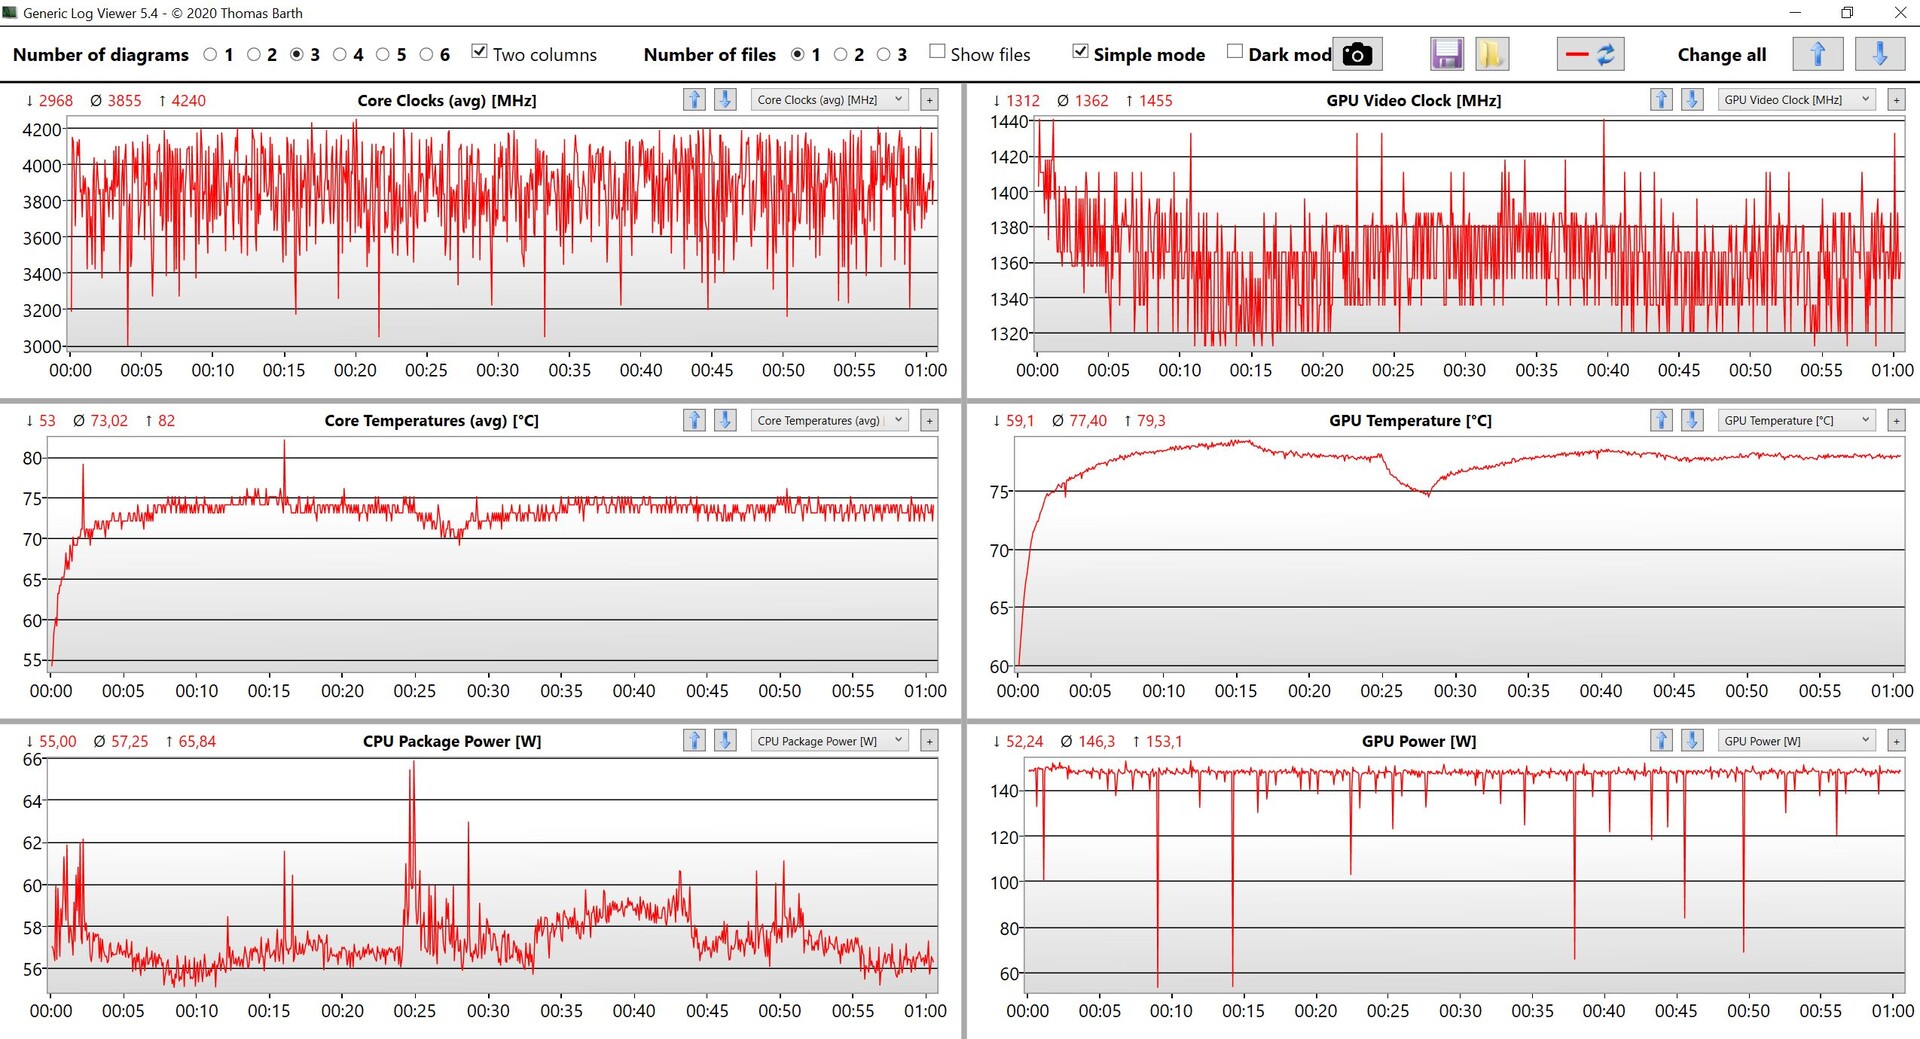
In the stress test, the processor quickly levels off at ~93 watts and the graphics card at ~150 watts. These values also remain stable throughout the test.

(±) The maximum temperature on the upper side is 44.4 °C / 112 F, compared to the average of 40.5 °C / 105 F, ranging from 21.2 to 68.8 °C for the class Gaming.
(-) The bottom heats up to a maximum of 60.8 °C / 141 F, compared to the average of 43.3 °C / 110 F
(+) In idle usage, the average temperature for the upper side is 31.1 °C / 88 F, compared to the device average of 33.9 °C / 93 F.
(-) Playing The Witcher 3, the average temperature for the upper side is 39.1 °C / 102 F, compared to the device average of 33.9 °C / 93 F.
(±) The palmrests and touchpad can get very hot to the touch with a maximum of 39.6 °C / 103.3 F.
(-) The average temperature of the palmrest area of similar devices was 28.9 °C / 84 F (-10.7 °C / -19.3 F).
| Lenovo Legion 7 16IAX7-82TD004SGE Intel Core i9-12900HX, NVIDIA GeForce RTX 3080 Ti Laptop GPU | SCHENKER XMG Neo 17 M22 AMD Ryzen 9 6900HX, NVIDIA GeForce RTX 3080 Ti Laptop GPU | MSI Titan GT77 12UHS Intel Core i9-12900HX, NVIDIA GeForce RTX 3080 Ti Laptop GPU | Aorus 17X XES Intel Core i9-12900HX, NVIDIA GeForce RTX 3070 Ti Laptop GPU | Asus ROG Flow X16 GV601RW-M5082W AMD Ryzen 9 6900HS, NVIDIA GeForce RTX 3070 Ti Laptop GPU | Razer Blade 17 Early 2022 Intel Core i9-12900H, NVIDIA GeForce RTX 3080 Ti Laptop GPU | Asus ROG Zephyrus Duo 16 GX650RX AMD Ryzen 9 6900HX, NVIDIA GeForce RTX 3080 Ti Laptop GPU | Lenovo Legion 7 16ARHA7 AMD Ryzen 9 6900HX, AMD Radeon RX 6850M XT | |
|---|---|---|---|---|---|---|---|---|
| Heat | 8% | 5% | -7% | -1% | -3% | 9% | 15% | |
| Maximum Upper Side * (°C) | 44.4 | 49 -10% | 40.8 8% | 54 -22% | 55.1 -24% | 50 -13% | 45 -1% | 37.2 16% |
| Maximum Bottom * (°C) | 60.8 | 52 14% | 52.4 14% | 58 5% | 50.3 17% | 56 8% | 50 18% | 43 29% |
| Idle Upper Side * (°C) | 33.8 | 30 11% | 34.6 -2% | 37 -9% | 35.5 -5% | 36 -7% | 33 2% | 34 -1% |
| Idle Bottom * (°C) | 38.8 | 33 15% | 38.4 1% | 39 -1% | 36.1 7% | 38 2% | 33 15% | 32.8 15% |
* ... smaller is better
Speakers
Despite the large case, Lenovo only installs two stereo speakers (2x 2 watts), which are acceptable in terms of sound but nothing special. The speakers are not the best for gaming anyway, so users should use headphones. When manufacturers install sound systems with 4 or 6 modules into compact ultrabooks, you should expect better speakers, even in a flagship gaming laptop.
Lenovo Legion 7 16IAX7-82TD004SGE audio analysis
(+) | speakers can play relatively loud (83 dB)
Bass 100 - 315 Hz
(±) | reduced bass - on average 8.3% lower than median
(±) | linearity of bass is average (10.9% delta to prev. frequency)
Mids 400 - 2000 Hz
(±) | higher mids - on average 6.1% higher than median
(±) | linearity of mids is average (7.9% delta to prev. frequency)
Highs 2 - 16 kHz
(+) | balanced highs - only 3.1% away from median
(+) | highs are linear (5.6% delta to prev. frequency)
Overall 100 - 16.000 Hz
(+) | overall sound is linear (14.9% difference to median)
Compared to same class
» 30% of all tested devices in this class were better, 6% similar, 64% worse
» The best had a delta of 6%, average was 18%, worst was 132%
Compared to all devices tested
» 19% of all tested devices were better, 4% similar, 77% worse
» The best had a delta of 4%, average was 24%, worst was 134%
Asus ROG Zephyrus Duo 16 GX650RX audio analysis
(±) | speaker loudness is average but good (80 dB)
Bass 100 - 315 Hz
(±) | reduced bass - on average 8.9% lower than median
(±) | linearity of bass is average (12.4% delta to prev. frequency)
Mids 400 - 2000 Hz
(±) | higher mids - on average 6.8% higher than median
(+) | mids are linear (4.3% delta to prev. frequency)
Highs 2 - 16 kHz
(±) | reduced highs - on average 6% lower than median
(±) | linearity of highs is average (7.3% delta to prev. frequency)
Overall 100 - 16.000 Hz
(±) | linearity of overall sound is average (16.5% difference to median)
Compared to same class
» 42% of all tested devices in this class were better, 6% similar, 52% worse
» The best had a delta of 6%, average was 18%, worst was 132%
Compared to all devices tested
» 26% of all tested devices were better, 6% similar, 68% worse
» The best had a delta of 4%, average was 24%, worst was 134%
Energy Management - Gamer with short stamina
Power Consumption
The Legion 7 16 is not a particularly economical notebook. Even in idle, we measured more than 25 watts. When gaming, you can expect around 250 watts, and is even slightly above 300 watts for a short time in the stress test. The included 300-watt power supply is thus just sufficient, but leaves no room for battery charging in cases of extreme load.
| Off / Standby | |
| Idle | |
| Load |
|
Key:
min: | |
| Lenovo Legion 7 16IAX7-82TD004SGE i9-12900HX, GeForce RTX 3080 Ti Laptop GPU, Micron 3400 1TB MTFDKBA1T0TFH, IPS, 2560x1600, 16" | SCHENKER XMG Neo 17 M22 R9 6900HX, GeForce RTX 3080 Ti Laptop GPU, Samsung SSD 980 Pro 1TB MZ-V8P1T0BW, IPS, 2560x1600, 17" | MSI Titan GT77 12UHS i9-12900HX, GeForce RTX 3080 Ti Laptop GPU, Samsung PM9A1 MZVL21T0HCLR, IPS-Level, 1920x1080, 17.3" | Aorus 17X XES i9-12900HX, GeForce RTX 3070 Ti Laptop GPU, Gigabyte AG470S1TB-SI B10, IPS, 1920x1080, 17.3" | Asus ROG Flow X16 GV601RW-M5082W R9 6900HS, GeForce RTX 3070 Ti Laptop GPU, Micron 3400 1TB MTFDKBA1T0TFH, Mini LED, 2560x1600, 16.1" | Razer Blade 17 Early 2022 i9-12900H, GeForce RTX 3080 Ti Laptop GPU, Samsung PM9A1 MZVL21T0HCLR, IPS, 3840x2160, 17.3" | Asus ROG Zephyrus Duo 16 GX650RX R9 6900HX, GeForce RTX 3080 Ti Laptop GPU, 2x Samsung SSD 980 Pro 2TB MZ-V8P2T0 (RAID 0), IPS-Level, 3840x2400, 16" | Lenovo Legion 7 16ARHA7 R9 6900HX, Radeon RX 6850M XT, Samsung PM9A1 MZVL22T0HBLB, IPS, 2560x1600, 16" | Average NVIDIA GeForce RTX 3080 Ti Laptop GPU | Average of class Gaming | |
|---|---|---|---|---|---|---|---|---|---|---|
| Power Consumption | 34% | -18% | -6% | 5% | 6% | 9% | 19% | 4% | 15% | |
| Idle Minimum * (Watt) | 19.2 | 7 64% | 30.21 -57% | 18 6% | 12.2 36% | 17 11% | 19 1% | 9.9 48% | 17.2 ? 10% | 14.4 ? 25% |
| Idle Average * (Watt) | 25.1 | 11 56% | 32.42 -29% | 28 -12% | 25.5 -2% | 23 8% | 24 4% | 22 12% | 23.3 ? 7% | 20.5 ? 18% |
| Idle Maximum * (Watt) | 27.1 | 17 37% | 33.7 -24% | 36 -33% | 29.8 -10% | 34 -25% | 31 -14% | 23.1 15% | 30.8 ? -14% | 27.4 ? -1% |
| Load Average * (Watt) | 132 | 92 30% | 125.09 5% | 153 -16% | 183 -39% | 120 9% | 104 21% | 94.4 28% | 121.2 ? 8% | 110.7 ? 16% |
| Witcher 3 ultra * (Watt) | 253 | 221 13% | 256 -1% | 221 13% | 183.6 27% | 229 9% | 186.5 26% | 249 2% | ||
| Load Maximum * (Watt) | 308.9 | 306 1% | 321.88 -4% | 290 6% | 253 18% | 243 21% | 256 17% | 276 11% | 276 ? 11% | 263 ? 15% |
* ... smaller is better
Power consumption Witcher 3 / Stress test
Power consumption with an external monitor
Battery Life
Although Lenovo installs the largest possible battery with 99.99 Wh, the components simply require a lot of power and even with active graphics switching, the runtimes are limited to a maximum of 4-5 hours in practice. Under load, the laptop is out of juice after just one hour despite reduced performance. At least the battery is recharged quickly with the 300-watt power adapter, especially when the express charging function is active. It then takes just 71 minutes before the battery is fully recharged when the device is switched on.
| Lenovo Legion 7 16IAX7-82TD004SGE i9-12900HX, GeForce RTX 3080 Ti Laptop GPU, 99 Wh | SCHENKER XMG Neo 17 M22 R9 6900HX, GeForce RTX 3080 Ti Laptop GPU, 99 Wh | MSI Titan GT77 12UHS i9-12900HX, GeForce RTX 3080 Ti Laptop GPU, 99.9 Wh | Aorus 17X XES i9-12900HX, GeForce RTX 3070 Ti Laptop GPU, 99 Wh | Asus ROG Flow X16 GV601RW-M5082W R9 6900HS, GeForce RTX 3070 Ti Laptop GPU, 90 Wh | Razer Blade 17 Early 2022 i9-12900H, GeForce RTX 3080 Ti Laptop GPU, 82 Wh | Asus ROG Zephyrus Duo 16 GX650RX R9 6900HX, GeForce RTX 3080 Ti Laptop GPU, 90 Wh | Lenovo Legion 7 16ARHA7 R9 6900HX, Radeon RX 6850M XT, 99 Wh | Average of class Gaming | |
|---|---|---|---|---|---|---|---|---|---|
| Battery Runtime | 95% | 65% | 24% | 19% | 40% | 66% | 110% | 54% | |
| H.264 (h) | 5.1 | 6.6 29% | 7.2 41% | 3.8 -25% | 4.8 -6% | 9.3 82% | 7.77 ? 52% | ||
| WiFi v1.3 (h) | 4.5 | 9 100% | 6.9 53% | 4.4 -2% | 5.7 27% | 3.8 -16% | 7.8 73% | 7.3 62% | 6.51 ? 45% |
| Witcher 3 ultra (h) | 0.9 | 1.5 67% | 0.9 0% | 1.039 ? 15% | |||||
| Load (h) | 0.7 | 1.8 157% | 1.4 100% | 1.4 100% | 0.9 29% | 1.7 143% | 1 43% | 1.8 157% | 1.431 ? 104% |
| Reader / Idle (h) | 12 | 7.1 | 12.5 | 4.9 | 9.71 ? |
Pros
Cons
Verdict - Legion 7 is an excellent gamer
The new Lenovo Legion 7 is a very good gaming notebook that, despite its comparatively compact compact 16-inch case, does not have to do without the most powerful components. Thanks to good cooling, no compromises are made in terms of performance. Both the Core i9-12900HX and the GeForce RTX 3080 Ti perform at a very high level. However, this comes at a price: considering the performance of the much cheaper AMD model, this inevitably raises the question of the price-performance ratio, which is no longer particularly good at 4,500 Euros (~US$ 4,500).
A better panel would have also been desirable for this price. There is no question that the matte WQHD panel with 165 Hz is very suitable for gaming, but an OLED or mini-LED display would have been even better. The keyboard also has room for improvement.
Full power ahead: Lenovo combines the fastest components on the market in the Legion 7 16 and installs them in a stylish aluminum case with extensive lighting. However, the top model is also very expensive at an RRP of 4,500 Euros (~US$ 4,500).
The AMD models of the Legion 7 16 have a big advantage in terms of price-performance ratio, but competing 17-inch devices with comparable equipment (Intel HX CPU, GeForce RTX 3080 Ti) are not really cheaper either.
Price and Availability
Users are advised to check directly via Lenovo's website from their location (where applicable). We found, for example, that the Lenovo Legion 7 16 is available in the UK (£2,515.99), France (2,829.65€), the USA ($2,094.39), Singapore (SG$3,047.50) and India (₹237,595).
These represent the starting prices; users wanting more powerful components will be required to pay more. US readers should note that the model linked here is the AMD variant, not the Intel, which does not yet appear to be available in the US.
Note: This list is not exhaustive. Prices are as of 16.09.22 and subject to change.
Lenovo Legion 7 16IAX7-82TD004SGE
- 09/15/2022 v7 (old)
Andreas Osthoff
More articles related to this device
Lenovo Legion 7 16IAX7-82TD004SGE (Legion 7 16 Series)Related Articles


Price comparison

