Razer Blade 15 Advanced Model Early 2022 review - Compact gaming laptop with fast display
Packed with the latest Intel and Nvidia chips, the Razer Blade 15 2022 spring model promises iterative improvements for the popular 15-inch gaming laptop range. The main difference between the model reviewed here and the previously reviewed Blade 15 2022 is the 1080p 360 Hz panel, so readers can stick to this review for details on the largely identical physical specs. The Blade 15's direct competitors include other high-performance 15.6-inch gaming laptops such as the Schenker XMG Neo 15 E22, the Asus ROG Strix Scar 15, the MSI Stealth GS66 12UGS and the MSI Vector GP66 12UGS.
Further Razer reviews:
Possible Competitors in Comparison
Rating | Date | Model | Weight | Height | Size | Resolution | Price |
|---|---|---|---|---|---|---|---|
| 88.3 % v7 (old) | 05 / 2022 | Razer Blade 15 Advanced Model Early 2022 i7-12800H, GeForce RTX 3080 Ti Laptop GPU | 2.1 kg | 16.99 mm | 15.60" | 1920x1080 | |
| 89.1 % v7 (old) | 03 / 2022 | Razer Blade 15 2022 i7-12800H, GeForce RTX 3080 Ti Laptop GPU | 2.1 kg | 16.99 mm | 15.60" | 2560x1440 | |
v (old) | 03 / 2022 | Schenker XMG Neo 15 E22 (Early 2022, RTX 3080 Ti) i7-12700H, GeForce RTX 3080 Ti Laptop GPU | 2.2 kg | 26.6 mm | 15.60" | 2560x1440 | |
| 86.3 % v7 (old) | 07 / 2021 | Asus ROG Strix Scar 15 G533QS R9 5900HX, GeForce RTX 3080 Laptop GPU | 2.3 kg | 27.2 mm | 15.60" | 2560x1440 | |
| 84.5 % v7 (old) | 02 / 2022 | MSI Stealth GS66 12UGS i7-12700H, GeForce RTX 3070 Ti Laptop GPU | 2.2 kg | 19.8 mm | 15.60" | 2560x1440 | |
| 86.9 % v7 (old) | 03 / 2022 | MSI Vector GP66 12UGS i9-12900H, GeForce RTX 3070 Ti Laptop GPU | 2.3 kg | 23.4 mm | 15.60" | 1920x1080 |
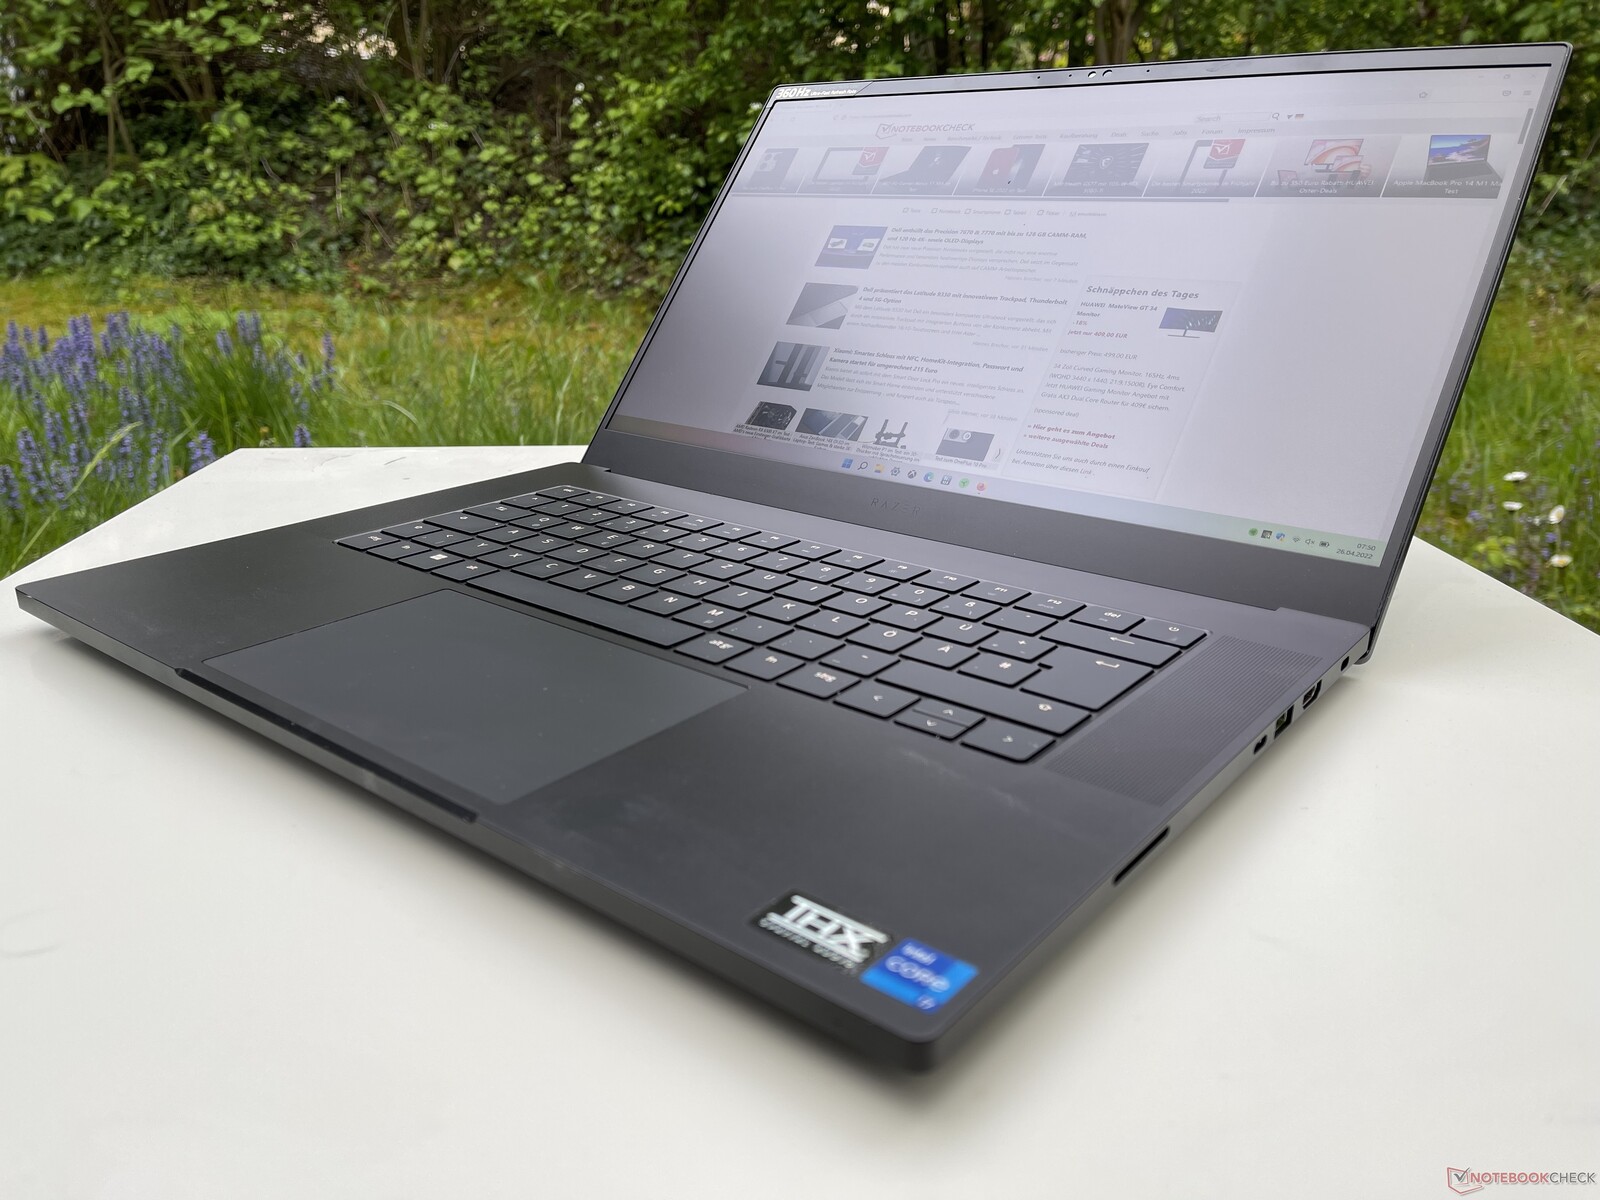
Case - Compact and suitable for travel
For the case, we again see the familiar, slick metal construction with which the Blade series originally made a name for itself. Stability, workmanship and torsion resistance thus remain excellent. The flipside is the high susceptibility to fingerprints.
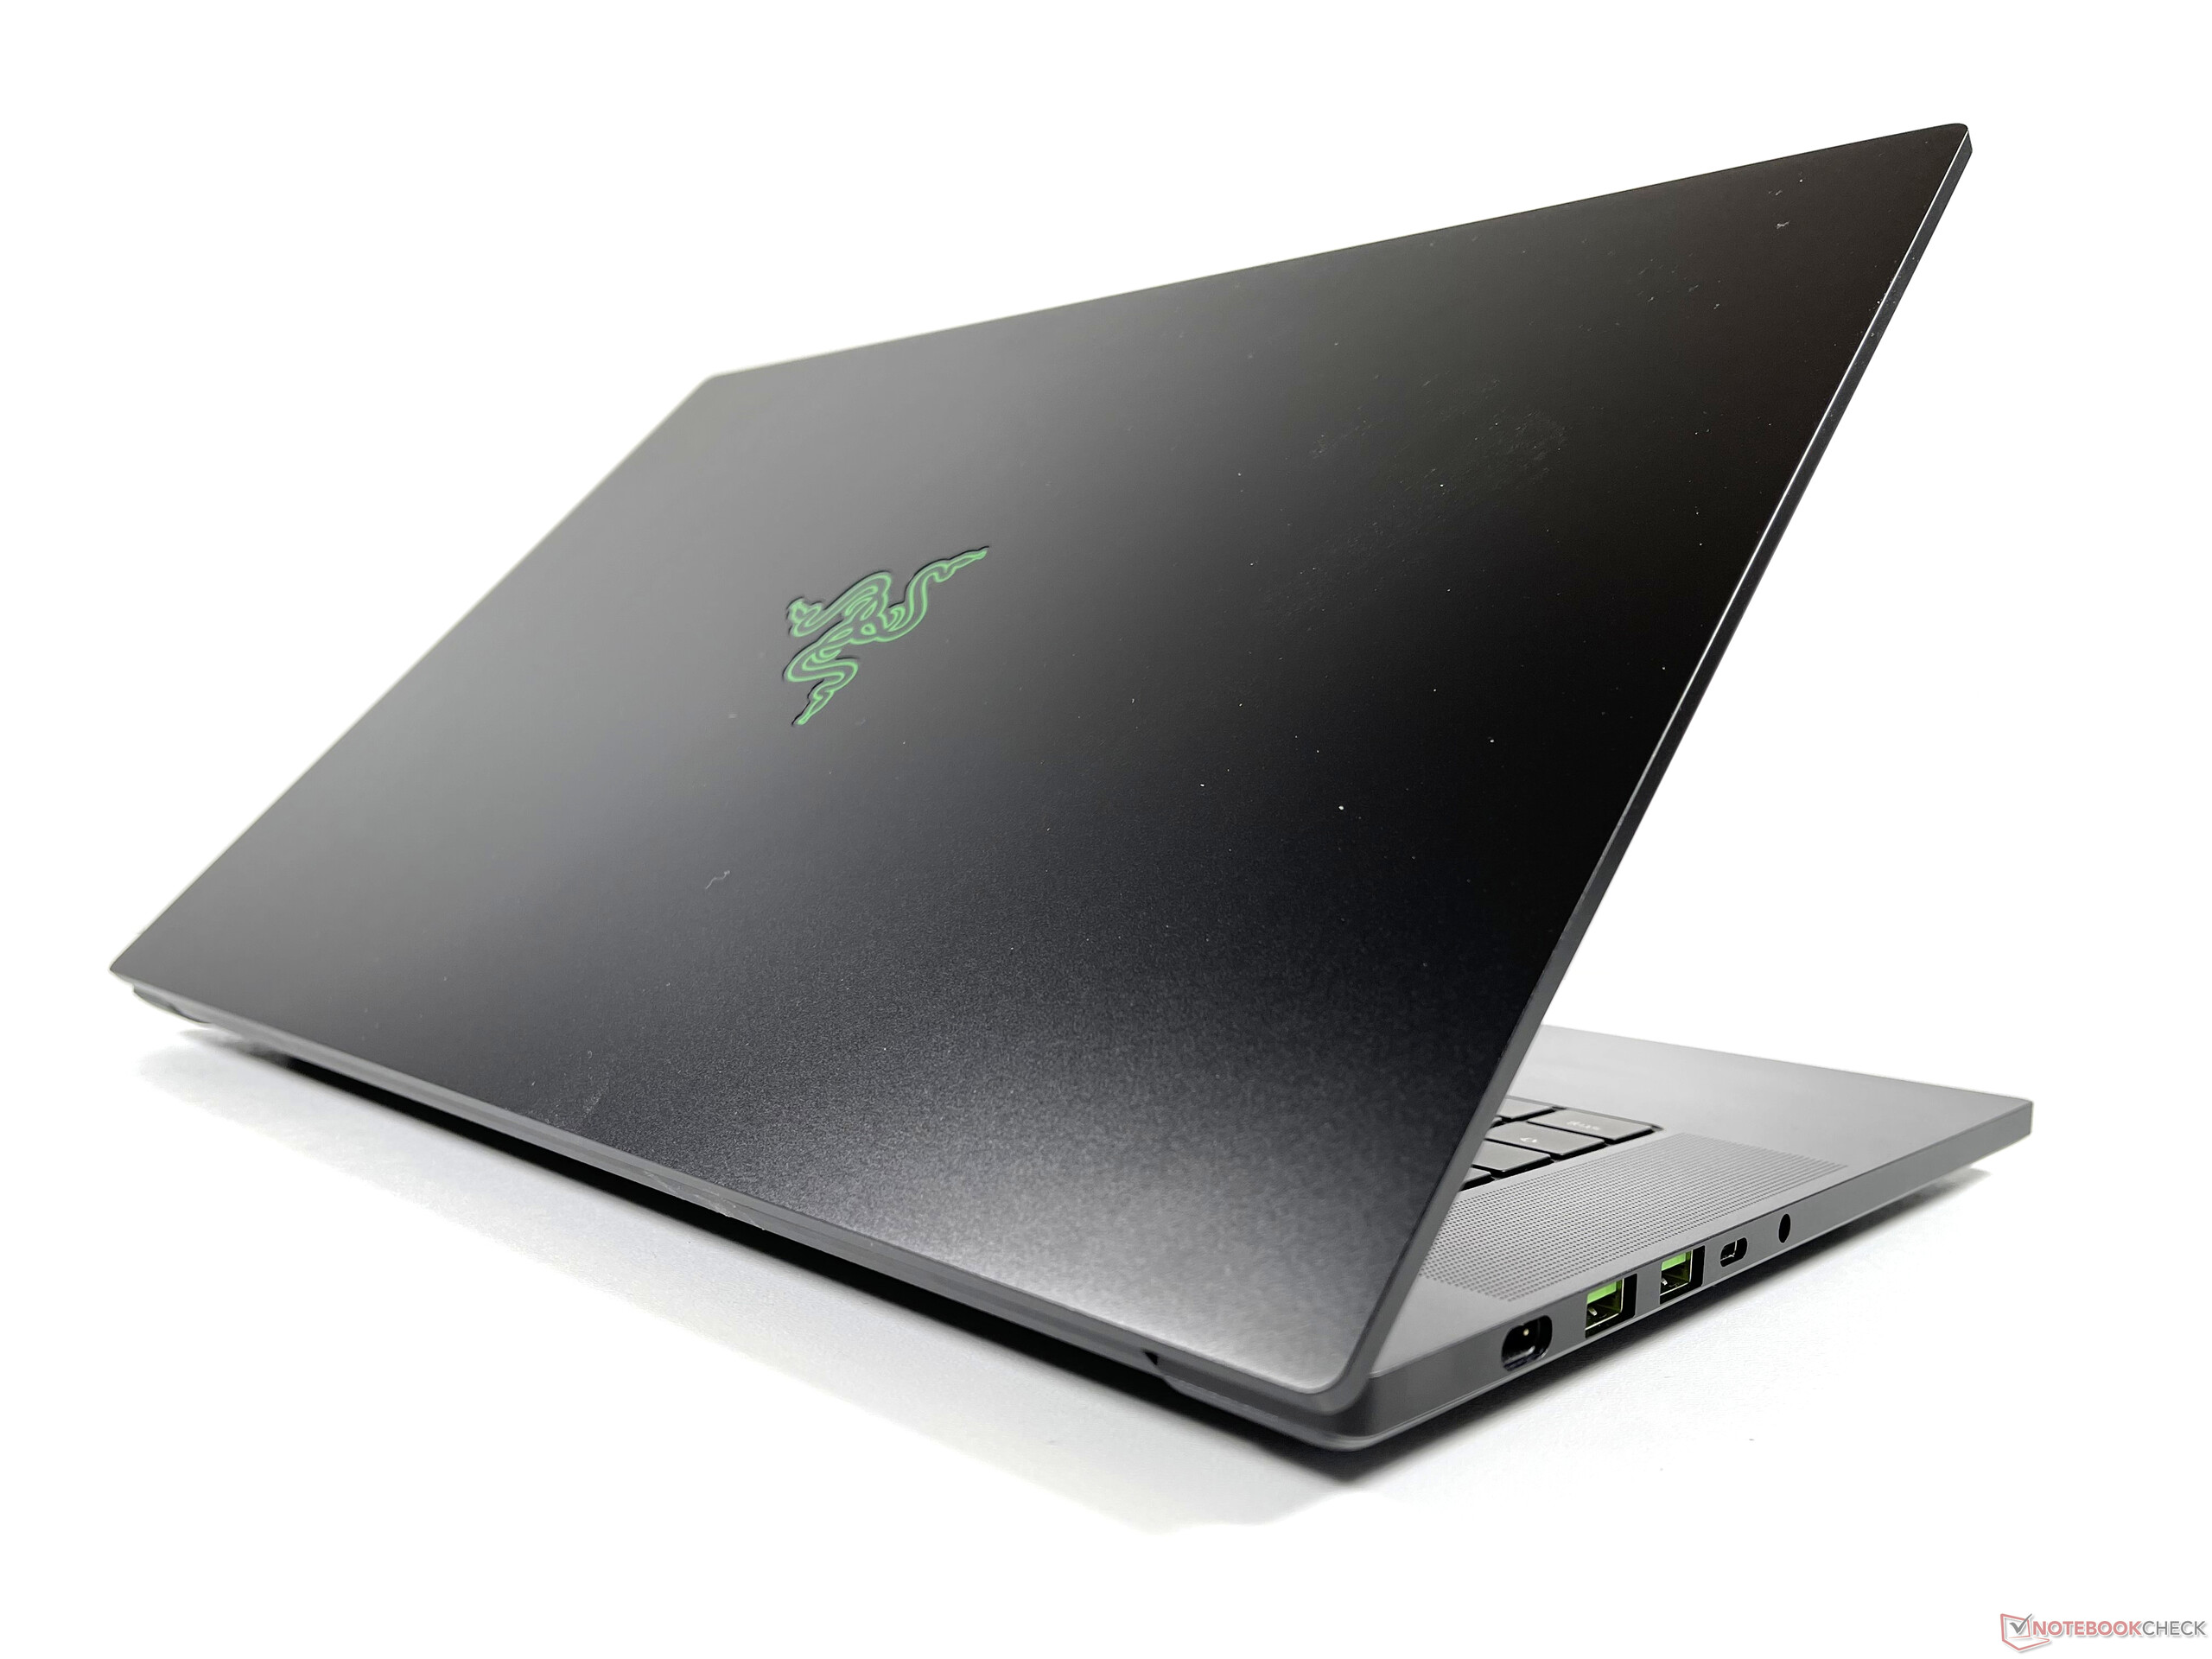
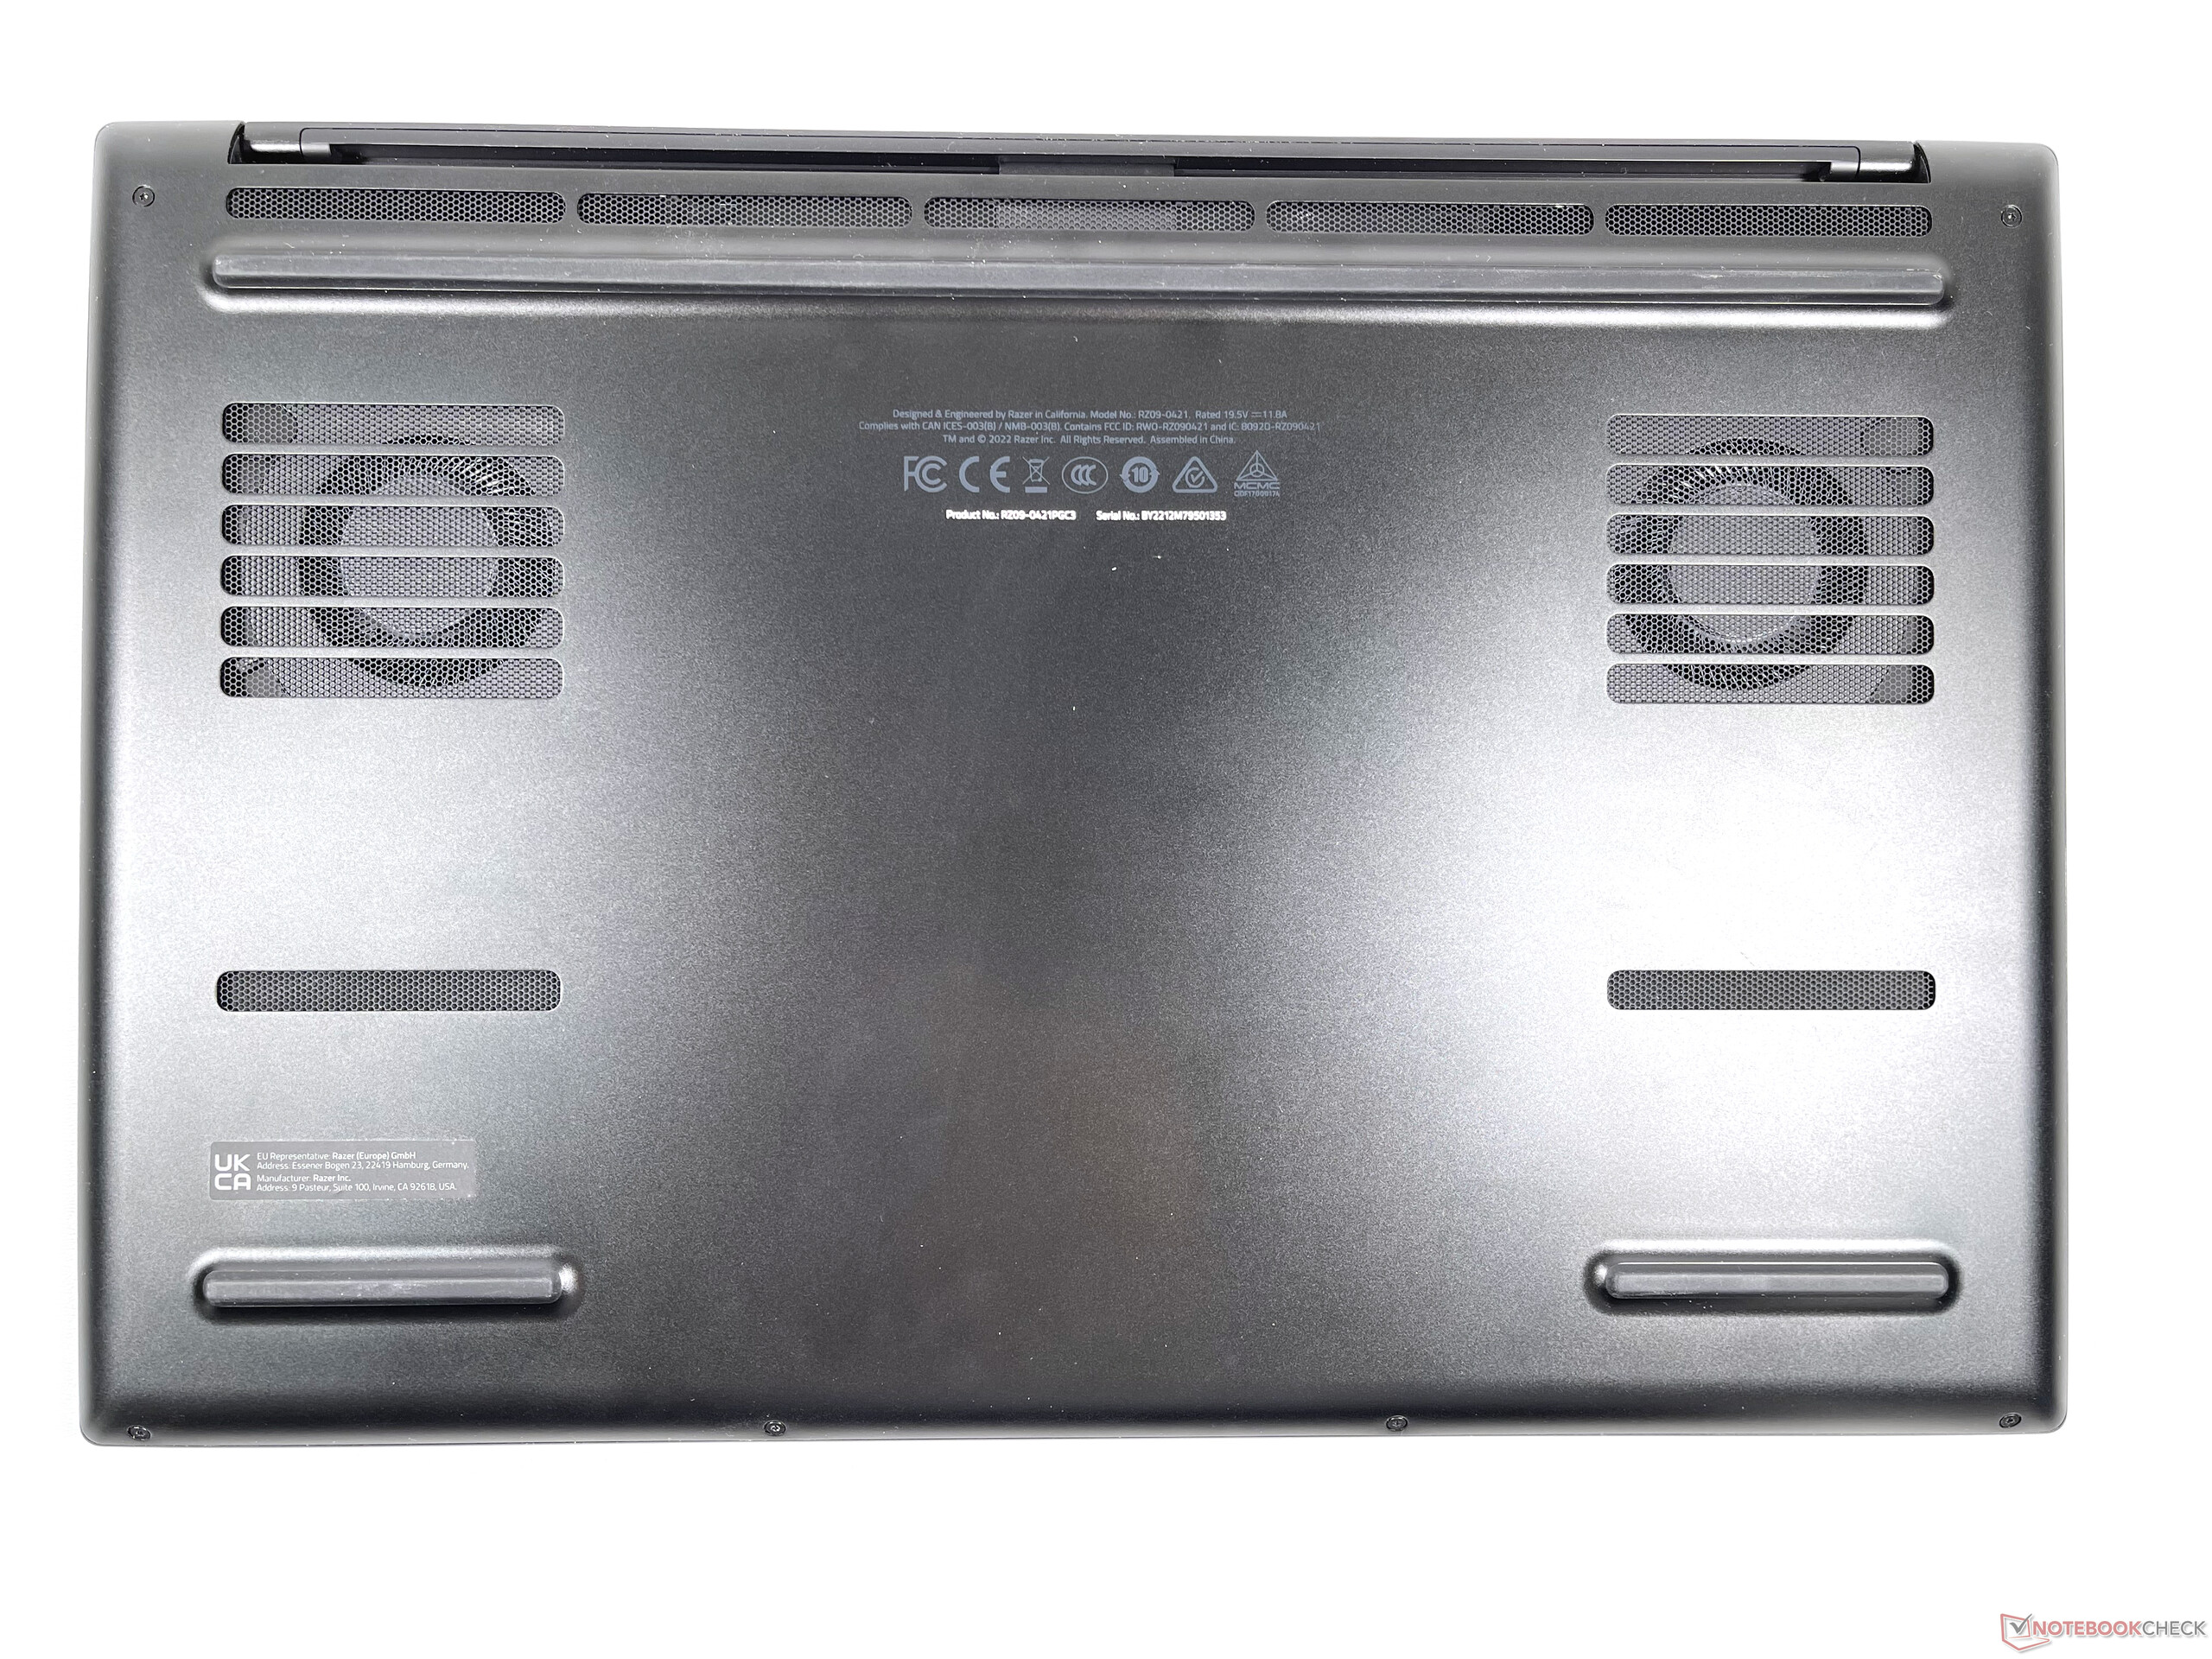
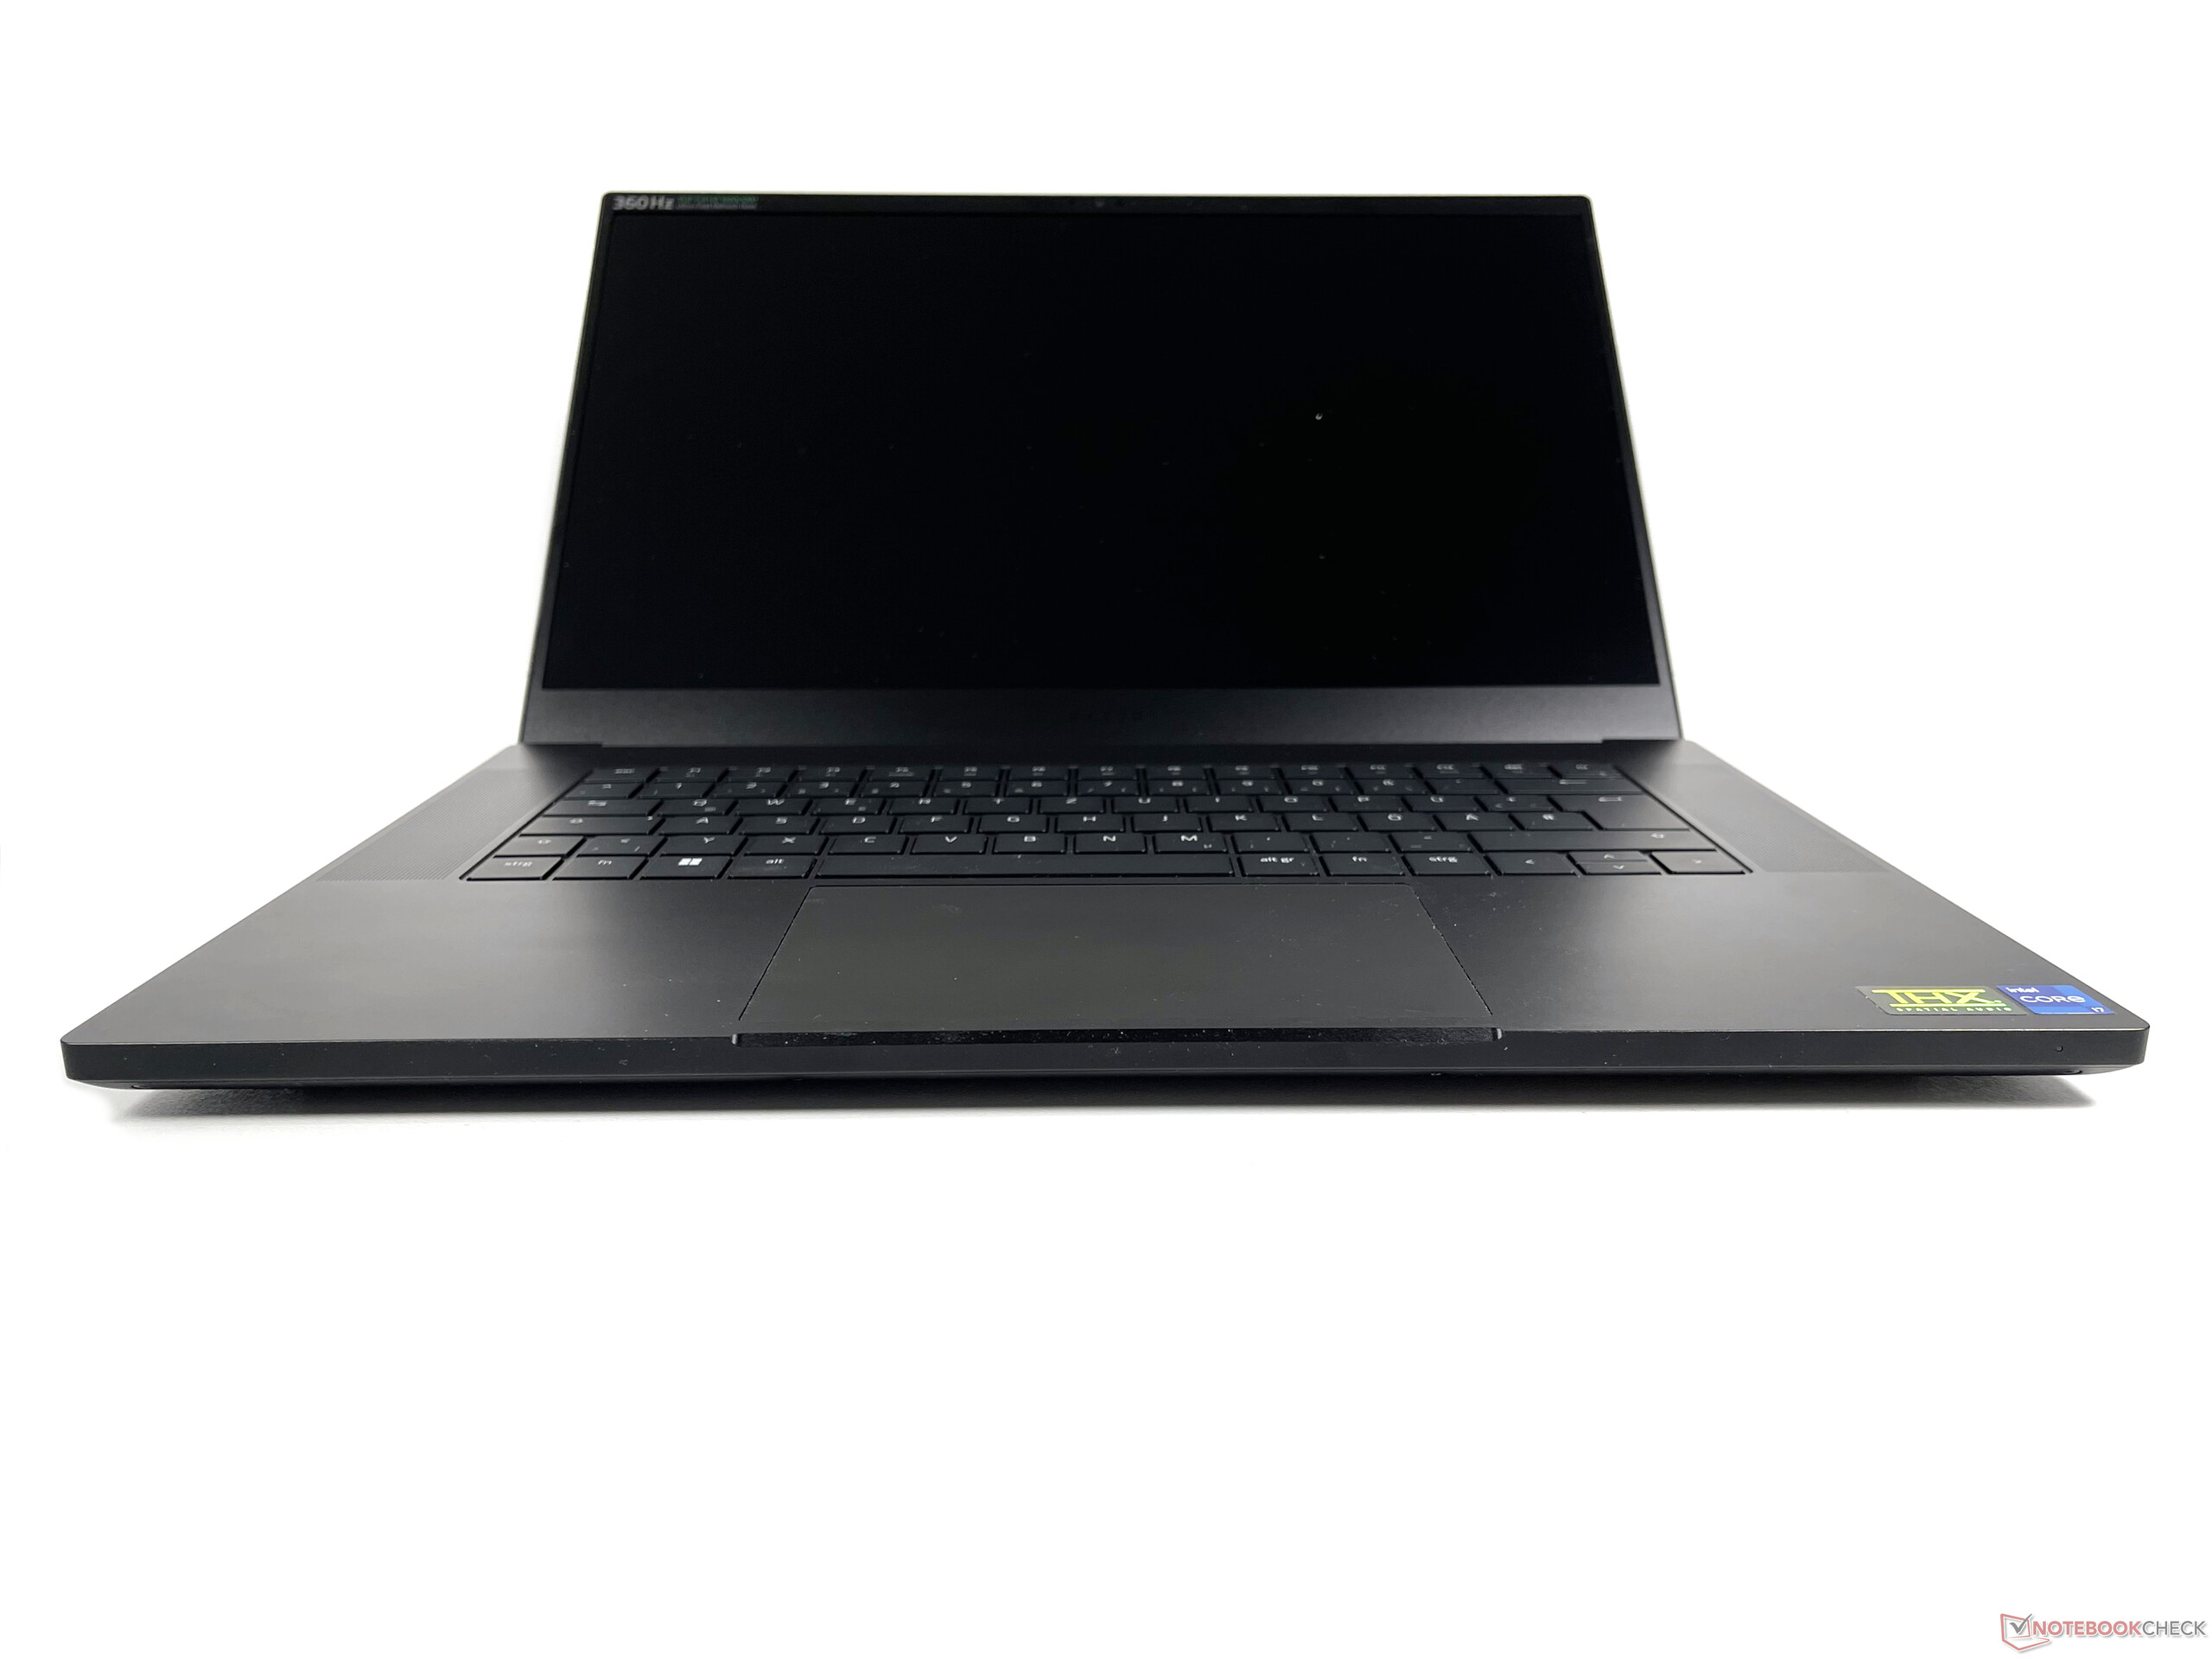
The Razer Blade 15 is a very compact 15.6-inch laptop and is both smaller and thinner than most of its competitors. In particular, the ROG Strix Scar 15 and the XMG Neo 15 E22 are significantly thicker and around 100—200 g heavier than our 2.1 kg review device.
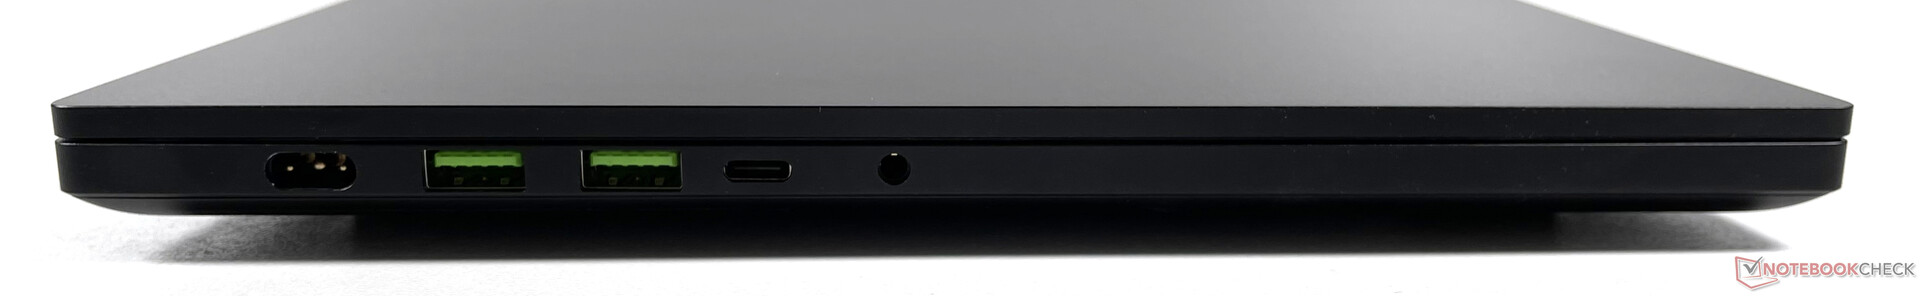
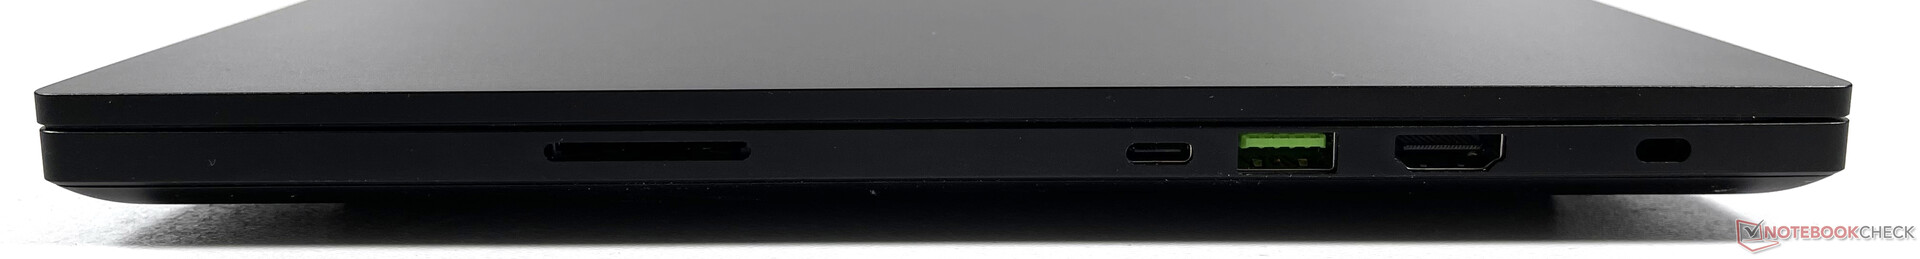
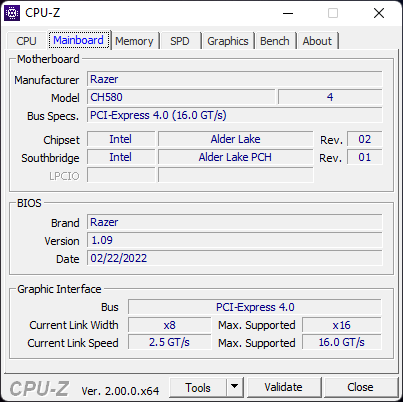
Hardware - Blade 15 with modern connectivity
There are no big surprises in terms of connectivity. Worth mentioning are the full-fledged SD card reader and the HDMI port, which supports version 2.1. Unlike many competitors such as the XMG Neo 15 E22, there is no dedicated LAN port here. But this can be rectified via a Thunderbolt dock if needed.
SD Card Reader
The performance of the SD card reader is on a high level. In the sequential AS-SSD read test with our microSD AV PRO 128GB V60 card, an error occurred on our review device.
| SD Card Reader - average JPG Copy Test (av. of 3 runs) | |
| Razer Blade 15 2022 (Toshiba Exceria Pro SDXC 64 GB UHS-II) | |
| Razer Blade 15 Advanced Model Early 2022 (AV PRO microSD 128 GB V60) | |
| Average of class Gaming (20 - 210, n=62, last 2 years) | |
| Schenker XMG Neo 15 E22 (Early 2022, RTX 3080 Ti) | |
Communication
The integrated Killer Wi-Fi 6E 1690i module offered very fast transfer rates when connected to our Asus GT-AXE11000 test router. Bluetooth 5.2 support is also provided.
| Networking | |
| iperf3 transmit AXE11000 | |
| Razer Blade 15 Advanced Model Early 2022 | |
| Average of class Gaming (469 - 1862, n=111, last 2 years) | |
| iperf3 receive AXE11000 | |
| Razer Blade 15 Advanced Model Early 2022 | |
| MSI Stealth GS66 12UGS | |
| Average of class Gaming (680 - 1745, n=111, last 2 years) | |
Webcam


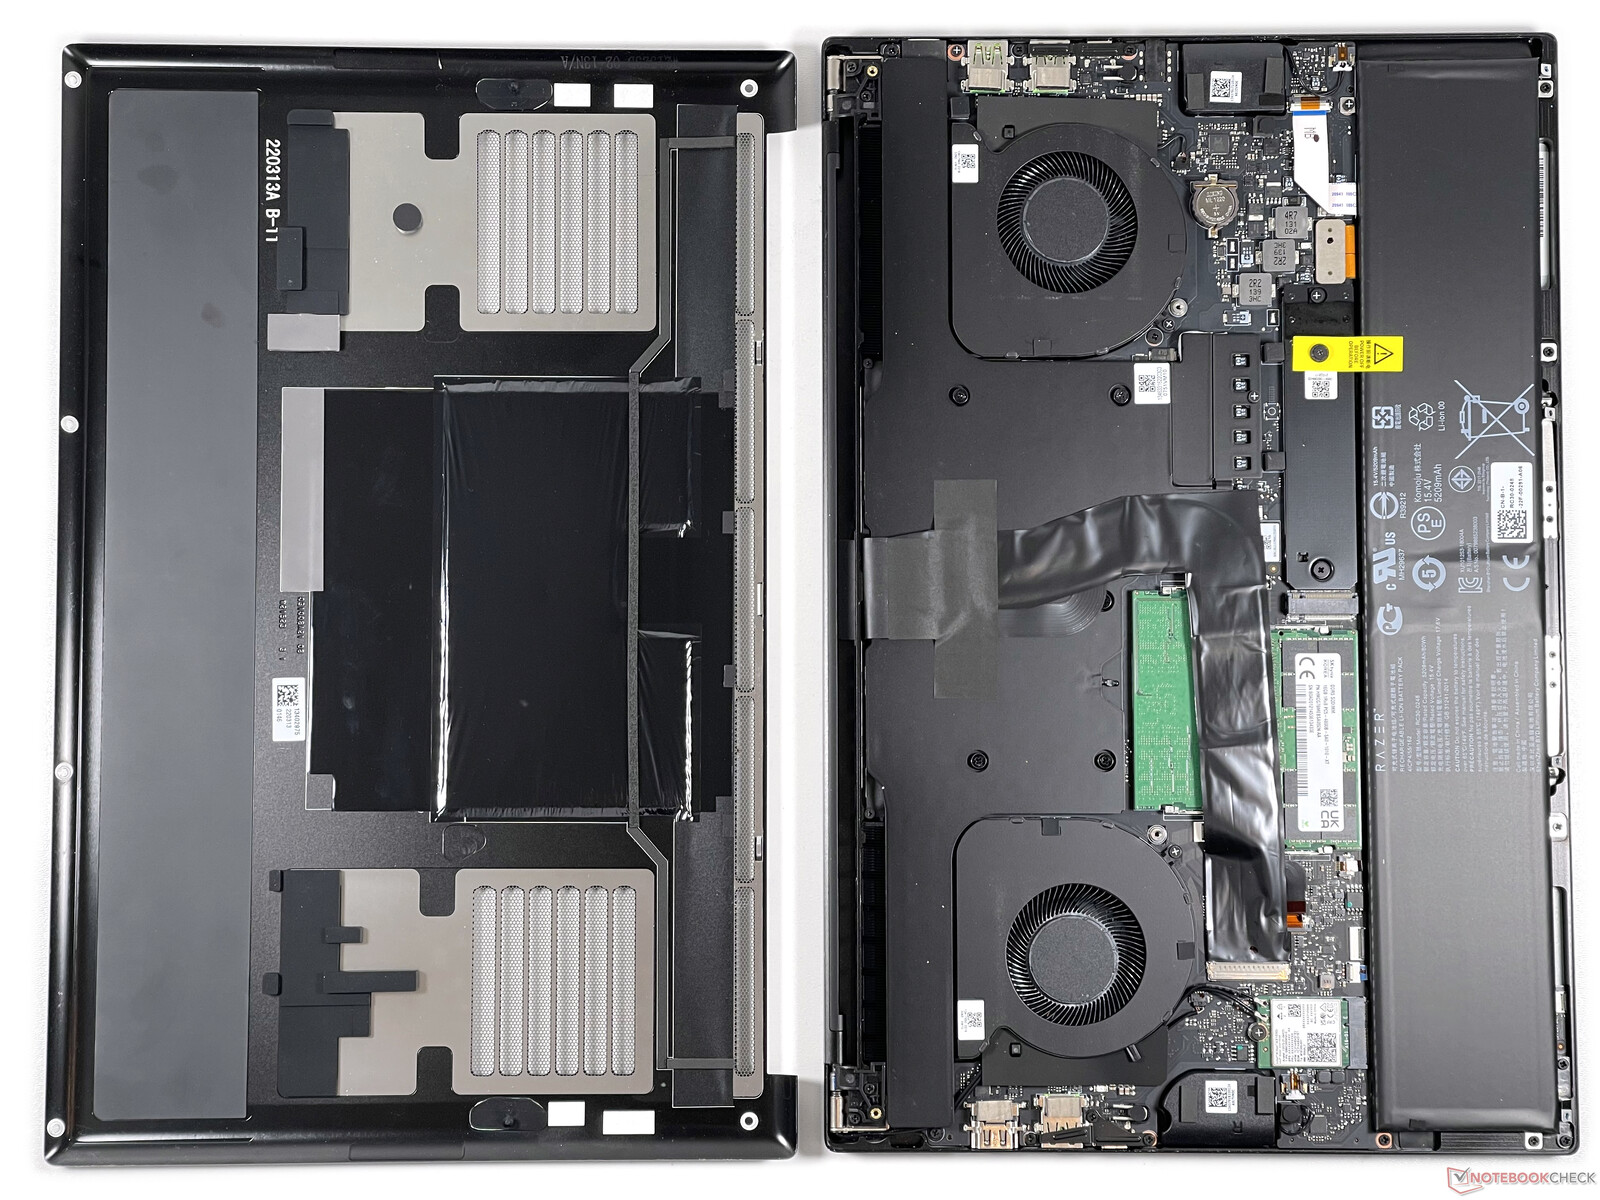
Maintenance
After removing six Torx screws (T5), one has access to both RAM modules, the battery, the WLAN module and (after removing an additional cover) the M.2 SSD.
Input devices - Large clickpad and tidy keyboard
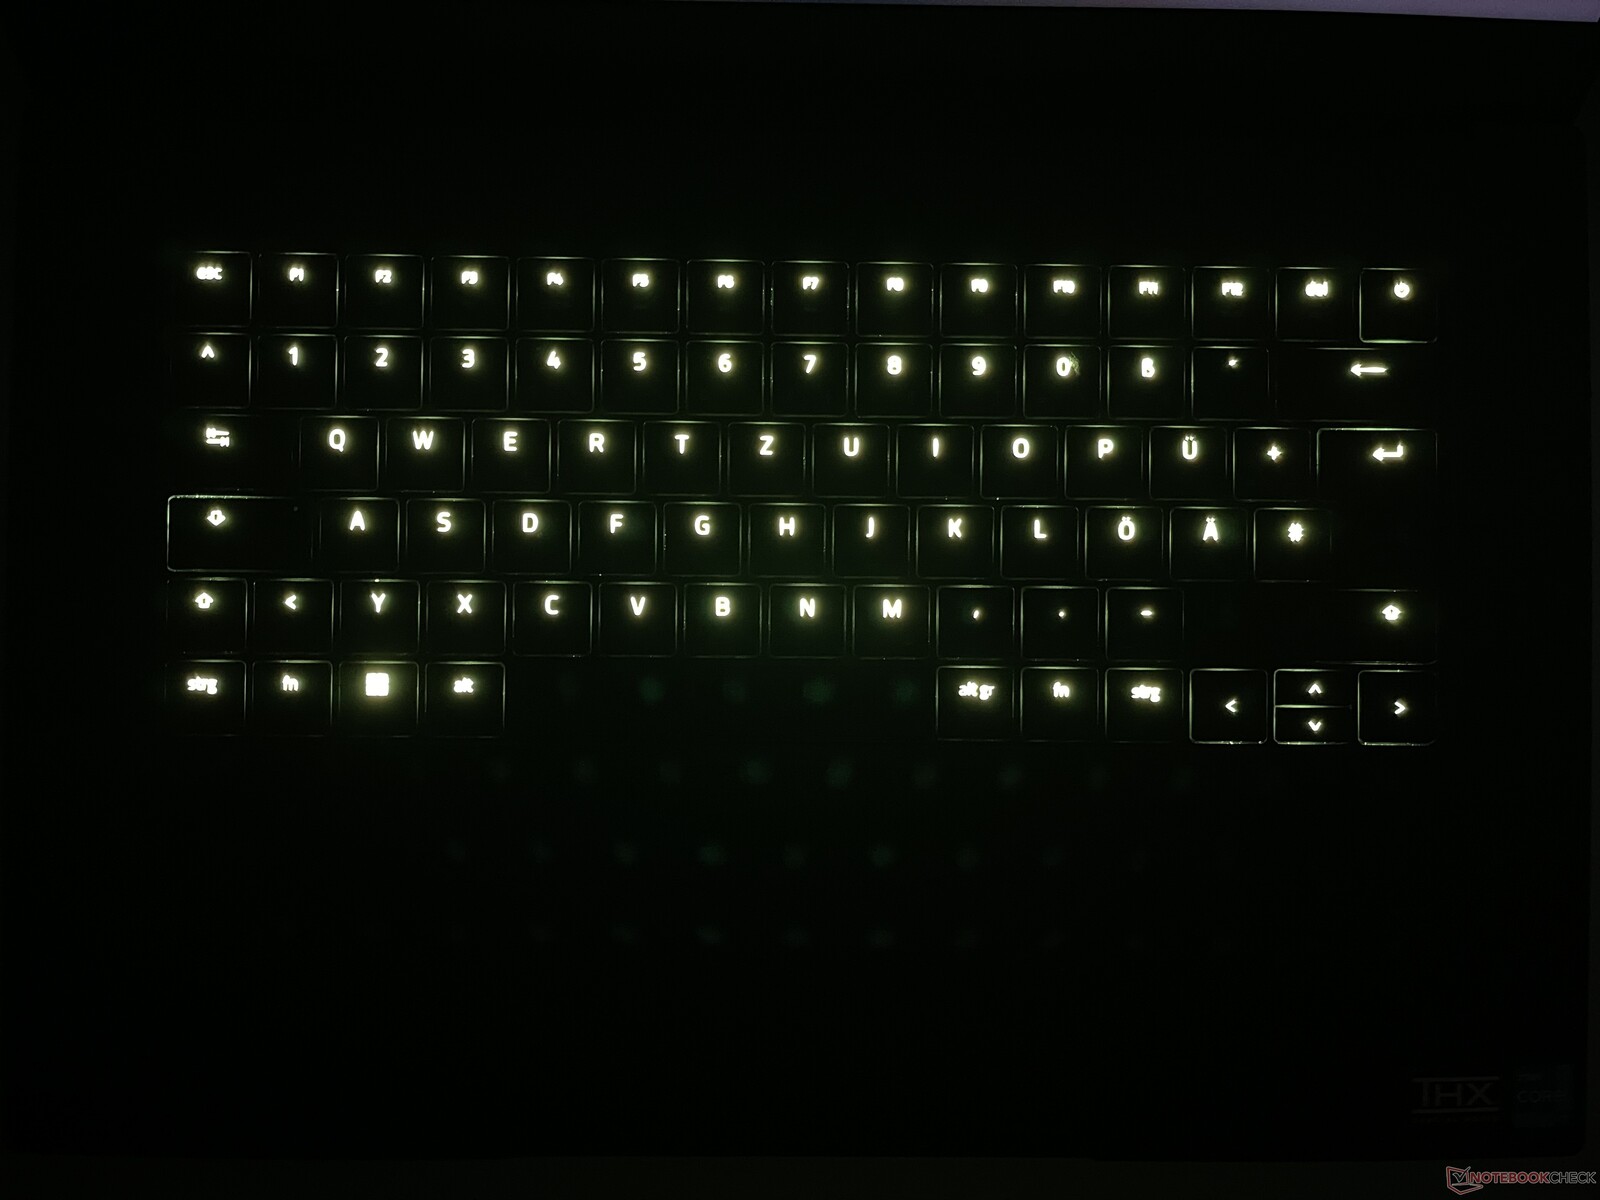
Keyboard
The keyboard features RGB key lighting with 16 brightness levels (including "off") and half-height arrow up and arrow down keys, which allows Razer to place the entire keyboard in a rectangular area centered between the speaker openings. The keys offer a flat key travel and quiet, muffled typing sounds. Key resistance is moderate and the center of the keyboard hardly yields when typing.
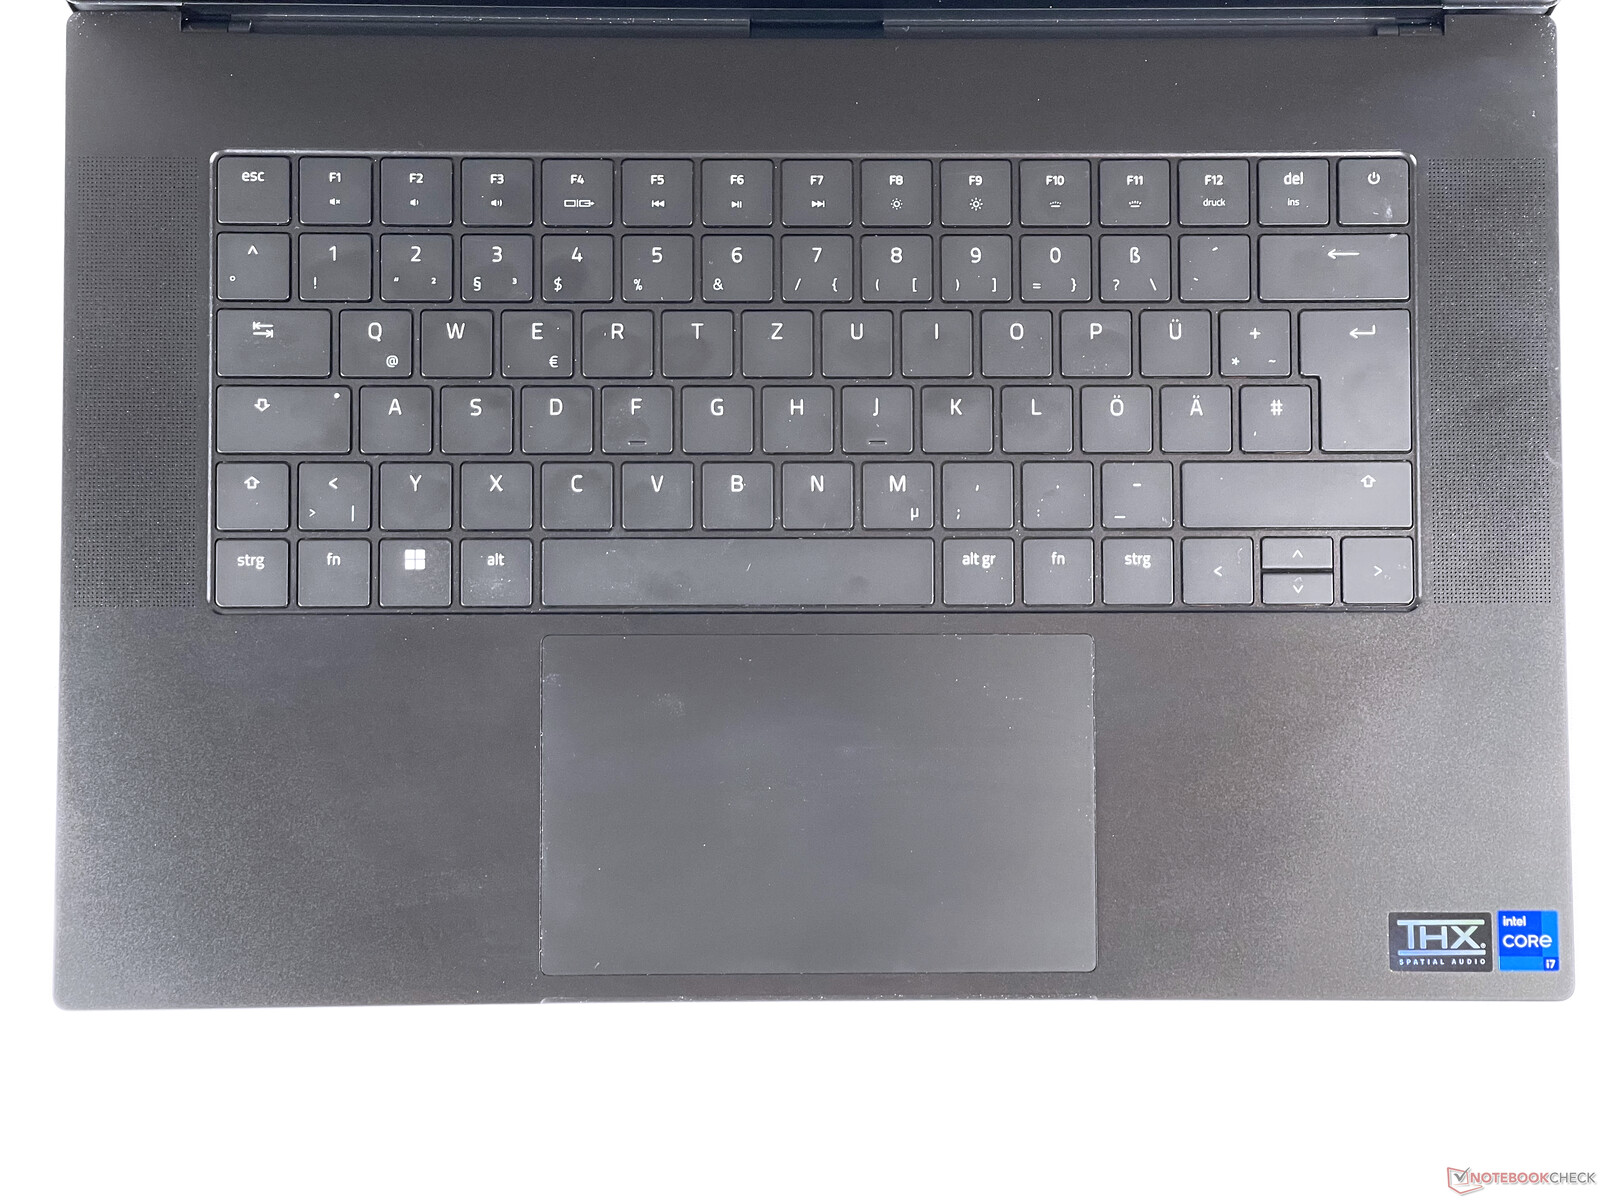
Touchpad
The touchpad comprises an area of around 13x8 cm and allows for excellent finger gliding. The clicks are characterized by a short key travel and clear haptic feedback.
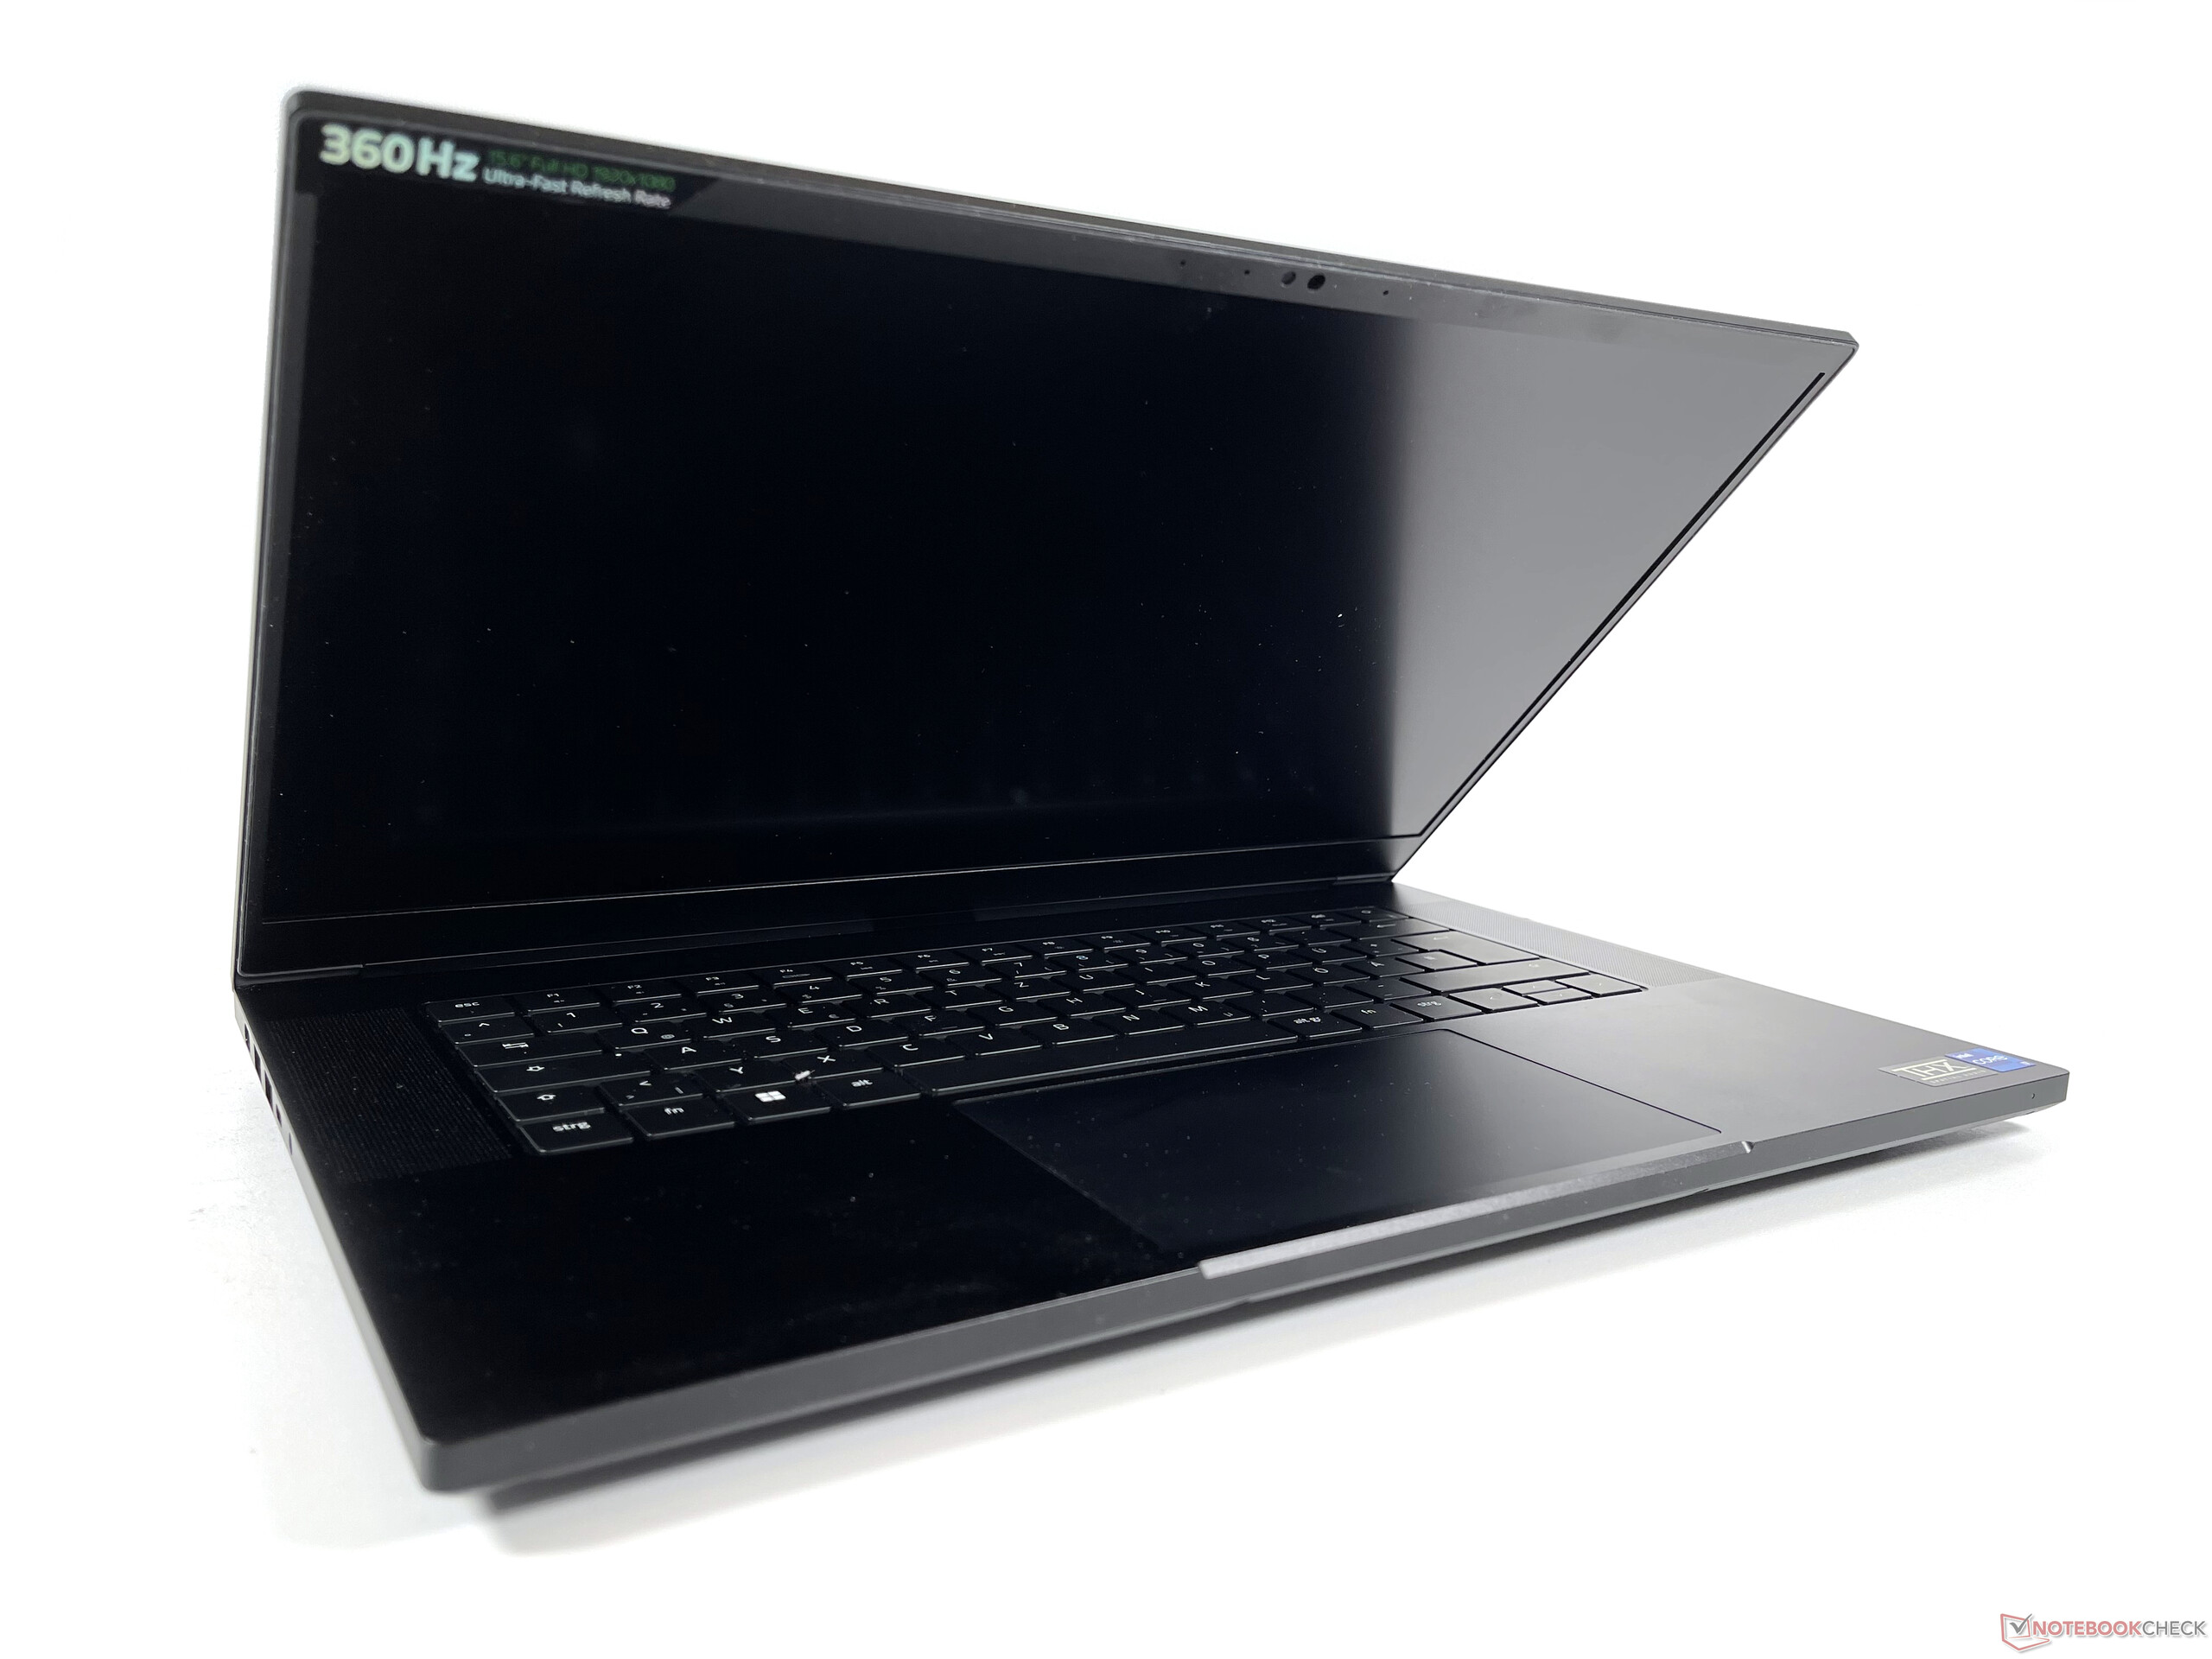
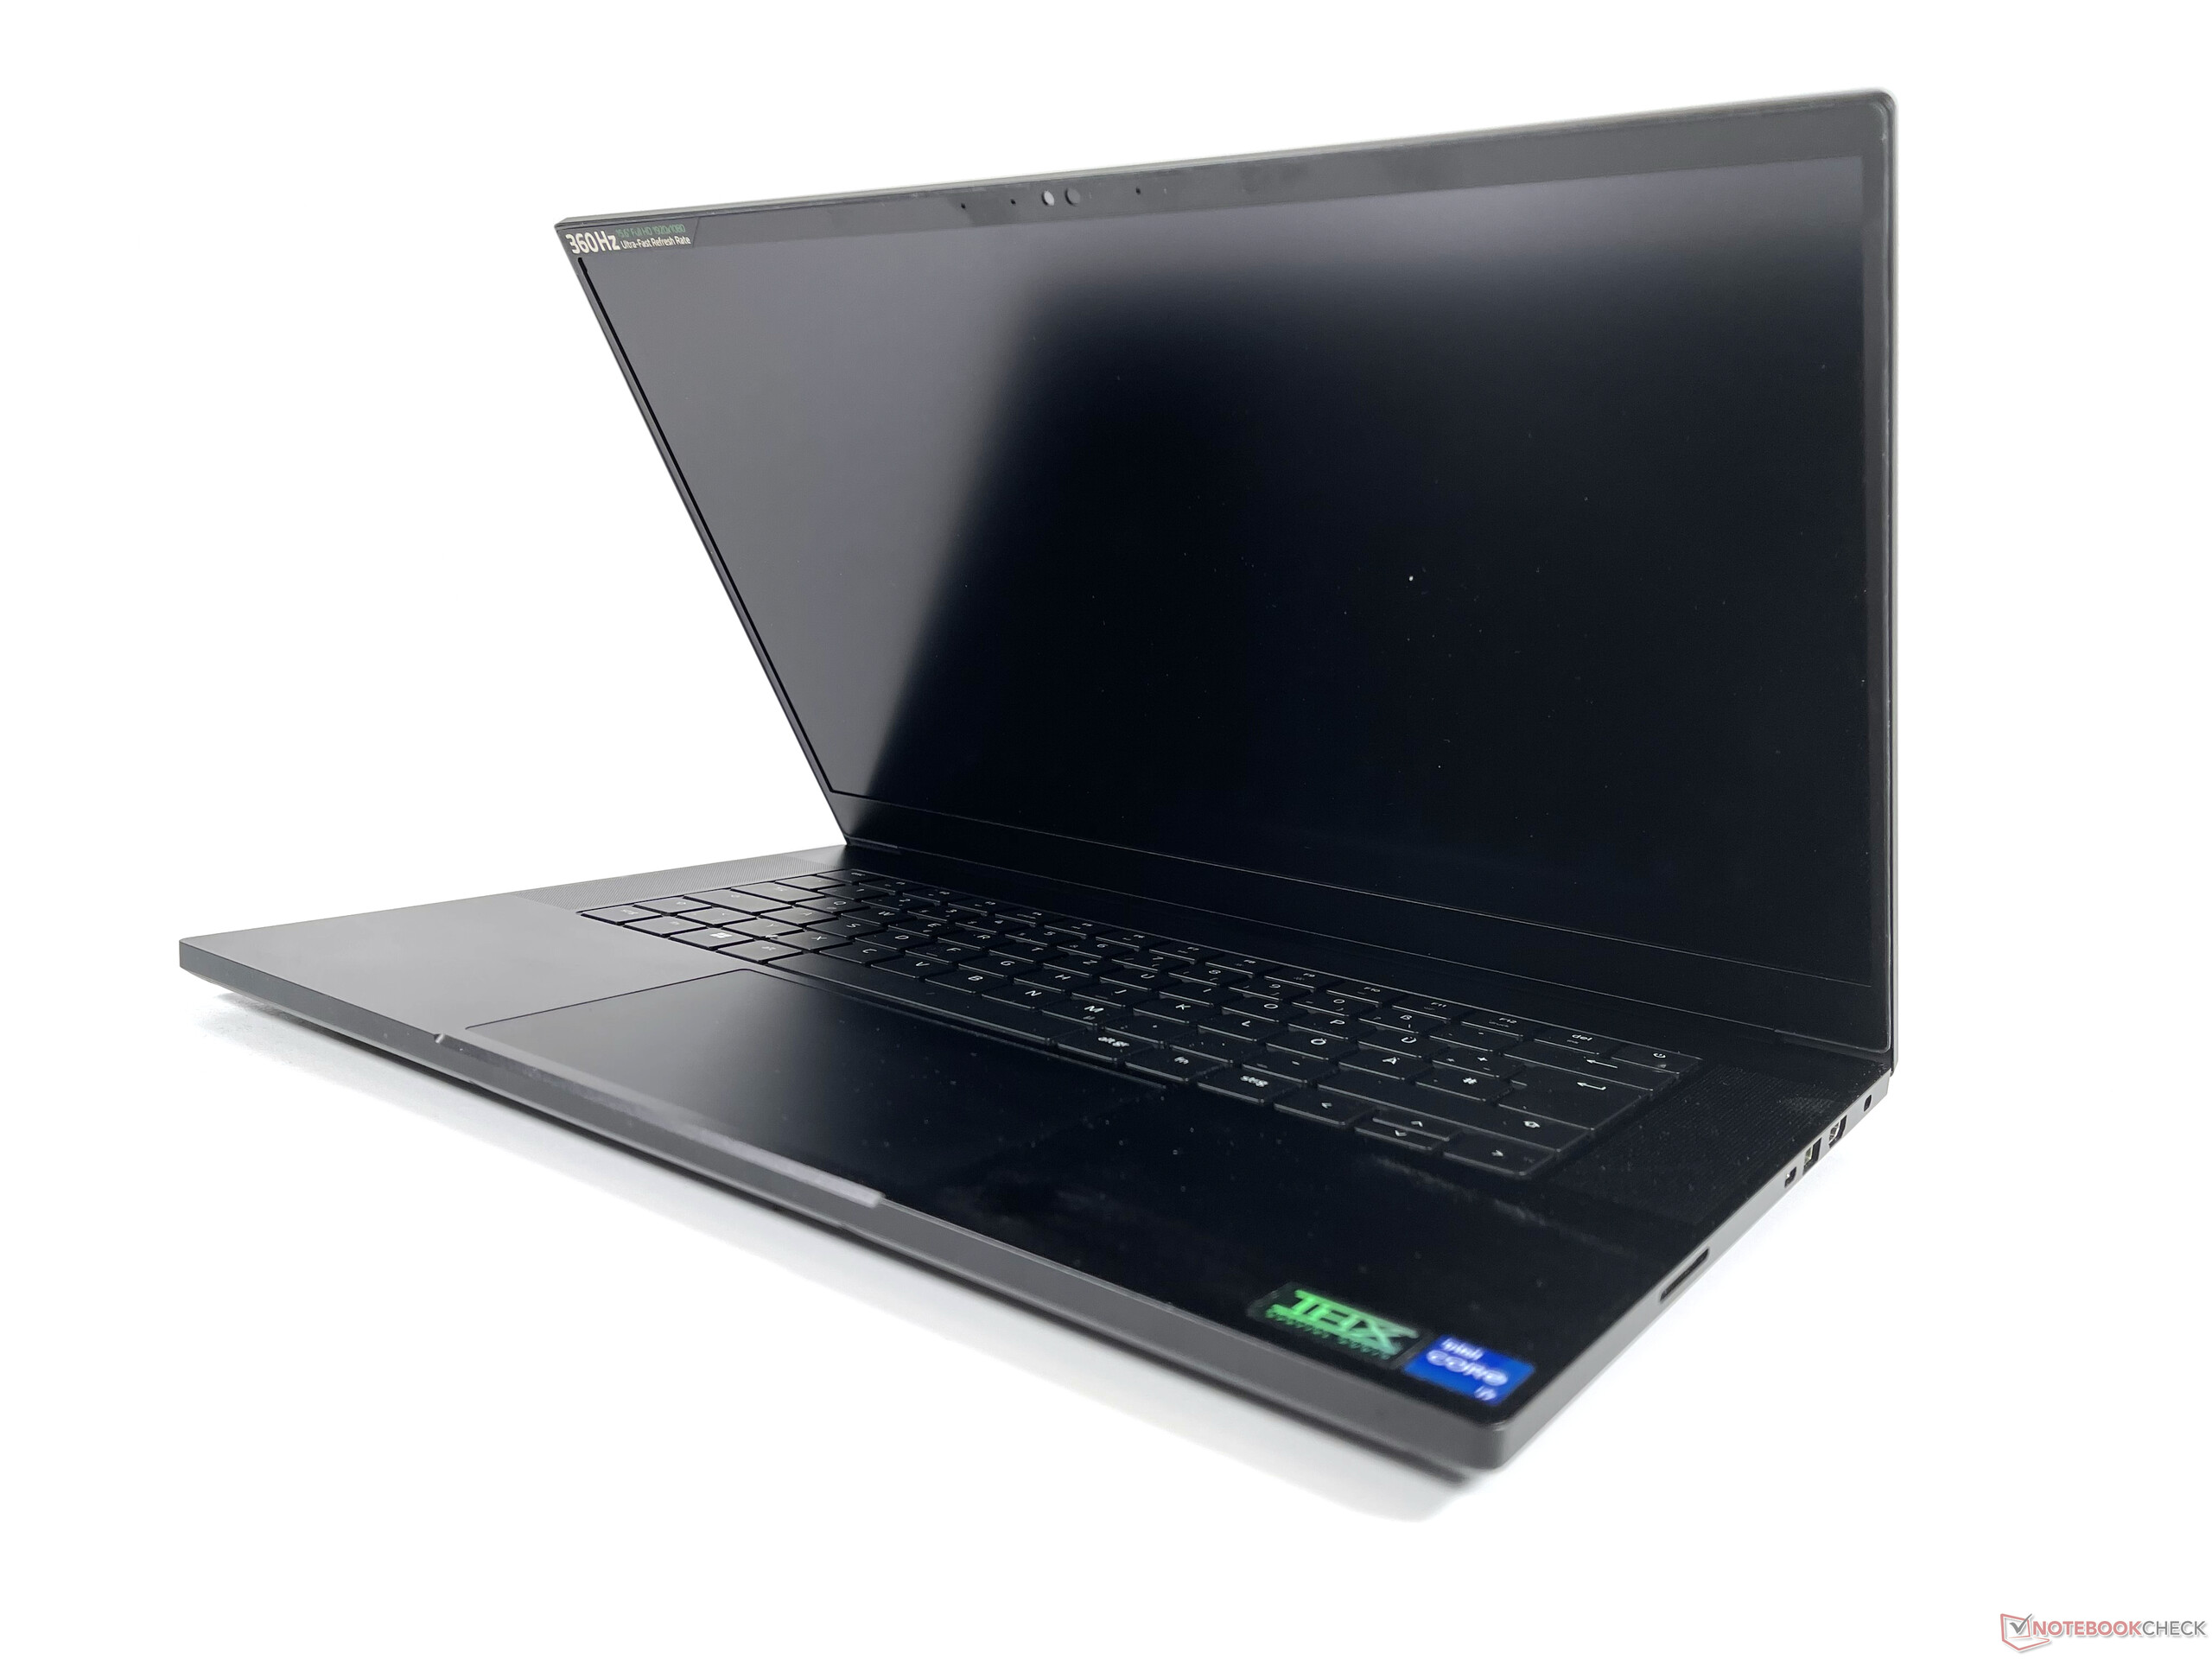
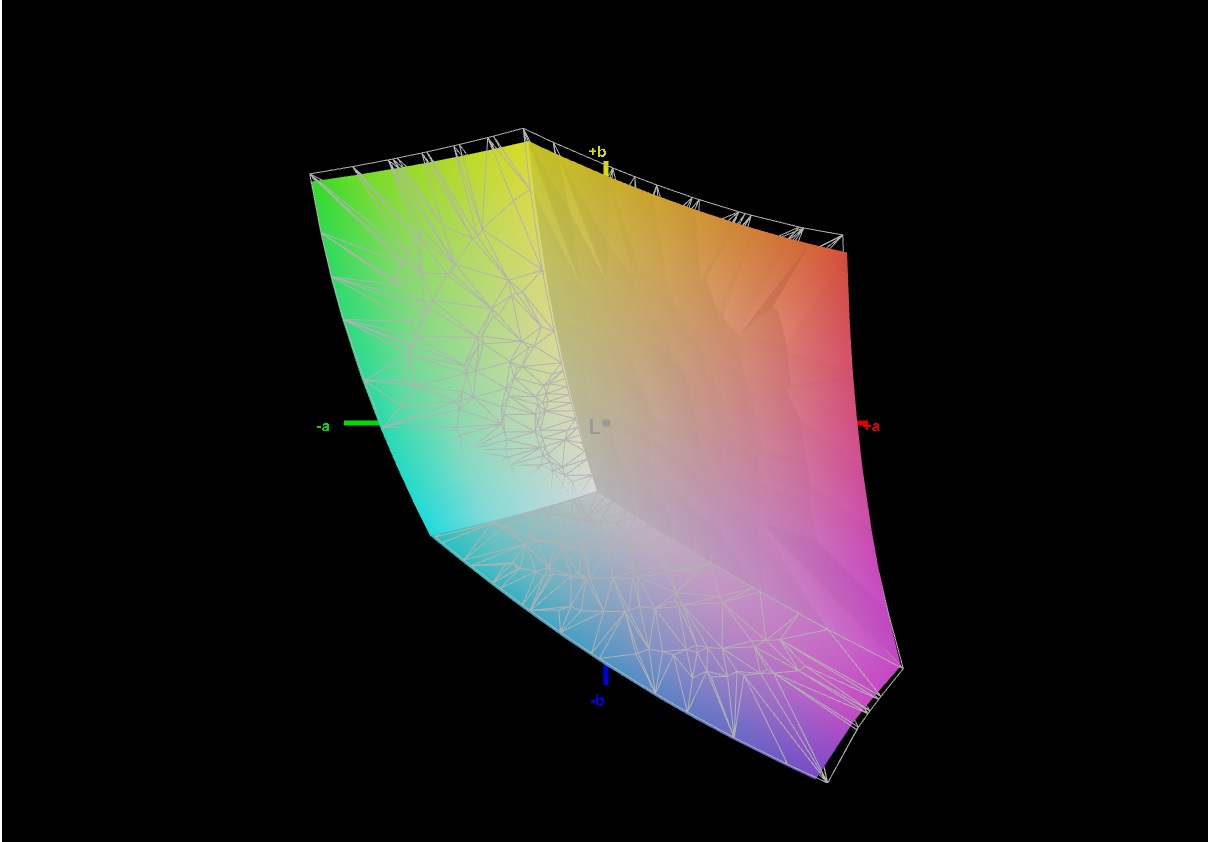
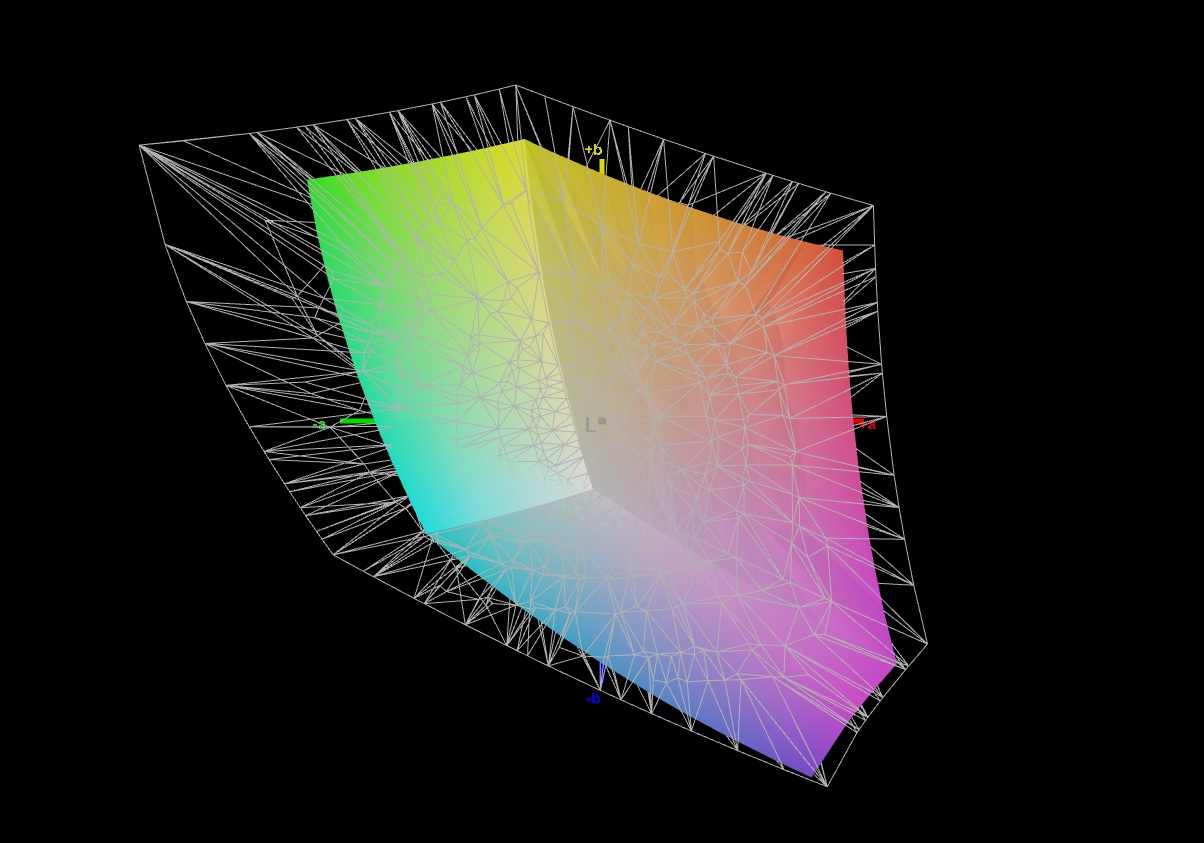
Display - Fast panel with limited color spectrum
A matte, full HD IPS panel with a native resolution of 1920x1080 pixels and a refresh rate of 360 Hz is installed in our review device. Alternatively, a QHD 240 Hz and a 4K 144 Hz display are available, each of which should cover the DCI-P3 color space. The QHD model also supports Nvidia G-Sync and Advanced Optimus.
The brightness of 315 cd/m² on average is more than sufficient for most application scenarios and, together with a decent black value of 0.24, results in an above-average contrast of 1,375:1 in class comparison. The gray-to-gray response times are particularly short and we could not detect any PWM.
| |||||||||||||||||||||||||
Brightness Distribution: 89 %
Center on Battery: 330 cd/m²
Contrast: 1375:1 (Black: 0.24 cd/m²)
ΔE ColorChecker Calman: 1.47 | ∀{0.5-29.43 Ø4.75}
calibrated: 0.63
ΔE Greyscale Calman: 1.8 | ∀{0.09-98 Ø5}
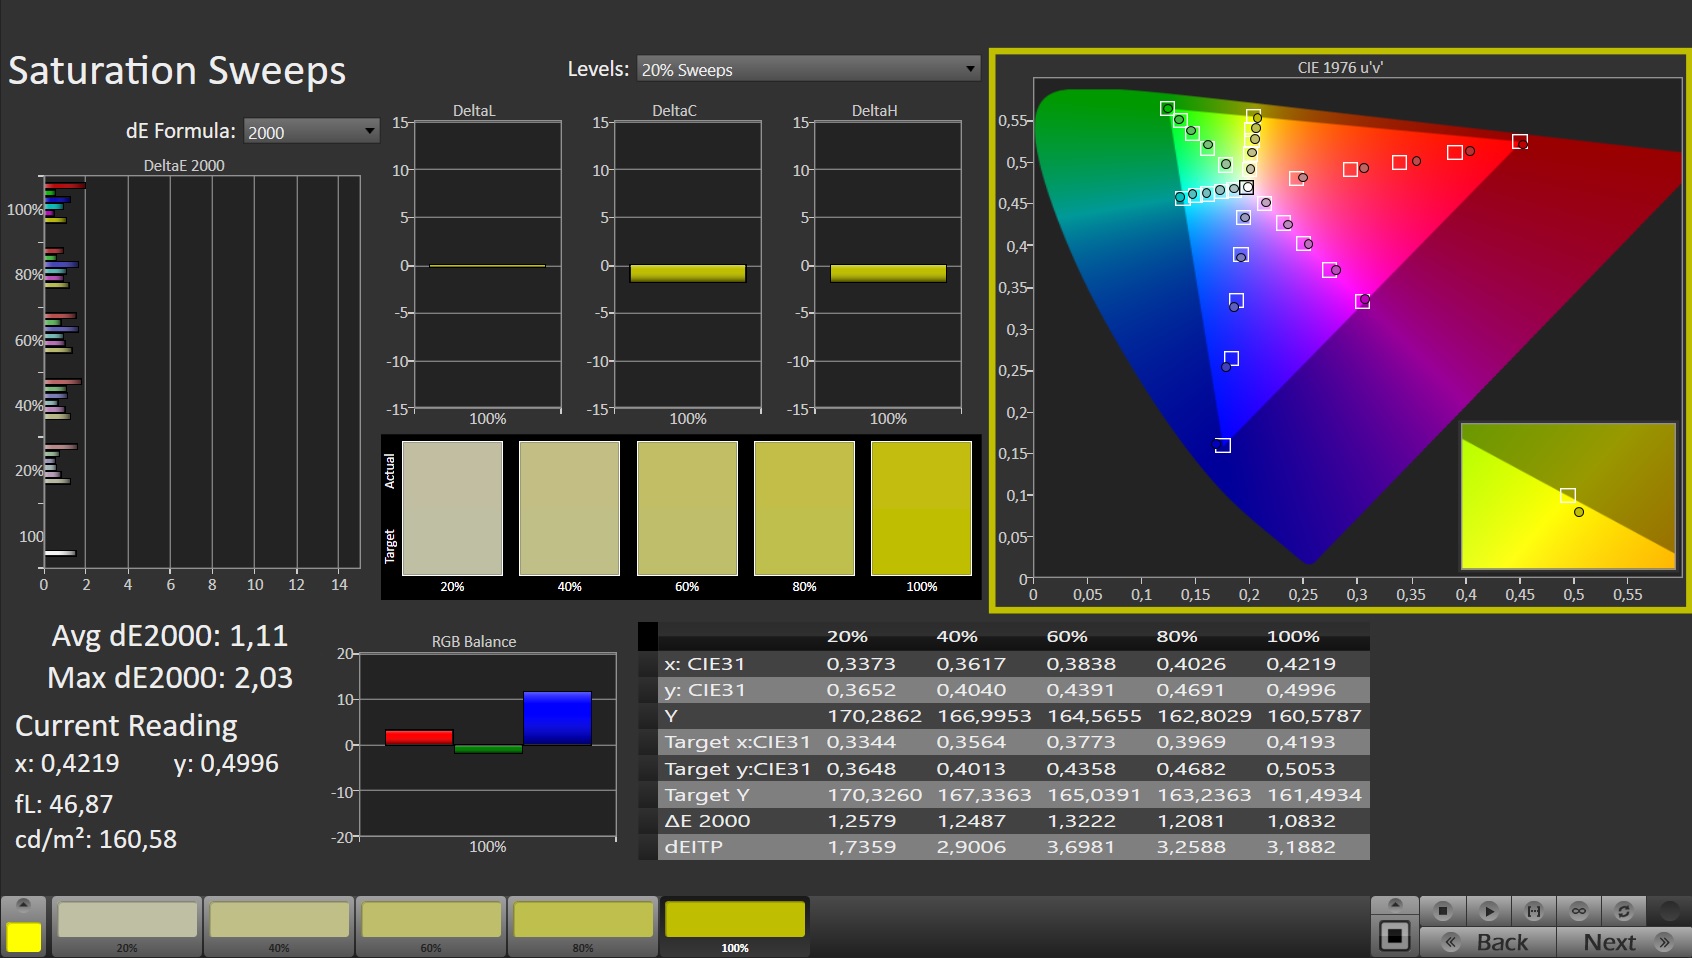
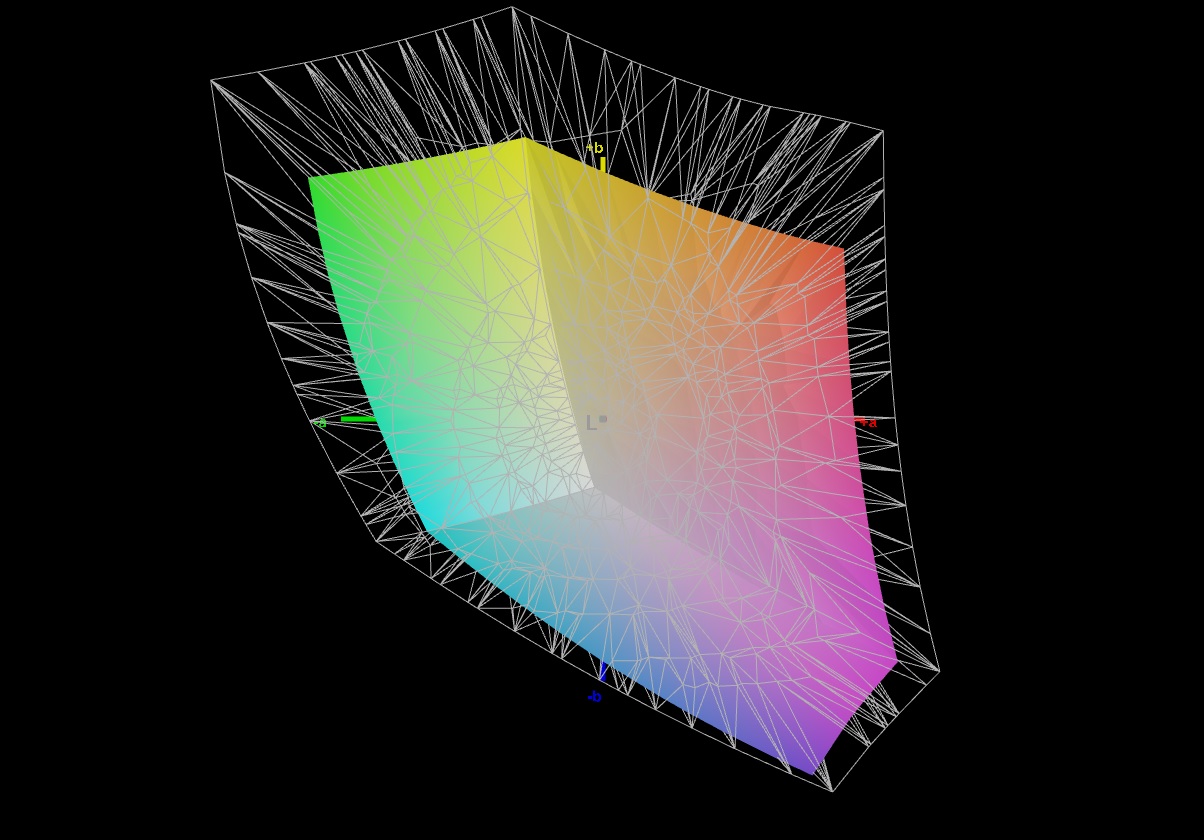
67.4% AdobeRGB 1998 (Argyll 3D)
85.1% sRGB (Argyll 3D)
65.3% Display P3 (Argyll 3D)
Gamma: 2.282
CCT: 6499 K
| Razer Blade 15 Advanced Model Early 2022 TL156VDXP02-0, IPS, 1920x1080, 15.6" | Razer Blade 15 2022 Sharp LQ156T1JW03, IPS, 2560x1440, 15.6" | Schenker XMG Neo 15 E22 (Early 2022, RTX 3080 Ti) BOE0A67 (BOE CQ NE156QHM-NZ1), IPS, 2560x1440, 15.6" | Asus ROG Strix Scar 15 G533QS BOE CQ NE156QHM-NY1, IPS, 2560x1440, 15.6" | MSI Stealth GS66 12UGS Sharp LQ156T1JW04 (SHP153C), IPS-Level, 2560x1440, 15.6" | MSI Vector GP66 12UGS BOE NE156FHM-NZ3, IPS, 1920x1080, 15.6" | |
|---|---|---|---|---|---|---|
| Display | 33% | 31% | 31% | 10% | ||
| Display P3 Coverage (%) | 65.3 | 99.1 52% | 97.6 49% | 96.4 48% | 70.1 7% | |
| sRGB Coverage (%) | 85.1 | 99.9 17% | 99.9 17% | 99.7 17% | 99.5 17% | |
| AdobeRGB 1998 Coverage (%) | 67.4 | 86.8 29% | 85.3 27% | 85.6 27% | 72.1 7% | |
| Response Times | -123% | -119% | -122% | -10% | -13% | |
| Response Time Grey 50% / Grey 80% * (ms) | 4.3 ? | 14.4 ? -235% | 14.4 ? -235% | 14 ? -226% | 6 ? -40% | 5.8 ? -35% |
| Response Time Black / White * (ms) | 10.5 ? | 11.6 ? -10% | 10.8 ? -3% | 12.4 ? -18% | 8.4 ? 20% | 9.6 ? 9% |
| PWM Frequency (Hz) | ||||||
| Screen | -54% | -38% | -77% | -87% | -45% | |
| Brightness middle (cd/m²) | 330 | 286 -13% | 295 -11% | 304.3 -8% | 272 -18% | 353.1 7% |
| Brightness (cd/m²) | 315 | 271 -14% | 277 -12% | 286 -9% | 253 -20% | 325 3% |
| Brightness Distribution (%) | 89 | 89 0% | 62 -30% | 76 -15% | 87 -2% | 85 -4% |
| Black Level * (cd/m²) | 0.24 | 0.25 -4% | 0.28 -17% | 0.33 -38% | 0.25 -4% | 0.38 -58% |
| Contrast (:1) | 1375 | 1144 -17% | 1054 -23% | 922 -33% | 1088 -21% | 929 -32% |
| Colorchecker dE 2000 * | 1.47 | 2.74 -86% | 2.36 -61% | 2.76 -88% | 3.73 -154% | 2.24 -52% |
| Colorchecker dE 2000 max. * | 2.73 | 5.21 -91% | 4.24 -55% | 5.57 -104% | 9.43 -245% | 5 -83% |
| Colorchecker dE 2000 calibrated * | 0.63 | 2.52 -300% | 2.38 -278% | 0.98 -56% | 1.02 -62% | |
| Greyscale dE 2000 * | 1.8 | 1.1 39% | 3.43 -91% | 4 -122% | 6.5 -261% | 4 -122% |
| Gamma | 2.282 96% | 2.2 100% | 2.44 90% | 2.14 103% | 2.172 101% | 2.24 98% |
| CCT | 6499 100% | 6408 101% | 6266 104% | 6844 95% | 6485 100% | 6864 95% |
| Total Average (Program / Settings) | -48% /
-45% | -79% /
-54% | -56% /
-60% | -22% /
-51% | -16% /
-28% |
* ... smaller is better
In our configuration, the Razer Blade 15 only covers 85% of the sRGB color space. Considering the manufacturer's claim of "up to 100%", we expected more here.
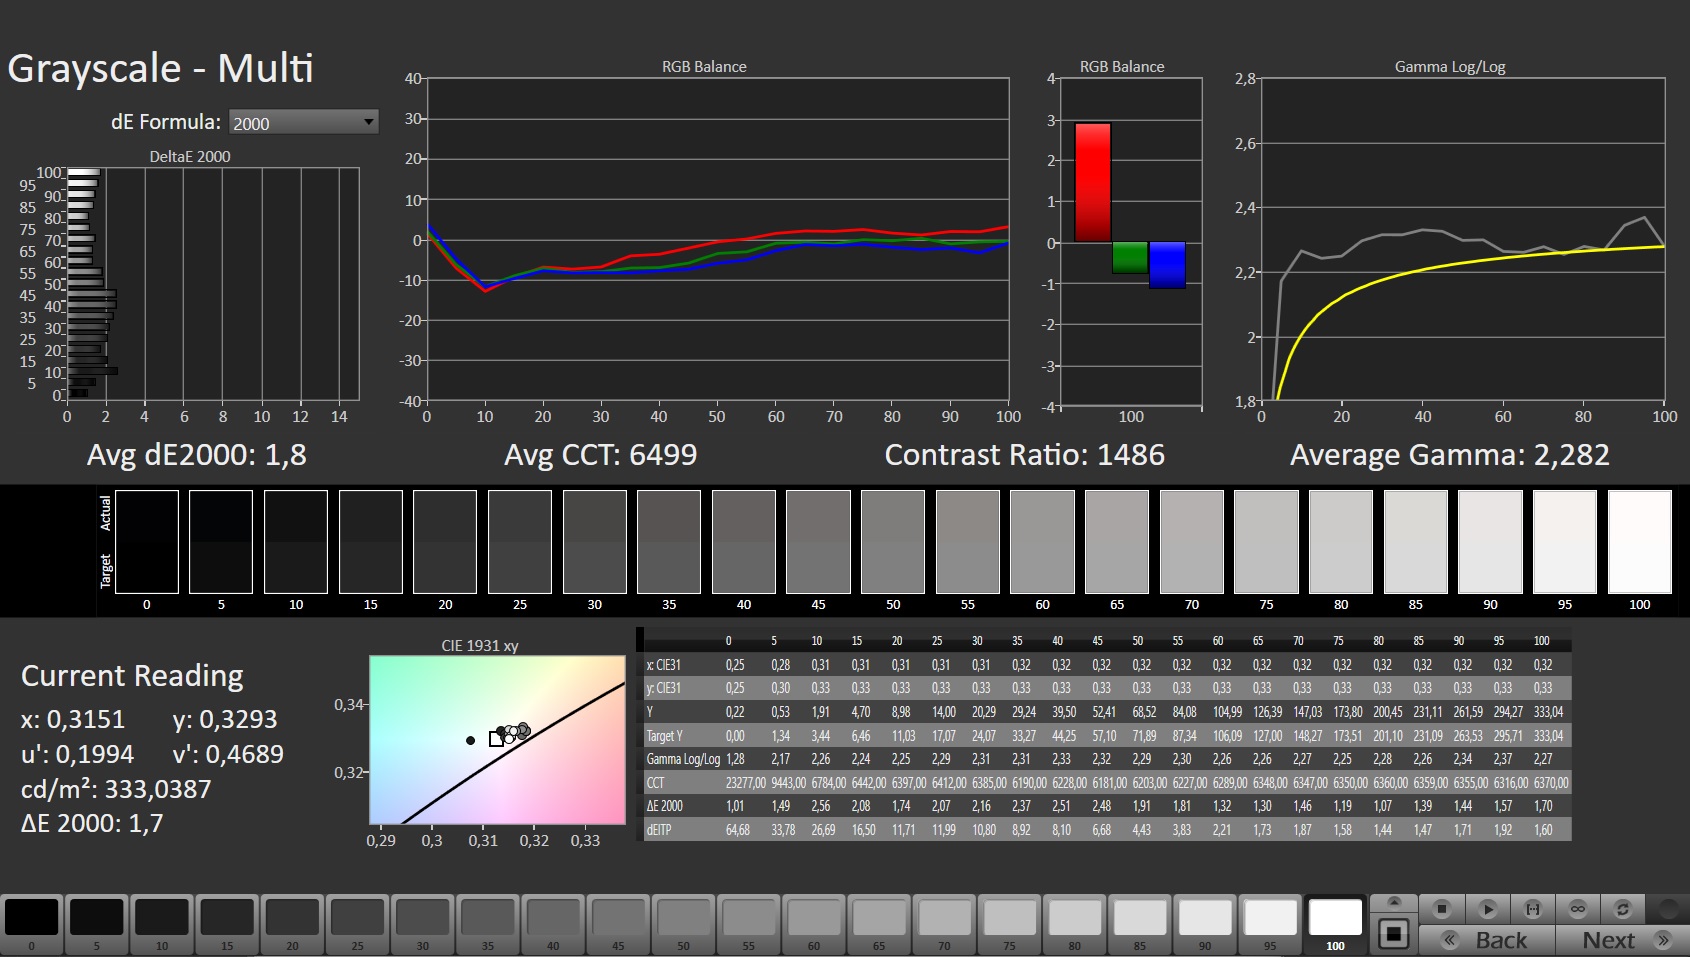
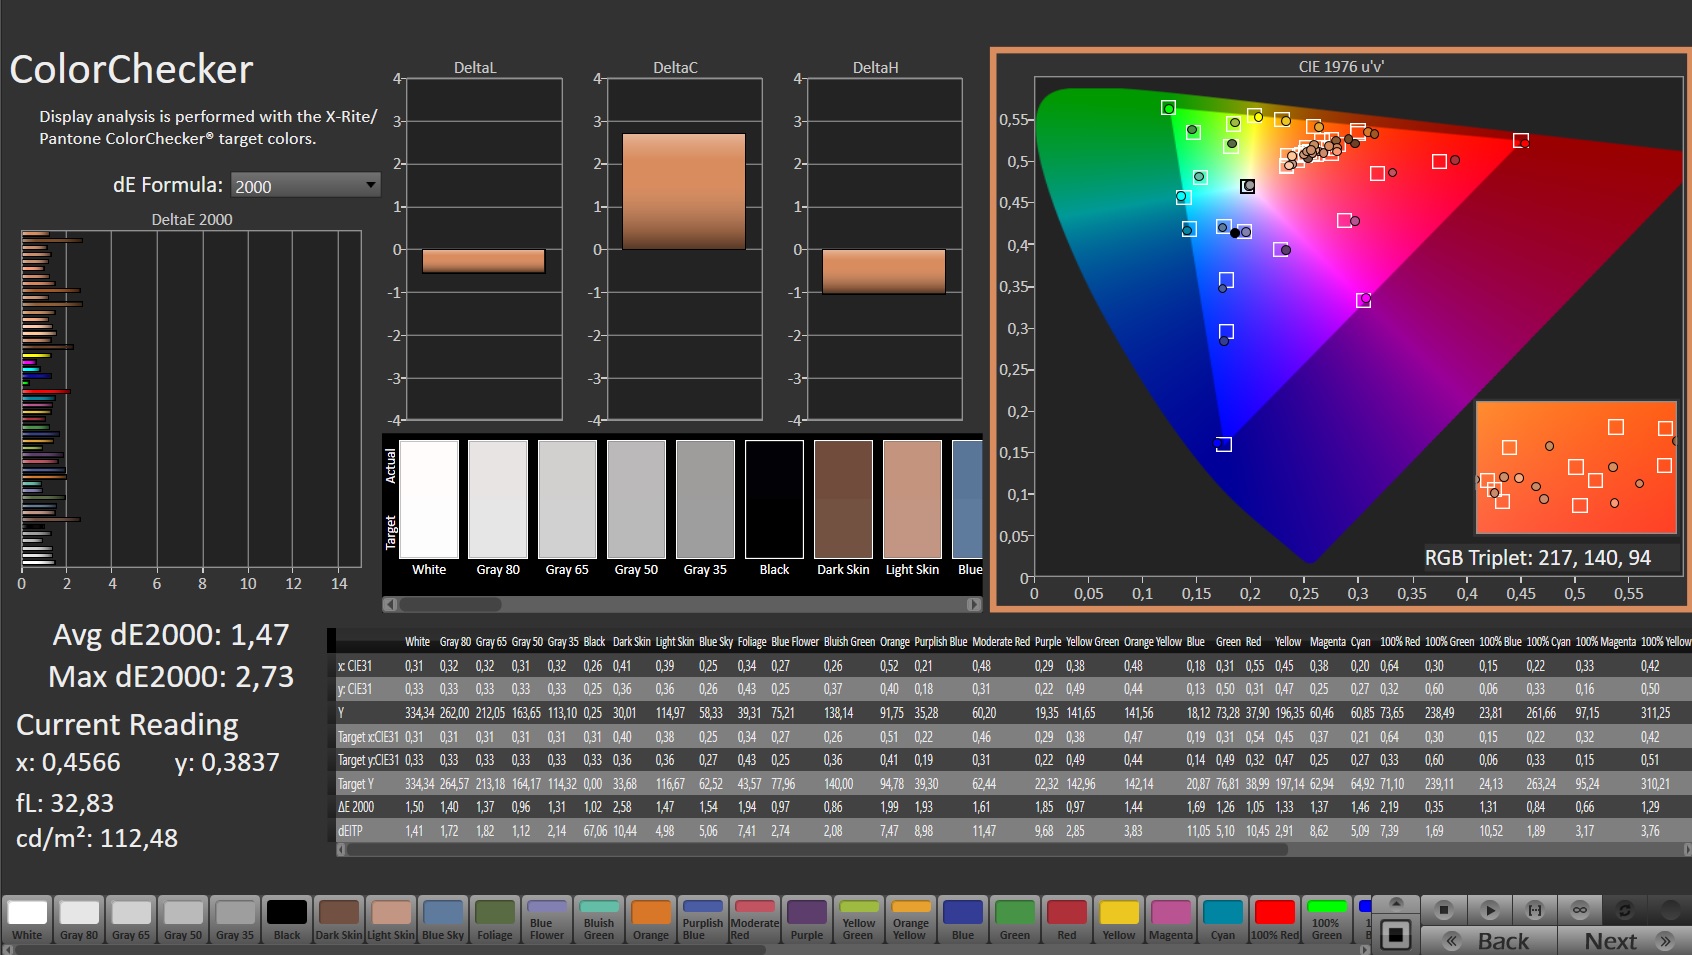
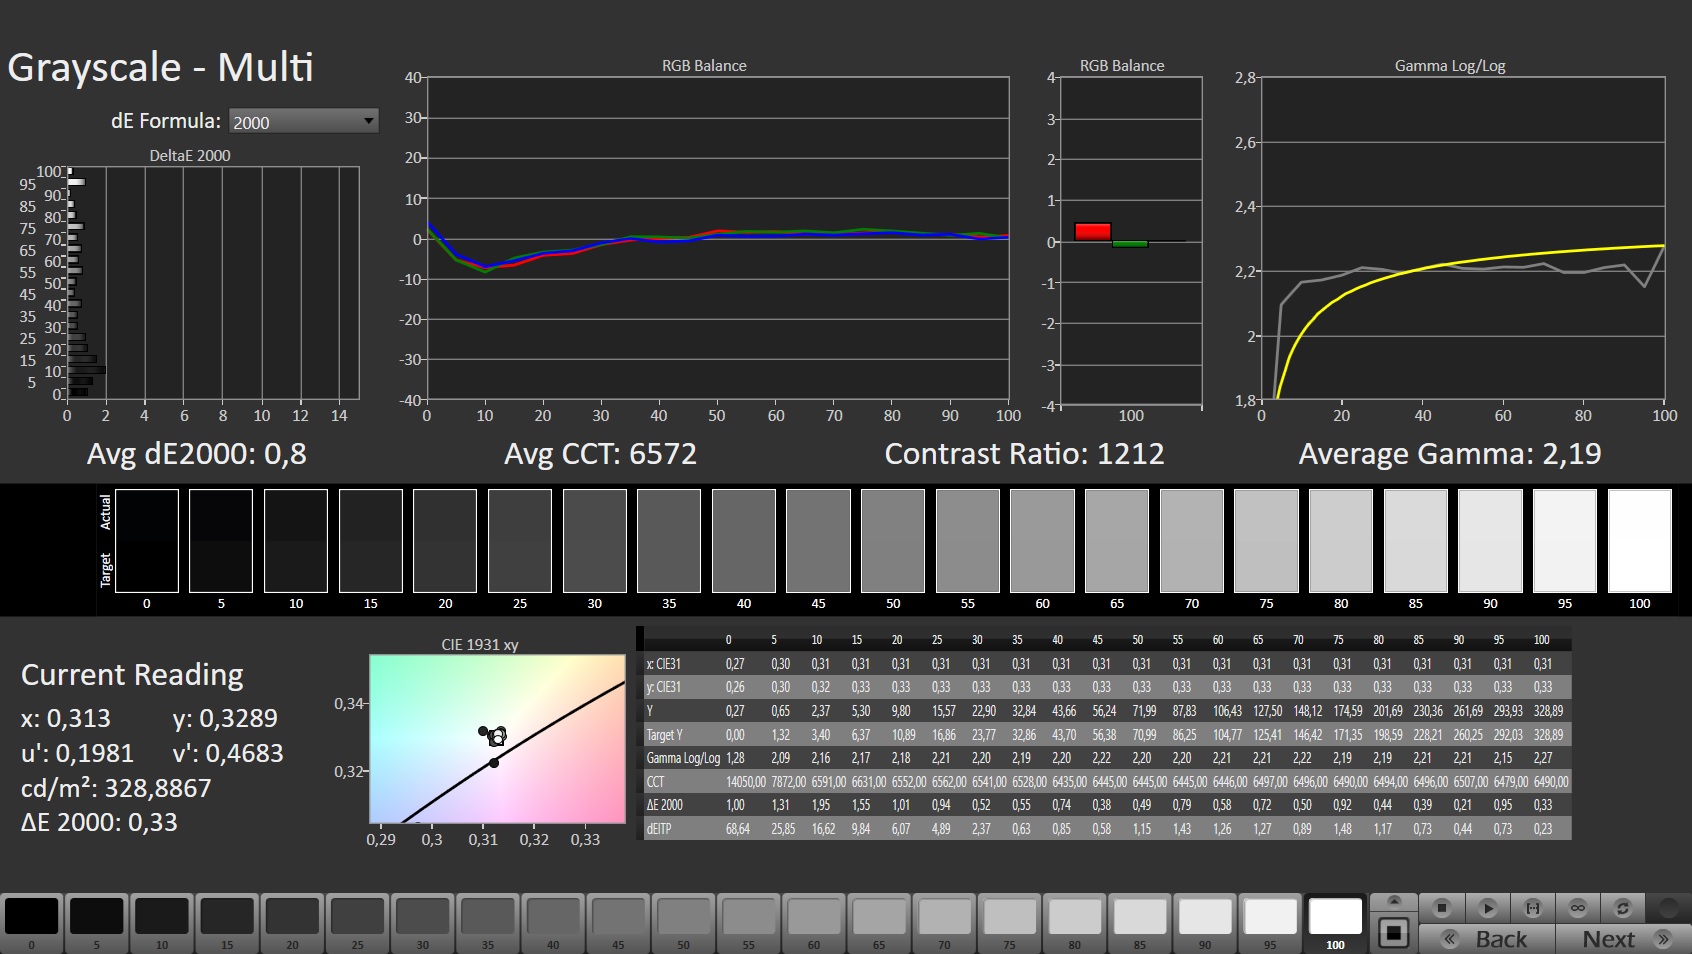
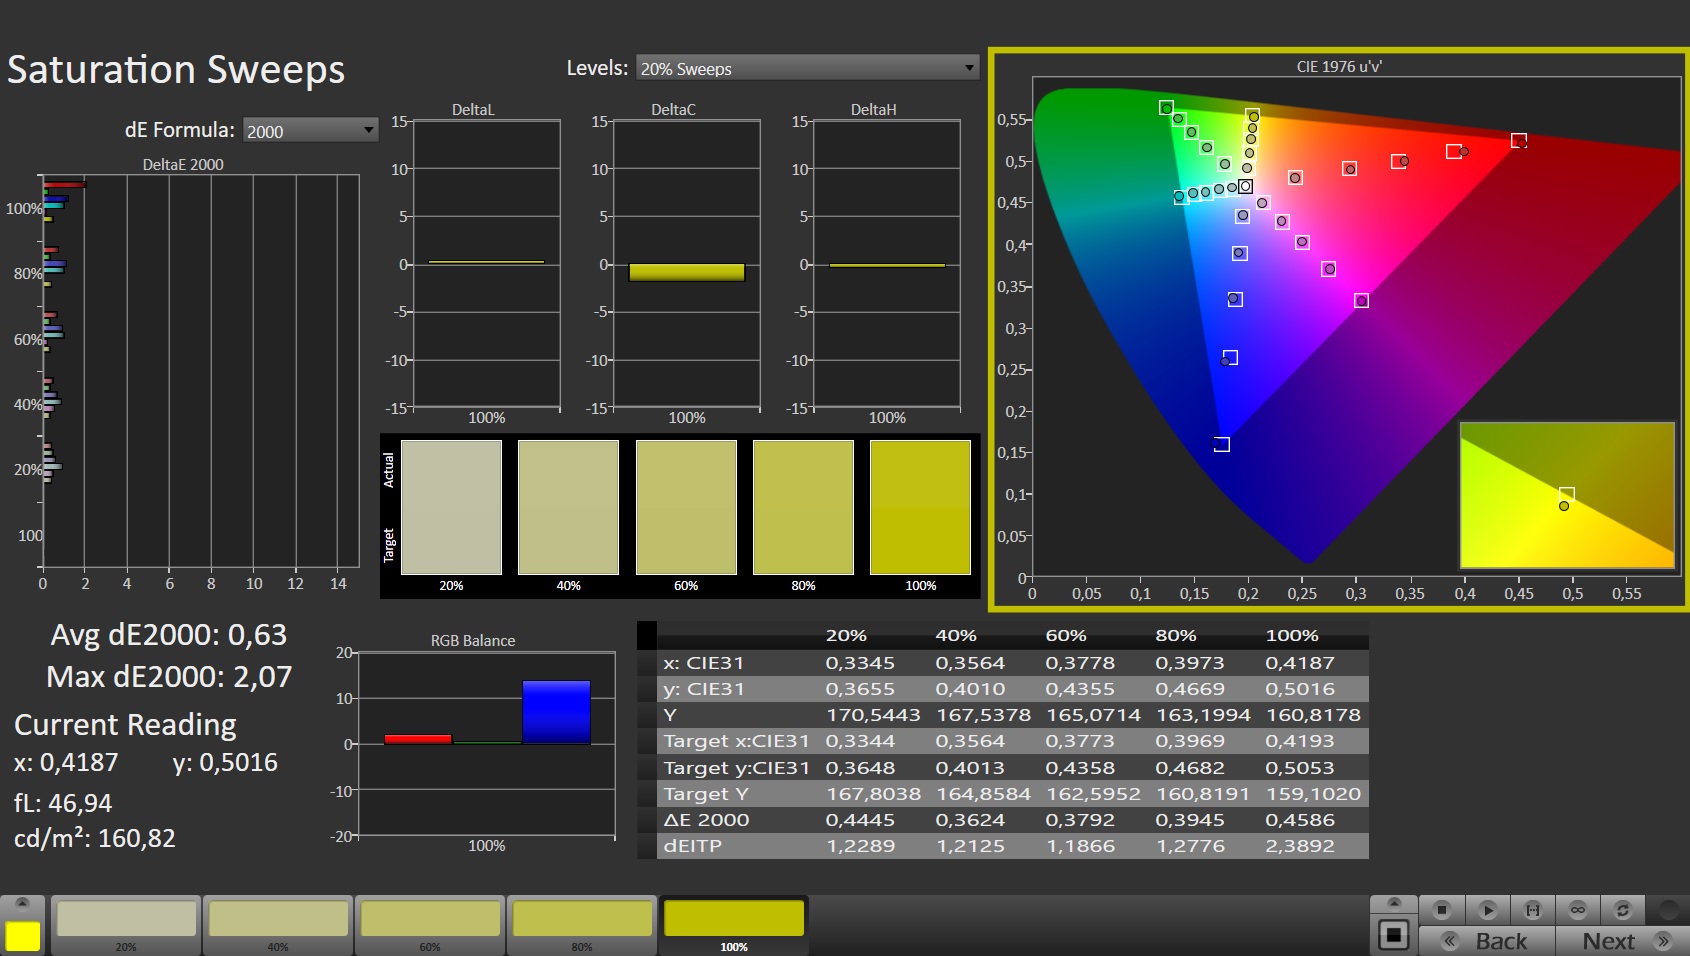
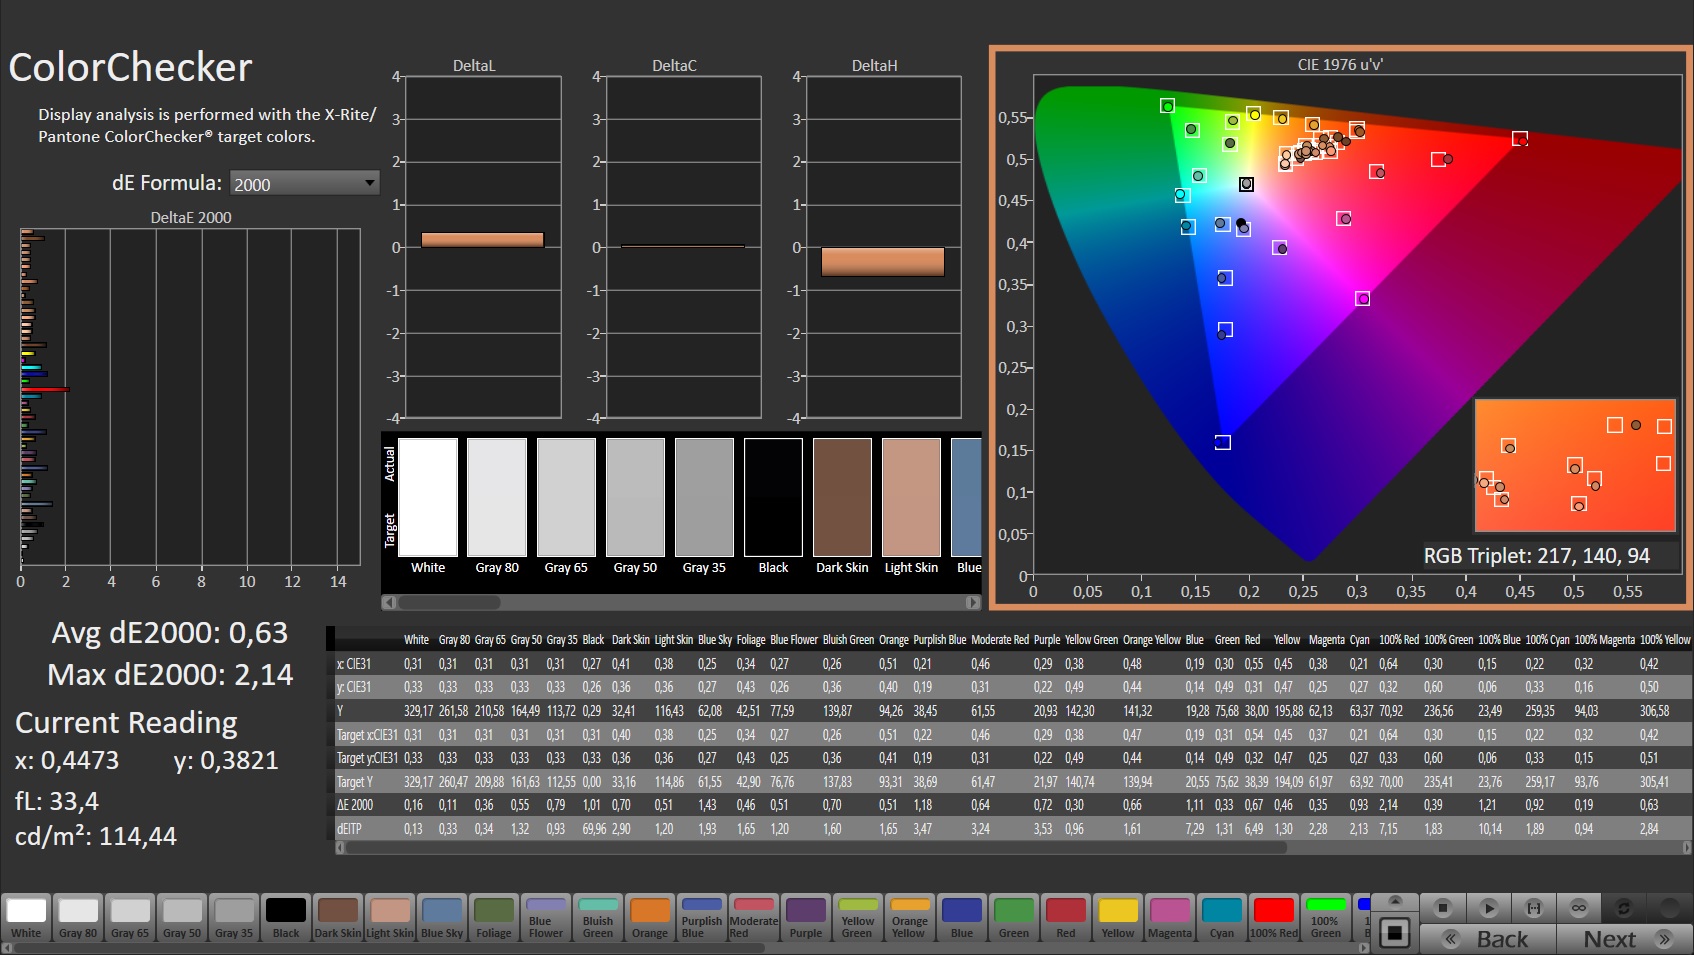
Upon delivery, the DeltaE color space deviations of the grayscales and colors are already in the ideal range (less than 3) and can be improved to a solid 0.63 and 0.8 respectively by subsequent calibration.
Display Response Times
| ↔ Response Time Black to White | ||
|---|---|---|
| 10.5 ms ... rise ↗ and fall ↘ combined | ↗ 5.7 ms rise | 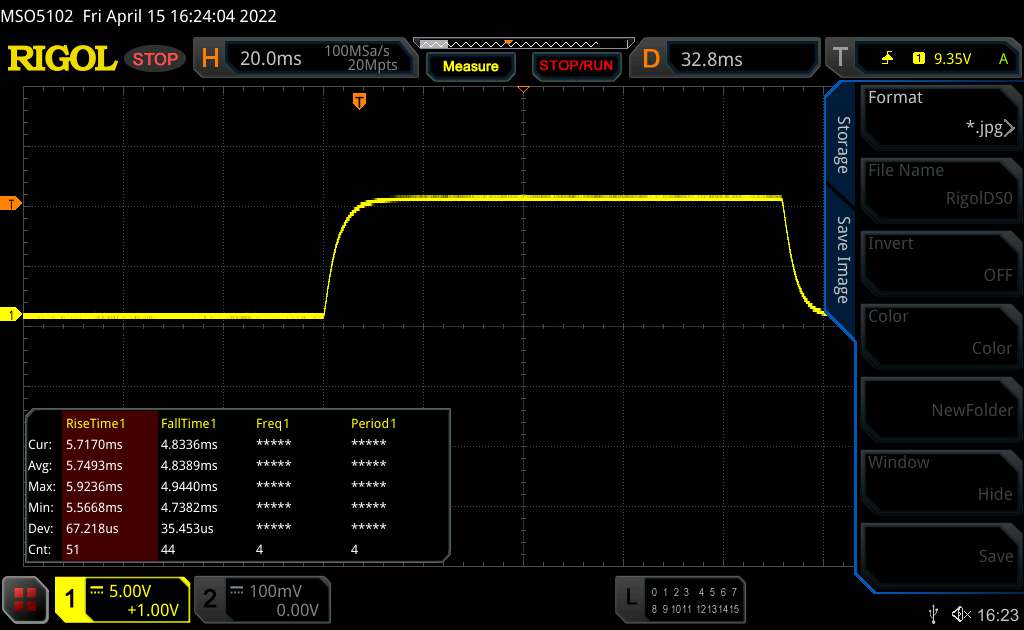 |
| ↘ 4.8 ms fall | ||
| The screen shows good response rates in our tests, but may be too slow for competitive gamers. In comparison, all tested devices range from 0.1 (minimum) to 240 (maximum) ms. » 28 % of all devices are better. This means that the measured response time is better than the average of all tested devices (20.1 ms). | ||
| ↔ Response Time 50% Grey to 80% Grey | ||
| 4.3 ms ... rise ↗ and fall ↘ combined | ↗ 2.4 ms rise | 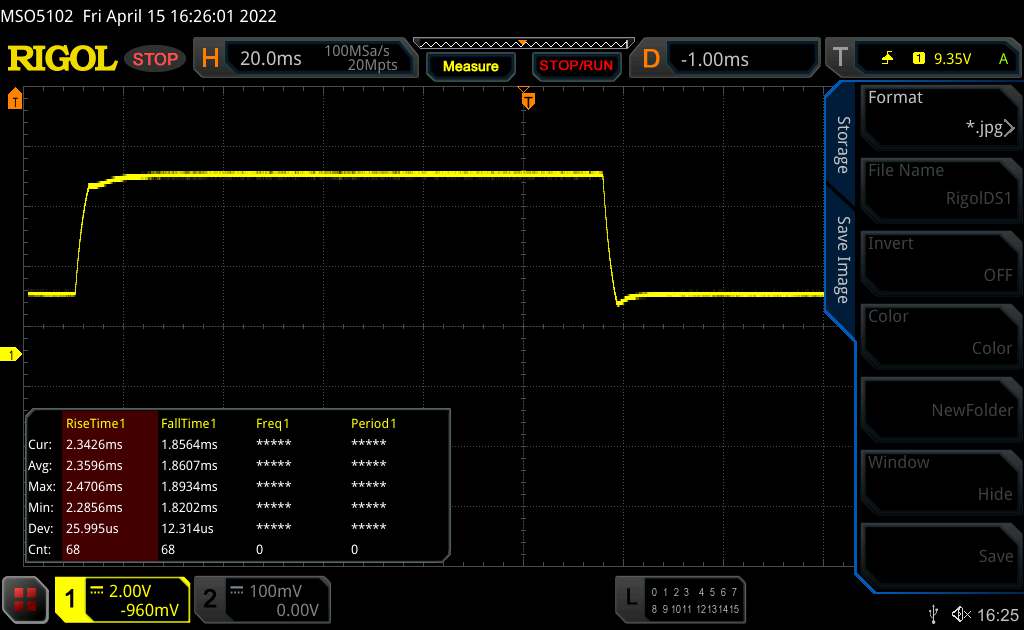 |
| ↘ 1.9 ms fall | ||
| The screen shows very fast response rates in our tests and should be very well suited for fast-paced gaming. In comparison, all tested devices range from 0.165 (minimum) to 636 (maximum) ms. » 15 % of all devices are better. This means that the measured response time is better than the average of all tested devices (31.4 ms). | ||
Screen Flickering / PWM (Pulse-Width Modulation)
| Screen flickering / PWM not detected | 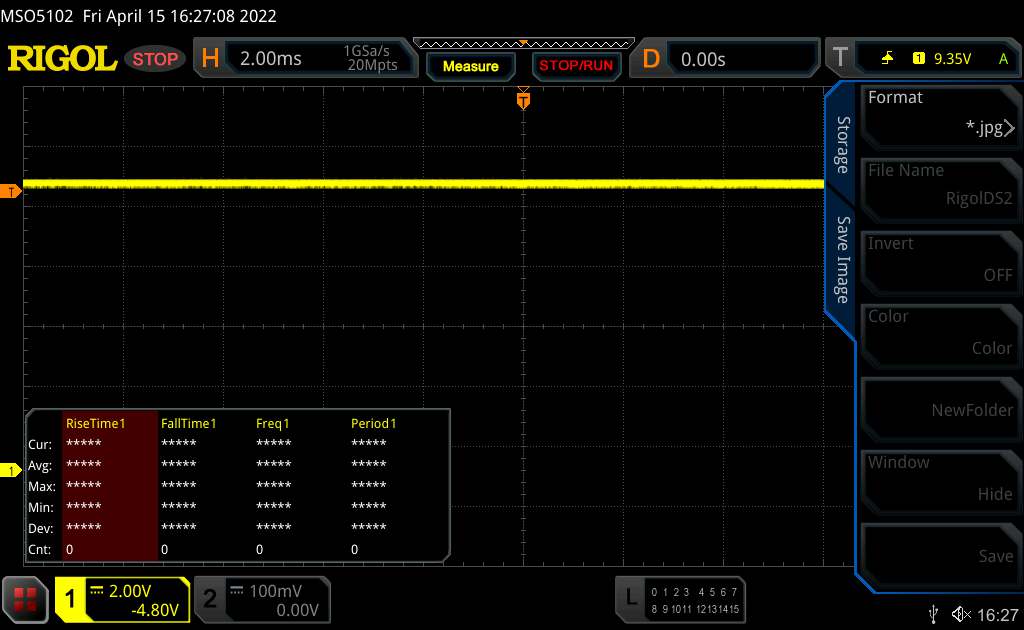 | ||
In comparison: 53 % of all tested devices do not use PWM to dim the display. If PWM was detected, an average of 7986 (minimum: 5 - maximum: 343500) Hz was measured. | |||
Thanks to a brightness of over 300 cd/m², the display is also equipped for outdoor use as long as you stay in the shade.
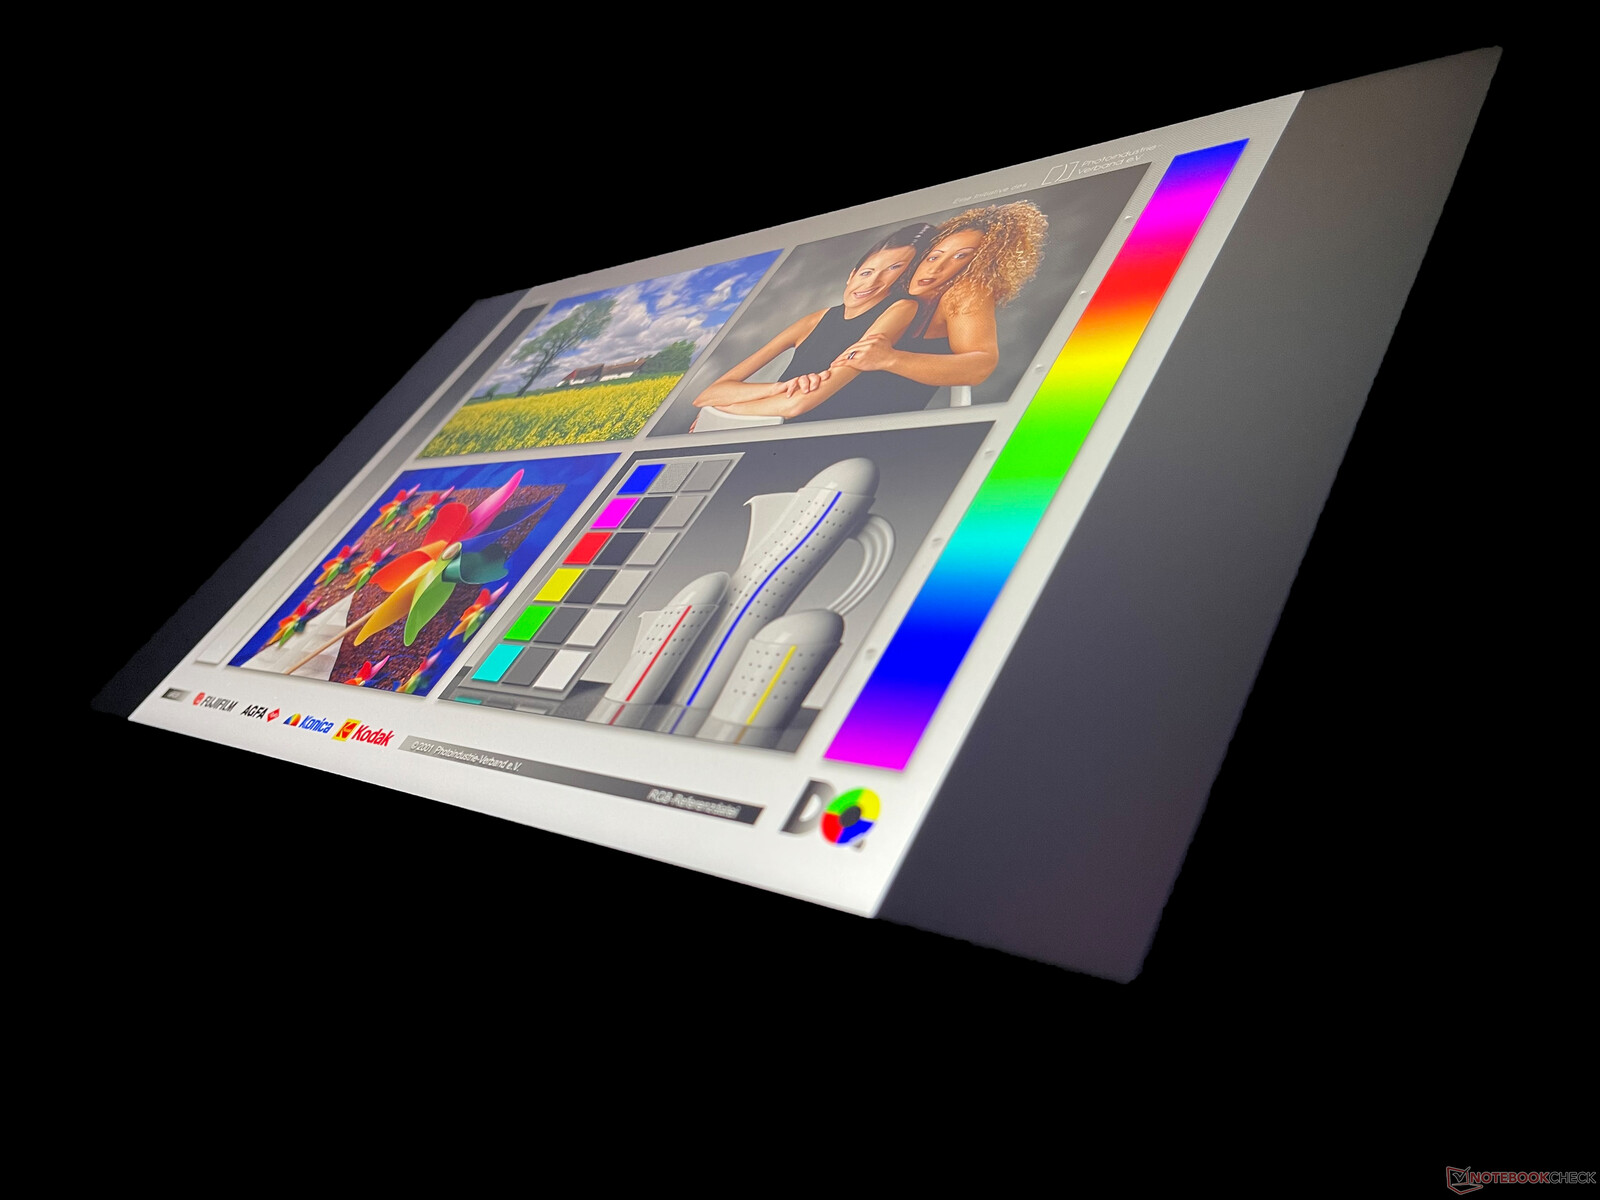
Viewing angles are superb. Even at steep angles, the colors and contrasts of the IPS display are hardly distorted.
Performance - Razer gaming laptop with top hardware
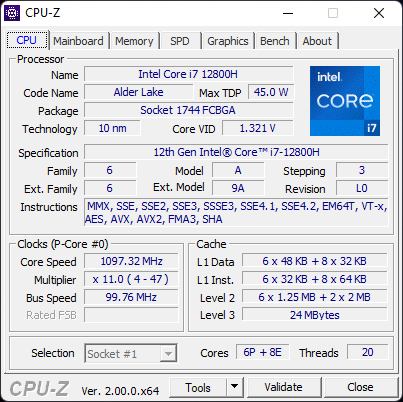
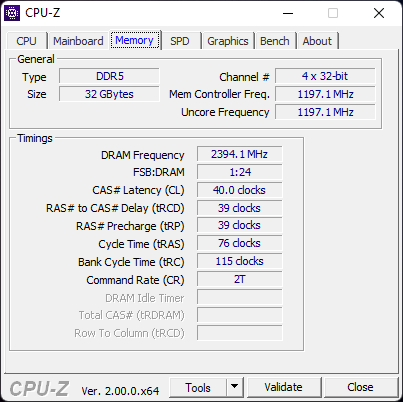
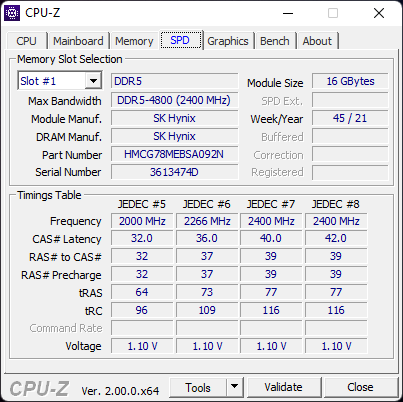
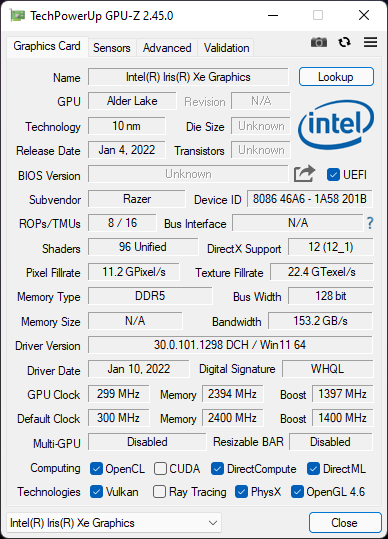
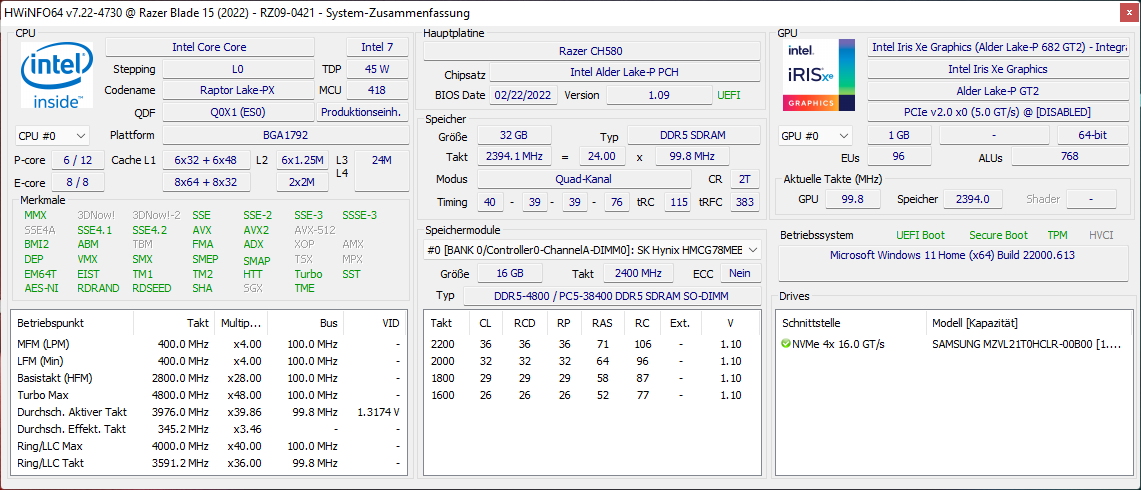
Our Razer Blade 15 is equipped with an Intel Core i7-12800H and an Nvidia GeForce RTX 3080 Ti. There is also 32 GB of DDR5 RAM in quad-channel mode and a 1 TB PCIe 4.0 SSD. In combination with the 4K panel, the laptop is alternatively available with the Core i9-12900H.
Test Conditions
In order to gain new insights during testing, we performed all measurements with the Synapse "Balanced" profile. This makes the GPU work with a maximum TGP of around 95 W and also limits the CPU. You can find the maximum achievable scores in our other review.
Processor
The Intel Core i7-12800H is a brand new 12th generation Intel processor with DDR5 RAM support. DDR5 functionality allows the two RAM modules to operate in quad-channel mode.
The Razer Blade 15 is less able to keep up with competitors in terms of CPU performance in "Balanced" mode than without performance limitations. Even the nominally weaker Core i7-12700H in the XMG Neo 15 E22 beats our review device in both scenarios in the Cinebench R15 multi-loop test. The fact that some single-thread benchmarks turn out better is probably due to the fact that the temperature limits are reached before the TDP limits. The turbo boost only remains active for a short time.
The Cinebench R15 multi-thread test delivers the same score in battery mode under the profile we selected.
Cinebench R15 Multi Sustained Load
* ... smaller is better
AIDA64: FP32 Ray-Trace | FPU Julia | CPU SHA3 | CPU Queen | FPU SinJulia | FPU Mandel | CPU AES | CPU ZLib | FP64 Ray-Trace | CPU PhotoWorxx
| Performance rating | |
| Average of class Gaming | |
| Asus ROG Strix Scar 15 G533QS | |
| MSI Stealth GS66 12UGS | |
| Schenker XMG Neo 15 E22 (Early 2022, RTX 3080 Ti) | |
| MSI Vector GP66 12UGS | |
| Average Intel Core i7-12800H | |
| Razer Blade 15 2022 | |
| Razer Blade 15 Advanced Model Early 2022 | |
| AIDA64 / FP32 Ray-Trace | |
| Average of class Gaming (10227 - 85542, n=127, last 2 years) | |
| Asus ROG Strix Scar 15 G533QS | |
| Schenker XMG Neo 15 E22 (Early 2022, RTX 3080 Ti) | |
| MSI Stealth GS66 12UGS | |
| Average Intel Core i7-12800H (5839 - 15206, n=5) | |
| MSI Vector GP66 12UGS | |
| Razer Blade 15 2022 | |
| Razer Blade 15 Advanced Model Early 2022 | |
| AIDA64 / FPU Julia | |
| Average of class Gaming (51376 - 238426, n=127, last 2 years) | |
| Asus ROG Strix Scar 15 G533QS | |
| Average Intel Core i7-12800H (27801 - 80002, n=5) | |
| Schenker XMG Neo 15 E22 (Early 2022, RTX 3080 Ti) | |
| MSI Stealth GS66 12UGS | |
| MSI Vector GP66 12UGS | |
| Razer Blade 15 2022 | |
| Razer Blade 15 Advanced Model Early 2022 | |
| AIDA64 / CPU SHA3 | |
| Average of class Gaming (2180 - 9817, n=127, last 2 years) | |
| Asus ROG Strix Scar 15 G533QS | |
| Schenker XMG Neo 15 E22 (Early 2022, RTX 3080 Ti) | |
| MSI Stealth GS66 12UGS | |
| MSI Vector GP66 12UGS | |
| Average Intel Core i7-12800H (2013 - 3684, n=5) | |
| Razer Blade 15 2022 | |
| Razer Blade 15 Advanced Model Early 2022 | |
| AIDA64 / CPU Queen | |
| Average of class Gaming (49785 - 173351, n=126, last 2 years) | |
| MSI Vector GP66 12UGS | |
| Asus ROG Strix Scar 15 G533QS | |
| MSI Stealth GS66 12UGS | |
| Schenker XMG Neo 15 E22 (Early 2022, RTX 3080 Ti) | |
| Average Intel Core i7-12800H (85965 - 108084, n=5) | |
| Razer Blade 15 2022 | |
| Razer Blade 15 Advanced Model Early 2022 | |
| AIDA64 / FPU SinJulia | |
| Average of class Gaming (4424 - 33636, n=127, last 2 years) | |
| Asus ROG Strix Scar 15 G533QS | |
| Schenker XMG Neo 15 E22 (Early 2022, RTX 3080 Ti) | |
| MSI Stealth GS66 12UGS | |
| MSI Vector GP66 12UGS | |
| Razer Blade 15 2022 | |
| Average Intel Core i7-12800H (7027 - 9658, n=5) | |
| Razer Blade 15 Advanced Model Early 2022 | |
| AIDA64 / FPU Mandel | |
| Average of class Gaming (25115 - 128721, n=127, last 2 years) | |
| Asus ROG Strix Scar 15 G533QS | |
| Schenker XMG Neo 15 E22 (Early 2022, RTX 3080 Ti) | |
| MSI Stealth GS66 12UGS | |
| Average Intel Core i7-12800H (15765 - 38179, n=5) | |
| MSI Vector GP66 12UGS | |
| Razer Blade 15 2022 | |
| Razer Blade 15 Advanced Model Early 2022 | |
| AIDA64 / CPU AES | |
| Asus ROG Strix Scar 15 G533QS | |
| Average of class Gaming (39258 - 247074, n=127, last 2 years) | |
| MSI Stealth GS66 12UGS | |
| MSI Vector GP66 12UGS | |
| Schenker XMG Neo 15 E22 (Early 2022, RTX 3080 Ti) | |
| Razer Blade 15 Advanced Model Early 2022 | |
| Average Intel Core i7-12800H (55371 - 73928, n=5) | |
| Razer Blade 15 2022 | |
| AIDA64 / CPU ZLib | |
| Average of class Gaming (574 - 2531, n=127, last 2 years) | |
| Schenker XMG Neo 15 E22 (Early 2022, RTX 3080 Ti) | |
| MSI Vector GP66 12UGS | |
| MSI Stealth GS66 12UGS | |
| Razer Blade 15 2022 | |
| Average Intel Core i7-12800H (701 - 1047, n=5) | |
| Asus ROG Strix Scar 15 G533QS | |
| Razer Blade 15 Advanced Model Early 2022 | |
| AIDA64 / FP64 Ray-Trace | |
| Average of class Gaming (5509 - 45446, n=127, last 2 years) | |
| Asus ROG Strix Scar 15 G533QS | |
| Schenker XMG Neo 15 E22 (Early 2022, RTX 3080 Ti) | |
| MSI Stealth GS66 12UGS | |
| Average Intel Core i7-12800H (3257 - 8559, n=5) | |
| MSI Vector GP66 12UGS | |
| Razer Blade 15 2022 | |
| Razer Blade 15 Advanced Model Early 2022 | |
| AIDA64 / CPU PhotoWorxx | |
| Average of class Gaming (10805 - 62916, n=127, last 2 years) | |
| Razer Blade 15 2022 | |
| Schenker XMG Neo 15 E22 (Early 2022, RTX 3080 Ti) | |
| MSI Stealth GS66 12UGS | |
| Razer Blade 15 Advanced Model Early 2022 | |
| Average Intel Core i7-12800H (31329 - 40992, n=5) | |
| MSI Vector GP66 12UGS | |
| Asus ROG Strix Scar 15 G533QS | |
System Performance
System performance is solid, according to the PCMark 10 tests. In everyday use, operating speed is smooth and there are no noticeable delays, which is why you can use "Balanced" mode free of worry.
CrossMark: Overall | Productivity | Creativity | Responsiveness
| PCMark 10 / Score | |
| Average of class Gaming (5828 - 10060, n=108, last 2 years) | |
| MSI Vector GP66 12UGS | |
| Razer Blade 15 2022 | |
| Average Intel Core i7-12800H, NVIDIA GeForce RTX 3080 Ti Laptop GPU (7313 - 7744, n=3) | |
| MSI Stealth GS66 12UGS | |
| Razer Blade 15 Advanced Model Early 2022 | |
| Schenker XMG Neo 15 E22 (Early 2022, RTX 3080 Ti) | |
| Asus ROG Strix Scar 15 G533QS | |
| PCMark 10 / Essentials | |
| MSI Vector GP66 12UGS | |
| MSI Stealth GS66 12UGS | |
| Razer Blade 15 2022 | |
| Average Intel Core i7-12800H, NVIDIA GeForce RTX 3080 Ti Laptop GPU (10597 - 10814, n=3) | |
| Average of class Gaming (8810 - 12600, n=112, last 2 years) | |
| Razer Blade 15 Advanced Model Early 2022 | |
| Asus ROG Strix Scar 15 G533QS | |
| Schenker XMG Neo 15 E22 (Early 2022, RTX 3080 Ti) | |
| PCMark 10 / Productivity | |
| Average of class Gaming (6662 - 16716, n=110, last 2 years) | |
| MSI Vector GP66 12UGS | |
| Asus ROG Strix Scar 15 G533QS | |
| Razer Blade 15 Advanced Model Early 2022 | |
| Razer Blade 15 2022 | |
| Average Intel Core i7-12800H, NVIDIA GeForce RTX 3080 Ti Laptop GPU (9470 - 9675, n=3) | |
| MSI Stealth GS66 12UGS | |
| Schenker XMG Neo 15 E22 (Early 2022, RTX 3080 Ti) | |
| PCMark 10 / Digital Content Creation | |
| Average of class Gaming (7505 - 19351, n=110, last 2 years) | |
| MSI Vector GP66 12UGS | |
| Razer Blade 15 2022 | |
| Average Intel Core i7-12800H, NVIDIA GeForce RTX 3080 Ti Laptop GPU (10351 - 12306, n=3) | |
| MSI Stealth GS66 12UGS | |
| Schenker XMG Neo 15 E22 (Early 2022, RTX 3080 Ti) | |
| Razer Blade 15 Advanced Model Early 2022 | |
| Asus ROG Strix Scar 15 G533QS | |
| CrossMark / Overall | |
| Average of class Gaming (1247 - 2344, n=109, last 2 years) | |
| Razer Blade 15 Advanced Model Early 2022 | |
| Average Intel Core i7-12800H, NVIDIA GeForce RTX 3080 Ti Laptop GPU (n=1) | |
| CrossMark / Productivity | |
| Average of class Gaming (1299 - 2211, n=109, last 2 years) | |
| Razer Blade 15 Advanced Model Early 2022 | |
| Average Intel Core i7-12800H, NVIDIA GeForce RTX 3080 Ti Laptop GPU (n=1) | |
| CrossMark / Creativity | |
| Average of class Gaming (1275 - 2729, n=109, last 2 years) | |
| Razer Blade 15 Advanced Model Early 2022 | |
| Average Intel Core i7-12800H, NVIDIA GeForce RTX 3080 Ti Laptop GPU (n=1) | |
| CrossMark / Responsiveness | |
| Average of class Gaming (1030 - 2330, n=109, last 2 years) | |
| Razer Blade 15 Advanced Model Early 2022 | |
| Average Intel Core i7-12800H, NVIDIA GeForce RTX 3080 Ti Laptop GPU (n=1) | |
| PCMark 8 Home Score Accelerated v2 | 6657 points | |
| PCMark 8 Work Score Accelerated v2 | 7009 points | |
| PCMark 10 Score | 7313 points | |
Help | ||
| AIDA64 / Memory Copy | |
| Average of class Gaming (21750 - 108104, n=127, last 2 years) | |
| Schenker XMG Neo 15 E22 (Early 2022, RTX 3080 Ti) | |
| Razer Blade 15 2022 | |
| MSI Stealth GS66 12UGS | |
| Razer Blade 15 Advanced Model Early 2022 | |
| Average Intel Core i7-12800H (48643 - 62522, n=5) | |
| MSI Vector GP66 12UGS | |
| Asus ROG Strix Scar 15 G533QS | |
| AIDA64 / Memory Read | |
| Average of class Gaming (22956 - 104349, n=127, last 2 years) | |
| Schenker XMG Neo 15 E22 (Early 2022, RTX 3080 Ti) | |
| Razer Blade 15 2022 | |
| MSI Stealth GS66 12UGS | |
| Razer Blade 15 Advanced Model Early 2022 | |
| Average Intel Core i7-12800H (56629 - 66199, n=5) | |
| MSI Vector GP66 12UGS | |
| Asus ROG Strix Scar 15 G533QS | |
| AIDA64 / Memory Write | |
| Average of class Gaming (22297 - 133486, n=127, last 2 years) | |
| MSI Stealth GS66 12UGS | |
| Razer Blade 15 2022 | |
| Razer Blade 15 Advanced Model Early 2022 | |
| Schenker XMG Neo 15 E22 (Early 2022, RTX 3080 Ti) | |
| Average Intel Core i7-12800H (50923 - 66074, n=5) | |
| MSI Vector GP66 12UGS | |
| Asus ROG Strix Scar 15 G533QS | |
| AIDA64 / Memory Latency | |
| Average of class Gaming (75.3 - 259, n=127, last 2 years) | |
| Razer Blade 15 Advanced Model Early 2022 | |
| MSI Stealth GS66 12UGS | |
| MSI Vector GP66 12UGS | |
| Asus ROG Strix Scar 15 G533QS | |
| Average Intel Core i7-12800H (89.3 - 95.2, n=5) | |
| Schenker XMG Neo 15 E22 (Early 2022, RTX 3080 Ti) | |
| Razer Blade 15 2022 | |
* ... smaller is better
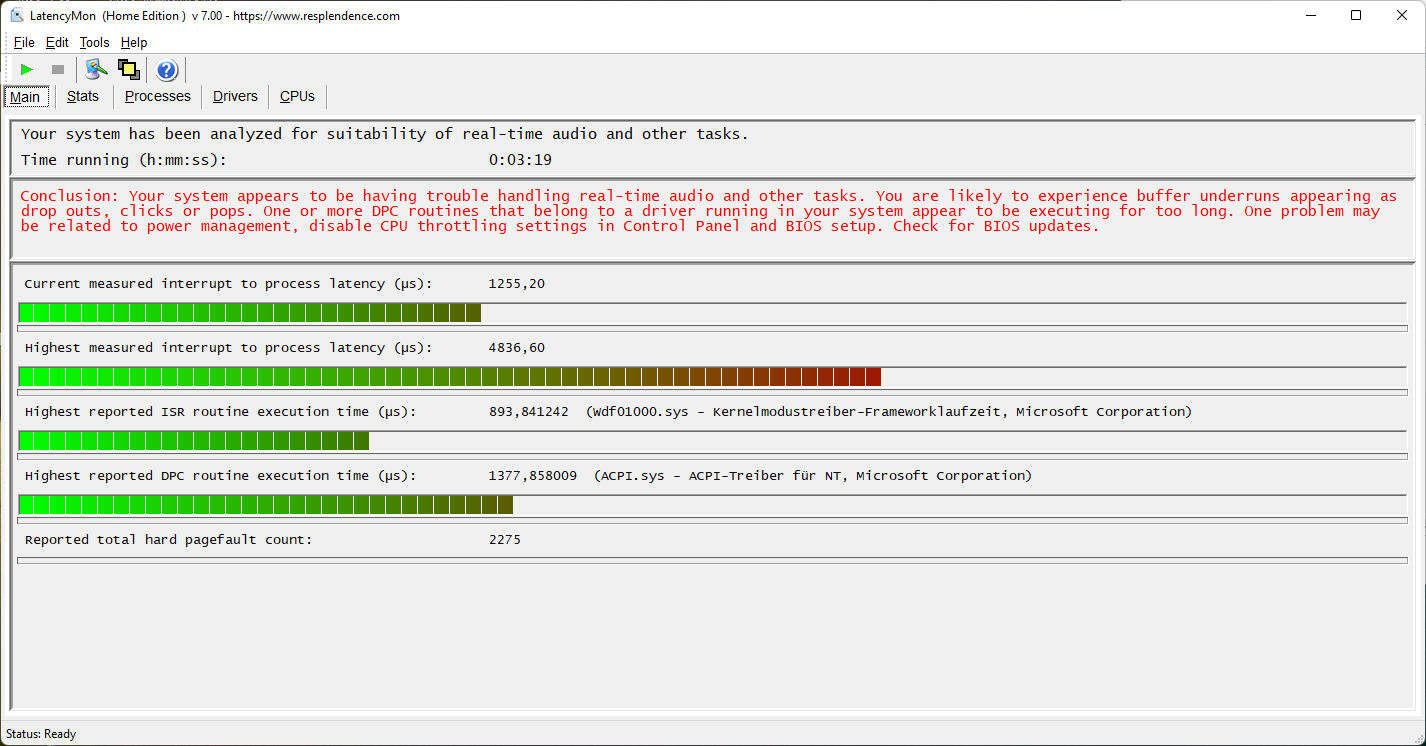
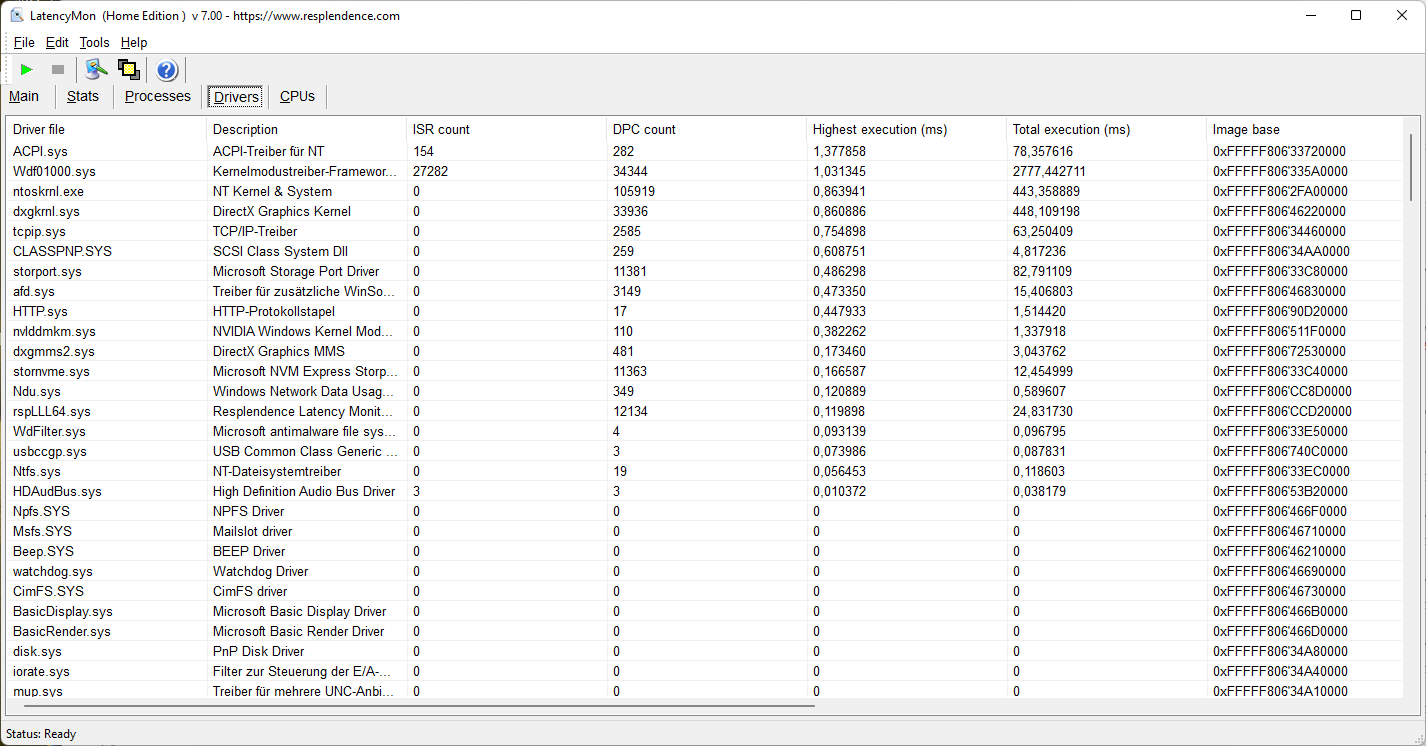
DPC Latencies
According to LatencyMon, DPC latencies may be too high for real-time audio and video editing in the configuration we tested.
| DPC Latencies / LatencyMon - interrupt to process latency (max), Web, Youtube, Prime95 | |
| Razer Blade 15 Advanced Model Early 2022 | |
| MSI Vector GP66 12UGS | |
| MSI Stealth GS66 12UGS | |
| Asus ROG Strix Scar 15 G533QS | |
| Razer Blade 15 2022 | |
| Schenker XMG Neo 15 E22 (Early 2022, RTX 3080 Ti) | |
* ... smaller is better
Storage Devices
A 1TB Samsung PM9A1 M.2 SDD with PCIe 4.0 is installed in our review device, which results in very high data transfer rates. Since the PCIe 4.0 SSD "CA6-8D1024" from SSSTC was installed in our first Blade 15 review device, the drive models and transfer rates may differ.

* ... smaller is better
Sustained Read Performance: DiskSpd Read Loop, Queue Depth 8
GPU
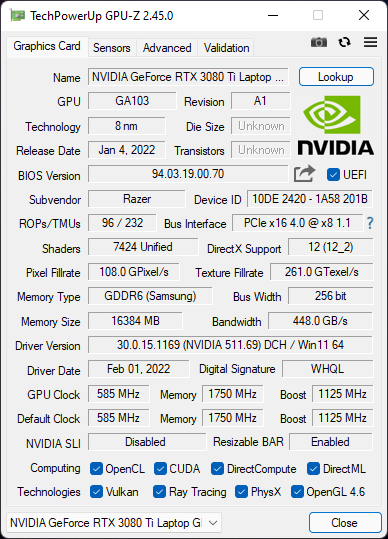
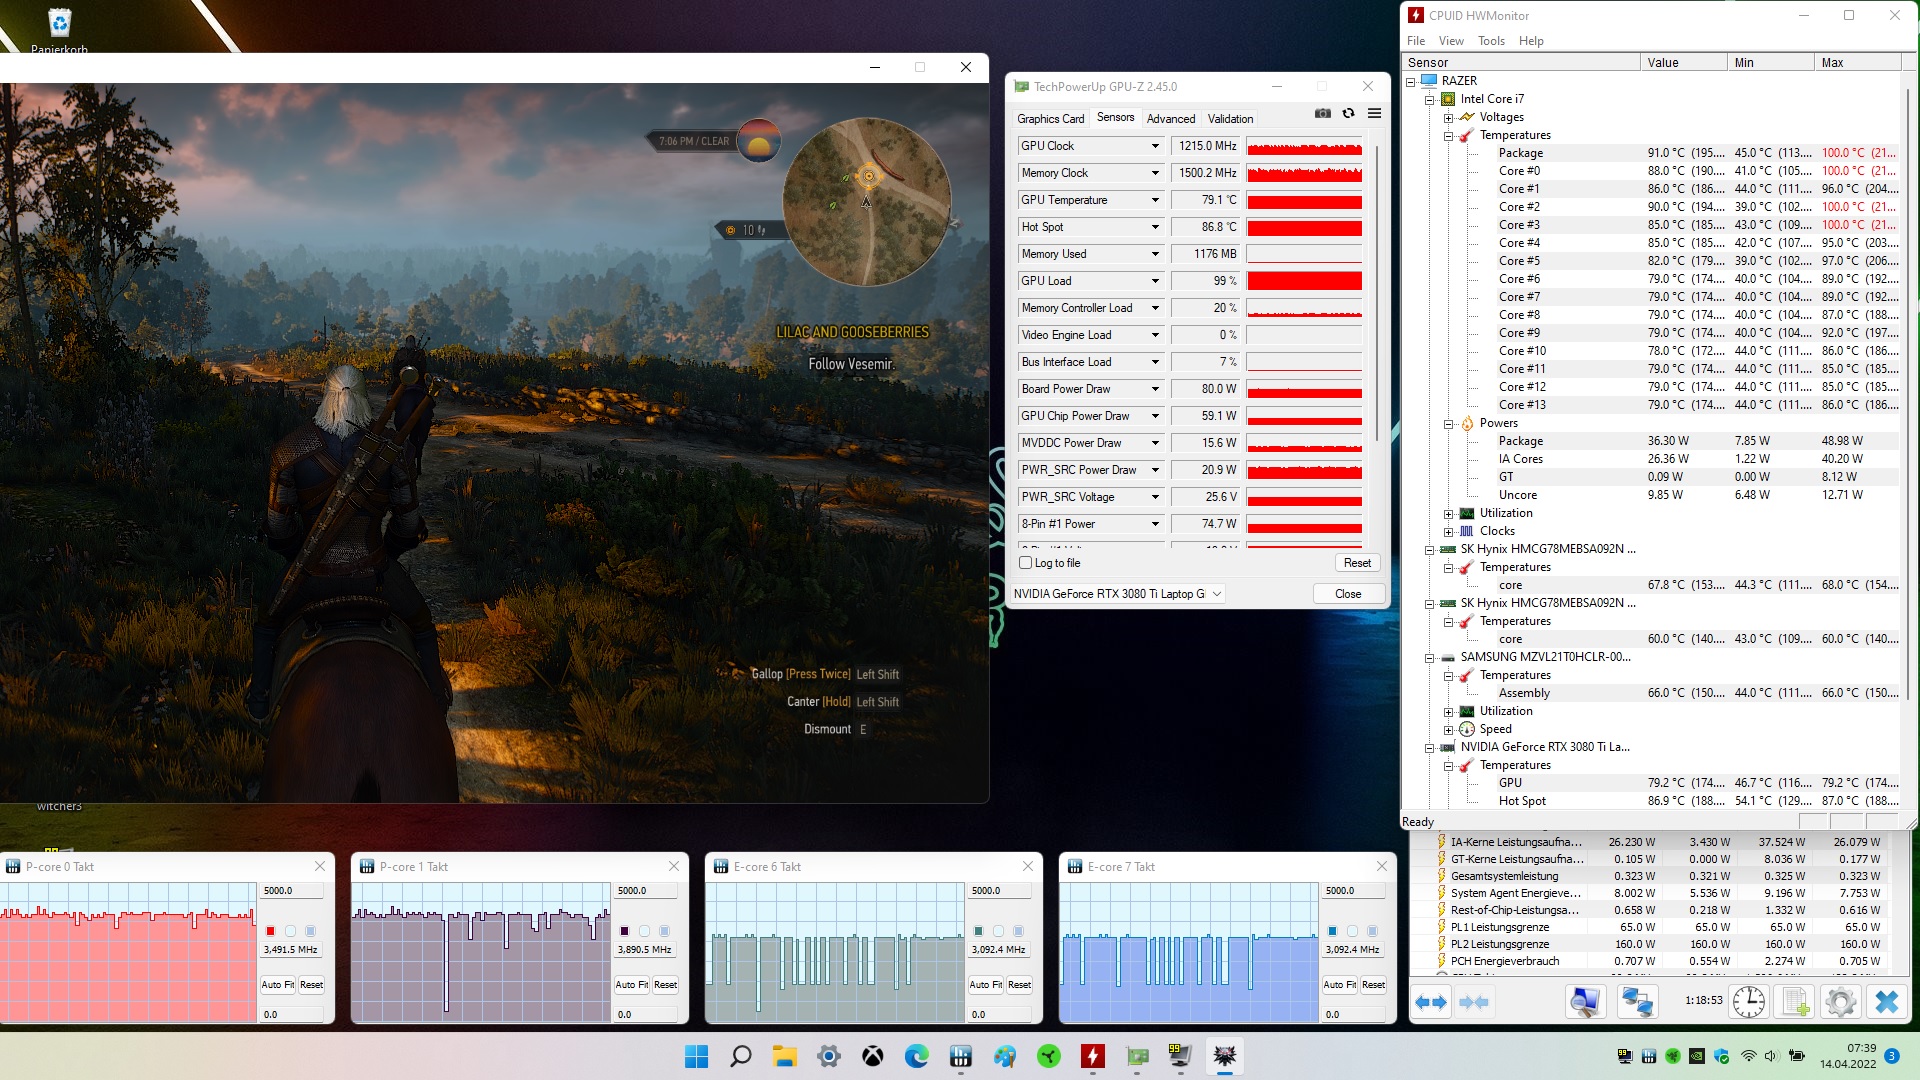
The mobile Nvidia GeForce RTX 3080 Ti with 16 GB of VRAM belongs to the Ampere Refresh generation. Based on the 3DMark benchmarks, using "Balanced" mode results in a performance deficit of about 10-20%. Small drops can be seen in the frame rate progression of The Witcher 3, but this had a subjectively minimal impact on gaming experience.
Performance is limited in battery mode. A Fire Strike run delivered physics and graphics scores of 12,888 and 10,344 respectively in battery mode, compared to 21866 and 25240 in mains mode.
| 3DMark 11 Performance | 25091 points | |
| 3DMark Ice Storm Standard Score | 158195 points | |
| 3DMark Cloud Gate Standard Score | 43351 points | |
| 3DMark Fire Strike Score | 21106 points | |
| 3DMark Time Spy Score | 9596 points | |
Help | ||
Gaming Performance
Gming benchmarks are naturally weaker in balanced performance mode. Nevertheless, absolute frame rates are still high enough for a smooth gaming experience, so you don't necessarily have to run the Blade 15 in high-performance mode.
Witcher 3 FPS Diagram
| low | med. | high | ultra | |
|---|---|---|---|---|
| GTA V (2015) | 178.7 | 170.7 | 153.4 | 92.4 |
| The Witcher 3 (2015) | 316 | 200 | 155.5 | 89.3 |
| Dota 2 Reborn (2015) | 59.9 | 59.9 | 59.9 | 59.9 |
| Final Fantasy XV Benchmark (2018) | 148.3 | 119.4 | 90.4 | |
| X-Plane 11.11 (2018) | 124.3 | 109.5 | 93.4 | |
| Strange Brigade (2018) | 361 | 212 | 167.6 | 149.8 |
Emissions - Heat-conductive housing
Noise
The fans are sluggish and allow the components to become a little warm before they kick in. In particular, the average noise level under load is perceptibly lower in balanced mode. The noise level of our first Blade 15 (mode: maximum performance) was within the usual range. No coil whining was detected in our review device.
Noise level
| Idle |
| 26 / 27 / 29 dB(A) |
| Load |
| 37 / 45 dB(A) |
 | ||
30 dB silent 40 dB(A) audible 50 dB(A) loud |
||
min: | ||
| Razer Blade 15 Advanced Model Early 2022 i7-12800H, GeForce RTX 3080 Ti Laptop GPU | Razer Blade 15 2022 i7-12800H, GeForce RTX 3080 Ti Laptop GPU | Schenker XMG Neo 15 E22 (Early 2022, RTX 3080 Ti) i7-12700H, GeForce RTX 3080 Ti Laptop GPU | Asus ROG Strix Scar 15 G533QS R9 5900HX, GeForce RTX 3080 Laptop GPU | MSI Stealth GS66 12UGS i7-12700H, GeForce RTX 3070 Ti Laptop GPU | MSI Vector GP66 12UGS i9-12900H, GeForce RTX 3070 Ti Laptop GPU | |
|---|---|---|---|---|---|---|
| Noise | -5% | -2% | -8% | -12% | -2% | |
| off / environment * (dB) | 26 | 25.4 2% | 24 8% | 25.5 2% | 24 8% | 22.9 12% |
| Idle Minimum * (dB) | 26 | 26.2 -1% | 24 8% | 25.5 2% | 31 -19% | 23.4 10% |
| Idle Average * (dB) | 27 | 26.2 3% | 24 11% | 25.5 6% | 32 -19% | 23.4 13% |
| Idle Maximum * (dB) | 29 | 28.4 2% | 27.76 4% | 37.1 -28% | 35 -21% | 27.4 6% |
| Load Average * (dB) | 37 | 44.7 -21% | 38.81 -5% | 39.2 -6% | 48 -30% | 36 3% |
| Witcher 3 ultra * (dB) | 44 | 44.7 -2% | 54.2 -23% | 50.5 -15% | 43 2% | 58.2 -32% |
| Load Maximum * (dB) | 45 | 51.9 -15% | 54.18 -20% | 51.8 -15% | 48 -7% | 58 -29% |
* ... smaller is better
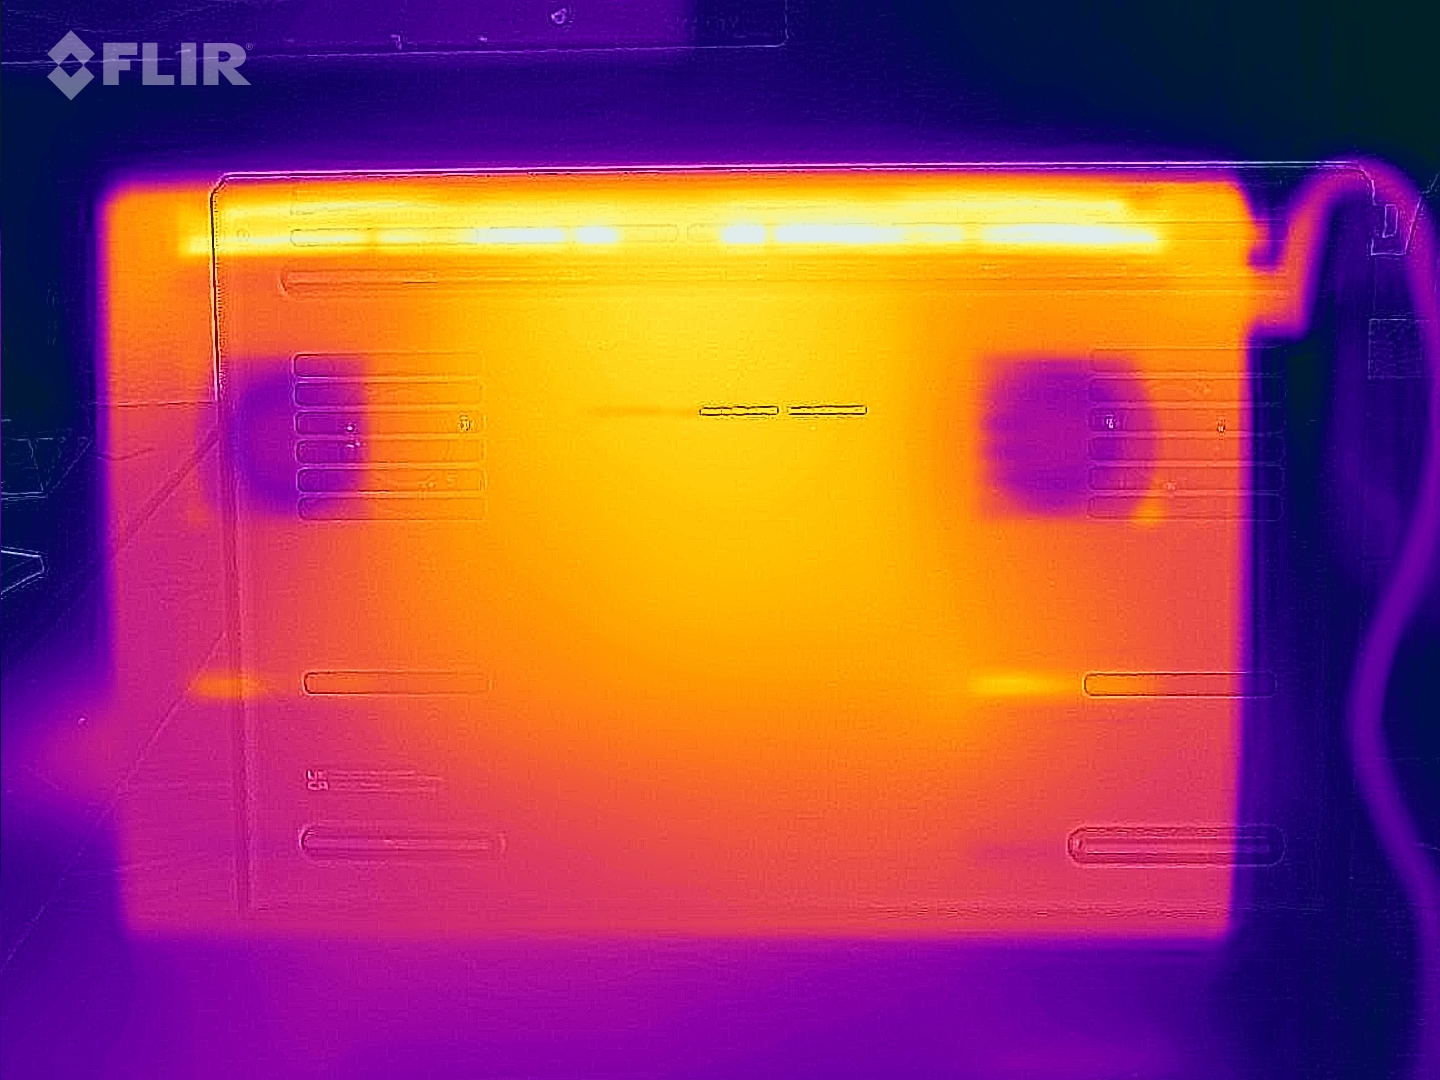
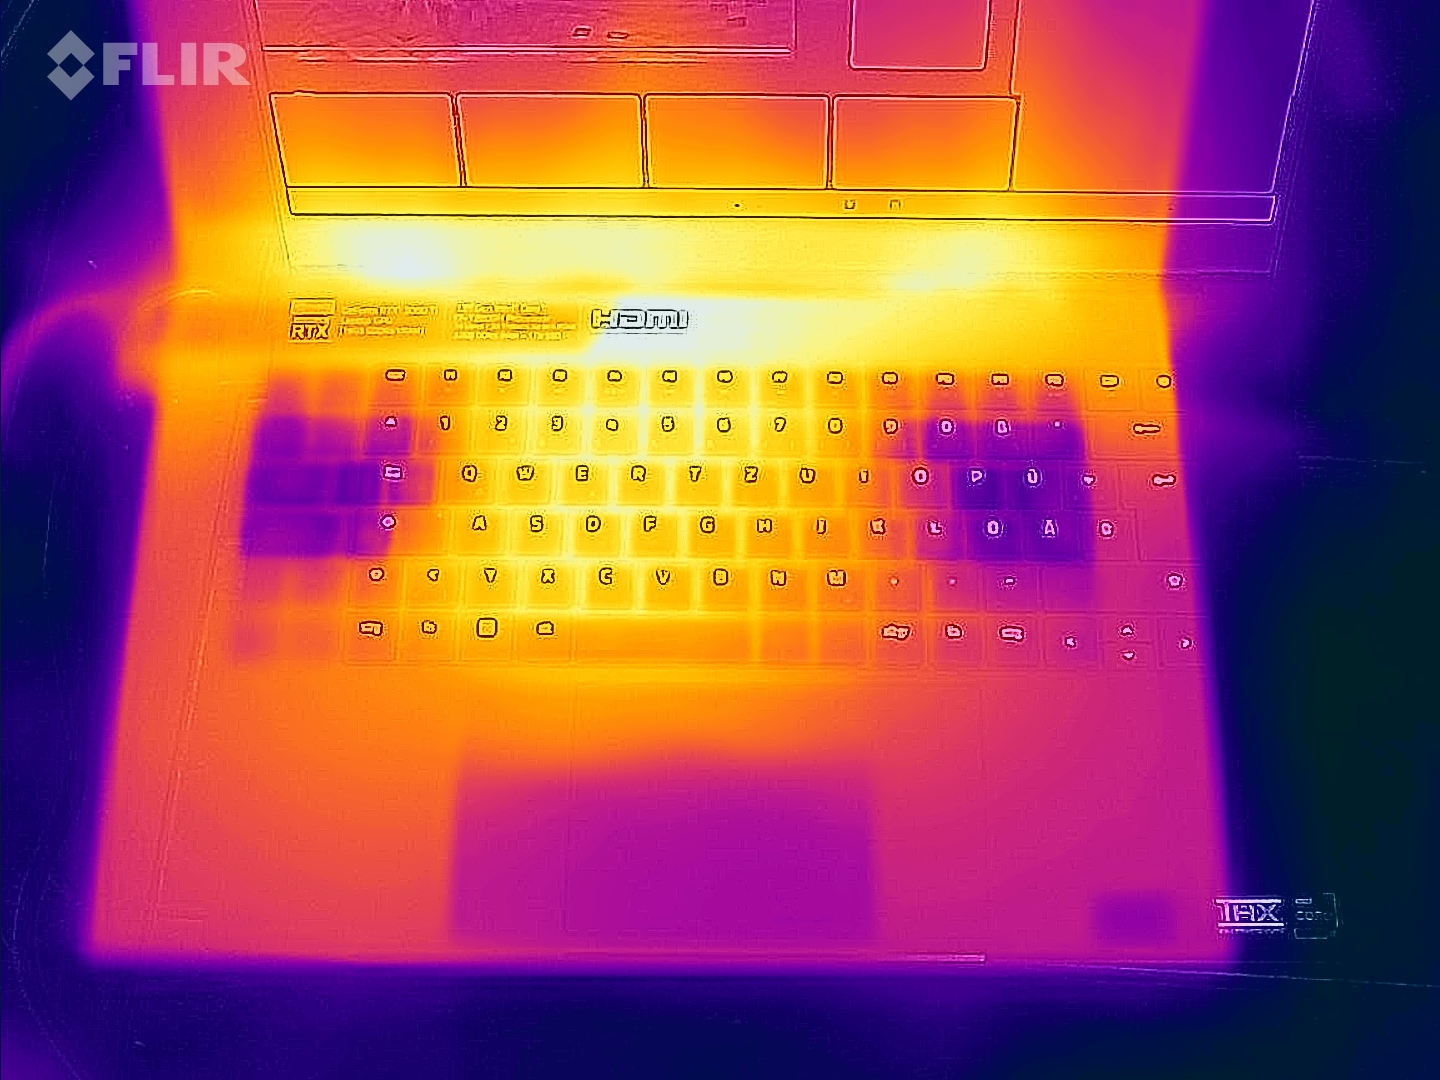
Temperature
Due to the metal construction and the powerful components, the case becomes relatively hot under moderate load. The laptop also heats up strongly via the control surfaces when playing The Witcher 3, for example.
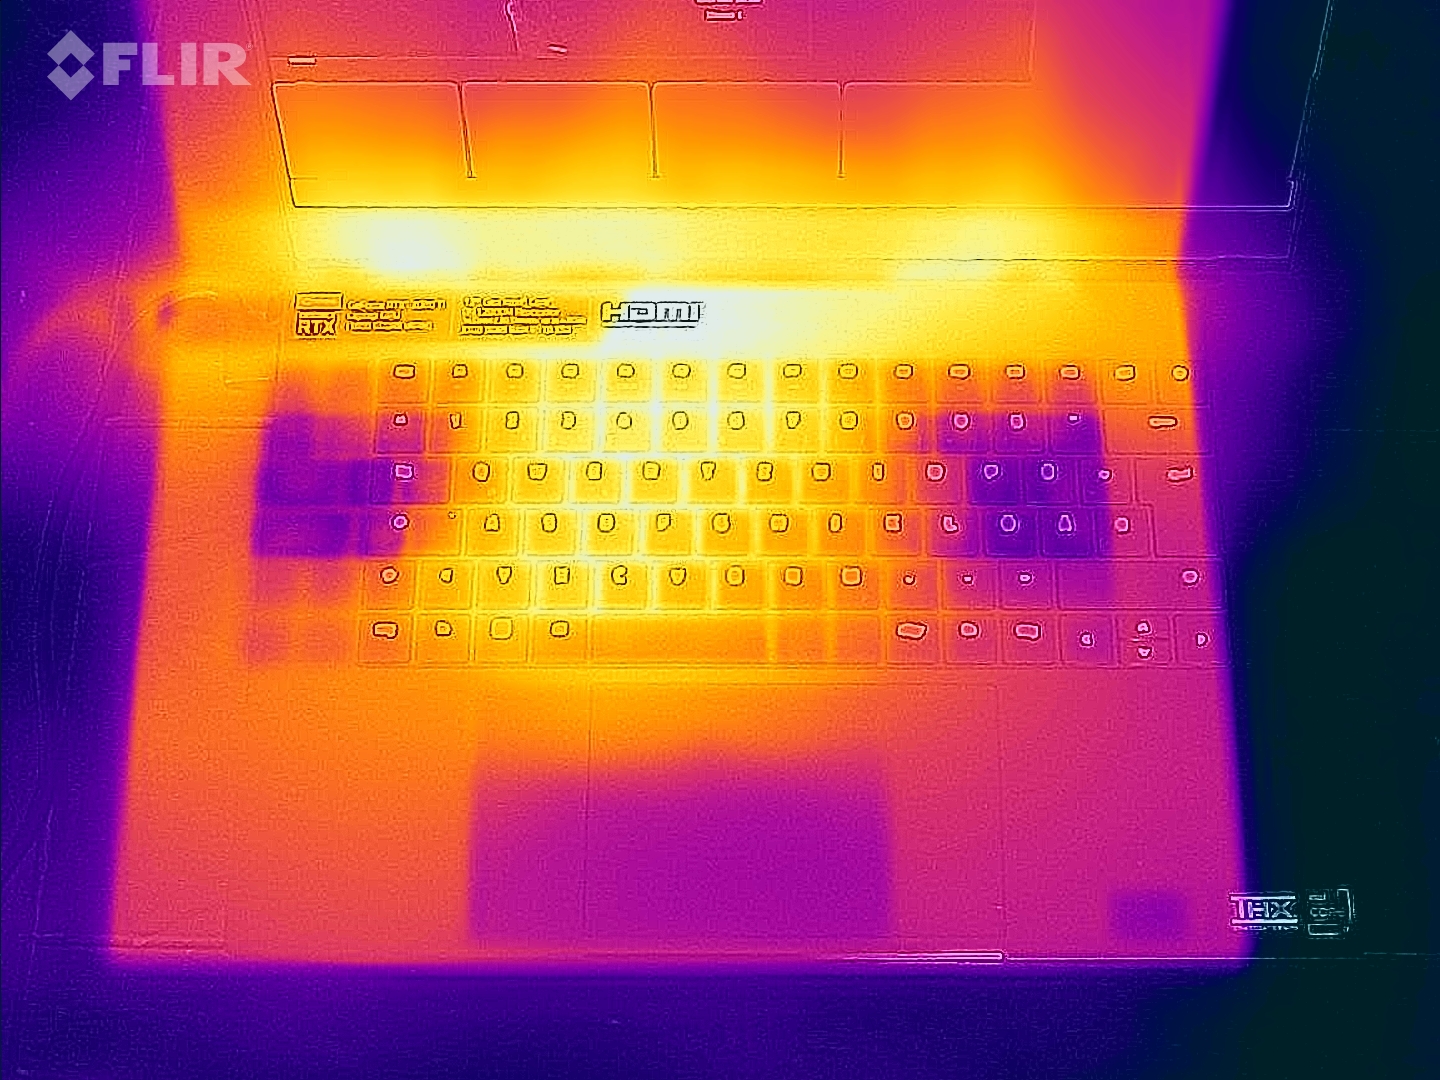
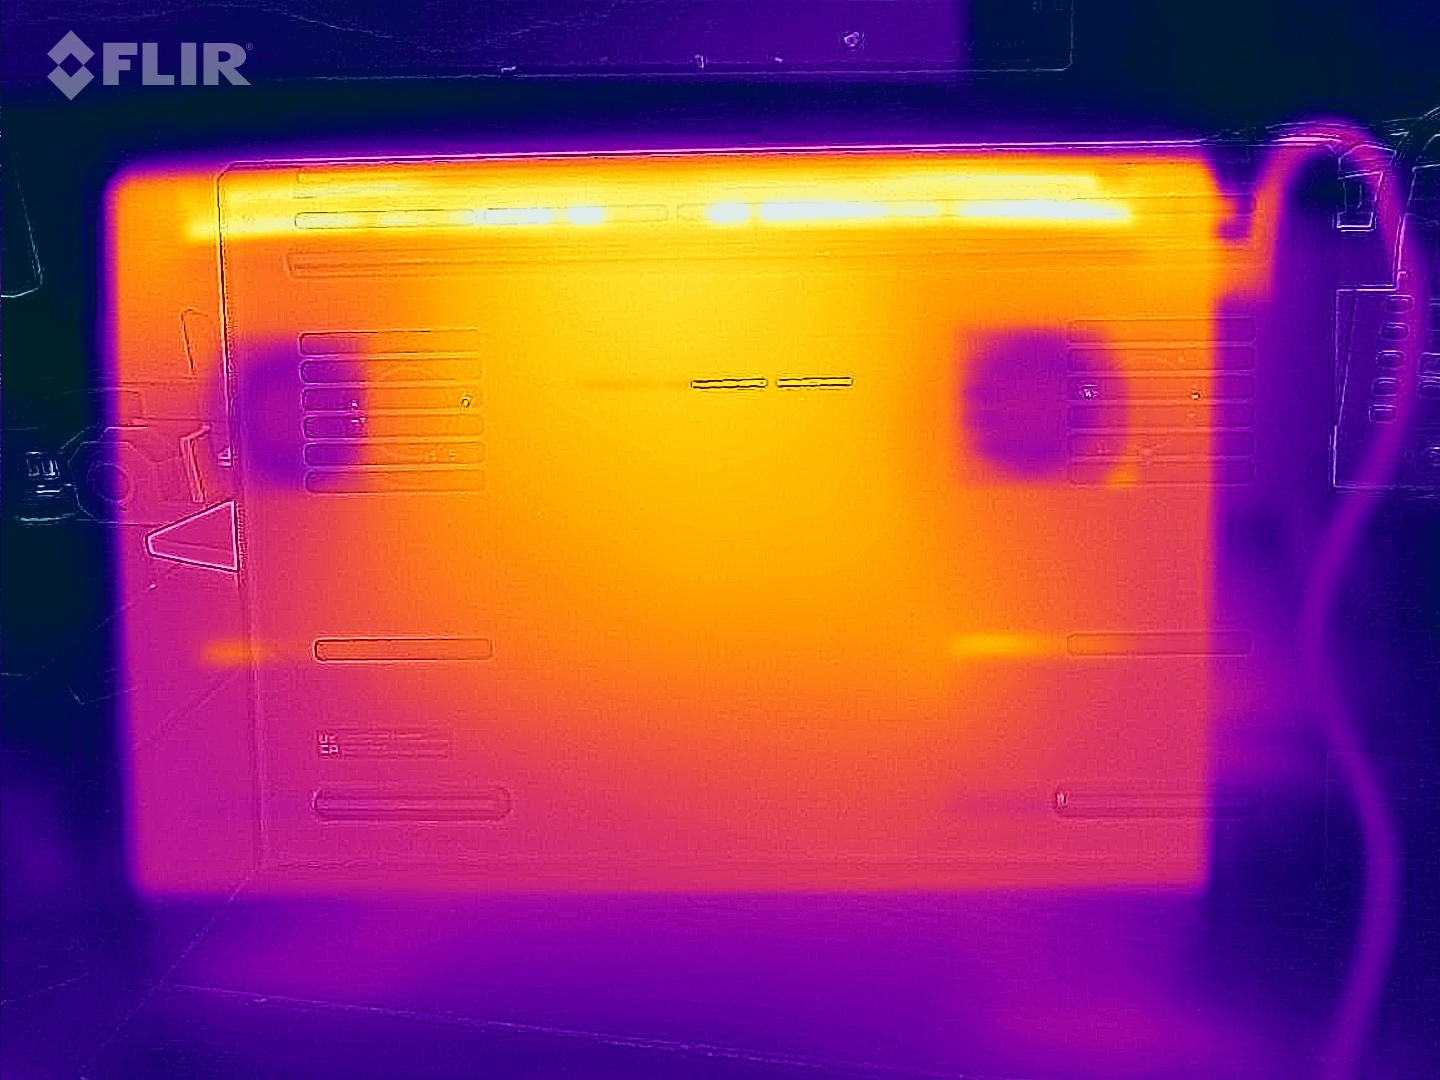
(-) The maximum temperature on the upper side is 53 °C / 127 F, compared to the average of 40.4 °C / 105 F, ranging from 21.2 to 68.8 °C for the class Gaming.
(-) The bottom heats up to a maximum of 53 °C / 127 F, compared to the average of 43.3 °C / 110 F
(±) In idle usage, the average temperature for the upper side is 33.2 °C / 92 F, compared to the device average of 33.9 °C / 93 F.
(-) Playing The Witcher 3, the average temperature for the upper side is 45.2 °C / 113 F, compared to the device average of 33.9 °C / 93 F.
(-) The palmrests and touchpad can get very hot to the touch with a maximum of 43 °C / 109.4 F.
(-) The average temperature of the palmrest area of similar devices was 28.8 °C / 83.8 F (-14.2 °C / -25.6 F).
| Razer Blade 15 Advanced Model Early 2022 Intel Core i7-12800H, NVIDIA GeForce RTX 3080 Ti Laptop GPU | Razer Blade 15 2022 Intel Core i7-12800H, NVIDIA GeForce RTX 3080 Ti Laptop GPU | Schenker XMG Neo 15 E22 (Early 2022, RTX 3080 Ti) Intel Core i7-12700H, NVIDIA GeForce RTX 3080 Ti Laptop GPU | Asus ROG Strix Scar 15 G533QS AMD Ryzen 9 5900HX, NVIDIA GeForce RTX 3080 Laptop GPU | MSI Stealth GS66 12UGS Intel Core i7-12700H, NVIDIA GeForce RTX 3070 Ti Laptop GPU | MSI Vector GP66 12UGS Intel Core i9-12900H, NVIDIA GeForce RTX 3070 Ti Laptop GPU | |
|---|---|---|---|---|---|---|
| Heat | 3% | -3% | 8% | 11% | 12% | |
| Maximum Upper Side * (°C) | 53 | 50 6% | 52 2% | 43.4 18% | 54 -2% | 40.2 24% |
| Maximum Bottom * (°C) | 53 | 47 11% | 68 -28% | 48.2 9% | 59 -11% | 43.8 17% |
| Idle Upper Side * (°C) | 36 | 37.4 -4% | 32 11% | 35.2 2% | 26 28% | 34.8 3% |
| Idle Bottom * (°C) | 38 | 38.4 -1% | 36 5% | 37 3% | 27 29% | 37 3% |
* ... smaller is better
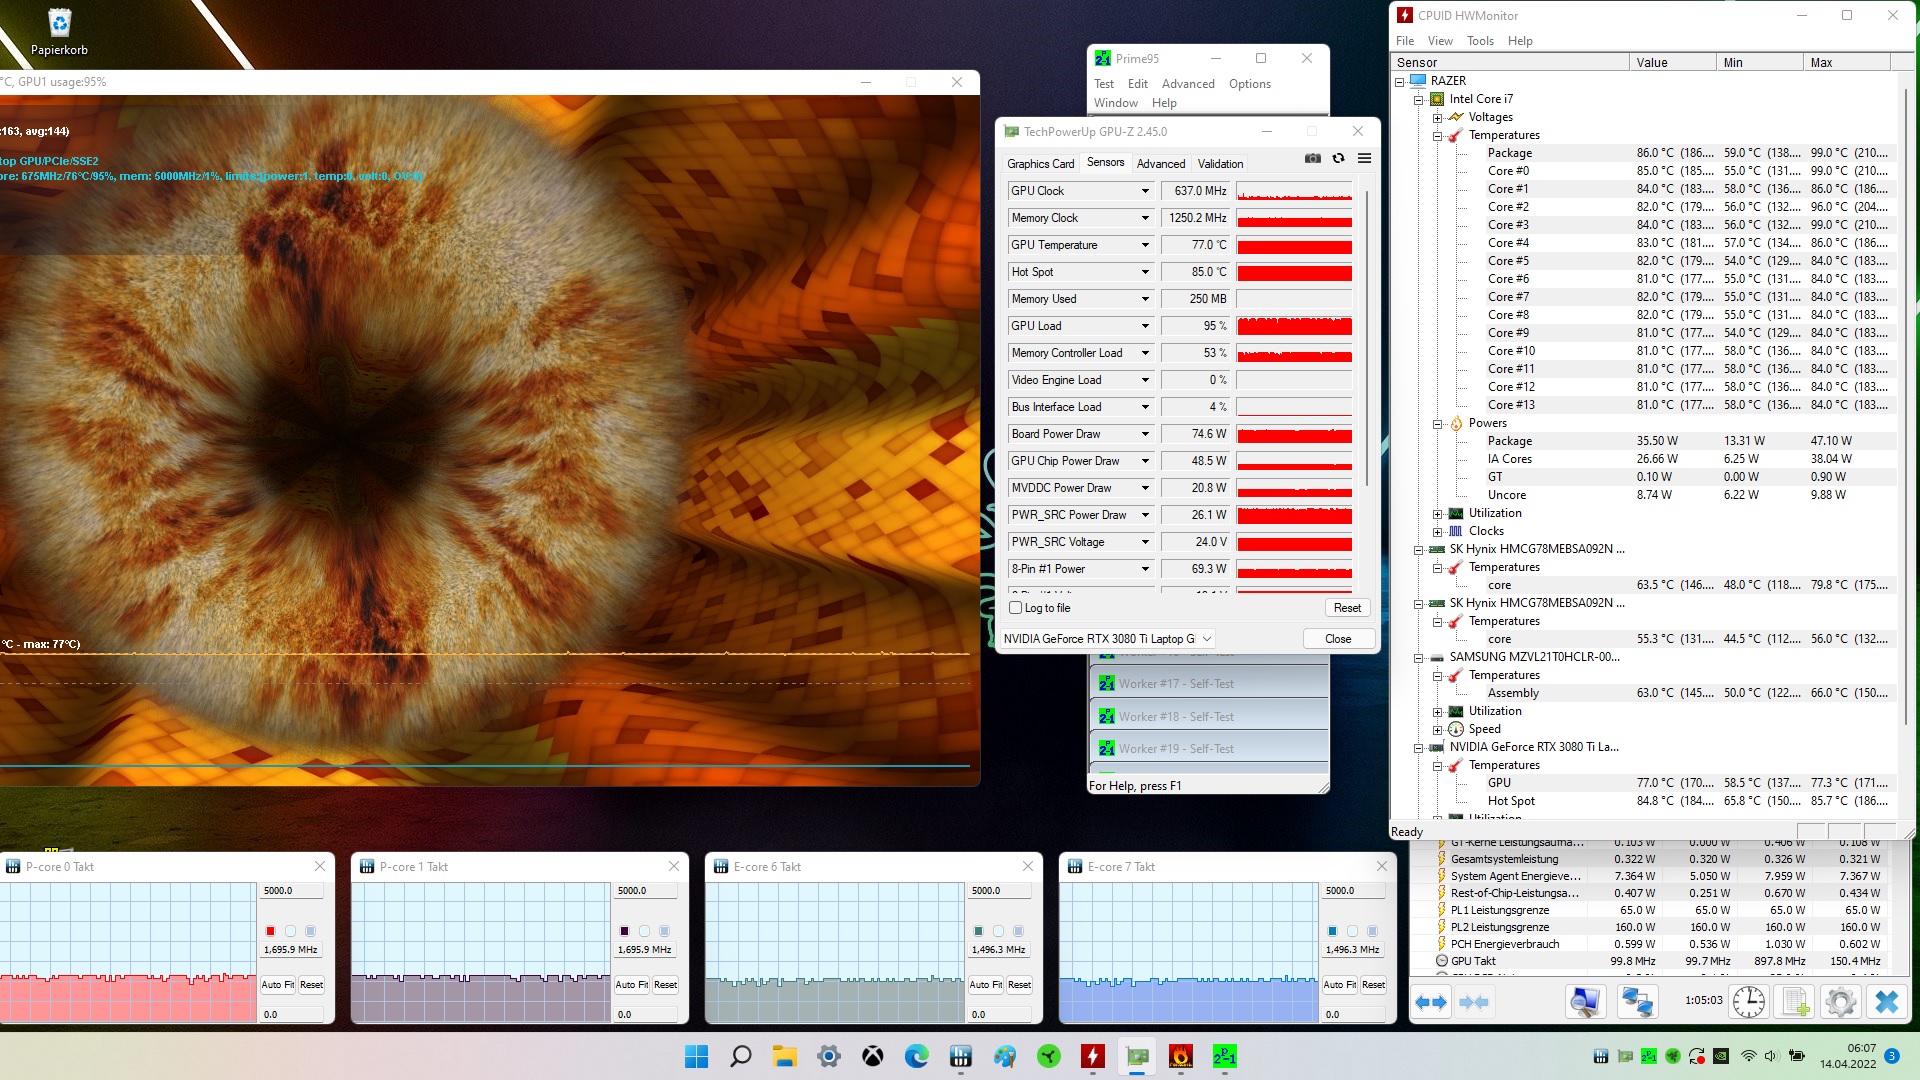
Stress Test
In our stress test, we loaded the system simultaneously with Prime95 and FurMark. The CPU began the test with P- and E-core clock speeds of about 2 and 1.9 GHz, respectively, and stabilized at 1.7 and 1.5 GHz, respectively, and at around 85°C over longer periods of time. The GPU started at around 1,100 MHz and eventually leveled out at 640 MHz and at a core temperature of 77°C.
Speakers
The speakers are unevenly tuned. The pink noise diagram shows the significantly flatter frequency drop of the MacBook Pro 16, which is one of the best laptops in this discipline. External audio devices can be connected via Bluetooth, USB or the 3.5mm port.
Razer Blade 15 Advanced Model Early 2022 audio analysis
(+) | speakers can play relatively loud (92 dB)
Bass 100 - 315 Hz
(-) | nearly no bass - on average 21.8% lower than median
(±) | linearity of bass is average (9.2% delta to prev. frequency)
Mids 400 - 2000 Hz
(+) | balanced mids - only 4.1% away from median
(+) | mids are linear (3.4% delta to prev. frequency)
Highs 2 - 16 kHz
(+) | balanced highs - only 3.3% away from median
(+) | highs are linear (6.8% delta to prev. frequency)
Overall 100 - 16.000 Hz
(±) | linearity of overall sound is average (15% difference to median)
Compared to same class
» 31% of all tested devices in this class were better, 6% similar, 63% worse
» The best had a delta of 6%, average was 18%, worst was 132%
Compared to all devices tested
» 20% of all tested devices were better, 4% similar, 76% worse
» The best had a delta of 4%, average was 24%, worst was 134%
Apple MacBook Pro 16 2021 M1 Pro audio analysis
(+) | speakers can play relatively loud (84.7 dB)
Bass 100 - 315 Hz
(+) | good bass - only 3.8% away from median
(+) | bass is linear (5.2% delta to prev. frequency)
Mids 400 - 2000 Hz
(+) | balanced mids - only 1.3% away from median
(+) | mids are linear (2.1% delta to prev. frequency)
Highs 2 - 16 kHz
(+) | balanced highs - only 1.9% away from median
(+) | highs are linear (2.7% delta to prev. frequency)
Overall 100 - 16.000 Hz
(+) | overall sound is linear (4.6% difference to median)
Compared to same class
» 0% of all tested devices in this class were better, 0% similar, 100% worse
» The best had a delta of 5%, average was 17%, worst was 45%
Compared to all devices tested
» 0% of all tested devices were better, 0% similar, 100% worse
» The best had a delta of 4%, average was 24%, worst was 134%
Energy Management - No runtime records
Power Consumption
The idle consumption values of 19 W on average are significantly lower than those of the previously reviewed Razer Blade 15 (36.4 W). This is likely due to the more economical performance profile and the lower display resolution. In The Witcher 3, overall consumption is about 13% lower.
Maximum consumption of the 230 W power supply during the simultaneous execution of Prime95 and FurMark was 179 W. The 230 W power supply is sufficiently sized.
| Off / Standby | |
| Idle | |
| Load |
|
Key:
min: | |
| Razer Blade 15 Advanced Model Early 2022 i7-12800H, GeForce RTX 3080 Ti Laptop GPU | Razer Blade 15 2022 i7-12800H, GeForce RTX 3080 Ti Laptop GPU | Schenker XMG Neo 15 E22 (Early 2022, RTX 3080 Ti) i7-12700H, GeForce RTX 3080 Ti Laptop GPU | Asus ROG Strix Scar 15 G533QS R9 5900HX, GeForce RTX 3080 Laptop GPU | MSI Stealth GS66 12UGS i7-12700H, GeForce RTX 3070 Ti Laptop GPU | MSI Vector GP66 12UGS i9-12900H, GeForce RTX 3070 Ti Laptop GPU | Average of class Gaming | |
|---|---|---|---|---|---|---|---|
| Power Consumption | -48% | -14% | -2% | 5% | -34% | -5% | |
| Idle Minimum * (Watt) | 17 | 33.2 -95% | 14 18% | 11.2 34% | 11 35% | 17.5 -3% | 13.6 ? 20% |
| Idle Average * (Watt) | 19 | 36.4 -92% | 18 5% | 16.4 14% | 16 16% | 20.1 -6% | 19.4 ? -2% |
| Idle Maximum * (Watt) | 25 | 37.6 -50% | 19 24% | 29.4 -18% | 23 8% | 47.3 -89% | 24.8 ? 1% |
| Load Average * (Watt) | 108 | 116.7 -8% | 115 -6% | 106.2 2% | 110 -2% | 107.3 1% | 109 ? -1% |
| Witcher 3 ultra * (Watt) | 150 | 172 -15% | 228 -52% | 189 -26% | 151 -1% | 225 -50% | |
| Load Maximum * (Watt) | 179 | 228.6 -28% | 307 -72% | 213.6 -19% | 230 -28% | 277.7 -55% | 254 ? -42% |
* ... smaller is better
Power Consumption Witcher 3 / Stress test
{
Battery Life
In our real-world WLAN test, the Blade 15 achieves a runtime of 4:53 h. Hardly any competitor can keep up with the 7:20 h of the Asus ROG Strix Scar 15, while the MSI Vector GP66 also offers a longer runtime despite a smaller battery (65 Wh vs. 80 Wh).
| Razer Blade 15 Advanced Model Early 2022 i7-12800H, GeForce RTX 3080 Ti Laptop GPU, 80 Wh | Razer Blade 15 2022 i7-12800H, GeForce RTX 3080 Ti Laptop GPU, 80 Wh | Schenker XMG Neo 15 E22 (Early 2022, RTX 3080 Ti) i7-12700H, GeForce RTX 3080 Ti Laptop GPU, 93 Wh | Asus ROG Strix Scar 15 G533QS R9 5900HX, GeForce RTX 3080 Laptop GPU, 90 Wh | MSI Stealth GS66 12UGS i7-12700H, GeForce RTX 3070 Ti Laptop GPU, 99.9 Wh | MSI Vector GP66 12UGS i9-12900H, GeForce RTX 3070 Ti Laptop GPU, 65 Wh | Average of class Gaming | |
|---|---|---|---|---|---|---|---|
| Battery runtime | 0% | 48% | 19% | -5% | -12% | 15% | |
| Reader / Idle (h) | 8.1 | 11.1 37% | 7.8 -4% | 7.9 -2% | 8.99 ? 11% | ||
| H.264 (h) | 5.9 | 6.9 17% | 7.93 ? 34% | ||||
| WiFi v1.3 (h) | 4.9 | 4.9 0% | 6.7 37% | 7.3 49% | 5.4 10% | 5.7 16% | 6.76 ? 38% |
| Load (h) | 2 | 3.8 90% | 1.4 -30% | 1.6 -20% | 1 -50% | 1.502 ? -25% |
Pros
Cons
Verdict
The Blade 15 is a very compact and well-made laptop. The connectivity is just as modern as the new chips from Intel and Nvidia and is well rounded off by a fast SD card reader. The display offers incredibly smooth visual representation and a decent maximum brightness, but unlike the QHD model, Advanced Optimus is lacking and the color space coverage could be a little better. Considering the target group, however, the latter is acceptable.
The benchmarks in "Balanced" mode give an interesting picture. In practice, performance is often more than sufficient and the noise level is significantly lower. However, the surfaces of the case still heat up very strongly.
If you're looking for a stylish, compact gaming laptop with an exceptionally fast display, look no further. However, temperature-sensitive users should be wary here.
Another point of criticism is the speakers: Many cheaper laptops offer better sound. Asus' ROG Strix Scar 15 is a less compact, AMD-based alternative to the Razer Blade 15 with much longer battery runtimes. For users who are often on the go and need a lot of performance, the Razer Blade 15 may still be the right choice.
Price and Availability
Our configuration of the Razer Blade 15 is currently available at B&H Photo Video for US$ 3,699.99 or via the official Razer website for the same price.
Razer Blade 15 Advanced Model Early 2022
- 05/04/2022 v7 (old)
Marius Schell
Price comparison

