 Deutsch
 English
 Español
 Français
 Italiano
 Nederlands
 Polski
 Português
 Русский
 Türkçe
 Svenska
 Chinese
 Magyar
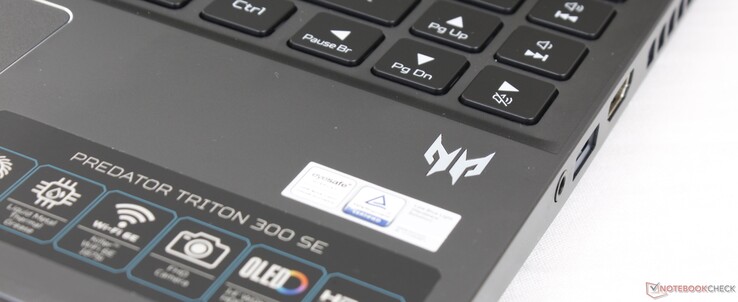
Acer Predator Triton 300 SE PT314 review: Liquid metal cooling for a 14-inch laptop
It's been two years since we last reviewed the Predator Triton 300. This latest model, called the Predator Triton 300 SE, utilizes newer 12th gen Core H-series CPUs and Nvidia Ampere RTX GPUs alongside a smaller 14-inch chassis design. It thus competes with some of the smallest gaming laptops in the market including the Razer Blade 14, Asus Zephyrus G14, and the Alienware x14.
Our review unit is a higher-end SKU with the Core i9-12900H CPU and 90 Hz 1800p OLED display for approximately $1950 USD. Another configuration is available with the Core i7-12700H CPU, 165 Hz 1200p IPS display, and half the RAM and storage for hundreds of dollars less. All options at the moment otherwise come with the same 95 W GeForce RTX 3060 GPU.
A larger 16-inch version is available which shares the same Predator Triton 300 SE name but with a different model number (PT316 vs. PT314).
More Acer reviews:
Potential Competitors in Comparison
Rating | Date | Model | Weight | Height | Size | Resolution | Best Price |
|---|---|---|---|---|---|---|---|
| 86 % | 11/2022 | Acer Predator Triton 300 SE i9-12900H, GeForce RTX 3060 Laptop GPU | 1.7 kg | 19.8 mm | 14.00" | 2880x1800 | |
| 86.4 % | 10/2022 | Asus ROG Zephyrus G14 GA402RJ R7 6800HS, Radeon RX 6700S | 1.7 kg | 19.5 mm | 14.00" | 2560x1600 | |
| 89.4 % | 05/2022 | Razer Blade 14 Ryzen 9 6900HX R9 6900HX, GeForce RTX 3070 Ti Laptop GPU | 1.8 kg | 16.8 mm | 14.00" | 2560x1440 | |
| 86.7 % | 03/2022 | Alienware x14 i7 RTX 3060 i7-12700H, GeForce RTX 3060 Laptop GPU | 1.8 kg | 14.5 mm | 14.00" | 1920x1080 | |
| 87.2 % | 08/2022 | Dell Inspiron 14 Plus 7420 i7-12700H, GeForce RTX 3050 4GB Laptop GPU | 1.7 kg | 18.87 mm | 14.00" | 2240x1400 | |
| 87.7 % | 01/2022 | SCHENKER Vision 14 i7-11370H, GeForce RTX 3050 Ti Laptop GPU | 1.1 kg | 15.6 mm | 14.00" | 2880x1800 |
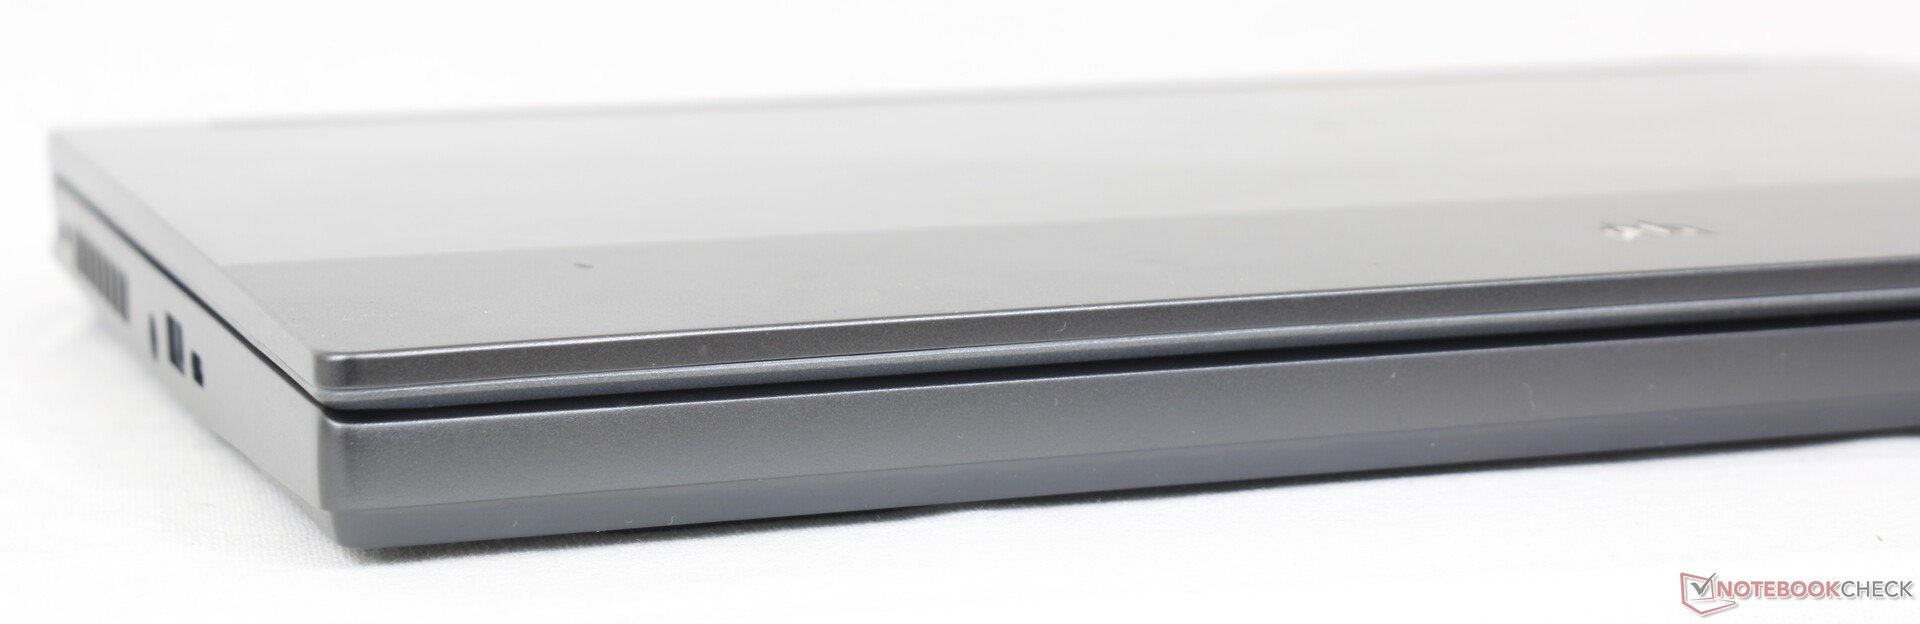
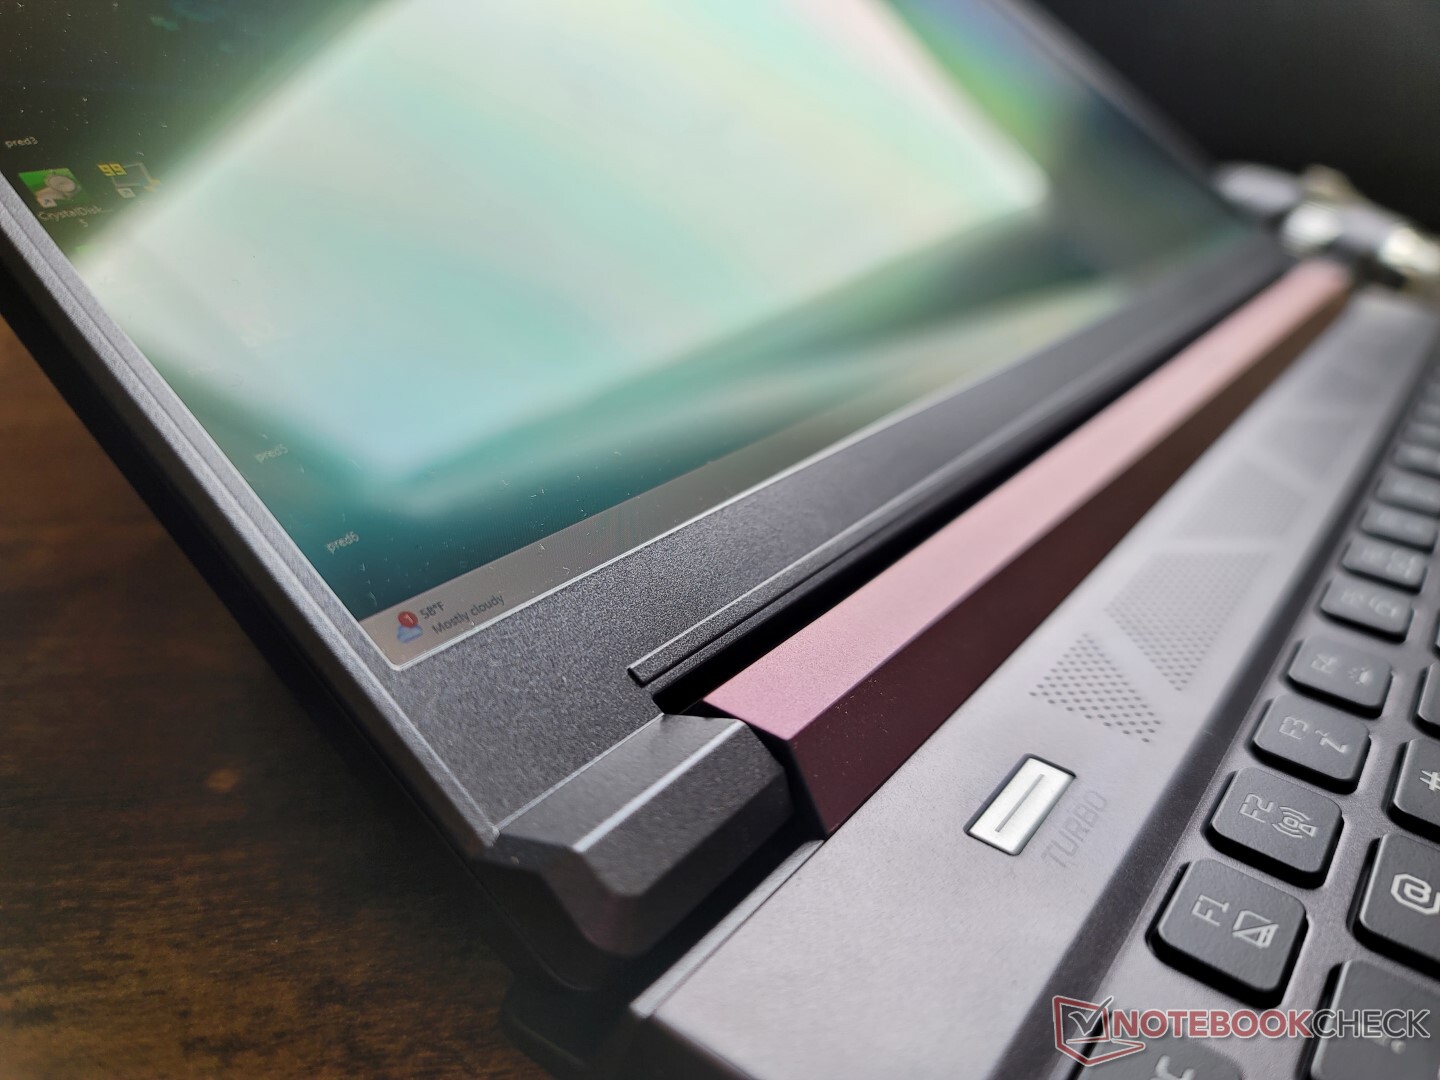
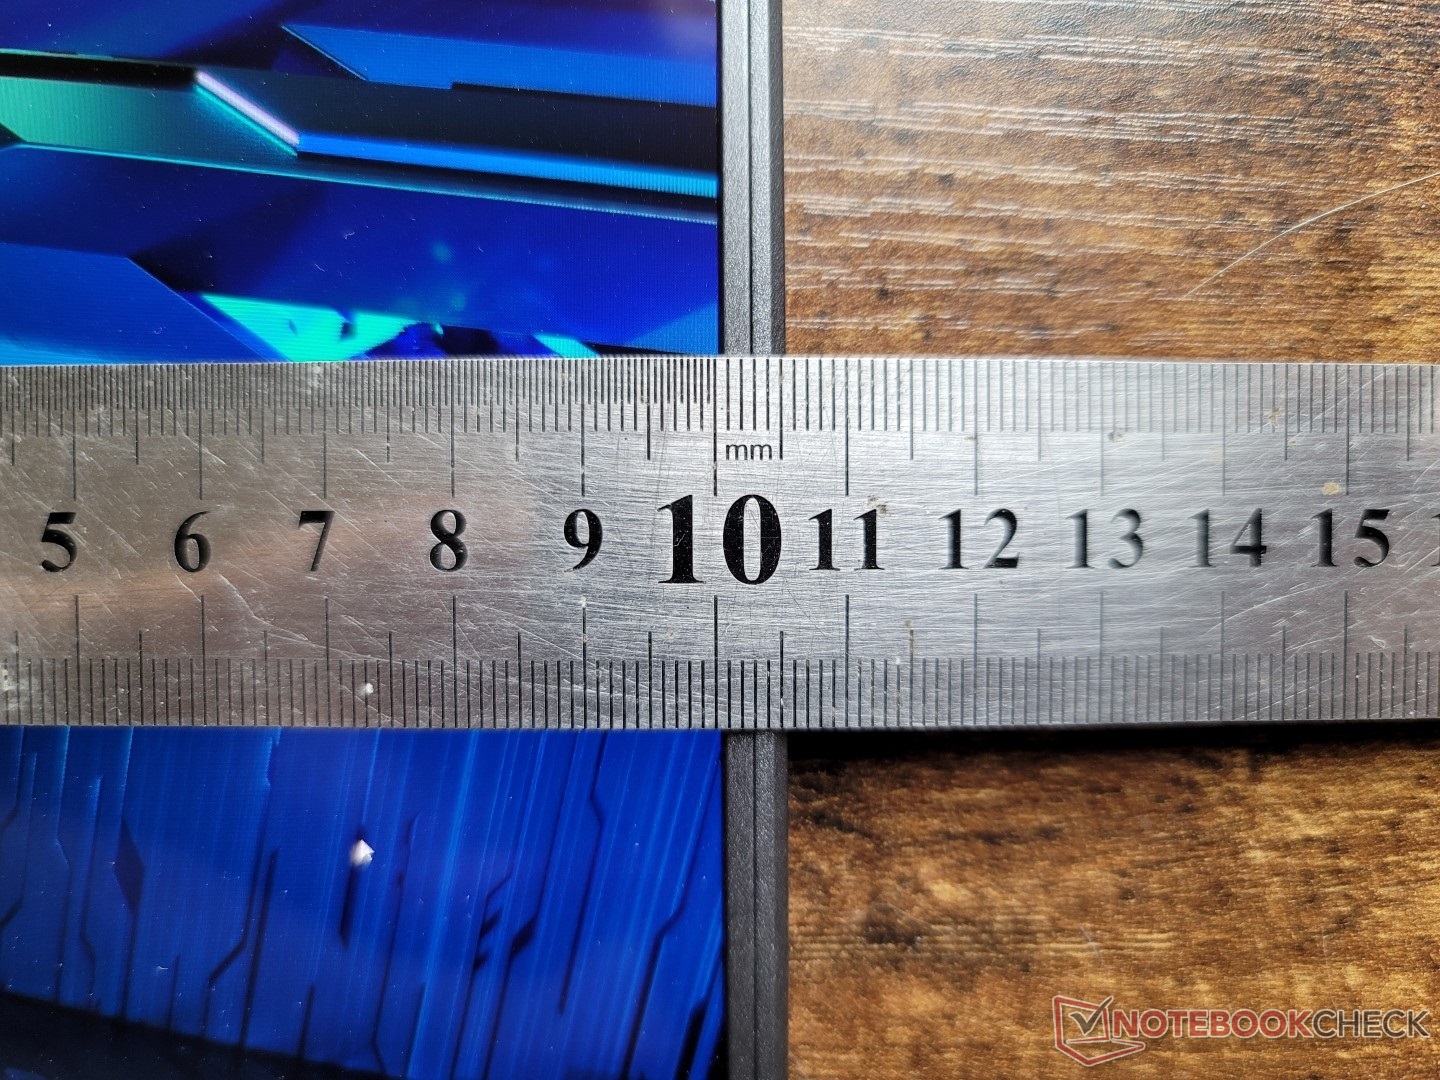
Case — Similar In Size To Zephyrus G14
The metal base is strong with only minimal signs of twisting or warping and no creaking when applying pressure along the keyboard center or corners. It's not as rigid as on the Razer Blade 14, but it certainly doesn't feel cheap, either.
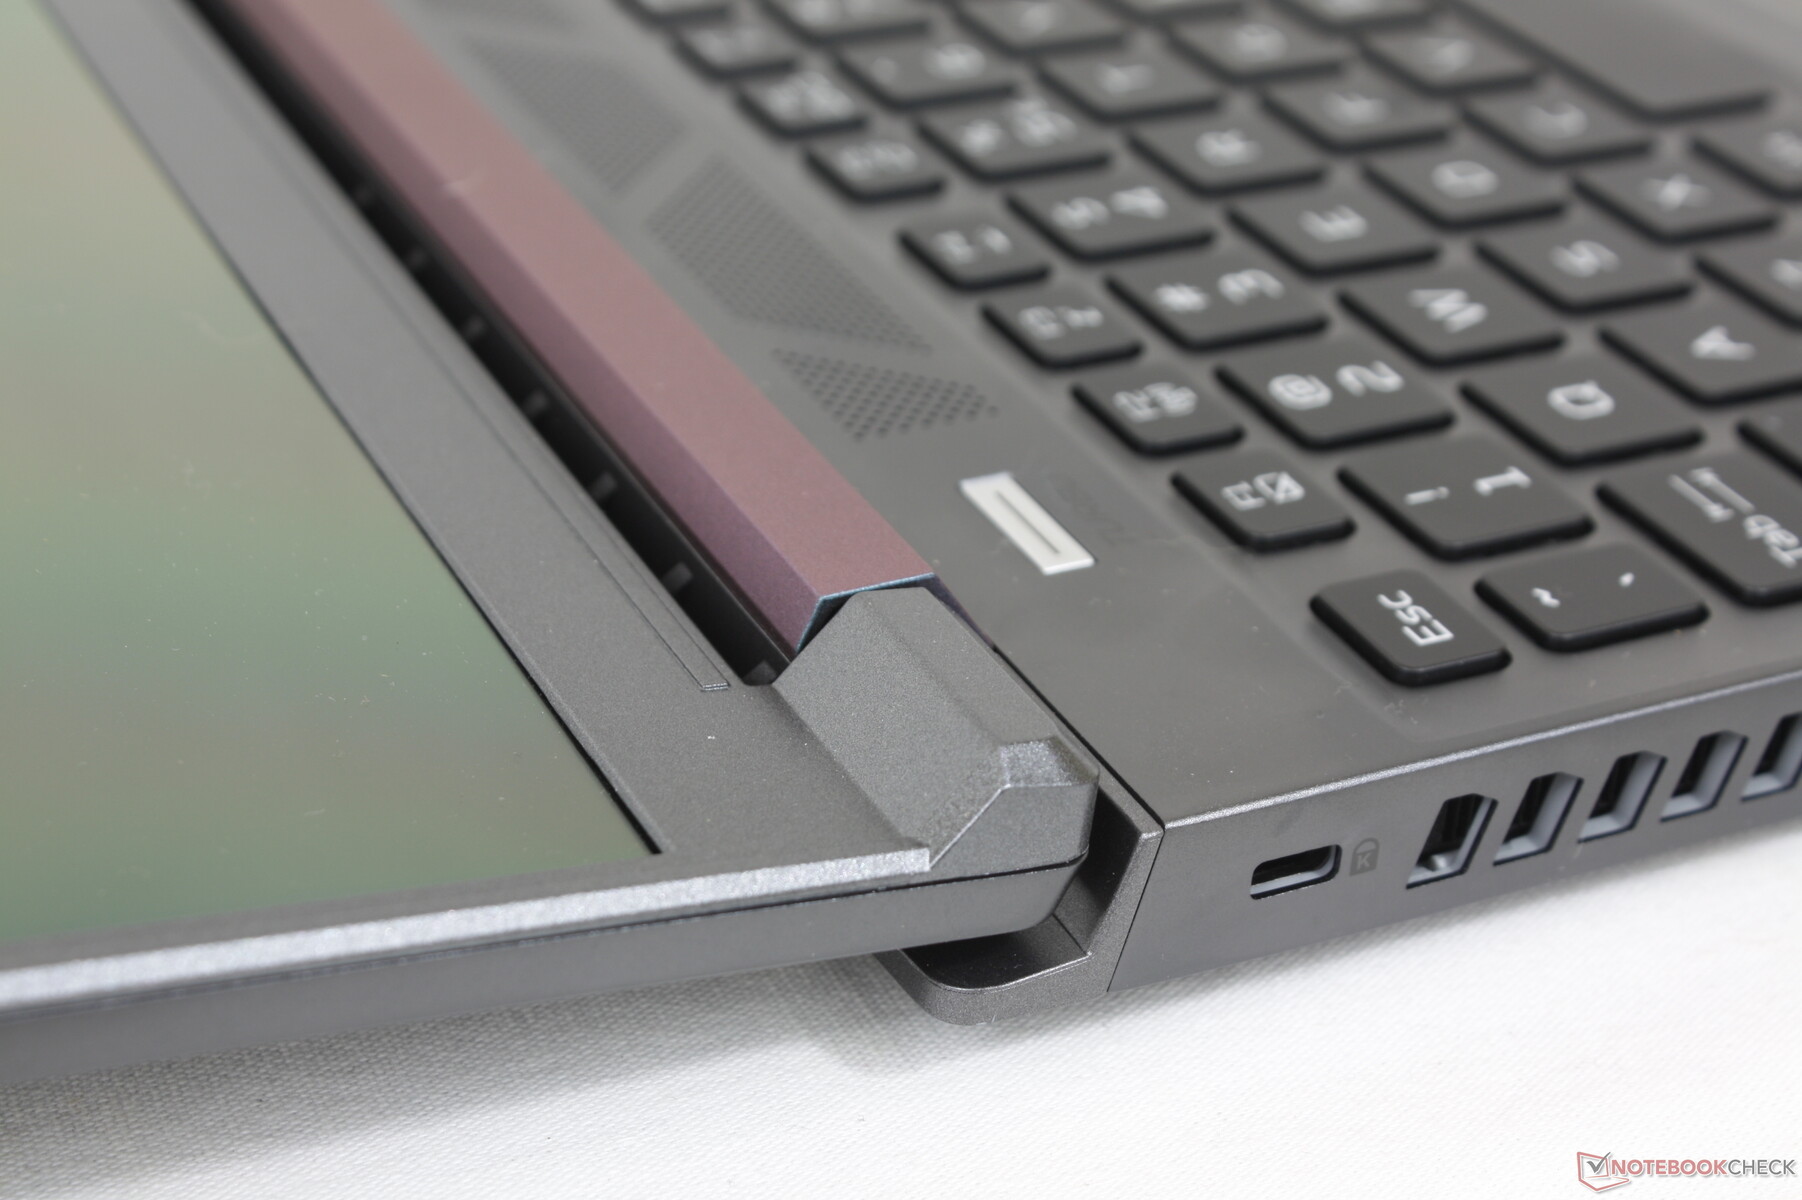
The weakest area of the chassis is its display. Though this is common on most laptops, the display on the Acer is particularly thin and noticeably more susceptible to warping than the displays on the Zephyrus G14 or Blade 14. We appreciate that the display can open almost the full 180 degrees unlike on the aforementioned Asus or Razer models, but the hinges on the Acer feel weaker and have a tendency to teeter more in comparison.
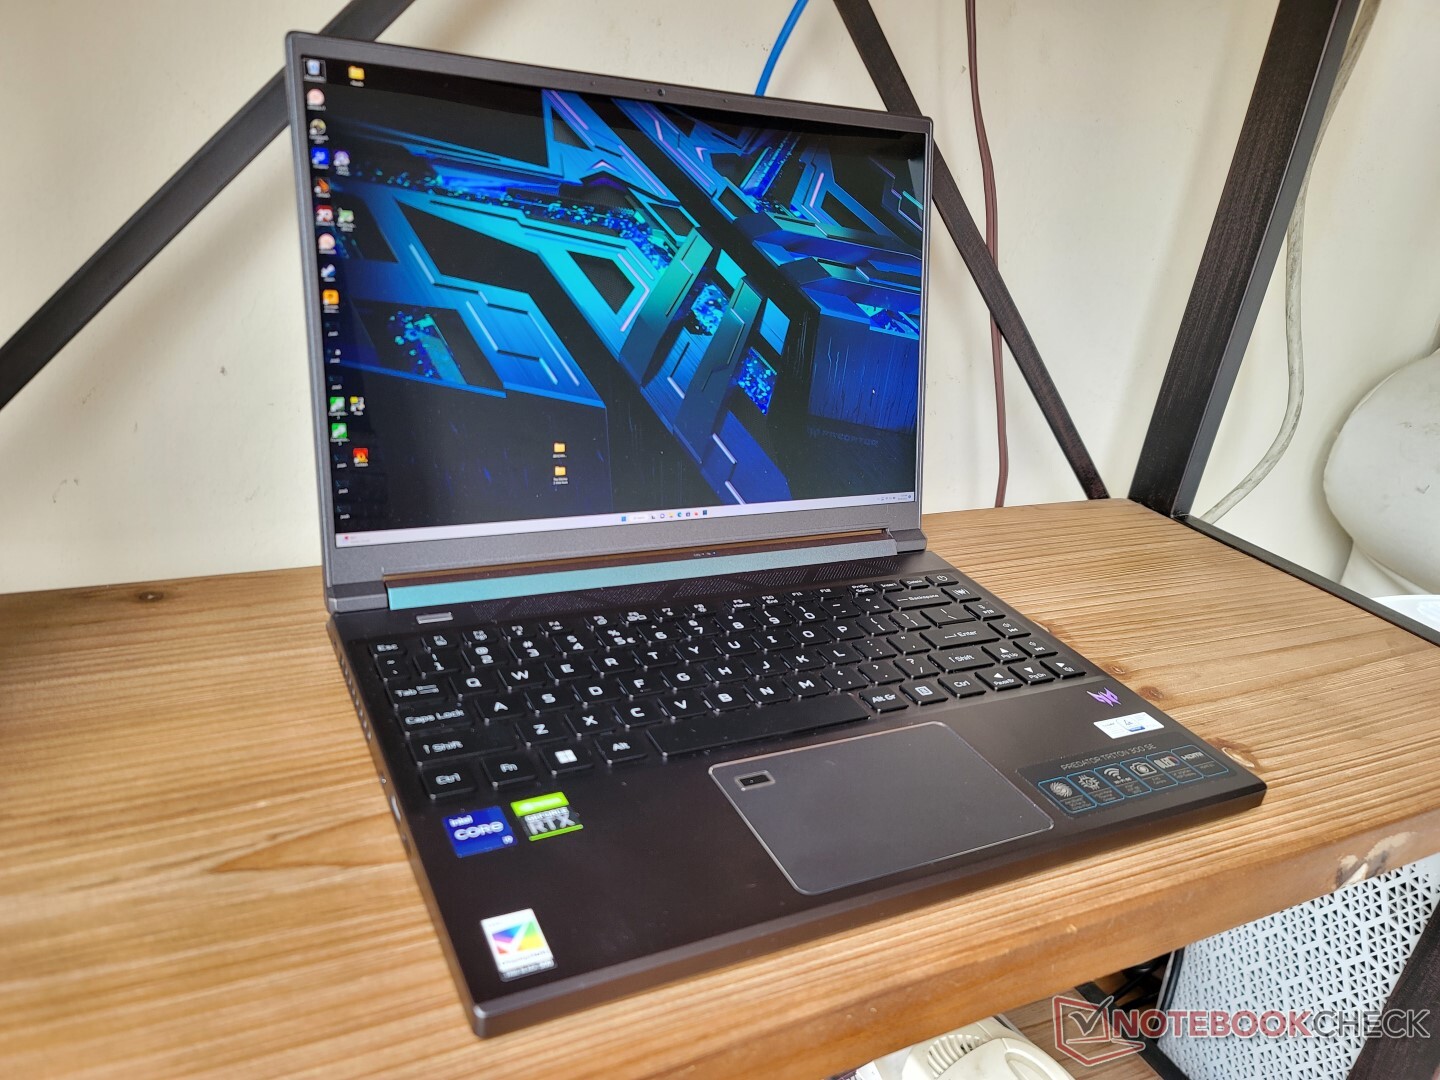
Coincidentally, both weight and dimensions are nearly identical to the Asus Zephyrus G14. The Blade 14 and Alienware x14 are each noticeably thinner, but they have larger footprints to compensate. Most regular 14-inch Ultrabooks like the Schenker Vision 14 can be significantly lighter by over half a kilogram but without the performance benefits.
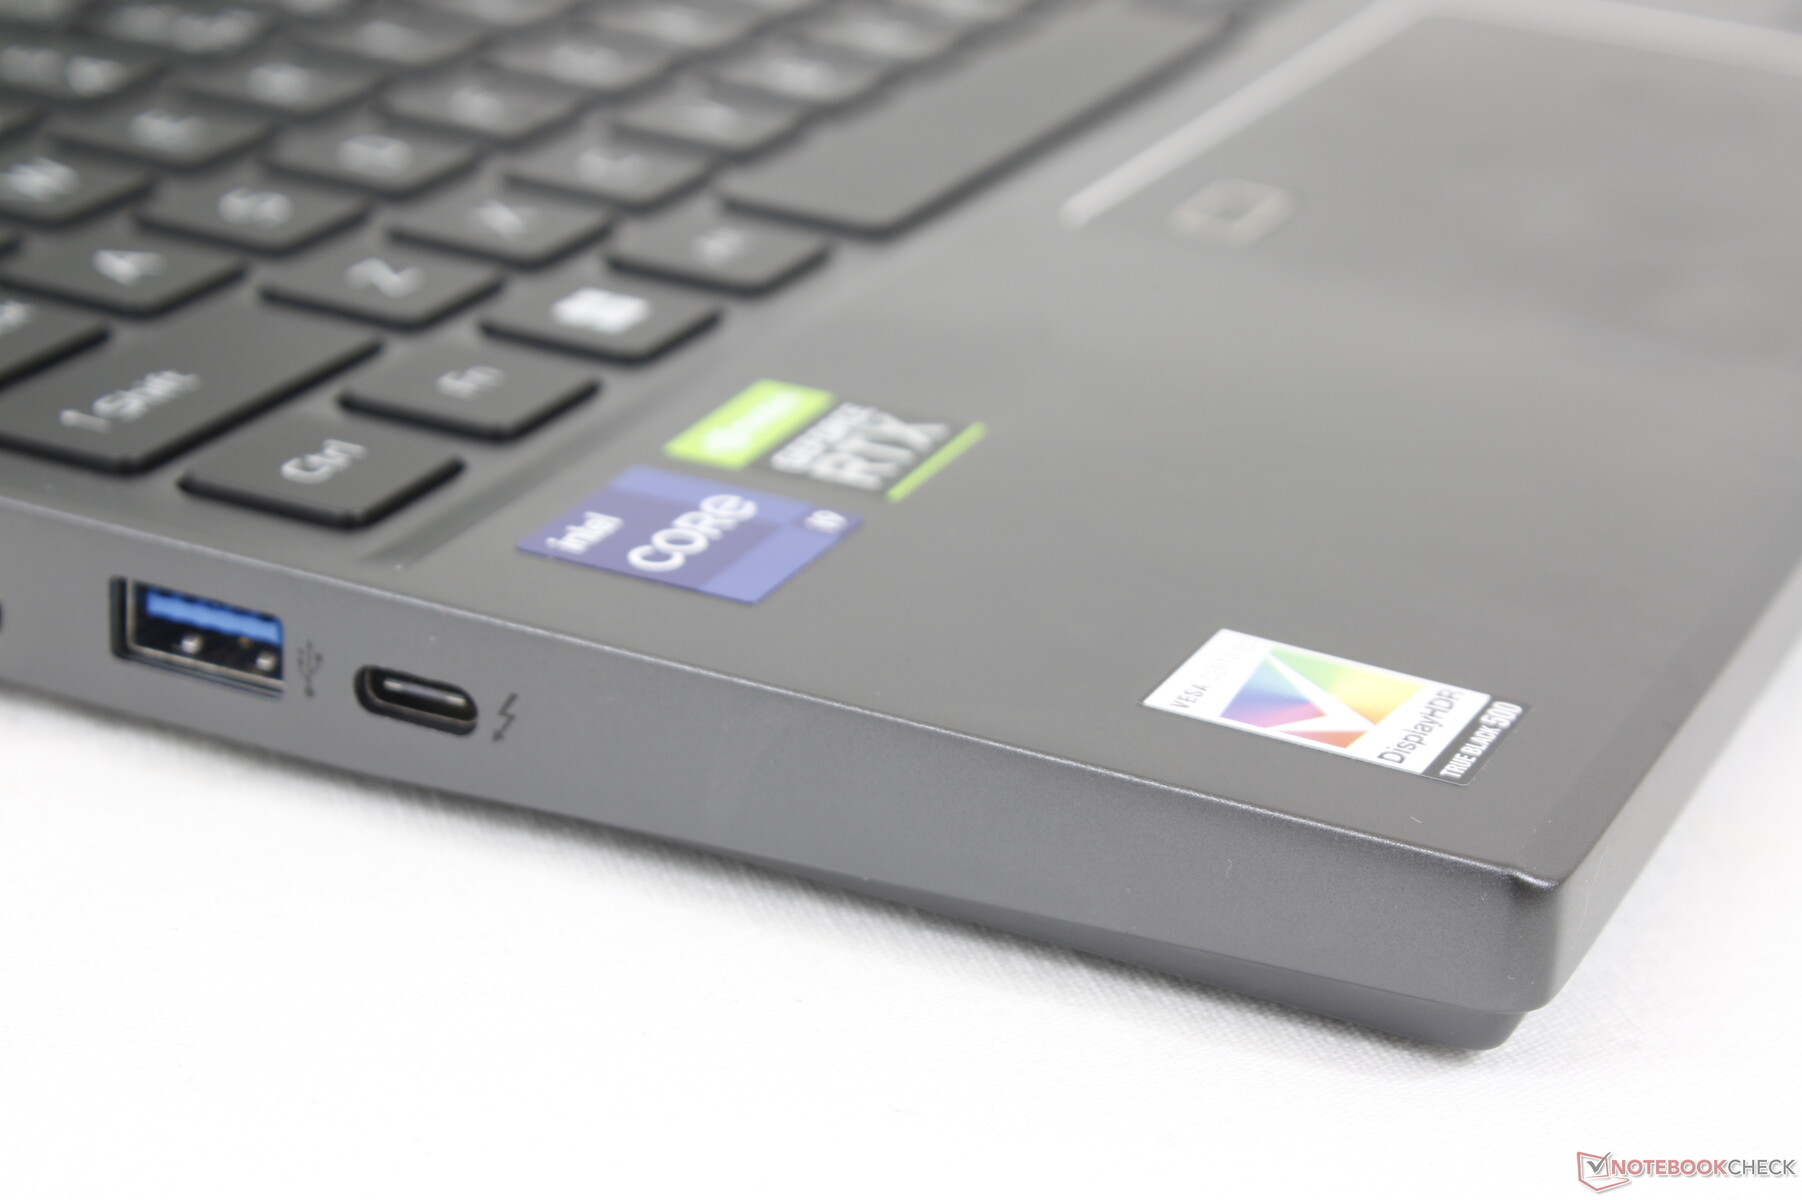
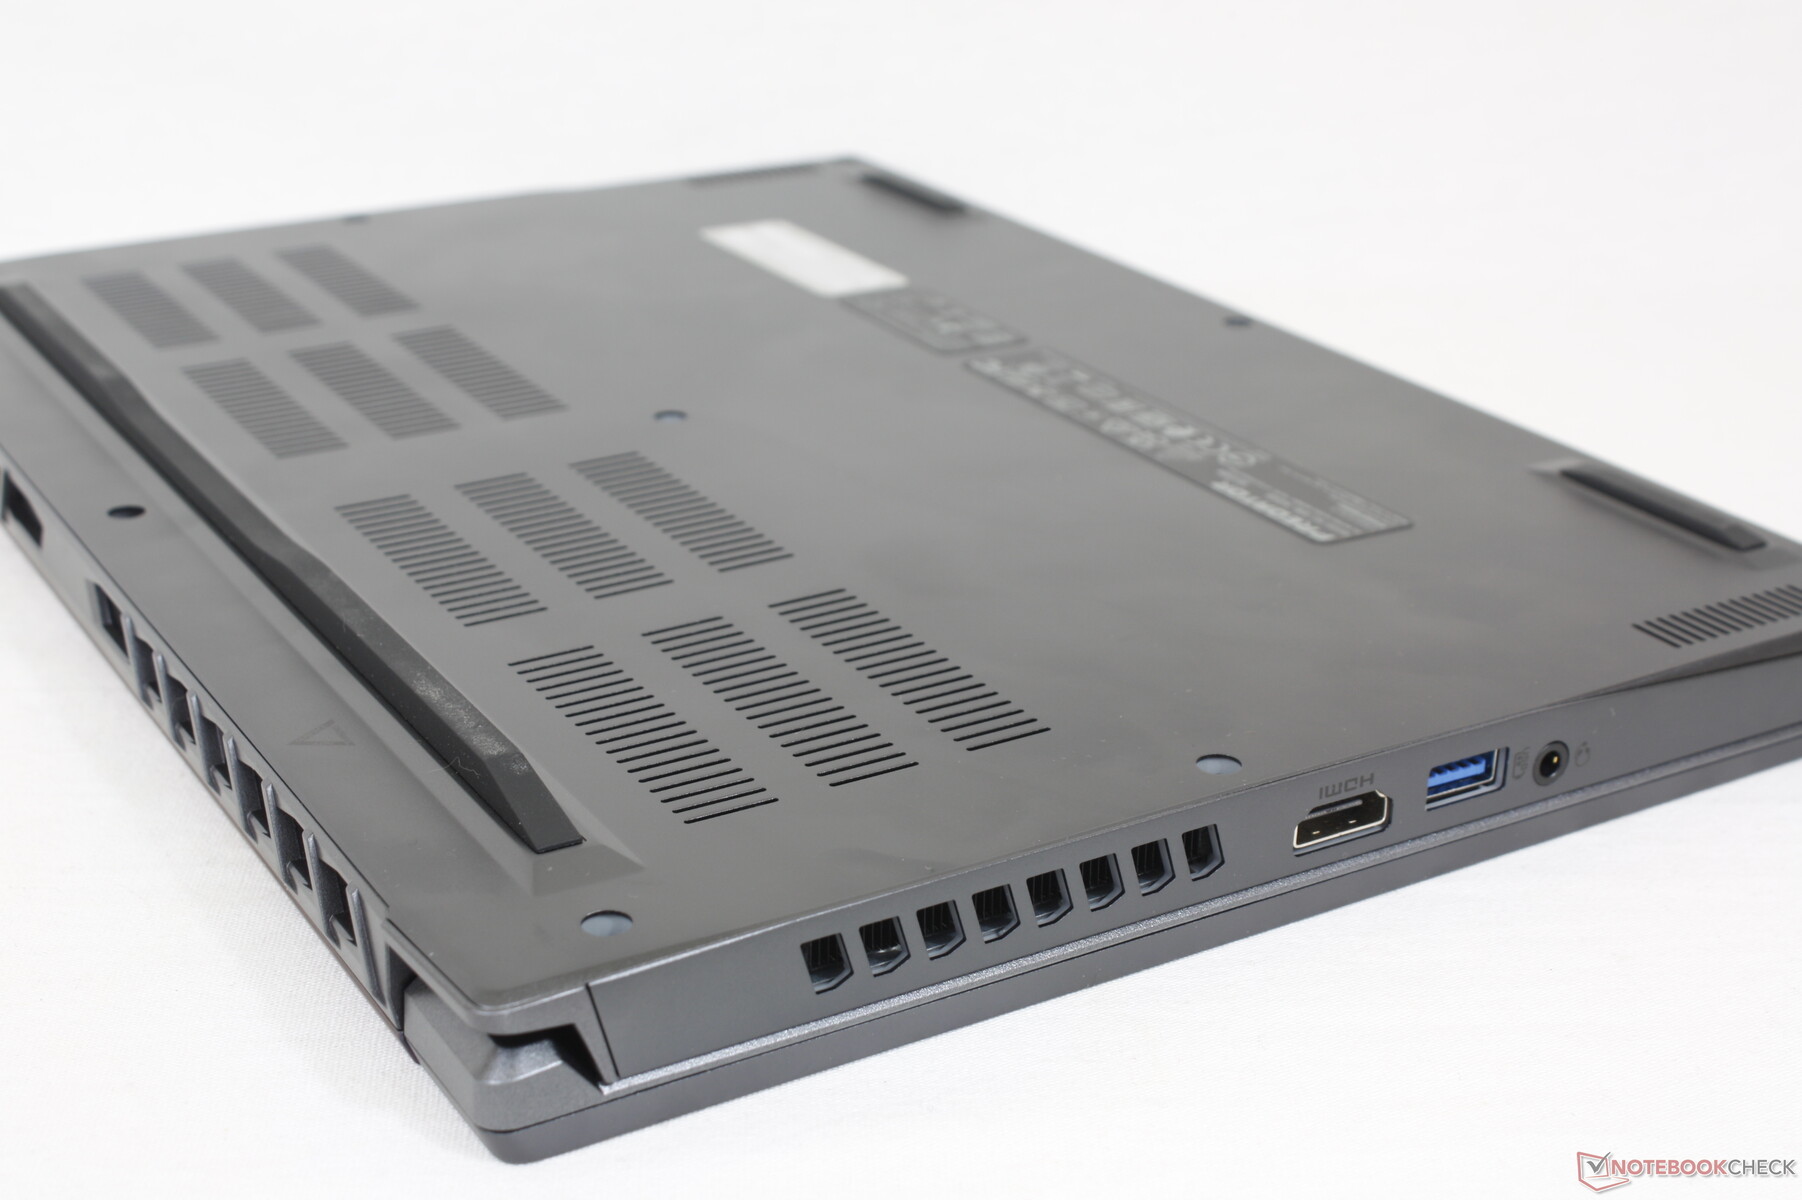
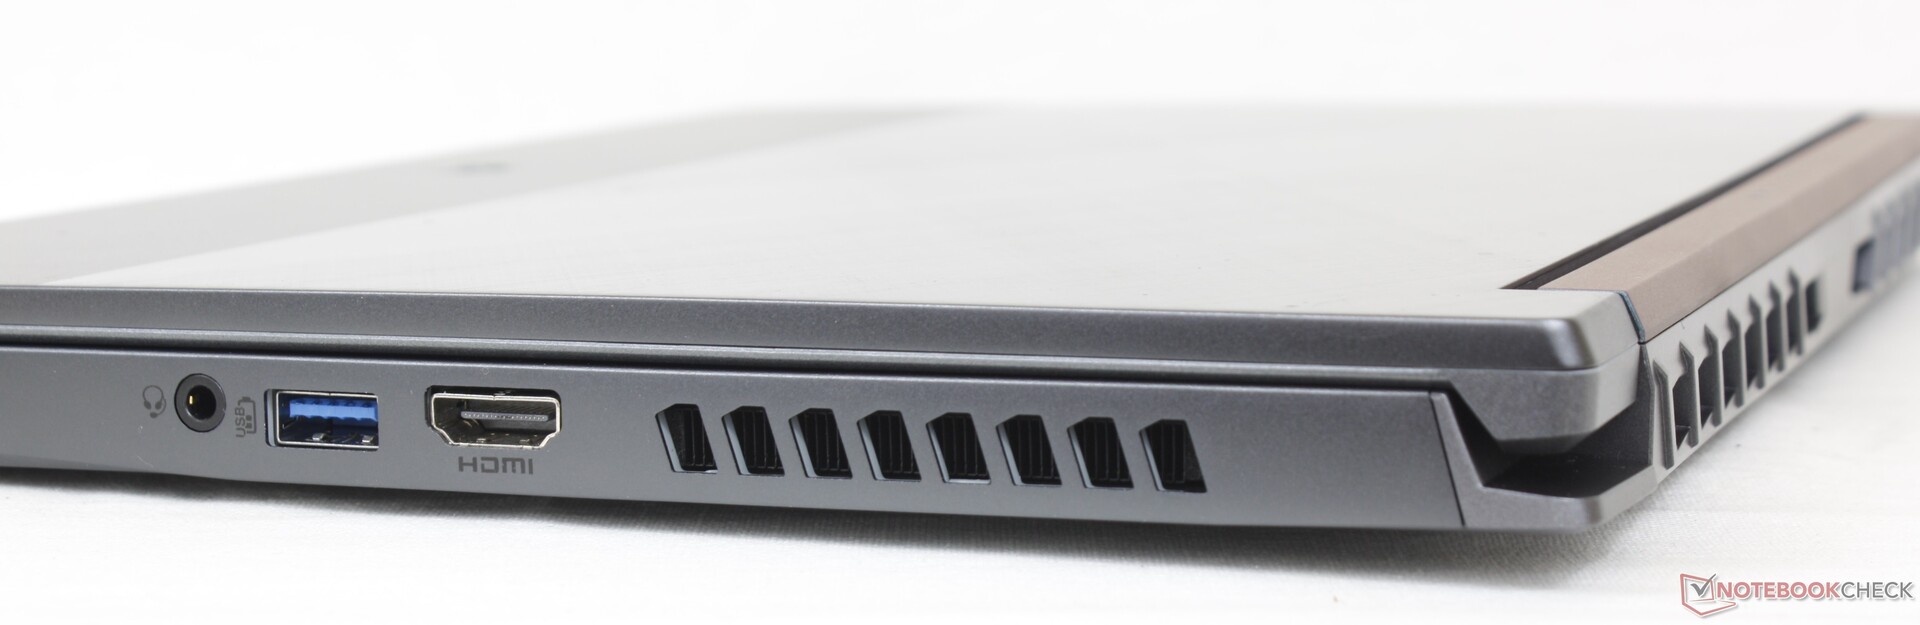
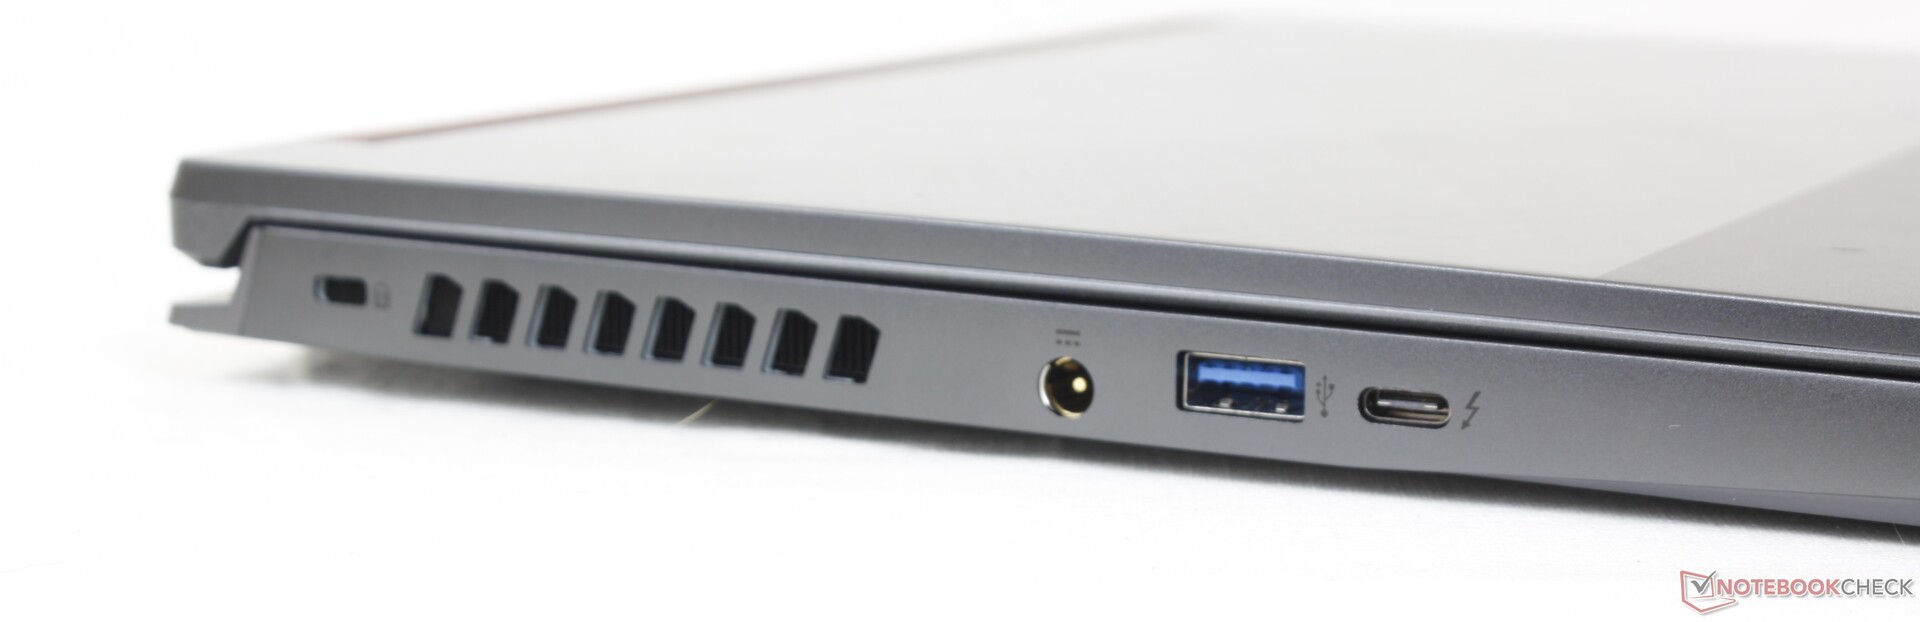
Connectivity — Thunderbolt 4 Support
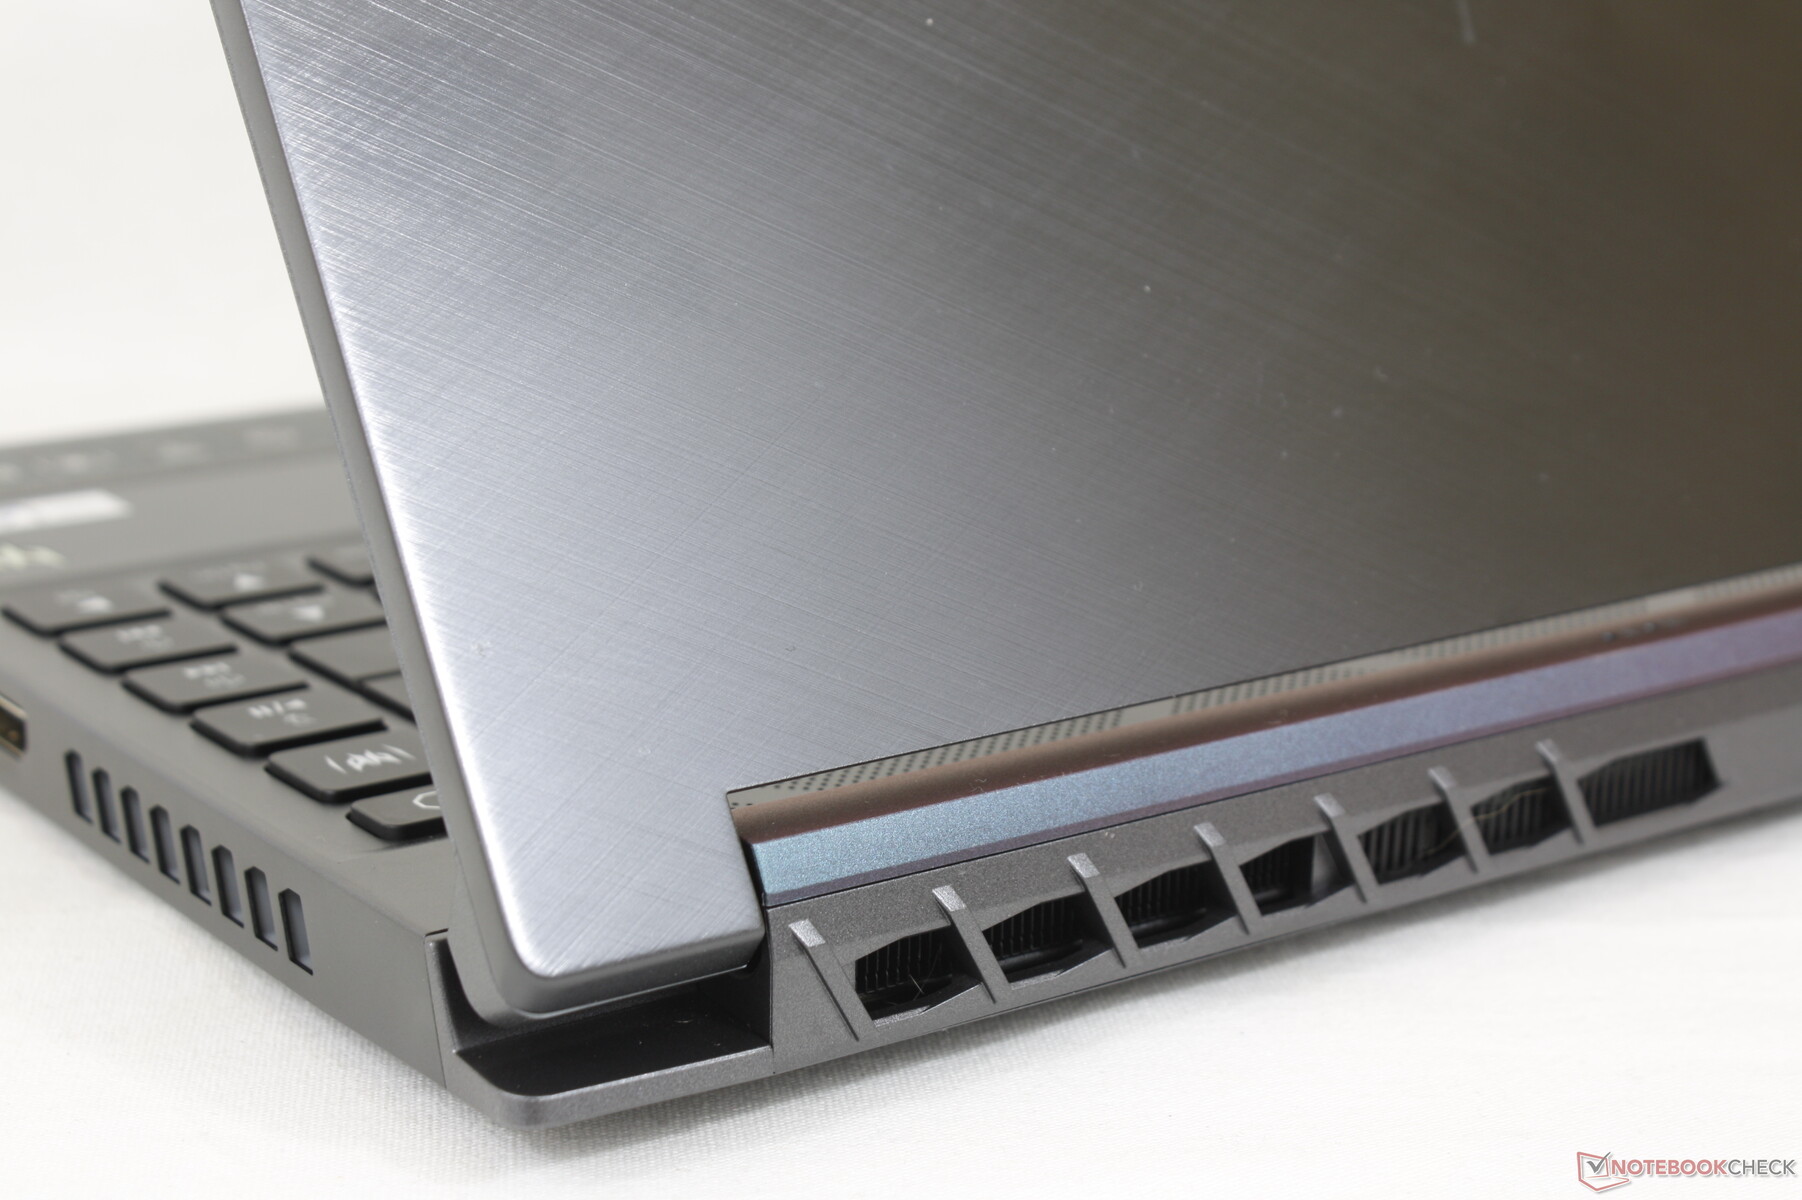
Port options are more limited than on the Asus Zephyrus G14 or Razer Blade 14 as each alternative integrates one more USB-C port than our Acer. Port positioning is also somewhat unfavorable because the ports are tightly packed and relatively close to the front edge. It's clear that the large ventilation grilles all around the chassis are taking valuable space away from the ports.
Communication
An Intel AX1675i comes standard for Wi-Fi 6E and Bluetooth 5.2 connectivity. We experienced fast and steady transfer rates when paired to our 6 GHz network.
| Networking | |
| iperf3 transmit AX12 | |
| Alienware x14 i7 RTX 3060 | |
| SCHENKER Vision 14 | |
| Razer Blade 14 Ryzen 9 6900HX | |
| iperf3 receive AX12 | |
| SCHENKER Vision 14 | |
| Razer Blade 14 Ryzen 9 6900HX | |
| Alienware x14 i7 RTX 3060 | |
| iperf3 receive AXE11000 6GHz | |
| Acer Predator Triton 300 SE | |
| Dell Inspiron 14 Plus 7420 | |
| iperf3 receive AXE11000 | |
| Asus ROG Zephyrus G14 GA402RJ | |
| iperf3 transmit AXE11000 6GHz | |
| Acer Predator Triton 300 SE | |
| Dell Inspiron 14 Plus 7420 | |
Webcam
A 2 MP camera comes standard to be comparable to many midrange Ultrabooks. There is no IR sensor or even a privacy shutter.


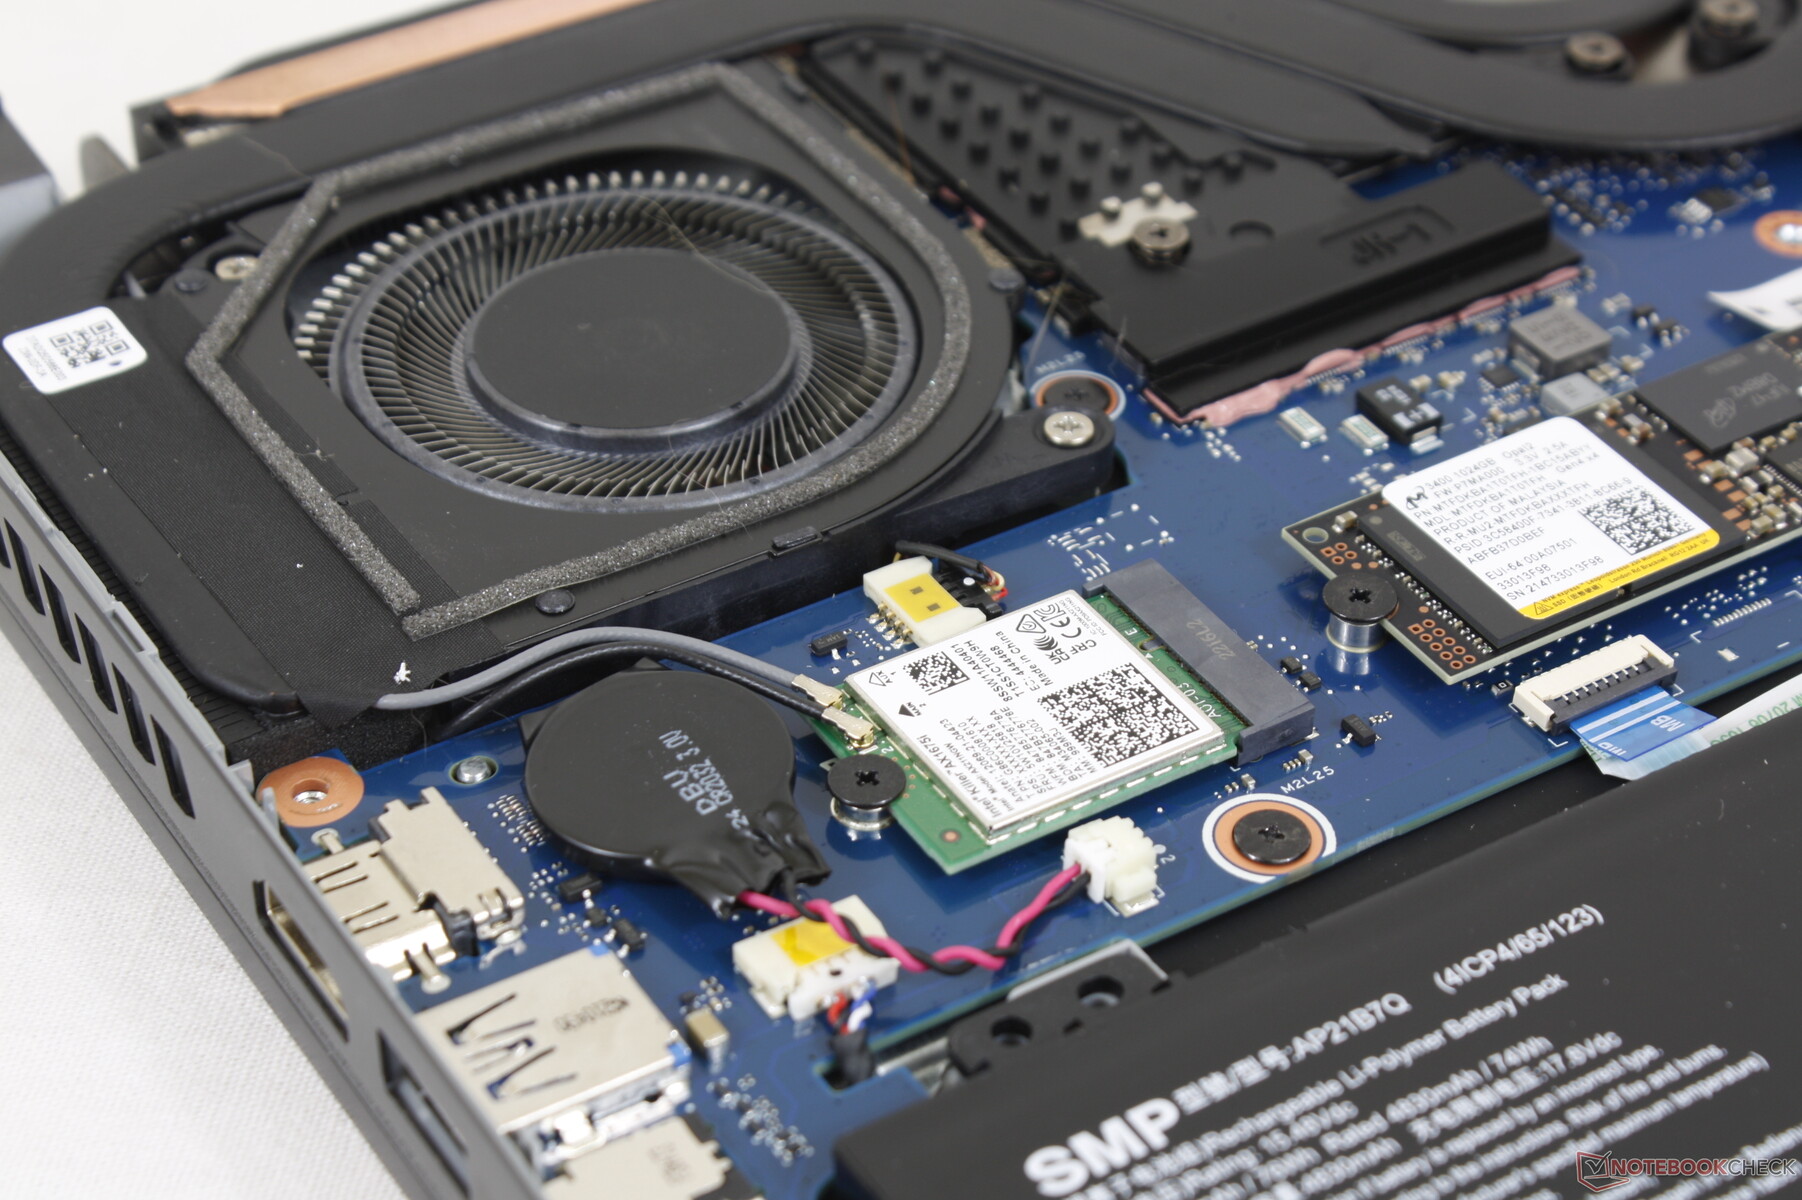
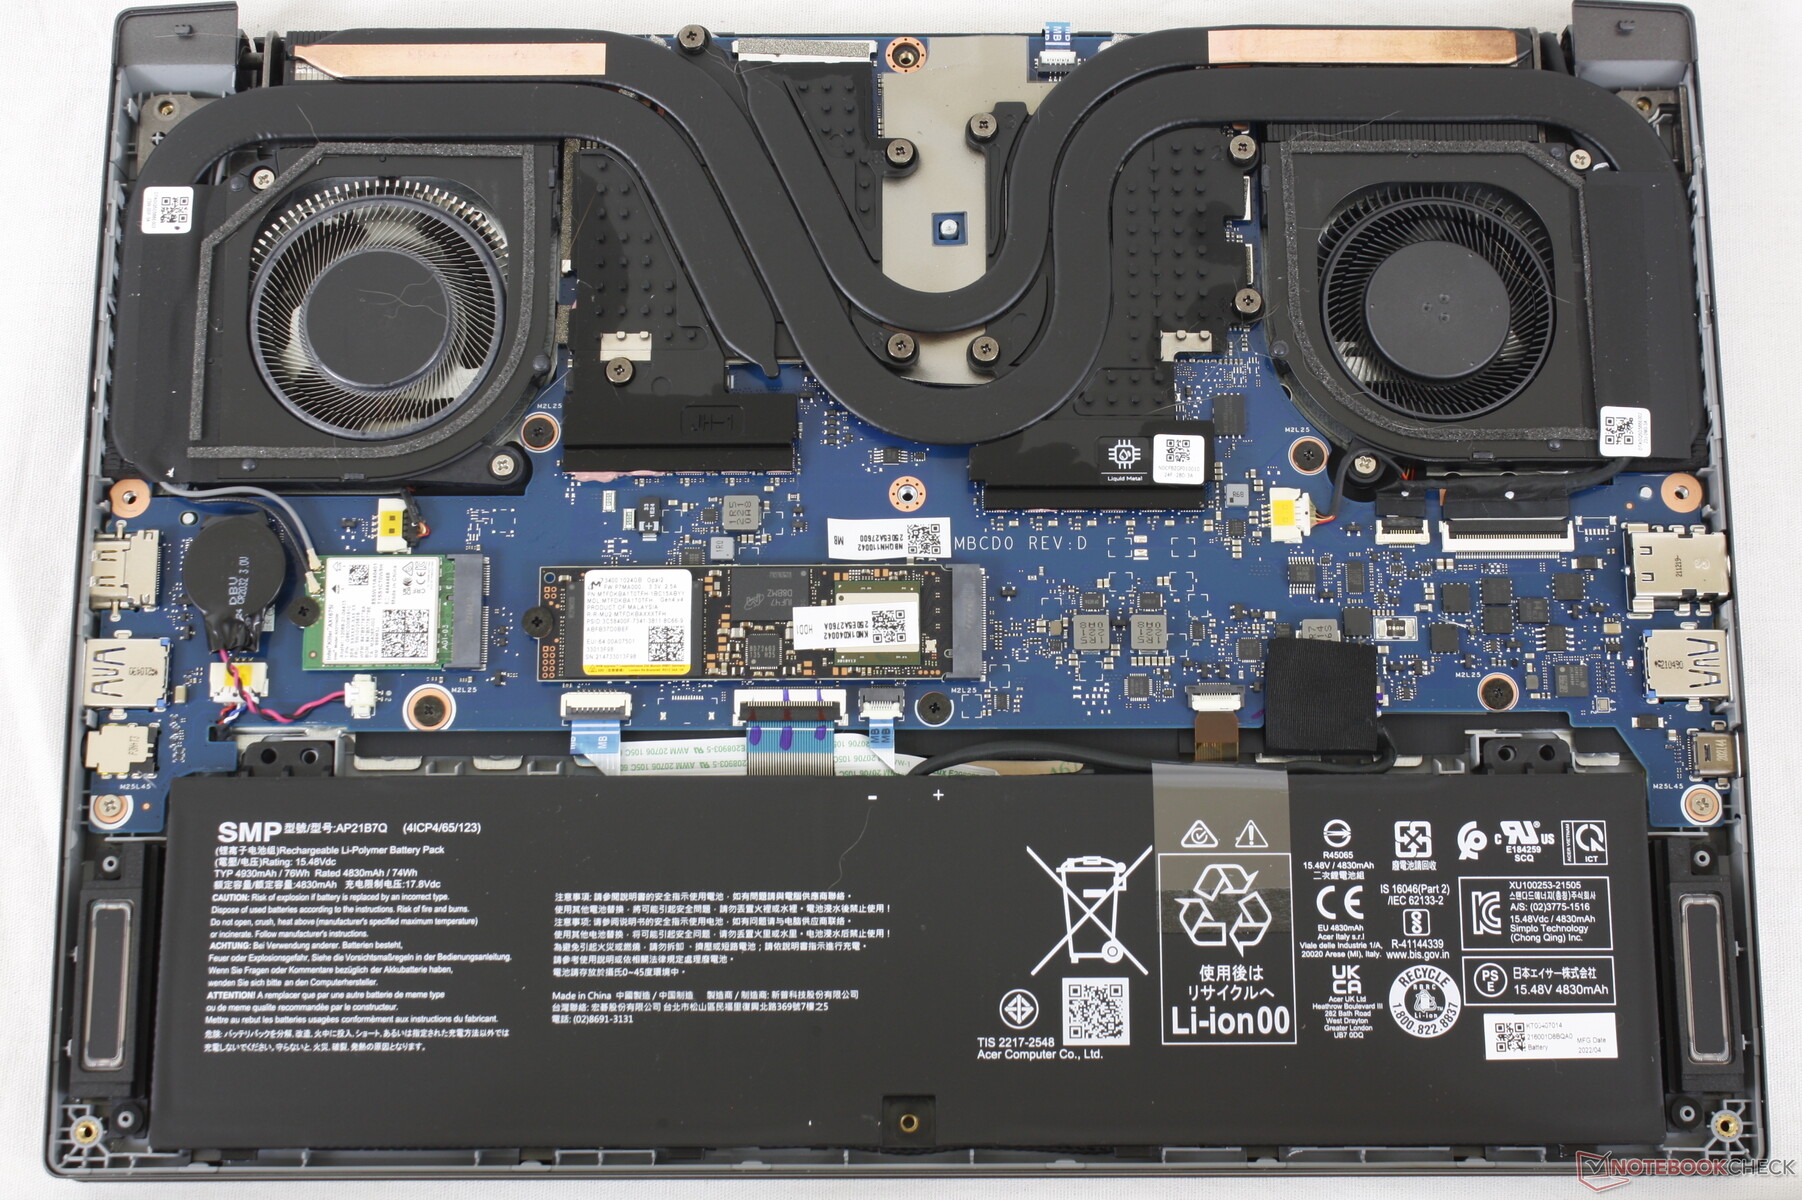
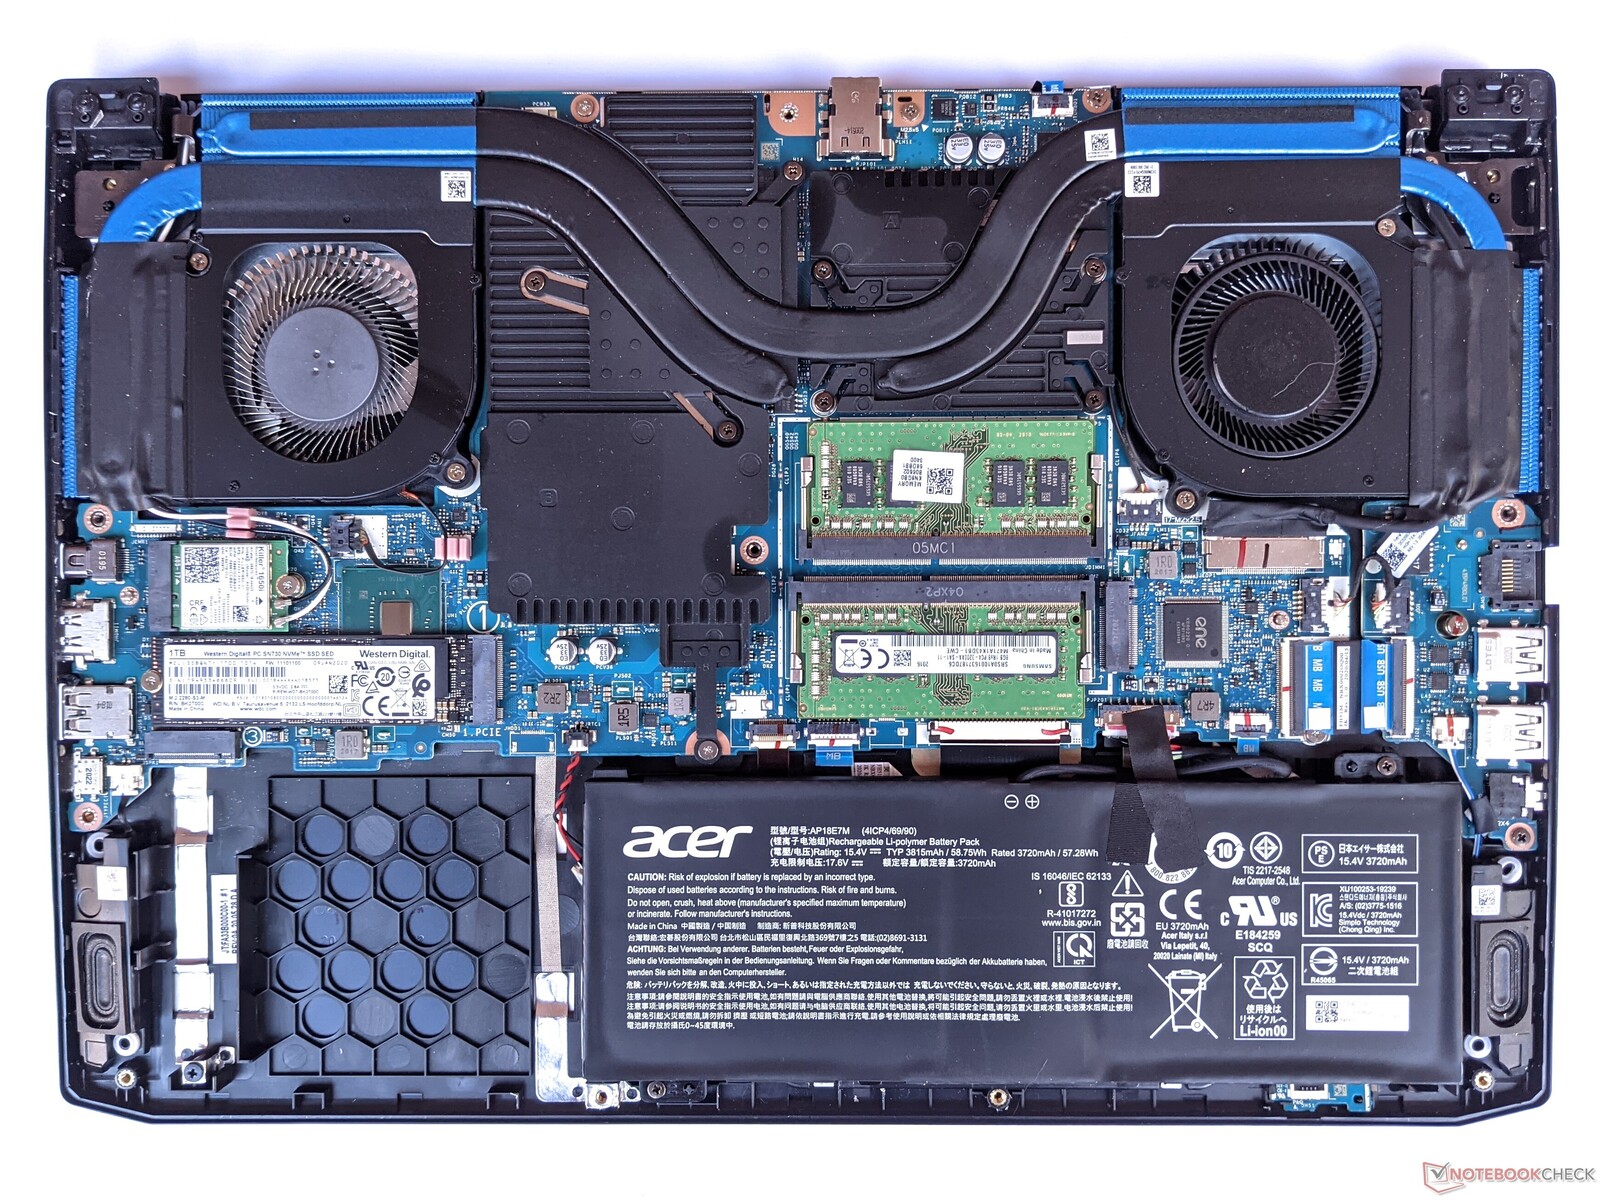
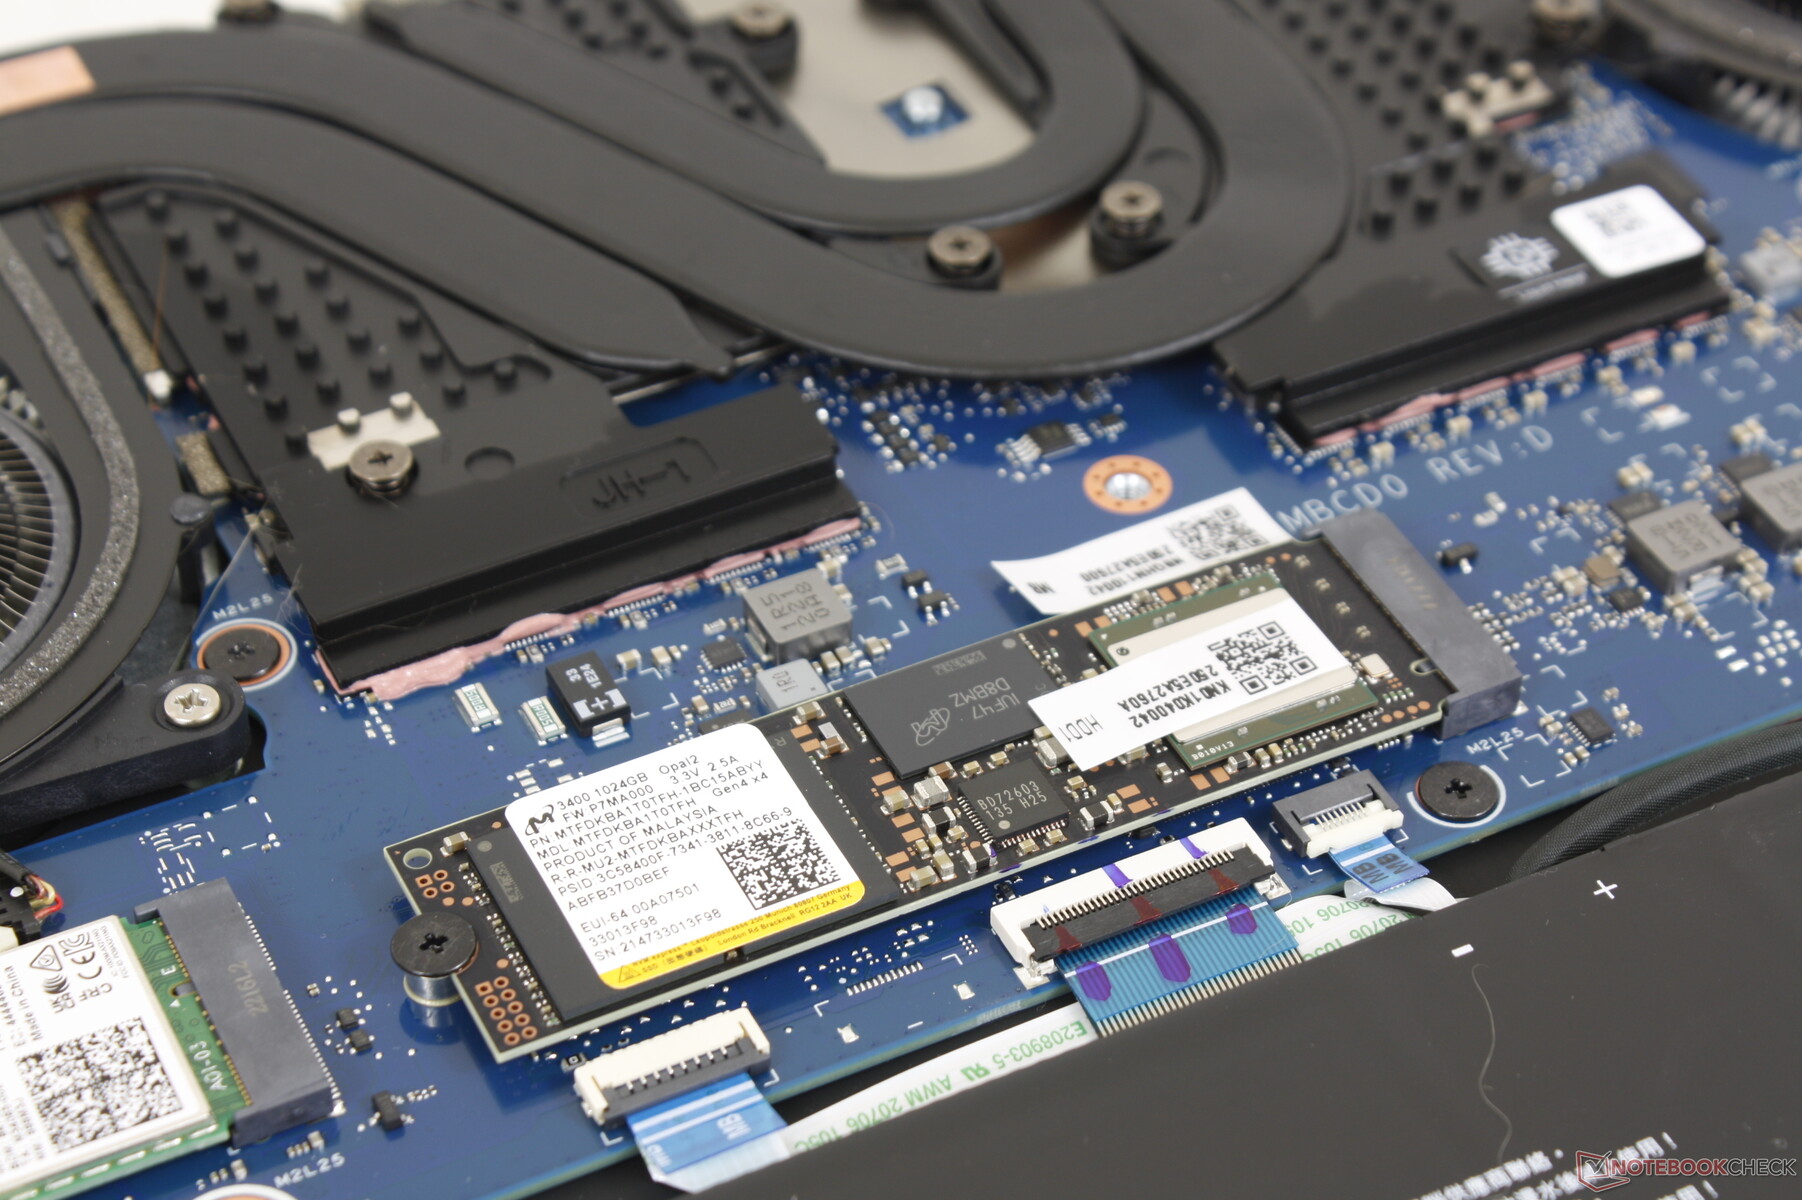
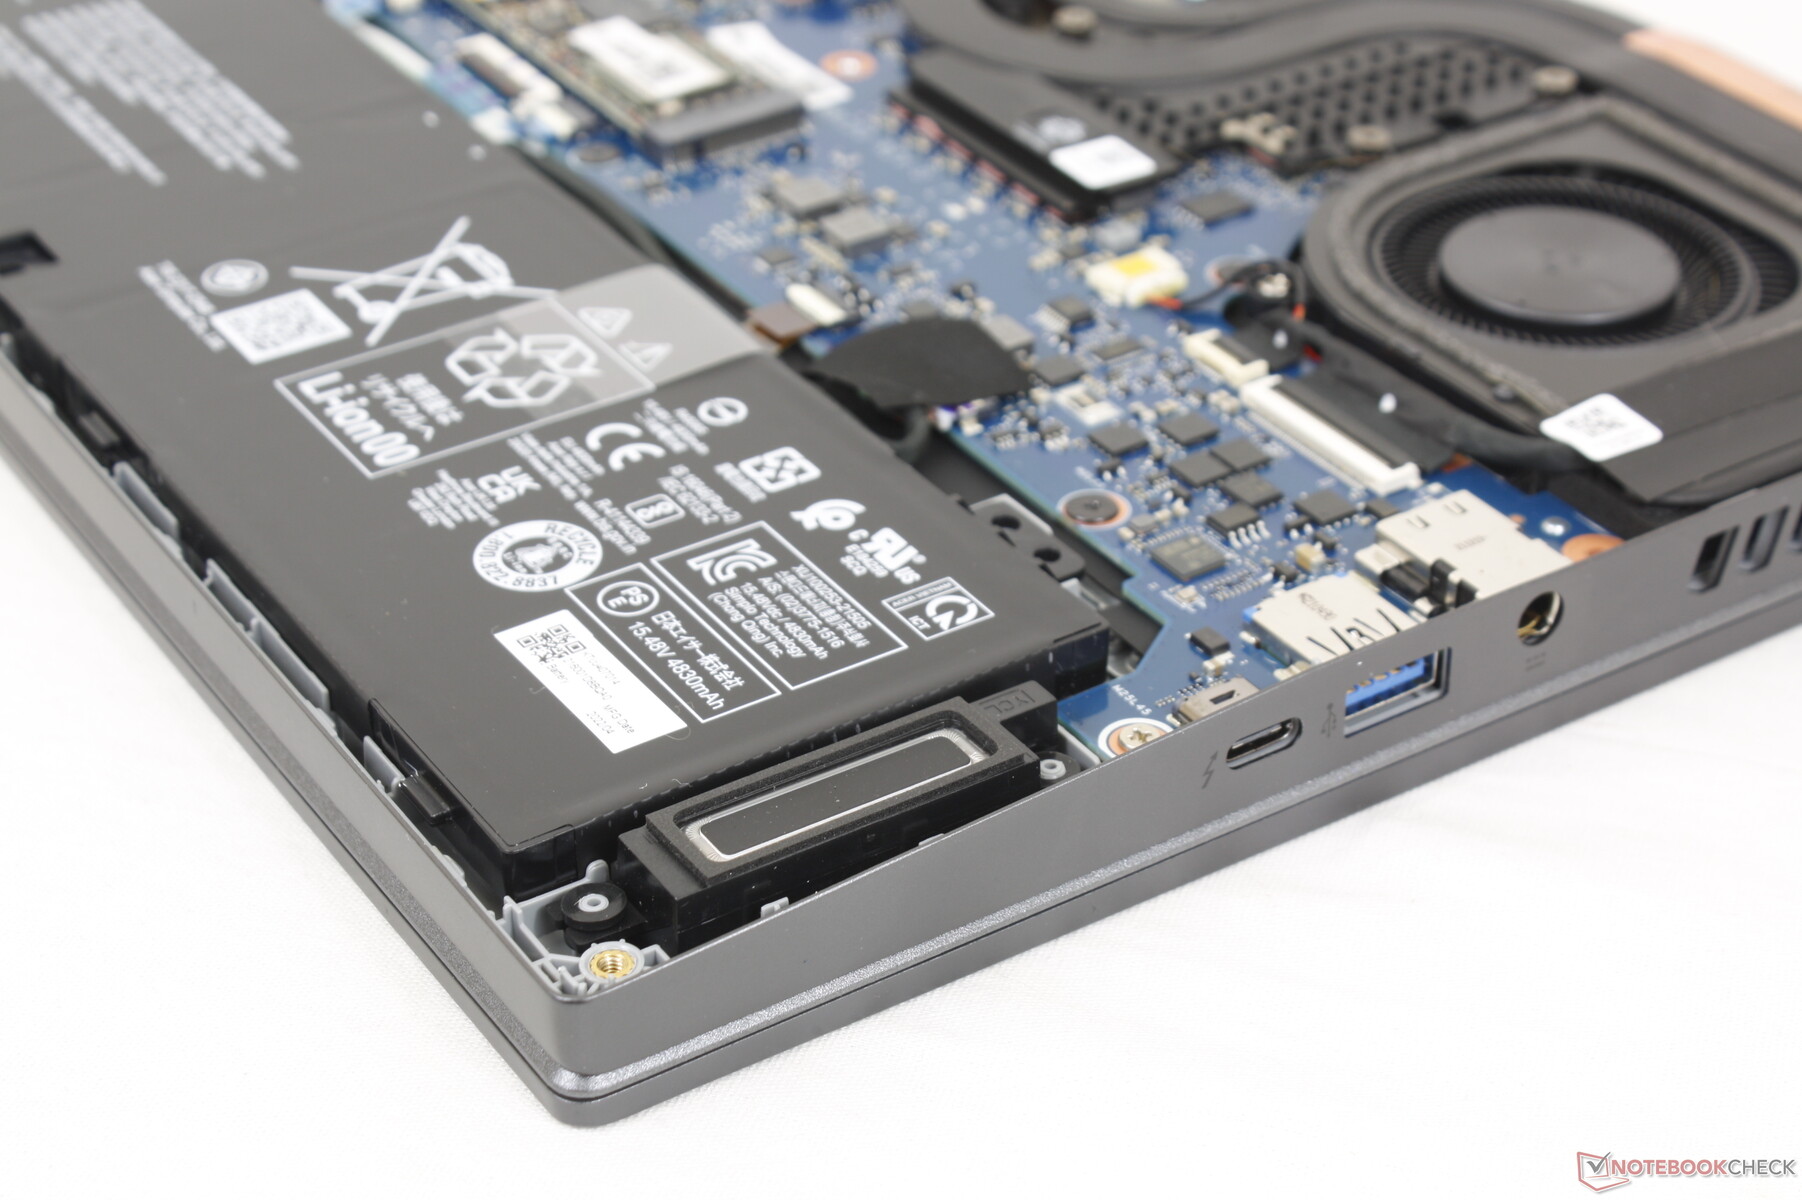
Maintenance
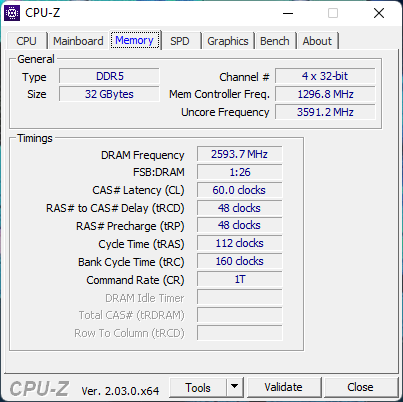
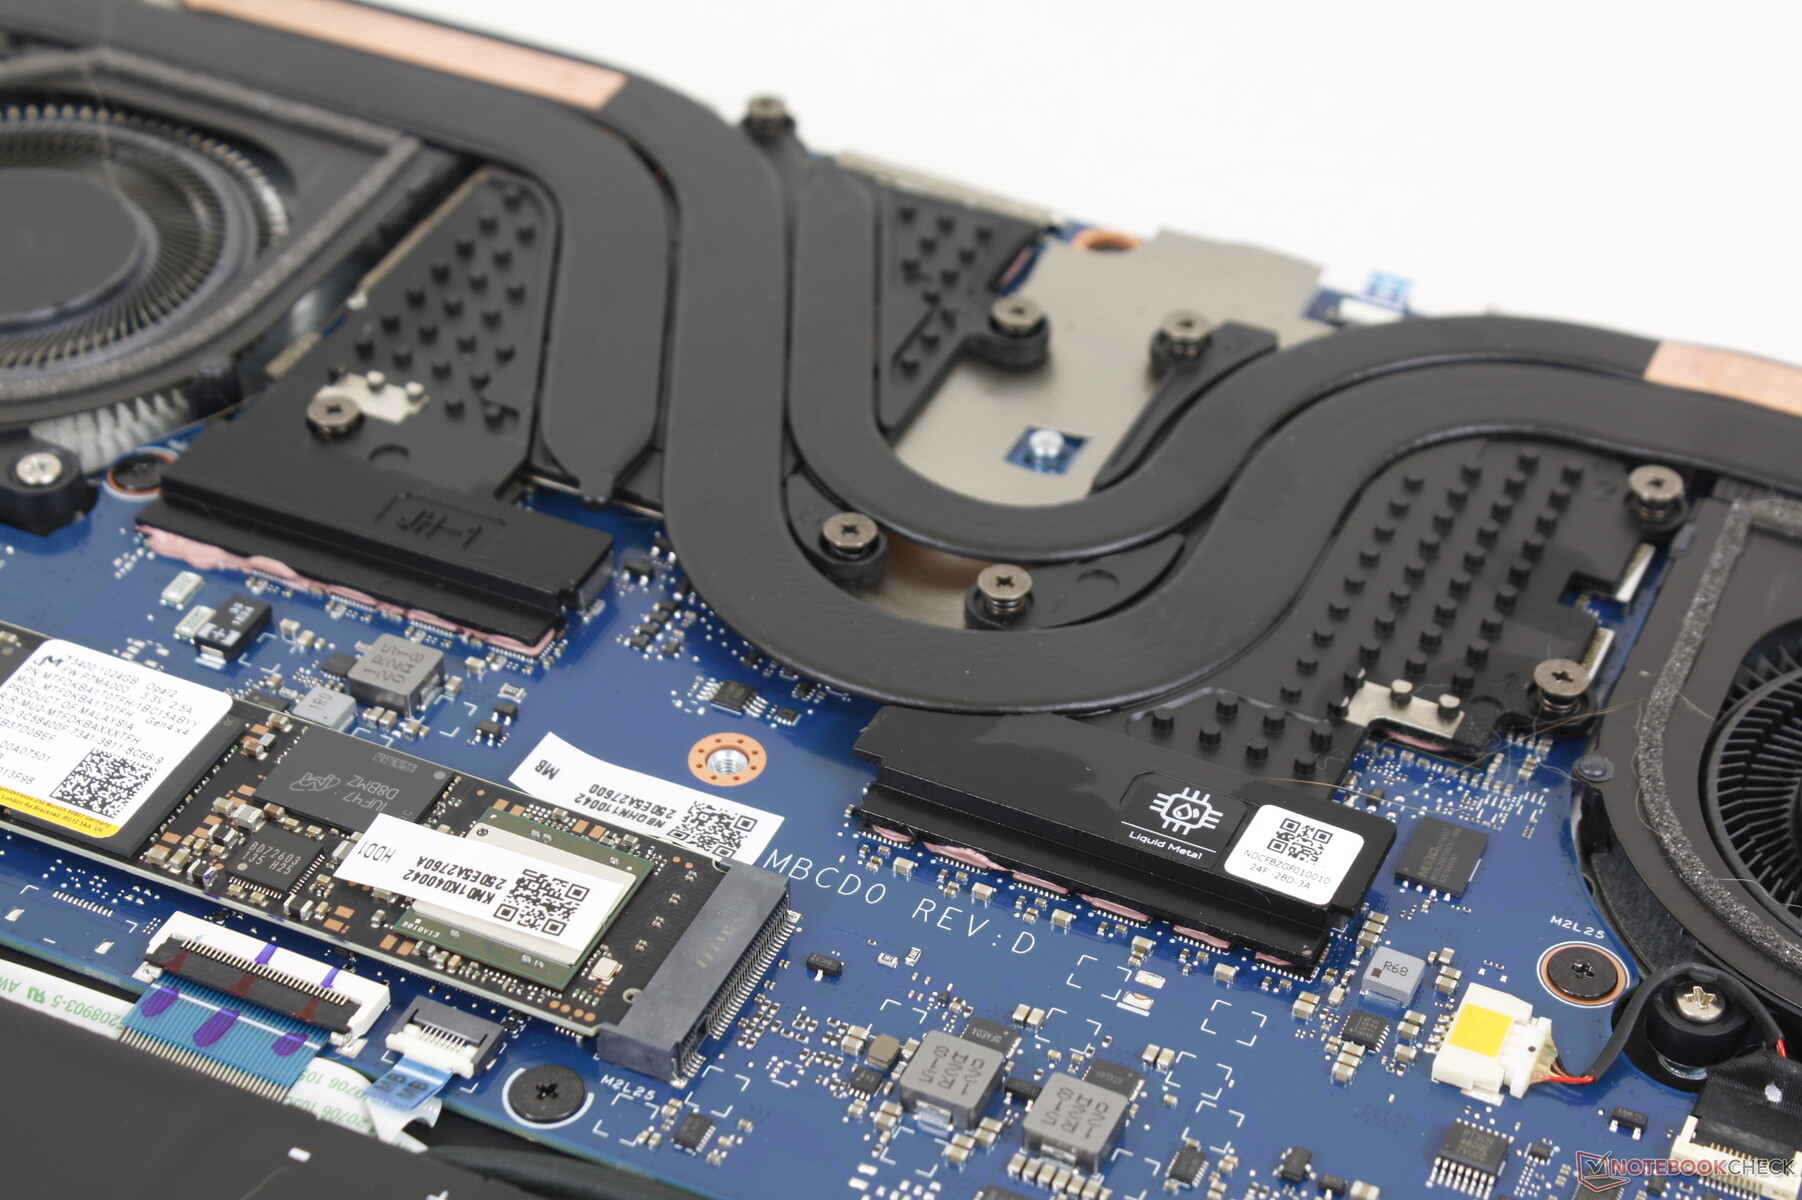
The bottom panel is secured by nine T6 Torx screws for relatively easy servicing. Users can only upgrade the SSD, WLAN module, and battery. The RAM modules are soldered unlike on the previous generation model.
Accessories and Warranty
The retail box includes a handy carrying case in addition to the AC adapter and paperwork. Other manufacturers rarely include carrying cases anymore without additional charges. The usual one-year limited manufacturer warranty applies if purchased in the US.
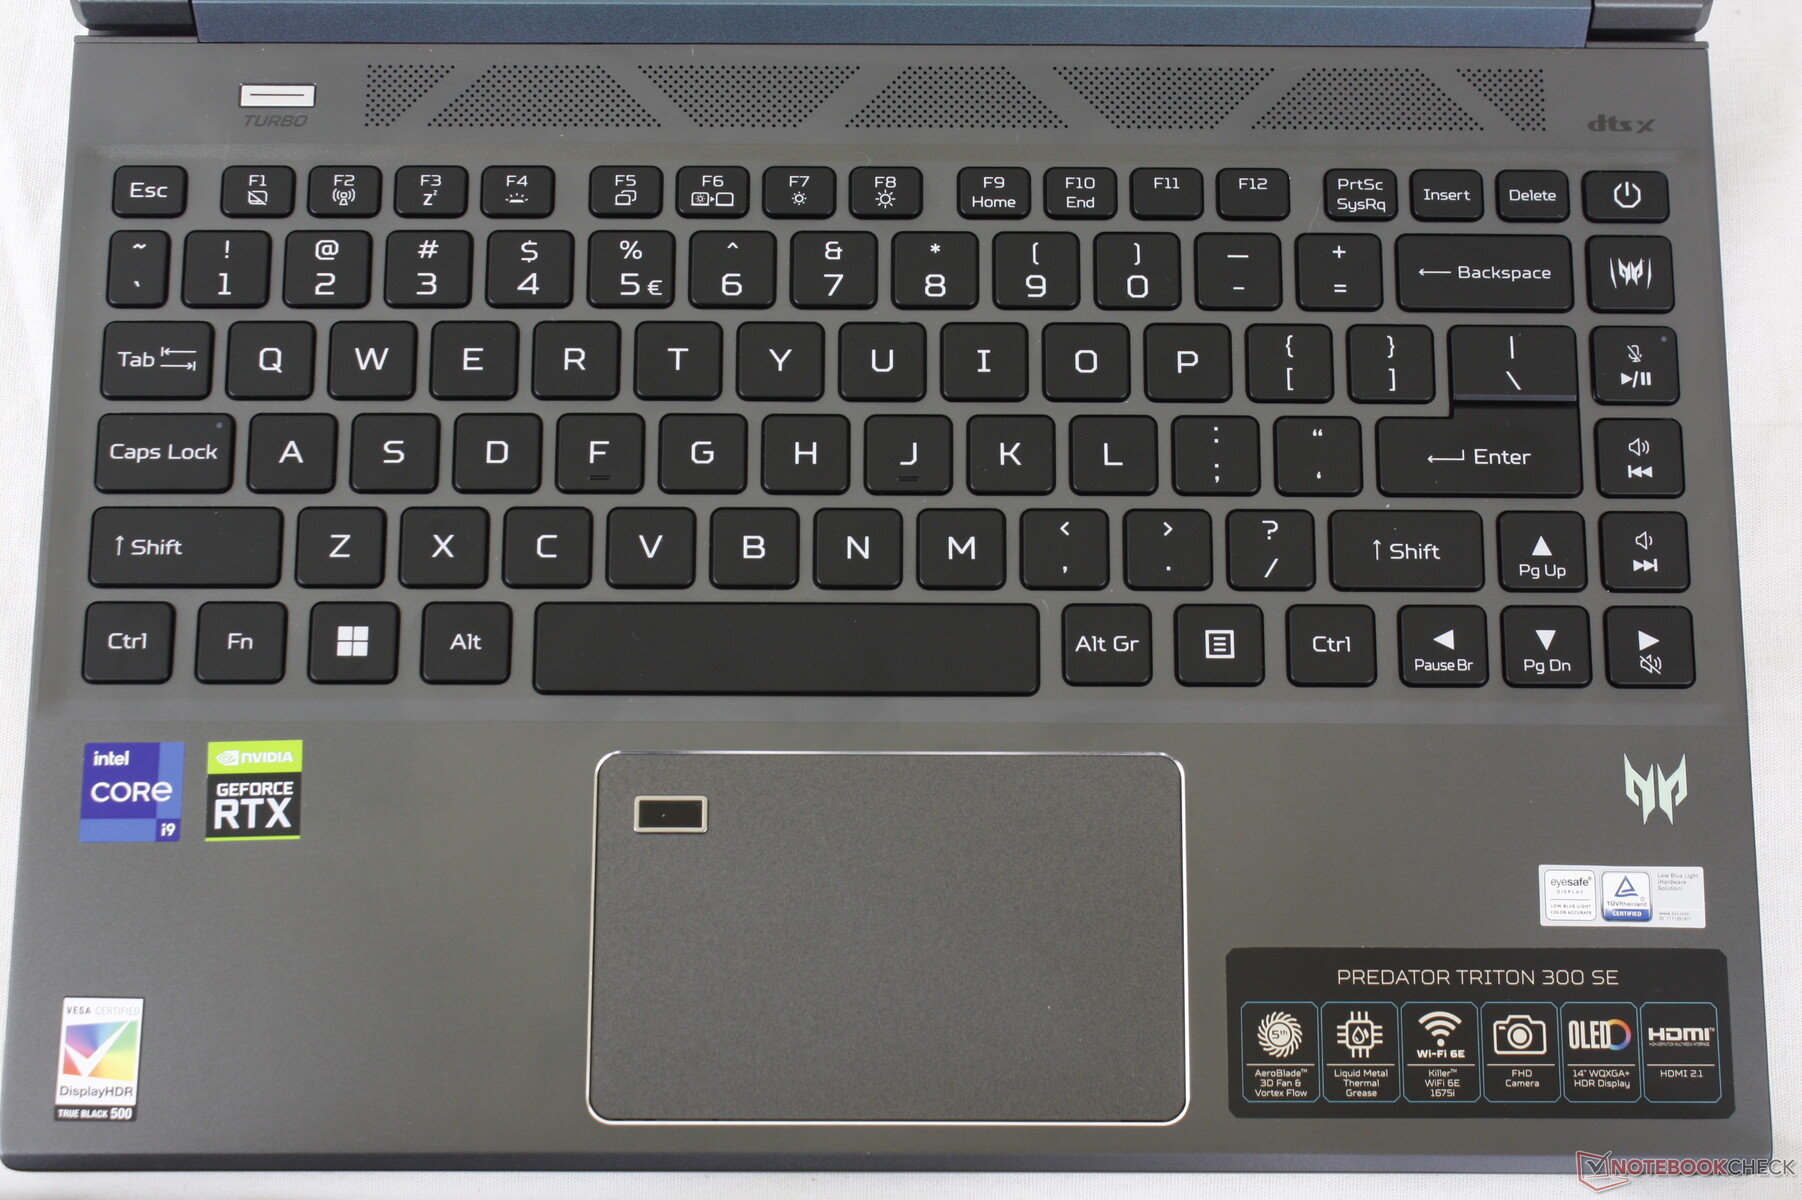
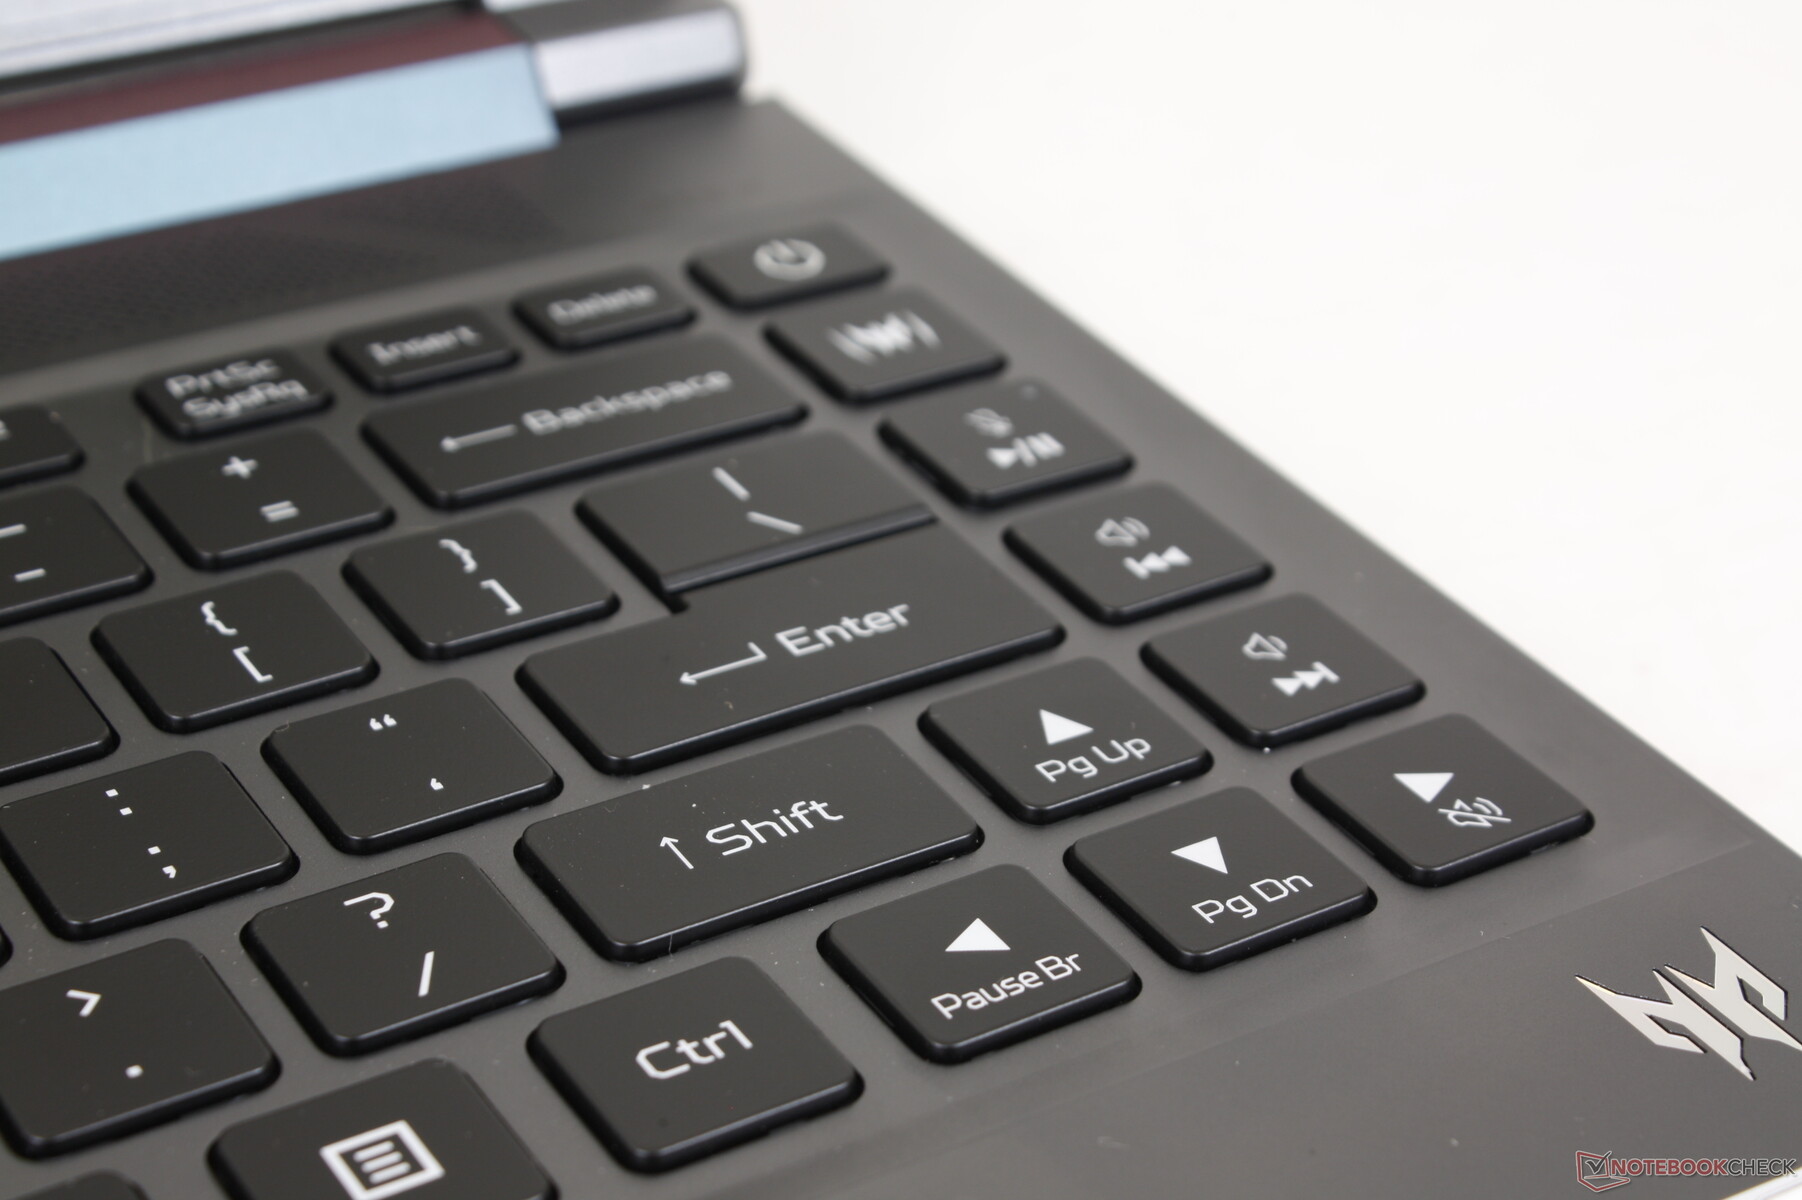
Input Devices — Soft And Quiet Keys
Keyboard
The keys are shallow in travel and have relatively weak feedback similar to the keys on the Blade 14 and many inexpensive Utlrabooks like the Asus VivoBook S14. If you've typed before on an Ultrabook before, then you'll know what to expect here. Feedback may be relatively quiet, but it's not as sharp as firm as the keys on a business-centric ThinkPad or EliteBook.
A three-zone RGB backlight comes standard whereas the Blade 14 includes per-key RGB lighting. All keys and symbols are backlit.
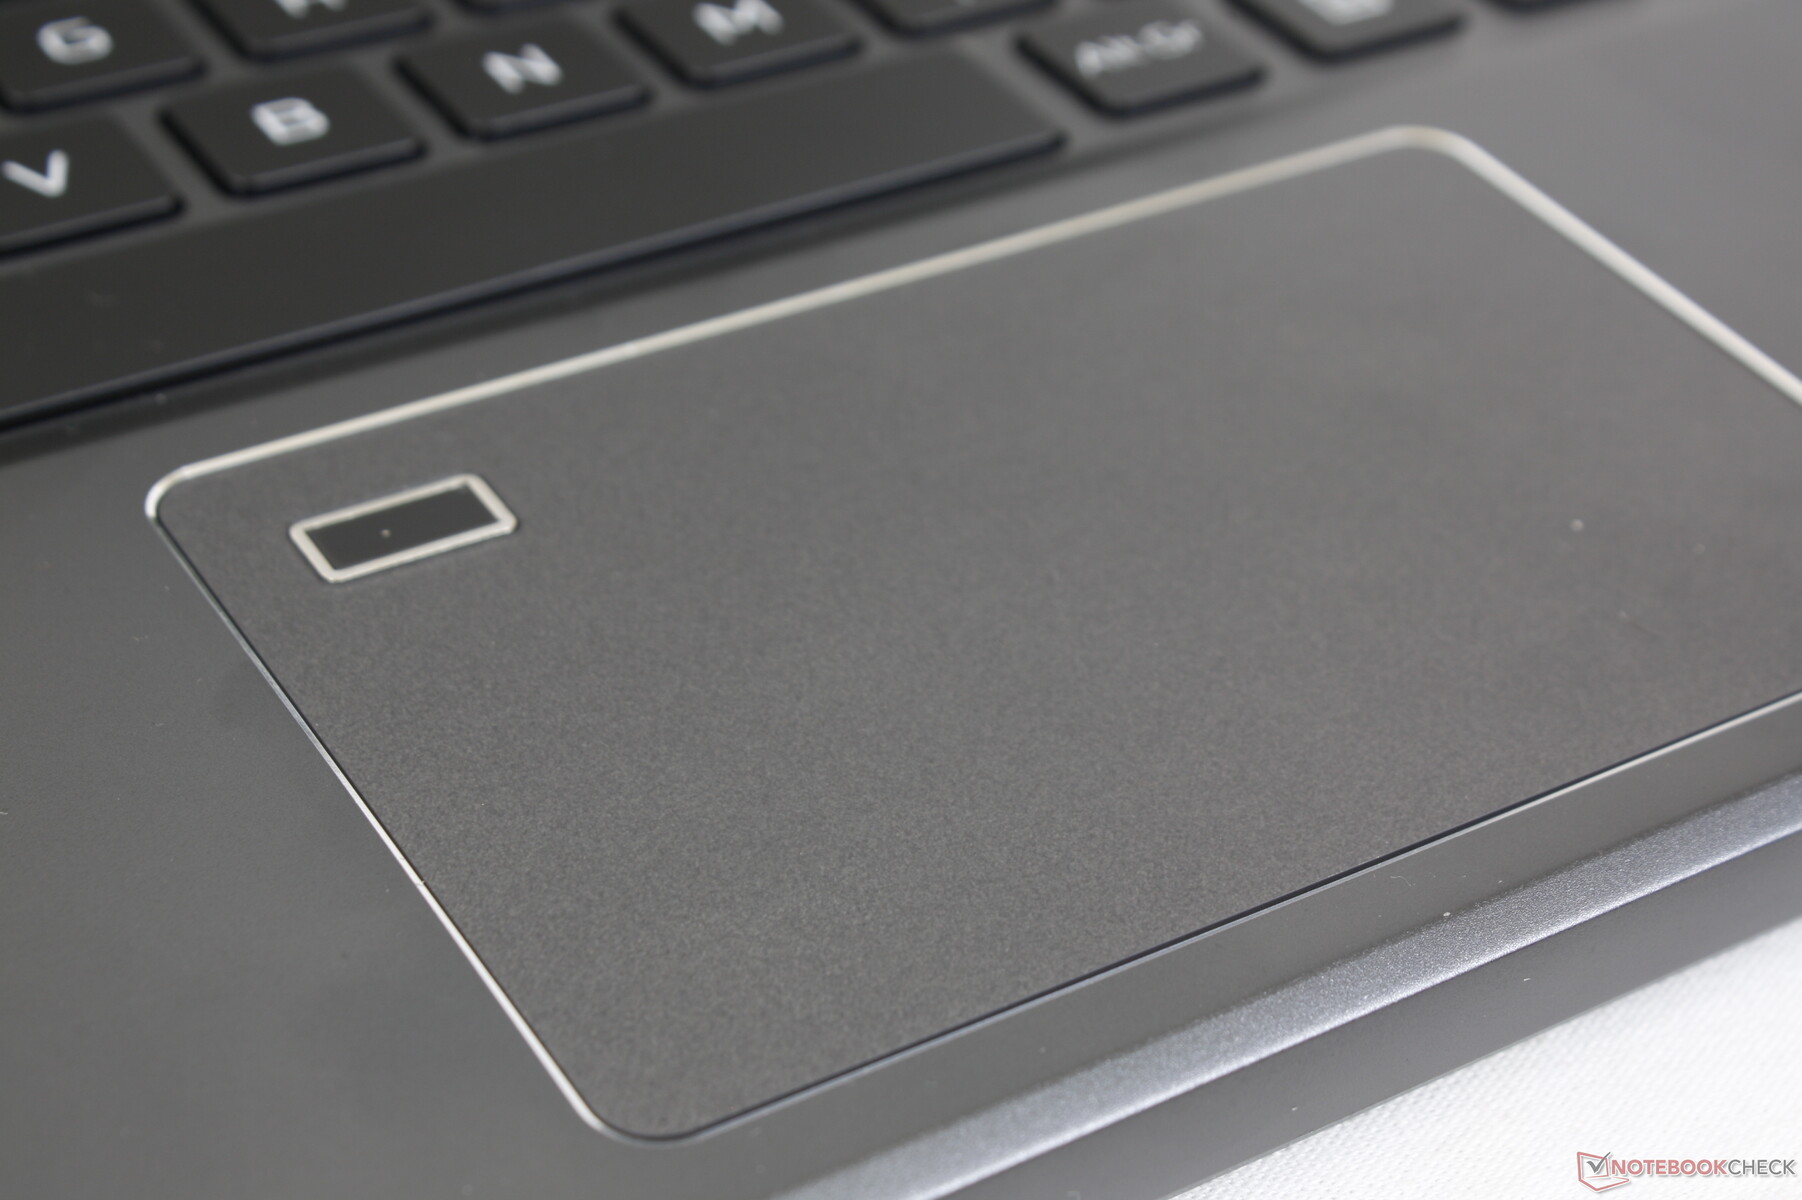
Touchpad
The clickpad is slightly larger than the clickpad on the Zephyrus G14 (10.5 x 6.5 cm vs. 10.5 x 6 cm). However, the fingerprint reader at the corner reduces the effective space for cursor control or multi-touch inputs and so the clickpad can feel smaller. Most other laptops have relocated the fingerprint reader to more convenient areas like the power button or keyboard instead. The Predator Triton 300 SE can feel like an older chassis design in this regard.
Feedback when clicking on the clickpad is soft and very shallow for a weak impression. You'll definitely want to use a USB mouse whenever possible.

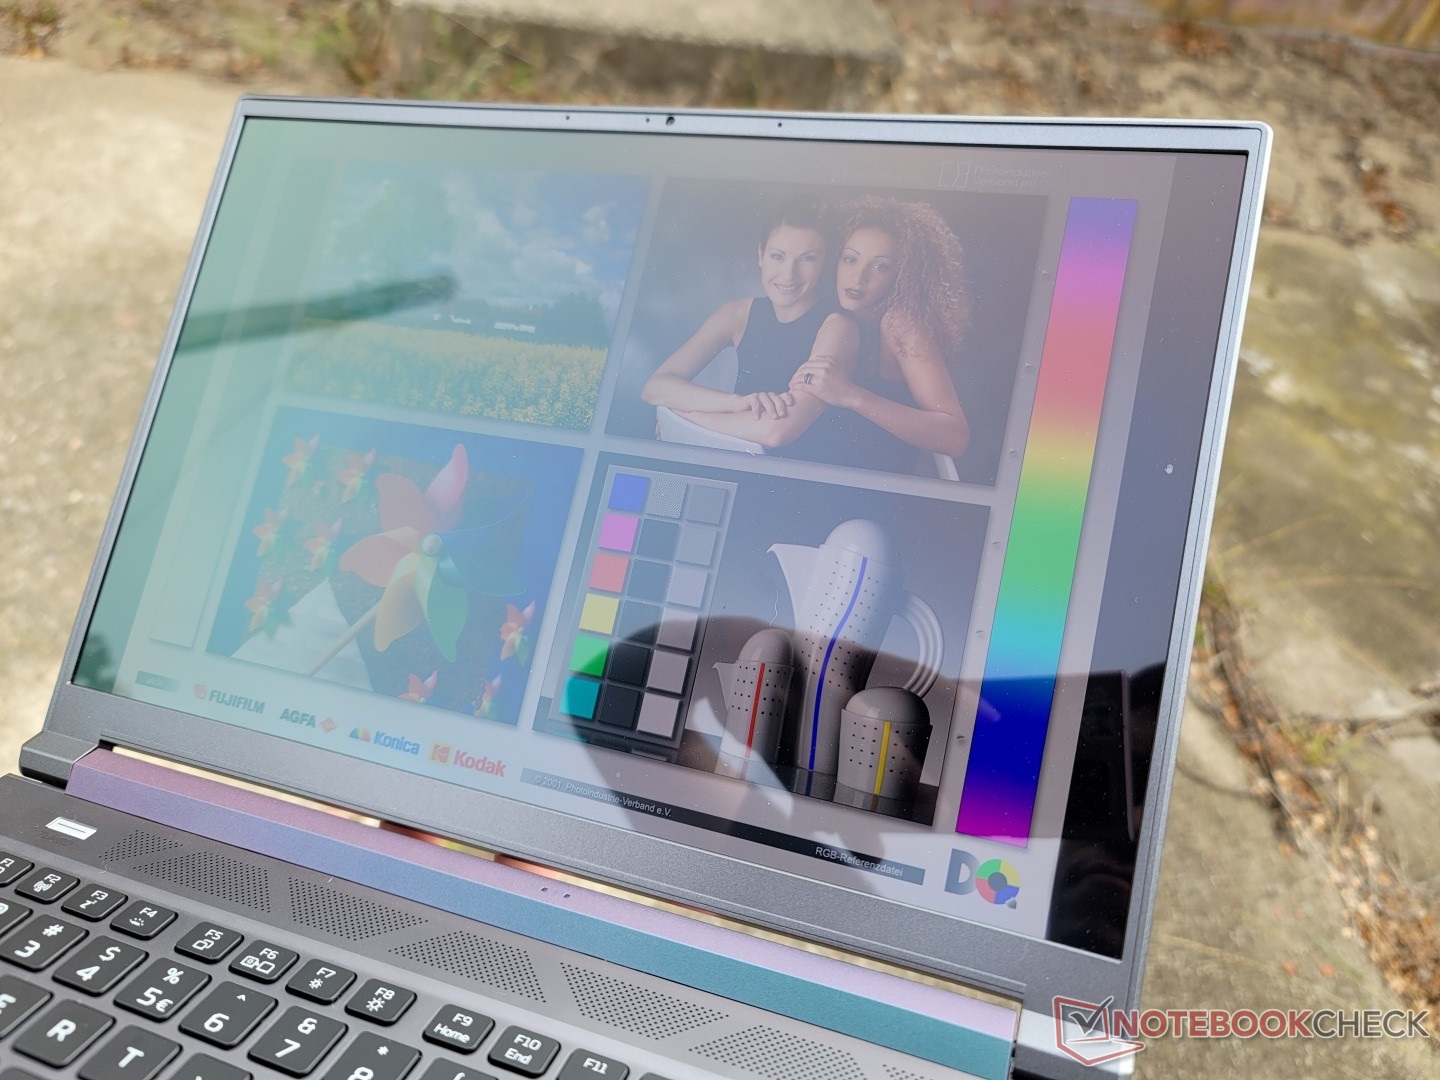
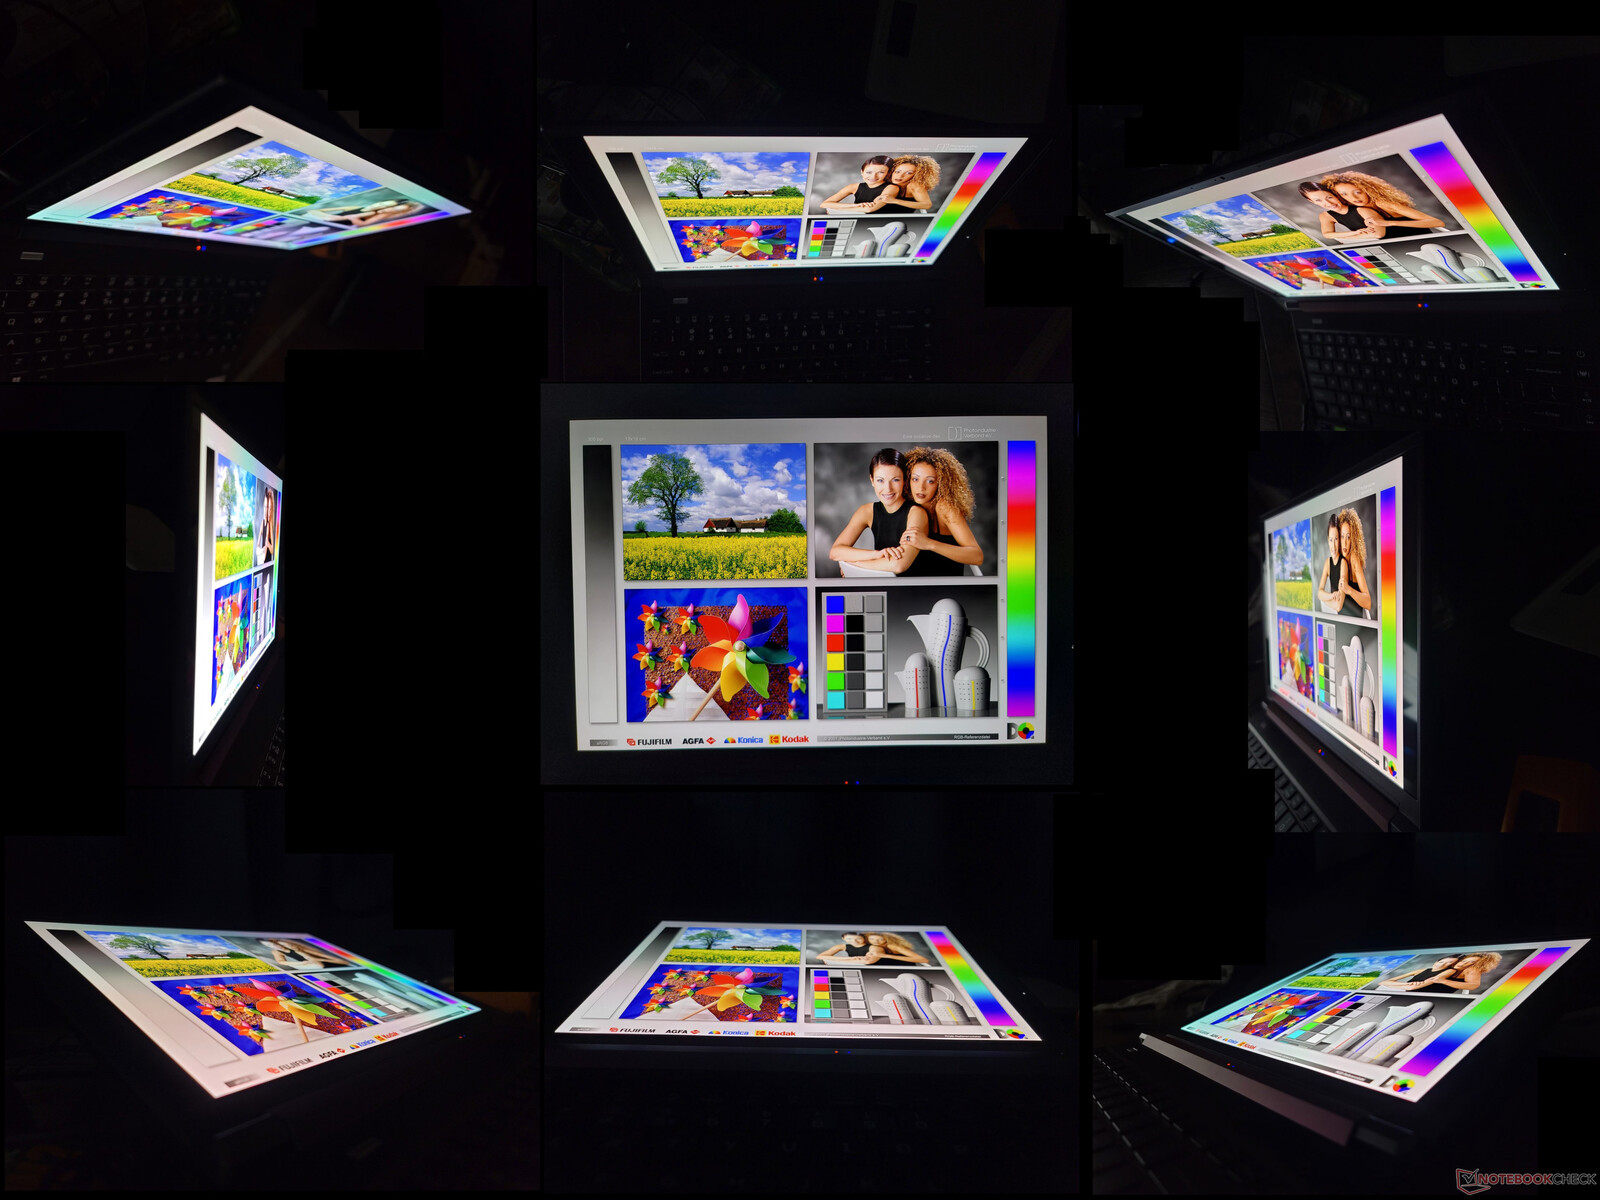
Display — OLED And IPS Options

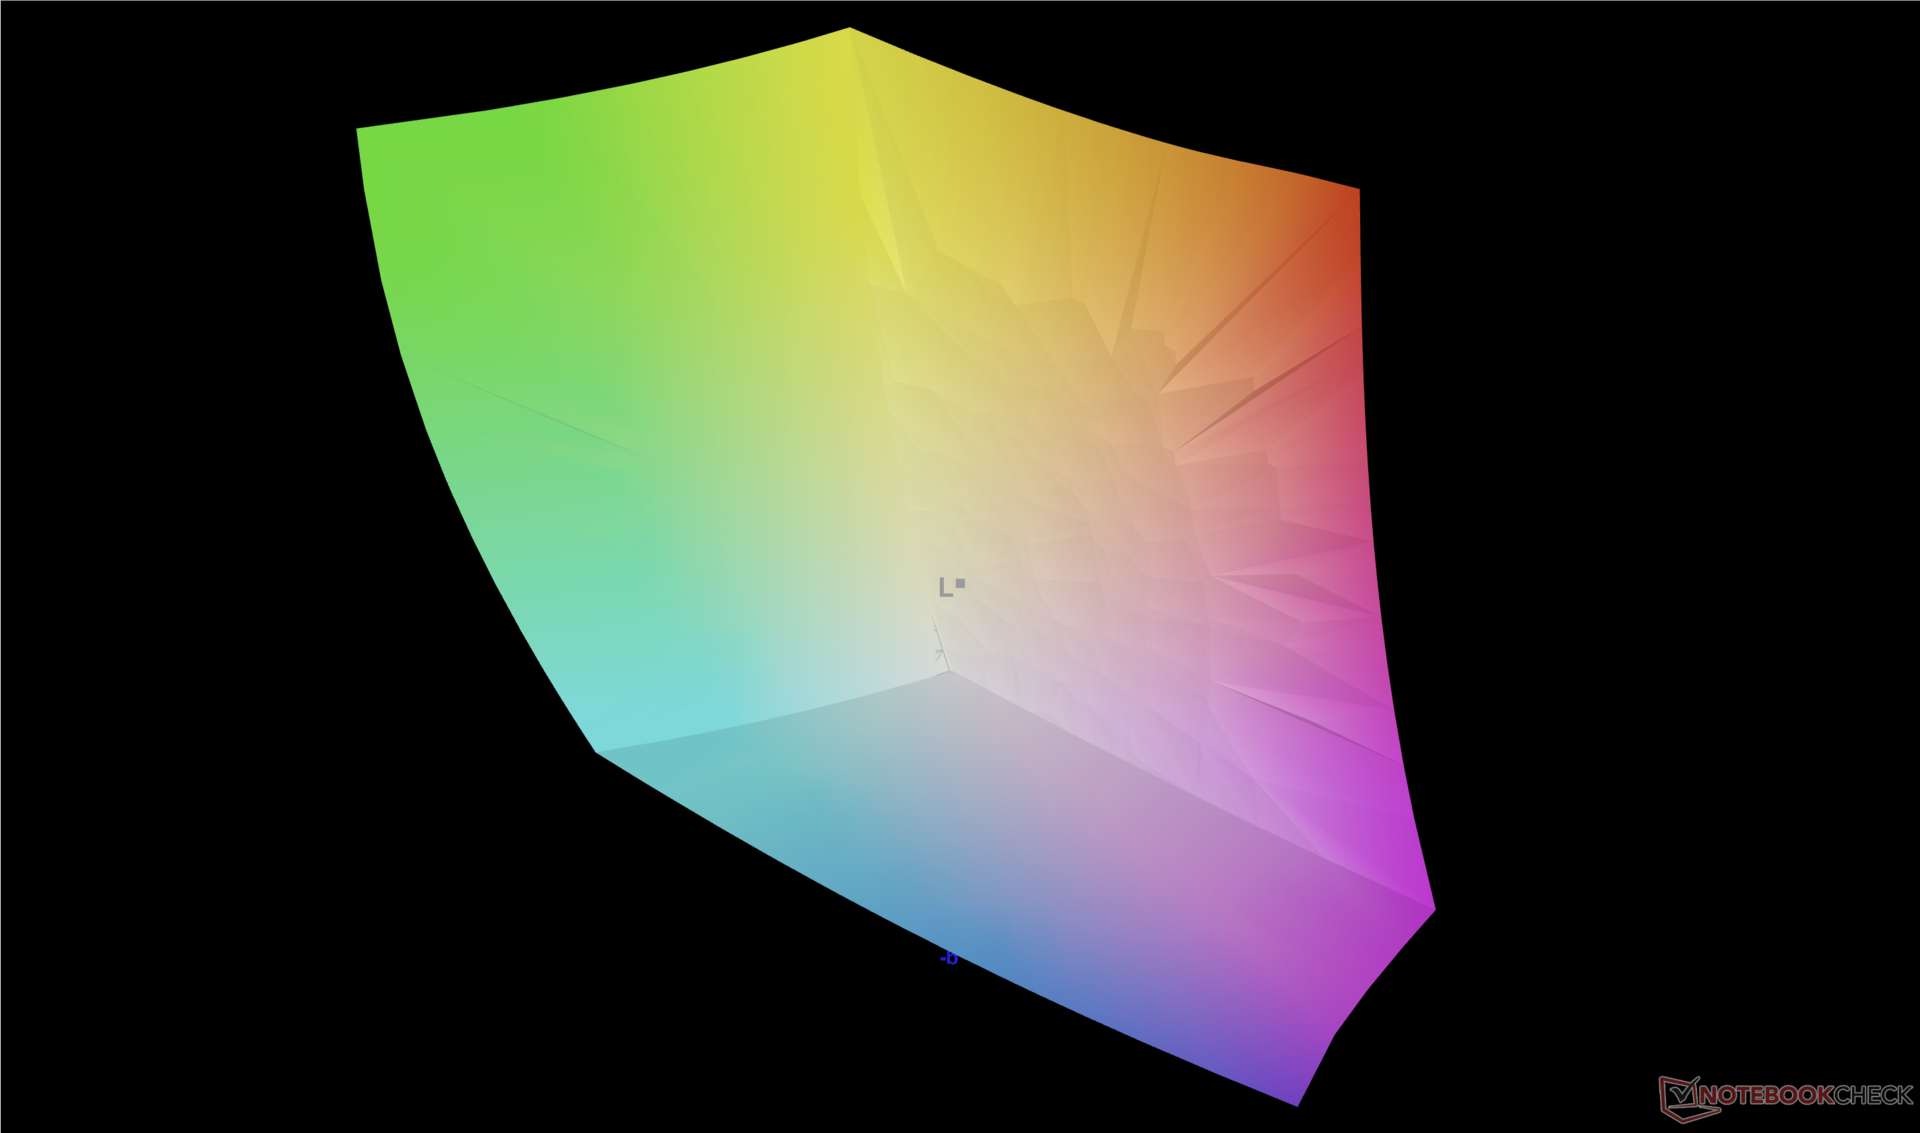
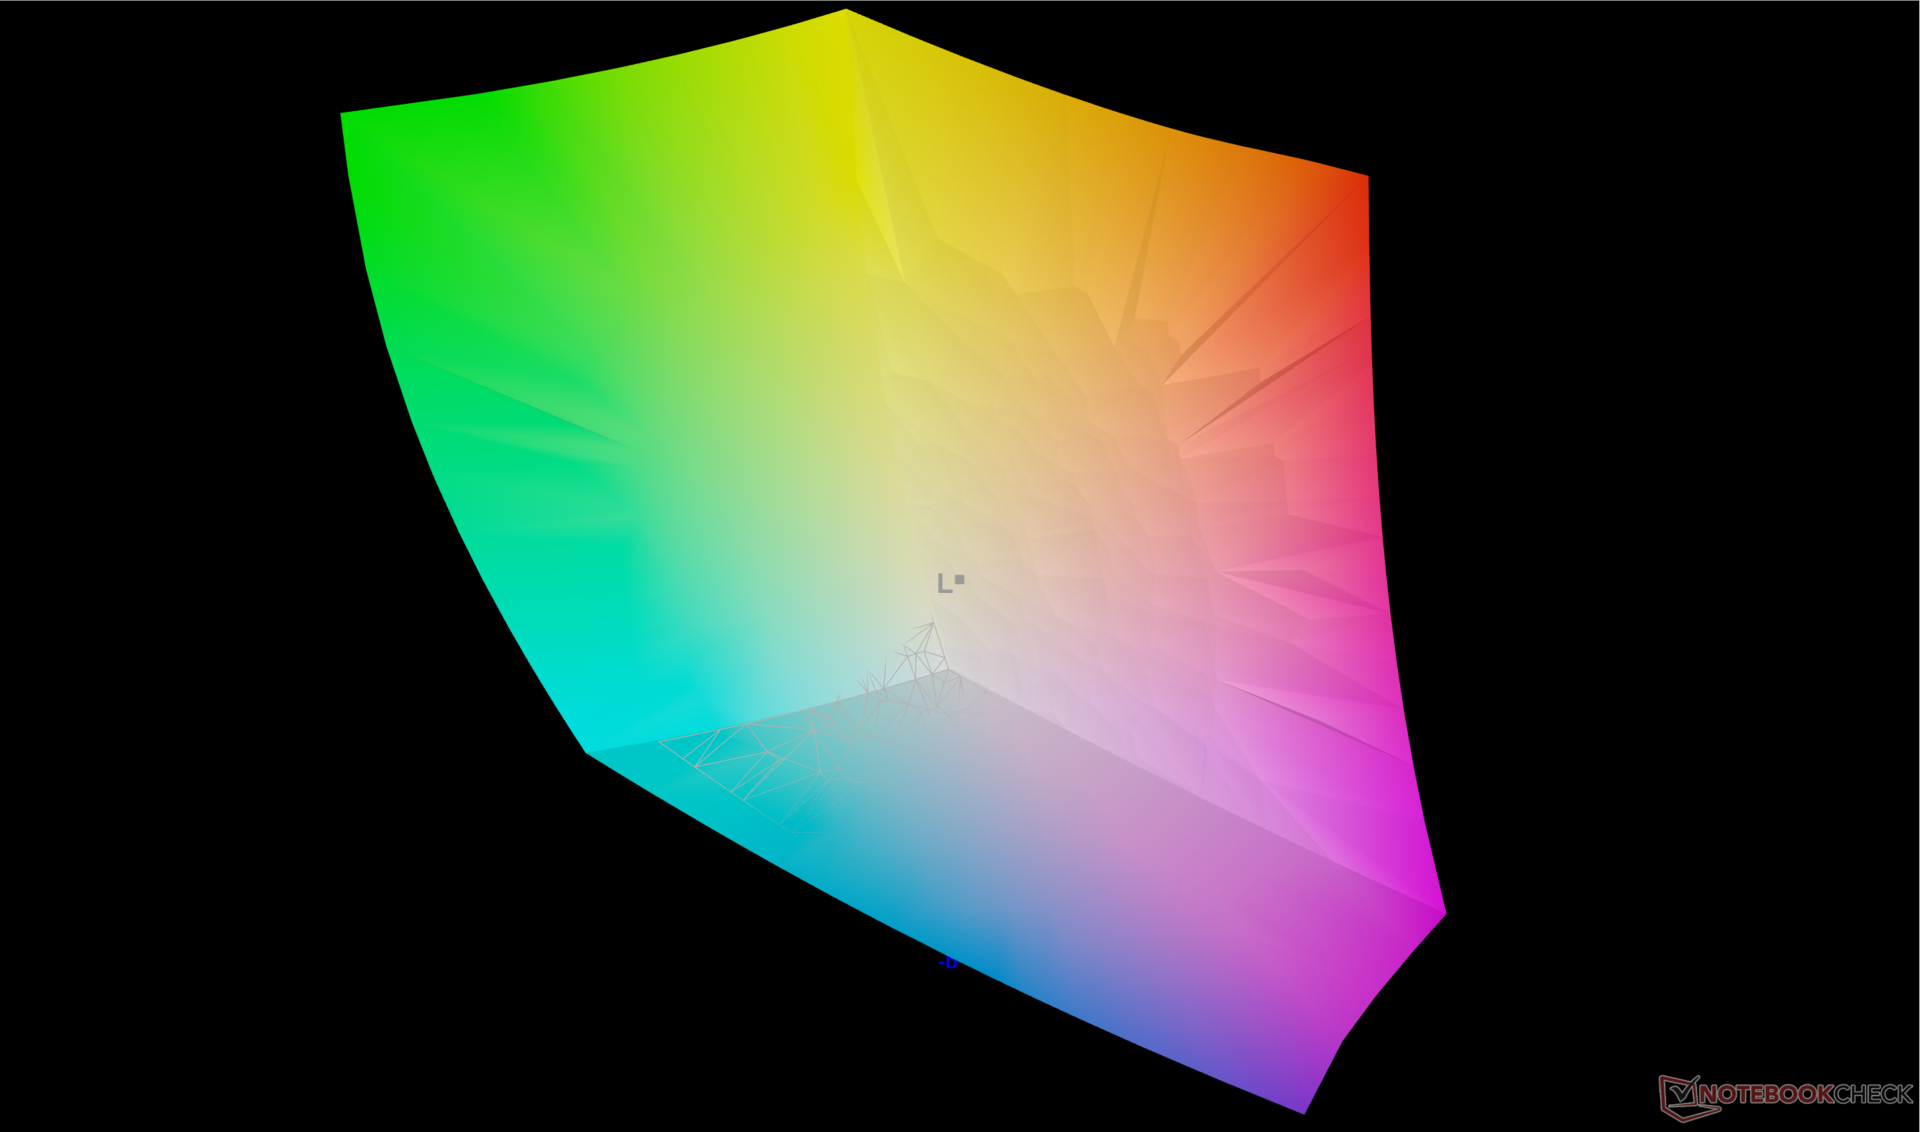
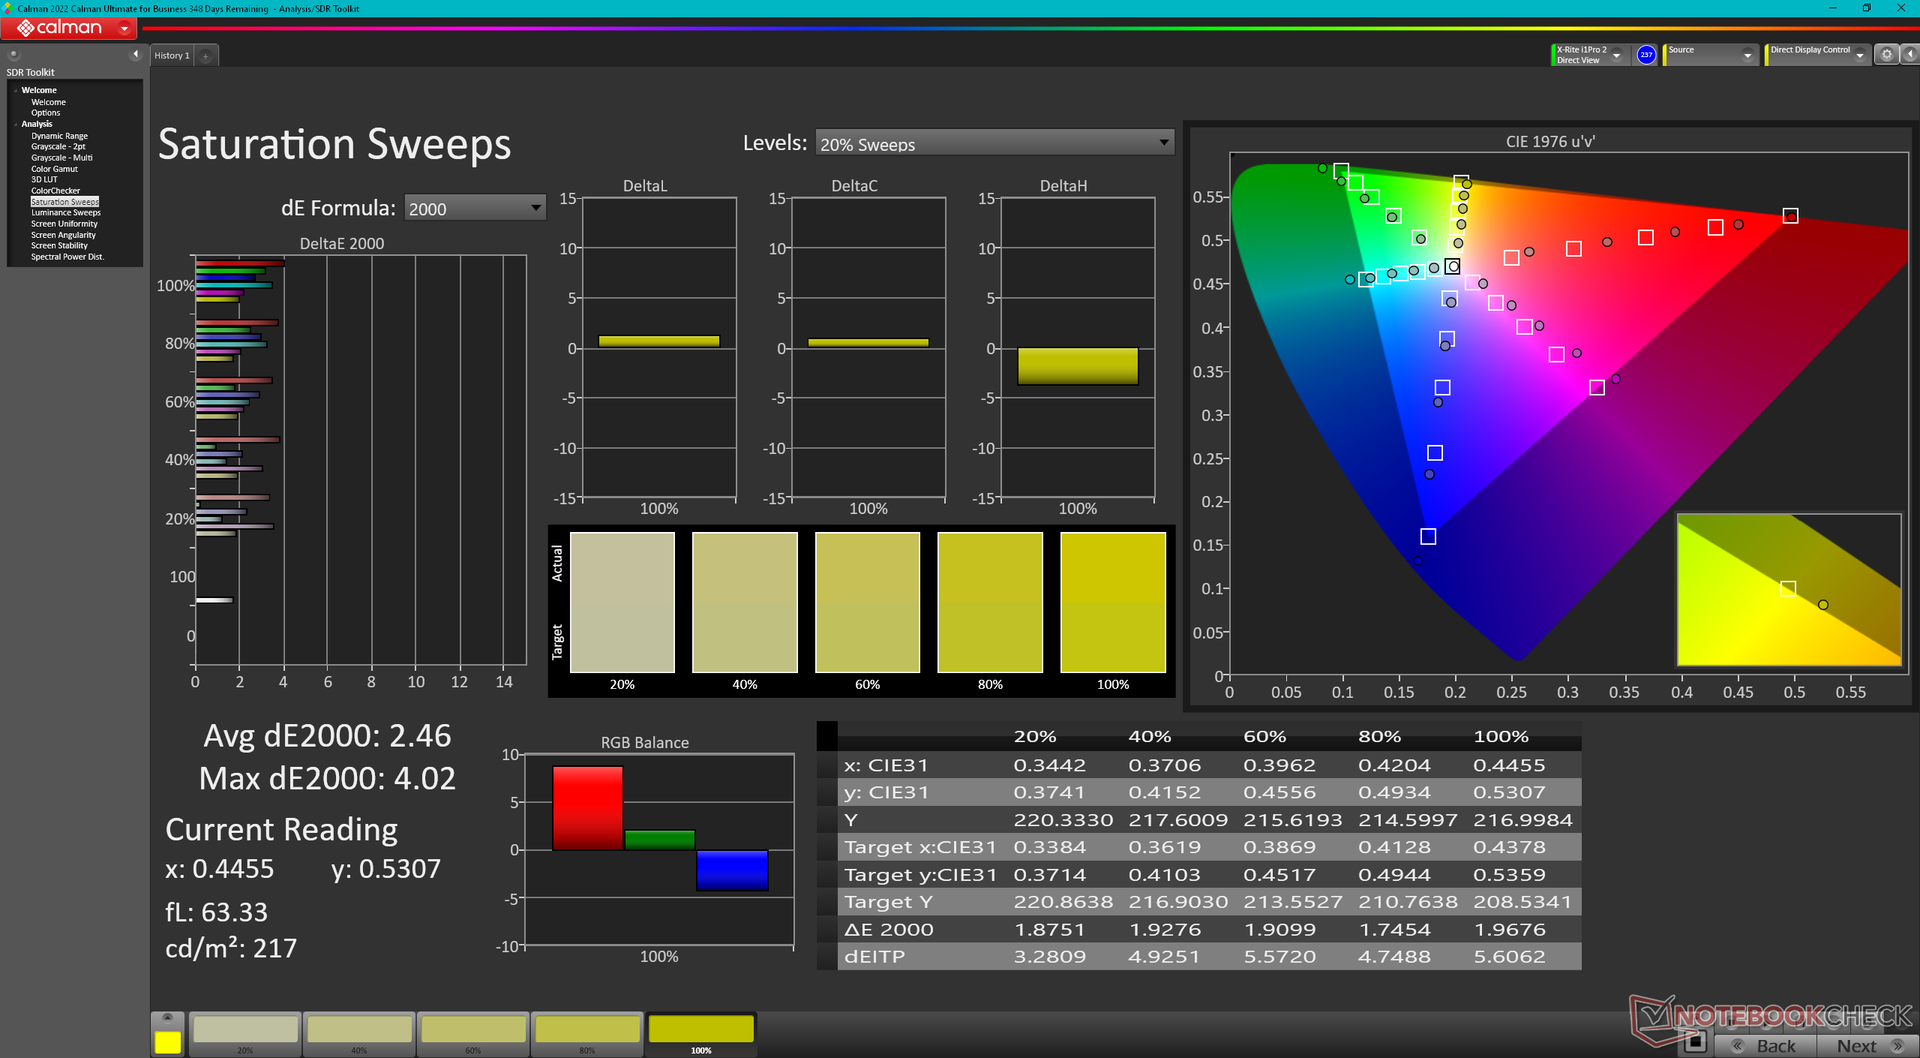
The Predator Triton 300 SE is one of the few OLED gaming laptops to offer both full DCI-P3 colors and a relatively fast 90 Hz refresh rate. Certain IPS alternatives can have even faster refresh rates such as the panel on the Blade 14, but they usually promise sRGB coverage only.
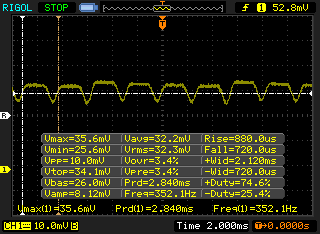
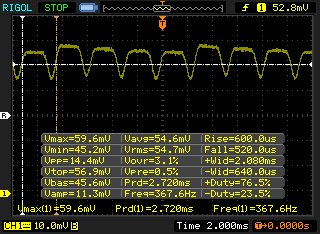
The lack of adaptive sync support is a noticeable drawback to the 14-inch Predator Triton 300 SE. Though ghosting may be almost nonexistent, the OLED panel definitely carries its own set of disadvantages when compared to IPS. A flickering frequency of about 352 Hz, for example, remains present at all brightness levels similar to what we've recorded on other 14-inch OLED laptops like the Asus VivoBook 14.
Acer offers a lower resolution 1200p IPS SKU with MUX support and a faster 165 Hz refresh rate. If full P3 color coverage is unimportant for your tasks, then the IPS alternative may be worth considering especially for gaming purposes.
| |||||||||||||||||||||||||
Brightness Distribution: 99 %
Center on Battery: 414.3 cd/m²
Contrast: ∞:1 (Black: 0 cd/m²)
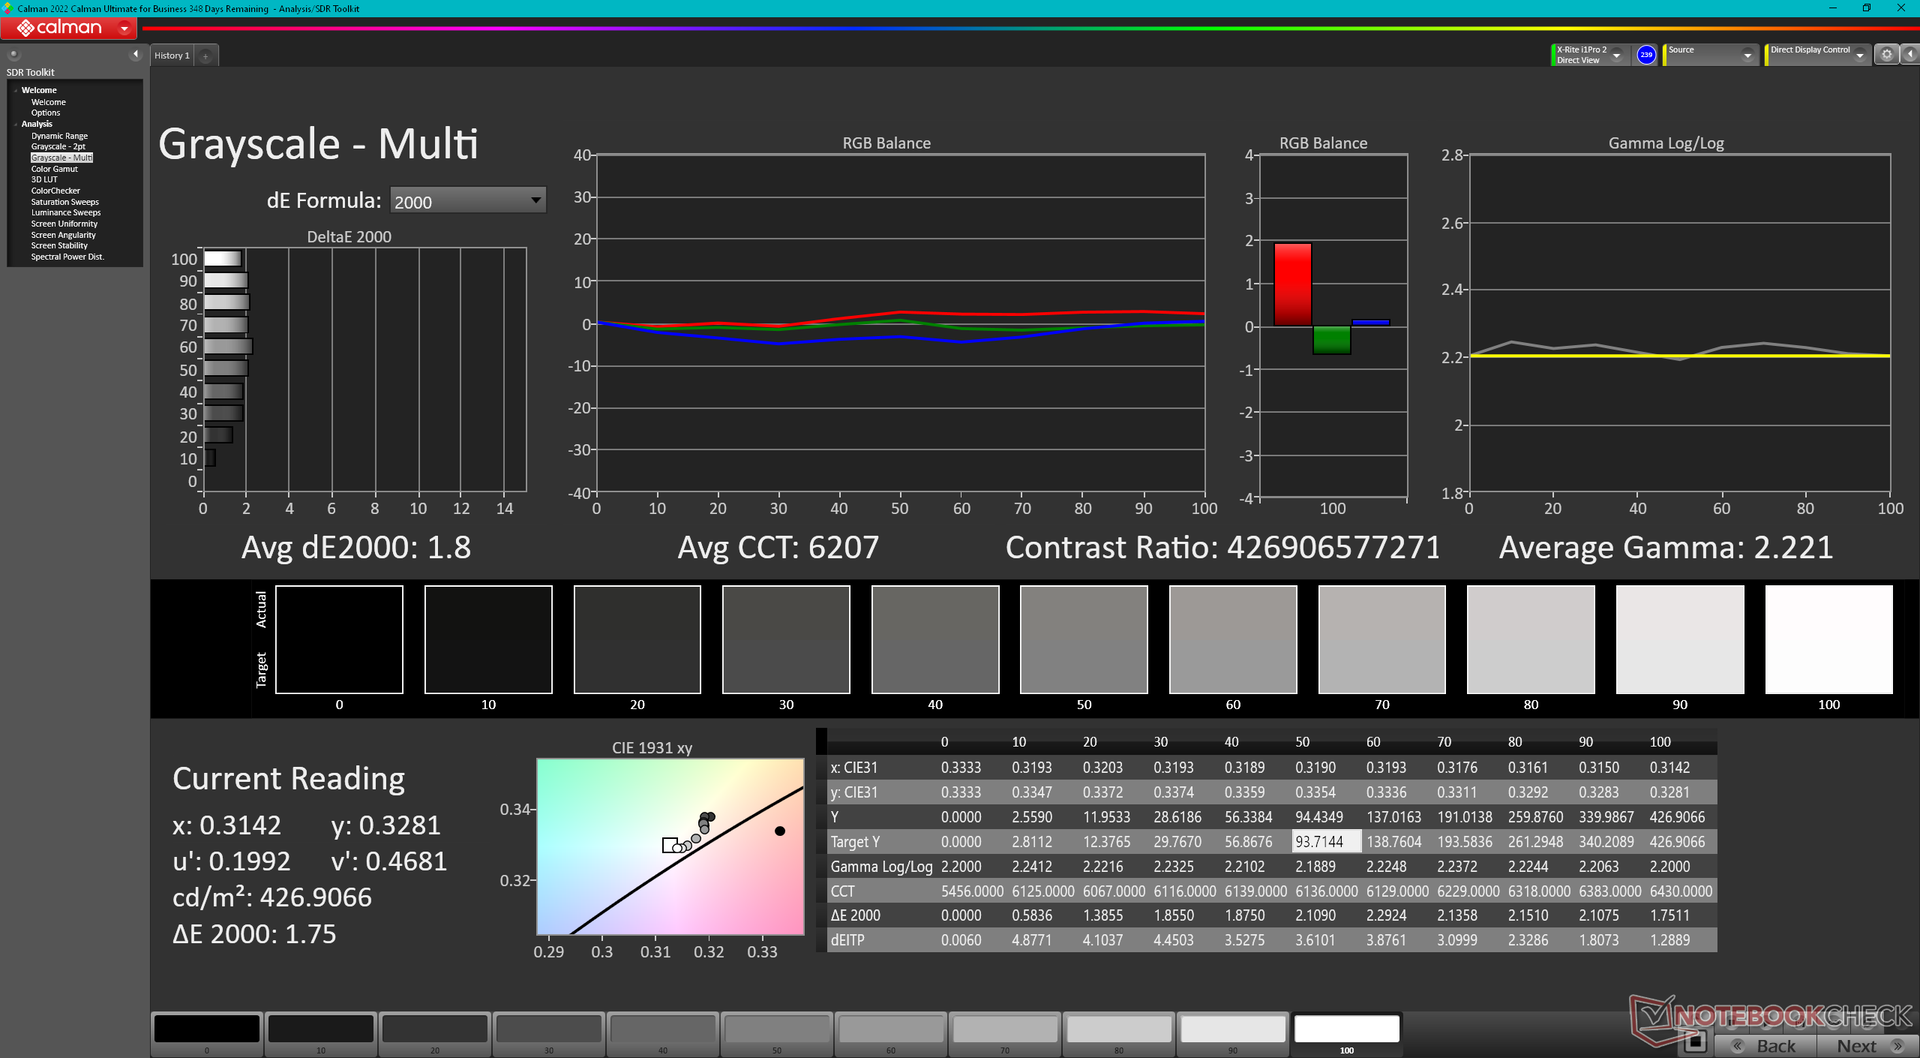
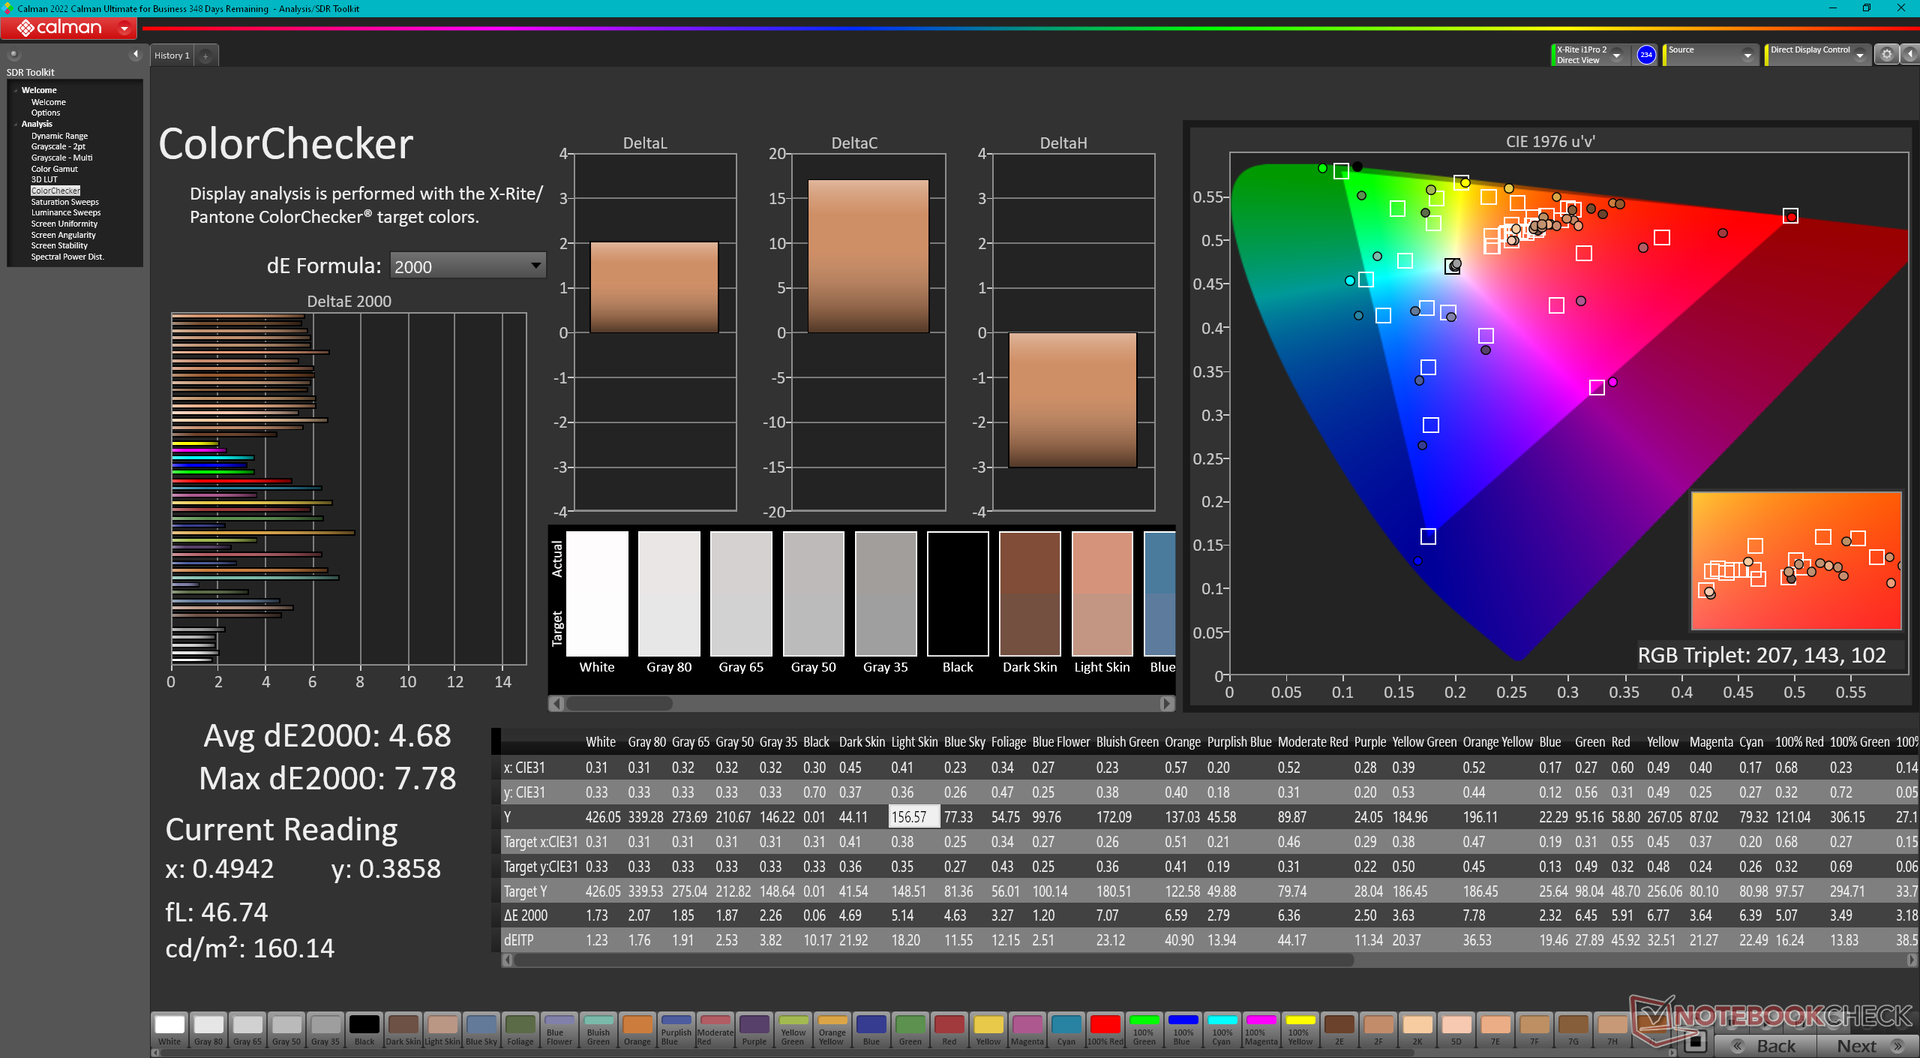
ΔE Color 4.68 | 0.5-29.43 Ø5
ΔE Greyscale 1.8 | 0.57-98 Ø5.3
99% AdobeRGB 1998 (Argyll 2.2.0 3D)
100% sRGB (Argyll 2.2.0 3D)
99.9% Display P3 (Argyll 2.2.0 3D)
Gamma: 2.22
| Acer Predator Triton 300 SE Samsung ATNA40YK07-0, OLED, 2880x1800, 14.00 | Asus ROG Zephyrus G14 GA402RJ BOEhydis NE140QDM-NX1, IPS, 2560x1600, 14.00 | Razer Blade 14 Ryzen 9 6900HX TL140BDXP02-0, IPS, 2560x1440, 14.00 | Alienware x14 i7 RTX 3060 SHP154D, IPS, 1920x1080, 14.00 | Dell Inspiron 14 Plus 7420 InfoVision 140NWHE, IPS, 2240x1400, 14.00 | SCHENKER Vision 14 MNE007ZA1, IPS, 2880x1800, 14.00 | |
|---|---|---|---|---|---|---|
| Display | -5% | -5% | -4% | -21% | -17% | |
| Display P3 Coverage | 99.9 | 97.6 -2% | 97.2 -3% | 99.6 0% | 68.8 -31% | 74.3 -26% |
| sRGB Coverage | 100 | 99.9 0% | 99.9 0% | 100 0% | 99.3 -1% | 97.6 -2% |
| AdobeRGB 1998 Coverage | 99 | 85.6 -14% | 85.7 -13% | 87.6 -12% | 69.5 -30% | 75.7 -24% |
| Response Times | 2058% | -1077% | -533% | -1944% | -2062% | |
| Response Time Grey 50% / Grey 80% * | 1.36 ? | 8.3 ? -510% | 16.8 ? -1135% | 9.6 ? -606% | 32.8 ? -2312% | 40.4 ? -2871% |
| Response Time Black / White * | 1.36 ? | 6 ? -341% | 15.2 ? -1018% | 7.6 ? -459% | 22.8 ? -1576% | 18.4 ? -1253% |
| PWM Frequency | 367.6 ? | 26191 ? 7025% | ||||
| Screen | 5% | 13% | -24% | -12% | 5% | |
| Brightness middle | 414.3 | 500 21% | 354 -15% | 434 5% | 331.1 -20% | 407 -2% |
| Brightness | 416 | 470 13% | 328 -21% | 411 -1% | 326 -22% | 407 -2% |
| Brightness Distribution | 99 | 85 -14% | 86 -13% | 89 -10% | 85 -14% | 94 -5% |
| Black Level * | 0.42 | 0.37 | 0.25 | 0.29 | 0.25 | |
| Colorchecker dE 2000 * | 4.68 | 2.45 48% | 1.66 65% | 3 36% | 2.23 52% | 2.6 44% |
| Colorchecker dE 2000 max. * | 7.78 | 5.34 31% | 3.83 51% | 7.1 9% | 5.44 30% | 4.4 43% |
| Greyscale dE 2000 * | 1.8 | 3.1 -72% | 1.6 11% | 5.1 -183% | 3.6 -100% | 2.7 -50% |
| Gamma | 2.22 99% | 2.213 99% | 2.23 99% | 2.19 100% | 2.21 100% | 2.18 101% |
| CCT | 6207 105% | 7251 90% | 6542 99% | 6204 105% | 6022 108% | 6316 103% |
| Contrast | 1190 | 957 | 1736 | 1142 | 1628 | |
| Colorchecker dE 2000 calibrated * | 1.2 | 0.7 | 0.63 | 2 | ||
| Total Average (Program / Settings) | 686% /
515% | -356% /
-190% | -187% /
-111% | -659% /
-366% | -691% /
-377% |
* ... smaller is better
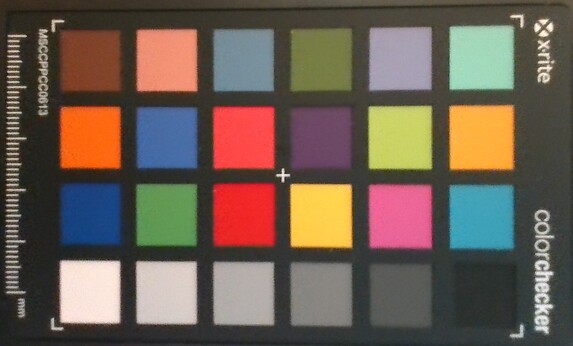
The panel is decently calibrated out the box against the P3 standard with average grayscale and color deltaE values of only 1.8 and 4.68, respectively.
Display Response Times
| ↔ Response Time Black to White | ||
|---|---|---|
| 1.36 ms ... rise ↗ and fall ↘ combined | ↗ 0.52 ms rise | 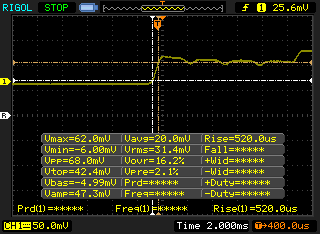 |
| ↘ 0.84 ms fall | ||
| The screen shows very fast response rates in our tests and should be very well suited for fast-paced gaming. In comparison, all tested devices range from 0.1 (minimum) to 240 (maximum) ms. » 4 % of all devices are better. This means that the measured response time is better than the average of all tested devices (21.5 ms). | ||
| ↔ Response Time 50% Grey to 80% Grey | ||
| 1.36 ms ... rise ↗ and fall ↘ combined | ↗ 0.68 ms rise |  |
| ↘ 0.68 ms fall | ||
| The screen shows very fast response rates in our tests and should be very well suited for fast-paced gaming. In comparison, all tested devices range from 0.2 (minimum) to 636 (maximum) ms. » 3 % of all devices are better. This means that the measured response time is better than the average of all tested devices (33.7 ms). | ||
Screen Flickering / PWM (Pulse-Width Modulation)
| Screen flickering / PWM detected | 367.6 Hz | ≤ 100 % brightness setting |  |
The display backlight flickers at 367.6 Hz (worst case, e.g., utilizing PWM) Flickering detected at a brightness setting of 100 % and below. There should be no flickering or PWM above this brightness setting. The frequency of 367.6 Hz is relatively high, so most users sensitive to PWM should not notice any flickering. However, there are reports that some users are still sensitive to PWM at 500 Hz and above, so be aware. In comparison: 53 % of all tested devices do not use PWM to dim the display. If PWM was detected, an average of 17900 (minimum: 5 - maximum: 3846000) Hz was measured. | |||
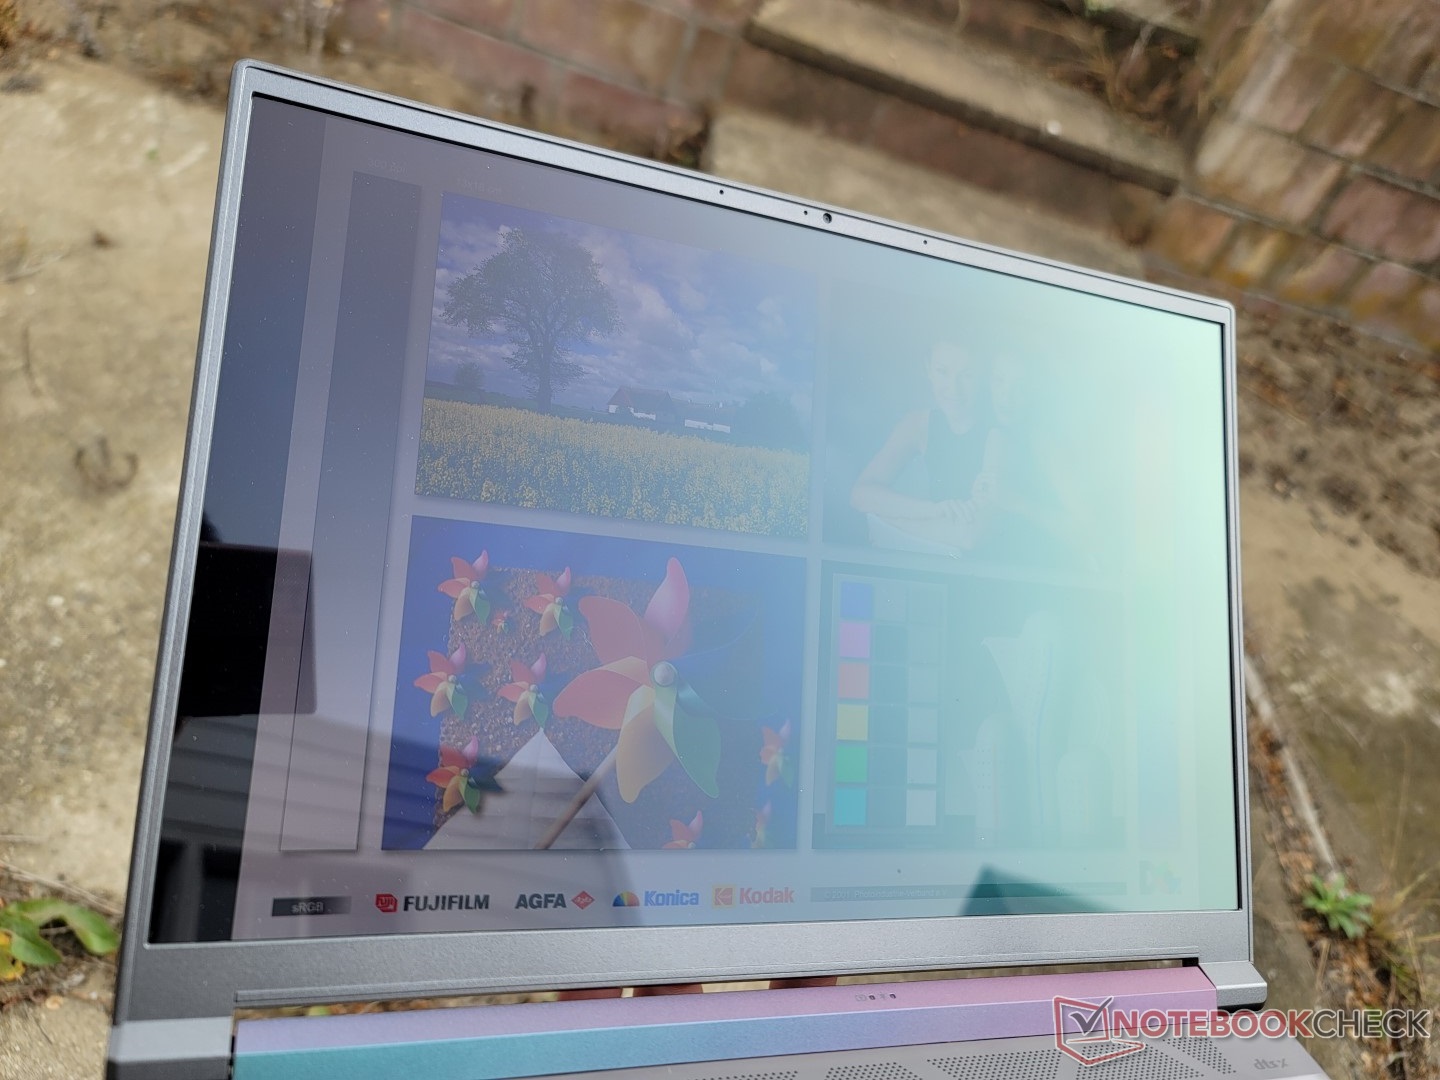
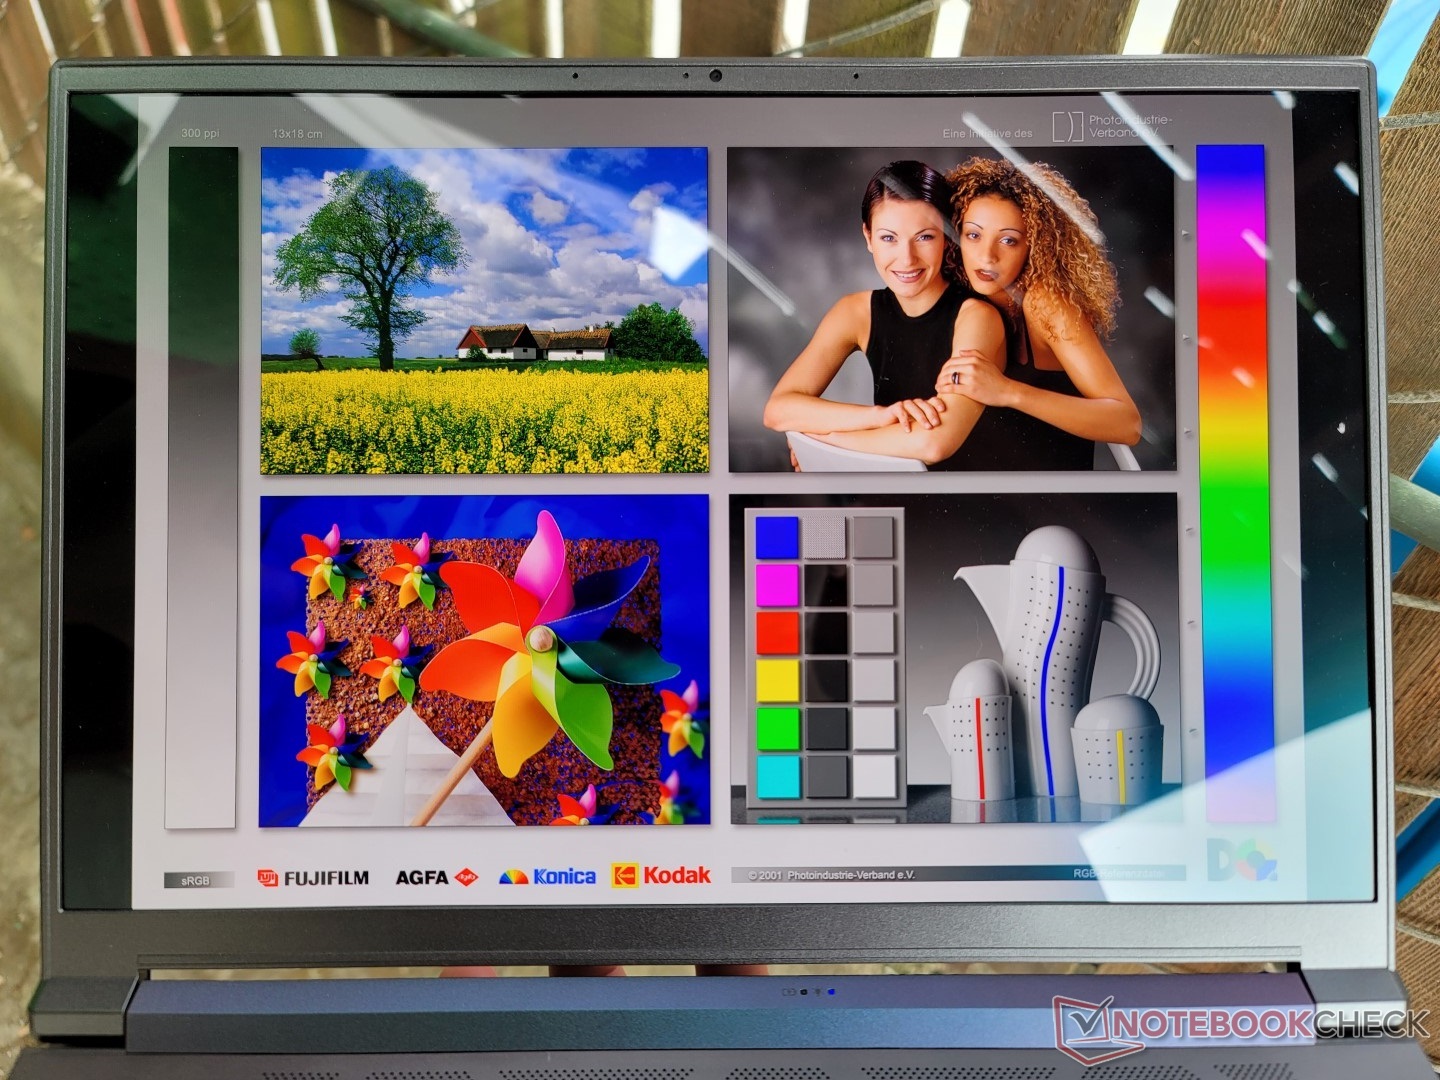
Outdoor visibility is decent if under shade due to the deep black levels and colors of the glossy OLED panel. Nonetheless, glare is still inevitable in most conditions. The matte display on the Zephyrus G14 is about 100 nits brighter for slightly easier readability.
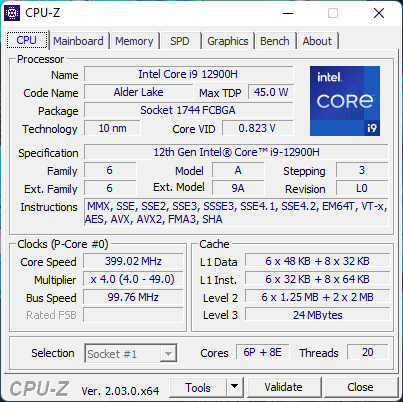
Performance — 12th Gen Core i9
Testing Conditions
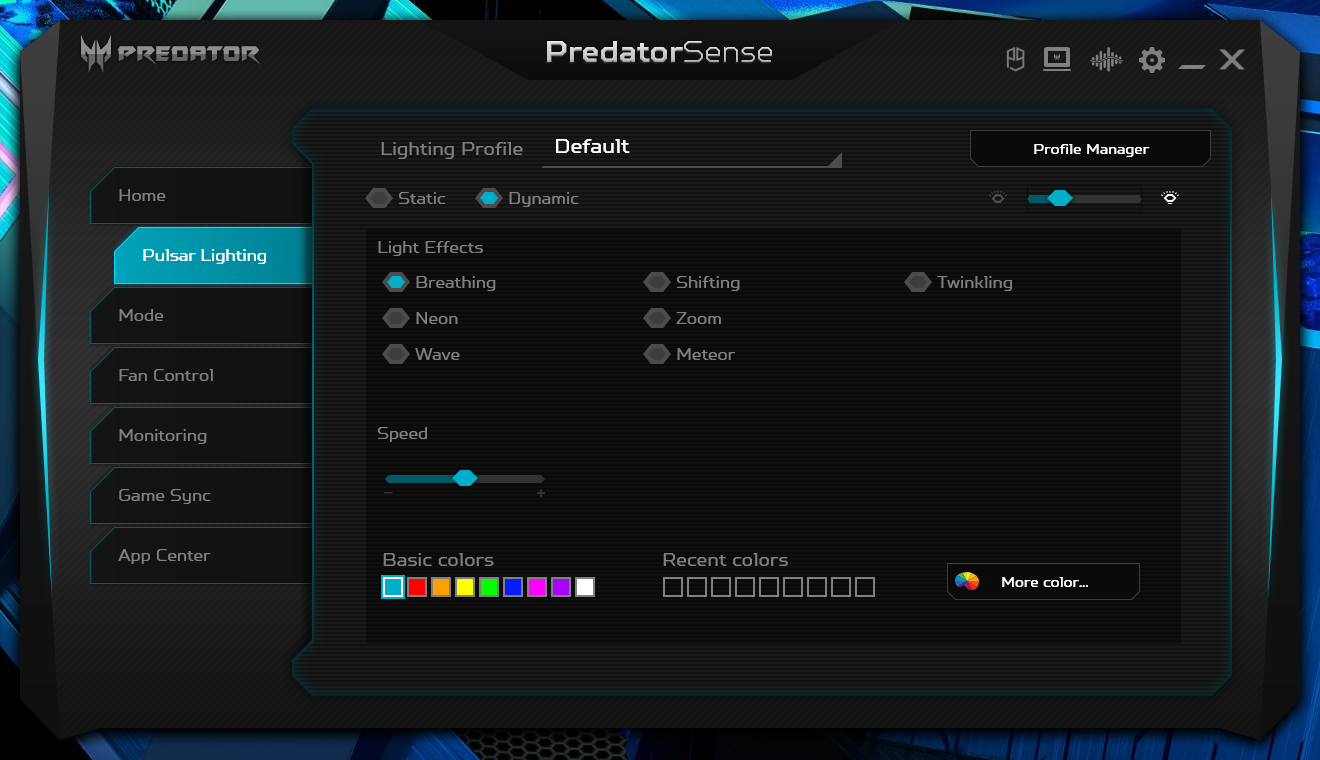
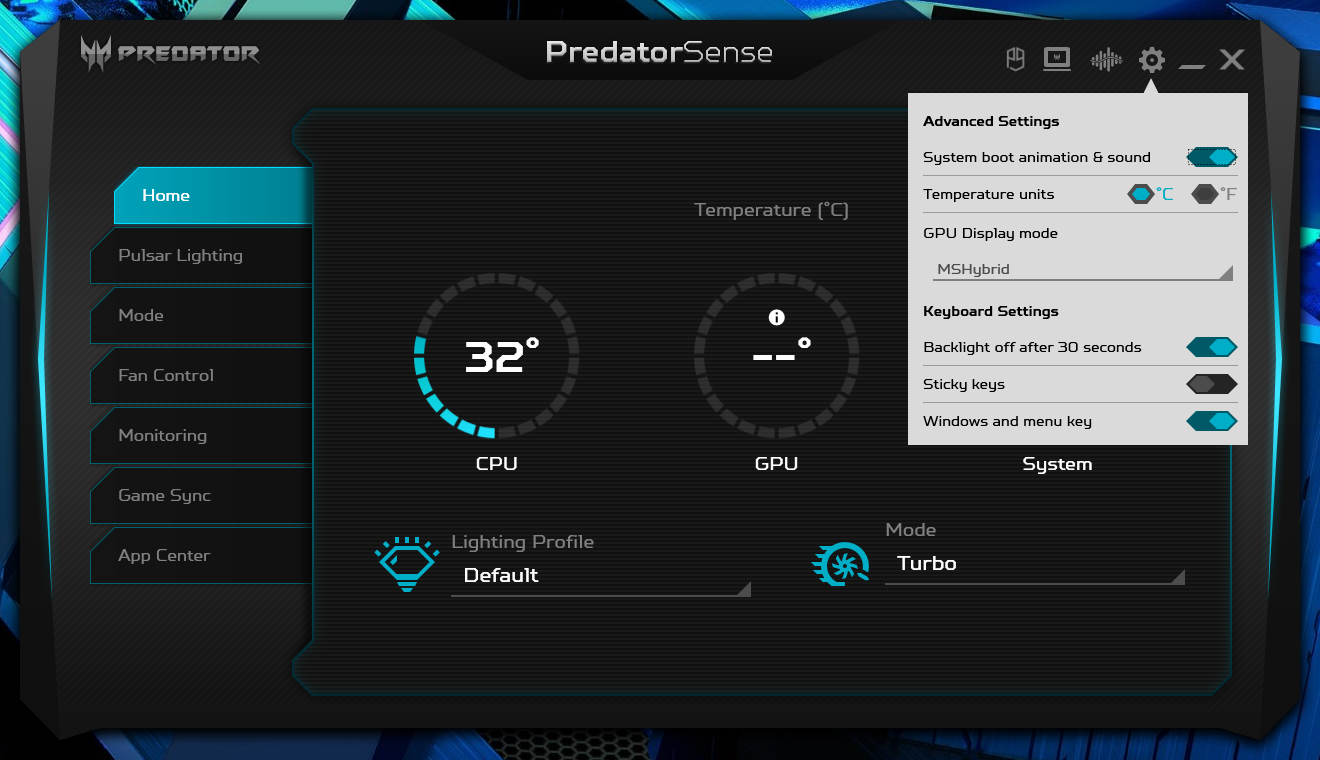
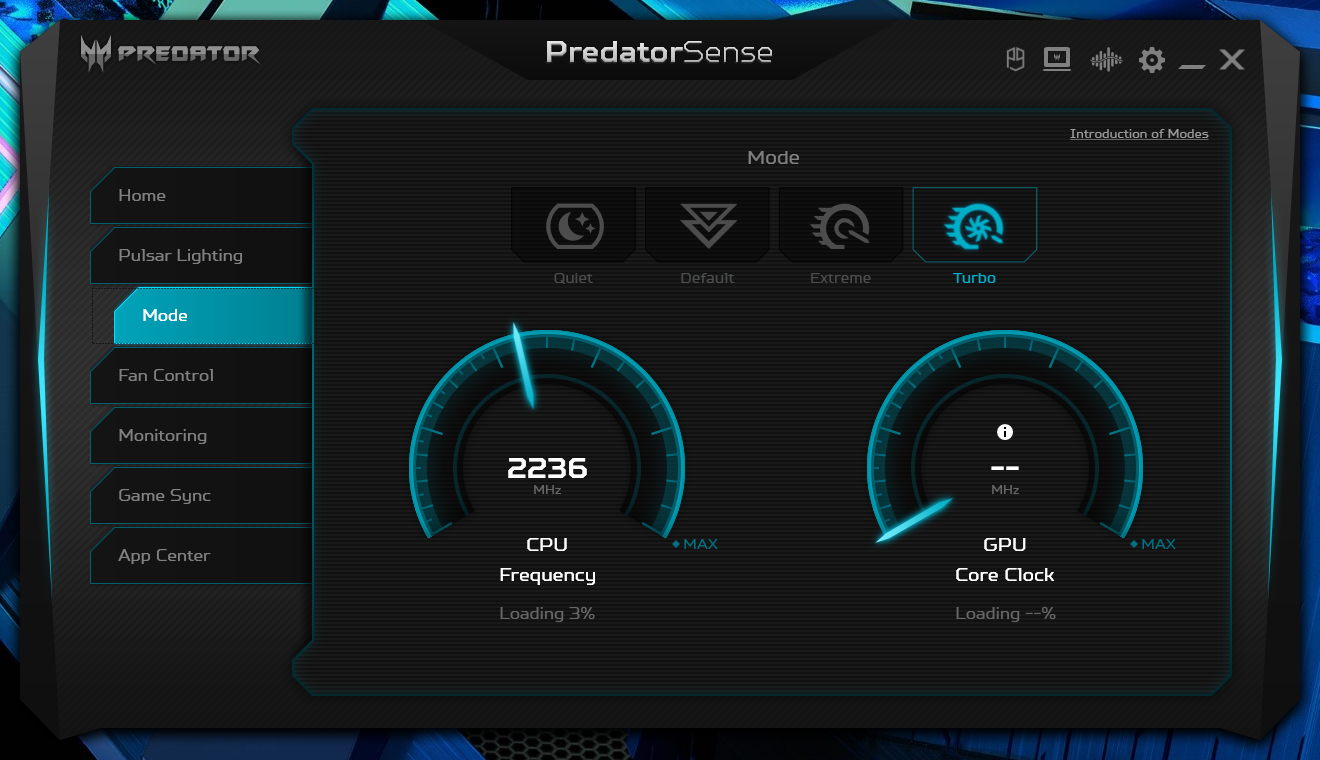
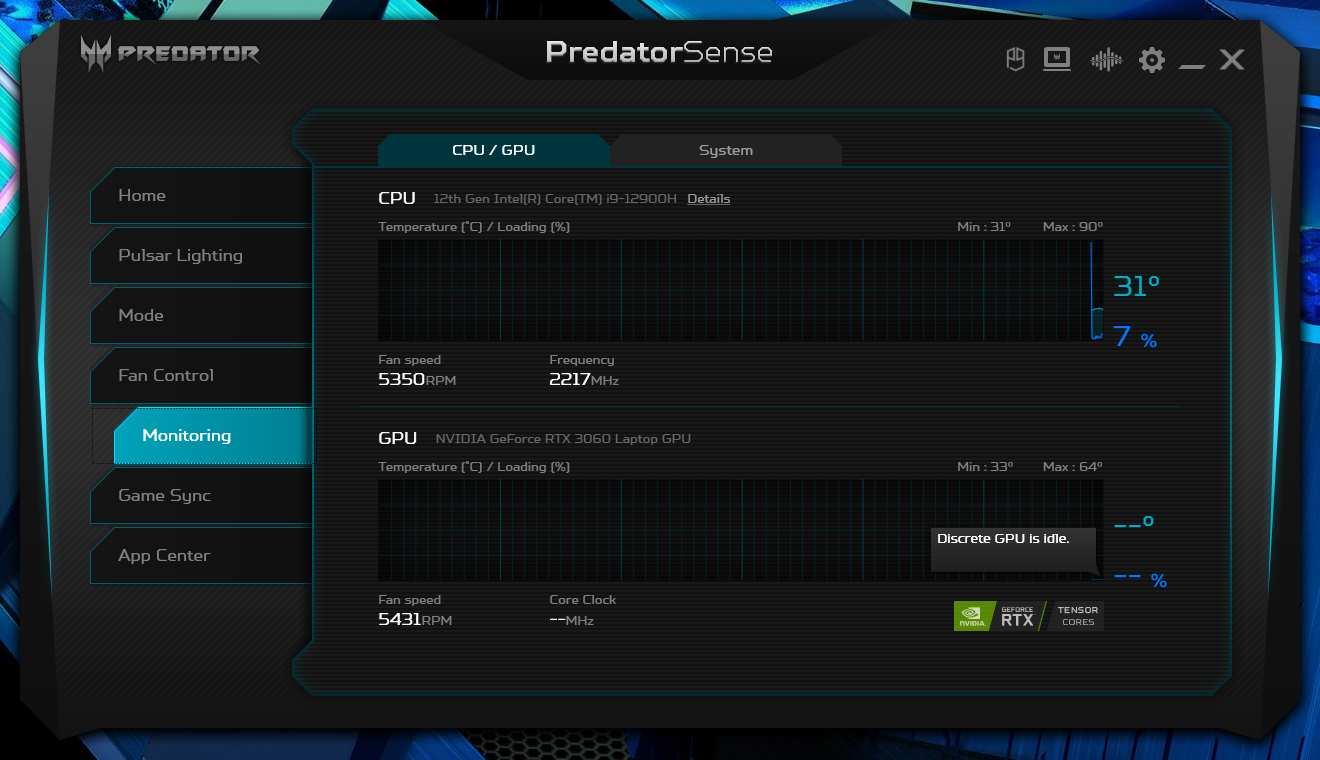
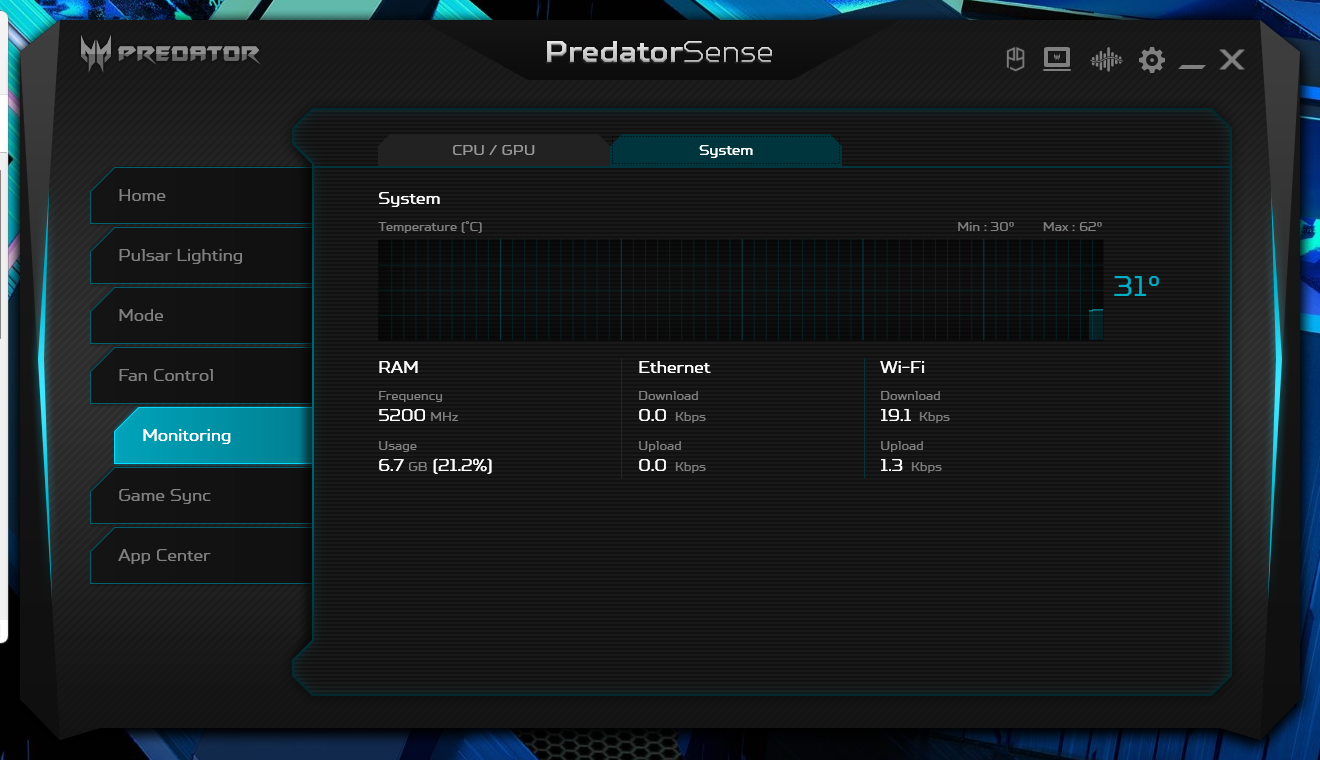
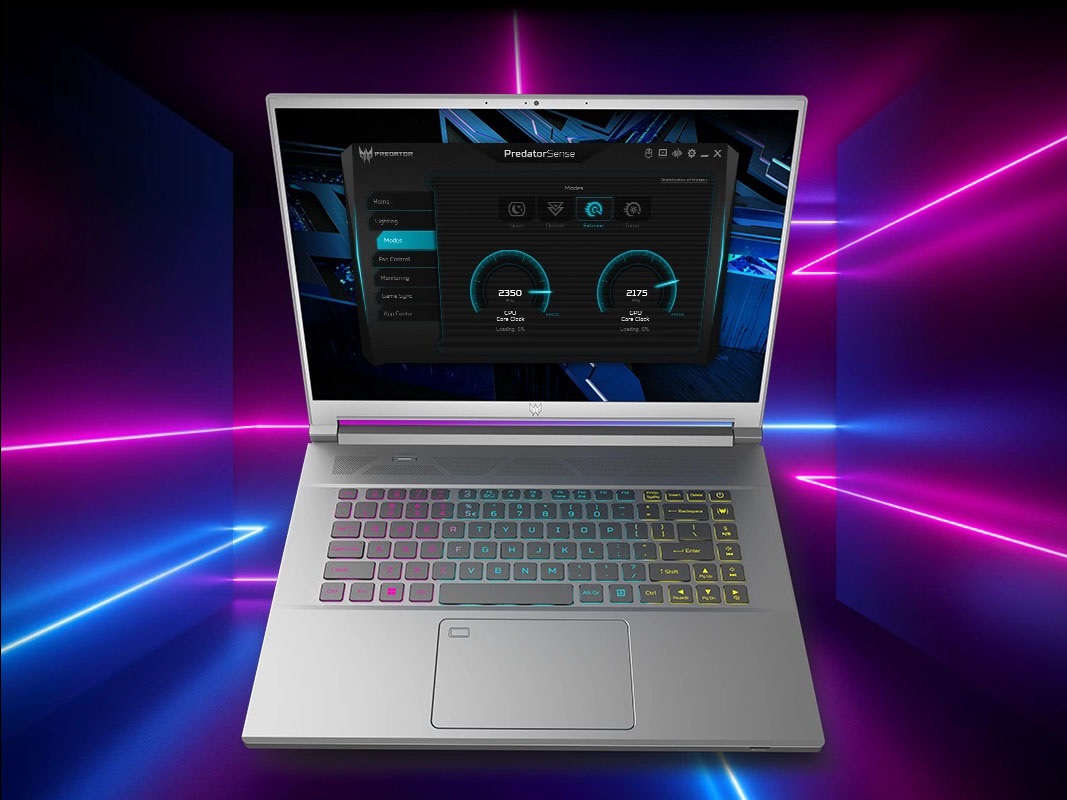
We set our unit to 'Best performance' mode via Windows and 'Turbo' mode via the pre-installed PredatorSense software prior to running any benchmarks below. It is recommended that owners become familiar with PredatorSense as it is the main control hub for adjusting the keyboard backlight, fans, boot settings, and more as shown by the screenshots below.
Unfortunately, MUX is only available on the non-OLED SKUs as confirmed by Acer. Attempting to switch out of MSHybrid mode via PredatorSense would crash our unit.
Processor
CPU performance is one of the fastest of any 14-inch gaming laptop. For anything significantly faster, you would have to consider larger models like the MSI GE77 with the Core i9-12900HX. Even so, the Core i9-12900H in our 14-inch Acer is unable to sustain very high Turbo Boost clock rates for extended periods as our Stress Test section below will show.
Downgrading to the Core i7-12700H SKU may only entail a performance deficit of just 1 to 2 percent based on our time with the Alienware x14. Potential buyers may be able to save a few hundred dollars this way and receive essentially the same processor performance as the more expensive Core i9-12900H.
Cinebench R15 Multi Loop
Cinebench R23: Multi Core | Single Core
Cinebench R15: CPU Multi 64Bit | CPU Single 64Bit
Blender: v2.79 BMW27 CPU
7-Zip 18.03: 7z b 4 | 7z b 4 -mmt1
Geekbench 5.5: Multi-Core | Single-Core
HWBOT x265 Benchmark v2.2: 4k Preset
LibreOffice : 20 Documents To PDF
R Benchmark 2.5: Overall mean
| Cinebench R20 / CPU (Multi Core) | |
| MSI Raider GE77 HX 12UHS | |
| Acer Predator Triton 300 SE | |
| Alienware x14 i7 RTX 3060 | |
| Average Intel Core i9-12900H (2681 - 7471, n=25) | |
| Lenovo IdeaPad Gaming 3 15IAH7 | |
| Razer Blade 14 Ryzen 9 6900HX | |
| Acer Nitro 5 AN515-46-R1A1 | |
| Razer Blade 14 Ryzen 9 RTX 3070 | |
| Asus ROG Zephyrus G14 GA402RJ | |
| Asus ZenBook 14X UM5401QA-KN162 | |
| Lenovo Legion 5 Pro 16 ARH7H-82RG0047GE | |
| SCHENKER Vision 14 | |
| Cinebench R20 / CPU (Single Core) | |
| MSI Raider GE77 HX 12UHS | |
| Acer Predator Triton 300 SE | |
| Average Intel Core i9-12900H (624 - 738, n=25) | |
| Alienware x14 i7 RTX 3060 | |
| Lenovo IdeaPad Gaming 3 15IAH7 | |
| Acer Nitro 5 AN515-46-R1A1 | |
| Razer Blade 14 Ryzen 9 6900HX | |
| SCHENKER Vision 14 | |
| Lenovo Legion 5 Pro 16 ARH7H-82RG0047GE | |
| Asus ROG Zephyrus G14 GA402RJ | |
| Asus ZenBook 14X UM5401QA-KN162 | |
| Razer Blade 14 Ryzen 9 RTX 3070 | |
| Cinebench R23 / Multi Core | |
| MSI Raider GE77 HX 12UHS | |
| Acer Predator Triton 300 SE | |
| Alienware x14 i7 RTX 3060 | |
| Average Intel Core i9-12900H (7359 - 19648, n=25) | |
| Lenovo IdeaPad Gaming 3 15IAH7 | |
| Razer Blade 14 Ryzen 9 6900HX | |
| Acer Nitro 5 AN515-46-R1A1 | |
| Razer Blade 14 Ryzen 9 RTX 3070 | |
| Asus ROG Zephyrus G14 GA402RJ | |
| Asus ZenBook 14X UM5401QA-KN162 | |
| Lenovo Legion 5 Pro 16 ARH7H-82RG0047GE | |
| SCHENKER Vision 14 | |
| Cinebench R23 / Single Core | |
| Acer Predator Triton 300 SE | |
| MSI Raider GE77 HX 12UHS | |
| Average Intel Core i9-12900H (1634 - 1921, n=25) | |
| Alienware x14 i7 RTX 3060 | |
| Lenovo IdeaPad Gaming 3 15IAH7 | |
| Acer Nitro 5 AN515-46-R1A1 | |
| Razer Blade 14 Ryzen 9 6900HX | |
| SCHENKER Vision 14 | |
| Lenovo Legion 5 Pro 16 ARH7H-82RG0047GE | |
| Asus ROG Zephyrus G14 GA402RJ | |
| Asus ZenBook 14X UM5401QA-KN162 | |
| Razer Blade 14 Ryzen 9 RTX 3070 | |
| Cinebench R15 / CPU Multi 64Bit | |
| MSI Raider GE77 HX 12UHS | |
| Alienware x14 i7 RTX 3060 | |
| Average Intel Core i9-12900H (1395 - 3077, n=25) | |
| Acer Predator Triton 300 SE | |
| Razer Blade 14 Ryzen 9 6900HX | |
| Lenovo IdeaPad Gaming 3 15IAH7 | |
| Acer Nitro 5 AN515-46-R1A1 | |
| Razer Blade 14 Ryzen 9 RTX 3070 | |
| Asus ROG Zephyrus G14 GA402RJ | |
| Asus ZenBook 14X UM5401QA-KN162 | |
| Lenovo Legion 5 Pro 16 ARH7H-82RG0047GE | |
| SCHENKER Vision 14 | |
| SCHENKER Vision 14 | |
| Cinebench R15 / CPU Single 64Bit | |
| MSI Raider GE77 HX 12UHS | |
| Acer Predator Triton 300 SE | |
| Average Intel Core i9-12900H (235 - 277, n=26) | |
| Alienware x14 i7 RTX 3060 | |
| Acer Nitro 5 AN515-46-R1A1 | |
| Lenovo IdeaPad Gaming 3 15IAH7 | |
| Razer Blade 14 Ryzen 9 6900HX | |
| Lenovo Legion 5 Pro 16 ARH7H-82RG0047GE | |
| Asus ROG Zephyrus G14 GA402RJ | |
| SCHENKER Vision 14 | |
| Asus ZenBook 14X UM5401QA-KN162 | |
| Razer Blade 14 Ryzen 9 RTX 3070 | |
| Blender / v2.79 BMW27 CPU | |
| SCHENKER Vision 14 | |
| Lenovo Legion 5 Pro 16 ARH7H-82RG0047GE | |
| Asus ZenBook 14X UM5401QA-KN162 | |
| Asus ROG Zephyrus G14 GA402RJ | |
| Razer Blade 14 Ryzen 9 RTX 3070 | |
| Acer Nitro 5 AN515-46-R1A1 | |
| Average Intel Core i9-12900H (160 - 451, n=25) | |
| Alienware x14 i7 RTX 3060 | |
| Lenovo IdeaPad Gaming 3 15IAH7 | |
| Razer Blade 14 Ryzen 9 6900HX | |
| Acer Predator Triton 300 SE | |
| MSI Raider GE77 HX 12UHS | |
| 7-Zip 18.03 / 7z b 4 | |
| MSI Raider GE77 HX 12UHS | |
| Alienware x14 i7 RTX 3060 | |
| Acer Predator Triton 300 SE | |
| Razer Blade 14 Ryzen 9 6900HX | |
| Average Intel Core i9-12900H (34684 - 76677, n=25) | |
| Acer Nitro 5 AN515-46-R1A1 | |
| Asus ROG Zephyrus G14 GA402RJ | |
| Asus ZenBook 14X UM5401QA-KN162 | |
| Razer Blade 14 Ryzen 9 RTX 3070 | |
| Lenovo Legion 5 Pro 16 ARH7H-82RG0047GE | |
| Lenovo IdeaPad Gaming 3 15IAH7 | |
| SCHENKER Vision 14 | |
| 7-Zip 18.03 / 7z b 4 -mmt1 | |
| MSI Raider GE77 HX 12UHS | |
| Razer Blade 14 Ryzen 9 6900HX | |
| Average Intel Core i9-12900H (5302 - 6289, n=25) | |
| Acer Nitro 5 AN515-46-R1A1 | |
| Alienware x14 i7 RTX 3060 | |
| Acer Predator Triton 300 SE | |
| Lenovo Legion 5 Pro 16 ARH7H-82RG0047GE | |
| SCHENKER Vision 14 | |
| Asus ROG Zephyrus G14 GA402RJ | |
| Lenovo IdeaPad Gaming 3 15IAH7 | |
| Asus ZenBook 14X UM5401QA-KN162 | |
| Razer Blade 14 Ryzen 9 RTX 3070 | |
| Geekbench 5.5 / Multi-Core | |
| MSI Raider GE77 HX 12UHS | |
| Alienware x14 i7 RTX 3060 | |
| Acer Predator Triton 300 SE | |
| Average Intel Core i9-12900H (8519 - 14376, n=26) | |
| Razer Blade 14 Ryzen 9 6900HX | |
| Acer Nitro 5 AN515-46-R1A1 | |
| Asus ROG Zephyrus G14 GA402RJ | |
| Asus ZenBook 14X UM5401QA-KN162 | |
| Lenovo IdeaPad Gaming 3 15IAH7 | |
| Lenovo Legion 5 Pro 16 ARH7H-82RG0047GE | |
| SCHENKER Vision 14 | |
| Geekbench 5.5 / Single-Core | |
| MSI Raider GE77 HX 12UHS | |
| Acer Predator Triton 300 SE | |
| Average Intel Core i9-12900H (1631 - 1892, n=26) | |
| Alienware x14 i7 RTX 3060 | |
| Lenovo IdeaPad Gaming 3 15IAH7 | |
| SCHENKER Vision 14 | |
| Razer Blade 14 Ryzen 9 6900HX | |
| Acer Nitro 5 AN515-46-R1A1 | |
| Asus ROG Zephyrus G14 GA402RJ | |
| Lenovo Legion 5 Pro 16 ARH7H-82RG0047GE | |
| Asus ZenBook 14X UM5401QA-KN162 | |
| HWBOT x265 Benchmark v2.2 / 4k Preset | |
| MSI Raider GE77 HX 12UHS | |
| Acer Predator Triton 300 SE | |
| Razer Blade 14 Ryzen 9 6900HX | |
| Alienware x14 i7 RTX 3060 | |
| Average Intel Core i9-12900H (8.05 - 22.5, n=25) | |
| Acer Nitro 5 AN515-46-R1A1 | |
| Lenovo IdeaPad Gaming 3 15IAH7 | |
| Razer Blade 14 Ryzen 9 RTX 3070 | |
| Asus ROG Zephyrus G14 GA402RJ | |
| Lenovo Legion 5 Pro 16 ARH7H-82RG0047GE | |
| Asus ZenBook 14X UM5401QA-KN162 | |
| SCHENKER Vision 14 | |
| LibreOffice / 20 Documents To PDF | |
| Lenovo Legion 5 Pro 16 ARH7H-82RG0047GE | |
| Razer Blade 14 Ryzen 9 RTX 3070 | |
| Asus ROG Zephyrus G14 GA402RJ | |
| Asus ZenBook 14X UM5401QA-KN162 | |
| Acer Nitro 5 AN515-46-R1A1 | |
| Razer Blade 14 Ryzen 9 6900HX | |
| Lenovo IdeaPad Gaming 3 15IAH7 | |
| SCHENKER Vision 14 | |
| Average Intel Core i9-12900H (36.8 - 59.8, n=25) | |
| MSI Raider GE77 HX 12UHS | |
| Acer Predator Triton 300 SE | |
| Alienware x14 i7 RTX 3060 | |
| R Benchmark 2.5 / Overall mean | |
| Razer Blade 14 Ryzen 9 RTX 3070 | |
| SCHENKER Vision 14 | |
| Asus ZenBook 14X UM5401QA-KN162 | |
| Asus ROG Zephyrus G14 GA402RJ | |
| Lenovo IdeaPad Gaming 3 15IAH7 | |
| Lenovo Legion 5 Pro 16 ARH7H-82RG0047GE | |
| Acer Nitro 5 AN515-46-R1A1 | |
| Razer Blade 14 Ryzen 9 6900HX | |
| Alienware x14 i7 RTX 3060 | |
| Average Intel Core i9-12900H (0.4218 - 0.506, n=25) | |
| Acer Predator Triton 300 SE | |
| MSI Raider GE77 HX 12UHS | |
* ... smaller is better
AIDA64: FP32 Ray-Trace | FPU Julia | CPU SHA3 | CPU Queen | FPU SinJulia | FPU Mandel | CPU AES | CPU ZLib | FP64 Ray-Trace | CPU PhotoWorxx
| Performance Rating | |
| Razer Blade 14 Ryzen 9 6900HX | |
| Acer Predator Triton 300 SE | |
| Asus ROG Zephyrus G14 GA402RJ | |
| Average Intel Core i9-12900H | |
| Dell Inspiron 14 Plus 7420 | |
| Alienware x14 i7 RTX 3060 | |
| SCHENKER Vision 14 | |
| AIDA64 / FP32 Ray-Trace | |
| Razer Blade 14 Ryzen 9 6900HX | |
| Acer Predator Triton 300 SE | |
| Asus ROG Zephyrus G14 GA402RJ | |
| Dell Inspiron 14 Plus 7420 | |
| Average Intel Core i9-12900H (4074 - 18289, n=25) | |
| SCHENKER Vision 14 | |
| Alienware x14 i7 RTX 3060 | |
| AIDA64 / FPU Julia | |
| Razer Blade 14 Ryzen 9 6900HX | |
| Asus ROG Zephyrus G14 GA402RJ | |
| Acer Predator Triton 300 SE | |
| Dell Inspiron 14 Plus 7420 | |
| Average Intel Core i9-12900H (22307 - 93236, n=25) | |
| Alienware x14 i7 RTX 3060 | |
| SCHENKER Vision 14 | |
| AIDA64 / CPU SHA3 | |
| Acer Predator Triton 300 SE | |
| Razer Blade 14 Ryzen 9 6900HX | |
| Average Intel Core i9-12900H (1378 - 4215, n=25) | |
| Asus ROG Zephyrus G14 GA402RJ | |
| Alienware x14 i7 RTX 3060 | |
| Dell Inspiron 14 Plus 7420 | |
| SCHENKER Vision 14 | |
| AIDA64 / CPU Queen | |
| Acer Predator Triton 300 SE | |
| Razer Blade 14 Ryzen 9 6900HX | |
| Average Intel Core i9-12900H (78172 - 111241, n=25) | |
| Asus ROG Zephyrus G14 GA402RJ | |
| Alienware x14 i7 RTX 3060 | |
| Dell Inspiron 14 Plus 7420 | |
| SCHENKER Vision 14 | |
| AIDA64 / FPU SinJulia | |
| Razer Blade 14 Ryzen 9 6900HX | |
| Asus ROG Zephyrus G14 GA402RJ | |
| Acer Predator Triton 300 SE | |
| Alienware x14 i7 RTX 3060 | |
| Average Intel Core i9-12900H (5709 - 10410, n=25) | |
| Dell Inspiron 14 Plus 7420 | |
| SCHENKER Vision 14 | |
| AIDA64 / FPU Mandel | |
| Razer Blade 14 Ryzen 9 6900HX | |
| Asus ROG Zephyrus G14 GA402RJ | |
| Acer Predator Triton 300 SE | |
| Dell Inspiron 14 Plus 7420 | |
| Average Intel Core i9-12900H (11257 - 45581, n=25) | |
| Alienware x14 i7 RTX 3060 | |
| SCHENKER Vision 14 | |
| AIDA64 / CPU AES | |
| Razer Blade 14 Ryzen 9 6900HX | |
| Acer Predator Triton 300 SE | |
| Asus ROG Zephyrus G14 GA402RJ | |
| Alienware x14 i7 RTX 3060 | |
| Average Intel Core i9-12900H (31935 - 151546, n=25) | |
| SCHENKER Vision 14 | |
| Dell Inspiron 14 Plus 7420 | |
| AIDA64 / CPU ZLib | |
| Acer Predator Triton 300 SE | |
| Alienware x14 i7 RTX 3060 | |
| Average Intel Core i9-12900H (449 - 1193, n=25) | |
| Dell Inspiron 14 Plus 7420 | |
| Razer Blade 14 Ryzen 9 6900HX | |
| Asus ROG Zephyrus G14 GA402RJ | |
| SCHENKER Vision 14 | |
| AIDA64 / FP64 Ray-Trace | |
| Razer Blade 14 Ryzen 9 6900HX | |
| Acer Predator Triton 300 SE | |
| Asus ROG Zephyrus G14 GA402RJ | |
| Dell Inspiron 14 Plus 7420 | |
| Average Intel Core i9-12900H (2235 - 10511, n=25) | |
| Alienware x14 i7 RTX 3060 | |
| SCHENKER Vision 14 | |
| AIDA64 / CPU PhotoWorxx | |
| Acer Predator Triton 300 SE | |
| Alienware x14 i7 RTX 3060 | |
| Average Intel Core i9-12900H (20960 - 48269, n=26) | |
| Dell Inspiron 14 Plus 7420 | |
| Razer Blade 14 Ryzen 9 6900HX | |
| SCHENKER Vision 14 | |
| Asus ROG Zephyrus G14 GA402RJ | |
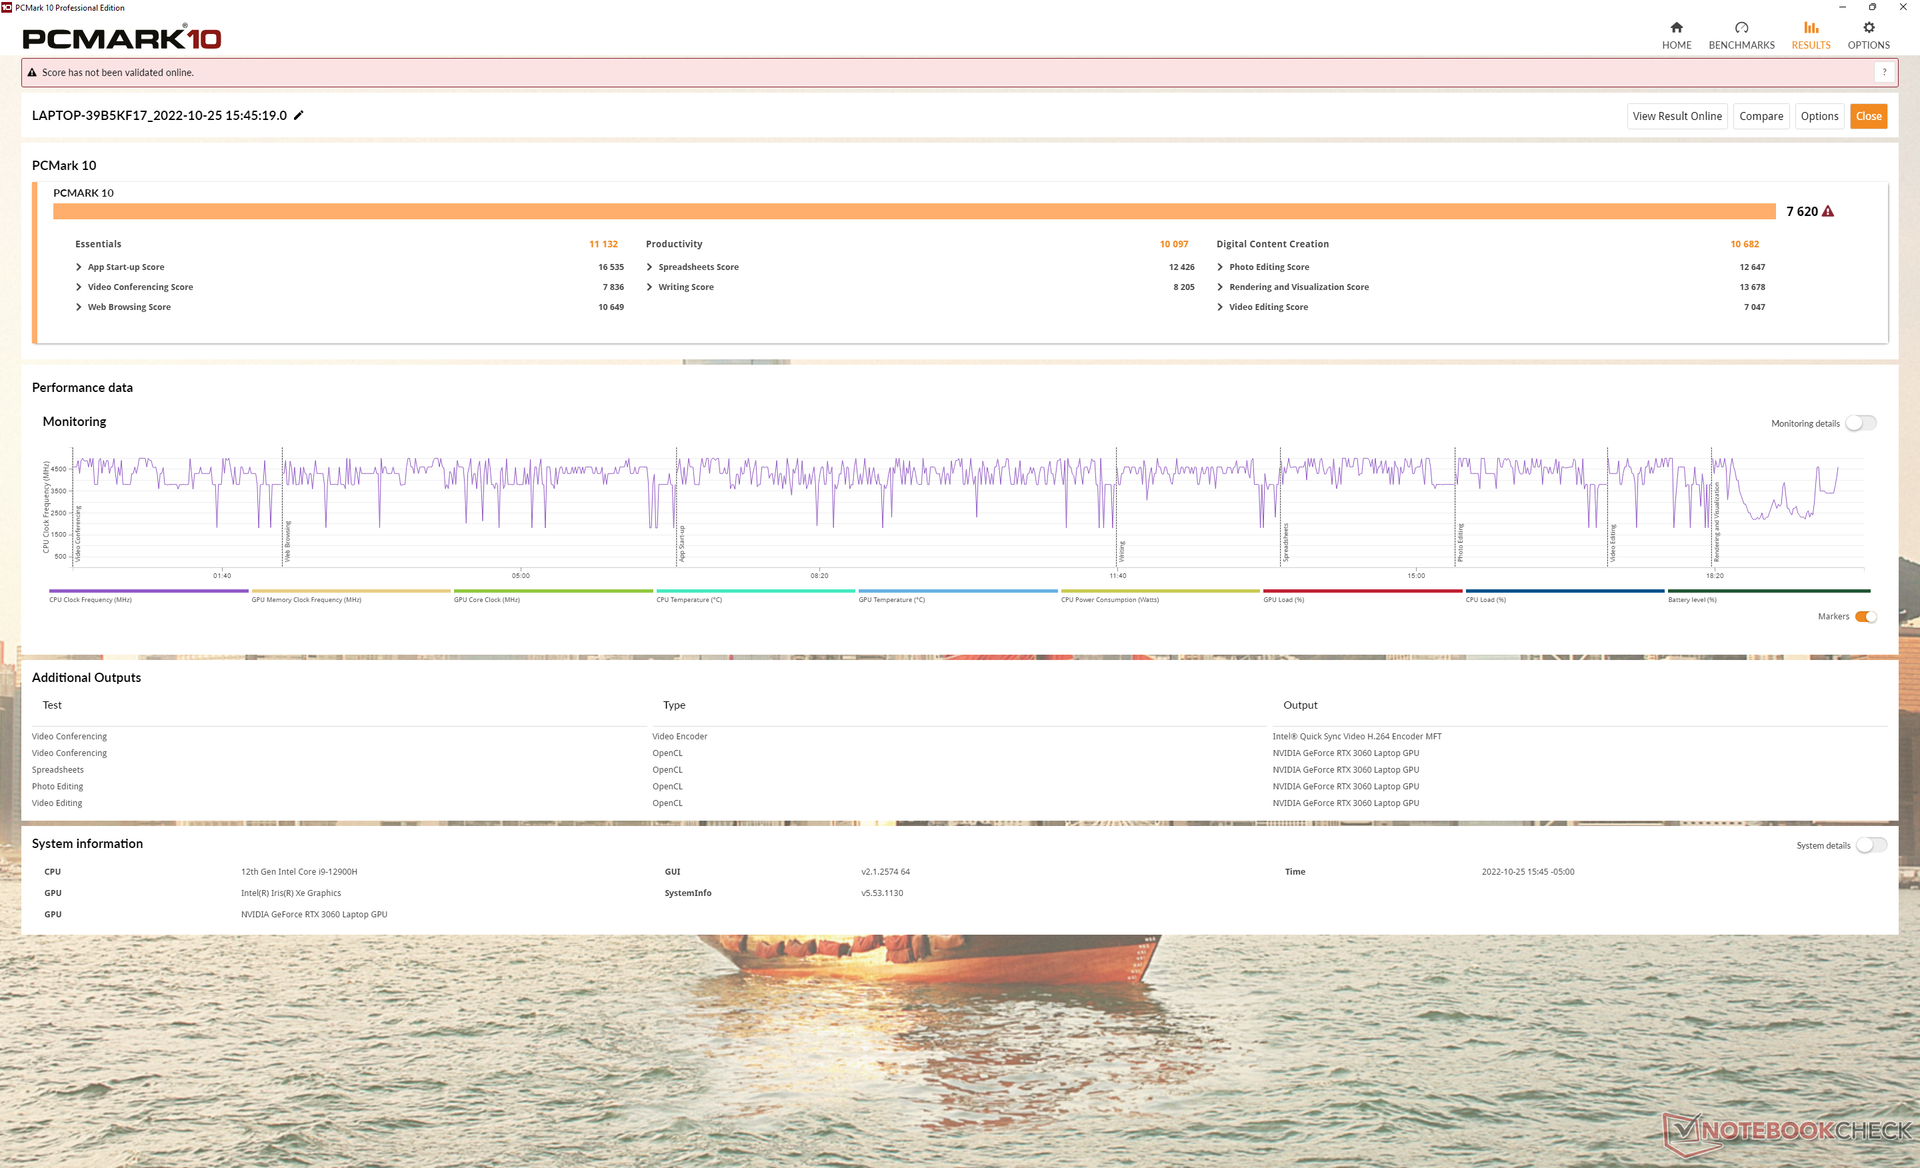
System Performance
PCMark results are almost 50 percent faster than the 2020 Predator Triton 300 since the older model had an unusually low Digital Content Creation score. The scores are now where they should be relative to other gaming laptops with the latest Zen 3+ or 12th gen Core H CPUs like the Dell G16.
CrossMark: Overall | Productivity | Creativity | Responsiveness
| CrossMark / Overall | |
| Acer Predator Triton 300 SE | |
| Alienware x14 i7 RTX 3060 | |
| Dell Inspiron 14 Plus 7420 | |
| SCHENKER Vision 14 | |
| CrossMark / Productivity | |
| Acer Predator Triton 300 SE | |
| Alienware x14 i7 RTX 3060 | |
| Dell Inspiron 14 Plus 7420 | |
| SCHENKER Vision 14 | |
| CrossMark / Creativity | |
| Acer Predator Triton 300 SE | |
| Alienware x14 i7 RTX 3060 | |
| Dell Inspiron 14 Plus 7420 | |
| SCHENKER Vision 14 | |
| CrossMark / Responsiveness | |
| Acer Predator Triton 300 SE | |
| Alienware x14 i7 RTX 3060 | |
| SCHENKER Vision 14 | |
| Dell Inspiron 14 Plus 7420 | |
| PCMark 10 Score | 7620 points | |
Help | ||
| AIDA64 / Memory Copy | |
| Alienware x14 i7 RTX 3060 | |
| Acer Predator Triton 300 SE | |
| Average Intel Core i9-12900H (34438 - 74264, n=25) | |
| Dell Inspiron 14 Plus 7420 | |
| Razer Blade 14 Ryzen 9 6900HX | |
| Asus ROG Zephyrus G14 GA402RJ | |
| SCHENKER Vision 14 | |
| AIDA64 / Memory Read | |
| Alienware x14 i7 RTX 3060 | |
| Acer Predator Triton 300 SE | |
| Dell Inspiron 14 Plus 7420 | |
| Average Intel Core i9-12900H (36365 - 74642, n=25) | |
| Razer Blade 14 Ryzen 9 6900HX | |
| Asus ROG Zephyrus G14 GA402RJ | |
| SCHENKER Vision 14 | |
| AIDA64 / Memory Write | |
| Alienware x14 i7 RTX 3060 | |
| Acer Predator Triton 300 SE | |
| Average Intel Core i9-12900H (32276 - 67858, n=25) | |
| Dell Inspiron 14 Plus 7420 | |
| Asus ROG Zephyrus G14 GA402RJ | |
| Razer Blade 14 Ryzen 9 6900HX | |
| SCHENKER Vision 14 | |
| AIDA64 / Memory Latency | |
| Dell Inspiron 14 Plus 7420 | |
| Alienware x14 i7 RTX 3060 | |
| Acer Predator Triton 300 SE | |
| Asus ROG Zephyrus G14 GA402RJ | |
| Average Intel Core i9-12900H (88 - 118.1, n=24) | |
| Razer Blade 14 Ryzen 9 6900HX | |
| SCHENKER Vision 14 | |
* ... smaller is better
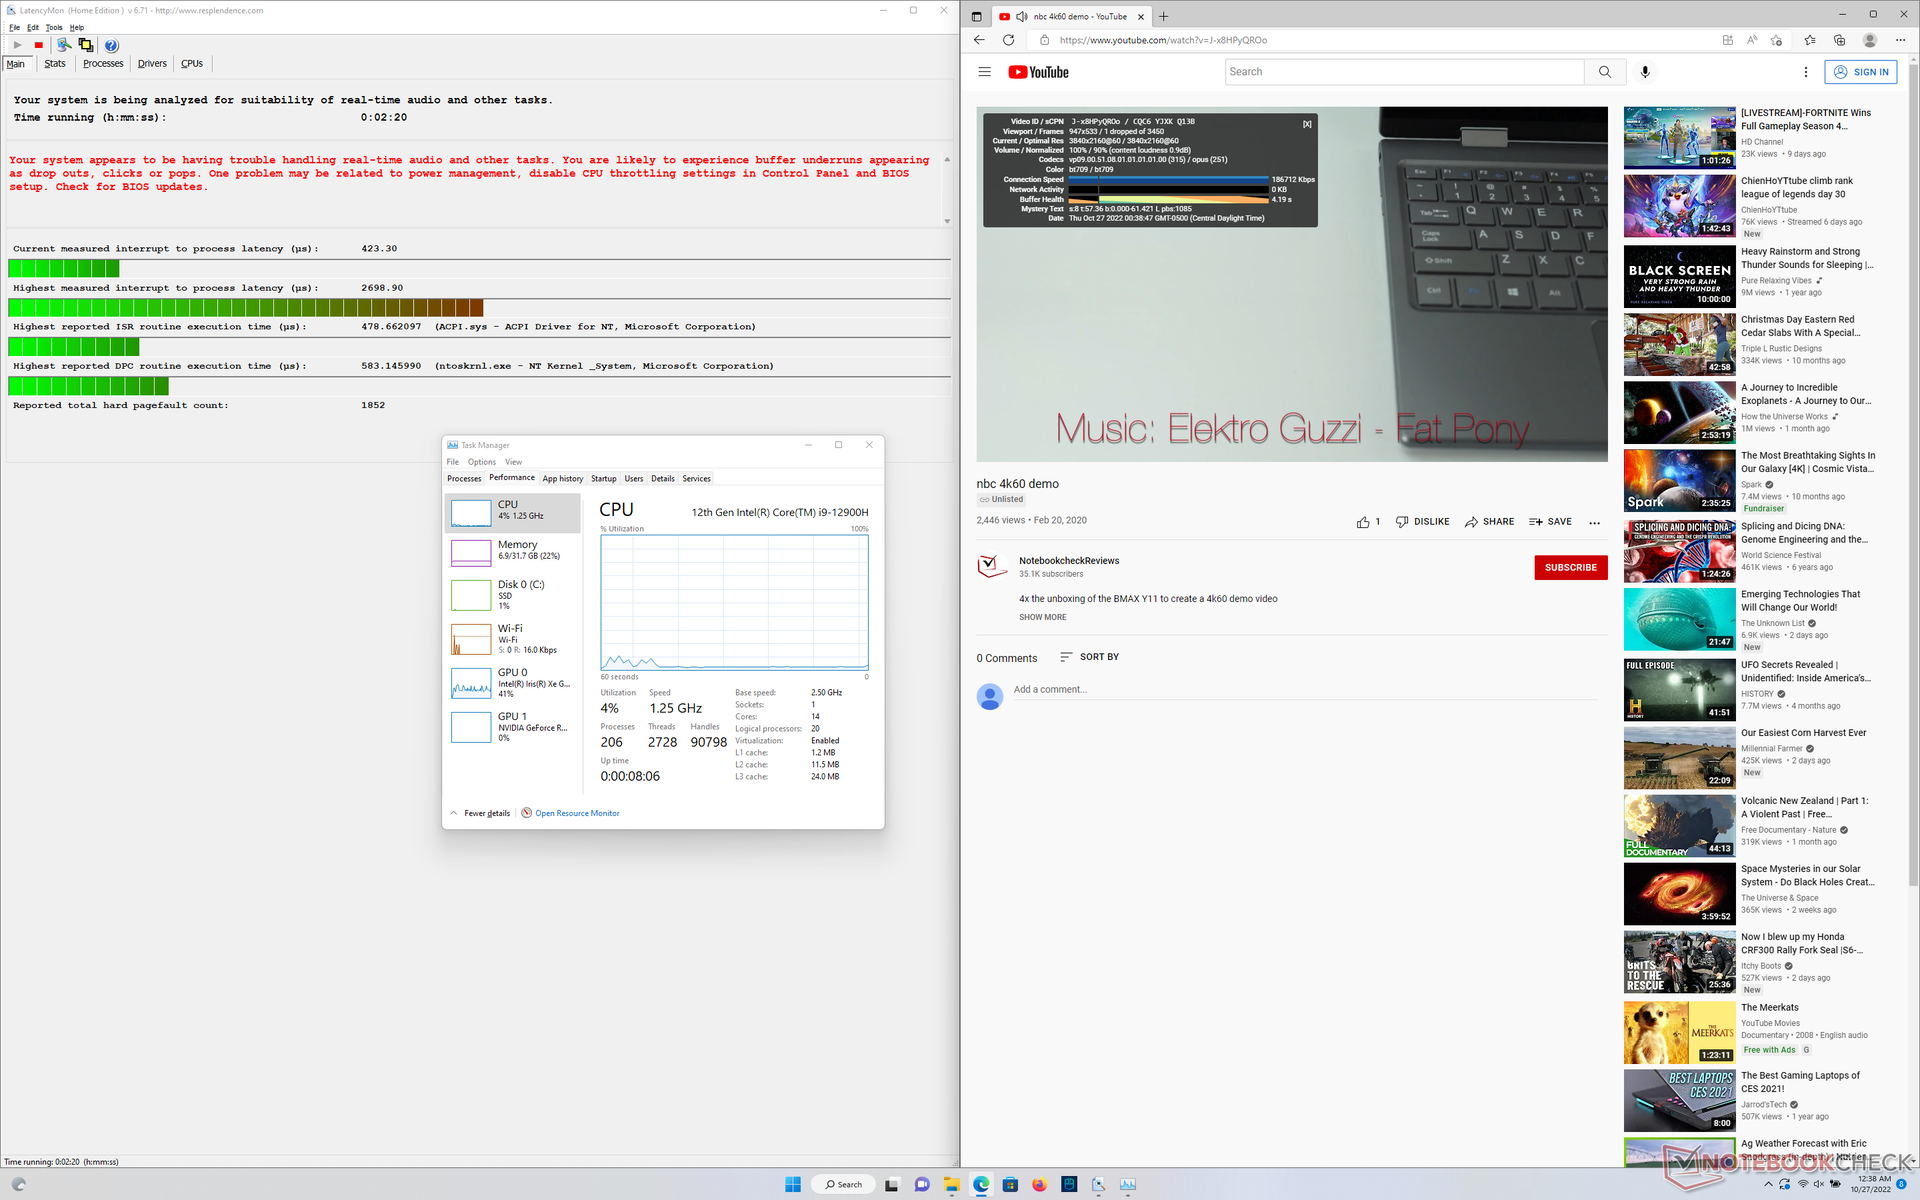
DPC Latency
LatencyMon reveals DPC issues when opening multiple browser tabs of our homepage. The 2020 Predator Triton 300 would suffer from similar DPC issues as well and so it's a bit disappointing to see this unaddressed. Beyond that, there are no major skipped frames when playing 4K60 video.
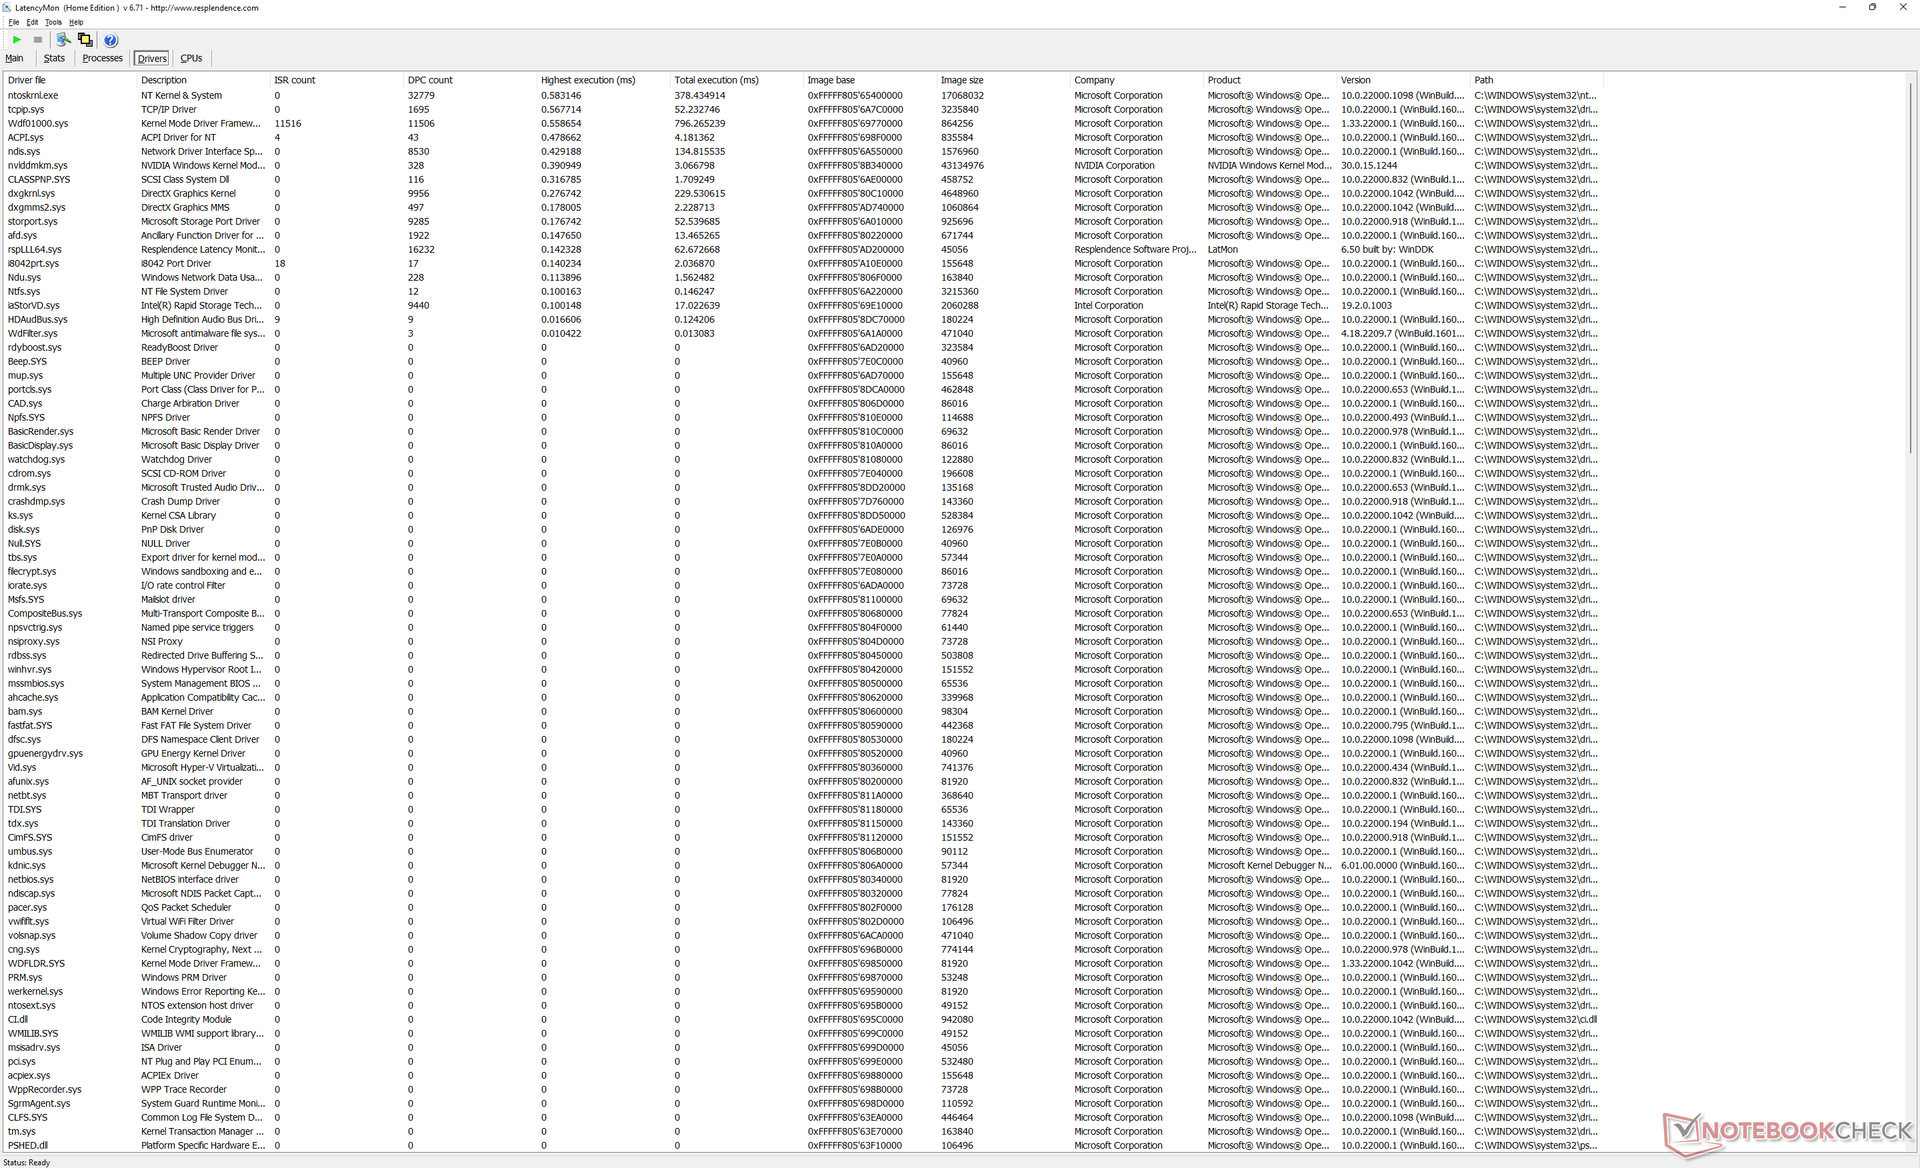
| DPC Latencies / LatencyMon - interrupt to process latency (max), Web, Youtube, Prime95 | |
| Acer Predator Triton 300 SE | |
| Razer Blade 14 Ryzen 9 6900HX | |
| Alienware x14 i7 RTX 3060 | |
| Asus ROG Zephyrus G14 GA402RJ | |
| SCHENKER Vision 14 | |
| Dell Inspiron 14 Plus 7420 | |
* ... smaller is better
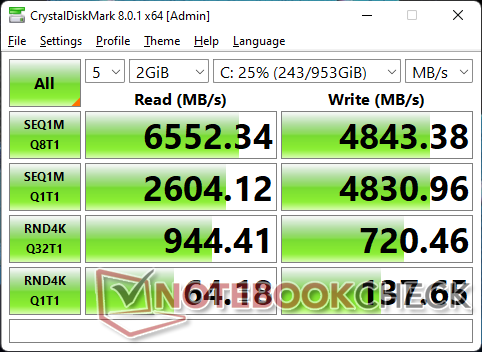
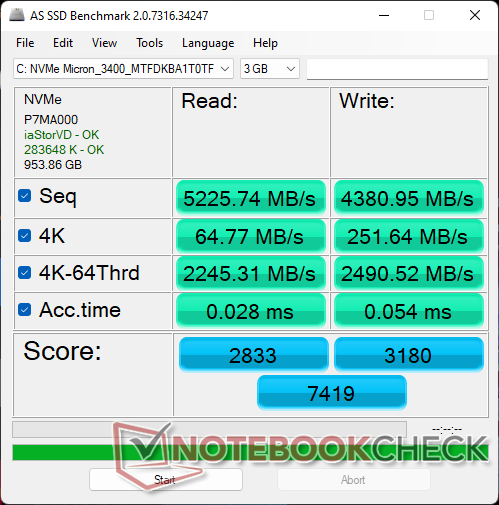
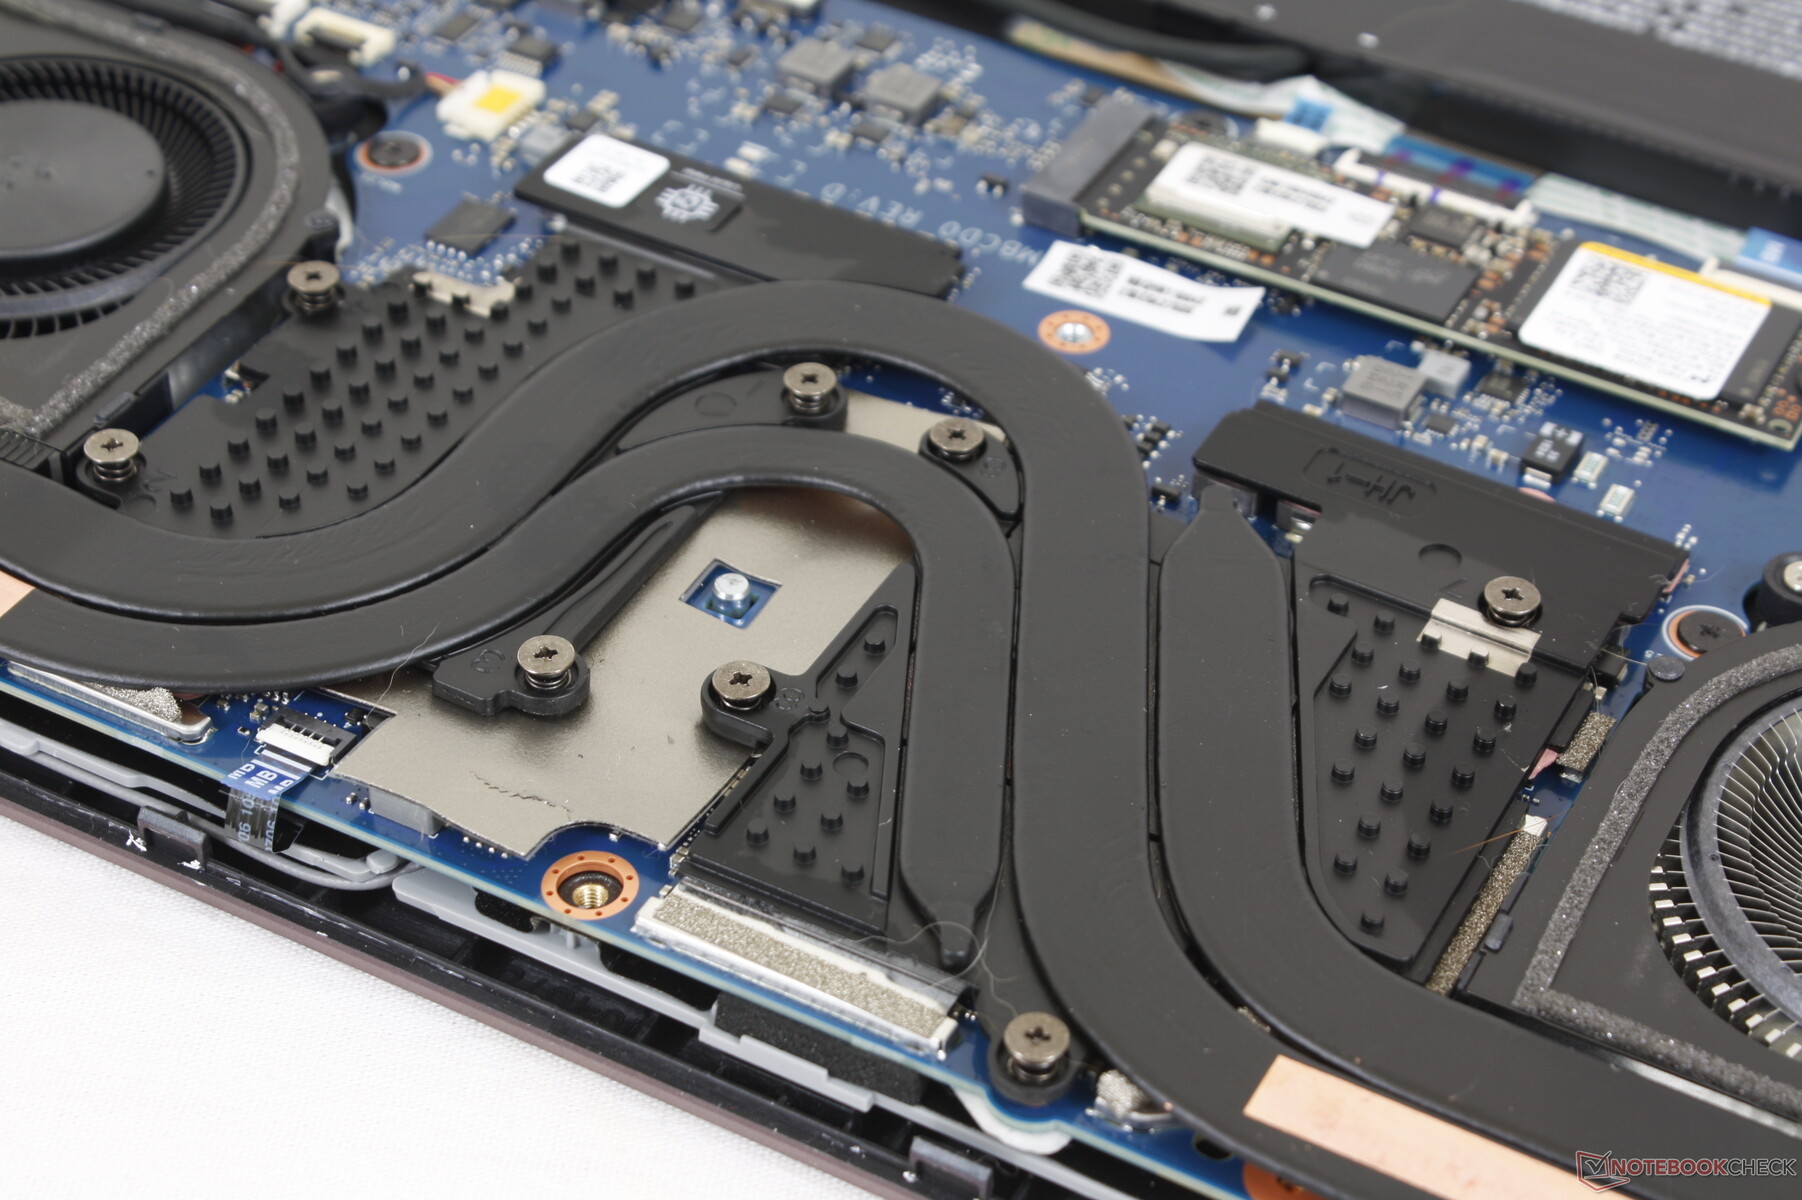
Storage Devices — No Heat Spreader Included
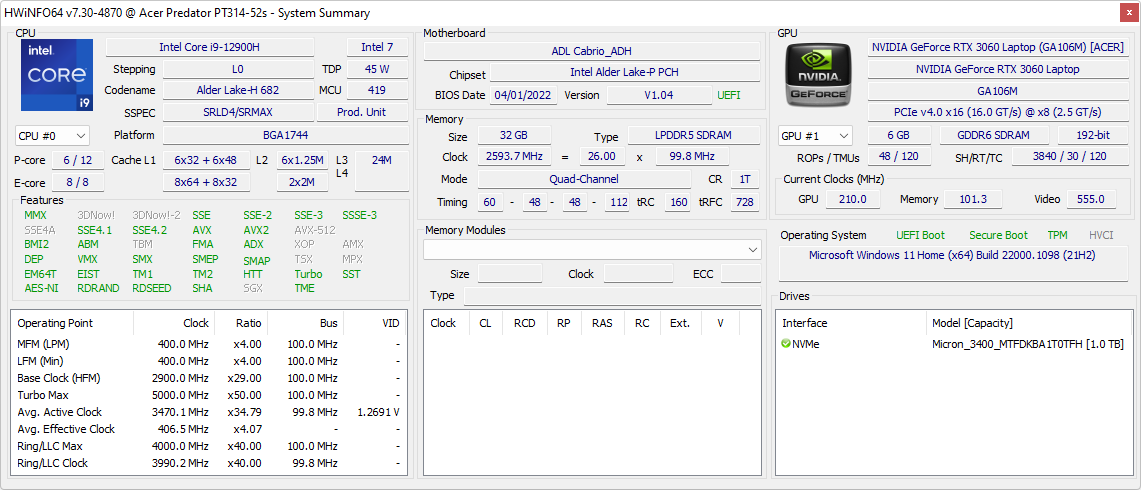
Our test unit comes with a 1 TB Micron 3400 PCIe4 NVMe SSD for sequential read and writes rates of up to 6600 MB/s and 5000 MB/s, respectively. Unfortunately, the drive is unable to sustain such fast speeds for extended periods likely due the lack of a heat spreader. Our DiskSpd loop results below shows read rates as high as 6500 MB/s during the start of the test before they falling to just 1700 MB/s or even 400 MB/s over time. Competitors like the Razer Blade 14 are much better at sustaining faster SSD transfer rates in comparison.

| Drive Performance Rating - Percent | |
| Razer Blade 14 Ryzen 9 6900HX | |
| SCHENKER Vision 14 | |
| Acer Predator Triton 300 SE -11! | |
| Alienware x14 i7 RTX 3060 | |
| Asus ROG Zephyrus G14 GA402RJ | |
| Dell Inspiron 14 Plus 7420 | |
* ... smaller is better
Disk Throttling: DiskSpd Read Loop, Queue Depth 8
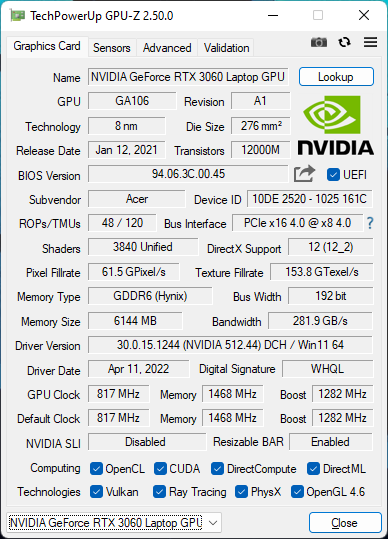
GPU Performance — 95 W TGP
Graphics performance is within 1 to 2 percent of the average laptop in our database equipped with the same GeForce RTX 3060 GPU even when running on Turbo mode. If Turbo mode is off, performance would drop by about 5 to 6 percent to be slower than the average. Thus, users must run the Predator Triton 300 SE at its loudest setting if they want to get the most out of the laptop when gaming.
Overall performance is still faster than the older RTX 2060 in the 2020 Predator Triton 300 by about 25 to 30 percent. Most games are stable at 1080p maximum settings except for the most demanding of titles like Cyberpunk 2077. Performance begins to buckle at the native 1800p resolution and there is unfortunately no G-Sync support here to alleviate the uneven frame pacing. We find 1800p at medium to medium-high settings to be the sweet spot for this machine.
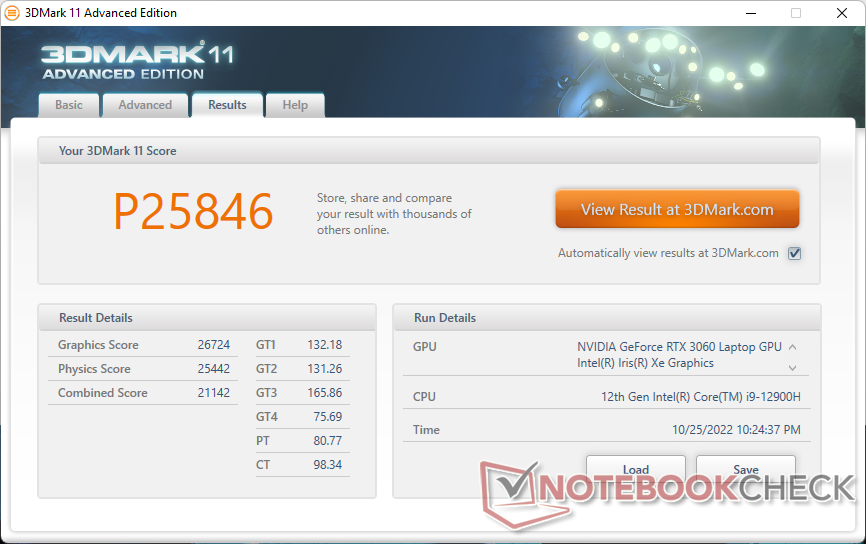
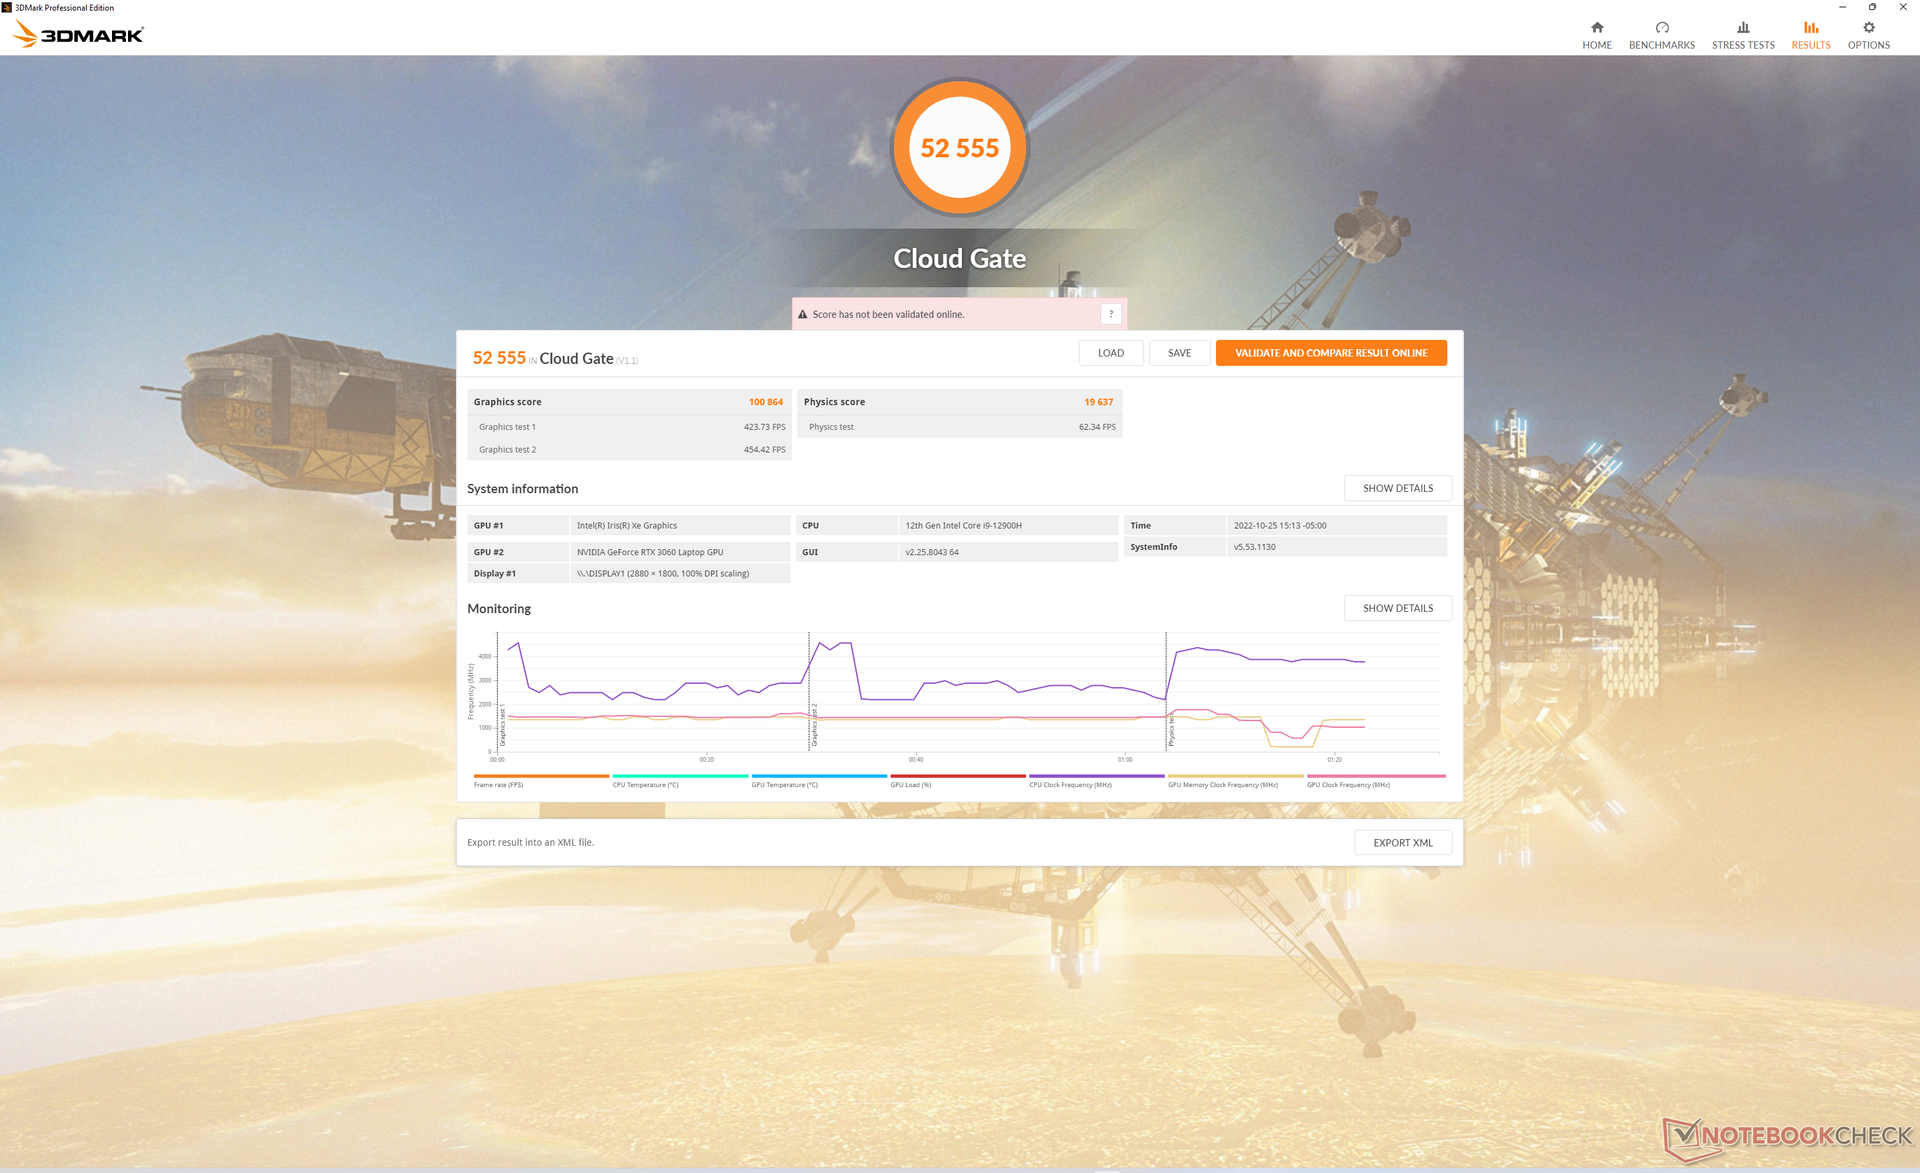
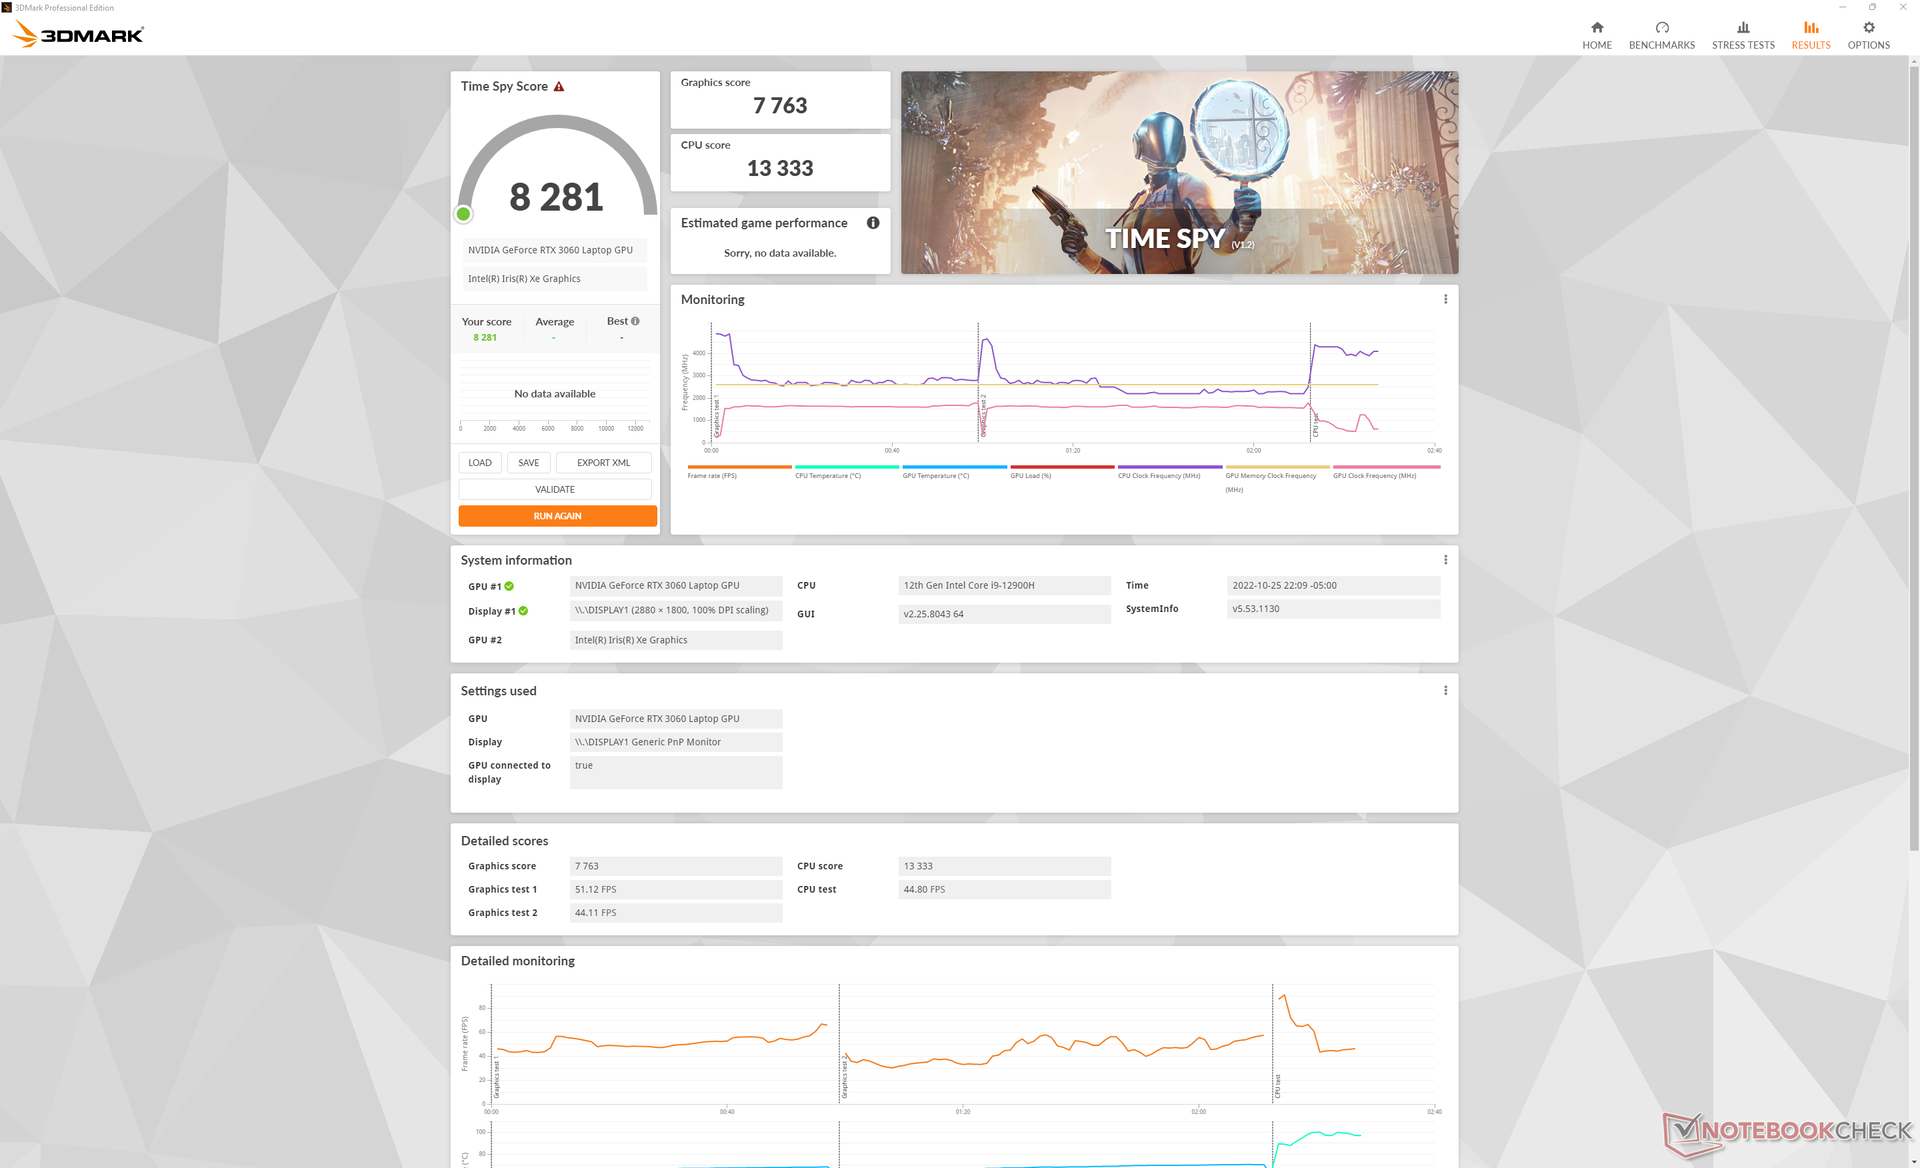
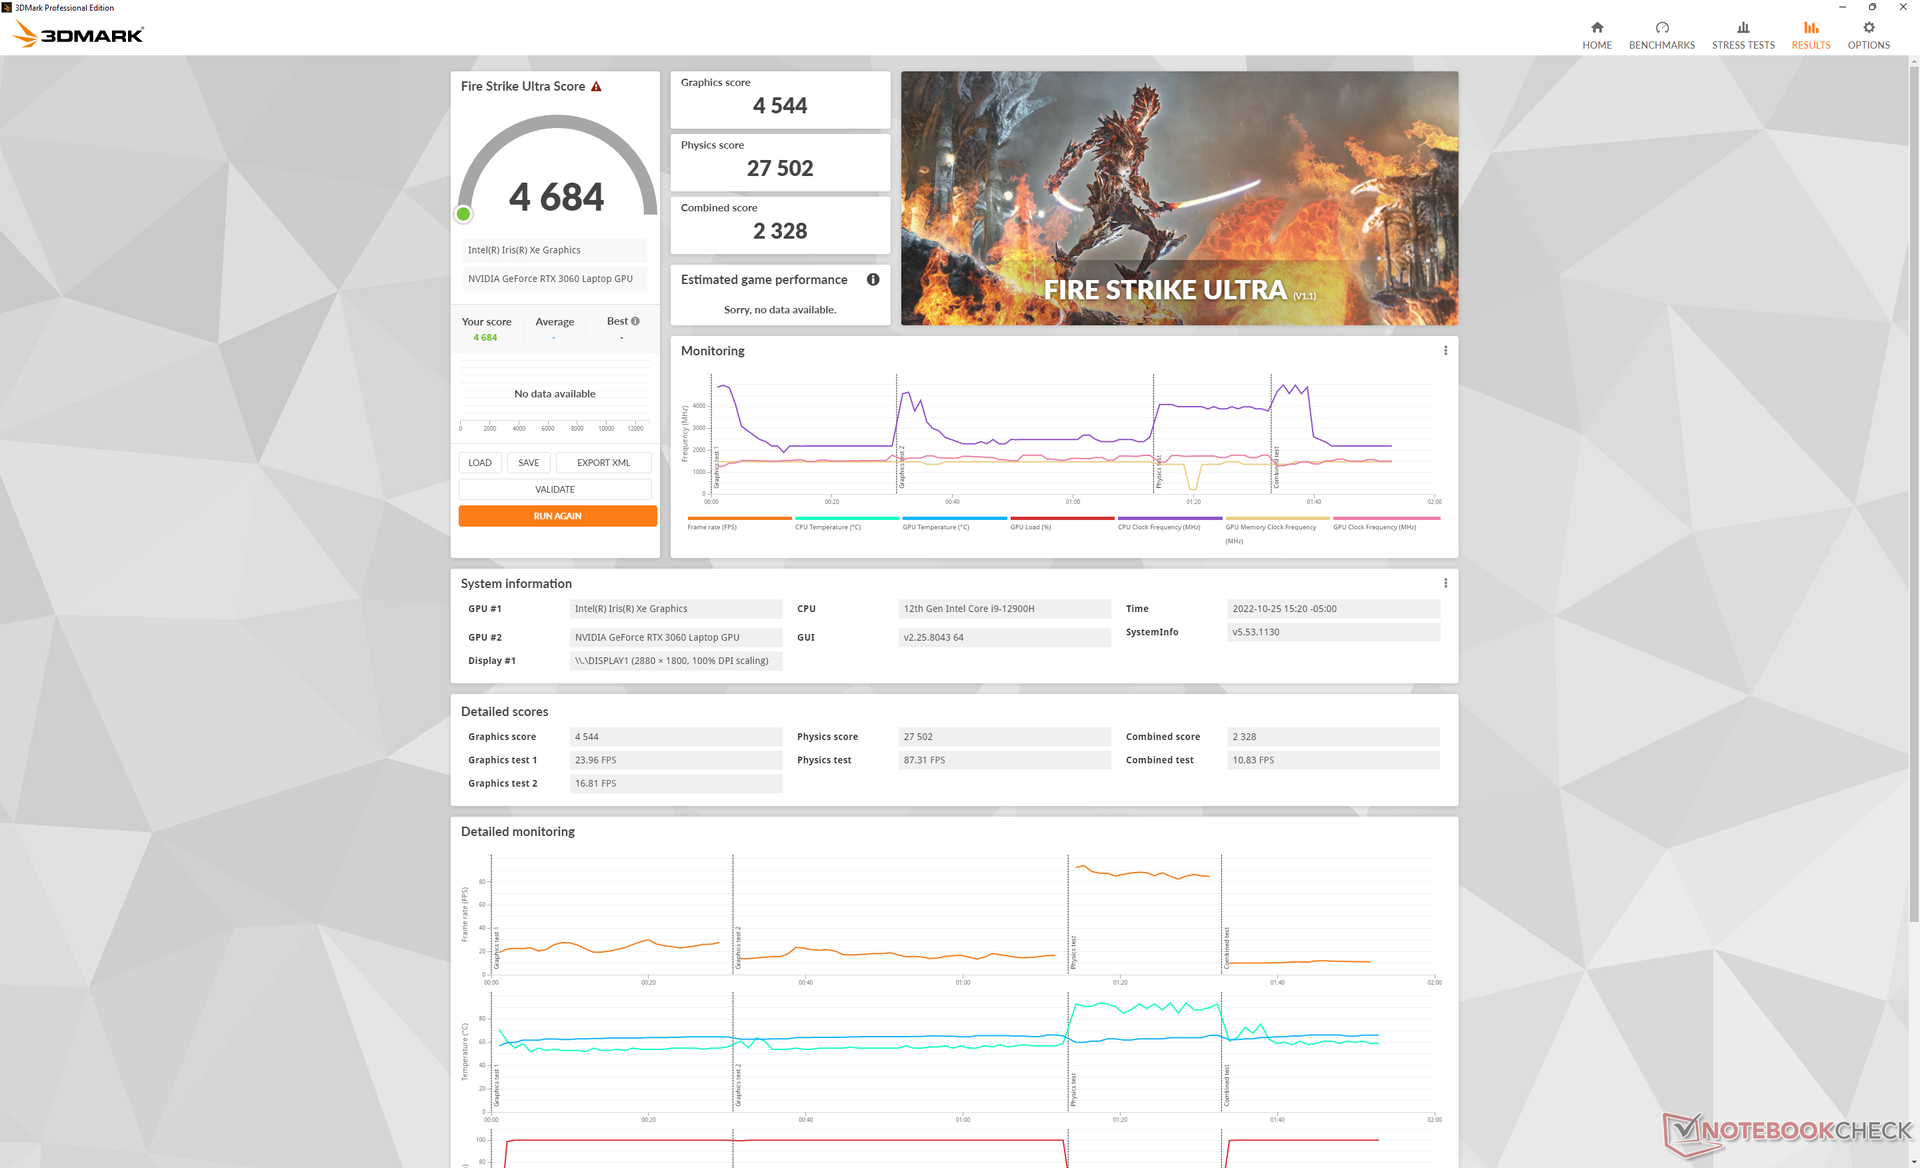

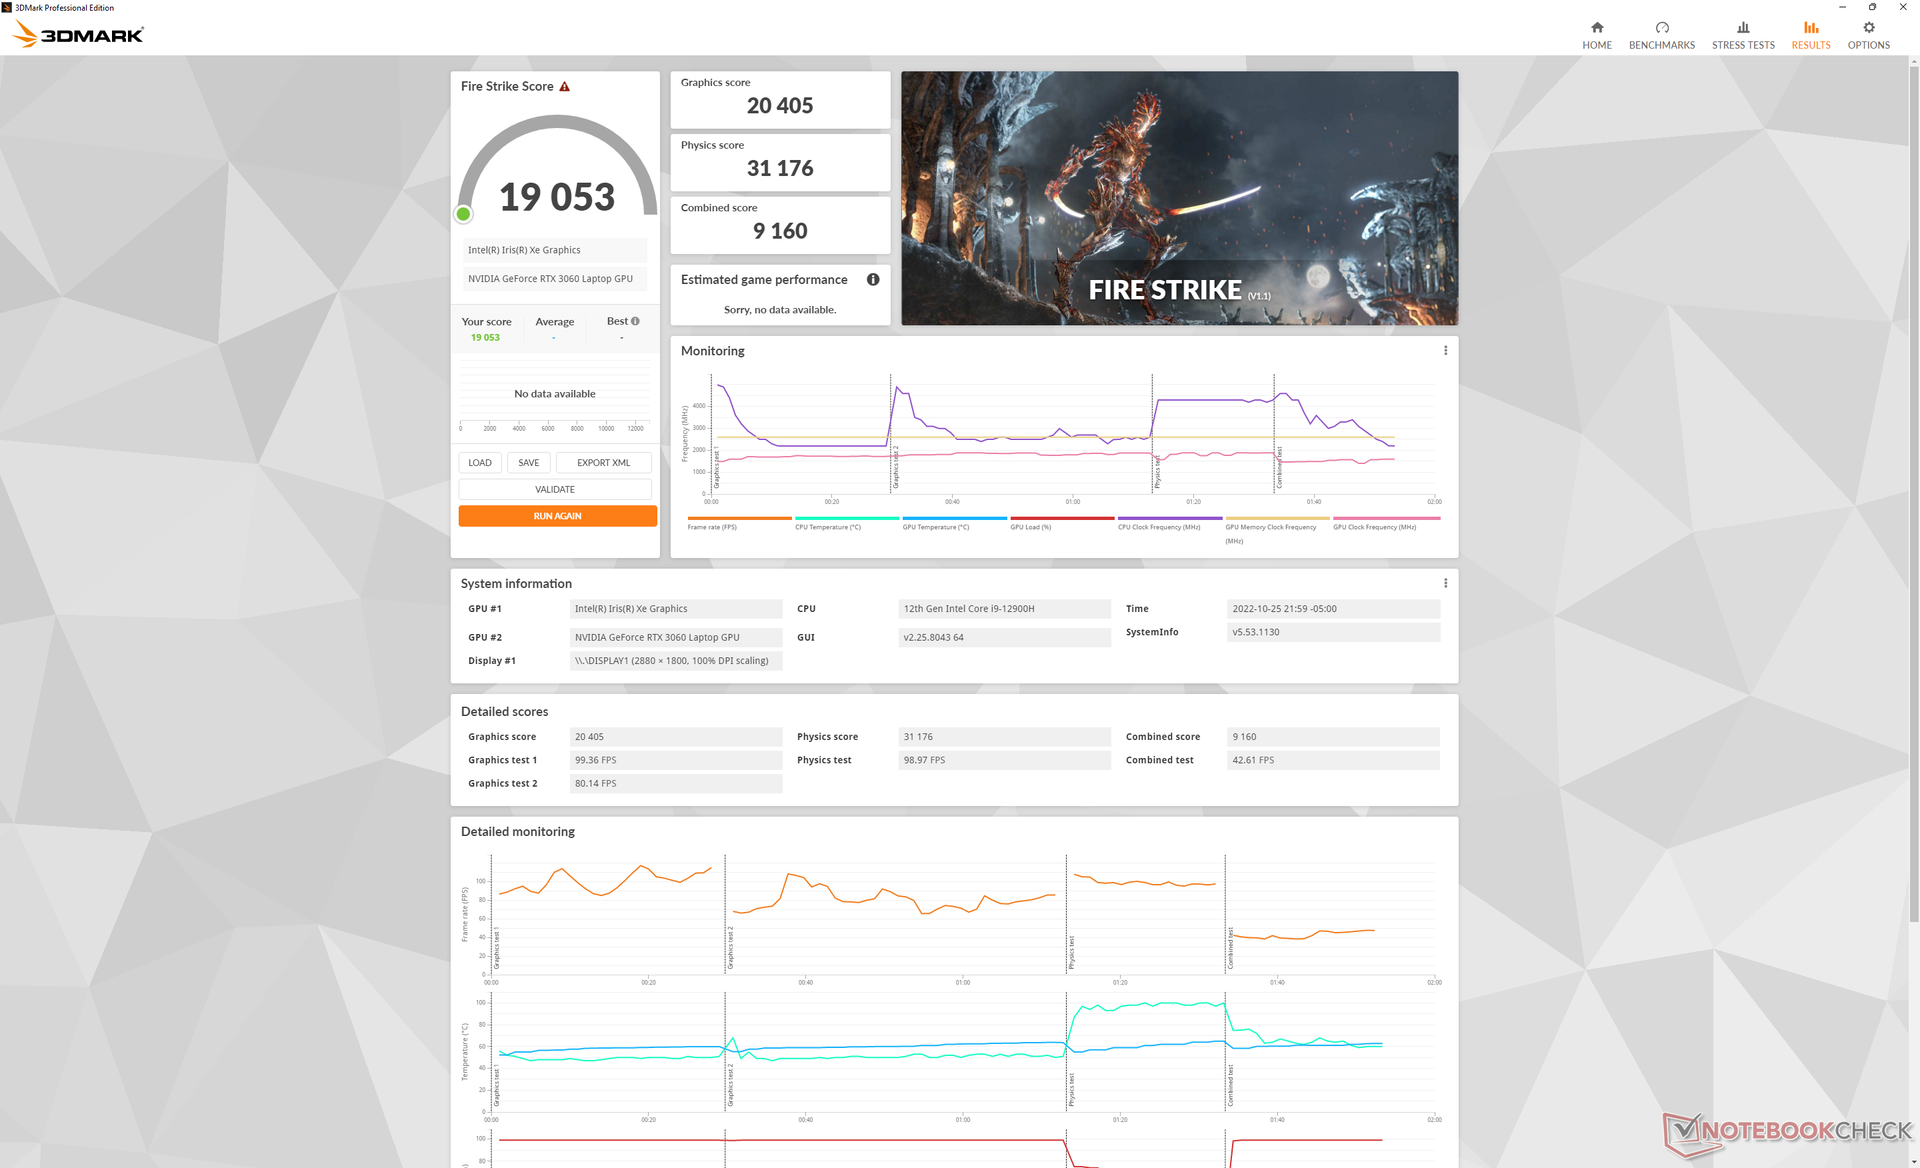
| 3DMark 11 Performance | 25846 points | |
| 3DMark Cloud Gate Standard Score | 52555 points | |
| 3DMark Fire Strike Score | 19053 points | |
| 3DMark Time Spy Score | 8281 points | |
Help | ||
* ... smaller is better
Witcher 3 FPS Chart
| low | med. | high | ultra | QHD | |
| GTA V (2015) | 185.9 | 181.8 | 172.3 | 99.6 | 75.2 |
| The Witcher 3 (2015) | 341.1 | 230 | 145.6 | 75 | |
| Dota 2 Reborn (2015) | 185 | 169.2 | 162.1 | 153.6 | |
| Final Fantasy XV Benchmark (2018) | 176.4 | 105.1 | 79.1 | 60.5 | |
| X-Plane 11.11 (2018) | 141.8 | 126.1 | 101 | ||
| Strange Brigade (2018) | 389 | 196.7 | 157.8 | 138.6 | 100.8 |
| Cyberpunk 2077 1.6 (2022) | 109.8 | 71.9 | 70.4 | 57.7 | 36 |
Emissions — Loud When Gaming
System Noise
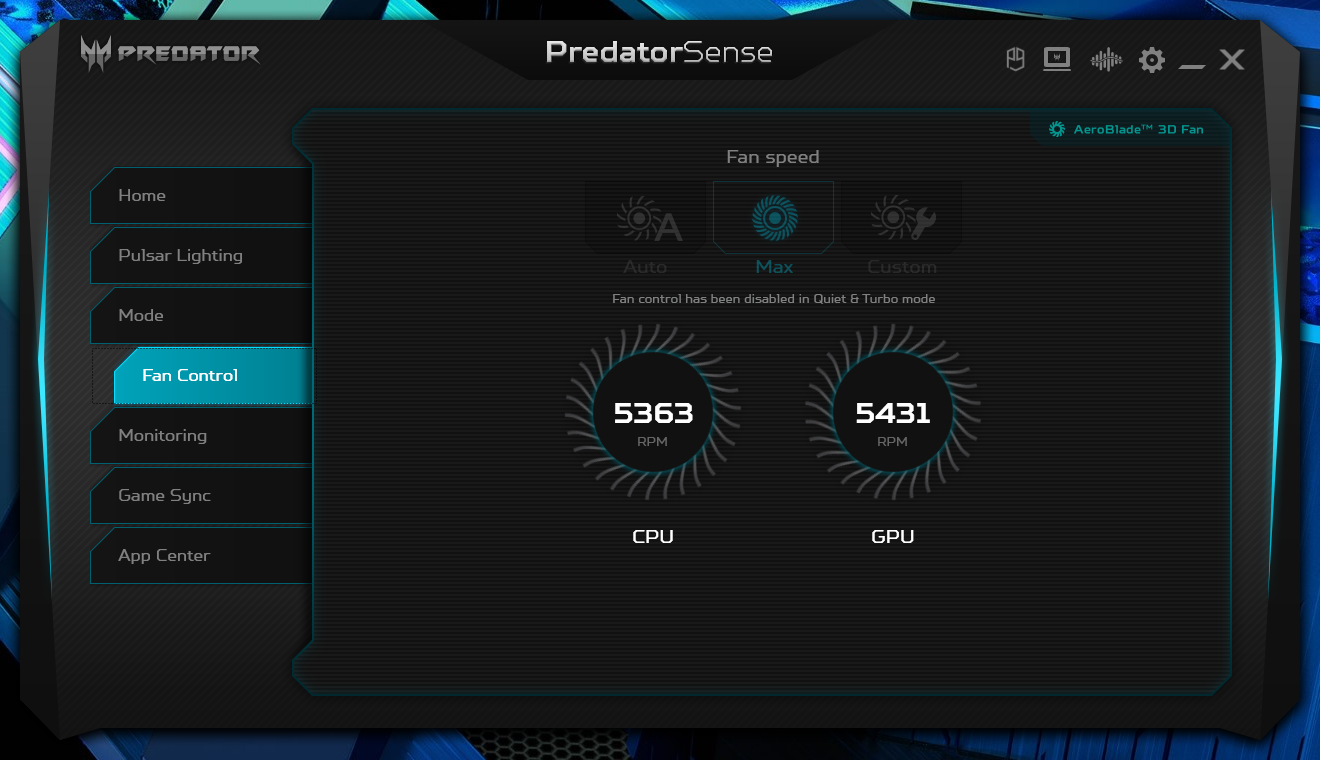
PredatorSense fan modes include Quiet, Default, and Turbo. The fans pulse frequently if set to Default or higher and so it's recommended to set the system to Quiet if web browsing or video streaming. Otherwise, fan noise can be as high as 34 dB(A) against a silent background of 24 dB(A) when running undemanding loads.
There is a massive difference in fan noise between the Default and Turbo mode settings. Fan noise when running Witcher 3 on Default tops out at 47 dB(A) compared to 60 dB(A) if on Turbo. 60 dB(A) is significantly louder than most other laptops regardless of size as shown by our table below. As stated earlier, enabling Turbo mode is mandatory to fully exploit the 95 W TGP GPU. Nonetheless, users may want to consider gaming on Default mode instead for the quieter fan noise even if it entails a 5 to 6 percent performance drop.
Noise Level
| Idle |
| 23.8 / 23.8 / 30.6 dB(A) |
| Load |
| 44.2 / 60 dB(A) |
 | ||
30 dB silent 40 dB(A) audible 50 dB(A) loud |
||
min: | ||
| Acer Predator Triton 300 SE GeForce RTX 3060 Laptop GPU, i9-12900H, Micron 3400 1TB MTFDKBA1T0TFH | Asus ROG Zephyrus G14 GA402RJ Radeon RX 6700S, R7 6800HS, Micron 2450 1TB MTFDKBA1T0TFK | Razer Blade 14 Ryzen 9 6900HX GeForce RTX 3070 Ti Laptop GPU, R9 6900HX, Samsung PM9A1 MZVL21T0HCLR | Alienware x14 i7 RTX 3060 GeForce RTX 3060 Laptop GPU, i7-12700H, WDC PC SN810 1TB | Dell Inspiron 14 Plus 7420 GeForce RTX 3050 4GB Laptop GPU, i7-12700H, SK Hynix BC711 512GB HFM512GD3GX013N | SCHENKER Vision 14 GeForce RTX 3050 Ti Laptop GPU, i7-11370H, Samsung SSD 980 Pro 1TB MZ-V8P1T0BW | |
|---|---|---|---|---|---|---|
| Noise | 5% | 16% | 4% | 8% | 8% | |
| off / environment * | 23.8 | 25 -5% | 23.3 2% | 24.7 -4% | 23.2 3% | 24.3 -2% |
| Idle Minimum * | 23.8 | 25 -5% | 23.3 2% | 24.7 -4% | 23.2 3% | 24.3 -2% |
| Idle Average * | 23.8 | 26 -9% | 23.3 2% | 24.7 -4% | 23.2 3% | 24.3 -2% |
| Idle Maximum * | 30.6 | 29 5% | 23.3 24% | 30.9 -1% | 23.2 24% | 25.9 15% |
| Load Average * | 44.2 | 45 -2% | 34.7 21% | 40 10% | 47.5 -7% | 43.3 2% |
| Witcher 3 ultra * | 60.1 | 43 28% | 42.1 30% | 51.5 14% | 51.7 14% | 44.6 26% |
| Load Maximum * | 60 | 45 25% | 42.1 30% | 51.5 14% | 51.7 14% | 49.5 17% |
* ... smaller is better
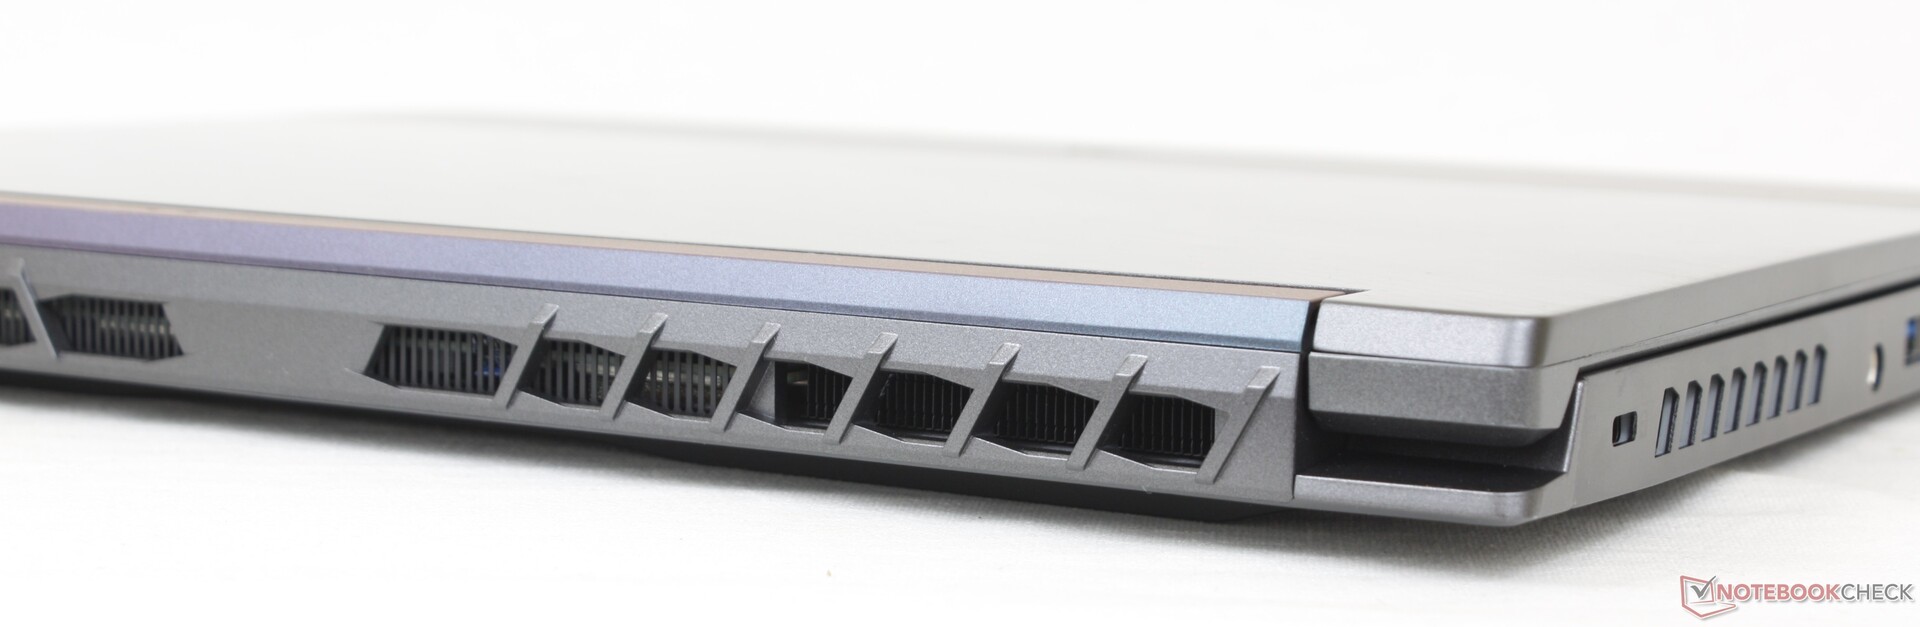
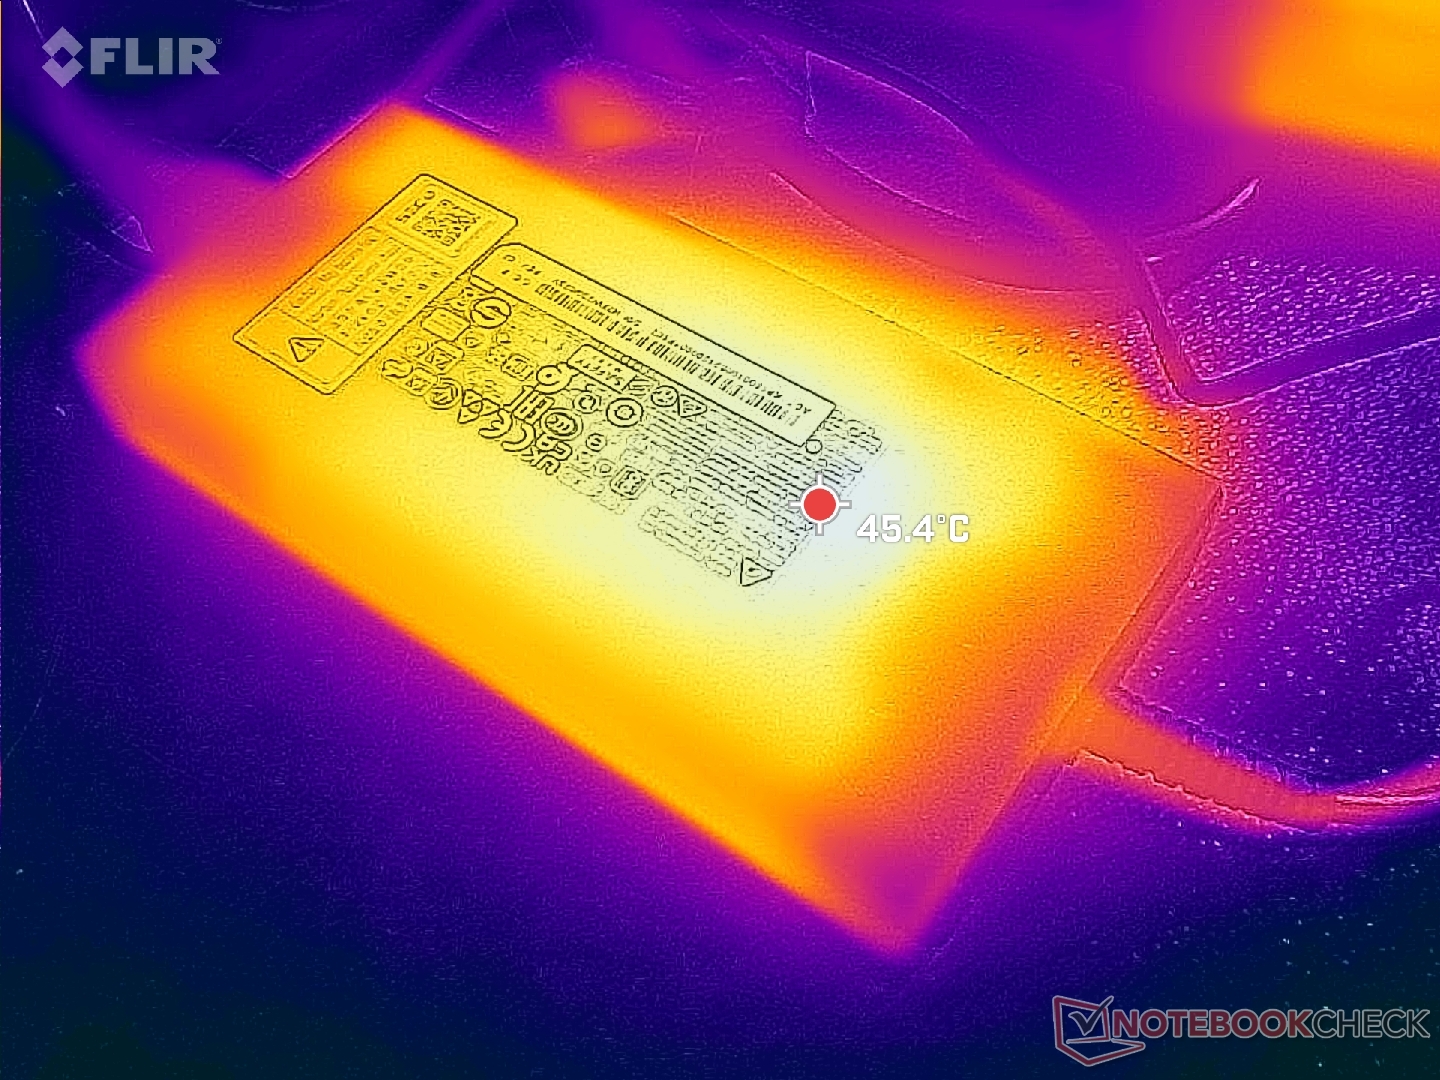
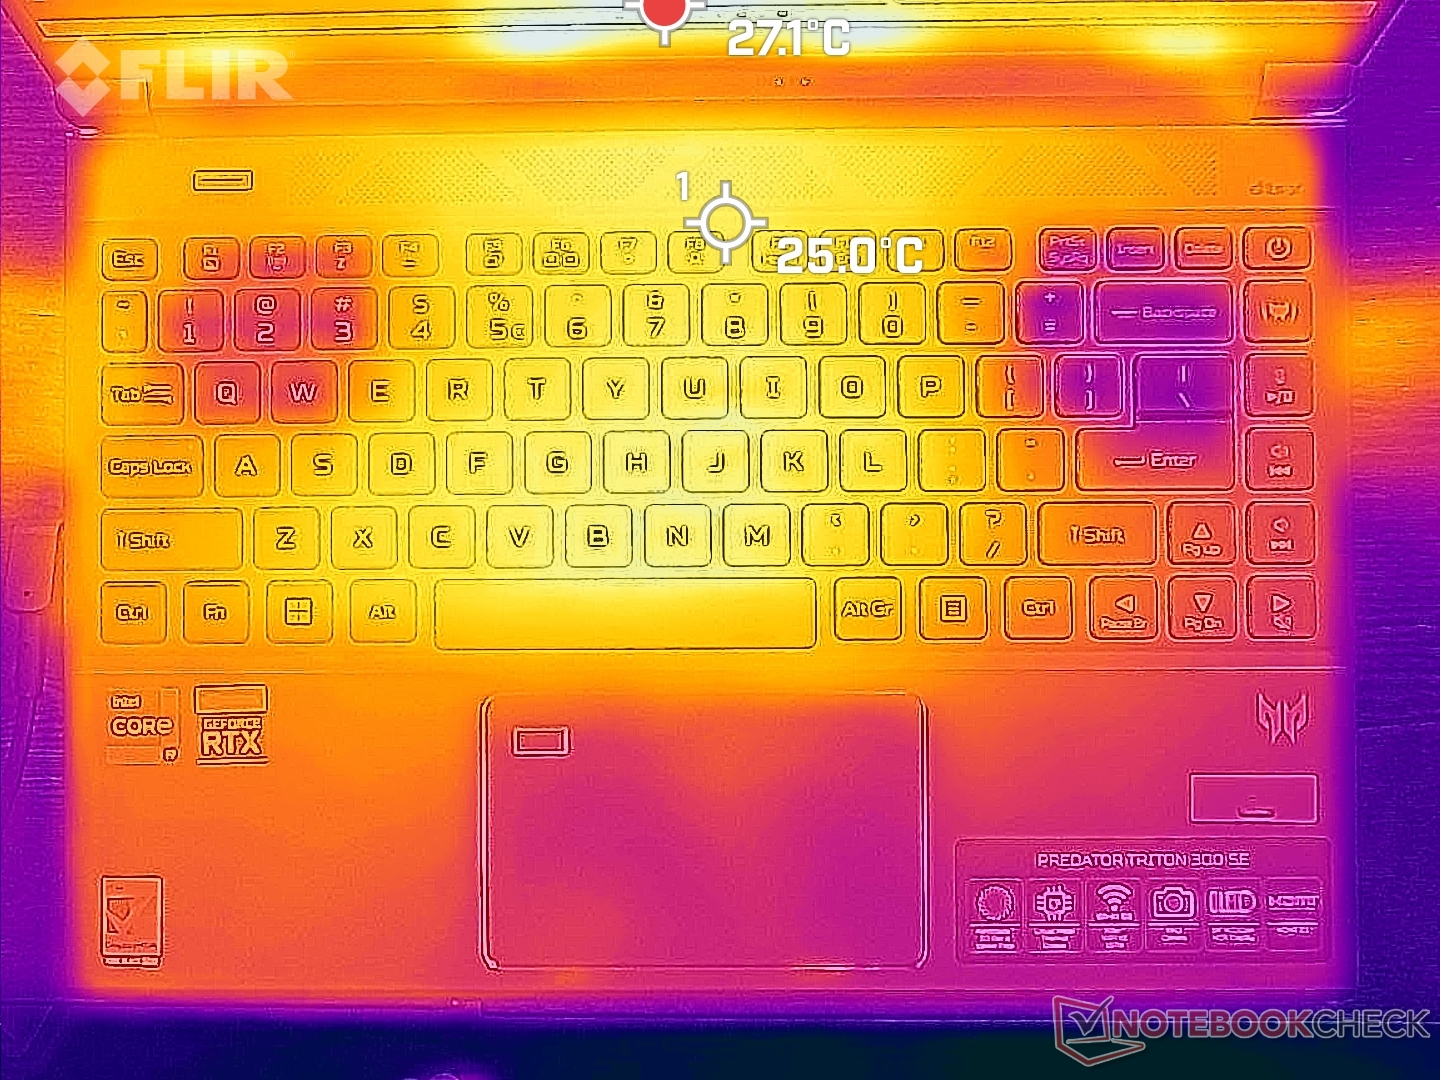
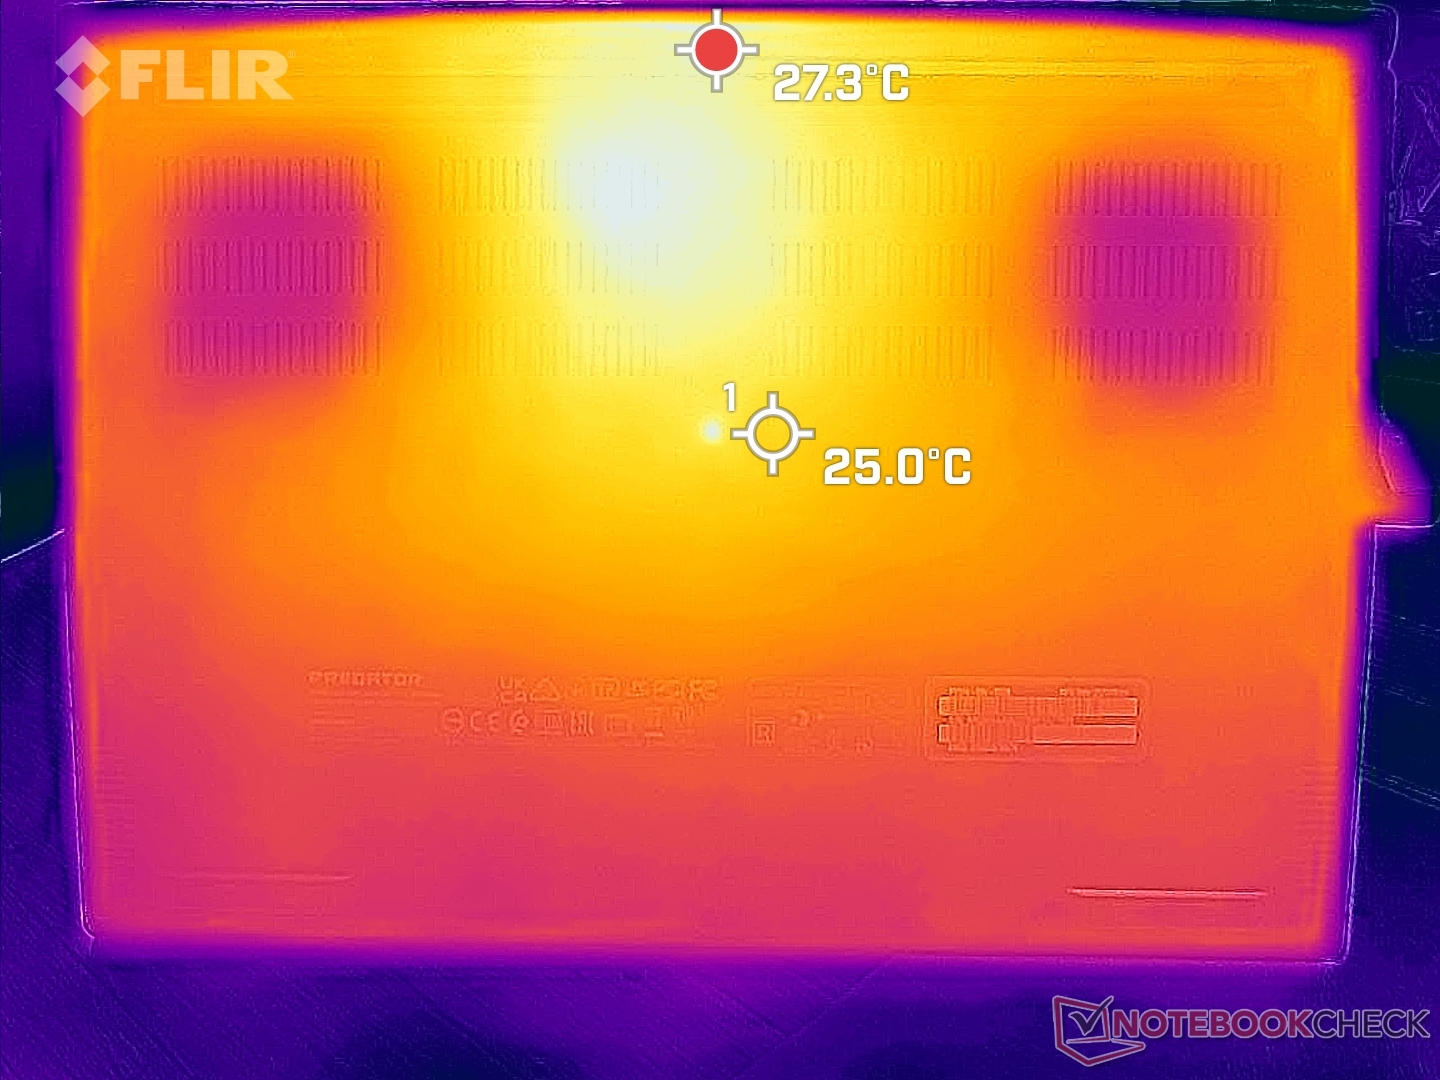
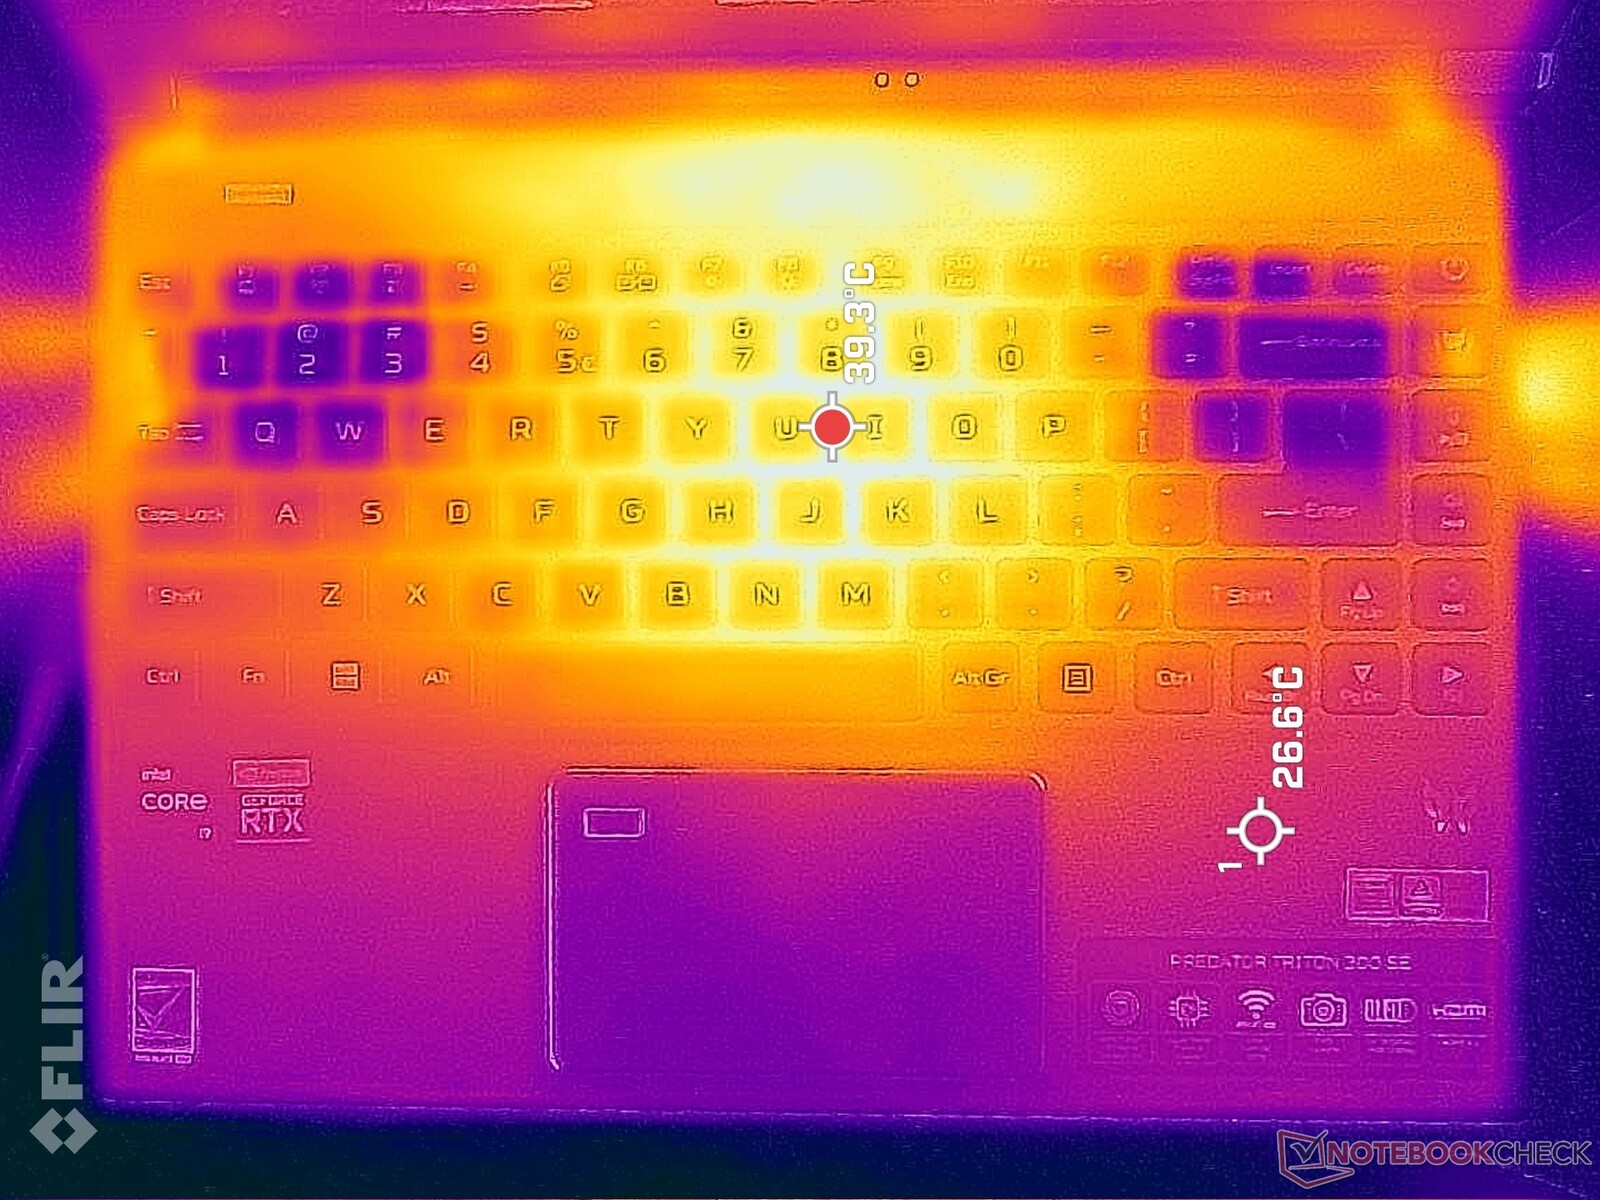
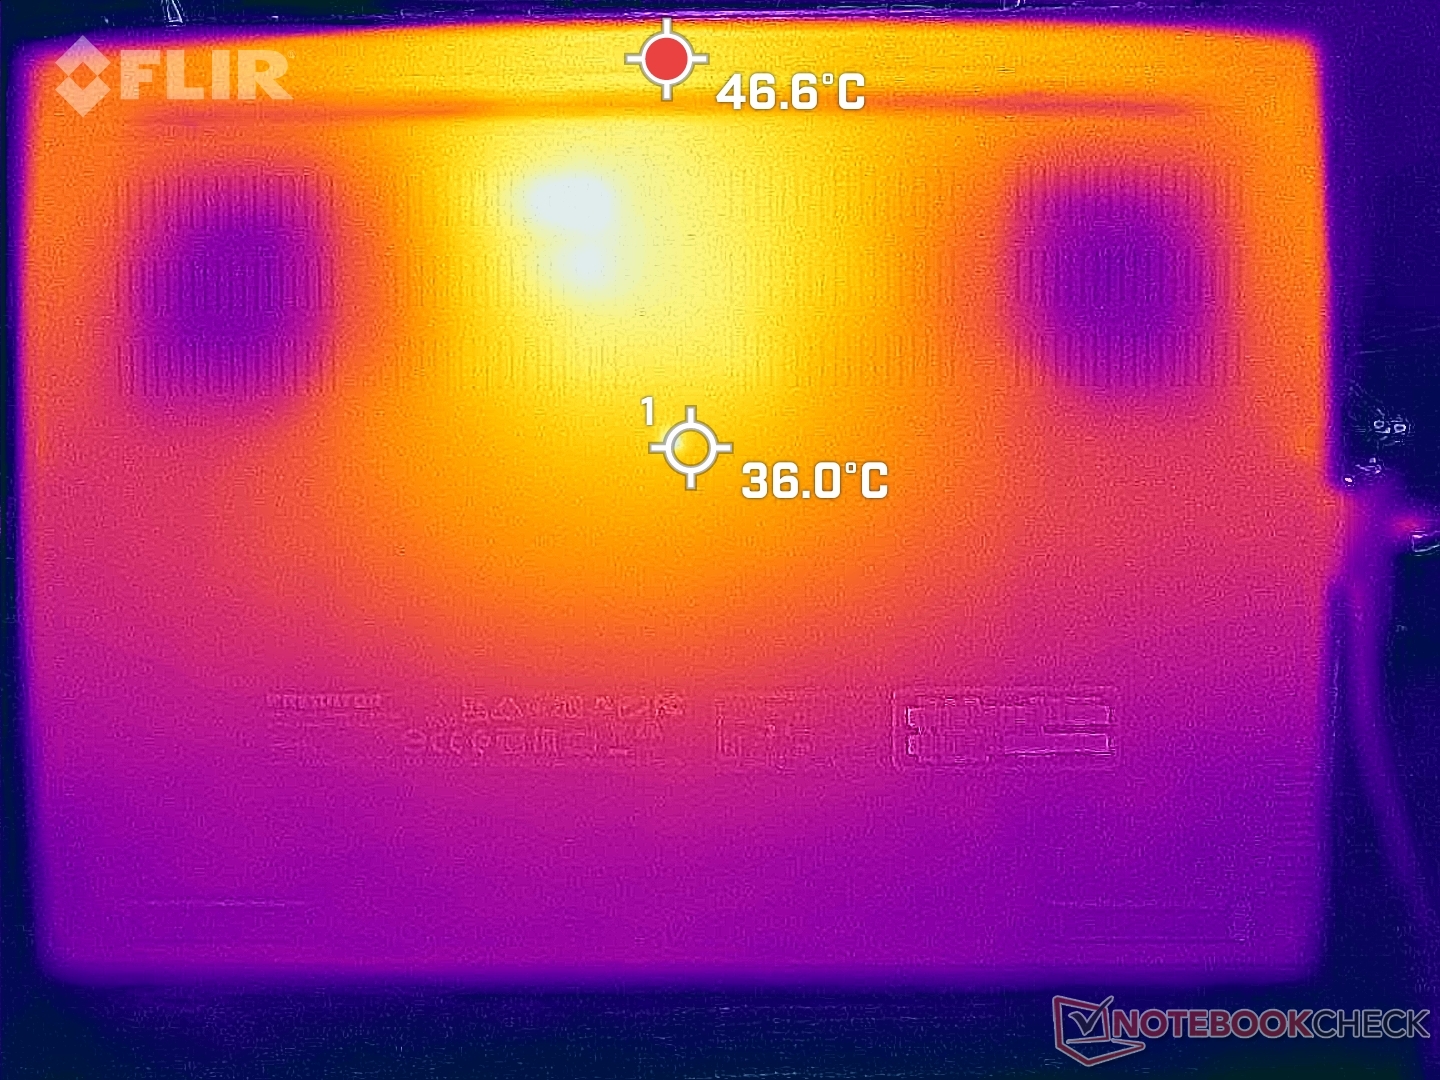
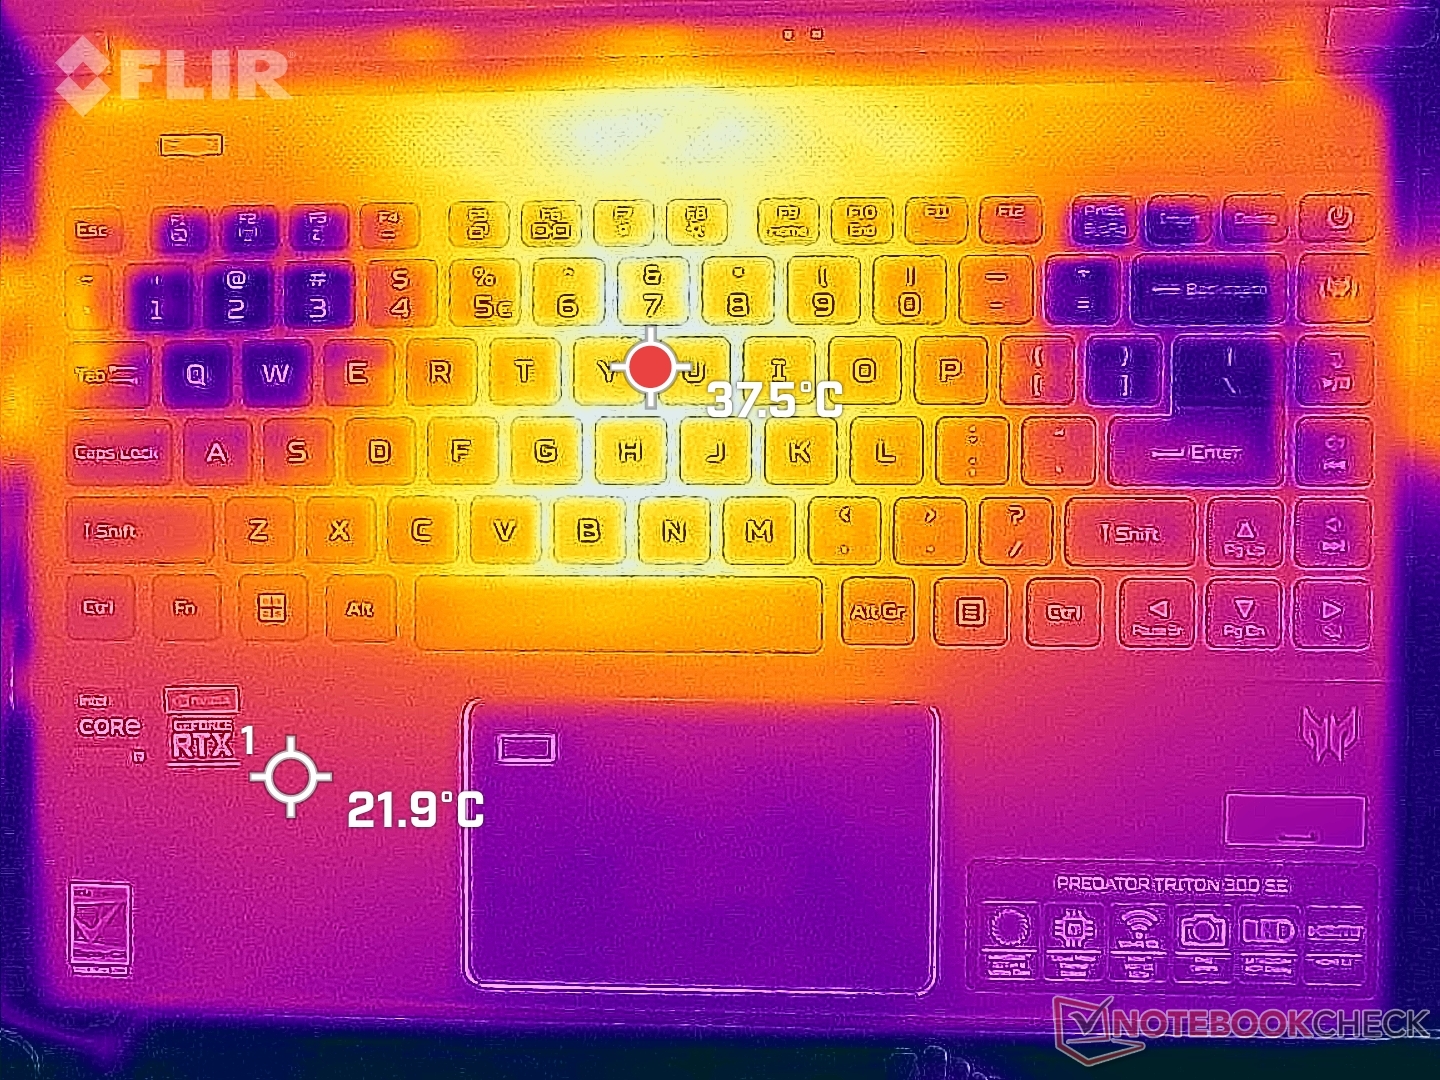
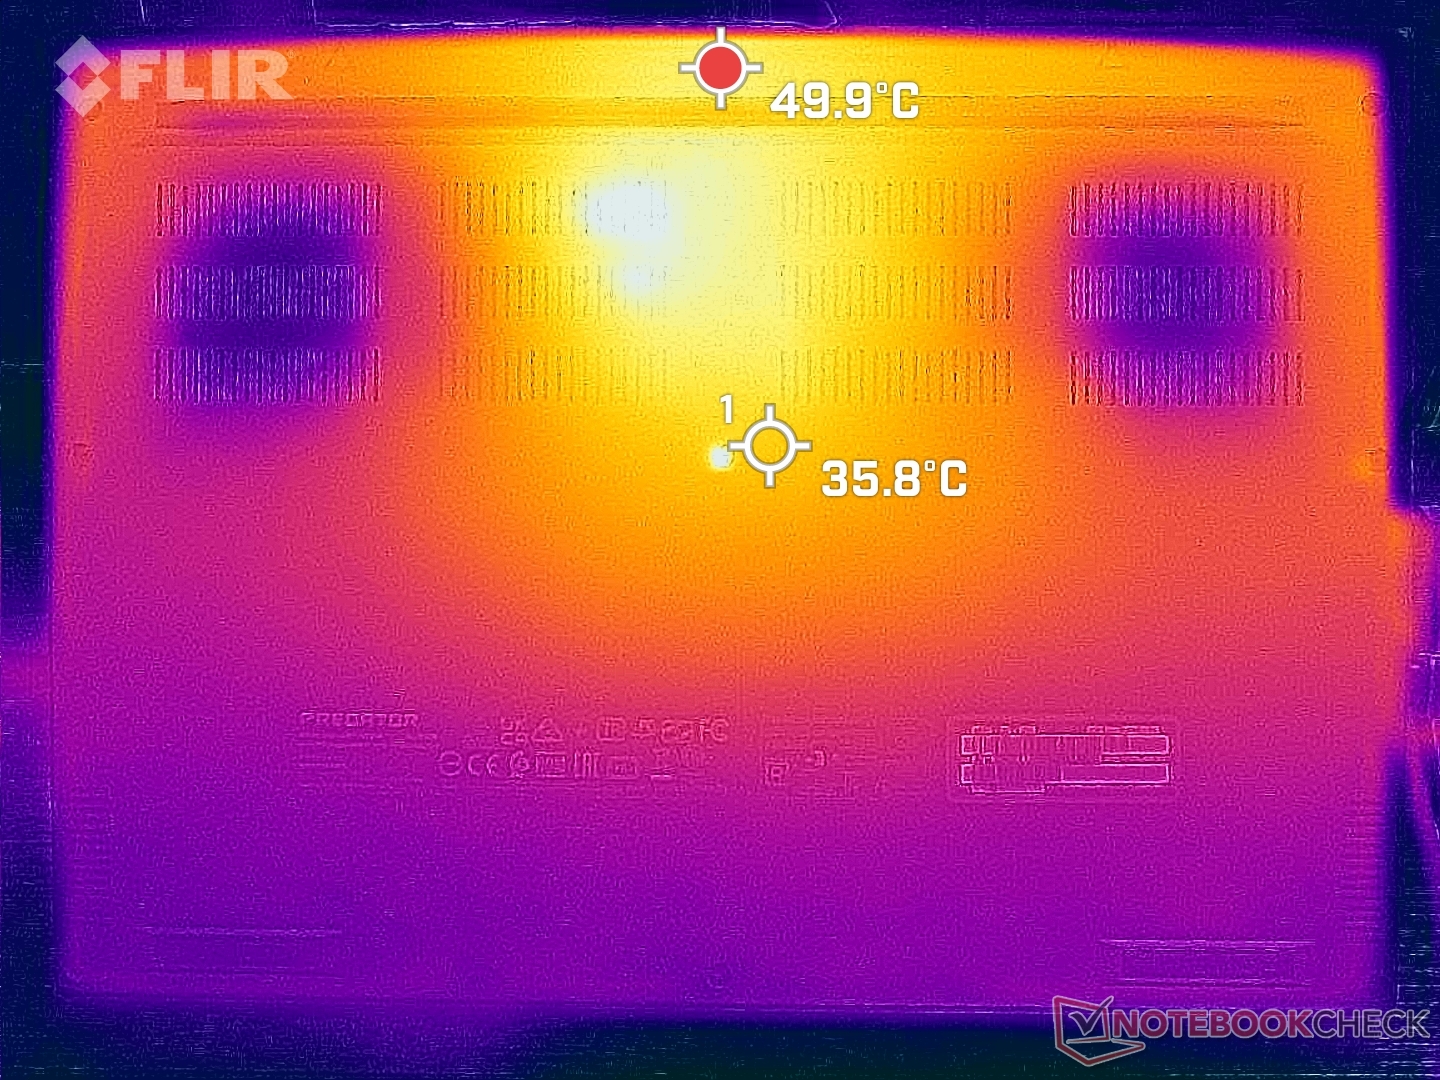
Temperature
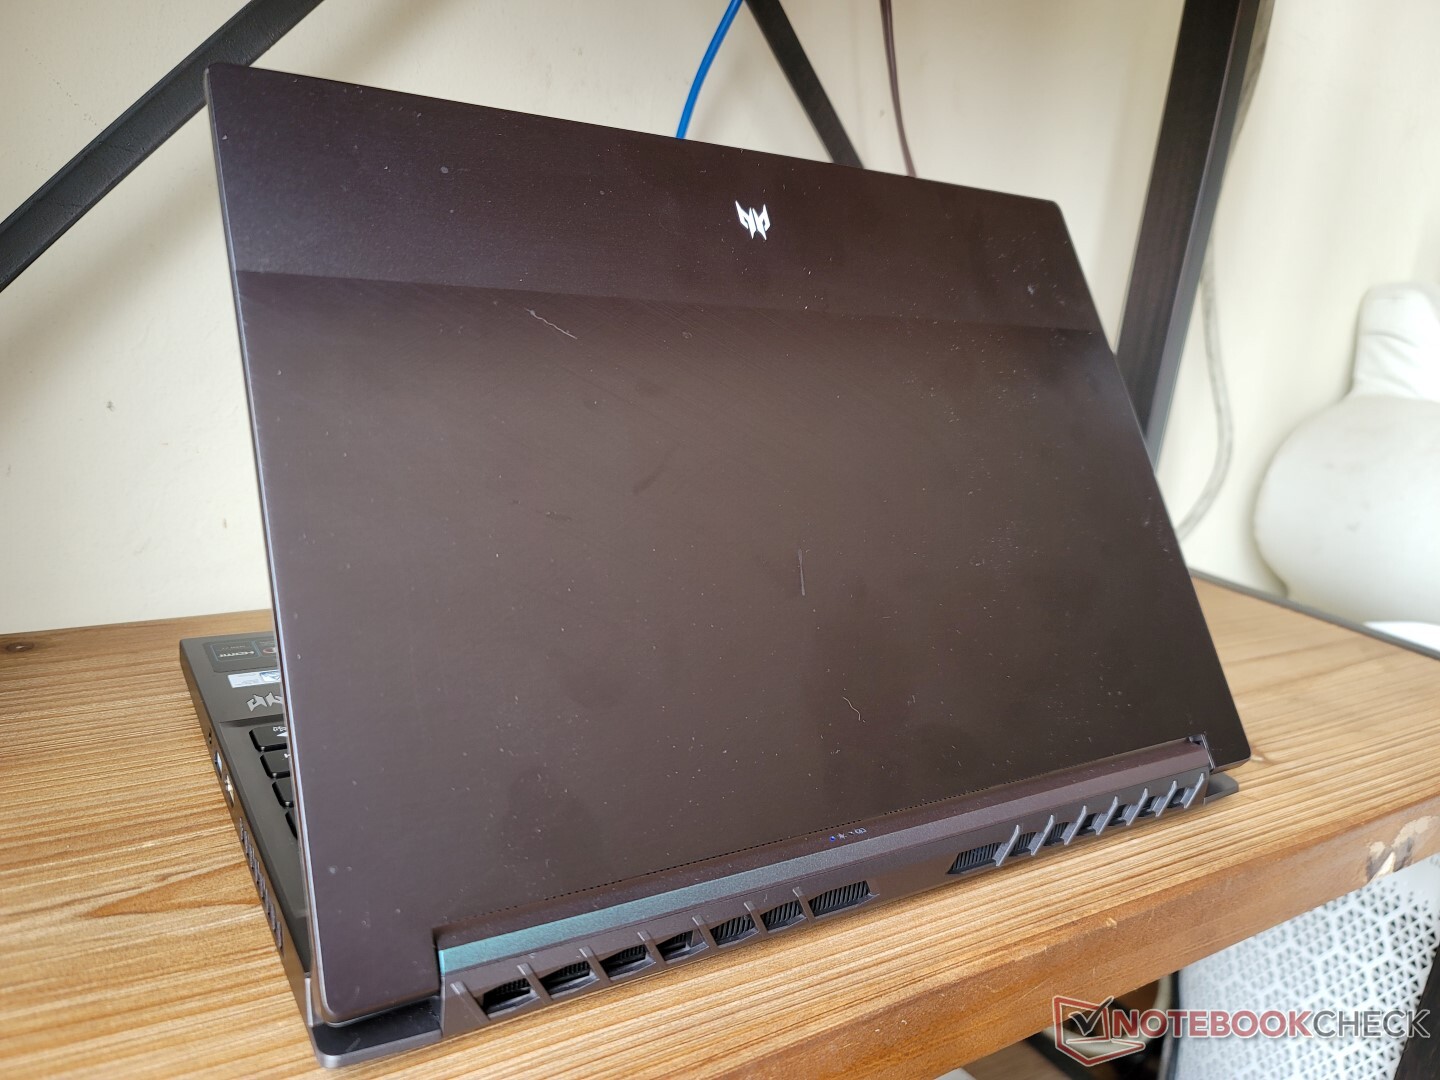
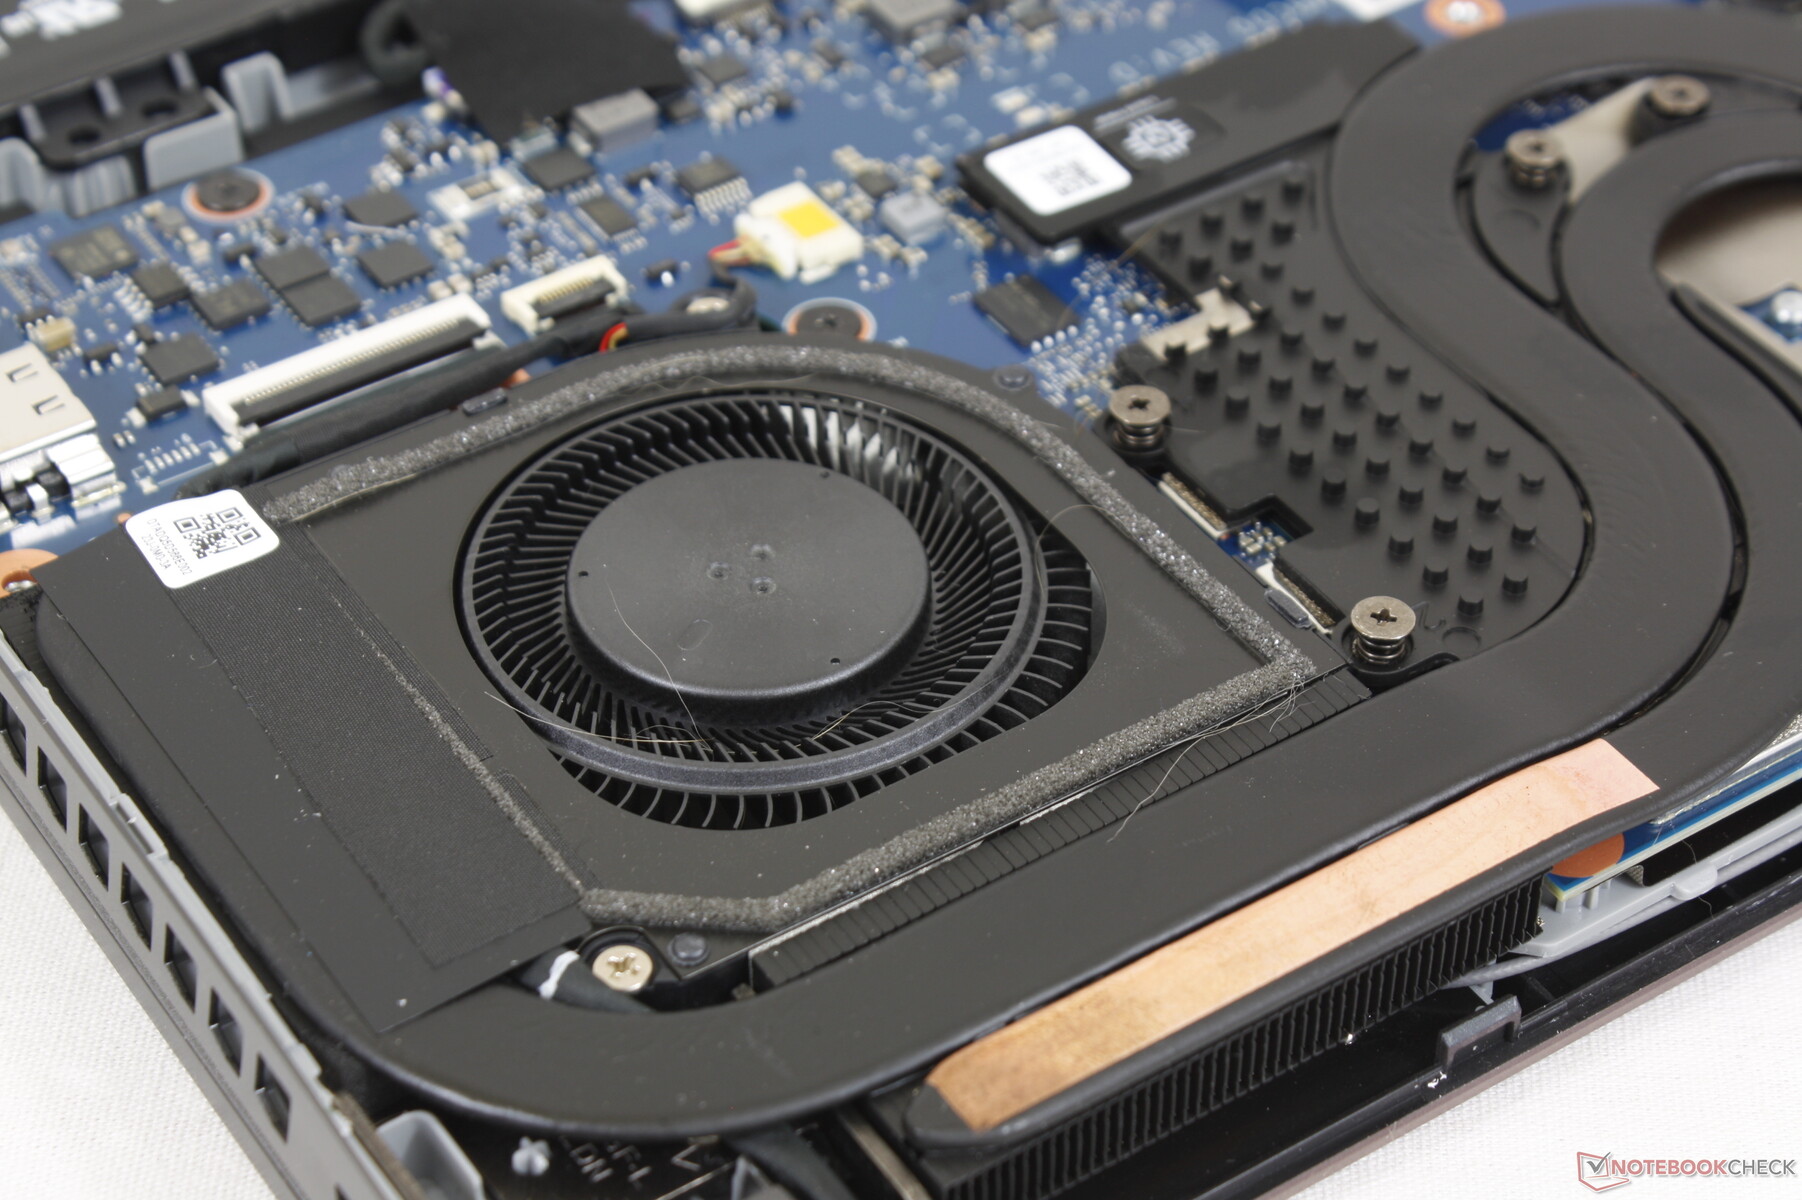
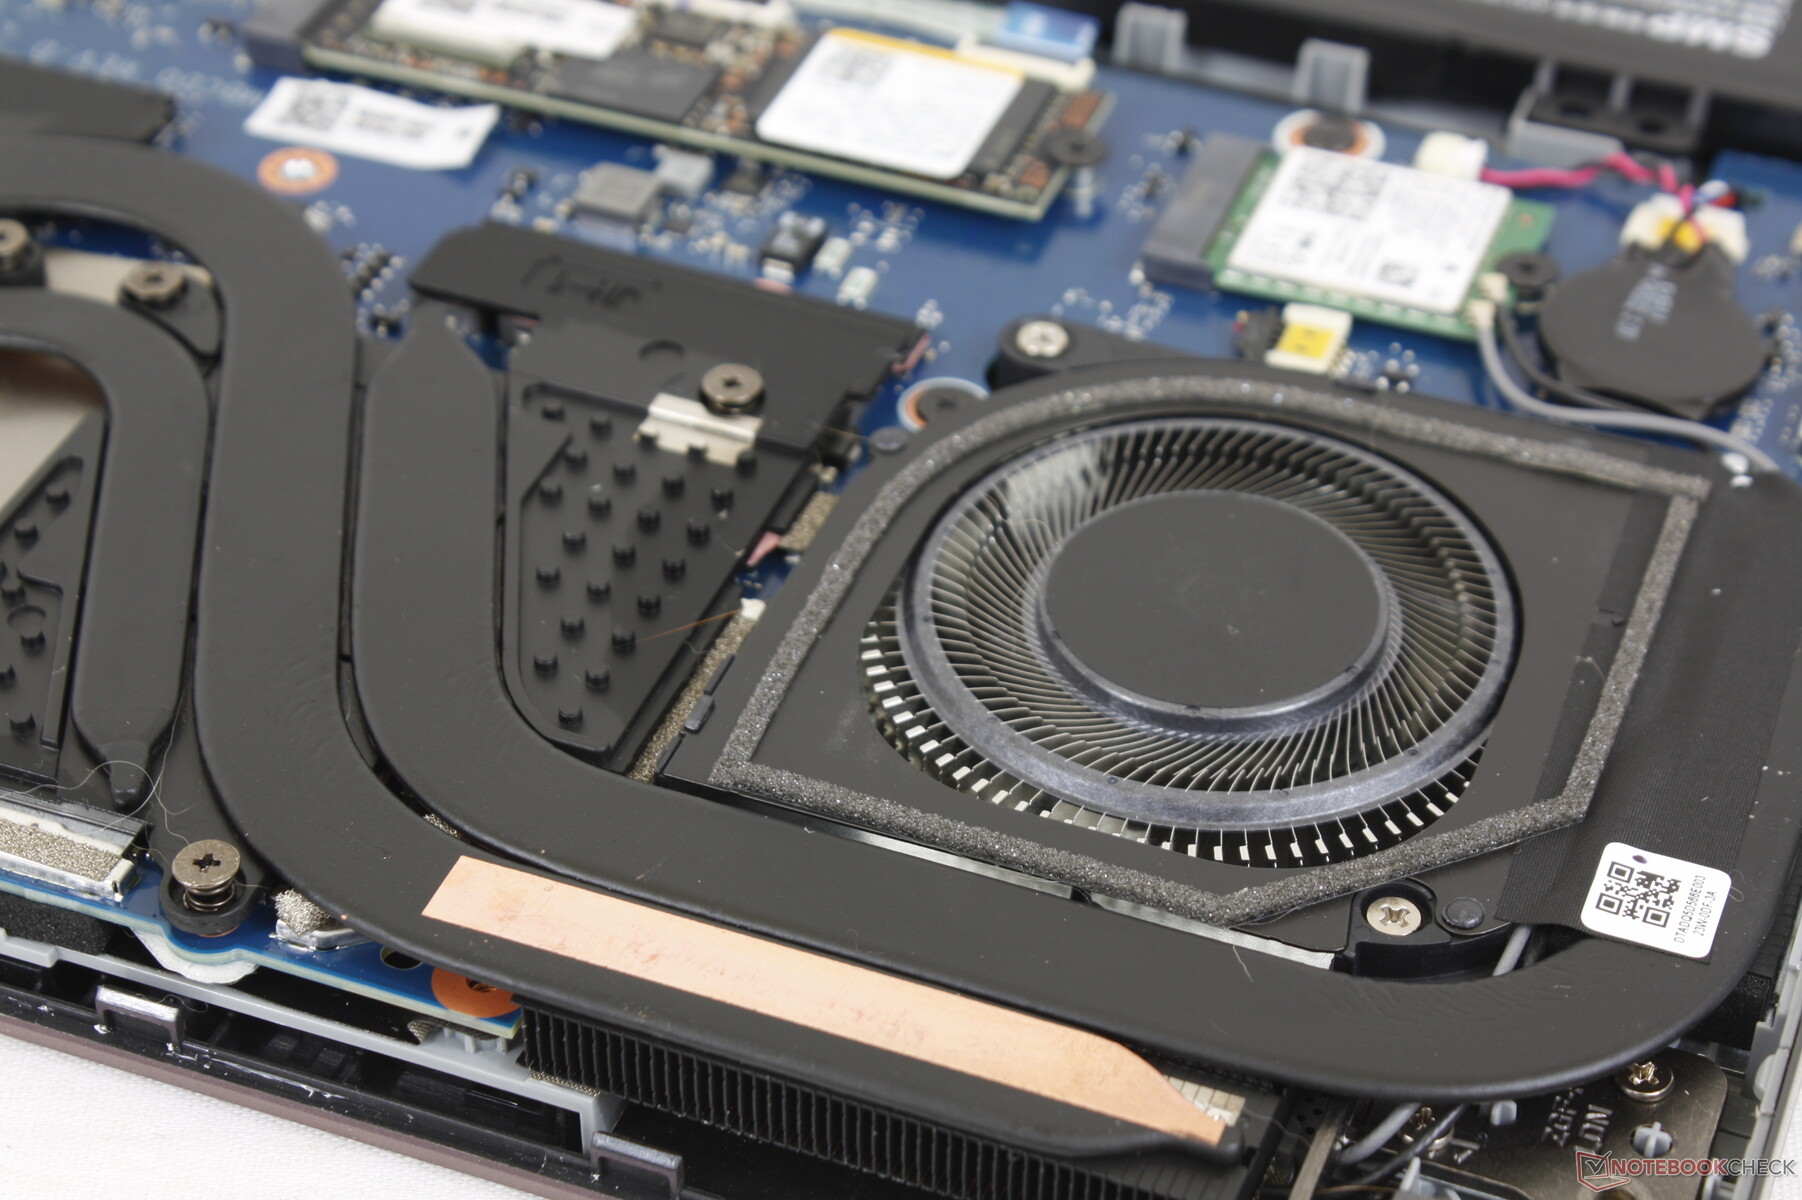
Hot spots can reach up to 43 C and 46 C on the top and bottom, respectively, toward the rear of the chassis as shown by the heat maps below. Overall surface temperatures are noticeably cooler than what we recorded on the Zephyrus G14 or Alienware x14 where hot spots can easily reach over 50 C when under similar conditions.
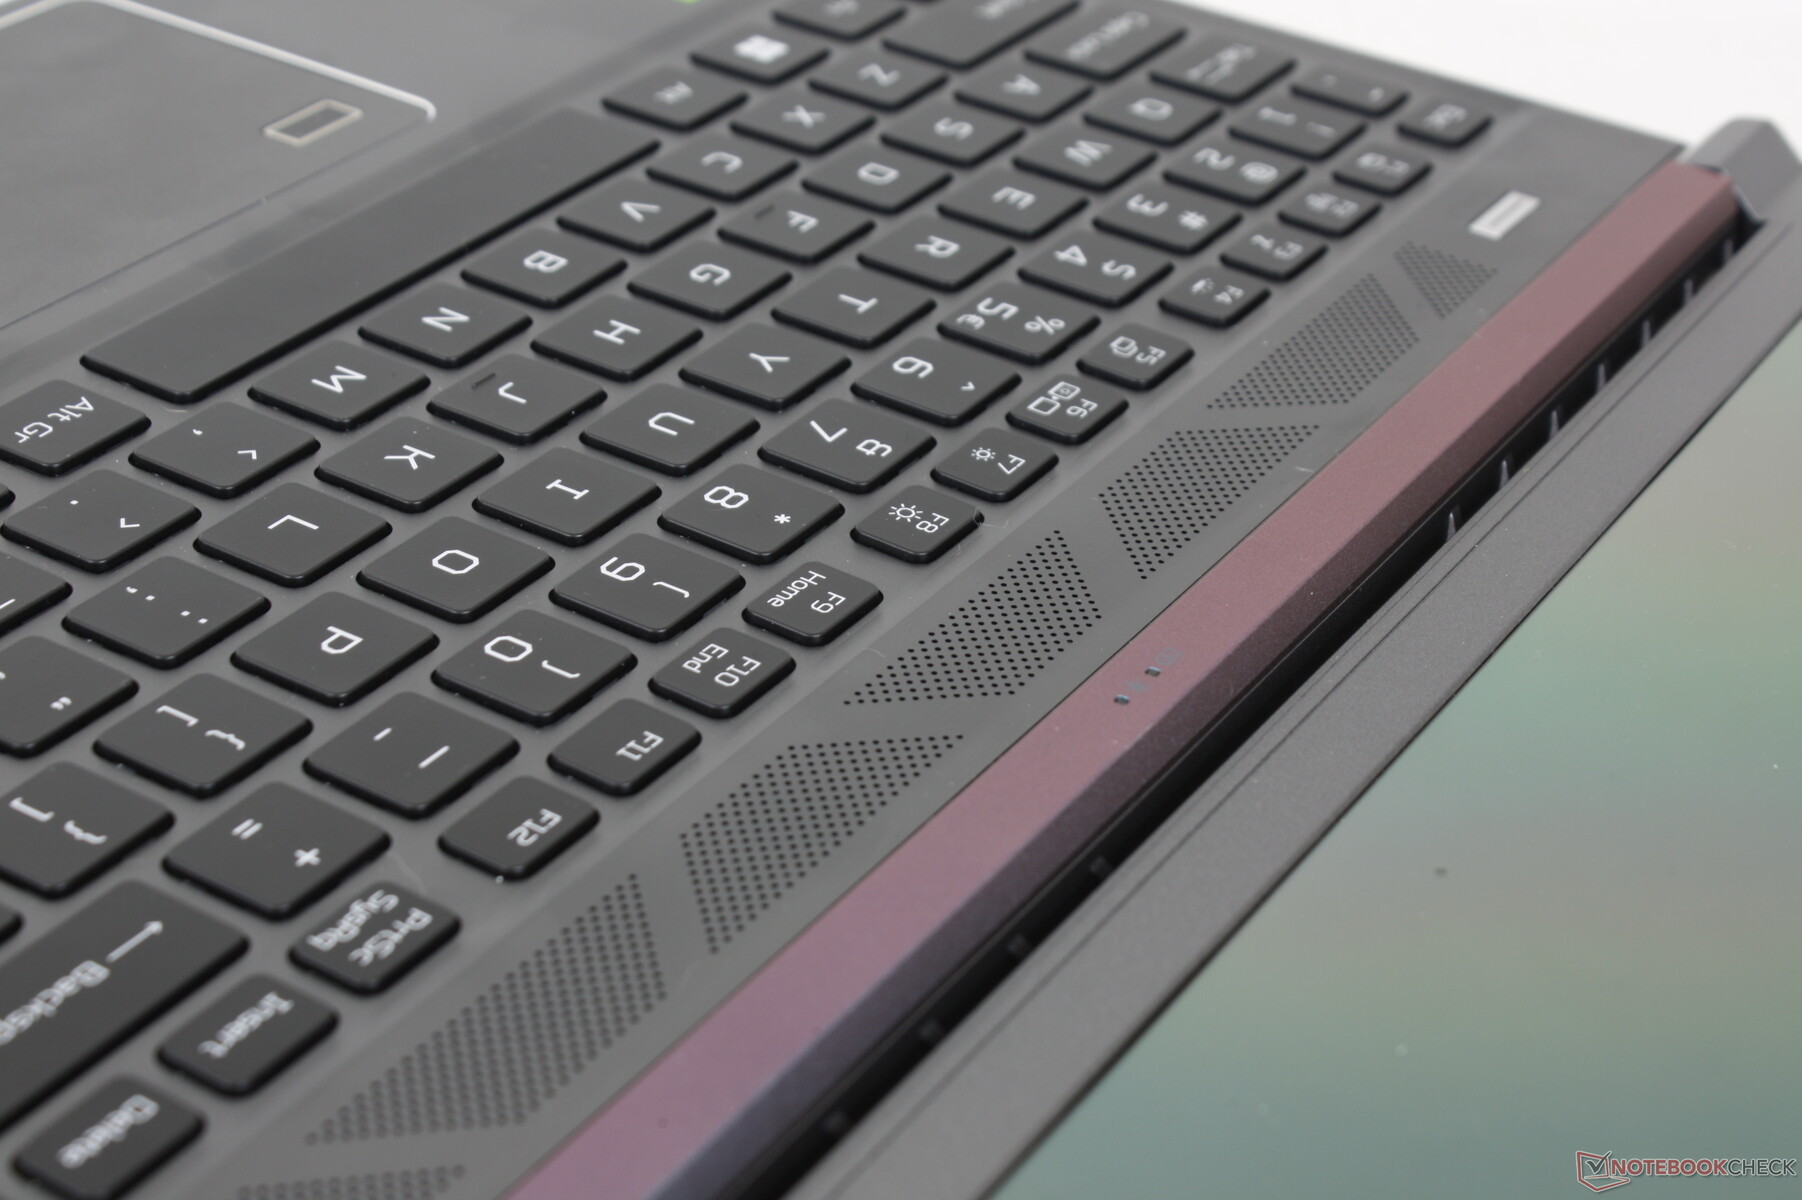
Almost half of the chassis is dedicated to ventilation including the edges, rear, bottom, and sides of the keyboard. Be sure to not accidentally block any in the ventilation grilles to preserve optimal cooling.
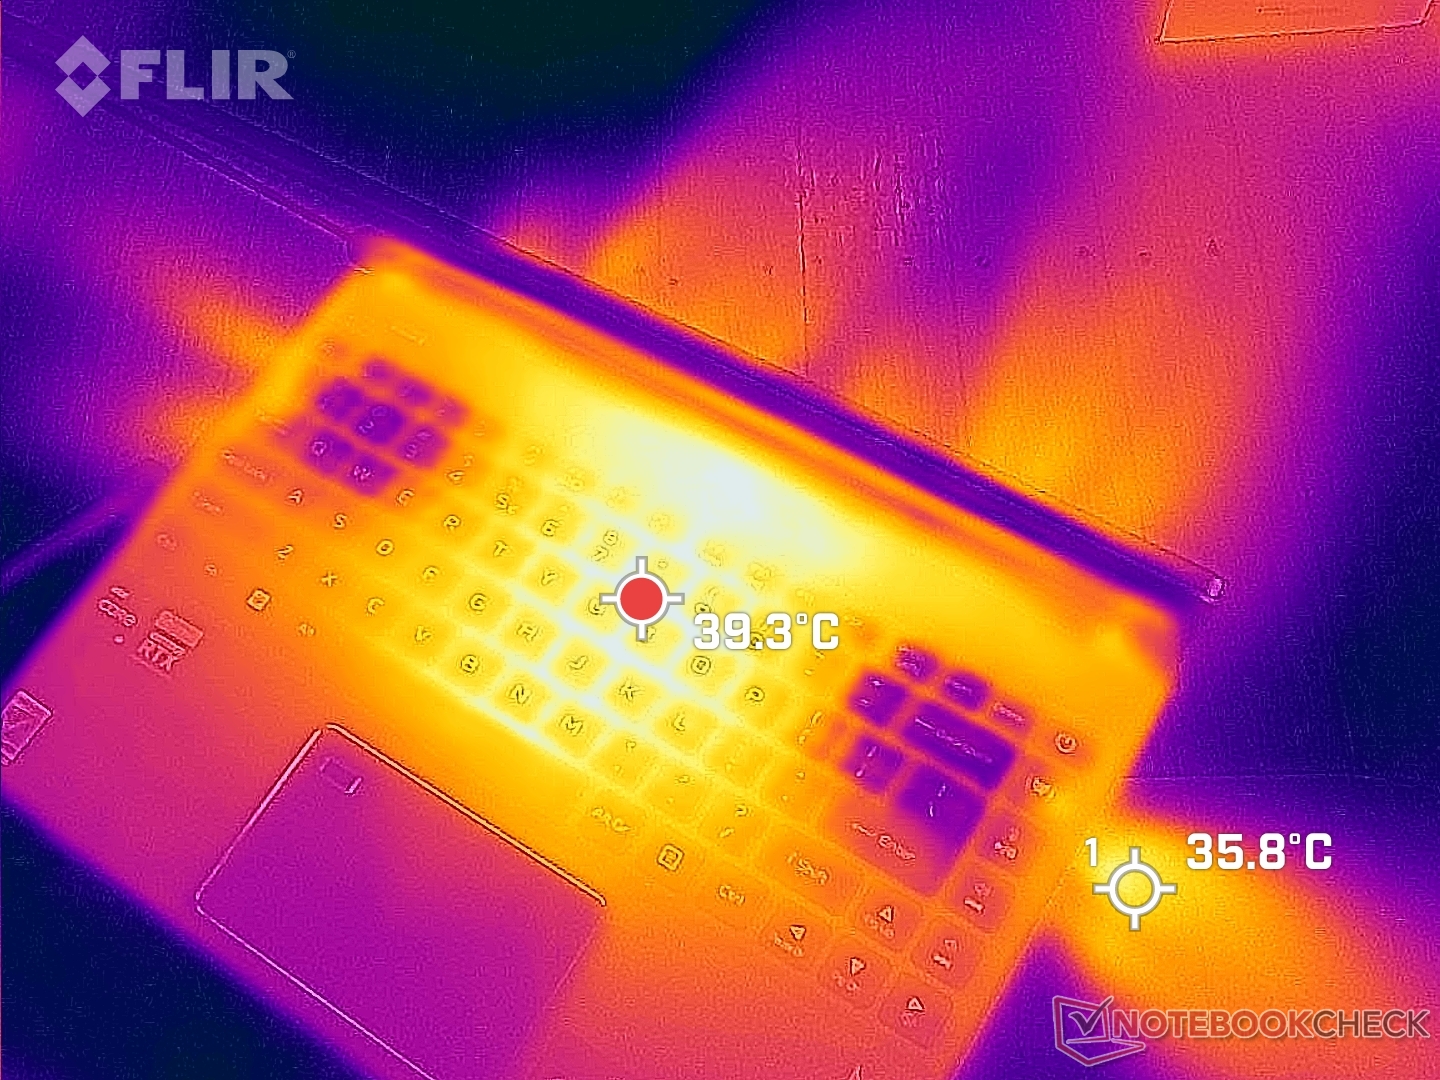
(±) The maximum temperature on the upper side is 43 °C / 109 F, compared to the average of 40.4 °C / 105 F, ranging from 21.2 to 68.8 °C for the class Gaming.
(-) The bottom heats up to a maximum of 46.4 °C / 116 F, compared to the average of 43.2 °C / 110 F
(+) In idle usage, the average temperature for the upper side is 26 °C / 79 F, compared to the device average of 33.8 °C / 93 F.
(±) Playing The Witcher 3, the average temperature for the upper side is 37.1 °C / 99 F, compared to the device average of 33.8 °C / 93 F.
(+) The palmrests and touchpad are reaching skin temperature as a maximum (32 °C / 89.6 F) and are therefore not hot.
(-) The average temperature of the palmrest area of similar devices was 28.9 °C / 84 F (-3.1 °C / -5.6 F).
| Acer Predator Triton 300 SE Intel Core i9-12900H, NVIDIA GeForce RTX 3060 Laptop GPU | Asus ROG Zephyrus G14 GA402RJ AMD Ryzen 7 6800HS, AMD Radeon RX 6700S | Razer Blade 14 Ryzen 9 6900HX AMD Ryzen 9 6900HX, NVIDIA GeForce RTX 3070 Ti Laptop GPU | Alienware x14 i7 RTX 3060 Intel Core i7-12700H, NVIDIA GeForce RTX 3060 Laptop GPU | Dell Inspiron 14 Plus 7420 Intel Core i7-12700H, NVIDIA GeForce RTX 3050 4GB Laptop GPU | SCHENKER Vision 14 Intel Core i7-11370H, NVIDIA GeForce RTX 3050 Ti Laptop GPU | |
|---|---|---|---|---|---|---|
| Heat | -24% | -13% | -1% | 8% | -12% | |
| Maximum Upper Side * | 43 | 53 -23% | 40.6 6% | 51.3 -19% | 40 7% | 49.7 -16% |
| Maximum Bottom * | 46.4 | 54 -16% | 42.6 8% | 44.4 4% | 36.4 22% | 56 -21% |
| Idle Upper Side * | 28.2 | 34 -21% | 38 -35% | 27.2 4% | 27 4% | 28.8 -2% |
| Idle Bottom * | 28.4 | 38 -34% | 37 -30% | 26.6 6% | 29.2 -3% | 30.6 -8% |
* ... smaller is better
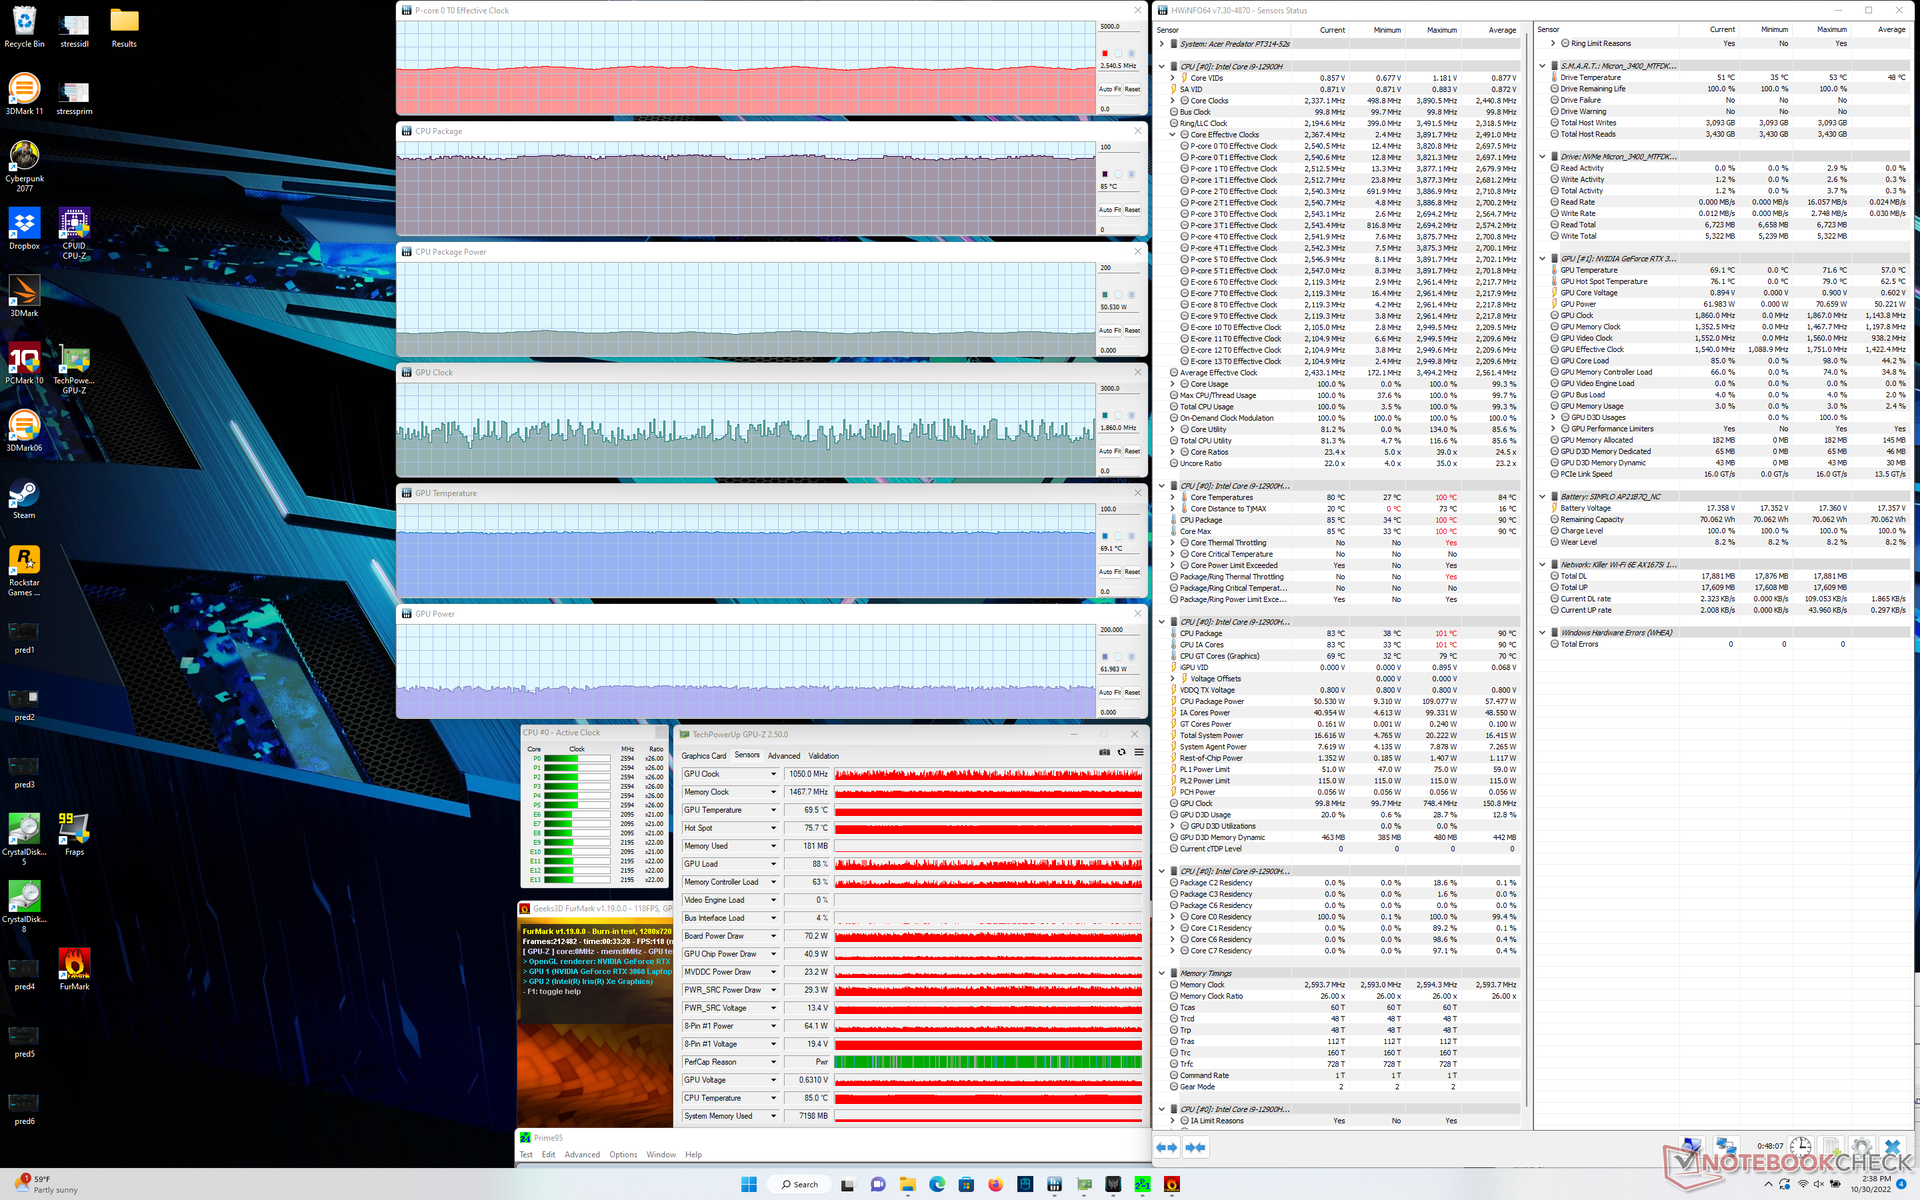
Stress Test
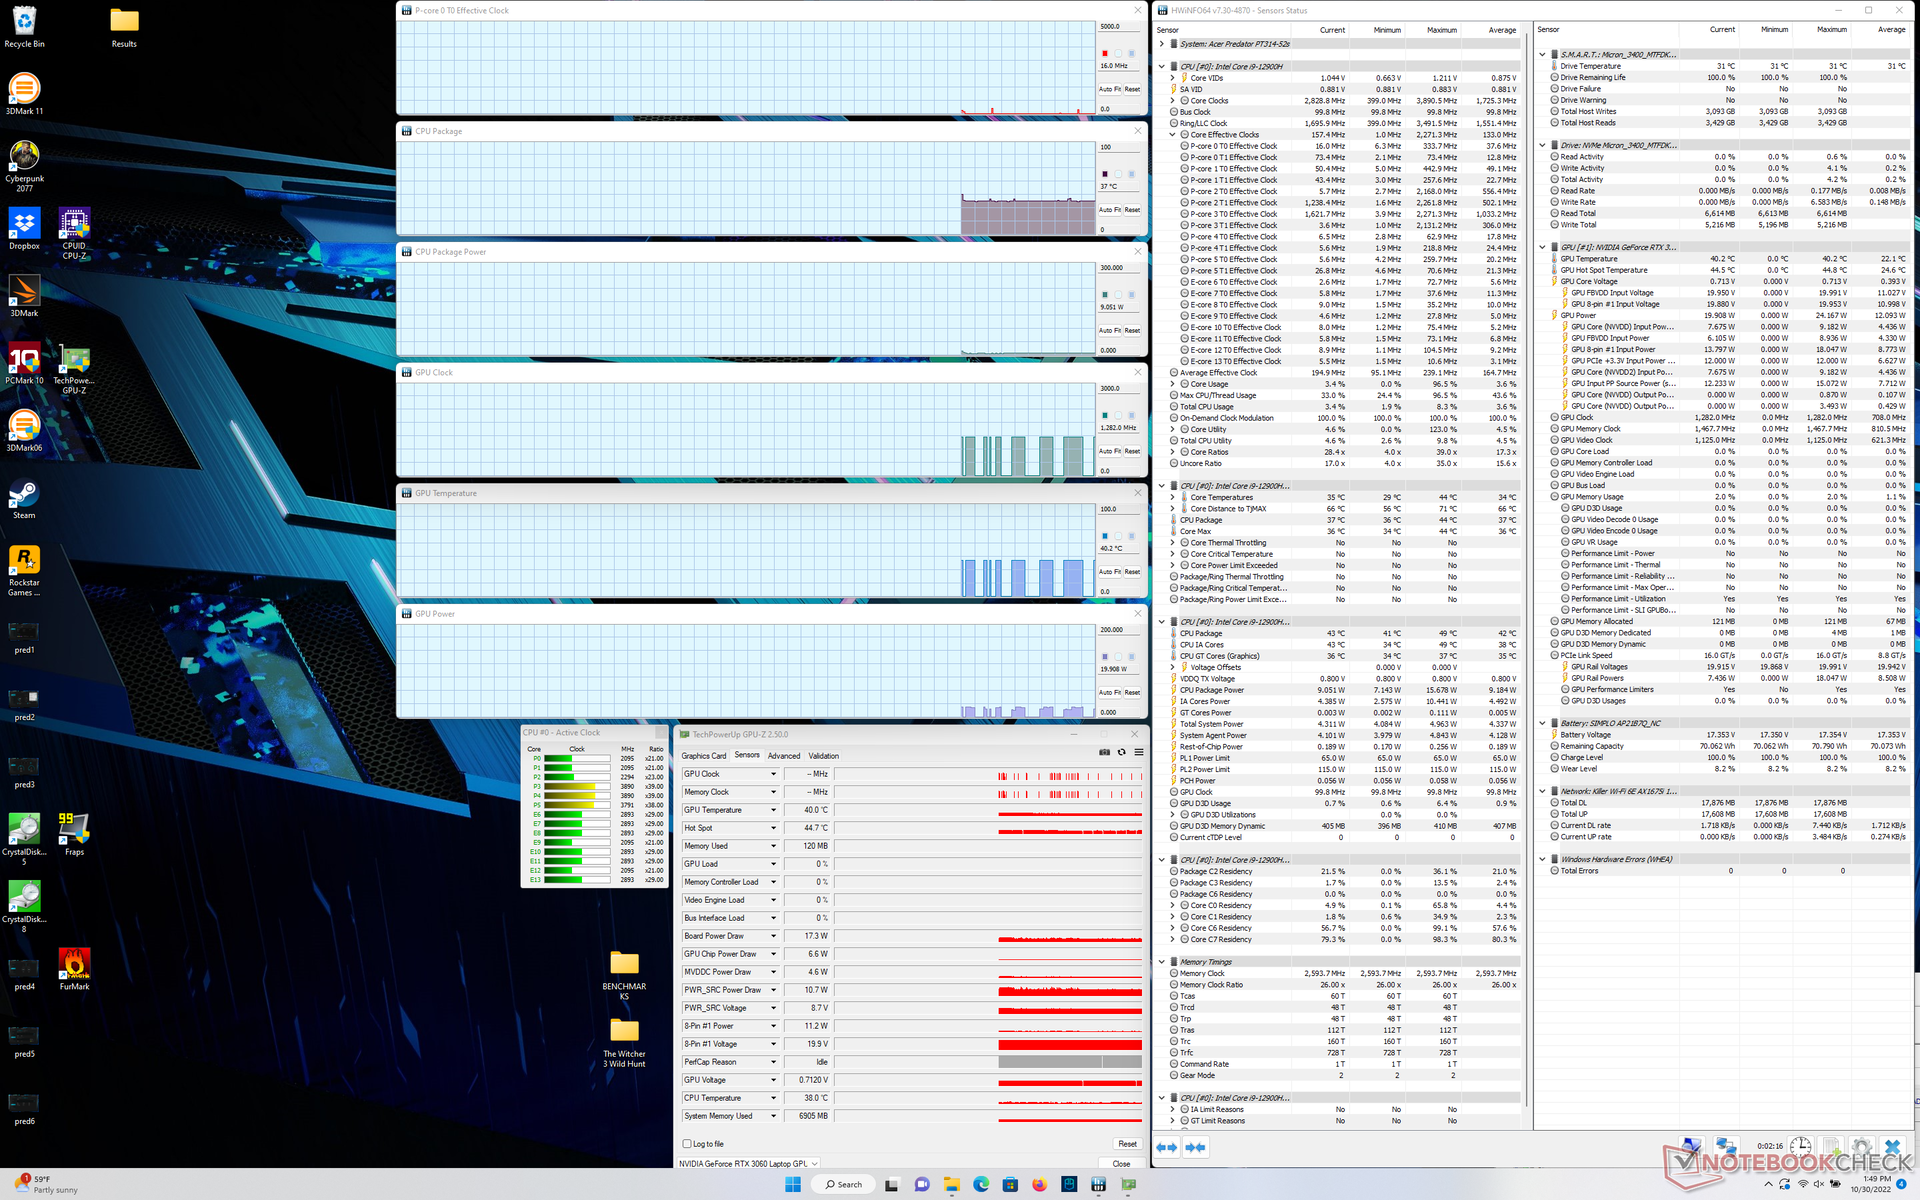
CPU clock rates, temperature, and board power draw would spike to 3.7 GHz, 100 C, and 108 W, respectively, when initiating Prime95 stress. After just a couple of seconds, however, clock rate and power draw would begin falling before stabilizing at just 3.0 GHz and 69 W, respectively, while maintaining a core temperature of 100 C. Very few laptop CPUs stabilize at temperature ranges over 90 C and so this is a bit alarming to see on the Acer. The Dell Precision 5470 with the same Core i9-12900H CPU, for example, would stabilize at up to 2.4 GHz and 80 C when under similar conditions. It's clear that the Acer system is pushing the Core i9 CPU as far as the cooling solution can allow.
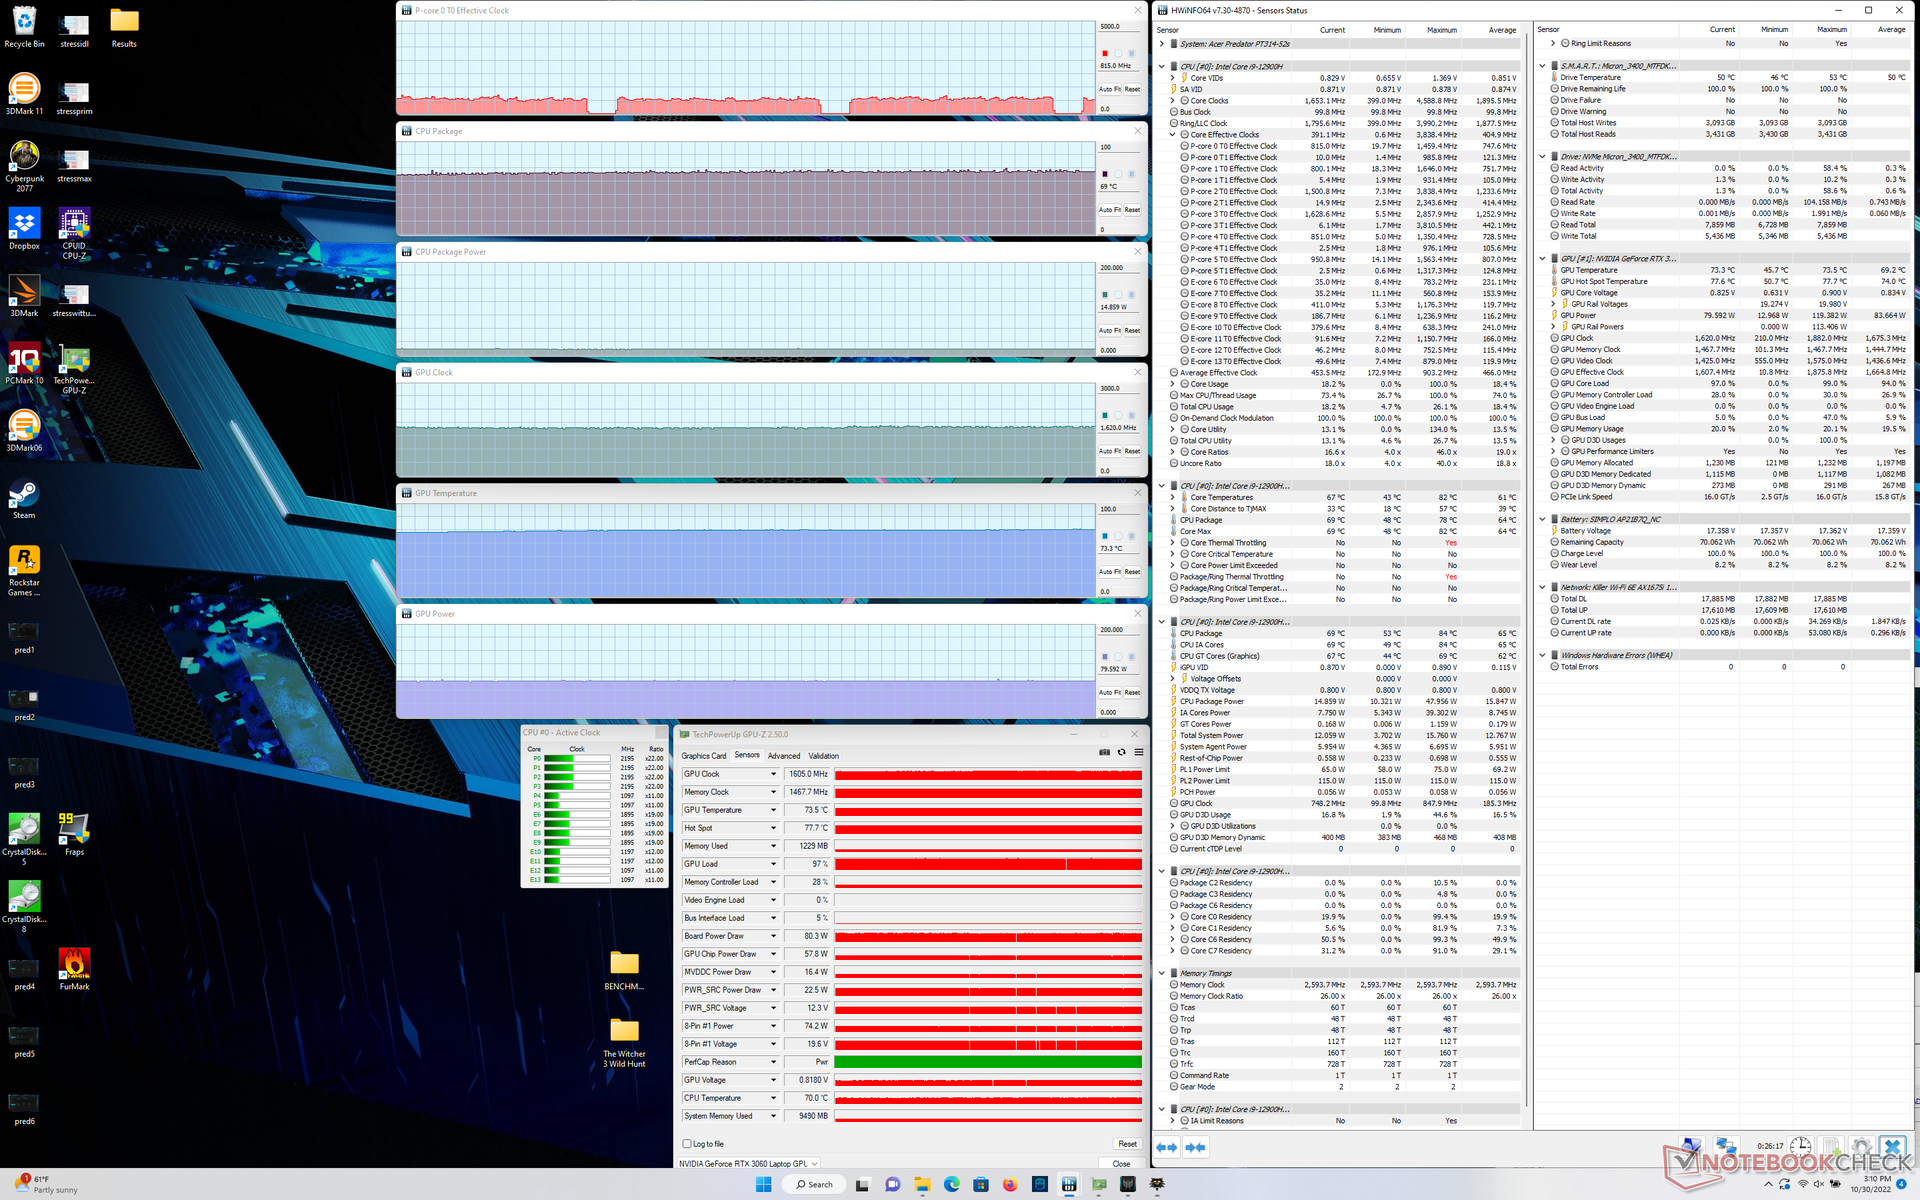
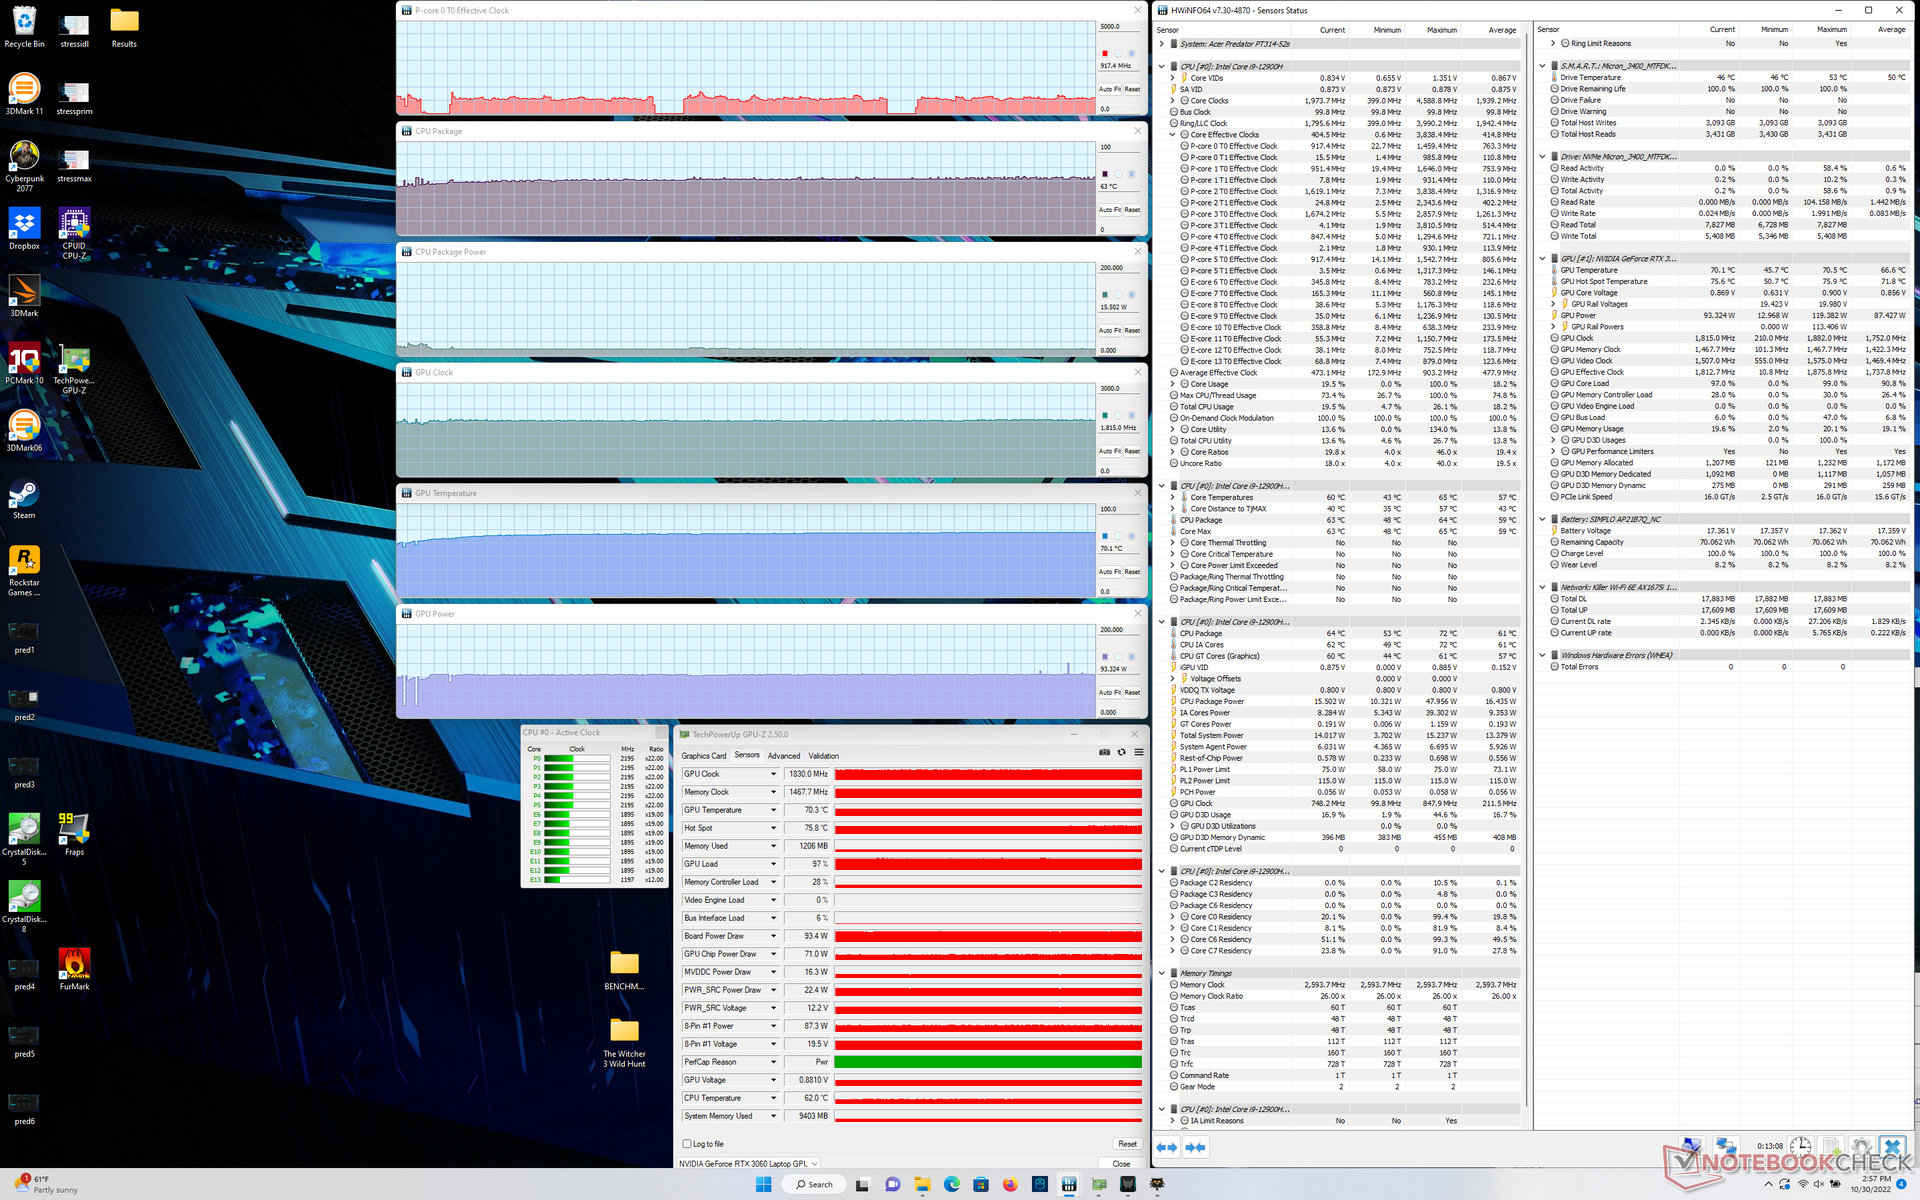
Running Witcher 3 on Turbo mode causes the Nvidia GPU to stabilize at 1830 MHz, 70 C, and 93 W. If Turbo mode is disabled, clock rates and board power draw would drop to 1605 MHz and 80 W, respectively, while temperature would rise slightly to 73 C because of the lower fan ceiling. Thus, users must enable Turbo mode if they wish to fully exploit the 95 W TGP GPU.
Running on battery power limits performance especially since Turbo mode requires mains. A Fire Strike test on batteries would return Physics and Graphics scores of 14166 and 11131 points, respectively, compared to 31176 and 20405 points when on mains.
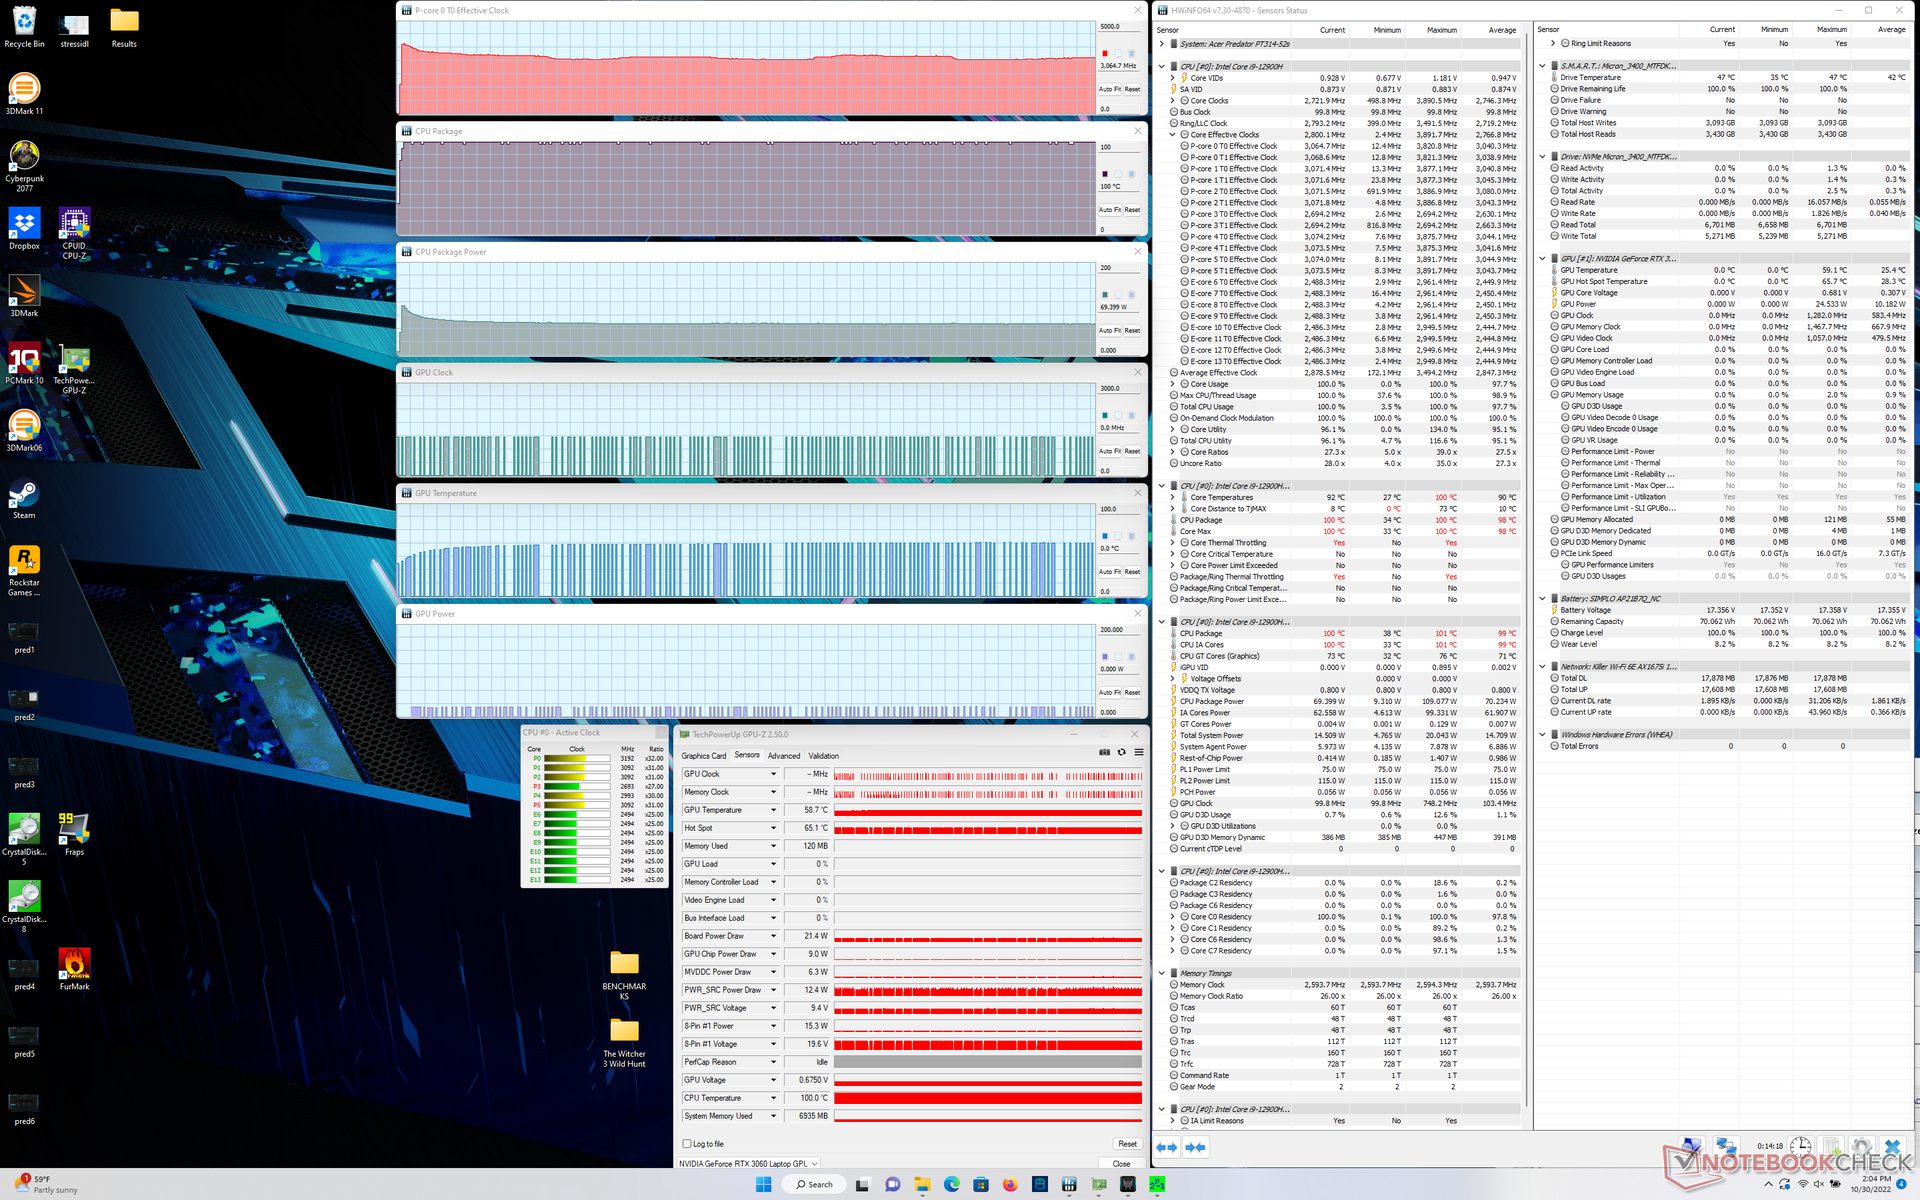
| CPU Clock (GHz) | GPU Clock (MHz) | Average CPU Temperature (°C) | Average GPU Temperature (°C) | |
| System Idle | -- | -- | 37 | 40 |
| Prime95 Stress | 3.0 - 3.1 | -- | 100 | 59 |
| Prime95 + FurMark Stress | 2.5 | ~1050 | 85 | 69 |
| Witcher 3 Stress (Turbo off) | ~0.8 | 1605 | 69 | 73 |
| Witcher 3 Stress (Turbo on) | ~0.8 | 1830 | 63 | 70 |
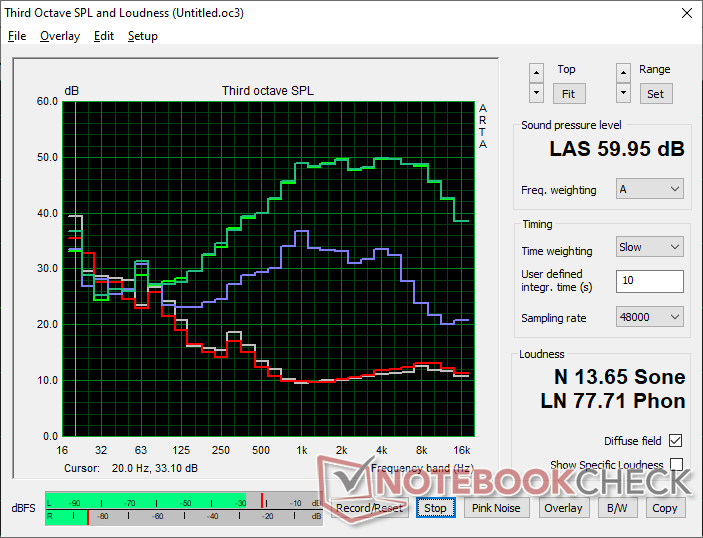
Speakers
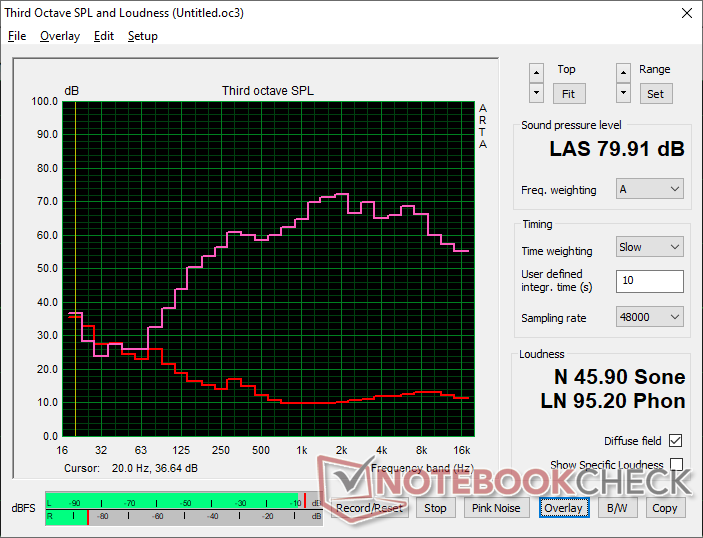
Acer Predator Triton 300 SE audio analysis
(±) | speaker loudness is average but good (79.9 dB)
Bass 100 - 315 Hz
(±) | reduced bass - on average 10.3% lower than median
(±) | linearity of bass is average (9.7% delta to prev. frequency)
Mids 400 - 2000 Hz
(±) | higher mids - on average 5% higher than median
(+) | mids are linear (4% delta to prev. frequency)
Highs 2 - 16 kHz
(±) | higher highs - on average 5.5% higher than median
(±) | linearity of highs is average (7.6% delta to prev. frequency)
Overall 100 - 16.000 Hz
(±) | linearity of overall sound is average (15.1% difference to median)
Compared to same class
» 29% of all tested devices in this class were better, 6% similar, 64% worse
» The best had a delta of 6%, average was 18%, worst was 132%
Compared to all devices tested
» 17% of all tested devices were better, 4% similar, 79% worse
» The best had a delta of 4%, average was 25%, worst was 134%
Apple MacBook Pro 16 2021 M1 Pro audio analysis
(+) | speakers can play relatively loud (84.7 dB)
Bass 100 - 315 Hz
(+) | good bass - only 3.8% away from median
(+) | bass is linear (5.2% delta to prev. frequency)
Mids 400 - 2000 Hz
(+) | balanced mids - only 1.3% away from median
(+) | mids are linear (2.1% delta to prev. frequency)
Highs 2 - 16 kHz
(+) | balanced highs - only 1.9% away from median
(+) | highs are linear (2.7% delta to prev. frequency)
Overall 100 - 16.000 Hz
(+) | overall sound is linear (4.6% difference to median)
Compared to same class
» 0% of all tested devices in this class were better, 0% similar, 100% worse
» The best had a delta of 5%, average was 18%, worst was 45%
Compared to all devices tested
» 0% of all tested devices were better, 0% similar, 100% worse
» The best had a delta of 4%, average was 25%, worst was 134%
Energy Management
Power Consumption — More Efficient Than Last Generation Model
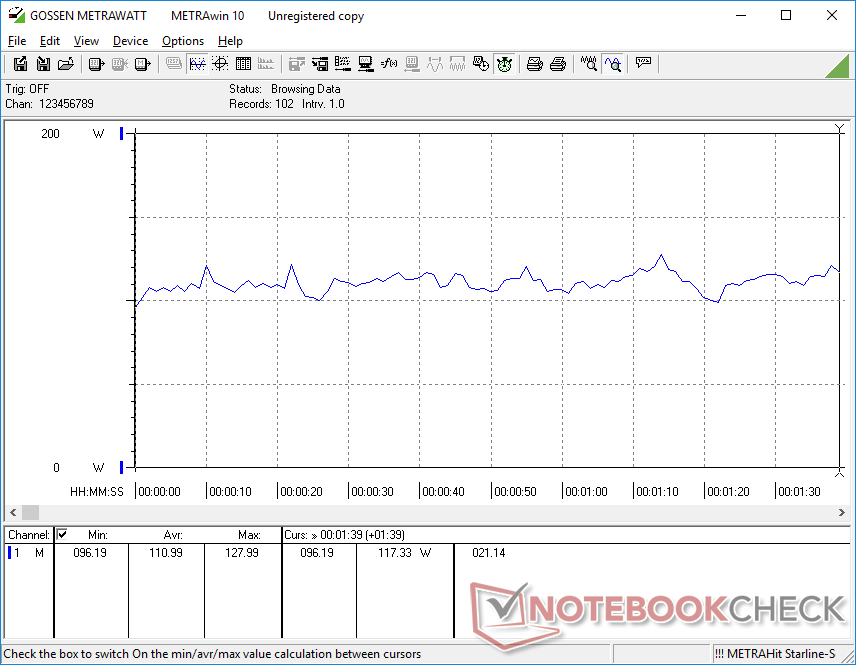
Overall consumption is quite similar to the Alienware x14 which ships with similar CPU and GPU options. Idling on desktop on power saver mode and on the lowest brightness setting would consume just 8 W while the highest performance mode and brightness settings would consume about 18 W. Note that power consumption and therefore battery life are sensitive to onscreen colors unlike on IPS panels as shown by our OLED power consumption measurements here.
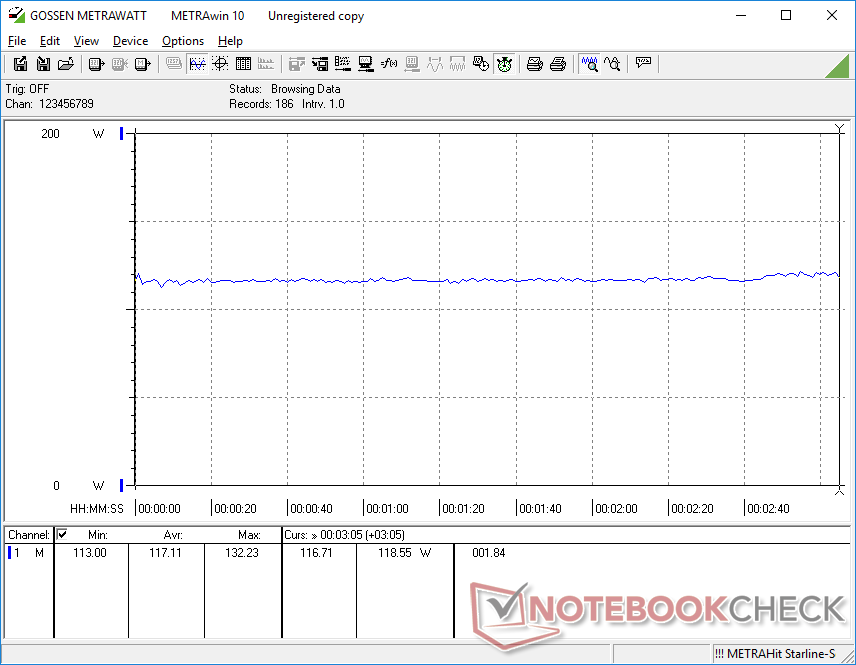
Running Witcher 3 to represent gaming load consumes about 14 percent less power than on the 2020 Predator Triton 300 while providing up to 30 percent faster graphics performance for a significant boost in performance-per-watt. The 12th gen CPU, however, is now even more power-hungry than before.
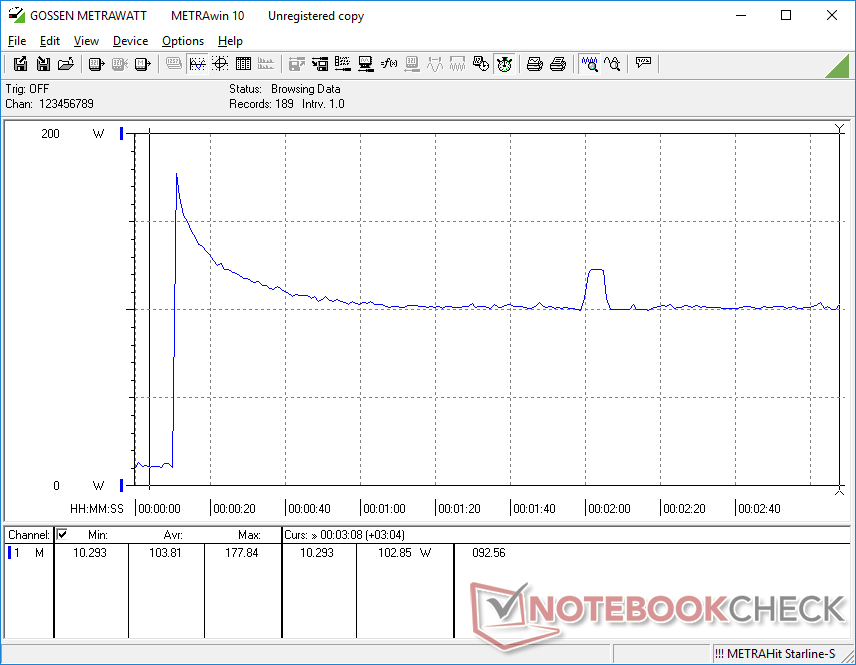
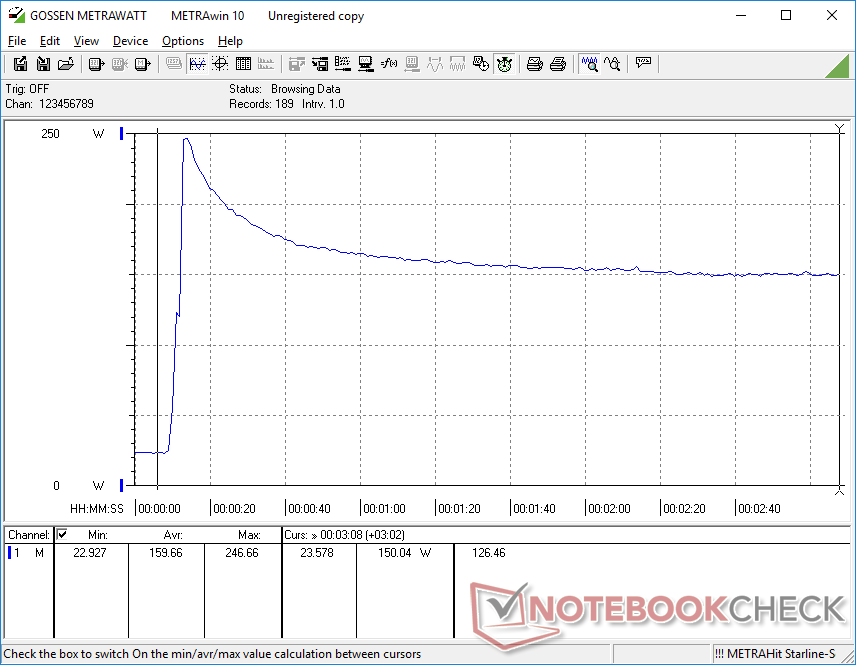
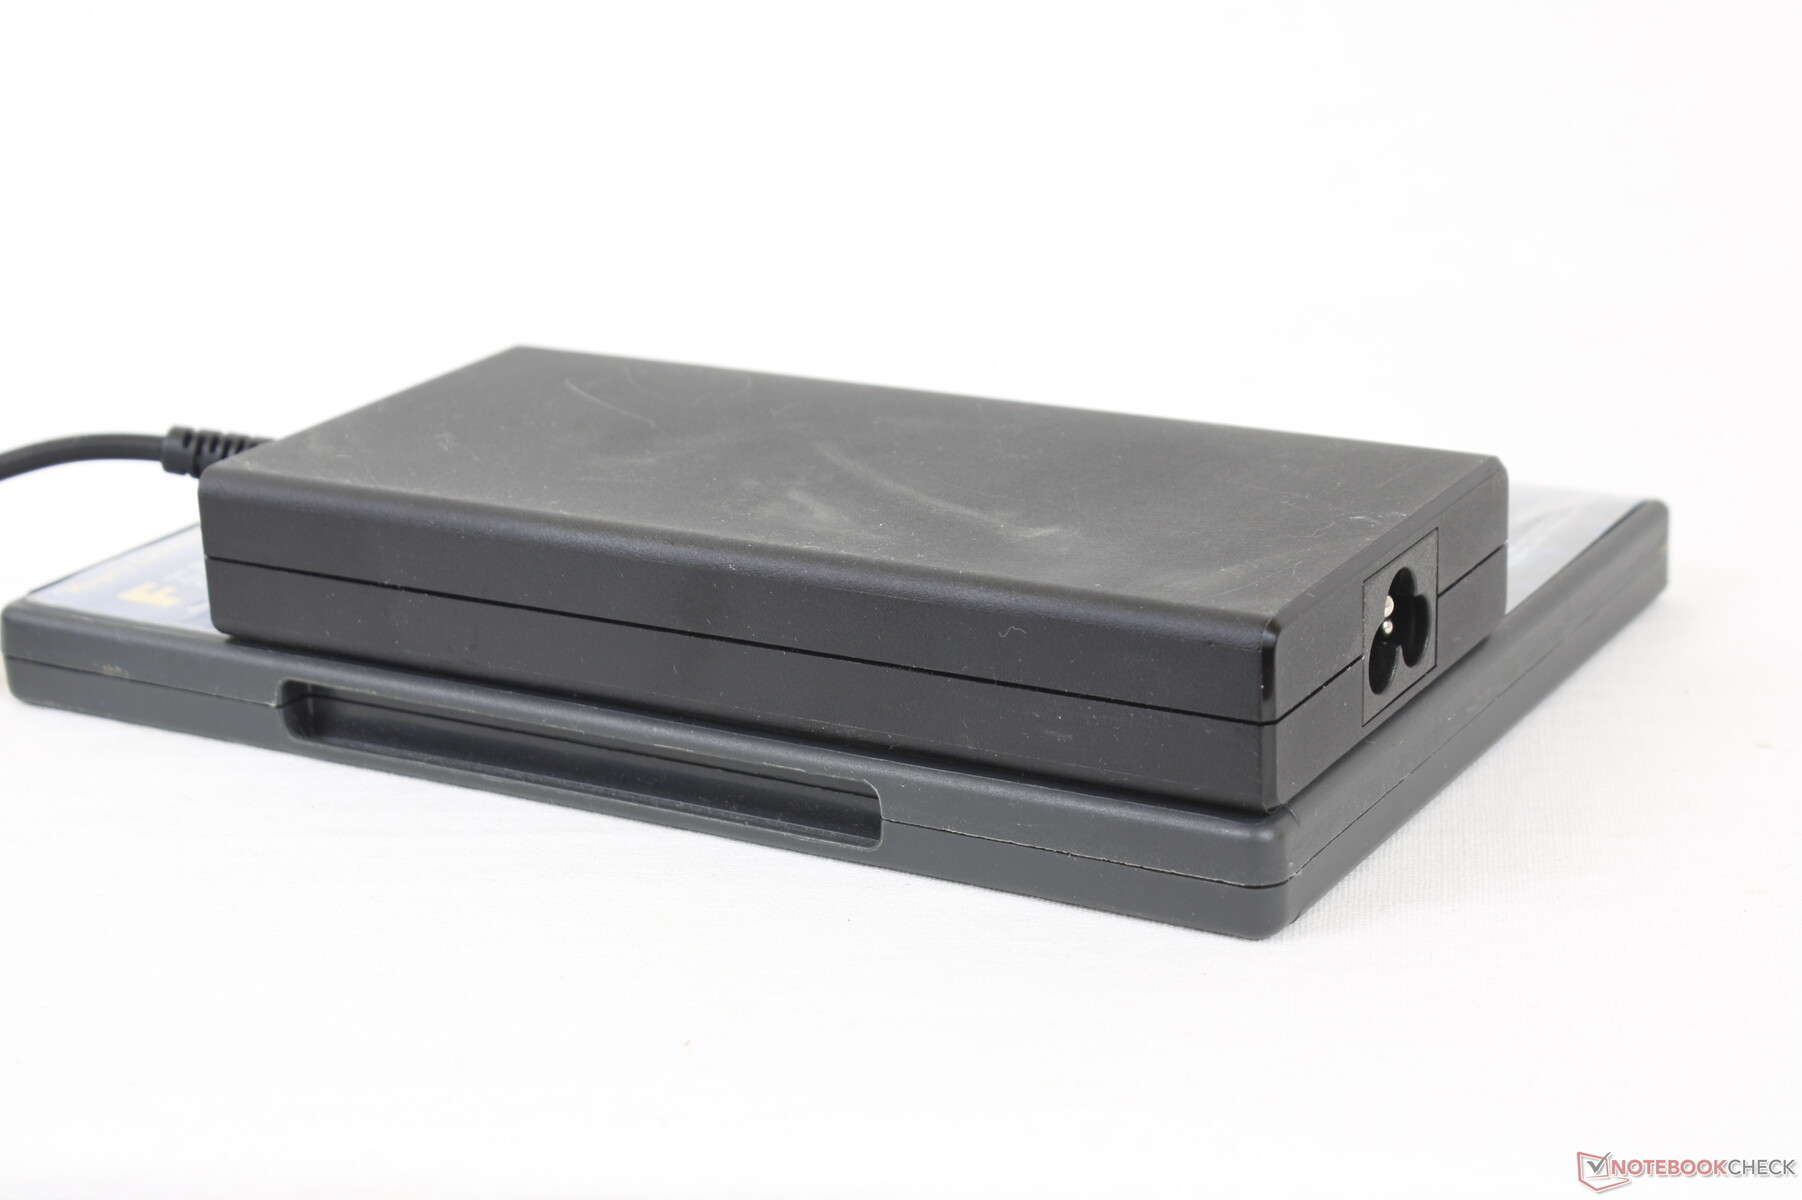
We're able to record a temporary maximum draw of 246 W from the medium-sized (~15.1 x 7.2 x 2.3 cm) 200 W AC adapter when the CPU and GPU are each at 100 percent utilization. This rate would quickly fall and stabilize at a safer level of 150 W as shown by our graph below due to thermal concerns. The system can still recharge at a reasonable rate whilst gaming.
| Off / Standby | |
| Idle | |
| Load |
|
| Acer Predator Triton 300 SE i9-12900H, GeForce RTX 3060 Laptop GPU, Micron 3400 1TB MTFDKBA1T0TFH, OLED, 2880x1800, 14.00 | Asus ROG Zephyrus G14 GA402RJ R7 6800HS, Radeon RX 6700S, Micron 2450 1TB MTFDKBA1T0TFK, IPS, 2560x1600, 14.00 | Razer Blade 14 Ryzen 9 6900HX R9 6900HX, GeForce RTX 3070 Ti Laptop GPU, Samsung PM9A1 MZVL21T0HCLR, IPS, 2560x1440, 14.00 | Alienware x14 i7 RTX 3060 i7-12700H, GeForce RTX 3060 Laptop GPU, WDC PC SN810 1TB, IPS, 1920x1080, 14.00 | SCHENKER Vision 14 i7-11370H, GeForce RTX 3050 Ti Laptop GPU, Samsung SSD 980 Pro 1TB MZ-V8P1T0BW, IPS, 2880x1800, 14.00 | Acer Predator Triton 300 PT315-52-79LP i7-10750H, GeForce RTX 2060 Mobile, WDC PC SN730 SDBQNTY-1T00, IPS, 1920x1080, 15.60 | |
|---|---|---|---|---|---|---|
| Power Consumption | -24% | -34% | 15% | 22% | 12% | |
| Idle Minimum * | 7.6 | 12 -58% | 10.2 -34% | 7.9 -4% | 6.7 12% | 4 47% |
| Idle Average * | 12.3 | 18 -46% | 26 -111% | 11.1 10% | 12.6 -2% | 10 19% |
| Idle Maximum * | 17.6 | 26 -48% | 26.7 -52% | 11.8 33% | 15.4 12% | 19 -8% |
| Load Average * | 111 | 88 21% | 89.3 20% | 107.4 3% | 85.7 23% | 96 14% |
| Witcher 3 ultra * | 117.1 | 157.7 -35% | 158.7 -36% | 111 5% | 83 29% | 136 -16% |
| Load Maximum * | 245.8 | 194 21% | 227.5 7% | 140.4 43% | 110.9 55% | 214 13% |
* ... smaller is better
Power Consumption Witcher 3 / Stresstest
Power Consumption external Monitor
Battery Life — Not Bad For The Size And Power
Runtimes are average at just over 6 hours of real-world WLAN browsing on the Balanced power profile. Nonetheless, most other 14-inch laptops can last for even longer including the Asus ROG Zephyrus G14 or Razer Blade 14 by several more hours each. The more power-hungry Intel CPU and OLED panel are likely responsible for the overall shorter battery life.
Charging from empty to full capacity is relatively slow at 2 hours. Furthermore, the system cannot be recharged via USB-C.
| Acer Predator Triton 300 SE i9-12900H, GeForce RTX 3060 Laptop GPU, 76 Wh | Asus ROG Zephyrus G14 GA402RJ R7 6800HS, Radeon RX 6700S, 76 Wh | Razer Blade 14 Ryzen 9 6900HX R9 6900HX, GeForce RTX 3070 Ti Laptop GPU, 62 Wh | Alienware x14 i7 RTX 3060 i7-12700H, GeForce RTX 3060 Laptop GPU, 80 Wh | Dell Inspiron 14 Plus 7420 i7-12700H, GeForce RTX 3050 4GB Laptop GPU, 64 Wh | SCHENKER Vision 14 i7-11370H, GeForce RTX 3050 Ti Laptop GPU, 53 Wh | |
|---|---|---|---|---|---|---|
| Battery Runtime | 64% | 42% | 1% | 11% | -1% | |
| Reader / Idle | 486 | 732 51% | 712 47% | |||
| WiFi v1.3 | 374 | 612 64% | 571 53% | 535 43% | 432 16% | 327 -13% |
| Load | 77 | 93 21% | 45 -42% | 54 -30% | 86 12% | |
| H.264 | 561 | 405 | ||||
| Witcher 3 ultra | 45 |
Pros
Cons
Verdict — Good, But Not Good Enough
The 14-inch Predator Triton 300 SE faces stiff competition against the Asus Zephyrus G14, Razer Blade 14, and Alienware x14. When compared to the Zephyrus G14, the Asus laptop is frequently on sale for hundreds of dollars less while offering the same level of graphics performance and nearly identical weight and dimensions. When compared to the Blade 14, Razer's laptop is arguably sleeker with its thinner design and per-key RGB lighting. And lastly, the Alienware x14 integrates firmer keyboard keys and an even thinner profile. All these machines have better SSD performance than the Acer as well.
The Acer Predator Triton 300 SE is an especially powerful gaming laptop regardless of size. However, other 14-inch gaming laptops have it beat when it comes to fan noise and SSD performance.
The Acer system is also noisier than the three alternatives mentioned above when running games. We understand that Turbo mode is going to be loud no matter what, but the fact that it's so much louder than the competition puts a dent to the system. Turbo mode must be enabled to fully exploit the GPU in the Acer.
There are a few redeeming qualities such as the 16:10 90 Hz OLED panel, fast Core i9 CPU, and support for Thunderbolt 4 all of which are unavailable on the Razer Blade 14 and most Asus Zephyrus G14 models. In fact, the Predator Triton 300 SE is one of the only 16:10 gaming laptops in the 14-inch category at the moment. If such unique features are not a priority, however, then the Zephyrus G14, Blade 14, or Alienware x14 are worth considering.
Price and Availability
The 14-inch Predator Triton 300 SE is now widely available through retailers like Amazon, Best Buy, and Newegg for about $2000 USD if configured like our review unit. Lesser SKUs with the Core i7 CPU are available for $1600 USD.
Acer Predator Triton 300 SE
-
11/02/2022 v7
Allen Ngo
More articles related to this device
Acer Predator Triton 300 SE (Predator Triton 300 Series)Related Articles


Pricecompare
