

Liquid cooling box runs quieter than expected: Uniwill Technology GM7AG8N laptop review ↺
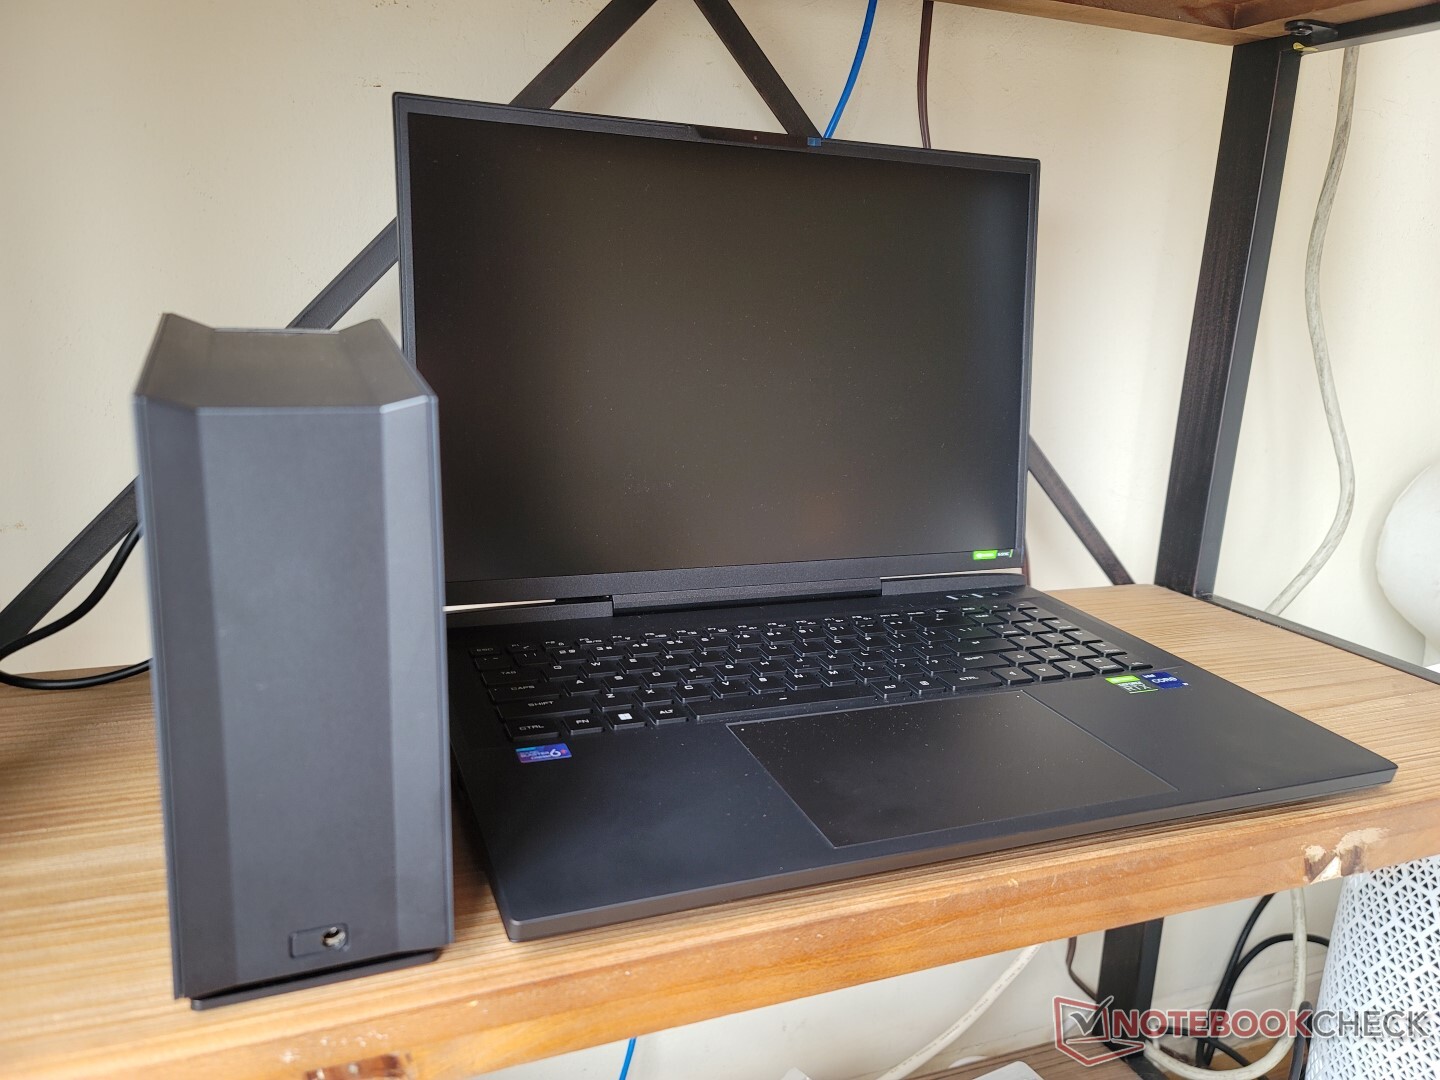
After testing the water-cooled 15.6-inch Tongfang GM5AG8W earlier this year from Schenker, we're now ready to test out the water-cooled 17-inch GM7AG8N courtesy of Uniwill Technology/Tongfang. External cooling docks can be considered an extreme solution to the lofty cooling demands of newer mobile CPUs and GPUs. Whereas desktops have the luxury of space, gaming laptops must fit increasingly faster processors into increasingly thinner form factors every year.
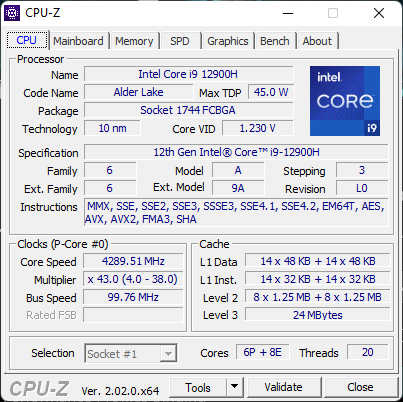
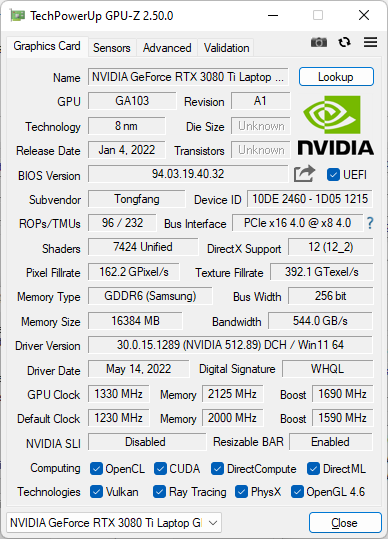
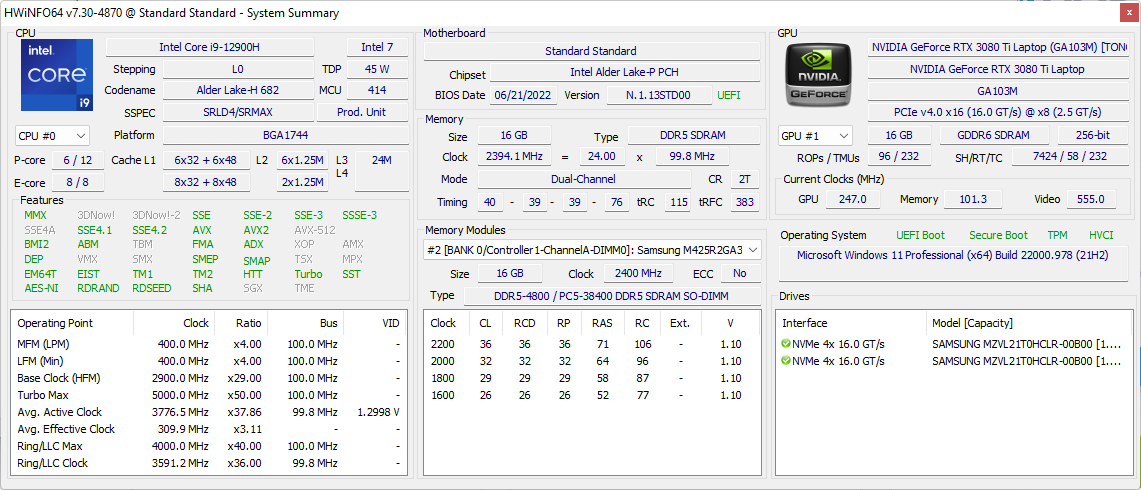
Our test unit comes with the 12th gen Core i9-12900H CPU, 175 W GeForce RTX 3080 Ti GPU with MUX, 17-inch 240 Hz 1600p IPS display, and an integrated Cherry MX mechanical keyboard. The model is not yet widely available at the time of publishing.
The Uniwill Technology GM7AG8N competes directly with more traditional 17-inch gaming laptops like the Razer Blade 17, Asus ROG Zephyrus S17, MSI Stealth GS77, or the Gigabyte Aorus 17X. However, the Uniwill is a 16:10 form factor whereas most other 17-inch alternatives are still 16:9. The cooling box is the same as on the Schenker GM5AG8W and so we recommend checking out our existing reviews here and here for more details on how to setup the external cooler.
More Uniwill Technology reviews:
Potential Competitors in Comparison
Rating | Date | Model | Weight | Height | Size | Resolution | Price |
|---|---|---|---|---|---|---|---|
| 88.1 % v7 (old) | 10 / 2022 | Uniwell Technology GM7AG8N Liquid Cooling Box i9-12900H, GeForce RTX 3080 Ti Laptop GPU | 2.7 kg | 27.6 mm | 17.00" | 2560x1600 | |
| 88.3 % v7 (old) | 08 / 2022 | MSI Titan GT77 12UHS i9-12900HX, GeForce RTX 3080 Ti Laptop GPU | 3.3 kg | 23 mm | 17.30" | 1920x1080 | |
| 83.7 % v7 (old) | 08 / 2022 | Aorus 17X XES i9-12900HX, GeForce RTX 3070 Ti Laptop GPU | 2.7 kg | 30 mm | 17.30" | 1920x1080 | |
| 89.9 % v7 (old) | 07 / 2022 | Razer Blade 17 Early 2022 i9-12900H, GeForce RTX 3080 Ti Laptop GPU | 2.8 kg | 19.9 mm | 17.30" | 3840x2160 | |
| 87.2 % v7 (old) | 04 / 2022 | MSI Stealth GS77 12UHS-083US i7-12700H, GeForce RTX 3080 Ti Laptop GPU | 2.9 kg | 20.8 mm | 17.30" | 2560x1440 | |
| 90.1 % v7 (old) | 07 / 2021 | Asus ROG Zephyrus S17 GX703HSD i9-11900H, GeForce RTX 3080 Laptop GPU | 2.8 kg | 19.9 mm | 17.30" | 2560x1440 |
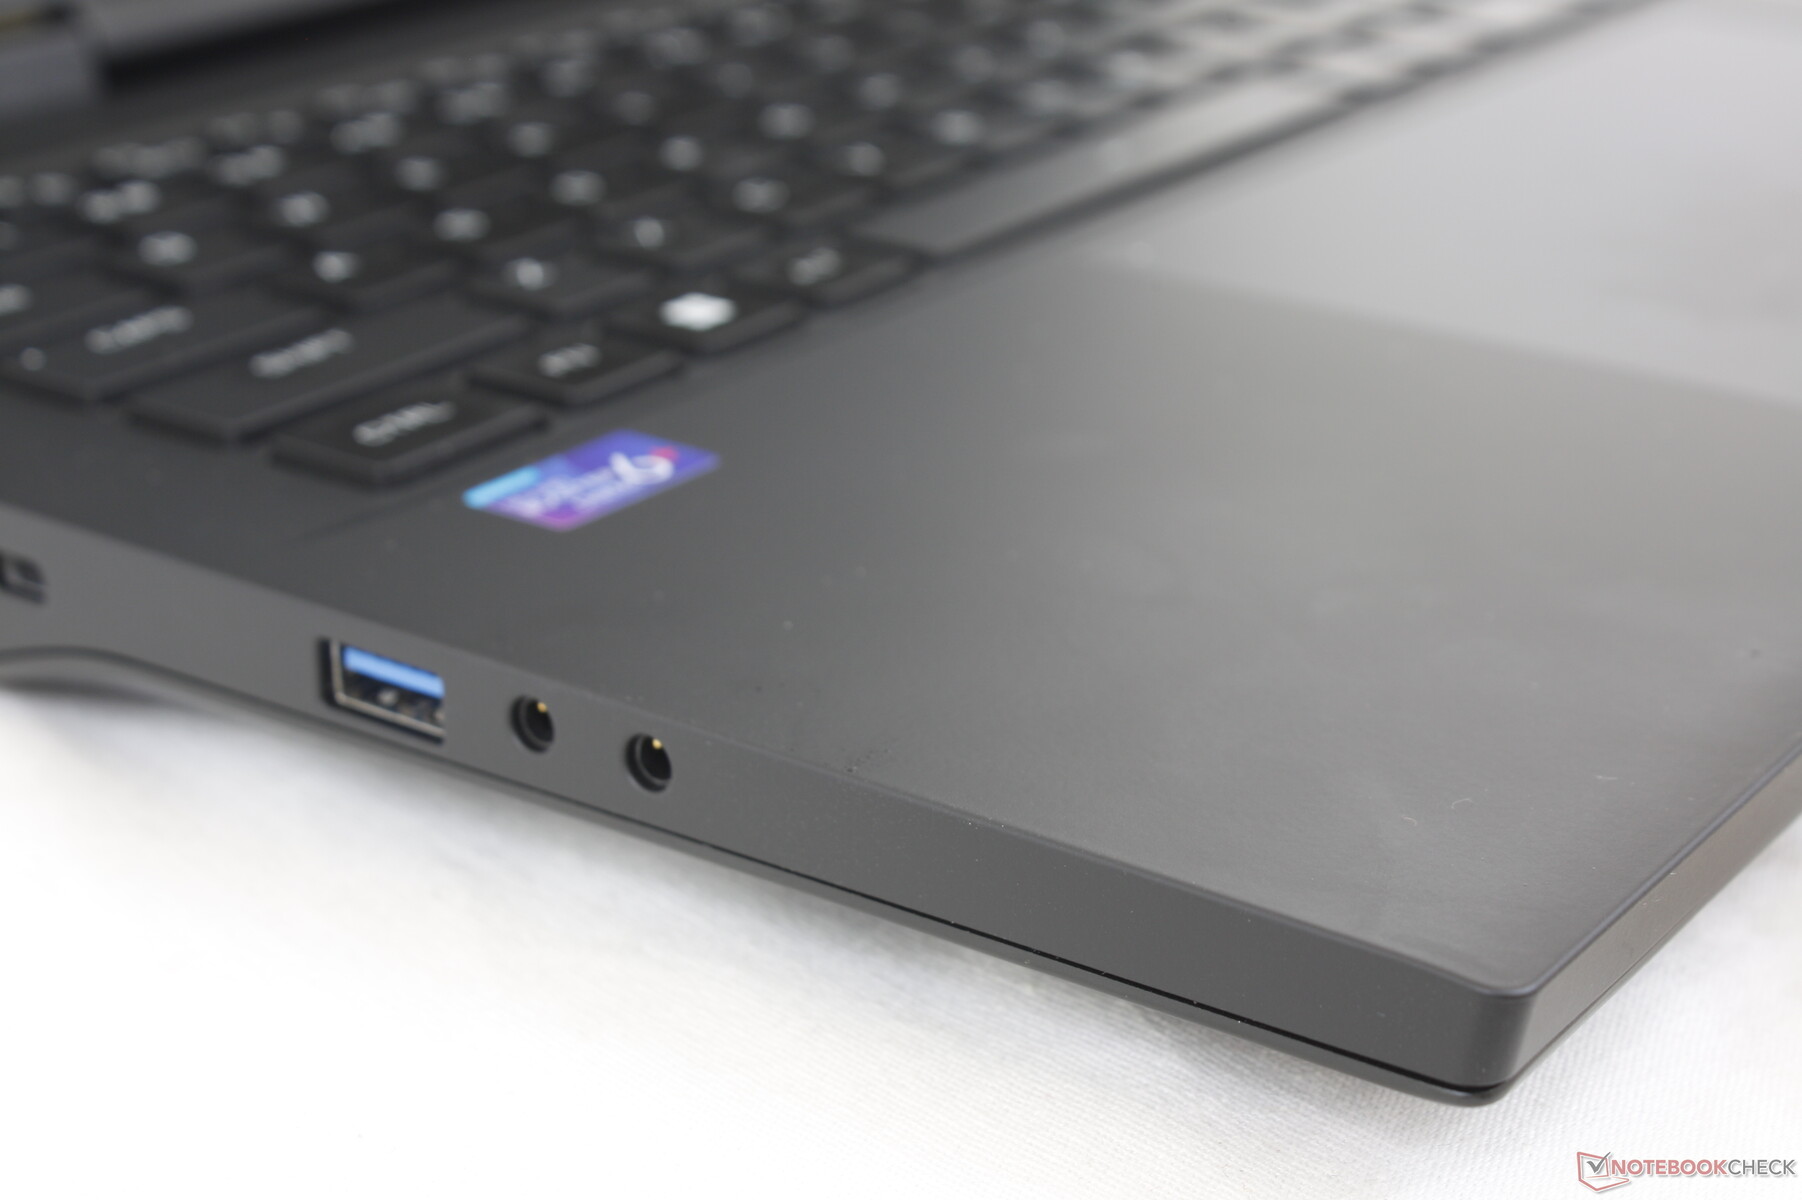
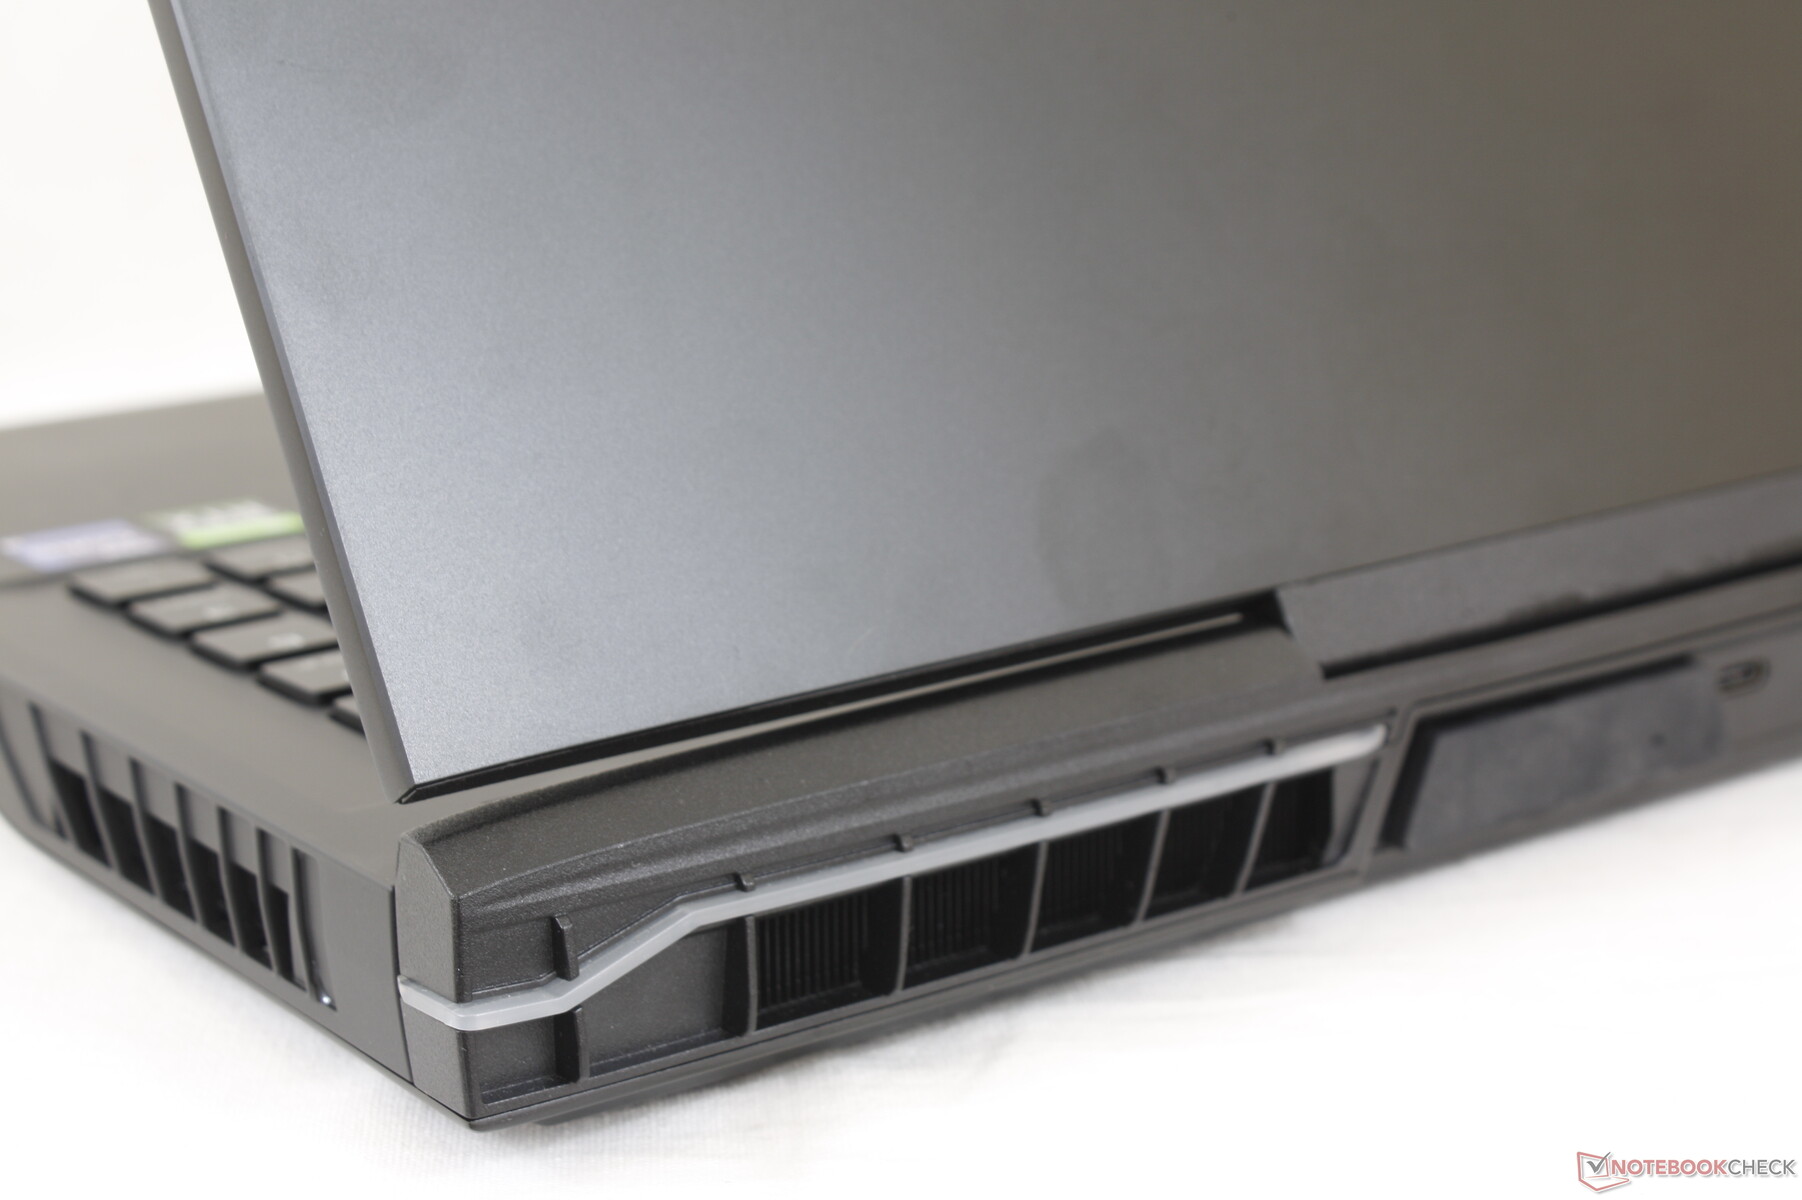
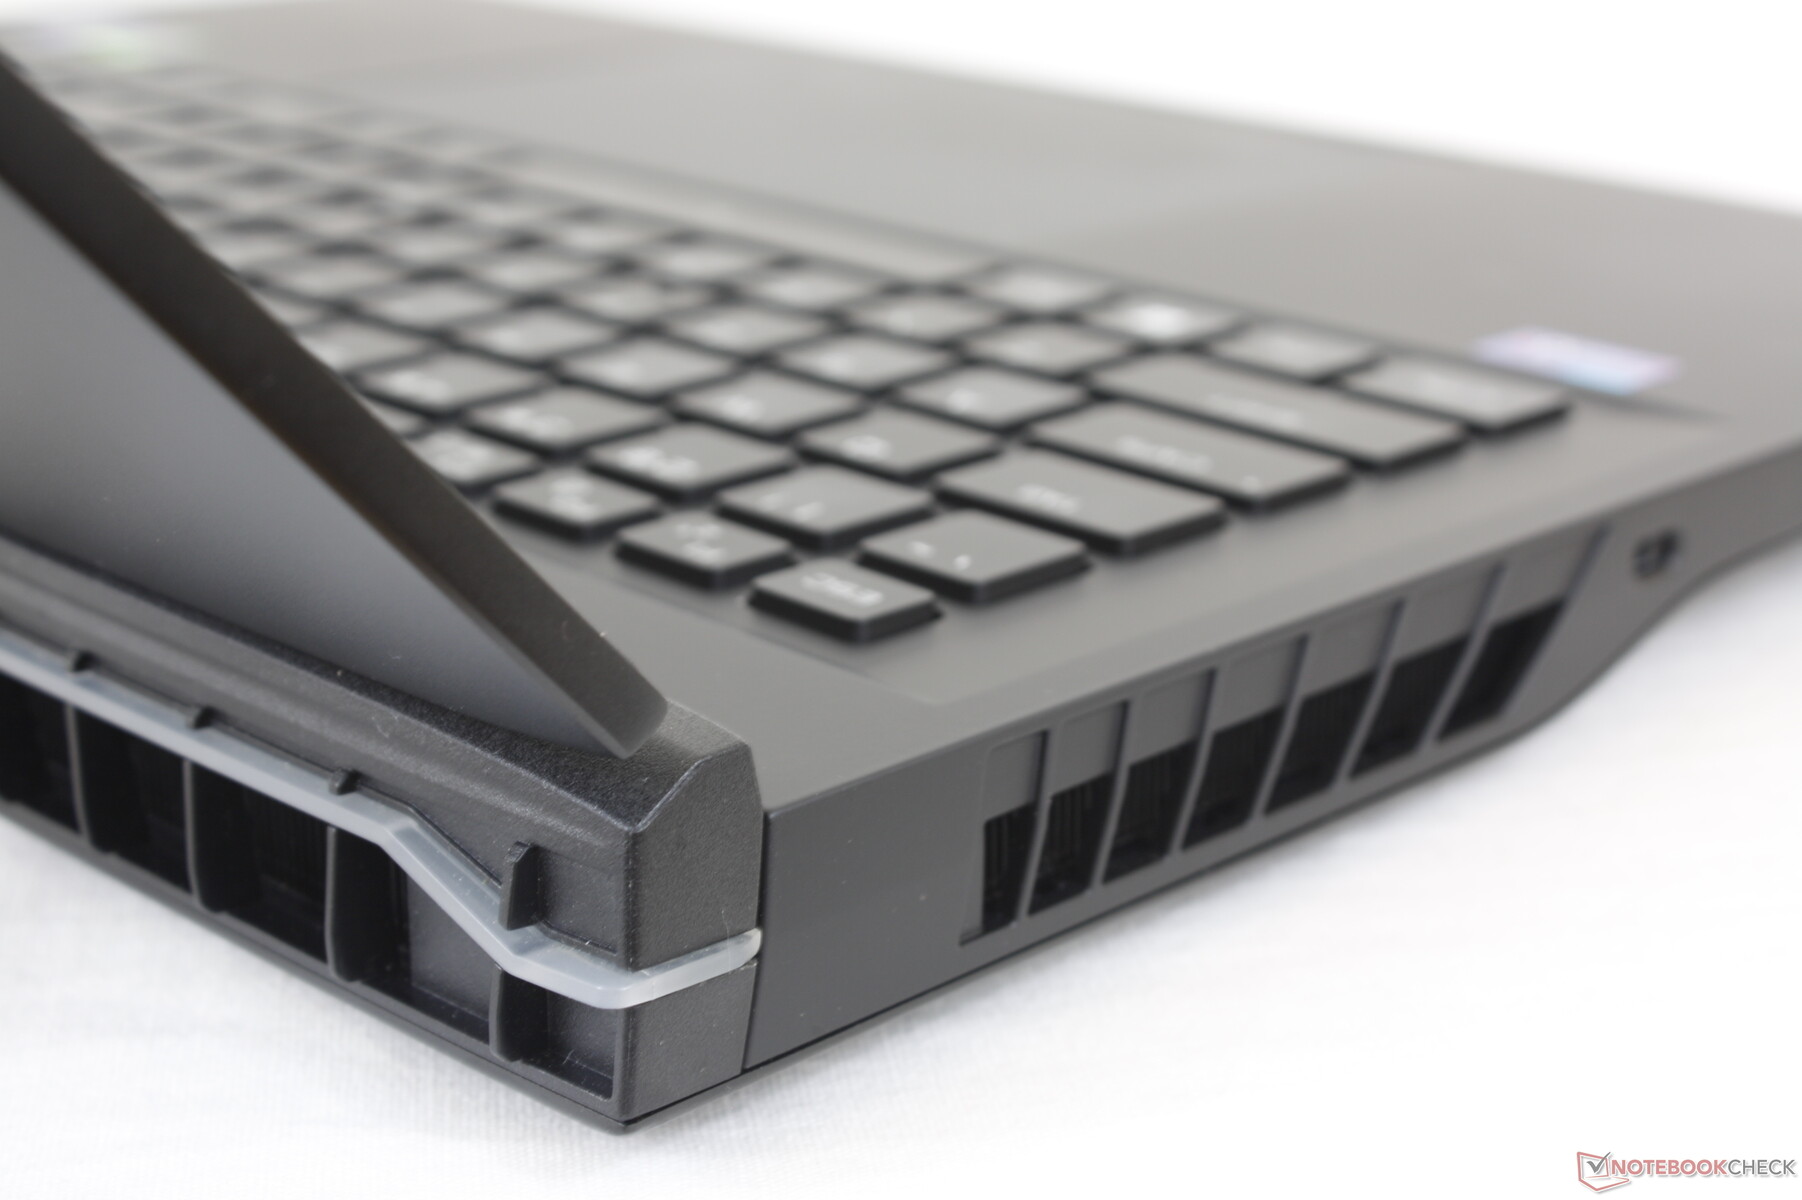
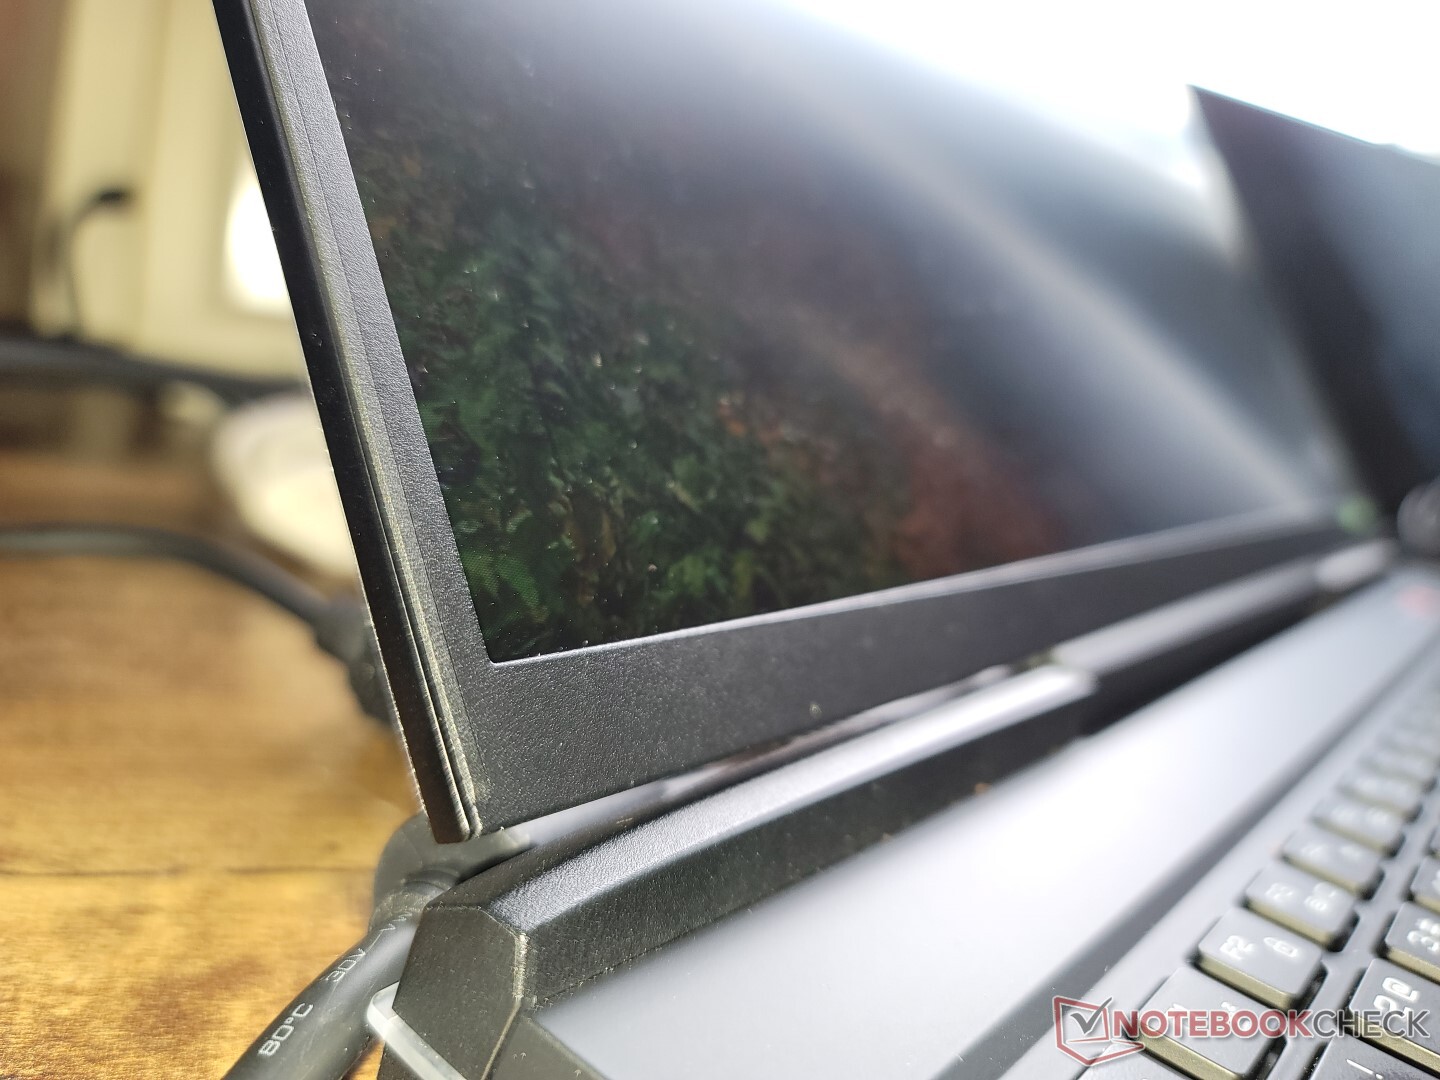
Case — A Huge Fingerprint Magnet
The 17-inch Uniwill Technology GM7AG8N shares similar features to the 15.6-inch GM5AG8W since both support the same external water cooling box. Nonetheless, the two models are very different when it comes to the keyboard deck and bottom plate design. Whereas the GM5AG8W integrates a beveled keyboard with lots of ventilation grilles on the bottom, the GM7AG8N has a chiclet keyboard with redesigned vents. The LED styling is also different between them as the GM7AG8N has an LED bar along the rear while the GM5AG8W has one along the front.
Chassis rigidity is excellent for the base and keyboard deck. Attempting to twist the base or apply pressure on the keyboard center would result in just minimal flexing and no creaking. The hinges and lid are also strong, but they're slightly more flexible than on the Razer Blade 17 series.
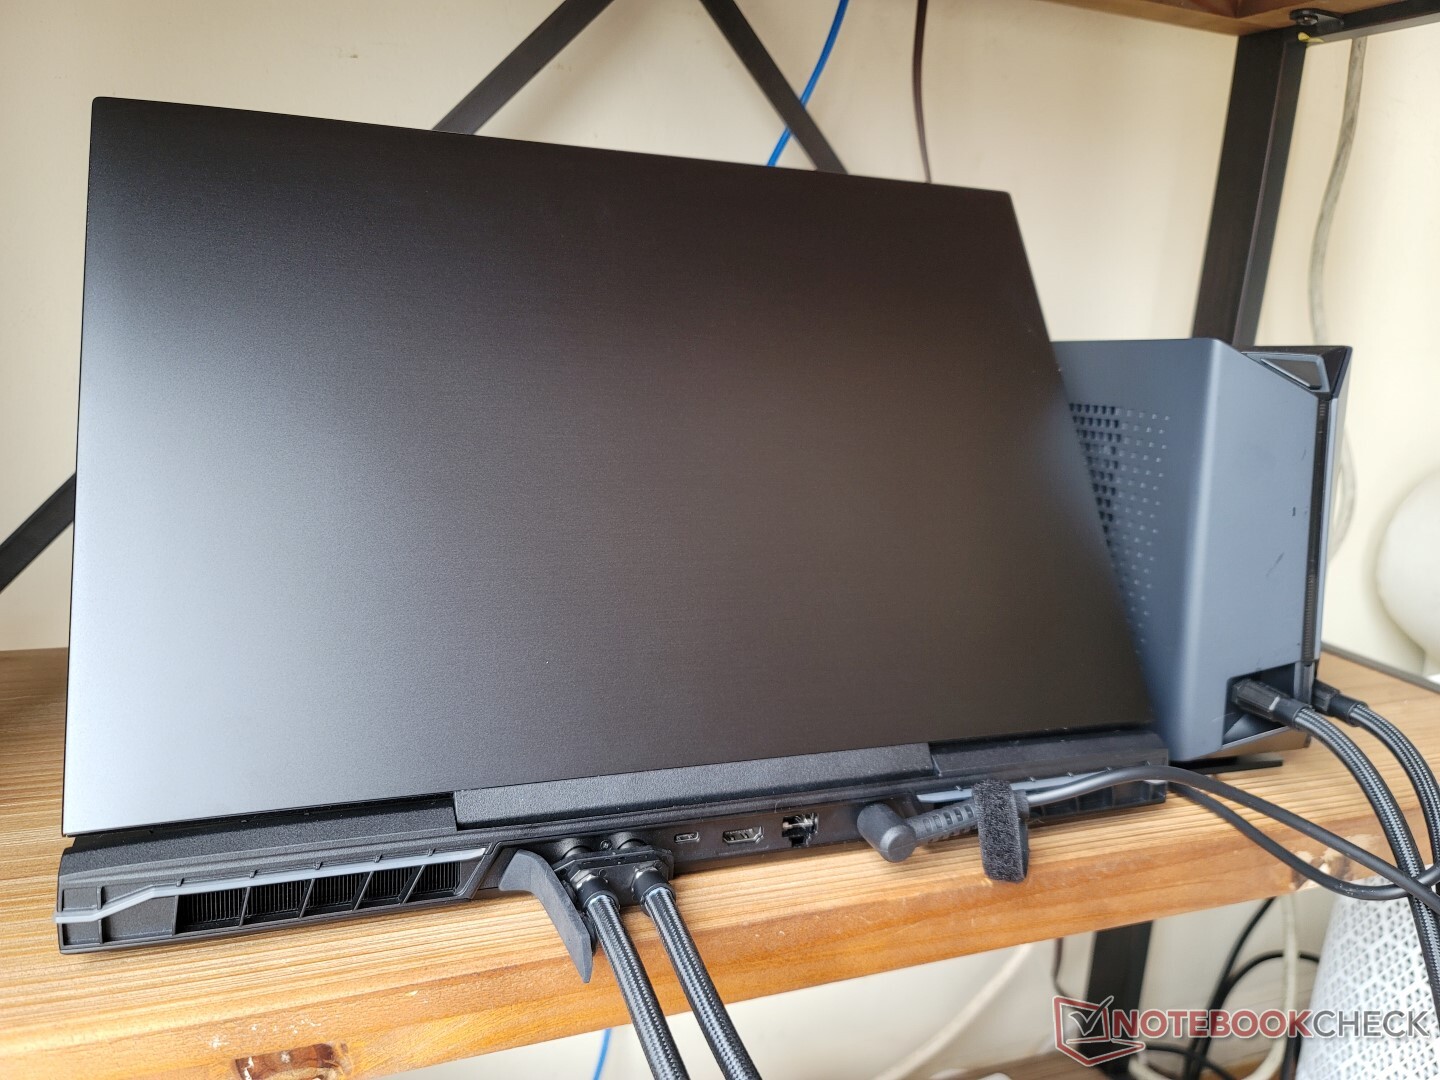
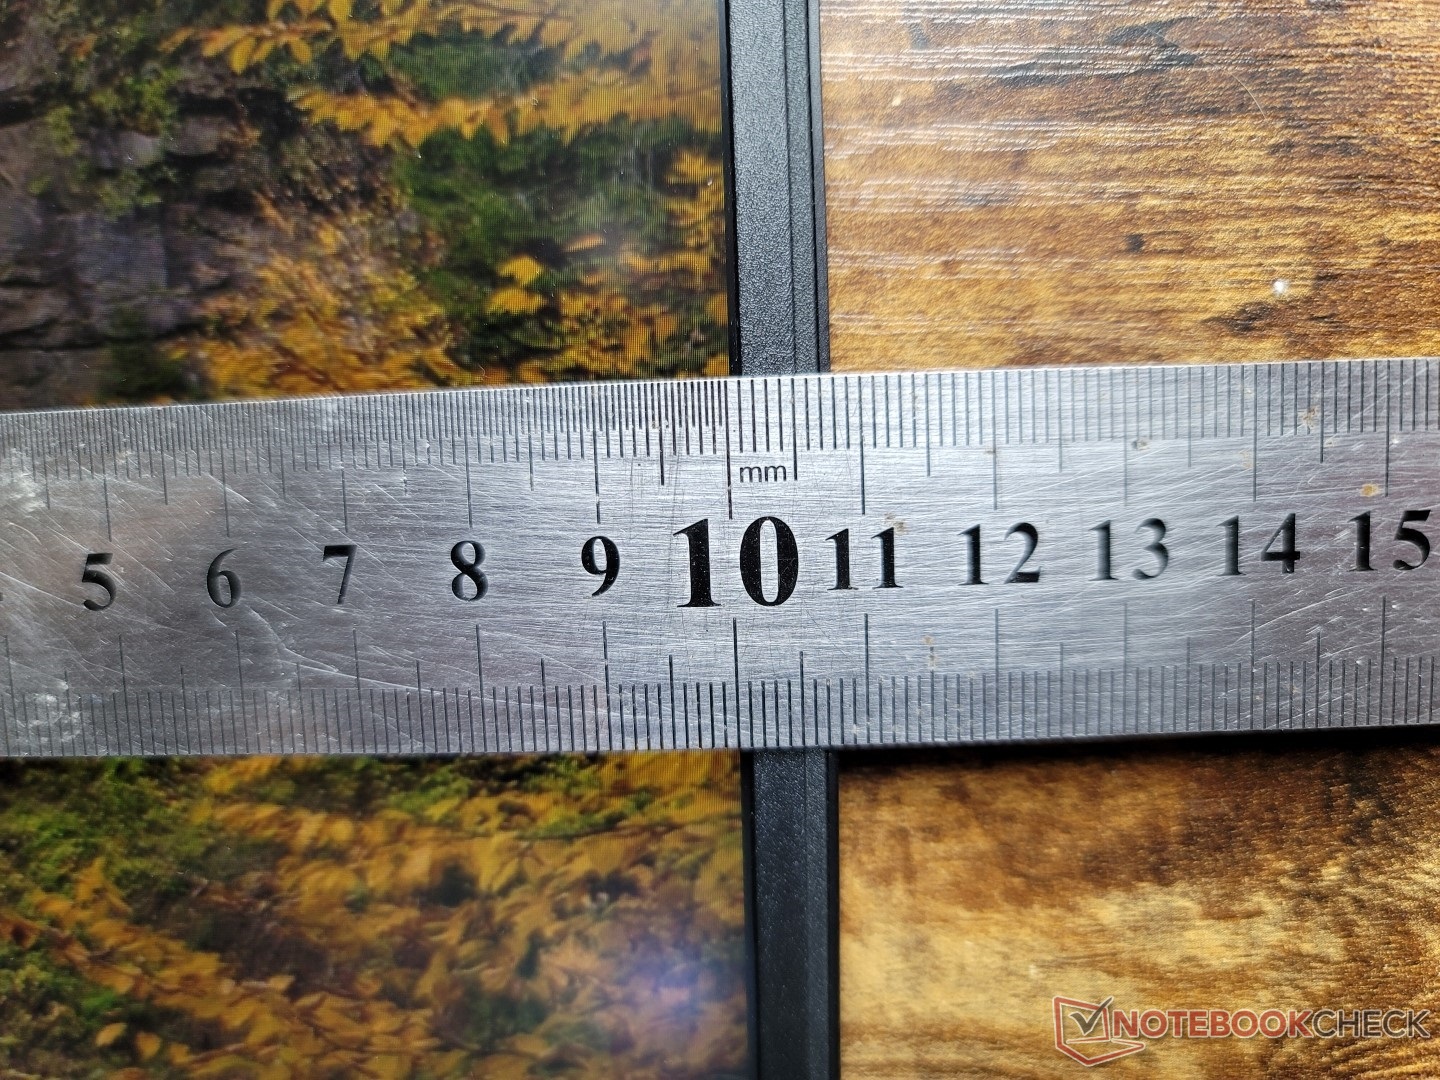
The Uniwill is thicker and longer than most other 17-inch gaming laptops while weighing about the same. Its slightly squarer footprint can be attributed to its 16:10 aspect ratio which is uncommon for a gaming laptop of this screen size. Overall weight is thankfully average for the category before accounting for the external cooling box.
- Laptop weight: 2749 g
- AC adapter weight: 1057 g
- External cooling box with water tubes (no water): 1160 g
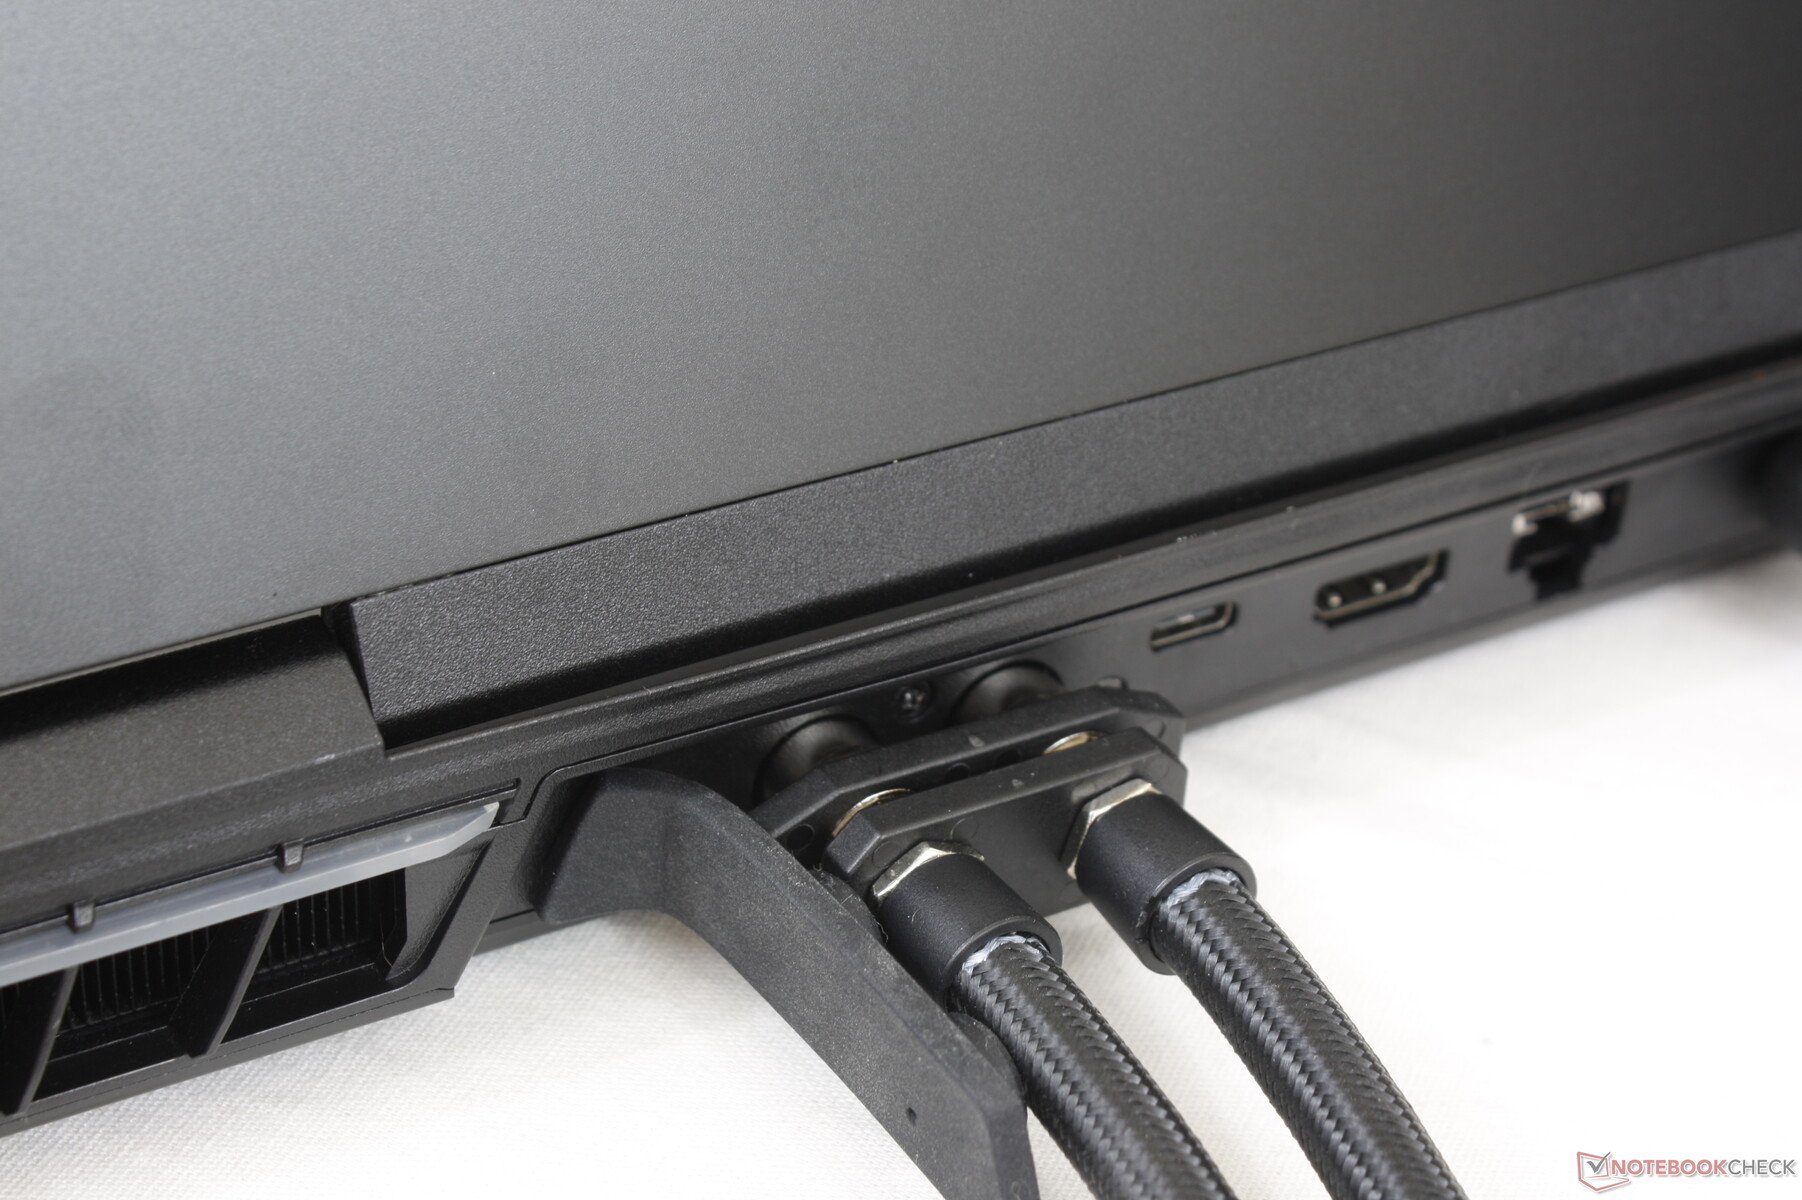
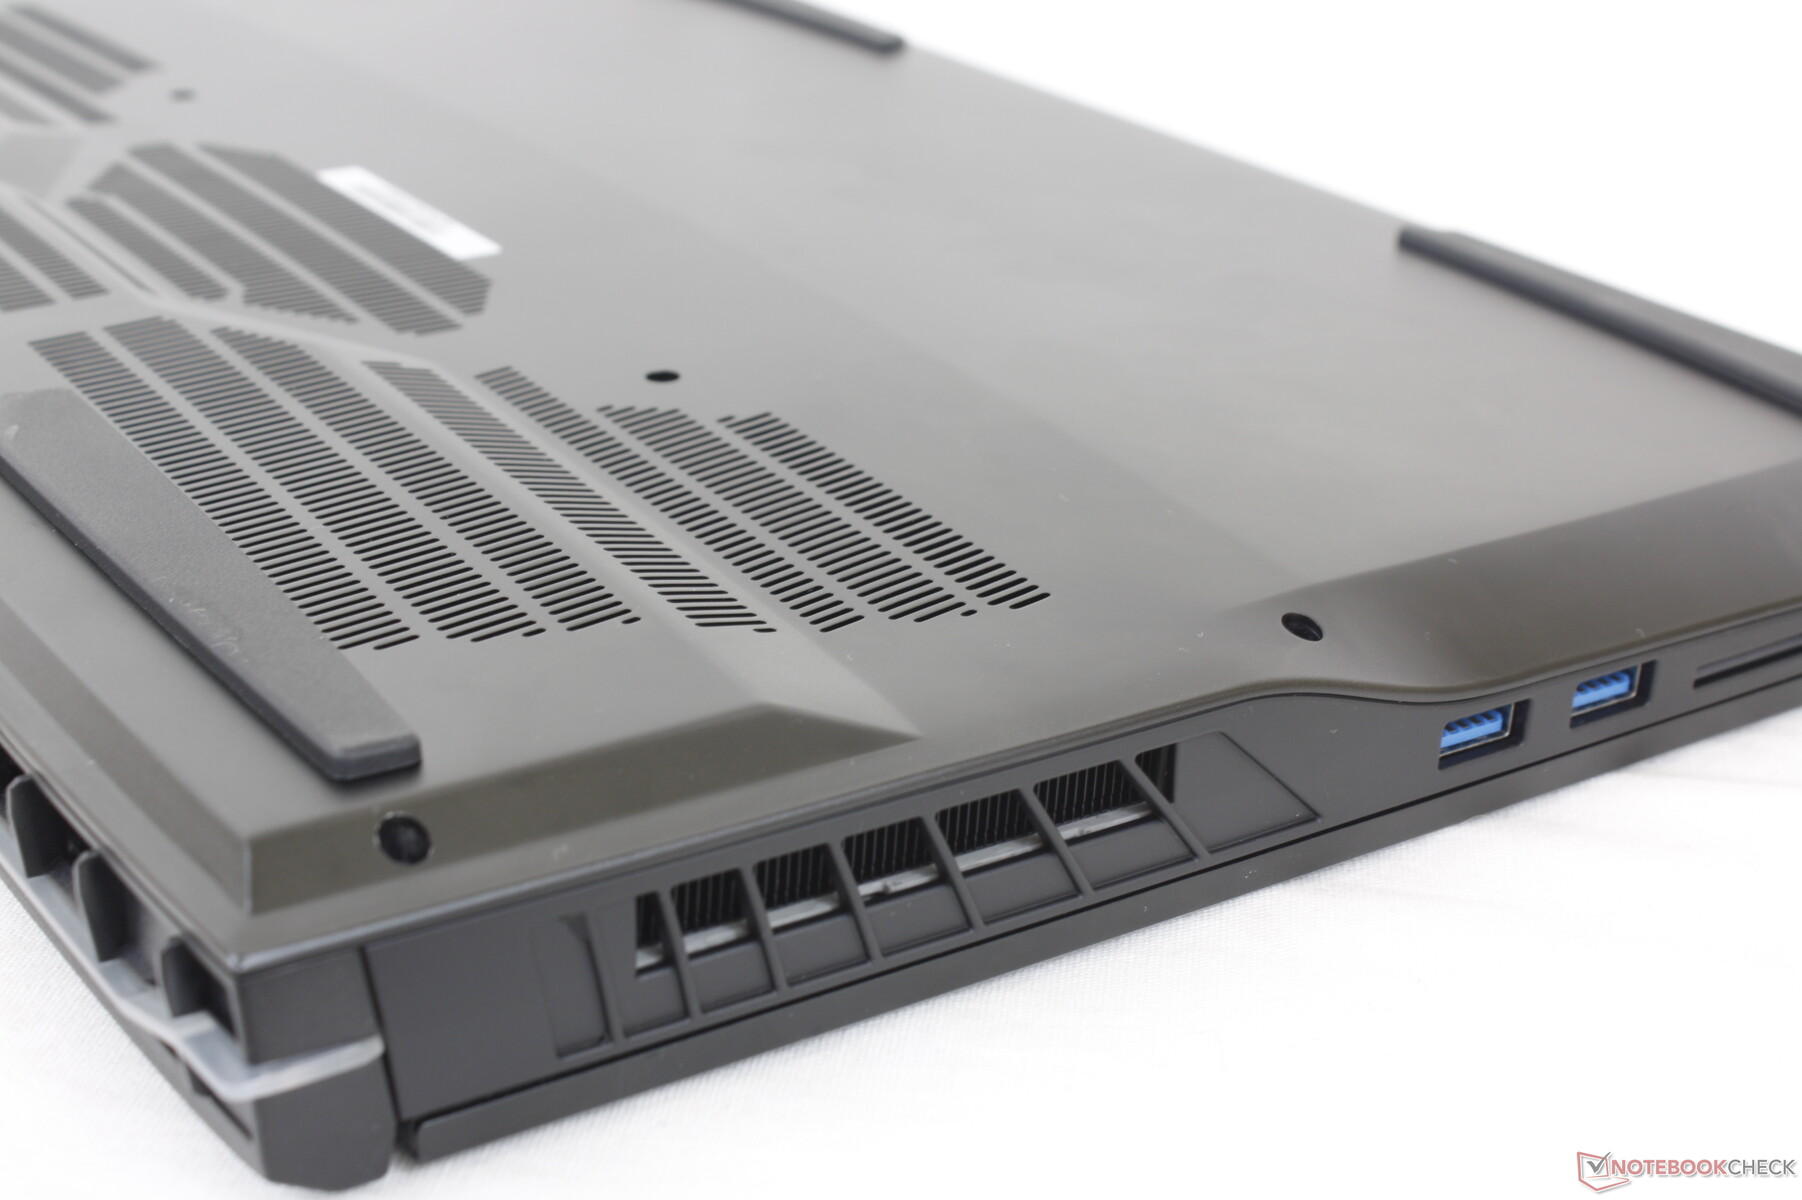
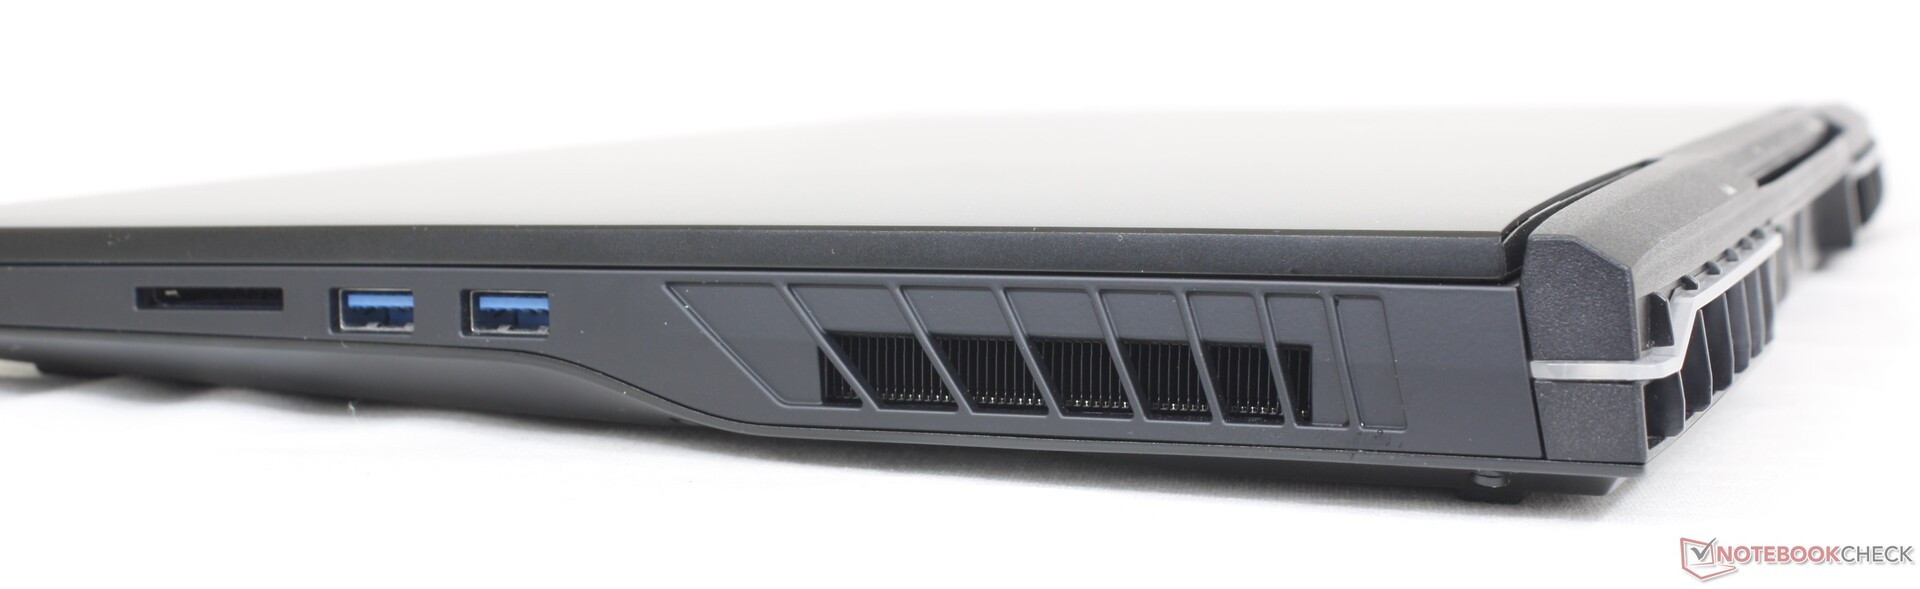
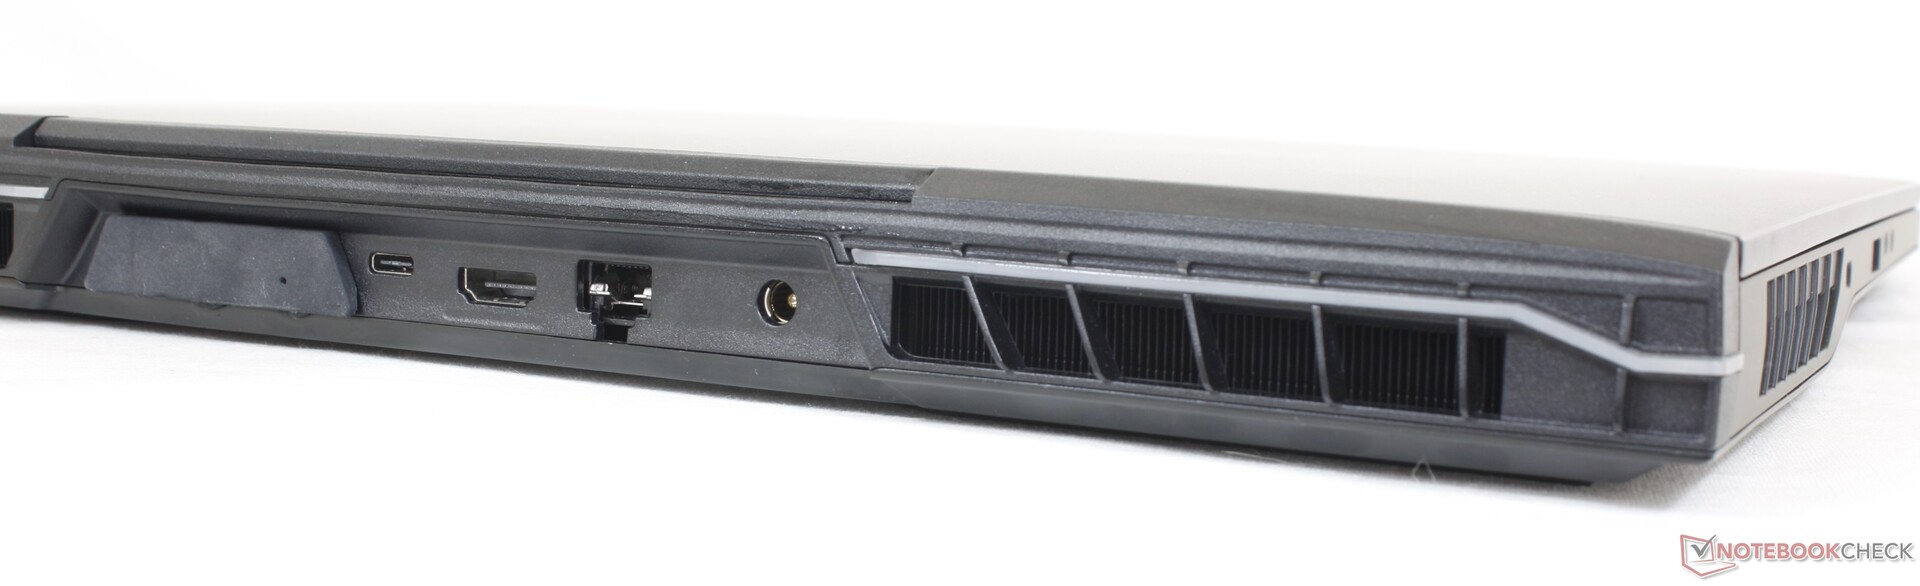
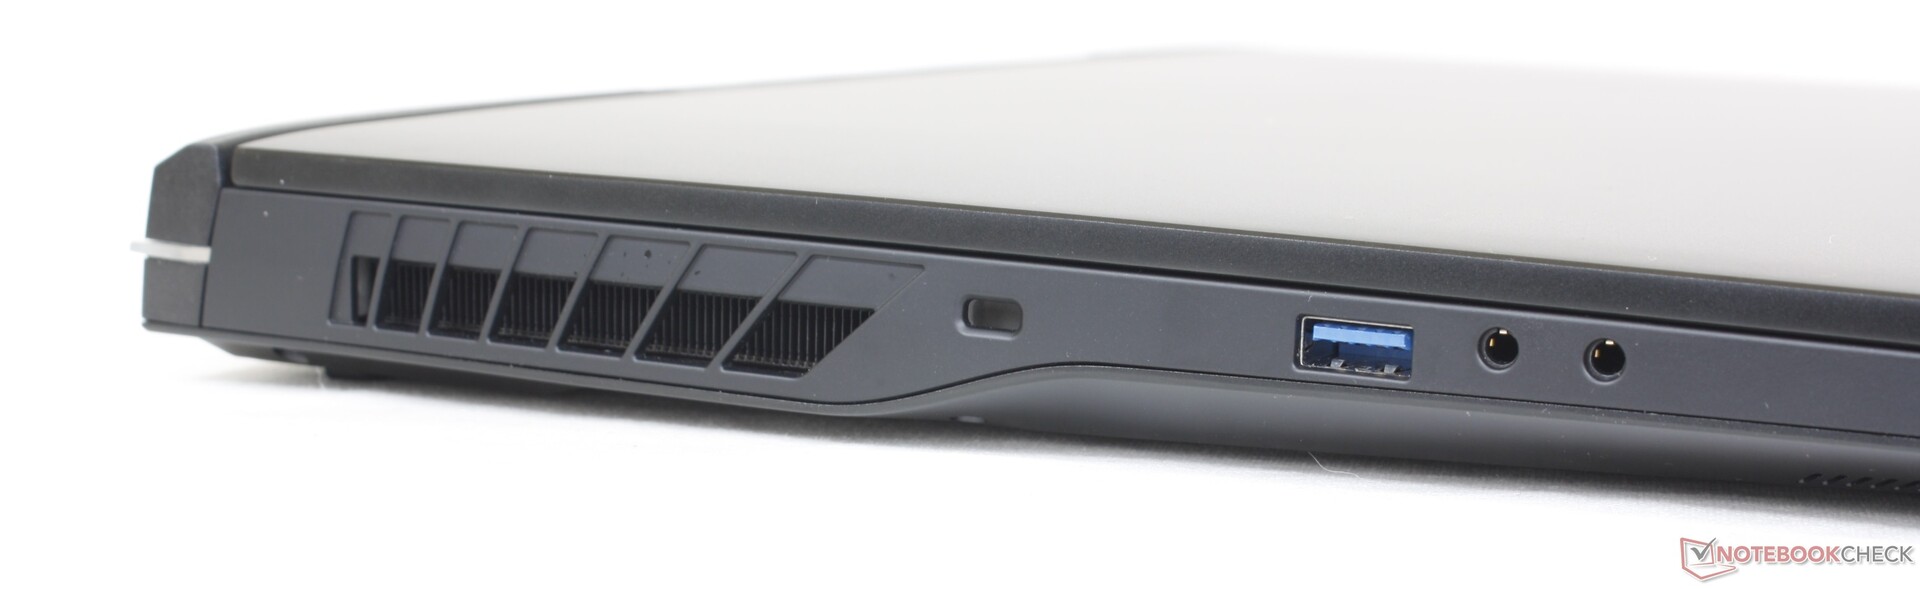
Connectivity — Thunderbolt 4 Support
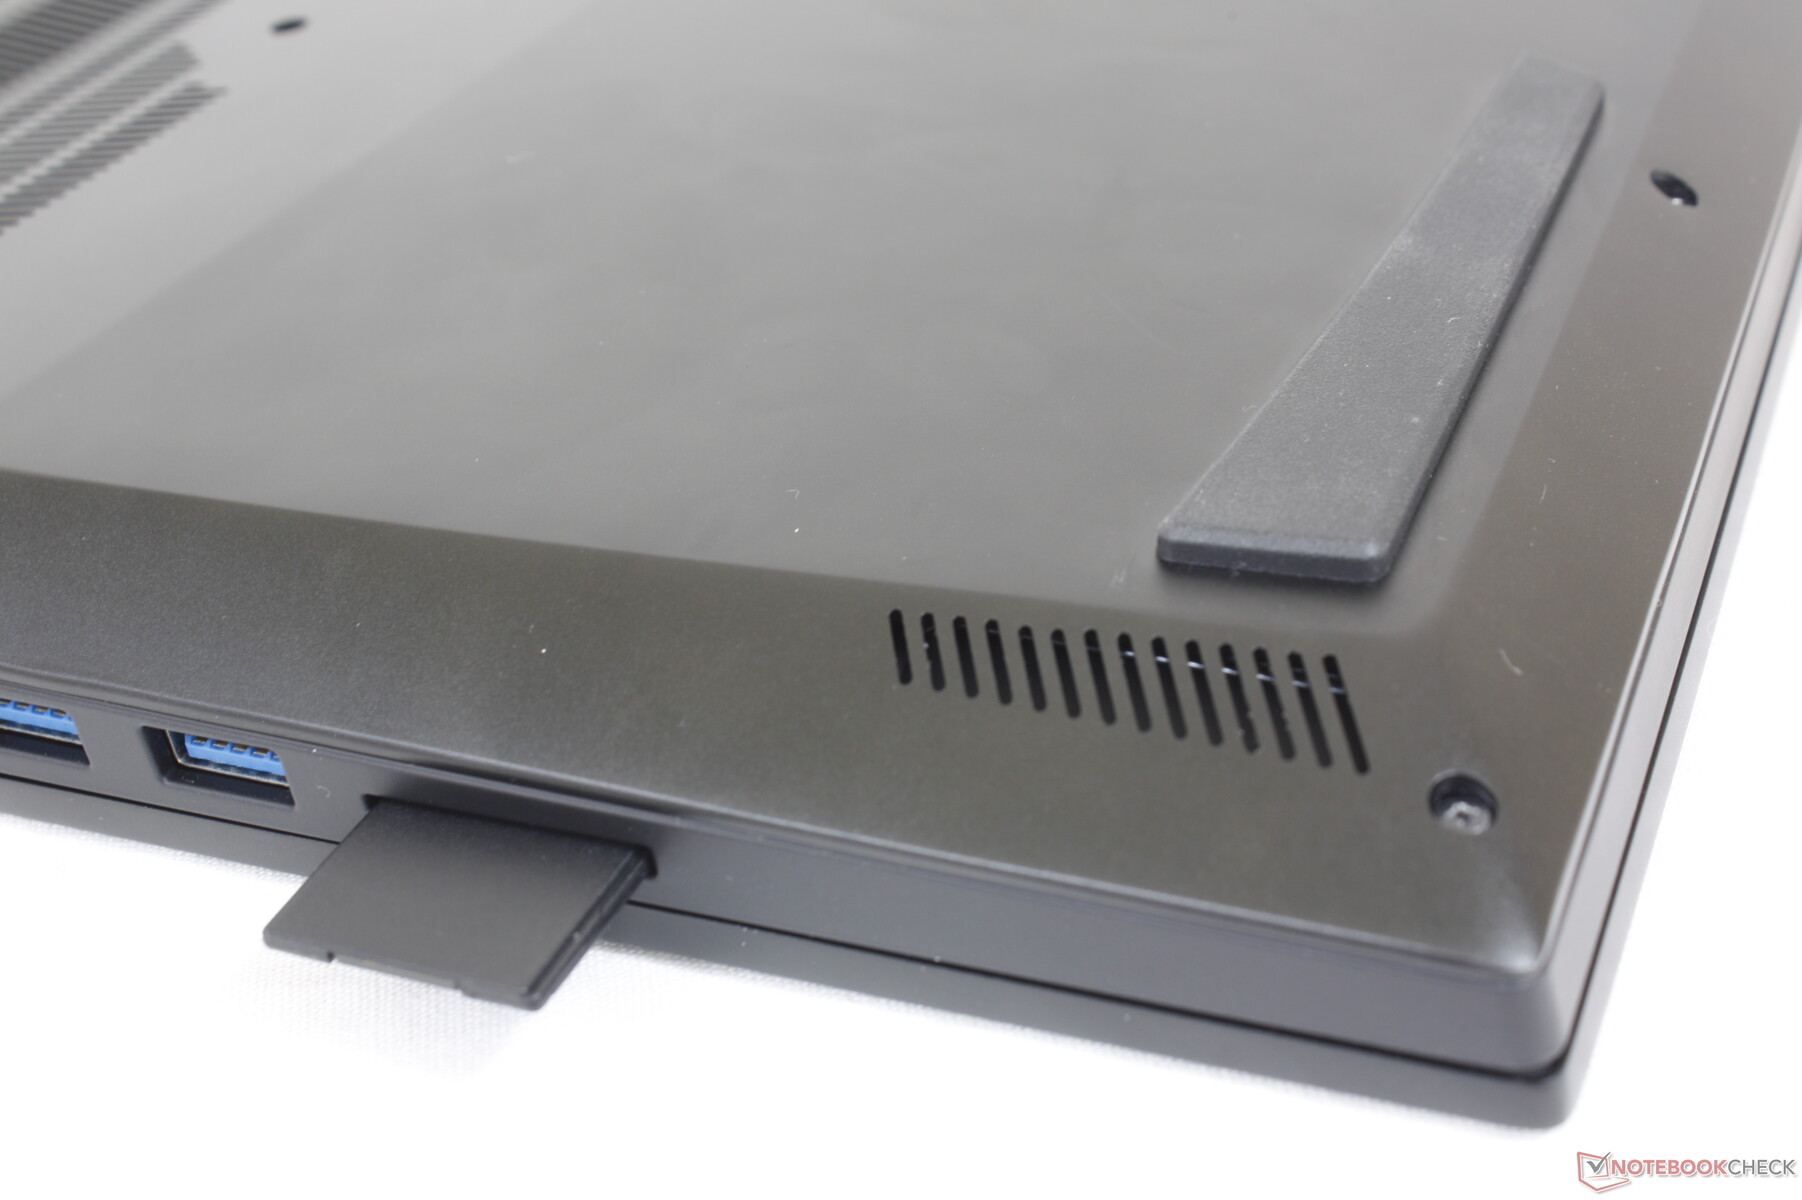
Port options and positioning are identical to the 15.6-inch Schenker XMG Neo 15 E22 even though our Uniwill is a larger 17-inch form factor. We would like to see additional USB-C ports in the future as the single port feels limiting.

SD Card Reader
Transfer rates with the integrated card reader is only half that of the Asus Zephyrus S17 or Razer Blade 17. This shouldn't be an issue for most users aside from those who rely heavily on transferring large files via SD cards.
| SD Card Reader | |
| average JPG Copy Test (av. of 3 runs) | |
| Asus ROG Zephyrus S17 GX703HSD | |
| Razer Blade 17 Early 2022 (AV PRO microSD 128 GB V60) | |
| Uniwell Technology GM7AG8N Liquid Cooling Box (AV PRO microSD 128 GB V60) | |
| MSI Stealth GS77 12UHS-083US (AV Pro V60) | |
| MSI Titan GT77 12UHS (AV PRO microSD 128 GB V60) | |
| maximum AS SSD Seq Read Test (1GB) | |
| Asus ROG Zephyrus S17 GX703HSD | |
| Uniwell Technology GM7AG8N Liquid Cooling Box (AV PRO microSD 128 GB V60) | |
| MSI Titan GT77 12UHS (AV PRO microSD 128 GB V60) | |
| MSI Stealth GS77 12UHS-083US (AV Pro V60) | |
Communication
It's a bit disappointing to not see Wi-Fi 6E included considering the high price of the laptop. Nonetheless, Wi-Fi 6 is still more than enough for most users since Wi-Fi 6E is rarely any better in most real-world scenarios.
| Networking | |
| iperf3 transmit AX12 | |
| MSI Stealth GS77 12UHS-083US | |
| Asus ROG Zephyrus S17 GX703HSD | |
| iperf3 receive AX12 | |
| MSI Stealth GS77 12UHS-083US | |
| Asus ROG Zephyrus S17 GX703HSD | |
| iperf3 receive AXE11000 6GHz | |
| Aorus 17X XES | |
| MSI Titan GT77 12UHS | |
| iperf3 receive AXE11000 | |
| MSI Titan GT77 12UHS | |
| Razer Blade 17 Early 2022 | |
| Uniwell Technology GM7AG8N Liquid Cooling Box | |
| iperf3 transmit AXE11000 6GHz | |
| Aorus 17X XES | |
| MSI Titan GT77 12UHS | |
| iperf3 transmit AXE11000 | |
| MSI Titan GT77 12UHS | |
| Uniwell Technology GM7AG8N Liquid Cooling Box | |
Webcam
The 2 MP camera has poor colors even by the already low webcam standards. IR is supported, but there is no privacy shutter.


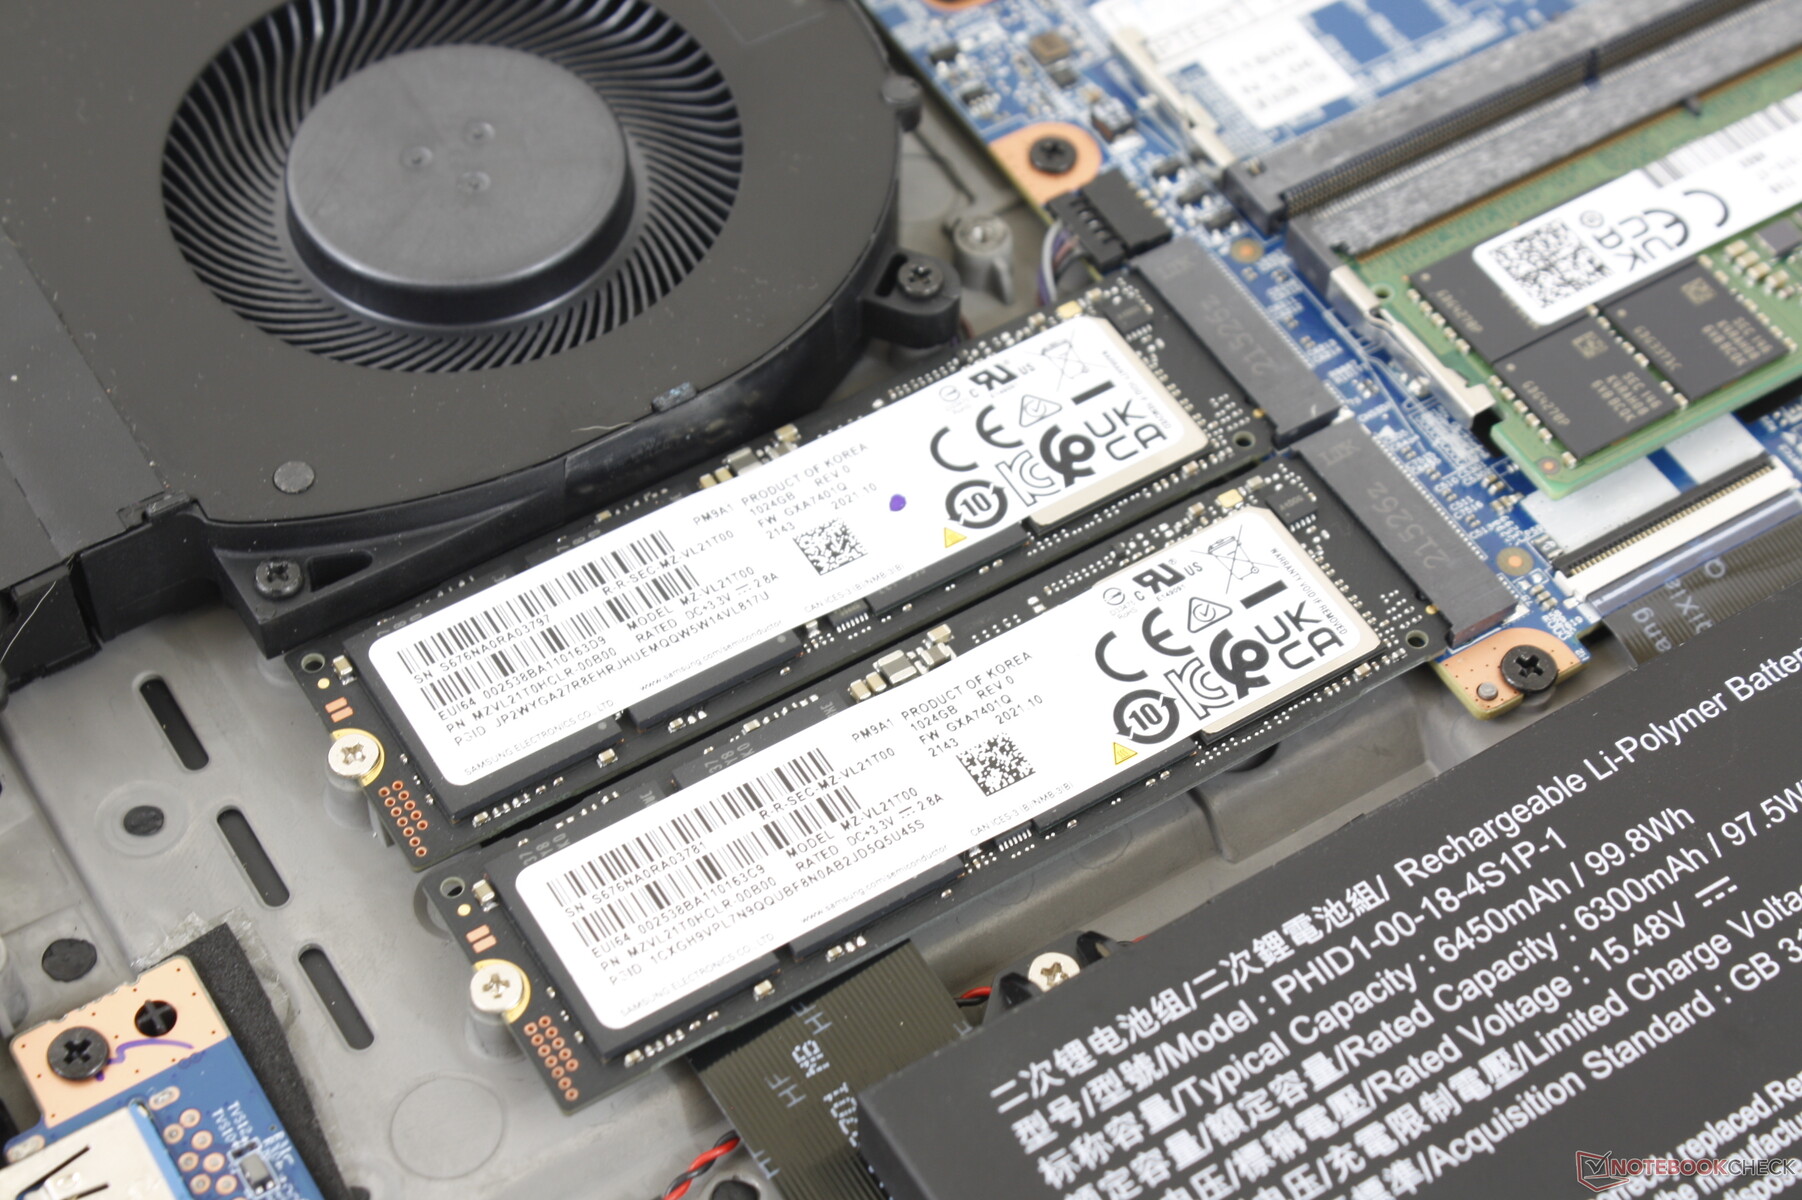
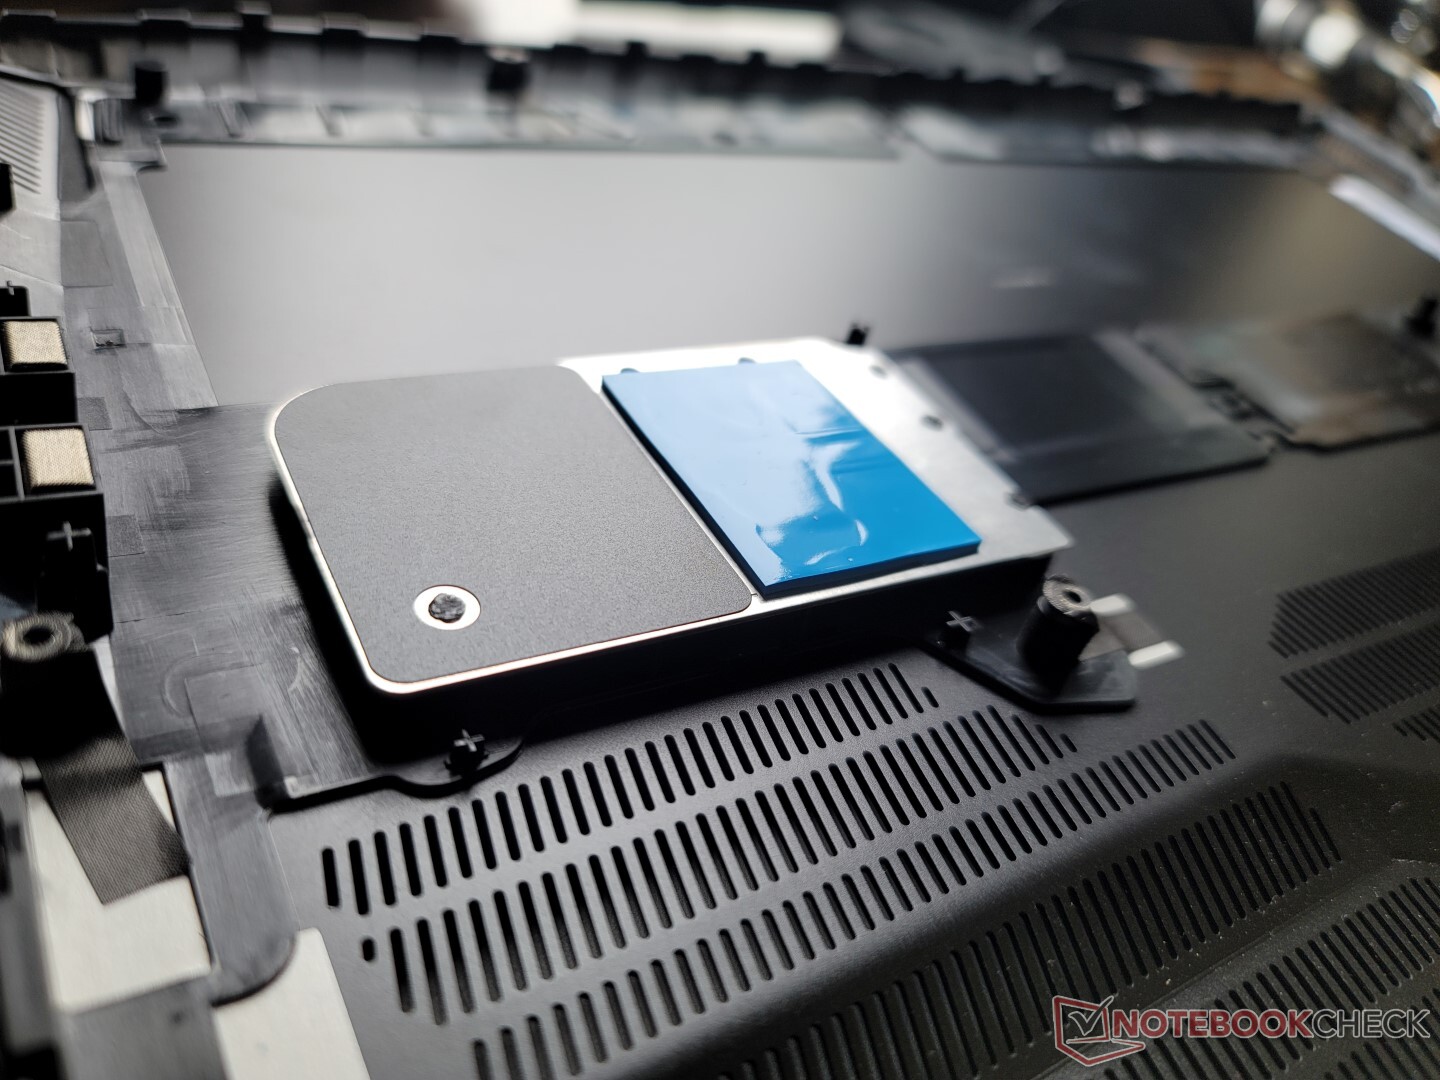
Maintenance
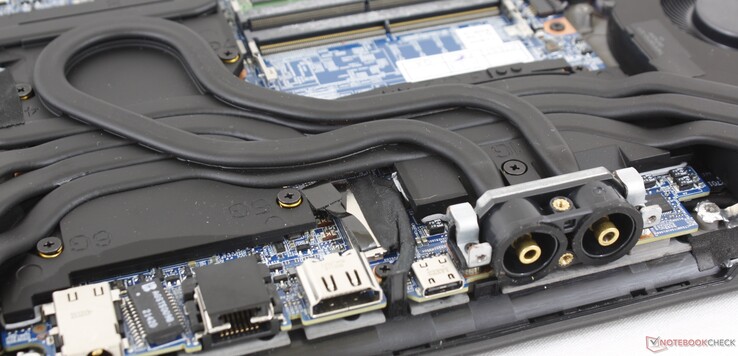
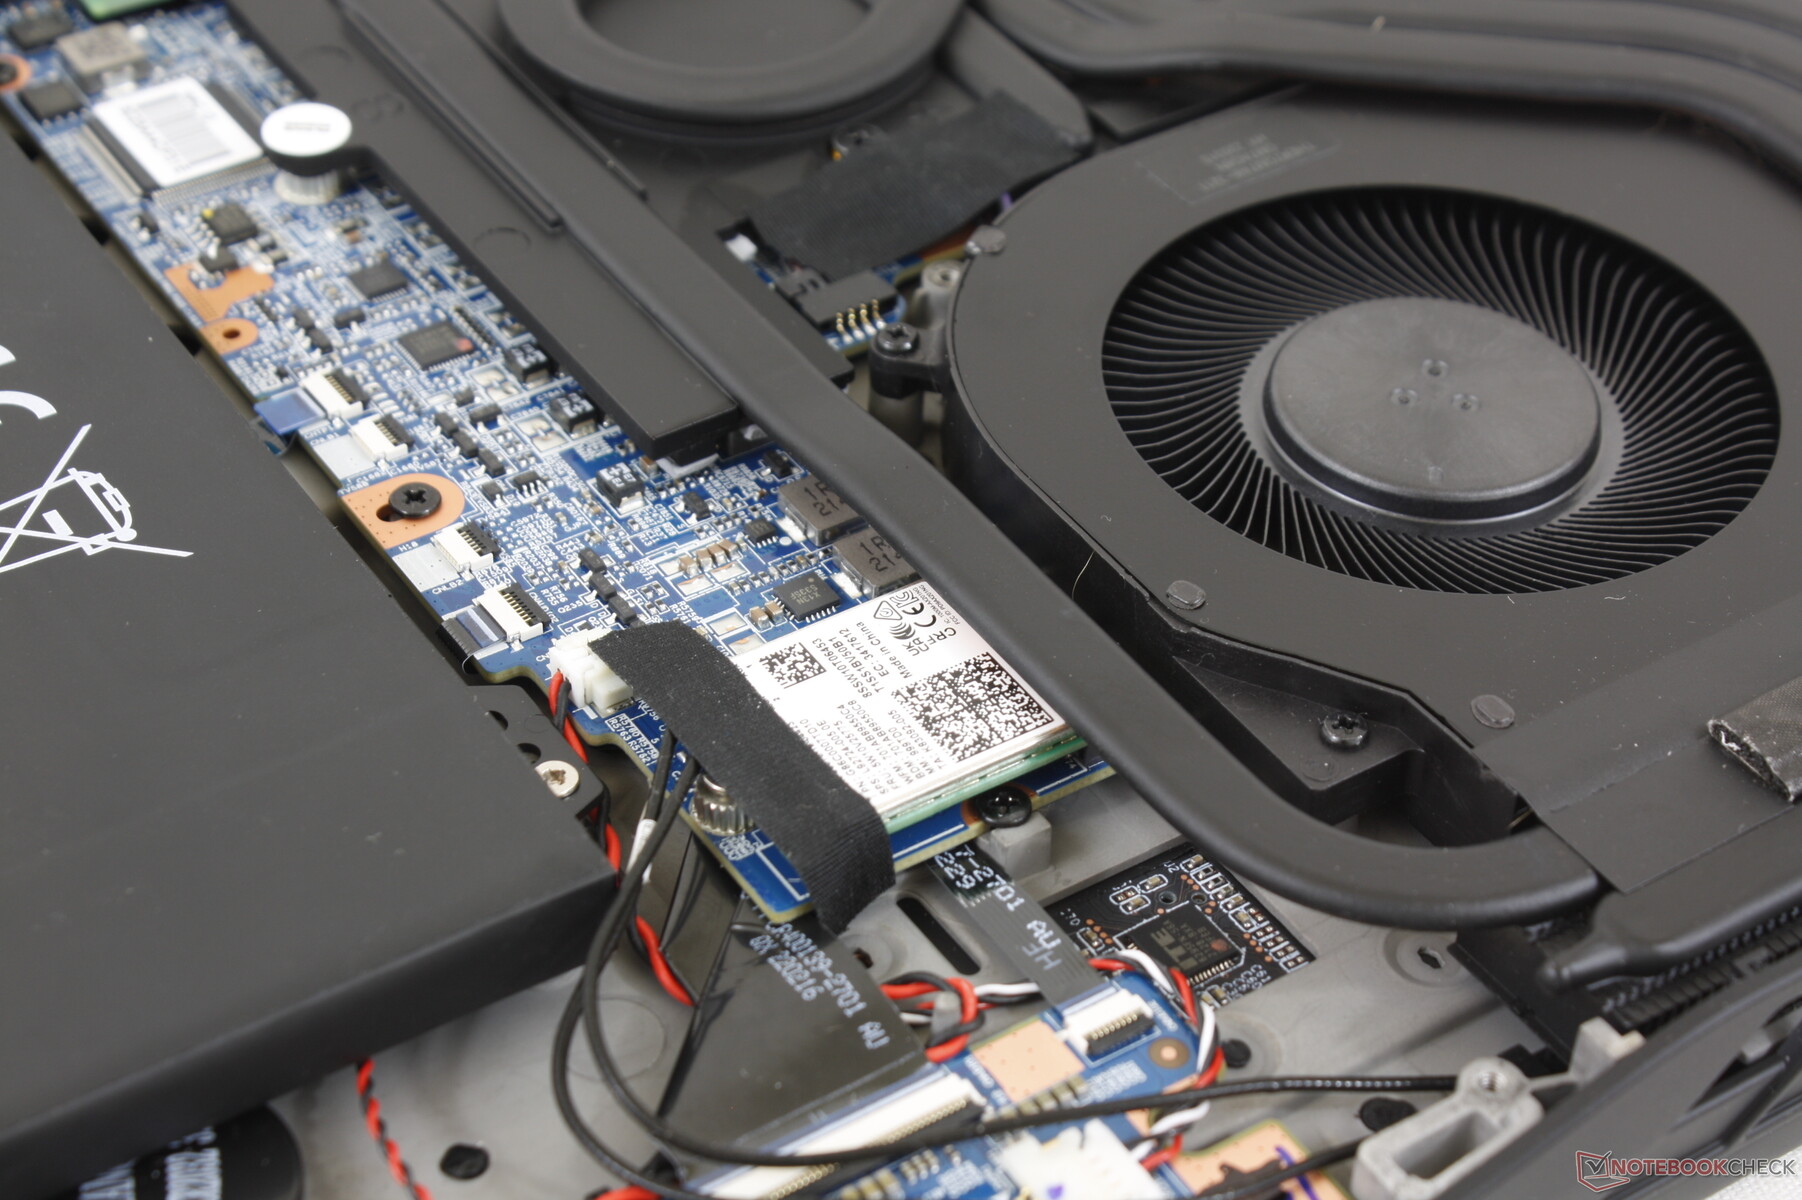
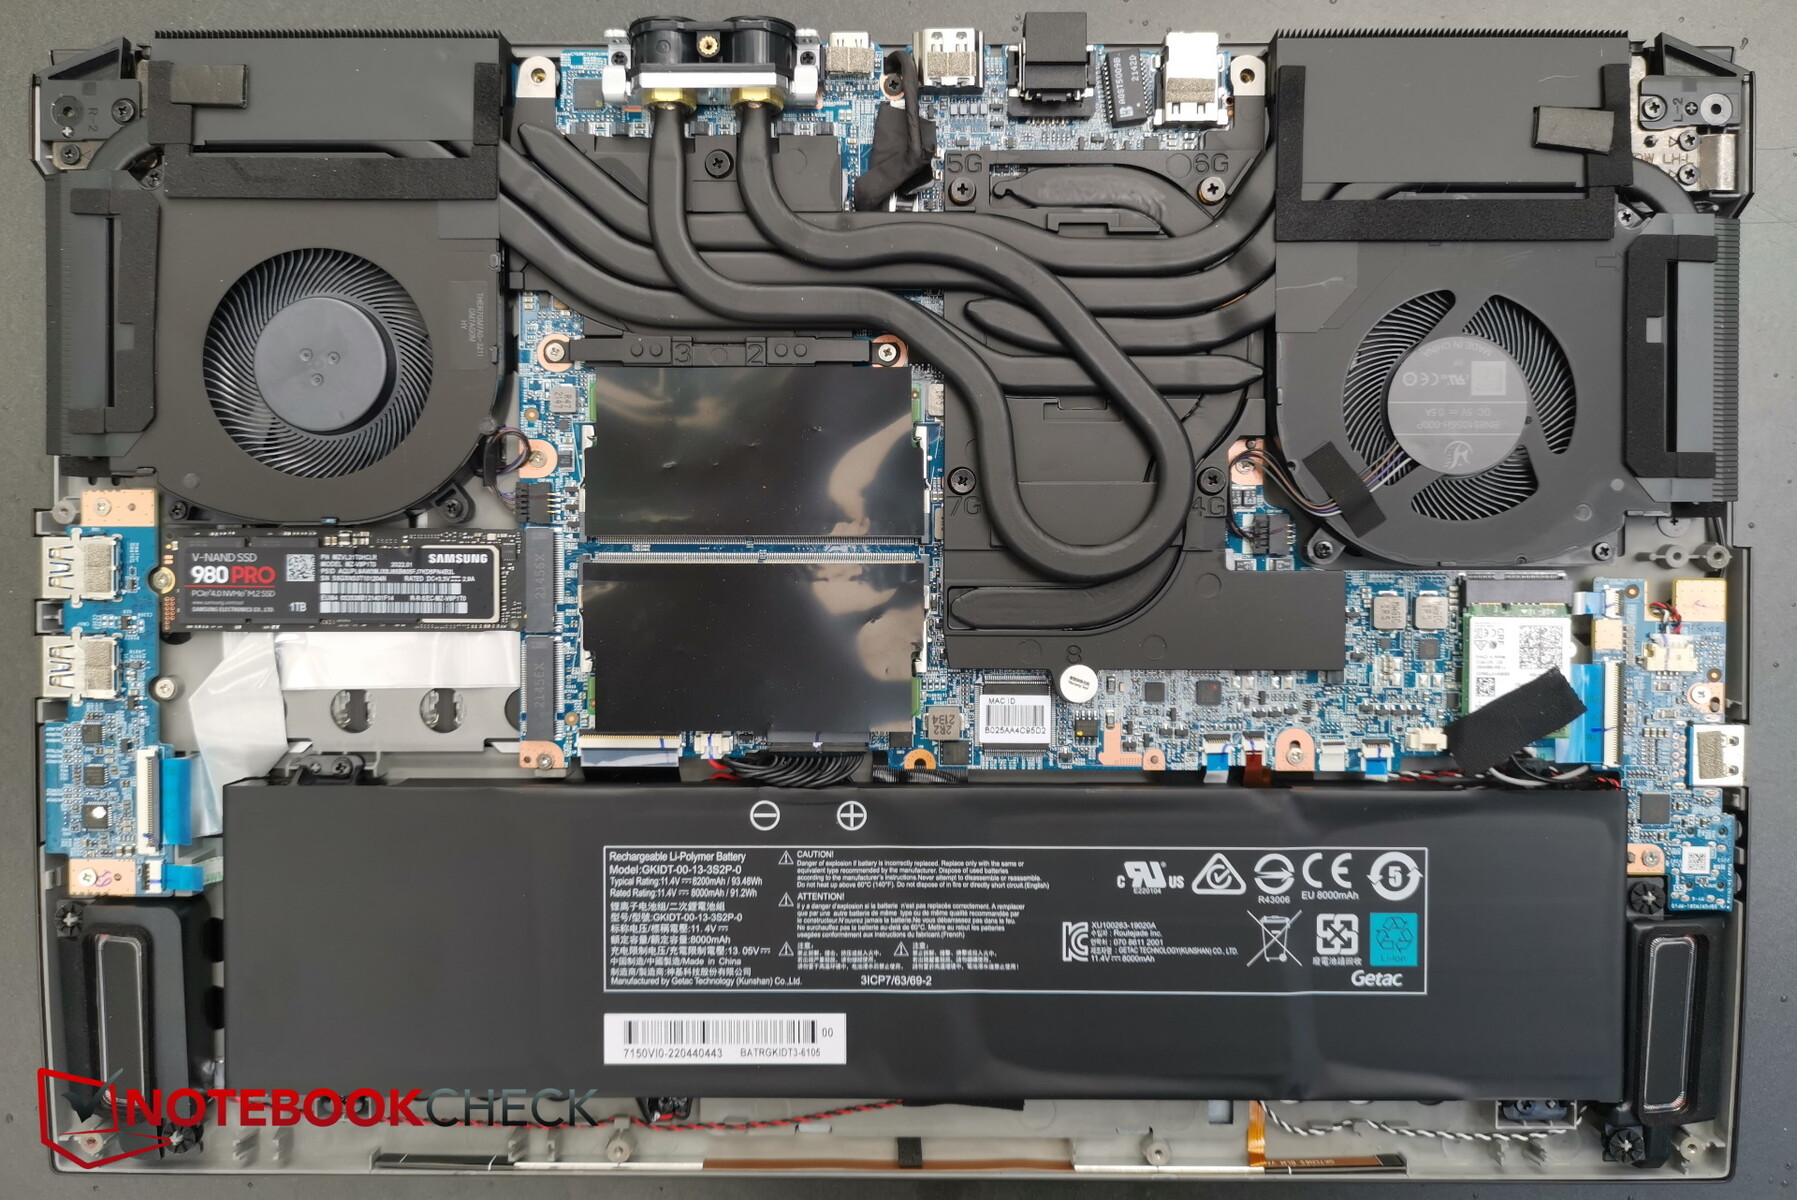
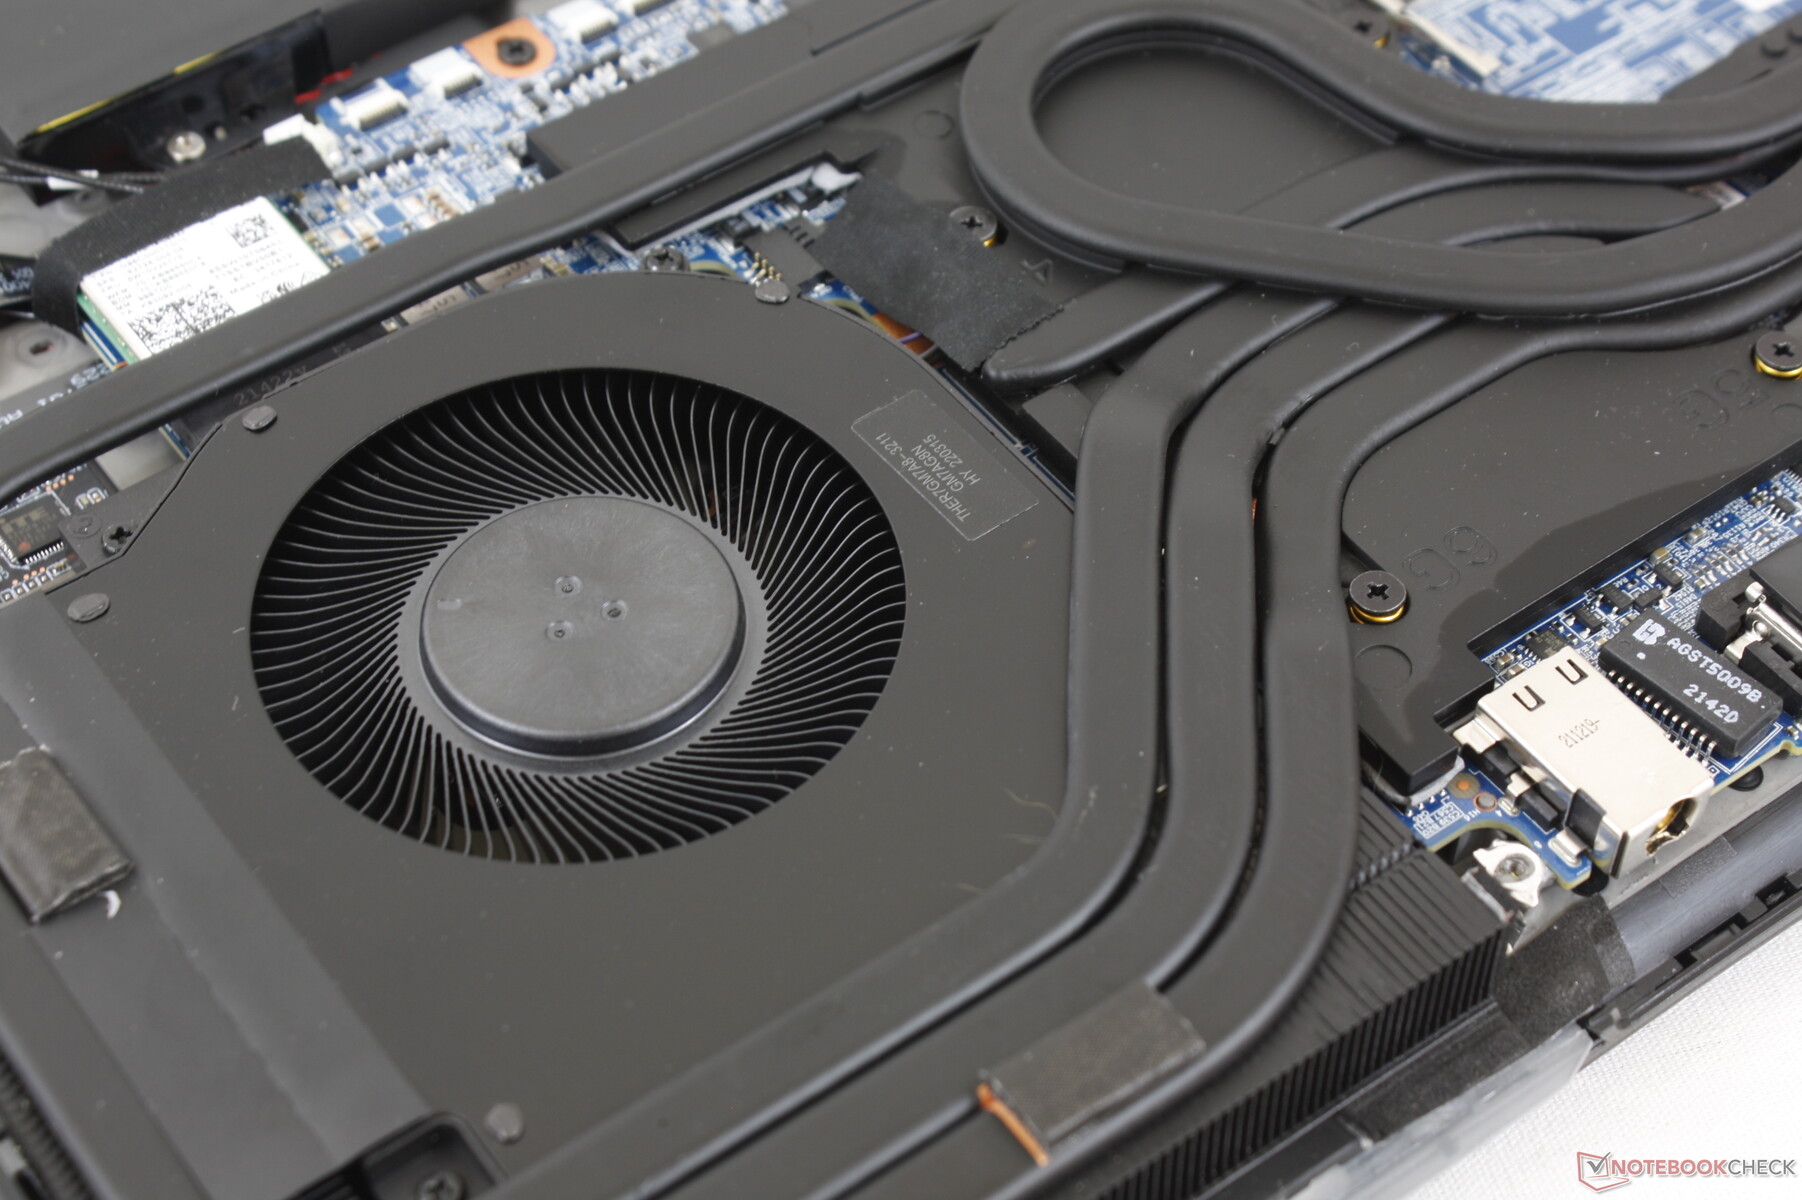
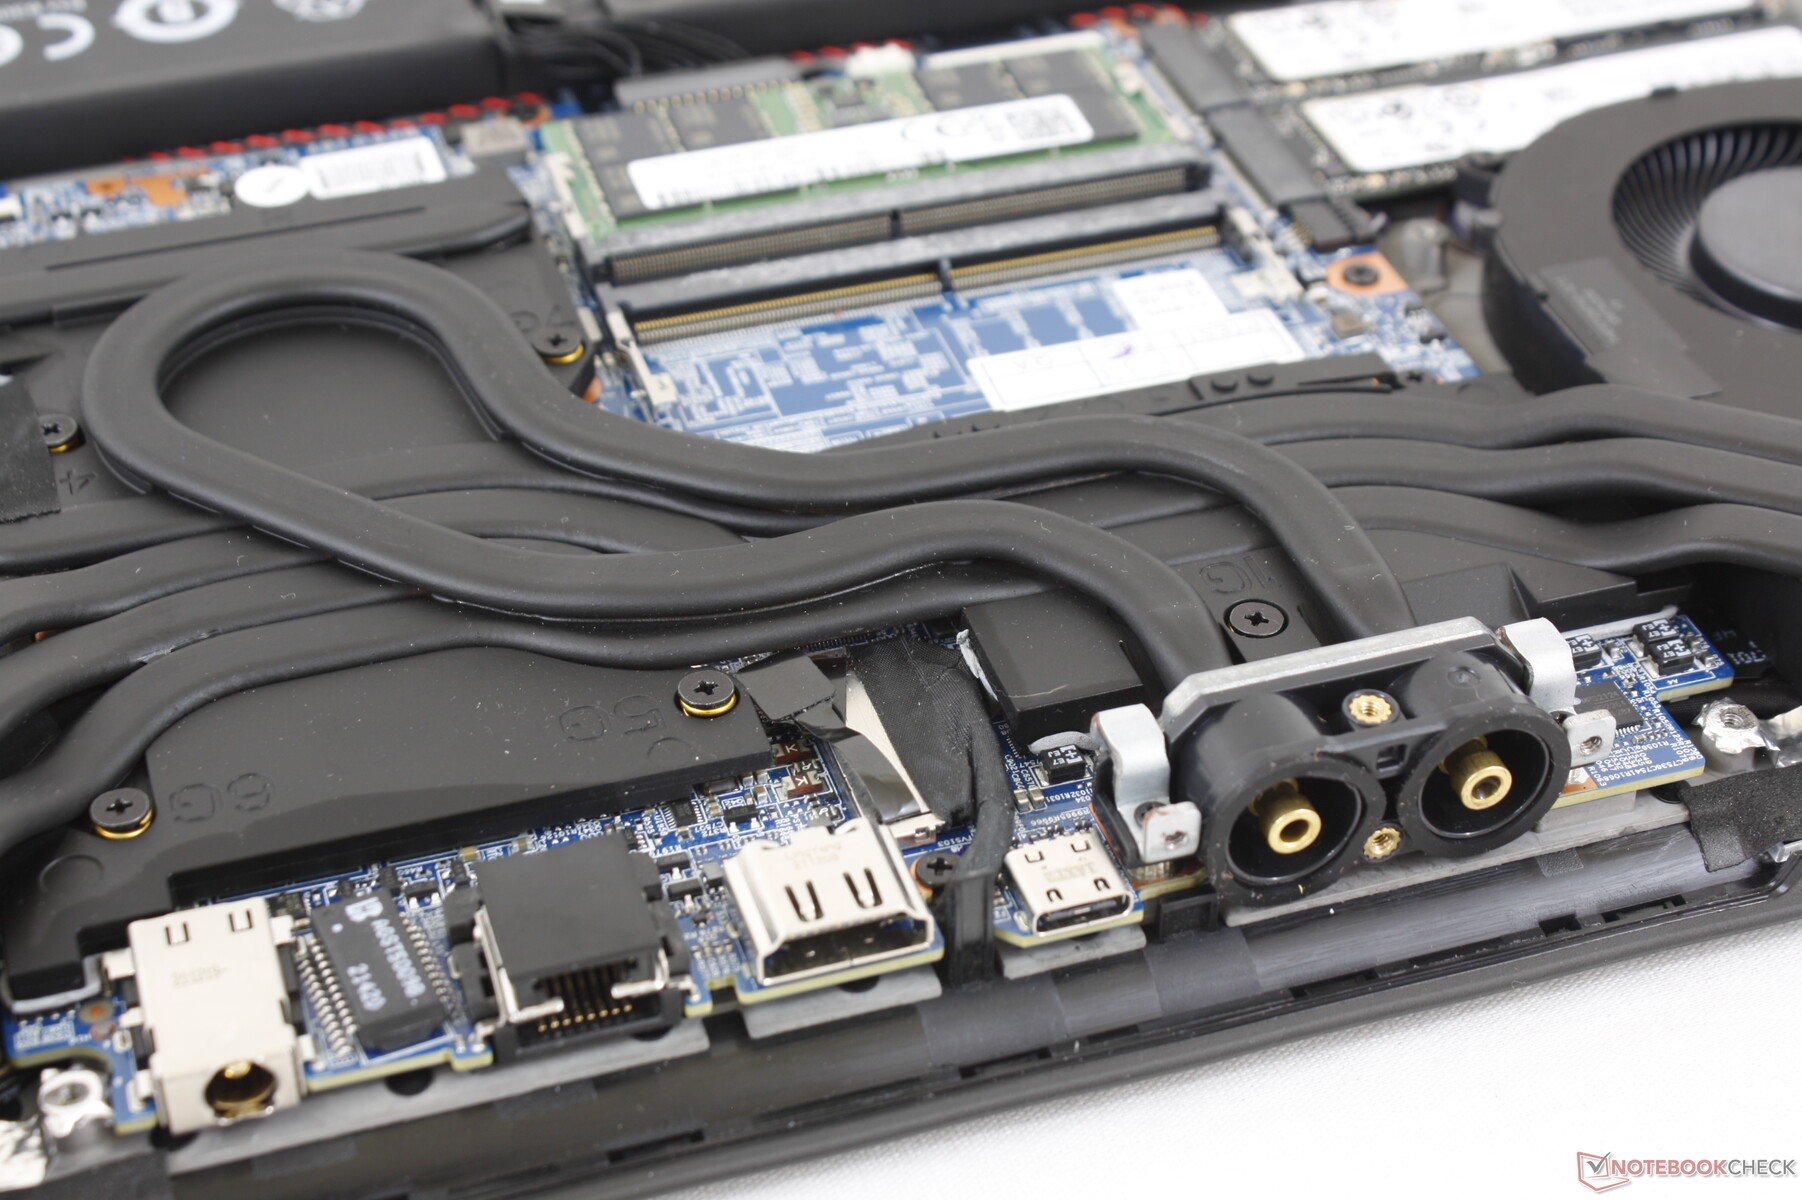
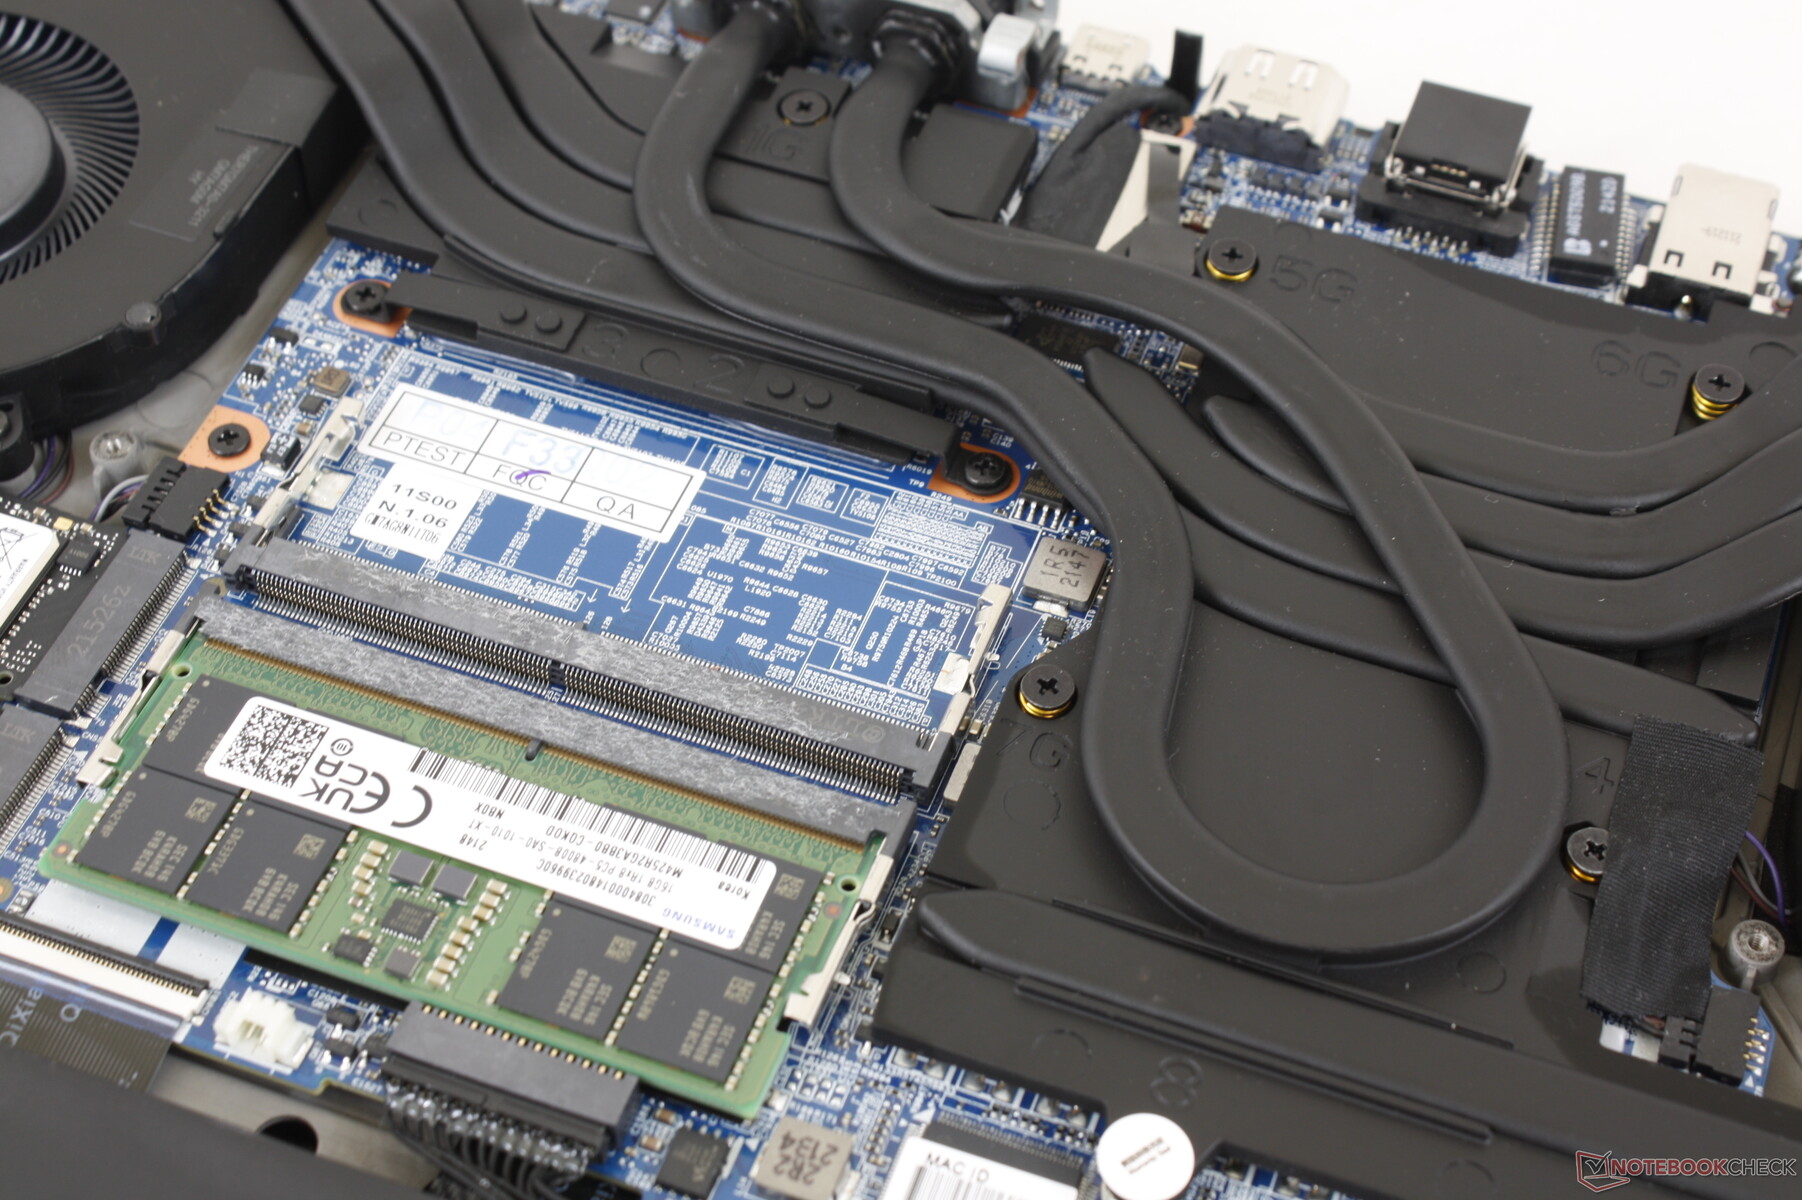
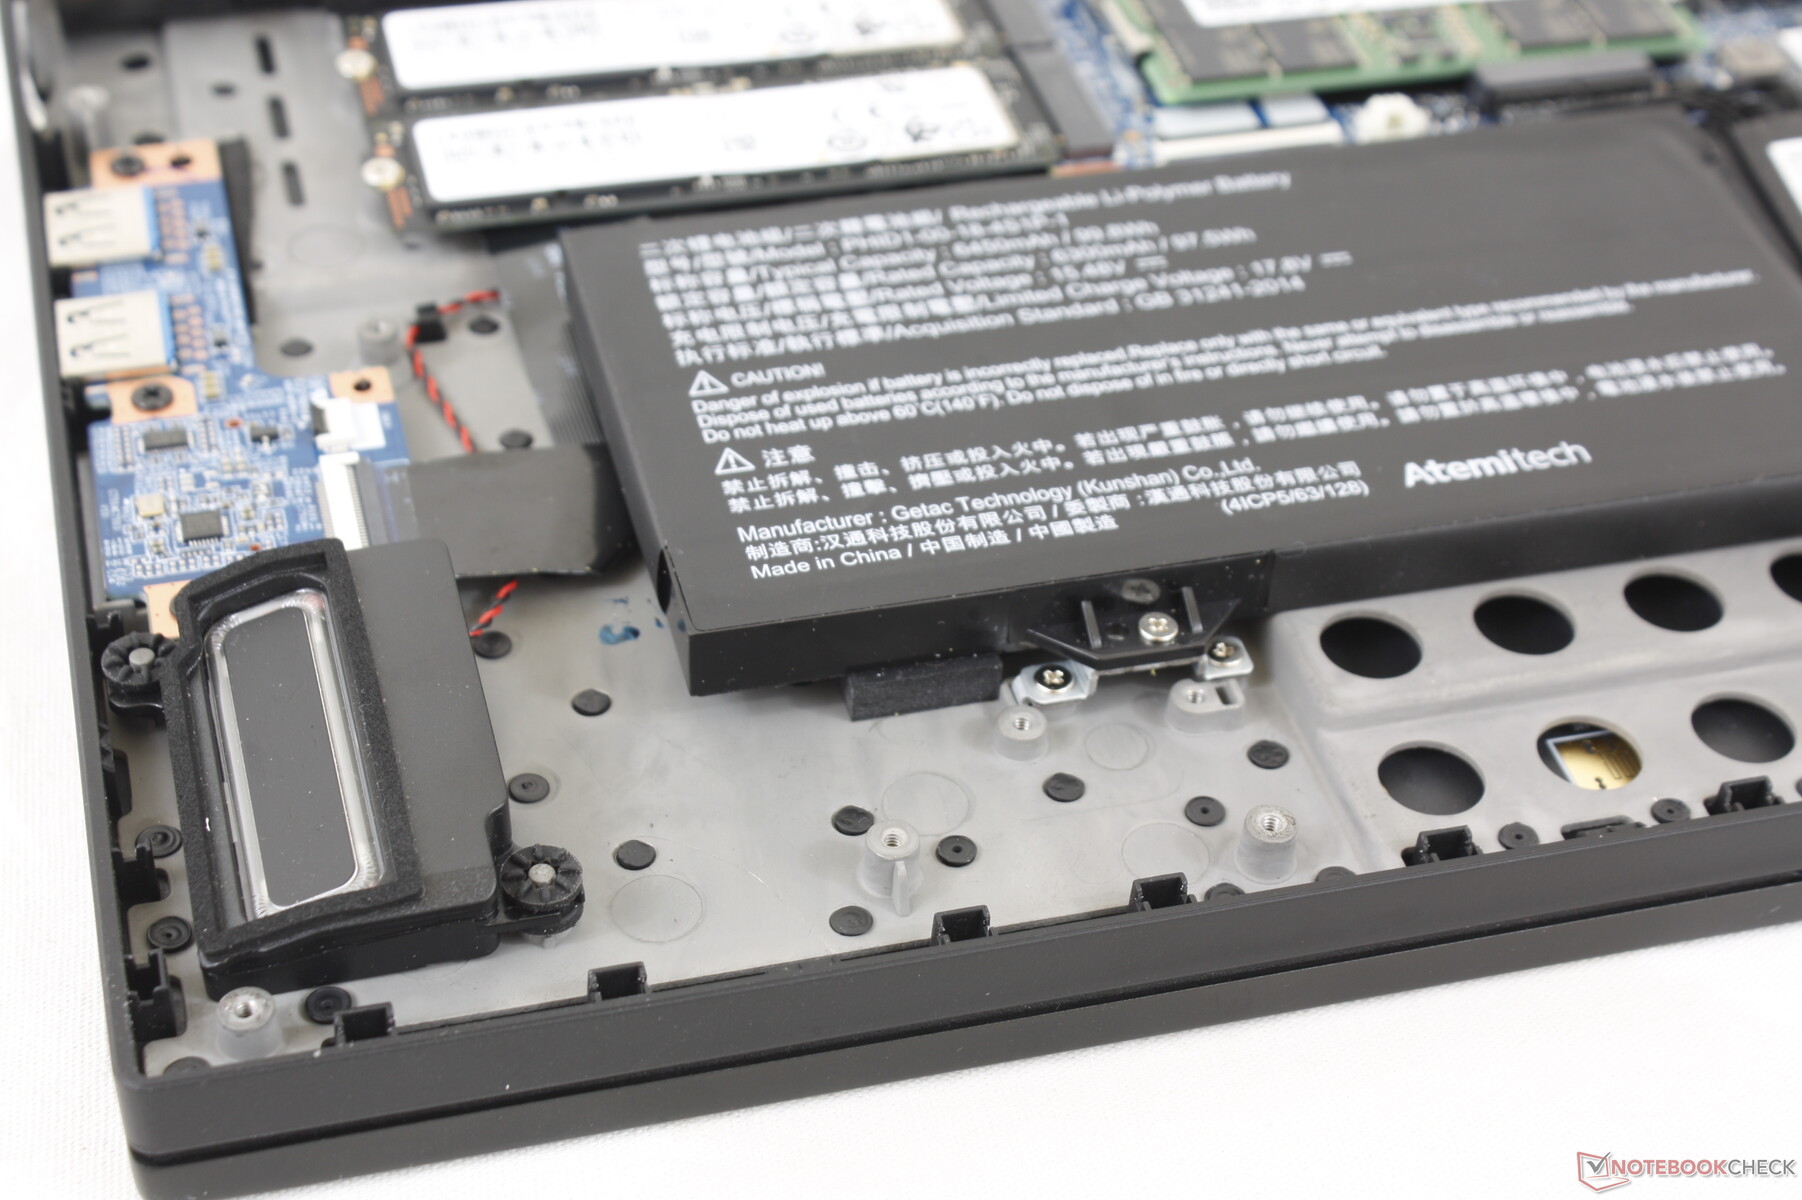
The bottom panel pops off easily after removing several Philips screws for straightforward RAM or SSD upgrades. The motherboard has many similarities to the GM5AG8W but with slight changes to the cooling solution as shown by the comparison images below.

Accessories and Warranty
The external cooling box includes two drain plugs, two water tubes, two water stoppers, and a user's manual in addition to the usual AC adapter.
The standard one-year limited warranty applies if purchased in the US.
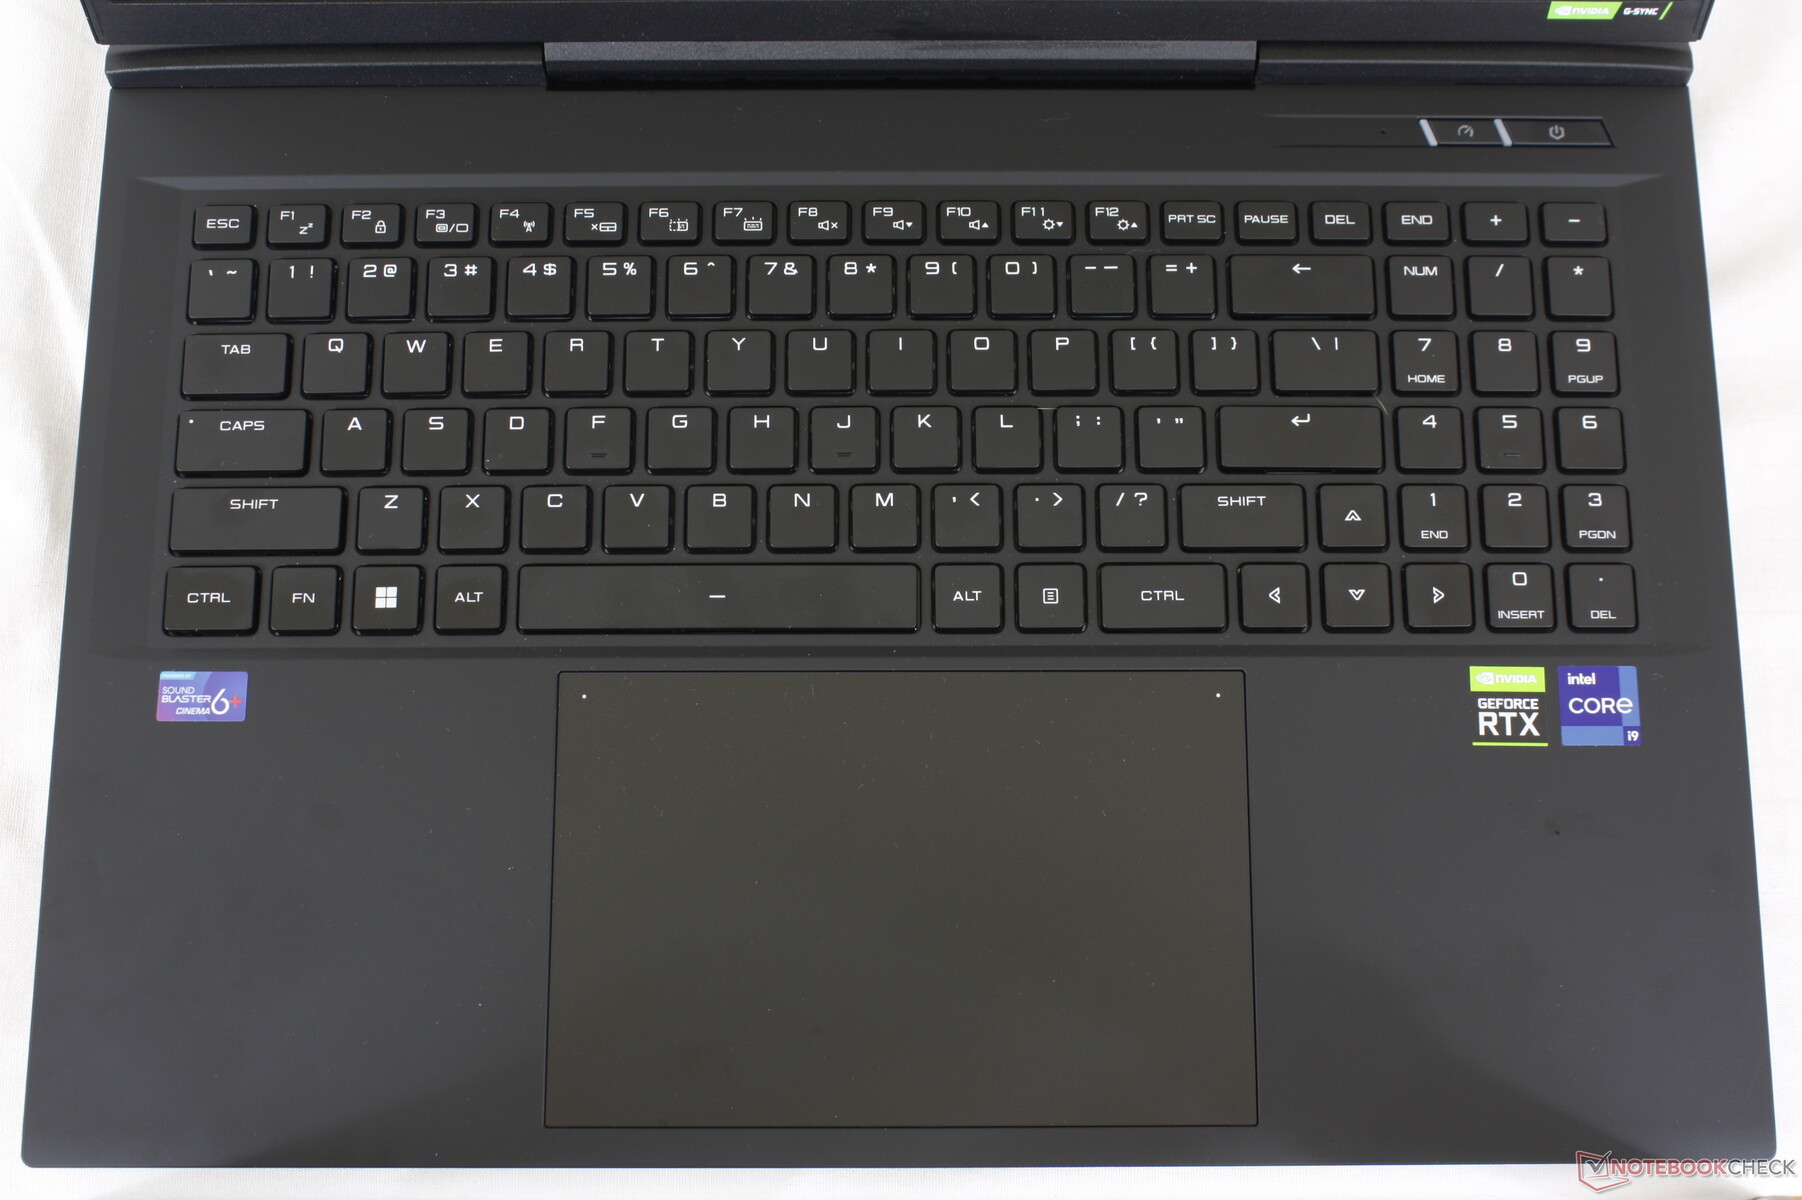
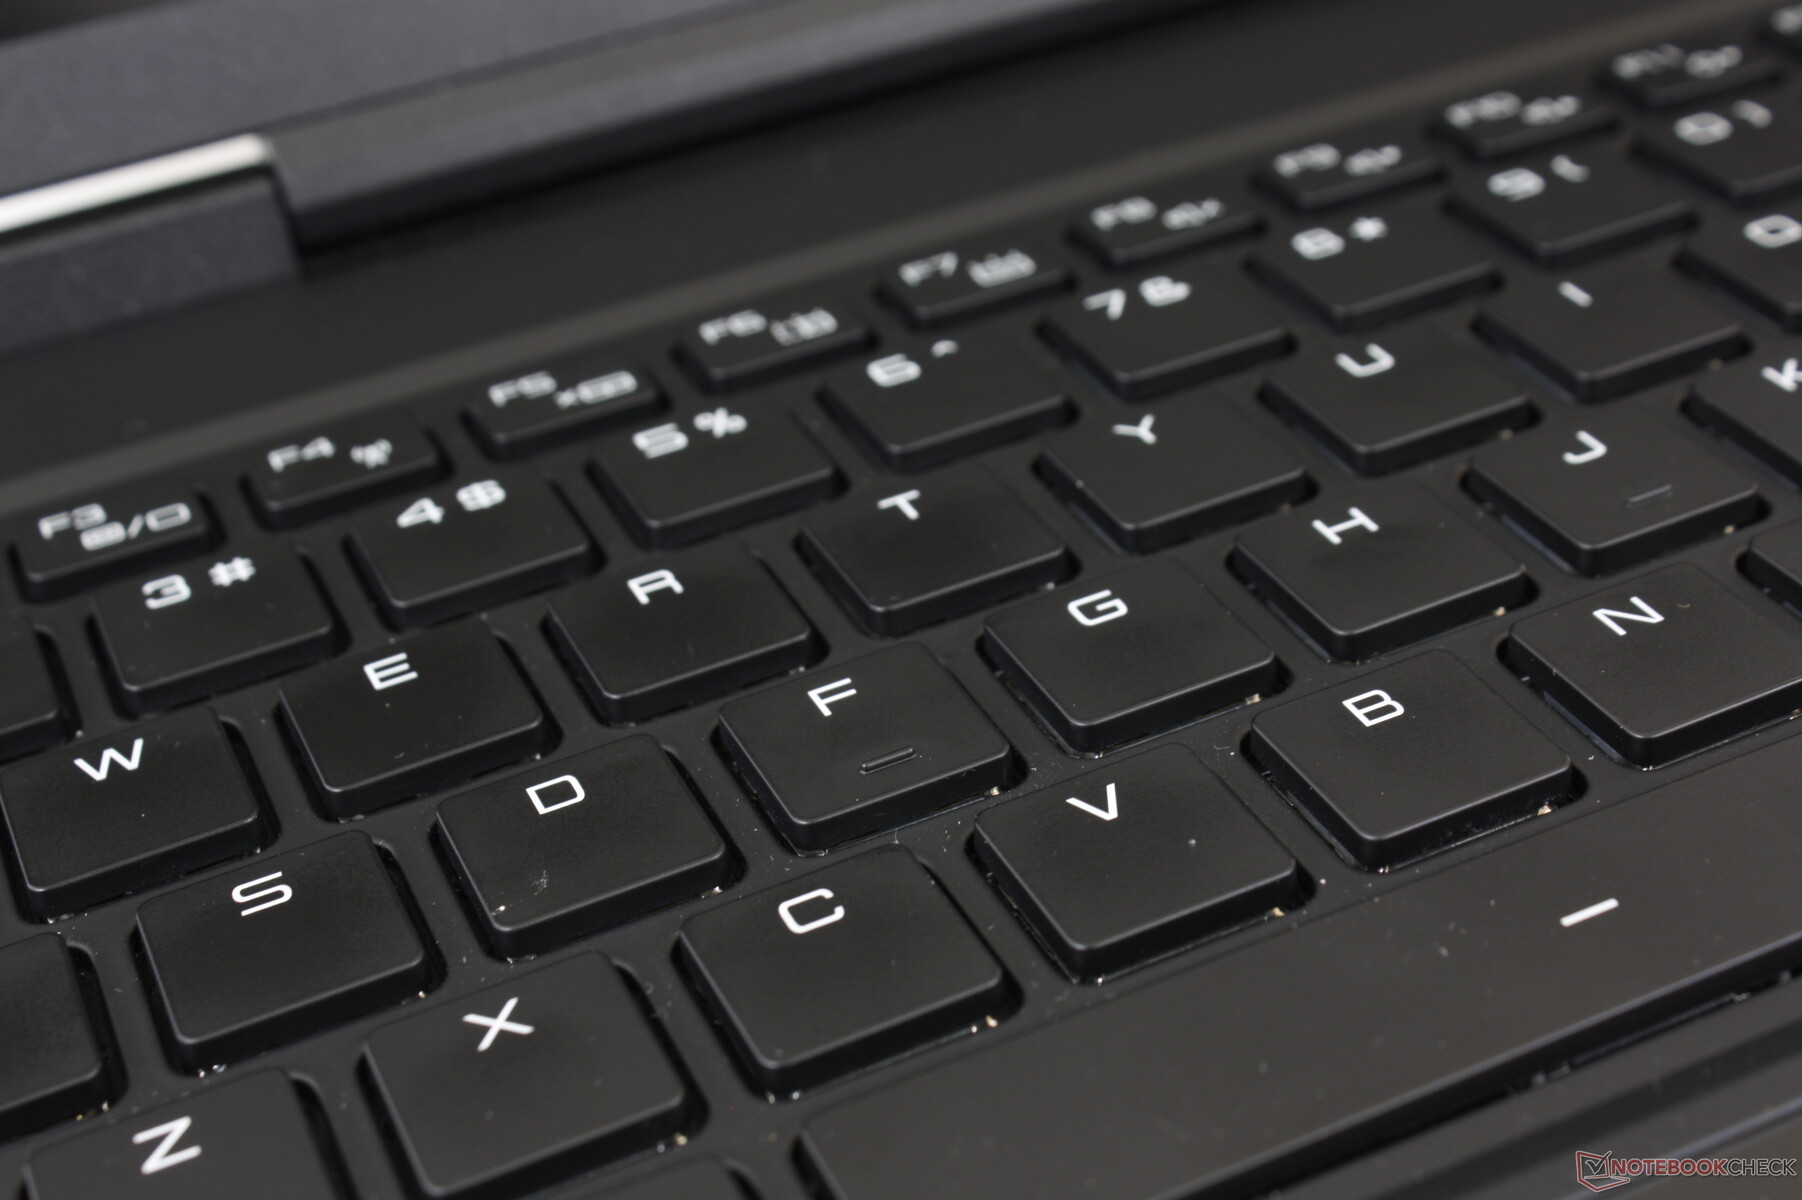
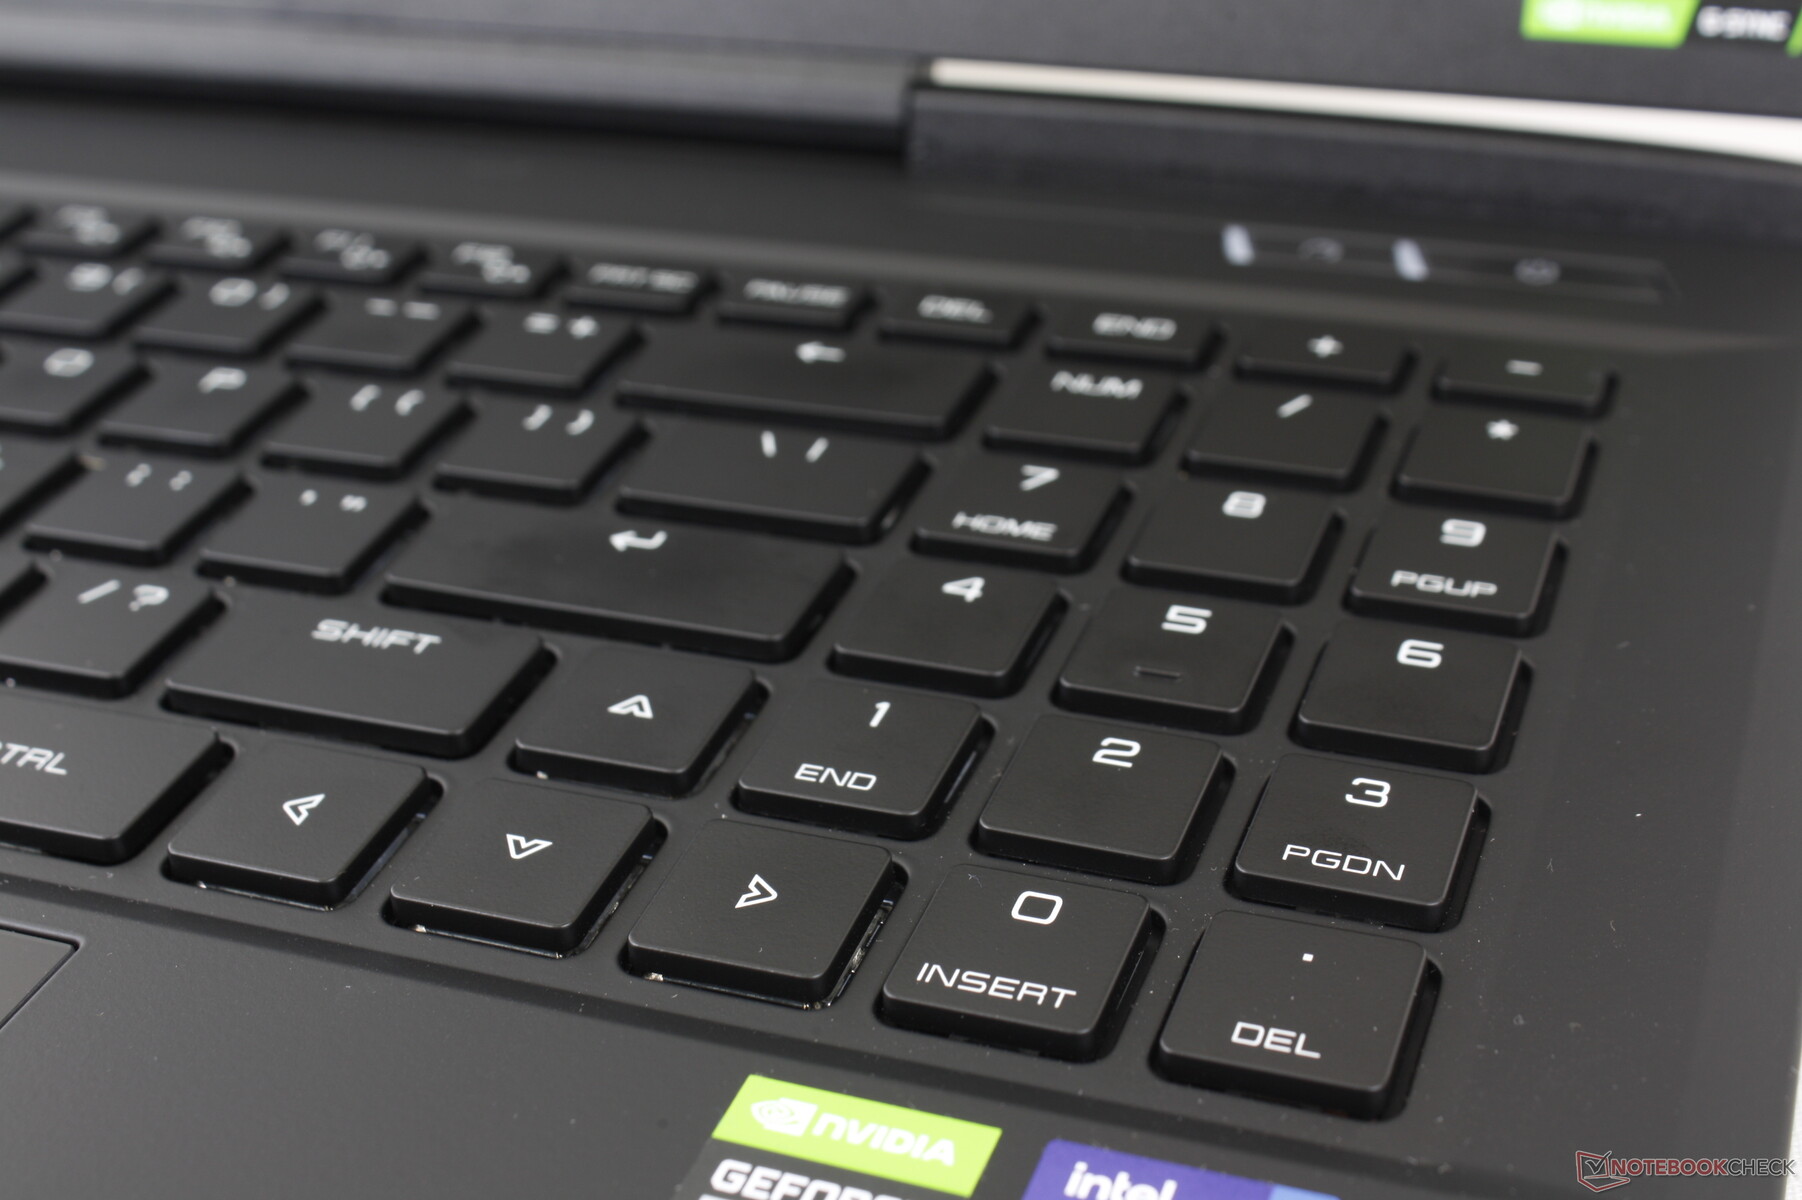
Input Devices — Loud And Clicky
Keyboard
The per-key RGB keyboard is different than on the XMG Neo 15 E22 even though the two laptops share the same ports. The Cherry MX keys on our Uniwill offer noticeably deeper travel, crisper feedback, and a much louder clatter than on most other laptops. You'll want to avoid using this laptop in classrooms, conferences, or libraries because of the loud clatter.
An annoying aspect we noticed is that the numpad keys are softer and quieter than the main QWERTY keys and so feedback is not uniform across all keys. It feels awkward typing between words and numbers because feedback is so different between the keys.
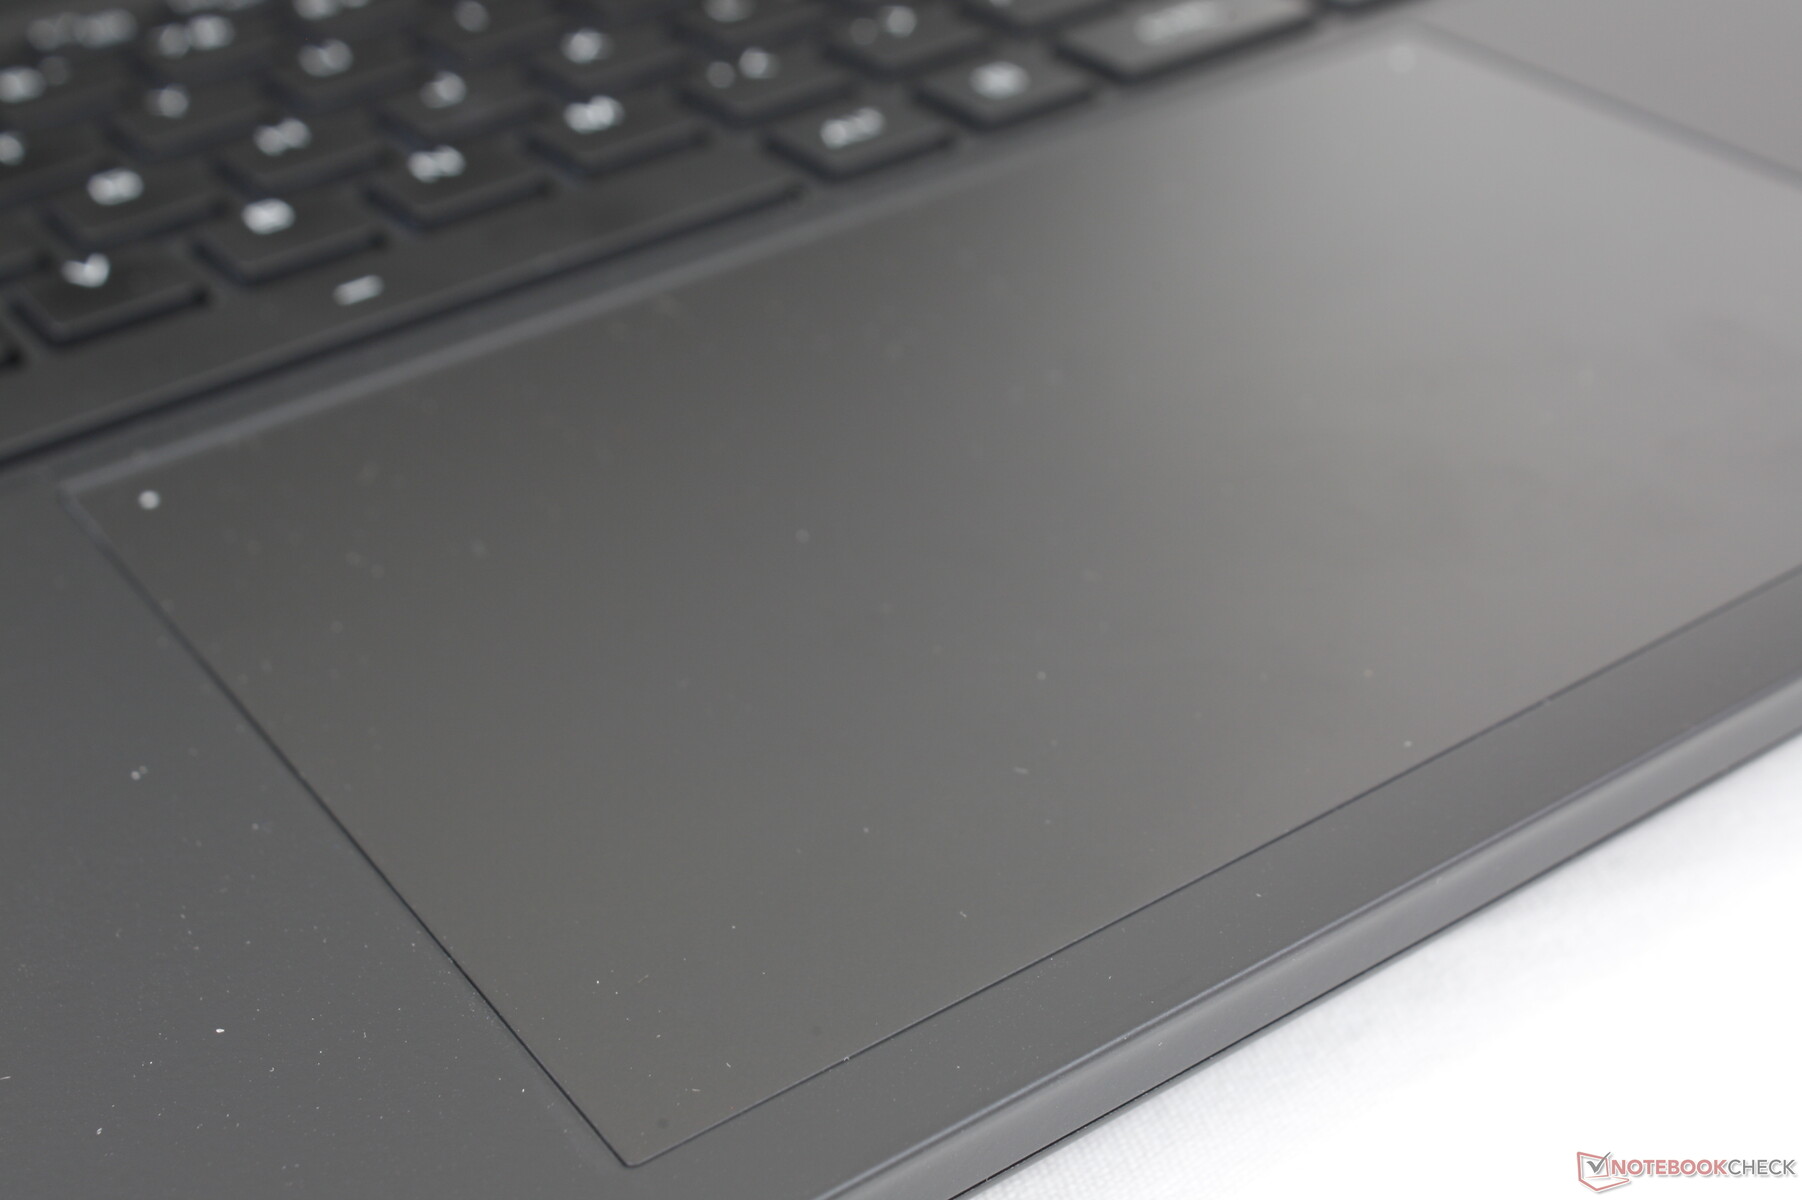
Touchpad
The oversized clickpad is even larger than the already large clickpad on the MSI GS77 (15.5 x 10 cm vs. 13.2 x 8.2 cm). Its surface is slightly rubberized for a very smooth glide at medium-to-high speeds with only a bit of sticking at slower speeds.
Feedback when clicking on the clickpad is firmer than on the large XPS 17 clickpad for a more satisfying feel. It's definitely louder, however, but we don't expect this to be a huge issue since the mechanical keys are already quite loud anyway.
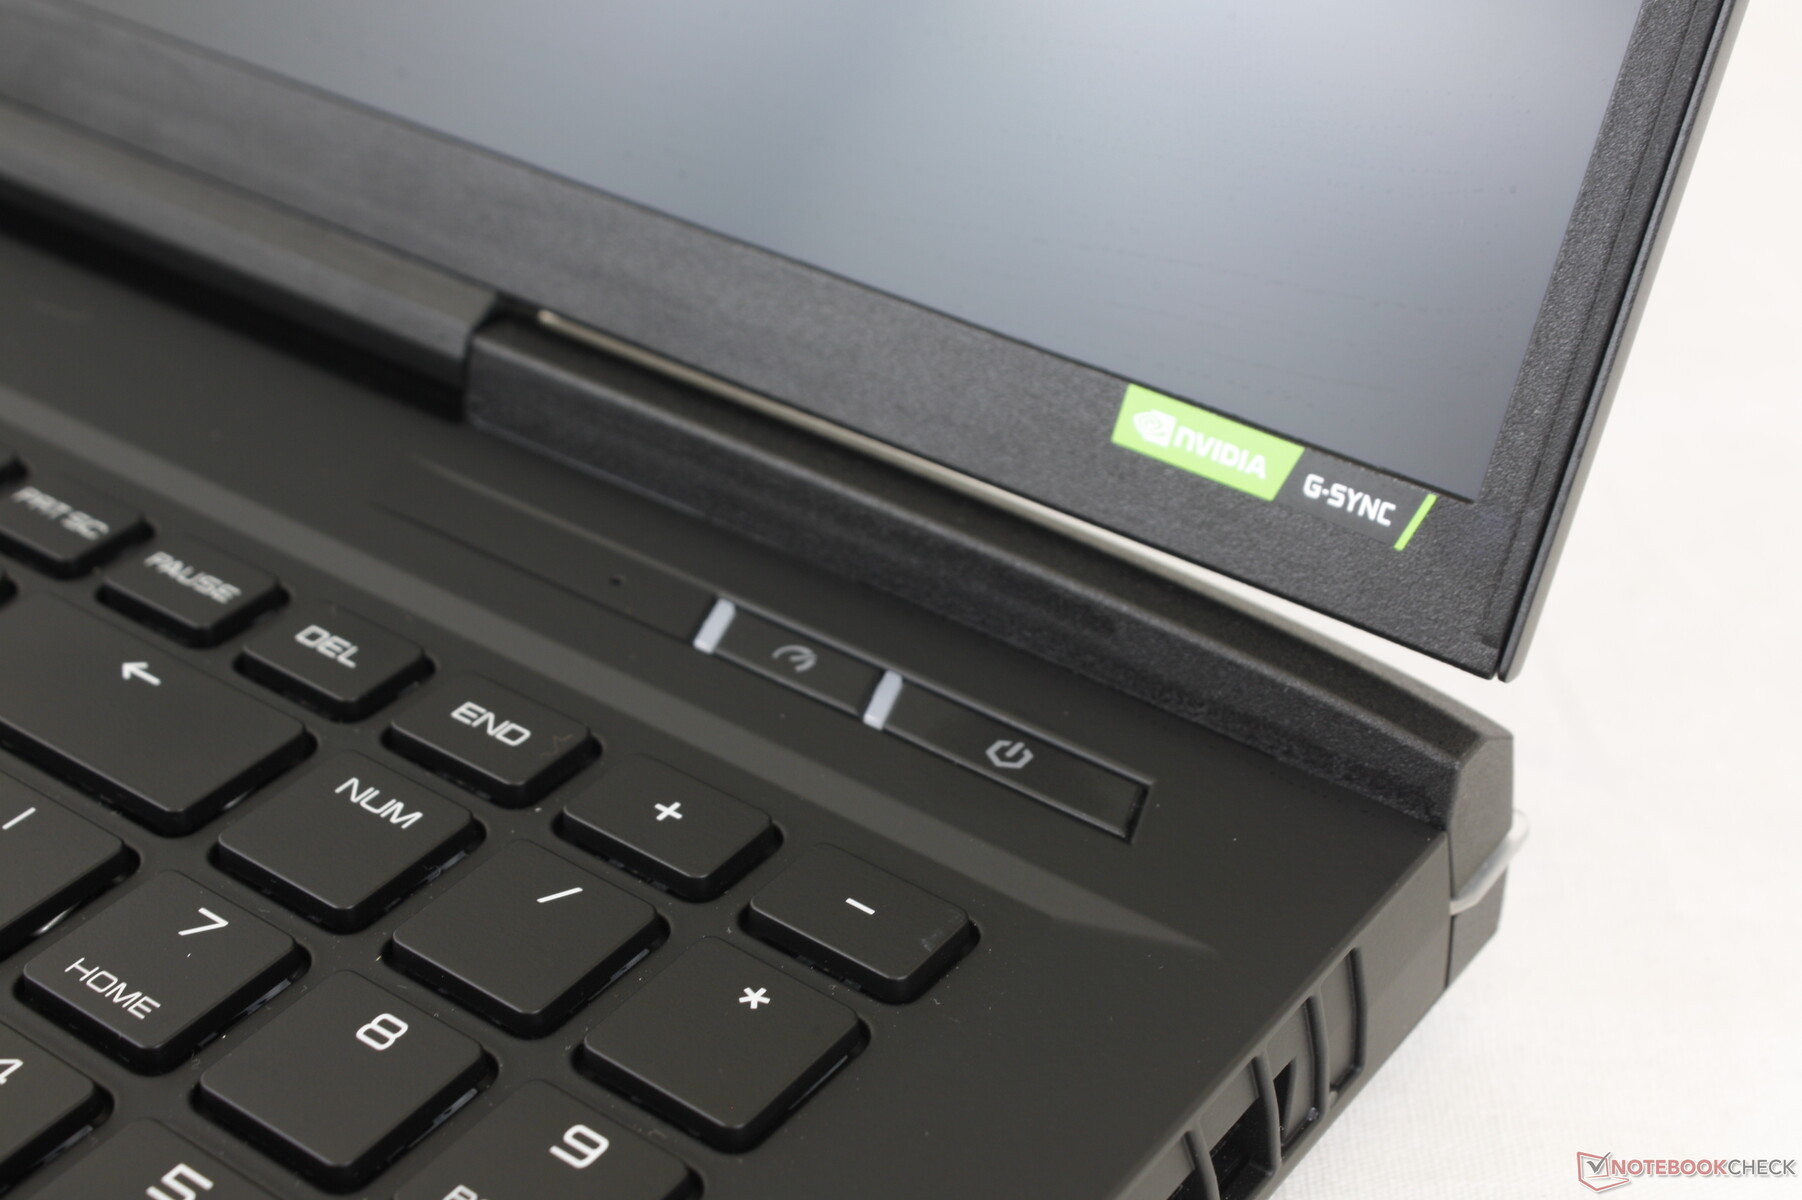
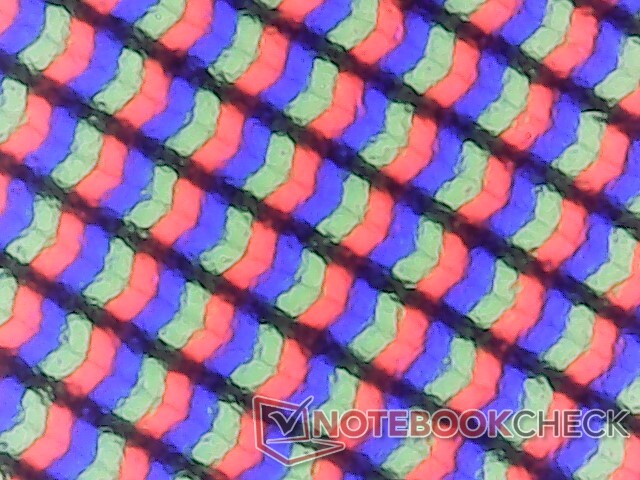
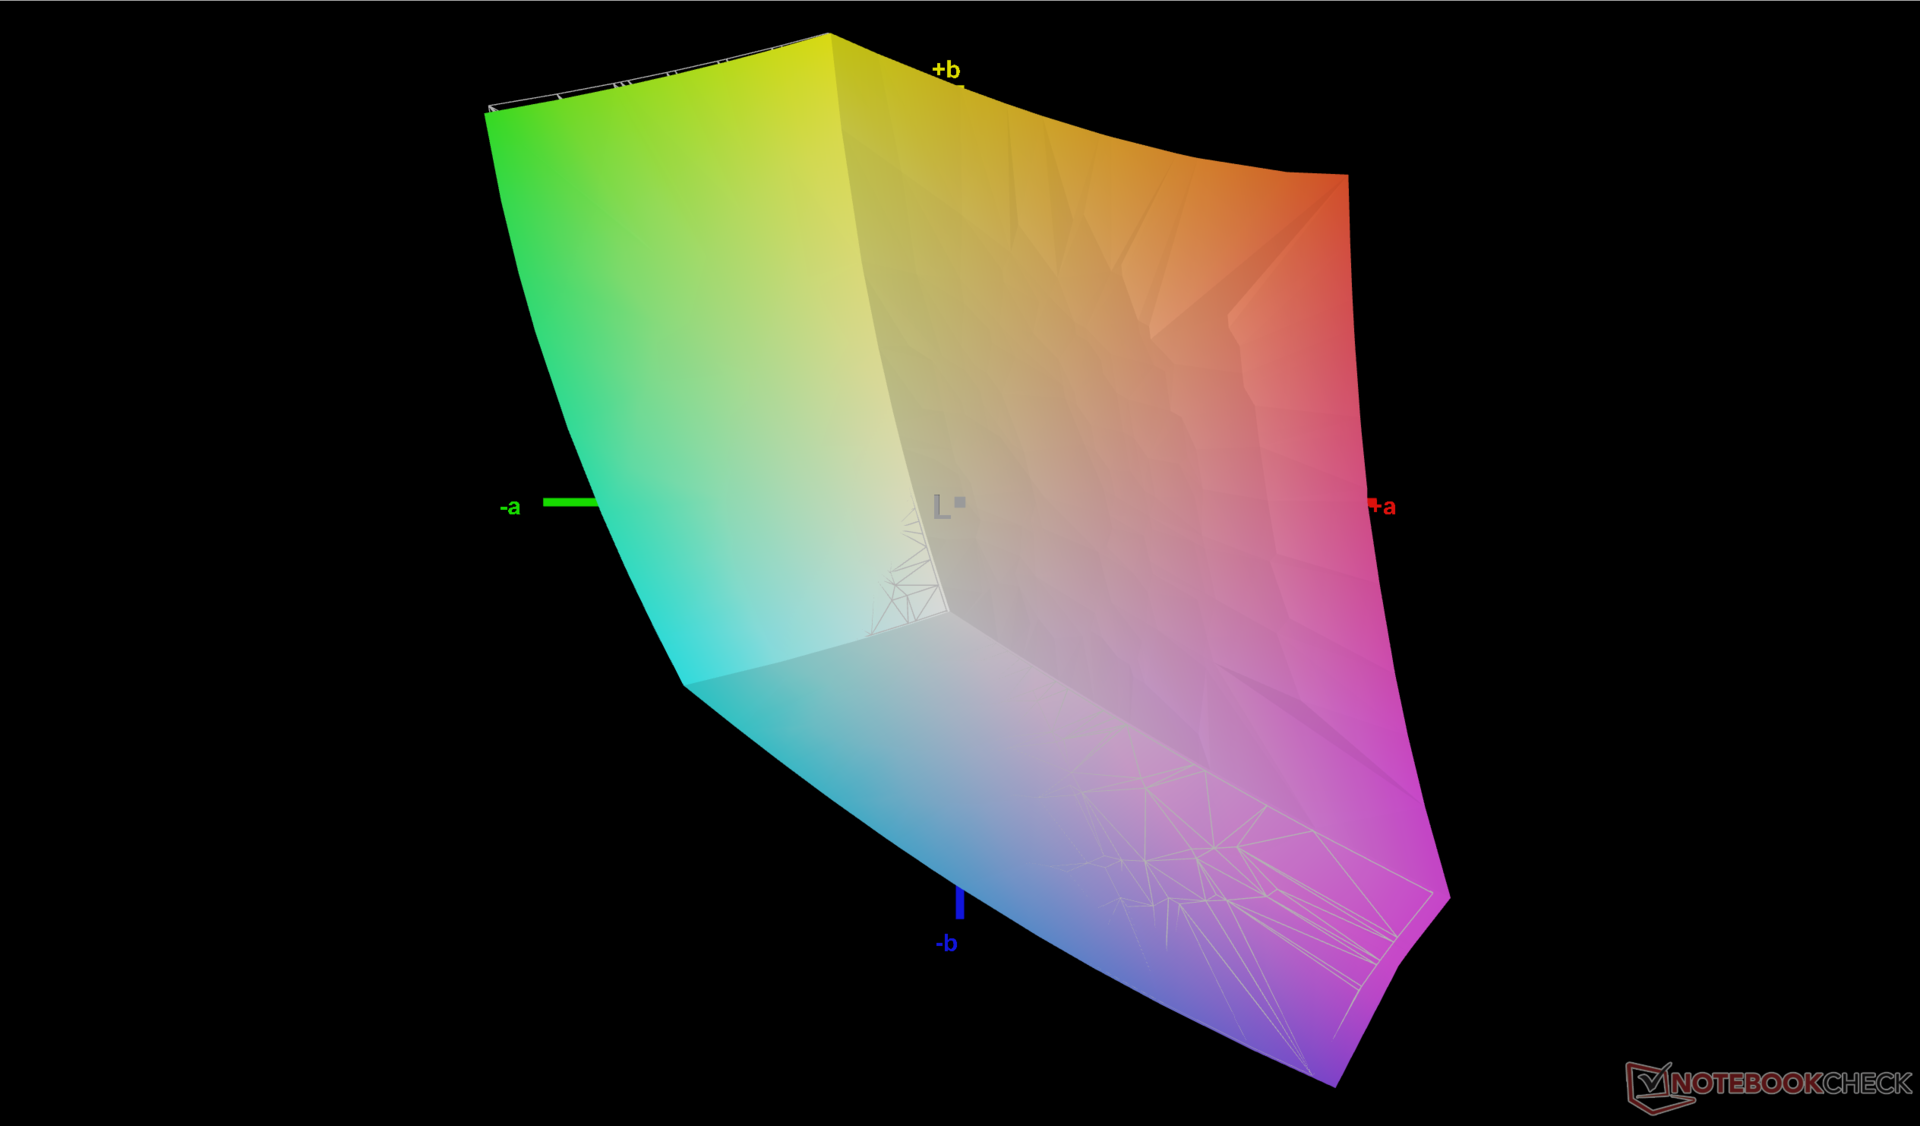
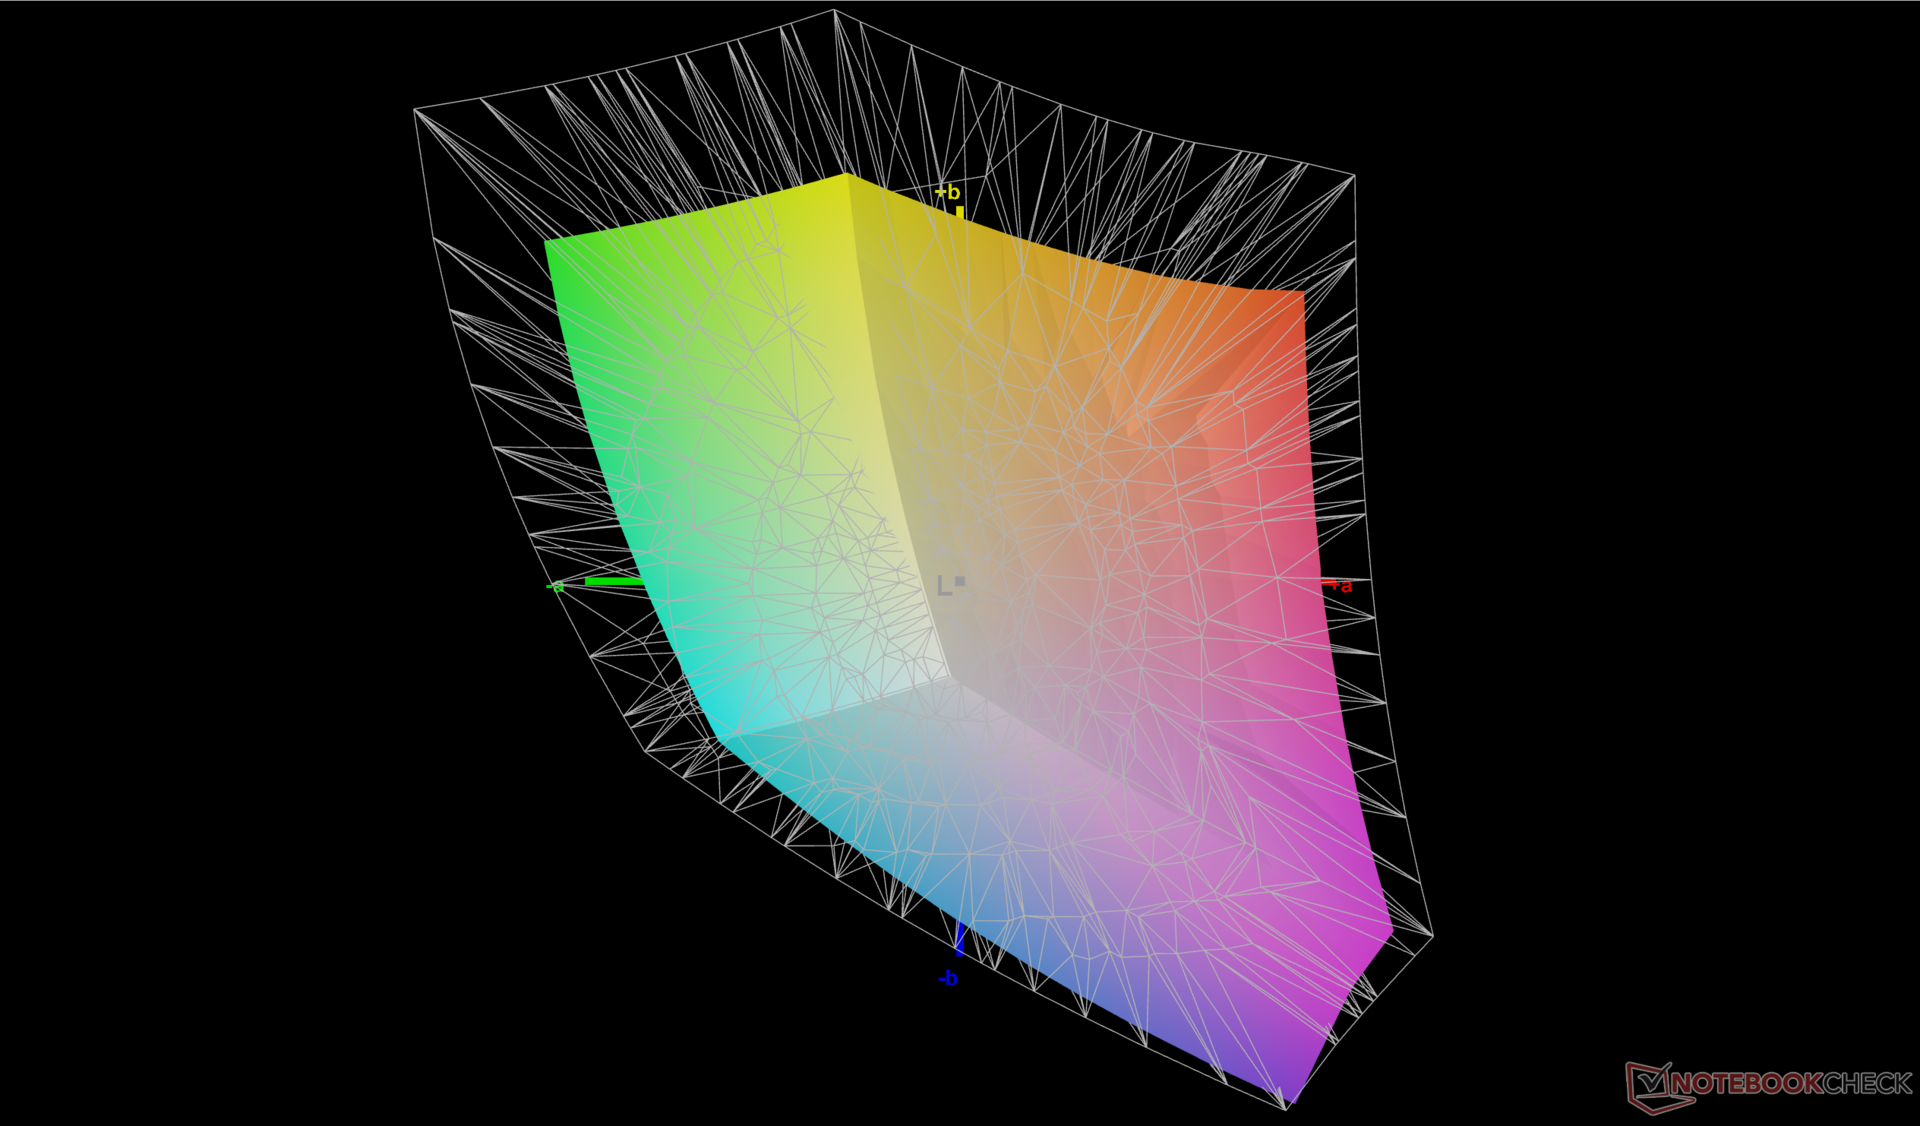
Display — Optimized For 1440p Gaming
The BOE NE170QDM-NZ1 panel on our Uniwill test unit is the first to appear in our database. This G-Sync-compatible IPS panel offers full sRGB coverage, fast response times, good contrast, a fast 240 Hz refresh rate, and a relatively bright 400-nit backlight to be worthy fit for an enthusiast gaming machine. However, most other gaming laptops like the Razer Blade 17 have additional panel options like 4K or OLED both of which are unavailable on the Uniwill .
| |||||||||||||||||||||||||
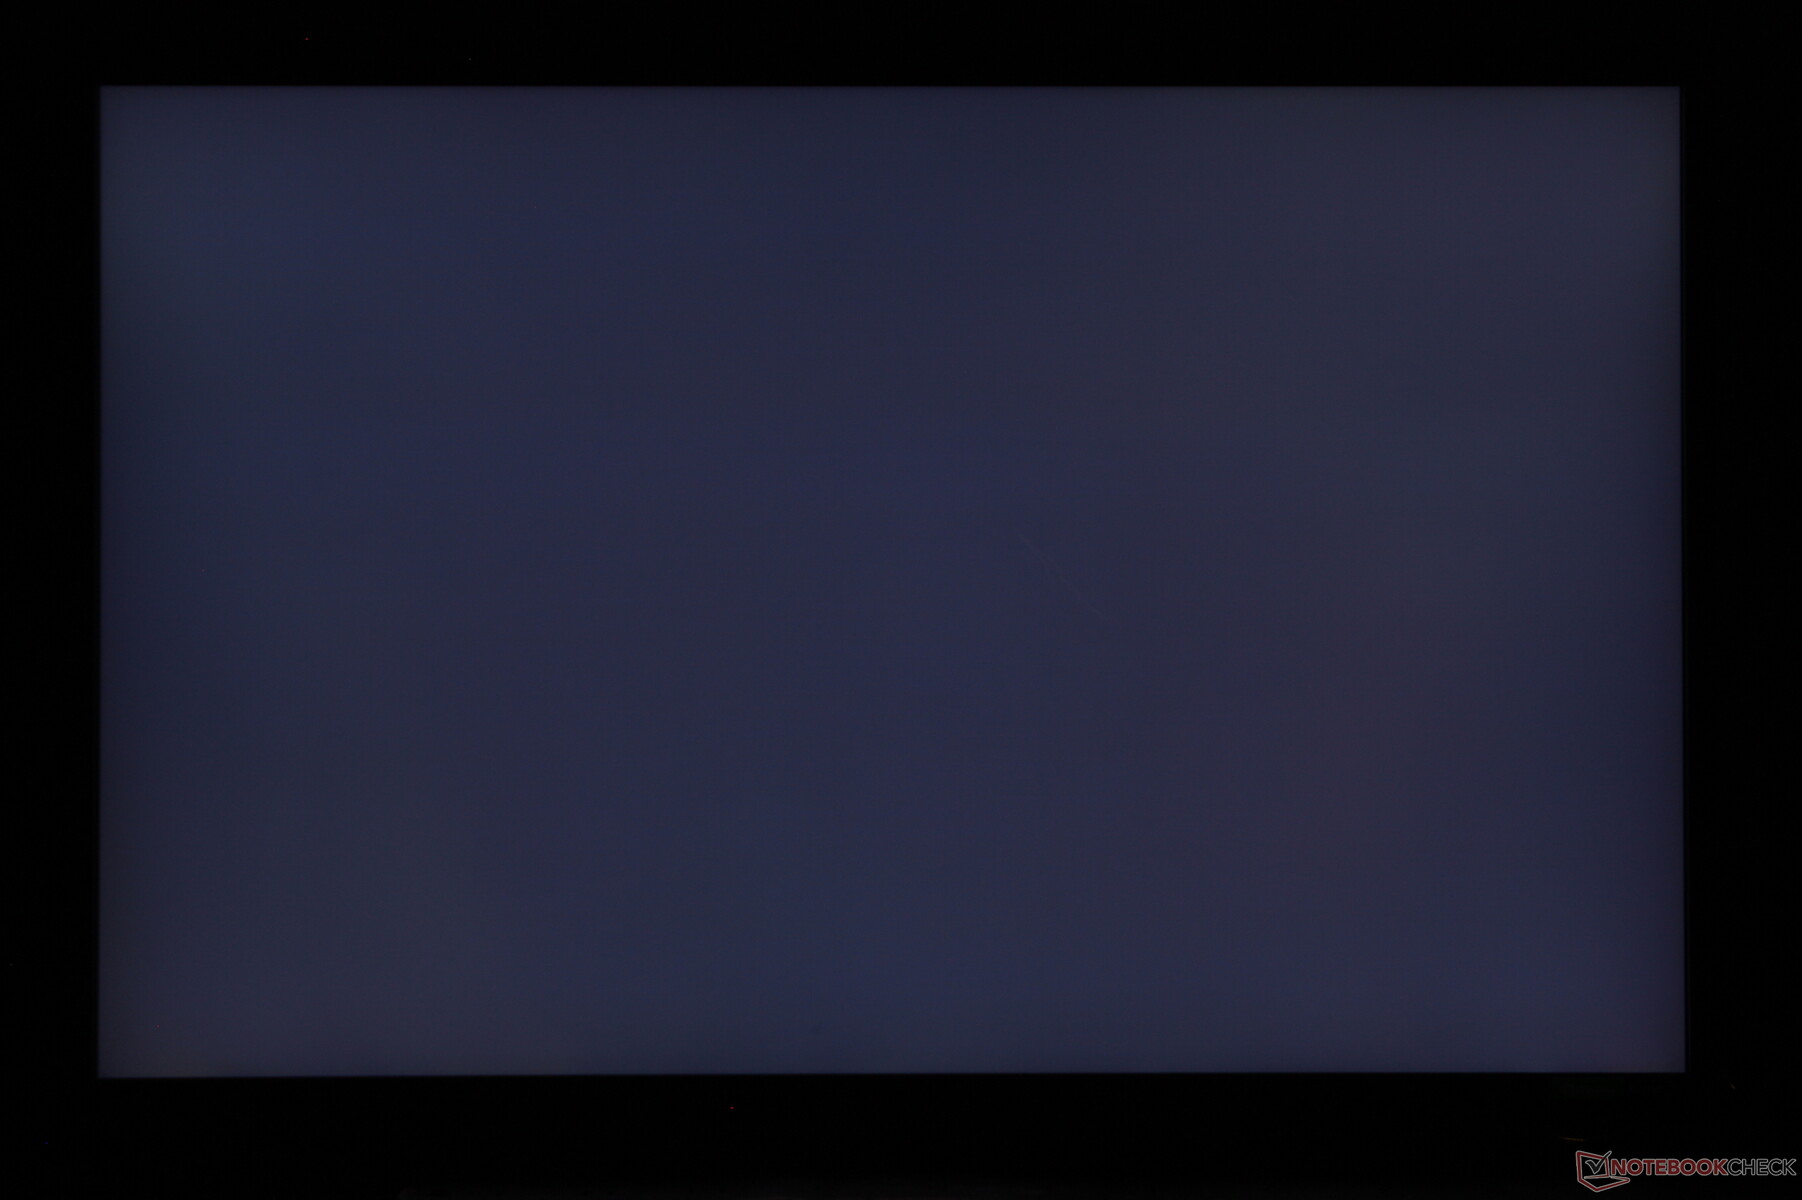
Brightness Distribution: 91 %
Center on Battery: 392.5 cd/m²
Contrast: 872:1 (Black: 0.45 cd/m²)
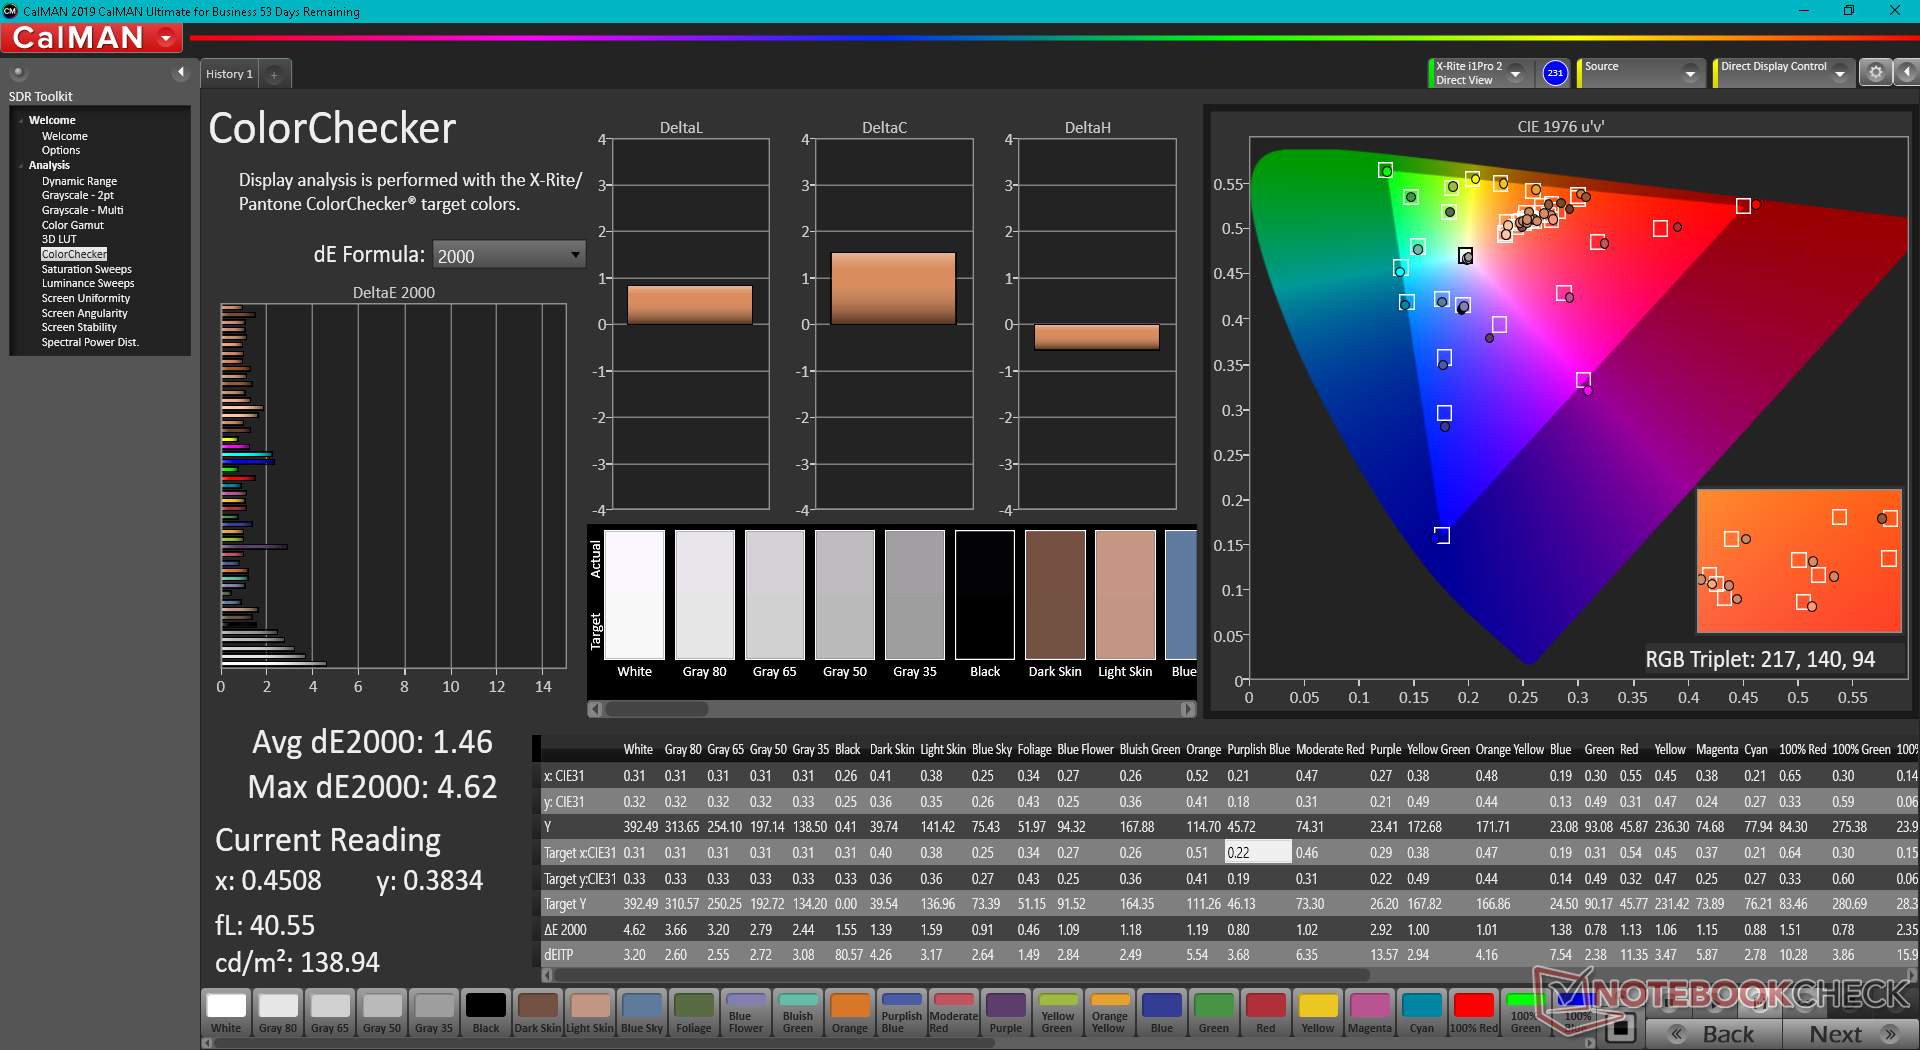
ΔE ColorChecker Calman: 1.46 | ∀{0.5-29.43 Ø4.83}
calibrated: 0.38
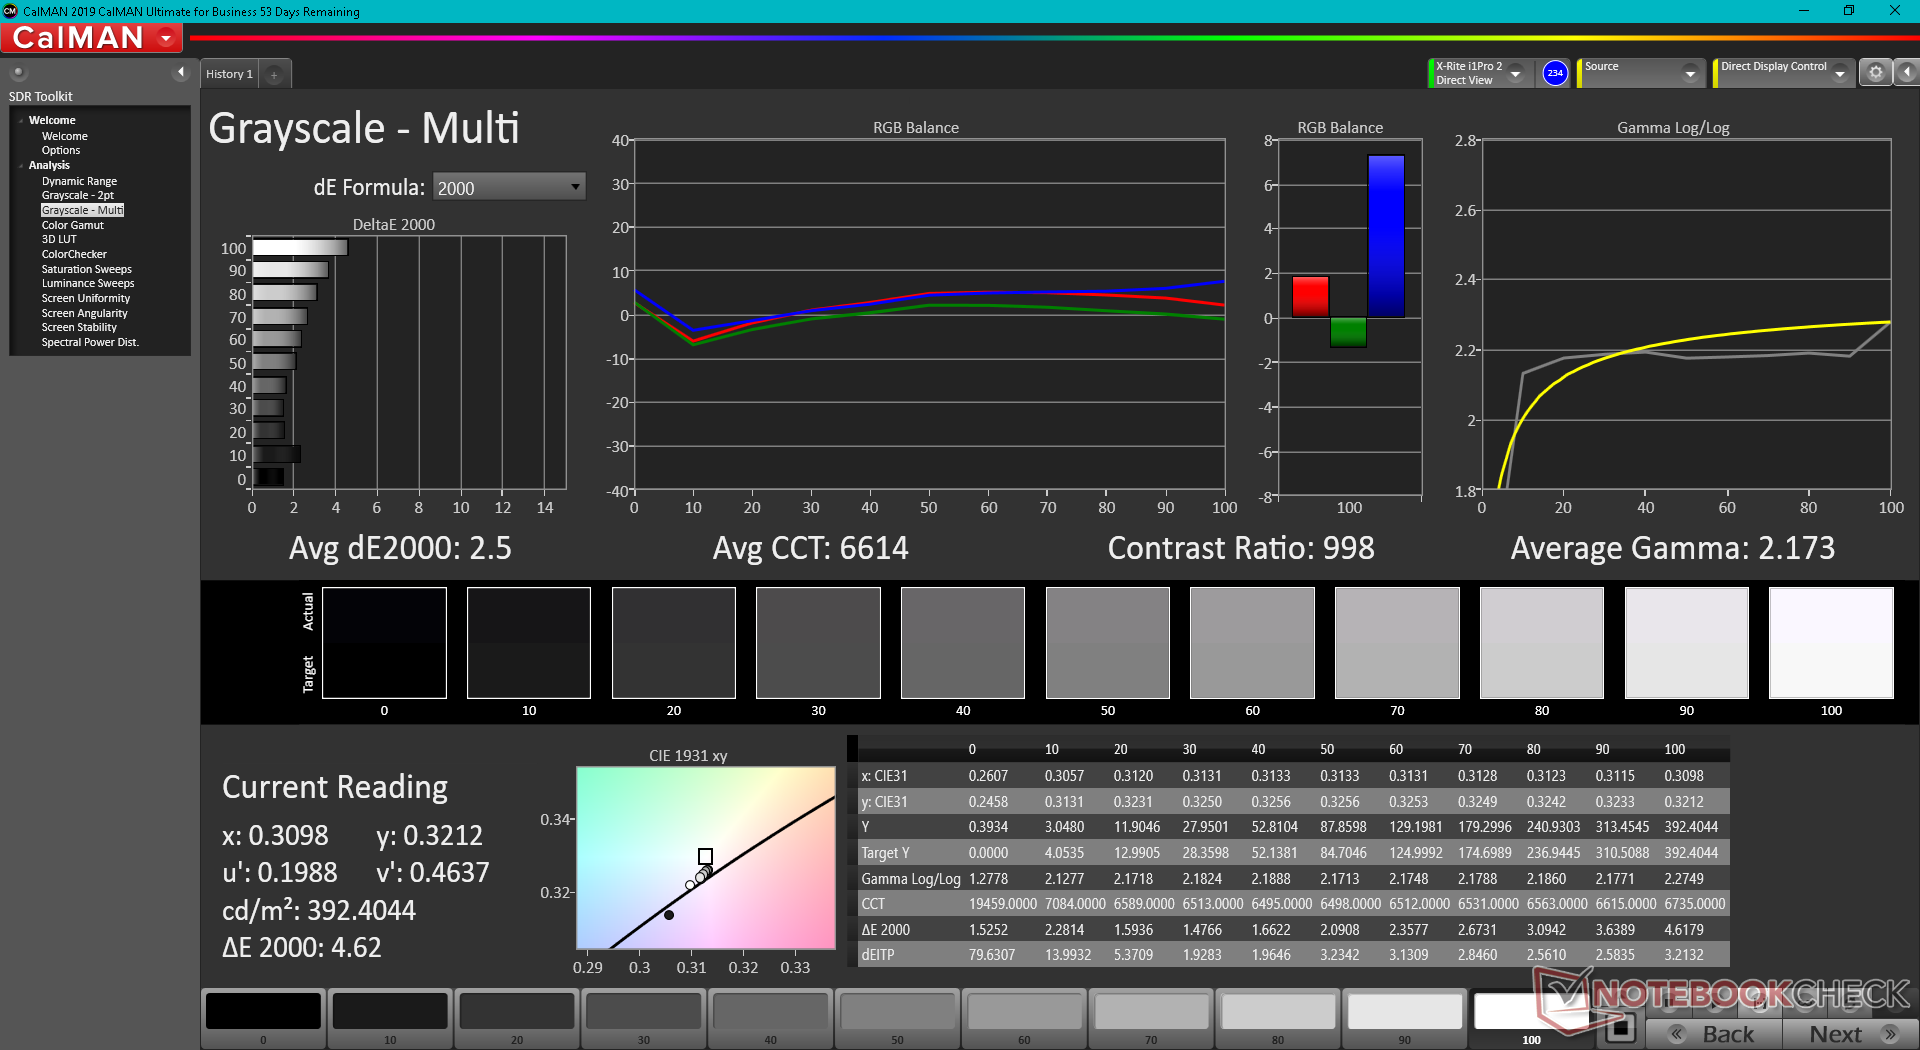
ΔE Greyscale Calman: 2.5 | ∀{0.09-98 Ø5.1}
69.8% AdobeRGB 1998 (Argyll 3D)
99.7% sRGB (Argyll 3D)
69.1% Display P3 (Argyll 3D)
Gamma: 2.17
CCT: 6614 K
| Uniwell Technology GM7AG8N Liquid Cooling Box BOE NE170QDM-NZ1, IPS, 2560x1600, 17" | MSI Titan GT77 12UHS Sharp SHP1544 LQ173M1JW08, IPS-Level, 1920x1080, 17.3" | Aorus 17X XES Sharp SHP1563, IPS, 1920x1080, 17.3" | Razer Blade 17 Early 2022 AU Optronics B173ZAN06.9, IPS, 3840x2160, 17.3" | MSI Stealth GS77 12UHS-083US BOE NE173QHM-NZ1, IPS, 2560x1440, 17.3" | Asus ROG Zephyrus S17 GX703HSD BOE099D (BOE CQ NE173QHM-NY3), IPS, 2560x1440, 17.3" | |
|---|---|---|---|---|---|---|
| Display | 2% | 1% | 23% | 21% | 19% | |
| Display P3 Coverage | 69.1 | 70.8 2% | 70.1 1% | 99.4 44% | 96.2 39% | 94.2 36% |
| sRGB Coverage | 99.7 | 98.9 -1% | 99.9 0% | 100 0% | 99.7 0% | 98.7 -1% |
| AdobeRGB 1998 Coverage | 69.8 | 73 5% | 71.9 3% | 87.3 25% | 85.8 23% | 84.4 21% |
| Response Times | 63% | 59% | 44% | -31% | 43% | |
| Response Time Grey 50% / Grey 80% * | 12.8 ? | 3.03 ? 76% | 3.4 ? 73% | 7.5 ? 41% | 17.6 ? -38% | 4.8 62% |
| Response Time Black / White * | 10.4 ? | 5.28 ? 49% | 5.8 ? 44% | 5.6 ? 46% | 12.8 ? -23% | 8 23% |
| PWM Frequency | ||||||
| Screen | -55% | -74% | 11% | -47% | -62% | |
| Brightness middle | 392.5 | 280 -29% | 278 -29% | 503 28% | 334.8 -15% | 322 -18% |
| Brightness | 392 | 275 -30% | 273 -30% | 486 24% | 305 -22% | 288 -27% |
| Brightness Distribution | 91 | 79 -13% | 79 -13% | 84 -8% | 79 -13% | 72 -21% |
| Black Level * | 0.45 | 0.4 11% | 0.26 42% | 0.44 2% | 0.34 24% | 0.3 33% |
| Contrast | 872 | 700 -20% | 1069 23% | 1143 31% | 985 13% | 1073 23% |
| Colorchecker dE 2000 * | 1.46 | 2.1 -44% | 3.96 -171% | 1.08 26% | 4.1 -181% | 3.05 -109% |
| Colorchecker dE 2000 max. * | 4.62 | 5.83 -26% | 10.78 -133% | 4.54 2% | 7.28 -58% | 5.23 -13% |
| Colorchecker dE 2000 calibrated * | 0.38 | 1.58 -316% | 1.07 -182% | 0.6 -58% | 1.92 -405% | |
| Greyscale dE 2000 * | 2.5 | 3.3 -32% | 6.8 -172% | 1.3 48% | 5.6 -124% | 3.11 -24% |
| Gamma | 2.17 101% | 2.13 103% | 2.224 99% | 2.151 102% | 2.16 102% | 2.13 103% |
| CCT | 6614 98% | 7060 92% | 7651 85% | 6541 99% | 6314 103% | 6553 99% |
| Color Space (Percent of AdobeRGB 1998) | 84 | |||||
| Color Space (Percent of sRGB) | 99 | |||||
| Total Average (Program / Settings) | 3% /
-26% | -5% /
-39% | 26% /
18% | -19% /
-29% | 0% /
-30% |
* ... smaller is better
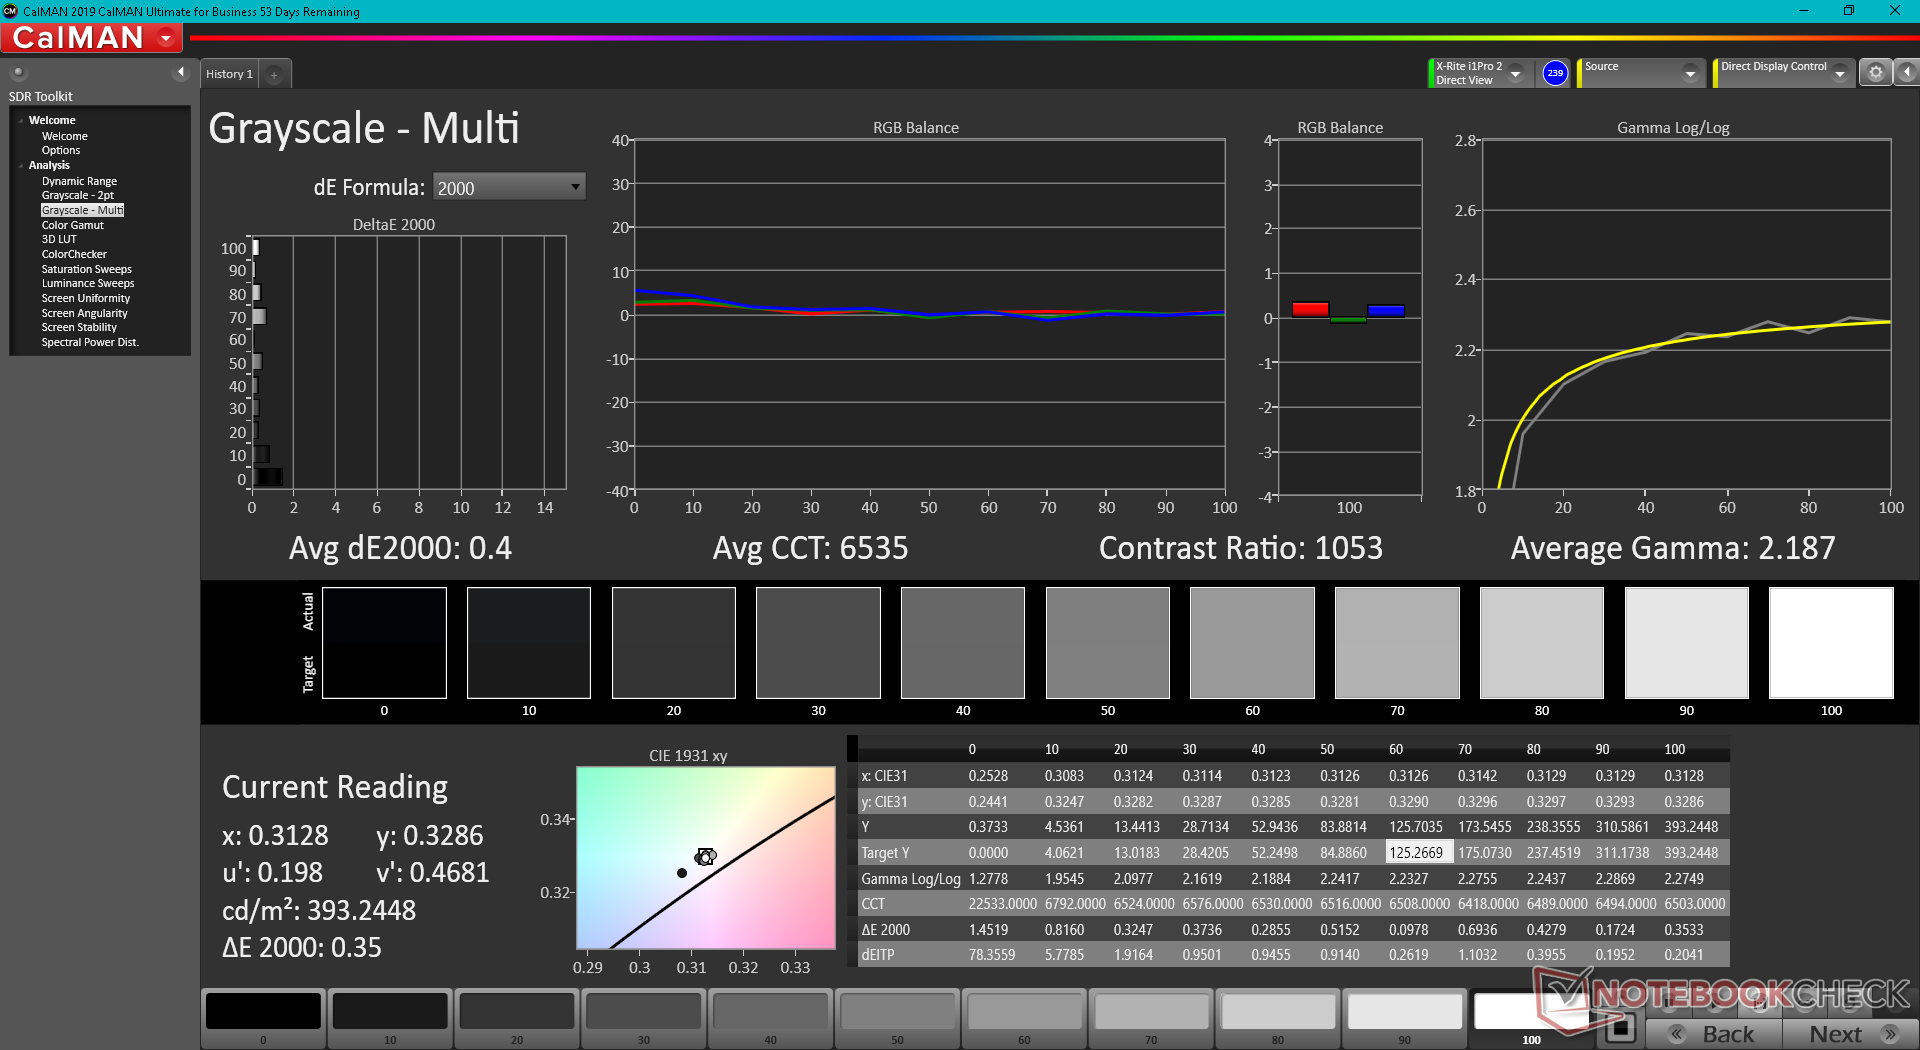
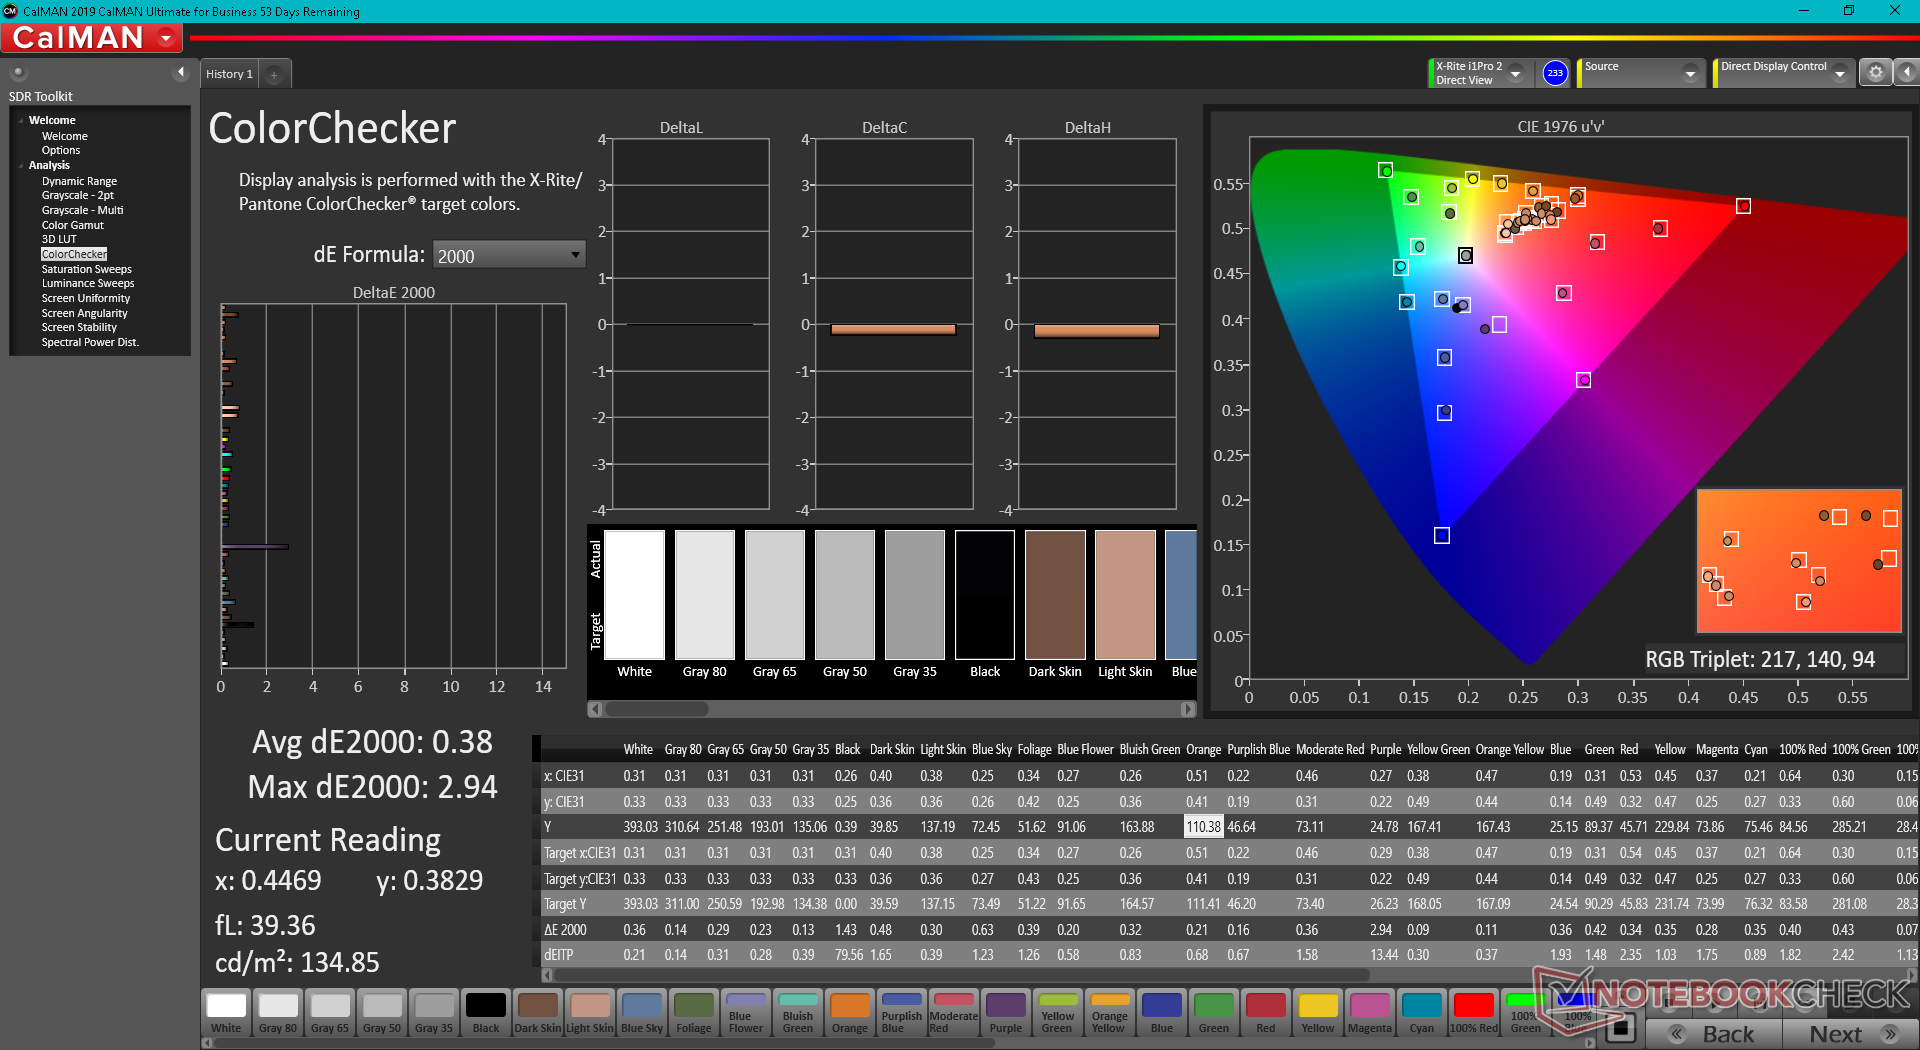
The display is already well-calibrated out of the box as shown by our CalMAN results below. Attempting to calibrate it even further with our X-Rite colorimeter would improve average grayscale and color DeltaE values just marginally to 0.4 and 0.38, respectively.


Display Response Times
| ↔ Response Time Black to White | ||
|---|---|---|
| 10.4 ms ... rise ↗ and fall ↘ combined | ↗ 6 ms rise | 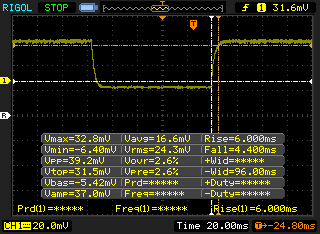 |
| ↘ 4.4 ms fall | ||
| The screen shows good response rates in our tests, but may be too slow for competitive gamers. In comparison, all tested devices range from 0.1 (minimum) to 240 (maximum) ms. » 26 % of all devices are better. This means that the measured response time is better than the average of all tested devices (20.5 ms). | ||
| ↔ Response Time 50% Grey to 80% Grey | ||
| 12.8 ms ... rise ↗ and fall ↘ combined | ↗ 6 ms rise |  |
| ↘ 6.8 ms fall | ||
| The screen shows good response rates in our tests, but may be too slow for competitive gamers. In comparison, all tested devices range from 0.165 (minimum) to 636 (maximum) ms. » 24 % of all devices are better. This means that the measured response time is better than the average of all tested devices (32.1 ms). | ||
Screen Flickering / PWM (Pulse-Width Modulation)
| Screen flickering / PWM not detected | 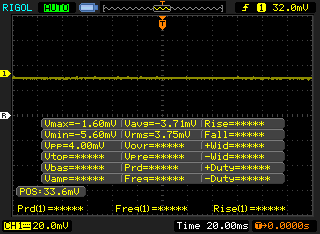 | ||
In comparison: 53 % of all tested devices do not use PWM to dim the display. If PWM was detected, an average of 8327 (minimum: 5 - maximum: 343500) Hz was measured. | |||
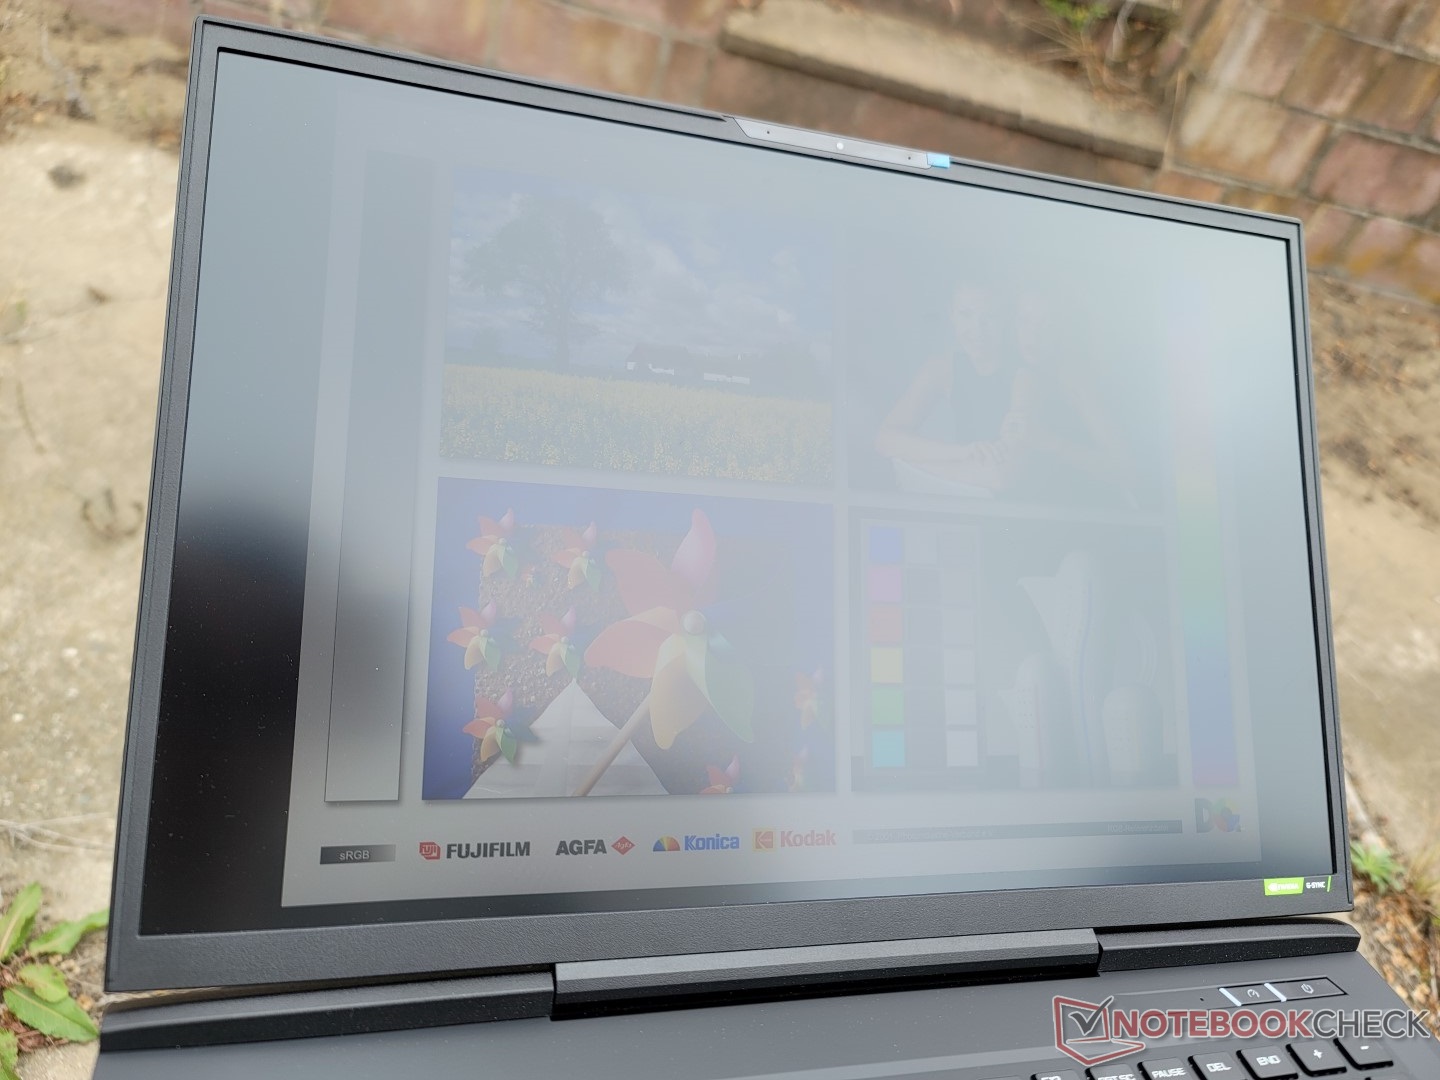
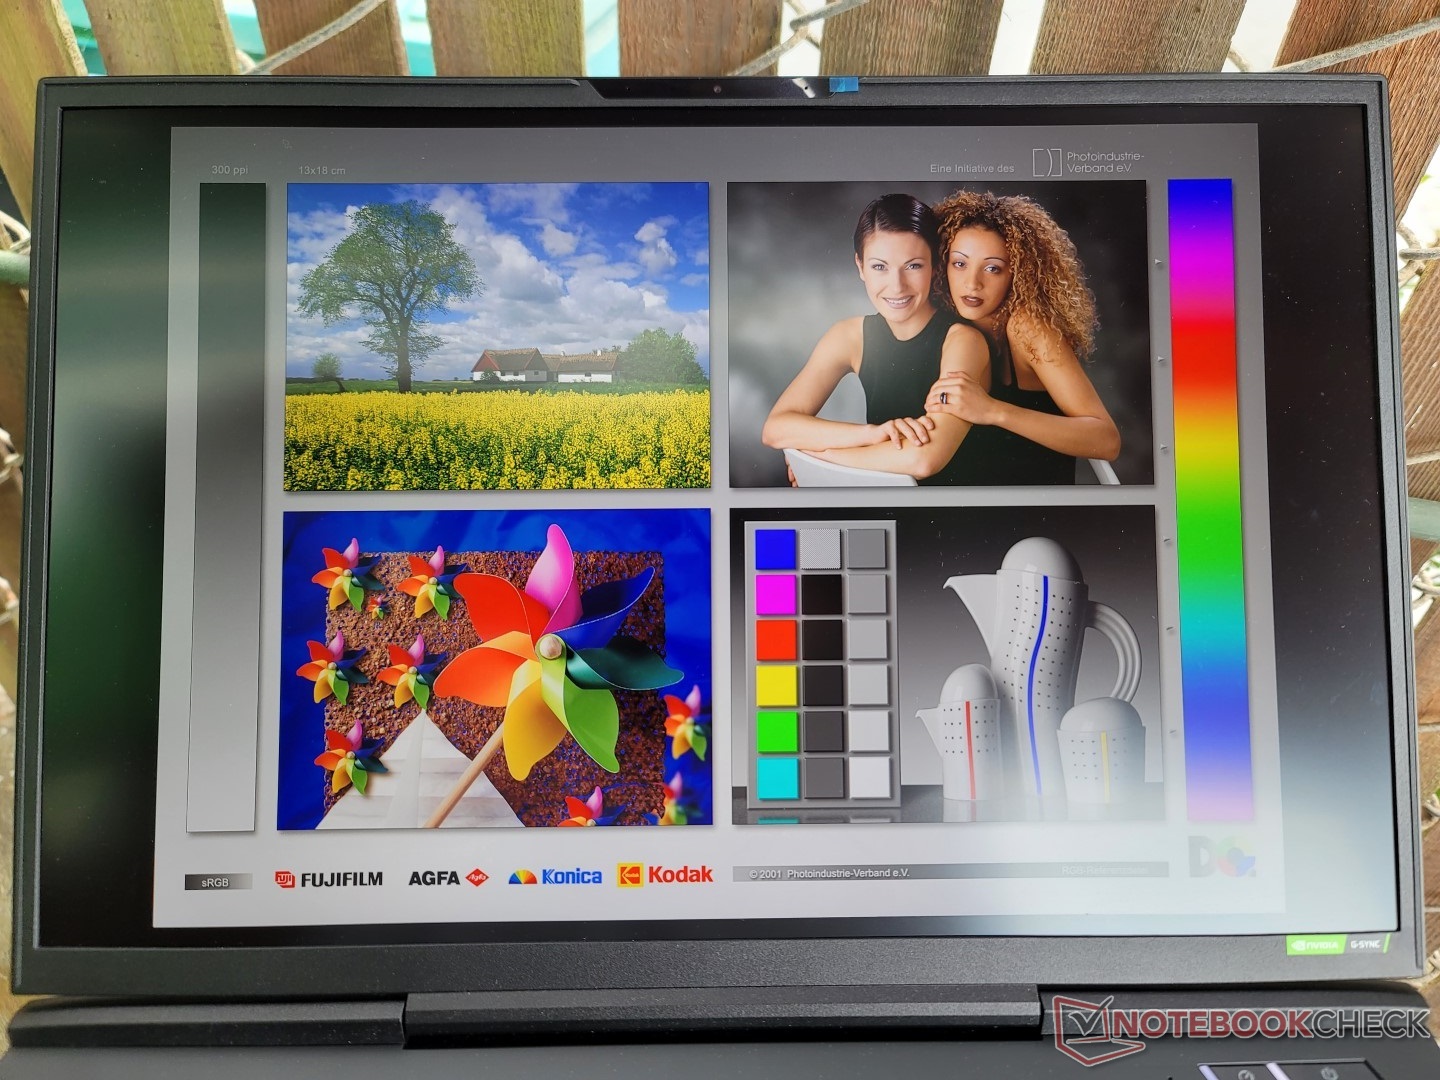
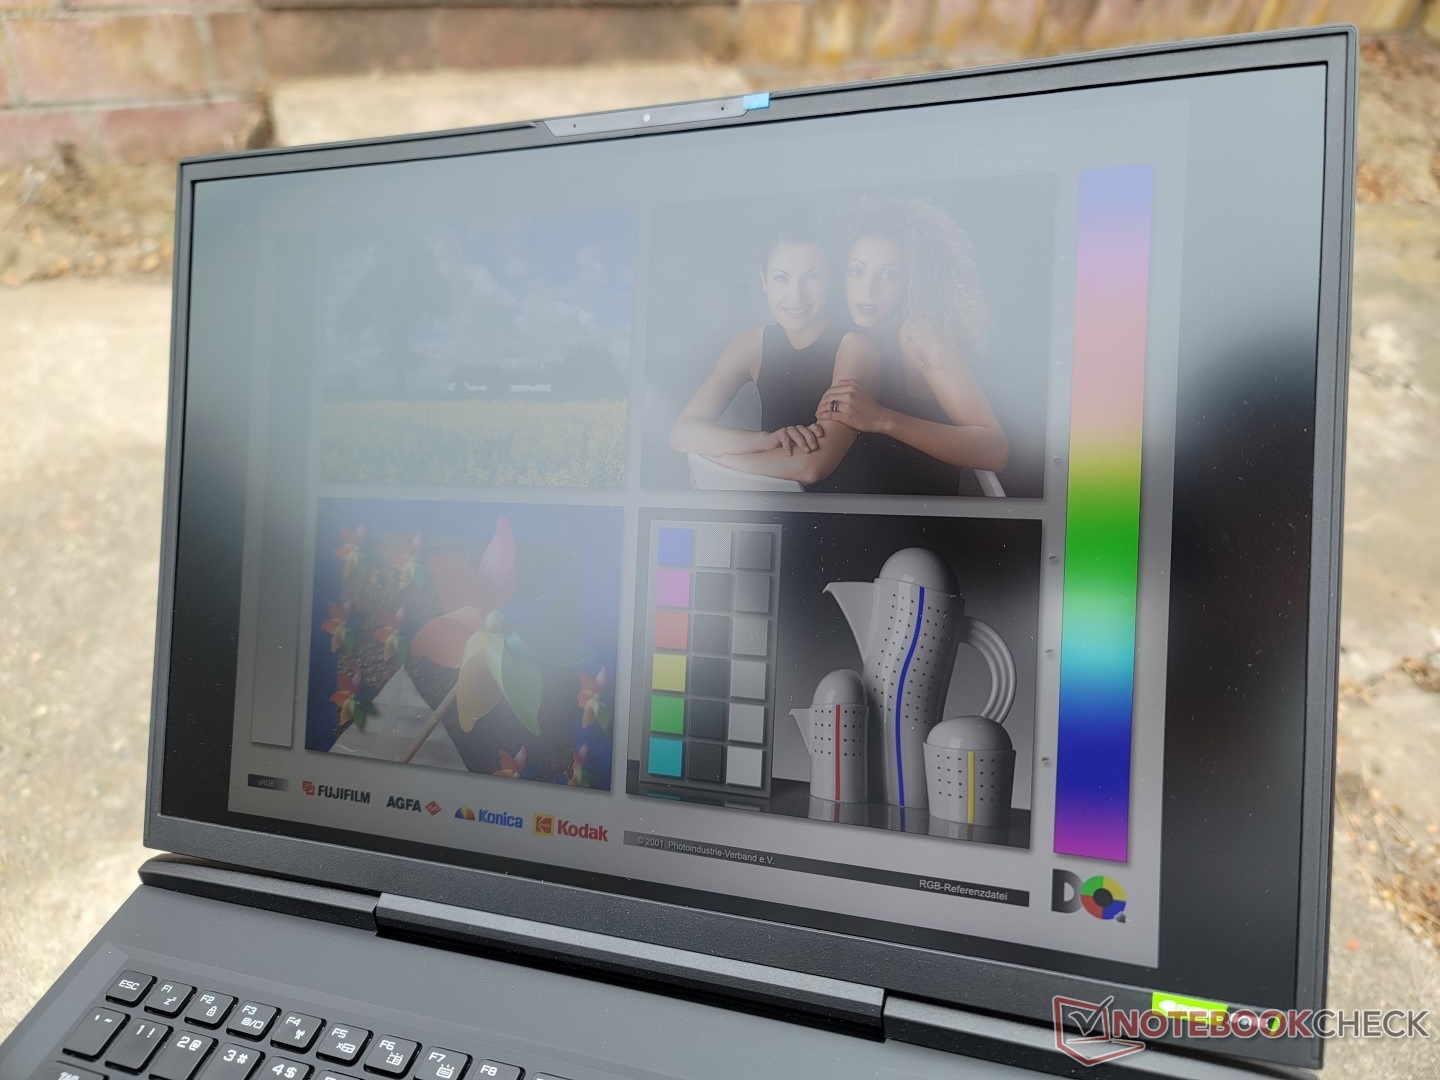
Outdoor visibility is decent if under shade. The 400-nit backlight is brighter than on most other gaming laptops like the Aorus 17X or Asus Zephyrus S17 where 300 nits is common.
Performance — Unthrottled
Testing Conditions
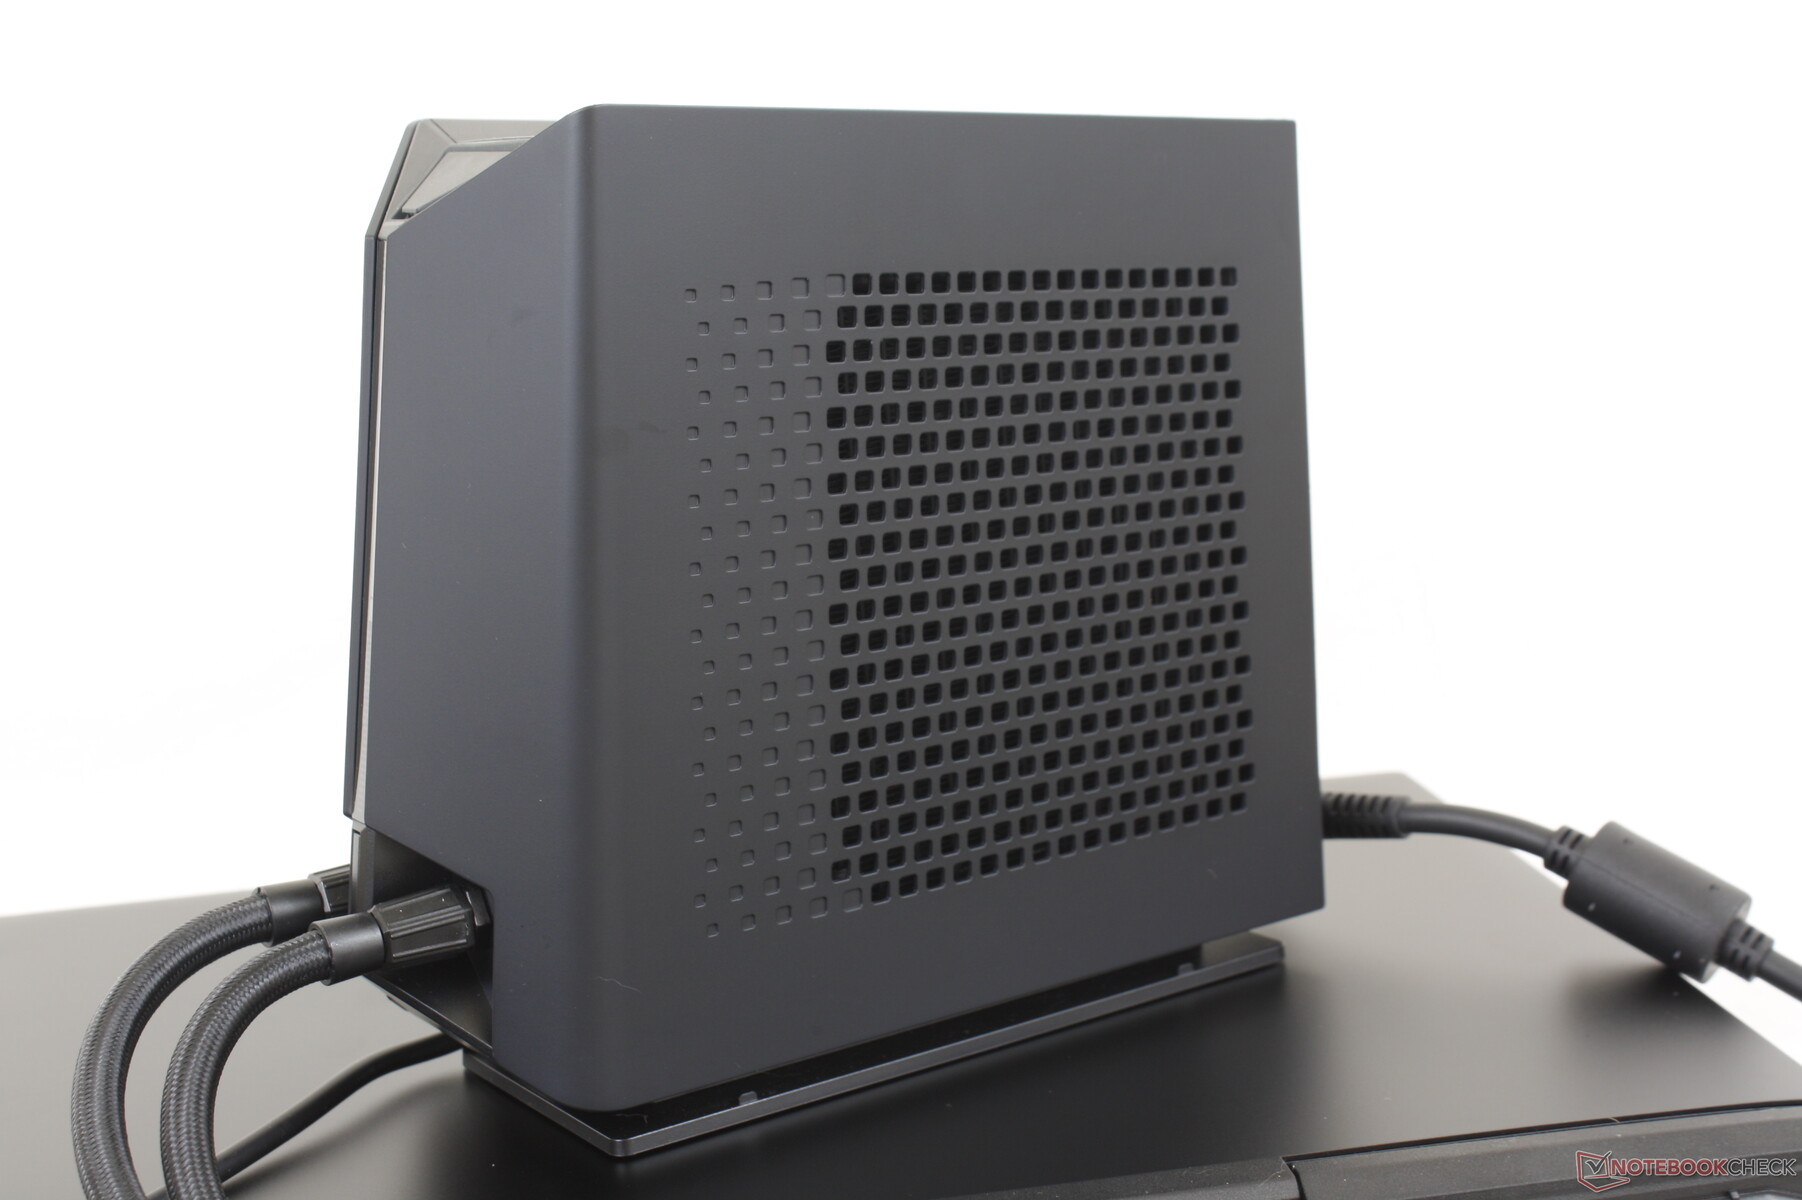
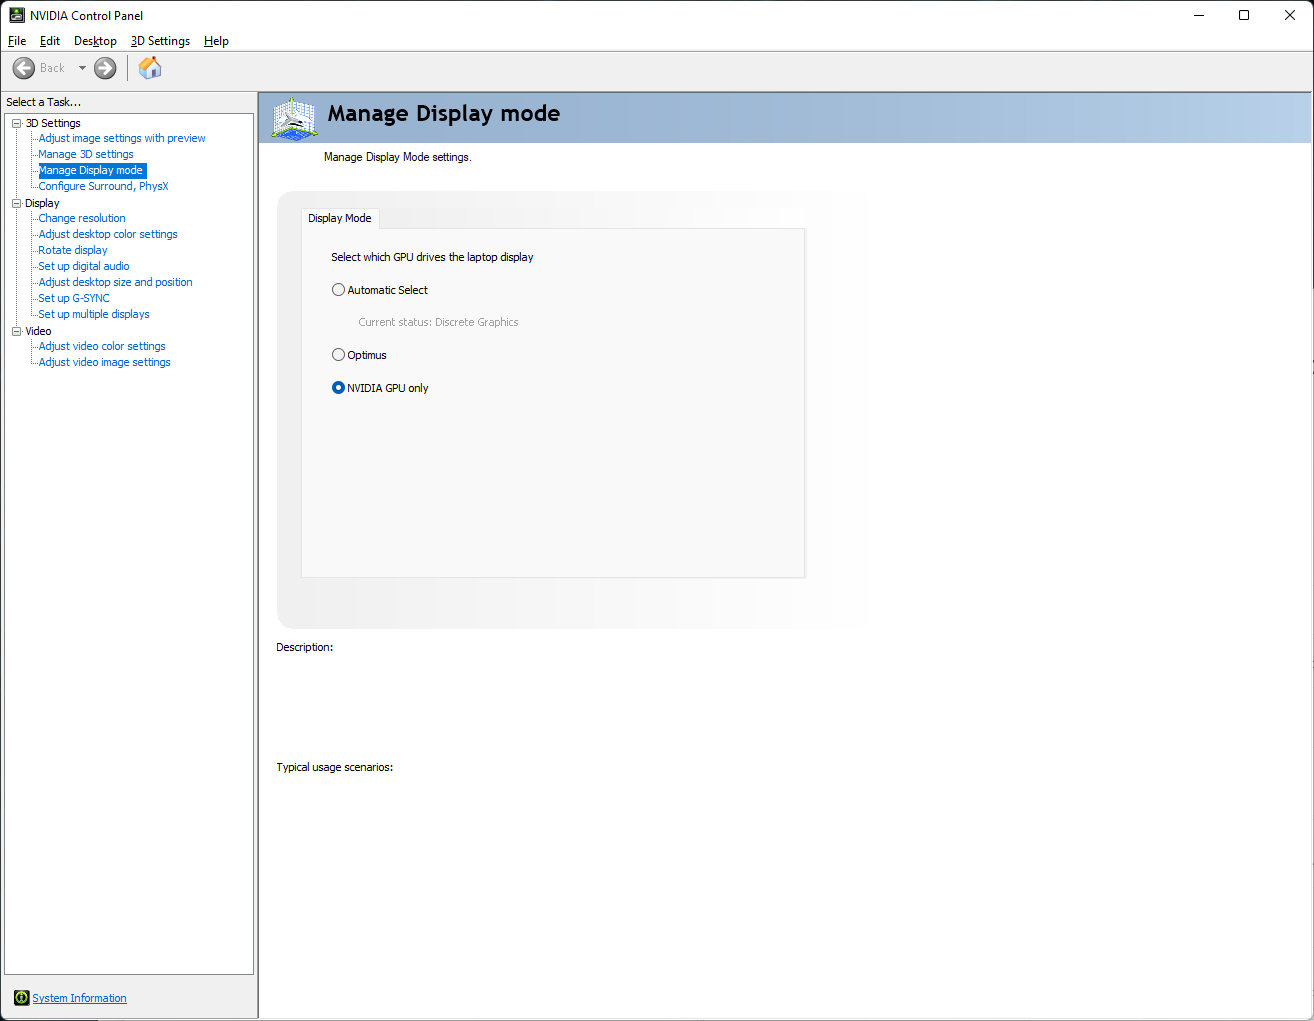
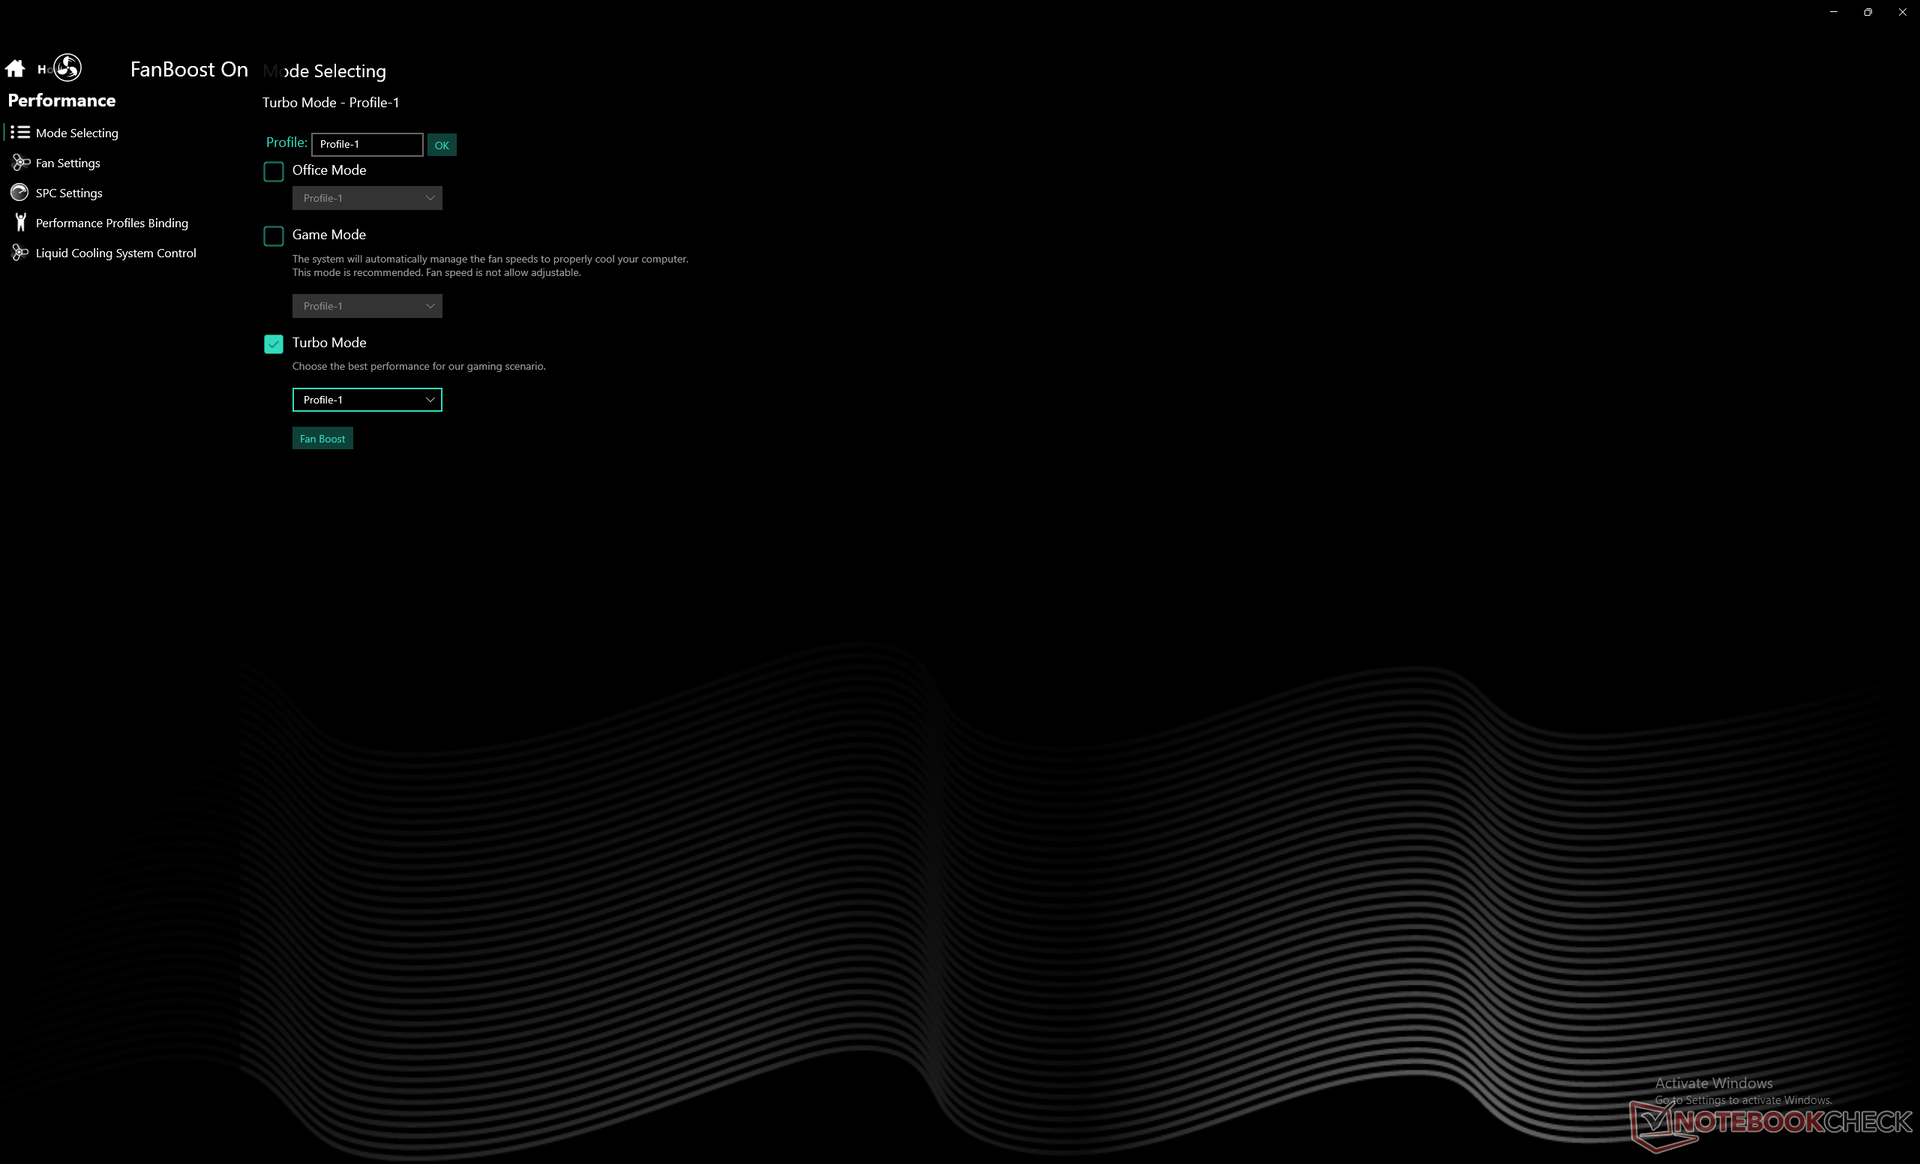
Unless stated otherwise, all tests and benchmarks below were performed with the external cooling box connected and active. We also made sure to set Windows to Performance, disable Optimus in favor of MUX, and set the Control Center software to "Fan Boost".
The cooling box has three noise level settings: Quieter, Quiet, and Balanced. The naming isn't fooling anyone, however, as these three settings can be translated to Low, Medium, and Loudest. We set our cooling box unit to "Balanced" for the purposes of testing. Keep in mind that the cooling box will not run on battery power.
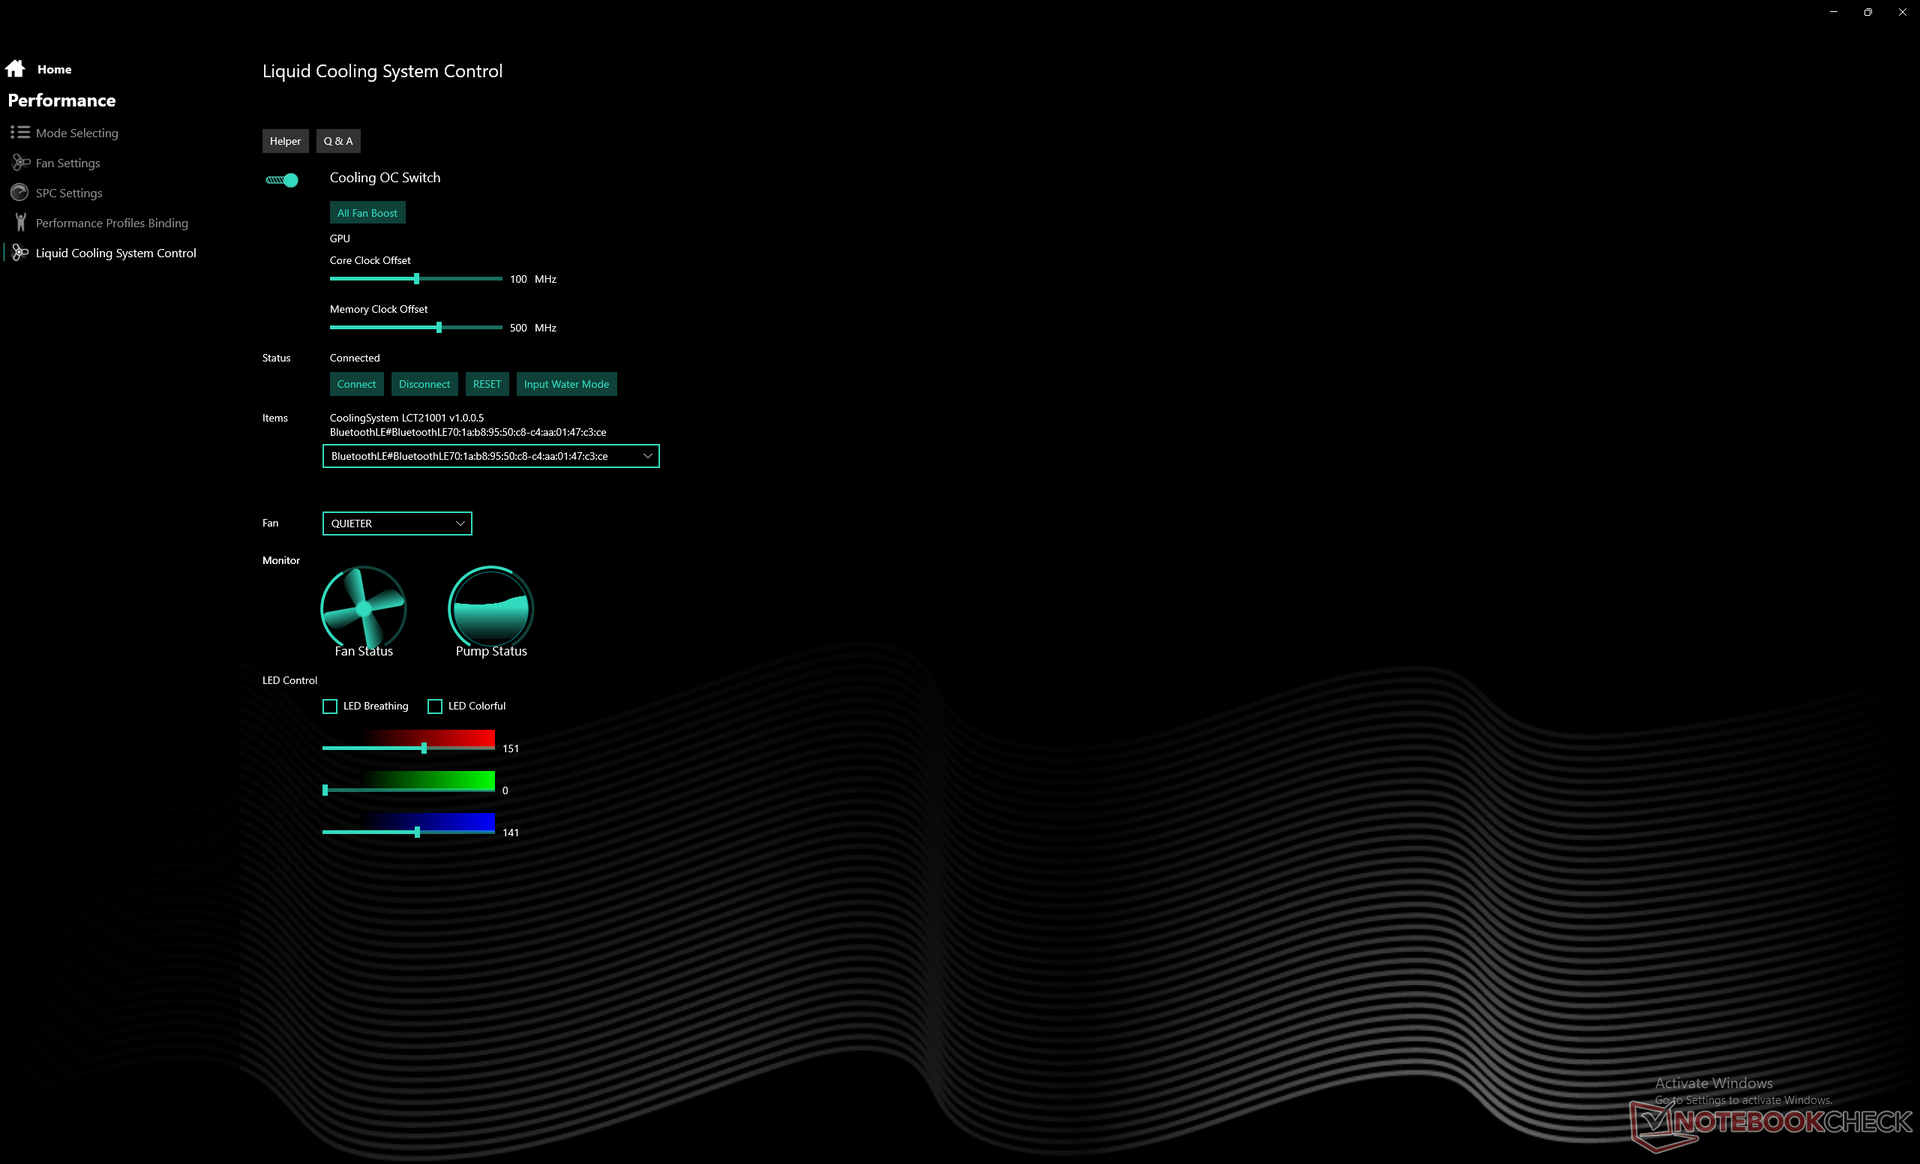
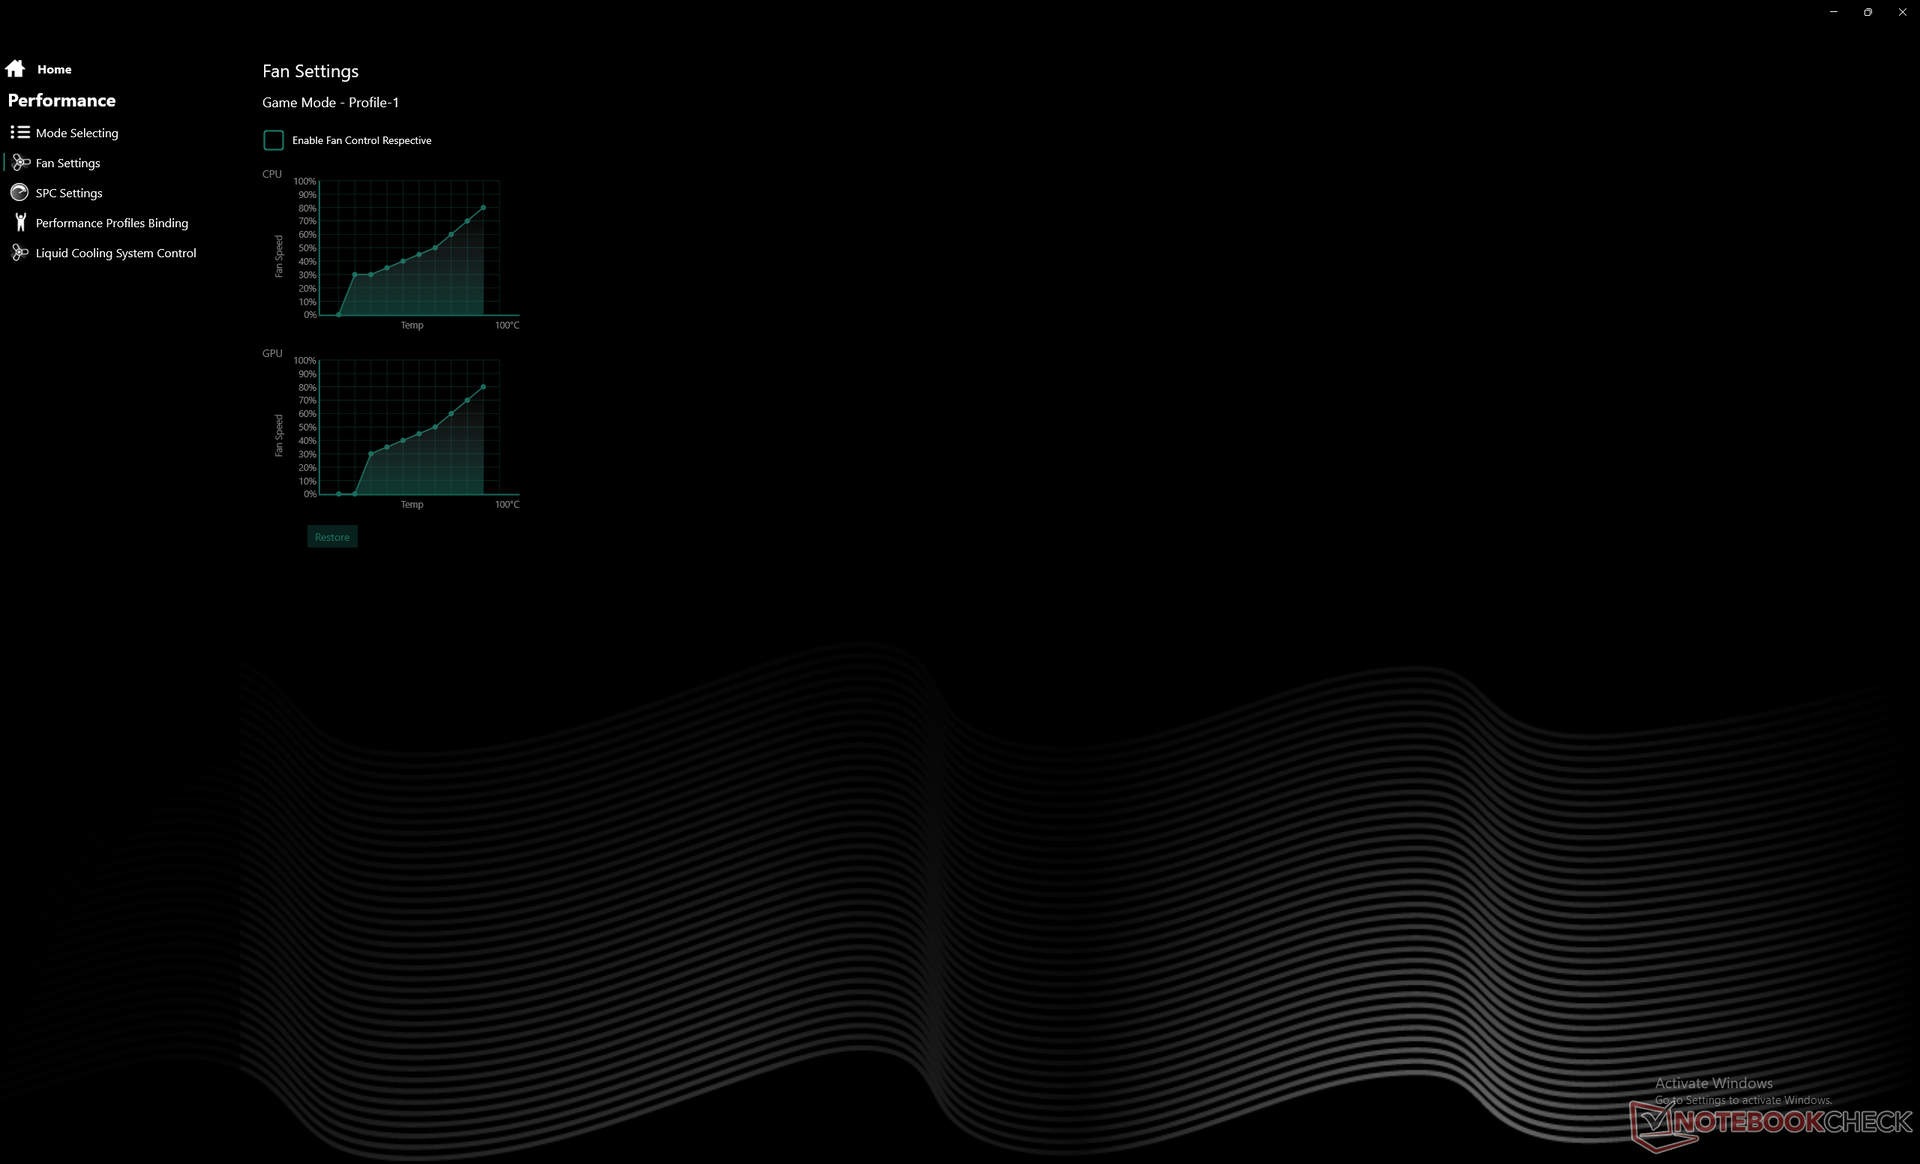
It's highly recommended that owners become familiar with the preinstalled Control Center software as it is the control hub for the laptop. Everything from performance to lighting, fan controls, and overclocking is controlled here as shown by some screenshots below. Our overclock settings are the default settings of the laptop as shipped.

Processor
CPU performance is better than expected with results that are 15 to 25 percent faster than the average laptop in our database with the same Core i9-12900H. In fact, this Uniwill model is the fastest Core i9-12900H laptop we've tested thus far.
Performance sustainability is also excellent as one would expect from any decent gaming laptop especially from one that is water-cooled.
Cinebench R15 Multi Loop
Cinebench R20: CPU (Multi Core) | CPU (Single Core)
Cinebench R23: Multi Core | Single Core
Cinebench R15: CPU Multi 64Bit | CPU Single 64Bit
Blender: v2.79 BMW27 CPU
7-Zip 18.03: 7z b 4 | 7z b 4 -mmt1
Geekbench 5.5: Multi-Core | Single-Core
HWBOT x265 Benchmark v2.2: 4k Preset
LibreOffice : 20 Documents To PDF
R Benchmark 2.5: Overall mean
* ... smaller is better
AIDA64: FP32 Ray-Trace | FPU Julia | CPU SHA3 | CPU Queen | FPU SinJulia | FPU Mandel | CPU AES | CPU ZLib | FP64 Ray-Trace | CPU PhotoWorxx
| Performance Rating | |
| MSI Titan GT77 12UHS | |
| Uniwell Technology GM7AG8N Liquid Cooling Box | |
| Aorus 17X XES | |
| Average Intel Core i9-12900H | |
| MSI Stealth GS77 12UHS-083US | |
| Razer Blade 17 Early 2022 | |
| Asus ROG Zephyrus S17 GX703HSD -9! | |
| AIDA64 / FP32 Ray-Trace | |
| MSI Titan GT77 12UHS | |
| Uniwell Technology GM7AG8N Liquid Cooling Box | |
| Aorus 17X XES | |
| Average Intel Core i9-12900H (4074 - 18289, n=28) | |
| MSI Stealth GS77 12UHS-083US | |
| Razer Blade 17 Early 2022 | |
| AIDA64 / FPU Julia | |
| MSI Titan GT77 12UHS | |
| Uniwell Technology GM7AG8N Liquid Cooling Box | |
| Aorus 17X XES | |
| Average Intel Core i9-12900H (22307 - 93236, n=28) | |
| MSI Stealth GS77 12UHS-083US | |
| Razer Blade 17 Early 2022 | |
| AIDA64 / CPU SHA3 | |
| MSI Titan GT77 12UHS | |
| Uniwell Technology GM7AG8N Liquid Cooling Box | |
| Aorus 17X XES | |
| MSI Stealth GS77 12UHS-083US | |
| Average Intel Core i9-12900H (1378 - 4215, n=28) | |
| Razer Blade 17 Early 2022 | |
| AIDA64 / CPU Queen | |
| Uniwell Technology GM7AG8N Liquid Cooling Box | |
| Aorus 17X XES | |
| MSI Titan GT77 12UHS | |
| Average Intel Core i9-12900H (78172 - 111241, n=28) | |
| MSI Stealth GS77 12UHS-083US | |
| Razer Blade 17 Early 2022 | |
| AIDA64 / FPU SinJulia | |
| MSI Titan GT77 12UHS | |
| Aorus 17X XES | |
| Uniwell Technology GM7AG8N Liquid Cooling Box | |
| MSI Stealth GS77 12UHS-083US | |
| Average Intel Core i9-12900H (5709 - 10410, n=28) | |
| Razer Blade 17 Early 2022 | |
| AIDA64 / FPU Mandel | |
| MSI Titan GT77 12UHS | |
| Uniwell Technology GM7AG8N Liquid Cooling Box | |
| Aorus 17X XES | |
| Average Intel Core i9-12900H (11257 - 45581, n=28) | |
| MSI Stealth GS77 12UHS-083US | |
| Razer Blade 17 Early 2022 | |
| AIDA64 / CPU AES | |
| MSI Titan GT77 12UHS | |
| Aorus 17X XES | |
| MSI Stealth GS77 12UHS-083US | |
| Average Intel Core i9-12900H (31935 - 151546, n=28) | |
| Uniwell Technology GM7AG8N Liquid Cooling Box | |
| Razer Blade 17 Early 2022 | |
| AIDA64 / CPU ZLib | |
| MSI Titan GT77 12UHS | |
| Uniwell Technology GM7AG8N Liquid Cooling Box | |
| MSI Stealth GS77 12UHS-083US | |
| Aorus 17X XES | |
| Average Intel Core i9-12900H (449 - 1193, n=28) | |
| Razer Blade 17 Early 2022 | |
| Asus ROG Zephyrus S17 GX703HSD | |
| AIDA64 / FP64 Ray-Trace | |
| MSI Titan GT77 12UHS | |
| Uniwell Technology GM7AG8N Liquid Cooling Box | |
| Aorus 17X XES | |
| Average Intel Core i9-12900H (2235 - 10511, n=28) | |
| MSI Stealth GS77 12UHS-083US | |
| Razer Blade 17 Early 2022 | |
| AIDA64 / CPU PhotoWorxx | |
| MSI Titan GT77 12UHS | |
| Aorus 17X XES | |
| MSI Stealth GS77 12UHS-083US | |
| Razer Blade 17 Early 2022 | |
| Average Intel Core i9-12900H (20960 - 48269, n=29) | |
| Uniwell Technology GM7AG8N Liquid Cooling Box | |
System Performance
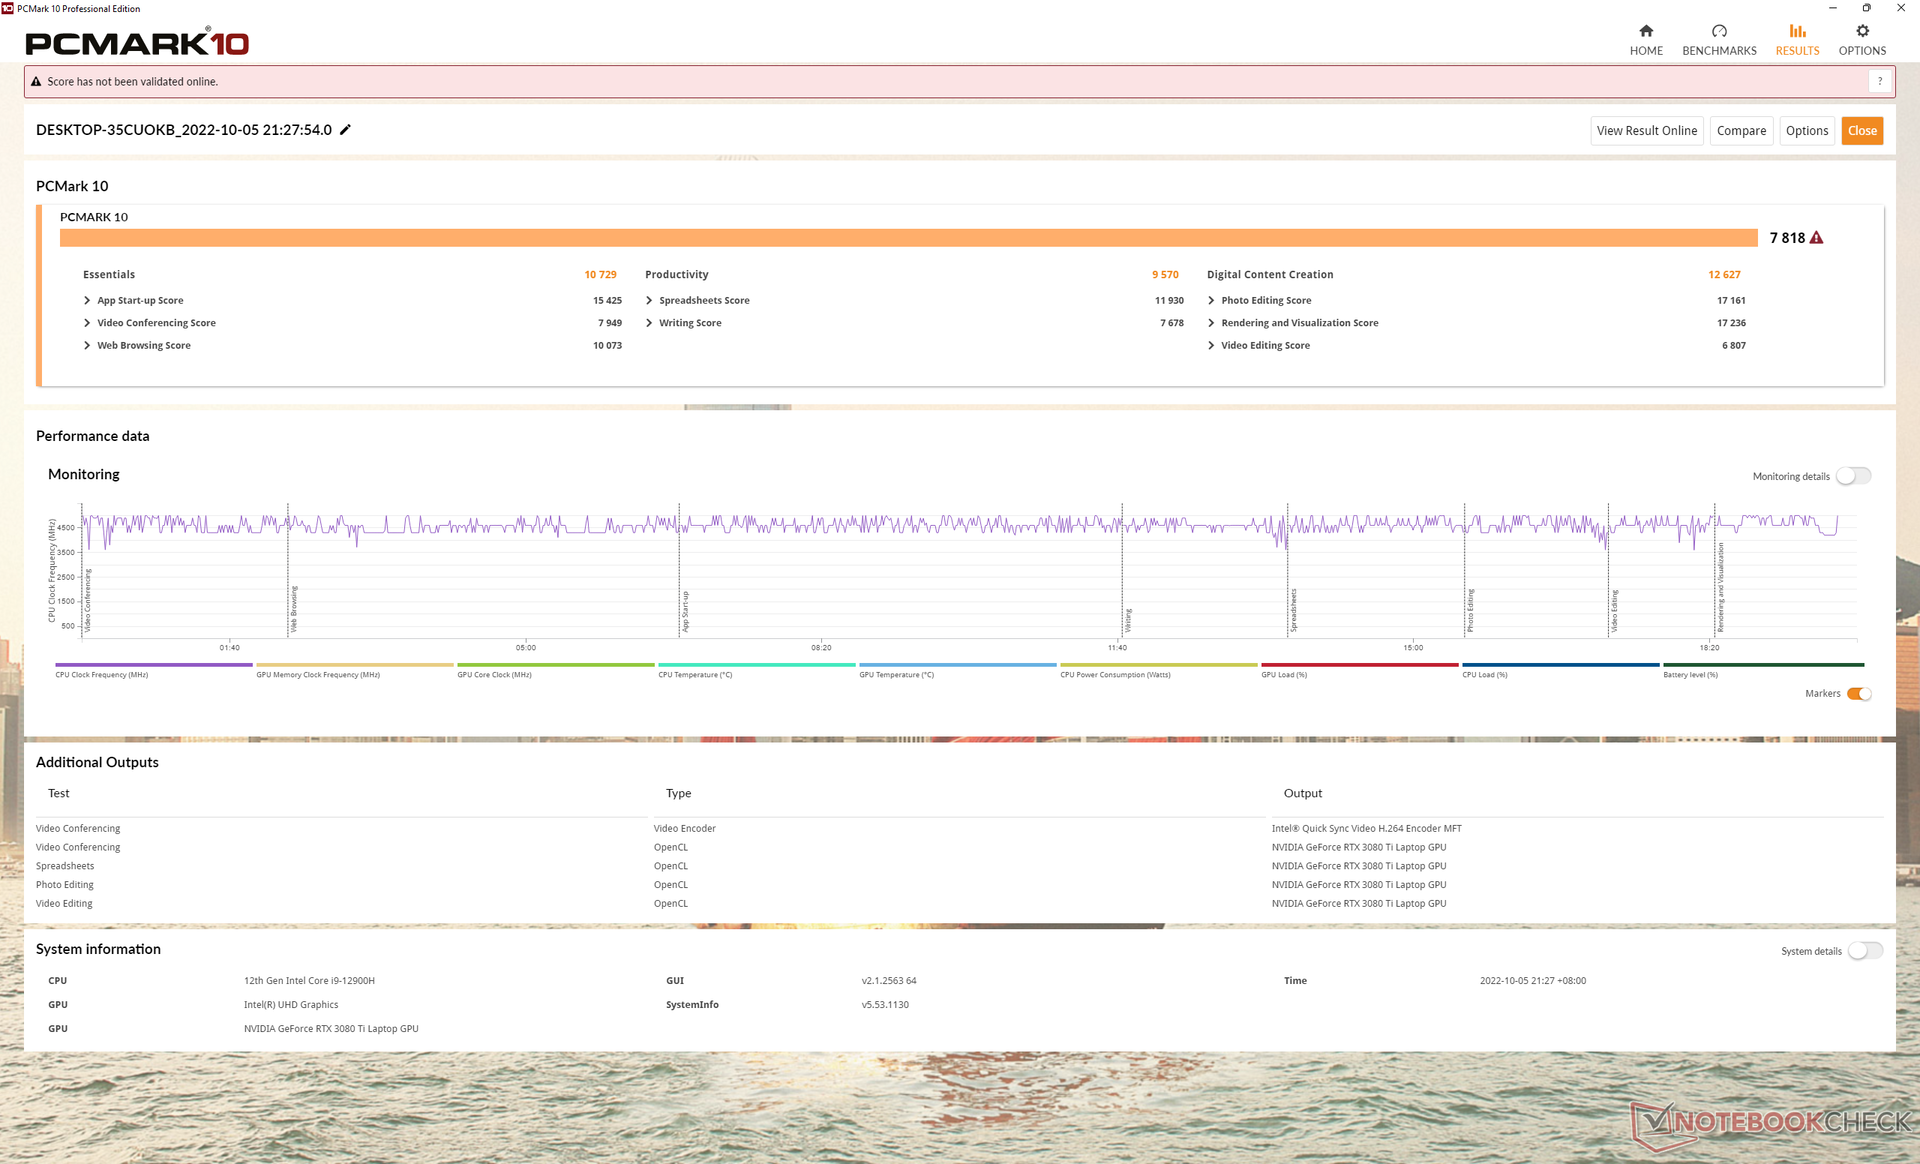
PCMark 10 results are comparable to other laptops with the same CPU and GPU like the Alienware x15 R2 P111F or Razer Blade 17 Early 2022.
CrossMark: Overall | Productivity | Creativity | Responsiveness
| PCMark 10 / Score | |
| MSI Titan GT77 12UHS | |
| Aorus 17X XES | |
| Uniwell Technology GM7AG8N Liquid Cooling Box | |
| Average Intel Core i9-12900H, NVIDIA GeForce RTX 3080 Ti Laptop GPU (7139 - 8083, n=6) | |
| MSI Stealth GS77 12UHS-083US | |
| Asus ROG Zephyrus S17 GX703HSD | |
| Razer Blade 17 Early 2022 | |
| PCMark 10 / Essentials | |
| MSI Titan GT77 12UHS | |
| Average Intel Core i9-12900H, NVIDIA GeForce RTX 3080 Ti Laptop GPU (10254 - 11178, n=6) | |
| Uniwell Technology GM7AG8N Liquid Cooling Box | |
| Asus ROG Zephyrus S17 GX703HSD | |
| Aorus 17X XES | |
| MSI Stealth GS77 12UHS-083US | |
| Razer Blade 17 Early 2022 | |
| PCMark 10 / Productivity | |
| Aorus 17X XES | |
| MSI Titan GT77 12UHS | |
| Average Intel Core i9-12900H, NVIDIA GeForce RTX 3080 Ti Laptop GPU (9102 - 11186, n=6) | |
| Uniwell Technology GM7AG8N Liquid Cooling Box | |
| MSI Stealth GS77 12UHS-083US | |
| Asus ROG Zephyrus S17 GX703HSD | |
| Razer Blade 17 Early 2022 | |
| PCMark 10 / Digital Content Creation | |
| MSI Titan GT77 12UHS | |
| Uniwell Technology GM7AG8N Liquid Cooling Box | |
| Aorus 17X XES | |
| Average Intel Core i9-12900H, NVIDIA GeForce RTX 3080 Ti Laptop GPU (9847 - 12627, n=6) | |
| MSI Stealth GS77 12UHS-083US | |
| Razer Blade 17 Early 2022 | |
| Asus ROG Zephyrus S17 GX703HSD | |
| CrossMark / Overall | |
| Aorus 17X XES | |
| MSI Titan GT77 12UHS | |
| Average Intel Core i9-12900H, NVIDIA GeForce RTX 3080 Ti Laptop GPU (1696 - 1965, n=3) | |
| Razer Blade 17 Early 2022 | |
| Uniwell Technology GM7AG8N Liquid Cooling Box | |
| CrossMark / Productivity | |
| Aorus 17X XES | |
| MSI Titan GT77 12UHS | |
| Average Intel Core i9-12900H, NVIDIA GeForce RTX 3080 Ti Laptop GPU (1622 - 1870, n=3) | |
| Razer Blade 17 Early 2022 | |
| Uniwell Technology GM7AG8N Liquid Cooling Box | |
| CrossMark / Creativity | |
| Aorus 17X XES | |
| MSI Titan GT77 12UHS | |
| Average Intel Core i9-12900H, NVIDIA GeForce RTX 3080 Ti Laptop GPU (1855 - 2135, n=3) | |
| Razer Blade 17 Early 2022 | |
| Uniwell Technology GM7AG8N Liquid Cooling Box | |
| CrossMark / Responsiveness | |
| Aorus 17X XES | |
| MSI Titan GT77 12UHS | |
| Razer Blade 17 Early 2022 | |
| Average Intel Core i9-12900H, NVIDIA GeForce RTX 3080 Ti Laptop GPU (1483 - 1777, n=3) | |
| Uniwell Technology GM7AG8N Liquid Cooling Box | |
| PCMark 10 Score | 7818 points | |
Help | ||
| AIDA64 / Memory Copy | |
| MSI Titan GT77 12UHS | |
| Aorus 17X XES | |
| MSI Stealth GS77 12UHS-083US | |
| Razer Blade 17 Early 2022 | |
| Average Intel Core i9-12900H (34438 - 74264, n=28) | |
| Uniwell Technology GM7AG8N Liquid Cooling Box | |
| AIDA64 / Memory Read | |
| Aorus 17X XES | |
| MSI Stealth GS77 12UHS-083US | |
| Razer Blade 17 Early 2022 | |
| MSI Titan GT77 12UHS | |
| Average Intel Core i9-12900H (36365 - 74642, n=28) | |
| Uniwell Technology GM7AG8N Liquid Cooling Box | |
| AIDA64 / Memory Write | |
| MSI Stealth GS77 12UHS-083US | |
| MSI Titan GT77 12UHS | |
| Aorus 17X XES | |
| Average Intel Core i9-12900H (32276 - 67858, n=28) | |
| Razer Blade 17 Early 2022 | |
| Uniwell Technology GM7AG8N Liquid Cooling Box | |
| AIDA64 / Memory Latency | |
| MSI Stealth GS77 12UHS-083US | |
| Uniwell Technology GM7AG8N Liquid Cooling Box | |
| MSI Titan GT77 12UHS | |
| Aorus 17X XES | |
| Average Intel Core i9-12900H (74.7 - 118.1, n=27) | |
| Asus ROG Zephyrus S17 GX703HSD | |
* ... smaller is better
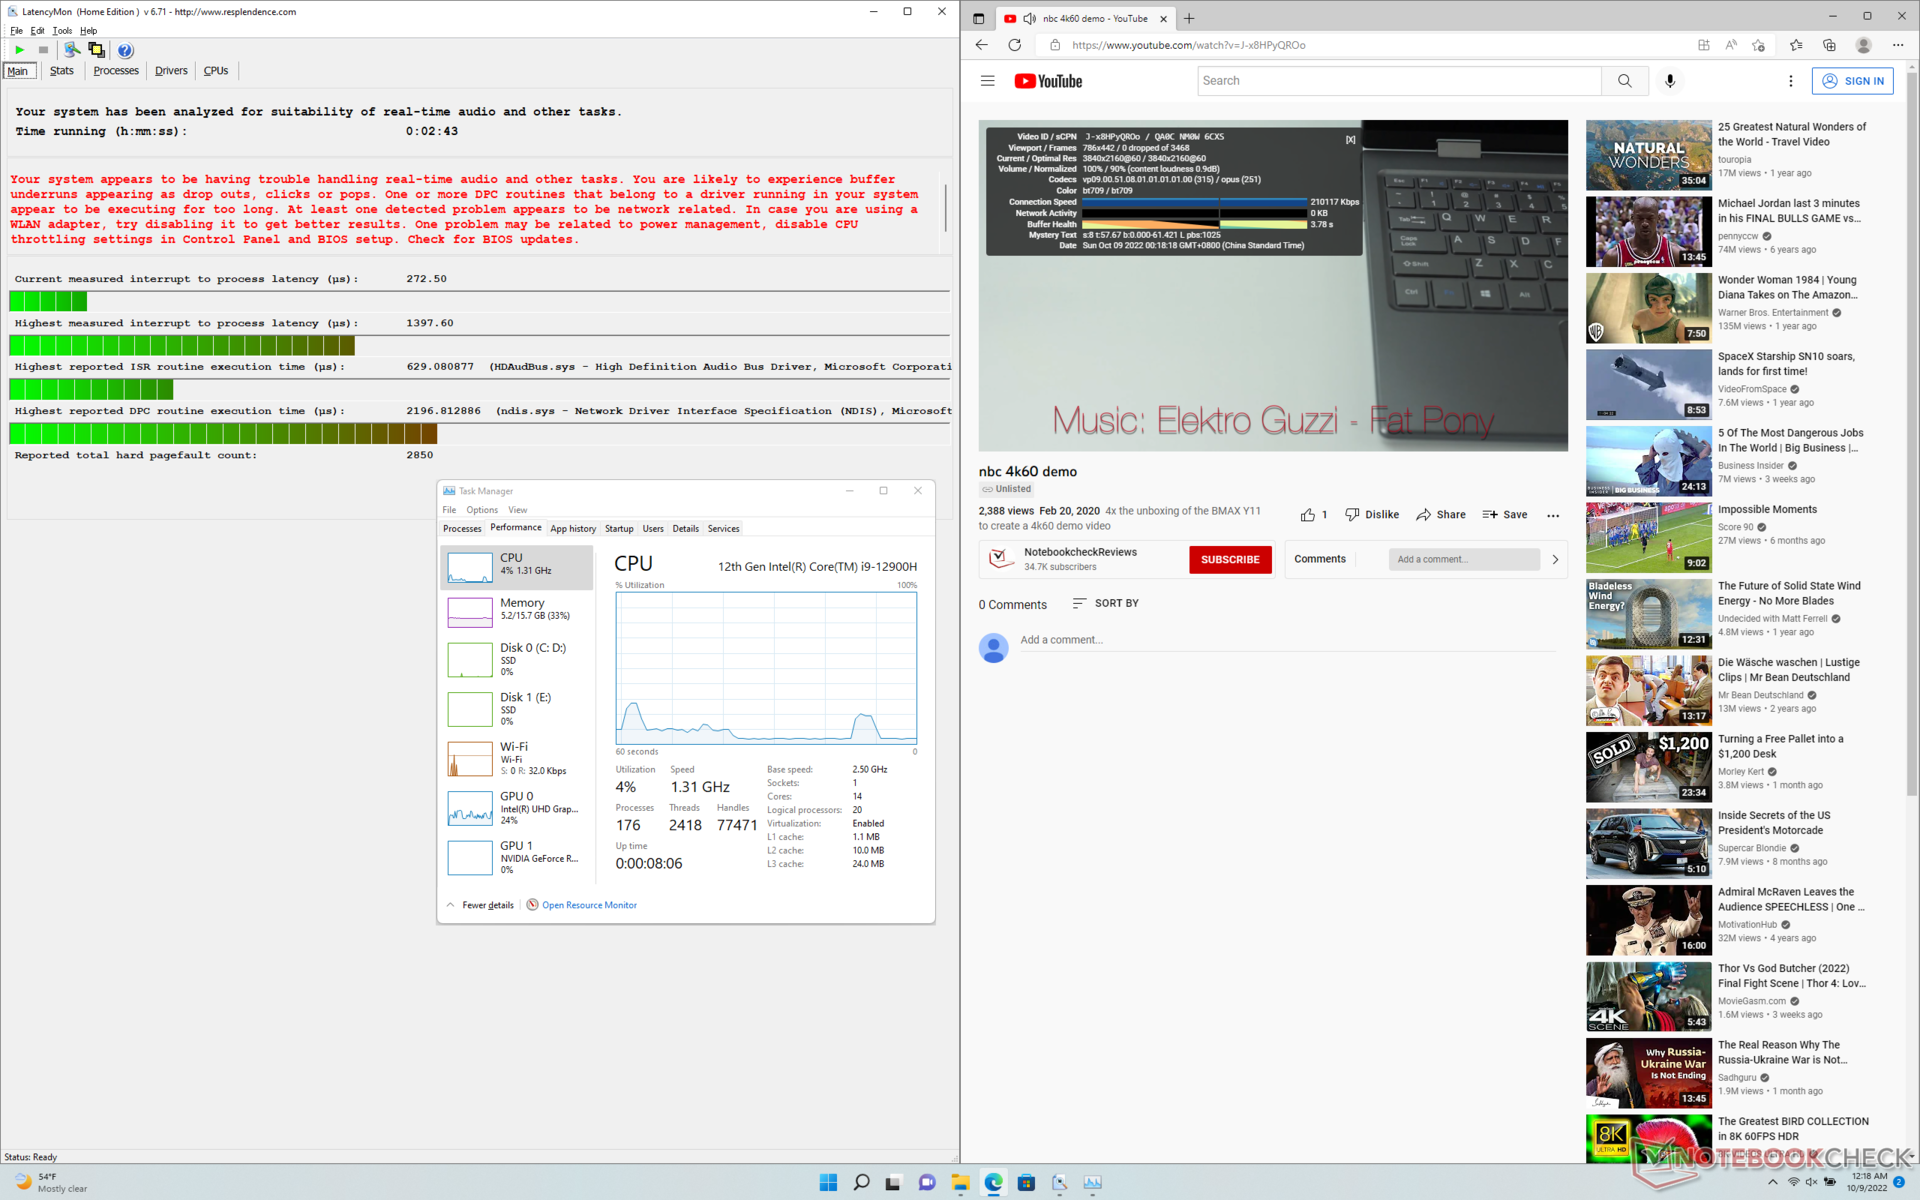
DPC Latency
LatencyMon reveals DPC issues when opening multiple browser tabs of our homepage. 4K60 video playback is otherwise perfect with no dropped frames.

| DPC Latencies / LatencyMon - interrupt to process latency (max), Web, Youtube, Prime95 | |
| MSI Stealth GS77 12UHS-083US | |
| Asus ROG Zephyrus S17 GX703HSD | |
| Uniwell Technology GM7AG8N Liquid Cooling Box | |
| Aorus 17X XES | |
| Razer Blade 17 Early 2022 | |
* ... smaller is better
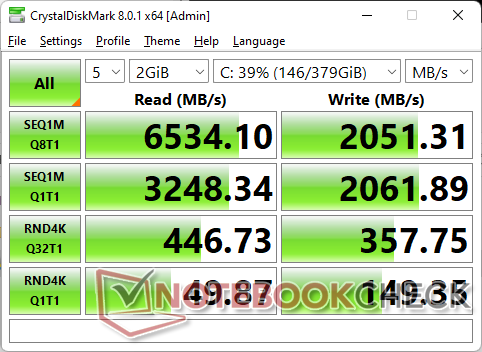
Storage Devices — 2x M.2 2280 PCIe4 x4 Support
Our test unit comes equipped with the same Samsung PM9A1 MZVL21T0HCLR PCIe4 x4 SSD as found many other high-end gaming laptops like the MSI Titan GT77. However, the drive exhibits performance issues when stressed despite the fact that a heat spreader is included. When running DiskSpd in a loop, read rates would start out very high at ~6500 MB/s before quickly falling to ~1400 MB/s as shown by our graph below. This could be a potential bug with the system.


| Drive Performance Rating - Percent | |
| Asus ROG Zephyrus S17 GX703HSD | |
| Aorus 17X XES | |
| MSI Titan GT77 12UHS | |
| Razer Blade 17 Early 2022 | |
| MSI Stealth GS77 12UHS-083US | |
| Uniwell Technology GM7AG8N Liquid Cooling Box | |
* ... smaller is better
Disk Throttling: DiskSpd Read Loop, Queue Depth 8
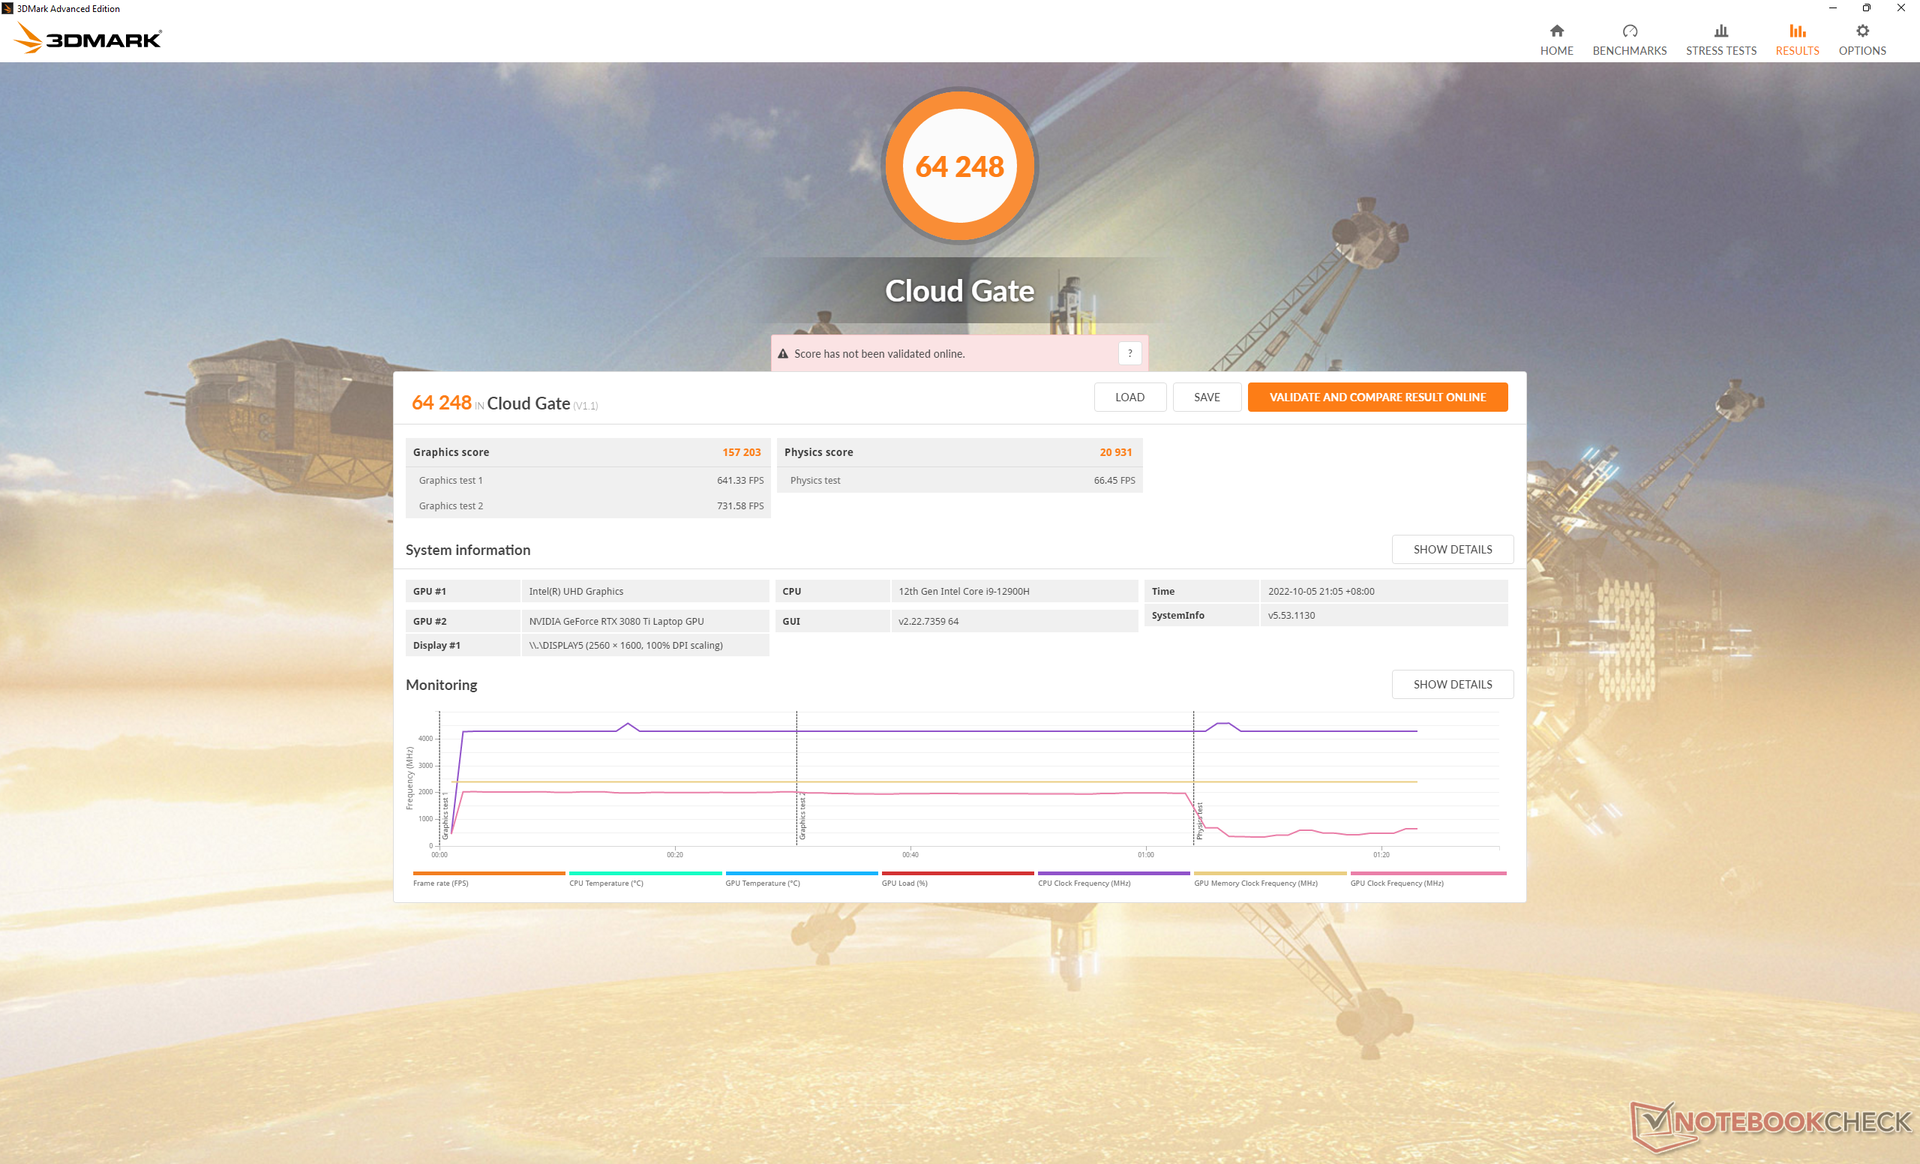
GPU Performance — Full Fat 175 W TGP GPU
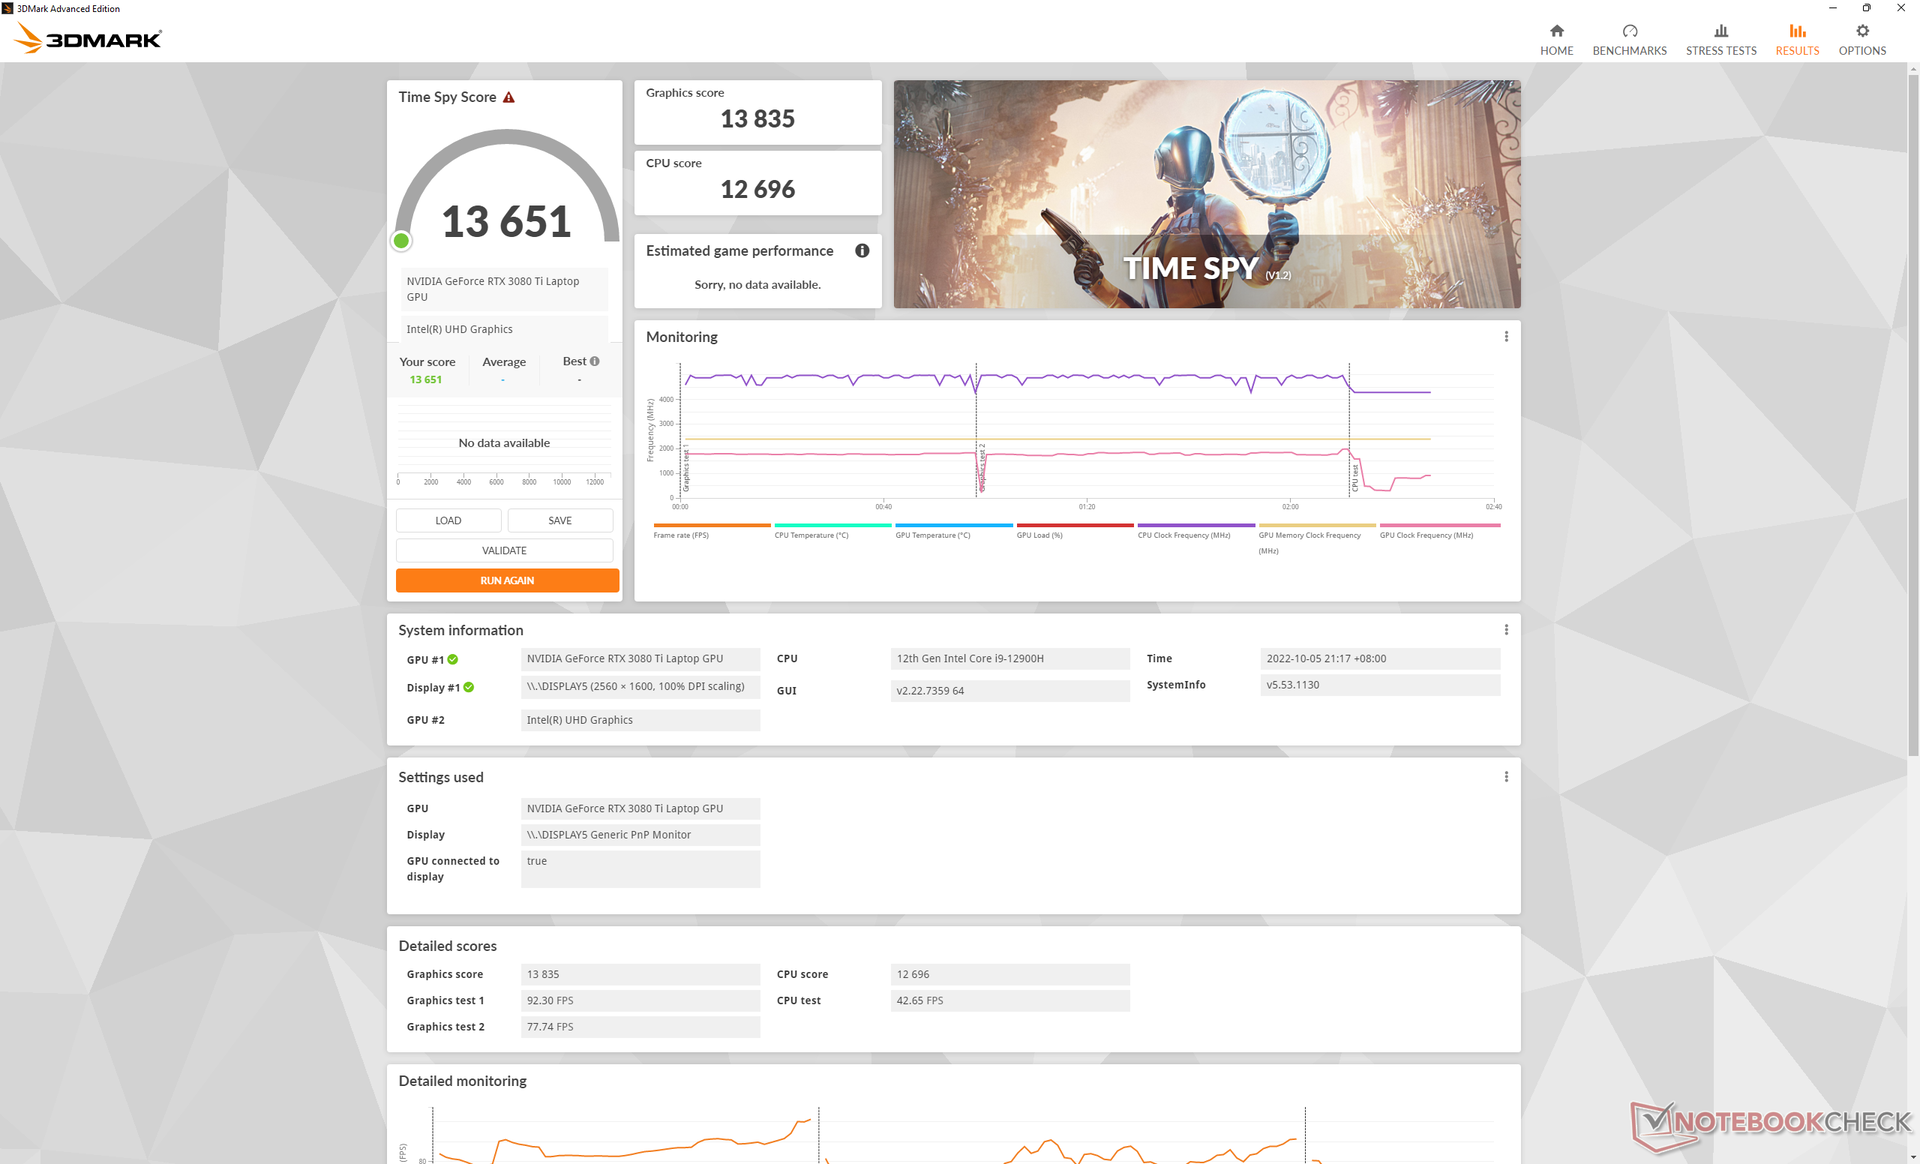
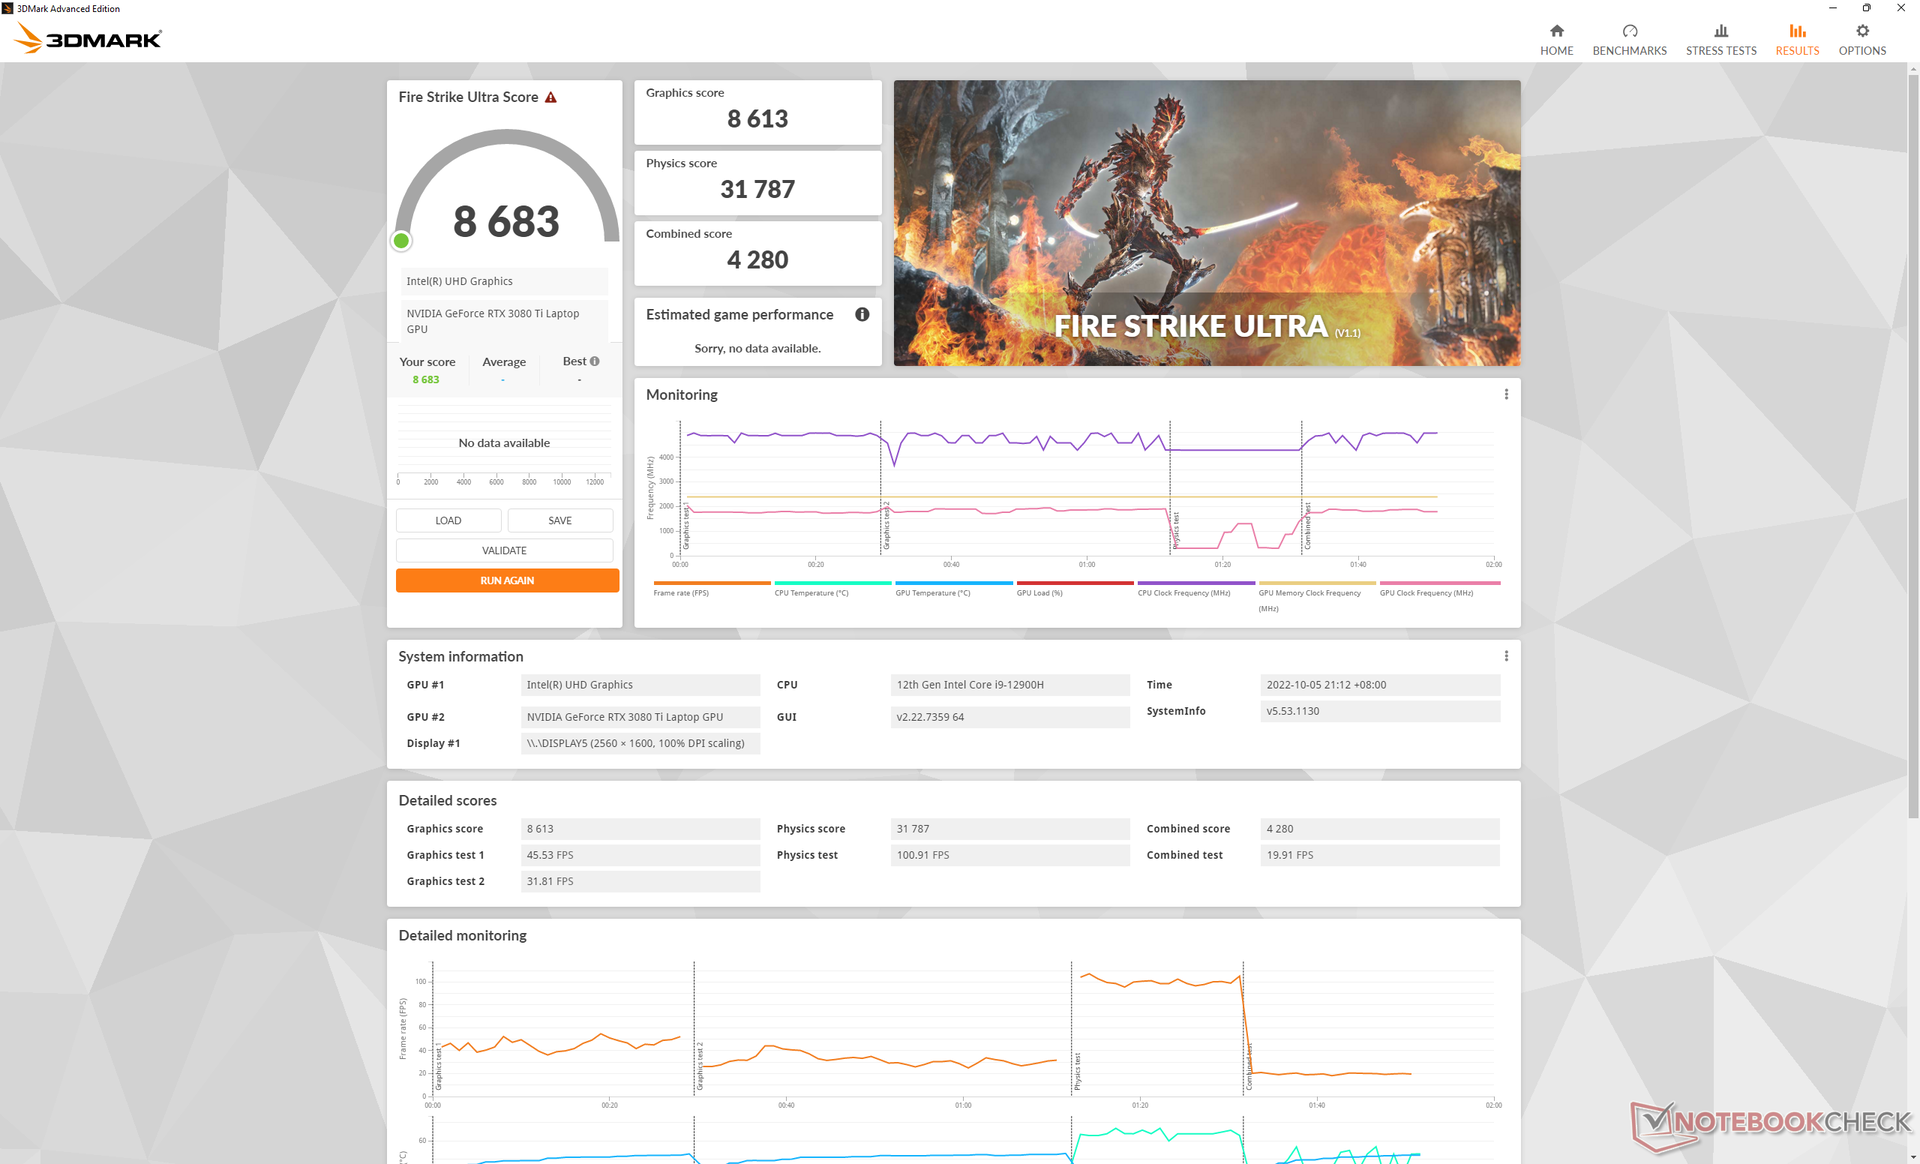
Graphics performance is about 5 to 15 percent faster than the average laptop in our database equipped with the same GeForce RTX 3080 Ti GPU. The GPU is able to run even faster if users decide to overclock it further beyond the manufacturer settings.
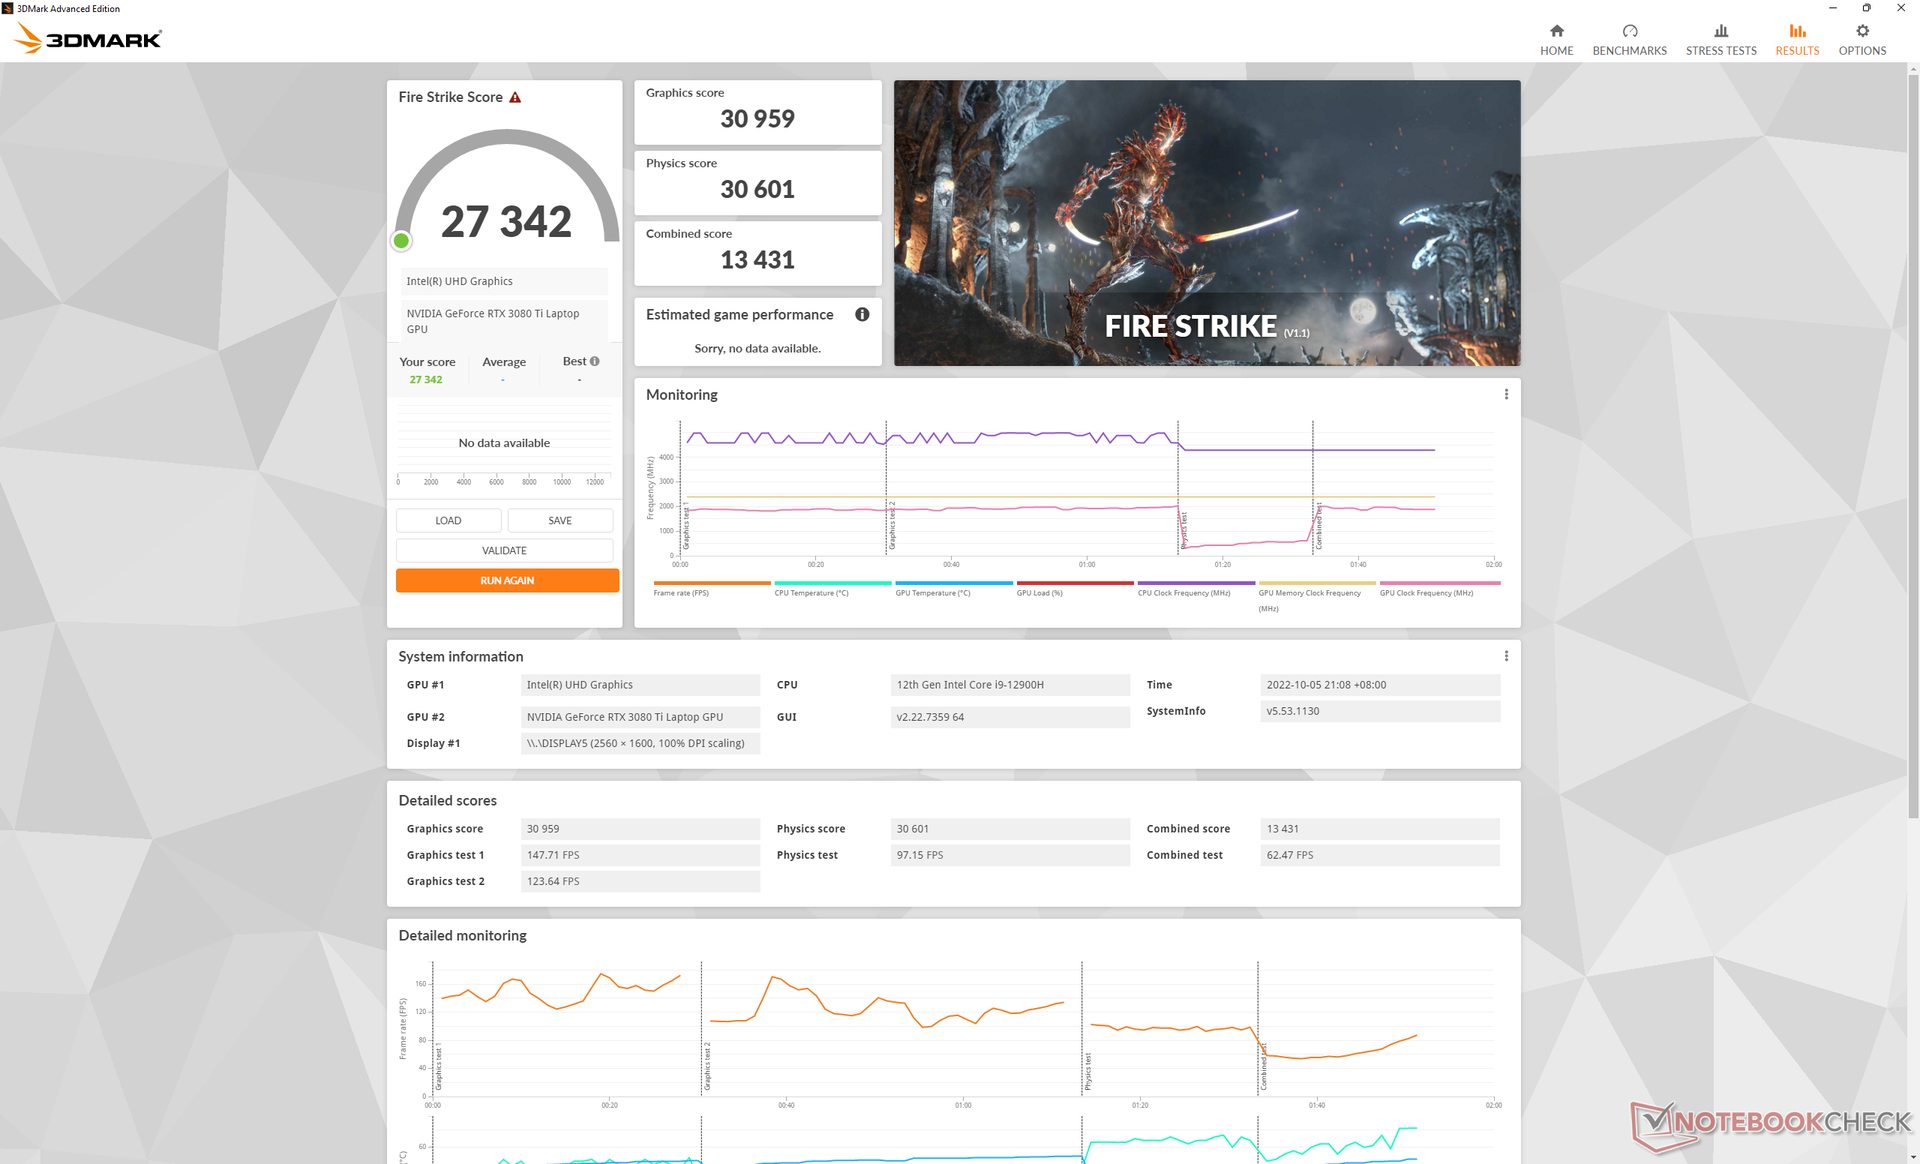
Interestingly, graphics performance is not reduced if running the cooling box at its lowest fan level setting. Running Fire Strike at the "Quietest" mode would result in Physics and Graphics scores 31443 and 31311 points, respectively, compared to 30601 and 30959 points when on the "Balanced" cooling box mode. This is especially important as it means you don't have to run the system at its maximum fan settings if you don't intend to overclock the GPU.


| 3DMark 11 Performance | 34262 points | |
| 3DMark Cloud Gate Standard Score | 64248 points | |
| 3DMark Fire Strike Score | 27342 points | |
| 3DMark Time Spy Score | 13651 points | |
Help | ||
| Blender | |
| v3.3 Classroom OPTIX/RTX | |
| Aorus 17X XES | |
| MSI Titan GT77 12UHS | |
| Uniwell Technology GM7AG8N Liquid Cooling Box | |
| v3.3 Classroom CUDA | |
| Aorus 17X XES | |
| Uniwell Technology GM7AG8N Liquid Cooling Box | |
| MSI Titan GT77 12UHS | |
| v3.3 Classroom CPU | |
| Aorus 17X XES | |
| Uniwell Technology GM7AG8N Liquid Cooling Box | |
| MSI Titan GT77 12UHS | |
* ... smaller is better
Witcher 3 FPS Chart
| low | med. | high | ultra | QHD | |
|---|---|---|---|---|---|
| GTA V (2015) | 184.8 | 181.6 | 177.3 | 123.3 | 112.6 |
| The Witcher 3 (2015) | 464.9 | 366.2 | 257.5 | 127.2 | |
| Dota 2 Reborn (2015) | 171.3 | 158.9 | 152.3 | 145.3 | |
| Final Fantasy XV Benchmark (2018) | 188.7 | 164.4 | 122.7 | 97 | |
| X-Plane 11.11 (2018) | 149.2 | 133.8 | 106.2 | ||
| Strange Brigade (2018) | 448 | 311 | 255 | 224 | 166.8 |
| Cyberpunk 2077 1.6 (2022) | 144.9 | 140.1 | 115.8 | 96.7 | 63.3 |
Emissions
System Noise
As mentioned earlier, the cooling box has three fan modes: Quieter, Quiet, and Balanced. Fan noise on "Quietest" is already quite loud at 41.6 dB(A) which is as loud as most Ultrabooks when running high loads. Bumping this up to "Quiet" and "Balanced" mode will increase fan noise to 44.2 dB(A) and 45.8 dB(A), respectively. We recommend placing the cooling box as far back as possible from your seat to reduce noise levels.
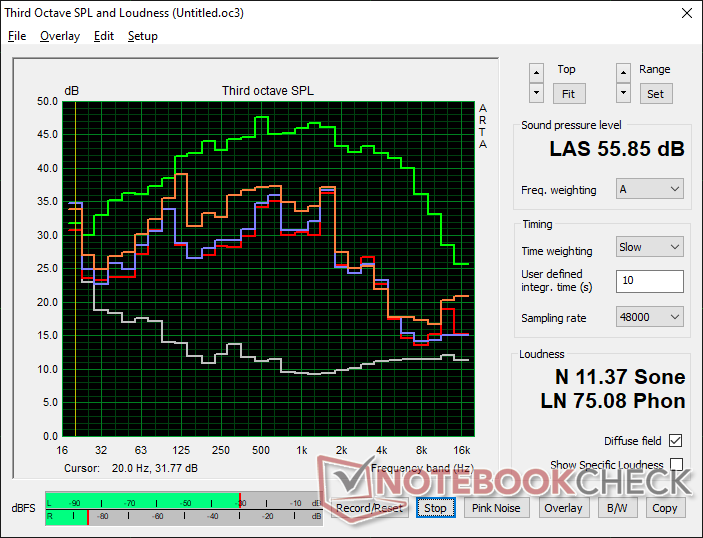
There is a fourth power profile in the Control Center software called "Fan Boost" with runs the internal fans at their maximum RPMs. When both "Fan Boost" and the cooling box "Balanced" modes are active, overall system noise can be as loud as 55.9 dB(A) which is actually very similar to most "regular" 17-inch gaming laptops without external cooling solutions.
The big kicker here is that you don't have to enable Fan Boost or have the cooling box at its loudest setting in order to run the CPU or GPU at stock speeds. In contrast, most other gaming laptops like the Asus Zephyrus S17 or Razer Blade 17 require users to enable Turbo Mode or else TGP will be throttled when gaming. This means that Uniwill owners can run the cooling box at its "Quietest" mode of 41.6 dB(A) for better-than-average RTX 3080 Ti gaming performance whereas most other gaming laptops must endure a fan noise of 50 dB(A) or higher just to come close to the performance of the Uniwill . In short, the cooling box is able to do almost all of the cooling work even when gaming at the quietest fan settings without needing to throttle the CPU or GPU.

Noise Level
| Idle |
| 41.6 / 42.1 / 42.1 dB(A) |
| Load |
| 42.2 / 55.9 dB(A) |
 | ||
30 dB silent 40 dB(A) audible 50 dB(A) loud |
||
min: | ||
| Uniwell Technology GM7AG8N Liquid Cooling Box GeForce RTX 3080 Ti Laptop GPU, i9-12900H, Samsung PM9A1 MZVL21T0HCLR | MSI Titan GT77 12UHS GeForce RTX 3080 Ti Laptop GPU, i9-12900HX, Samsung PM9A1 MZVL21T0HCLR | Aorus 17X XES GeForce RTX 3070 Ti Laptop GPU, i9-12900HX, Gigabyte AG470S1TB-SI B10 | Razer Blade 17 Early 2022 GeForce RTX 3080 Ti Laptop GPU, i9-12900H, Samsung PM9A1 MZVL21T0HCLR | MSI Stealth GS77 12UHS-083US GeForce RTX 3080 Ti Laptop GPU, i7-12700H, Micron 3400 1TB MTFDKBA1T0TFH | Asus ROG Zephyrus S17 GX703HSD GeForce RTX 3080 Laptop GPU, i9-11900H, Samsung PM9A1 MZVL22T0HBLB | |
|---|---|---|---|---|---|---|
| Noise | 17% | 5% | 12% | 19% | 23% | |
| off / environment * | 22.8 | 21.9 4% | 26 -14% | 26 -14% | 24.5 -7% | 23 -1% |
| Idle Minimum * | 41.6 | 24.53 41% | 28 33% | 26 37% | 24.5 41% | 23 45% |
| Idle Average * | 42.1 | 24.53 42% | 32 24% | 27 36% | 24.5 42% | 23 45% |
| Idle Maximum * | 42.1 | 24.53 42% | 38 10% | 32 24% | 30.8 27% | 23 45% |
| Load Average * | 42.2 | 46.25 -10% | 53 -26% | 50 -18% | 34.6 18% | 41 3% |
| Witcher 3 ultra * | 55.9 | 56.86 -2% | 54 3% | 51 9% | 46.2 17% | 45 19% |
| Load Maximum * | 55.9 | 54.25 3% | 55 2% | 51 9% | 56.8 -2% | 52 7% |
* ... smaller is better
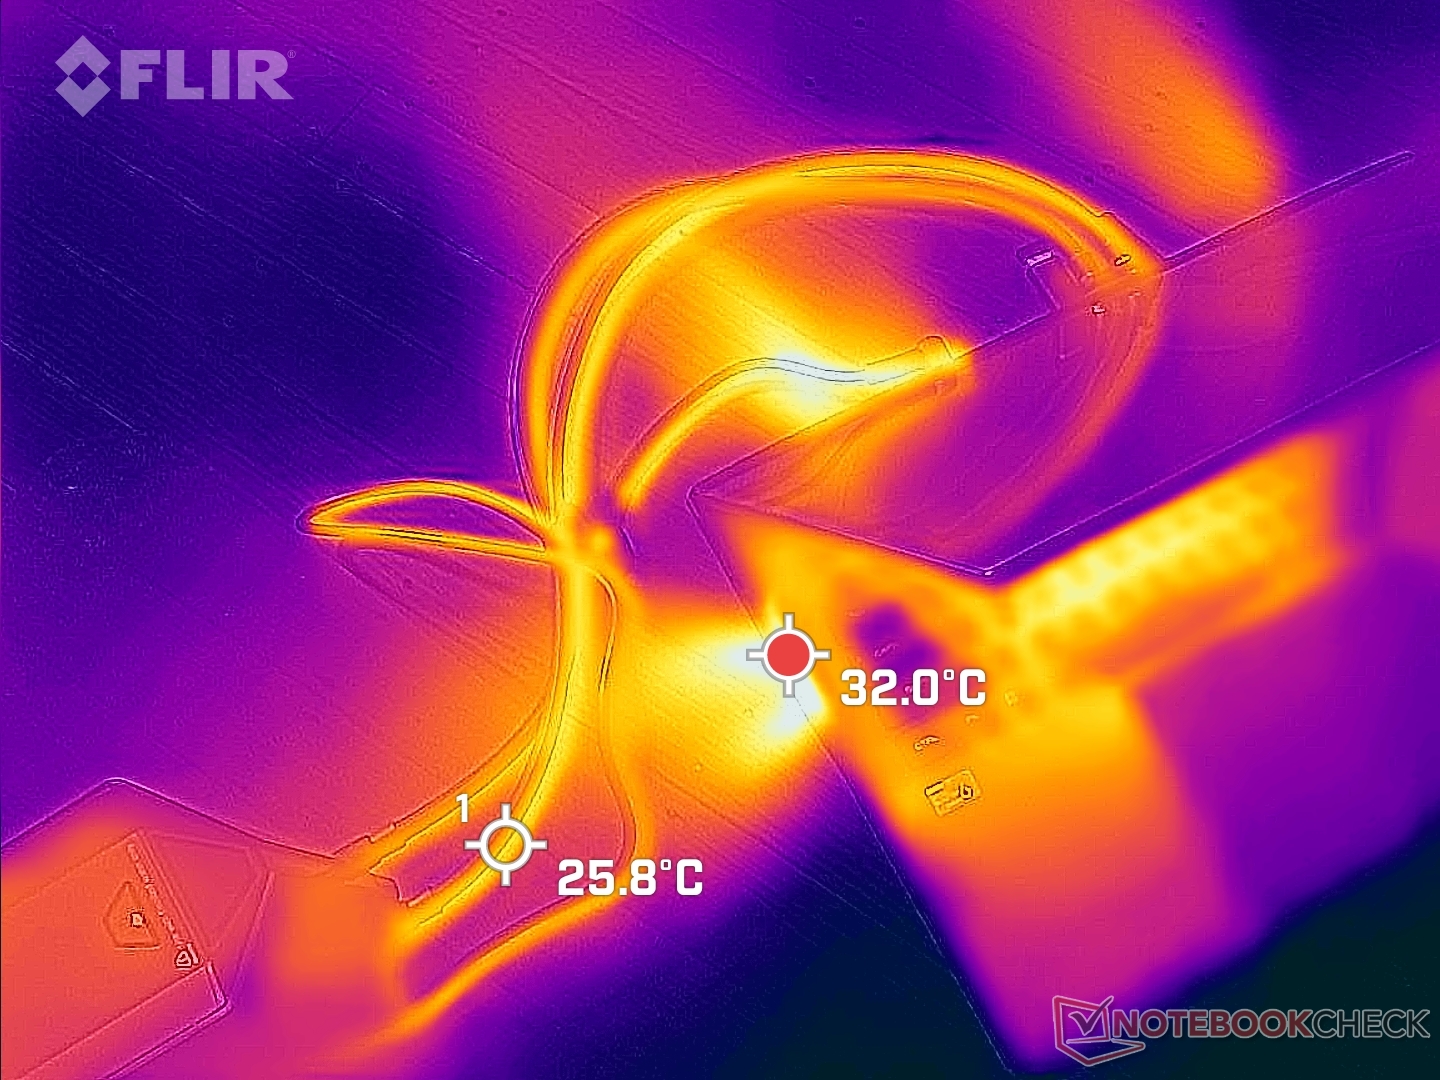
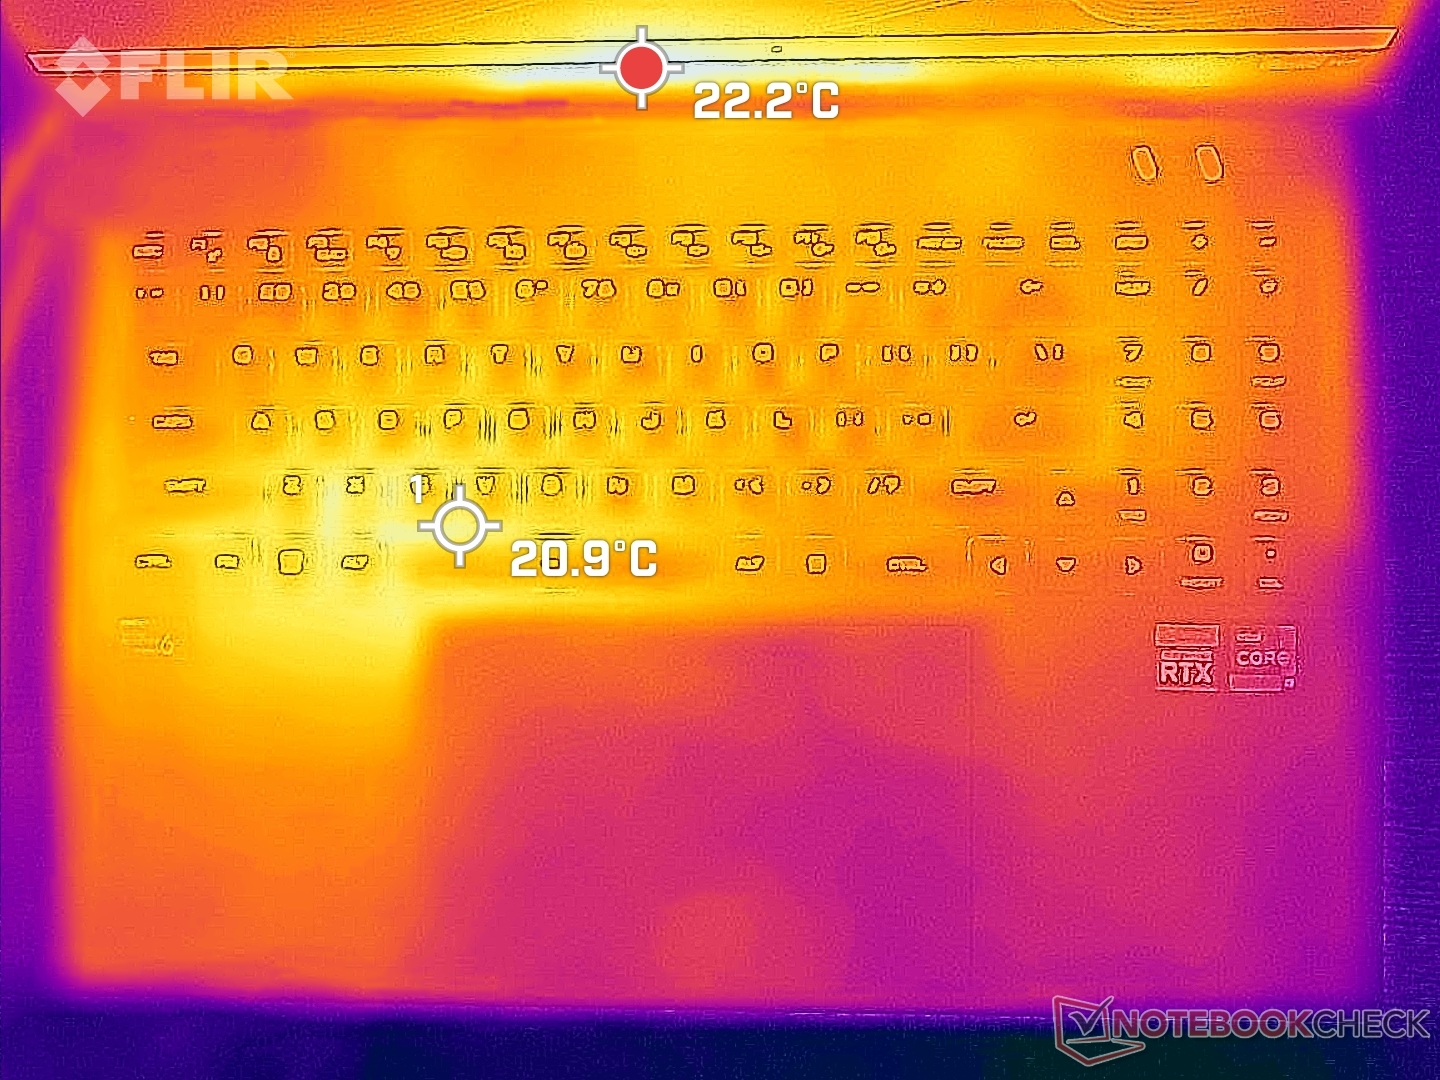
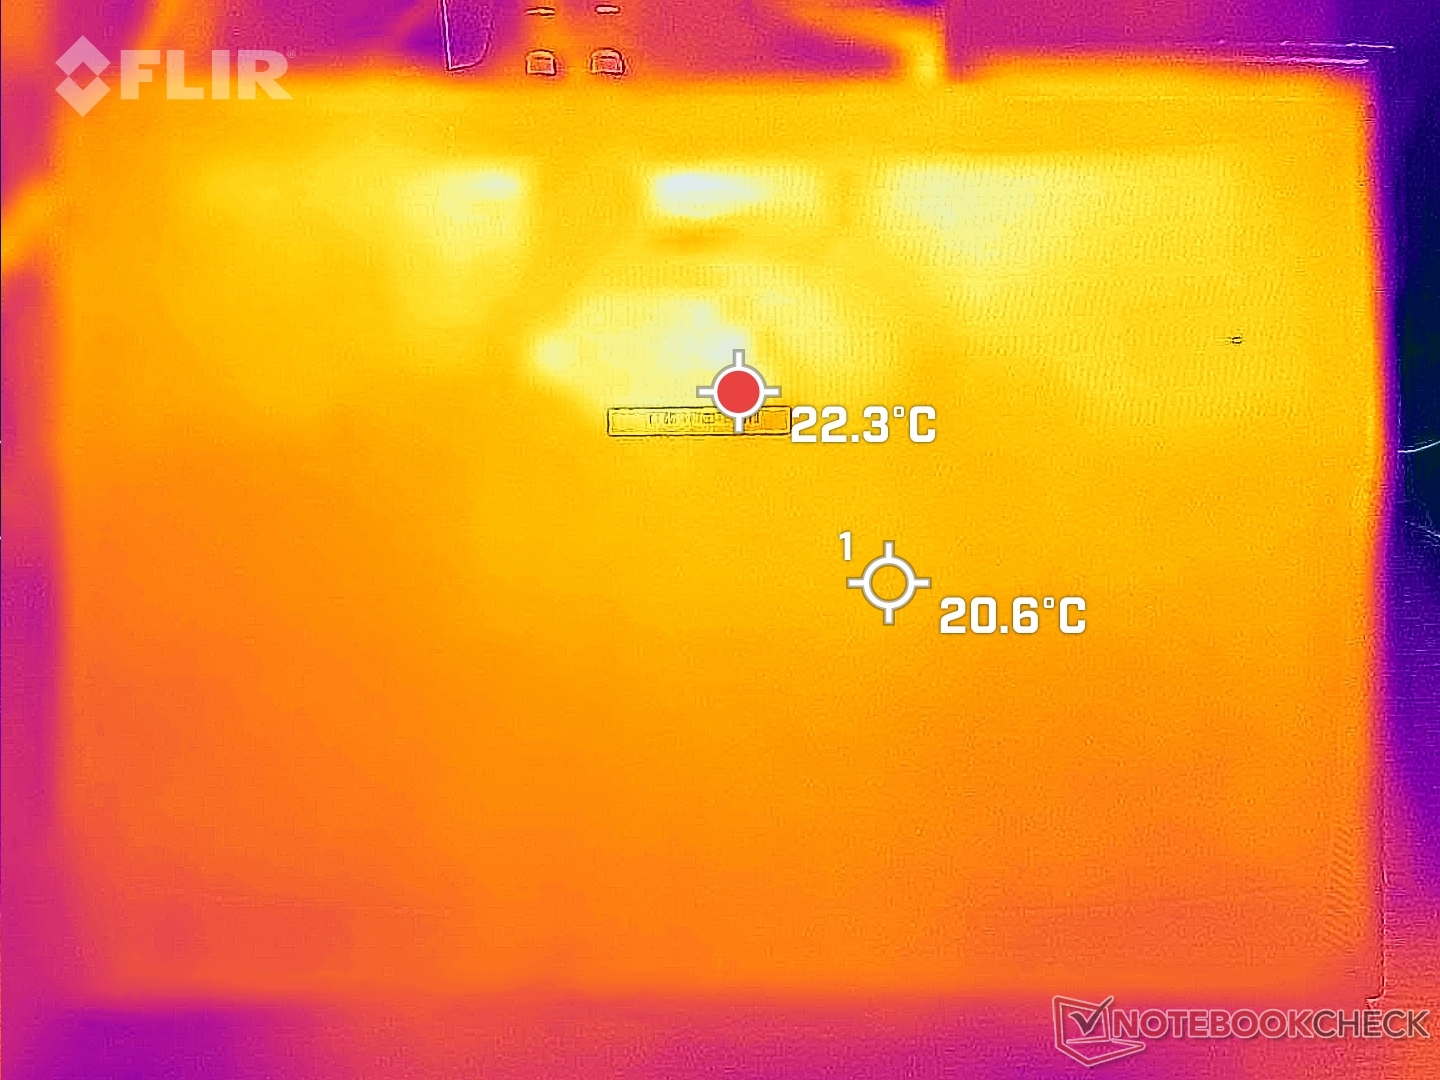
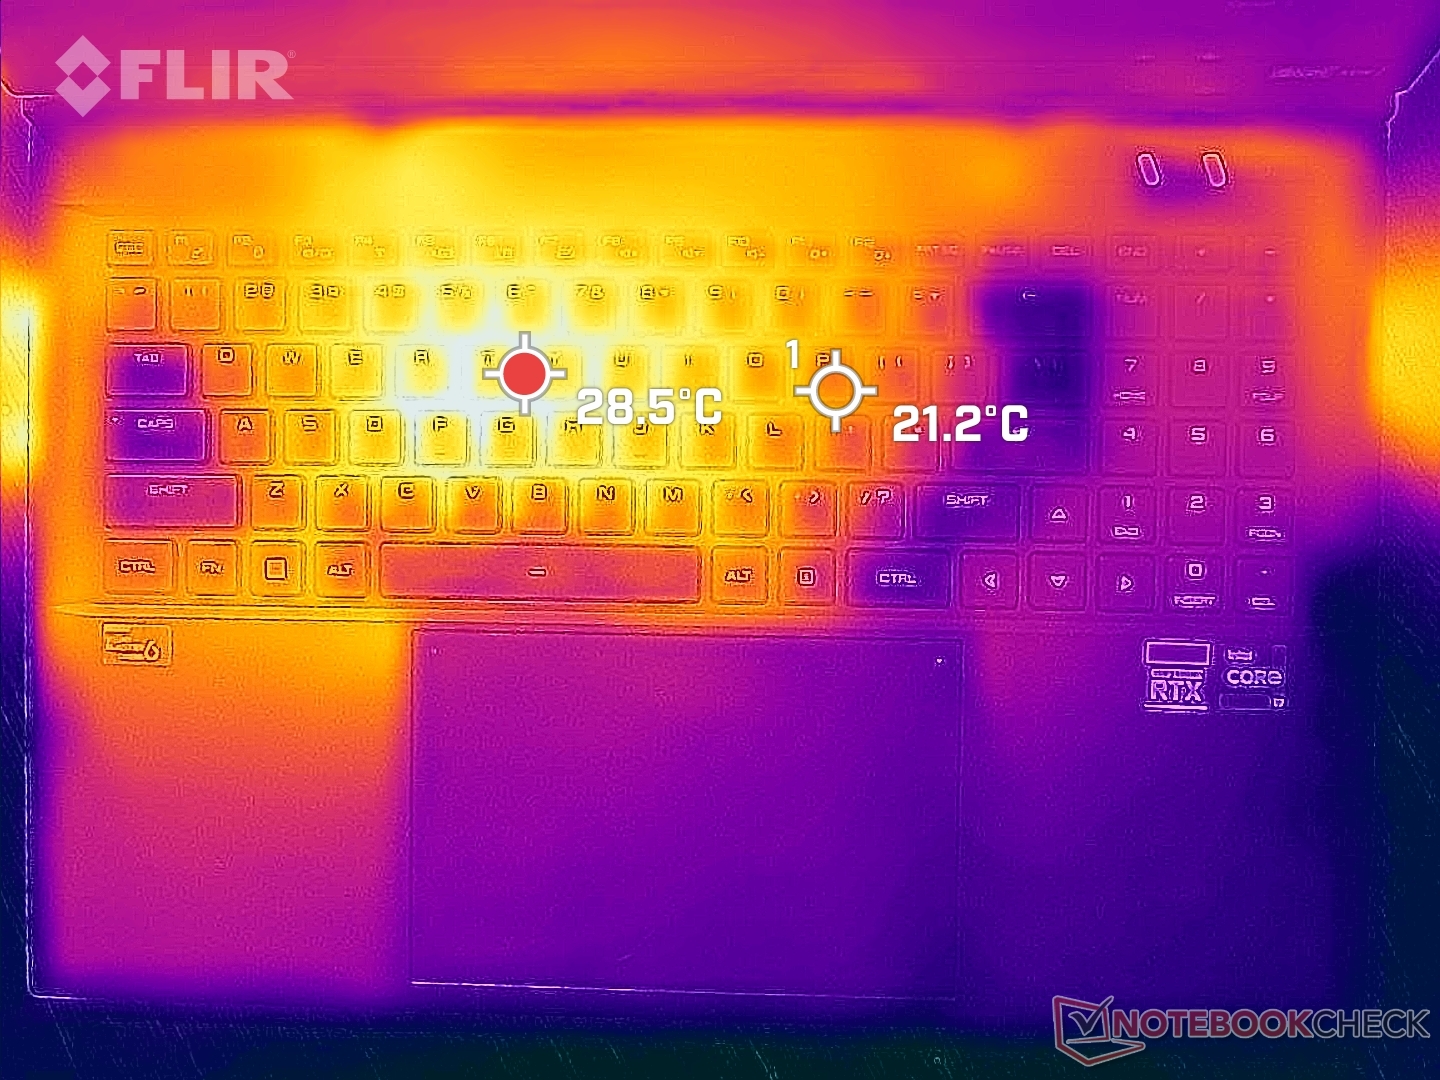
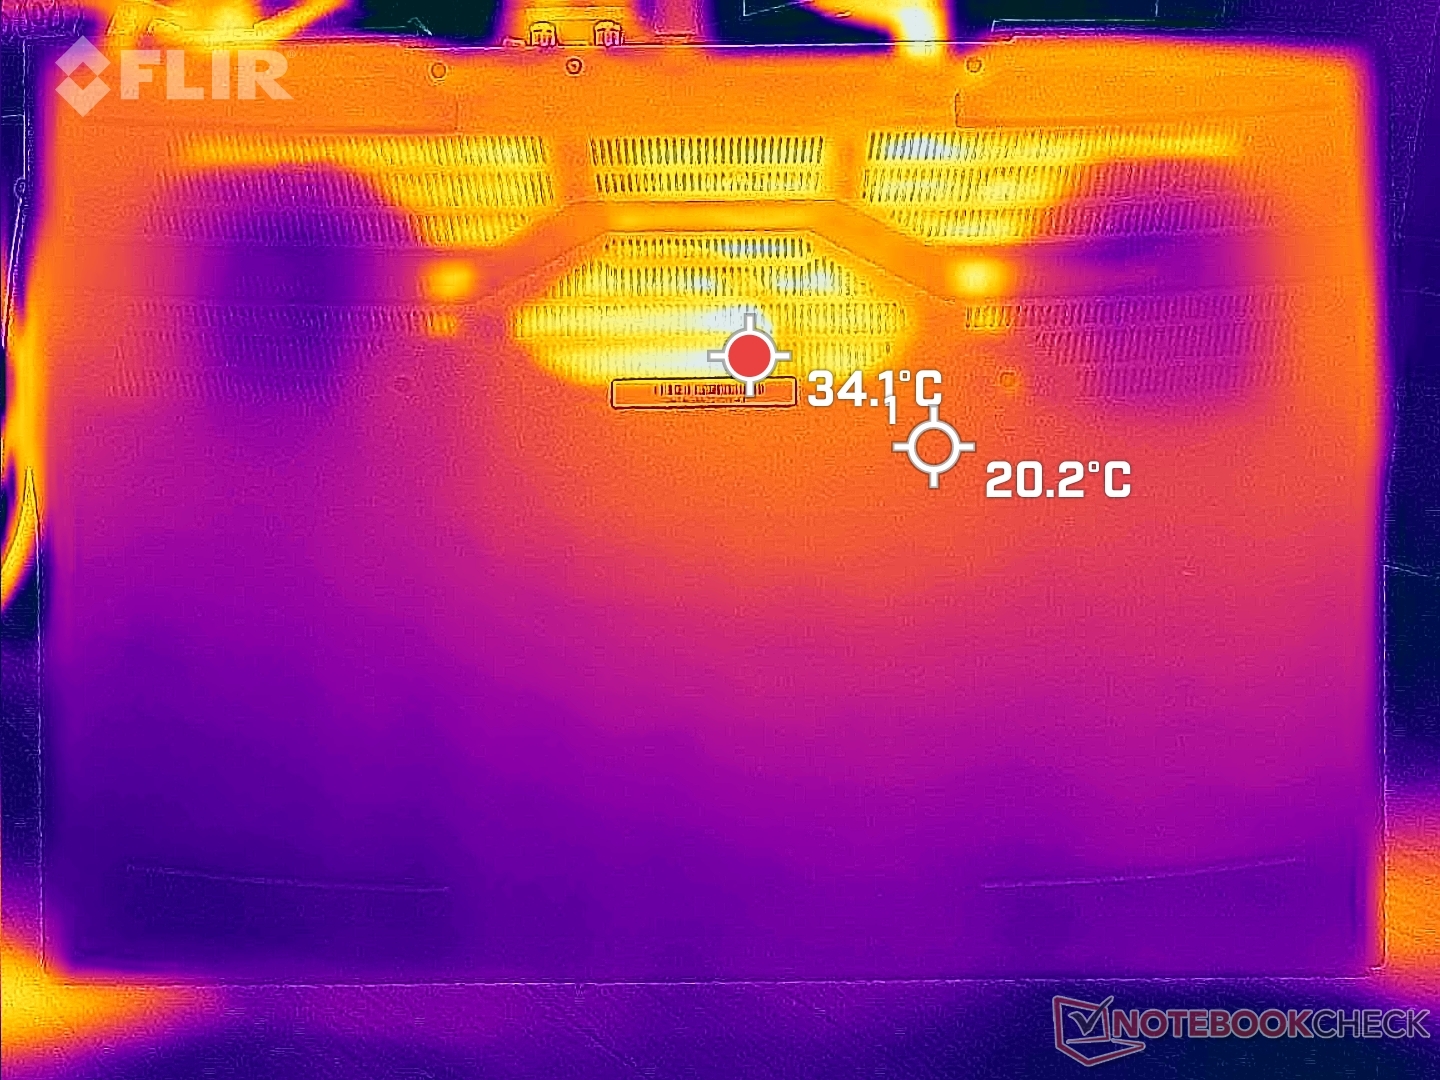
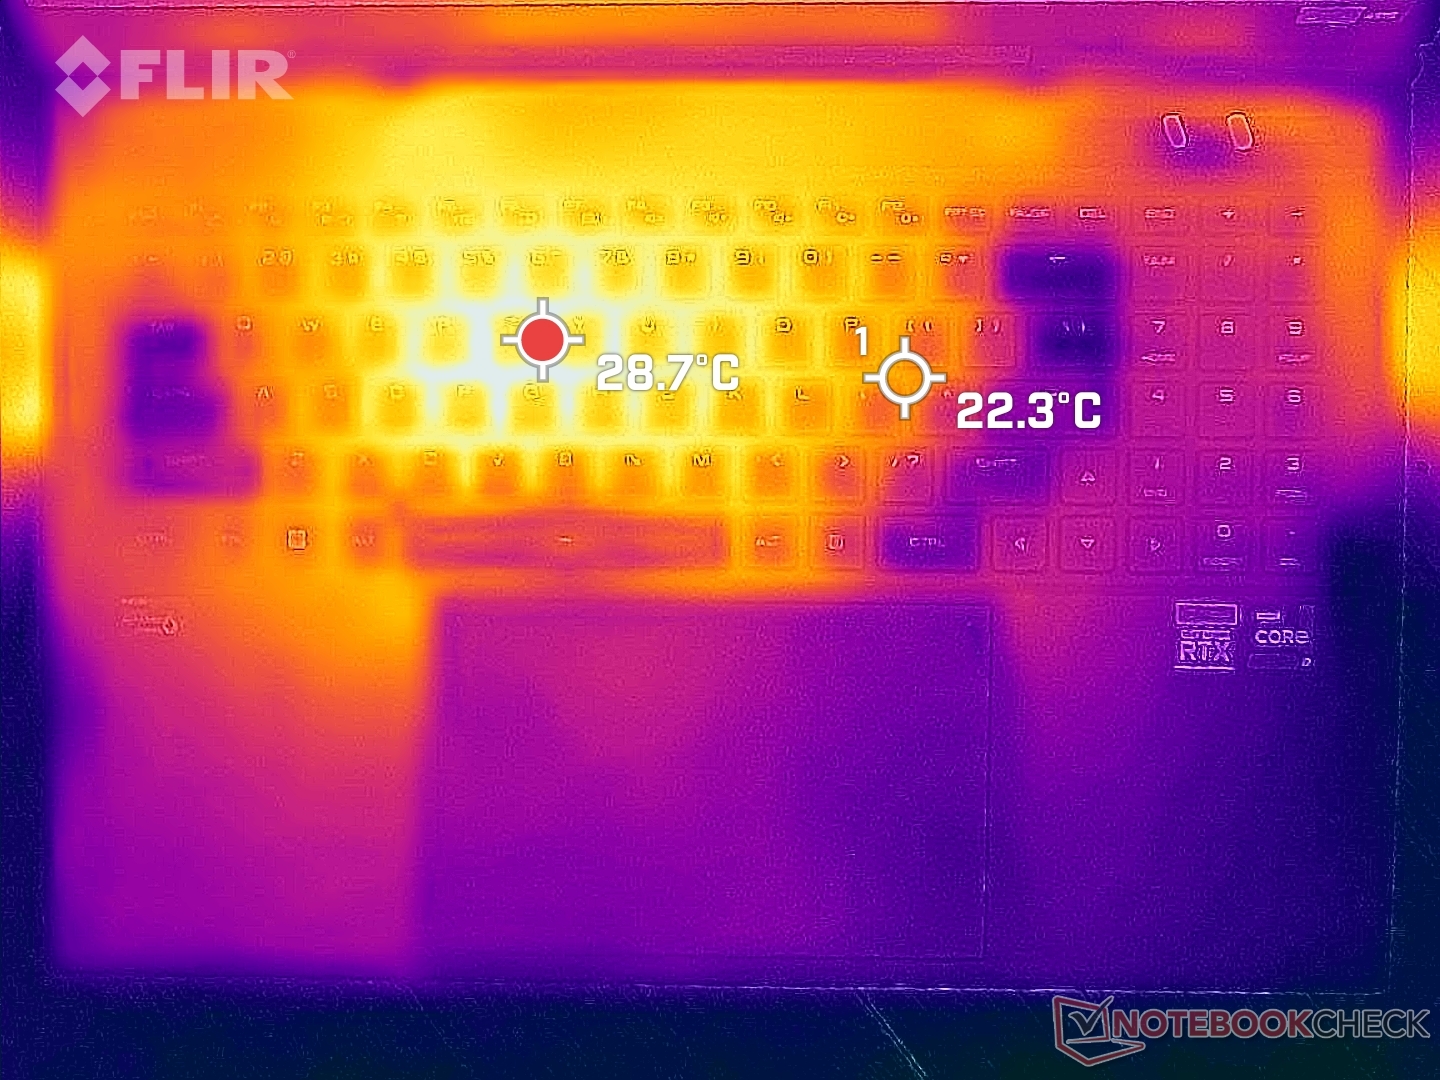
Temperature — Keeping It Cool
Surface temperatures are the coolest we've ever recorded on any gaming laptop. When subjected to 100 percent CPU and GPU utilization, hot spots on the top and bottom would only reach 32 C and 30 C, respectively, compared to 50 C to 60+ C on the MSI Stealth GS77. The average temperature rise is only about 3 C when compared to an idling state. The cooling box is remarkable in terms of keeping temperatures in check.
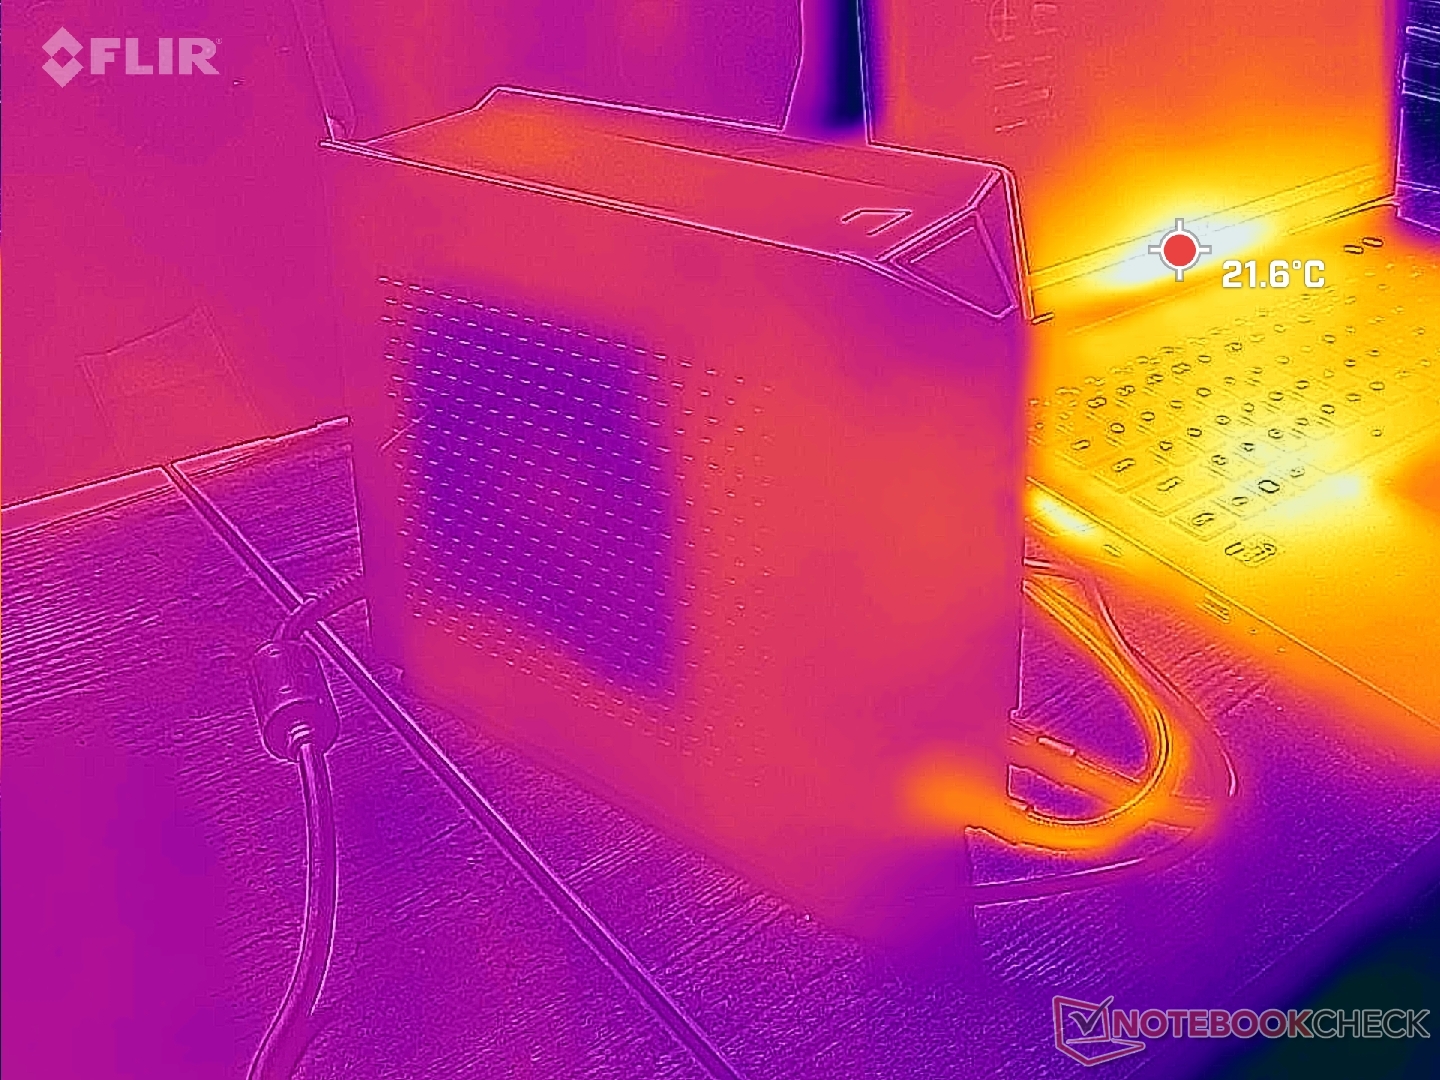

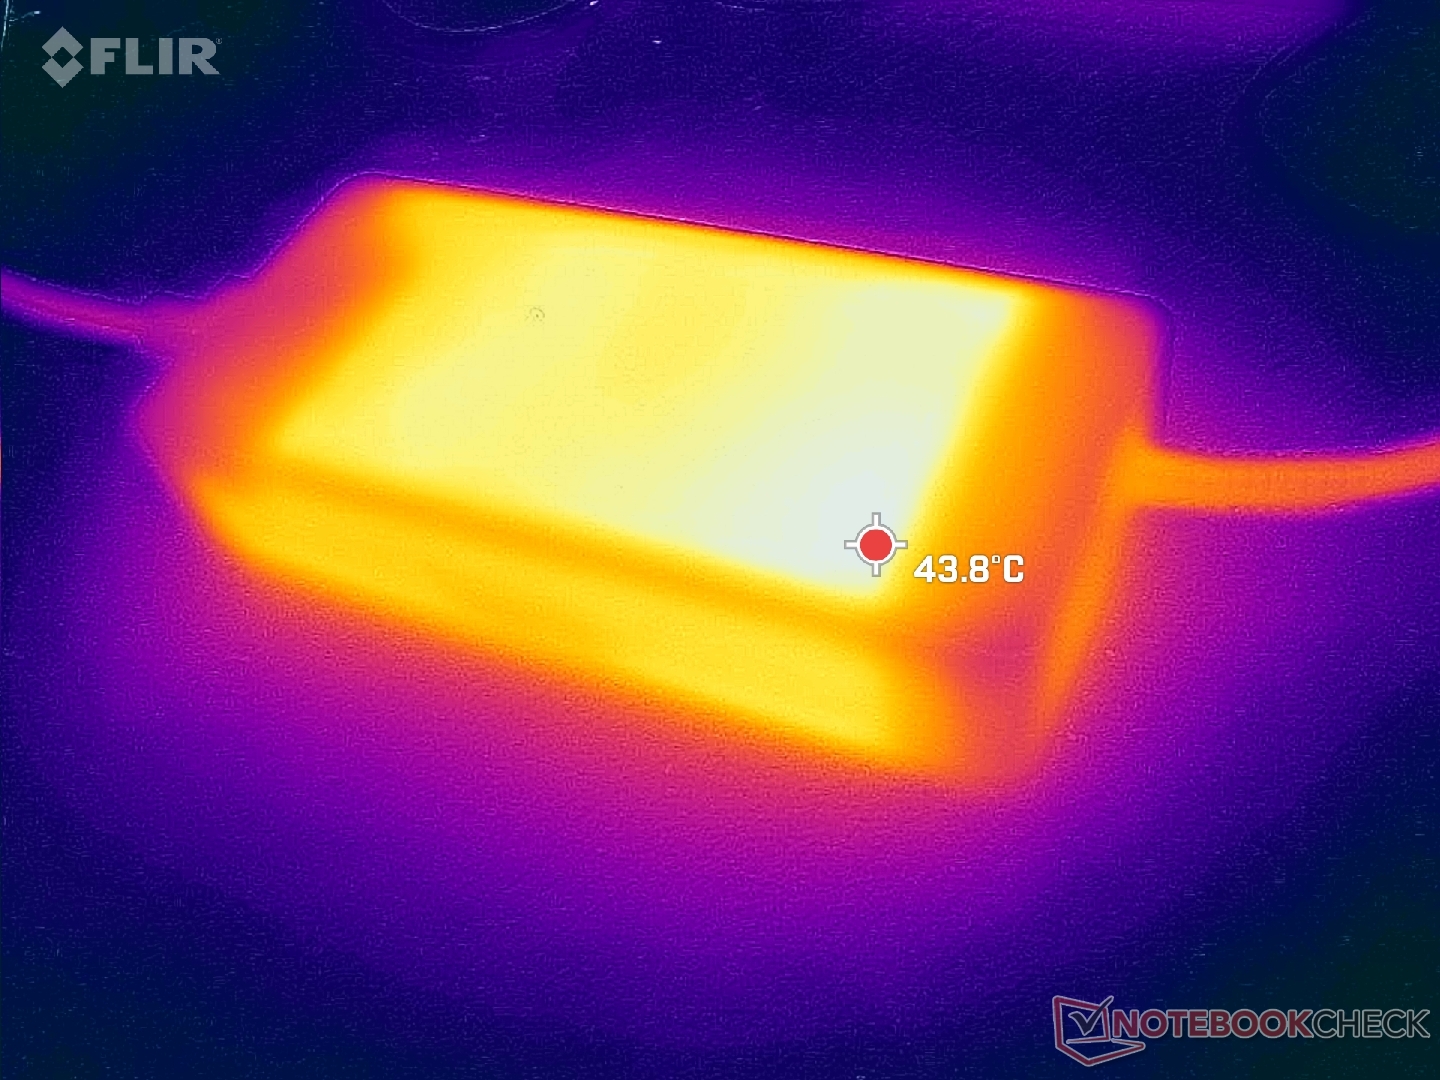
(+) The maximum temperature on the upper side is 32 °C / 90 F, compared to the average of 40.5 °C / 105 F, ranging from 21.2 to 68.8 °C for the class Gaming.
(+) The bottom heats up to a maximum of 30 °C / 86 F, compared to the average of 43.3 °C / 110 F
(+) In idle usage, the average temperature for the upper side is 24.5 °C / 76 F, compared to the device average of 33.9 °C / 93 F.
(+) Playing The Witcher 3, the average temperature for the upper side is 27.2 °C / 81 F, compared to the device average of 33.9 °C / 93 F.
(+) The palmrests and touchpad are cooler than skin temperature with a maximum of 25.2 °C / 77.4 F and are therefore cool to the touch.
(+) The average temperature of the palmrest area of similar devices was 28.9 °C / 84 F (+3.7 °C / 6.6 F).

| Uniwell Technology GM7AG8N Liquid Cooling Box Intel Core i9-12900H, NVIDIA GeForce RTX 3080 Ti Laptop GPU | MSI Titan GT77 12UHS Intel Core i9-12900HX, NVIDIA GeForce RTX 3080 Ti Laptop GPU | Aorus 17X XES Intel Core i9-12900HX, NVIDIA GeForce RTX 3070 Ti Laptop GPU | Razer Blade 17 Early 2022 Intel Core i9-12900H, NVIDIA GeForce RTX 3080 Ti Laptop GPU | MSI Stealth GS77 12UHS-083US Intel Core i7-12700H, NVIDIA GeForce RTX 3080 Ti Laptop GPU | Asus ROG Zephyrus S17 GX703HSD Intel Core i9-11900H, NVIDIA GeForce RTX 3080 Laptop GPU | |
|---|---|---|---|---|---|---|
| Heat | -47% | -65% | -58% | -55% | -59% | |
| Maximum Upper Side * | 32 | 40.8 -28% | 54 -69% | 50 -56% | 50.6 -58% | 59 -84% |
| Maximum Bottom * | 30 | 52.4 -75% | 58 -93% | 56 -87% | 59.6 -99% | 53 -77% |
| Idle Upper Side * | 26.4 | 34.6 -31% | 37 -40% | 36 -36% | 30 -14% | 35 -33% |
| Idle Bottom * | 25 | 38.4 -54% | 39 -56% | 38 -52% | 37.4 -50% | 35 -40% |
* ... smaller is better
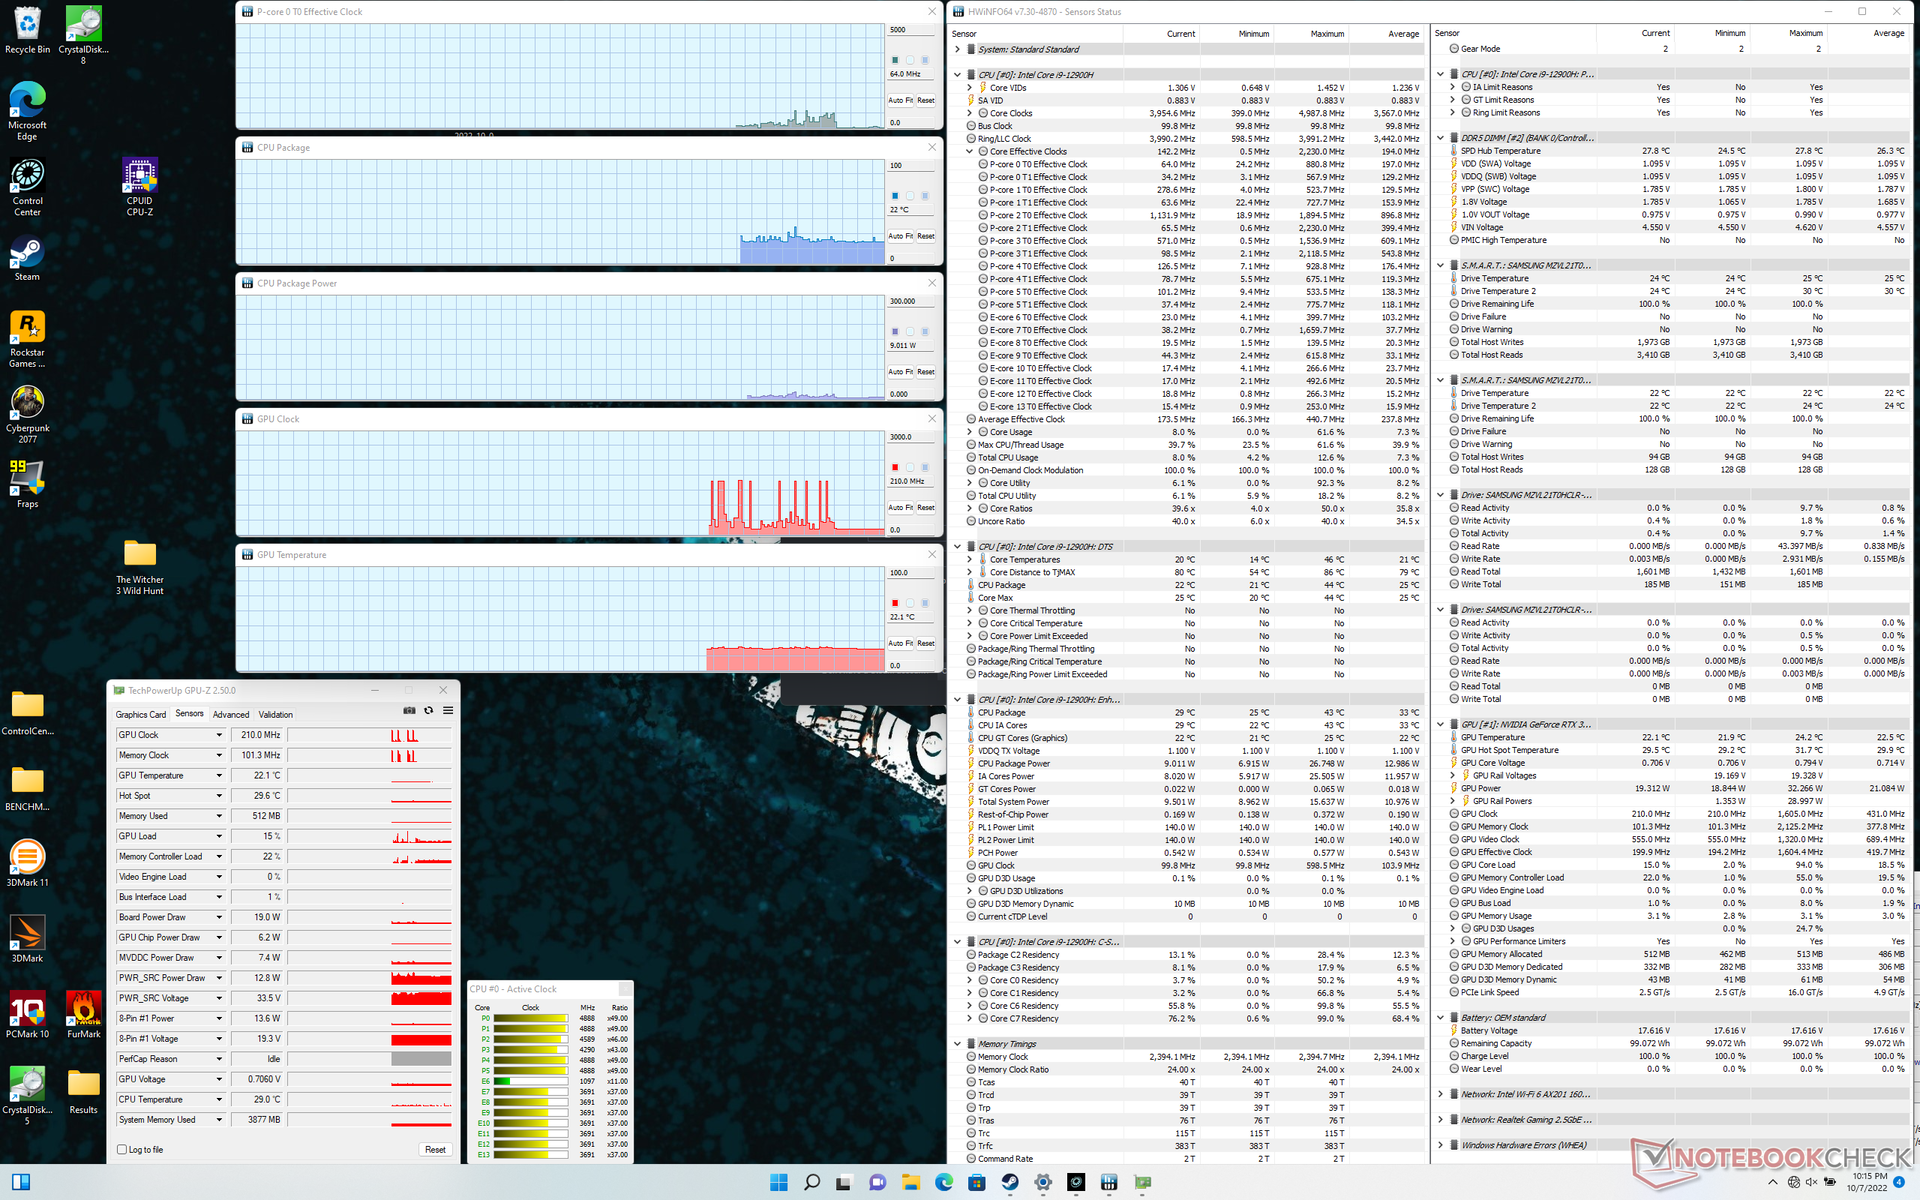
Stress Test — Lots Of Overclocking Headroom
The system exhibits no issues maintaining a high Turbo Boost clock rate of 4.3 GHz when the cooling box and internal fans are set to their respective maximums. The CPU would stabilize at a high clock rate of 4.3 GHz, low core temperature of 54 C, and a high board power draw of 98 W when running Prime95. Running this same Prime95 test on the MSI Vector GP66 with the exact same CPU would result in slower core clock rates, a higher temperature, and a lower power draw of 3.0 GHz, 90 C, and 70 W, respectively.
Temperature and power draw when running Prime95 would sometimes spike to 78 C and 140 W, respectively, without impacting clock rates. We're not sure why this occurs, but it's notable nonetheless.
The GPU would stabilize at 1890 MHz, 2125 MHz VRAM, 55 C, and 163 W (against its rated TGP of 175 W) when running Witcher 3. Repeating this test on the MSI GS77 with the same 3080 Ti GPU would result in a slower 1432 MHz clock rate and 1750 MHz VRAM, warmer 75 C temperature, and lower power draw of 105 W. The benefits of an external water cooling box are very clear in this regard.
Running on battery power limits performance as one would expect. A Fire Strike test on batteries would return Physics and Graphics scores of just 11276 and 4393 points, respectively, compared to 30601 and 30959 points when on mains.
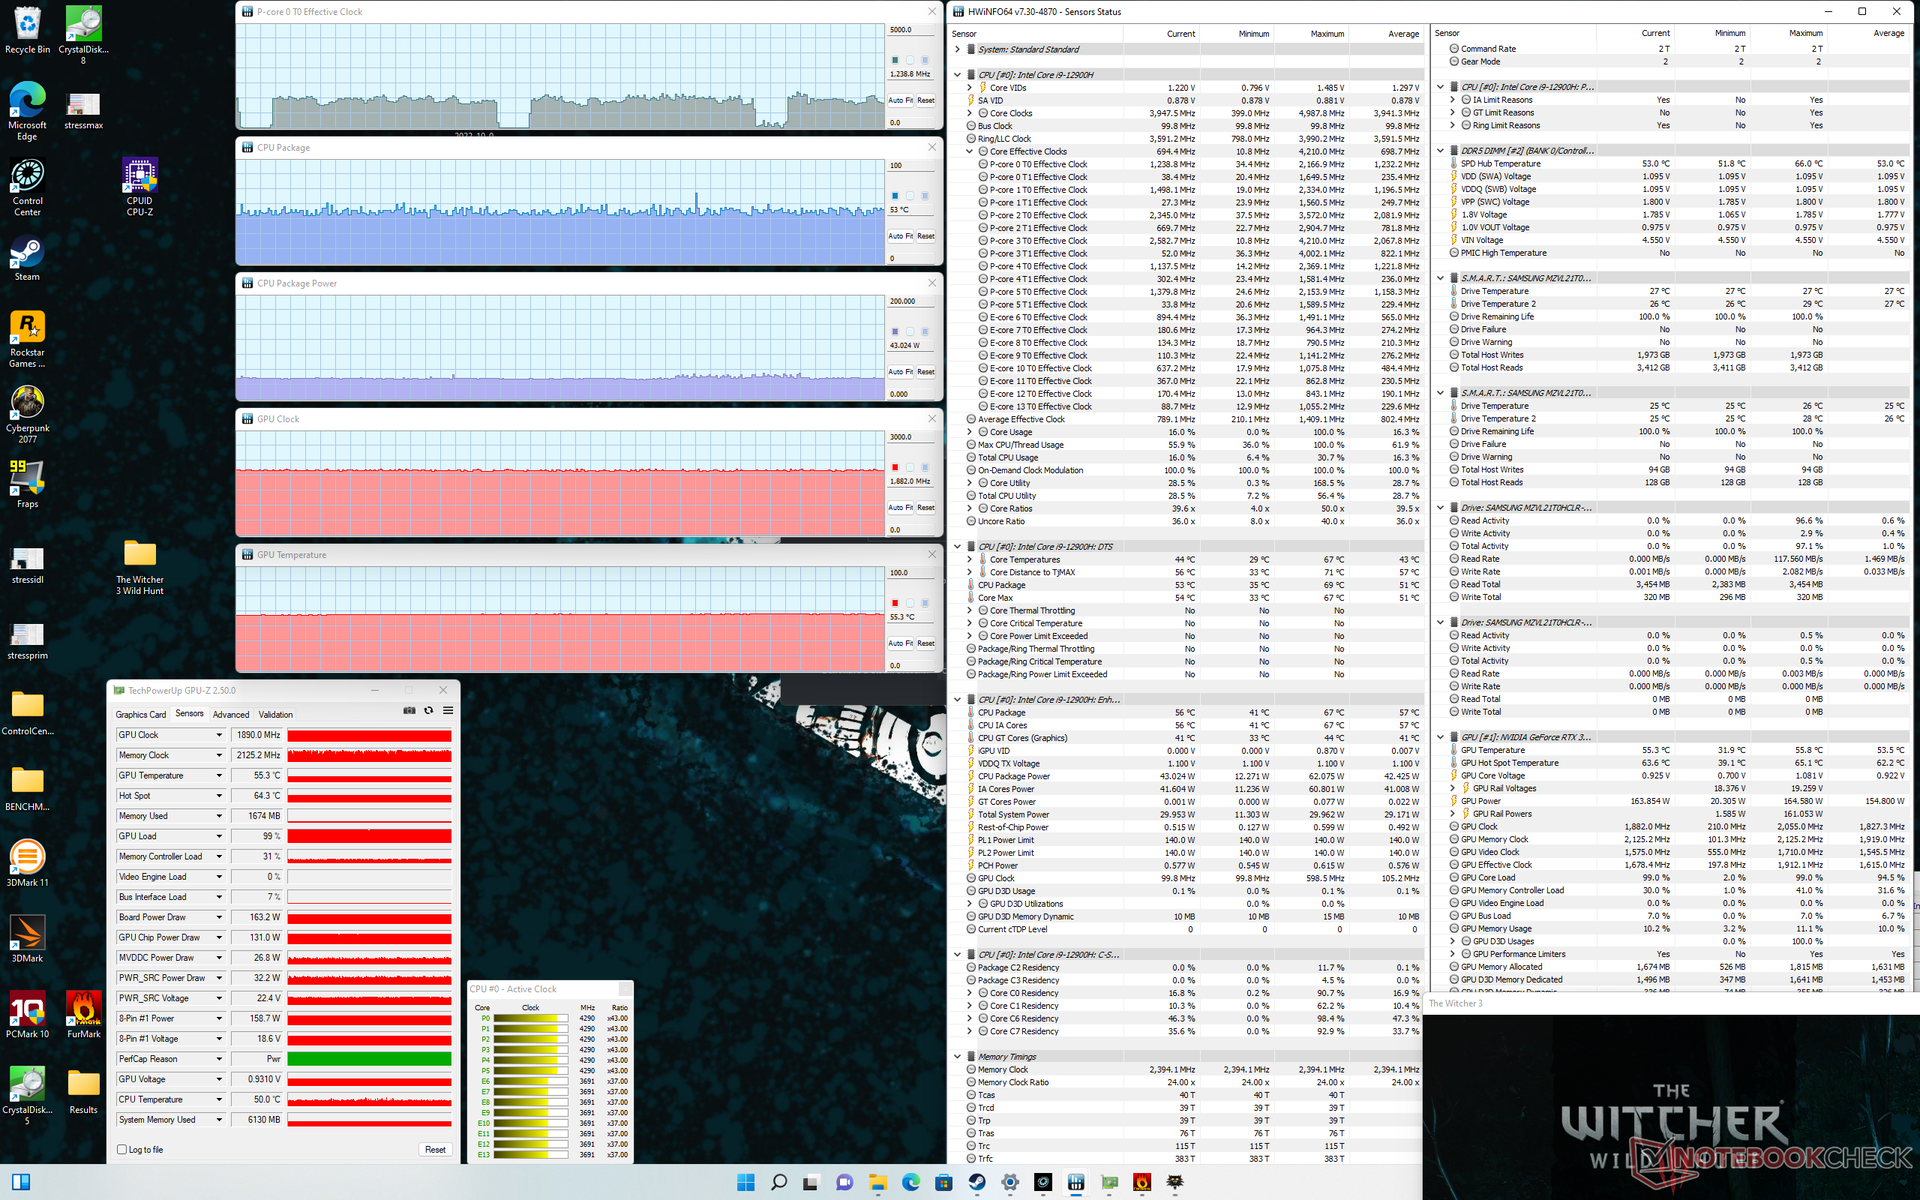
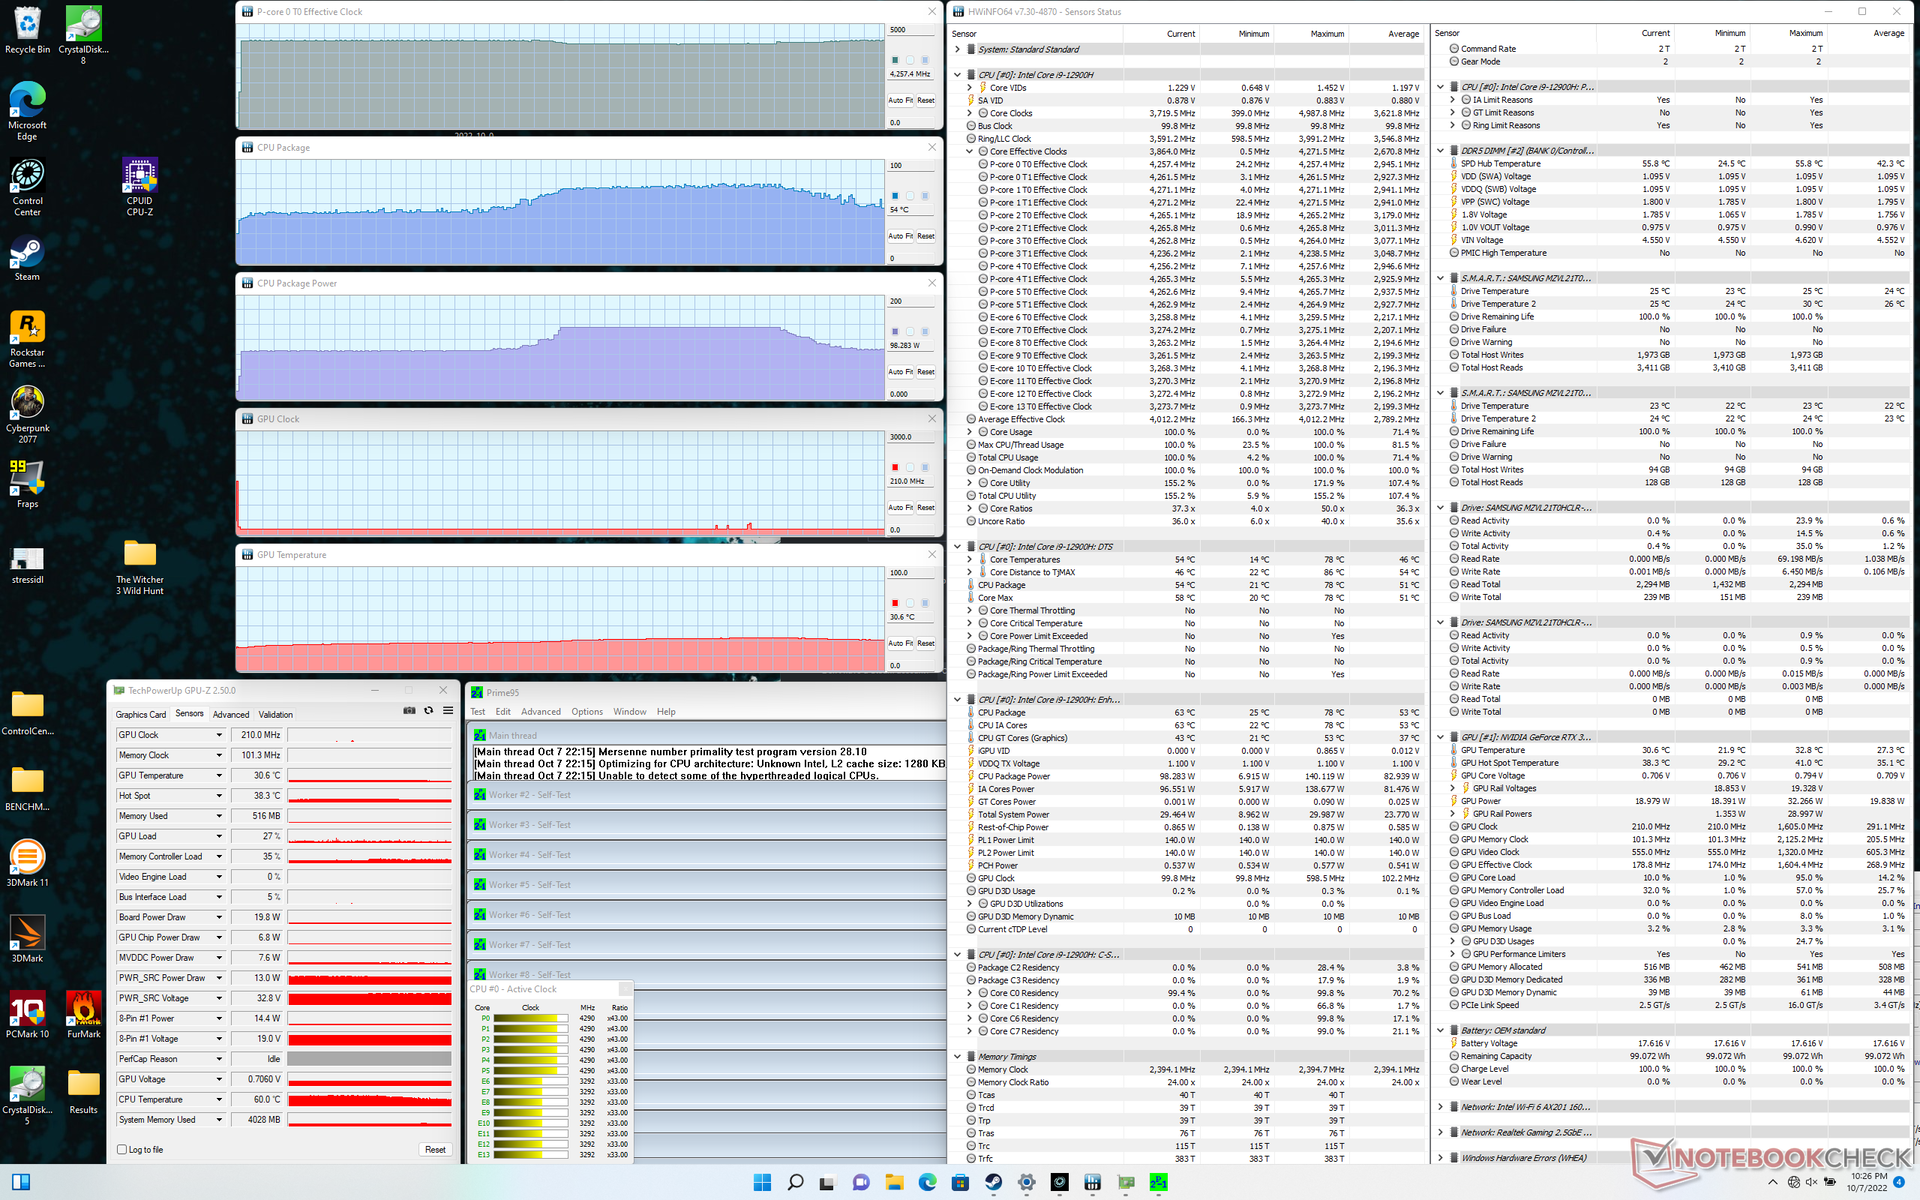
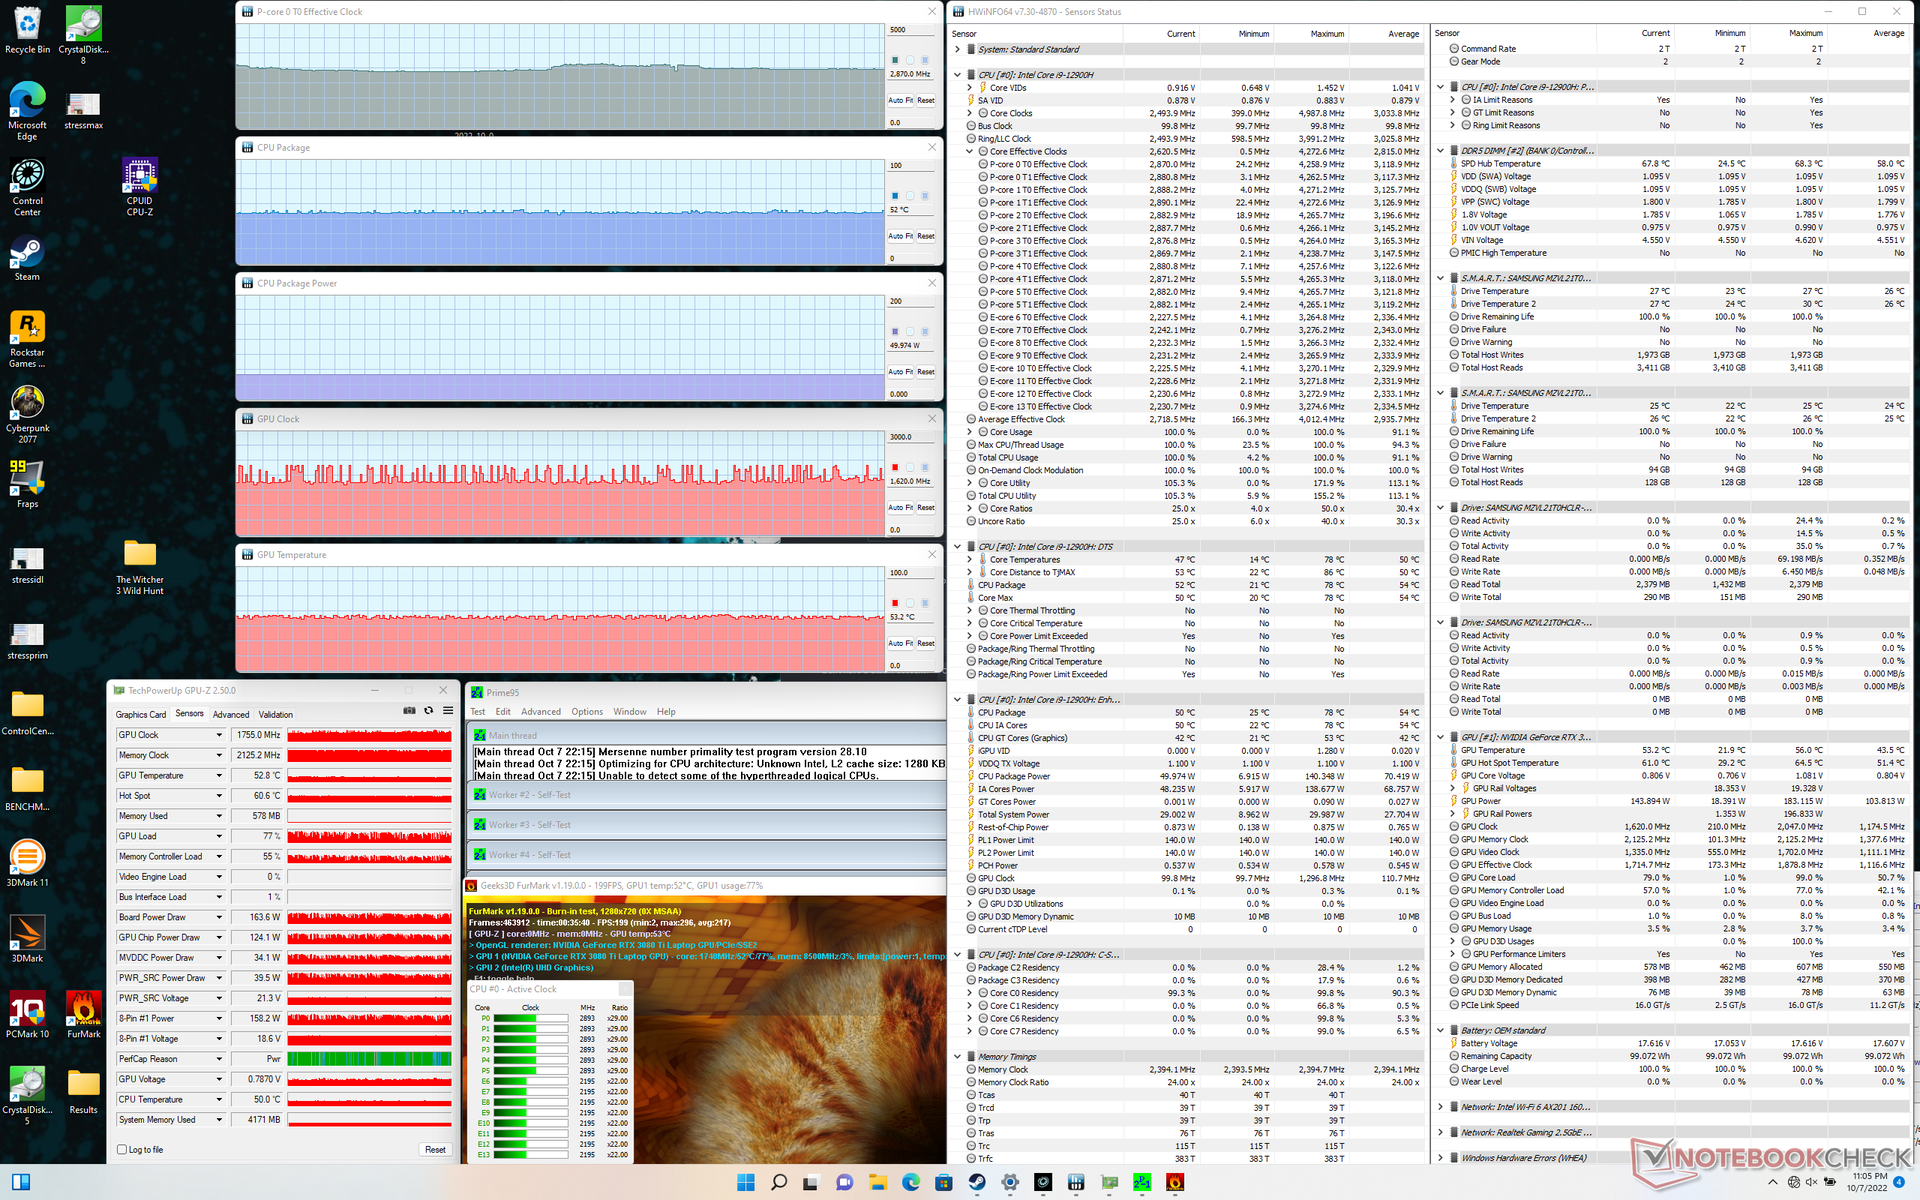
| CPU Clock (GHz) | GPU Clock (MHz) | Average CPU Temperature (°C) | Average GPU Temperature (°C) | |
| System Idle | -- | -- | 22 | 22 |
| Prime95 Stress | 4.3 | -- | 54 | 31 |
| Prime95 + FurMark Stress | 2.9 | ~1755 | 52 | 53 |
| Witcher 3 Stress | ~1.3 | 1890 | 53 | 55 |
Speakers
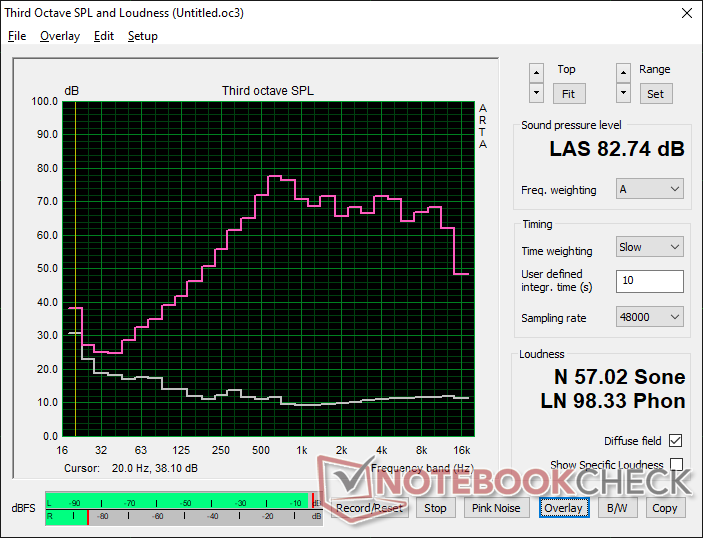
Uniwell Technology GM7AG8N Liquid Cooling Box audio analysis
(+) | speakers can play relatively loud (82.7 dB)
Bass 100 - 315 Hz
(-) | nearly no bass - on average 17.5% lower than median
(±) | linearity of bass is average (8% delta to prev. frequency)
Mids 400 - 2000 Hz
(±) | higher mids - on average 5% higher than median
(±) | linearity of mids is average (7.8% delta to prev. frequency)
Highs 2 - 16 kHz
(+) | balanced highs - only 2.2% away from median
(+) | highs are linear (5.5% delta to prev. frequency)
Overall 100 - 16.000 Hz
(±) | linearity of overall sound is average (15.1% difference to median)
Compared to same class
» 32% of all tested devices in this class were better, 6% similar, 62% worse
» The best had a delta of 6%, average was 18%, worst was 132%
Compared to all devices tested
» 19% of all tested devices were better, 4% similar, 76% worse
» The best had a delta of 4%, average was 24%, worst was 134%
Apple MacBook Pro 16 2021 M1 Pro audio analysis
(+) | speakers can play relatively loud (84.7 dB)
Bass 100 - 315 Hz
(+) | good bass - only 3.8% away from median
(+) | bass is linear (5.2% delta to prev. frequency)
Mids 400 - 2000 Hz
(+) | balanced mids - only 1.3% away from median
(+) | mids are linear (2.1% delta to prev. frequency)
Highs 2 - 16 kHz
(+) | balanced highs - only 1.9% away from median
(+) | highs are linear (2.7% delta to prev. frequency)
Overall 100 - 16.000 Hz
(+) | overall sound is linear (4.6% difference to median)
Compared to same class
» 0% of all tested devices in this class were better, 0% similar, 100% worse
» The best had a delta of 5%, average was 18%, worst was 45%
Compared to all devices tested
» 0% of all tested devices were better, 0% similar, 100% worse
» The best had a delta of 4%, average was 24%, worst was 134%
Energy Management
Power Consumption — Yikes!
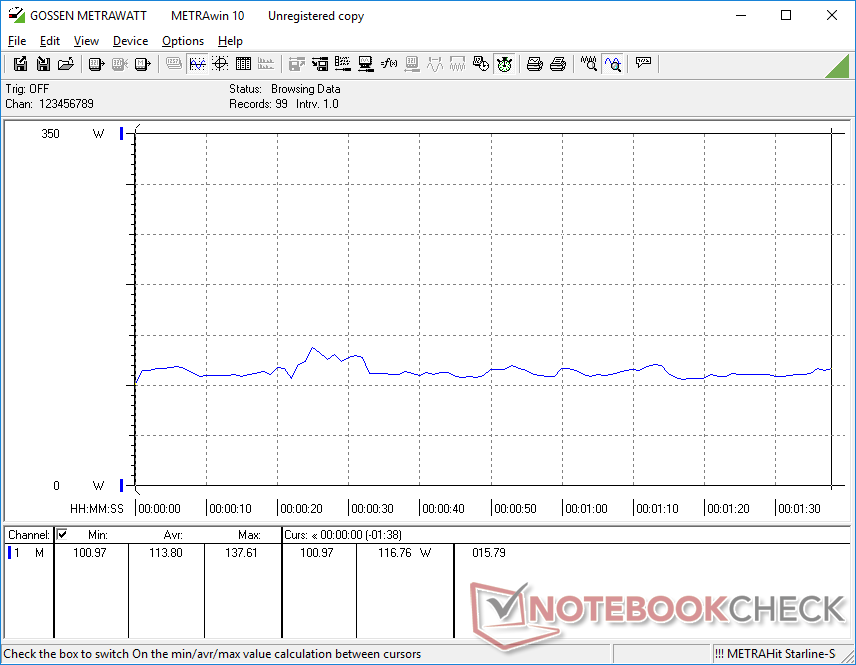
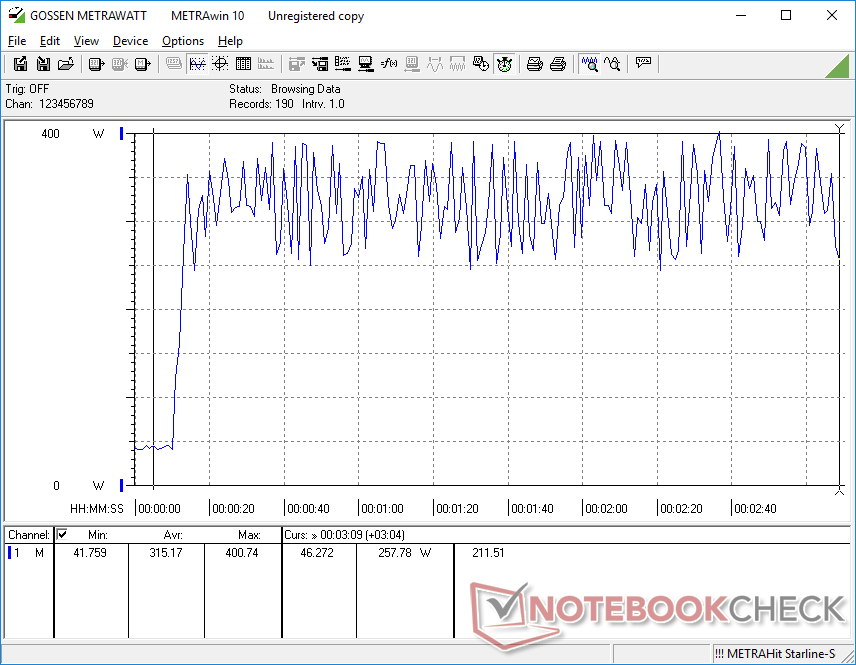
Idling on desktop at the lowest brightness and power profile settings and with the cooling box disconnected draws just 14 W from the outlet. In contrast, idling on desktop at the highest brightness and power profile settings and with the cooing box active would draw almost 44 W compared to ~35 W or less on the Asus ROG Zephyrus S17 or Razer Blade 17. You may want to turn off the cooling box if not in use to save on power bills.
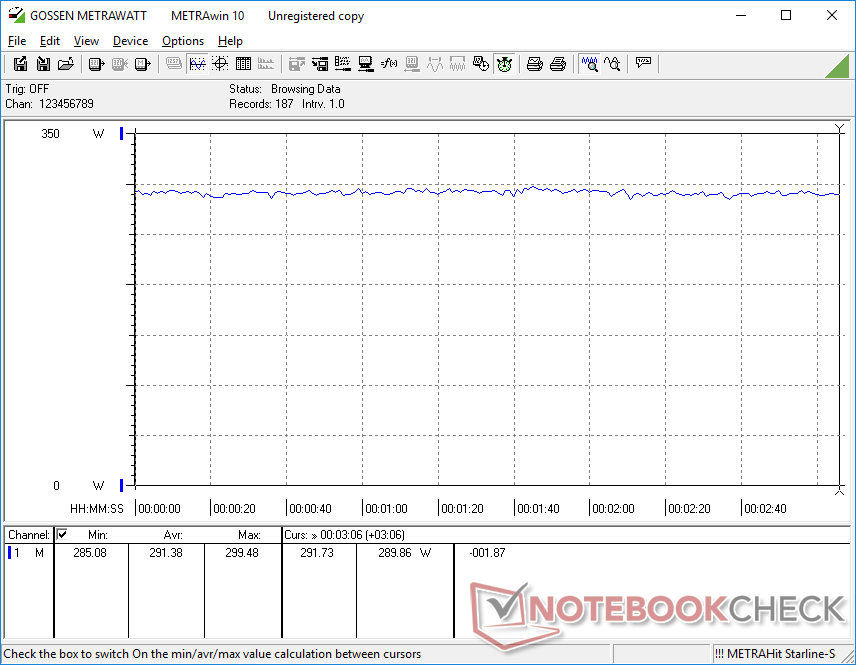
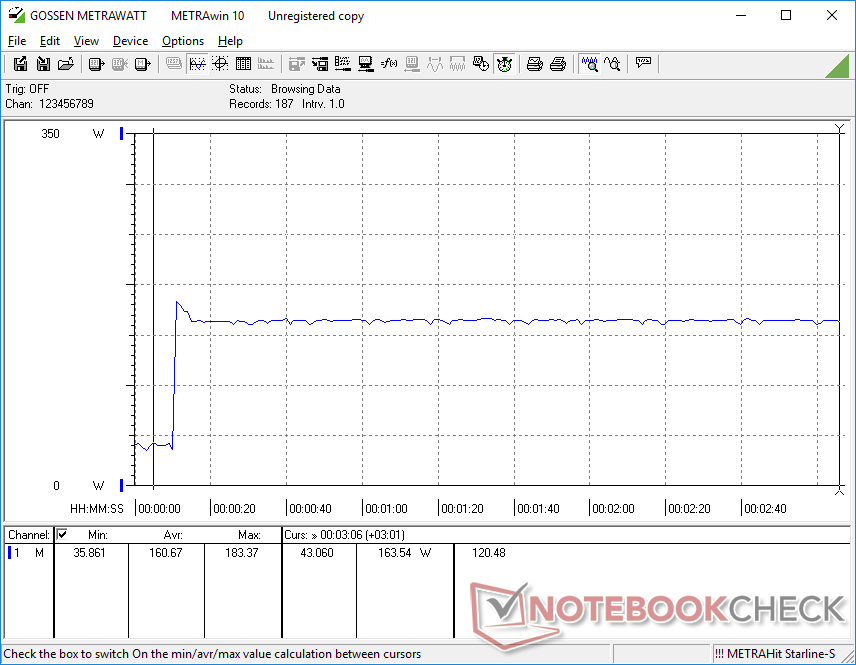
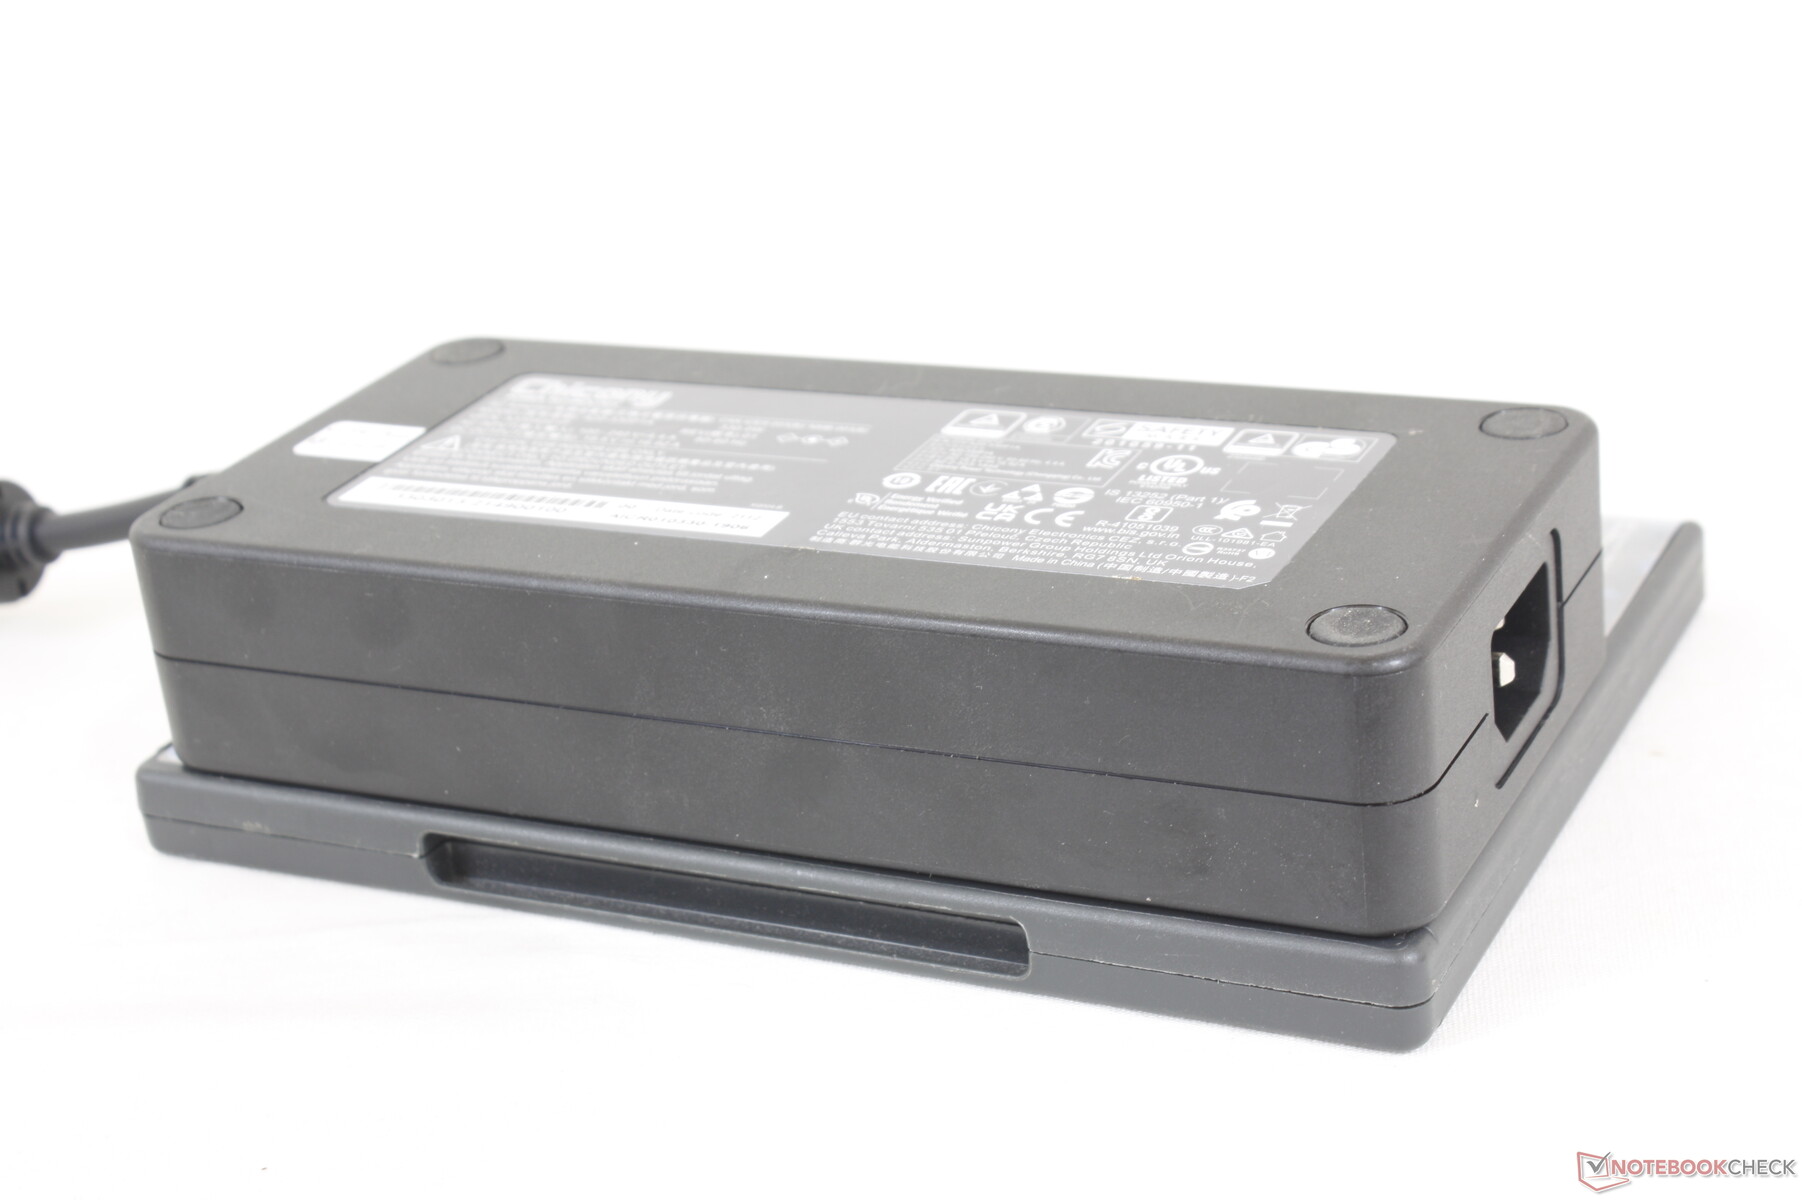
The large AC adapter (~18.5 x 8.5 x 3.5 cm) is rated for 330 W. Running Witcher 3 already draws 291 W to be significantly more than most other laptops including even the massive MSI Titan GT77 by almost 15 percent. If the CPU and GPU are each at 100 percent utilization, power consumption can cycle between 250 W and 400 W as shown by our graphs below. The included 330 W AC adapter is sufficient for gaming purposes, but more power is evidently needed if you intend on running both the CPU and GPU at their respective maximums.
| Off / Standby | |
| Idle | |
| Load |
|
Key:
min: | |
| Uniwell Technology GM7AG8N Liquid Cooling Box i9-12900H, GeForce RTX 3080 Ti Laptop GPU, Samsung PM9A1 MZVL21T0HCLR, IPS, 2560x1600, 17" | MSI Titan GT77 12UHS i9-12900HX, GeForce RTX 3080 Ti Laptop GPU, Samsung PM9A1 MZVL21T0HCLR, IPS-Level, 1920x1080, 17.3" | Aorus 17X XES i9-12900HX, GeForce RTX 3070 Ti Laptop GPU, Gigabyte AG470S1TB-SI B10, IPS, 1920x1080, 17.3" | Razer Blade 17 Early 2022 i9-12900H, GeForce RTX 3080 Ti Laptop GPU, Samsung PM9A1 MZVL21T0HCLR, IPS, 3840x2160, 17.3" | MSI Stealth GS77 12UHS-083US i7-12700H, GeForce RTX 3080 Ti Laptop GPU, Micron 3400 1TB MTFDKBA1T0TFH, IPS, 2560x1440, 17.3" | Asus ROG Zephyrus S17 GX703HSD i9-11900H, GeForce RTX 3080 Laptop GPU, Samsung PM9A1 MZVL22T0HBLB, IPS, 2560x1440, 17.3" | |
|---|---|---|---|---|---|---|
| Power Consumption | -10% | 5% | 15% | 22% | 14% | |
| Idle Minimum * | 13.7 | 30.21 -121% | 18 -31% | 17 -24% | 20 -46% | 21.7 -58% |
| Idle Average * | 38 | 32.42 15% | 28 26% | 23 39% | 21.4 44% | 27 29% |
| Idle Maximum * | 43.4 | 33.7 22% | 36 17% | 34 22% | 27 38% | 33 24% |
| Load Average * | 113.8 | 125.09 -10% | 153 -34% | 120 -5% | 100.5 12% | 108 5% |
| Witcher 3 ultra * | 291 | 256 12% | 221 24% | 229 21% | 165 43% | 195 33% |
| Load Maximum * | 400.8 | 321.88 20% | 290 28% | 243 39% | 247.1 38% | 210 48% |
* ... smaller is better
Power Consumption Witcher 3 / Stresstest
Power Consumption external Monitor
Battery Life — Actually Not Bad
Battery capacity is similar to the MSI Stealth GS77 at 99 Wh. Overall runtimes are similar to the MSI GT77 despite their size differences.
USB-PD is not supported and so the laptop cannot be charged via USB-C.
| Uniwell Technology GM7AG8N Liquid Cooling Box i9-12900H, GeForce RTX 3080 Ti Laptop GPU, 99 Wh | MSI Titan GT77 12UHS i9-12900HX, GeForce RTX 3080 Ti Laptop GPU, 99.9 Wh | Aorus 17X XES i9-12900HX, GeForce RTX 3070 Ti Laptop GPU, 99 Wh | Razer Blade 17 Early 2022 i9-12900H, GeForce RTX 3080 Ti Laptop GPU, 82 Wh | MSI Stealth GS77 12UHS-083US i7-12700H, GeForce RTX 3080 Ti Laptop GPU, 99 Wh | Asus ROG Zephyrus S17 GX703HSD i9-11900H, GeForce RTX 3080 Laptop GPU, 90 Wh | |
|---|---|---|---|---|---|---|
| Battery Runtime | -8% | -23% | -19% | 0% | 38% | |
| Reader / Idle | 521 | 428 -18% | 647 24% | |||
| WiFi v1.3 | 418 | 412.1 -1% | 266 -36% | 229 -45% | 369 -12% | 449 7% |
| Load | 96 | 82 -15% | 86 -10% | 103 7% | 84 -12% | 162 69% |
| H.264 | 433 | 226 | 290 | 430 | ||
| Witcher 3 ultra | 90 | 62 |
Pros
Cons
Verdict — It Really Works
An external water pump is a crazy solution for cooling a gaming laptop. Not only is it clunky with its cables and tubes, but it also makes transporting a huge hassle. It essentially anchors the laptop to the desk and discourages travel even more so than an eGPU docking station.
The liquid cooling box is for a relatively small enthusiast laptop market, but its performance and relatively low noise are nonetheless impressive and better than expected. It faces steep challenges against the rising eGPU market, however.
The results, however, are difficult to ignore. Overall performance is faster than most other laptops equipped with the same Core i9-12900H CPU and RTX 3080 Ti GPU even when the Uniwill and cooling box are set to their lowest fan settings. It's able to run noticeably quieter than traditional gaming laptops without needing to throttle performance which is not something we can say for almost any other gaming laptop out there.
Results are equally impressive when the system is set to its maximum fan settings. The stable core temperatures of just around 55 C is over 30 C cooler than on most ultrathin gaming laptops to be the lowest recorded temperature we've seen for the category. This leaves a lot of overclocking headroom for enthusiasts if they are willing to tolerate the louder fan noise.
Price and Availability
The Uniwill GM7AG8N and liquid cooling box are not yet widely available for purchase.
Uniwell Technology GM7AG8N Liquid Cooling Box
- 10/13/2022 v7 (old)
Allen Ngo


Price comparison
