Notebookcheck Logo

AMD Ryzen 9 7950X3D vs Qualcomm Snapdragon 660 vs AMD Ryzen 9 7900X

AMD Ryzen 9 7950X3D

► remove from comparison AMD R9 7950X3D

The AMD Ryzen 9 7950X3D is a high-end desktop processor of the Raphael series with 16 cores and SMT (Simultaneous Multithreading), which means it can process up to 32 threads simultaneously. With the release in February 2023, the Ryzen 9 7950X3D is AMD's fastest consumer processor and the new top model of the 7000 series. The CPU cores clock from 4.2 GHz (base clock) up to 5.7 GHz (single core Turbo). In addition, the AMD Ryzen 9 7950X3D has a CCD with 8 cores that can access the fast 3D V-cache, which offers considerably more gaming performance.

The performance of the AMD Ryzen 9 7950X3D is consistently excellent in all applications tested. In addition, AMD was again able to increase the single-thread performance compared to the non-X3D models. Nevertheless, the lower base clock compared to the AMD Ryzen 9 7950X means that a small drop in multi-thread performance has to be accepted.

The internal structure of the processor is comparable to the previous AMD Ryzen 9 7950X. The AMD Ryzen 9 7950X3D is also still based on the chiplet design consisting of two CCD clusters with 8 cores each. However, the two CCDs differ significantly from each other because one offers the fast 3D V-Cache, which primarily improves gaming performance. In testing, the AMD Ryzen 9 7950X3D was able to put the Intel Core i9-13900K in second place and is the fastest gaming CPU on the market at the time of testing. 

The AMD Ryzen 9 7950X3D is an extremely energy-efficient CPU with up to 162 watts (PPT) and is significantly more frugal under load than an AMD Ryzen 9 7950X (max. 230 watts).

Qualcomm Snapdragon 660

► remove from comparison Qualcomm SD 660

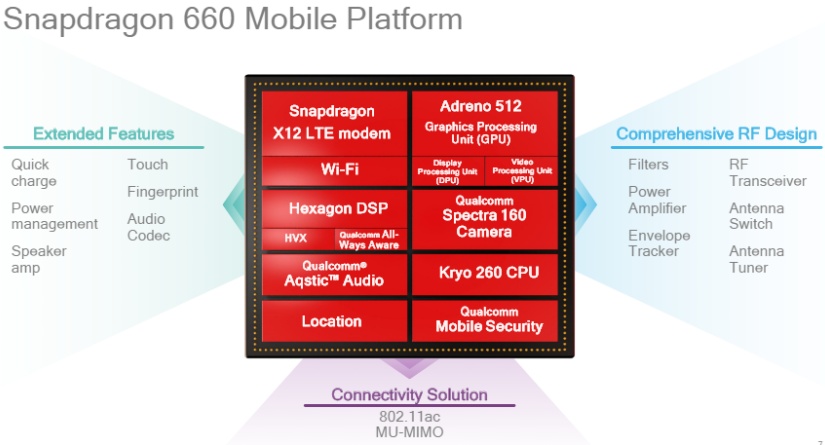
The Qualcomm Snapdragon 660 (SD660) is a fast mid-range ARM-based SoC largely found on Android tablets and smartphones. Announced in mid 2017, the SD660 is the successor to the Snapdragon 625. It features 8 Kryo 260 cores (custom design, 64-Bit capable) that are divided in two clusters. A fast cluster of four cores with up to 2.2 GHz and a power saving efficiency cluster with up to 1.8 GHz. Both clusters can also used together.

In addition to the 8 CPU cores, the SoC integrates a mid range Adreno 512 GPU with a LPDDR4 memory controller (dual-channel 1866 MHz)  and supports Wi-Fi (802.11ac + MIMO, max. 867 Mbps), Bluetooth 5, and LTE (X12 LTE modem with up to 600 Mbps download and 150 Mbps upload).

Performance

In Benchmarks of the Oppo R11, the CPU part of the Snapdragon SD660 performs between former high end Socs like the Snapdragon 821 in the Pixel XL and the Snapdragon 835. The graphics performance is however much lower, as the Adreno 512 is only a slight upgrade of the older Adreno 510 (due to the higher clock speed).

CPU

The Snapdragon 660 is based on a similar concept as ARM's big.LITTLE, which combines a low power CPU cluster (2x Kyro clocked at up to 1.8 GHz) and a performance CPU cluster (2x Kyro clocked at up to 2.2 GHz). The clock speed of each cluster can be individually adjusted (but not per core) and the lowest clock speed is 310 MHz (unverified).

Power Consumption

Thanks to the new 14 nm process, the energy efficiency has been improved noticeably compared to its 20 nm predecessors.

AMD Ryzen 9 7900X

► remove from comparison AMD R9 7900X

The AMD Ryzen 9 7900X is a fast high-end desktop processor of the Raphael series. It offers 12 cores based on the Zen 4 architecture that supports hyperthreading (24 threads). The cores clock from 4.7 (base) up to 5.7 GHz (single core boost). When all 12 cores are fully loaded, 5.1 GHz is the max. clock speed. The 7900X is the second fastest Ryzen at launch, only bested by the Ryzen 9 7950X with 4 more cores.

The performance of the R9 7900X is clearly better than the old Ryzen 9 5900X thanks to the improved architecture and modern 5nm process. Compared to Intels Raptor Lake Core i9-13700K the single-core performance is slightly lower and the multi-core performance slightly faster. The gaming performance is a bit lower, and is on average only on par with the Core i5-13600K and also lower than the old Ryzen 7 5800X3D.

The Raphael series still uses a chiplet design with two CCD-clusters (each with 8 possible cores) in 5nm and an IO-die (including the memory controller and the Radeon Graphics iGPU) in 6nm.

ModelAMD Ryzen 9 7950X3DQualcomm Snapdragon 660AMD Ryzen 9 7900X
SeriesAMD Raphael (Zen 4, Ryzen 7000)Qualcomm SnapdragonAMD Raphael (Zen 4, Ryzen 7000)
CodenameRaphael (Zen4)Kryo 260Raphael (Zen4)
Series: Raphael (Zen 4, Ryzen 7000) Raphael (Zen4)
AMD Ryzen 9 7950X3D « 4.2 - 5.7 GHz16 / 32 cores128 MB L3
AMD Ryzen 9 7900X4.7 - 5.6 GHz12 / 24 cores64 MB L3
AMD Ryzen 9 79003.7 - 5.4 GHz12 / 24 cores64 MB L3
AMD Ryzen 7 7700X4.5 - 5.4 GHz8 / 16 cores32 MB L3
AMD Ryzen 7 77003.8 - 5.3 GHz8 / 16 cores32 MB L3
AMD Ryzen 7 7800X3D4.2 - 5 GHz8 / 16 cores96 MB L3
AMD Ryzen 5 7600X4.7 - 5.3 GHz6 / 12 cores32 MB L3
AMD Ryzen 5 76003.8 - 5.1 GHz6 / 12 cores32 MB L3
Qualcomm Snapdragon 6652.2 GHz8 / 8 cores Kryo 260
Qualcomm Snapdragon 6621.8 - 2 GHz8 / 8 cores Kryo 260
Qualcomm Snapdragon 660 « 2.2 GHz8 / 8 cores Kryo 260
Qualcomm Snapdragon 6361.8 GHz8 / 8 cores Kryo 260
AMD Ryzen 9 7950X3D4.2 - 5.7 GHz16 / 32 cores128 MB L3
AMD Ryzen 9 7900X « 4.7 - 5.6 GHz12 / 24 cores64 MB L3
AMD Ryzen 9 79003.7 - 5.4 GHz12 / 24 cores64 MB L3
AMD Ryzen 7 7700X4.5 - 5.4 GHz8 / 16 cores32 MB L3
AMD Ryzen 7 77003.8 - 5.3 GHz8 / 16 cores32 MB L3
AMD Ryzen 7 7800X3D4.2 - 5 GHz8 / 16 cores96 MB L3
AMD Ryzen 5 7600X4.7 - 5.3 GHz6 / 12 cores32 MB L3
AMD Ryzen 5 76003.8 - 5.1 GHz6 / 12 cores32 MB L3
Clock4200 - 5700 MHz2200 MHz4700 - 5600 MHz
L1 Cache1 MB768 KB
L2 Cache16 MB12 MB
L3 Cache128 MB64 MB
Cores / Threads16 / 32
16 x 5.7 GHz AMD Zen 4
8 / 812 / 24
TDP120 Watt170 Watt
Transistors13140 MillionCCD: 6,5 Mrd + IOD: 3,4 Mrd Million
5 nm14 nm5 nm (CCD), 6 nm (I/O) nm, 0.650 - 1.475V
Die Size263 mm22x 70 (CCD) mm2 + 122 (I/O) mm2
max. Temp.89 °C95 °C
SocketAM5 (LGA 1718)AM5 (LGA 1718)
FeaturesMMX(+), SSE, SSE2, SSE3, SSSE3, SSE4.1, SSE4.2, SSE4A, x86-64, AMD-V, AES, AVX, AVX2, AVX512F, FMA3, SHA, XFR2, Precision Boost 2Adreno 512 GPU, X12 LTE Modem, Hexagon 680 DSP, Specra ISPMMX(+), SSE, SSE2, SSE3, SSSE3, SSE4.1, SSE4.2, SSE4A, x86-64, AMD-V, AES, AVX, AVX2, AVX512F, FMA3, SHA, Precision Boost 2
iGPUAMD Radeon Graphics (Ryzen 7000) (400 - 2200 MHz)Qualcomm Adreno 512 ( - 850 MHz)AMD Radeon Graphics (Ryzen 7000)
Architecturex86ARMx86
$699 U.S.
Announced
Manufacturerwww.amd.comwww.qualcomm.com

Benchmarks

Performance Rating - CB R15 + R20 + 7-Zip + X265 + Blender + 3DM11 CPU - R9 7950X3D
61.1 pt (85%)
Performance Rating - Geekbench 5.5, PCM Work, Sling Shot Physics, Antutu v8 CPU - SD 660
0.5 pt (40%)
Performance Rating - CB R15 + R20 + 7-Zip + X265 + Blender + 3DM11 CPU - R9 7900X
57.1 pt (79%)
Cinebench R23 - Cinebench R23 Multi Core
36291 Points (34%)
min: 28925     avg: 29289     median: 29300 (27%)     max: 29628 Points
Cinebench R23 - Cinebench R23 Single Core
2053 Points (87%)
min: 2012     avg: 2020     median: 2016.5 (86%)     max: 2039 Points
Cinebench R20 - Cinebench R20 CPU (Single Core)
795 Points (88%)
min: 780     avg: 783     median: 782.5 (87%)     max: 787 Points
Cinebench R20 - Cinebench R20 CPU (Multi Core)
14188 Points (35%)
min: 11353     avg: 11474     median: 11471.5 (28%)     max: 11623 Points
Cinebench R15 - Cinebench R15 CPU Multi 64 Bit
5974 Points (38%)
min: 4753     avg: 4818     median: 4820.5 (30%)     max: 4856 Points
Cinebench R15 - Cinebench R15 CPU Single 64 Bit
326 Points (98%)
min: 319     avg: 322.2     median: 323 (97%)     max: 325 Points
Cinebench R11.5 - Cinebench R11.5 CPU Multi 64 Bit
64.6 Points (84%)
min: 53.91     avg: 54.6     median: 54.7 (71%)     max: 55.26 Points
Cinebench R11.5 - Cinebench R11.5 CPU Single 64 Bit
3.9 Points (96%)
min: 3.78     avg: 3.8     median: 3.8 (95%)     max: 3.85 Points
Cinebench R10 - Cinebench R10 Rend. Single (32bit)
16551 Points (100%)
min: 8465     avg: 8658     median: 8623 (52%)     max: 8858 Points
Cinebench R10 - Cinebench R10 Rend. Multi (32bit)
138015 Points (100%)
min: 67036     avg: 68658     median: 68579.5 (50%)     max: 70741 Points
Cinebench R10 - Cinebench R10 Rend. Multi (64bit)
72361 Points (50%)
min: 121250     avg: 126872     median: 125768 (87%)     max: 134469 Points
Cinebench R10 - Cinebench R10 Rend. Single (64bit)
8853 Points (11%)
min: 16151     avg: 16234     median: 16246 (20%)     max: 16338 Points
wPrime 2.10 - wPrime 2.0 1024m *
33.9 s (0%)
min: 39.576     avg: 40.4     median: 40.3 (0%)     max: 41.122 s
wPrime 2.10 - wPrime 2.0 32m *
2 s (0%)
min: 1.781     avg: 1.8     median: 1.8 (0%)     max: 1.872 s
WinRAR - WinRAR 4.0
15779 Points (25%)
17225 Points (27%)
7-Zip 18.03 - 7-Zip 18.03 Multli Thread 4 runs
159341 MIPS (91%)
min: 124975     avg: 127080     median: 127195 (73%)     max: 129087 MIPS
7-Zip 18.03 - 7-Zip 18.03 Single Thread 4 runs
8321 MIPS (99%)
min: 8252     avg: 8280     median: 8269 (99%)     max: 8345 MIPS
X264 HD Benchmark 4.0 - x264 Pass 2
265.5 fps (93%)
241 fps (84%)
X264 HD Benchmark 4.0 - x264 Pass 1
392.5 fps (91%)
376 fps (87%)
HWBOT x265 Benchmark v2.2 - HWBOT x265 4k Preset
42.4 fps (75%)
min: 36.2     avg: 36.8     median: 36.9 (65%)     max: 37.1 fps
TrueCrypt - TrueCrypt Serpent
2.8 GB/s (0%)
1.5 GB/s (0%)
TrueCrypt - TrueCrypt Twofish
4.2 GB/s (72%)
2.8 GB/s (48%)
TrueCrypt - TrueCrypt AES
26.9 GB/s (70%)
14.8 GB/s (39%)
Blender - Blender 3.3 Classroom CPU *
133 Seconds (2%)
min: 165     avg: 166.4     median: 166 (2%)     max: 168 Seconds
Blender - Blender 2.79 BMW27 CPU *
86 Seconds (1%)
min: 105     avg: 106.2     median: 106 (1%)     max: 107 Seconds
R Benchmark 2.5 - R Benchmark 2.5 *
0.4 sec (8%)
min: 0.3643     avg: 0.4     median: 0.4 (8%)     max: 0.3758 sec
3DMark 06 - CPU - 3DMark 06 - CPU
20279 Points (43%)
min: 20439     avg: 21223     median: 21284 (45%)     max: 21659 Points
Super Pi mod 1.5 XS 1M - Super Pi mod 1.5 XS 1M *
6.1 s (1%)
6.1 s (1%)
Super Pi mod 1.5 XS 2M - Super Pi mod 1.5 XS 2M *
13.2 s (1%)
13.3 s (1%)
Super Pi Mod 1.5 XS 32M - Super Pi mod 1.5 XS 32M *
305.1 s (1%)
313.4 s (1%)
3DMark Vantage - 3DM Vant. Perf. CPU no Physx
99321 Points (87%)
min: 82063     avg: 100438     median: 102019 (89%)     max: 102765 Points
3DMark 11 - 3DM11 Performance Physics
36991 Points (100%)
min: 26455     avg: 27800     median: 27731 (75%)     max: 28963 Points
3DMark - 3DMark Ice Storm Physics
86389 Points (70%)
min: 96003     avg: 102745     median: 103232 (84%)     max: 105350 Points
3DMark - 3DMark Ice Storm Extreme Physics
86306 Points (70%)
min: 97281     avg: 102964     median: 103220 (84%)     max: 106230 Points
3DMark - 3DMark Ice Storm Unlimited Physics
87725 Points (74%)
min: 15088     avg: 19093     median: 19488.5 (16%)     max: 21016 Points
min: 94657     avg: 102993     median: 101826 (86%)     max: 108551 Points
3DMark - 3DMark Cloud Gate Physics
26168 Points (66%)
min: 25631     avg: 26260     median: 26310.5 (67%)     max: 26732 Points
3DMark - 3DMark Fire Strike Standard Physics
44787 Points (80%)
min: 40436     avg: 42329     median: 42325 (75%)     max: 43200 Points
3DMark - 3DMark Time Spy CPU
17206 Points (73%)
min: 13634     avg: 15940     median: 15959.5 (67%)     max: 16721 Points
3DMark - 3DMark Sling Shot (ES 3.0) Unlimited Physics
100%
1 SD 660 +
min: 2238     avg: 2695     median: 2752 (31%)     max: 2815 Points
Geekbench 5.5 - Geekbench 5.1 - 5.4 64 Bit Single-Core
2311 Points (98%)
min: 294     avg: 322.8     median: 330.5 (14%)     max: 336 Points
min: 2274     avg: 2290     median: 2294 (97%)     max: 2297 Points
Geekbench 5.5 - Geekbench 5.1 - 5.4 64 Bit Multi-Core
24343 Points (44%)
min: 1304     avg: 1445     median: 1440.5 (3%)     max: 1595 Points
min: 19987     avg: 20553     median: 20667.5 (37%)     max: 20799 Points
Geekbench 5.0 - Geekbench 5.0 64 Bit Single-Core
2183 Points (9%)
min: 313     avg: 321.5     median: 321.5 (1%)     max: 330 Points
min: 2183     avg: 2195     median: 2196 (10%)     max: 2201 Points
Geekbench 5.0 - Geekbench 5.0 64 Bit Multi-Core
23720 Points (75%)
min: 1127     avg: 1305     median: 1305 (4%)     max: 1483 Points
min: 19975     avg: 20532     median: 20658 (65%)     max: 20765 Points
Geekbench 4.4 - Geekbench 4.1 - 4.4 64 Bit Single-Core
9240 Points (92%)
min: 1431     avg: 1598     median: 1617 (16%)     max: 1646 Points
min: 9193     avg: 9260     median: 9275 (93%)     max: 9311 Points
Geekbench 4.4 - Geekbench 4.1 - 4.4 64 Bit Multi-Core
87922 Points (96%)
min: 4895     avg: 5694     median: 5850 (6%)     max: 5913 Points
min: 74731     avg: 76662     median: 77033 (85%)     max: 77769 Points
Geekbench 4.0 - Geekbench 4.0 64 Bit Single-Core
100%
1 SD 660 +
min: 1609     avg: 1628     median: 1628 (22%)     max: 1647 Points
Geekbench 4.0 - Geekbench 4.0 64 Bit Multi-Core
100%
1 SD 660 +
min: 5846     avg: 5860     median: 5859.5 (14%)     max: 5873 Points
Geekbench 2 - 32 Bit - Geekbench Stream
100%
1 SD 660 +
min: 1038     avg: 1079     median: 1079 (9%)     max: 1120 Points
Geekbench 2 - 32 Bit - Geekbench Memory
100%
1 SD 660 +
min: 2981     avg: 2996     median: 2995.5 (27%)     max: 3010 Points
Geekbench 2 - 32 Bit - Geekbench Floating Point
100%
1 SD 660 +
min: 9892     avg: 10223     median: 10223 (20%)     max: 10554 Points
Geekbench 2 - 32 Bit - Geekbench Integer
100%
1 SD 660 +
min: 5295     avg: 5302     median: 5301.5 (11%)     max: 5308 Points
Geekbench 2 - 32 Bit - Geekbench Total Score
100%
1 SD 660 +
min: 6031     avg: 6141     median: 6141 (16%)     max: 6251 Points
Mozilla Kraken 1.1 - Kraken 1.1 Total Score *
437 ms (1%)
min: 3796     avg: 4115     median: 3954 (5%)     max: 4769 ms
min: 431     avg: 438     median: 440 (1%)     max: 441 ms
Sunspider - Sunspider 1.0 Total Score *
100%
1 SD 660 +
630 ms (7%)
Octane V2 - Octane V2 Total Score
100%
1 SD 660 +
min: 8463     avg: 9973     median: 10070 (9%)     max: 10945 Points
WebXPRT 4 - WebXPRT 4 Score
313 Points (90%)
min: 300     avg: 305.8     median: 304.5 (88%)     max: 314 Points
WebXPRT 3 - WebXPRT 3 Score
383 Points (80%)
min: 47     avg: 57.1     median: 59 (12%)     max: 63 Points
min: 371     avg: 383.8     median: 383 (80%)     max: 395 Points
AnTuTu v6 - AnTuTu v6 Total Score
100%
1 SD 660 +
min: 105973     avg: 116194     median: 117165 (40%)     max: 120479 Points
AnTuTu v7 - AnTuTu v7 MEM
100%
1 SD 660 +
min: 6301     avg: 7335     median: 7220.5 (22%)     max: 8424 Points
AnTuTu v7 - AnTuTu v7 UX
100%
1 SD 660 +
min: 33509     avg: 37799     median: 38669.5 (47%)     max: 39182 Points
AnTuTu v7 - AnTuTu v7 GPU
100%
1 SD 660 +
min: 21675     avg: 28666     median: 30372.5 (9%)     max: 30829 Points
AnTuTu v7 - AnTuTu v7 CPU
100%
1 SD 660 +
min: 48764     avg: 63355     median: 64877.5 (40%)     max: 66862 Points
AnTuTu v7 - AnTuTu v7 Total Score
100%
1 SD 660 +
min: 116346     avg: 137699     median: 140898 (25%)     max: 143551 Points
AnTuTu v8 - AnTuTu v8 UX
100%
1 SD 660 +
min: 26647     avg: 30836     median: 32596 (27%)     max: 33266 Points
AnTuTu v8 - AnTuTu v8 MEM
100%
1 SD 660 +
min: 28919     avg: 31931     median: 32883 (27%)     max: 33992 Points
AnTuTu v8 - AnTuTu v8 GPU
100%
1 SD 660 +
min: 33505     avg: 36822     median: 35936 (7%)     max: 41026 Points
AnTuTu v8 - AnTuTu v8 CPU
100%
1 SD 660 +
min: 62411     avg: 68266     median: 66442 (24%)     max: 75946 Points
AnTuTu v8 - AnTuTu v8 Total Score
100%
1 SD 660 +
min: 157877     avg: 167856     median: 161462 (16%)     max: 184230 Points
AndEBench - AndEBench Java
100%
1 SD 660 +
3240 Iter./s (100%)
AndEBench - AndEBench Native
100%
1 SD 660 +
28882 Iter./s (95%)
PassMark PerformanceTest Mobile V1 - PerformanceTest Mobile V1 CPU Tests
100%
1 SD 660 +
min: 2487     avg: 125771     median: 186416 (25%)     max: 188411 Points
PCMark for Android - PCM f. Android Work Score 3.0
100%
1 SD 660 +
6514 Points (30%)
PCMark for Android - PCM f. Android Computer Vision
100%
1 SD 660 +
min: 3032     avg: 3285     median: 3363 (18%)     max: 3486 Points
PCMark for Android - PCM f. Android Storage
100%
1 SD 660 +
min: 2889     avg: 4395     median: 4250 (9%)     max: 5913 Points
PCMark for Android - PCM f. Android Work Score 2.0
100%
1 SD 660 +
min: 5789     avg: 6050     median: 6052 (40%)     max: 6426 Points
PCMark for Android - PCM f. Android Work Score
100%
1 SD 660 +
min: 6274     avg: 6676     median: 6723 (34%)     max: 7026 Points
CrossMark - CrossMark Overall
2193 Points (84%)
min: 2315     avg: 2370     median: 2370 (91%)     max: 2408 Points
Power Consumption - Prime95 Power Consumption - external Monitor *
276 Watt (48%)
319 Watt (55%)
Power Consumption - Cinebench R15 Multi Power Consumption - external Monitor *
273 Watt (50%)
313 Watt (57%)
Power Consumption - Idle Power Consumption - external Monitor *
118.4 Watt (78%)
94.1 Watt (62%)
Power Consumption - Cinebench R15 Multi Power Efficiency - external Monitor
21.9 Points per Watt (16%)
15.5 Points per Watt (12%)

Average Benchmarks AMD Ryzen 9 7950X3D → 100% n=9

Average Benchmarks Qualcomm Snapdragon 660 → 22% n=9

Average Benchmarks AMD Ryzen 9 7900X → 97% n=9

- Range of benchmark values for this graphics card
- Average benchmark values for this graphics card
* Smaller numbers mean a higher performance
1 This benchmark is not used for the average calculation

v1.26
log 01. 04:58:09

#0 checking url part for id 15000 +0s ... 0s

#1 checking url part for id 9944 +0s ... 0s

#2 checking url part for id 14608 +0s ... 0s

#3 not redirecting to Ajax server +0s ... 0s

#4 did not recreate cache, as it is less than 5 days old! Created at Fri, 31 May 2024 05:40:08 +0200 +0.001s ... 0.001s

#5 composed specs +0.031s ... 0.032s

#6 did output specs +0s ... 0.032s

#7 getting avg benchmarks for device 15000 +0.017s ... 0.049s

#8 got single benchmarks 15000 +0.012s ... 0.061s

#9 getting avg benchmarks for device 9944 +0.017s ... 0.078s

#10 got single benchmarks 9944 +0.049s ... 0.127s

#11 getting avg benchmarks for device 14608 +0.016s ... 0.143s

#12 got single benchmarks 14608 +0.055s ... 0.198s

#13 got avg benchmarks for devices +0s ... 0.198s

#14 min, max, avg, median took s +0.545s ... 0.743s

#15 return log +0s ... 0.743s

Please share our article, every link counts!
> Expert Reviews and News on Laptops, Smartphones and Tech Innovations > Benchmarks / Tech > Processor Comparison - Head 2 Head
Redaktion, 2017-09- 8 (Update: 2023-07- 1)