Notebookcheck Logo

AMD Ryzen 7 9800X3D vs AMD Ryzen AI Max+ 395

AMD Ryzen 7 9800X3D

► remove from comparison AMD R7 9800X3D

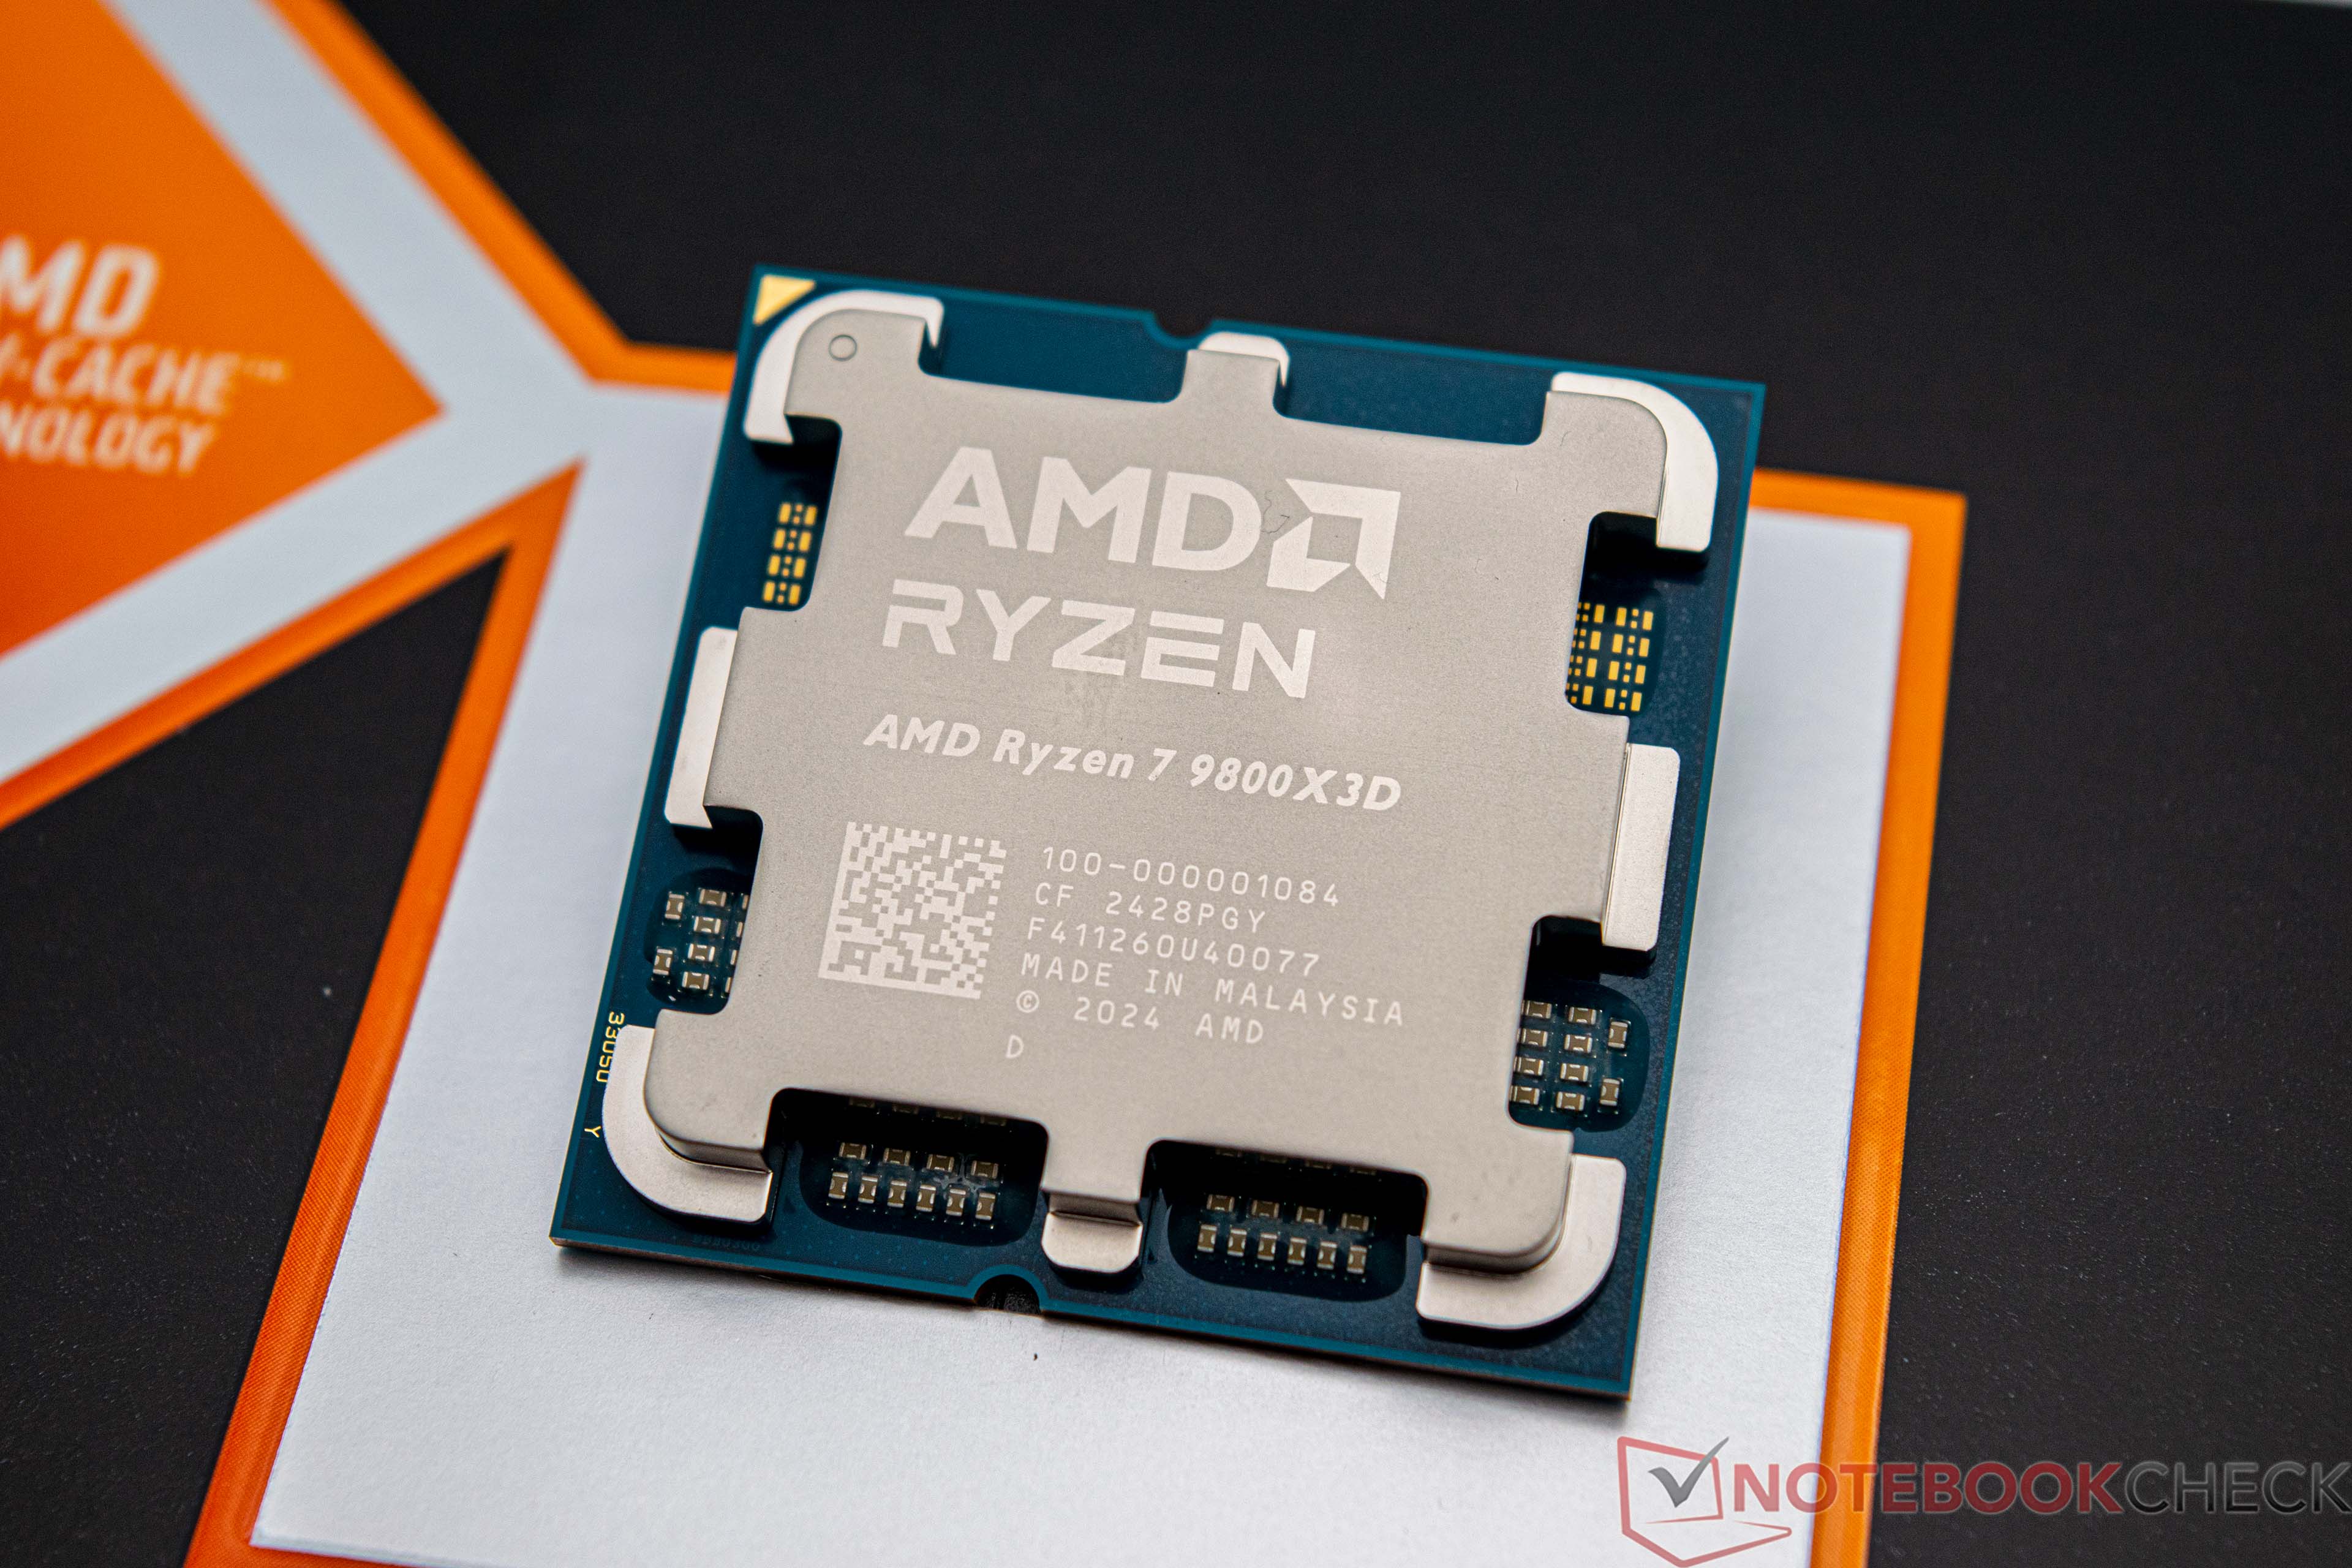
Der AMD Ryzen 7 9800X3D ist ein High-End-Prozessor, der speziell für Gamer und anspruchsvolle Anwender entwickelt wurde. Er basiert auf der neuesten Zen-5-Architektur von AMD und wird im fortschrittlichen 4-nm-Verfahren gefertigt, was nicht nur höhere Effizienz, sondern auch eine bessere Leistung ermöglicht. Mit seinen 8 Kernen und 16 Threads bietet der 9800X3D eine solide Basis für rechenintensive Anwendungen.

Der größte Vorteil des AMD Ryzen 7 9800X3D ist die 3D V-Cache-Technologie, die komplett überarbeitet wurde und sich signifikant von den Modellen der 7000er-Serie unterscheidet. Die Änderungen resultieren in einer deutlich gesteigerten Taktfrequenz und einer besseren Wärmeverteilung. Der interne Aufbau besteht weiterhin aus einem I/O-Die sowie einem CCD. Letzterer beinhaltet die 8 Kerne sowie den 3D V-Cache und wird im 4nm-Prozess hergestellt. Beim I/O-Die hält AMD weiterhin am 6nm-Herstellungsprozess fest. Die Taktraten steigen im Vergleich zum Vorgängermodell spürbar. So beträgt der Basistakt 4,7 GH/z, wenngleich im Turbo bis zu 5,2 GH/s möglich sind.

Neben der überragenden Gaming-Performance überzeugt der AMD Ryzen 7 9800X3D auch in produktiven Anwendungen. Während er speziell auf Spieleoptimierung ausgelegt ist, schneidet er in Anwendungen wie 3D-Modellierung, Videobearbeitung und anderen kreativen Workloads spürbar besser ab als ein AMD Ryzen 7 7800X3D.

Die Leistungsaufnahme des AMD Ryzen 7 9800X3D beträgt 120 Watt, welche als PPT maximal 162 Watt beträgt. Damit gibt es in diesem Punkt keine Änderungen im Vergleich zum AMD Ryzen 7 7800X3D. Aufgrund gesteigerter Leistung kann die Effizienz des AMD Ryzen 7 9800X3D spürbar gesteigert werden. An die Effizienz der Arrow-Lake-Prozessoren kommt AMD allerdings trotz deutlich besserer Gaming-Leistung nicht heran.

Hier geht es zu unserem Test des AMD Ryzen 7 9800X3D.

AMD Ryzen AI Max+ 395

► remove from comparison AMD Ryzen AI Max+ 395

The AMD Ryzen AI Max+ 395 is a powerful Strix Halo family processor that debuted in January 2025. The APU comes with 16 Zen 5 CPU cores running at up to 5.1 GHz, the 40 CU RDNA 3+ Radeon 8060S graphics adapter and the 50 TOPS XDNA 2 neural engine. Other noteworthy features include PCIe 4, USB 4 and LPDDR5x-8000 RAM support and a whole lot of L3 cache.

Architecture and Features

Unlike Strix Point, Strix Halo parts are powered by Zen 5 cores - no Zen 5c here. It's not clear if this is the desktop Zen 5 implementation with full AVX512 throughput or the mobile one. According to AMD, Zen 5 delivers a 16% IPC improvement over Zen 4 thanks to branch prediction improvements and other refinements.

Elsewhere, the AI Max+ chip supports RAM as fast as LPDDR5x-8000, and is natively compatible with USB 4 (and therefore Thunderbolt). It has PCIe 4.0 support for a throughput of 1.9 GB/s per lane, just like its 8000 series predecessors had. The integrated XDNA 2 NPU delivers up to 50 INT8 TOPS for accelerating various AI workloads.

Performance

From leaks, we know that the Ryzen delivers around 20,700 Geekbench 6.3 Multi points, meaning it trades blow with very powerful desktop CPUs like the Ryzen 9 9900X.

Graphics

The Radeon 8060S is the most powerful iGPU that AMD has on offer, as of Jan 2025. It features 40 RDNA 3+ architecture CUs (2560 unified shaders) that could see it outcompeting lower mid-range desktop graphics cards like the GeForce RTX 4050. This GPU will undoubtedly run any game at 1080p on Ultra, however, the ultimate question is whether or not the cooling solution of the laptop will be powerful enough to let the iGPU shine.

Naturally, the Radeon is capable of driving four SUHD 4320p60 monitors. It can also efficiently encode and decode the most popular video codecs including AVC, HEVC, VP9 and AV1. The latest addition to that list, the VVC codec, is not supported unlike it is with Intel Lunar Lake chips.

Power consumption

The AI Max+ 395 can eat up to 120 W depending on the system and its TDP power targets, with 45 W named as the minimum TDP.

The 4 nm TSMC process that the CPU cores are built with make for decent, as of Jan 2025, energy efficiency.

ModelAMD Ryzen 7 9800X3DAMD Ryzen AI Max+ 395
CodenameGranite RidgeStrix Halo
SeriesAMD Granite Ridge (Zen 5, AM5)AMD Strix Halo/Point (Zen 5/5c, Ryzen AI 300)
Series: Strix Halo/Point (Zen 5/5c, Ryzen AI 300) Strix Halo
AMD Ryzen 9 9950X3D compare4.3 - 5.7 GHz16 / 32 cores128 MB L3
AMD Ryzen 9 9950X compare4.3 - 5.7 GHz16 / 32 cores64 MB L3
AMD Ryzen 9 9900X compare4.4 - 5.6 GHz12 / 24 cores64 MB L3
AMD Ryzen 7 9700X compare3.8 - 5.5 GHz8 / 16 cores32 MB L3
AMD Ryzen 7 9800X3D « 4.7 - 5.2 GHz8 / 16 cores96 MB L3
AMD Ryzen 5 9600X compare3.9 - 5.4 GHz6 / 12 cores32 MB L3
AMD Ryzen AI Max+ 395 « 3 - 5.1 GHz16 / 32 cores64 MB L3
AMD Ryzen AI Max 390 compare3.2 - 5 GHz12 / 24 cores64 MB L3
AMD Ryzen AI Max 385 compare3.6 - 5 GHz8 / 16 cores32 MB L3
Clock4700 - 5200 MHz3000 - 5100 MHz
L1 Cache640 KB
L2 Cache8 MB16 MB
L3 Cache96 MB64 MB
Cores / Threads8 / 16
8 x 5.2 GHz AMD Zen 5
16 / 32
16 x 5.1 GHz AMD Zen 5
TDP120 Watt55 Watt
TDP Turbo PL2162 Watt
Transistors9970 Million
Technology4 nm4 nm
Voltage1.28 - 1.31 (nominal), 1.4 (max) V
Die Size192.6 mm2
max. Temp.95 °C
SocketAM5 (LGA 1718)FP11
FeaturesDDR5-5600 RAM (incl. ECC), PCIe 5, MMX, SSE, SSE2, SSE3, SSSE3, SSE4.1, SSE4.2, SSE4A, AES, AVX, AVX2, AVX512, BMI1, BMI2, F16C, FMA3, EVP, SMAP, SMEP, SMT, SHA, XFR2LPDDR5x-8000 RAM, PCIe 4, USB 4, XDNA 2 NPU (50 TOPS), SMT, AES, AVX, AVX2, AVX512, FMA3, MMX (+), SHA, SSE, SSE2, SSE3, SSSE3, SSE4.1, SSE4.2, SSE4A
iGPUAMD Radeon 610M ( - 2200 MHz)AMD Radeon RX 8060S ( - 2900 MHz)
Architecturex86x86
$479 U.S.
Announced
Manufacturerwww.amd.comwww.amd.com

Benchmarks

Performance Rating - CB R15 + R20 + 7-Zip + X265 + Blender + 3DM11 CPU - R7 9800X3D
47.3 pt (79%)
Restrict / Search: Model: Max. age: years
Performance Rating - CB R15 + R20 + 7-Zip + X265 + Blender + 3DM11 CPU - Ryzen AI Max+ 395
45.7 pt (76%)
Restrict / Search: Model: Max. age: years
Cinebench 2024 - Cinebench 2024 CPU Single Core
132 Points (74%)
116.8 Points (66%)
Cinebench 2024 - Cinebench 2024 CPU Multi Core
1358 Points (25%)
1648 Points (31%)
Cinebench R23 - Cinebench R23 Multi Core
23230 Points (22%)
29063 Points (27%)
Cinebench R23 - Cinebench R23 Single Core
2080 Points (88%)
2034 Points (86%)
Cinebench R20 - Cinebench R20 CPU (Single Core)
818 Points (89%)
791 Points (86%)
Cinebench R20 - Cinebench R20 CPU (Multi Core)
9057 Points (22%)
11357 Points (28%)
Cinebench R15 - Cinebench R15 CPU Multi 64 Bit
3647 Points (23%)
4830 Points (30%)
Cinebench R15 - Cinebench R15 CPU Single 64 Bit
328 Points (91%)
317 Points (88%)
Cinebench R11.5 - Cinebench R11.5 CPU Multi 64 Bit
41.7 Points (54%)
55.9 Points (72%)
Cinebench R11.5 - Cinebench R11.5 CPU Single 64 Bit
3.8 Points (91%)
3.8 Points (89%)
Cinebench R10 - Cinebench R10 Rend. Single (32bit)
8933 Points (54%)
8728 Points (53%)
Cinebench R10 - Cinebench R10 Rend. Multi (32bit)
60825 Points (44%)
67475 Points (49%)
Cinebench R10 - Cinebench R10 Rend. Multi (64bit)
119288 Points (76%)
Cinebench R10 - Cinebench R10 Rend. Single (64bit)
16618 Points (20%)
wPrime 2.10 - wPrime 2.0 1024m *
54.3 s (1%)
347.1 s (4%)
wPrime 2.10 - wPrime 2.0 32m *
2.3 s (0%)
7.3 s (1%)
WinRAR - WinRAR 4.0
15574 Points (25%)
38410 Points (61%)
7-Zip 18.03 - 7-Zip 18.03 Multi Thread 4 runs
min: 90226     avg: 90604     median: 90354 (52%)     max: 91233 MIPS
121368 MIPS (70%)
7-Zip 18.03 - 7-Zip 18.03 Single Thread 4 runs
min: 8346     avg: 8407     median: 8392 (99%)     max: 8484 MIPS
6540 MIPS (77%)
X264 HD Benchmark 4.0 - x264 Pass 2
203 fps (68%)
X264 HD Benchmark 4.0 - x264 Pass 1
375.5 fps (87%)
HWBOT x265 Benchmark v2.2 - HWBOT x265 4k Preset
30.6 fps (54%)
36.2 fps (64%)
TrueCrypt - TrueCrypt Serpent
1.7 GB/s (50%)
2.8 GB/s (82%)
TrueCrypt - TrueCrypt Twofish
2.9 GB/s (50%)
4.4 GB/s (76%)
TrueCrypt - TrueCrypt AES
17.8 GB/s (46%)
23.5 GB/s (61%)
Blender - Blender 3.3 Classroom CPU *
204 Seconds (3%)
163 Seconds (2%)
Blender - Blender 2.79 BMW27 CPU *
137 Seconds (1%)
107 Seconds (1%)
R Benchmark 2.5 - R Benchmark 2.5 *
0.3 sec (7%)
0.4 sec (9%)
3DMark 06 - CPU - 3DMark 06 - CPU
min: 17855     avg: 18319     median: 18341.5 (39%)     max: 18804 Points
18770 Points (40%)
Super Pi mod 1.5 XS 1M - Super Pi mod 1.5 XS 1M *
8 s (2%)
8.2 s (2%)
Super Pi mod 1.5 XS 2M - Super Pi mod 1.5 XS 2M *
17.1 s (1%)
17.6 s (1%)
Super Pi Mod 1.5 XS 32M - Super Pi mod 1.5 XS 32M *
407.8 s (2%)
3DMark Vantage - 3DM Vant. Perf. CPU no Physx
min: 106182     avg: 108581     median: 108660 (83%)     max: 109721 Points
88295 Points (68%)
3DMark 11 - 3DM11 Performance Physics
min: 34973     avg: 38174     median: 38568 (95%)     max: 40357 Points
26998 Points (66%)
3DMark - 3DMark Ice Storm Physics
min: 104270     avg: 105635     median: 105729 (86%)     max: 107334 Points
3DMark - 3DMark Ice Storm Extreme Physics
min: 104072     avg: 105578     median: 105670 (86%)     max: 107578 Points
3DMark - 3DMark Ice Storm Unlimited Physics
min: 106846     avg: 109007     median: 108655 (90%)     max: 112948 Points
3DMark - 3DMark Cloud Gate Physics
min: 28550     avg: 29255     median: 29271.5 (74%)     max: 29952 Points
3DMark - 3DMark Fire Strike Standard Physics
min: 38742     avg: 39187     median: 39248 (70%)     max: 39893 Points
38075 Points (68%)
3DMark - 3DMark Time Spy CPU
min: 14848     avg: 15759     median: 15803 (67%)     max: 16218 Points
11285 Points (48%)
Geekbench 6.4 - Geekbench 6.4 Single-Core
min: 3213     avg: 3278     median: 3285 (82%)     max: 3337 Points
2978 Points (74%)
Geekbench 6.4 - Geekbench 6.4 Multi-Core
min: 17704     avg: 18164     median: 18202 (71%)     max: 18579 Points
21269 Points (83%)
Geekbench 6.0 - Geekbench 6.0 Single-Core
3105 Points (99%)
Geekbench 6.0 - Geekbench 6.0 Multi-Core
21003 Points (86%)
Geekbench 5.5 - Geekbench 5.1 - 5.5 64 Bit Single-Core
min: 2382     avg: 2425     median: 2428.5 (95%)     max: 2450 Points
2275 Points (89%)
Geekbench 5.5 - Geekbench 5.1 - 5.5 64 Bit Multi-Core
min: 15973     avg: 16469     median: 16531 (30%)     max: 16726 Points
22023 Points (39%)
Geekbench 5.0 - Geekbench 5.0 64 Bit Single-Core
min: 2176     avg: 2275     median: 2282 (10%)     max: 2316 Points
Geekbench 5.0 - Geekbench 5.0 64 Bit Multi-Core
min: 15903     avg: 16448     median: 16524.5 (52%)     max: 16773 Points
Geekbench 4.4 - Geekbench 4.1 - 4.4 64 Bit Single-Core
min: 9107     avg: 9442     median: 9444 (94%)     max: 9739 Points
Geekbench 4.4 - Geekbench 4.1 - 4.4 64 Bit Multi-Core
min: 64532     avg: 68545     median: 68717 (68%)     max: 70460 Points
Mozilla Kraken 1.1 - Kraken 1.1 Total Score *
401 ms (0%)
425 ms (0%)
Octane V2 - Octane V2 Total Score
123023 Points (93%)
WebXPRT 4 - WebXPRT 4 Score
337 Points (93%)
317 Points (87%)
WebXPRT 3 - WebXPRT 3 Score
353 Points (63%)
358 Points (64%)
CrossMark - CrossMark Overall
min: 2210     avg: 2279     median: 2278.5 (85%)     max: 2347 Points
2274 Points (85%)
Power Consumption - Prime95 Power Consumption - external Monitor *
272 Watt (47%)
111.2 Watt (19%)
Power Consumption - Cinebench R15 Multi Power Consumption - external Monitor *
238 Watt (43%)
133.2 Watt (24%)
Power Consumption - Idle Power Consumption - external Monitor *
min: 87.4     avg: 105.4     median: 104.1 (69%)     max: 137.9 Watt
11.2 Watt (7%)
Power Consumption - Idle Power Consumption 150cd 1min *
13.8 Watt (15%)
Power Consumption - Power Efficiency - Cinebench R15 Multi external Monitor
15.3 Points per Watt (11%)
36.3 Points per Watt (27%)

Average Benchmarks AMD Ryzen 7 9800X3D → 100% n=39

Average Benchmarks AMD Ryzen AI Max+ 395 → 107% n=39

- Range of benchmark values for this graphics card
red legend - Average benchmark values for this graphics card
* Smaller numbers mean a higher performance
1 This benchmark is not used for the average calculation

Add one or more devices and compare

In the following list you can select (and also search for) devices that should be added to the comparison. You can select more than one device.

restrict list:
v1.33
log 22. 09:39:45

#0 ran 0s before starting gpusingle class +0s ... 0s

#1 checking url part for id 18494 +0s ... 0s

#2 checking url part for id 18628 +0s ... 0s

#3 redirected to Ajax server, took 1753169985s time from redirect:0 +0s ... 0s

#4 did not recreate cache, as it is less than 5 days old! Created at Tue, 22 Jul 2025 05:17:04 +0200 +0s ... 0s

#5 composed specs +0.003s ... 0.004s

#6 did output specs +0s ... 0.004s

#7 getting avg benchmarks for device 18494 +0.004s ... 0.007s

#8 got single benchmarks 18494 +0.04s ... 0.047s

#9 getting avg benchmarks for device 18628 +0.003s ... 0.05s

#10 got single benchmarks 18628 +0s ... 0.051s

#11 got avg benchmarks for devices +0s ... 0.051s

#12 min, max, avg, median took s +0.048s ... 0.098s

#13 return log +0.001s ... 0.099s

Please share our article, every link counts!
Mail Logo
> Expert Reviews and News on Laptops, Smartphones and Tech Innovations > Benchmarks / Tech > Processor Comparison - Head 2 Head
Redaktion, 2017-09- 8 (Update: 2023-07- 1)