ARM Mali-G77 MP9 vs Qualcomm Adreno 690
ARM Mali-G77 MP9 ► remove from comparison
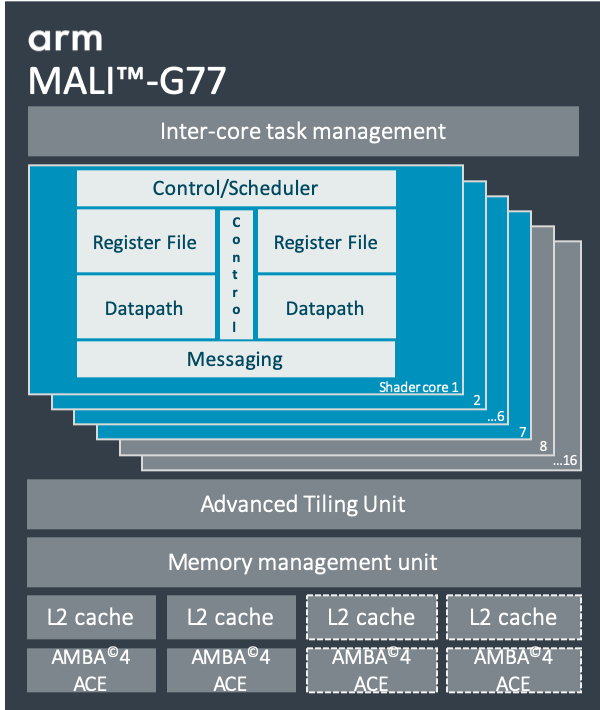
The ARM Mali-G77MP9 is an integrated high-end graphics card for ARM based SoCs (mostly Android based). It was introduced early 2020 in the Mediatek Dimensity 1000 (and 1000+). It integrates 9 of the 16 possible cores and is based on the Valhal architecture. According to ARM it offers improvements in the machine learning efficiency (+60%), a 30% improved performance and a 30% improved efficiency compared to the previous generation (G76).
The graphics card is one of the fastest in Android devices of 2020 and therefore able to run all games fluently.
The GPU supports all modern graphics APIs like OpenGL ES 3.2, Vulkan 1.1 and OpenCL 2.0.
Qualcomm Adreno 690 ► remove from comparison
The Qualcomm Adreno 690 is an integrated graphics card in the Qualcomm Snapdragon 8cx Gen 3 SoC for Windows laptops. According to Qualcomm, the 690 is up to 60% faster than the previous generation. In our tests with the Lenovo ThinkPad X13s, the Adreno 690 was only on par with a low en Intel UHD Graphics iGPU and not well suited for 3D games.
The chip is manufactured in 5nm at Samsung (5LPE) and suited for fanless laptops.
ARM Mali-G77 MP9 Qualcomm Adreno 690 Adreno 600 Series Codename Valhall Architecture Valhall Pipelines 9 - unified Shared Memory no yes API OpenGL ES 3.2 DirectX 12 technology 7 nm 5 nm Date of Announcement 19.03.2020 06.12.2018 Link to Manufacturer Page developer.arm.com Power Consumption 7 Watt
Benchmarks Performance Rating - 3DMark 11 + Fire Strike + Time Spy - Adreno 690
1.3 pt (4%)
...
max:
3DMark - 3DMark Time Spy Score
909 Points (3%)
3DMark - 3DMark Time Spy Graphics
811 Points (2%)
3DMark - 3DMark Ice Storm Unlimited Graphics
60765 Points (7%)
3DMark - 3DMark Cloud Gate Score
min: 8602 avg: 9818 median: 9818 (10%) max: 11034 Points
3DMark - 3DMark Cloud Gate Graphics
min: 13768 avg: 16708 median: 16707.5 (4%) max: 19647 Points
3DMark - 3DMark Fire Strike Standard Score
min: 2758 avg: 2835 median: 2834.5 (5%) max: 2911 Points
3DMark - 3DMark Fire Strike Standard Graphics
min: 2837 avg: 2933 median: 2932.5 (3%) max: 3028 Points
3DMark - 3DMark Ice Storm Graphics
14652 Points (2%)
3DMark - 3DMark Sling Shot (ES 3.0) Unlimited
min: 7612 avg: 8312 median: 8226 (36%) max: 9182 Points
3DMark - 3DMark Sling Shot (ES 3.0) Unlimited Graphics
min: 9823 avg: 11258 median: 11692.5 (26%) max: 11824 Points
3DMark - 3DMark Sling Shot Extreme (ES 3.1) Unlimited
min: 6890 avg: 7321 median: 7393.5 (37%) max: 7606 Points
3DMark - 3DMark Sling Shot Extreme (ES 3.1) Unlimited Graphics
min: 7501 avg: 8264 median: 8477 (25%) max: 8601 Points
3DMark - 3DMark Wild Life Unlimited
min: 4194 avg: 4405 median: 4405 (2%) max: 4578 Points
3DMark - 3DMark Wild Life Extreme Unlimited
min: 1205 avg: 1258 median: 1256 (1%) max: 1300 Points
3067 Points (4%)
3DMark 11 - 3DM11 Performance Score
min: 3063 avg: 3085 median: 3077 (4%) max: 3115 Points
3DMark 11 - 3DM11 Performance GPU
min: 2898 avg: 2930 median: 2912 (3%) max: 2979 Points
Cinebench R10 Cinebench R10 Shading (32bit) + Qualcomm Adreno 690 Cinebench R10 - Cinebench R10 Shading (32bit)
558 Points (0%)
Cinebench R15 + Qualcomm Adreno 690 Cinebench R15 - Cinebench R15 OpenGL 64 Bit
min: 13.4 avg: 13.7 median: 13.7 (1%) max: 14 fps
Cinebench R15 OpenGL Ref. Match 64 Bit + Qualcomm Adreno 690 Cinebench R15 - Cinebench R15 OpenGL Ref. Match 64 Bit
98 % (98%)
GFXBench - GFXBench 5.0 4K Aztec Ruins High Tier Offscreen
min: 9 avg: 9.4 median: 9.4 (4%) max: 9.7 fps
GFXBench - GFXBench 5.0 Aztec Ruins High Tier Offscreen
min: 9.7 avg: 19.6 median: 21 (4%) max: 22 fps
GFXBench - GFXBench 5.0 Aztec Ruins Normal Tier Offscreen
min: 46 avg: 51.3 median: 51.5 (4%) max: 56 fps
GFXBench - GFXBench Car Chase Offscreen
min: 39 avg: 44.5 median: 44.5 (5%) max: 50 fps
GFXBench 3.1 - GFXBench Manhattan ES 3.1 Offscreen
min: 45 avg: 69.8 median: 78 (2%) max: 79 fps
GFXBench 3.0 - GFXBench 3.0 Manhattan Offscreen
min: 49 avg: 101.5 median: 115 (7%) max: 129 fps
GFXBench (DX / GLBenchmark) 2.7 + ARM Mali-G77 MP9 GFXBench (DX / GLBenchmark) 2.7 - GFXBench T-Rex HD Offscreen C24Z16
min: 176 avg: 185.4 median: 182.5 (1%) max: 202 fps
Antutu v9 - AnTuTu v9 GPU
min: 194863 avg: 220826 median: 221937 (28%) max: 248060 Points
Basemark GPU 1.2 - Basemark GPU 1.2 Vulkan Official Medium Offscreen 1080
min: 44.45 avg: 56.6 median: 53.8 (0%) max: 71.3 fps
Basemark GPU 1.2 - Basemark GPU 1.2 Vulkan Official High Offscreen 2160
24.8 fps (6%)
Geekbench 6.2 - Geekbench 6.2 GPU OpenCL
4700 Points (1%)
Geekbench 6.2 - Geekbench 6.2 GPU Vulkan
4718 Points (2%)
PassMark PerformanceTest Mobile V1 - PerformanceTest Mobile V1 2D Graphics Tests
min: 24859 avg: 29891 median: 29132.5 (29%) max: 36439 Points
PassMark PerformanceTest Mobile V1 - PerformanceTest Mobile V1 3D Graphics Tests
min: 24901 avg: 32263 median: 32888 (58%) max: 38376 Points
PassMark PerformanceTest 9 - PerformanceTest 9.0 3D Graphics Mark
28414 Points (100%)
Power Consumption - Furmark Stress Test Power Consumption - external Monitor *
min: 17 avg: 19.7 median: 19.7 (3%) max: 22.3 Watt
Power Consumption - The Witcher 3 Power Consumption - external Monitor *
15.8 Watt (2%)
Power Consumption - Witcher 3 Power Consumption *
16.4 Watt (4%)
Power Consumption - GFXBench Aztec Ruins Normal Tier Offscreen Power Consumption 150cd *
min: 0 avg: 5.1 median: 6.1 (2%) max: 6.9 Watt
Average Benchmarks ARM Mali-G77 MP9 → 100% n=1 Average Benchmarks Qualcomm Adreno 690 → 244% n=1
- Range of benchmark values for this graphics card
- Average benchmark values for this graphics card
* Smaller numbers mean a higher performance
1 This benchmark is not used for the average calculation
Game Benchmarks The following benchmarks stem from our benchmarks of review laptops. The performance depends on the used graphics memory, clock rate, processor, system settings, drivers, and operating systems. So the results don't have to be representative for all laptops with this GPU. For detailed information on the benchmark results, click on the fps number.
100%
Mali-G77 MP9:
56.5 fps
100%
Mali-G77 MP9:
30 30 [X] Xiaomi 11T 1.61.6
MediaTek Dimensity 1200 2GHz
Mali-G77 MP9
min:
29 fps, max:
31 fps
59.3 [X] OnePlus Nord 2T MediaTek Dimensity 1300 2GHz
Mali-G77 MP9
min:
57 fps, P1:
57 fps, max:
60 fps
60 119 ~ 60 fps
100%
Mali-G77 MP9:
50 59 [X] Xiaomi 11T 3.1.2a
MediaTek Dimensity 1200 2GHz
Mali-G77 MP9
min:
42 fps, max:
61 fps
60 ~ 56 fps
100%
Mali-G77 MP9:
119 144 ~ 132 fps
Average Gaming ARM Mali-G77 MP9 → 100% Average Gaming 30-70 fps → 100%
Qualcomm Adreno 690 low med. high ultra QHD 4K F1 22 26 22.5 17 12.6 X-Plane 11.11 14 12 11 Final Fantasy XV Benchmark 19 12.3 7.29 Dota 2 Reborn 58 55 44 37 The Witcher 3 25 16 10 4 GTA V 29.9 < 30 fps < 60 fps < 120 fps ≥ 120 fps 5 1 4 1 4 1 2 1
ARM Mali-G77 MP9 low med. high ultra QHD 4K Diablo Immortal 56.5 Armajet 60 PUBG Mobile 59 40 37 Asphalt 9: Legends 50 56 Real Racing 3 60 Subway Surfers 132 < 30 fps < 60 fps < 120 fps ≥ 120 fps 3 1 2 2 1
For more games that might be playable and a list of all games and graphics cards visit our Gaming List
v1.26
log 02. 12:20:06
#0 checking url part for id 10491 +0s ... 0s
#1 checking url part for id 11411 +0s ... 0s
#2 not redirecting to Ajax server +0s ... 0s
#3 did not recreate cache, as it is less than 5 days old! Created at Wed, 01 May 2024 05:36:19 +0200 +0.001s ... 0.001s
#4 composed specs +0.154s ... 0.155s
#5 did output specs +0s ... 0.155s
#6 start showIntegratedCPUs +0s ... 0.155s
#7 getting avg benchmarks for device 10491 +0.039s ... 0.194s
#8 got single benchmarks 10491 +0.06s ... 0.254s
#9 getting avg benchmarks for device 11411 +0.05s ... 0.304s
#10 got single benchmarks 11411 +0.015s ... 0.319s
#11 got avg benchmarks for devices +0s ... 0.319s
#12 min, max, avg, median took s +0.159s ... 0.478s
#13 before gaming benchmark output +0s ... 0.478s
#14 Got 65 rows for game benchmarks. +0.032s ... 0.51s
#15 composed SQL query for gamebenchmarks +0s ... 0.51s
#16 got data and put it in $dataArray +0.008s ... 0.519s
#17 benchmarks composed for output. +0.032s ... 0.551s
#18 calculated avg scores. +0s ... 0.551s
#19 return log +0.06s ... 0.611s
Please share our article, every link counts!
Redaktion, 2017-09- 8 (Update: 2023-07- 1)
 Deutsch
 English
 Español
 Français
 Italiano
 Nederlands
 Polski
 Português
 Русский
 Türkçe
 Svenska
 Chinese
 Magyar