ARM Mali-G72 MP12 vs Qualcomm Adreno 685 vs Qualcomm Adreno 690
ARM Mali-G72 MP12 ► remove from comparison
The ARM Mali-G72 MP12 is an integrated high-end graphics card for ARM based SoCs (mostly Android based). It was introduced in October 2017 in the Huawei Mate 10 and uses 12 clusters (hence the MP12 name). In our benchmarks it performs between a Adreno 530 and 540 and is therefore suitable for demanding mobile games.
The G72 is based on the second generation of the Bifrost architecture and offers improvements in the machine learning efficiency and a bigger tile buffer for 16x anti-aliasing.
The GPU supports all modern graphics APIs like OpenGL ES 3.2, Vulkan 1.0, OpenCL 2.0, DirectX 12 FL11_1 and Renderscript.
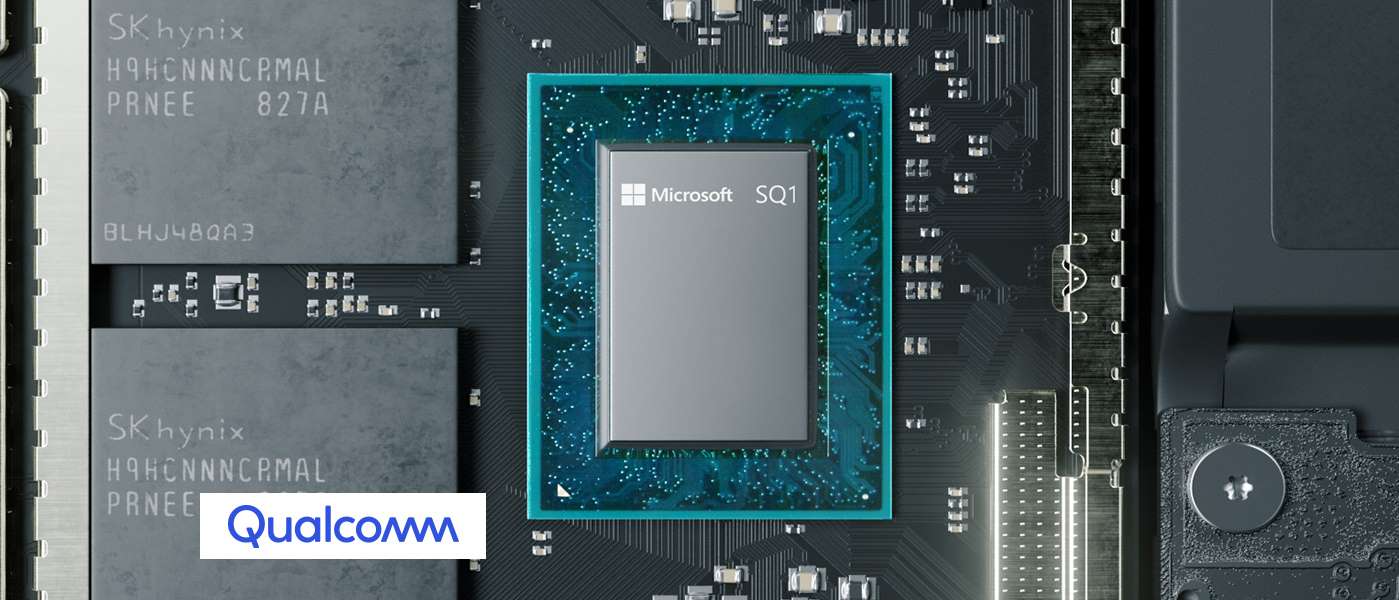
Qualcomm Adreno 685 ► remove from comparison
The Qualcomm Adreno 685 is an integrated graphics card in the Microsoft SQ1 ARM-based SoC. It is similar to the Adreno 680 in the Qualcomm Snapdragon 8cx SoC for Windows laptops but higher clocked and therefore with a higher theoretical performance (2 versus 1.8 TFlops).
Qualcomm Adreno 690 ► remove from comparison
The Qualcomm Adreno 690 is an integrated graphics card in the Qualcomm Snapdragon 8cx Gen 3 SoC for Windows laptops. According to Qualcomm, the 690 is up to 60% faster than the previous generation. In our tests with the Lenovo ThinkPad X13s, the Adreno 690 was only on par with a low en Intel UHD Graphics iGPU and not well suited for 3D games.
The chip is manufactured in 5nm at Samsung (5LPE) and suited for fanless laptops.
ARM Mali-G72 MP12 Qualcomm Adreno 685 Qualcomm Adreno 690 Adreno 600 Series Architecture Bifrost Pipelines 12 - unified Core Speed 850 MHz Shared Memory no yes yes API OpenGL ES 3.2 DirectX 12 DirectX 12 technology 16 nm 7 nm 5 nm Date of Announcement 18.10.2017 06.12.2018 06.12.2018 Link to Manufacturer Page developer.arm.com Power Consumption 7 Watt 7 Watt
Benchmarks Performance Rating - 3DMark 11 + Fire Strike + Time Spy - Adreno 690
1.3 pt (4%)
...
max:
3DMark - 3DMark Time Spy Score
909 Points (3%)
3DMark - 3DMark Time Spy Graphics
811 Points (2%)
3DMark - 3DMark Ice Storm Unlimited Graphics
min: 22429 avg: 32596 median: 33740 (4%) max: 36231 Points
3DMark - 3DMark Cloud Gate Score
min: 8602 avg: 9818 median: 9818 (10%) max: 11034 Points
3DMark - 3DMark Cloud Gate Graphics
min: 13768 avg: 16708 median: 16707.5 (4%) max: 19647 Points
3DMark - 3DMark Fire Strike Standard Score
min: 2758 avg: 2835 median: 2834.5 (5%) max: 2911 Points
3DMark - 3DMark Fire Strike Standard Graphics
min: 2837 avg: 2933 median: 2932.5 (3%) max: 3028 Points
3DMark - 3DMark Ice Storm Graphics
14652 Points (2%)
3DMark - 3DMark Sling Shot (ES 3.0) Unlimited
min: 2021 avg: 3208 median: 3360.5 (15%) max: 3710 Points
3DMark - 3DMark Sling Shot (ES 3.0) Unlimited Graphics
min: 2062 avg: 3386 median: 3545 (8%) max: 4040 Points
3DMark - 3DMark Sling Shot Extreme (ES 3.1) Unlimited
min: 2487 avg: 2882 median: 2961.5 (15%) max: 3070 Points
3DMark - 3DMark Sling Shot Extreme (ES 3.1) Unlimited Graphics
min: 2597 avg: 2945 median: 3012.5 (9%) max: 3109 Points
3DMark - 3DMark Wild Life Extreme Unlimited
3067 Points (4%)
3DMark 11 - 3DM11 Performance Score
1968 Points (3%)
min: 3063 avg: 3085 median: 3077 (4%) max: 3115 Points
3DMark 11 - 3DM11 Performance GPU
1927 Points (2%)
min: 2898 avg: 2930 median: 2912 (3%) max: 2979 Points
Cinebench R10 Cinebench R10 Shading (32bit) + Qualcomm Adreno 685 Cinebench R10 - Cinebench R10 Shading (32bit)
373 Points (0%)
Cinebench R10 Shading (32bit) + Qualcomm Adreno 690 558 Points (0%)
Cinebench R15 + Qualcomm Adreno 690 Cinebench R15 - Cinebench R15 OpenGL 64 Bit
min: 13.4 avg: 13.7 median: 13.7 (1%) max: 14 fps
Cinebench R15 OpenGL Ref. Match 64 Bit + Qualcomm Adreno 690 Cinebench R15 - Cinebench R15 OpenGL Ref. Match 64 Bit
98 % (98%)
GFXBench - GFXBench 5.0 Aztec Ruins High Tier Offscreen
min: 8.4 avg: 8.6 median: 8.6 (2%) max: 8.7 fps
GFXBench - GFXBench 5.0 Aztec Ruins Normal Tier Offscreen
min: 10 avg: 20.6 median: 23 (2%) max: 24 fps
GFXBench - GFXBench Car Chase Offscreen
min: 11 avg: 20.4 median: 21 (2%) max: 23 fps
GFXBench 3.1 - GFXBench Manhattan ES 3.1 Offscreen
min: 19 avg: 33.9 median: 38.5 (1%) max: 39 fps
GFXBench 3.0 - GFXBench 3.0 Manhattan Offscreen
min: 23 avg: 54.6 median: 59 (3%) max: 66 fps
31.7 fps (2%)
GFXBench (DX / GLBenchmark) 2.7 + ARM Mali-G72 MP12 GFXBench (DX / GLBenchmark) 2.7 - GFXBench T-Rex HD Offscreen C24Z16
min: 45 avg: 108 median: 118 (1%) max: 125 fps
GFXBench T-Rex HD Offscreen C24Z16 + Qualcomm Adreno 685
167.7 fps (1%)
Basemark X 1.1 - Basemark X 1.1 High Quality
25922 Points (59%)
Basemark X 1.1 - Basemark X 1.1 Medium Quality
39033 Points (87%)
ComputeMark v2.1 - ComputeMark v2.1 Result
2292 Points (2%)
PassMark PerformanceTest Mobile V1 - PerformanceTest Mobile V1 2D Graphics Tests
8180 Points (8%)
PassMark PerformanceTest Mobile V1 - PerformanceTest Mobile V1 3D Graphics Tests
3761 Points (7%)
Power Consumption - Furmark Stress Test Power Consumption - external Monitor *
min: 17 avg: 19.7 median: 19.7 (3%) max: 22.3 Watt
Power Consumption - The Witcher 3 Power Consumption - external Monitor *
15.8 Watt (2%)
Power Consumption - Witcher 3 Power Consumption *
16.4 Watt (4%)
Average Benchmarks ARM Mali-G72 MP12 → 0% n= Average Benchmarks Qualcomm Adreno 685 → 0% n= Average Benchmarks Qualcomm Adreno 690 → 0% n=
- Range of benchmark values for this graphics card
- Average benchmark values for this graphics card
* Smaller numbers mean a higher performance
1 This benchmark is not used for the average calculation
Game Benchmarks The following benchmarks stem from our benchmarks of review laptops. The performance depends on the used graphics memory, clock rate, processor, system settings, drivers, and operating systems. So the results don't have to be representative for all laptops with this GPU. For detailed information on the benchmark results, click on the fps number.
100%
Mali-G72 MP12:
32 [X] Honor Play 0.7.0
HiSilicon Kirin 970 2.4GHz
Mali-G72 MP12
min:
18 fps, max:
33 fps
fps
100%
Mali-G72 MP12:
32 [X] Honor 10 0.5.0
HiSilicon Kirin 970 2.4GHz
Mali-G72 MP12
min:
20 fps, max:
42 fps
32 [X] Honor Play 0.7.0
HiSilicon Kirin 970 2.4GHz
Mali-G72 MP12
min:
22 fps, max:
33 fps
33 [X] Huawei P20 Pro 0.7.0
HiSilicon Kirin 970 2.4GHz
Mali-G72 MP12
min:
14 fps, max:
41 fps
40 [X] Huawei P20 Pro 0.7.0 mit GPU Turbo
HiSilicon Kirin 970 2.4GHz
Mali-G72 MP12
min:
16 fps, max:
42 fps
~ 34 fps
100%
Mali-G72 MP12:
60 fps
100%
Mali-G72 MP12:
31 55 [X] Honor Play 1.24.1.2
HiSilicon Kirin 970 2.4GHz
Mali-G72 MP12
min:
43 fps, max:
60 fps
~ 43 fps
100%
Mali-G72 MP12:
30 54 [X] Honor Play 1.24.1.2
HiSilicon Kirin 970 2.4GHz
Mali-G72 MP12
min:
21 fps, max:
61 fps
58 [X] Honor 10 1.21.1.3
HiSilicon Kirin 970 2.4GHz
Mali-G72 MP12
min:
2 fps, max:
60 fps
58 [X] Huawei P20 Pro 1.23.1.2
HiSilicon Kirin 970 2.4GHz
Mali-G72 MP12
min:
40 fps, max:
60 fps
~ 50 fps
100%
Mali-G72 MP12:
60 fps
100%
Mali-G72 MP12:
30 30 30 59 [X] Huawei P20 1.3.3
HiSilicon Kirin 970 2.4GHz
Mali-G72 MP12
min:
46 fps, max:
60 fps
~ 37 fps
100%
Mali-G72 MP12:
30 30 30 ~ 30 fps
100%
Mali-G72 MP12:
29 29 30 30 [X] Huawei P20 3.6.0k
HiSilicon Kirin 970 2.4GHz
Mali-G72 MP12
min:
26 fps, max:
31 fps
~ 30 fps
100%
Mali-G72 MP12:
30 fps
100%
Mali-G72 MP12:
30 fps
100%
Mali-G72 MP12:
51 fps
Average Gaming ARM Mali-G72 MP12 → 100% Average Gaming 30-70 fps → 100%
Qualcomm Adreno 690 low med. high ultra QHD 4K F1 22 26 22.5 17 12.6 X-Plane 11.11 14 12 11 Final Fantasy XV Benchmark 19 12.3 7.29 Dota 2 Reborn 58 55 44 37 The Witcher 3 25 16 10 4 GTA V 29.9 < 30 fps < 60 fps < 120 fps ≥ 120 fps 5 1 4 1 4 1 2 1
For more games that might be playable and a list of all games and graphics cards visit our Gaming List
v1.26
log 11. 16:37:34
#0 checking url part for id 8138 +0s ... 0s
#1 checking url part for id 9954 +0s ... 0s
#2 checking url part for id 11411 +0s ... 0s
#3 not redirecting to Ajax server +0s ... 0s
#4 did not recreate cache, as it is less than 5 days old! Created at Fri, 10 May 2024 05:38:50 +0200 +0.001s ... 0.001s
#5 composed specs +0.146s ... 0.148s
#6 did output specs +0s ... 0.148s
#7 start showIntegratedCPUs +0s ... 0.148s
#8 getting avg benchmarks for device 8138 +0.04s ... 0.188s
#9 got single benchmarks 8138 +0.024s ... 0.212s
#10 getting avg benchmarks for device 9954 +0.002s ... 0.214s
#11 got single benchmarks 9954 +0.006s ... 0.22s
#12 getting avg benchmarks for device 11411 +0.022s ... 0.242s
#13 got single benchmarks 11411 +0.011s ... 0.253s
#14 got avg benchmarks for devices +0s ... 0.253s
#15 min, max, avg, median took s +0.108s ... 0.361s
#16 before gaming benchmark output +0s ... 0.361s
#17 Got 67 rows for game benchmarks. +0.012s ... 0.373s
#18 composed SQL query for gamebenchmarks +0s ... 0.373s
#19 got data and put it in $dataArray +0.008s ... 0.381s
#20 benchmarks composed for output. +0.032s ... 0.413s
#21 calculated avg scores. +0s ... 0.413s
#22 return log +0.002s ... 0.415s
Please share our article, every link counts!
Redaktion, 2017-09- 8 (Update: 2023-07- 1)
 Deutsch
 English
 Español
 Français
 Italiano
 Nederlands
 Polski
 Português
 Русский
 Türkçe
 Svenska
 Chinese
 Magyar