Notebookcheck Logo

Intel Celeron 6305 vs Intel Core i9-9900KS vs Intel Pentium Gold 7505

Intel Celeron 6305

► remove from comparison Intel Celeron 6305

The Intel Celeron 6305 (or 6305U) is a power efficient dual-core SoC for laptops and Ultrabooks based on the Tiger Lake-U generation that was announced in the third quarter of 2020. It integrates only two Willow Cove processor cores (2 threads - no Hyper-Threading/SMT). The clock speed is set at 1.8 GHz as the chip does not support Turbo Boost.

Performance

The average 6305 in our database is in the same league as the Celeron N4505, as far as multi-thread benchmark scores are concerned. This is a very poor result, as of late 2022.

Your mileage may vary depending on how high the CPU power limits are.

Another novelty is the integrated Xe graphics фвфзеук based on the completely new Gen 12 architecture. It should offer a significantly higher performance compared to the older UHD Graphics G1 (Ice Lake). In the 6305U Intel calls it just UHD Graphics and it offers 48 EUs.

Other improvements from Ice Lake should be also integrated in Tiger Lake like the AI hardware acceleration and the partial integration of Thunderbolt and Wifi 6 in the chip.

The chip is produced on the improved 10nm+ process (called 10 nm SuperFin) at Intel that should be comparable to the 7nm process at TSMC (e.g. Ryzen 4000 series).

Intel Core i9-9900KS

► remove from comparison Intel i9-9900KS

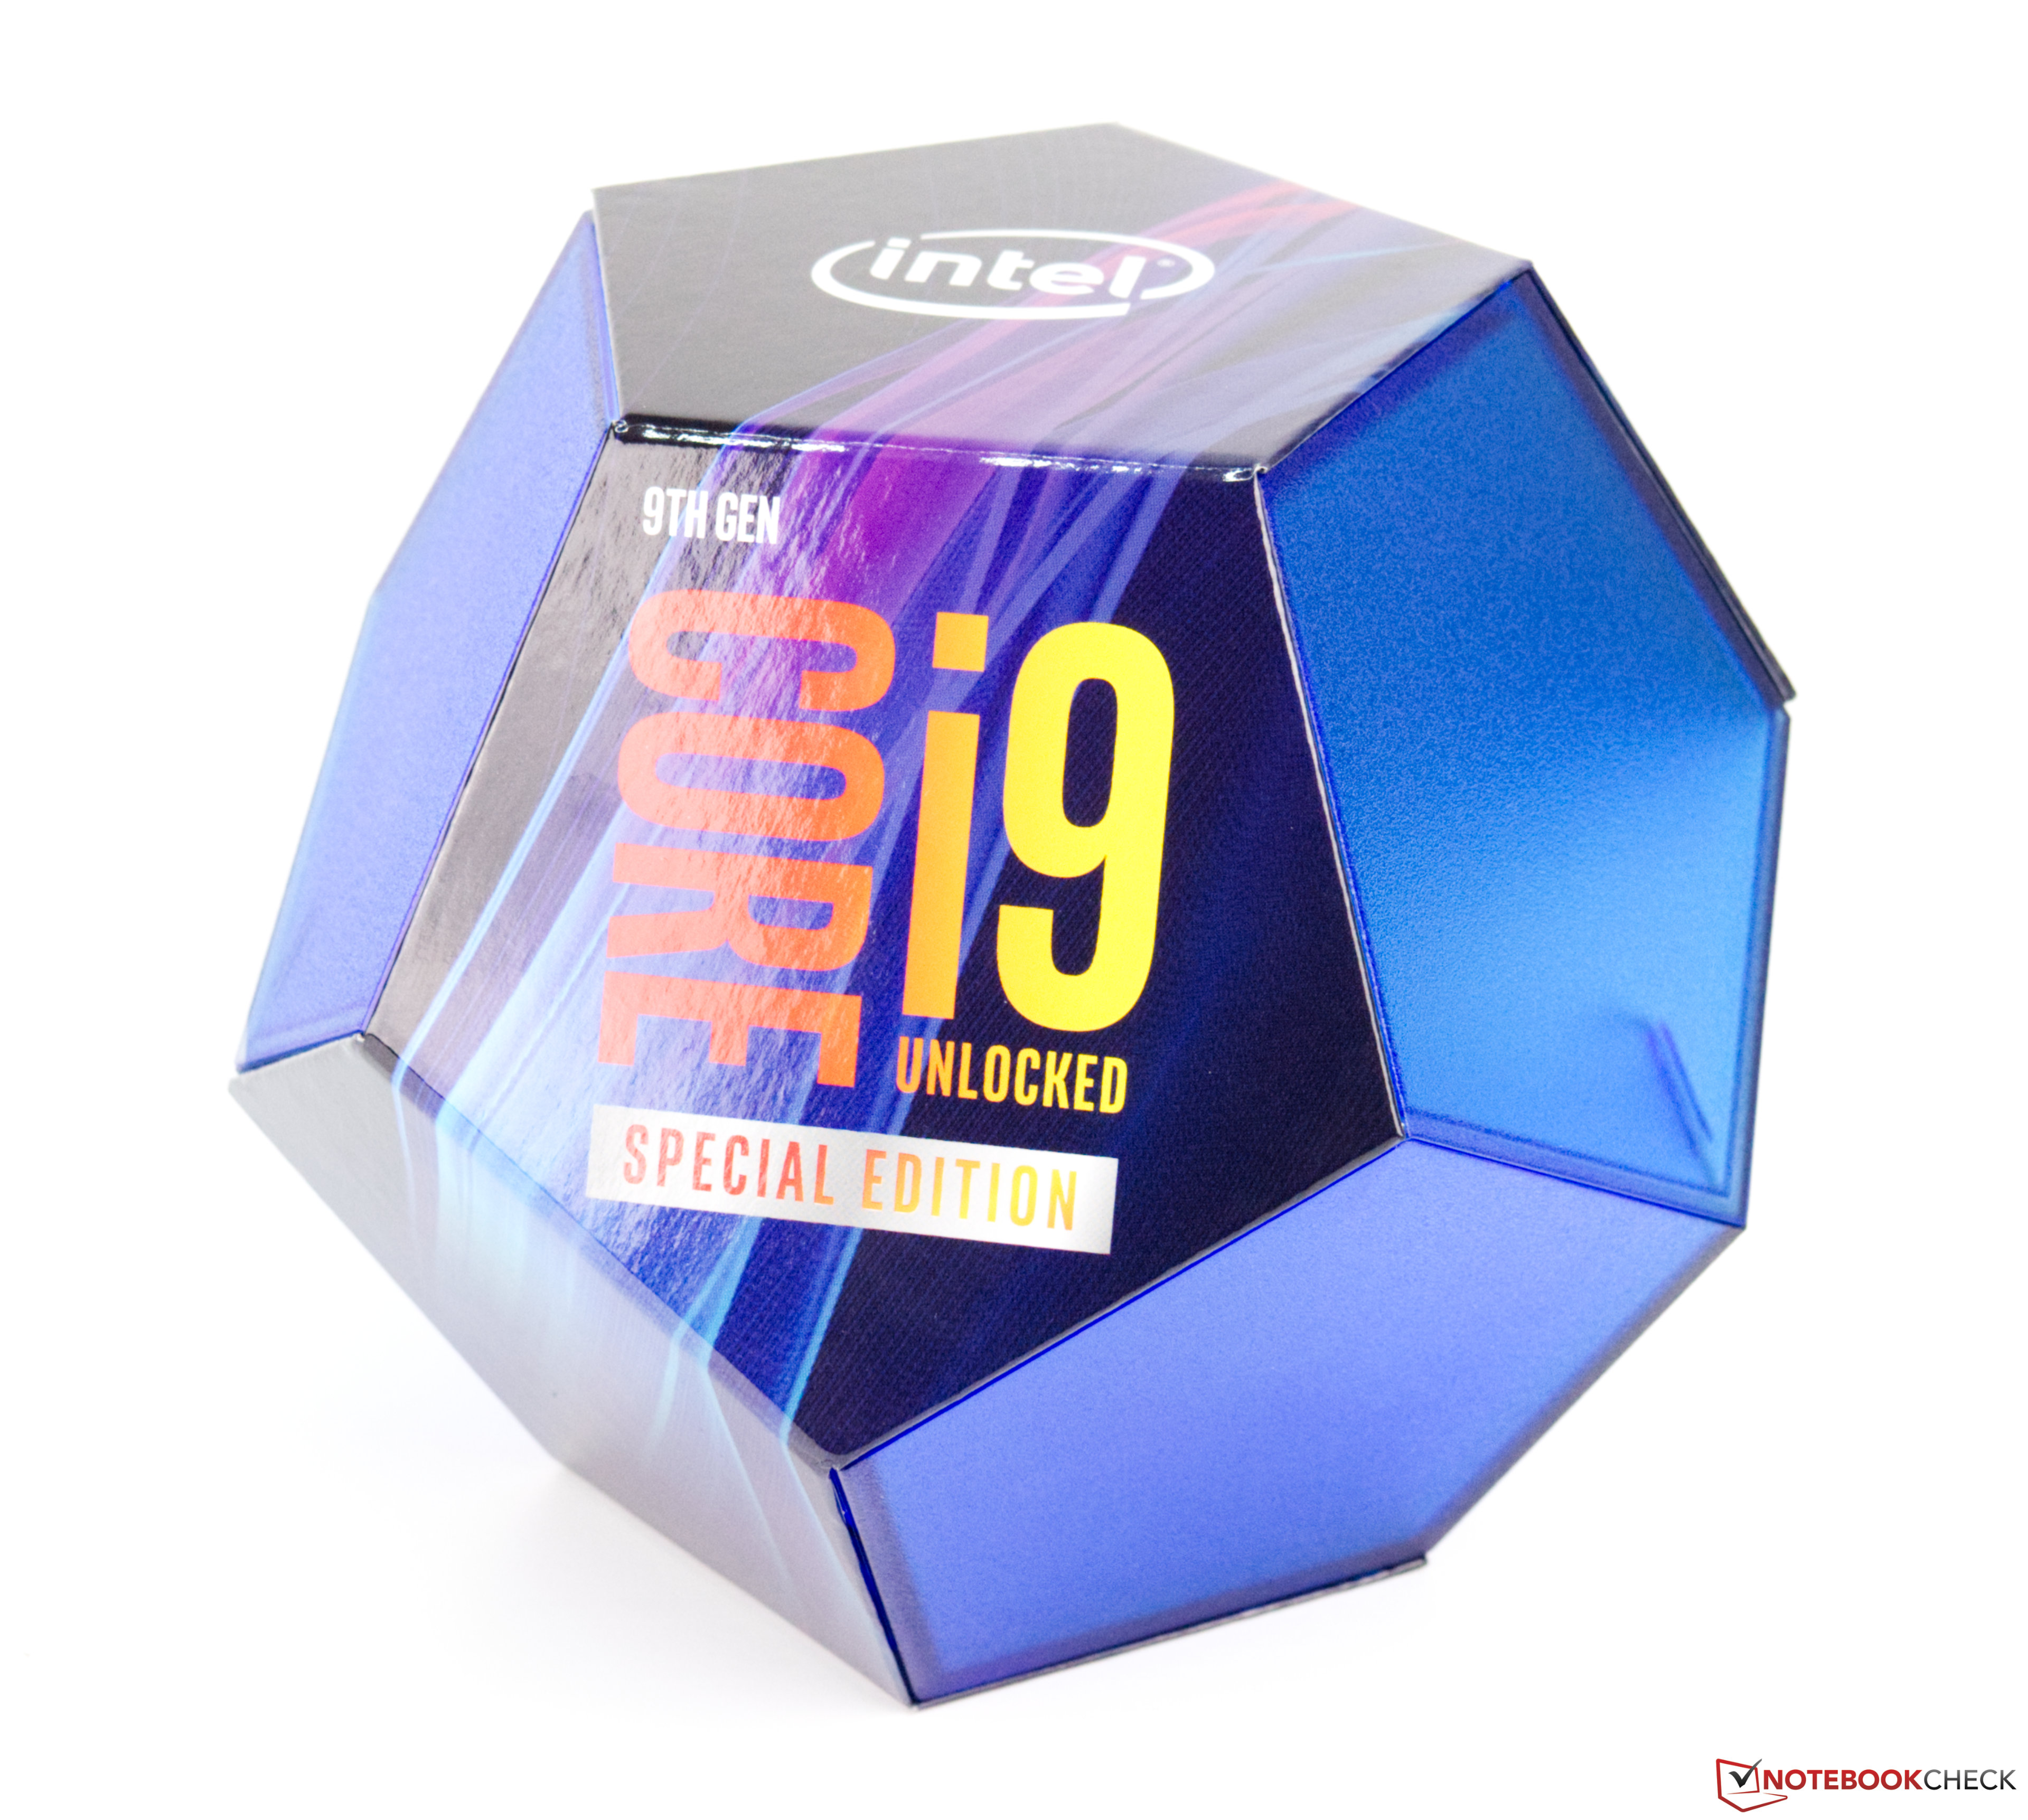
The Intel Core i9-9900KS is a high end desktop processor that includes 8 cores based on the Coffee Lake architecture. It is the fastest Coffee Lake CPU in 2019 and compared to the similar named i9-9900K, the KS offers an all core Turbo of 5 GHz. All cores can clock between 4 GHz and 5 GHz and thanks to Hyperthreading / SMT 16 threads can be executed in parallel. The CPU is still manufactured in the mature 14 nm process (14nm++). Thanks to the open multiplicator, the CPU is rather easy to overclock (if a Z390 based mainboard is used).

With good cooling, the i9-9900KS can be around 10% faster than the older Intel Core i9-9900K (thanks to the 5 GHz all core Turbo). Compare to the old Core i7-8700K, the 9900KS is even 45% faster. Especially for gaming, the 9900KS is currently the fastest option available. The fast Ryzen and Threadripper CPUs from AMD however offer a better multithreaded performance.

The integrated GPU is called Intel UHD Graphics 630 and clocks with up to 1.2 GHz. It is not suited for demanding 3D games and located in the low end.

The TDP is raised to 127 Watt for the additional performance, therefore a good CPU cooler is needed. When overclocking the CPU, more than 200 Watt can be reached unter load.

Intel Pentium Gold 7505

► remove from comparison

The Intel Pentium Gold 7505 is a power-efficient dual-core SoC for laptops and Ultrabooks based on the Tiger Lake-U generation that was announced in the third quarter of 2020. Unlike many other TGL-UP3 processors, the Pentium features an Infrastructure Processing Unit (Intel IPU). It integrates two Willow Cove processor cores (4 threads thanks to HyperThreading) clocked at 2 - 3.5 GHz (at 15 Watt TDP).

Another novelty is the integrated Xe graphics adapter based on the completely new Gen 12 architecture. It should offer a significantly higher performance compared to the older UHD Graphics G1 (Ice Lake).

Other improvements from Ice Lake are also integrated in Tiger Lake like the AI hardware acceleration and the partial integration of Thunderbolt and WiFi 6 in the chip.

Performance

The average 7505 in our database lags just slightly behind the N95, as far as multi-thread benchmark scores are concerned. In other words, this is an entry-level chip that's good enough for basic day-to-day activities only, as of late 2022.

Power consumption

This Pentium series chip has a default TDP (also known as the long-term power limit) of 15 W. Which is a tad too high to allow for passively cooled designs.

The Intel Pentium 7505 is built with Intel's 3rd generation 10 nm process marketed as SuperFin for low, as of mid 2023, energy efficiency.

ModelIntel Celeron 6305Intel Core i9-9900KSIntel Pentium Gold 7505
SeriesIntel Tiger LakeIntel Coffee LakeIntel Tiger Lake
CodenameTiger Lake-UCoffee Lake-RTiger Lake-U
Series: Tiger Lake Tiger Lake-U
Intel Pentium Gold 75052 - 3.5 GHz2 / 4 cores4 MB L3
Intel Celeron 6305 « 1.8 GHz2 / 2 cores4 MB L3
Intel Core i9-9900KS « 4 - 5 GHz8 / 16 cores16 MB L3
Intel Core i9-9900K3.6 - 5 GHz8 / 16 cores16 MB L3
Intel Core i7-9700K3.6 - 4.9 GHz8 / 8 cores12 MB L3
Intel Core i7-97003 - 4.7 GHz8 / 8 cores12 MB L3
Intel Core i5-9600K3.7 - 4.6 GHz6 / 6 cores9 MB L3
Intel Core i9-9900T2.1 - 4.4 GHz8 / 16 cores16 MB L3
Intel Core i5-9400F2.9 - 4.1 GHz6 / 6 cores9 MB L3
Intel Core i3-9100F3.6 - 4.2 GHz4 / 4 cores6 MB L3
Intel Pentium Gold 7505 « 2 - 3.5 GHz2 / 4 cores4 MB L3
Intel Celeron 63051.8 GHz2 / 2 cores4 MB L3
Clock1800 MHz4000 - 5000 MHz2000 - 3500 MHz
L1 Cache160 KB512 KB160 KB
L2 Cache2.5 MB2 MB2.5 MB
L3 Cache4 MB16 MB4 MB
Cores / Threads2 / 28 / 162 / 4
TDP15 Watt127 Watt15 Watt
Technology10 nm14 nm10 nm
max. Temp.100 °C100 °C100 °C
SocketBGA1449FCLGA1151BGA1449
FeaturesDDR4-3200/LPDDR4x-3733 RAM, PCIe 3, 4 GT/s bus, DL Boost, GNA, MMX, SSE, SSE2, SSE3, SSSE3, SSE4.1, SSE4.2, AES, AVX, AVX2, AVX512F, FMA3, SHADual-Channel DDR4-2666 Memory Controller, HyperThreading, AVX, AVX2, AES-NI, TSX-NI, Quick Sync, Virtualization, vProDDR4-3200/LPDDR4x-3733 RAM, PCIe 3, 4 GT/s bus, DL Boost, GNA, MMX, SSE, SSE2, SSE3, SSSE3, SSE4.1, SSE4.2, AVX, AVX2, AVX-512 [?], BMI2, ABM, FMA, ADX, VMX, SMEP, SMAP, EIST, TM1, TM2, HT, Turbo, SST, AES-NI, RDRAND, RDSEED, SHA
iGPUIntel UHD Graphics Xe G4 48EUs (400 - 1250 MHz)Intel UHD Graphics 630 (350 - 1200 MHz)Intel UHD Graphics Xe G4 48EUs (400 - 1250 MHz)
Architecturex86x86x86
Announced
Manufacturerark.intel.comwww.intel.deark.intel.com
Die Size178 mm2
$513 U.S.

Benchmarks

Performance Rating - CB R15 + R20 + 7-Zip + X265 + Blender + 3DM11 CPU - Celeron 6305
17.8 pt (25%)
Performance Rating - CB R15 + R20 + 7-Zip + X265 + Blender + 3DM11 CPU - i9-9900KS
38.4 pt (53%)
Performance Rating - CB R15 + R20 + 7-Zip + X265 + Blender + 3DM11 CPU - Pentium 7505
27.7 pt (38%)
Cinebench R23 - Cinebench R23 Multi Core
min: 1056     avg: 1072     median: 1071.5 (1%)     max: 1087 Points
min: 2594     avg: 2600     median: 2600 (2%)     max: 2606 Points
Cinebench R23 - Cinebench R23 Single Core
min: 566     avg: 567     median: 566.5 (24%)     max: 567 Points
min: 1110     avg: 1113     median: 1112.5 (47%)     max: 1115 Points
Cinebench R20 - Cinebench R20 CPU (Single Core)
217 Points (24%)
min: 509     avg: 512     median: 511.5 (57%)     max: 514 Points
min: 428     avg: 429     median: 429 (48%)     max: 430 Points
Cinebench R20 - Cinebench R20 CPU (Multi Core)
416 Points (1%)
min: 4463     avg: 4820     median: 4819.5 (12%)     max: 5176 Points
1017 Points (2%)
Cinebench R15 - Cinebench R15 CPU Multi 64 Bit
min: 160.8     avg: 161.1     median: 161.1 (1%)     max: 161.3 Points
min: 1962     avg: 2058     median: 2058 (13%)     max: 2154 Points
min: 397     avg: 400     median: 400 (3%)     max: 403 Points
Cinebench R15 - Cinebench R15 CPU Single 64 Bit
min: 82.6     avg: 84     median: 84 (25%)     max: 85.3 Points
min: 215     avg: 216     median: 216 (65%)     max: 217 Points
min: 164.9     avg: 165     median: 165 (50%)     max: 165.1 Points
Cinebench R11.5 - Cinebench R11.5 CPU Multi 64 Bit
1.9 Points (3%)
min: 22.31     avg: 23.2     median: 23.1 (30%)     max: 23.98 Points
4.5 Points (6%)
Cinebench R11.5 - Cinebench R11.5 CPU Single 64 Bit
1 Points (25%)
min: 2.43     avg: 2.4     median: 2.4 (61%)     max: 2.46 Points
1.9 Points (48%)
Cinebench R10 - Cinebench R10 Rend. Single (32bit)
3465 Points (21%)
min: 8143     avg: 8183     median: 8183 (49%)     max: 8223 Points
6773 Points (41%)
Cinebench R10 - Cinebench R10 Rend. Multi (32bit)
6611 Points (5%)
min: 50462     avg: 51779     median: 51778.5 (38%)     max: 53095 Points
14093 Points (10%)
Cinebench R10 - Cinebench R10 Rend. Multi (64bit)
69169 Points (48%)
Cinebench R10 - Cinebench R10 Rend. Single (64bit)
10759 Points (13%)
wPrime 2.10 - wPrime 2.0 1024m *
1231 s (15%)
min: 82     avg: 87.9     median: 87.9 (1%)     max: 93.8 s
454.1 s (5%)
wPrime 2.10 - wPrime 2.0 32m *
39.1 s (8%)
min: 3.232     avg: 3.6     median: 3.6 (1%)     max: 3.969 s
14.5 s (3%)
WinRAR - WinRAR 4.0
1210 Points (2%)
min: 8156     avg: 8353     median: 8353 (13%)     max: 8550 Points
2522 Points (4%)
7-Zip 18.03 - 7-Zip 18.03 Multli Thread 4 runs
min: 4226     avg: 4263     median: 4262.5 (2%)     max: 4299 MIPS
min: 55064     avg: 55735     median: 55735 (32%)     max: 56406 MIPS
min: 10347     avg: 10756     median: 10755.5 (6%)     max: 11164 MIPS
7-Zip 18.03 - 7-Zip 18.03 Single Thread 4 runs
min: 2233     avg: 2238     median: 2237.5 (27%)     max: 2242 MIPS
min: 5674     avg: 5734     median: 5734 (69%)     max: 5794 MIPS
min: 4032     avg: 4062     median: 4062 (49%)     max: 4092 MIPS
X264 HD Benchmark 4.0 - x264 Pass 2
11.3 fps (4%)
min: 116     avg: 122.5     median: 122.5 (43%)     max: 129 fps
24.9 fps (9%)
X264 HD Benchmark 4.0 - x264 Pass 1
61.9 fps (14%)
min: 276.2     avg: 278.9     median: 278.9 (64%)     max: 281.5 fps
131.1 fps (30%)
HWBOT x265 Benchmark v2.2 - HWBOT x265 4k Preset
min: 1.69     avg: 1.7     median: 1.7 (3%)     max: 1.71 fps
min: 15.31     avg: 16.3     median: 16.3 (29%)     max: 17.2 fps
min: 3.4     avg: 3.4     median: 3.4 (6%)     max: 3.46 fps
TrueCrypt - TrueCrypt Serpent
0.1 GB/s (0%)
1.2 GB/s (0%)
0.2 GB/s (0%)
TrueCrypt - TrueCrypt Twofish
0.1 GB/s (2%)
2.1 GB/s (36%)
0.3 GB/s (6%)
TrueCrypt - TrueCrypt AES
0.9 GB/s (2%)
min: 12.1     avg: 12.2     median: 12.2 (32%)     max: 12.2 GB/s
2.4 GB/s (6%)
Blender - Blender 3.3 Classroom CPU *
min: 2115     avg: 2130     median: 2129.5 (27%)     max: 2144 Seconds
Blender - Blender 2.79 BMW27 CPU *
min: 2824     avg: 2834     median: 2834 (20%)     max: 2844 Seconds
min: 205.1     avg: 224.6     median: 224.6 (2%)     max: 244 Seconds
min: 1142     avg: 1150     median: 1150 (8%)     max: 1158 Seconds
R Benchmark 2.5 - R Benchmark 2.5 *
1.4 sec (30%)
min: 0.739     avg: 0.7     median: 0.7 (16%)     max: 0.75 sec
3DMark 06 - CPU - 3DMark 06 - CPU
min: 14825     avg: 14884     median: 14883.5 (32%)     max: 14942 Points
4890 Points (10%)
Super Pi mod 1.5 XS 1M - Super Pi mod 1.5 XS 1M *
18.8 s (4%)
min: 7.405     avg: 7.4     median: 7.4 (2%)     max: 7.436 s
9.8 s (2%)
Super Pi mod 1.5 XS 2M - Super Pi mod 1.5 XS 2M *
41.3 s (2%)
min: 16.45     avg: 16.5     median: 16.5 (1%)     max: 16.59 s
22.1 s (1%)
Super Pi Mod 1.5 XS 32M - Super Pi mod 1.5 XS 32M *
905 s (4%)
min: 412.2     avg: 414.2     median: 414.2 (2%)     max: 416.1 s
523 s (2%)
3DMark 11 - 3DM11 Performance Physics
min: 1723     avg: 1936     median: 1935.5 (5%)     max: 2148 Points
min: 18531     avg: 18914     median: 18694 (51%)     max: 19517 Points
min: 5054     avg: 5285     median: 5285 (14%)     max: 5516 Points
3DMark - 3DMark Ice Storm Physics
min: 75473     avg: 75482     median: 75482 (61%)     max: 75491 Points
3DMark - 3DMark Ice Storm Extreme Physics
min: 75946     avg: 76061     median: 76060.5 (62%)     max: 76175 Points
3DMark - 3DMark Ice Storm Unlimited Physics
min: 19614     avg: 19990     median: 19990 (17%)     max: 20366 Points
min: 74085     avg: 75802     median: 75508 (64%)     max: 77813 Points
3DMark - 3DMark Cloud Gate Physics
min: 1619     avg: 1639     median: 1638.5 (4%)     max: 1658 Points
min: 19068     avg: 19770     median: 20049 (51%)     max: 20193 Points
min: 4164     avg: 4223     median: 4222.5 (11%)     max: 4281 Points
3DMark - 3DMark Fire Strike Standard Physics
min: 2368     avg: 2391     median: 2390.5 (4%)     max: 2413 Points
min: 24327     avg: 25511     median: 26016 (46%)     max: 26191 Points
min: 6057     avg: 6200     median: 6199.5 (11%)     max: 6342 Points
3DMark - 3DMark Time Spy CPU
min: 11017     avg: 11358     median: 11375 (48%)     max: 11683 Points
min: 2287     avg: 2326     median: 2325.5 (10%)     max: 2364 Points
Geekbench 5.5 - Geekbench 5.1 - 5.4 64 Bit Single-Core
min: 632     avg: 638     median: 638 (27%)     max: 644 Points
1372 Points (58%)
min: 1093     avg: 1143     median: 1129 (48%)     max: 1206 Points
Geekbench 5.5 - Geekbench 5.1 - 5.4 64 Bit Multi-Core
min: 1154     avg: 1198     median: 1198 (2%)     max: 1242 Points
9100 Points (16%)
min: 2210     avg: 2332     median: 2326 (4%)     max: 2459 Points
Geekbench 5.0 - Geekbench 5.0 64 Bit Single-Core
min: 626     avg: 629     median: 628.5 (3%)     max: 631 Points
min: 1126     avg: 1158     median: 1157.5 (5%)     max: 1189 Points
Geekbench 5.0 - Geekbench 5.0 64 Bit Multi-Core
min: 1151     avg: 1184     median: 1183.5 (4%)     max: 1216 Points
min: 2181     avg: 2305     median: 2305 (7%)     max: 2429 Points
Geekbench 4.4 - Geekbench 4.1 - 4.4 64 Bit Single-Core
min: 2776     avg: 2825     median: 2824.5 (28%)     max: 2873 Points
6308 Points (63%)
min: 4806     avg: 4999     median: 4998.5 (50%)     max: 5191 Points
Geekbench 4.4 - Geekbench 4.1 - 4.4 64 Bit Multi-Core
min: 4762     avg: 4950     median: 4949.5 (5%)     max: 5137 Points
35586 Points (39%)
min: 8981     avg: 9426     median: 9426 (10%)     max: 9871 Points
Geekbench 4.0 - Geekbench 4.0 64 Bit Single-Core
6313 Points (86%)
Geekbench 4.0 - Geekbench 4.0 64 Bit Multi-Core
35932 Points (88%)
Mozilla Kraken 1.1 - Kraken 1.1 Total Score *
min: 1678     avg: 1681     median: 1681 (2%)     max: 1684 ms
883 ms (1%)
min: 903     avg: 907     median: 906.5 (1%)     max: 910 ms
Sunspider - Sunspider 1.0 Total Score *
326.7 ms (4%)
152.9 ms (2%)
Octane V2 - Octane V2 Total Score
21416 Points (19%)
44538 Points (40%)
49676 Points (45%)
WebXPRT 4 - WebXPRT 4 Score
min: 142.3     avg: 142.8     median: 142.8 (41%)     max: 143.3 Points
WebXPRT 3 - WebXPRT 3 Score
min: 99.2     avg: 100.7     median: 100.7 (21%)     max: 102.2 Points
min: 181.4     avg: 184.4     median: 184.4 (38%)     max: 187.4 Points
CrossMark - CrossMark Overall
min: 501     avg: 508     median: 507.5 (19%)     max: 514 Points
min: 853     avg: 878     median: 877.5 (34%)     max: 902 Points
Power Consumption - Prime95 Power Consumption - external Monitor *
12.1 Watt (2%)
259.6 Watt (45%)
23.6 Watt (4%)
Power Consumption - Cinebench R15 Multi Power Consumption - external Monitor *
10.5 Watt (2%)
min: 219.3     avg: 269.1     median: 292.7 (53%)     max: 295.4 Watt
23 Watt (4%)
Power Consumption - Idle Power Consumption - external Monitor *
20.8 Watt (14%)
3.8 Watt (3%)
Power Consumption - Idle Power Consumption 150cd 1min *
6.6 Watt (7%)
6.6 Watt (7%)
Power Consumption - Cinebench R15 Multi Power Efficiency - external Monitor
15.4 Points per Watt (11%)
min: 7.29     avg: 8.1     median: 8.1 (6%)     max: 8.95 Points per Watt
17.3 Points per Watt (13%)

Average Benchmarks Intel Celeron 6305 → 100% n=32

Average Benchmarks Intel Core i9-9900KS → 653% n=32

Average Benchmarks Intel Pentium Gold 7505 → 197% n=32

- Range of benchmark values for this graphics card
- Average benchmark values for this graphics card
* Smaller numbers mean a higher performance
1 This benchmark is not used for the average calculation

v1.26
log 22. 10:52:08

#0 checking url part for id 12244 +0s ... 0s

#1 checking url part for id 11553 +0s ... 0s

#2 checking url part for id 12234 +0s ... 0s

#3 not redirecting to Ajax server +0s ... 0s

#4 did not recreate cache, as it is less than 5 days old! Created at Wed, 22 May 2024 05:37:27 +0200 +0.001s ... 0.001s

#5 composed specs +0.028s ... 0.029s

#6 did output specs +0s ... 0.029s

#7 getting avg benchmarks for device 12244 +0.019s ... 0.048s

#8 got single benchmarks 12244 +0.011s ... 0.058s

#9 getting avg benchmarks for device 11553 +0.017s ... 0.075s

#10 got single benchmarks 11553 +0.011s ... 0.087s

#11 getting avg benchmarks for device 12234 +0.016s ... 0.102s

#12 got single benchmarks 12234 +0.014s ... 0.116s

#13 got avg benchmarks for devices +0s ... 0.116s

#14 min, max, avg, median took s +0.477s ... 0.592s

#15 return log +0s ... 0.592s

Please share our article, every link counts!
> Expert Reviews and News on Laptops, Smartphones and Tech Innovations > Benchmarks / Tech > Processor Comparison - Head 2 Head
Redaktion, 2017-09- 8 (Update: 2023-07- 1)