

Lenovo ThinkPad T14 G3 review: Business laptop is better with AMD Ryzen Pro
he ThinkPad T14 and its predecessors have been among the most popular and best 14-inch business laptops for many years. Lenovo is now introducing an extensive redesign in the new T14 G3, including a new case that is now once again equipped with a 16:10 panel. The manufacturer continues to offer models with AMD and Intel CPUs, but the differences go a little further, the technical details of which will be revealed in the course of our review.
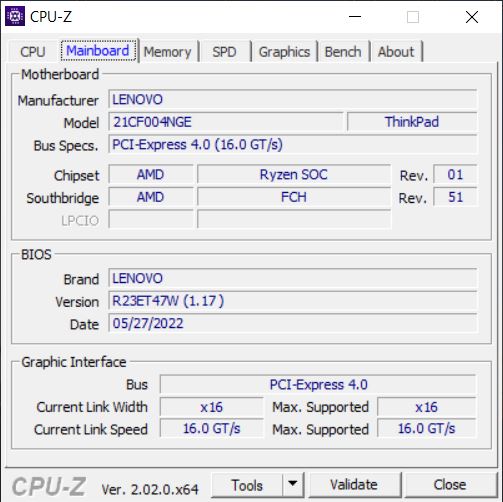
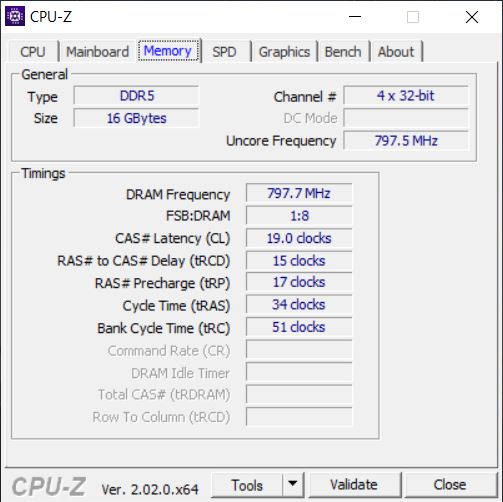
Our review sample is the ThinkPad T14 G3-21CF004NGE model with an AMD Ryzen 7 Pro 6850U, an integrated Radeon 680M GPU, 16 GB of LPDDR5-6400 RAM, a 512 GB PCIe 4.0 SSD, and a 14-inch display in 16:10 format with a resolution of 1920x1200. The RRP for this configuration is 1,859 Euros (~US$1,800), or 1,649 Euros (~US$1,596) for the identical Campus model.
Prices of the basic model, namely the T14 G3 AMD with the Ryzen 5 Pro 6650U, vary from country to country (see "Price and Availability" at the end of this review for more details). In the US, for example, the starting price is US$1,038.95. For the Intel variant with the Core i5-1235U, this is US$1,054.50.
Possible Competitors in Comparison
Rating | Date | Model | Weight | Height | Size | Resolution | Price |
|---|---|---|---|---|---|---|---|
| 88.8 % v7 (old) | 09 / 2022 | Lenovo ThinkPad T14 G3-21CF004NGE R7 PRO 6850U, Radeon 680M | 1.4 kg | 17.9 mm | 14.00" | 1920x1200 | |
| 90.1 % v7 (old) | 04 / 2022 | Dell Latitude 7420 JW6MH i5-1145G7, Iris Xe G7 80EUs | 1.3 kg | 17.3 mm | 14.00" | 1920x1080 | |
| 90.3 % v7 (old) | 09 / 2022 | Huawei MateBook X Pro 2022 i7-1260P, Iris Xe G7 96EUs | 1.3 kg | 15.6 mm | 14.20" | 3120x2080 | |
| 88.6 % v7 (old) | 07 / 2022 | HP EliteBook 845 G9 6F6H6EA R9 PRO 6950HS, Radeon 680M | 1.5 kg | 19.3 mm | 14.00" | 1920x1200 | |
| 88.1 % v7 (old) | 05 / 2021 | Lenovo ThinkPad T14 Gen2-20W1S00000 i7-1165G7, GeForce MX450 | 1.5 kg | 17.9 mm | 14.00" | 1920x1080 | |
| 90.1 % v7 (old) | 03 / 2022 | Lenovo ThinkPad T14s G2 20XGS01100 R7 PRO 5850U, Vega 8 | 1.3 kg | 16.14 mm | 14.00" | 1920x1080 |
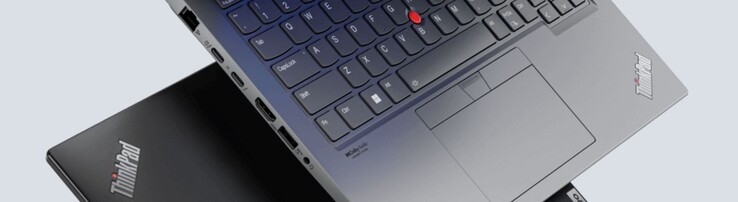
Case - ThinkPad with carbon fiber and magnesium
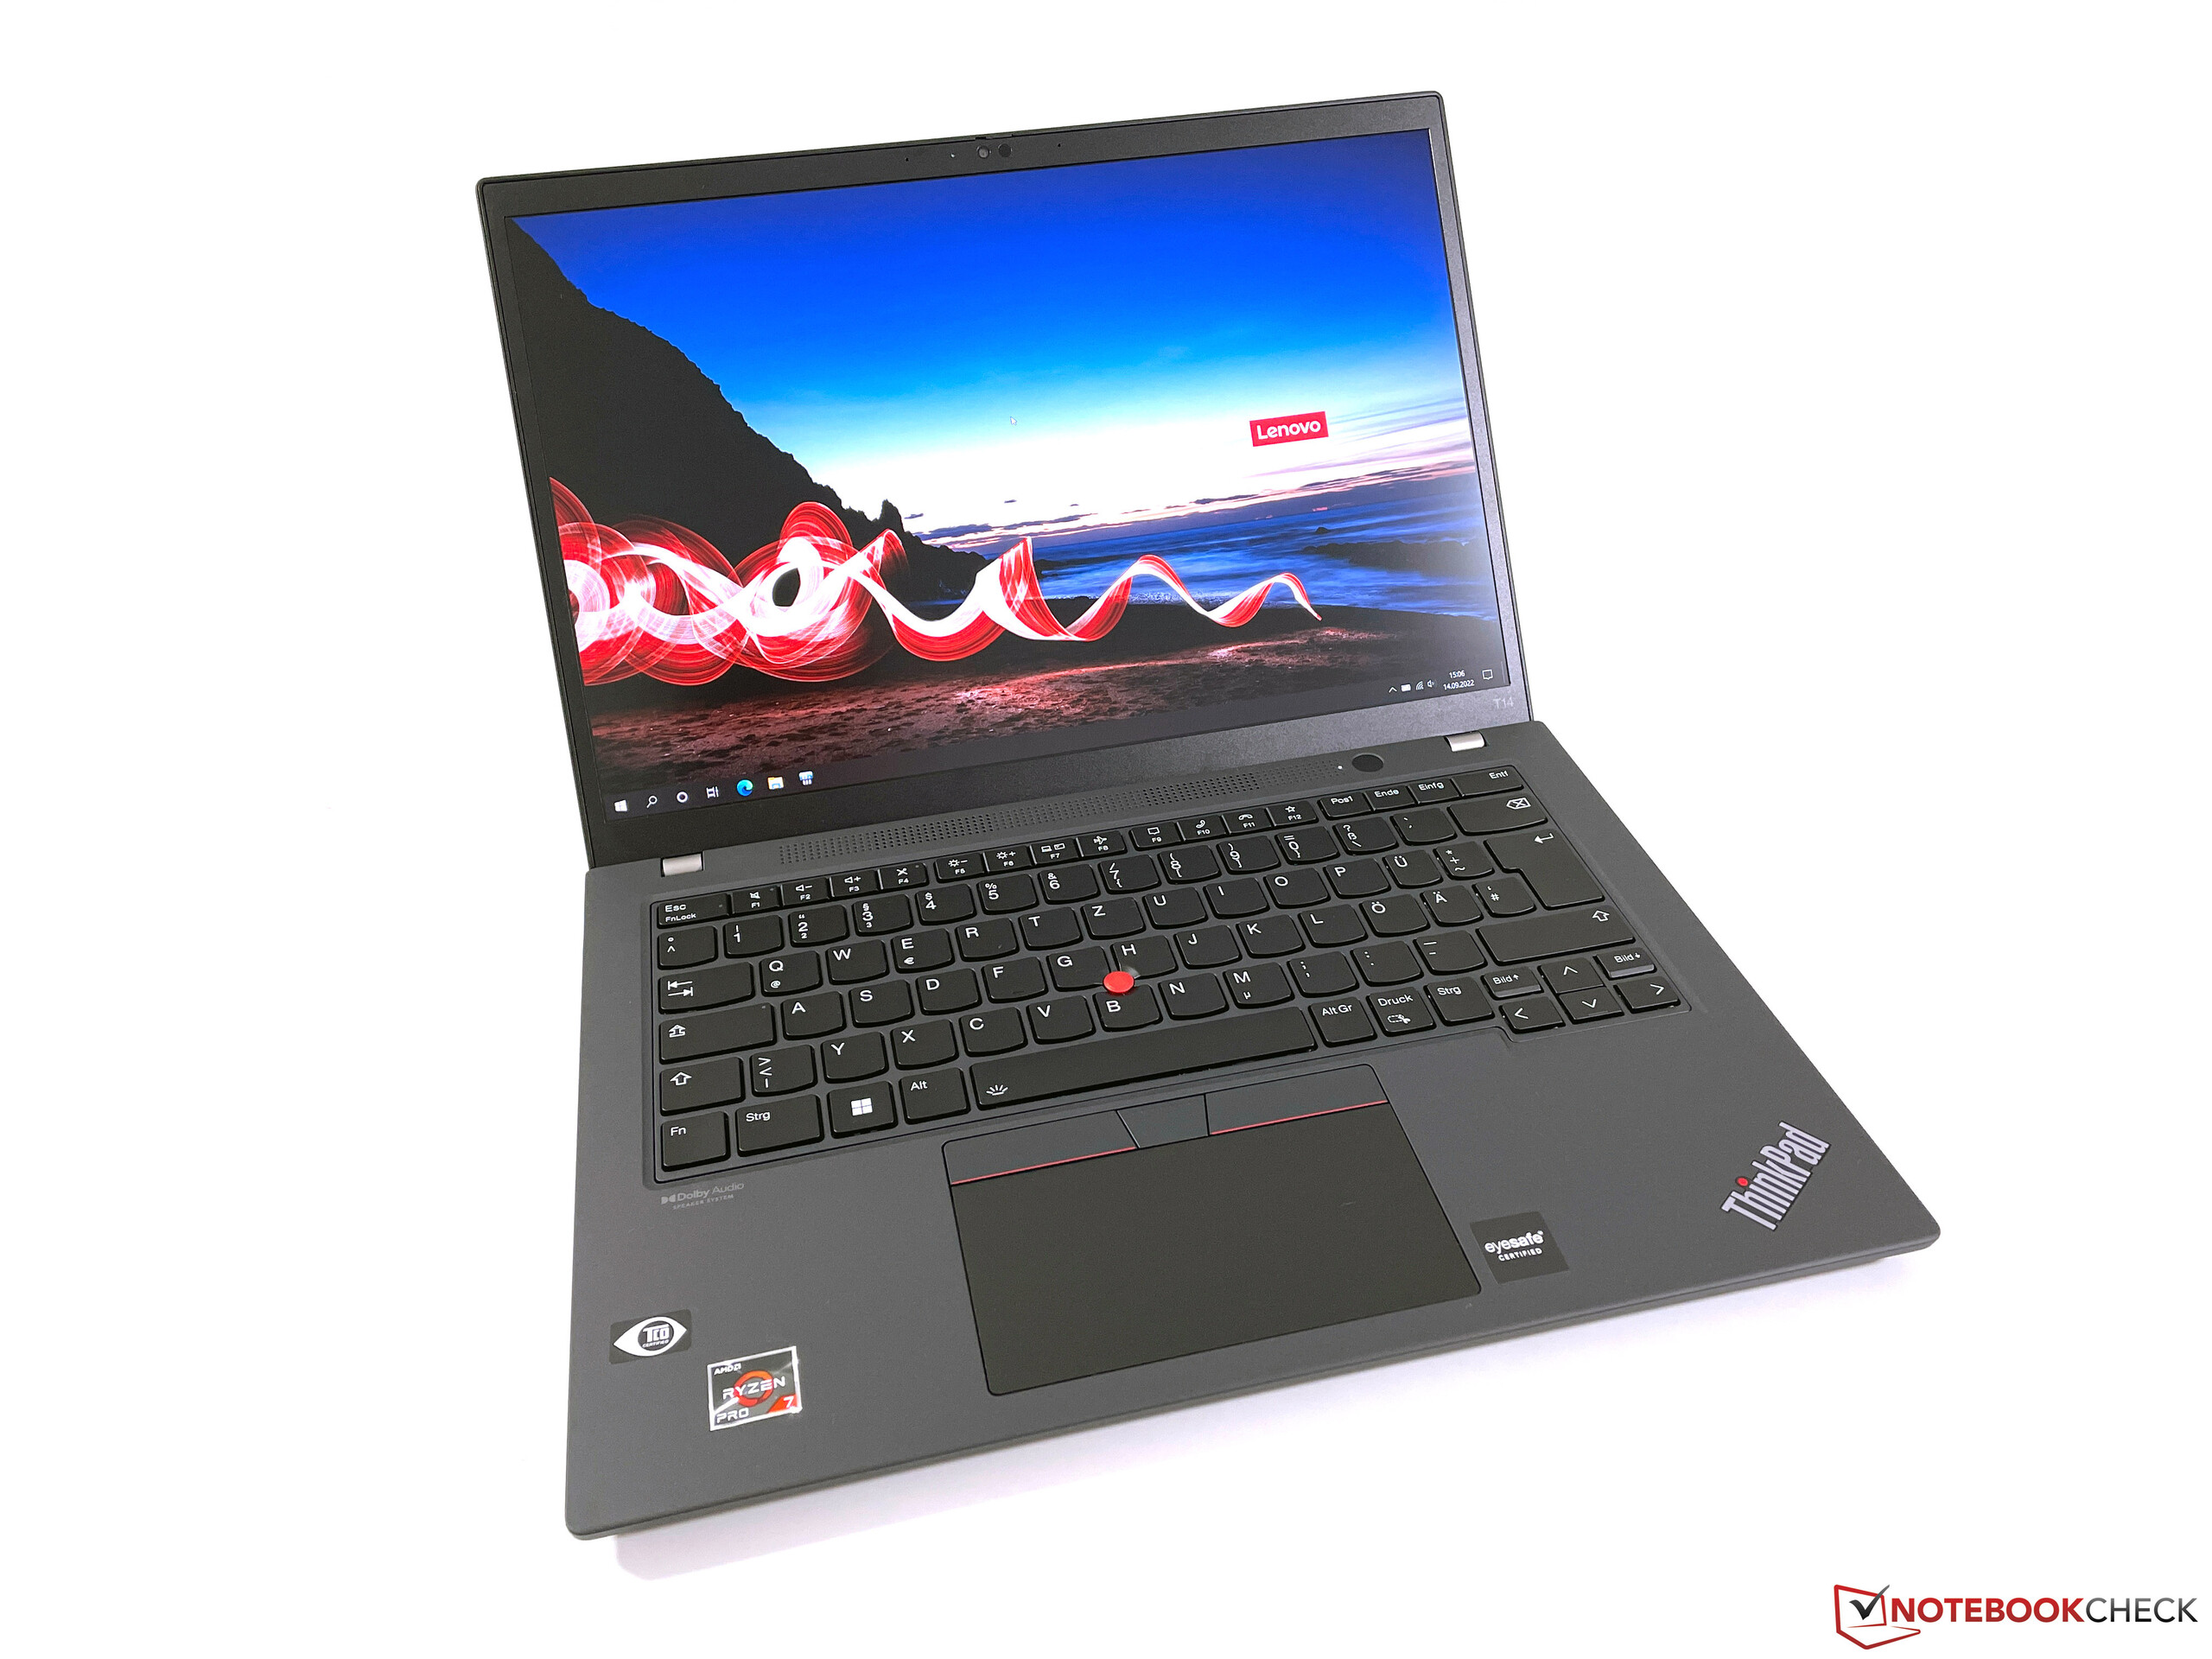
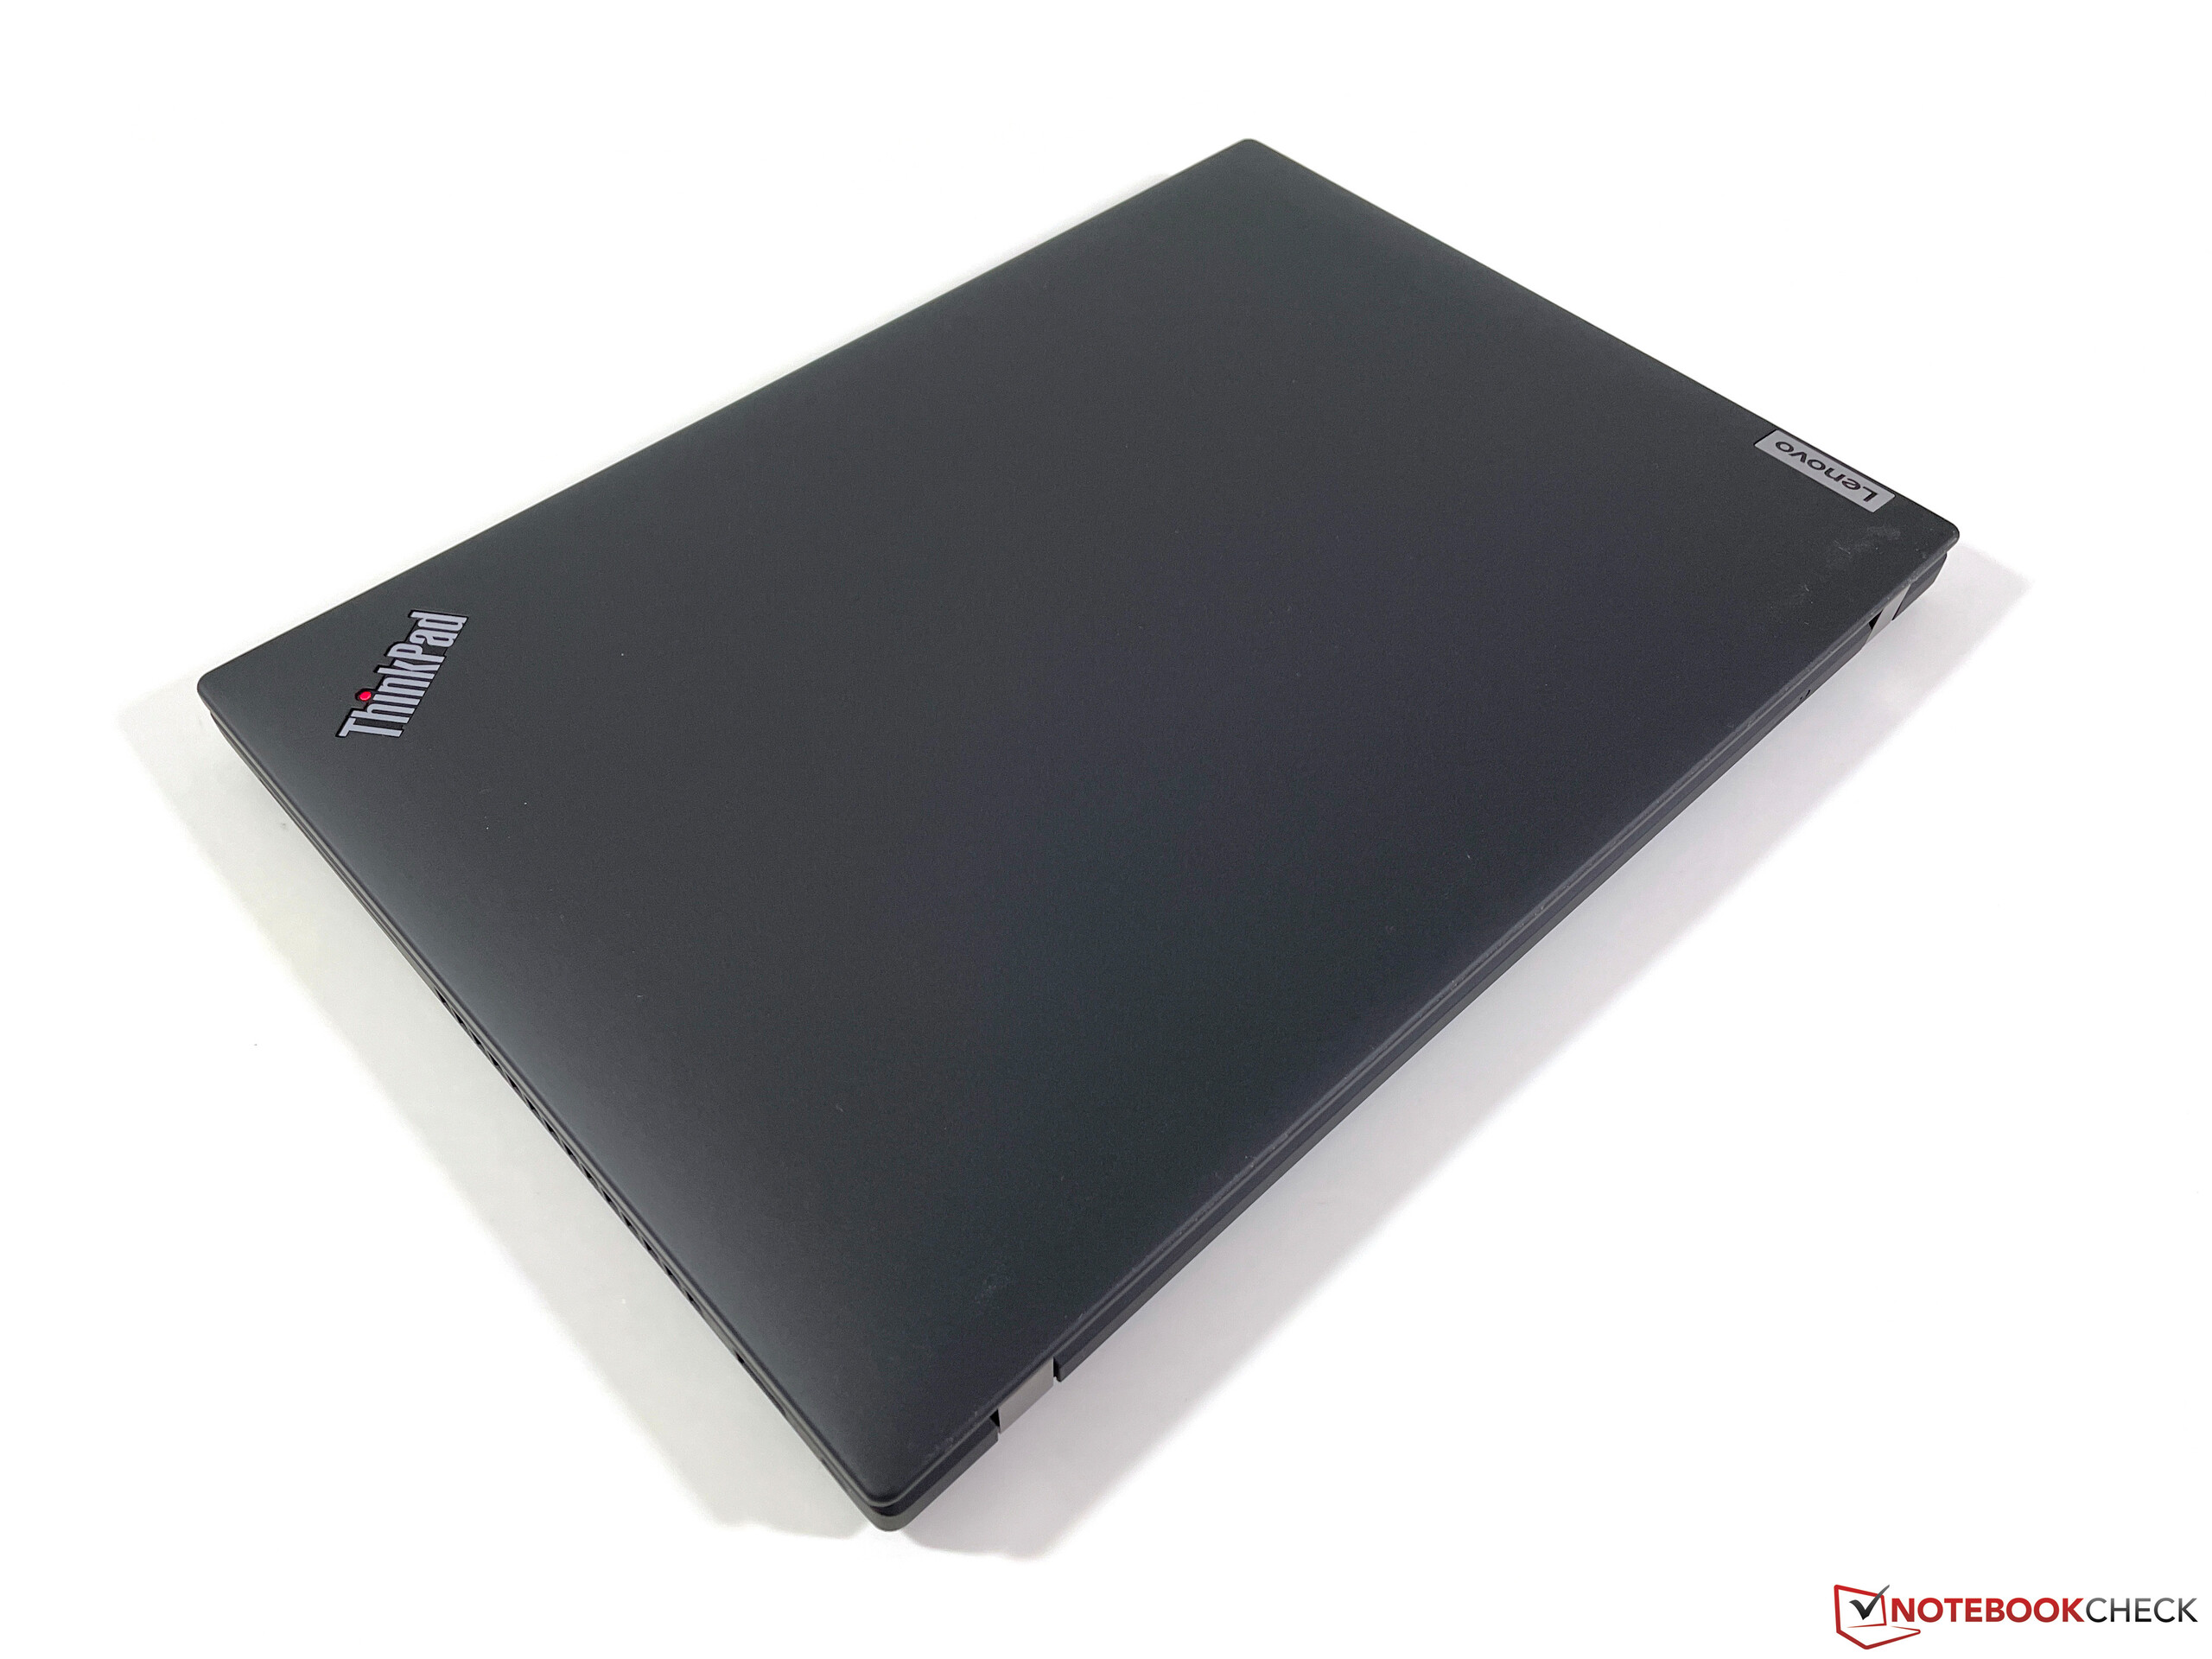
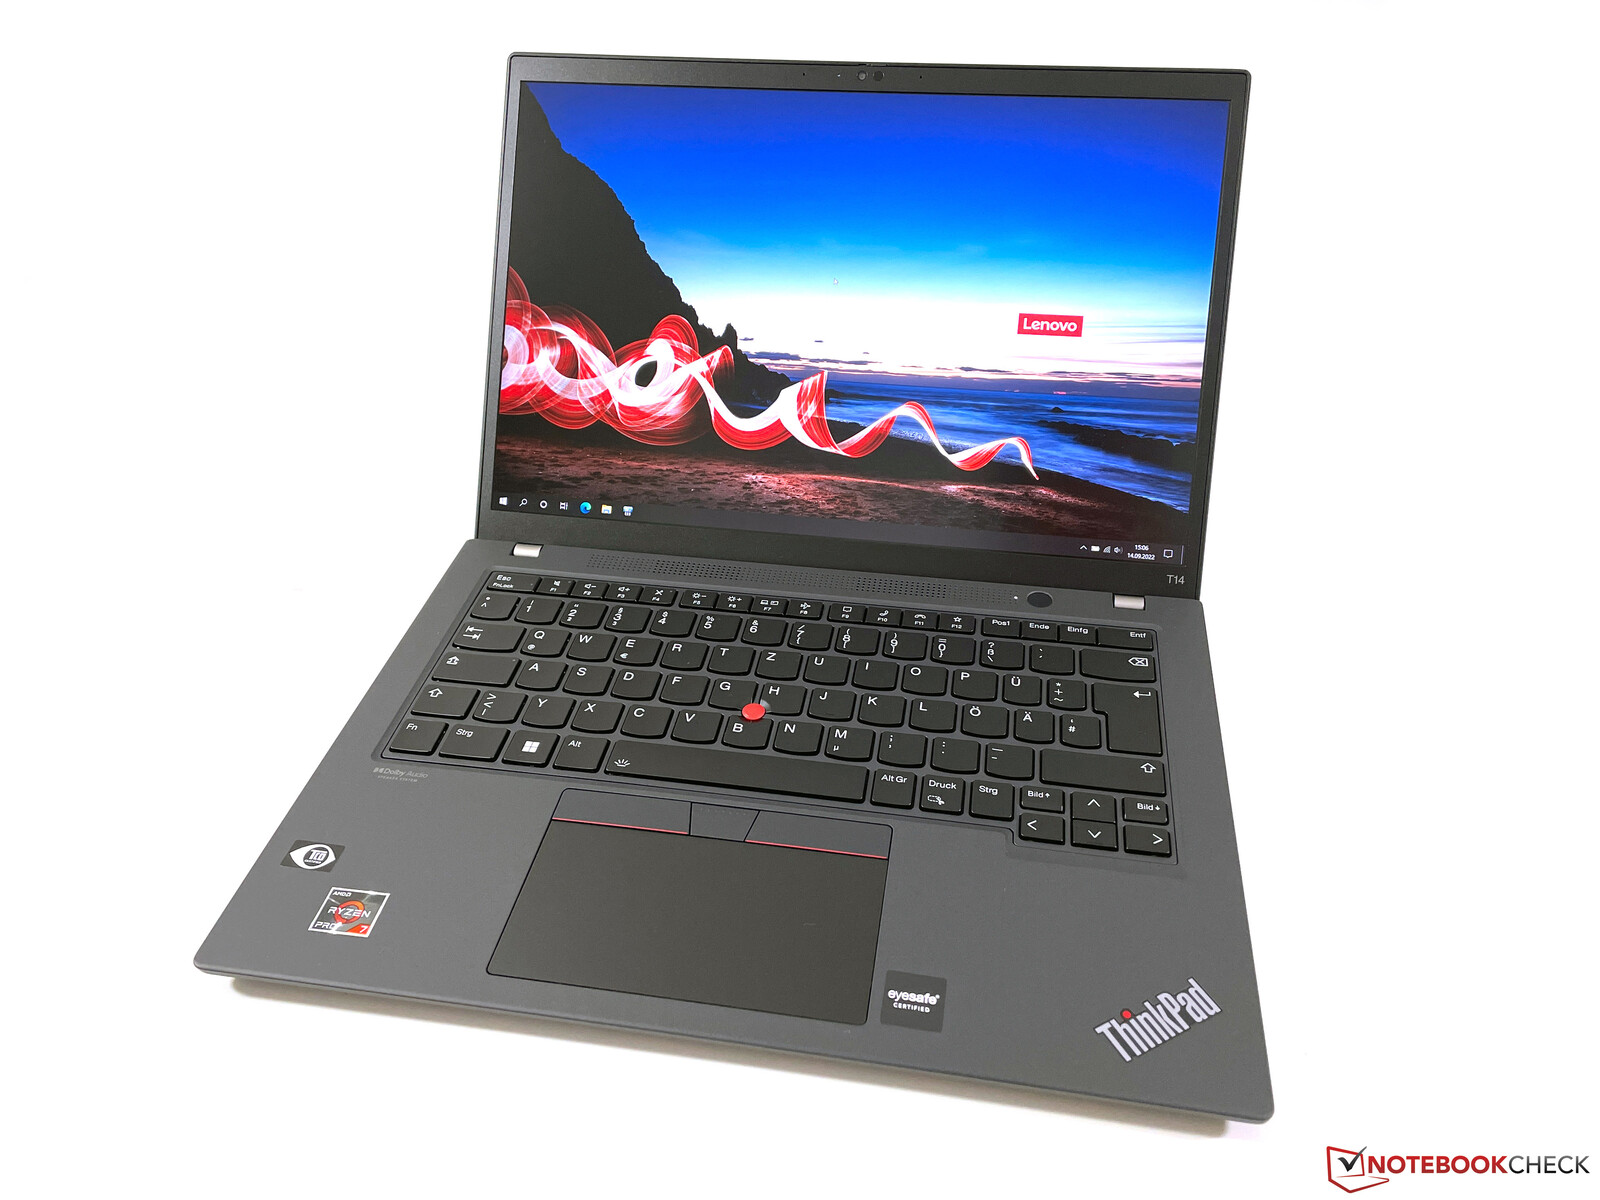
Although it is a new case, Lenovo has not changed the fundamental design and so the new T14 G3 is immediately recognizable as a ThinkPad. Yet there are two big differences to the predecessor: The case is now more anthracite-colored, i.e. a little brighter than before, so you can see the contrast to the black input devices. Moreover, the thinner screen edges are immediately noticeable; the very wide bottom edge in particular is now a thing of the past. Compared to contemporary consumer laptops, the edges are still quite wide at 8 mm on the sides and 14 mm above and below the panel, but the device now looks much more modern overall. In addition to the black/anthracite color variant, Lenovo also offers a silver variant with silver input devices.
A mix of materials are used for the case. For example, a fiberglass/magnesium combination is used for the baseplate and carbon/glass-fiber reinforced plastic for the lid. Surfaces feel minimally roughened or velvety, but a positive aspect is that we had considerably fewer problems with fingerprints during our review than in many other ThinkPads.
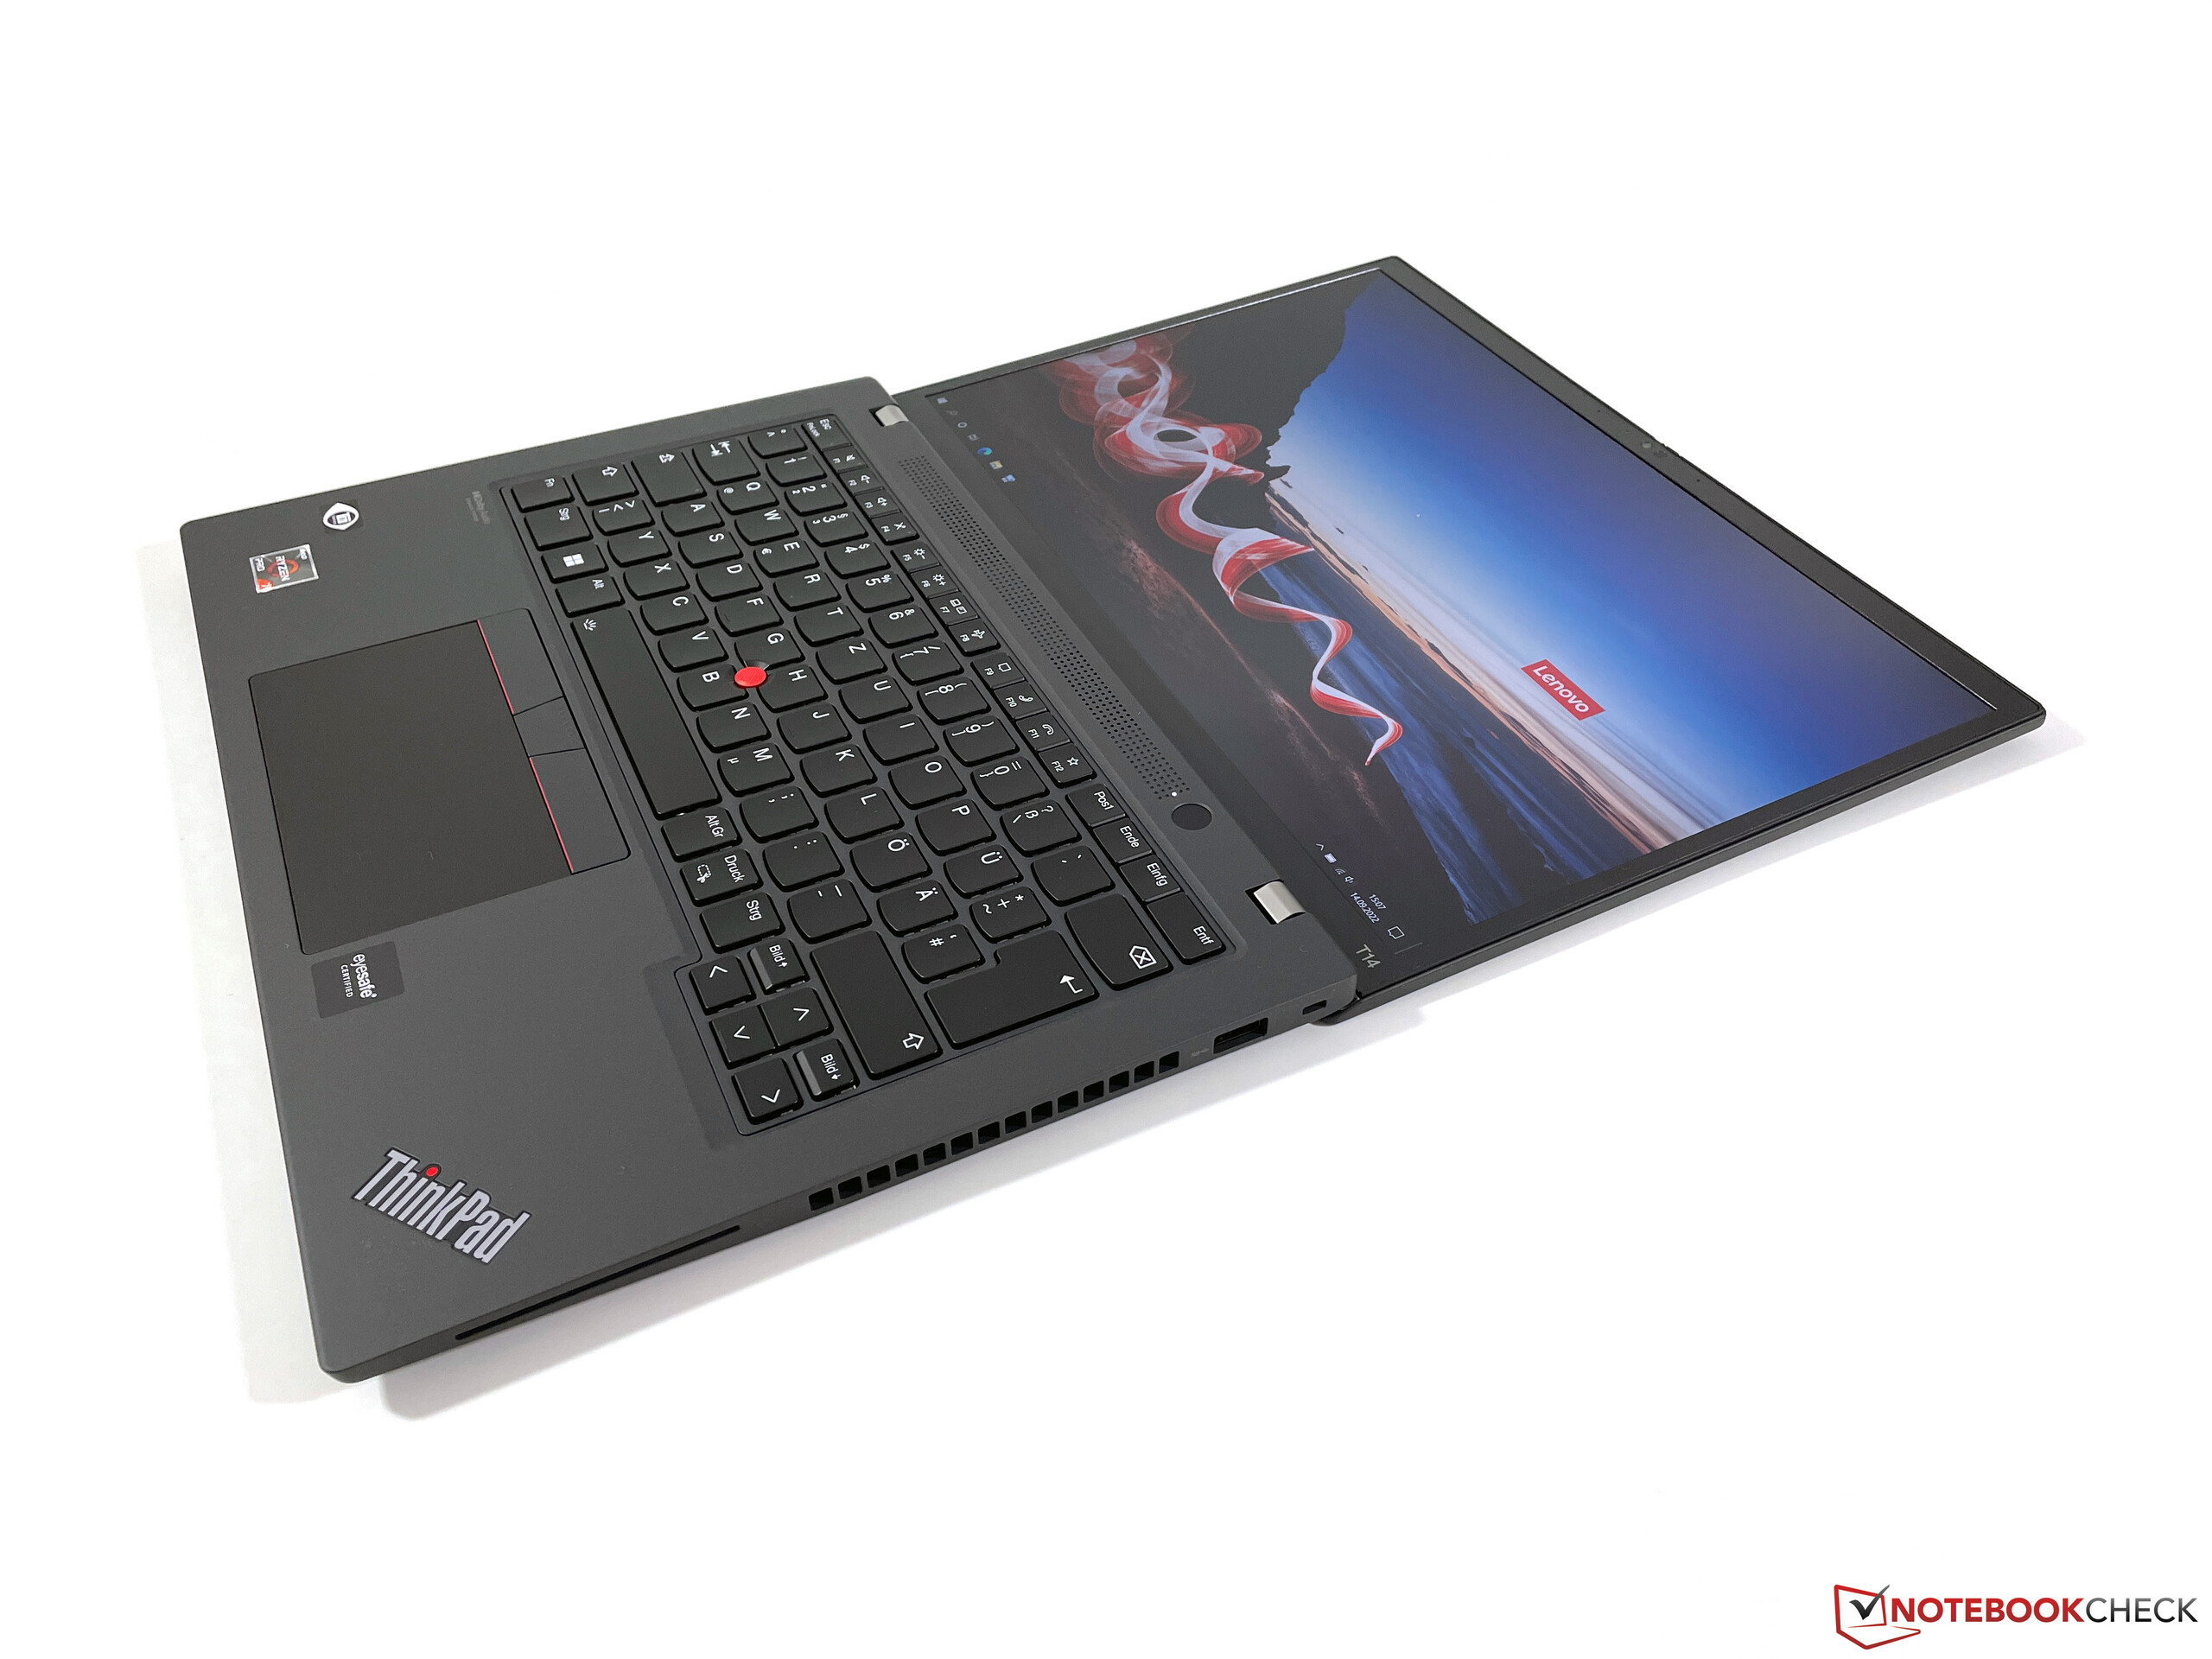
The stability of the base unit is good, but not outstanding. The center keyboard area can be visibly pressed in with a little force, but this does not translate to limitations in practice, even for very energetic typists. Slight creaking noises were heard when subjecting the base unit to torsional stress. The two hinges provide very good stability and effectively prevent the screen from teetering, but they are also very tight - changing the opening angle (max. 180 degrees) with just one hand is hardly possible, let alone opening the lid with one hand. The stability of the lid itself is excellent because it can hardly be bent (no creaking noises were registered here) and we were unable to elicit any image errors even with selective applications of pressure on the back.
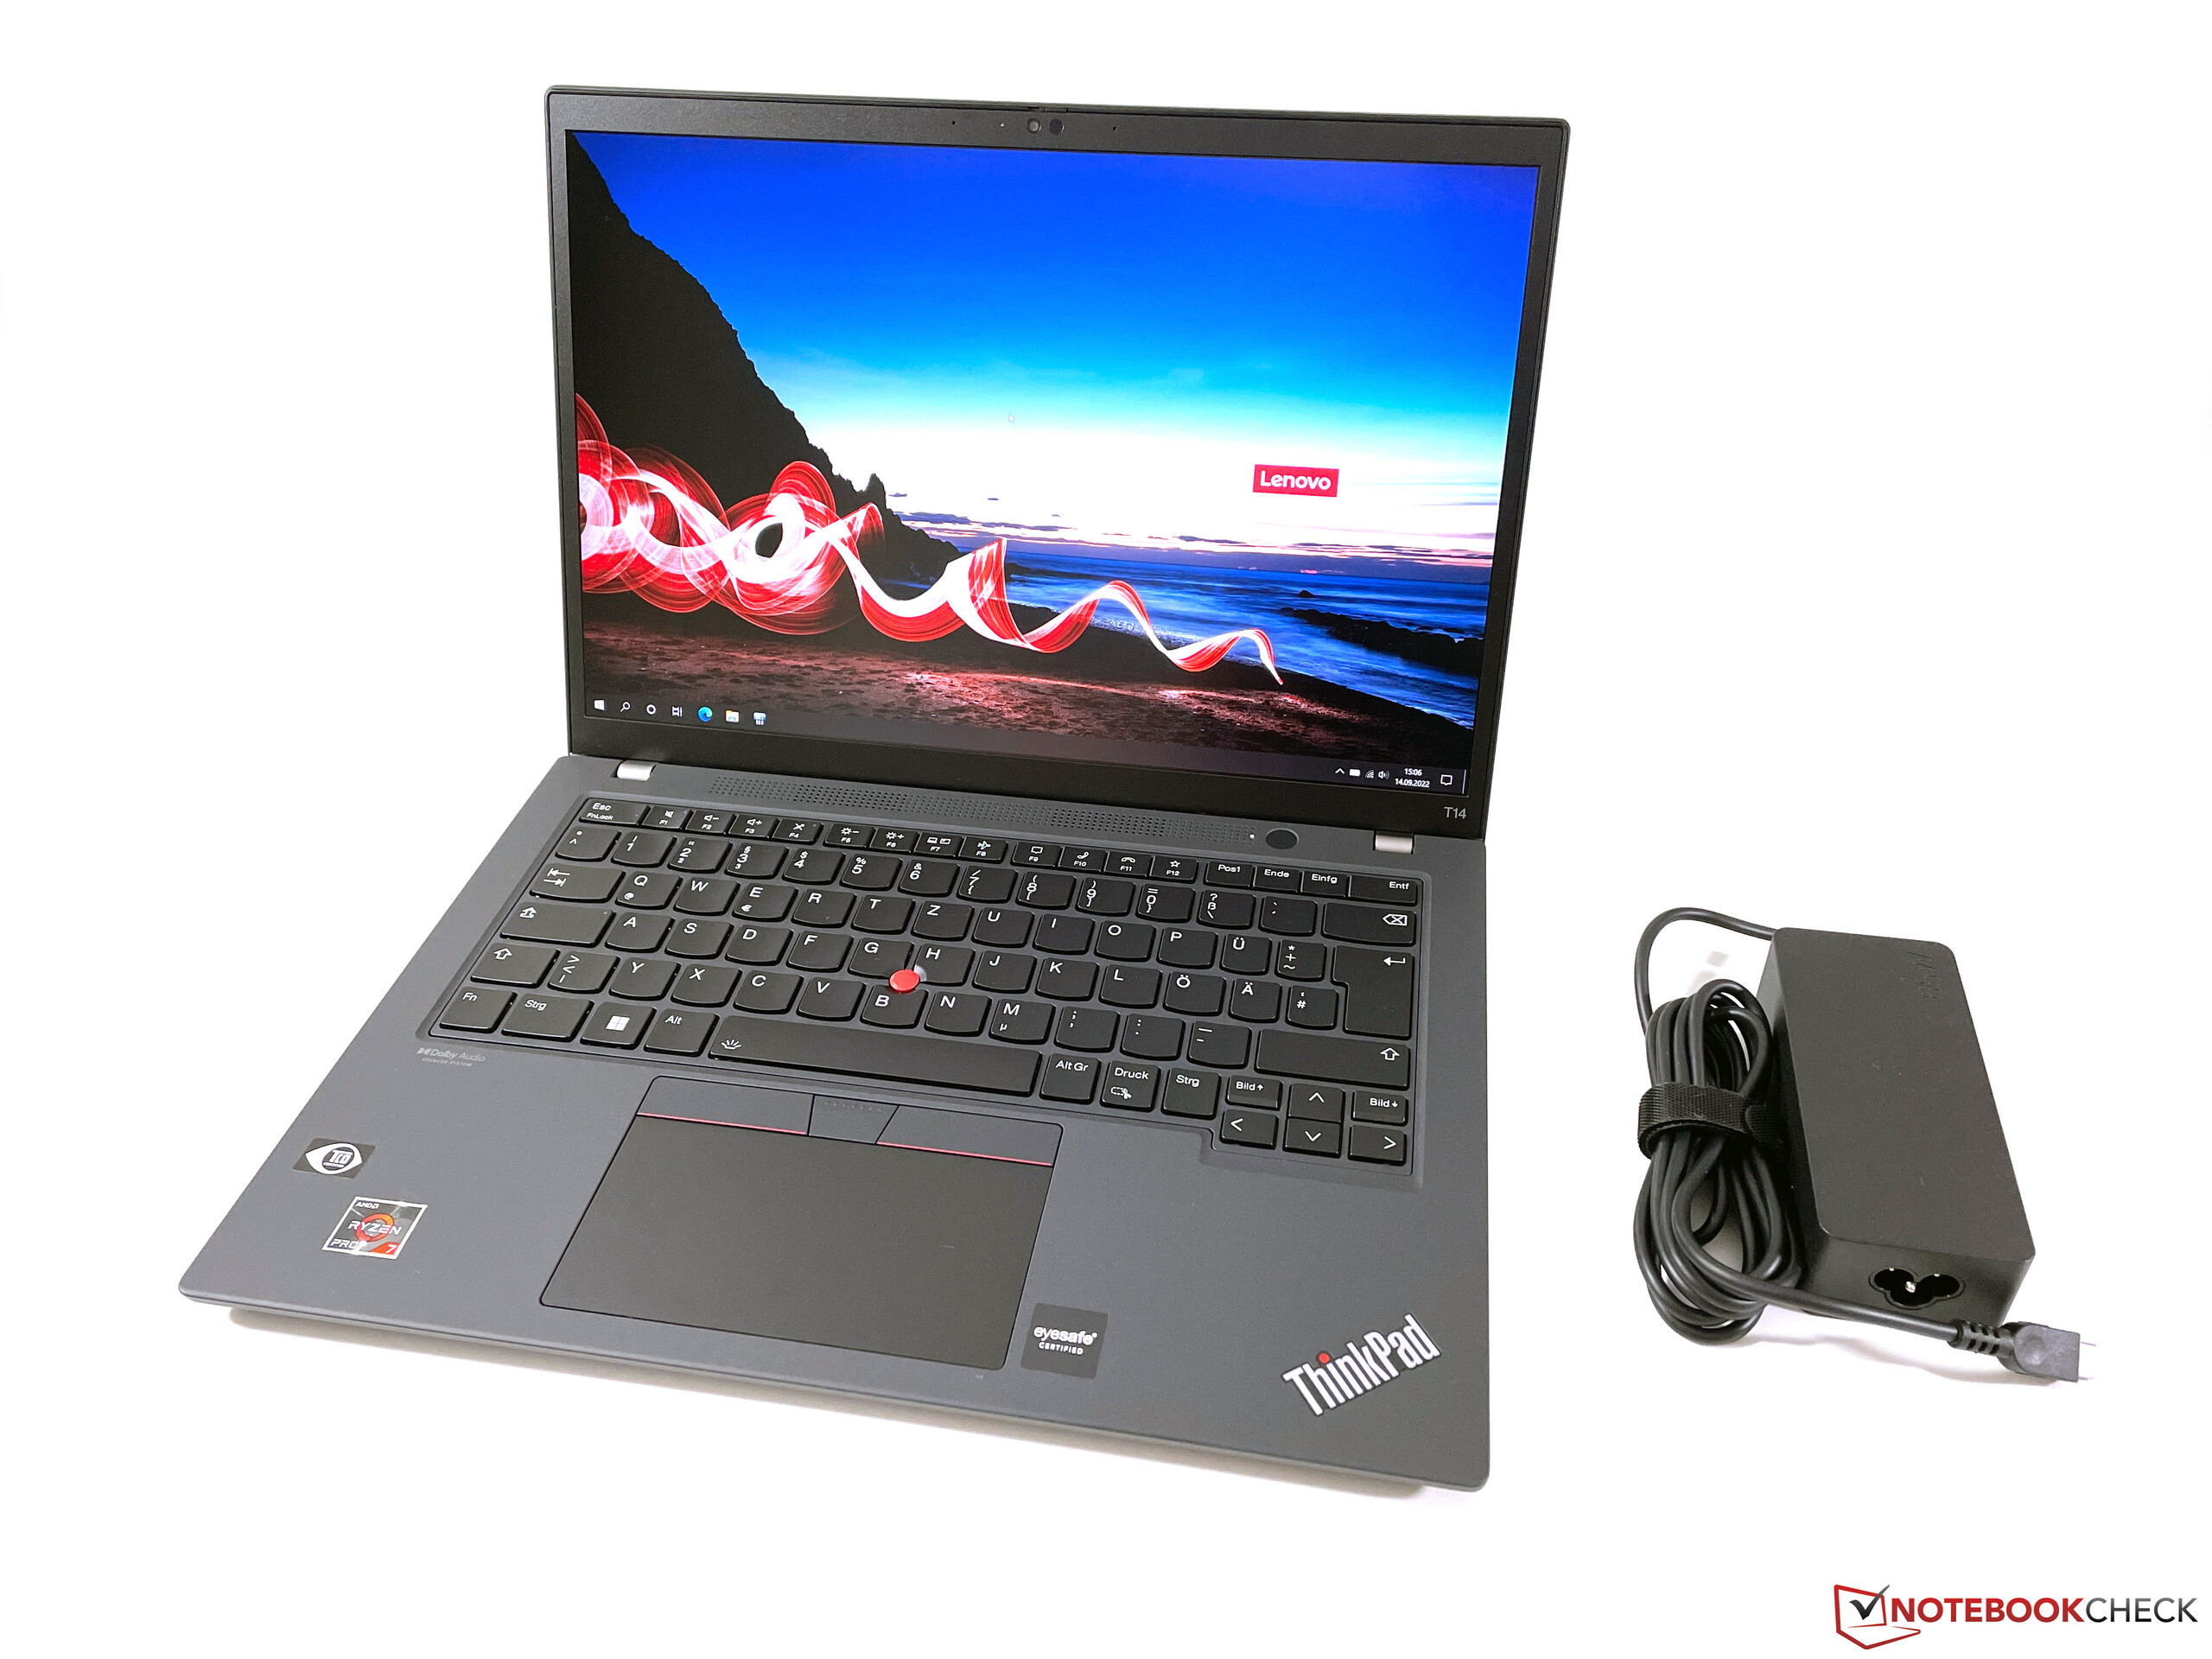
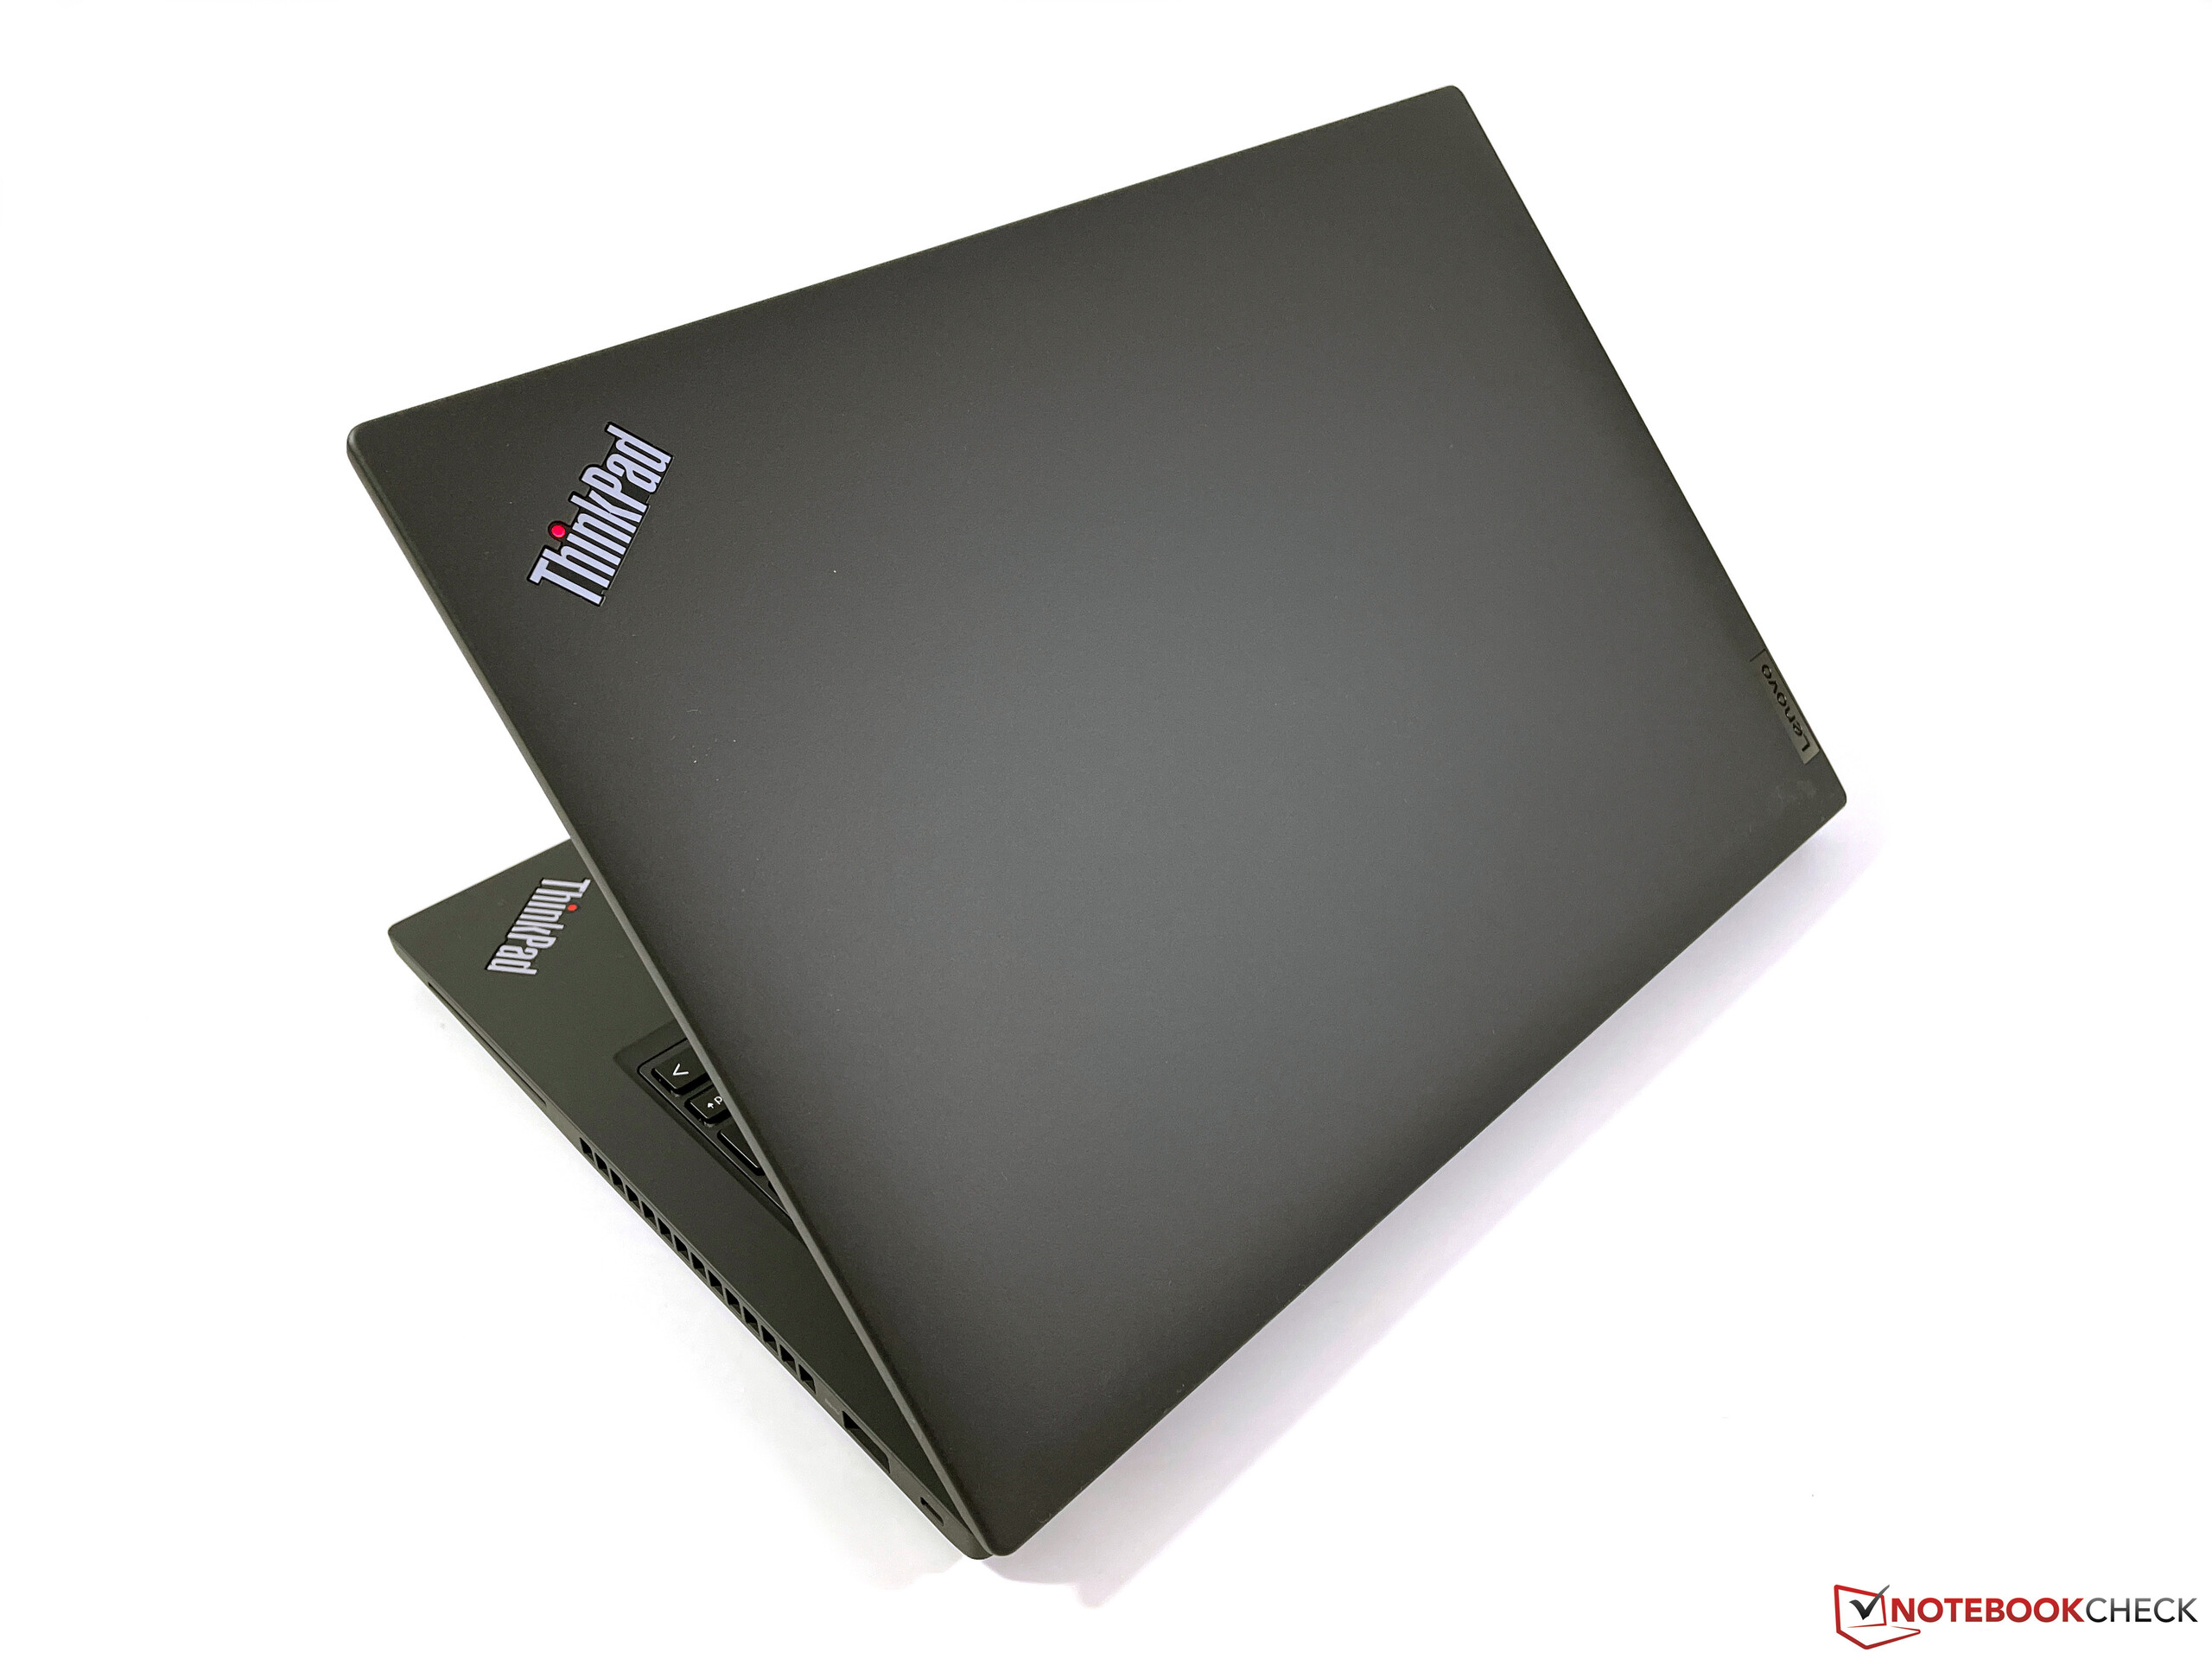
Compared to the predecessor, the new ThinkPad T14 G3 has become a bit slimmer, but at the same time, the 16:10 screen has not resulted in a deeper case. The weight is also slightly lower at just over 1.4 kg. Interestingly, Lenovo also offers a version with a smaller 3-cell battery that is around 100 grams lighter. The familiar 65-watt power adapter weighs around 350 grams and is also used for the Intel versions, even for the model with the dedicated GeForce MX550, which came as a strong surprise to us.
Equipment - Lenovo omits USB 4
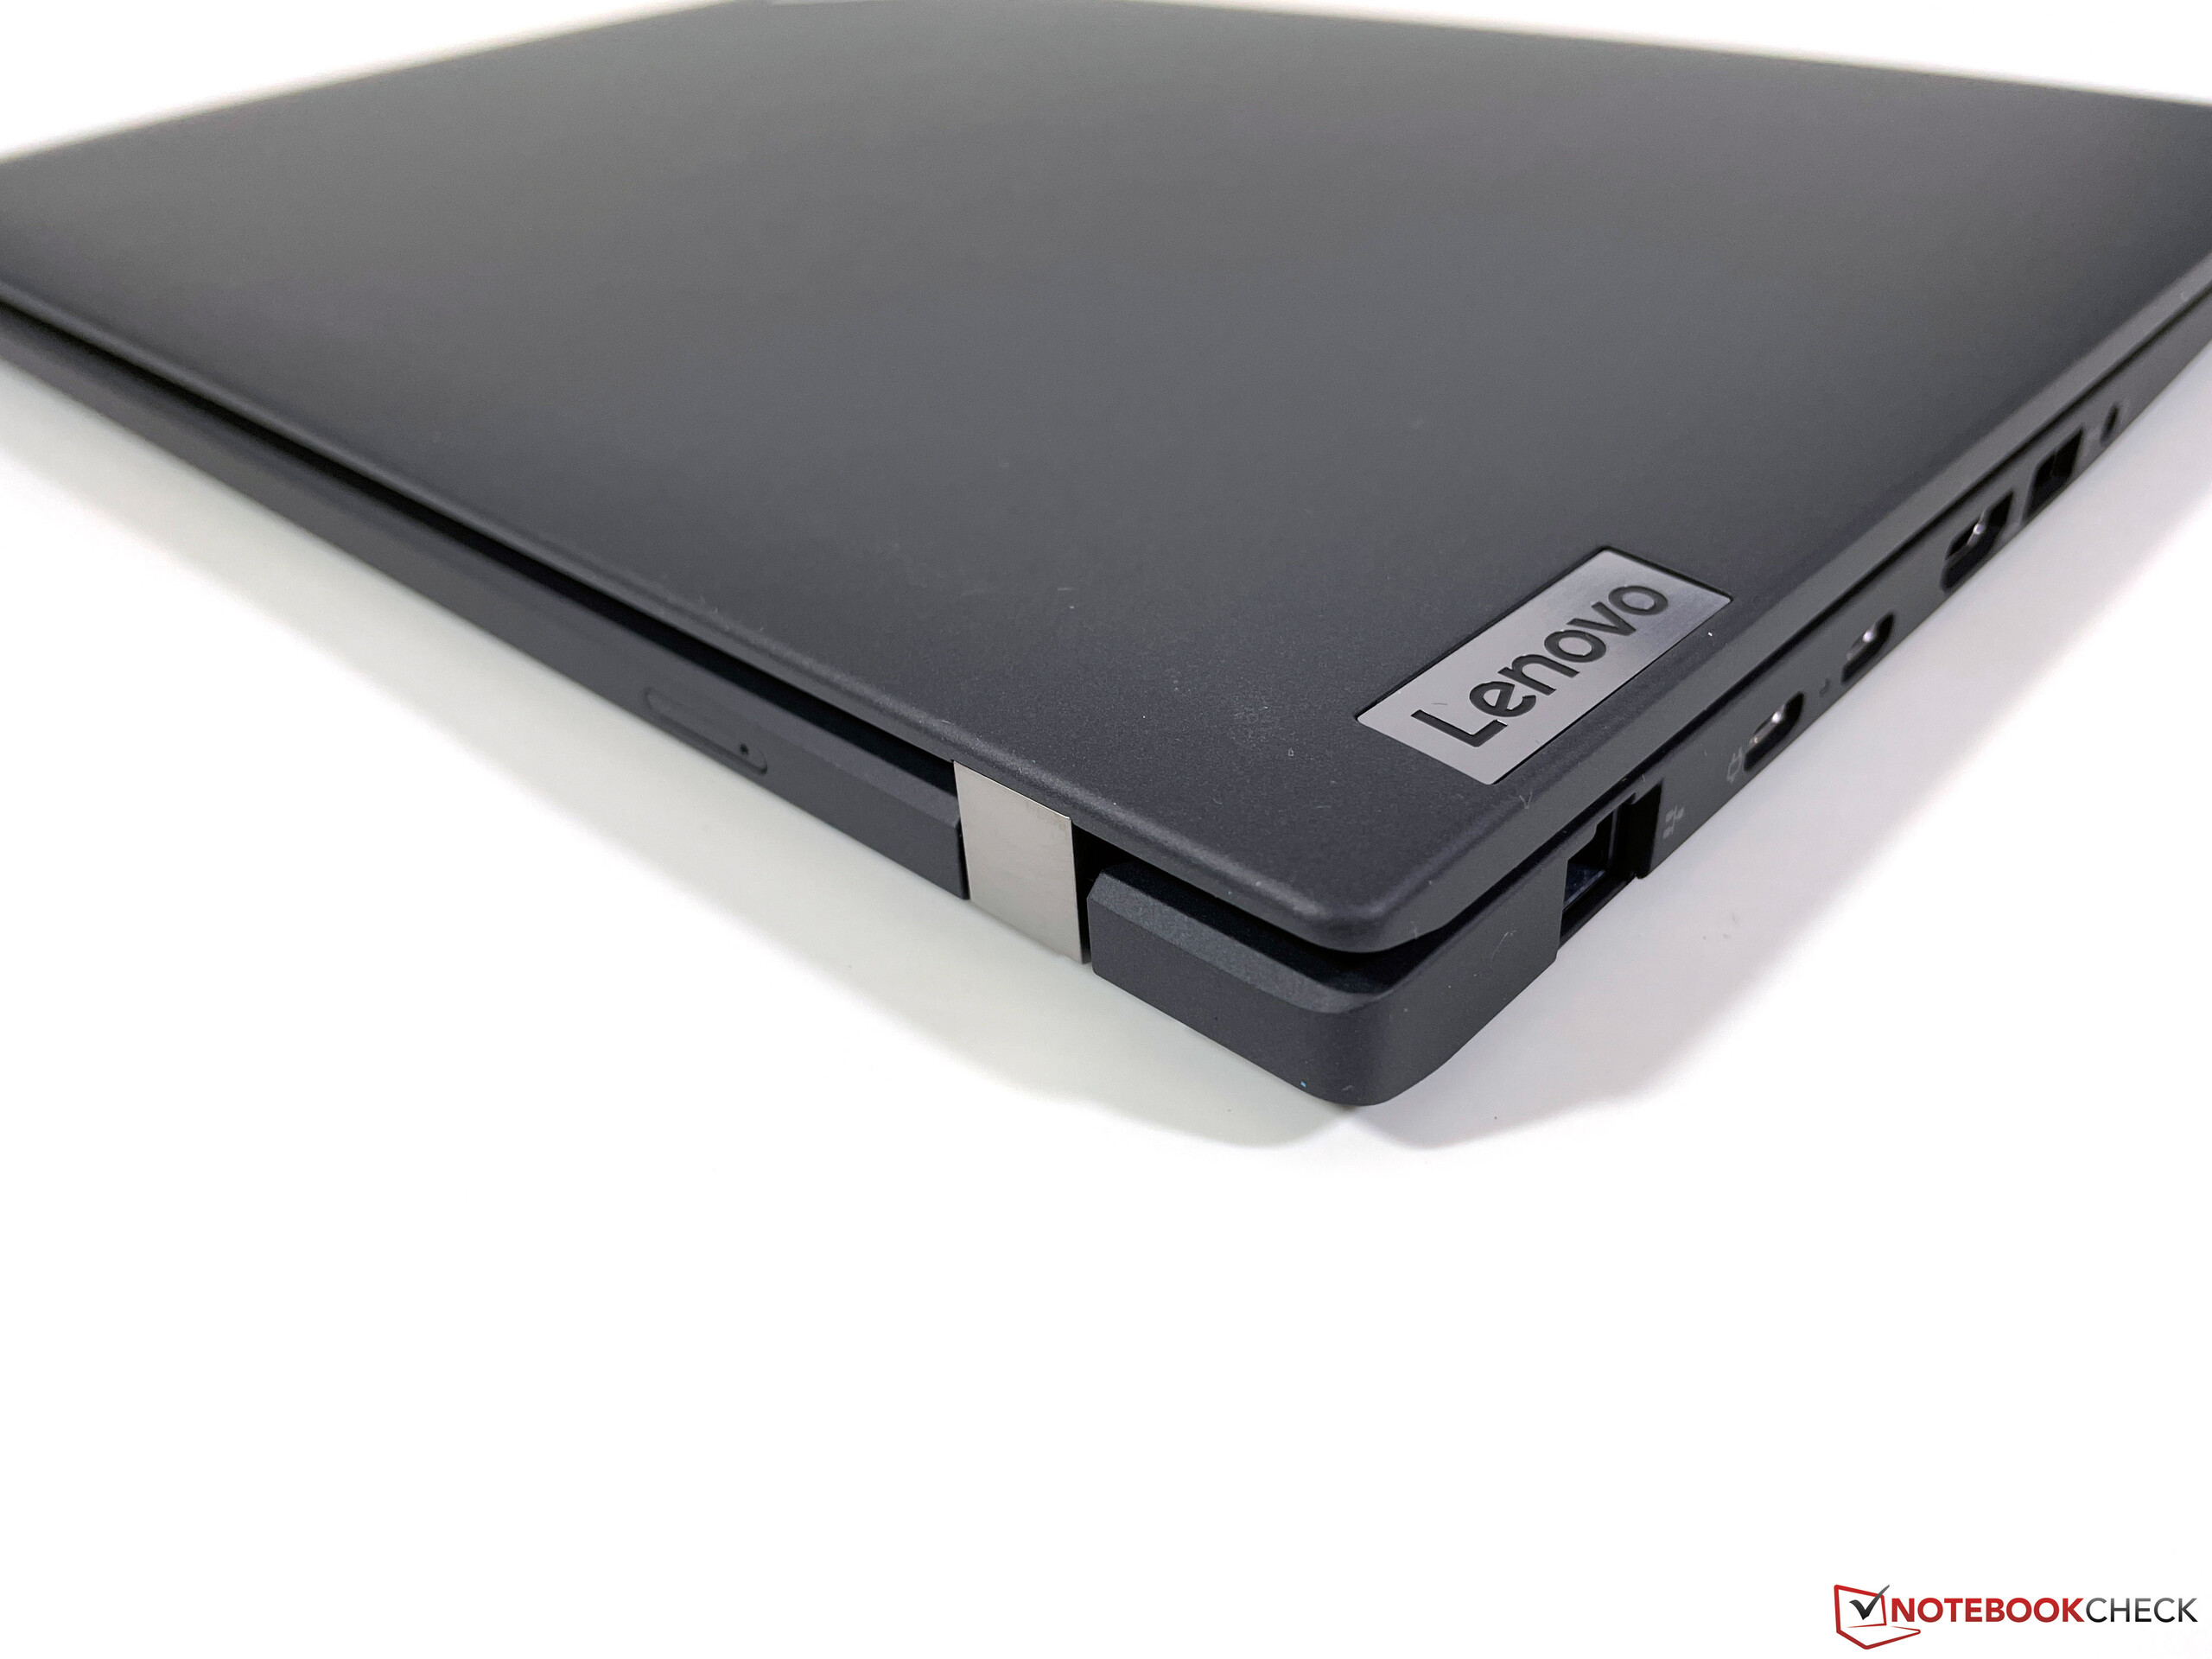
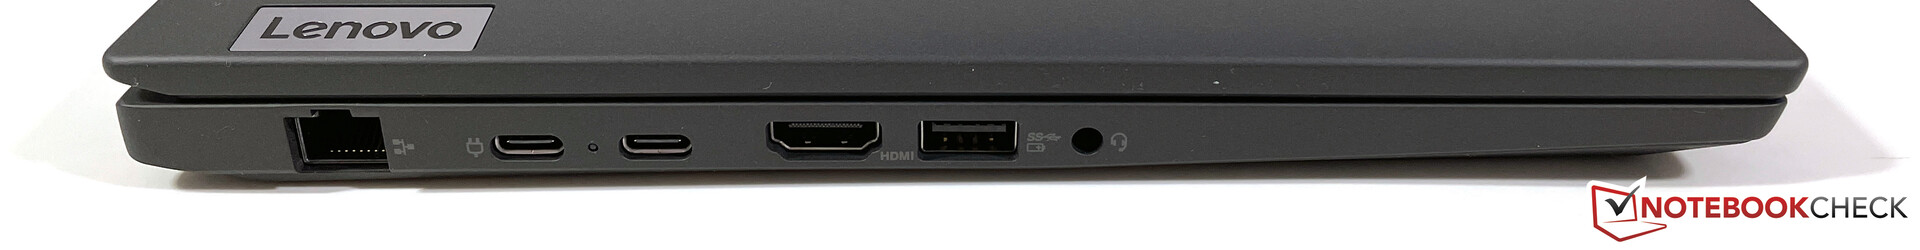
The ThinkPad T14 G3 offers a variety of ports, including normal USB-A ports, an HDMI output and a Gigabit Ethernet port. However, the omission of USB 4 is puzzling, since the two USB-C ports on the left support only the 3.2 Gen.2 standard. This is incomprehensible and, in our opinion, an unnecessary limitation, as Lenovo offers USB 4 support in the consumer models with the AMD CPUs. There is also an optional SmartCard reader on the front right. You'll also have to do without a card reader.


Communication
In terms of communication modules, you have almost the entire spectrum at your disposal because, in addition to a Gigabit Ethernet port, a modern Wi-Fi 6E module from Qualcomm (NFA725A) is used, which also supports Bluetooth 5.2 alongside the modern 6 GHz networks. Connection to the 6 GHz network of our Asus reference router functioned without any problems and both the transfer rates and the signal quality were excellent. There were also no problems when using a Wi-Fi 5 router (Fritz!Box 7590).
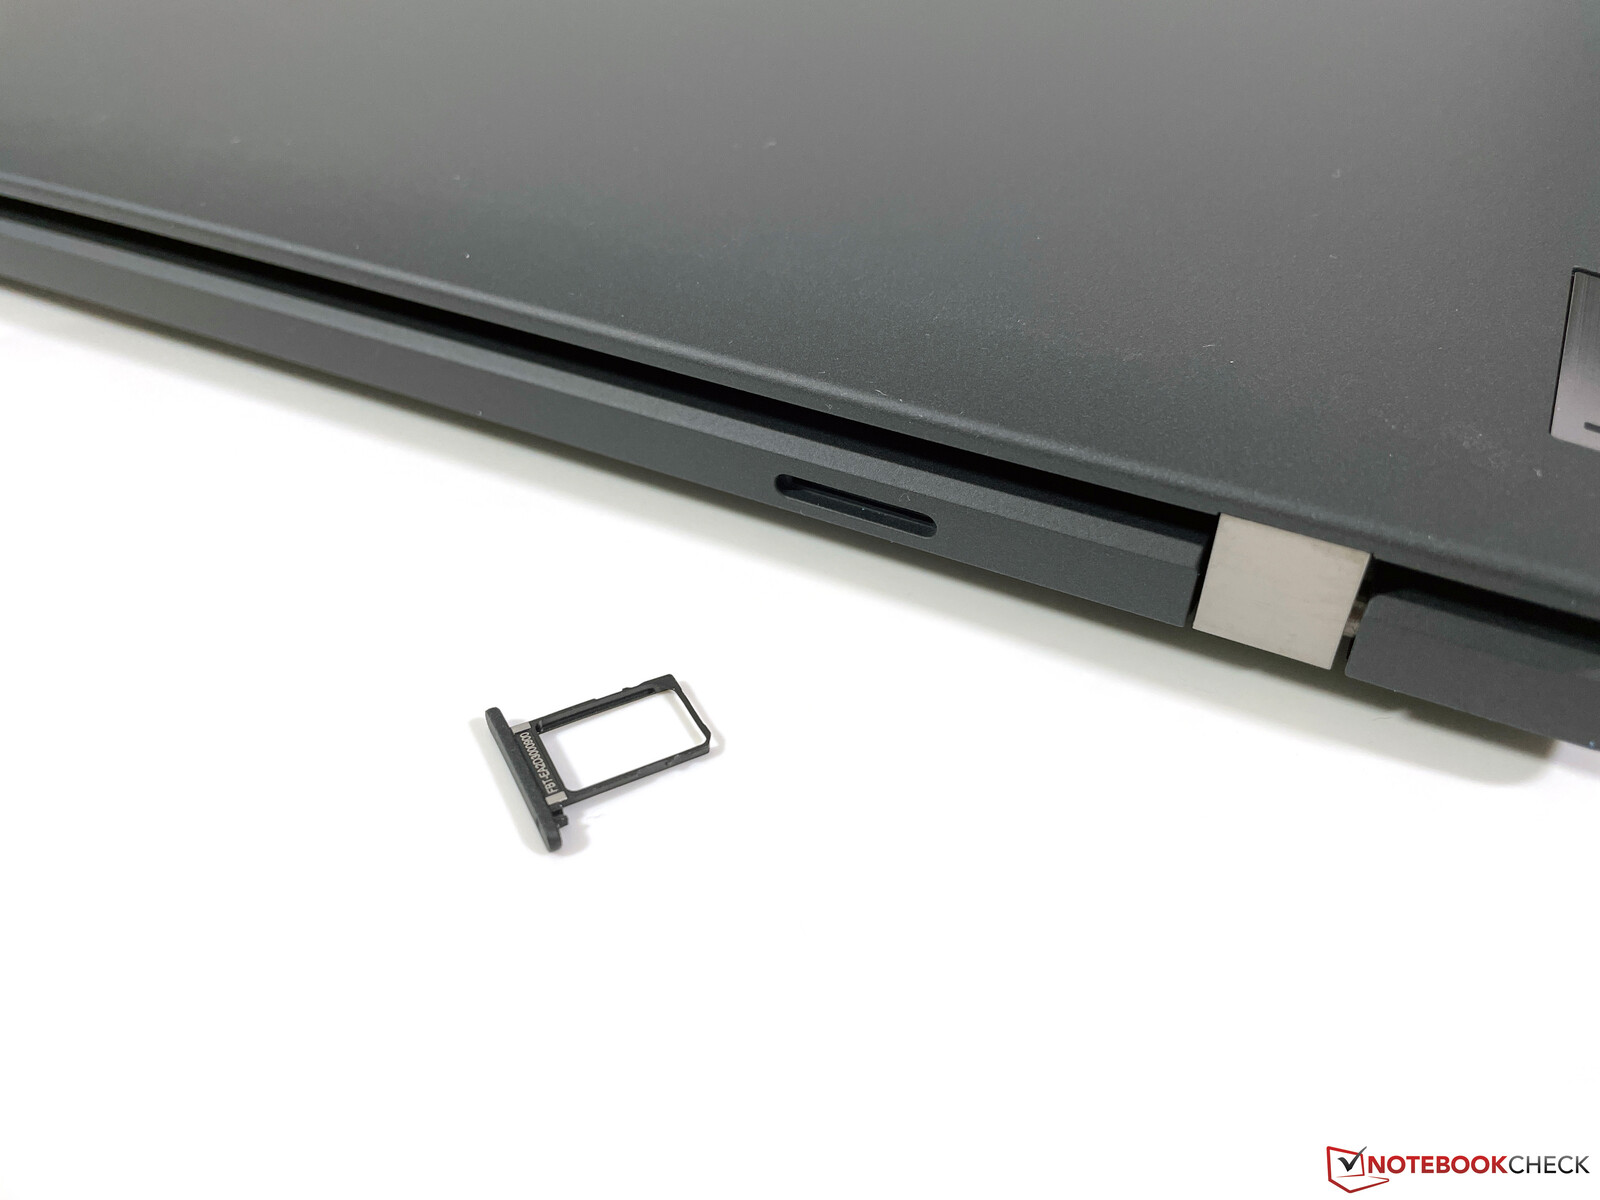
Those who are dependent on mobile internet have the option of configuring the T14 G3 with a WWAN module, but "only" a 4G/LTE module is used here; 5G modules are not available. However, you have to be careful when configuring or buying the device, since most configurations are not WWAN-ready, so there are no antennas and also no nano-SIM slot on the back. This is incomprehensible because Lenovo offers a WWAN-ready option in the configurator at no extra charge. Here you could simply deliver all models with WWAN, as was the case in the past.
Both the AMD and Intel versions of the T14 G3 are optionally available with the Quectel EM05-G WWAN module (LTE Cat.4) and each offer an eSIM as well as a nano-SIM slot. We were able to use a Telekom SIM card without any issue in testing and surfed in the LTE network without any problems. The signal strength was very good in urban areas and also better than that of a smartphone. According to the official spec sheet, there should also be a Fibocom L860 GL-16 module (Cat.16).
Webcam
Lenovo installs a 1080p webcam with a mechanical shutter in the upper screen bezel, which offers a better image quality compared to the old 720p sensors. An IR camera for facial recognition via Windows Hello has also been installed.


Maintenance
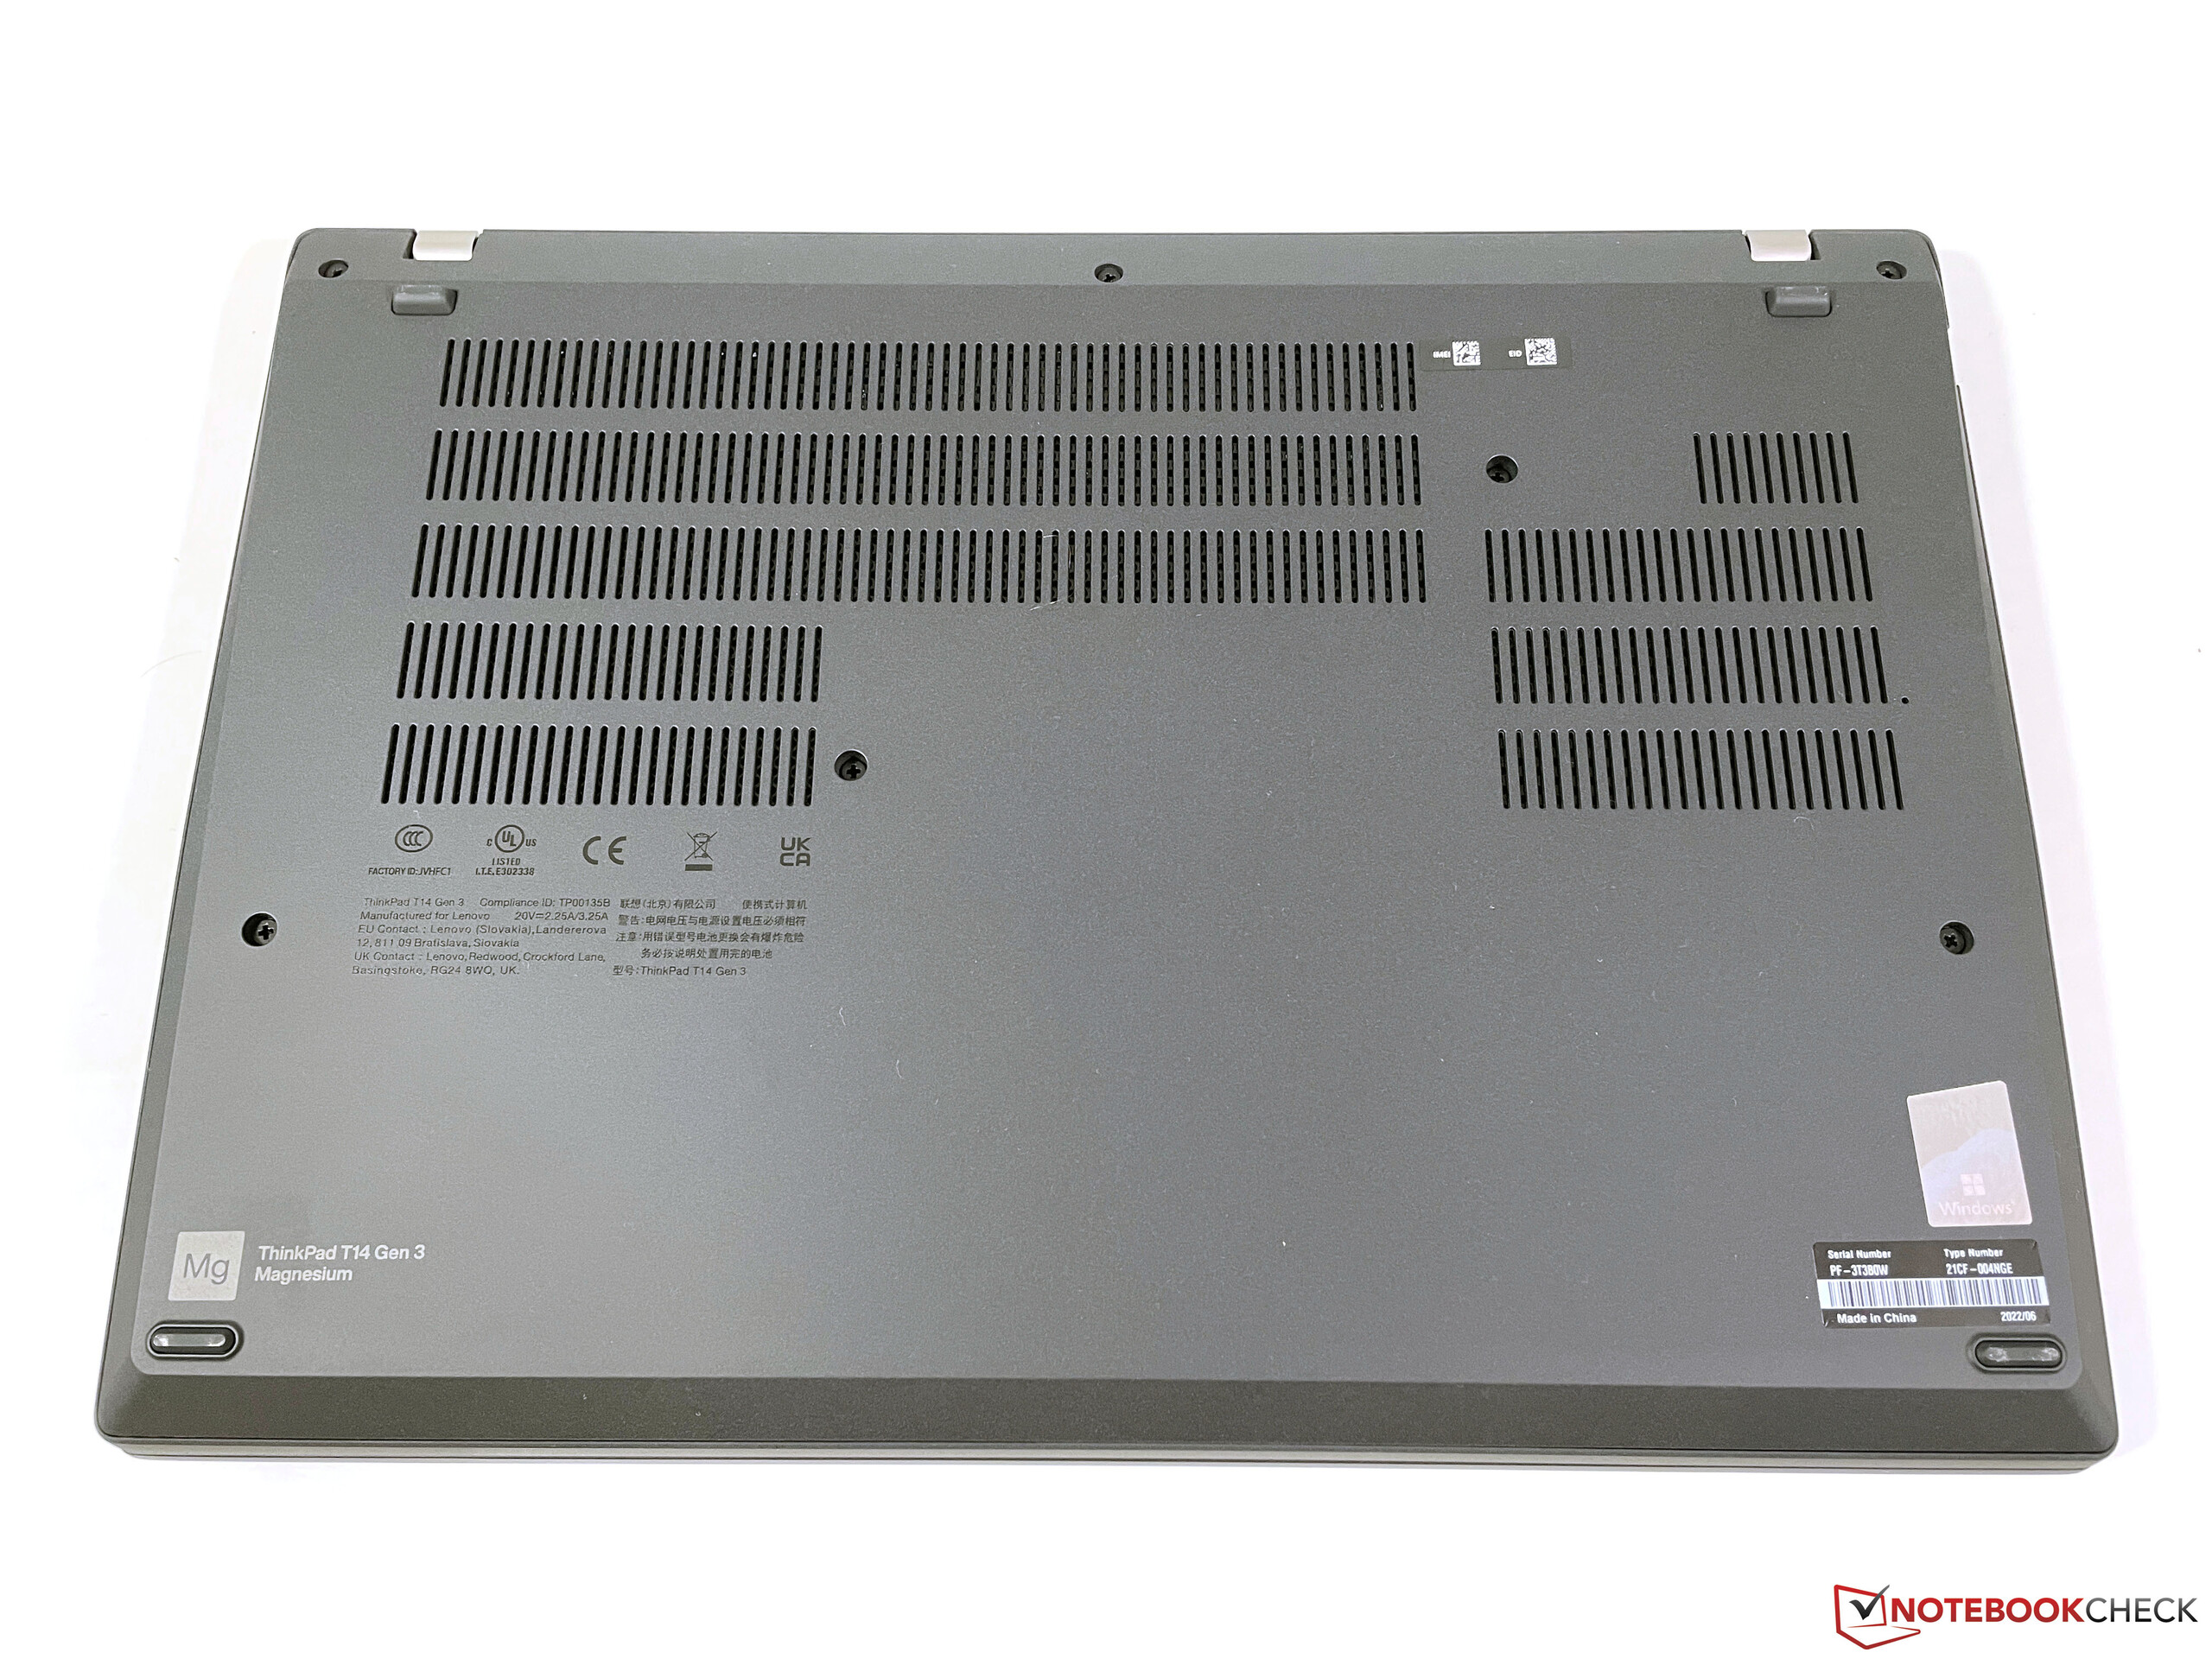
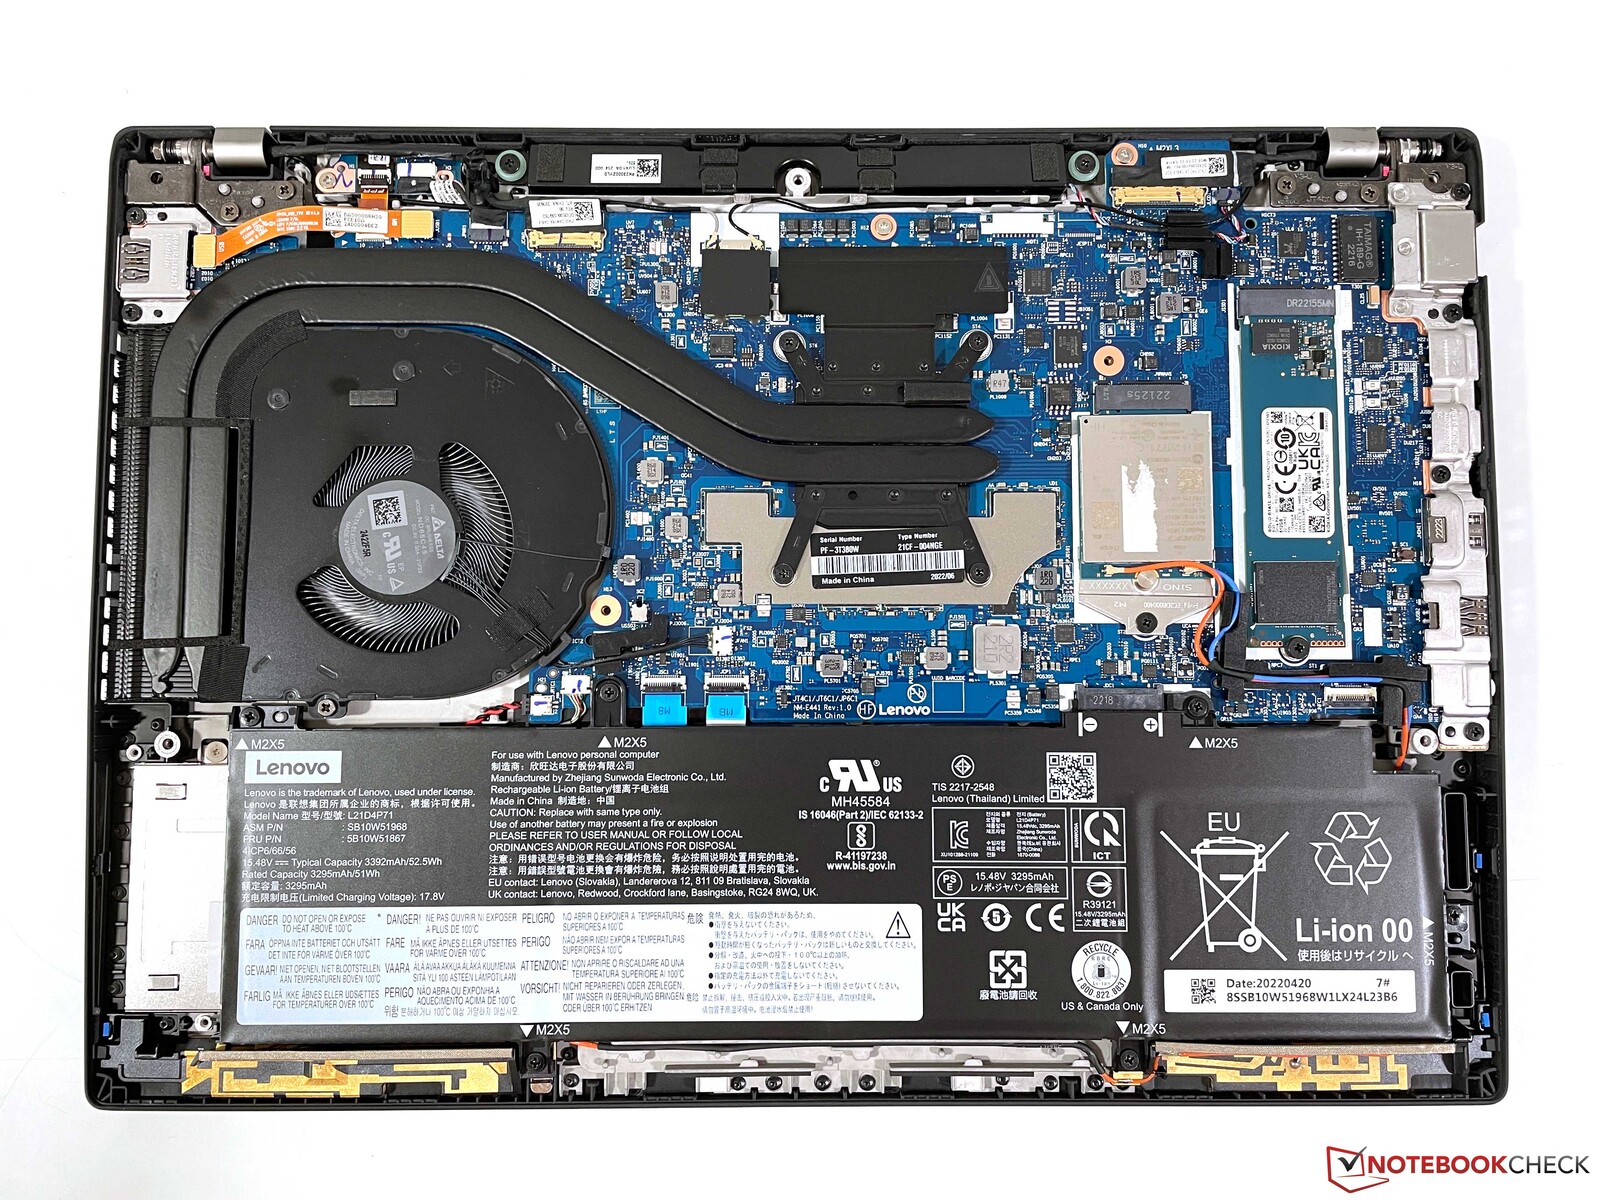
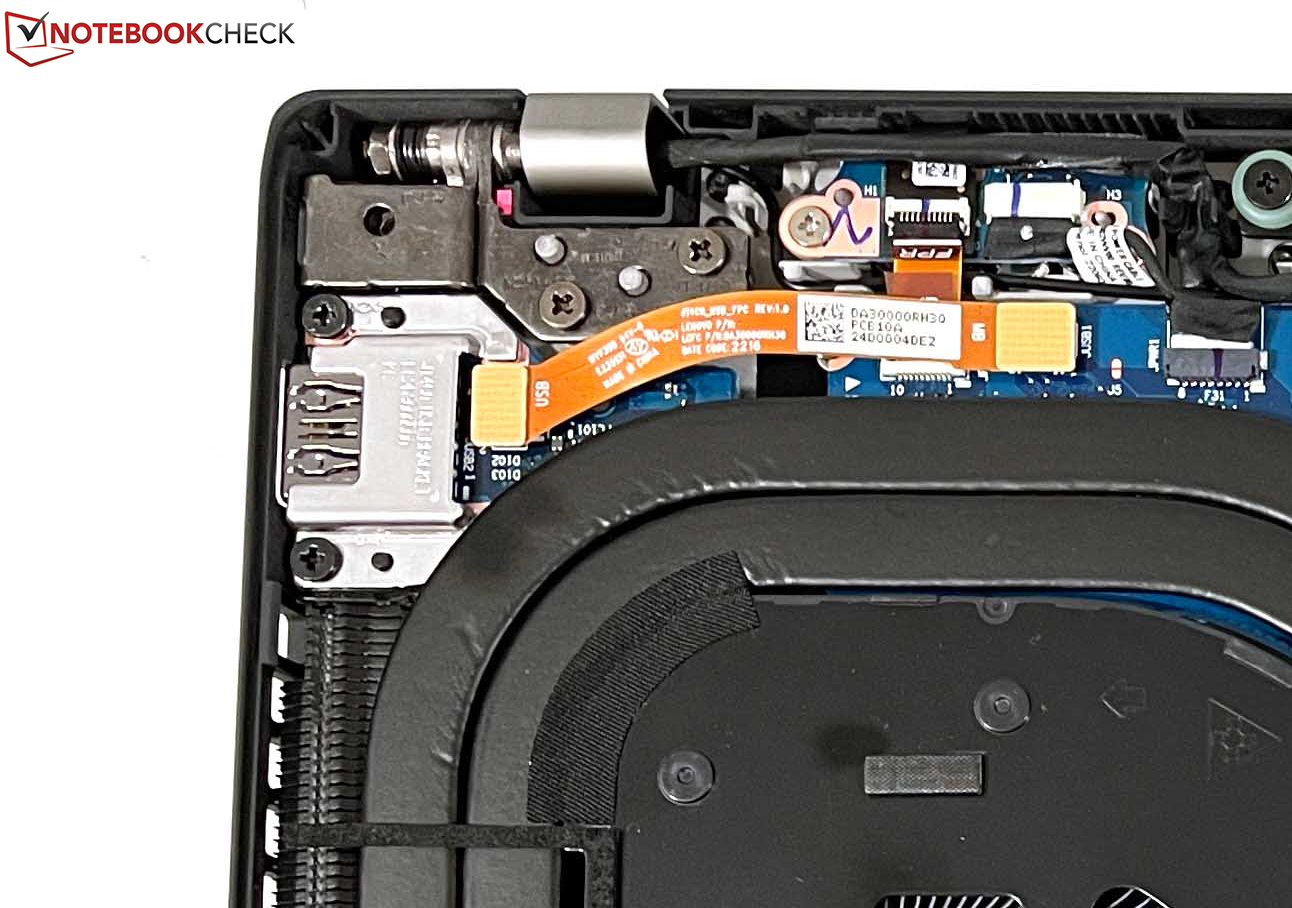
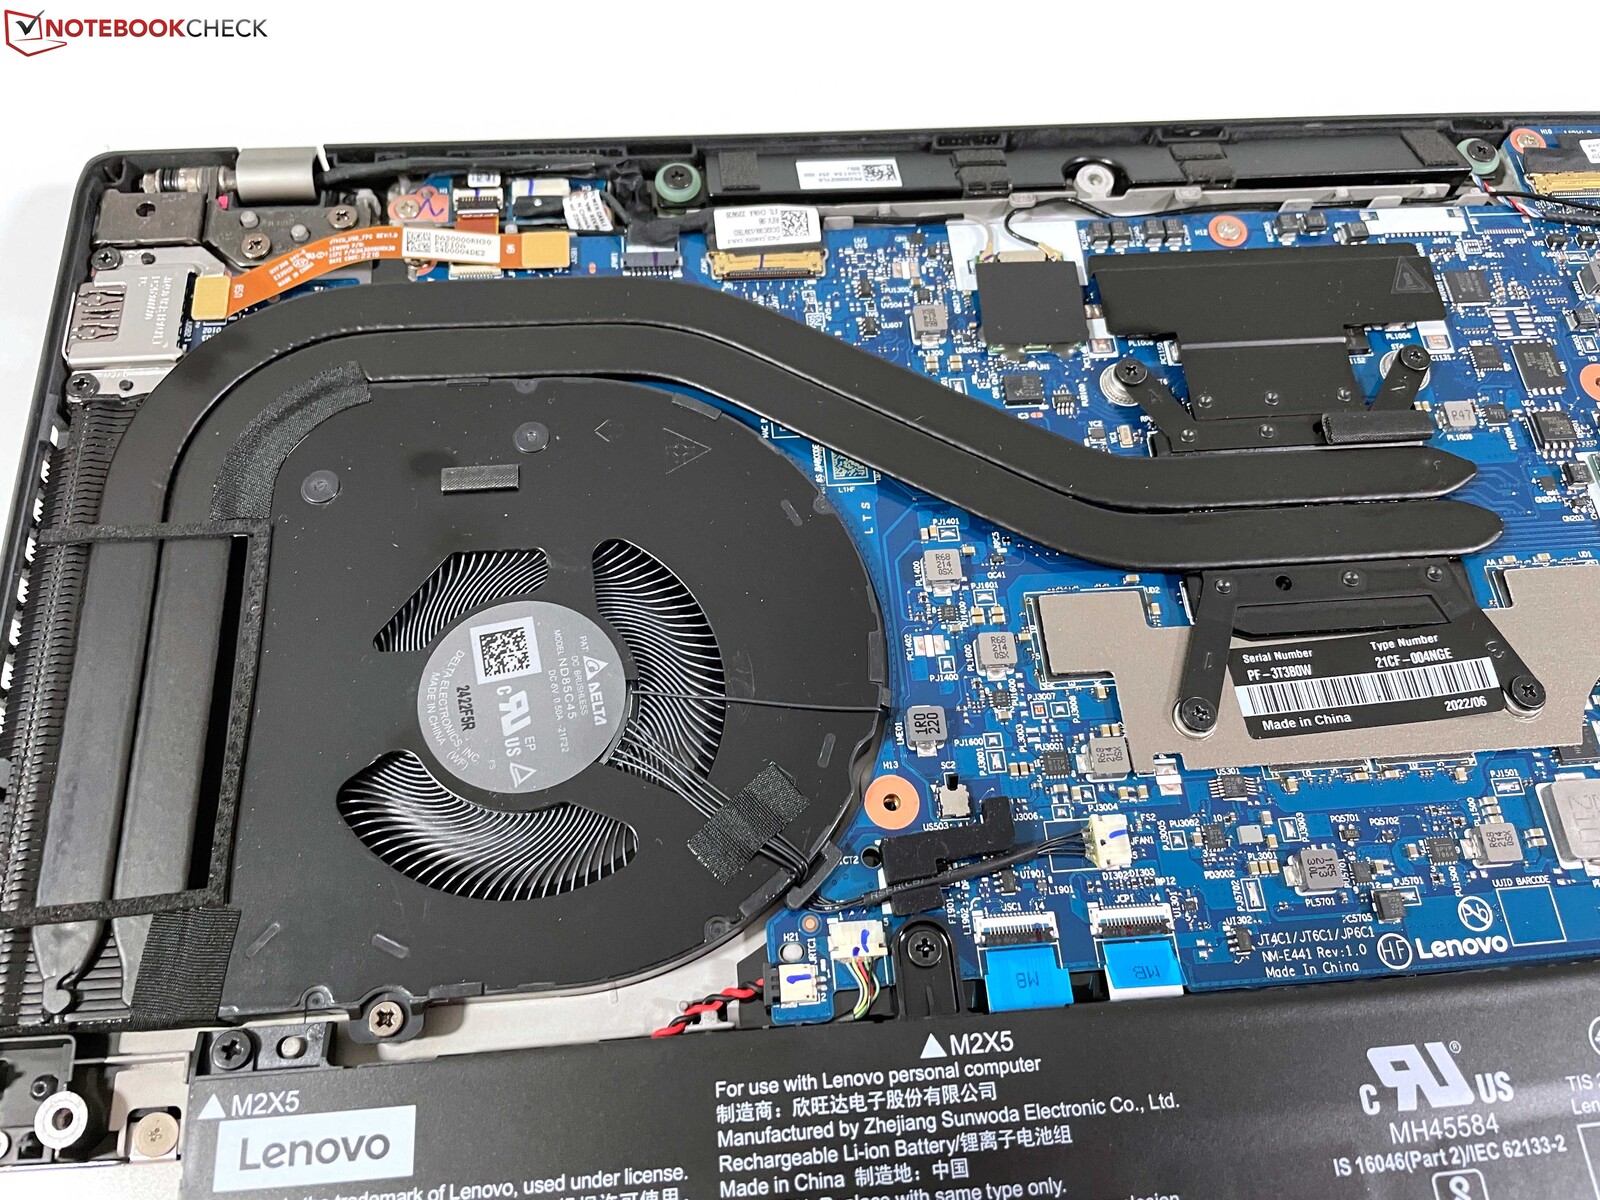
Lenovo has simplified access to the components because there are not so many plastic clips now. After loosening the 7 normal Philips screws, the cover can be removed very easily. Here you have access to the fan, the M.2-2280 SSD as well as the WWAN module, but the WLAN module is not replaceable. However, the RAM is soldered in the AMD model (max. 32 GB LPDDR5-6400), while the Intel model offers a RAM slot alongside a soldered module, which is why a maximum of 48 GB RAM (DDR4-3200) is possible. The battery is only screwed and can be replaced if necessary. The keyboard can also be very easy replaced by loosening two screws on the underside and then pushing the keyboard slightly forward and removing it.
Input devices - ThinkPad T14 only with 1.5 mm key drop
Keyboard
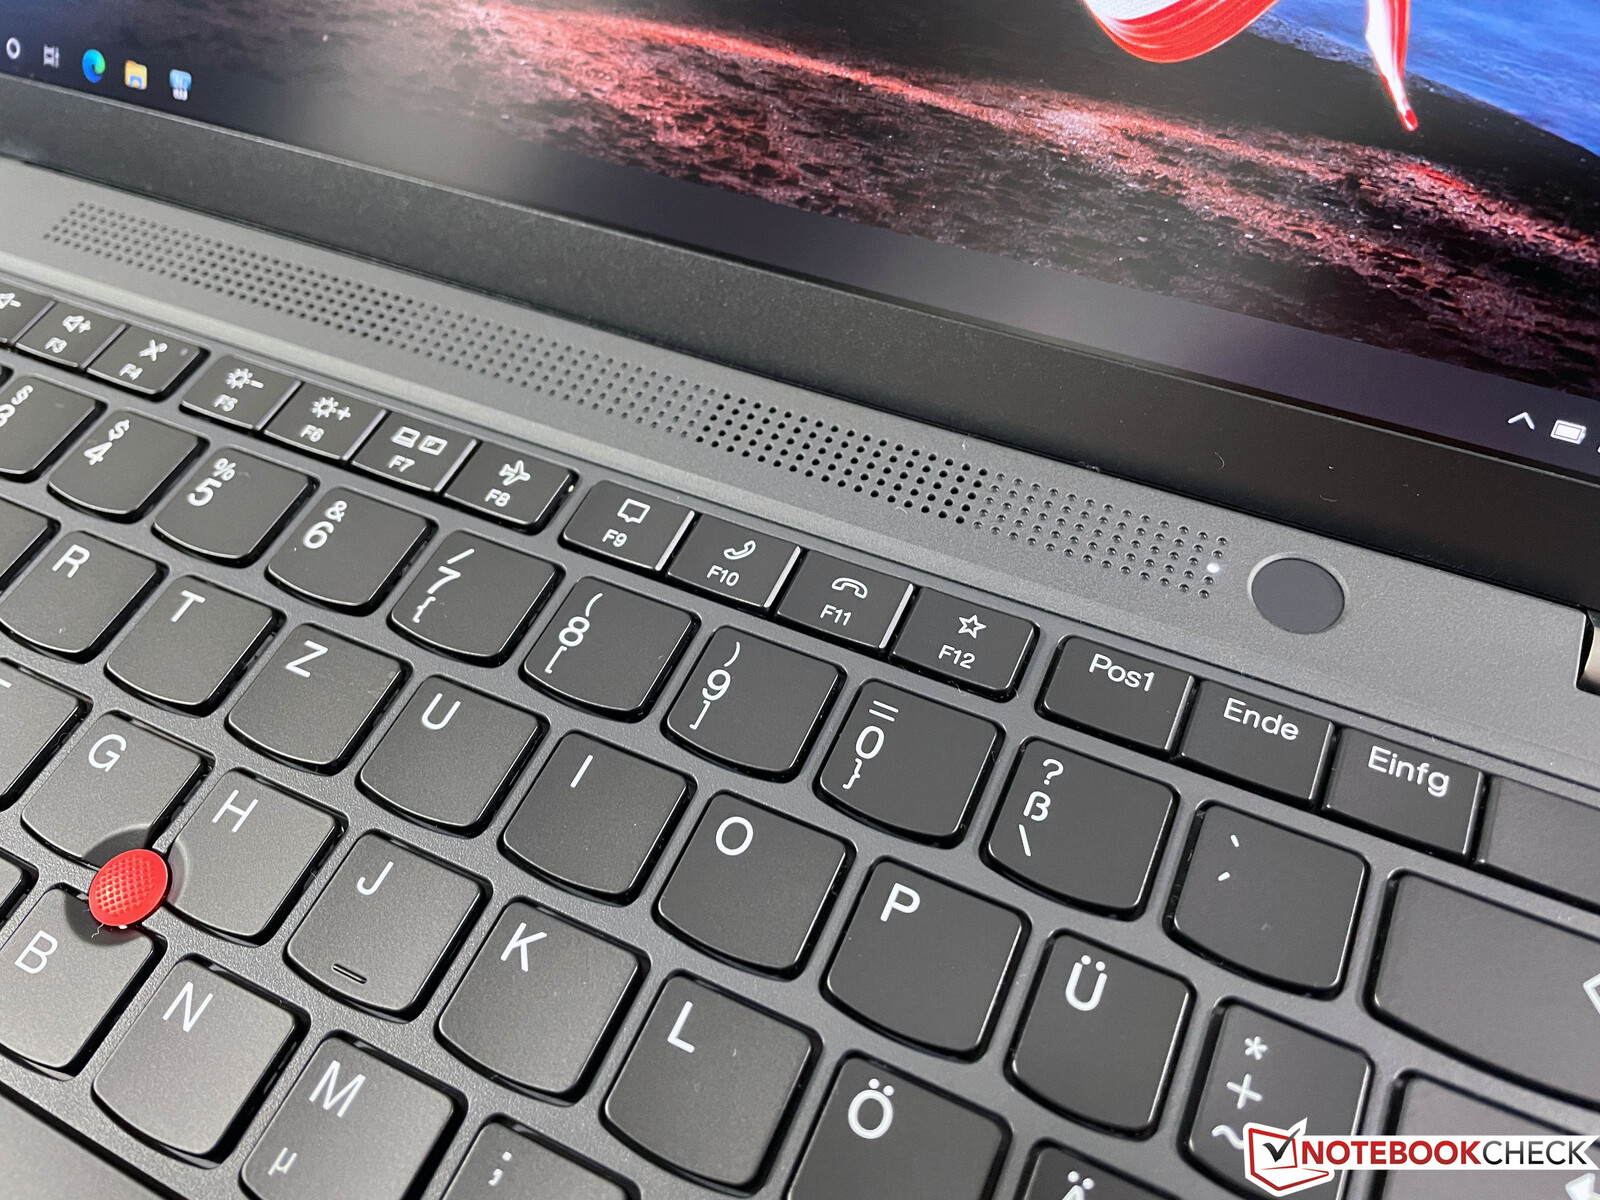
As with other ThinkPads, Lenovo has reduced the key travel for the new G3 model of the T14 from 1.8 to 1.5 mm, which is noticeable in practice. While key feedback is still concise and it is not a bad keyboard, the old models were simply better and more comfortable. Compared to other business laptops, Lenovo no longer has an advantage here and the keyboards from Dell as well as HP are now on a comparable level. The keyboard also offers a two-stage white backlight, but this cannot be activated automatically via the brightness sensor. The fingerprint scanner has been integrated into the power button, which is located above the keyboard.
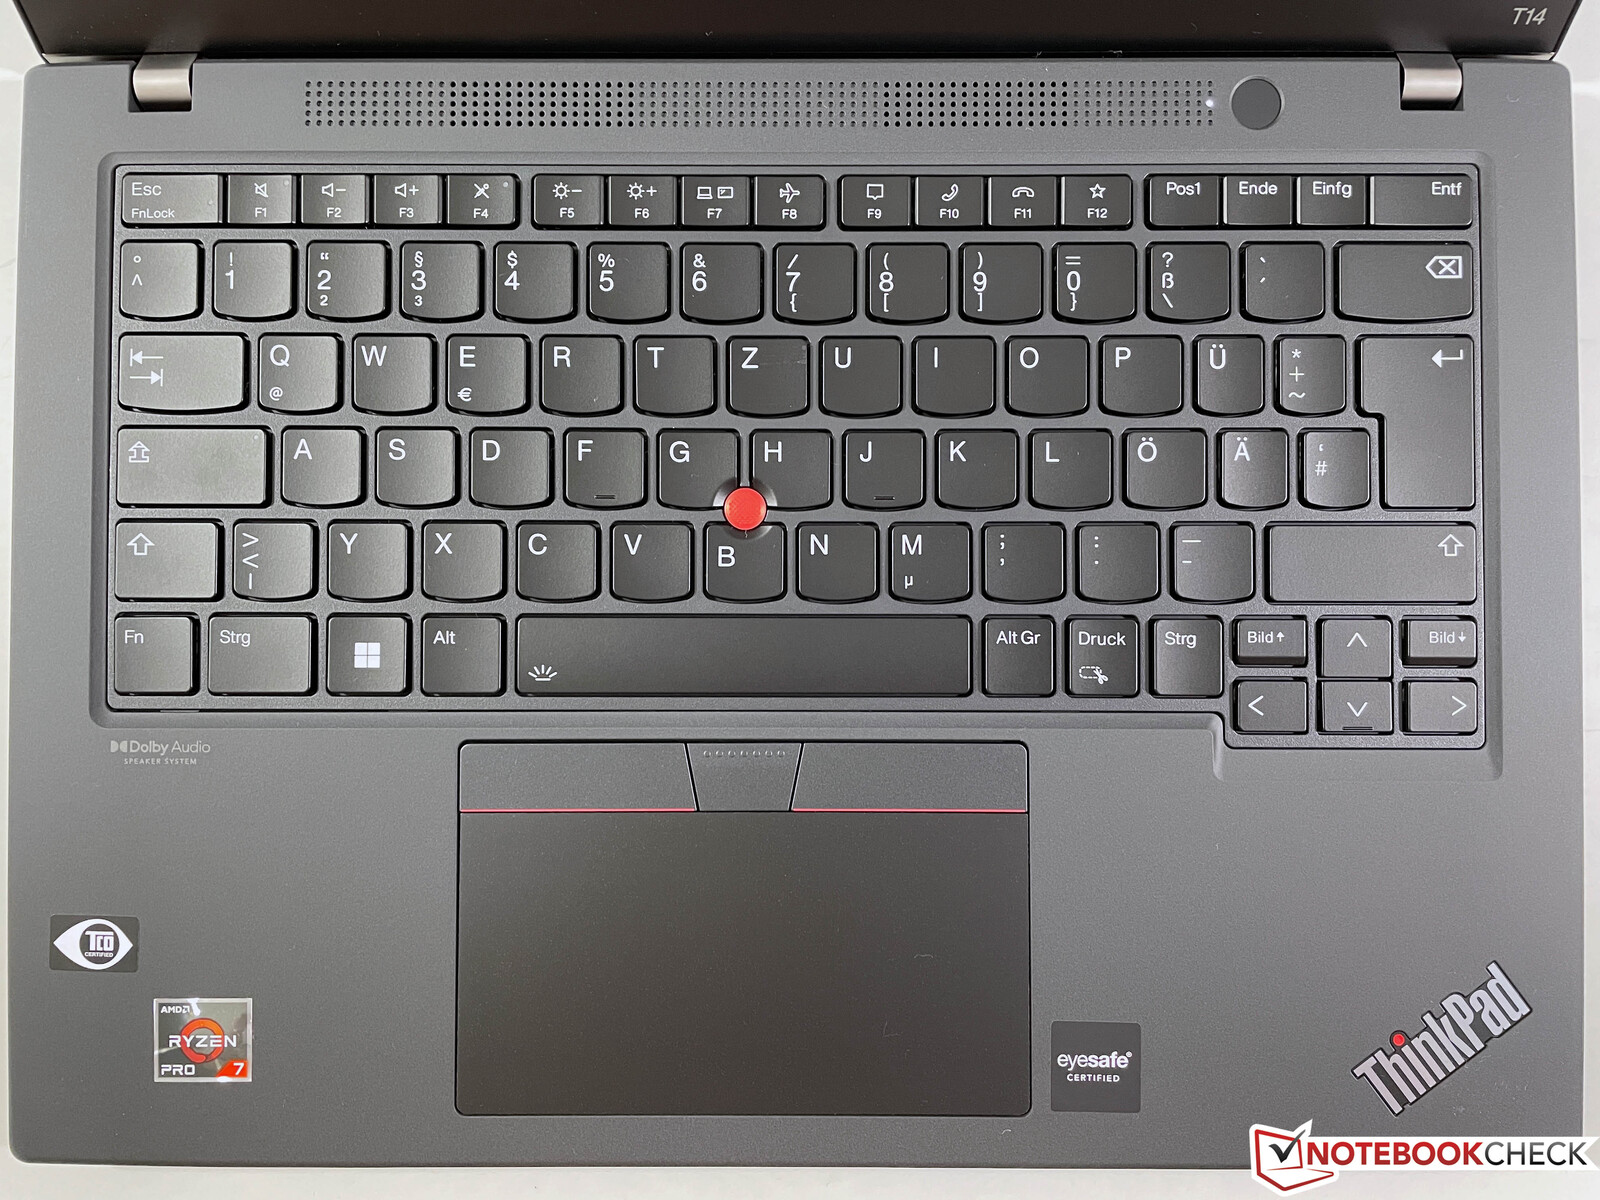

Touchpad & TrackPoint

The TouchPad is larger than in the predecessor and works very well in practice. We had no problems with the normal pointer control nor with gestures of up to four fingers under testing. The lower area of the pad can be pressed down, which is acknowledged by a rather muffled clicking sound.
Of course, the TrackPoint in the keyboard's center is also available for pointer movements and it functions very well. We were positively surprised by the new TrackPoint keys, which are now a bit wider, similar to the touchpad. These now offer slightly more travel and have been perfectly implemented in our review sample, so there is no instability or wobbling. They also offer a very rich and muffled click noise.
Display - T14 G3 now with 16:10
After having again equipped high-end devices such as the ThinkPad X1 Carbon with 16:10 panels since the last generation, the ThinkPad T14 G3 and the T14s G3 models are now also being converted. Lenovo offers a total of 6 different 14-inch panels for the T14 G3 AMD (5 for Europe), which can differ significantly in terms of image quality and brightness:
- WUXGA (1.920 x 1.200), 300 Nits, IPS, 700:1, 45% NTSC
- WUXGA (1.920 x 1.200), 400 Nits, IPS, 800:1, 100% sRGB, surcharge of around US$ 110
- WUXGA (1.920 x 1.200), 300 Nits, IPS, Touch, 700:1, 45% NTSC, surchage of around US$ 100
- WUXGA (1.920 x 1.200), 500 Nits, IPS, Touch, Privacy Guard, 1000:1, 100% sRGB, surcharge of around US$ 360
- 2.2K (2.240 x 1.400), 300 Nits, IPS, 1500:1, 100% sRGB
- WQUXGA (3.840 x 2.400), 500 Nits, 1500:1, 100% DCI-P3, DolbyVision HDR 400, surcharge of around US$ 420
The 2.2K display is not available in Europe. Our review sample has the 400 nits non-touch display, which will likely be the most popular variant for productive use and, based on experience, offers the best compromise between image quality and efficiency. As with the predecessors, there will probably be different suppliers again, so a certain panel lottery cannot be ruled out, which is why the minimum specifications with a contrast of 800:1 are so low.
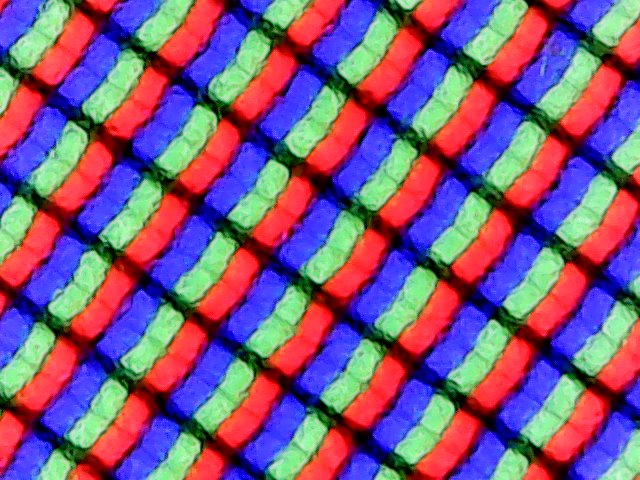

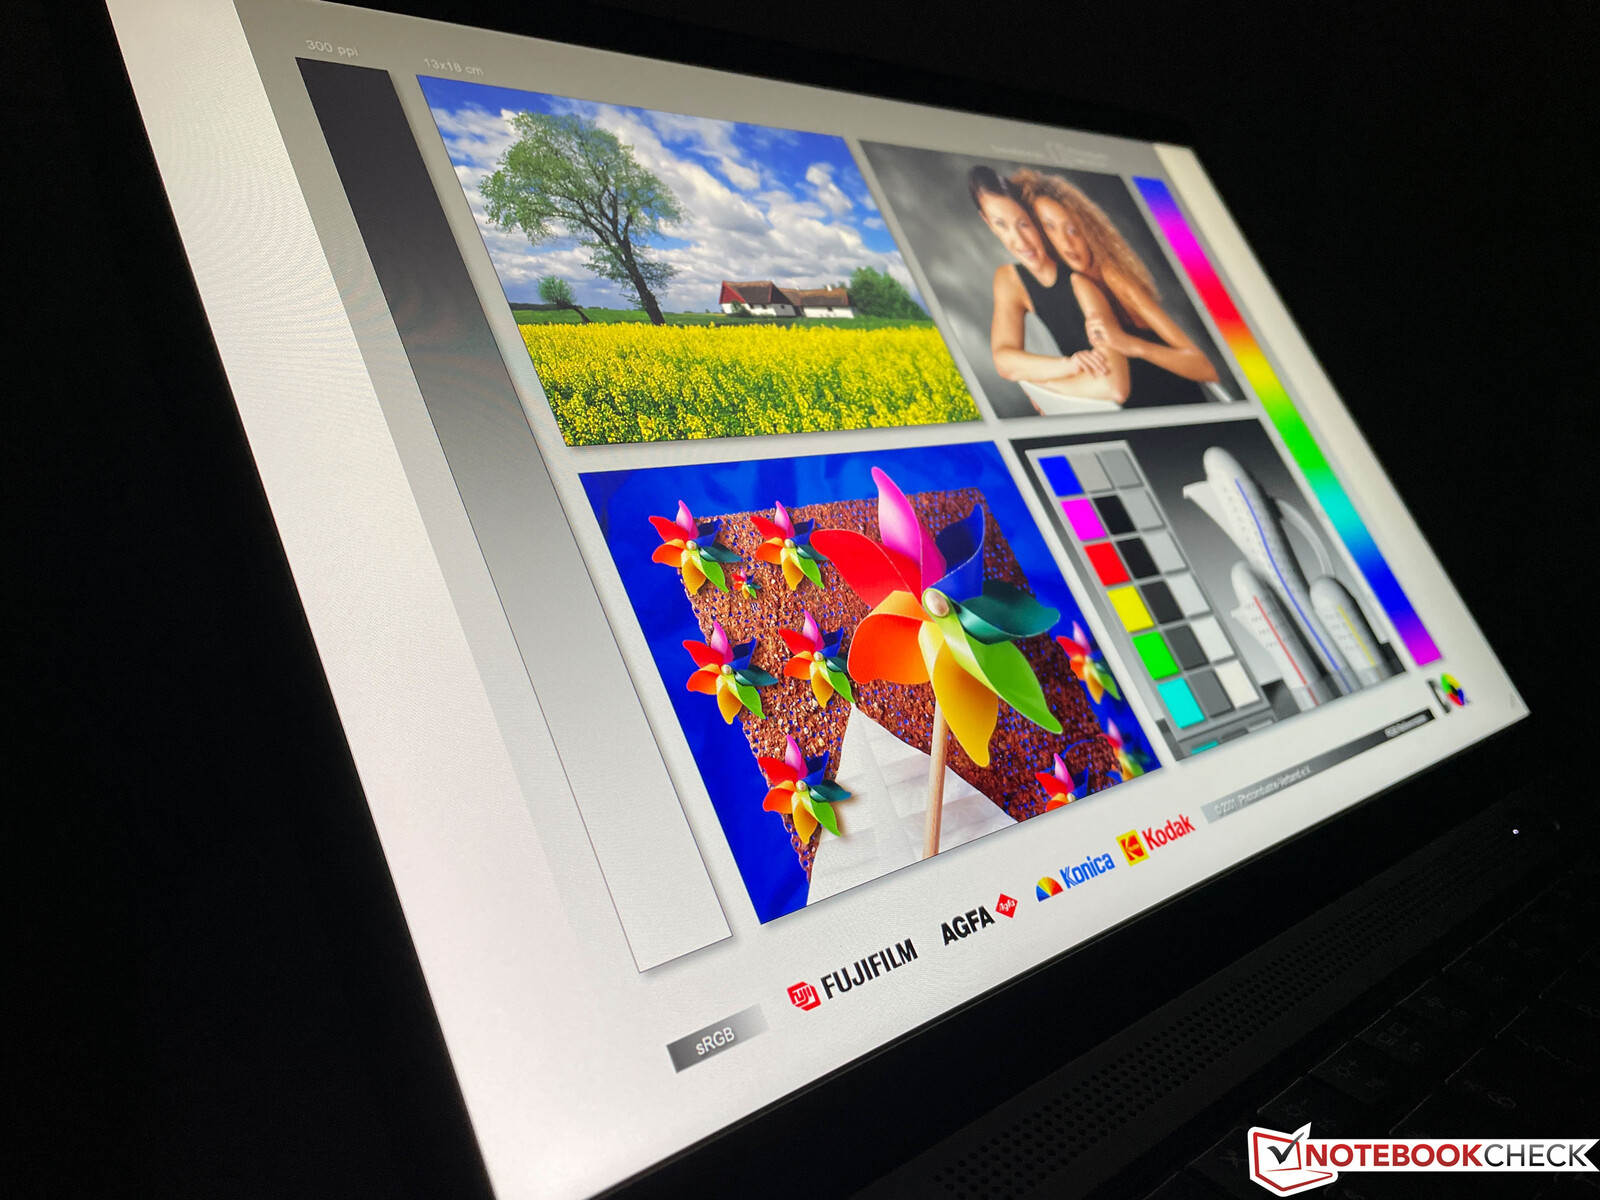
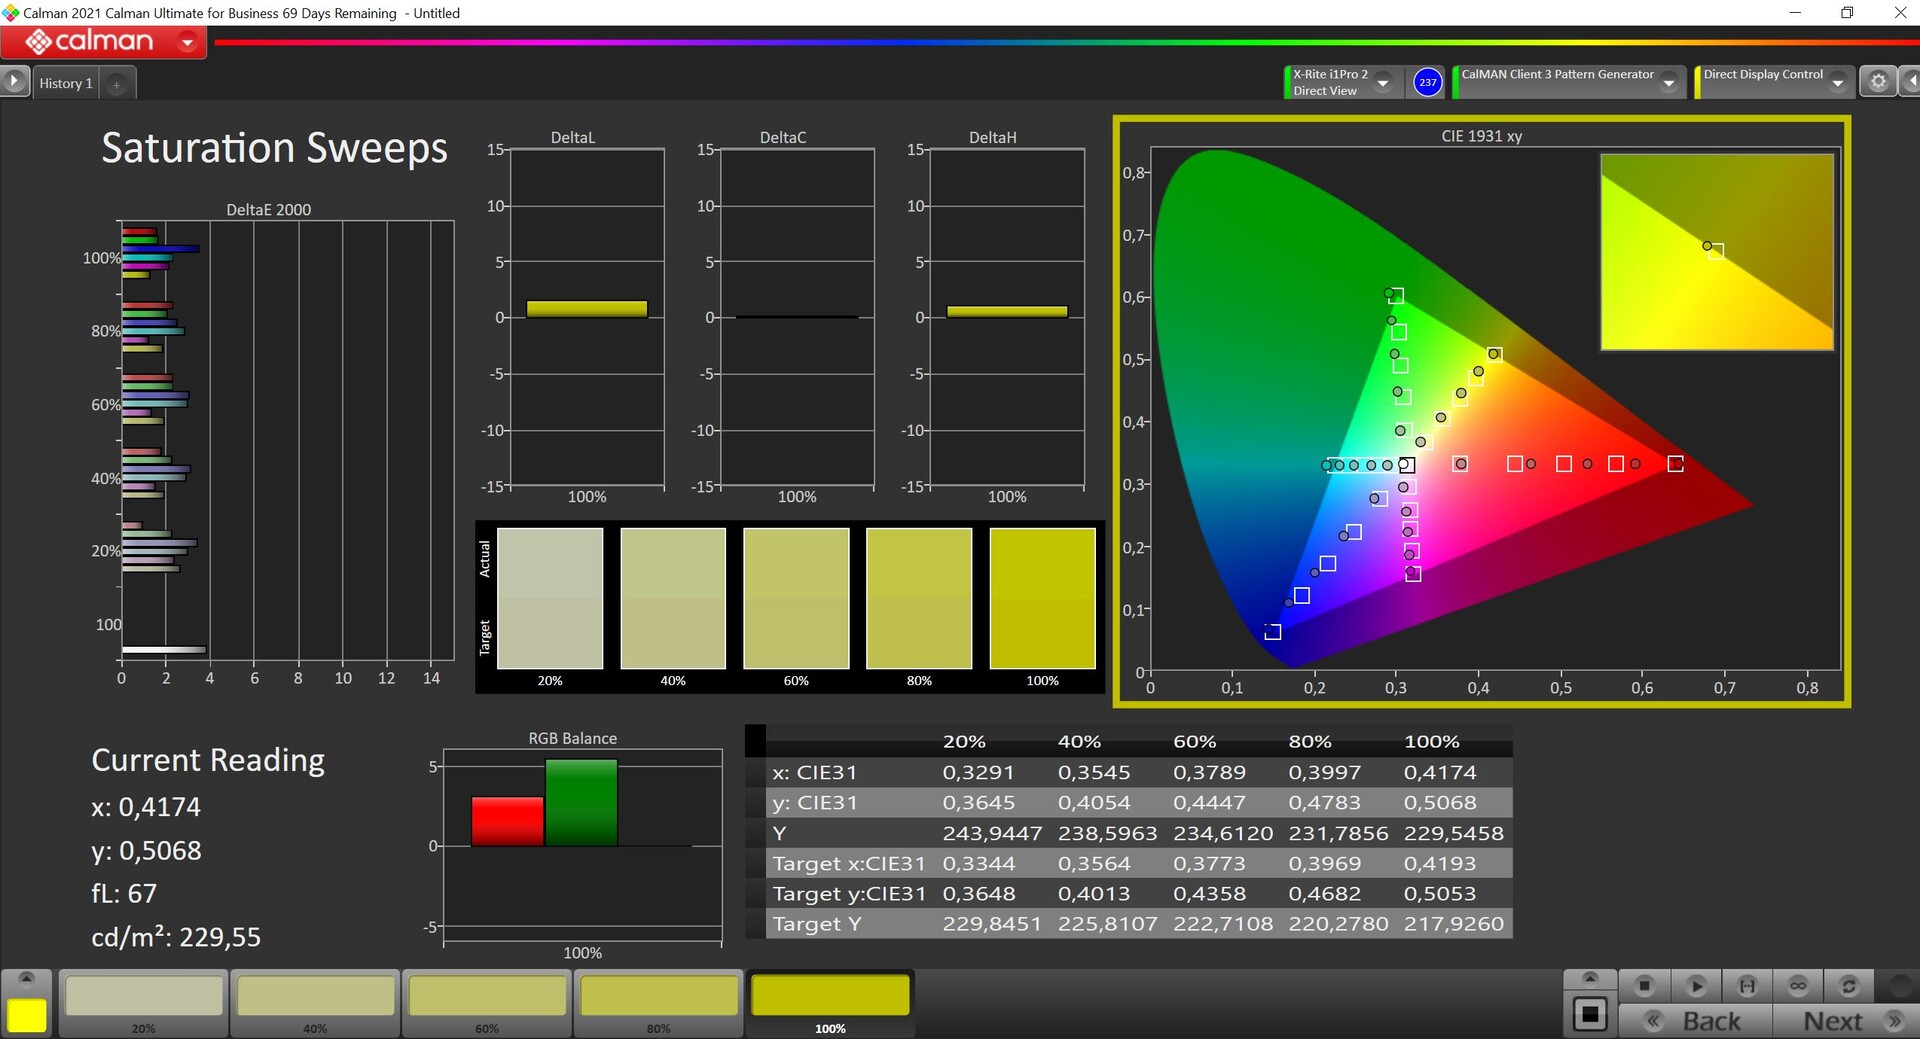
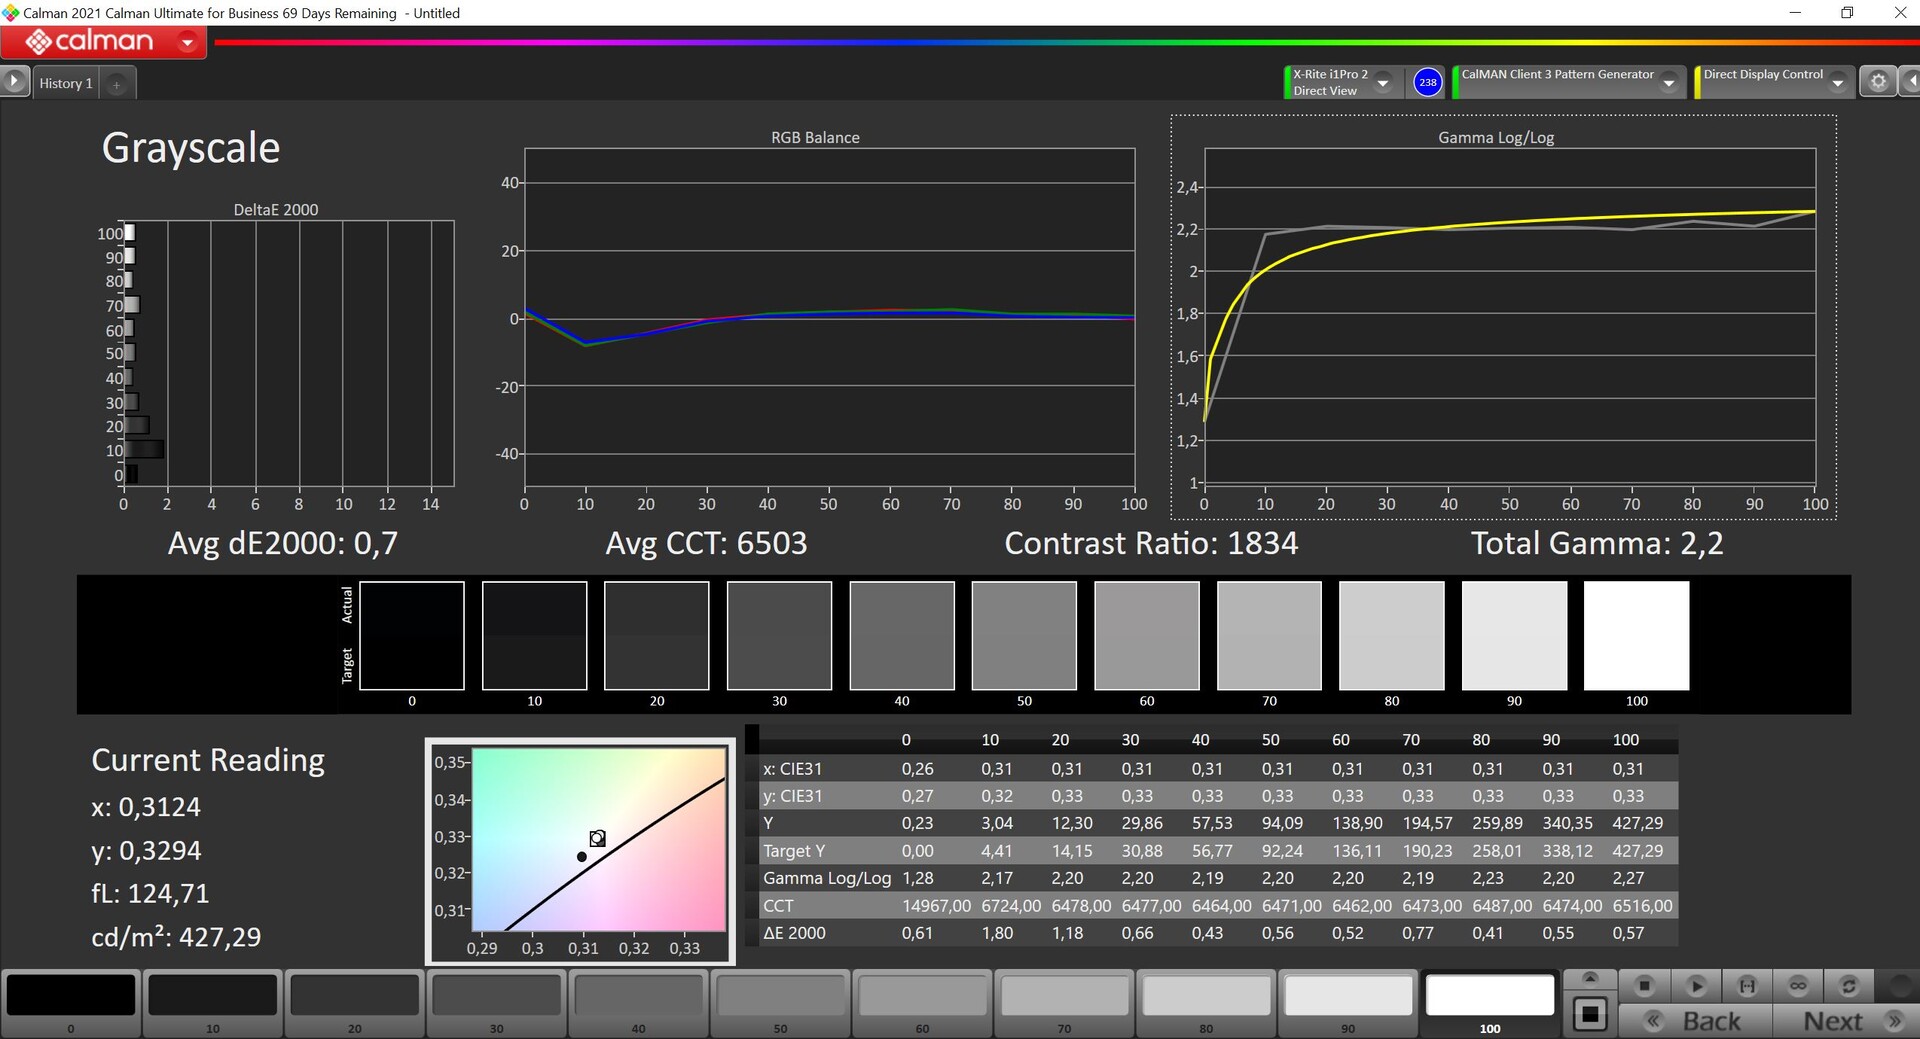
Our panel comes from LG (LP140WU1-SPB2) and performs well in practically all areas, considering the intended use. Despite the matte surface, bright surfaces don't appear grainy at all, content is sufficiently sharp despite the normal FHD resolution, and colors also look vivid. A look at the measured values also shows why this is the case. The contrast ratio is more than 2100:1, which is extremely good for an IPS panel. The specified brightness of 400 cd/m² is also exceeded by our review sample with an average of 432 cd/m². At the same time, the black value of 0.21 is very low. There are only minimal halos at maximum brightness and no PWM flickering was detected. Furthermore, the viewing angle stability of the IPS screen is very good.
| |||||||||||||||||||||||||
Brightness Distribution: 94 %
Center on Battery: 451 cd/m²
Contrast: 2148:1 (Black: 0.21 cd/m²)
ΔE ColorChecker Calman: 2.4 | ∀{0.5-29.43 Ø4.82}
calibrated: 1.3
ΔE Greyscale Calman: 3.3 | ∀{0.09-98 Ø5.1}
71.5% AdobeRGB 1998 (Argyll 3D)
97.4% sRGB (Argyll 3D)
69.2% Display P3 (Argyll 3D)
Gamma: 2.13
CCT: 6848 K
| Lenovo ThinkPad T14 G3-21CF004NGE LP140WU1-SPB2, IPS, 1920x1200, 14" | Dell Latitude 7420 JW6MH Chi Mei CMN1416 CHF07 140HCG, IPS, 1920x1080, 14" | Huawei MateBook X Pro 2022 TMX1422, IPS, 3120x2080, 14.2" | HP EliteBook 845 G9 6F6H6EA InfoVision X140NV4J, IPS, 1920x1200, 14" | Lenovo ThinkPad T14 Gen2-20W1S00000 LP140WF9-SPF2, IPS LED, 1920x1080, 14" | Lenovo ThinkPad T14s G2 20XGS01100 NE140FHM-N61, IPS LED, 1920x1080, 14" | |
|---|---|---|---|---|---|---|
| Display | -1% | 20% | 0% | -6% | -4% | |
| Display P3 Coverage | 69.2 | 68 -2% | 94.6 37% | 69 0% | 64.3 -7% | 69.7 1% |
| sRGB Coverage | 97.4 | 99 2% | 99.5 2% | 99 2% | 95.4 -2% | 91.8 -6% |
| AdobeRGB 1998 Coverage | 71.5 | 70 -2% | 86.5 21% | 70 -2% | 65.5 -8% | 67.2 -6% |
| Response Times | -34% | 25% | 8% | -38% | -148% | |
| Response Time Grey 50% / Grey 80% * | 41.4 ? | 55 ? -33% | 25.4 ? 39% | 31 ? 25% | 57.2 ? -38% | 84 ? -103% |
| Response Time Black / White * | 19.2 ? | 26 ? -35% | 17.1 ? 11% | 21 ? -9% | 26.4 ? -38% | 56 ? -192% |
| PWM Frequency | 2451 ? | |||||
| Screen | 9% | 13% | -13% | -20% | -71% | |
| Brightness middle | 451 | 408 -10% | 603 34% | 678 50% | 382 -15% | 397 -12% |
| Brightness | 435 | 378 -13% | 586 35% | 745 71% | 367 -16% | 386 -11% |
| Brightness Distribution | 94 | 86 -9% | 91 -3% | 69 -27% | 88 -6% | 88 -6% |
| Black Level * | 0.21 | 0.22 -5% | 0.39 -86% | 0.33 -57% | 0.14 33% | 0.28 -33% |
| Contrast | 2148 | 1855 -14% | 1546 -28% | 2055 -4% | 2729 27% | 1418 -34% |
| Colorchecker dE 2000 * | 2.4 | 1.54 36% | 1.1 54% | 3.56 -48% | 4.2 -75% | 5.8 -142% |
| Colorchecker dE 2000 max. * | 4.1 | 2.72 34% | 2.2 46% | 7.23 -76% | 7.9 -93% | 12.6 -207% |
| Colorchecker dE 2000 calibrated * | 1.3 | 1.08 17% | 1.2 8% | 1.05 19% | 0.9 31% | 1.9 -46% |
| Greyscale dE 2000 * | 3.3 | 1.95 41% | 1.5 55% | 4.93 -49% | 5.4 -64% | 8.3 -152% |
| Gamma | 2.13 103% | 2.33 94% | 2.17 101% | 2.63 84% | 2.31 95% | 2.07 106% |
| CCT | 6848 95% | 6806 96% | 6549 99% | 7114 91% | 7499 87% | 6867 95% |
| Color Space (Percent of AdobeRGB 1998) | 60.6 | |||||
| Color Space (Percent of sRGB) | 95.4 | |||||
| Total Average (Program / Settings) | -9% /
1% | 19% /
16% | -2% /
-8% | -21% /
-19% | -74% /
-68% |
* ... smaller is better
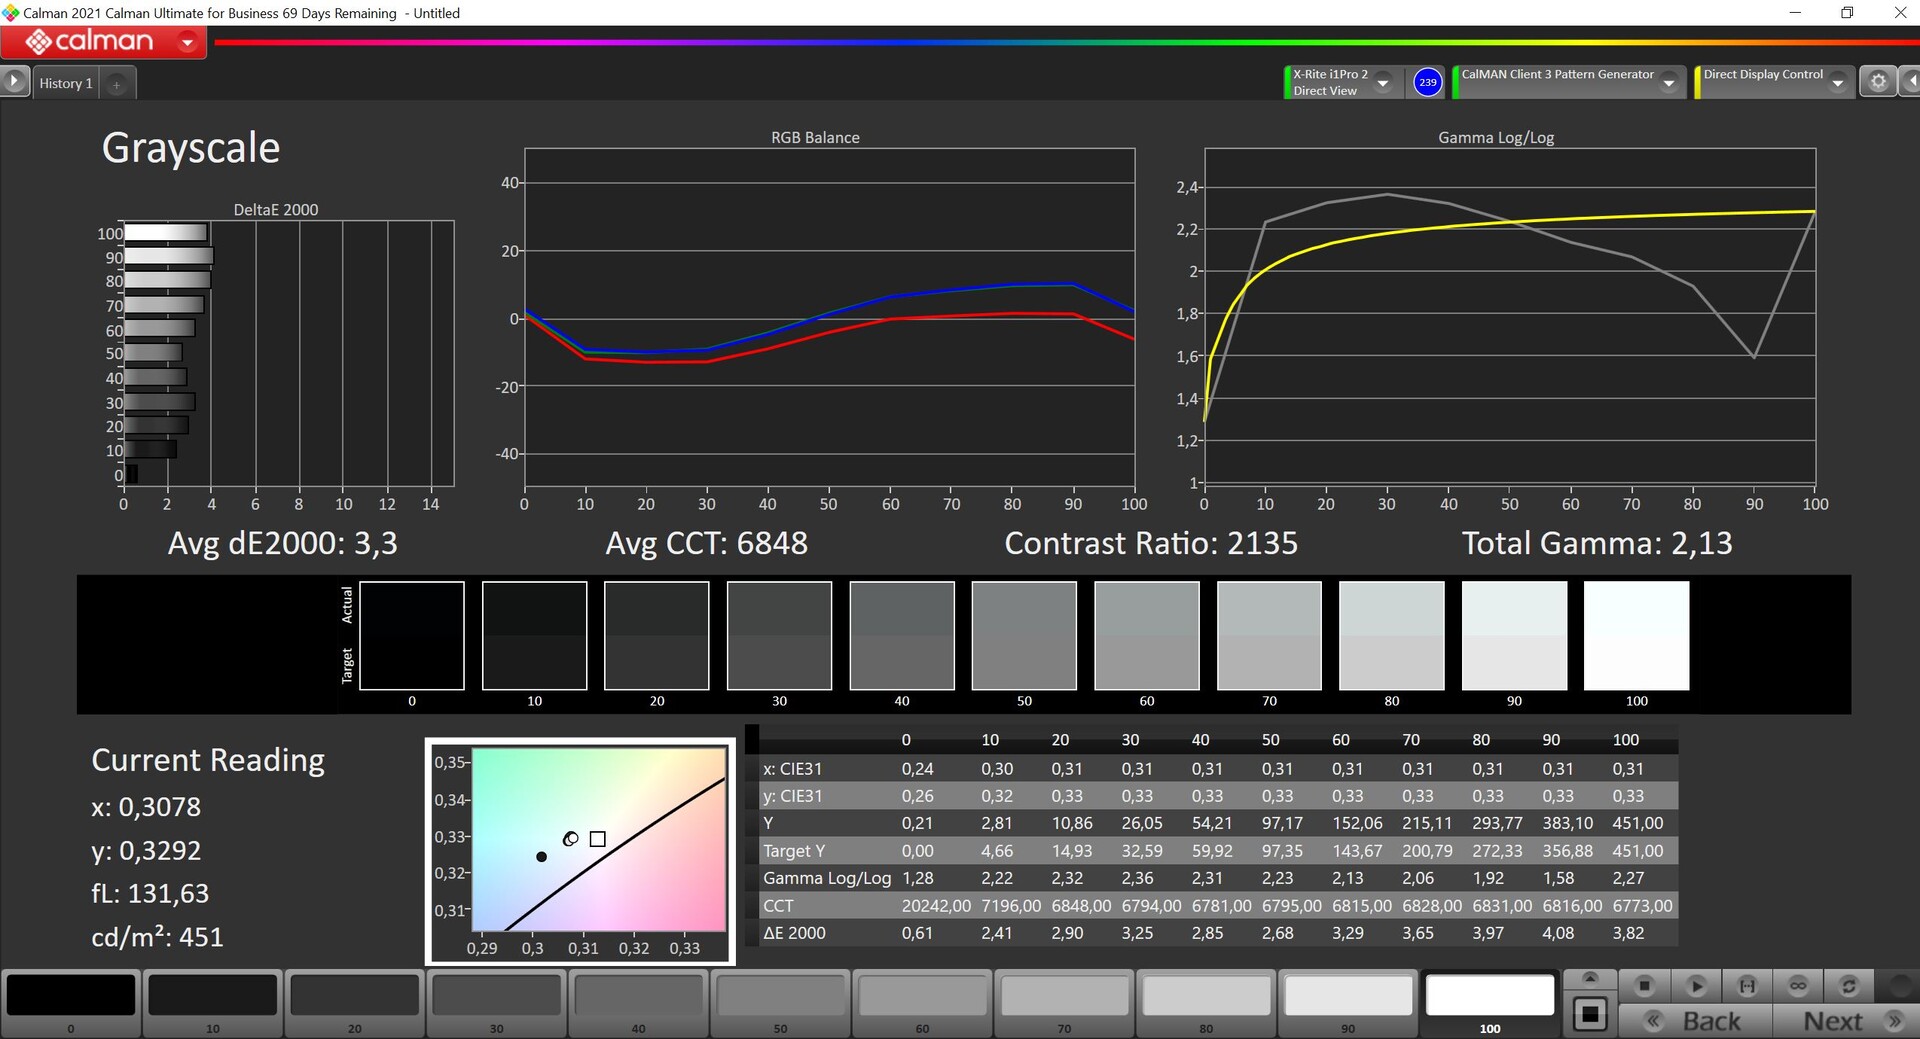
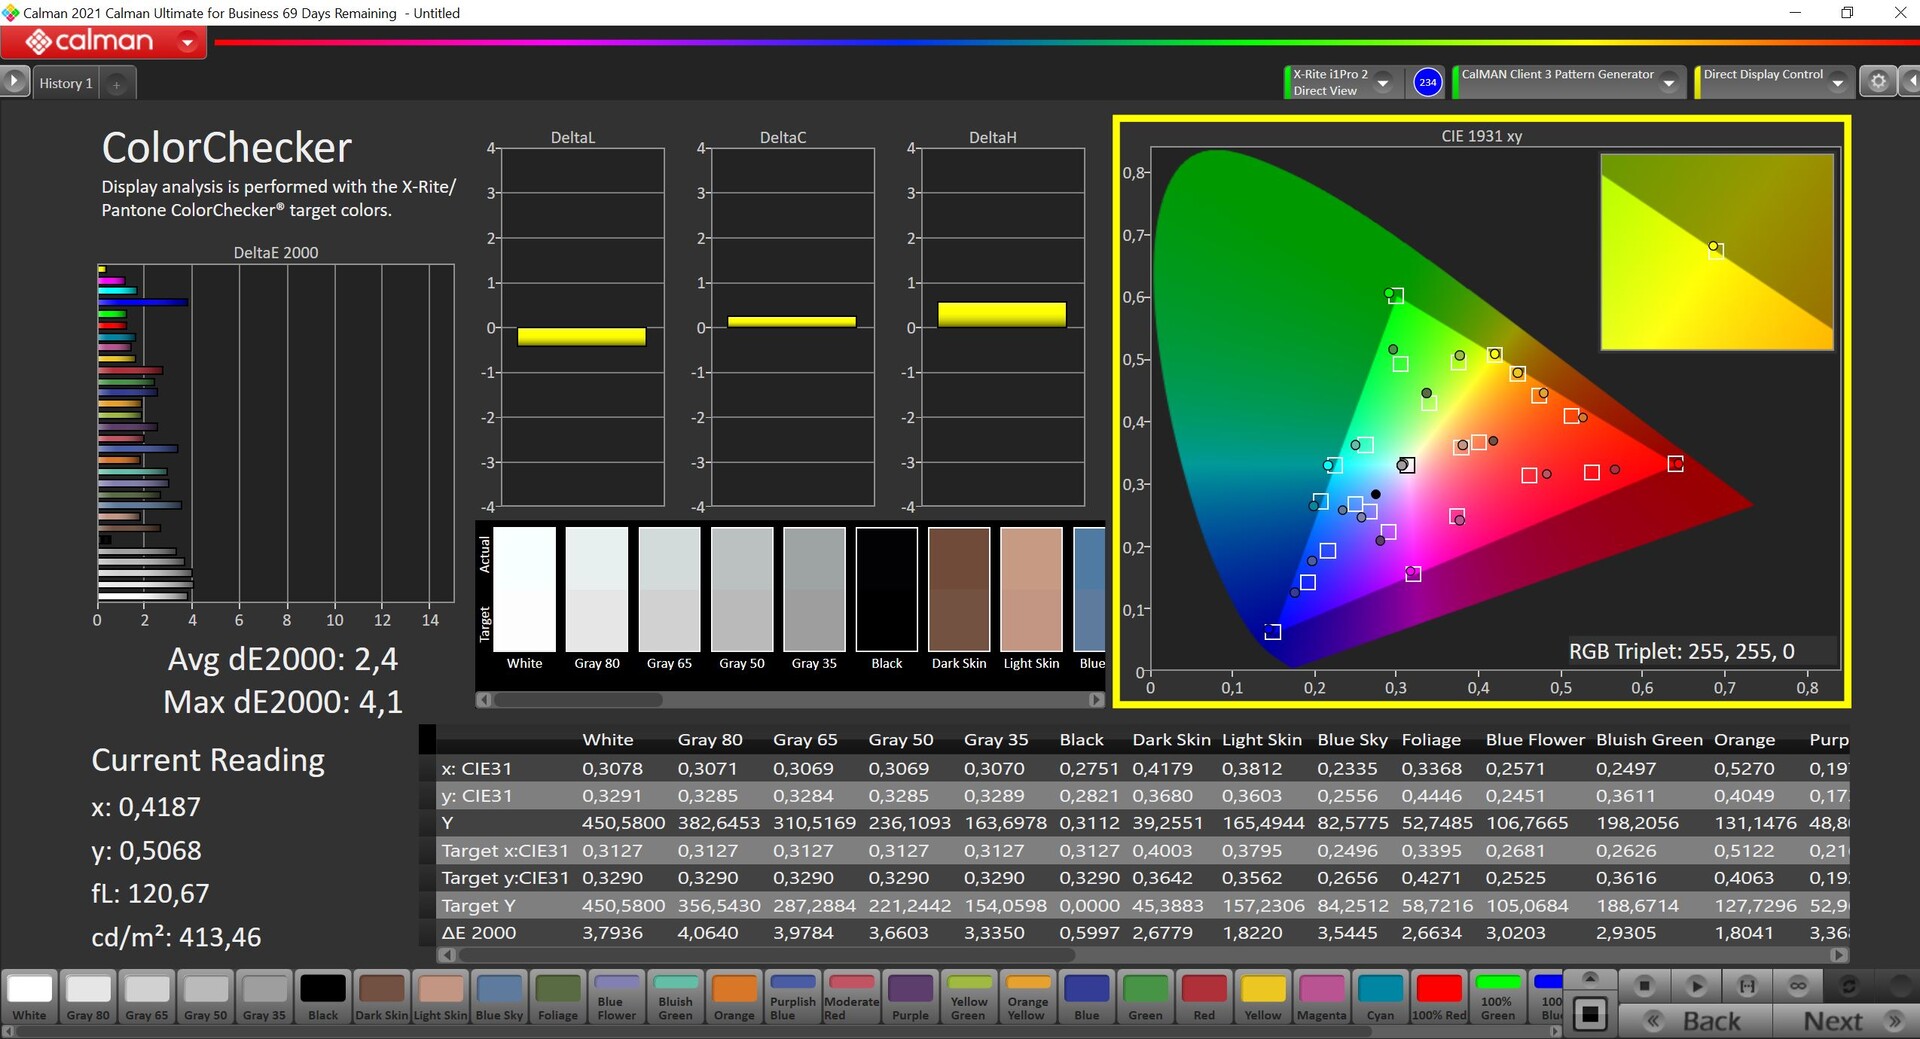


Upon using the laptop fresh out of the box, our analysis with the professional CalMAN software (X-Rite i1 Pro 2) reveals a slight color cast towards blue/green in conjunction with a color temperature that is slightly too cool. On the other hand, there are no large deviations from the sRGB reference color space in terms of grayscale or colors, so the panel does not necessarily need to be calibrated for normal office use.
Our own calibration (profile is available for free download above) brings about an improvement in the display quality and reduces the color deviations even further. Only 100% blue is just above the important limit of 3. Together with the almost complete sRGB coverage, the panel is therefore very suitable for video/image editing in the sRGB color space.
Display Response Times
| ↔ Response Time Black to White | ||
|---|---|---|
| 19.2 ms ... rise ↗ and fall ↘ combined | ↗ 6.8 ms rise |  |
| ↘ 12.4 ms fall | ||
| The screen shows good response rates in our tests, but may be too slow for competitive gamers. In comparison, all tested devices range from 0.1 (minimum) to 240 (maximum) ms. » 40 % of all devices are better. This means that the measured response time is similar to the average of all tested devices (20.4 ms). | ||
| ↔ Response Time 50% Grey to 80% Grey | ||
| 41.4 ms ... rise ↗ and fall ↘ combined | ↗ 18.8 ms rise |  |
| ↘ 22.6 ms fall | ||
| The screen shows slow response rates in our tests and will be unsatisfactory for gamers. In comparison, all tested devices range from 0.165 (minimum) to 636 (maximum) ms. » 65 % of all devices are better. This means that the measured response time is worse than the average of all tested devices (32 ms). | ||
Screen Flickering / PWM (Pulse-Width Modulation)
| Screen flickering / PWM not detected |  | ||
In comparison: 53 % of all tested devices do not use PWM to dim the display. If PWM was detected, an average of 8291 (minimum: 5 - maximum: 343500) Hz was measured. | |||
Users can work outdoors with the ThinkPad T14 G3 without issue as long as direct reflections from light sources are avoided. Even on bright days with sunshine, content can be well seen on the matte screen surface at full brightness. However, this may be somewhat more difficult in the case of the standard panel with its brightness of 300 cd/m².
Performance - AMD Ryzen Pro & PCIe 4.0
In terms of configuration, there are big differences between the AMD and Intel versions of the ThinkPad T14 G3. While the AMD model offers a choice between the two latest Ryzen Pro models with extended security features and fast iGPUs, the Intel version is much more complicated. Lenovo offers both the current Alder Lake U and P processors (vPro only for a surcharge), either with the respective iGPUs or a dedicated Nvidia GeForce MX550. Some technical documents even list the GeForce RTX 2050, but we were unable to find any corresponding configurations here, and in view of the high TGP rating (starting at 35 watts), an RTX 2050 in the T14 G3 would also surprise us.
| ThinkPad T14 G3 AMD | ThinkPad T14 G3 Intel | |
|---|---|---|
| CPU | AMD Ryzen 5 Pro 6650U AMD Ryzen 7 Pro 6850U |
Intel Alder Lake-U (i5-1235U, i5-1245U, i7-1255U, i7-1265U) Intel Alder Lake-P (i5-1240P, i5-1250P, i7-1260P, i7-1270P, i7-1280P) |
| GPU | AMD Radeon 660M AMD Radeon 680M |
Intel Iris Xe Graphics G7 (80 EUs or 96 EUs) Nvidia GeForce MX550 2 GB |
| RAM | max. 32 GB LPDDR5-6400 RAM onboard | max. 48 GB DDR4-3200 RAM, 8/16 GB onboard + 1 Slot |


Testing Conditions
Unlike other Lenovo laptops, the power settings of the ThinkPad models have been directly linked to the regular Windows power settings for some time now, which proves to be very convenient in everyday use. We performed the following benchmarks and measurements in Best Performance mode, where the TDP values are 30 watts for short-term load and 25 watts for permanent load. In Better Performance mode, this amounts to 26/22 watts, and drops even further to 14 watts with the More Battery Efficiency setting activated. These limits are significantly lower than the current Alder Lake CPUs, where the U-series chips can easily consume more than 50 watts during peak loads.
Processor - AMD Ryzen 7 Pro 6850U
The AMD Ryzen 7 Pro 6850U is principally the same as the well-known Ryzen 7 6800U, but the Pro version offers additional management and security features similar to Intel's vPro CPUs. The Ryzen 7 Pro thus offers 8 modern Zen3+ cores, which are manufactured using a modern 6 nm process. The maximum clock of the 8 cores (16 threads) is 4.7 GHz. We have already analyzed the normal Ryzen 7 6800U in detail and therefore refer to our special article for further details.
Basically, we can say that Intel's current Alder Lake CPUs offer more single-core performance with their hybrid architecture (applies to both Alder Lake-U and Alder Lake-P), but single-core power consumption is also higher. In terms of single-core efficiency, the Alder Lake-U chips are roughly on par, depending on the TDP setting. In the multi-core tests, on the other hand, Intel's mobile processors are only really competitive at very high consumption rates (40 watts or more), but then they are no longer particularly efficient.
| Power Consumption / Cinebench R23 Single Power Efficiency - external Monitor | |
| Apple M2 | |
| Intel Core i7-1255U | |
| AMD Ryzen 7 PRO 6850U | |
| AMD Ryzen 7 6800U | |
| Intel Core i7-1260P | |
| Intel Core i7-1260P | |
| Power Consumption / Cinebench R23 Multi Power Efficiency - external Monitor | |
| Apple M2 | |
| AMD Ryzen 7 PRO 6850U | |
| AMD Ryzen 7 6800U | |
| Intel Core i7-1260P | |
| Intel Core i7-1255U | |
| Intel Core i7-1260P | |
At a TDP configuration of 30/25 watts, the ThinkPad T14 G3 with the Ryzen 7 Pro 6850U only experiences a minimal drop in performance (stable at ~1,650 points) under sustained load, and in our Cinebench R15 loop, the Ryzen 7 Pro is beaten only by the Ryzen 9 Pro 6950HS in the HP EliteBook 845 G9, albeit with a higher consumption of 40 watts. The Intel Alder Lake P processors can usually keep up in the multi-core tests under short load, which is evident from the Core i7-1260P in the Huawei MateBook X Pro. It achieves ~1,400 points at 30 watts and just over 1,200 points at 25 watts, which correspond to our AMD review sample. Therefore, at comparable power consumption, the Alder Lake P chip is around 25% slower when all cores are under load. The Core i7-1255U also only achieves around 1,150 points with 23 watts. Intel's fastest mobile processor, the Core i7-1280P with four additional performance cores, is also beaten at 23 watts in the ThinkPad X1 Nano Gen.2.
Cinebench R15 Multi Sustained Load
If we assume comparable TDP values for the Intel CPUs, the surcharges for the faster chips are actually not worth it, because even the Core i7-1280P at 23 watts is not faster than the Core i7-1255U at 23 watts, despite the four additional performance cores.
In the other two performance modes, the Ryzen 7 Pro 6850U is still very competitive with ~1,570 points at 22 watts and ~1,220 points at 14 watts and is also fast enough in everyday use, while you also benefit from a much quieter fan.
Performance is not reduced in battery mode because there are no extremely high power limits compared to the Intel CPUs. More CPU benchmarks are available in our tech section.
Cinebench R23: Multi Core | Single Core
Cinebench R20: CPU (Multi Core) | CPU (Single Core)
Cinebench R15: CPU Multi 64Bit | CPU Single 64Bit
Blender: v2.79 BMW27 CPU
7-Zip 18.03: 7z b 4 | 7z b 4 -mmt1
Geekbench 5.5: Multi-Core | Single-Core
HWBOT x265 Benchmark v2.2: 4k Preset
LibreOffice : 20 Documents To PDF
R Benchmark 2.5: Overall mean
| CPU Performance Rating | |
| Huawei MateBook X Pro 2022 | |
| HP EliteBook 845 G9 6F6H6EA | |
| Lenovo ThinkPad T14 G3-21CF004NGE | |
| Average AMD Ryzen 7 PRO 6850U | |
| Average of class Office | |
| Lenovo ThinkPad T14s G2 20XGS01100 | |
| Dell Inspiron 14 7420 2-in-1 | |
| Lenovo ThinkPad Z13 21D2CTO1WW | |
| Lenovo ThinkPad T14 Gen2-20W1S00000 | |
| Dell Latitude 7420 JW6MH | |
| Cinebench R23 / Multi Core | |
| HP EliteBook 845 G9 6F6H6EA | |
| Average AMD Ryzen 7 PRO 6850U (9923 - 11026, n=6) | |
| Average of class Office (1577 - 20399, n=85, last 2 years) | |
| Lenovo ThinkPad T14 G3-21CF004NGE | |
| Huawei MateBook X Pro 2022 | |
| Lenovo ThinkPad Z13 21D2CTO1WW | |
| Lenovo ThinkPad T14s G2 20XGS01100 | |
| Dell Inspiron 14 7420 2-in-1 | |
| Lenovo ThinkPad T14 Gen2-20W1S00000 | |
| Dell Latitude 7420 JW6MH | |
| Cinebench R23 / Single Core | |
| Dell Inspiron 14 7420 2-in-1 | |
| Huawei MateBook X Pro 2022 | |
| Average of class Office (708 - 2130, n=85, last 2 years) | |
| HP EliteBook 845 G9 6F6H6EA | |
| Lenovo ThinkPad T14 Gen2-20W1S00000 | |
| Lenovo ThinkPad T14 G3-21CF004NGE | |
| Average AMD Ryzen 7 PRO 6850U (1409 - 1520, n=6) | |
| Lenovo ThinkPad Z13 21D2CTO1WW | |
| Lenovo ThinkPad T14s G2 20XGS01100 | |
| Dell Latitude 7420 JW6MH | |
| Cinebench R20 / CPU (Multi Core) | |
| HP EliteBook 845 G9 6F6H6EA | |
| Lenovo ThinkPad T14 G3-21CF004NGE | |
| Average AMD Ryzen 7 PRO 6850U (3784 - 4457, n=6) | |
| Average of class Office (590 - 8086, n=83, last 2 years) | |
| Huawei MateBook X Pro 2022 | |
| Lenovo ThinkPad Z13 21D2CTO1WW | |
| Lenovo ThinkPad T14s G2 20XGS01100 | |
| Dell Inspiron 14 7420 2-in-1 | |
| Lenovo ThinkPad T14 Gen2-20W1S00000 | |
| Dell Latitude 7420 JW6MH | |
| Cinebench R20 / CPU (Single Core) | |
| Dell Inspiron 14 7420 2-in-1 | |
| Huawei MateBook X Pro 2022 | |
| Average of class Office (285 - 815, n=83, last 2 years) | |
| HP EliteBook 845 G9 6F6H6EA | |
| Average AMD Ryzen 7 PRO 6850U (587 - 596, n=6) | |
| Lenovo ThinkPad T14 G3-21CF004NGE | |
| Lenovo ThinkPad T14 Gen2-20W1S00000 | |
| Lenovo ThinkPad Z13 21D2CTO1WW | |
| Lenovo ThinkPad T14s G2 20XGS01100 | |
| Dell Latitude 7420 JW6MH | |
| Cinebench R15 / CPU Multi 64Bit | |
| Huawei MateBook X Pro 2022 | |
| Huawei MateBook X Pro 2022 | |
| HP EliteBook 845 G9 6F6H6EA | |
| Lenovo ThinkPad T14 G3-21CF004NGE | |
| Average AMD Ryzen 7 PRO 6850U (1652 - 1901, n=6) | |
| Average of class Office (246 - 3132, n=87, last 2 years) | |
| Lenovo ThinkPad Z13 21D2CTO1WW | |
| Lenovo ThinkPad T14s G2 20XGS01100 | |
| Dell Inspiron 14 7420 2-in-1 | |
| Lenovo ThinkPad T14 Gen2-20W1S00000 | |
| Dell Latitude 7420 JW6MH | |
| Cinebench R15 / CPU Single 64Bit | |
| Dell Inspiron 14 7420 2-in-1 | |
| Huawei MateBook X Pro 2022 | |
| Average of class Office (99.5 - 312, n=85, last 2 years) | |
| HP EliteBook 845 G9 6F6H6EA | |
| Lenovo ThinkPad T14 G3-21CF004NGE | |
| Average AMD Ryzen 7 PRO 6850U (228 - 241, n=6) | |
| Lenovo ThinkPad Z13 21D2CTO1WW | |
| Lenovo ThinkPad T14s G2 20XGS01100 | |
| Lenovo ThinkPad T14 Gen2-20W1S00000 | |
| Dell Latitude 7420 JW6MH | |
| Blender / v2.79 BMW27 CPU | |
| Dell Latitude 7420 JW6MH | |
| Lenovo ThinkPad T14 Gen2-20W1S00000 | |
| Lenovo ThinkPad Z13 21D2CTO1WW | |
| Dell Inspiron 14 7420 2-in-1 | |
| Average of class Office (163 - 1956, n=86, last 2 years) | |
| Lenovo ThinkPad T14s G2 20XGS01100 | |
| Huawei MateBook X Pro 2022 | |
| Average AMD Ryzen 7 PRO 6850U (282 - 307, n=6) | |
| Lenovo ThinkPad T14 G3-21CF004NGE | |
| HP EliteBook 845 G9 6F6H6EA | |
| 7-Zip 18.03 / 7z b 4 | |
| Lenovo ThinkPad T14 G3-21CF004NGE | |
| HP EliteBook 845 G9 6F6H6EA | |
| Average AMD Ryzen 7 PRO 6850U (44011 - 50871, n=6) | |
| Lenovo ThinkPad T14s G2 20XGS01100 | |
| Huawei MateBook X Pro 2022 | |
| Average of class Office (7532 - 76886, n=87, last 2 years) | |
| Lenovo ThinkPad Z13 21D2CTO1WW | |
| Dell Inspiron 14 7420 2-in-1 | |
| Lenovo ThinkPad T14 Gen2-20W1S00000 | |
| Dell Latitude 7420 JW6MH | |
| 7-Zip 18.03 / 7z b 4 -mmt1 | |
| Dell Inspiron 14 7420 2-in-1 | |
| HP EliteBook 845 G9 6F6H6EA | |
| Lenovo ThinkPad T14 Gen2-20W1S00000 | |
| Average of class Office (3046 - 6497, n=86, last 2 years) | |
| Huawei MateBook X Pro 2022 | |
| Average AMD Ryzen 7 PRO 6850U (5057 - 5542, n=6) | |
| Lenovo ThinkPad T14 G3-21CF004NGE | |
| Lenovo ThinkPad T14s G2 20XGS01100 | |
| Lenovo ThinkPad Z13 21D2CTO1WW | |
| Dell Latitude 7420 JW6MH | |
| Geekbench 5.5 / Multi-Core | |
| Huawei MateBook X Pro 2022 | |
| Average of class Office (1532 - 14192, n=85, last 2 years) | |
| Lenovo ThinkPad T14 G3-21CF004NGE | |
| Average AMD Ryzen 7 PRO 6850U (7044 - 8050, n=6) | |
| HP EliteBook 845 G9 6F6H6EA | |
| Lenovo ThinkPad T14s G2 20XGS01100 | |
| Dell Inspiron 14 7420 2-in-1 | |
| Lenovo ThinkPad Z13 21D2CTO1WW | |
| Dell Latitude 7420 JW6MH | |
| Lenovo ThinkPad T14 Gen2-20W1S00000 | |
| Geekbench 5.5 / Single-Core | |
| Huawei MateBook X Pro 2022 | |
| Average of class Office (510 - 2096, n=86, last 2 years) | |
| Dell Inspiron 14 7420 2-in-1 | |
| HP EliteBook 845 G9 6F6H6EA | |
| Lenovo ThinkPad T14 G3-21CF004NGE | |
| Average AMD Ryzen 7 PRO 6850U (1433 - 1533, n=6) | |
| Lenovo ThinkPad T14 Gen2-20W1S00000 | |
| Lenovo ThinkPad Z13 21D2CTO1WW | |
| Lenovo ThinkPad T14s G2 20XGS01100 | |
| Dell Latitude 7420 JW6MH | |
| HWBOT x265 Benchmark v2.2 / 4k Preset | |
| Lenovo ThinkPad T14 G3-21CF004NGE | |
| HP EliteBook 845 G9 6F6H6EA | |
| Average AMD Ryzen 7 PRO 6850U (11.7 - 13.5, n=6) | |
| Huawei MateBook X Pro 2022 | |
| Average of class Office (1.72 - 22.4, n=84, last 2 years) | |
| Lenovo ThinkPad T14s G2 20XGS01100 | |
| Dell Inspiron 14 7420 2-in-1 | |
| Lenovo ThinkPad Z13 21D2CTO1WW | |
| Lenovo ThinkPad T14 Gen2-20W1S00000 | |
| Dell Latitude 7420 JW6MH | |
| LibreOffice / 20 Documents To PDF | |
| HP EliteBook 845 G9 6F6H6EA | |
| Lenovo ThinkPad Z13 21D2CTO1WW | |
| Average of class Office (41.5 - 129.6, n=84, last 2 years) | |
| Dell Latitude 7420 JW6MH | |
| Average AMD Ryzen 7 PRO 6850U (46.3 - 58, n=6) | |
| Lenovo ThinkPad T14 G3-21CF004NGE | |
| Dell Inspiron 14 7420 2-in-1 | |
| Lenovo ThinkPad T14s G2 20XGS01100 | |
| Lenovo ThinkPad T14 Gen2-20W1S00000 | |
| Huawei MateBook X Pro 2022 | |
| R Benchmark 2.5 / Overall mean | |
| Dell Latitude 7420 JW6MH | |
| Lenovo ThinkPad T14 Gen2-20W1S00000 | |
| Lenovo ThinkPad Z13 21D2CTO1WW | |
| Lenovo ThinkPad T14s G2 20XGS01100 | |
| Average of class Office (0.4098 - 1.06, n=83, last 2 years) | |
| Average AMD Ryzen 7 PRO 6850U (0.507 - 0.544, n=6) | |
| Lenovo ThinkPad T14 G3-21CF004NGE | |
| HP EliteBook 845 G9 6F6H6EA | |
| Huawei MateBook X Pro 2022 | |
| Dell Inspiron 14 7420 2-in-1 | |
* ... smaller is better
AIDA64: FP32 Ray-Trace | FPU Julia | CPU SHA3 | CPU Queen | FPU SinJulia | FPU Mandel | CPU AES | CPU ZLib | FP64 Ray-Trace | CPU PhotoWorxx
| Performance Rating | |
| HP EliteBook 845 G9 6F6H6EA | |
| Lenovo ThinkPad T14 G3-21CF004NGE | |
| Average AMD Ryzen 7 PRO 6850U | |
| Lenovo ThinkPad T14s G2 20XGS01100 | |
| Average of class Office | |
| Huawei MateBook X Pro 2022 | |
| Dell Latitude 7420 JW6MH | |
| Lenovo ThinkPad T14 Gen2-20W1S00000 | |
| AIDA64 / FP32 Ray-Trace | |
| HP EliteBook 845 G9 6F6H6EA | |
| Lenovo ThinkPad T14 G3-21CF004NGE | |
| Average AMD Ryzen 7 PRO 6850U (11272 - 12485, n=6) | |
| Average of class Office (1685 - 31245, n=85, last 2 years) | |
| Lenovo ThinkPad T14s G2 20XGS01100 | |
| Lenovo ThinkPad T14 Gen2-20W1S00000 | |
| Dell Latitude 7420 JW6MH | |
| Huawei MateBook X Pro 2022 | |
| AIDA64 / FPU Julia | |
| HP EliteBook 845 G9 6F6H6EA | |
| Lenovo ThinkPad T14 G3-21CF004NGE | |
| Average AMD Ryzen 7 PRO 6850U (72242 - 79484, n=6) | |
| Lenovo ThinkPad T14s G2 20XGS01100 | |
| Average of class Office (8977 - 125394, n=85, last 2 years) | |
| Lenovo ThinkPad T14 Gen2-20W1S00000 | |
| Dell Latitude 7420 JW6MH | |
| Huawei MateBook X Pro 2022 | |
| AIDA64 / CPU SHA3 | |
| HP EliteBook 845 G9 6F6H6EA | |
| Average of class Office (590 - 5398, n=85, last 2 years) | |
| Lenovo ThinkPad T14 G3-21CF004NGE | |
| Average AMD Ryzen 7 PRO 6850U (2419 - 2638, n=6) | |
| Lenovo ThinkPad T14s G2 20XGS01100 | |
| Lenovo ThinkPad T14 Gen2-20W1S00000 | |
| Dell Latitude 7420 JW6MH | |
| Huawei MateBook X Pro 2022 | |
| AIDA64 / CPU Queen | |
| HP EliteBook 845 G9 6F6H6EA | |
| Average AMD Ryzen 7 PRO 6850U (86644 - 92945, n=6) | |
| Lenovo ThinkPad T14 G3-21CF004NGE | |
| Lenovo ThinkPad T14s G2 20XGS01100 | |
| Huawei MateBook X Pro 2022 | |
| Average of class Office (20636 - 115197, n=85, last 2 years) | |
| Lenovo ThinkPad T14 Gen2-20W1S00000 | |
| Dell Latitude 7420 JW6MH | |
| AIDA64 / FPU SinJulia | |
| HP EliteBook 845 G9 6F6H6EA | |
| Lenovo ThinkPad T14 G3-21CF004NGE | |
| Average AMD Ryzen 7 PRO 6850U (10917 - 11637, n=6) | |
| Lenovo ThinkPad T14s G2 20XGS01100 | |
| Average of class Office (1064 - 18321, n=85, last 2 years) | |
| Huawei MateBook X Pro 2022 | |
| Lenovo ThinkPad T14 Gen2-20W1S00000 | |
| Dell Latitude 7420 JW6MH | |
| AIDA64 / FPU Mandel | |
| HP EliteBook 845 G9 6F6H6EA | |
| Average AMD Ryzen 7 PRO 6850U (39609 - 43843, n=6) | |
| Lenovo ThinkPad T14 G3-21CF004NGE | |
| Lenovo ThinkPad T14s G2 20XGS01100 | |
| Average of class Office (4415 - 66922, n=85, last 2 years) | |
| Lenovo ThinkPad T14 Gen2-20W1S00000 | |
| Dell Latitude 7420 JW6MH | |
| Huawei MateBook X Pro 2022 | |
| AIDA64 / CPU AES | |
| Lenovo ThinkPad T14s G2 20XGS01100 | |
| Lenovo ThinkPad T14 Gen2-20W1S00000 | |
| Dell Latitude 7420 JW6MH | |
| Huawei MateBook X Pro 2022 | |
| HP EliteBook 845 G9 6F6H6EA | |
| Lenovo ThinkPad T14 G3-21CF004NGE | |
| Average of class Office (7254 - 155900, n=85, last 2 years) | |
| Average AMD Ryzen 7 PRO 6850U (45568 - 50859, n=6) | |
| AIDA64 / CPU ZLib | |
| HP EliteBook 845 G9 6F6H6EA | |
| Lenovo ThinkPad T14 G3-21CF004NGE | |
| Average AMD Ryzen 7 PRO 6850U (641 - 713, n=6) | |
| Average of class Office (138.6 - 1366, n=85, last 2 years) | |
| Huawei MateBook X Pro 2022 | |
| Lenovo ThinkPad T14s G2 20XGS01100 | |
| Lenovo ThinkPad T14 Gen2-20W1S00000 | |
| Dell Latitude 7420 JW6MH | |
| AIDA64 / FP64 Ray-Trace | |
| HP EliteBook 845 G9 6F6H6EA | |
| Average AMD Ryzen 7 PRO 6850U (5967 - 6637, n=6) | |
| Lenovo ThinkPad T14 G3-21CF004NGE | |
| Average of class Office (859 - 17834, n=85, last 2 years) | |
| Lenovo ThinkPad T14s G2 20XGS01100 | |
| Lenovo ThinkPad T14 Gen2-20W1S00000 | |
| Dell Latitude 7420 JW6MH | |
| Huawei MateBook X Pro 2022 | |
| AIDA64 / CPU PhotoWorxx | |
| Huawei MateBook X Pro 2022 | |
| Dell Latitude 7420 JW6MH | |
| Average of class Office (9310 - 55359, n=85, last 2 years) | |
| Lenovo ThinkPad T14 G3-21CF004NGE | |
| Average AMD Ryzen 7 PRO 6850U (19707 - 26584, n=6) | |
| Lenovo ThinkPad T14s G2 20XGS01100 | |
| HP EliteBook 845 G9 6F6H6EA | |
| Lenovo ThinkPad T14 Gen2-20W1S00000 | |
System Performance
The ThinkPad T14 G3 is a very responsive laptop and we did not observe any jerks, hangs or other problems in our tests. This is further confirmed by good results in the synthetic benchmarks. Our review device was shipped with Windows 10 Professional, but it is also possible to switch to Windows 11 Pro without any problems.
CrossMark: Overall | Productivity | Creativity | Responsiveness
| PCMark 10 / Score | |
| Huawei MateBook X Pro 2022 | |
| Lenovo ThinkPad T14 G3-21CF004NGE | |
| Average AMD Ryzen 7 PRO 6850U, AMD Radeon 680M (5873 - 6152, n=6) | |
| Average of class Office (2823 - 7578, n=74, last 2 years) | |
| Lenovo ThinkPad T14s G2 20XGS01100 | |
| HP EliteBook 845 G9 6F6H6EA | |
| Lenovo ThinkPad T14 Gen2-20W1S00000 | |
| Dell Inspiron 14 7420 2-in-1 | |
| Dell Latitude 7420 JW6MH | |
| PCMark 10 / Essentials | |
| Huawei MateBook X Pro 2022 | |
| Lenovo ThinkPad T14s G2 20XGS01100 | |
| Dell Inspiron 14 7420 2-in-1 | |
| Average of class Office (6567 - 11296, n=74, last 2 years) | |
| Lenovo ThinkPad T14 Gen2-20W1S00000 | |
| Dell Latitude 7420 JW6MH | |
| Lenovo ThinkPad T14 G3-21CF004NGE | |
| Average AMD Ryzen 7 PRO 6850U, AMD Radeon 680M (9151 - 10263, n=6) | |
| HP EliteBook 845 G9 6F6H6EA | |
| PCMark 10 / Productivity | |
| Lenovo ThinkPad T14s G2 20XGS01100 | |
| Lenovo ThinkPad T14 Gen2-20W1S00000 | |
| Huawei MateBook X Pro 2022 | |
| Average AMD Ryzen 7 PRO 6850U, AMD Radeon 680M (8435 - 8891, n=6) | |
| Lenovo ThinkPad T14 G3-21CF004NGE | |
| Average of class Office (3041 - 10415, n=74, last 2 years) | |
| HP EliteBook 845 G9 6F6H6EA | |
| Dell Latitude 7420 JW6MH | |
| Dell Inspiron 14 7420 2-in-1 | |
| PCMark 10 / Digital Content Creation | |
| HP EliteBook 845 G9 6F6H6EA | |
| Average of class Office (2049 - 11108, n=74, last 2 years) | |
| Lenovo ThinkPad T14 G3-21CF004NGE | |
| Average AMD Ryzen 7 PRO 6850U, AMD Radeon 680M (6796 - 7417, n=6) | |
| Huawei MateBook X Pro 2022 | |
| Lenovo ThinkPad T14s G2 20XGS01100 | |
| Dell Inspiron 14 7420 2-in-1 | |
| Lenovo ThinkPad T14 Gen2-20W1S00000 | |
| Dell Latitude 7420 JW6MH | |
| CrossMark / Overall | |
| Huawei MateBook X Pro 2022 | |
| Dell Inspiron 14 7420 2-in-1 | |
| Average of class Office (348 - 1891, n=83, last 2 years) | |
| Lenovo ThinkPad T14 G3-21CF004NGE | |
| Lenovo ThinkPad T14s G2 20XGS01100 | |
| HP EliteBook 845 G9 6F6H6EA | |
| Average AMD Ryzen 7 PRO 6850U, AMD Radeon 680M (1154 - 1430, n=6) | |
| Dell Latitude 7420 JW6MH | |
| CrossMark / Productivity | |
| Huawei MateBook X Pro 2022 | |
| Dell Inspiron 14 7420 2-in-1 | |
| Average of class Office (393 - 1880, n=83, last 2 years) | |
| Lenovo ThinkPad T14 G3-21CF004NGE | |
| HP EliteBook 845 G9 6F6H6EA | |
| Lenovo ThinkPad T14s G2 20XGS01100 | |
| Average AMD Ryzen 7 PRO 6850U, AMD Radeon 680M (1188 - 1426, n=6) | |
| Dell Latitude 7420 JW6MH | |
| CrossMark / Creativity | |
| Huawei MateBook X Pro 2022 | |
| Average of class Office (319 - 2155, n=83, last 2 years) | |
| Dell Inspiron 14 7420 2-in-1 | |
| Lenovo ThinkPad T14 G3-21CF004NGE | |
| Lenovo ThinkPad T14s G2 20XGS01100 | |
| Average AMD Ryzen 7 PRO 6850U, AMD Radeon 680M (1180 - 1523, n=6) | |
| HP EliteBook 845 G9 6F6H6EA | |
| Dell Latitude 7420 JW6MH | |
| CrossMark / Responsiveness | |
| Huawei MateBook X Pro 2022 | |
| Average of class Office (258 - 1877, n=83, last 2 years) | |
| Dell Inspiron 14 7420 2-in-1 | |
| Dell Latitude 7420 JW6MH | |
| Lenovo ThinkPad T14 G3-21CF004NGE | |
| HP EliteBook 845 G9 6F6H6EA | |
| Average AMD Ryzen 7 PRO 6850U, AMD Radeon 680M (990 - 1243, n=6) | |
| Lenovo ThinkPad T14s G2 20XGS01100 | |
| PCMark 10 Score | 6060 points | |
Help | ||
| AIDA64 / Memory Copy | |
| Huawei MateBook X Pro 2022 | |
| Dell Latitude 7420 JW6MH | |
| Average of class Office (19648 - 108783, n=86, last 2 years) | |
| Lenovo ThinkPad T14 G3-21CF004NGE | |
| Average AMD Ryzen 7 PRO 6850U (31003 - 48605, n=6) | |
| Lenovo ThinkPad T14s G2 20XGS01100 | |
| HP EliteBook 845 G9 6F6H6EA | |
| Lenovo ThinkPad T14 Gen2-20W1S00000 | |
| AIDA64 / Memory Read | |
| Huawei MateBook X Pro 2022 | |
| Average of class Office (10084 - 127282, n=86, last 2 years) | |
| Dell Latitude 7420 JW6MH | |
| Lenovo ThinkPad T14 G3-21CF004NGE | |
| Average AMD Ryzen 7 PRO 6850U (34682 - 45079, n=6) | |
| Lenovo ThinkPad T14s G2 20XGS01100 | |
| HP EliteBook 845 G9 6F6H6EA | |
| Lenovo ThinkPad T14 Gen2-20W1S00000 | |
| AIDA64 / Memory Write | |
| Huawei MateBook X Pro 2022 | |
| Average of class Office (20073 - 117935, n=86, last 2 years) | |
| Dell Latitude 7420 JW6MH | |
| Lenovo ThinkPad T14 G3-21CF004NGE | |
| Average AMD Ryzen 7 PRO 6850U (34532 - 51096, n=6) | |
| Lenovo ThinkPad T14s G2 20XGS01100 | |
| HP EliteBook 845 G9 6F6H6EA | |
| Lenovo ThinkPad T14 Gen2-20W1S00000 | |
| AIDA64 / Memory Latency | |
| Lenovo ThinkPad T14 G3-21CF004NGE | |
| Huawei MateBook X Pro 2022 | |
| Average AMD Ryzen 7 PRO 6850U (92 - 135.3, n=6) | |
| Lenovo ThinkPad T14s G2 20XGS01100 | |
| HP EliteBook 845 G9 6F6H6EA | |
| Average of class Office (7.6 - 162.9, n=83, last 2 years) | |
| Dell Latitude 7420 JW6MH | |
| Lenovo ThinkPad T14 Gen2-20W1S00000 | |
* ... smaller is better
DPC Latency
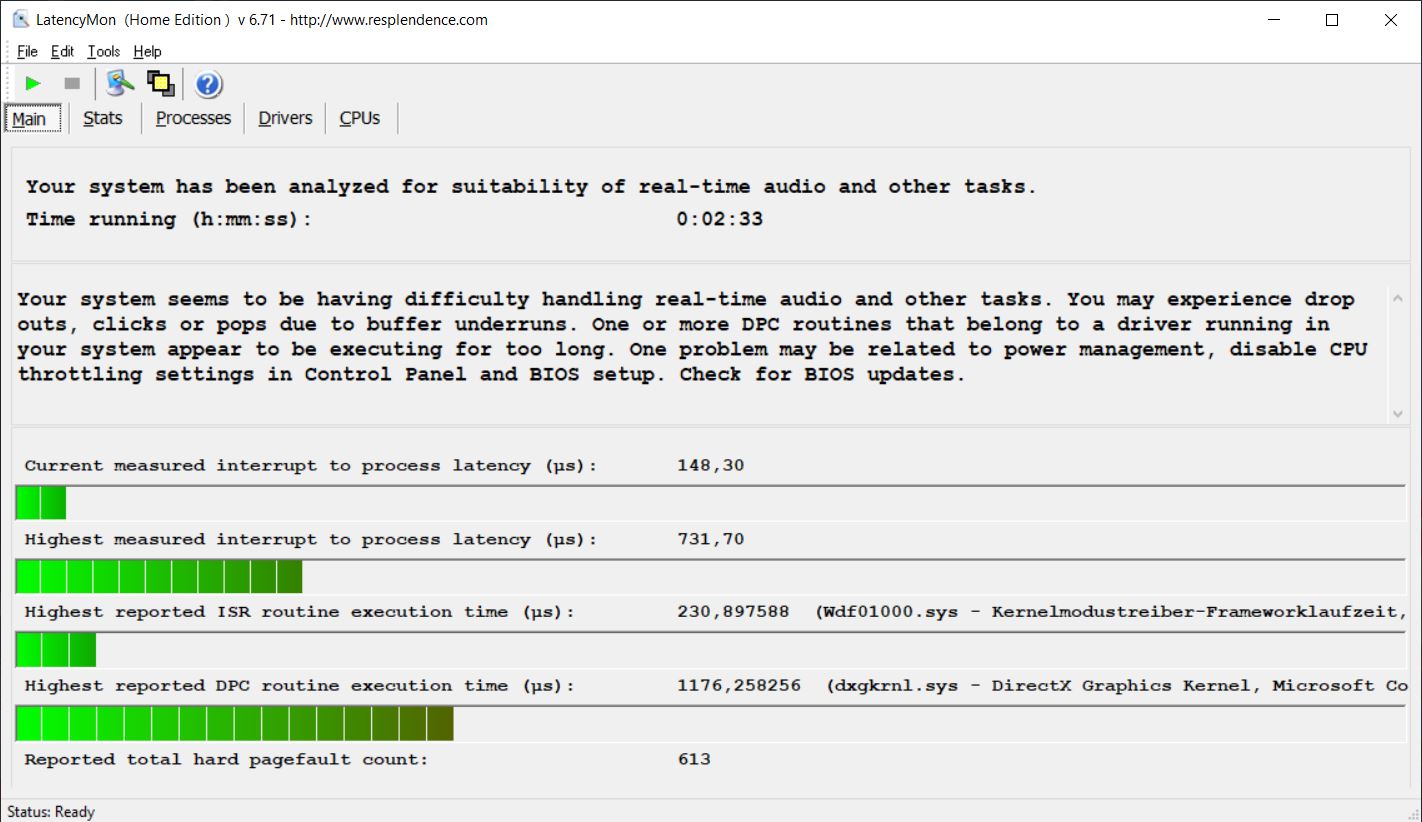
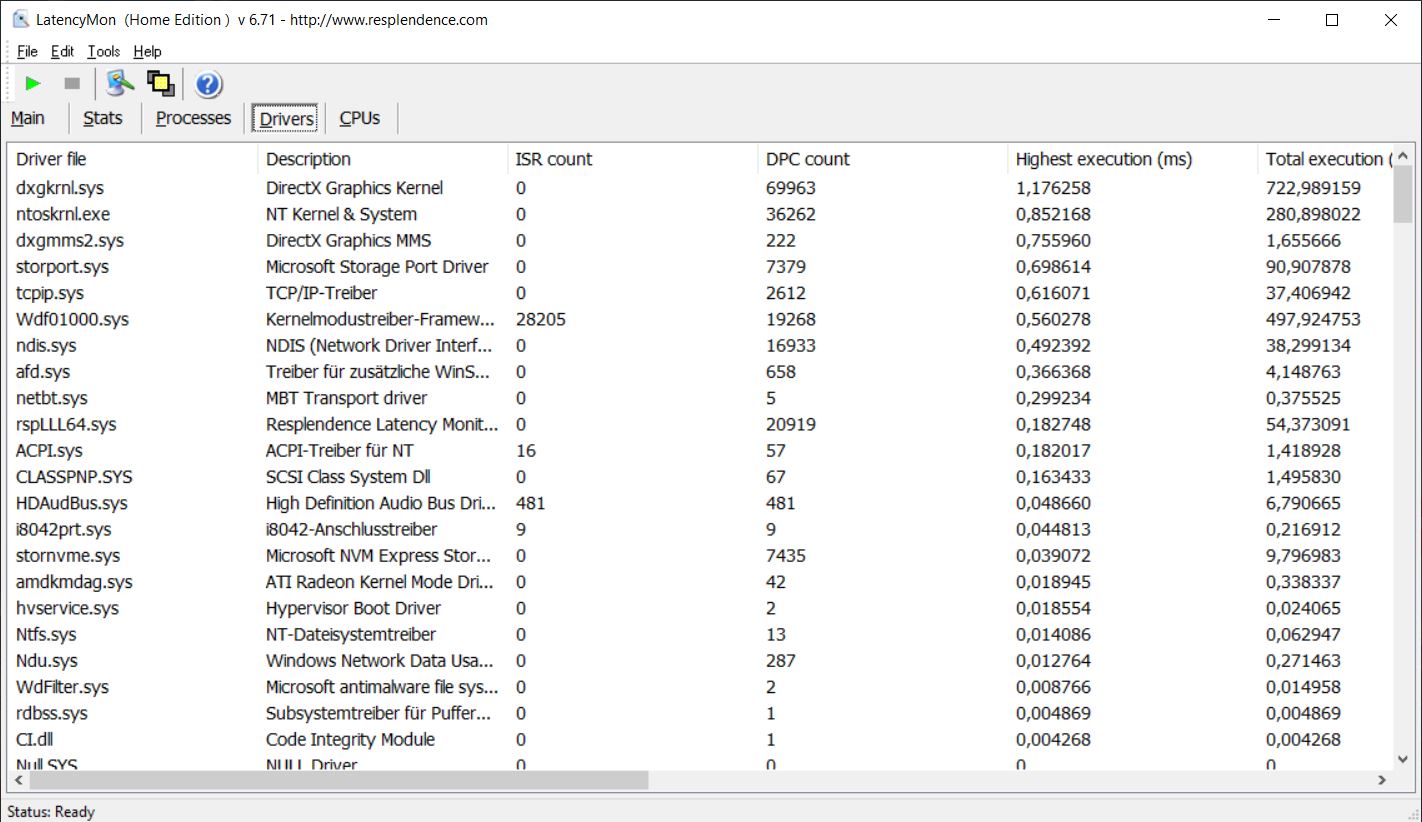
In our standardized latency test (web browsing, 4K YouTube playback, CPU load), the ThinkPad T14 G3 did not show any fundamental limitations under the current BIOS version, but a driver (DirectX Graphics Kernel) caused a slightly increased latency. Nonetheless, the review device still scores very well in the comparison field.
| DPC Latencies / LatencyMon - interrupt to process latency (max), Web, Youtube, Prime95 | |
| Lenovo ThinkPad T14 Gen2-20W1S00000 | |
| Lenovo ThinkPad T14s G2 20XGS01100 | |
| HP EliteBook 845 G9 6F6H6EA | |
| Dell Latitude 7420 JW6MH | |
| Huawei MateBook X Pro 2022 | |
| Lenovo ThinkPad T14 G3-21CF004NGE | |
* ... smaller is better
Storage Devices
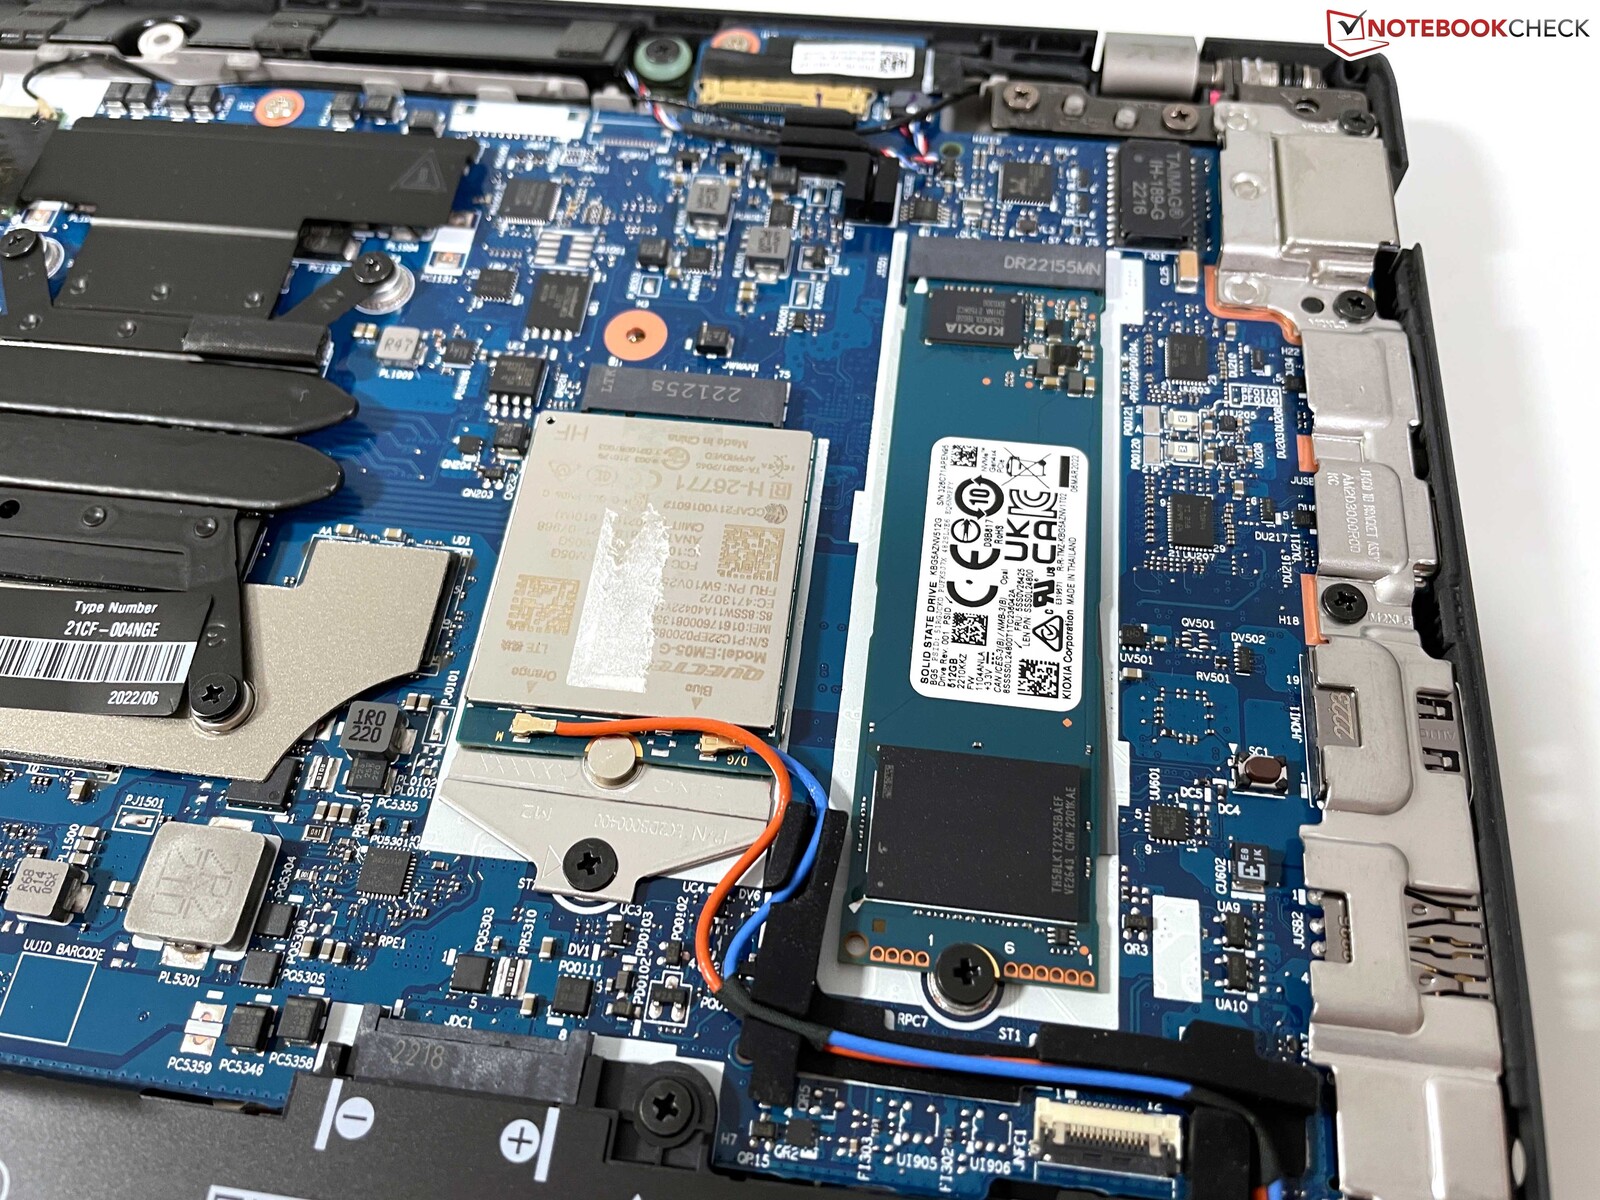
The AMD version of the ThinkPad T14 G3 offers a fast PCIe 4.0 slot for M.2-2280-SSDs, which is equipped with a Kioxia BG5 in our review sample. This is a modern PCIe 4.0-SSD, but is not one of the fastest modules and is specified with a maximum transfer rate of 3.5 GB/s. In our benchmarks, the results are decent at around 3 GB/s, but much more is possible here. At least performance remains fairly stable under prolonged load and does not drop due to temperature issues. Our review configuration offers 512 GB of storage, of which 434 GB is available after the first startup. More SSD benchmarks are listed here.

* ... smaller is better
Sustained Read Performance: DiskSpd Read Loop, Queue Depth 8
Graphics Card
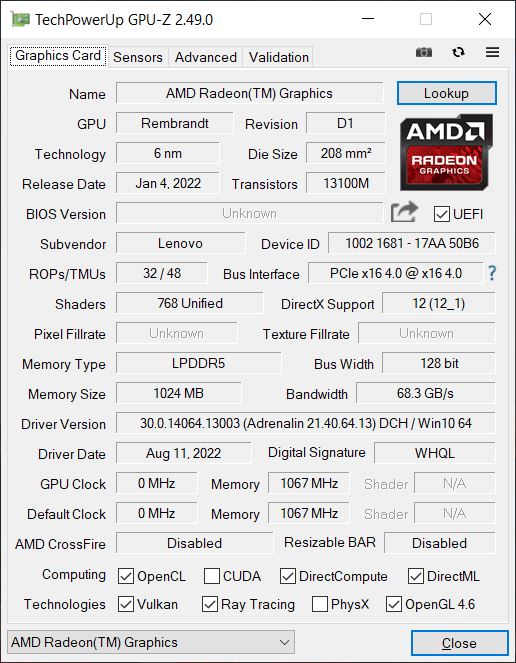
The Radeon 680M is currently the fastest integrated graphics card on the market and is able to compete with entry-level graphics cards such as the GeForce MX450 and is also not far away from the GeForce MX550, which is optionally available for the Intel model. However, we only have results for the MX550 with a very high TGP of 35 watts; we expect 25 watts for the T14 G3. So it could well be that the MX550 in the ThinkPad T14 doesn't offer any more performance than the 680M. The integrated Intel Xe Graphics G7 is clearly beaten and is roughly on par with the Radeon 660M in the Ryzen 5 Pro 6650U.
In addition to high graphics performance, which remains stable even under prolonged load and in battery mode, the integrated video decoder is also extremely efficient. For example, in our 4K YouTube video test, the GPU load is only 1-2 percent, compared to 43-44 percent with the Iris Xe Graphics G7 of the current Alder Lake processors. More GPU benchmarks are available here.
| 3DMark 11 Performance | 10275 points | |
| 3DMark Cloud Gate Standard Score | 32012 points | |
| 3DMark Fire Strike Score | 6486 points | |
| 3DMark Time Spy Score | 2555 points | |
Help | ||
In the Blender benchmark, the Radeon 680M also has advantages over the Iris Xe Graphics G7. Since Blender no longer supports OpenCL from version 3.0, AMD again supports GPU rendering via HIP (Heterogeneous-computing Interface for Portability), which is a competitor to Nvidia's CUDA technology. This reduces the rendering time in the Classroom benchmark from 525 seconds (CPU) to 335 seconds (HIP). We don't have many results for the CUDA GPUs yet, but both the RTX A1000 and RTX 3050 are at least three times faster. We are thus curious to see how the GeForce MX550 performs here.
| Blender / v3.3 Classroom CPU | |
| Beelink SEi11 Pro | |
| Lenovo ThinkPad Z13 21D2CTO1WW | |
| Asus VivoBook Pro 16X OLED N7600PC-L2026X (3.3.0) | |
| Average of class Office (245 - 3964, n=82, last 2 years) | |
| Huawei MateBook X Pro 2022 | |
| Lenovo ThinkPad T14 G3-21CF004NGE (3.2.0) | |
| HP Envy 16 h0112nr (3.2.0) | |
| Dell Precision 5000 5470 | |
| Blender / v3.3 Classroom HIP/AMD | |
| Average of class Office (296 - 1133, n=10, last 2 years) | |
| Lenovo ThinkPad Z13 21D2CTO1WW | |
| Lenovo ThinkPad T14 G3-21CF004NGE (3.2.0) | |
| Blender / v3.3 Classroom OPTIX/RTX | |
| Average of class Office (94 - 110, n=2, last 2 years) | |
| Dell Precision 5000 5470 | |
| Asus VivoBook Pro 16X OLED N7600PC-L2026X (3.3.0) | |
| HP Envy 16 h0112nr (3.2.0) | |
| Blender / v3.3 Classroom CUDA | |
| Average of class Office (155 - 175, n=2, last 2 years) | |
| Dell Precision 5000 5470 | |
| Asus VivoBook Pro 16X OLED N7600PC-L2026X (3.3.0) | |
| HP Envy 16 h0112nr (3.2.0) | |
* ... smaller is better
Although the ThinkPad T14 G3 is not a workstation, the Radeon 680M still performs rather well in the professional SPECviewperf benchmarks. The Intel Xe Graphics G7 is clearly outperformed in almost all tests, while the comparison with the dedicated GeForce MX550 depends on the scenario. The 680M is faster in some cases, the GeForce in other cases. At the very least, smaller projects can be carried out on the ThinkPad T14 G3 AMD.
Gaming Performance
The ThinkPad T14 G3 is first and foremost a business laptop, but thanks to its fast integrated GPU, you can definitely do some gaming as well. The Radeon 680M often manages smooth gameplay at medium and high details in 1080p resolution as long as the titles are not too demanding. In the gaming benchmarks, the fast 35-watt version of the GeForce MX550 is often slightly faster, but the difference to the MX550 in the ThinkPad T14 G3 is hardly worth mentioning.
| F1 2021 | |
| 1920x1080 High Preset AA:T AF:16x | |
| Average AMD Radeon 680M (26.8 - 69, n=21) | |
| Lenovo ThinkPad T14 G3-21CF004NGE (874931) | |
| Lenovo IdeaCentre AIO 3 24IAP7 (874931) | |
| Average of class Office (26.3 - 64.2, n=5, last 2 years) | |
| Huawei MateBook X Pro 2022 (874931) | |
| 1920x1080 Ultra High Preset + Raytracing AA:T AF:16x | |
| Lenovo IdeaCentre AIO 3 24IAP7 (874931) | |
| Huawei MateBook X Pro 2022 (874931) | |
| Average AMD Radeon 680M (16.1 - 29.1, n=18) | |
| Average of class Office (18.6 - 26.6, n=5, last 2 years) | |
| Lenovo ThinkPad T14 G3-21CF004NGE (874931) | |
| GTA V | |
| 1920x1080 High/On (Advanced Graphics Off) AA:2xMSAA + FX AF:8x | |
| Lenovo ThinkPad T14 G3-21CF004NGE | |
| Lenovo IdeaCentre AIO 3 24IAP7 | |
| HP EliteBook 845 G9 6F6H6EA | |
| Average AMD Radeon 680M (25.9 - 99.1, n=34) | |
| Average of class Office (6.19 - 97.5, n=74, last 2 years) | |
| Dell Latitude 7420 JW6MH | |
| Huawei MateBook X Pro 2022 | |
| Dell Inspiron 14 7420 2-in-1 | |
| 1920x1080 Highest Settings possible AA:4xMSAA + FX AF:16x | |
| Lenovo IdeaCentre AIO 3 24IAP7 | |
| Lenovo ThinkPad T14 G3-21CF004NGE | |
| Average AMD Radeon 680M (11.3 - 24.8, n=34) | |
| HP EliteBook 845 G9 6F6H6EA | |
| Average of class Office (3.98 - 47.8, n=72, last 2 years) | |
| Huawei MateBook X Pro 2022 | |
| Dell Latitude 7420 JW6MH | |
| Dell Inspiron 14 7420 2-in-1 | |
| Final Fantasy XV Benchmark | |
| 1920x1080 Standard Quality | |
| Lenovo IdeaCentre AIO 3 24IAP7 (1.3) | |
| Lenovo ThinkPad T14 G3-21CF004NGE (1.3) | |
| Average AMD Radeon 680M (18.3 - 36.9, n=38) | |
| Average of class Office (9.13 - 51.7, n=81, last 2 years) | |
| Huawei MateBook X Pro 2022 (1.3) | |
| HP EliteBook 845 G9 6F6H6EA (1.3) | |
| Dell Latitude 7420 JW6MH (1.3) | |
| Dell Inspiron 14 7420 2-in-1 (1.3) | |
| 1920x1080 High Quality | |
| Lenovo IdeaCentre AIO 3 24IAP7 (1.3) | |
| Lenovo ThinkPad T14 G3-21CF004NGE (1.3) | |
| Average AMD Radeon 680M (12.9 - 26.2, n=38) | |
| Average of class Office (6.45 - 36.5, n=79, last 2 years) | |
| Huawei MateBook X Pro 2022 (1.3) | |
| HP EliteBook 845 G9 6F6H6EA (1.3) | |
| Dell Inspiron 14 7420 2-in-1 (1.3) | |
| Strange Brigade | |
| 1920x1080 high AA:high AF:8 | |
| Lenovo IdeaCentre AIO 3 24IAP7 (1.47.22.14 D3D12) | |
| Lenovo ThinkPad T14 G3-21CF004NGE | |
| Average AMD Radeon 680M (25.3 - 53.1, n=36) | |
| Average of class Office (12 - 73.2, n=65, last 2 years) | |
| Huawei MateBook X Pro 2022 (1.47.22.14 D3D12) | |
| Lenovo ThinkPad T14s G2 20XGS01100 (1.47.22.14 D3D12) | |
| HP EliteBook 845 G9 6F6H6EA (1.47.22.14 D3D12) | |
| Dell Inspiron 14 7420 2-in-1 (1.47.22.14 D3D12) | |
| Dell Latitude 7420 JW6MH (1.47.22.14 D3D12) | |
| 1920x1080 ultra AA:ultra AF:16 | |
| Lenovo ThinkPad T14 G3-21CF004NGE | |
| Average AMD Radeon 680M (22 - 44.2, n=36) | |
| Lenovo IdeaCentre AIO 3 24IAP7 (1.47.22.14 D3D12) | |
| Average of class Office (12.8 - 61.7, n=61, last 2 years) | |
| Huawei MateBook X Pro 2022 (1.47.22.14 D3D12) | |
| Lenovo ThinkPad T14s G2 20XGS01100 (1.47.22.14 D3D12) | |
| HP EliteBook 845 G9 6F6H6EA (1.47.22.14 D3D12) | |
| Dell Inspiron 14 7420 2-in-1 (1.47.22.14 D3D12) | |
| Dell Latitude 7420 JW6MH (1.47.22.14 D3D12) | |
| Farming Simulator 22 | |
| 1920x1080 High Preset | |
| Lenovo IdeaCentre AIO 3 24IAP7 | |
| Average AMD Radeon 680M (30 - 72.5, n=4) | |
| Lenovo ThinkPad T14 G3-21CF004NGE | |
| Huawei MateBook X Pro 2022 | |
| 1920x1080 Very High Preset | |
| Lenovo ThinkPad T14 G3-21CF004NGE | |
| Lenovo IdeaCentre AIO 3 24IAP7 | |
| Average AMD Radeon 680M (27 - 53, n=4) | |
| Huawei MateBook X Pro 2022 | |
Gaming performance also remains stable under prolonged load, which is well illustrated by our Witcher 3 loop. When evaluating power consumption on an external screen (in order to rule out the varying internal panels of the review devices as influencing factors), the outstanding efficiency compared to the MX550 and especially the Iris Xe Graphics G7 is again evident. In terms of gaming performance, however, it's a pity that Lenovo has omitted USB 4, as this effectively means that you cannot connect an external graphics card, which would otherwise work very well due to the strong processor. Performance remains stable in battery mode. More gaming benchmarks are available here.
Witcher 3 FPS-Diagramm
| Power Consumption - Witcher 3 ultra Efficiency (external Monitor) | |
| AMD Radeon 680M | |
| AMD Radeon 680M | |
| NVIDIA GeForce MX550 | |
| AMD Radeon RX Vega 8 (Ryzen 4000/5000) | |
| Intel Iris Xe Graphics G7 80EUs | |
| Intel Iris Xe Graphics G7 96EUs | |
| Intel Iris Xe Graphics G7 96EUs | |
| Intel Iris Xe Graphics G7 96EUs | |
| low | med. | high | ultra | |
|---|---|---|---|---|
| GTA V (2015) | 133.6 | 120.1 | 99.1 | 22.2 |
| The Witcher 3 (2015) | 117 | 79 | 41 | 23.9 |
| Dota 2 Reborn (2015) | 111.4 | 96 | 72.8 | 63.1 |
| Final Fantasy XV Benchmark (2018) | 62 | 32.4 | 23 | |
| X-Plane 11.11 (2018) | 48.9 | 39.5 | 33.5 | |
| Far Cry 5 (2018) | 58 | 36 | 34 | 32 |
| Strange Brigade (2018) | 139 | 58 | 48 | 41 |
| F1 2021 (2021) | 140.5 | 70.8 | 55.1 | 21.2 |
| Farming Simulator 22 (2021) | 121 | 61 | 49 | 43 |
| F1 22 (2022) | 66.5 | 60.3 | 42.3 | 9.16 |
Emissions - AMD ThinkPad remains pleasantly quiet
Noise
The single fan remains pleasantly quiet in everyday use and is often deactivated during simple tasks, or there is only a very quiet noise that can hardly be heard. Under load, the fan reaches a maximum of 38 dB(A), but the noise is not high-pitched or annoying. As soon as the TDP stabilizes, the fan noise drops again to around 34 dB(A), which we also measured during gaming. Overall, this makes the ThinkPad T14 G3 one of the quietest devices in the comparison field, and if you select the most efficient power mode, the fan is hardly audible, even under load. No other electronic noises, such as coil whine, were detected.
Noise Level
| Idle |
| 24.2 / 24.2 / 25.8 dB(A) |
| Load |
| 32.2 / 38.8 dB(A) |
 | ||
30 dB silent 40 dB(A) audible 50 dB(A) loud |
||
min: | ||
| Lenovo ThinkPad T14 G3-21CF004NGE Radeon 680M, R7 PRO 6850U, Kioxia BG5 KBG5AZNV512G | Dell Latitude 7420 JW6MH Iris Xe G7 80EUs, i5-1145G7, SK Hynix BC711 HFM512GD3HX015N | Huawei MateBook X Pro 2022 Iris Xe G7 96EUs, i7-1260P, Silicon Motion PCIe-8 SSD 1TB | HP EliteBook 845 G9 6F6H6EA Radeon 680M, R9 PRO 6950HS, WDC PC SN810 1TB | Lenovo ThinkPad T14 Gen2-20W1S00000 GeForce MX450, i7-1165G7, Samsung PM981a MZVLB1T0HBLR | Lenovo ThinkPad T14s G2 20XGS01100 Vega 8, R7 PRO 5850U, Lenovo UMIS AM630 RPETJ1T24MGE2QDQ | |
|---|---|---|---|---|---|---|
| Noise | -11% | -1% | -8% | -4% | -3% | |
| off / environment * | 24.2 | 25.3 -5% | 23.5 3% | 25.5 -5% | 24.2 -0% | 26.81 -11% |
| Idle Minimum * | 24.2 | 25.3 -5% | 23.5 3% | 25.5 -5% | 24.2 -0% | 26.81 -11% |
| Idle Average * | 24.2 | 25.3 -5% | 23.5 3% | 25.5 -5% | 24.2 -0% | 26.81 -11% |
| Idle Maximum * | 25.8 | 25.3 2% | 25.9 -0% | 25.5 1% | 24.2 6% | 26.81 -4% |
| Load Average * | 32.2 | 44.9 -39% | 33.8 -5% | 38.1 -18% | 35.4 -10% | 30.16 6% |
| Witcher 3 ultra * | 34.1 | 35.4 -4% | 40.1 -18% | |||
| Load Maximum * | 38.8 | 44.9 -16% | 40.6 -5% | 44 -13% | 40.1 -3% | 33.98 12% |
* ... smaller is better
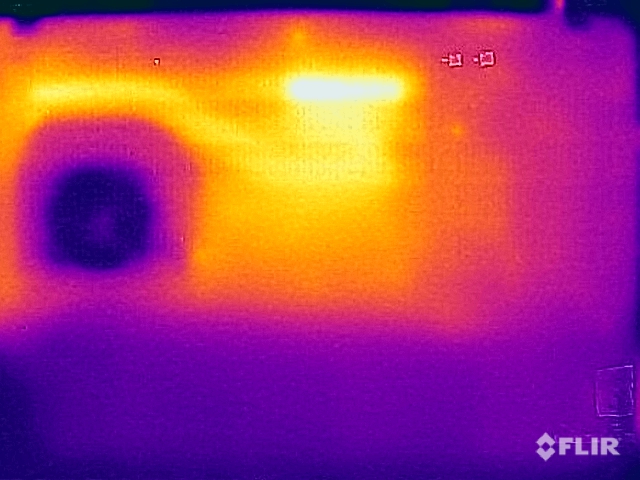
Temperature
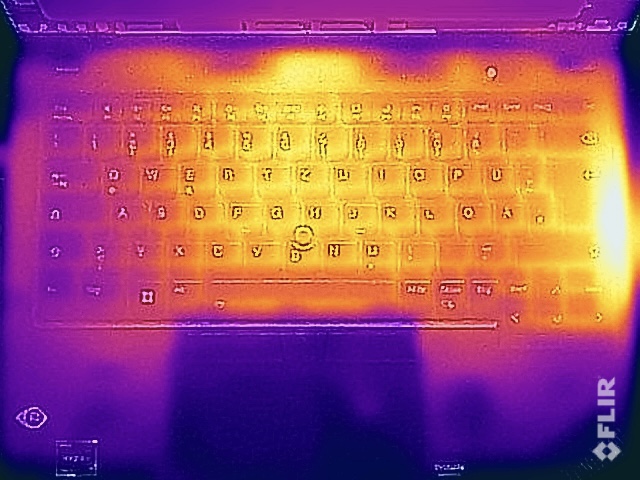
The case of the ThinkPad T14 G3 hardly heats up under low load, but things look different under load. In particular, the central rear area on the underside and the cover above the fan outlet next to the keyboard heat up very strongly. We are already familiar with warm surfaces next to the keyboard from the predecessors. Under load, the ThinkPad T14 G3 should not be placed on the lap, or else switched to battery-saving mode. This may be problematic for configurations of the T14 G3 with the dedicated GeForce MX550, which are naturally accompanied by increased thermal load.
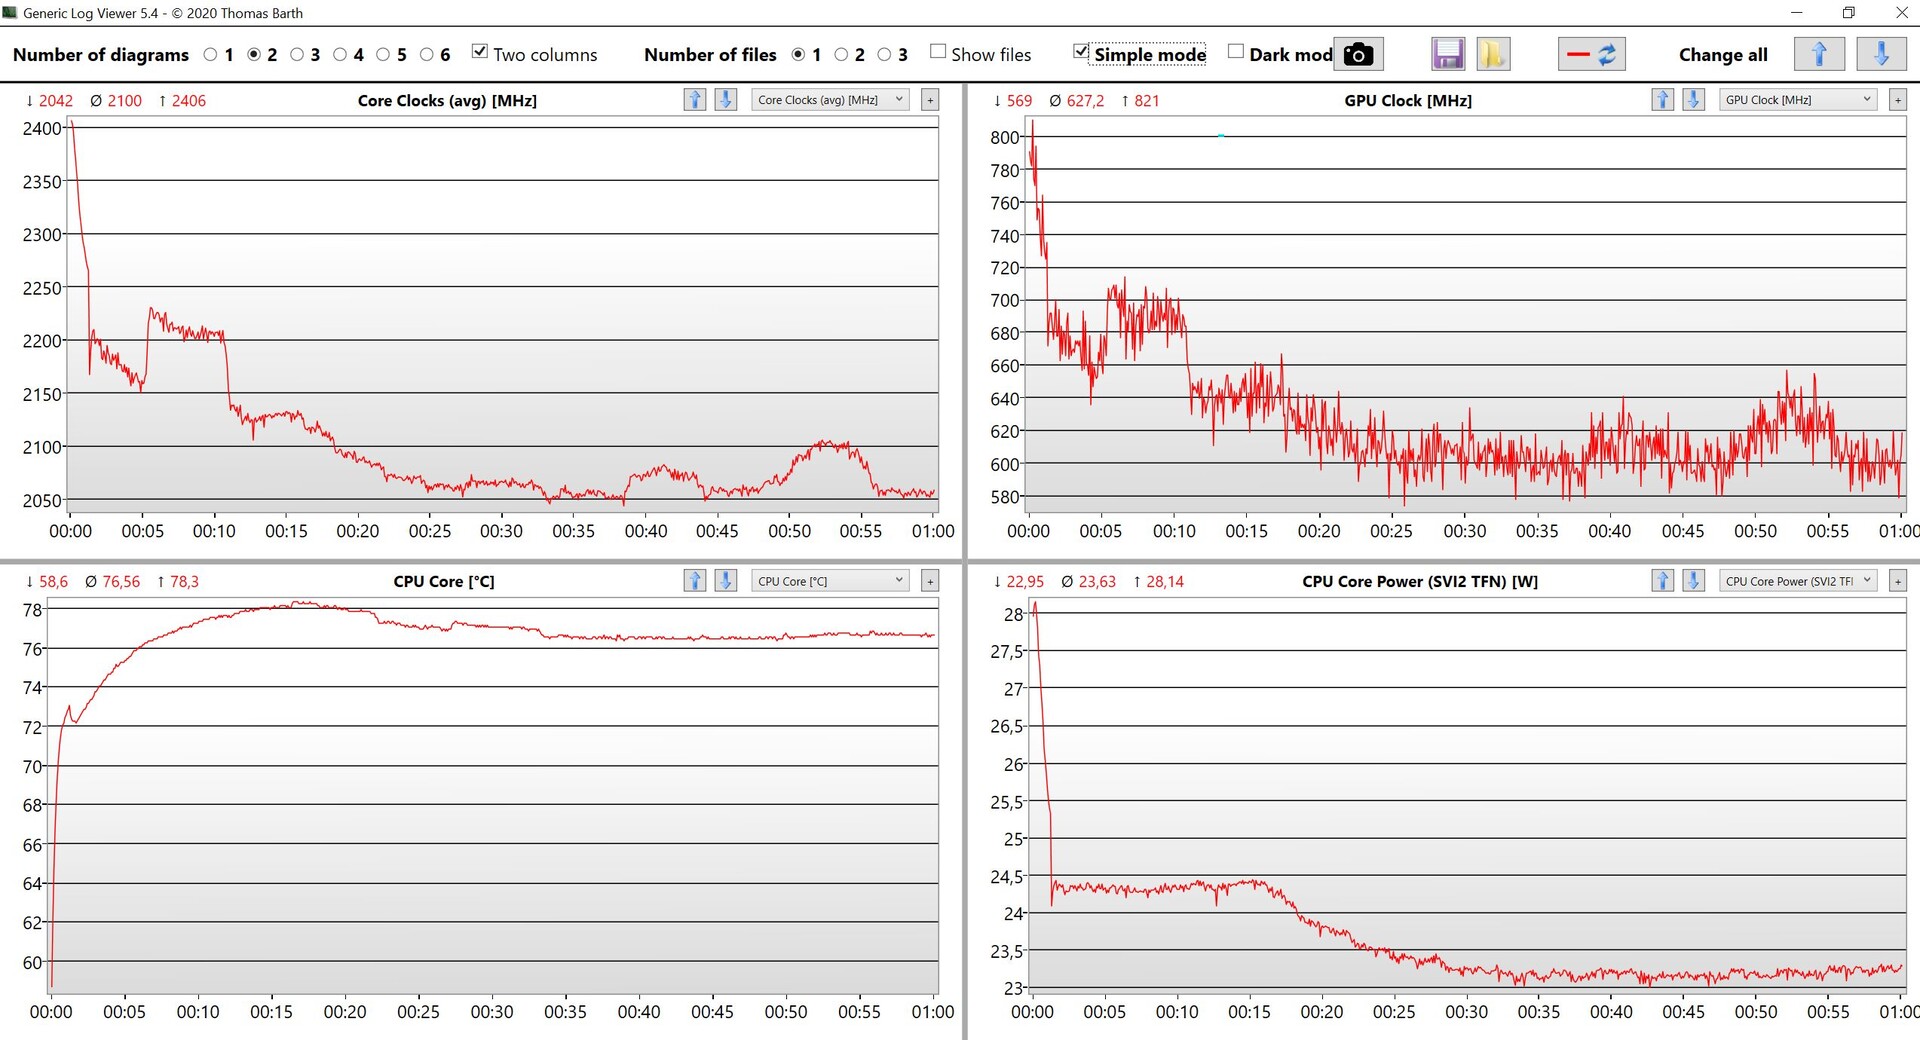
In the stress test with combined CPU/GPU load, the SoC's power consumption fluctuates around 25 watts for the first 15 minutes before stabilizing at 23 watts. No subsequent performance decline was observed after the end of the stress test.
(-) The maximum temperature on the upper side is 48.2 °C / 119 F, compared to the average of 34.3 °C / 94 F, ranging from 21.2 to 62.5 °C for the class Office.
(-) The bottom heats up to a maximum of 52.8 °C / 127 F, compared to the average of 36.8 °C / 98 F
(+) In idle usage, the average temperature for the upper side is 23.9 °C / 75 F, compared to the device average of 29.5 °C / 85 F.
(±) Playing The Witcher 3, the average temperature for the upper side is 37.8 °C / 100 F, compared to the device average of 29.5 °C / 85 F.
(+) The palmrests and touchpad are cooler than skin temperature with a maximum of 29.8 °C / 85.6 F and are therefore cool to the touch.
(-) The average temperature of the palmrest area of similar devices was 27.6 °C / 81.7 F (-2.2 °C / -3.9 F).
| Lenovo ThinkPad T14 G3-21CF004NGE AMD Ryzen 7 PRO 6850U, AMD Radeon 680M | Dell Latitude 7420 JW6MH Intel Core i5-1145G7, Intel Iris Xe Graphics G7 80EUs | Huawei MateBook X Pro 2022 Intel Core i7-1260P, Intel Iris Xe Graphics G7 96EUs | HP EliteBook 845 G9 6F6H6EA AMD Ryzen 9 PRO 6950HS, AMD Radeon 680M | Lenovo ThinkPad T14 Gen2-20W1S00000 Intel Core i7-1165G7, NVIDIA GeForce MX450 | Lenovo ThinkPad T14s G2 20XGS01100 AMD Ryzen 7 PRO 5850U, AMD Radeon RX Vega 8 (Ryzen 4000/5000) | |
|---|---|---|---|---|---|---|
| Heat | 6% | -2% | -12% | -7% | 1% | |
| Maximum Upper Side * | 48.2 | 37.1 23% | 43.1 11% | 49.4 -2% | 47 2% | 44.2 8% |
| Maximum Bottom * | 52.8 | 38.7 27% | 42 20% | 48 9% | 58.4 -11% | 38.9 26% |
| Idle Upper Side * | 24.4 | 27.3 -12% | 29.4 -20% | 30.8 -26% | 25.3 -4% | 27.7 -14% |
| Idle Bottom * | 24.5 | 28.1 -15% | 29.4 -20% | 31.4 -28% | 27.7 -13% | 28.3 -16% |
* ... smaller is better
Speakers
The two stereo speakers are located above the keyboard and direct the sound towards the user. However, since the two modules are placed very closely to each other, there is no stereo effect and the overall sound is quite thin. The strengths are the linear trebles, which are conducive to voice reproduction during conferences. Apart from some background music or the occasional video, however, you would be better off using external speakers or headphones.
Lenovo ThinkPad T14 G3-21CF004NGE audio analysis
(±) | speaker loudness is average but good (77.2 dB)
Bass 100 - 315 Hz
(-) | nearly no bass - on average 24.6% lower than median
(±) | linearity of bass is average (10.1% delta to prev. frequency)
Mids 400 - 2000 Hz
(+) | balanced mids - only 2.6% away from median
(+) | mids are linear (4.6% delta to prev. frequency)
Highs 2 - 16 kHz
(+) | balanced highs - only 3.3% away from median
(+) | highs are linear (3.8% delta to prev. frequency)
Overall 100 - 16.000 Hz
(±) | linearity of overall sound is average (18.8% difference to median)
Compared to same class
» 33% of all tested devices in this class were better, 7% similar, 60% worse
» The best had a delta of 7%, average was 21%, worst was 53%
Compared to all devices tested
» 41% of all tested devices were better, 8% similar, 51% worse
» The best had a delta of 4%, average was 24%, worst was 134%
Dell Latitude 7420 JW6MH audio analysis
(+) | speakers can play relatively loud (82.7 dB)
Bass 100 - 315 Hz
(-) | nearly no bass - on average 15.6% lower than median
(±) | linearity of bass is average (12.8% delta to prev. frequency)
Mids 400 - 2000 Hz
(+) | balanced mids - only 2.9% away from median
(+) | mids are linear (4% delta to prev. frequency)
Highs 2 - 16 kHz
(+) | balanced highs - only 2.5% away from median
(+) | highs are linear (4.3% delta to prev. frequency)
Overall 100 - 16.000 Hz
(+) | overall sound is linear (12.5% difference to median)
Compared to same class
» 4% of all tested devices in this class were better, 1% similar, 95% worse
» The best had a delta of 7%, average was 21%, worst was 53%
Compared to all devices tested
» 10% of all tested devices were better, 2% similar, 88% worse
» The best had a delta of 4%, average was 24%, worst was 134%
Power Management - AMD ThinkPad is very efficient
Power Consumption
With a 400-nits display and an AMD processor, the ThinkPad T14 G3 is extremely power efficient. Even at full brightness, the idle power consumption is less than 6 watts. Under load, we clearly see differences to the current Intel systems, which often reach the limit of the 65-watt power adapter during peak loads and are occasionally forced to draw on battery power. The AMD version of the ThinkPad, on the other hand, only draws a maximum of 50 watts under load, so the 65 watt power supply is completely sufficient.
| Off / Standby | |
| Idle | |
| Load |
|
Key:
min: | |
| Lenovo ThinkPad T14 G3-21CF004NGE R7 PRO 6850U, Radeon 680M, Kioxia BG5 KBG5AZNV512G, IPS, 1920x1200, 14" | Dell Latitude 7420 JW6MH i5-1145G7, Iris Xe G7 80EUs, SK Hynix BC711 HFM512GD3HX015N, IPS, 1920x1080, 14" | Huawei MateBook X Pro 2022 i7-1260P, Iris Xe G7 96EUs, Silicon Motion PCIe-8 SSD 1TB, IPS, 3120x2080, 14.2" | HP EliteBook 845 G9 6F6H6EA R9 PRO 6950HS, Radeon 680M, WDC PC SN810 1TB, IPS, 1920x1200, 14" | Lenovo ThinkPad T14 Gen2-20W1S00000 i7-1165G7, GeForce MX450, Samsung PM981a MZVLB1T0HBLR, IPS LED, 1920x1080, 14" | Lenovo ThinkPad T14s G2 20XGS01100 R7 PRO 5850U, Vega 8, Lenovo UMIS AM630 RPETJ1T24MGE2QDQ, IPS LED, 1920x1080, 14" | Average AMD Radeon 680M | Average of class Office | |
|---|---|---|---|---|---|---|---|---|
| Power Consumption | -10% | -111% | -111% | -47% | -4% | -82% | -43% | |
| Idle Minimum * | 2.4 | 2.7 -13% | 6.5 -171% | 6.4 -167% | 3.8 -58% | 3.16 -32% | 6.76 ? -182% | 4.53 ? -89% |
| Idle Average * | 5.3 | 6 -13% | 13.7 -158% | 12.4 -134% | 7.3 -38% | 5.6 -6% | 8.87 ? -67% | 7.42 ? -40% |
| Idle Maximum * | 5.6 | 7.6 -36% | 14.4 -157% | 18 -221% | 11.2 -100% | 7.13 -27% | 10.5 ? -88% | 8.88 ? -59% |
| Load Average * | 39.7 | 37 7% | 64.6 -63% | 63 -59% | 61.2 -54% | 30.86 22% | 53.2 ? -34% | 41.3 ? -4% |
| Witcher 3 ultra * | 42.8 | 33.2 22% | 57.2 -34% | 63.6 -49% | 41.2 4% | 37 14% | ||
| Load Maximum * | 50.6 | 65 -28% | 90.9 -80% | 68 -34% | 67.5 -33% | 46.55 8% | 70.1 ? -39% | 61.6 ? -22% |
* ... smaller is better
Power consumption Witcher 3 / Stress test
Power consumption with an external monitor
Battery Life
The 52.5 Wh battery ensures extremely good runtimes. At an adjusted brightness of 150 cd/m² (corresponding to 65% of the maximum brightness in our review sample), our video test runs for almost 16.5 hours, which is again confirmation of the very efficient video decoder. The WLAN test lasts nearly 13 hours, and almost 10 hours at maximum brightness. We also repeated the WLAN test (150 cd/m²) solely on cellular connection and the result was 10:18 minutes.
With the 65-watt power supply, the ThinkPad supports RapidCharge technology and a full charge takes just under 100 minutes with the device turned on; 50% is available after just 30 minutes and 80% after 53 minutes.
| Lenovo ThinkPad T14 G3-21CF004NGE R7 PRO 6850U, Radeon 680M, 52.5 Wh | Dell Latitude 7420 JW6MH i5-1145G7, Iris Xe G7 80EUs, 63 Wh | Huawei MateBook X Pro 2022 i7-1260P, Iris Xe G7 96EUs, 60 Wh | HP EliteBook 845 G9 6F6H6EA R9 PRO 6950HS, Radeon 680M, 51 Wh | Lenovo ThinkPad T14 Gen2-20W1S00000 i7-1165G7, GeForce MX450, 50 Wh | Lenovo ThinkPad T14s G2 20XGS01100 R7 PRO 5850U, Vega 8, 57 Wh | Average of class Office | |
|---|---|---|---|---|---|---|---|
| Battery Runtime | 57% | -21% | -12% | -14% | 13% | 8% | |
| H.264 | 984 | 455 -54% | 839 -15% | 891 -9% | 833 ? -15% | ||
| WiFi v1.3 | 772 | 848 10% | 451 -42% | 560 -27% | 538 -30% | 877 14% | 701 ? -9% |
| Load | 76 | 155 104% | 100 32% | 79 4% | 78 3% | 101 33% | 113.2 ? 49% |
Pros
Cons
Verdict - ThinkPad T3 G3 is very good, but comes with unnecessary limitations

The ThinkPad T14 is a very good business notebook. It is neither the thinnest nor the lightest 14-inch notebook, which it does not attempt to be, and this approach harbors advantages in everyday use, such as the extensive connectivity. Lenovo has brought an extensive redesign to bear with the new T14 G3, which is also a success in many areas. The 16:10 screen fits harmoniously into the overall concept and the extremely wide bottom screen edge has finally disappeared. The larger touchpad is also pleasing and the TrackPoint keys are among the best we have ever experienced in a ThinkPad with their rich and quiet clicks.
However, a negative aspect concerns the keyboard. Here, Lenovo is following the approach of other ThinkPads such as the X1 Carbon, reducing the key drop from 1.8 to 1.5 mm, which is unnecessary considering the thickness of the case. And you notice the difference when typing. It's a real pity that Lenovo continues to further dimish what was formerly a strong highlight, deliberately settling for poorer quality. The keyboard of the new T14 G3 is by no means bad, but it no longer has an advantage over other business competitors such as HP. Lenovo should reconsider its strategy here.
The new ThinkPad T14 G3 is a very good business laptop that is a well-rounded device overall with the fast and efficient AMD Ryzen 7 Pro, which has an advantage over the Intel variant in many areas.
When choosing between the ThinkPad T14 G3 with AMD or Intel CPUs, AMD is clearly the favorite because, in addition to high performance in the multi-core tests and the integrated GPU, it is especially impressive in terms of efficiency. Our experience with previous Alder Lake laptops has shown that very high power limits often lead to very responsive fans and higher power consumption in everyday use, which usually requires stronger power adapters. The AMD system is pleasantly quiet even under load and the battery runtimes also prove to be very good. The Intel version is available with a dedicated GeForce MX550, but this is unlikely to be faster than the integrated Radeon 680M, not to mention the additional thermal load. The only real advantage of the Intel version is the Thunderbolt support, although one must critically question why Lenovo has decided to forgo the implementation of USB 4 when this is possible in consumer models such as the Yoga 7 14. Furthermore, the RAM cannot be expanded in the AMD model, but faster working memory is used in return (LPDDR5-6400 vs. DDR4-3200).
The lack of USB 4 in the AMD version is an unnecessary limitation by Lenovo, and we also recommend that the manufacturer reconsider its strategy regarding the keyboard. Here, the quality keeps decreasing and the former advantage of better keyboards no longer exists.
Buyers should be a little wary when selecting the display because the basic panel is not much fun. Our review variant, with a brightness of 400 cd/m², is the best compromise between image quality and power consumption, as was also the case in earlier versions. The brightness is very good, the contrast ratio is extremely high and the image sharpness also perfectly adequate - it is simply a very good display for business use. Moreover, it is extremely efficient and ensures very good battery runtimes. The optional 4K panel with DCI-P3 coverage will offer better image quality, but will also require significantly more power.
The strongest competitor for the ThinkPad T14 G3 is probably the EliteBook 845 G9, since it uses the even stronger AMD Ryzen 9 Pro 6950HS, but you should avoid the Sure View panel. The Dell Latitude 7420, on the other hand, offers significantly less performance and is noticeably louder with its Tiger Lake processor. Other current business laptops will be reviewed in the coming weeks, including the new ThinkPad T14s G3 as well as the Intel/Nvidia variant of the ThinkPad T14 G3.
Price and Availability
Interested buyers are advised to check Lenovo's official website directly for availability. Both the AMD and Intel variants of the Lenovo ThinkPad T14 G3 appear to be widely available, with the exact configuration (and thus the price) depending on the country of purchase. For example, we found the AMD variant listed in the USA (US$1,038.95), Canada (CAD$1,319.45), the UK (£896.00), France (1,616.00€), Italy (1,359.00€), India (₹98,952) Singapore (SG$1,602.55), Australia (AU$2,289.00), the United Arab Emirates and South Africa. This list is not exhaustive and these prices represent the starting prices only, which invariably increase upon the selection of more powerful components.
Prices are as of 26.09 and are subject to change.
Lenovo ThinkPad T14 G3-21CF004NGE
- 09/23/2022 v7 (old)
Andreas Osthoff
More articles related to this device
Lenovo ThinkPad T14 G3-21CF004NGE (ThinkPad T14 Series)Related Articles


Price comparison

