

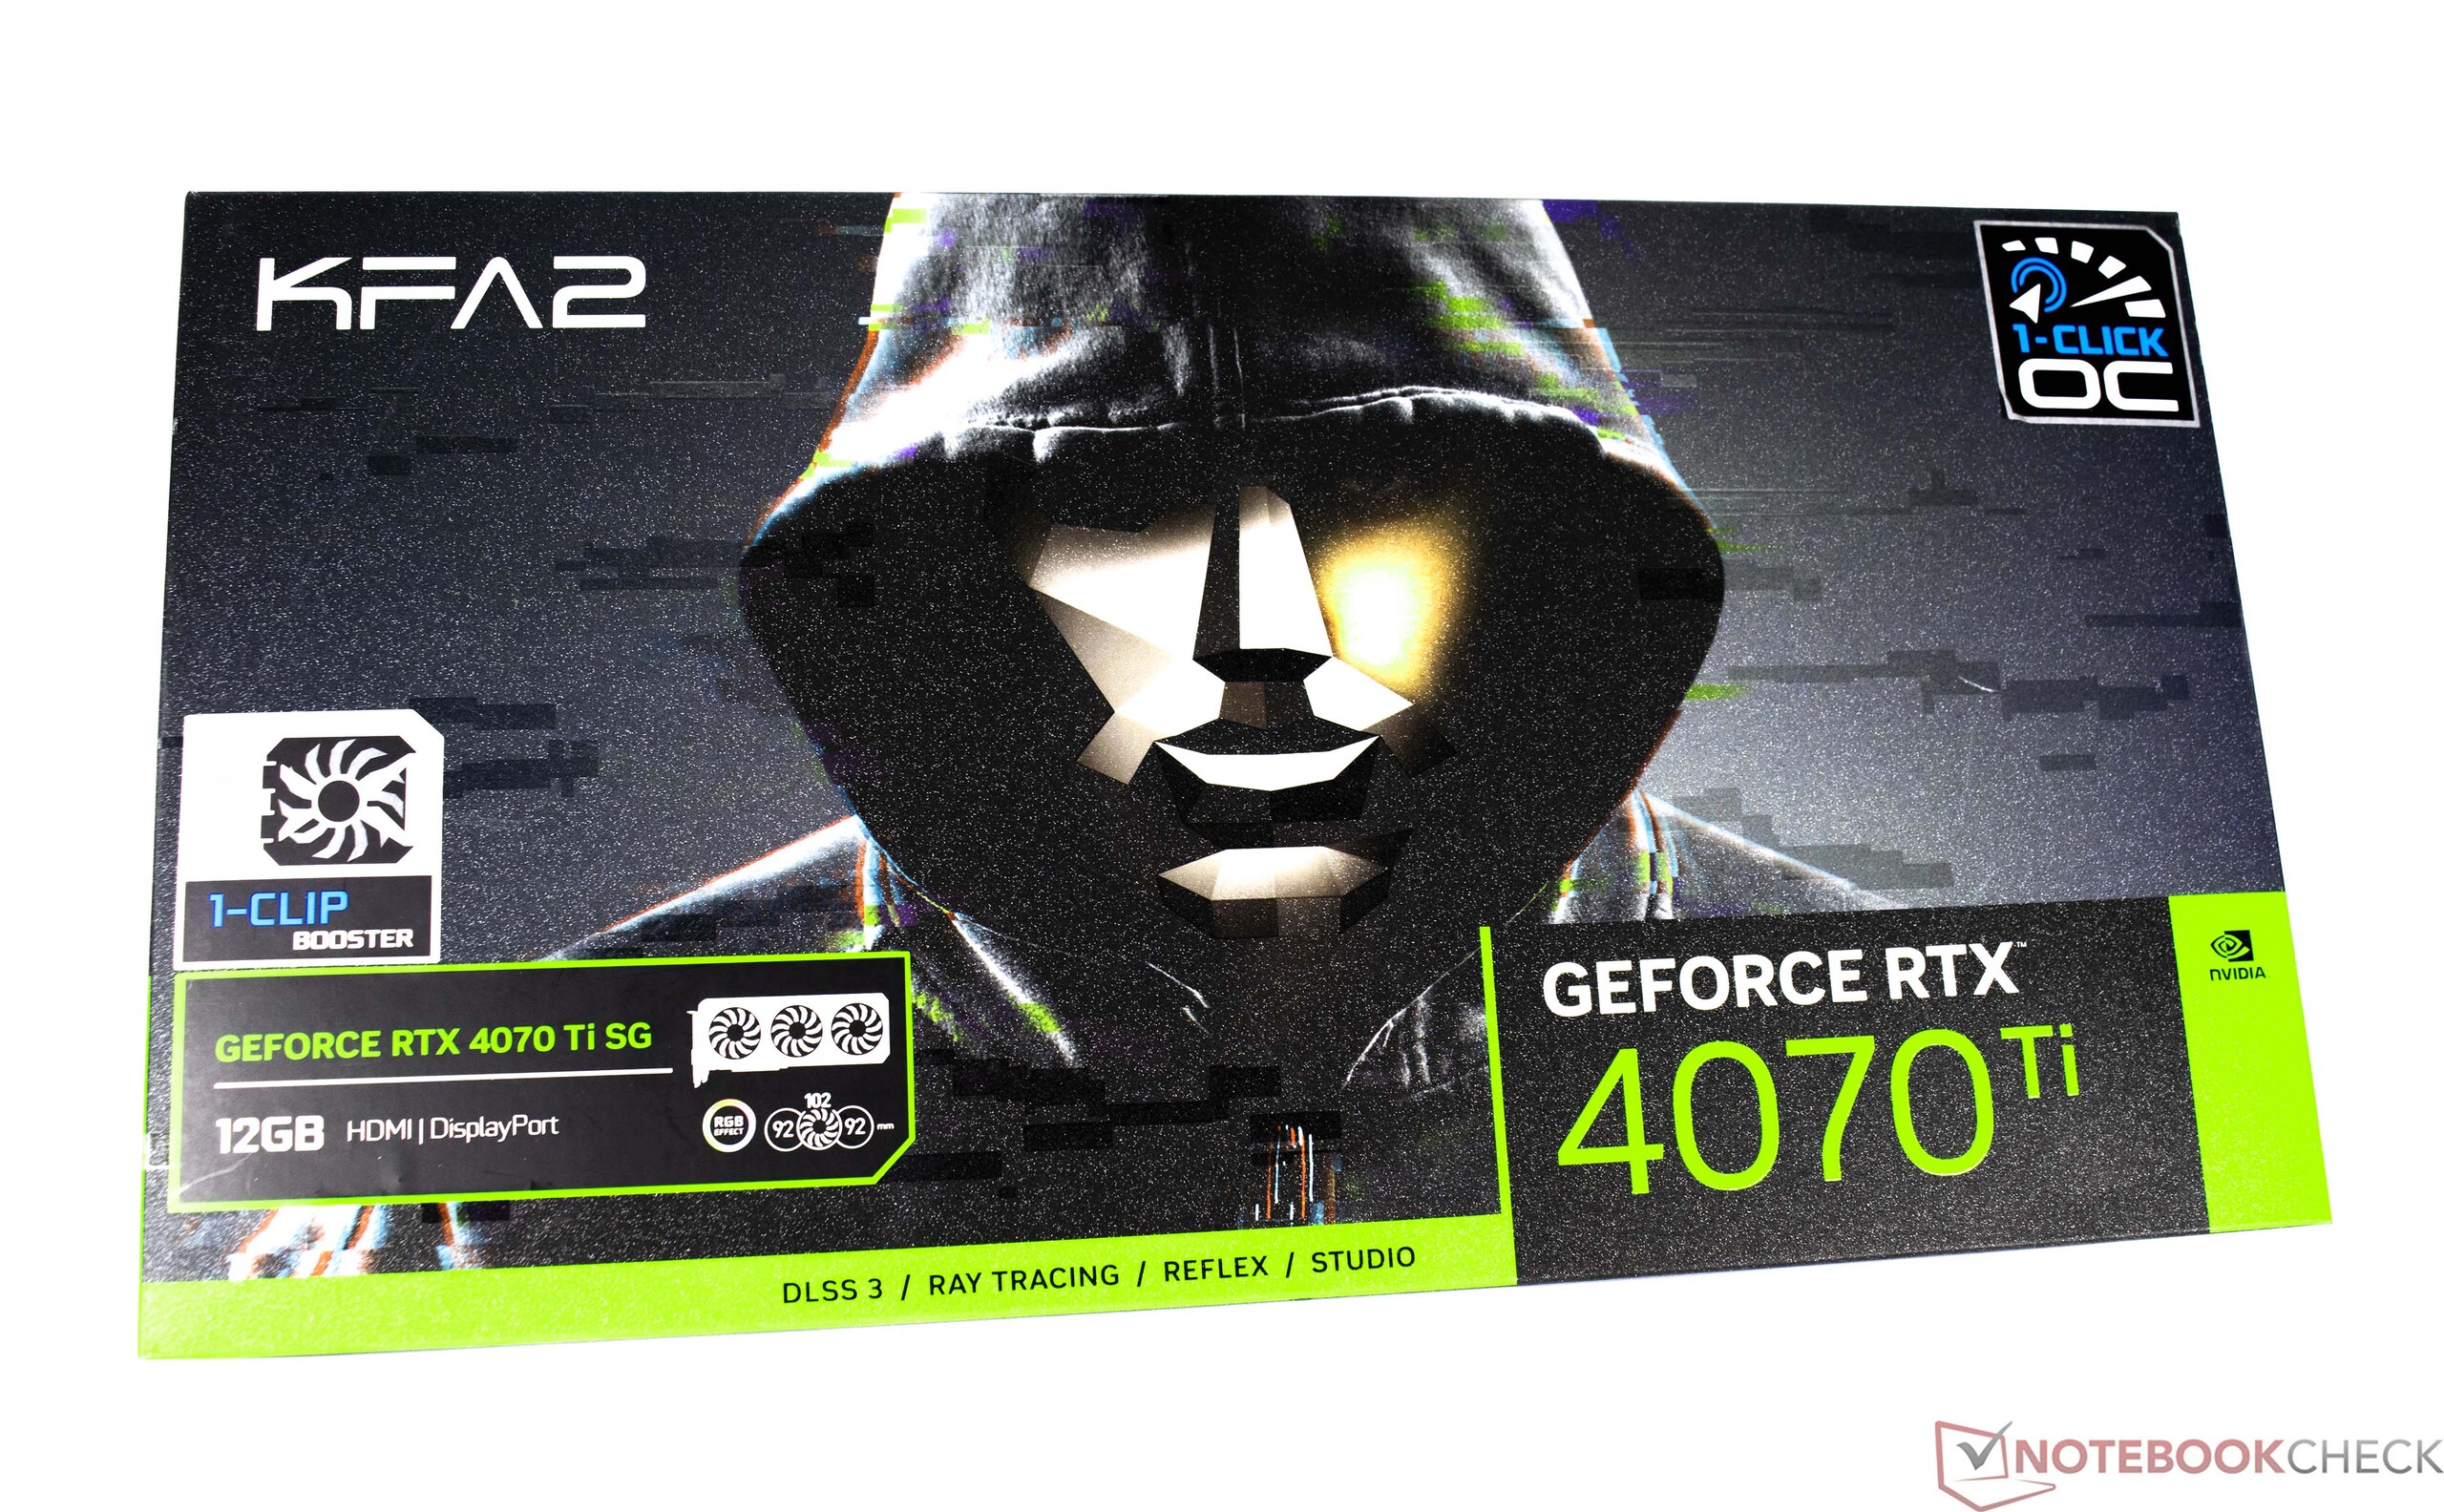
KFA2 GeForce RTX 4070 Ti SG desktop graphics card review: Nvidia's first Ada Lovelace GPU for under €1,000.
The Nvidia RTX 4070 Ti hit the shelves on 5 January this year. With the RTX 4070 Ti, Nvidia has expanded its Ada Lovelace lineup by introducing a modern GPU based on the latest architecture that costs under €1,000 (US$1,080); the card has an RRP of €899 (US$799) to be precise. It remains to be seen whether this price actually makes it to consumers. As always, you are going to find various models of the Nvidia GeForce RTX 4070 Ti from the usual board partners. And this time around, Nvidia isn't going to release a Founders Edition of the GPU.
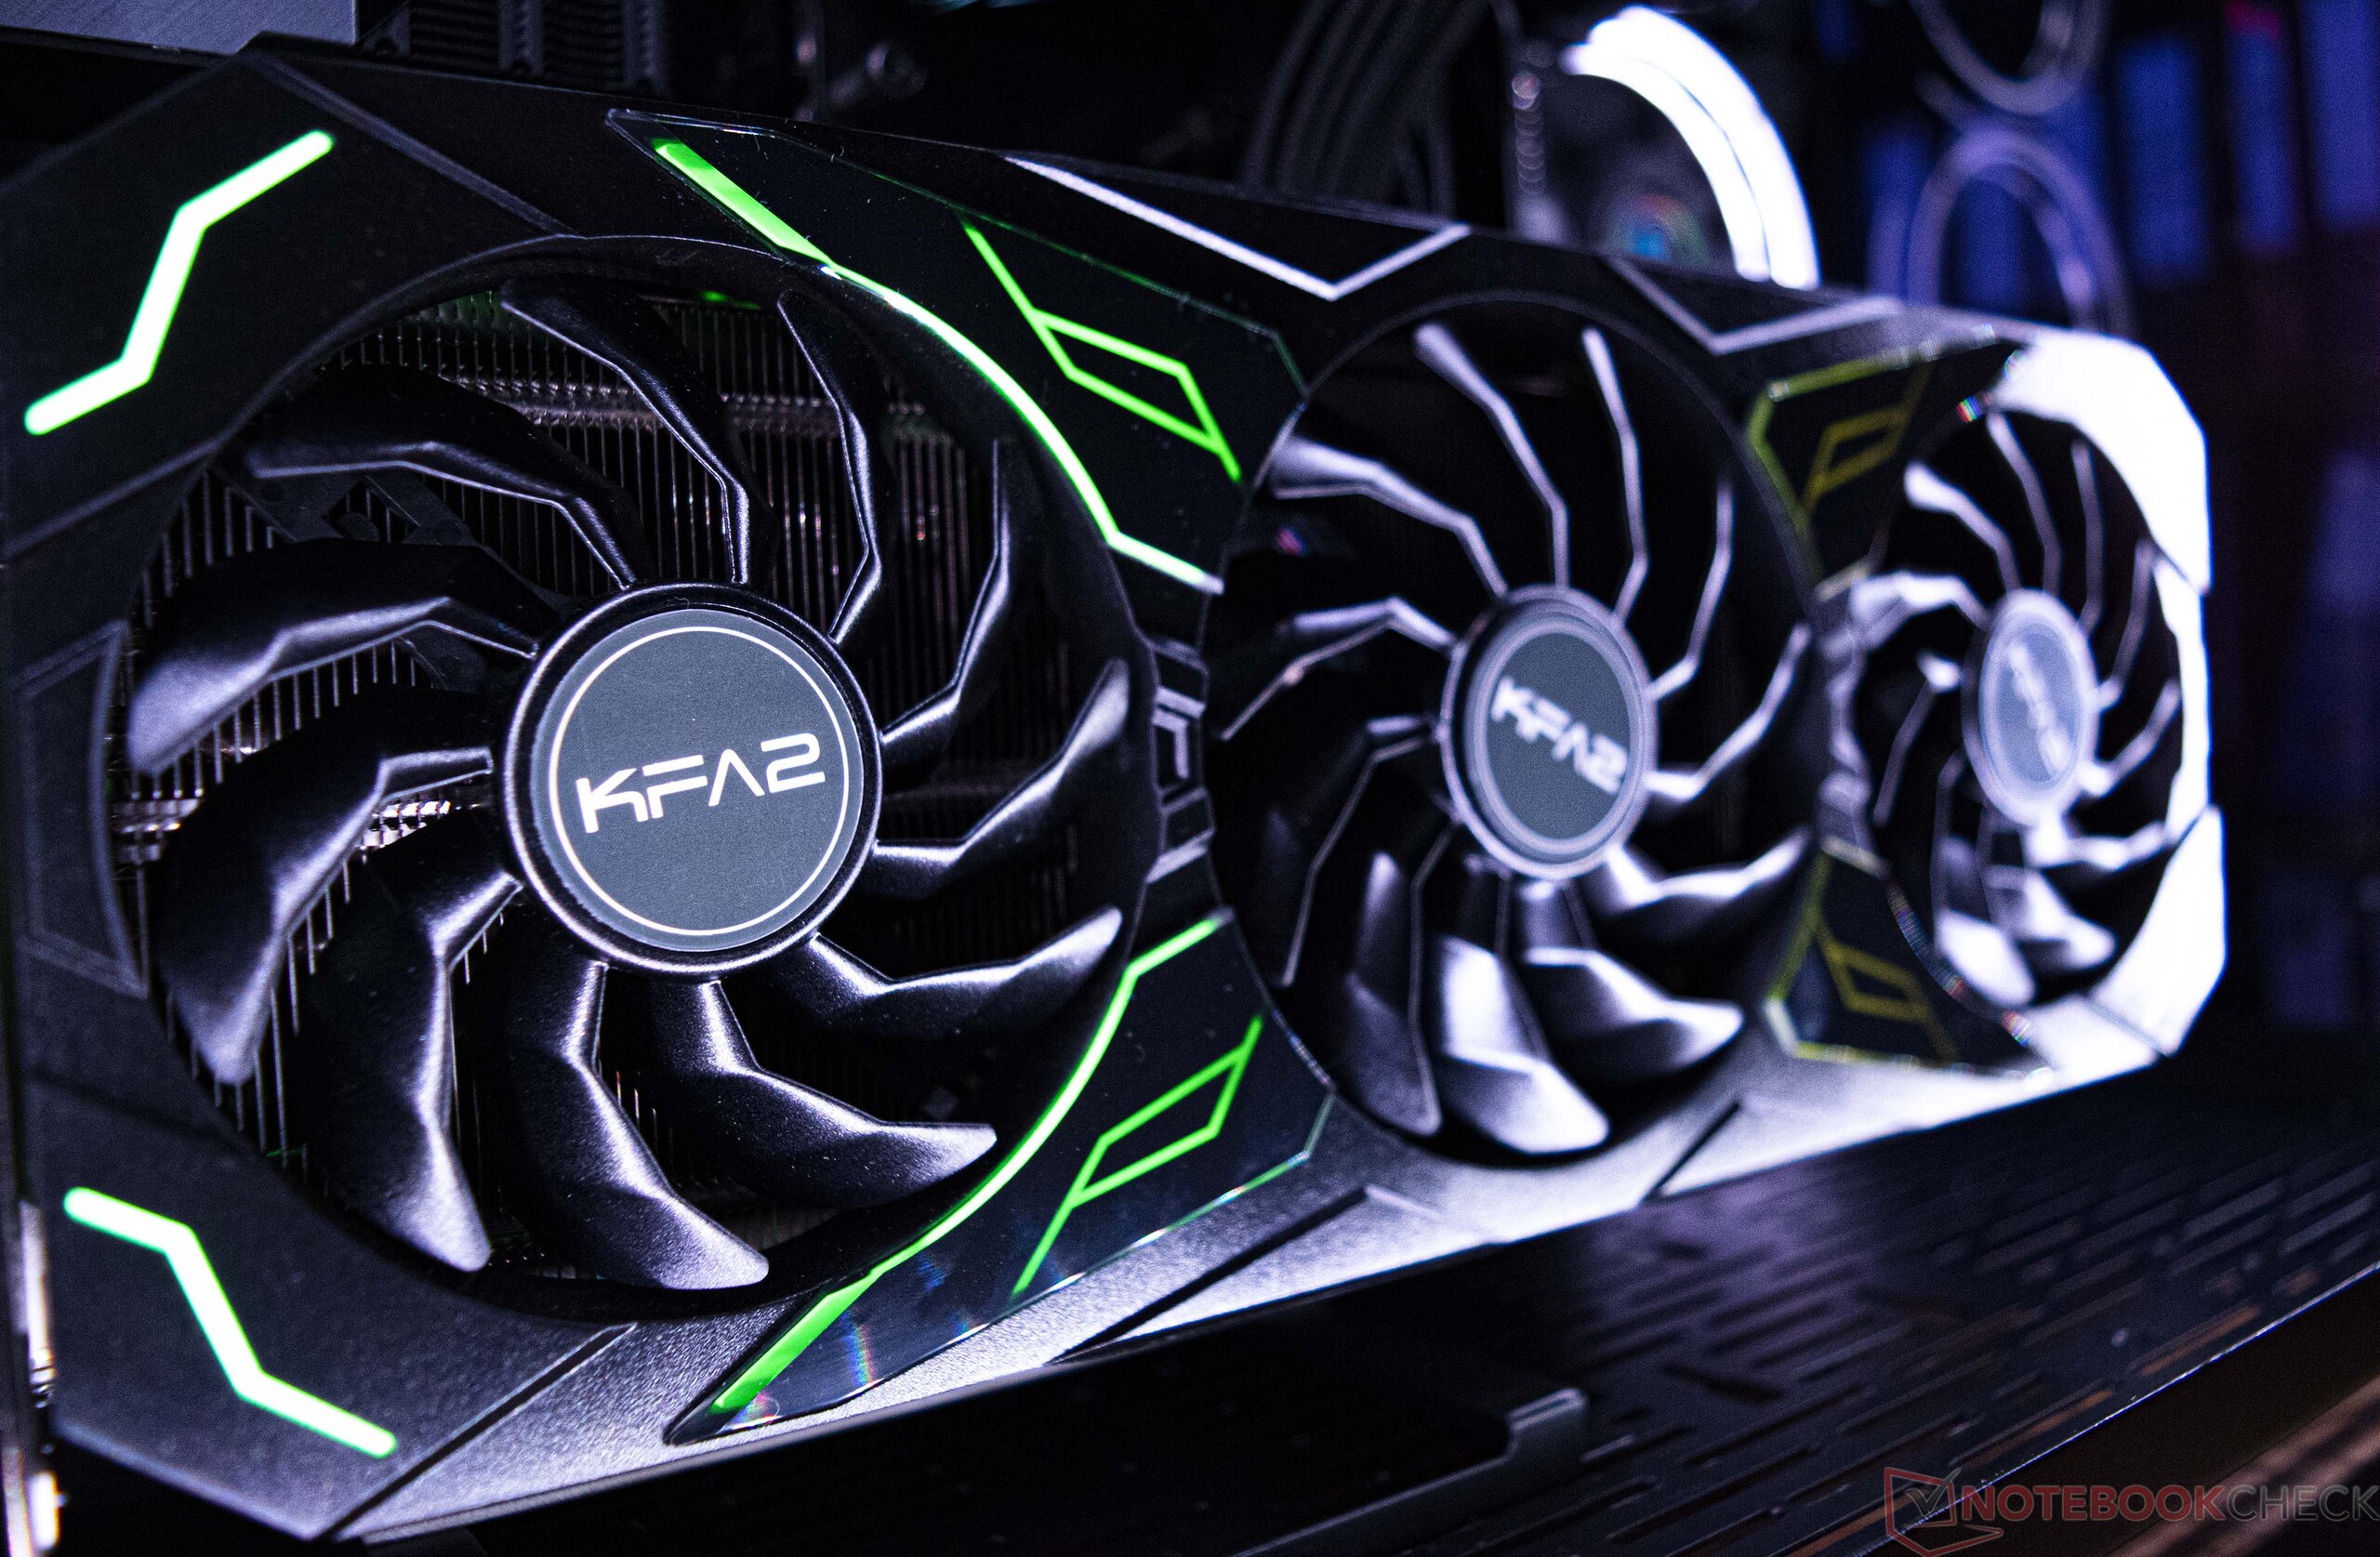
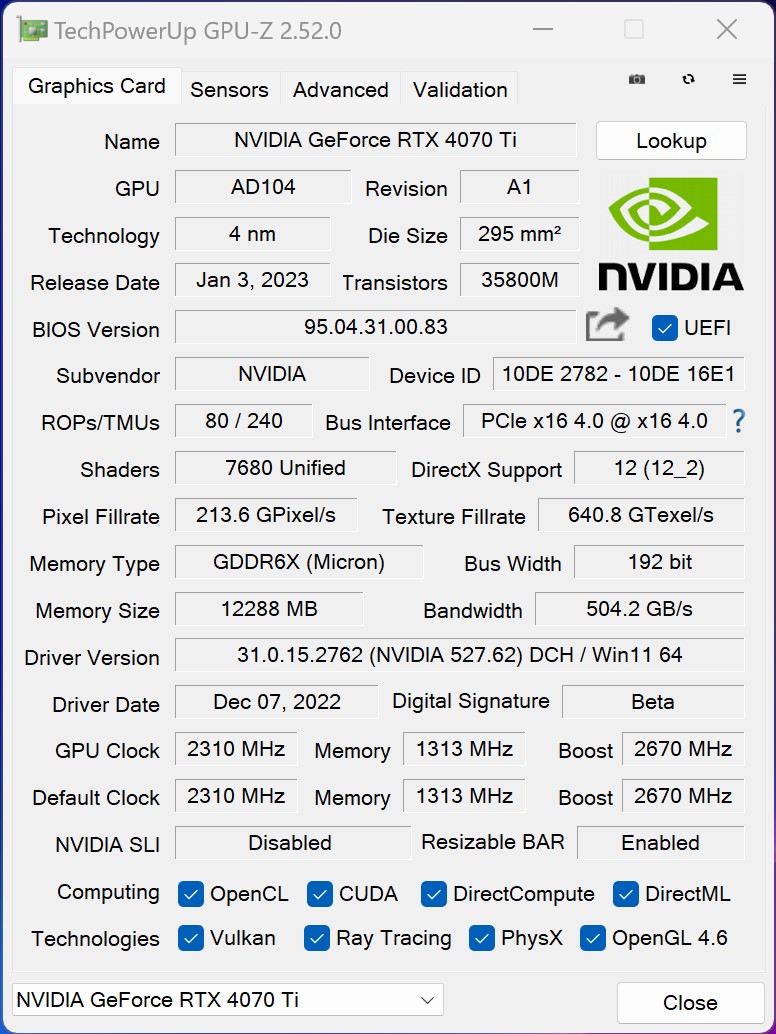
For this review, we are taking a look at the GeForce RTX 4070 Ti SG made by KFA2. At €949 (US$1,028), the RRP of our review unit is only marginally higher than the one set by Nvidia. The graphics card is based on the AD104 chip and features 7,680 shading units on a 295 mm² die. Equipped with 12 GB of VRAM, the GPU has considerably less memory than a GeForce RTX 4080 and a GeForce RTX 4090 (24 GB). The card also has a much narrower memory bus (192-bit) by comparison.
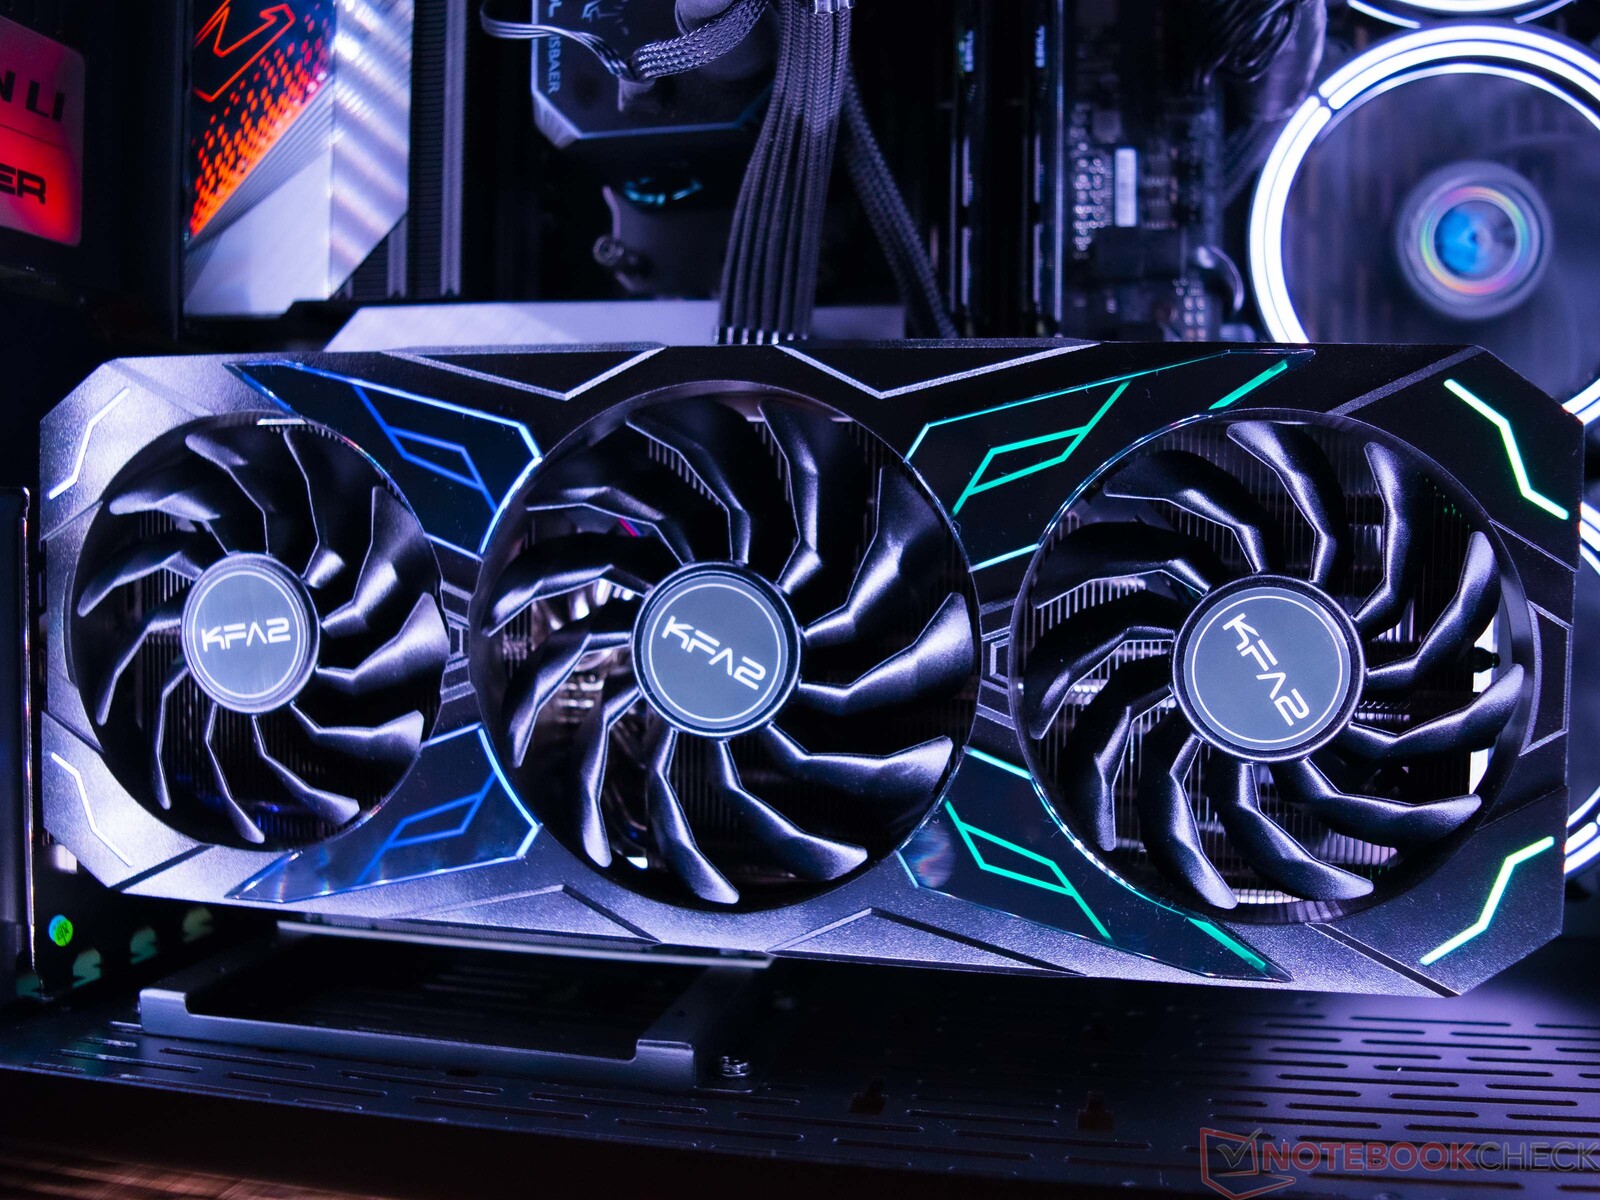
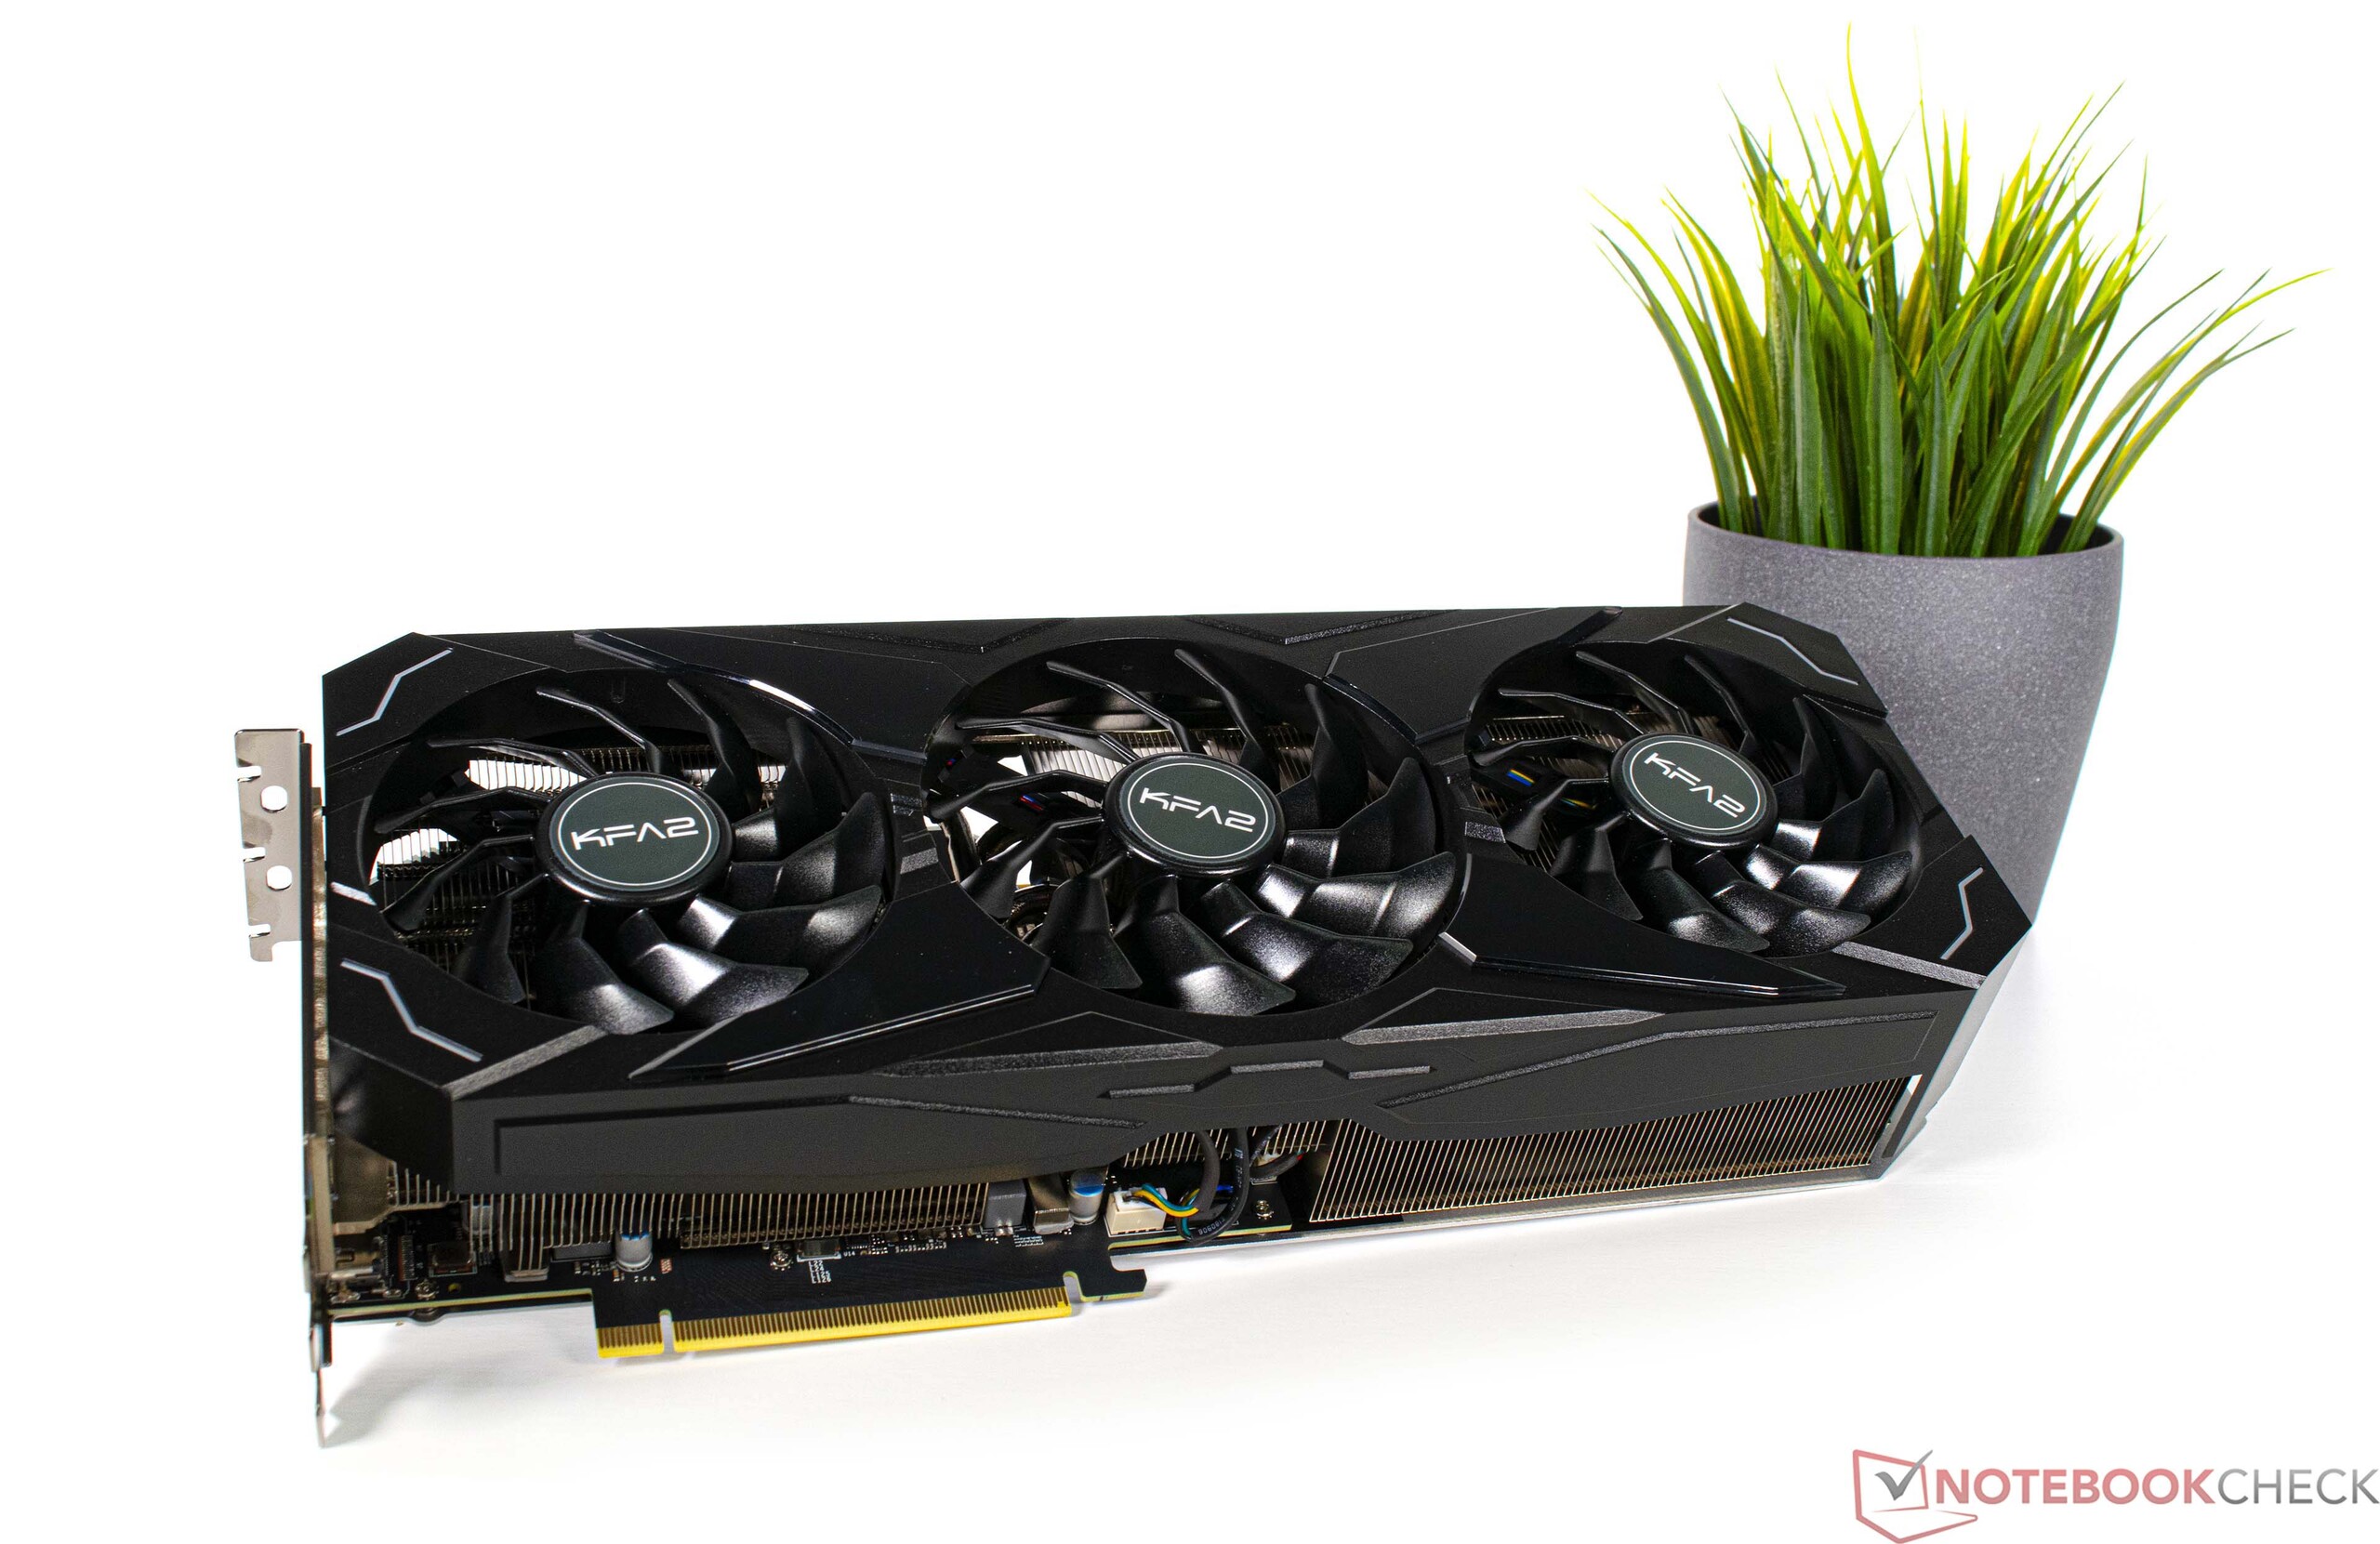
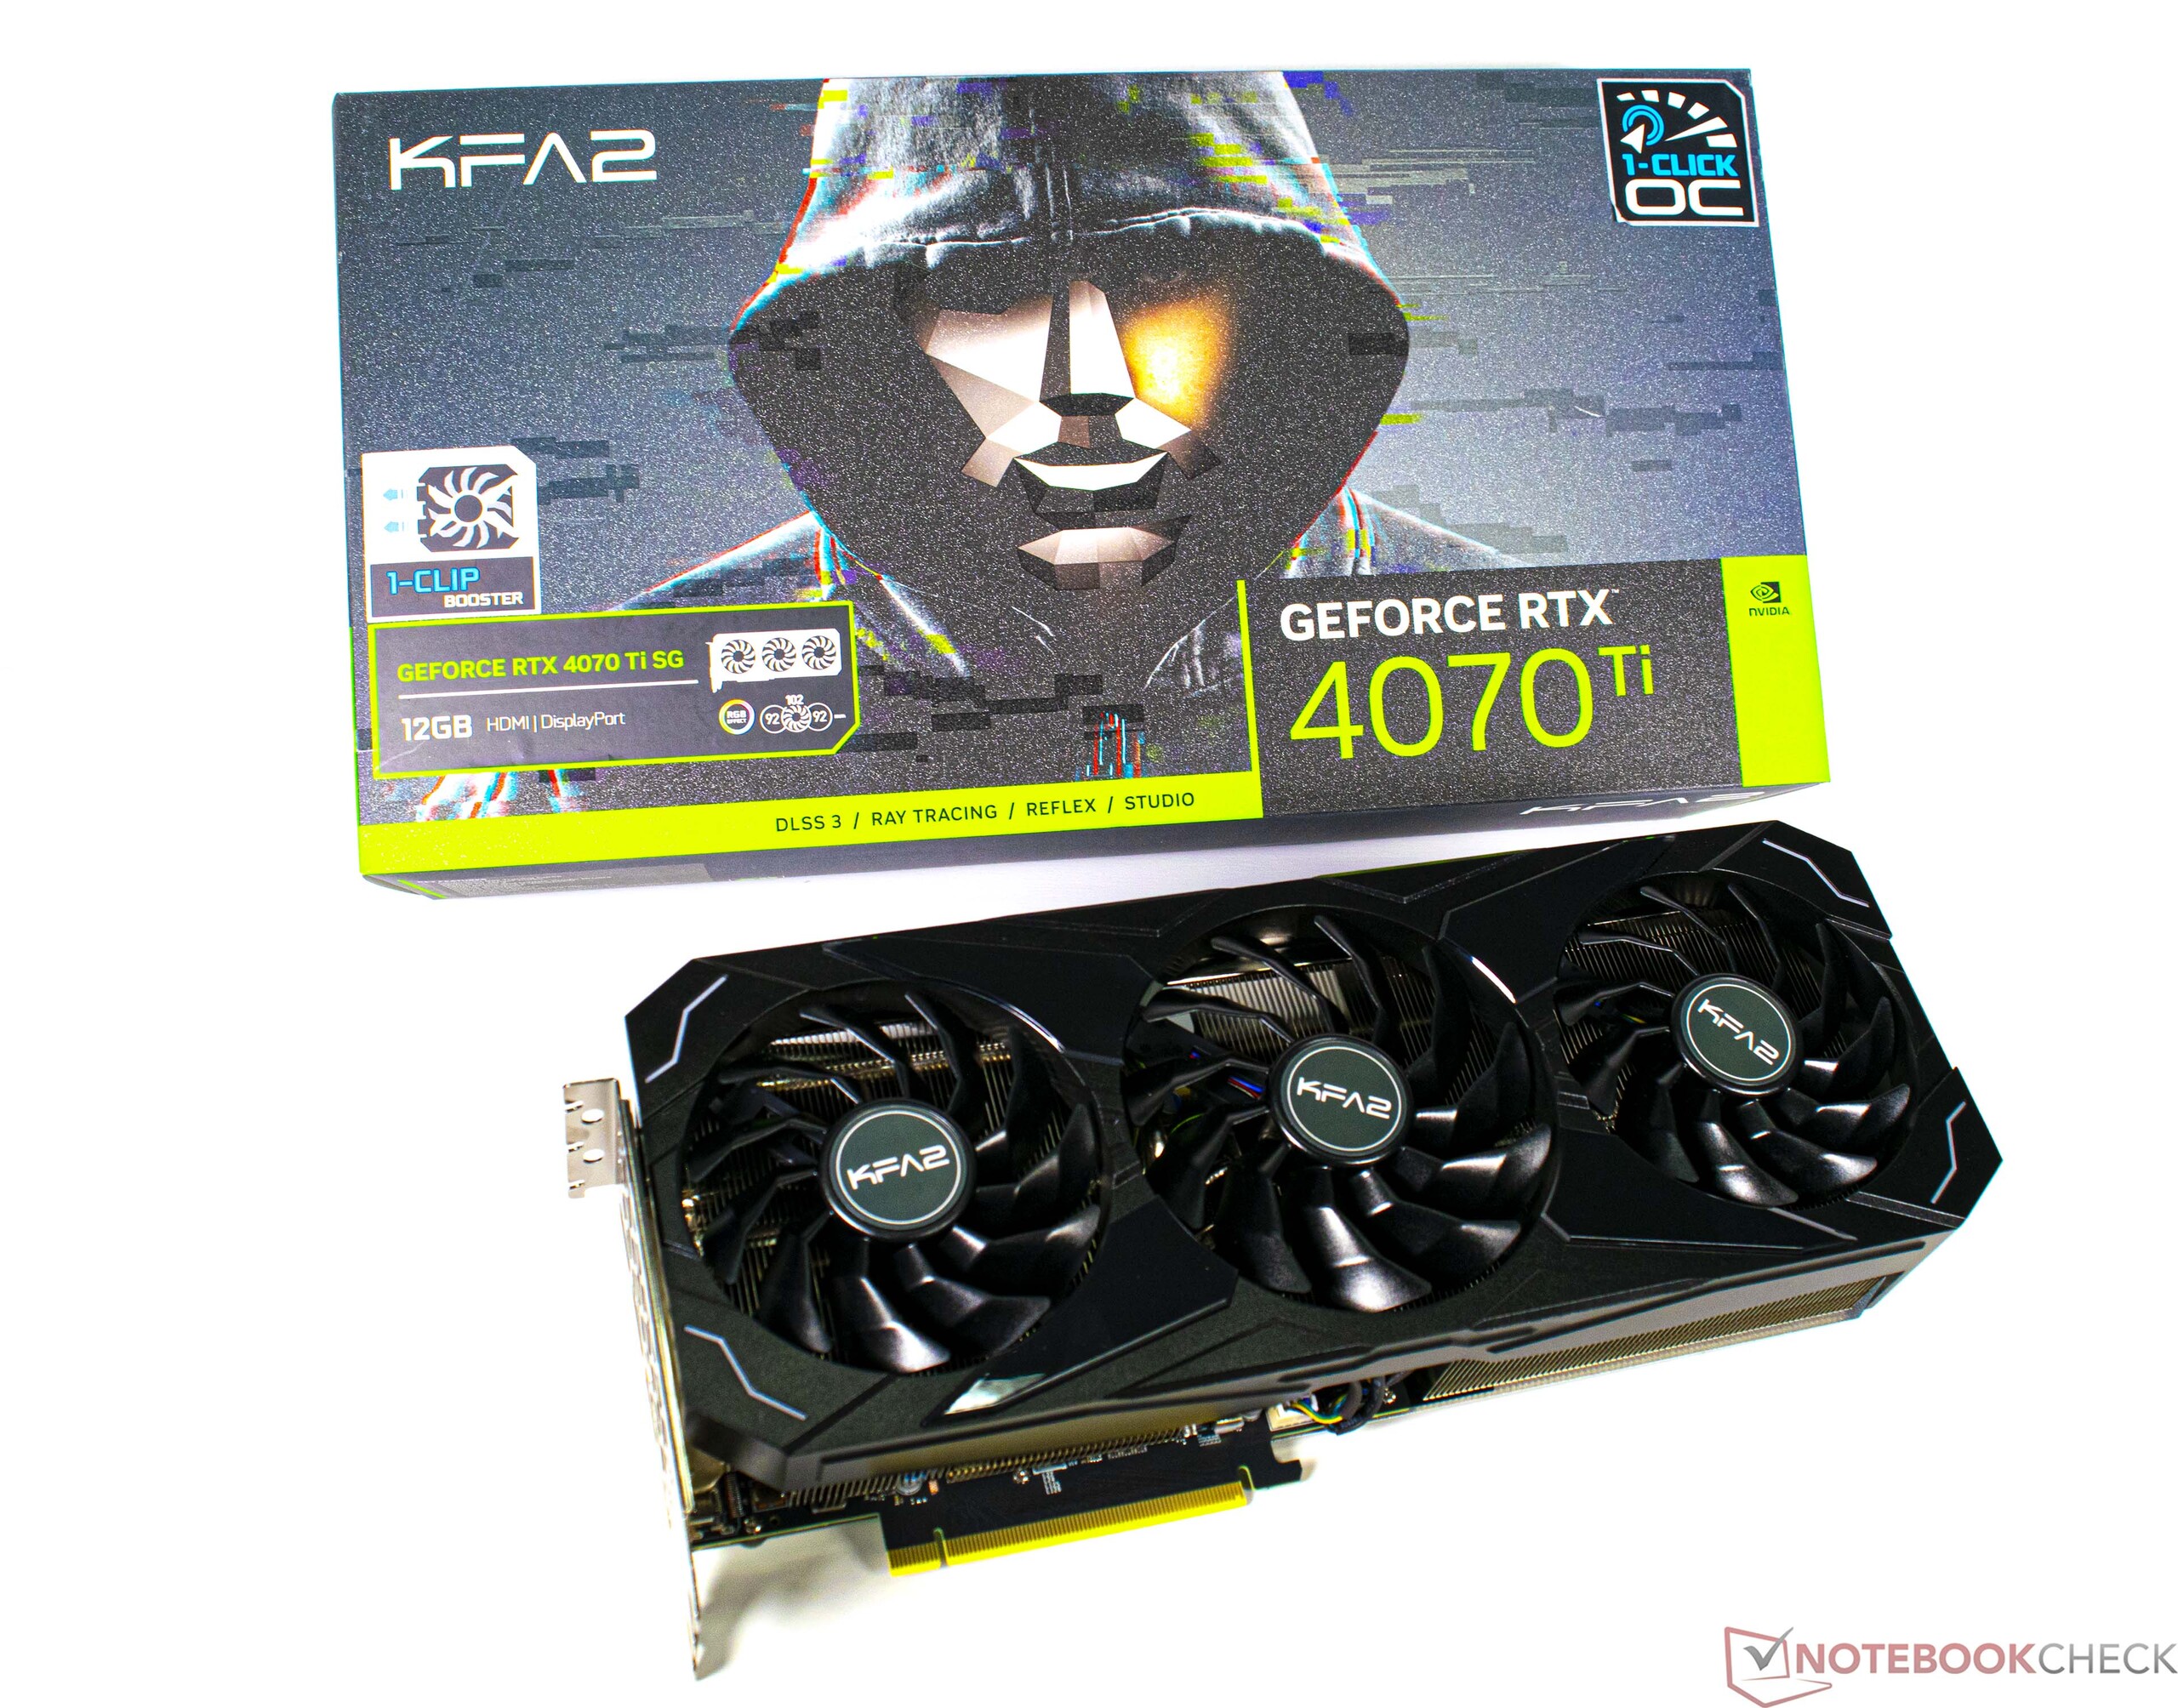
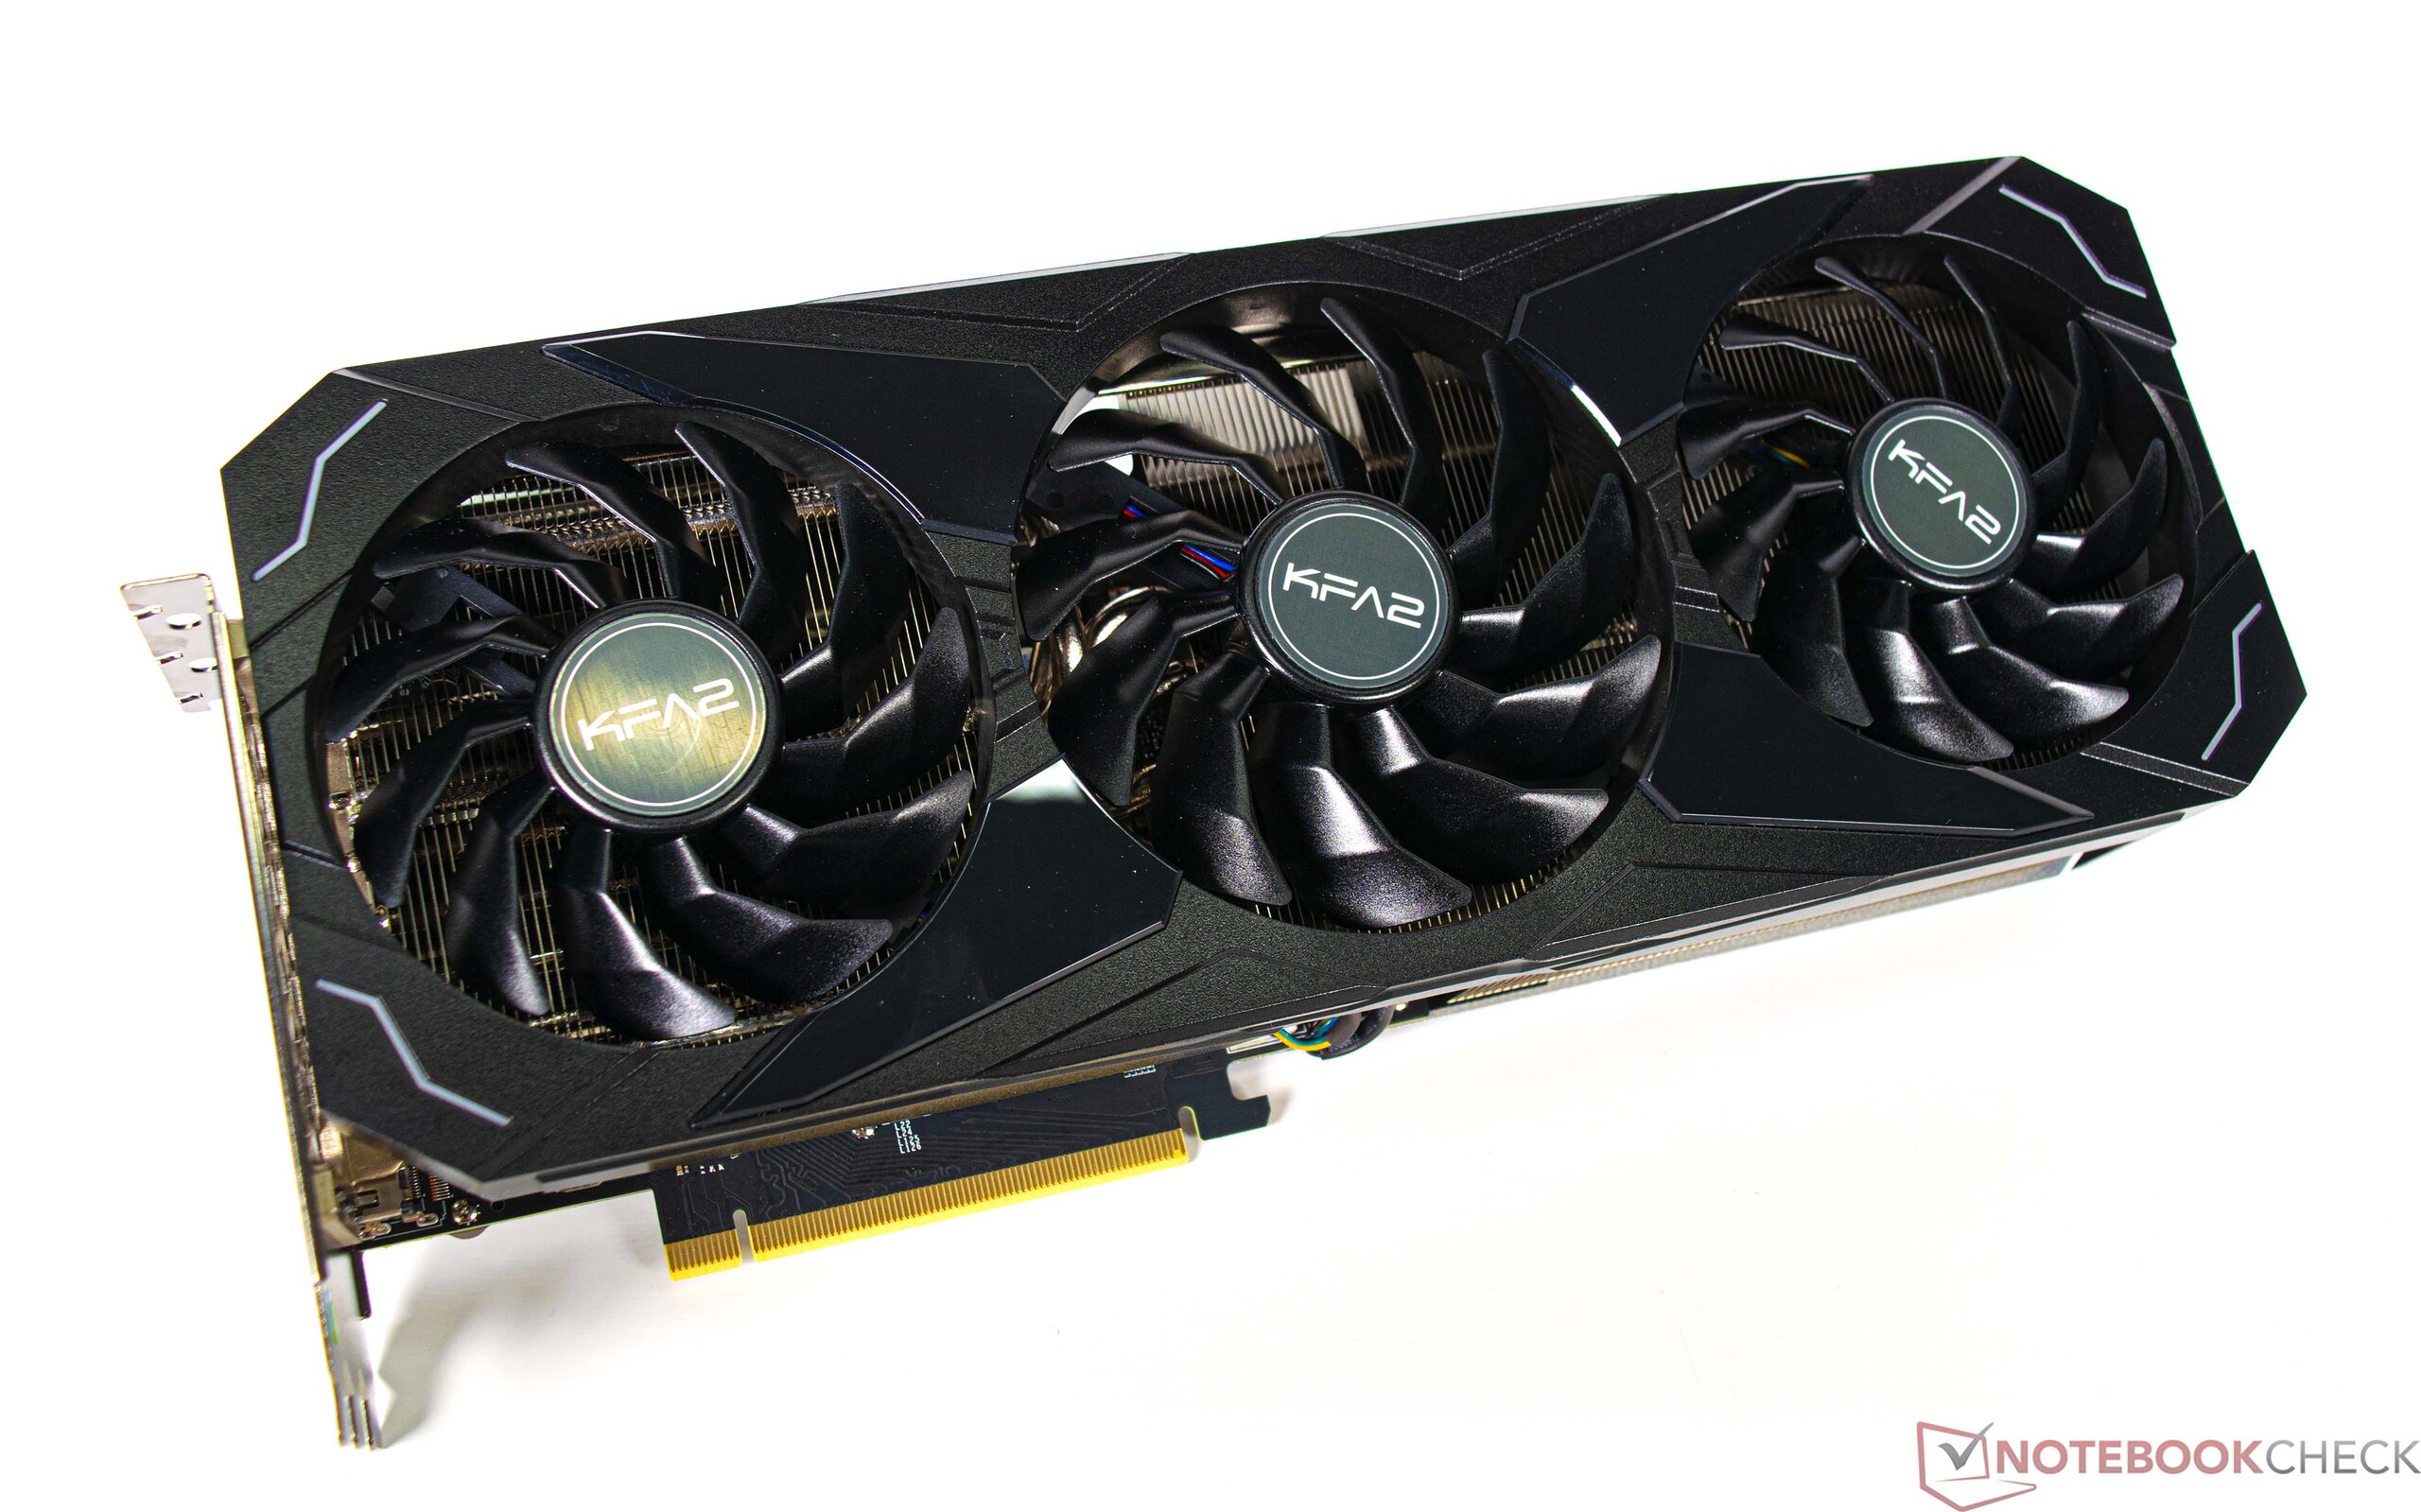
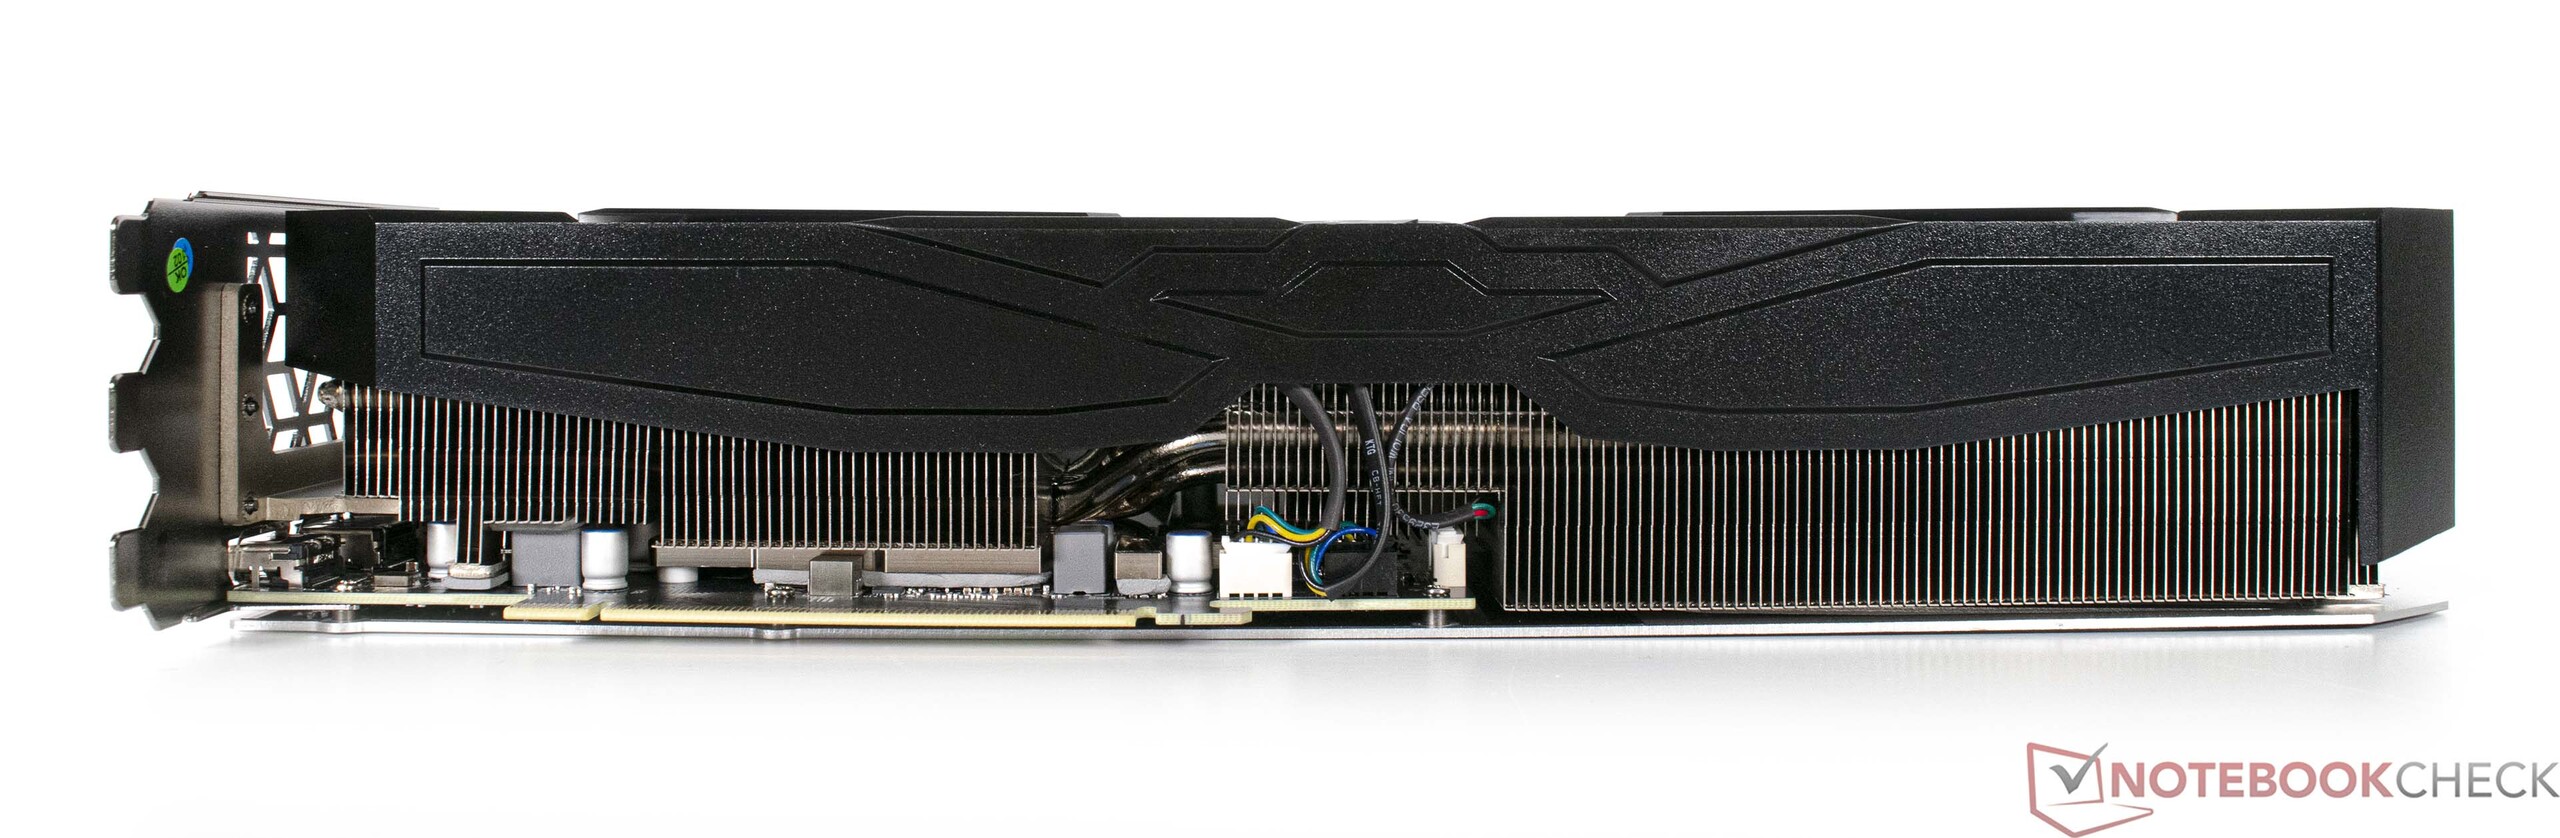
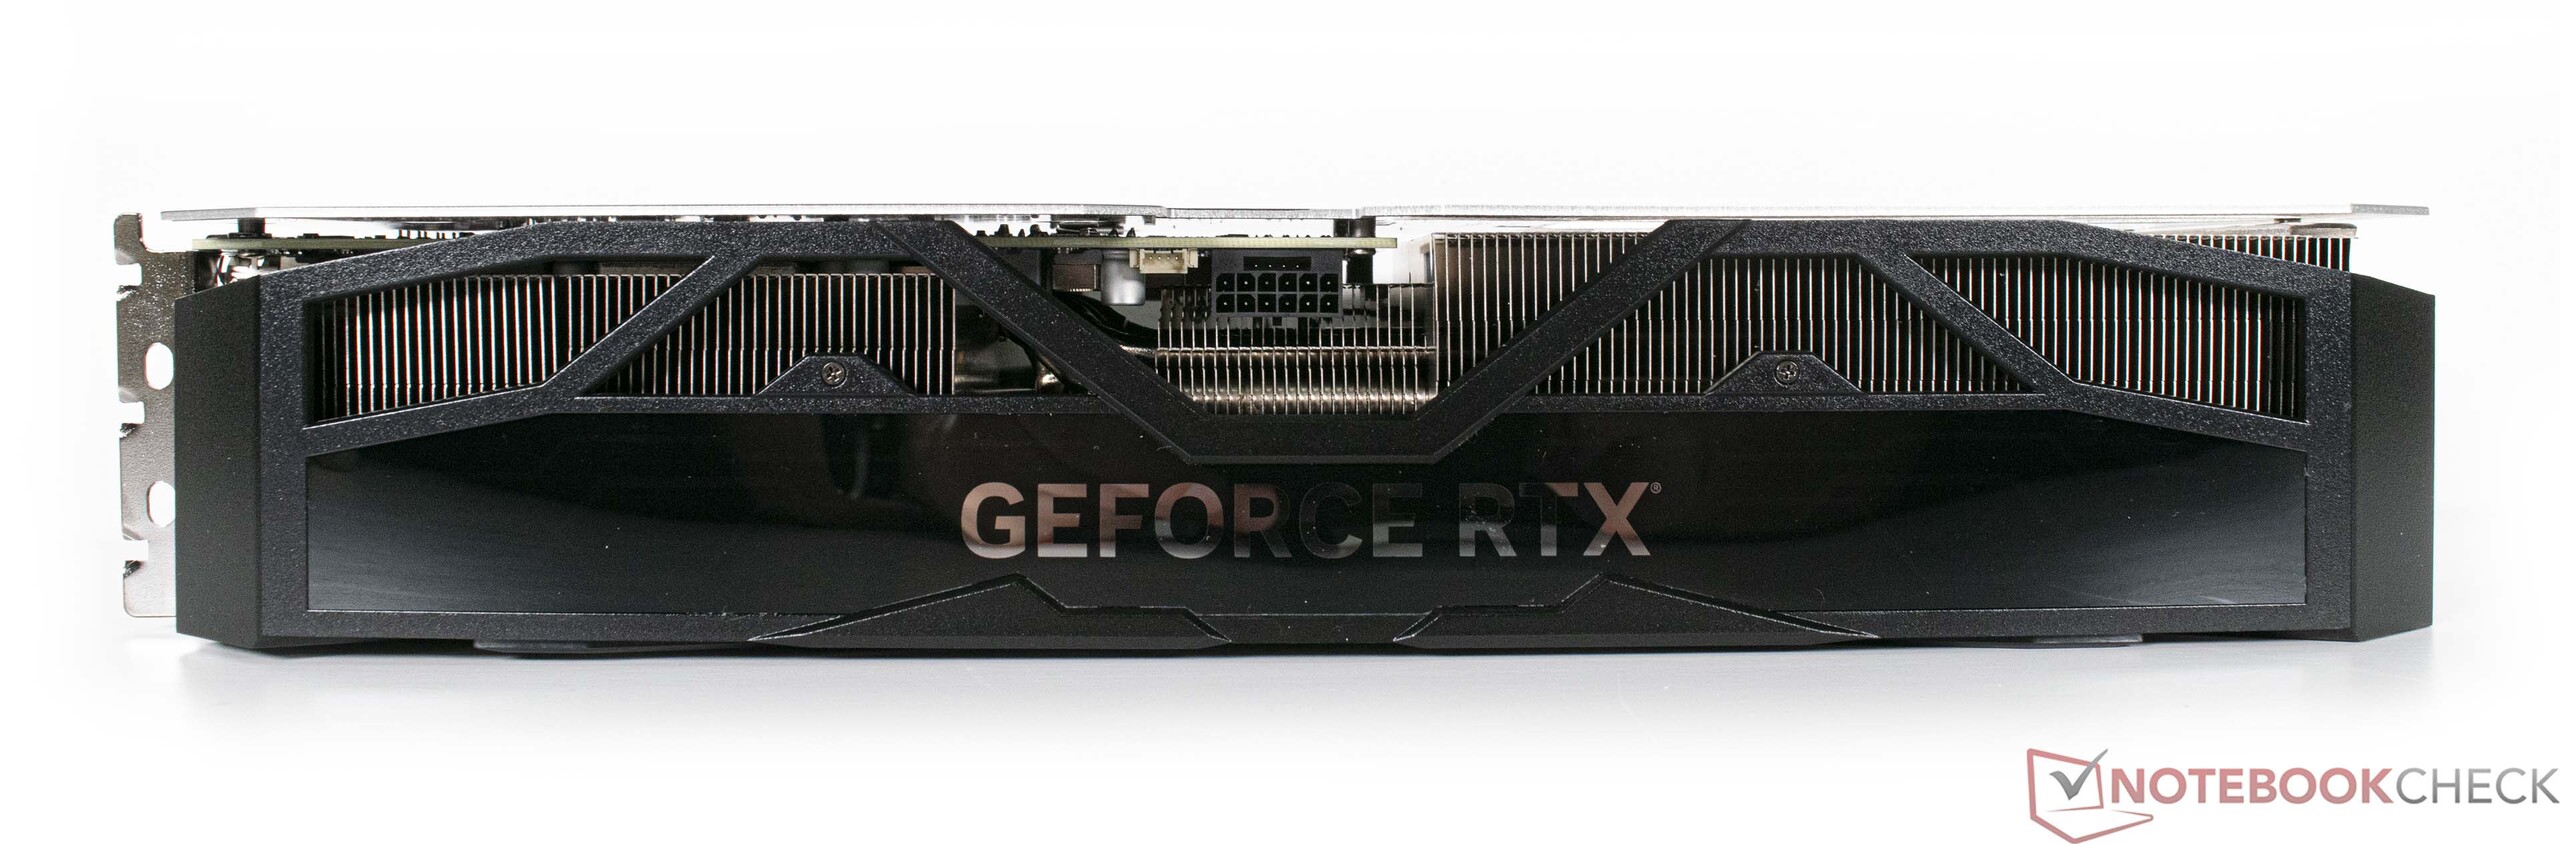
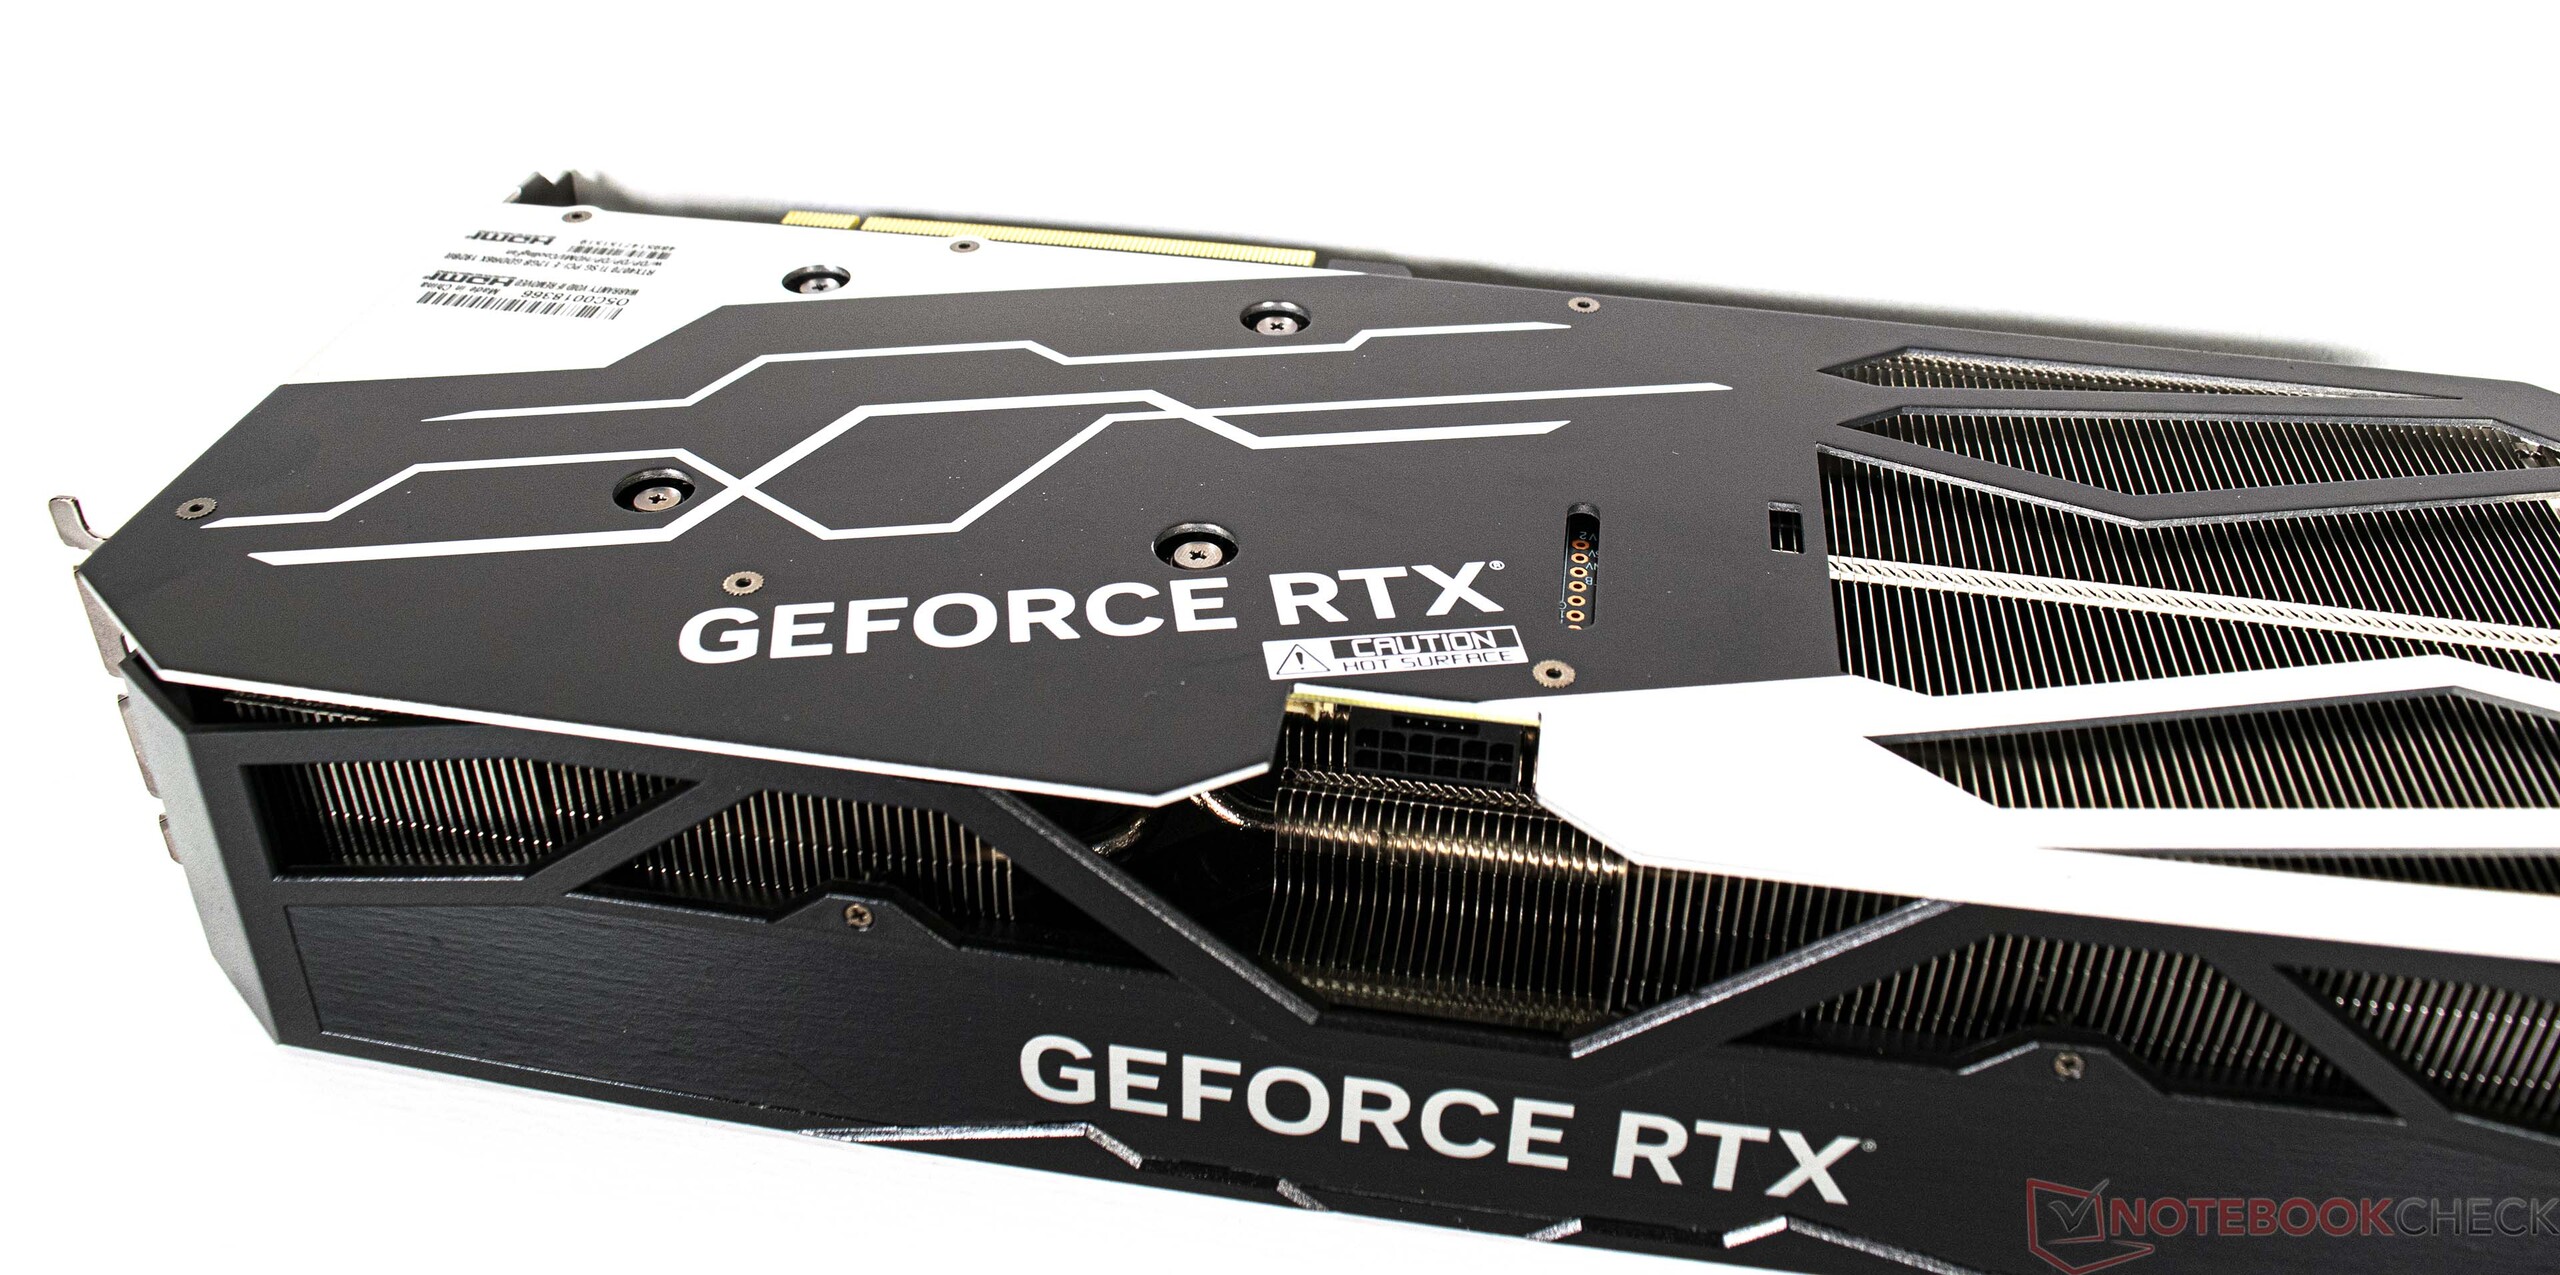
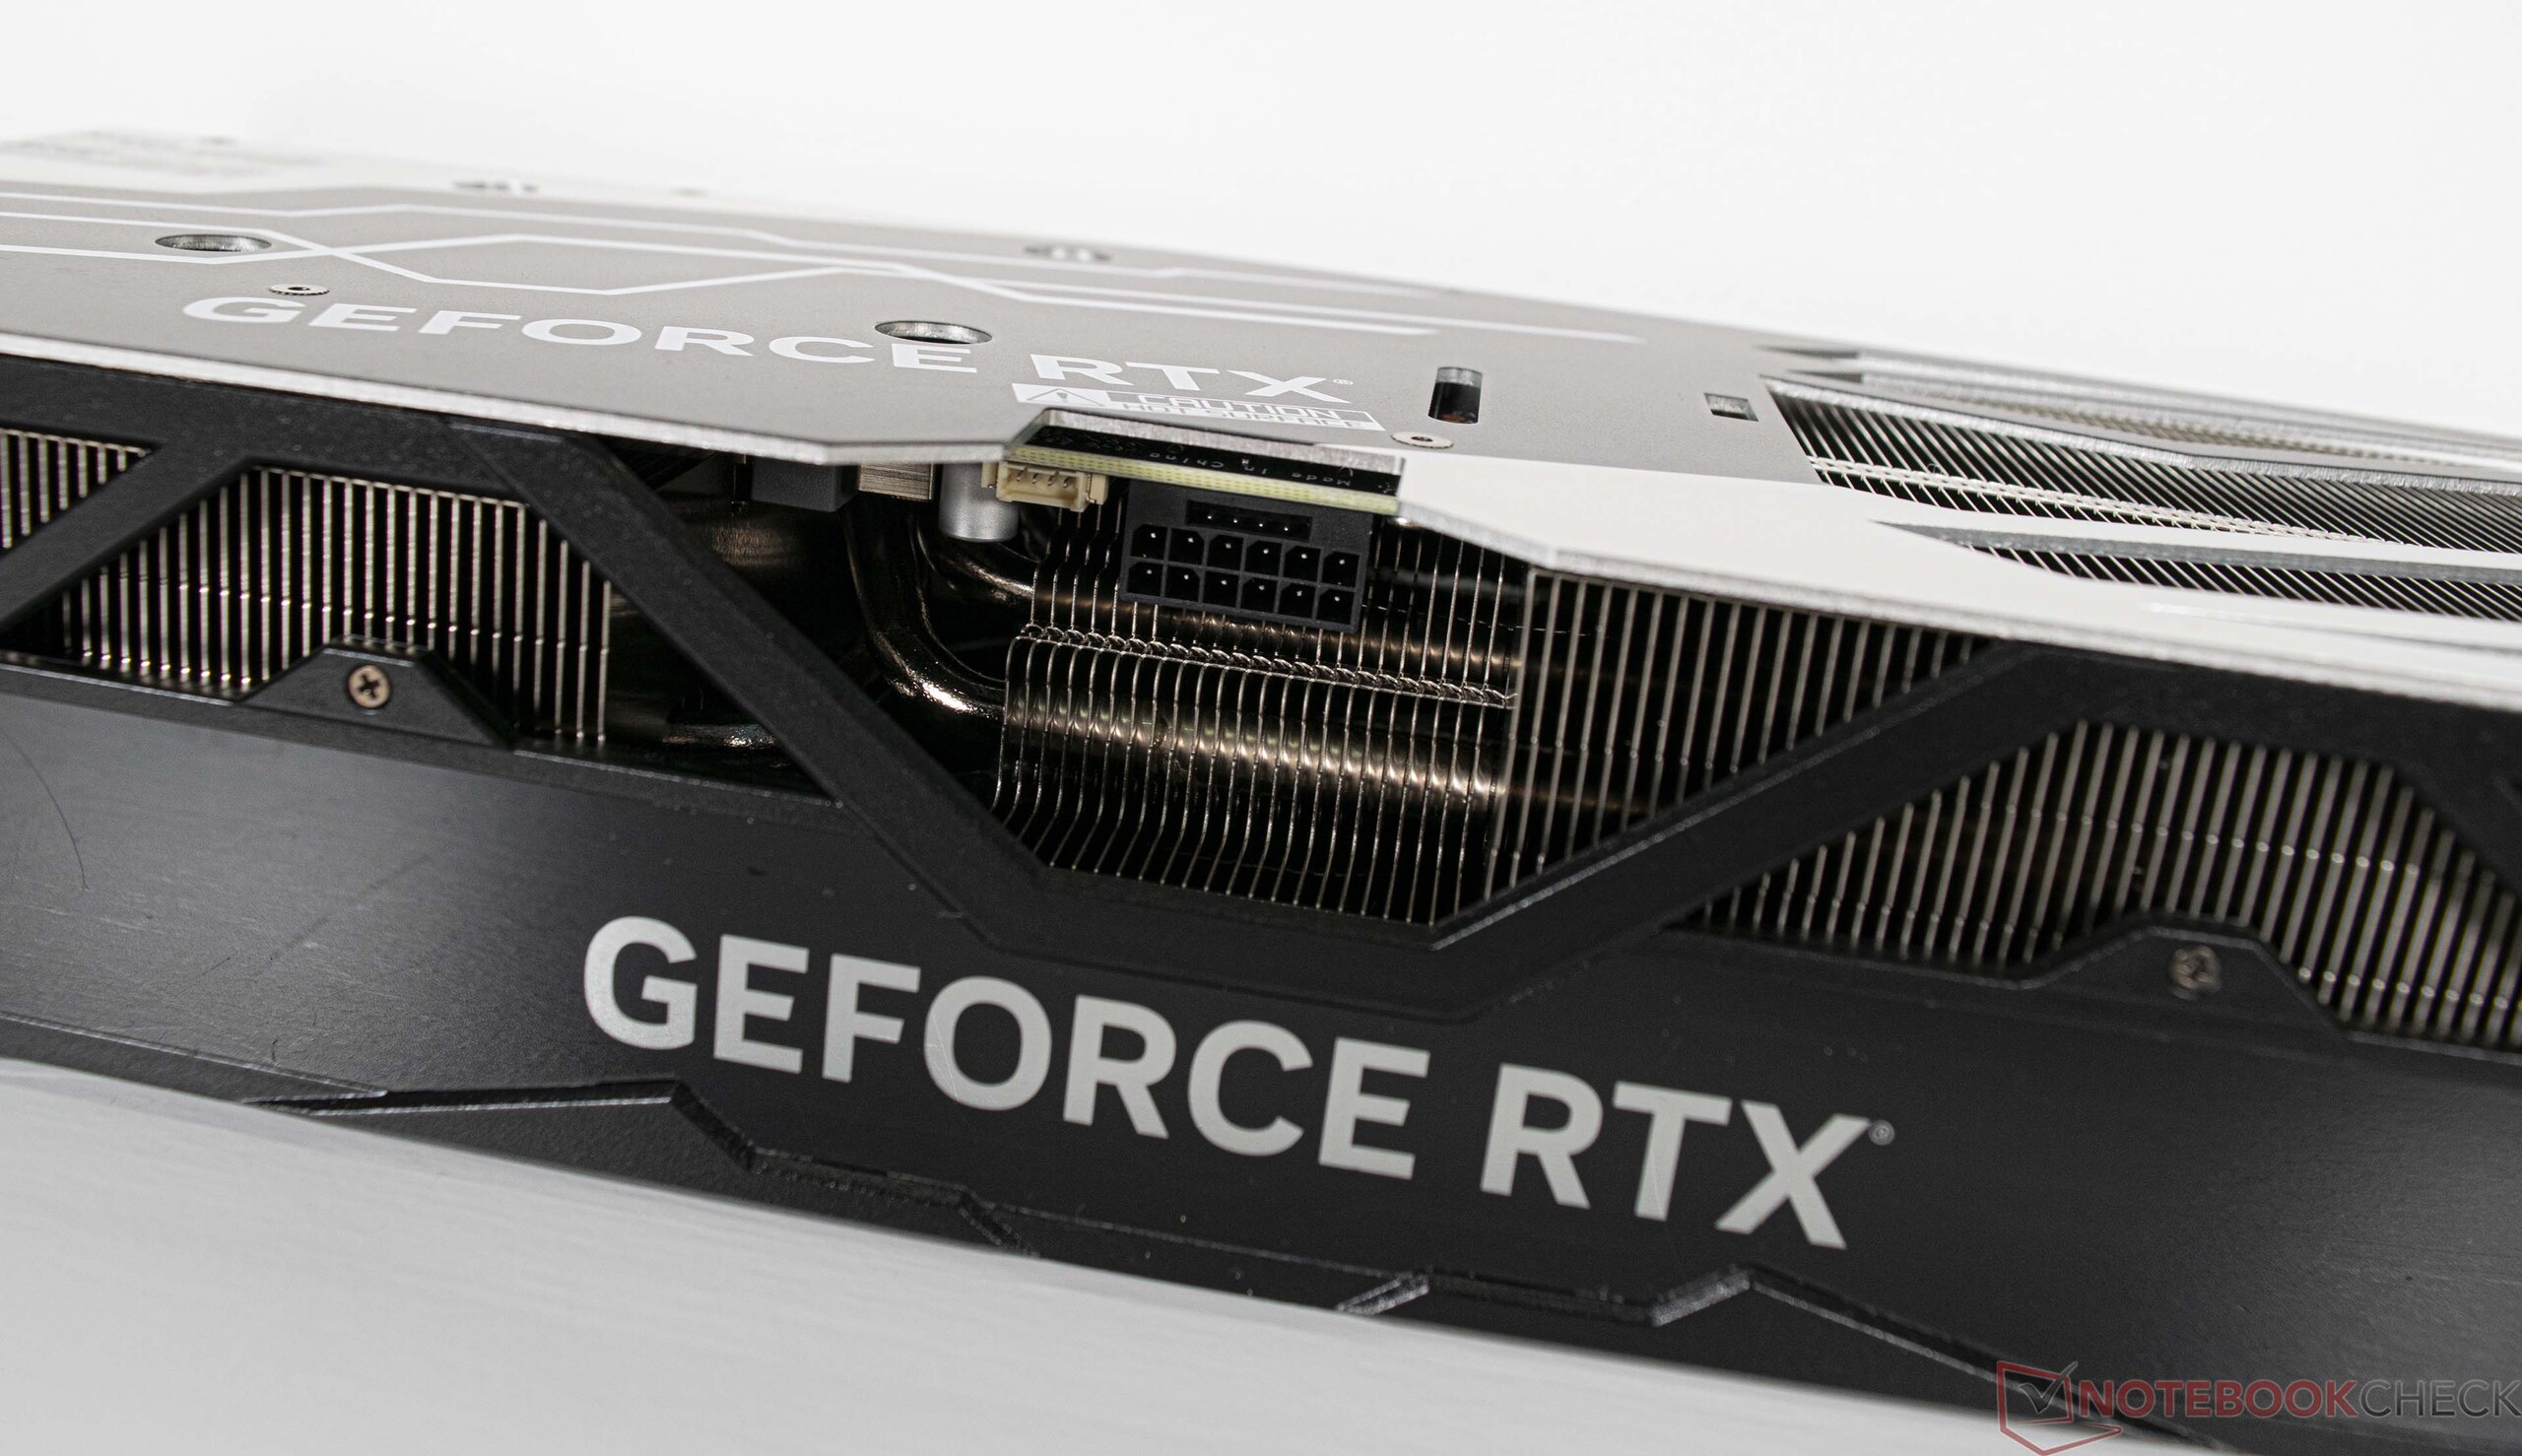
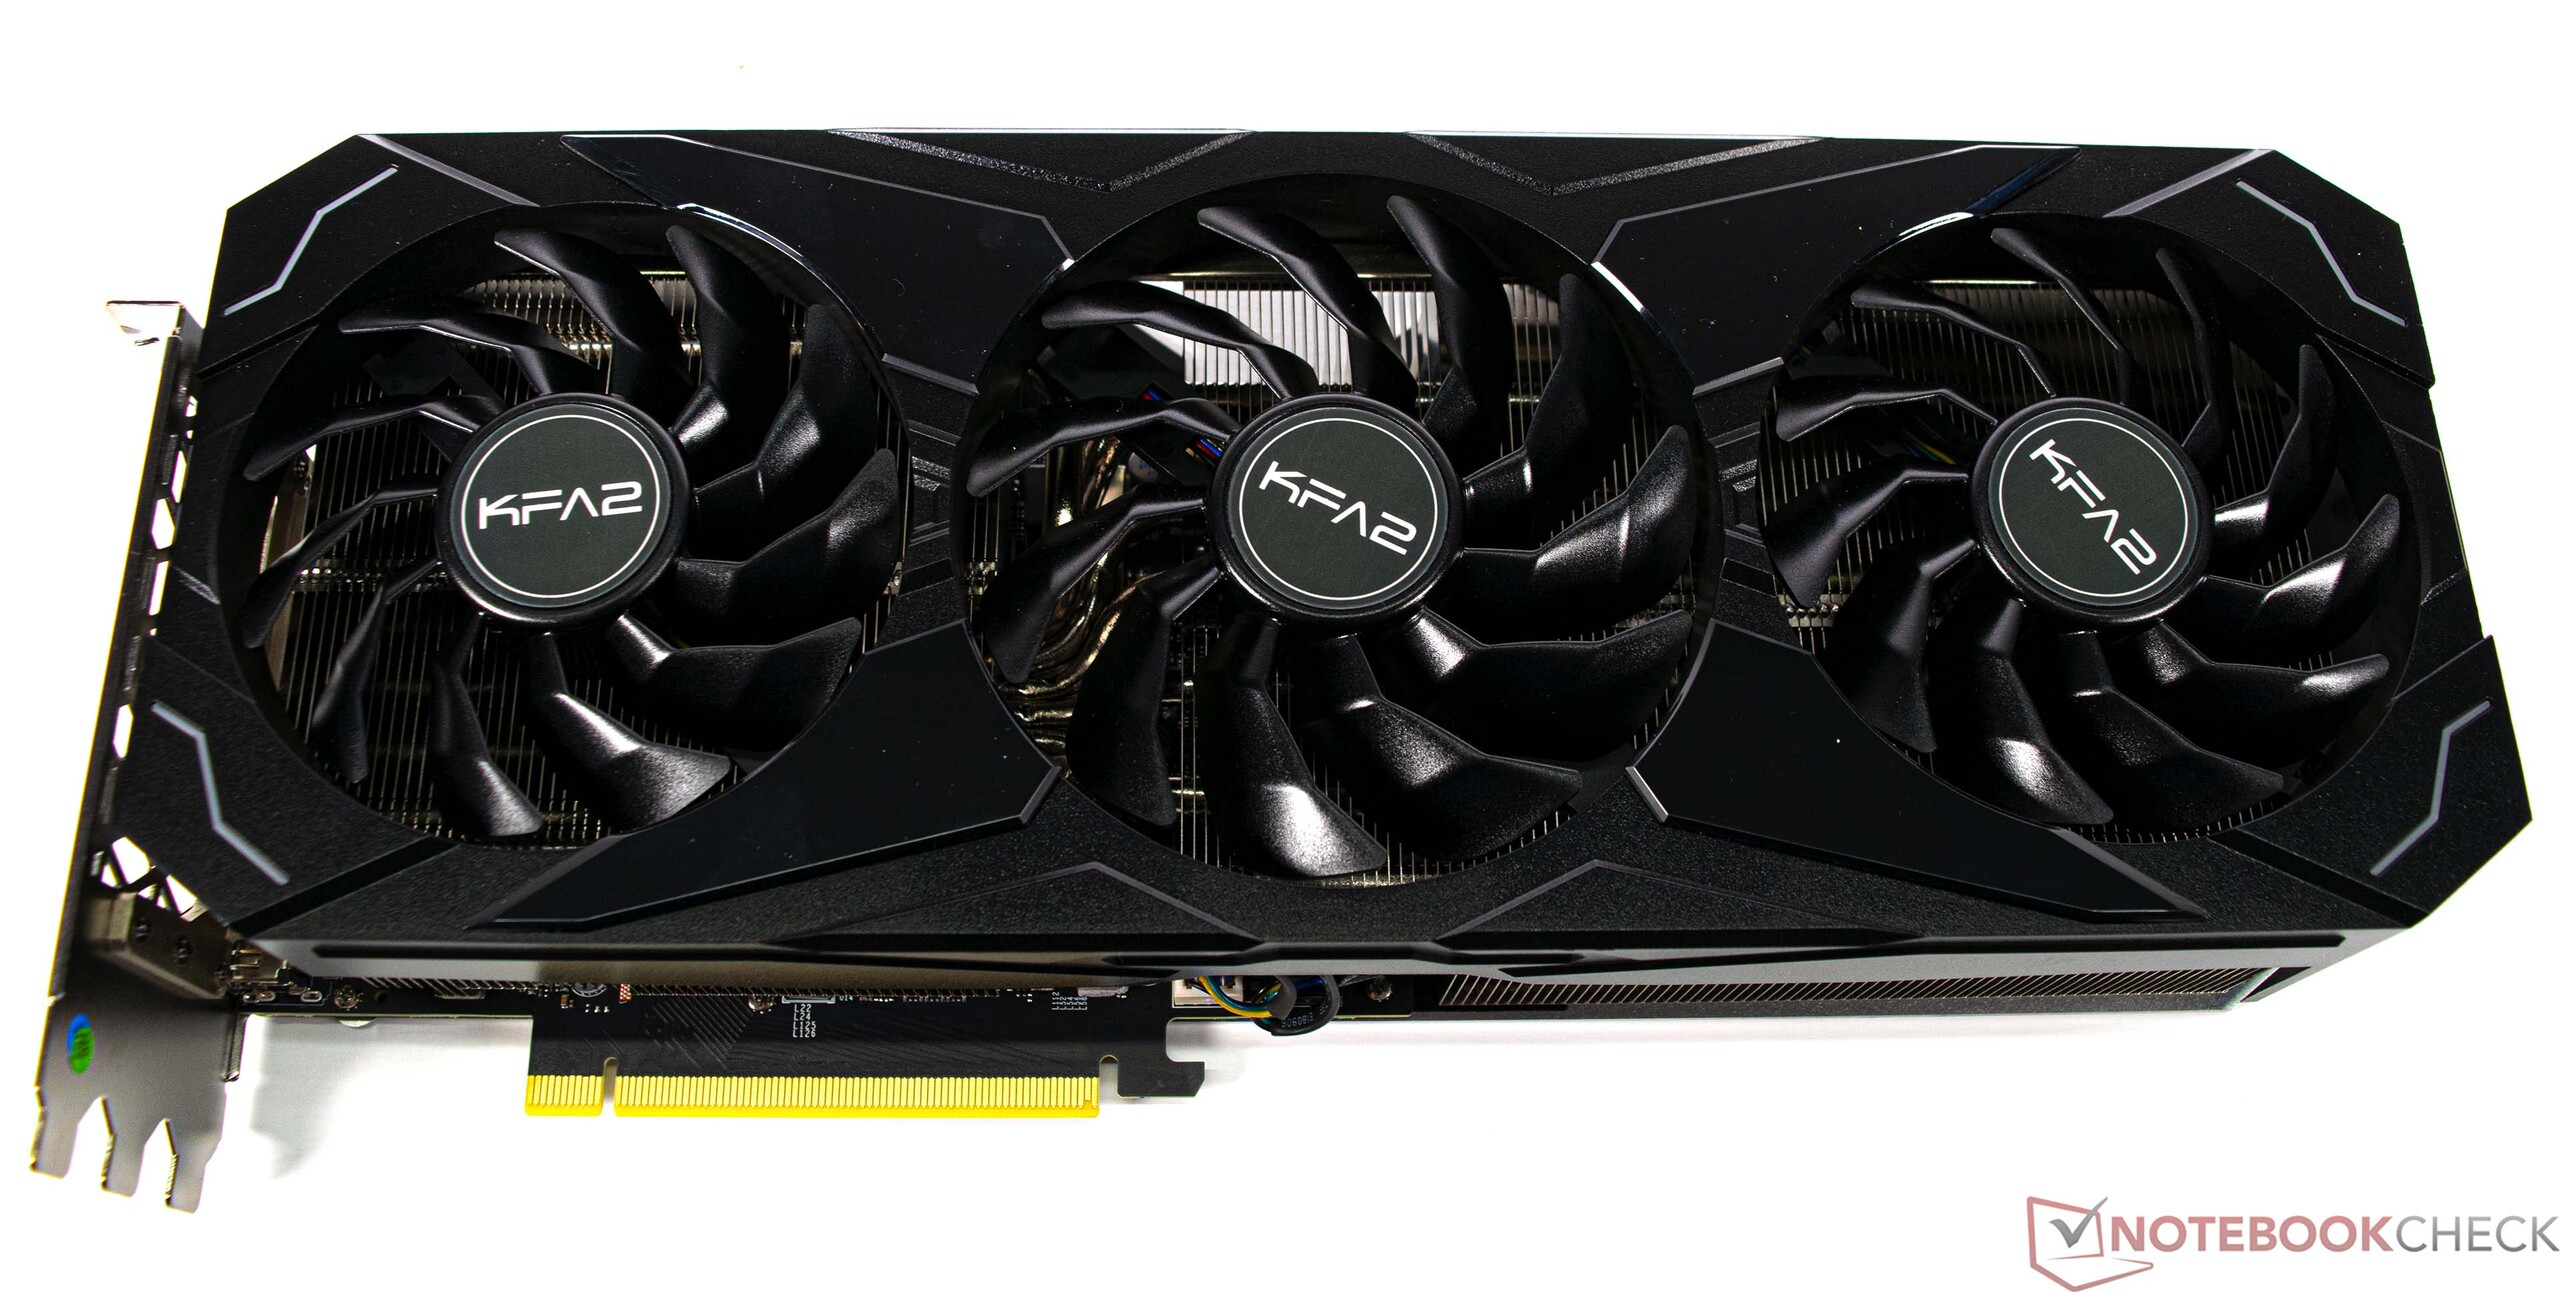
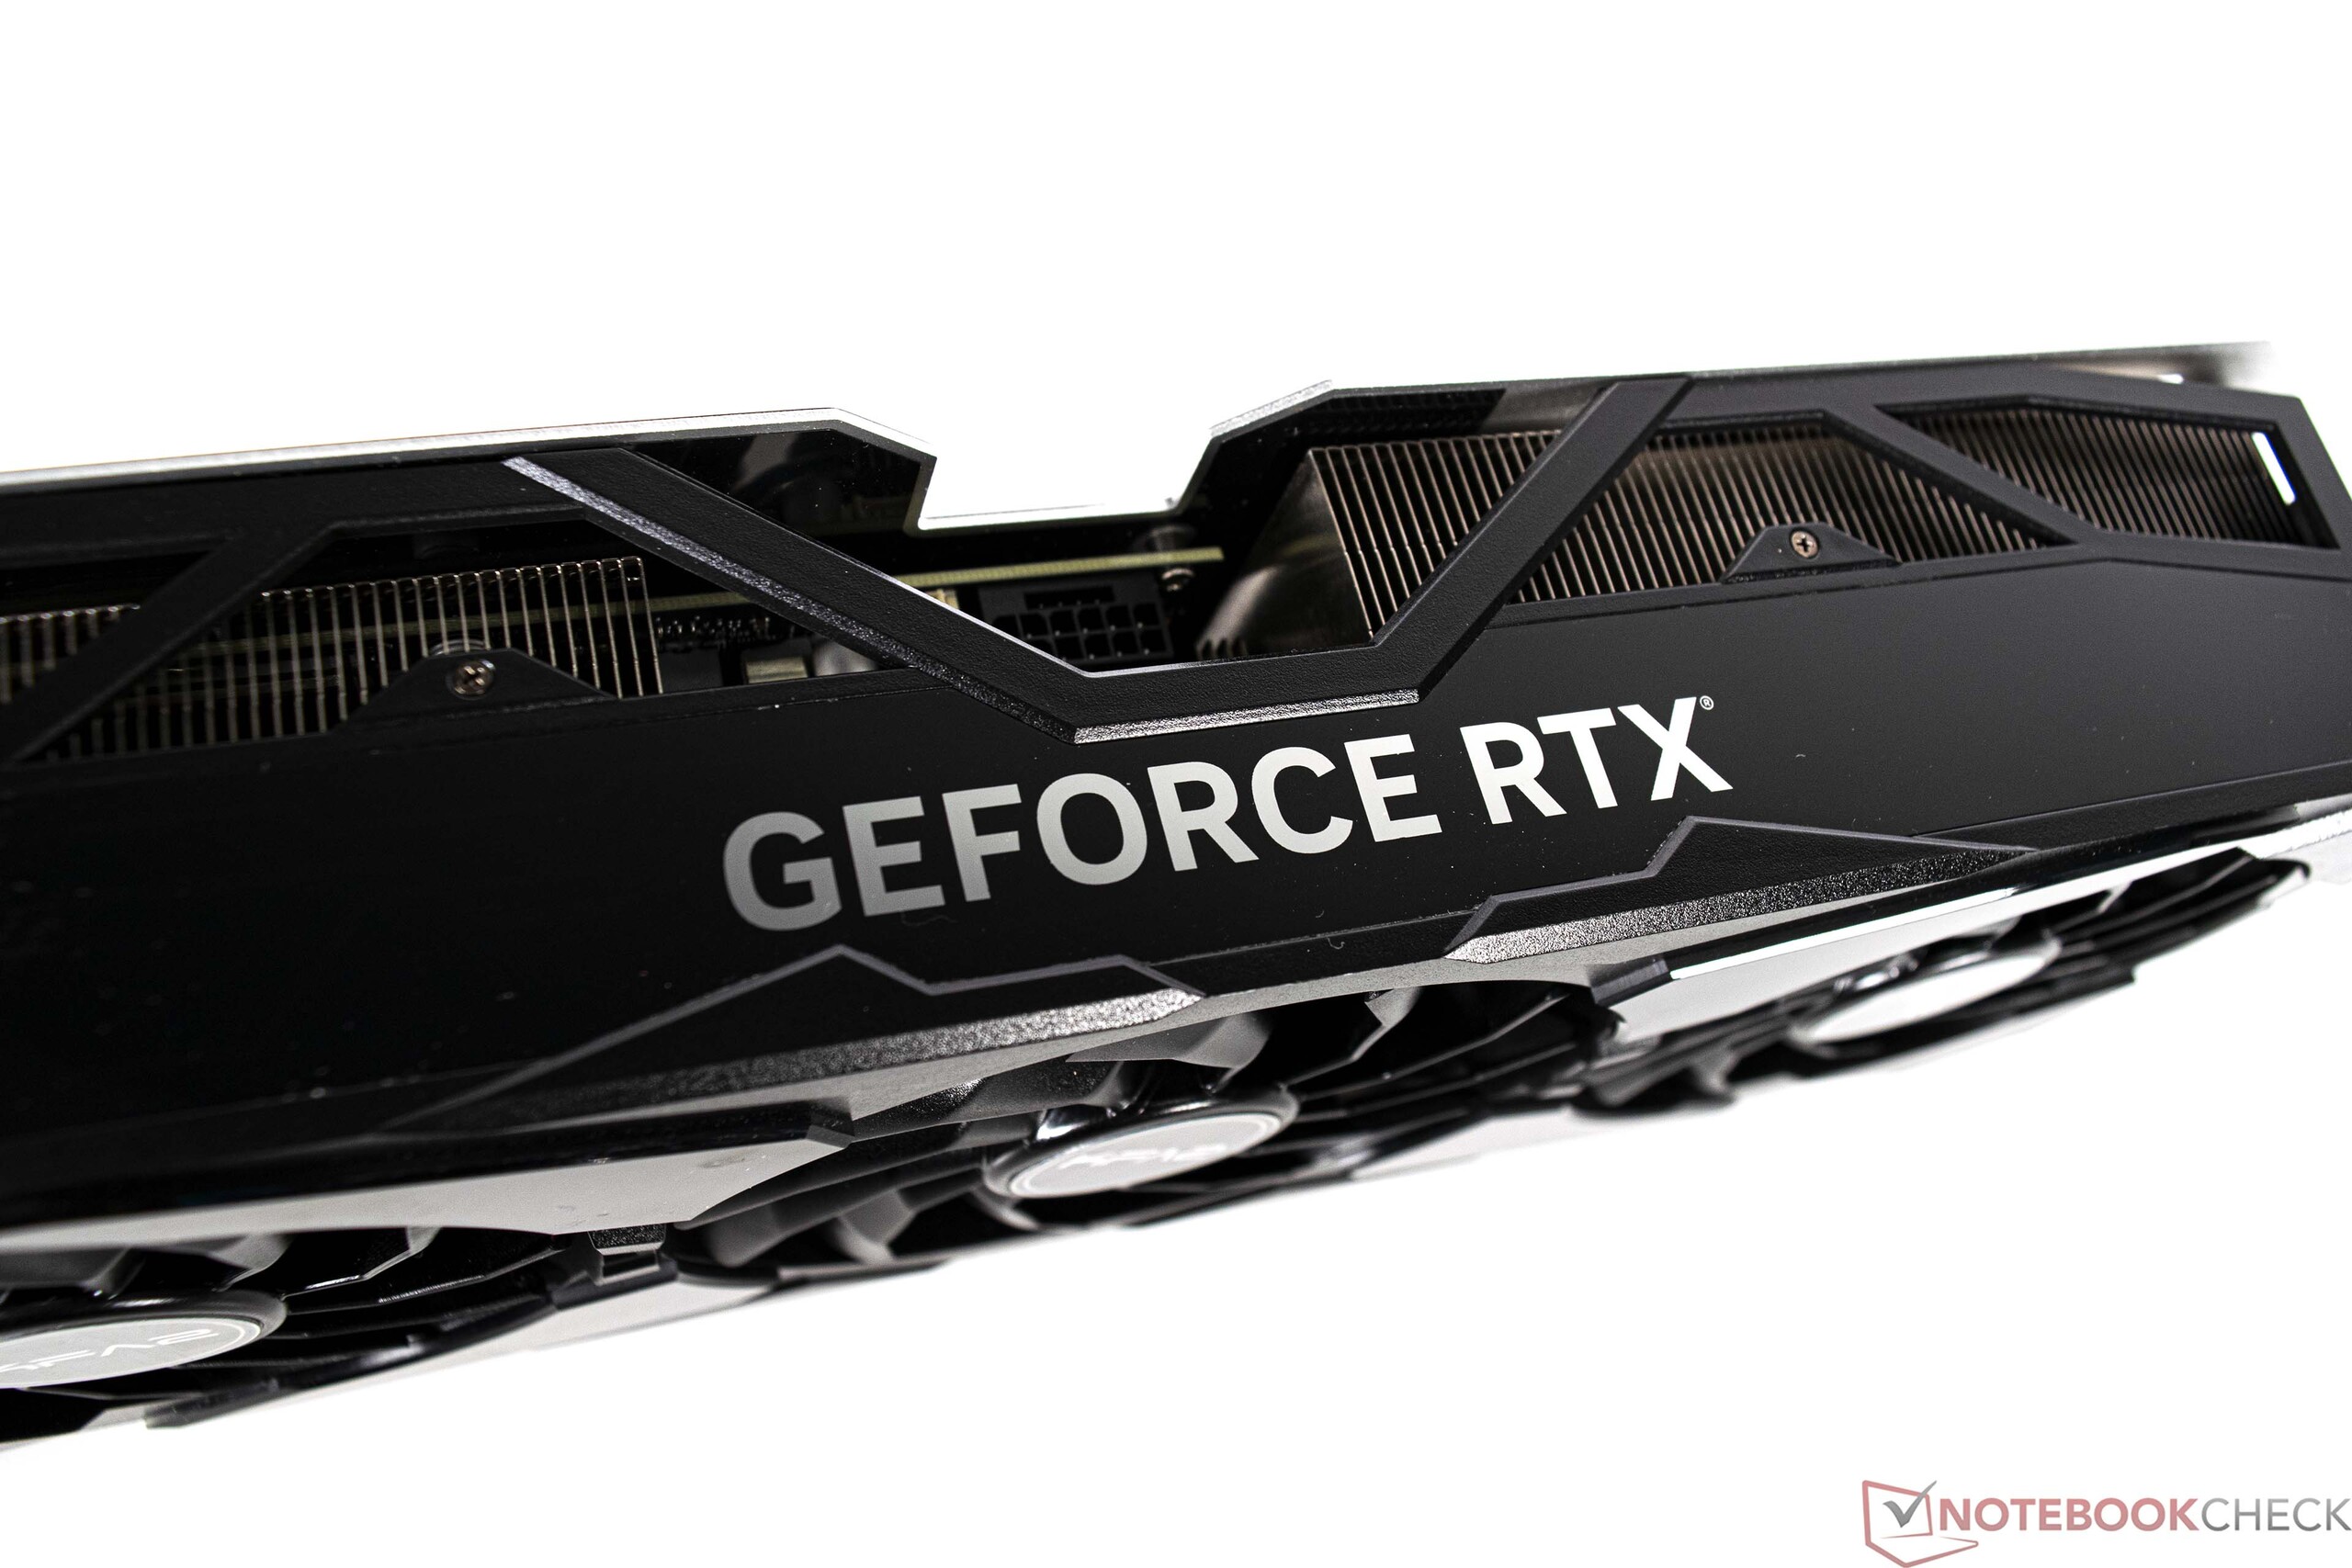
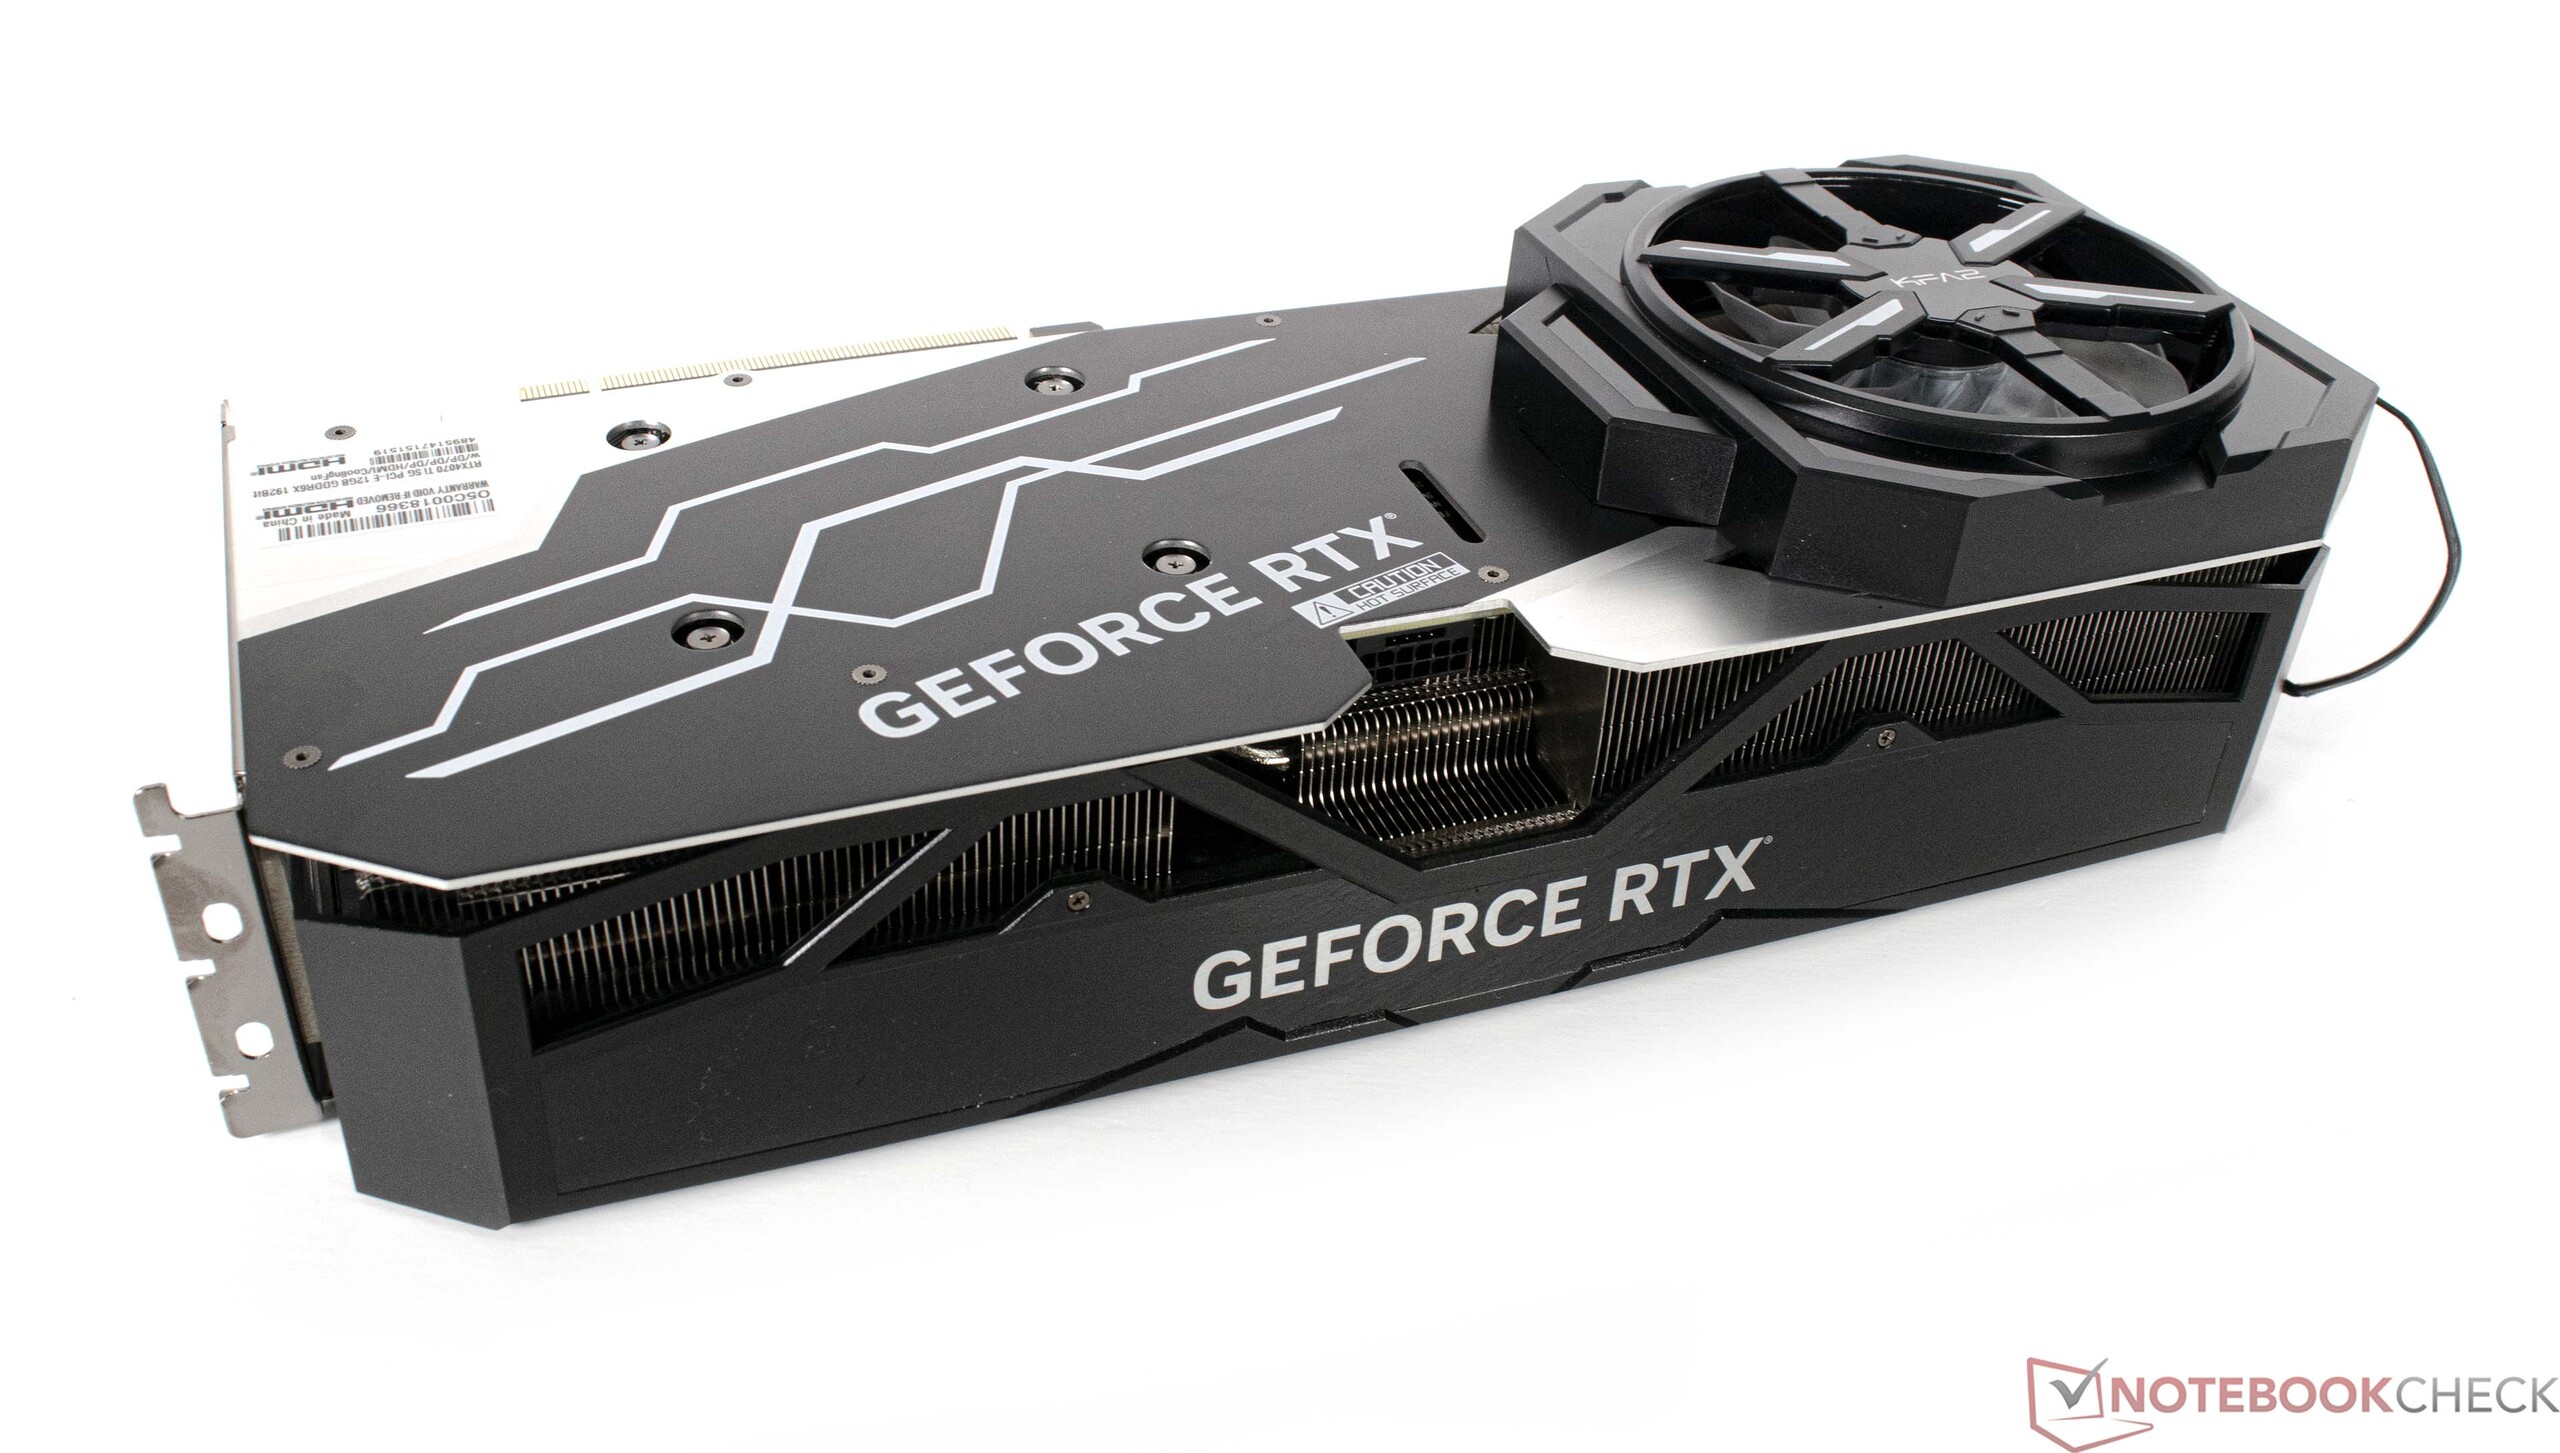
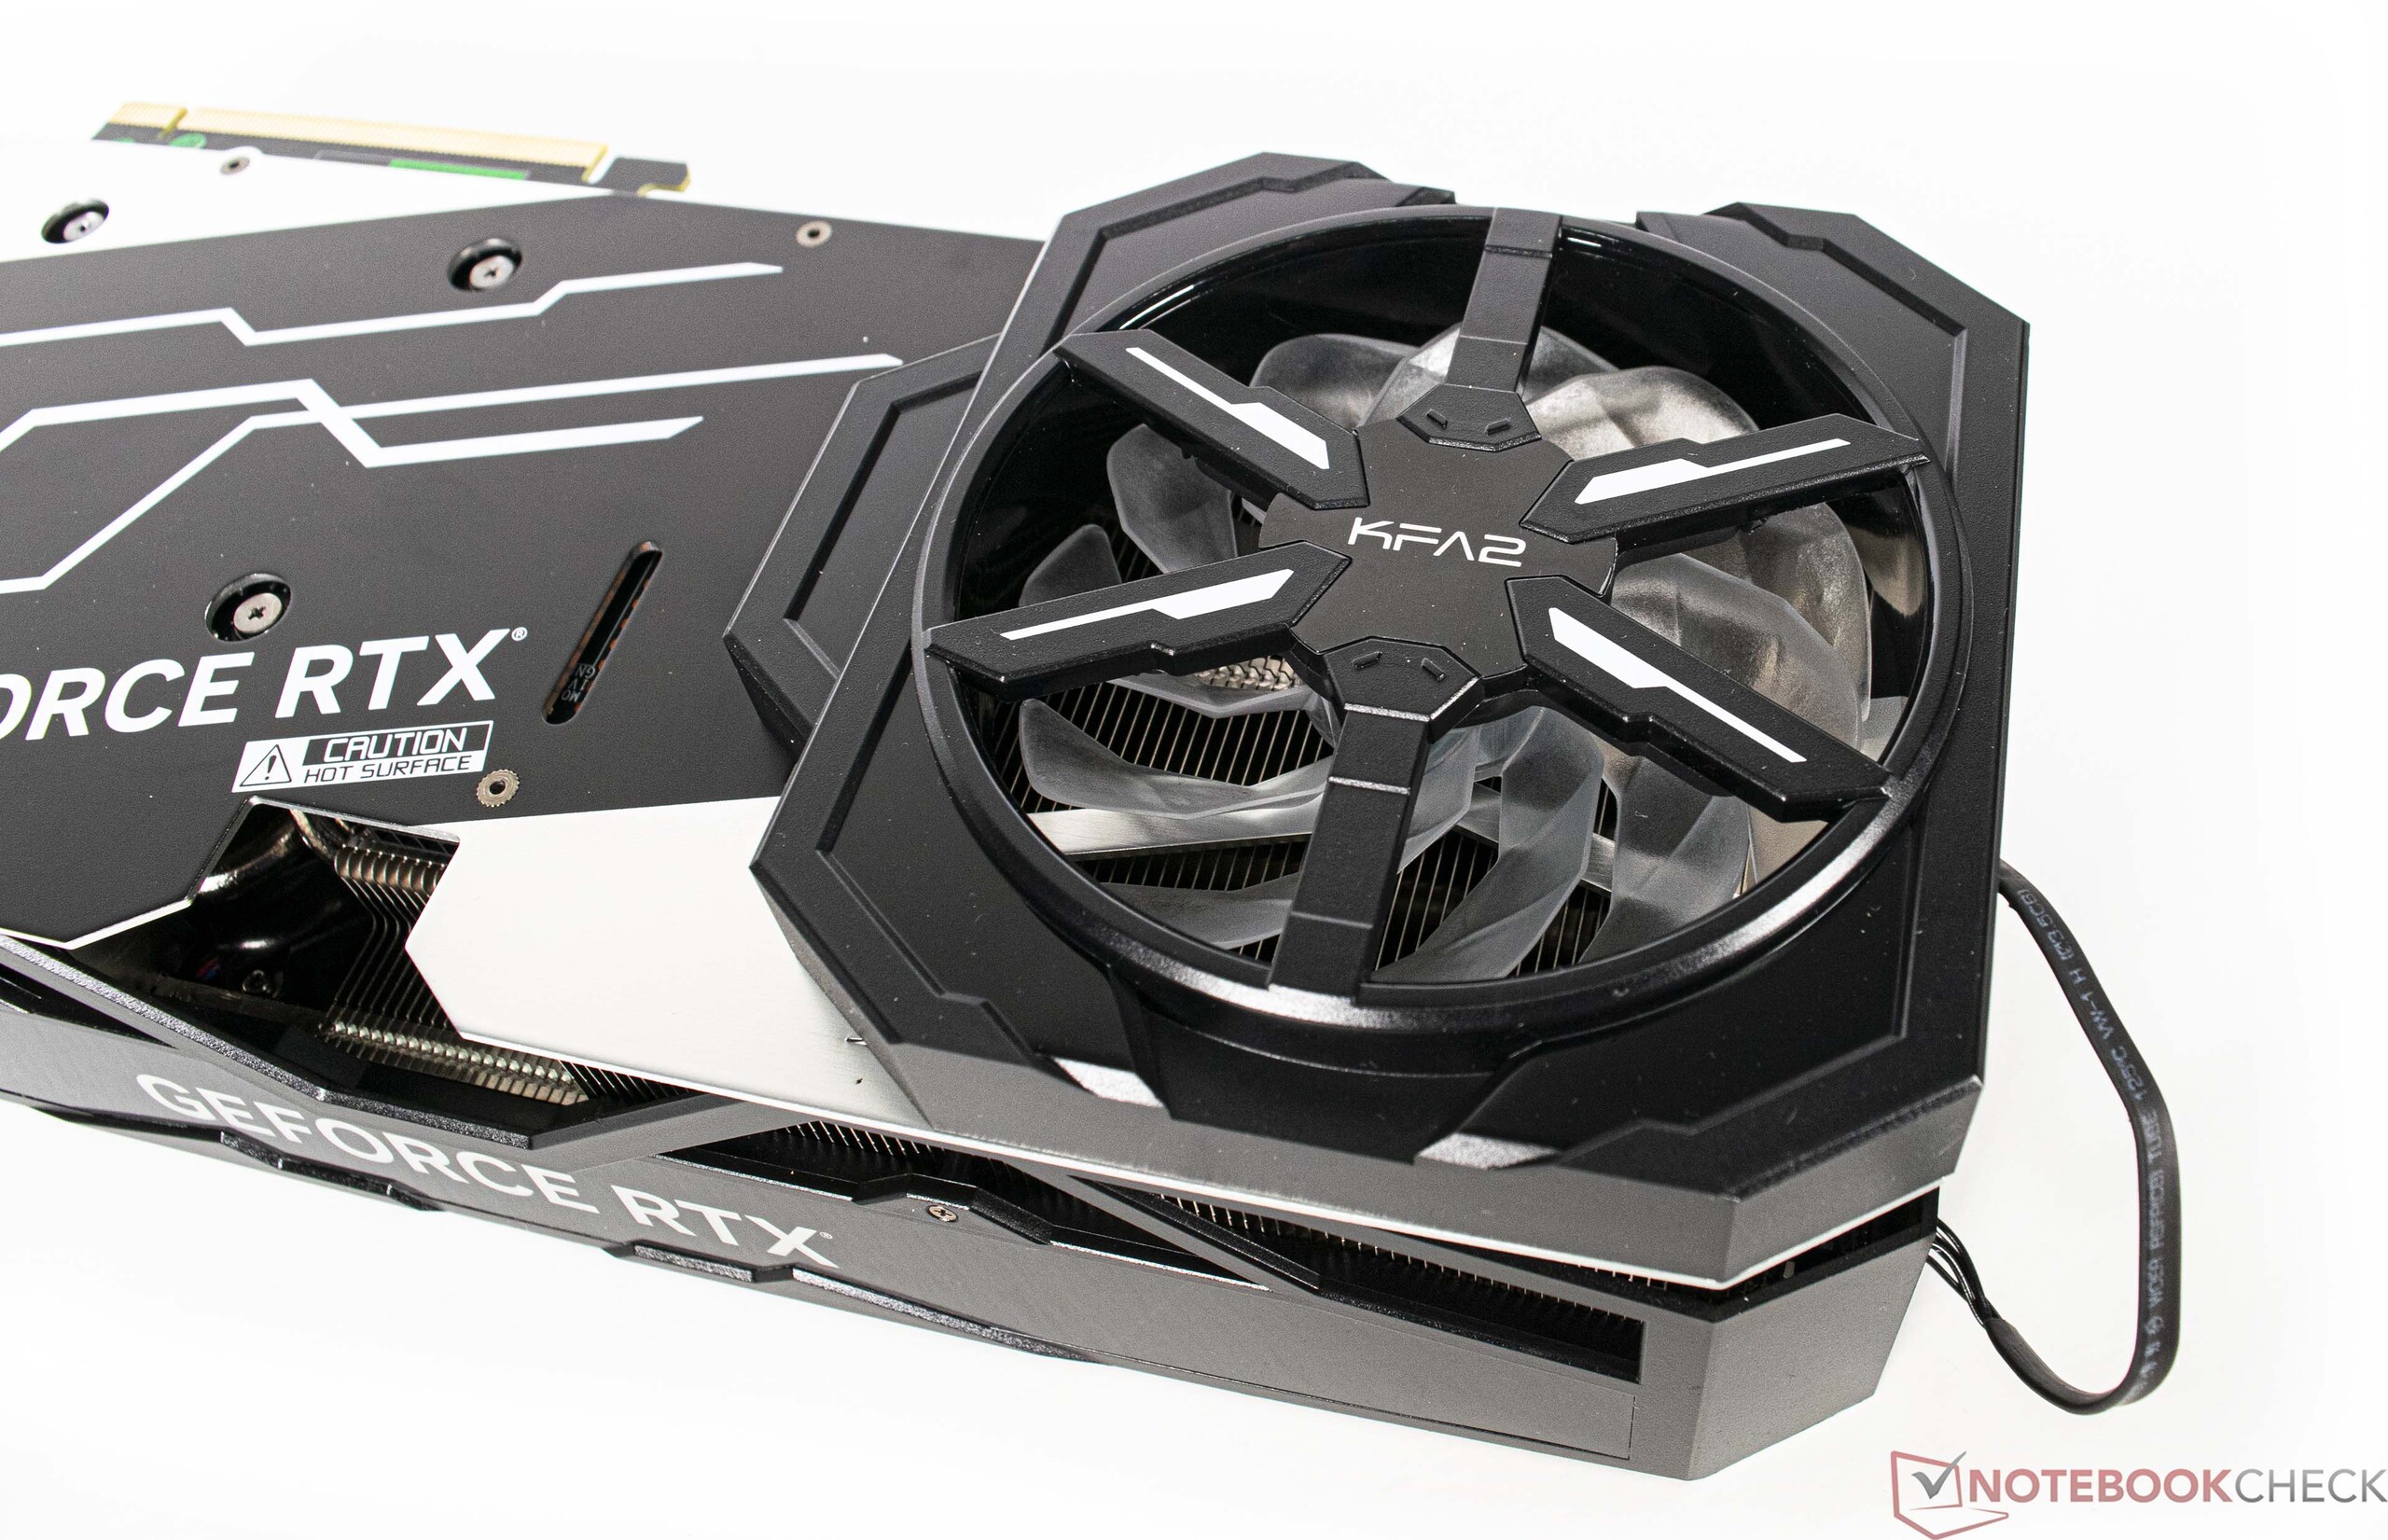
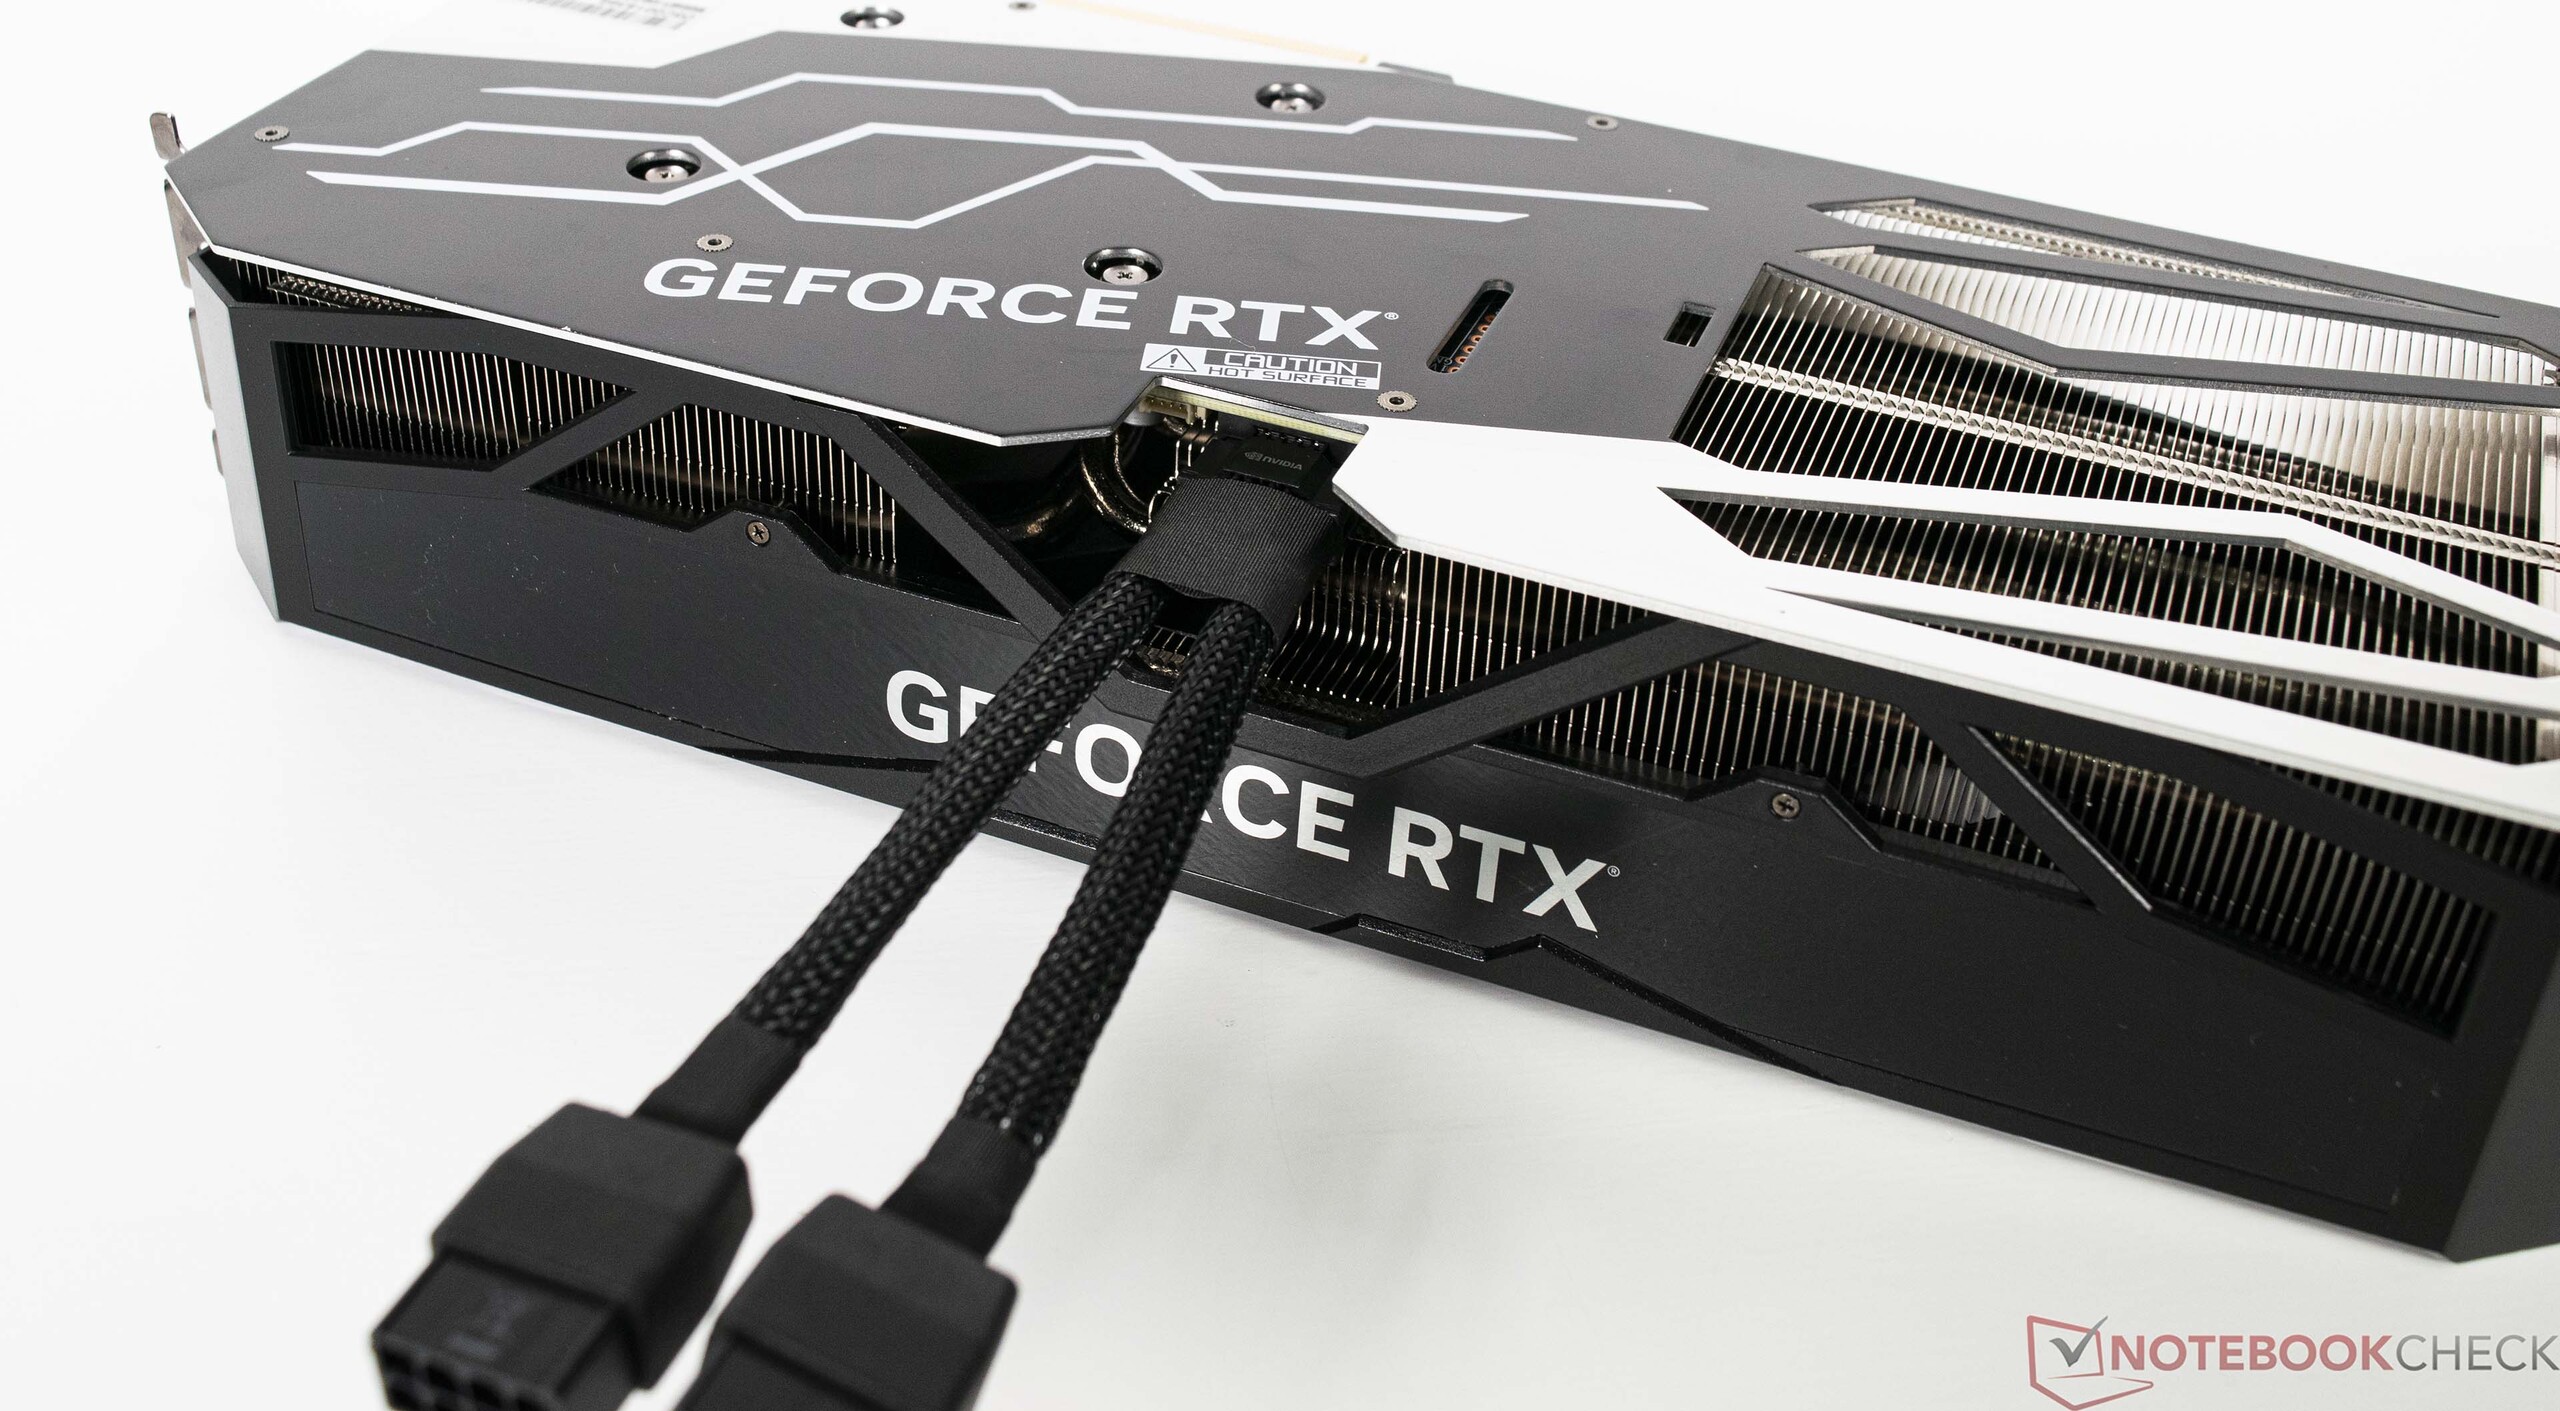
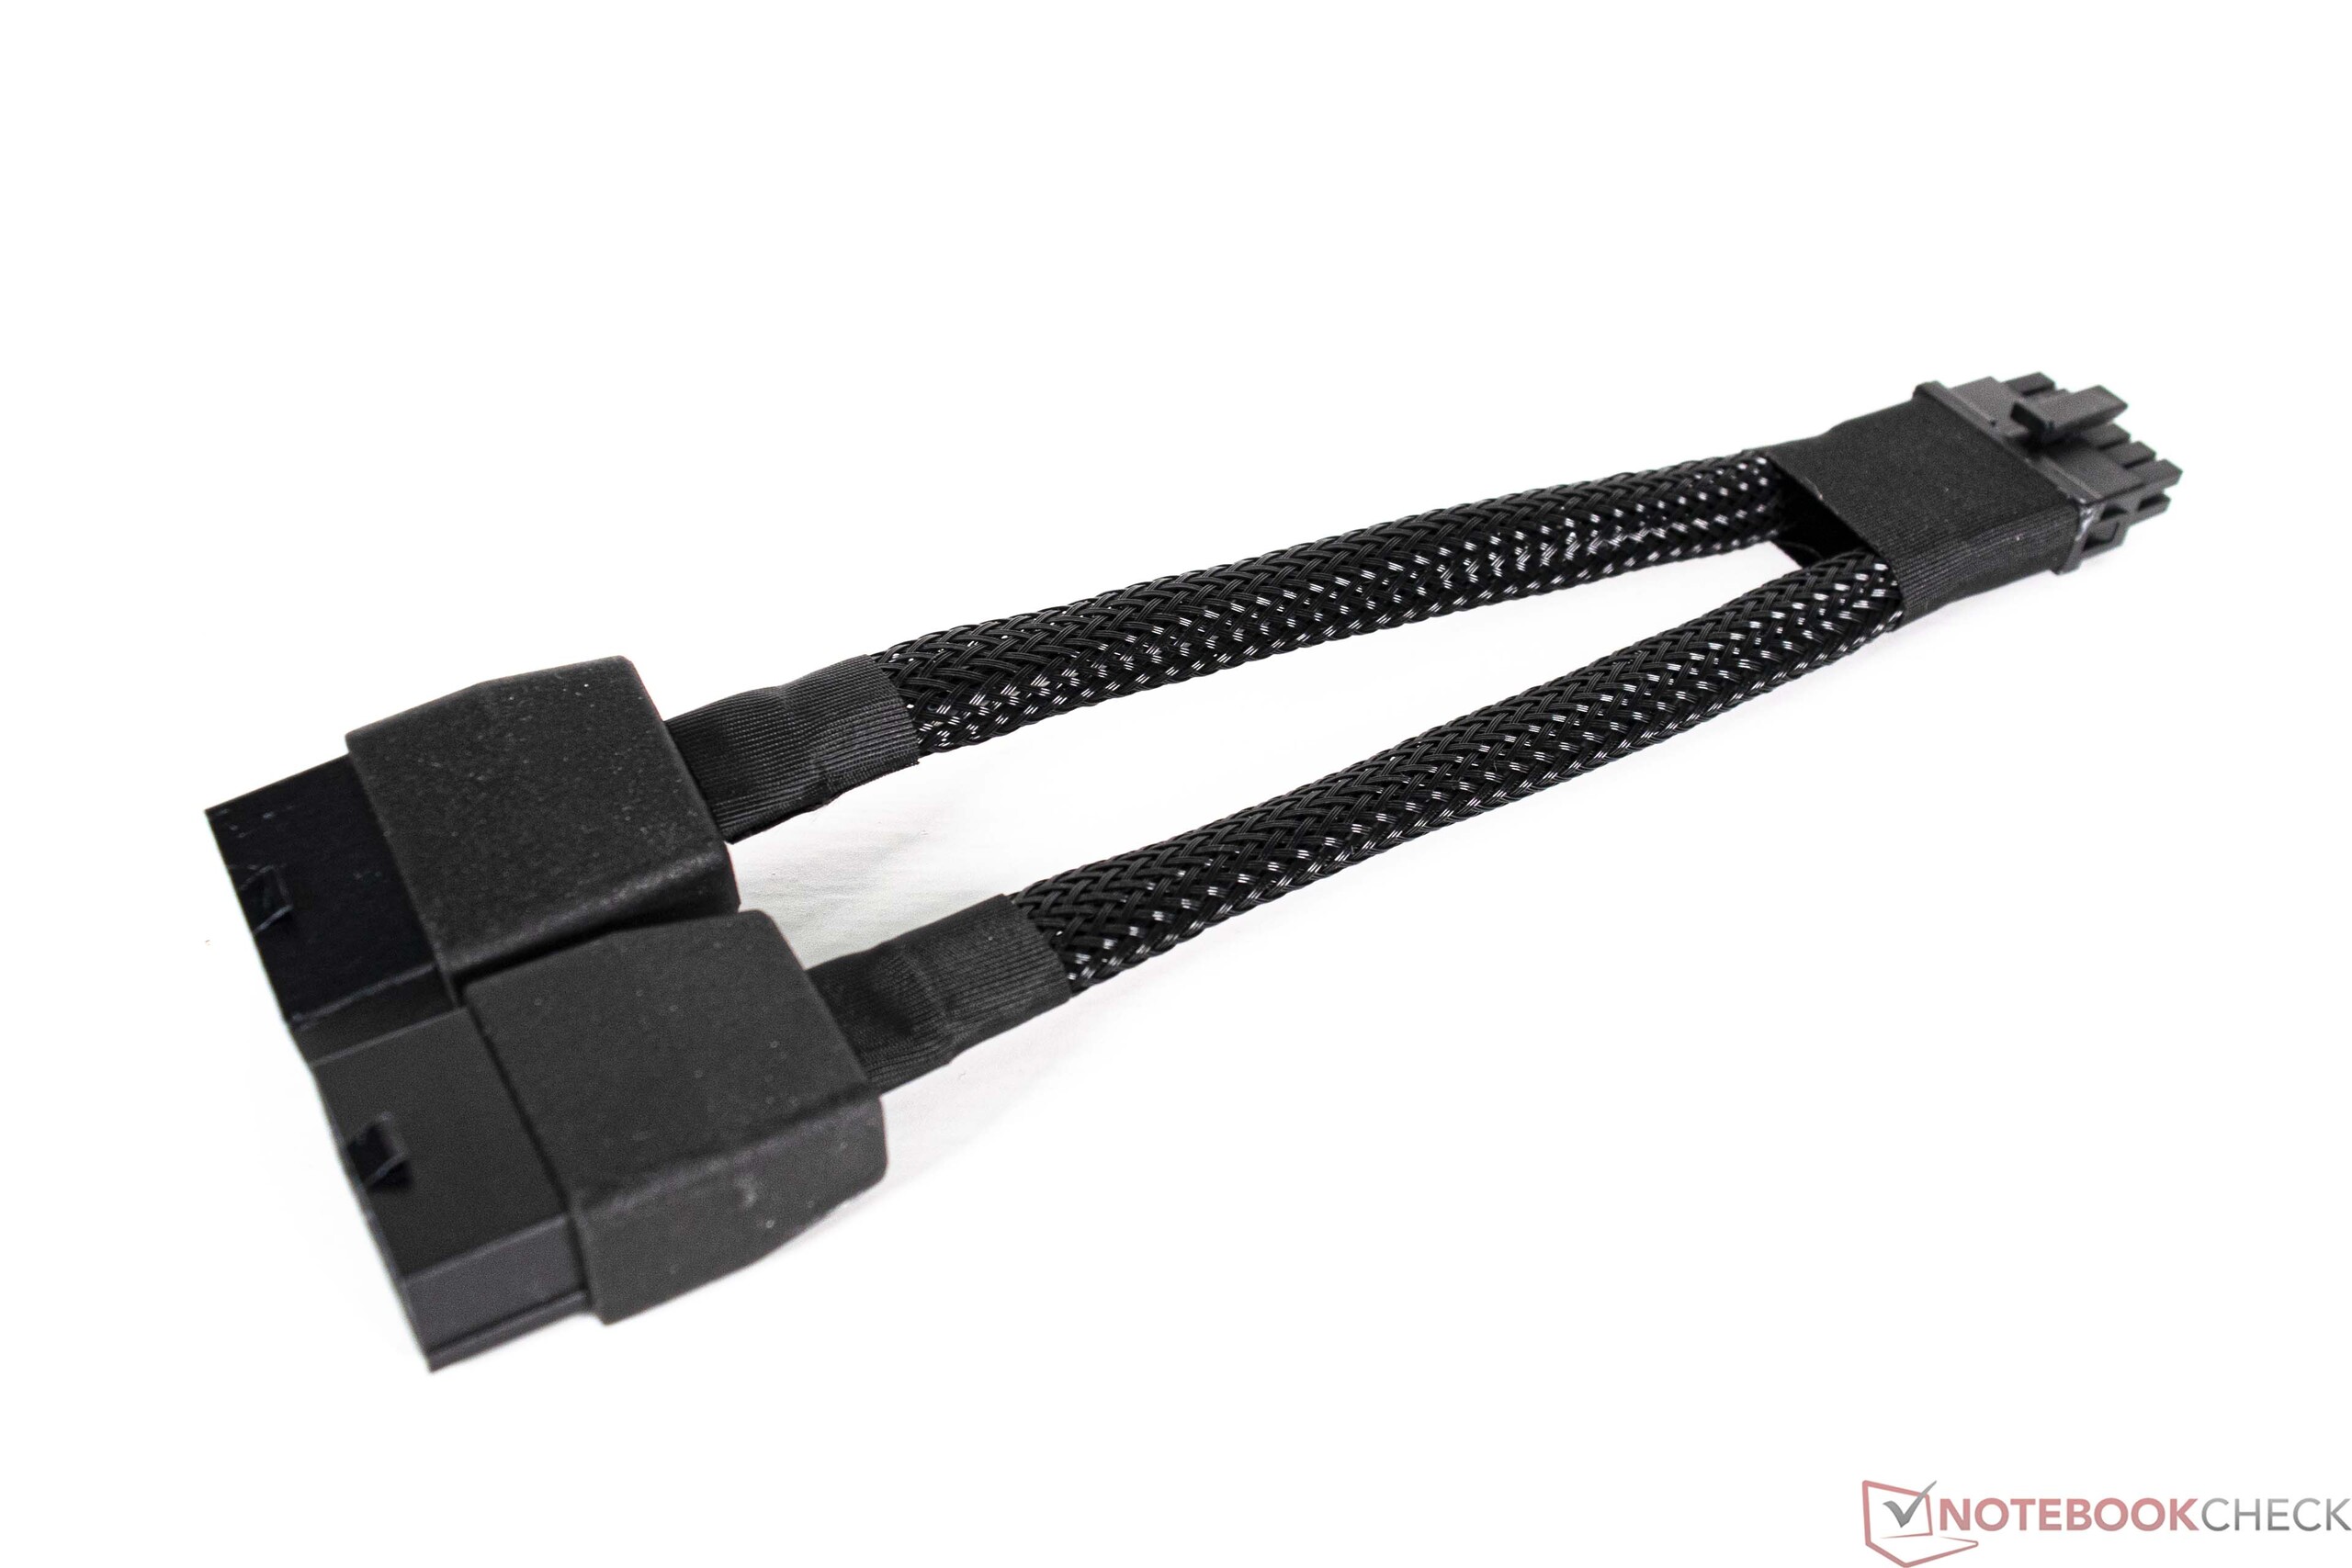
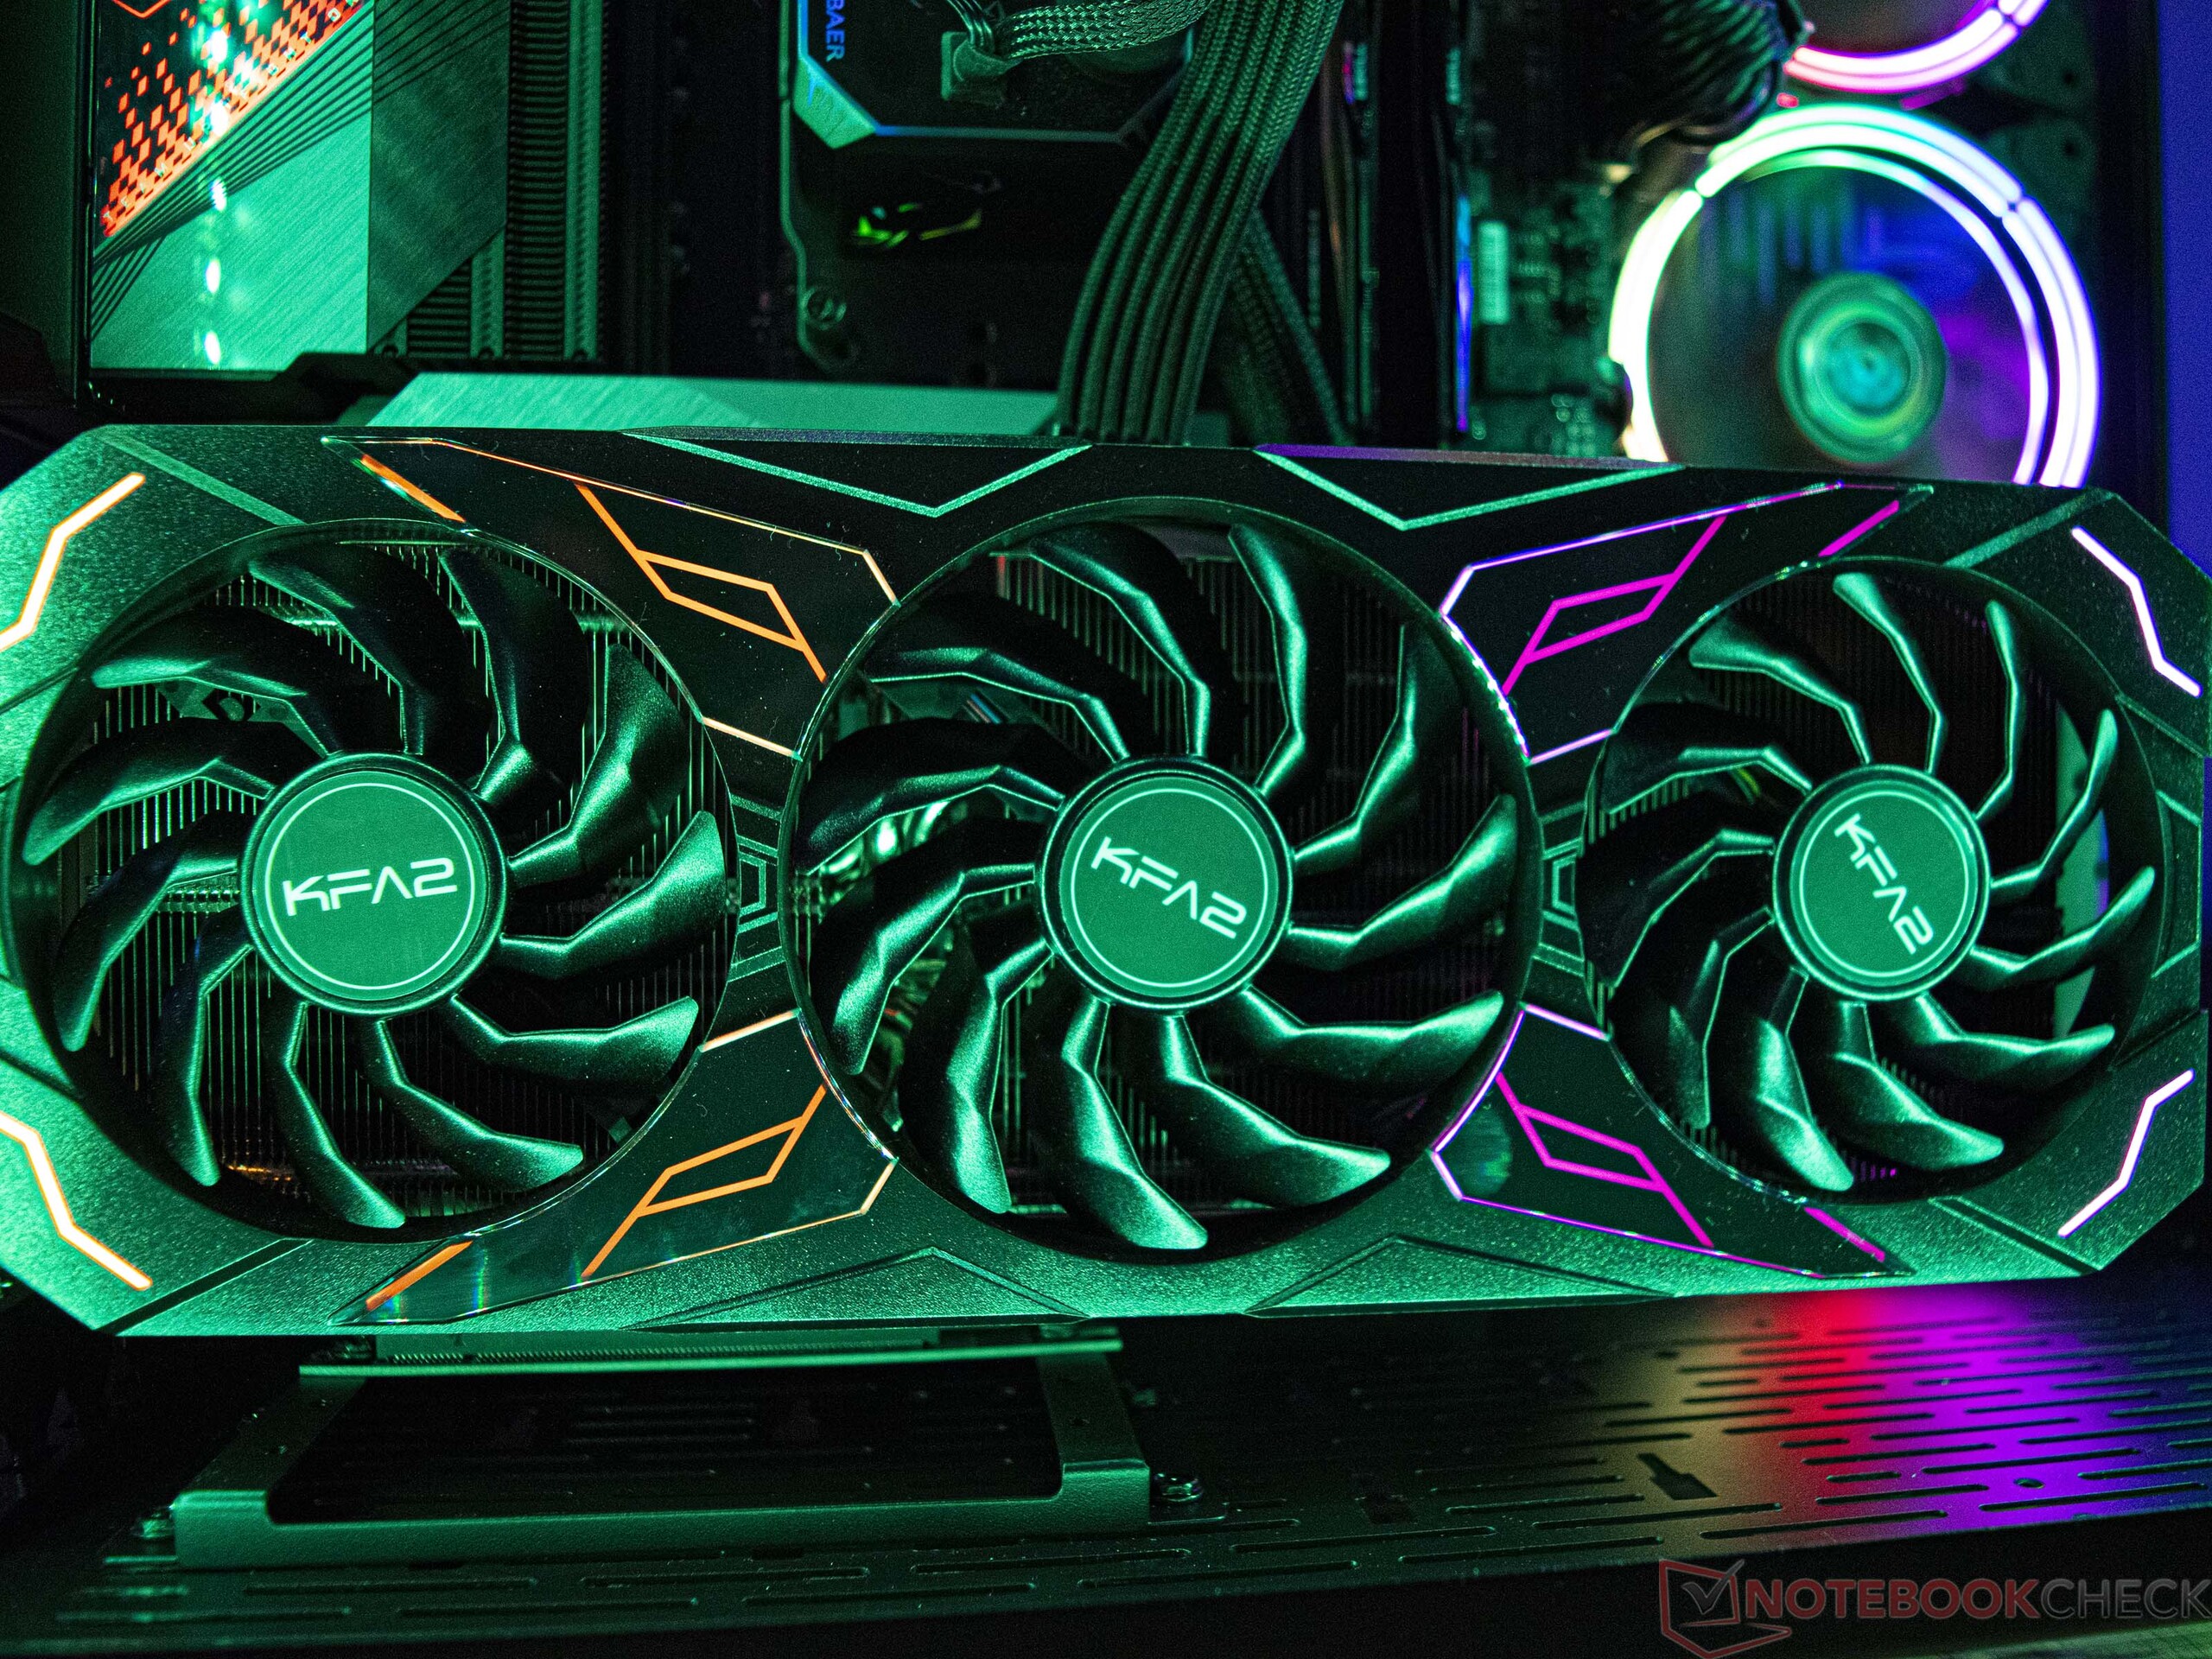
Aesthetically, the KFA2 GeForce RTX 4070 Ti SG doesn't look much different from the two larger RTX 40 Series models made by KFA2 at first glance. Upon a closer look, though, you'll find some minor changes. For instance, we noticed that the card uses fans of different sizes. Even so, they are still able to effectively cool the GPU due to the lower TDP (only up to 285 watts). The KFA2 GeForce RTX 4070 Ti SG has a three-slot form factor and thus occupies a lot of space in a case. The model, which has the "Serious Gaming" (SG) branding in its name, features a lot of RGB lighting, giving the card a very striking look. For power delivery, the graphics card uses the same 12VHPWR connector found on some newer Nvidia GPUs. Those who don't have a modern ATX 3.0 PSU with a native 12VHPWR connection can make use of the included 2x6+2 pin PCIe to 12VHPWR adapter.
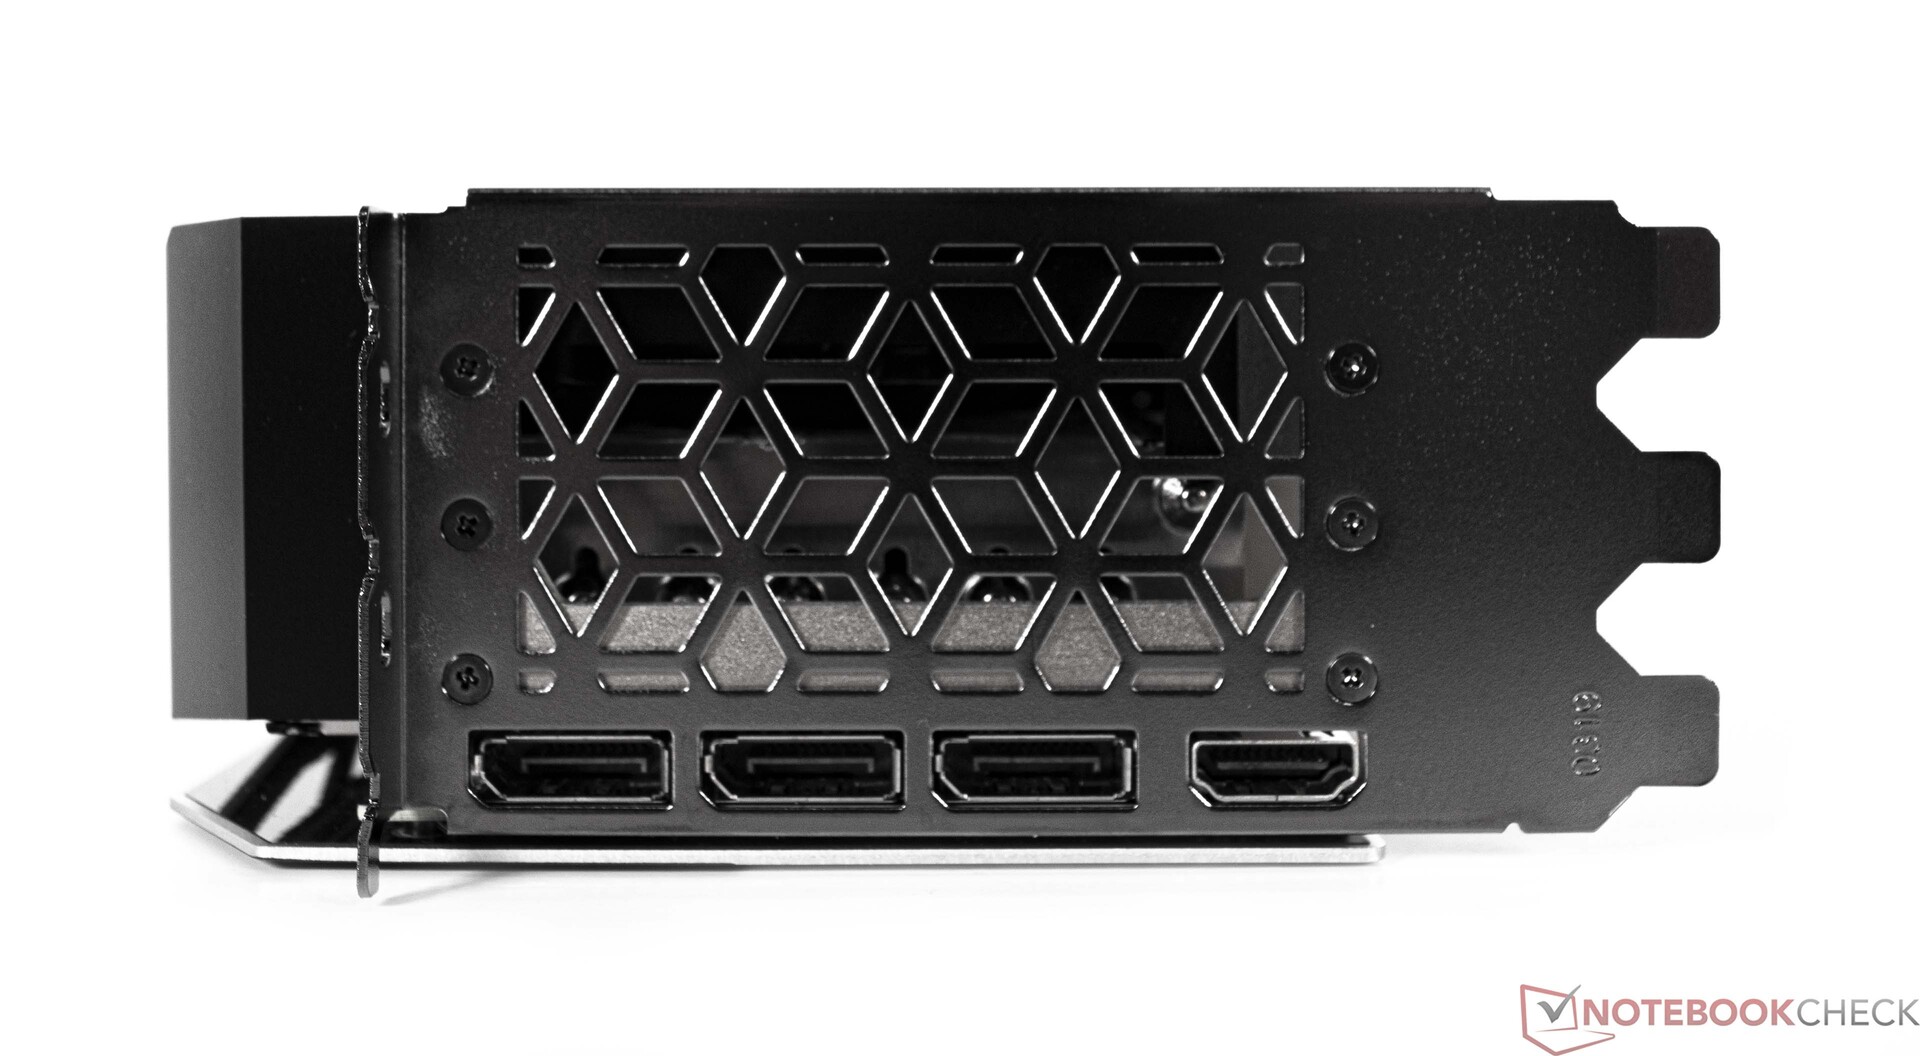
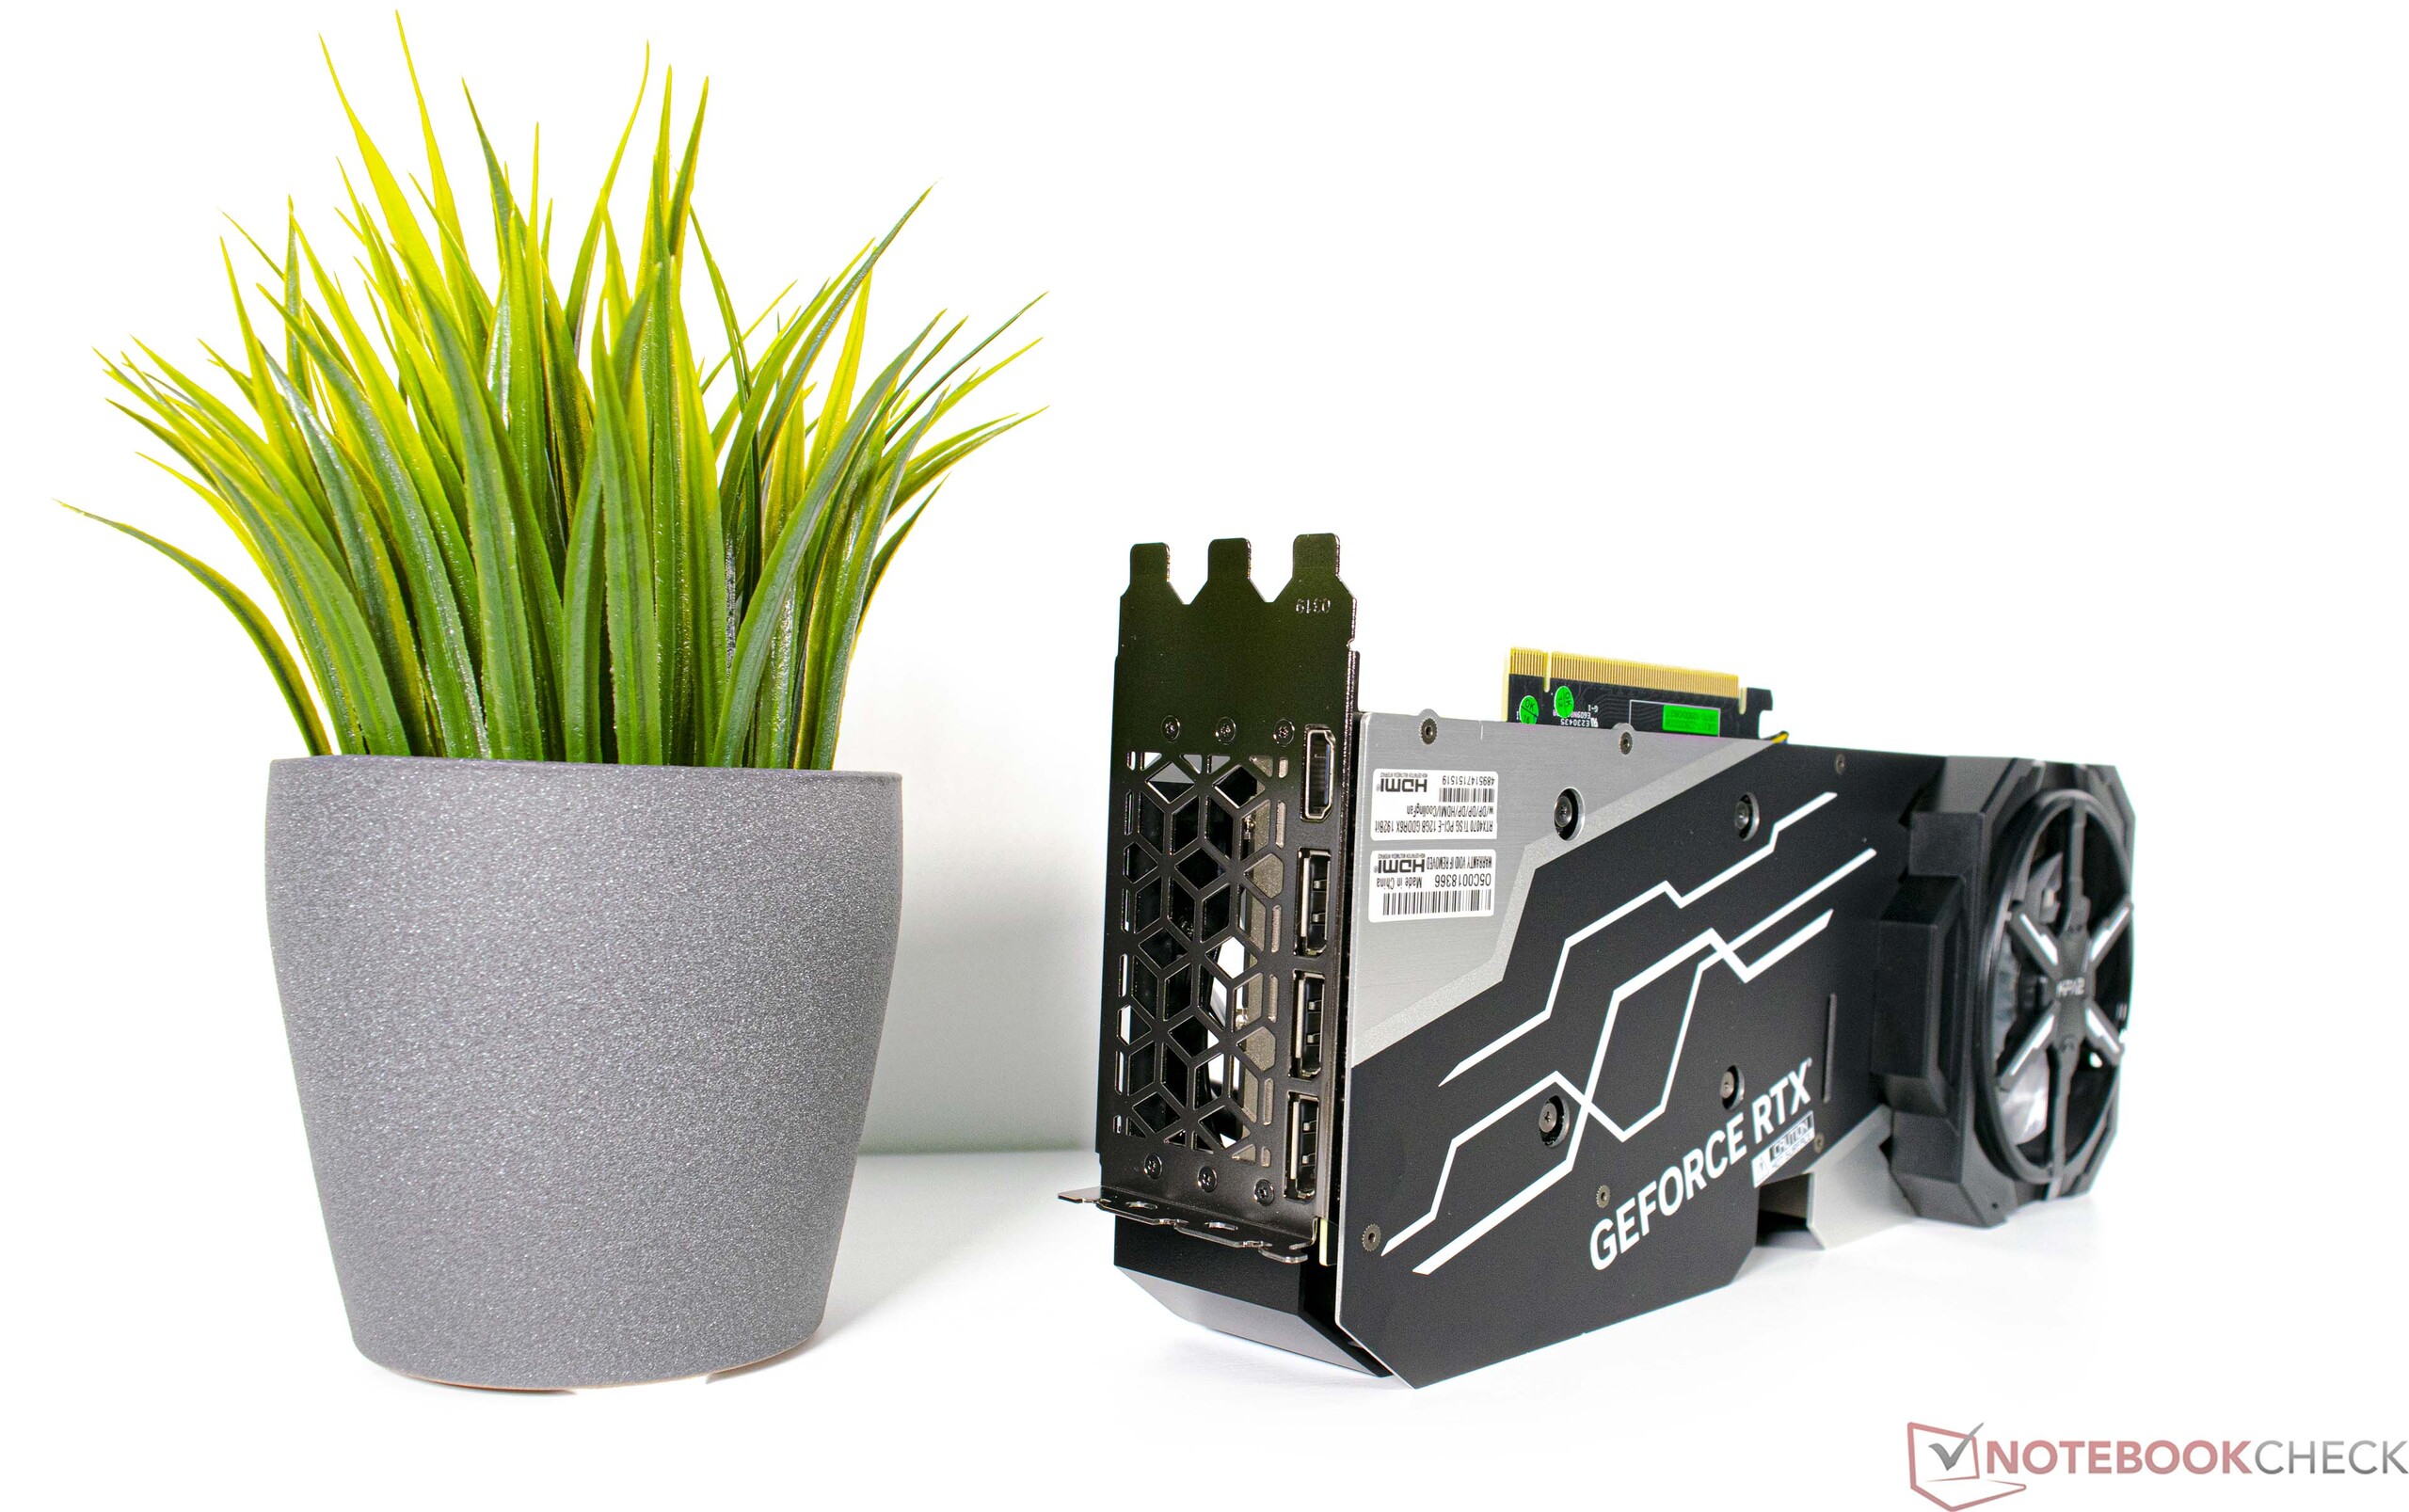
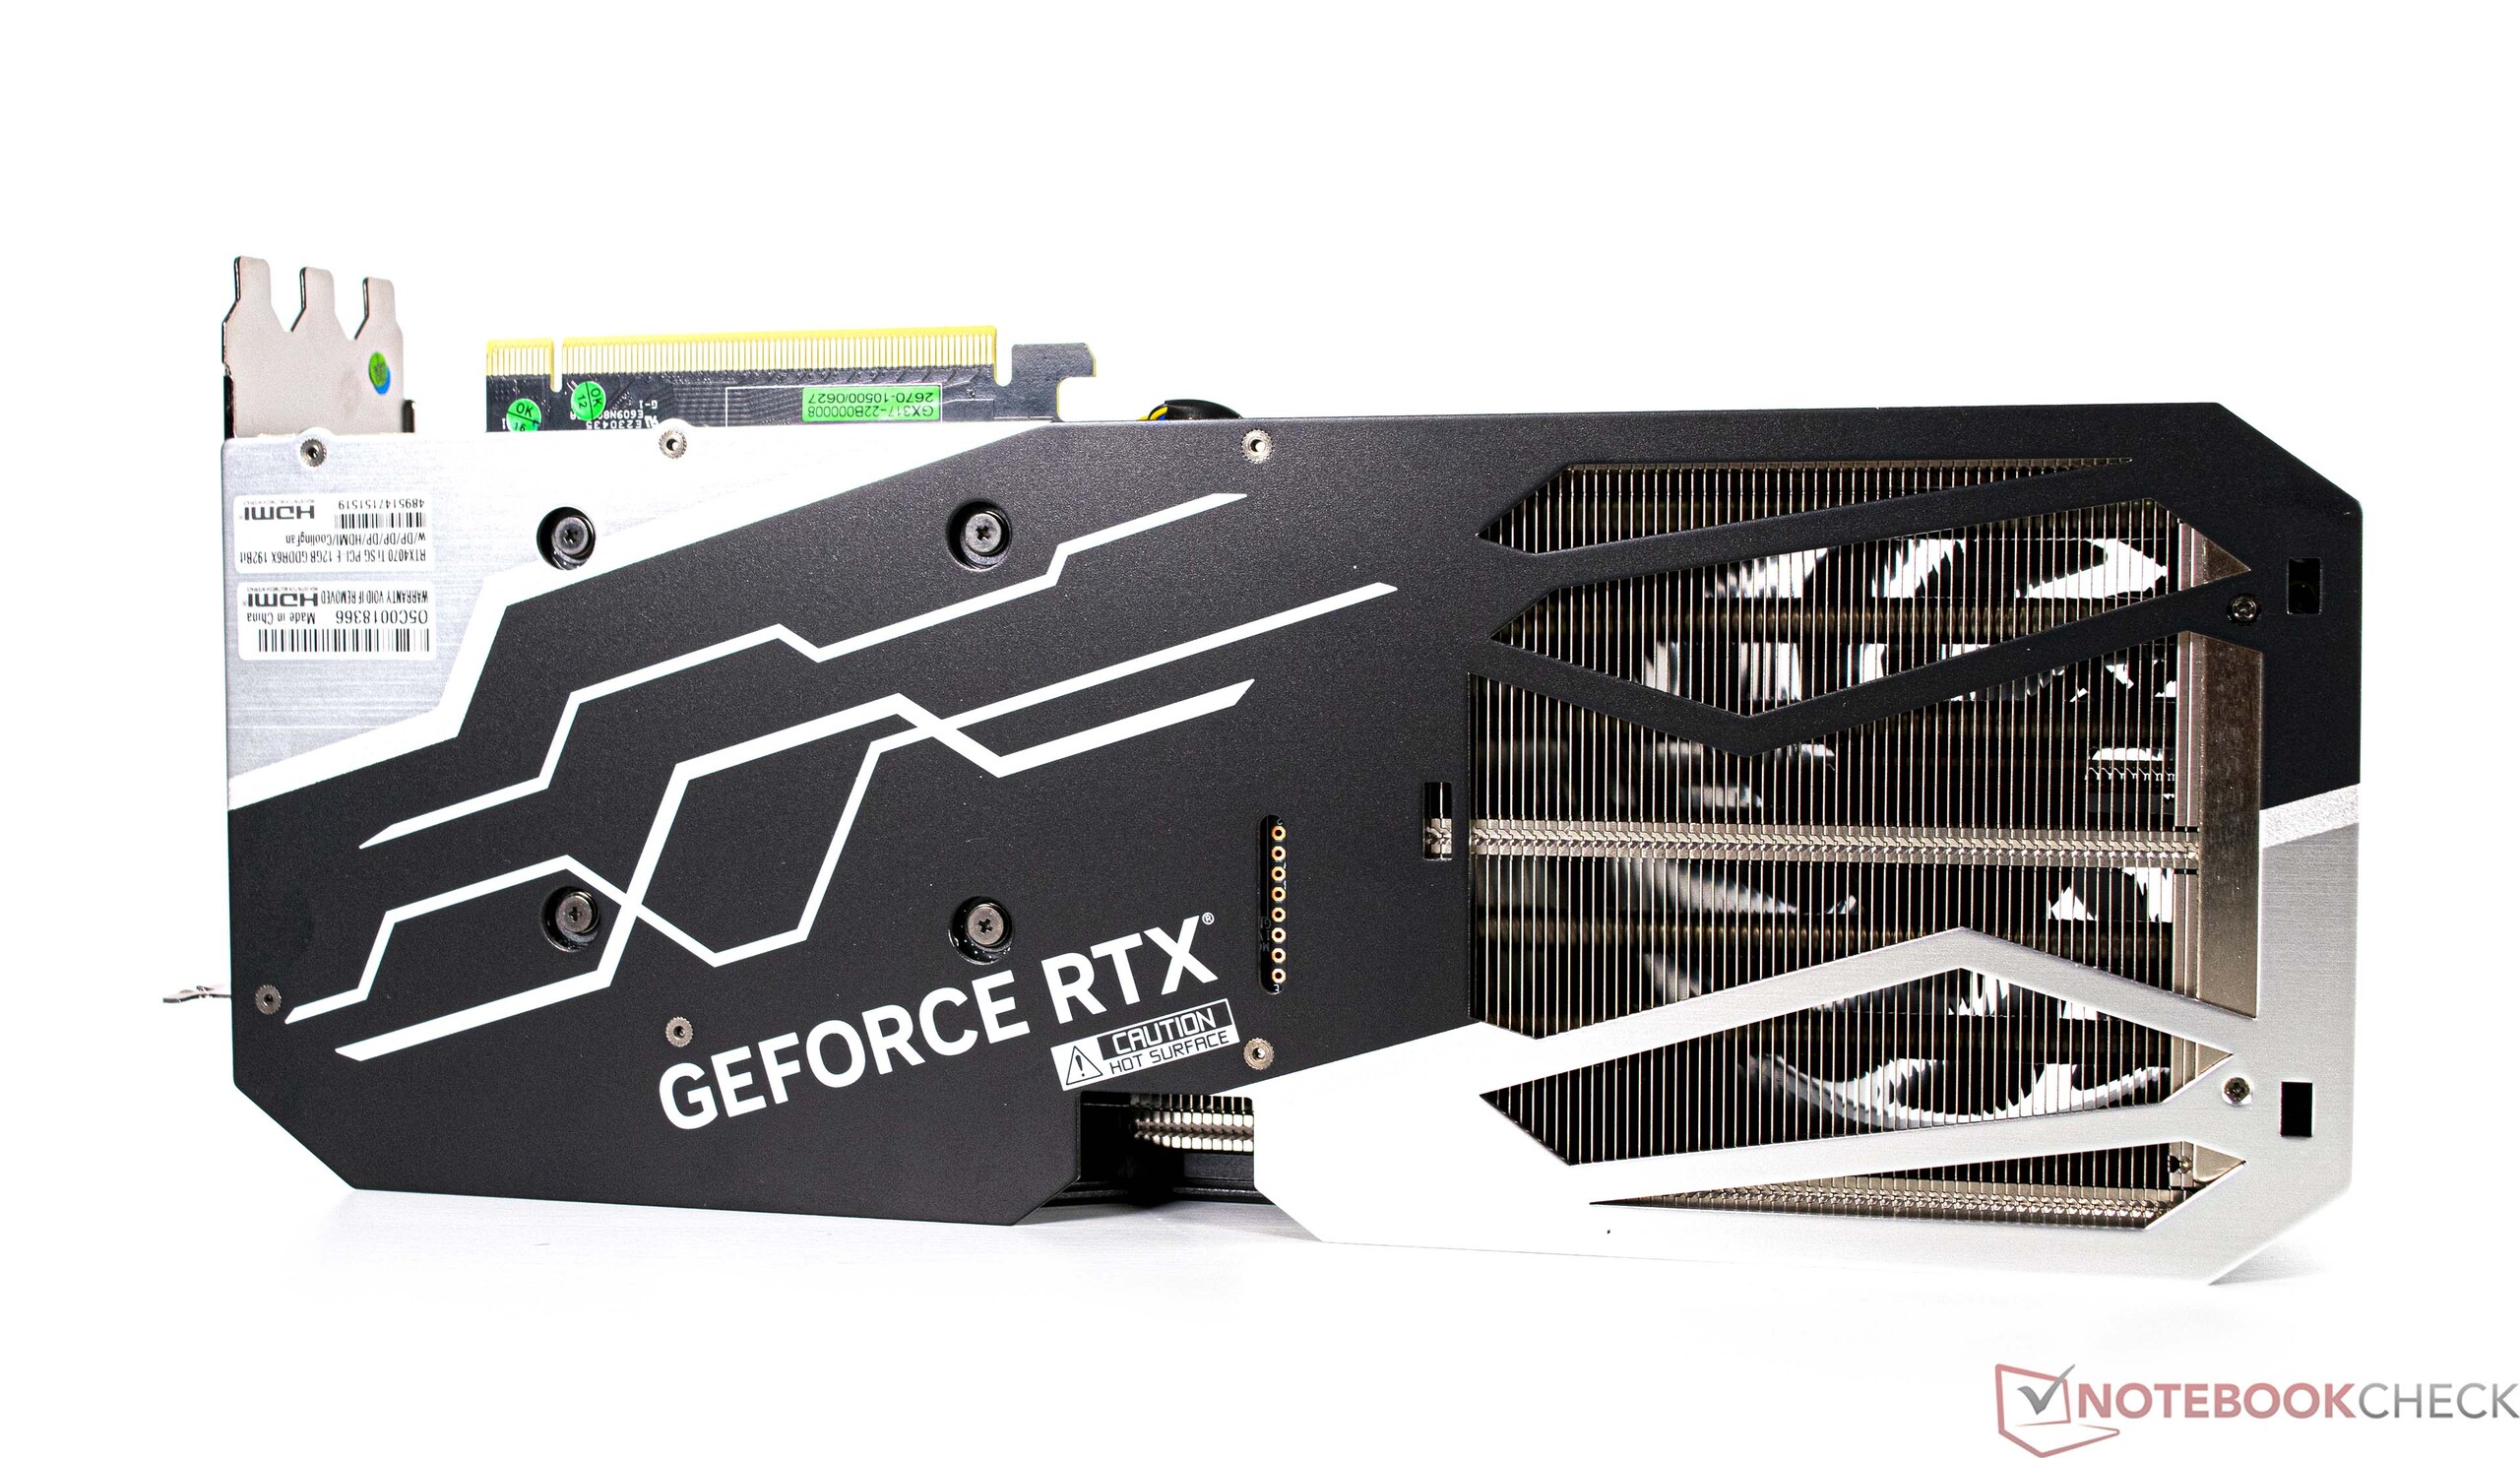
On the back, the KFA2 GeForce RTX 4070 Ti SG comes with 1x HDMI 2.1a port and 3x DisplayPort 1.4a.
KFA2 GeForce RTX 4070 Ti SG
Comparing the specs of GeForce graphics cards
| Specification | RTX 4090 (FE) | RTX 4080 | KFA2 RTX 4070 Ti | RTX 3090 Ti | RTX 3090 (FE) | RTX 3080 Ti (FE) | RTX 3080 (FE) | KFA2 RTX 3070 Ti |
| Chip | AD102 | AD103 | AD104 | GA102 | GA102 | GA102 | GA102 | GA104 |
| FinFET Prozess | 4 nm | 4 nm | 4 nm | 8 nm | 8 nm | 8 nm | 8 nm | 8 nm |
| CUDA Cores | 16,384 | 9,728 | 7,680 | 10,752 | 10,496 | 10,240 | 8,704 | 6,144 |
| Texture Units | 512 | 304 | 240 | 336 | 328 | 320 | 272 | 192 |
| Tensor Cores | 512 4. Gen. | 304 4. Gen. | 240 4. Gen. | 336 3. Gen. | 328 3. Gen. | 320 3. Gen. | 272 3. Gen. | 192 3. Gen. |
| RT Cores | 128 | 76 | 60 | 84 | 82 | 80 | 68 | 48 |
| GPU Base Clock | 2,235 MHz | 2,205 MHz | 2,310 MHz | 1,560 MHz | 1,395 MHz | 1,365 MHz | 1,440 MHz | 1,575 MHz |
| GPU Boost Clock | 2,520 MHz | 2,505 MHz | 2,670 MHz | 1,860 MHz | 1,695 MHz | 1,665 MHz | 1,710 MHz | 1,800 MHz |
| Memory Bus | 384 Bit | 256 Bit | 192 Bit | 384 Bit | 384 Bit | 384 Bit | 320 Bit | 256 Bit |
| Memory Bandwidth | 1,008 GB/s | 716.8 GB/s | 504.2 GB/s | 1,008 GB/s | 936 GB/s | 912.4 GB/s | 760 GB/s | 608.3 GB/s |
| Video Memory | 24 GB GDDR6X | 16 GB GDDR6X | 12 GB GDDR6 | 24 GB GDDR6X | 24 GB GDDR6X | 12 GB GDDR6X | 10 GB GDDR6X | 8 GB GDDR6X |
| Power consumption | 450 W | 320 W | 285 W | 450 W | 350 W | 350 W | 320 W | 290 W |
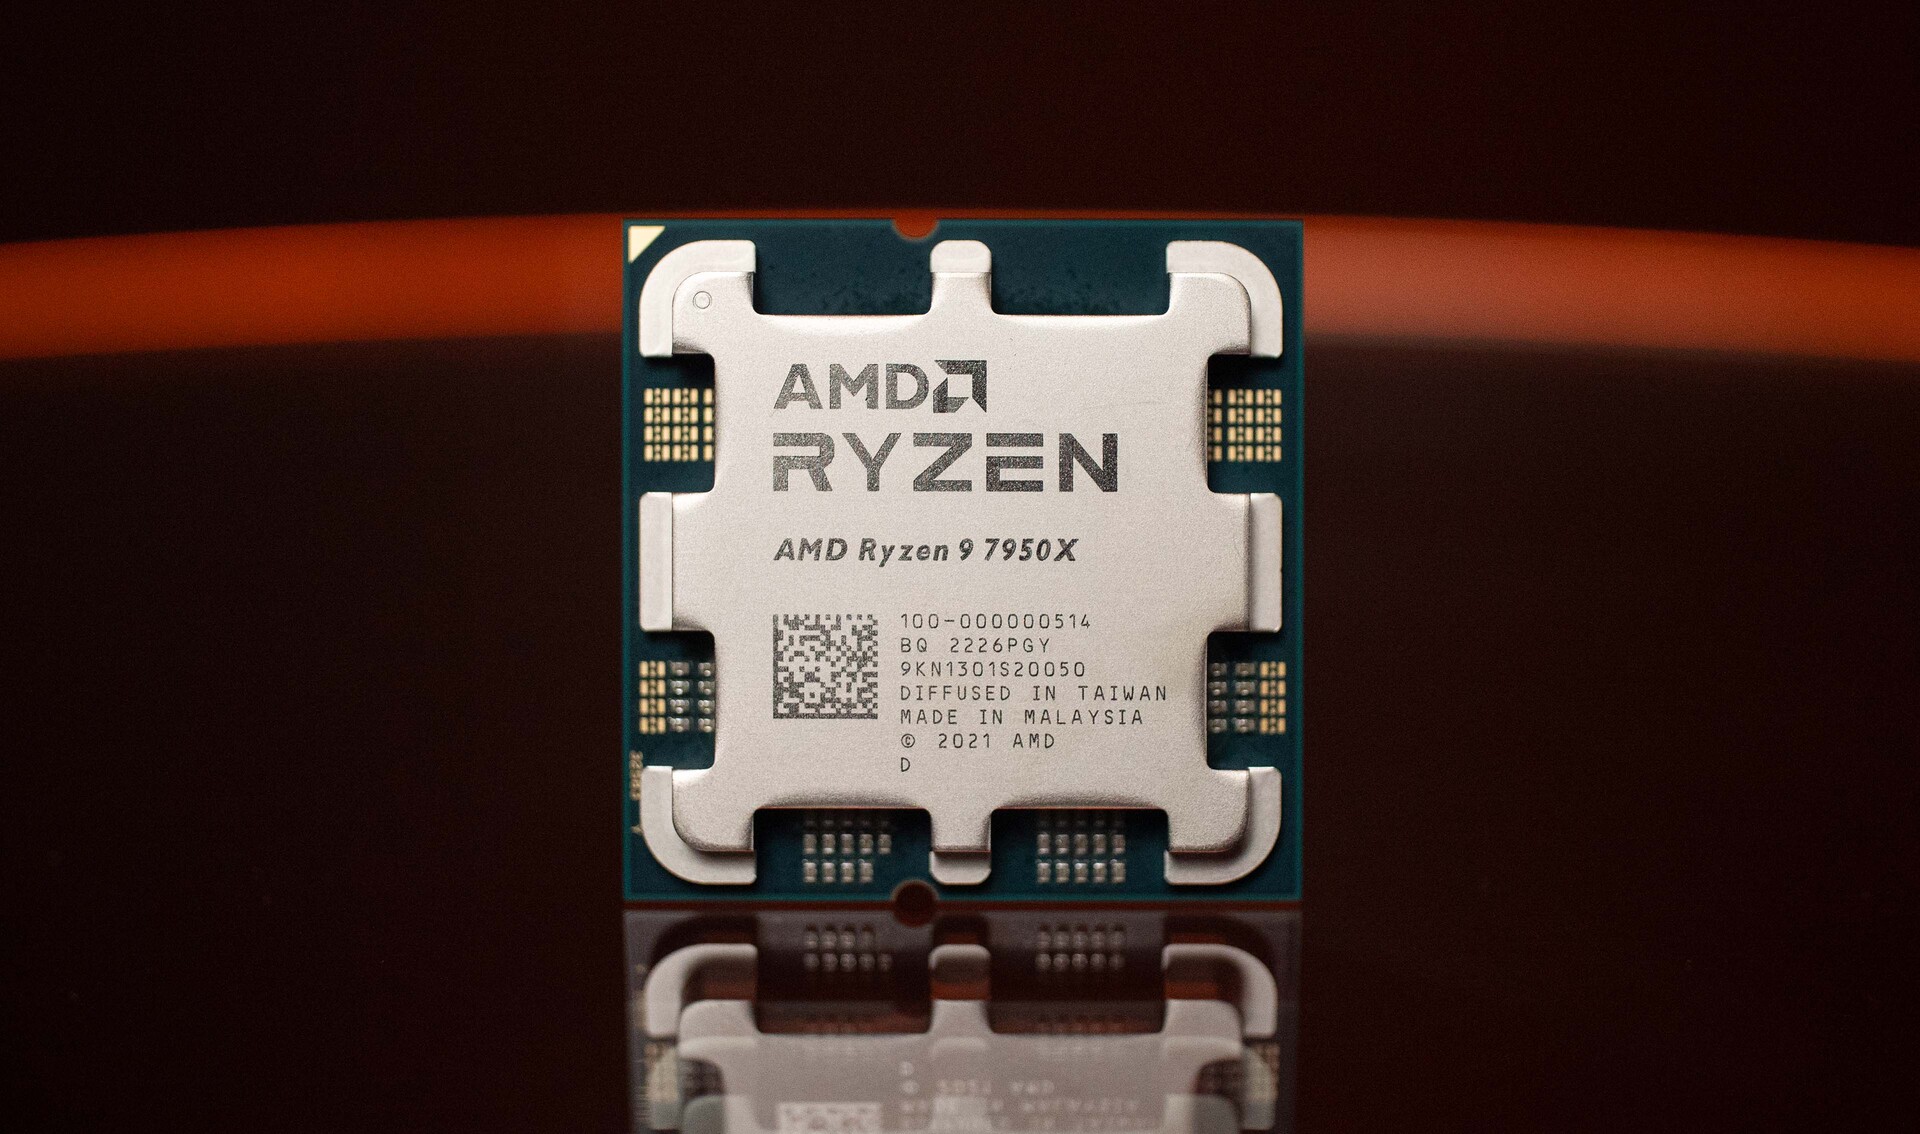
Our test system is based on AMD Ryzen 9 7950X
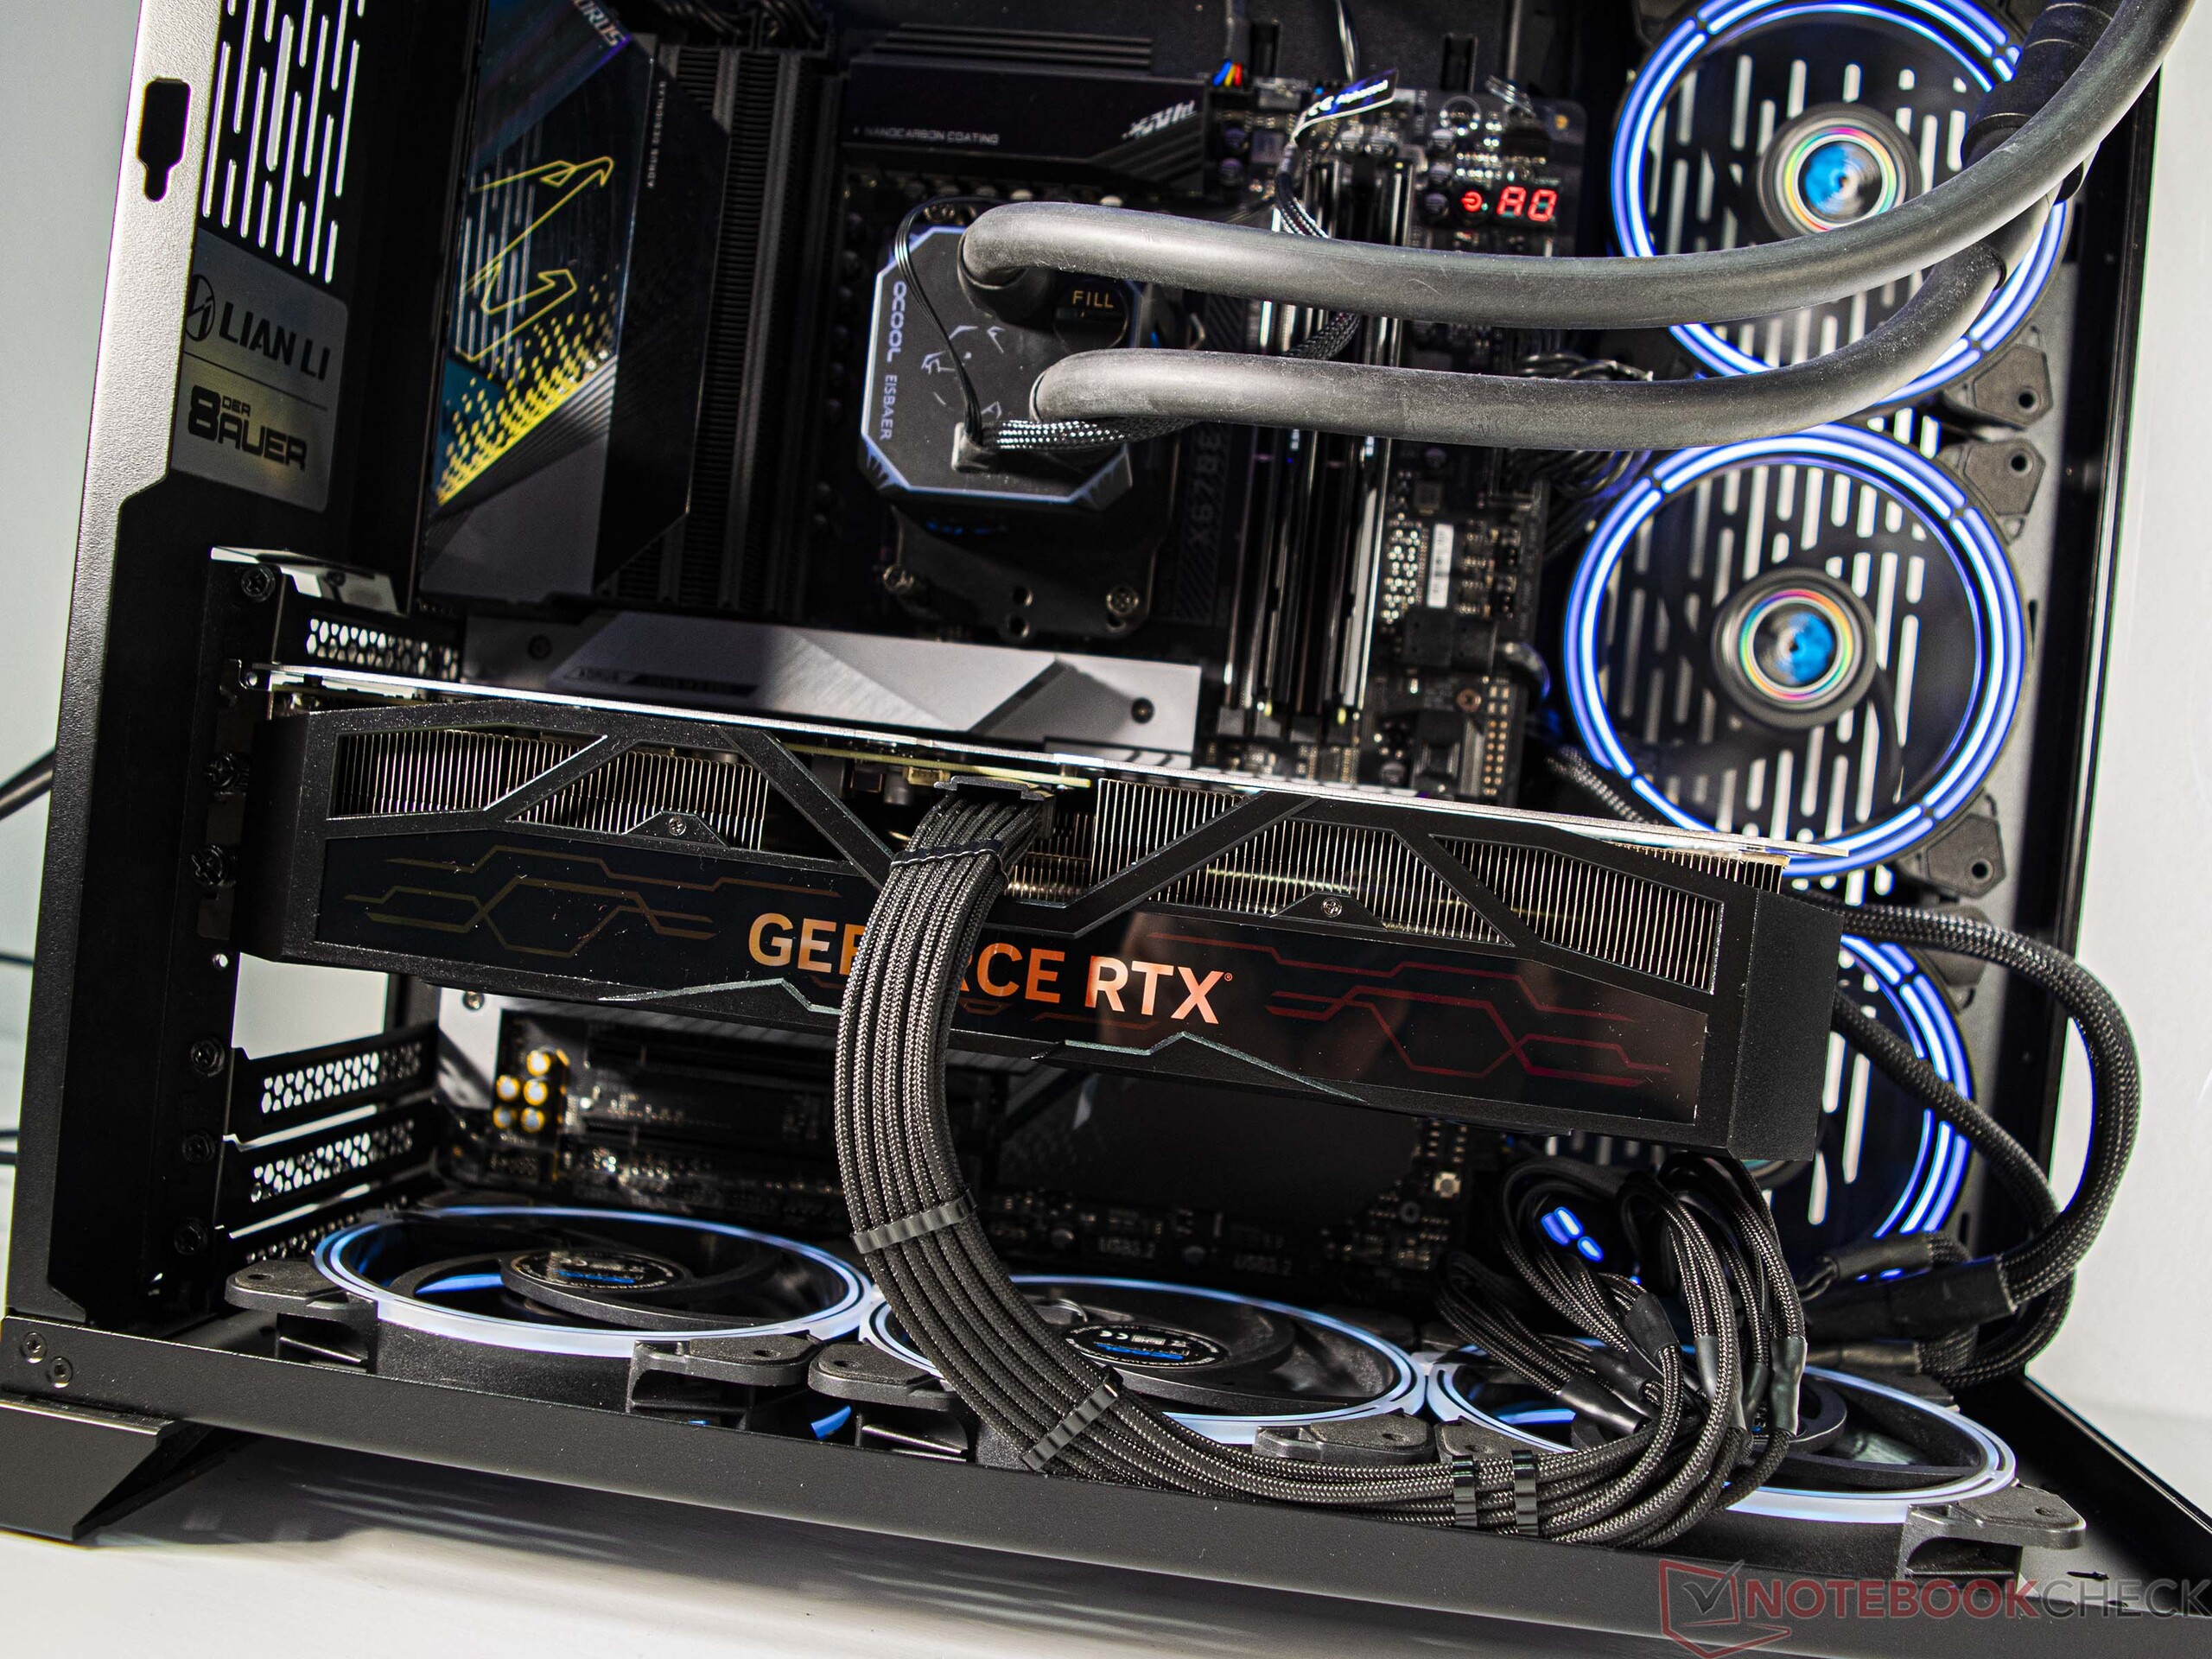
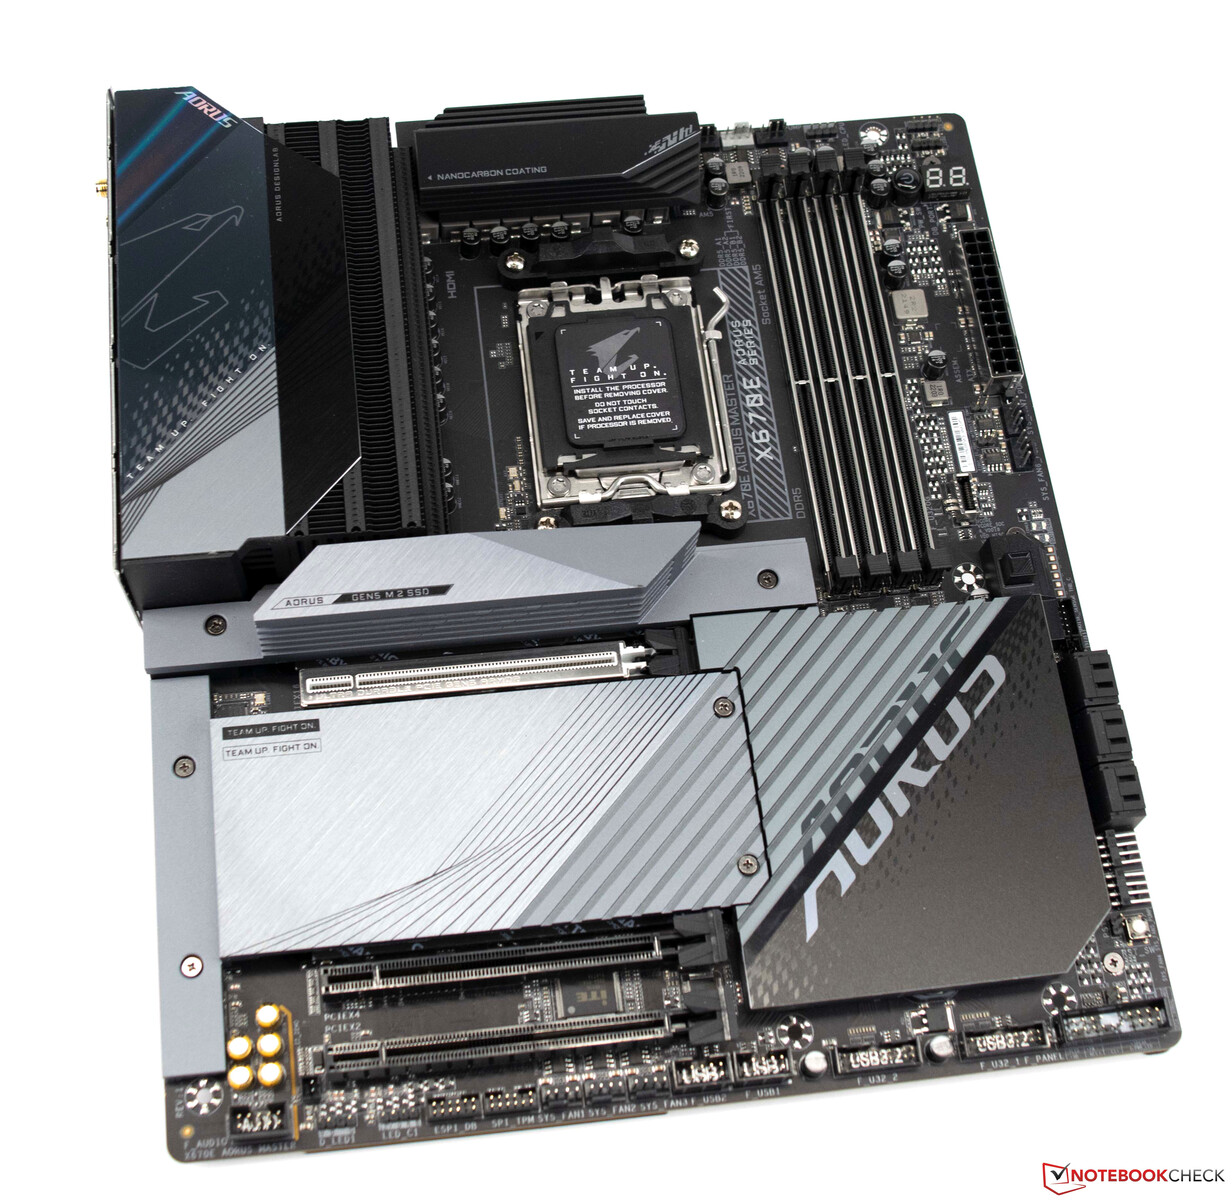
Our test system features a Gigabyte X670E Aorus Master motherboard paired with a high-performance AMD CPU (Ryzen 9 7950X), which is cooled by an Alphacool AIO solution (Alphacool Eisbaer Aurora 360 mm). The system has 32 GB of G.Skill memory running on an appropriate EXPO profile and is connected to a Gigabyte M32U monitor.
Detailed specs of the test system
We used the following system for the benchmarks and tests in this review:
- Lian-Li O11 Dynamic
- AMD Ryzen 9 7950X
- Gigabyte X670E Aorus Master, BIOS: F8a
- Alphacool Eisbear 360 AiO
- Corsair RM 1000x power supply
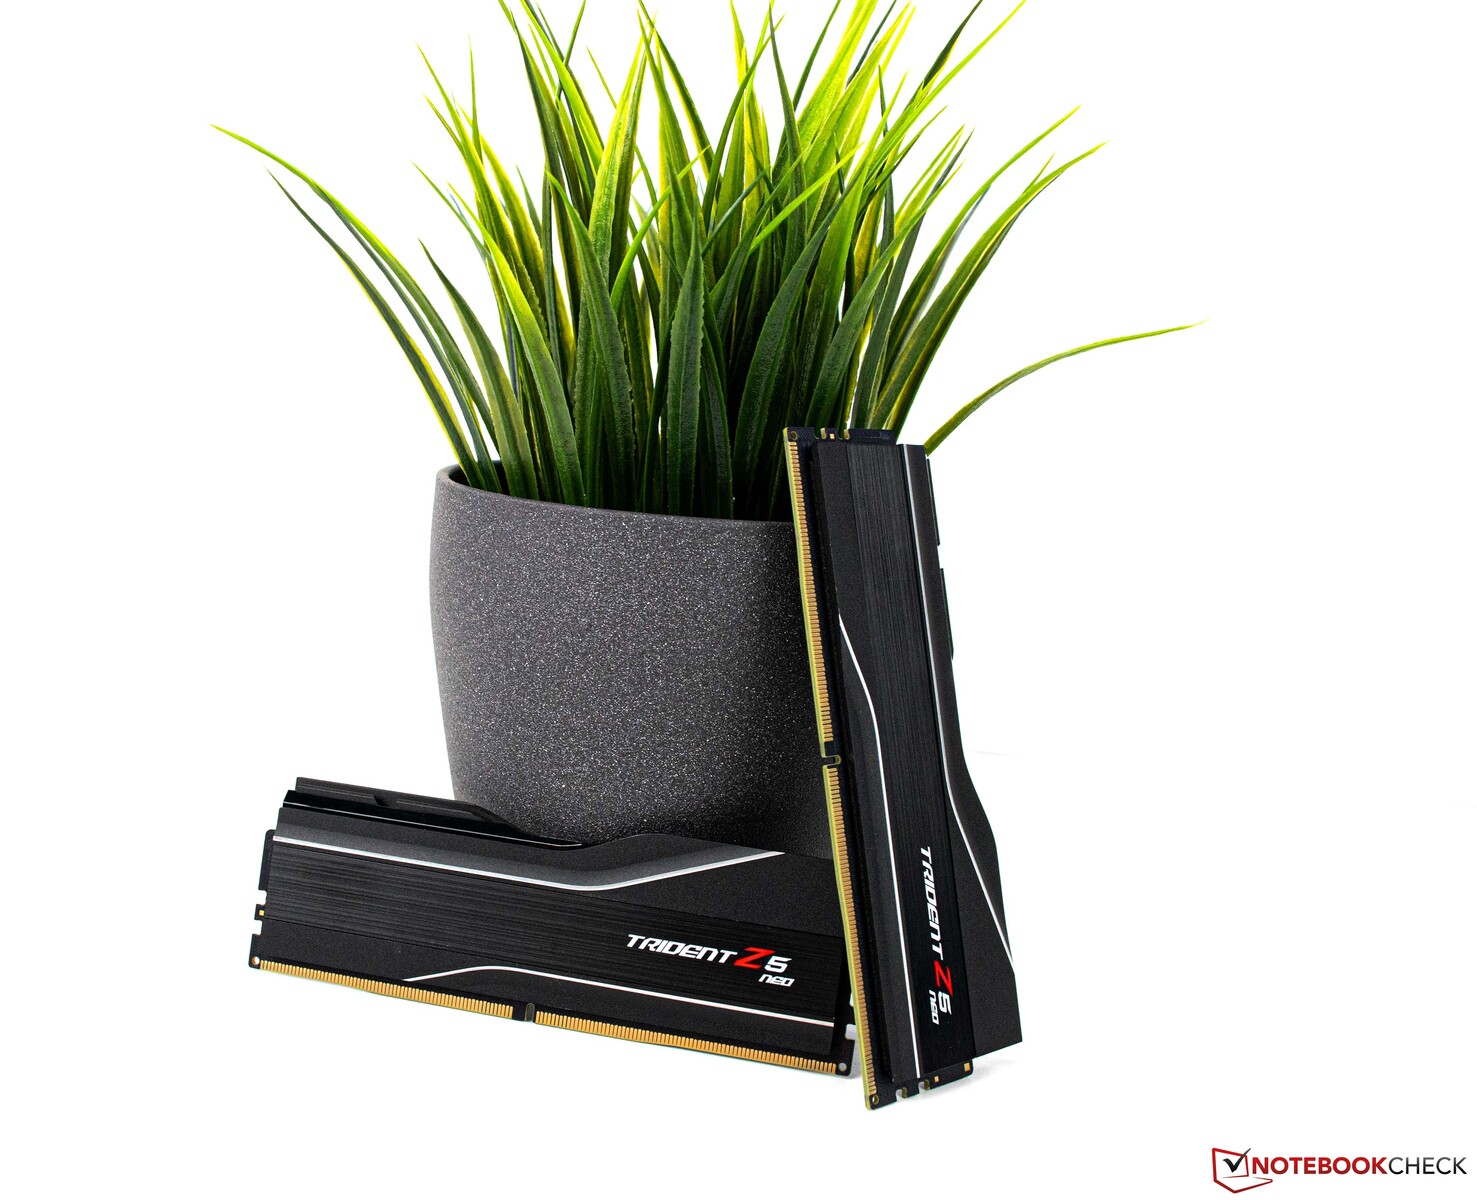
- G.Skill Trident Z5 Neo DDR5-6000 2x 16 GB, EXPO (DDR5-6000 CL30-38-38-96)
- Corsair MP600, 2 TB
- Crucial MX500, 2 TB
- Microsoft Windows 11 Professional 64-Bit (Version 22H2)
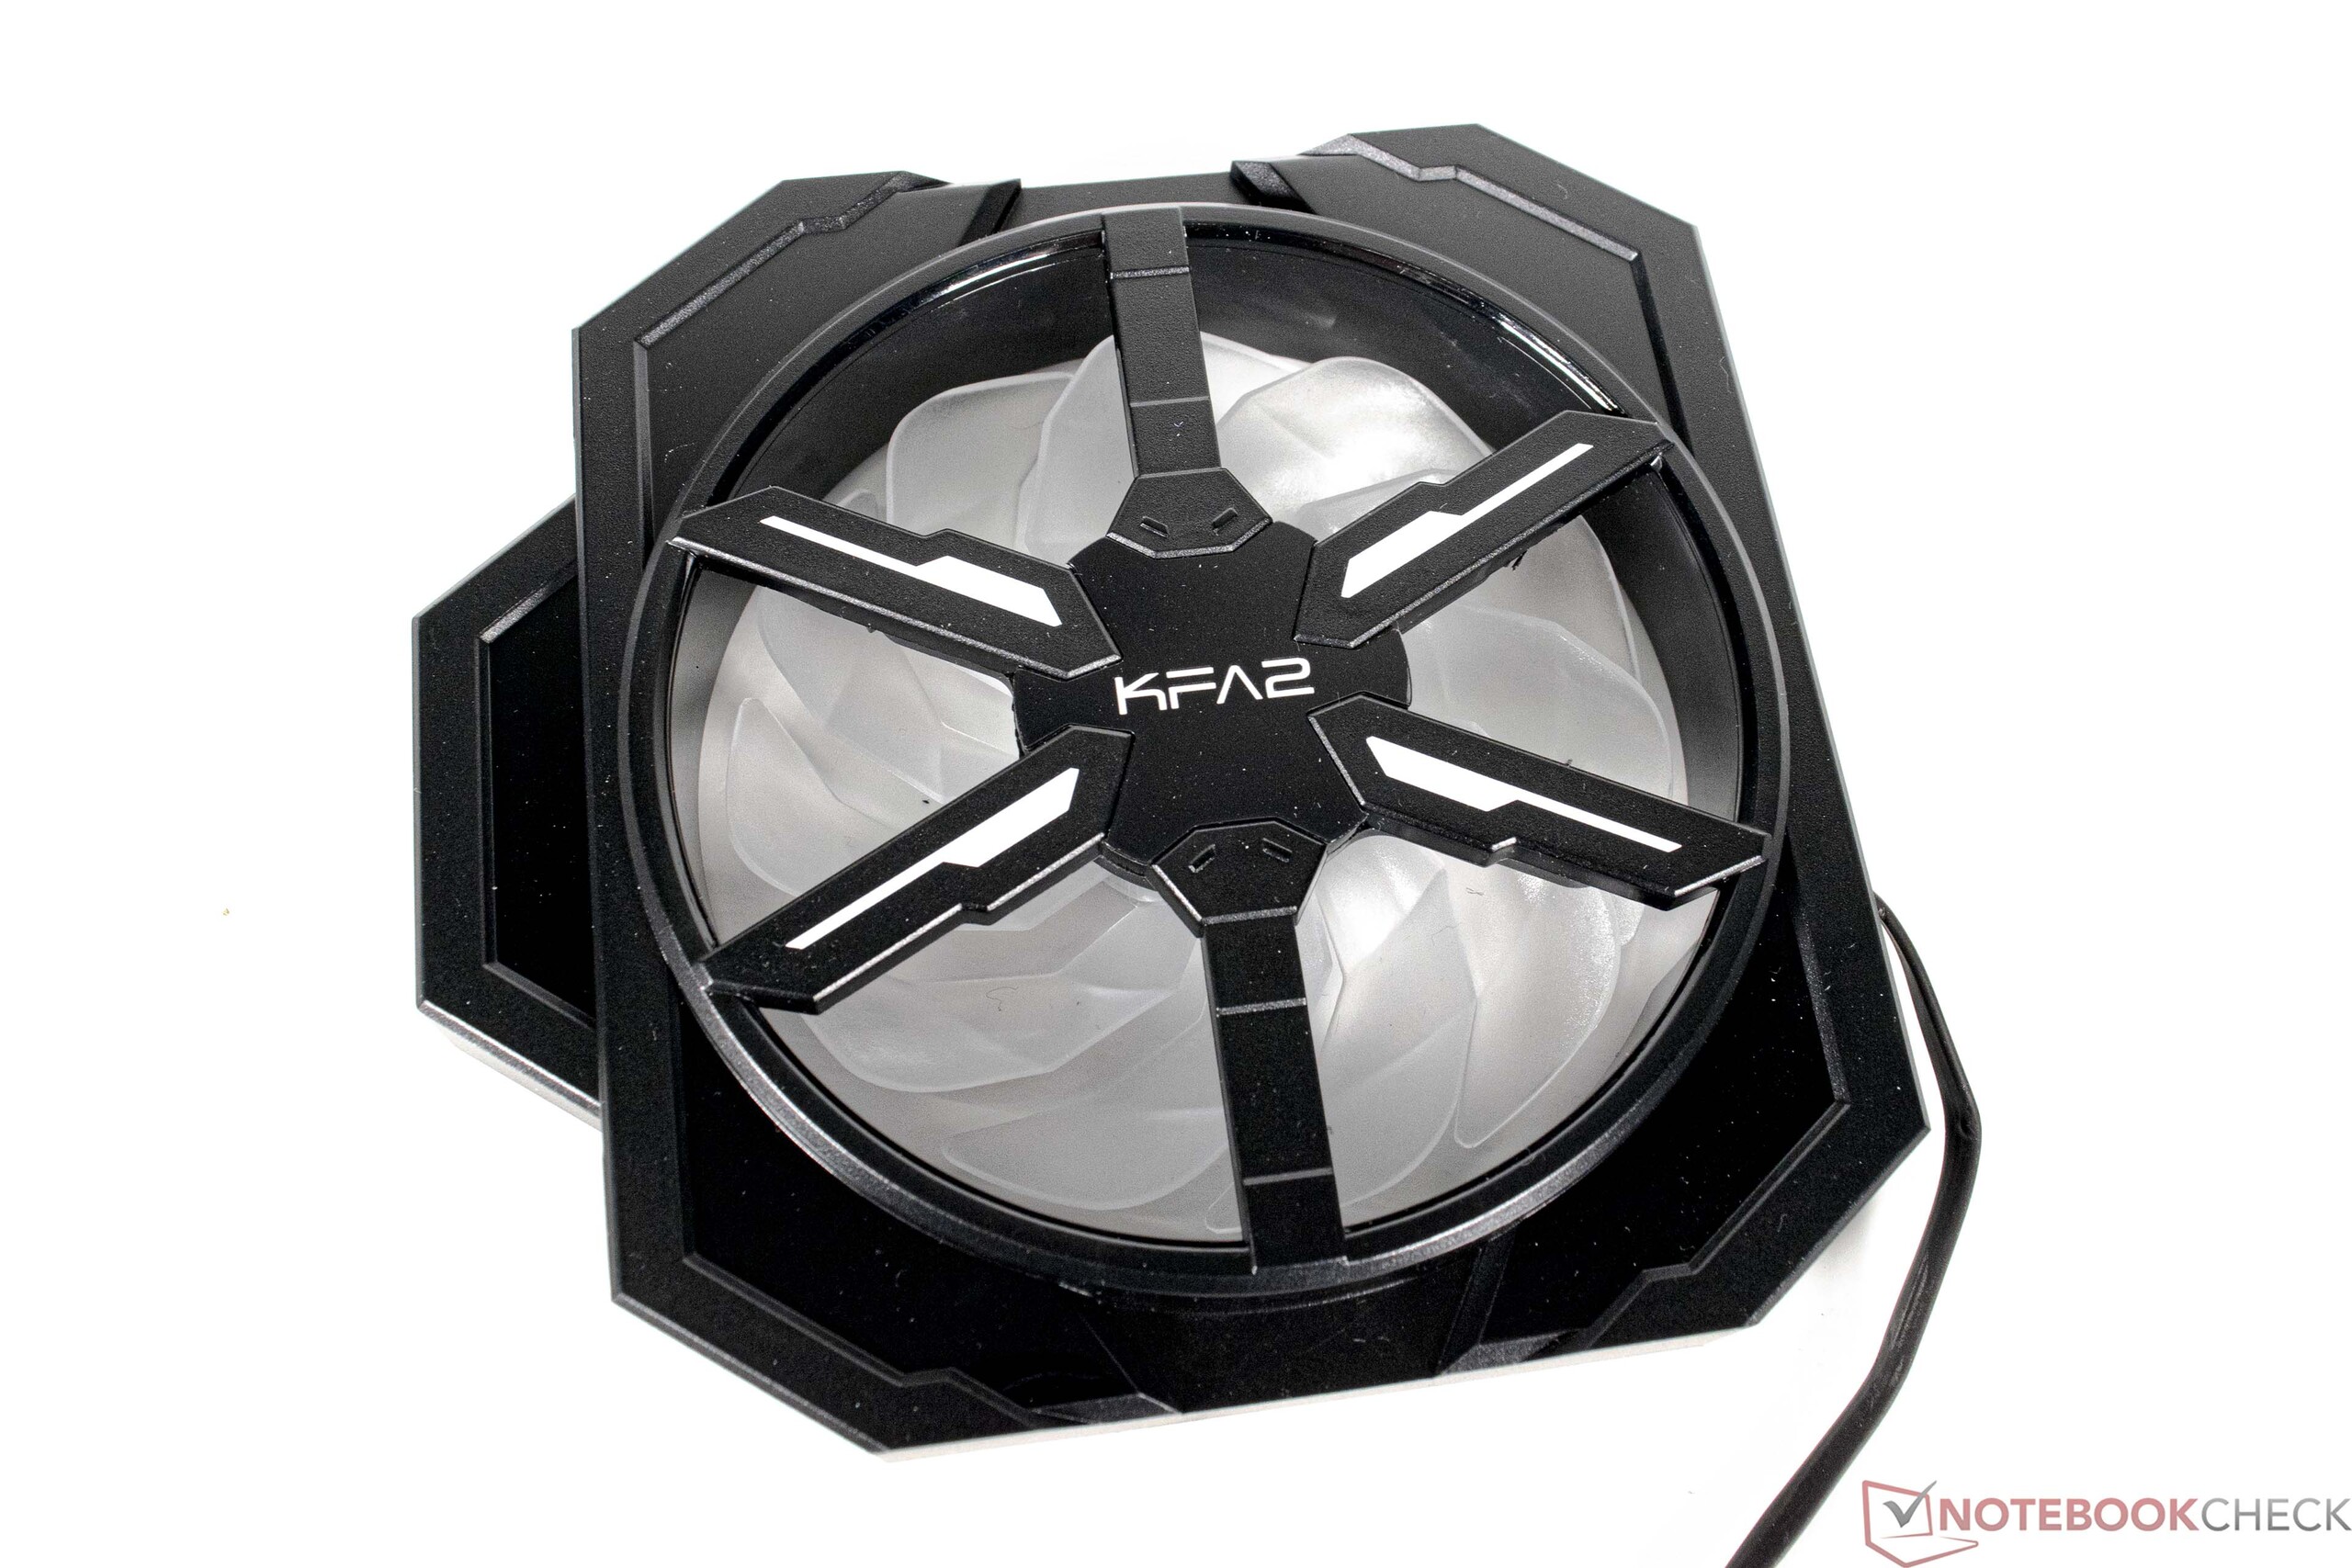
Details on the KFA2 GeForce RTX 4070 Ti SG
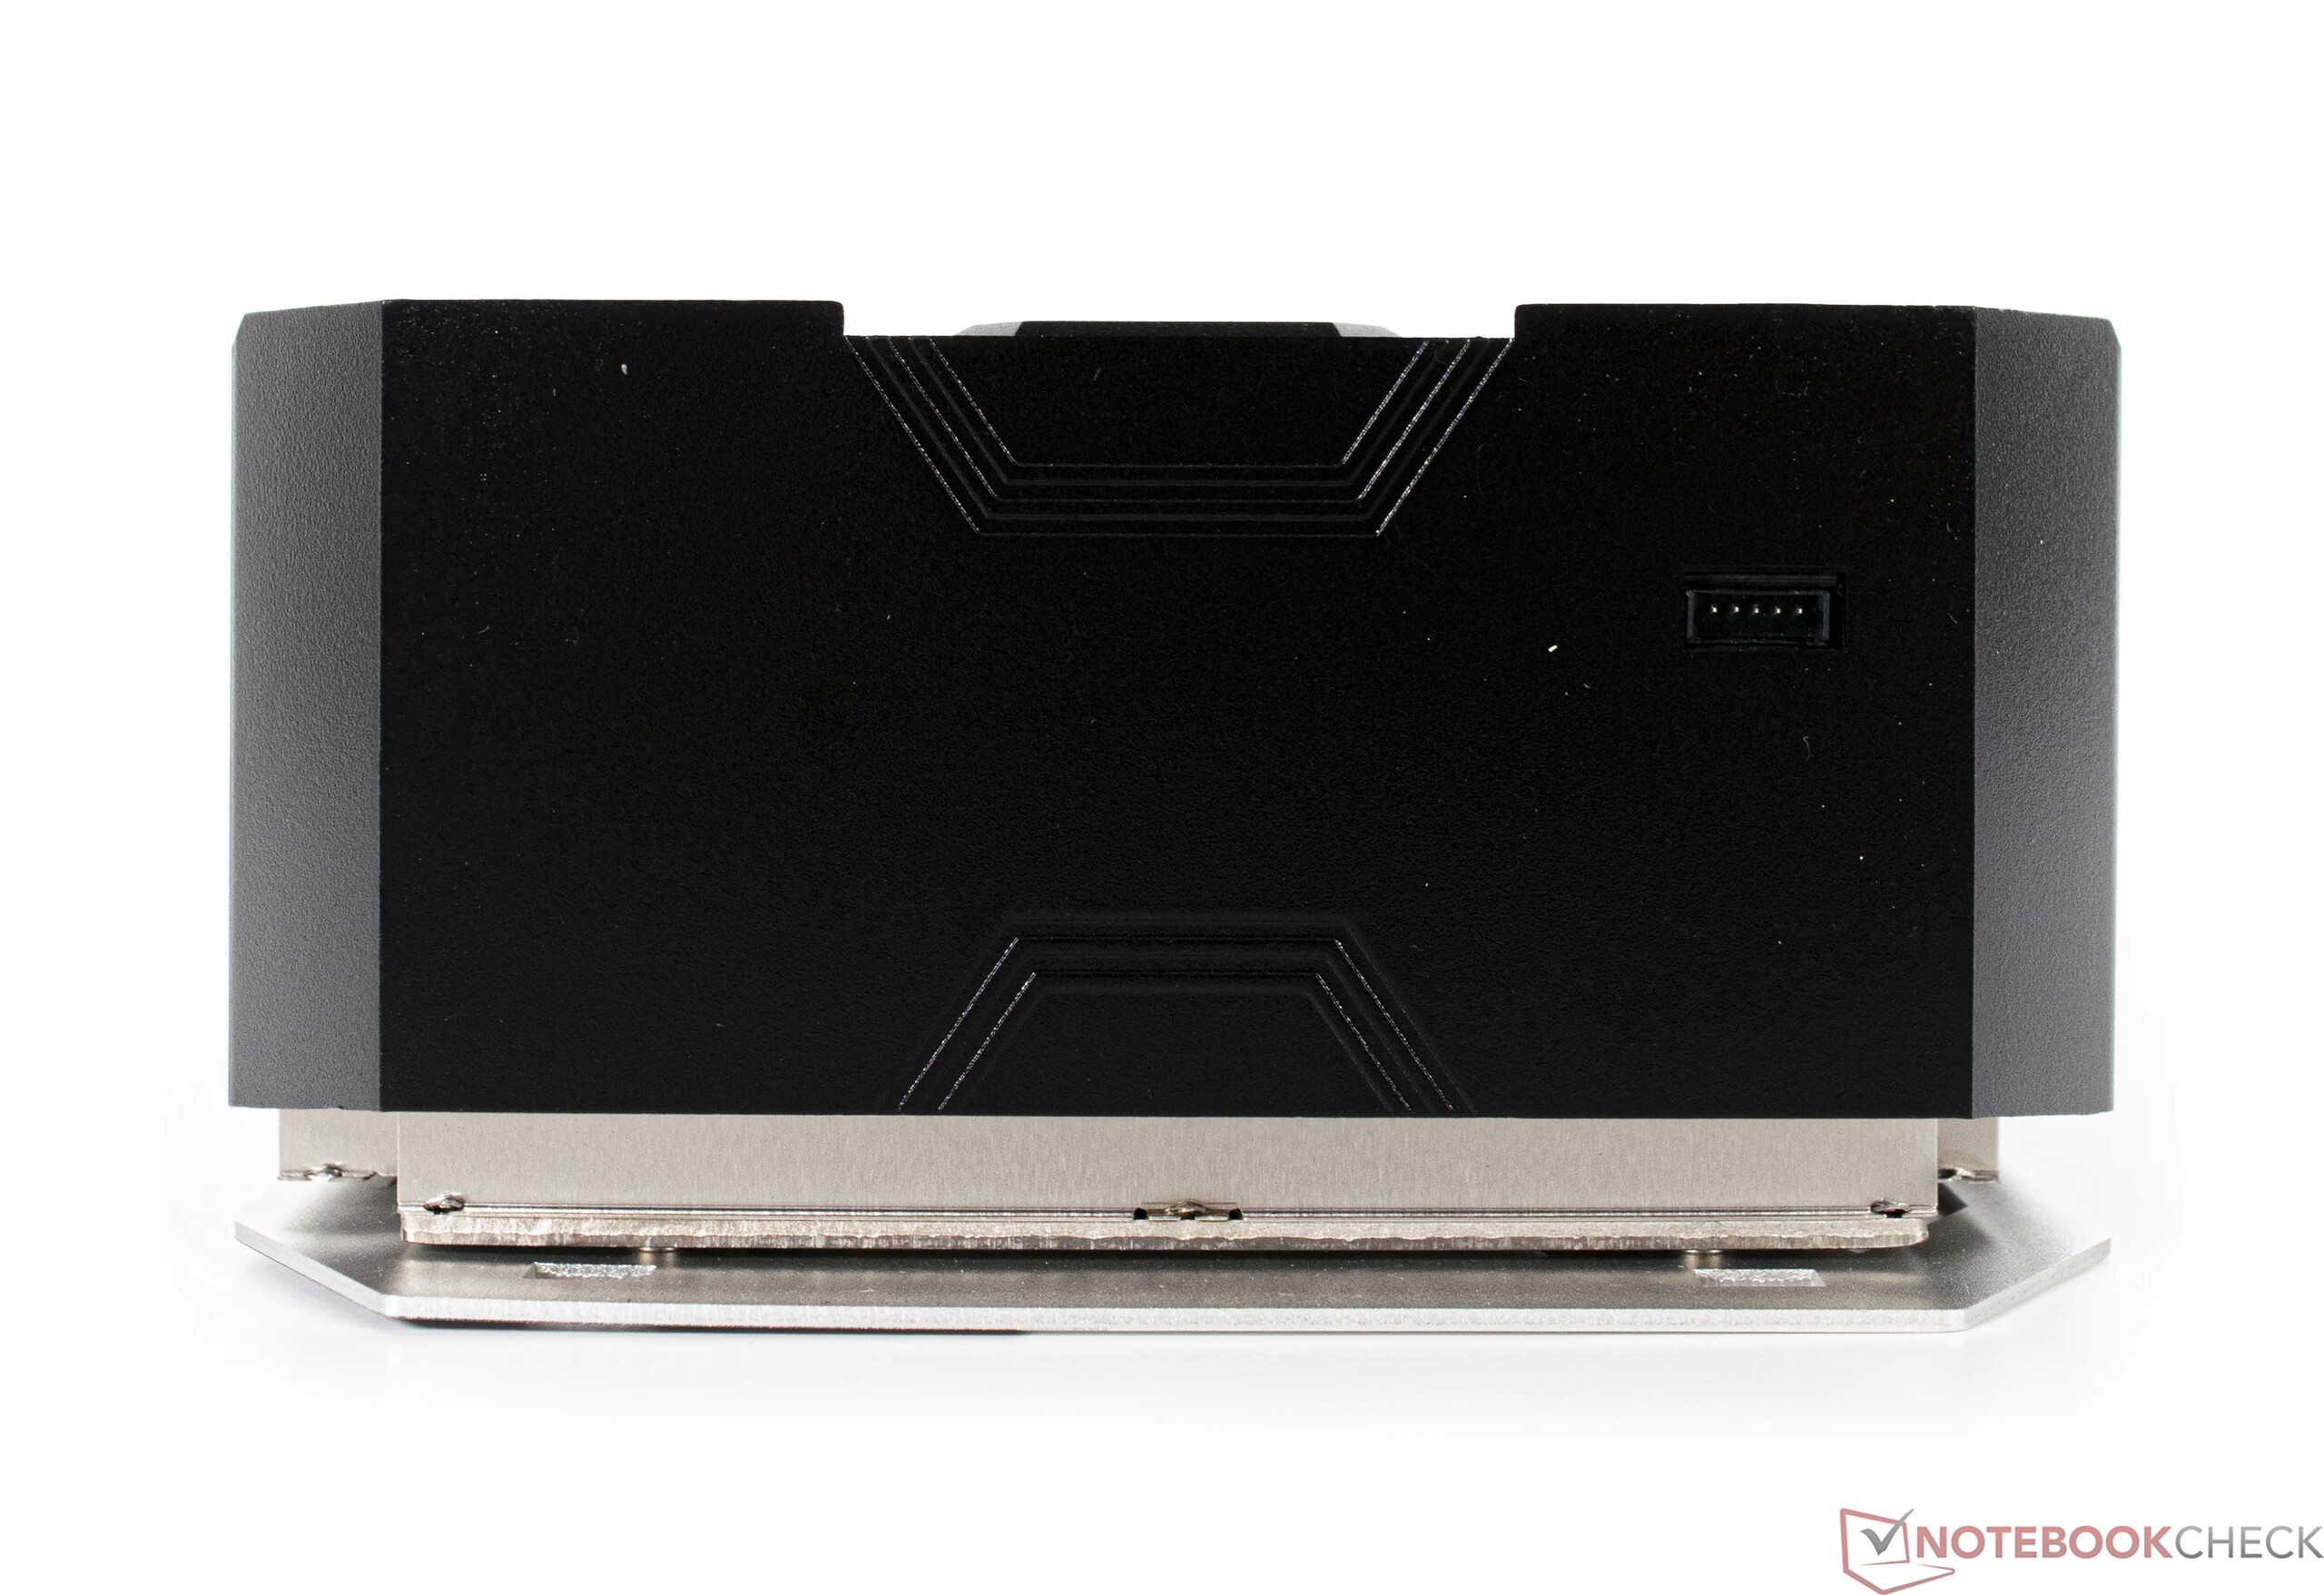
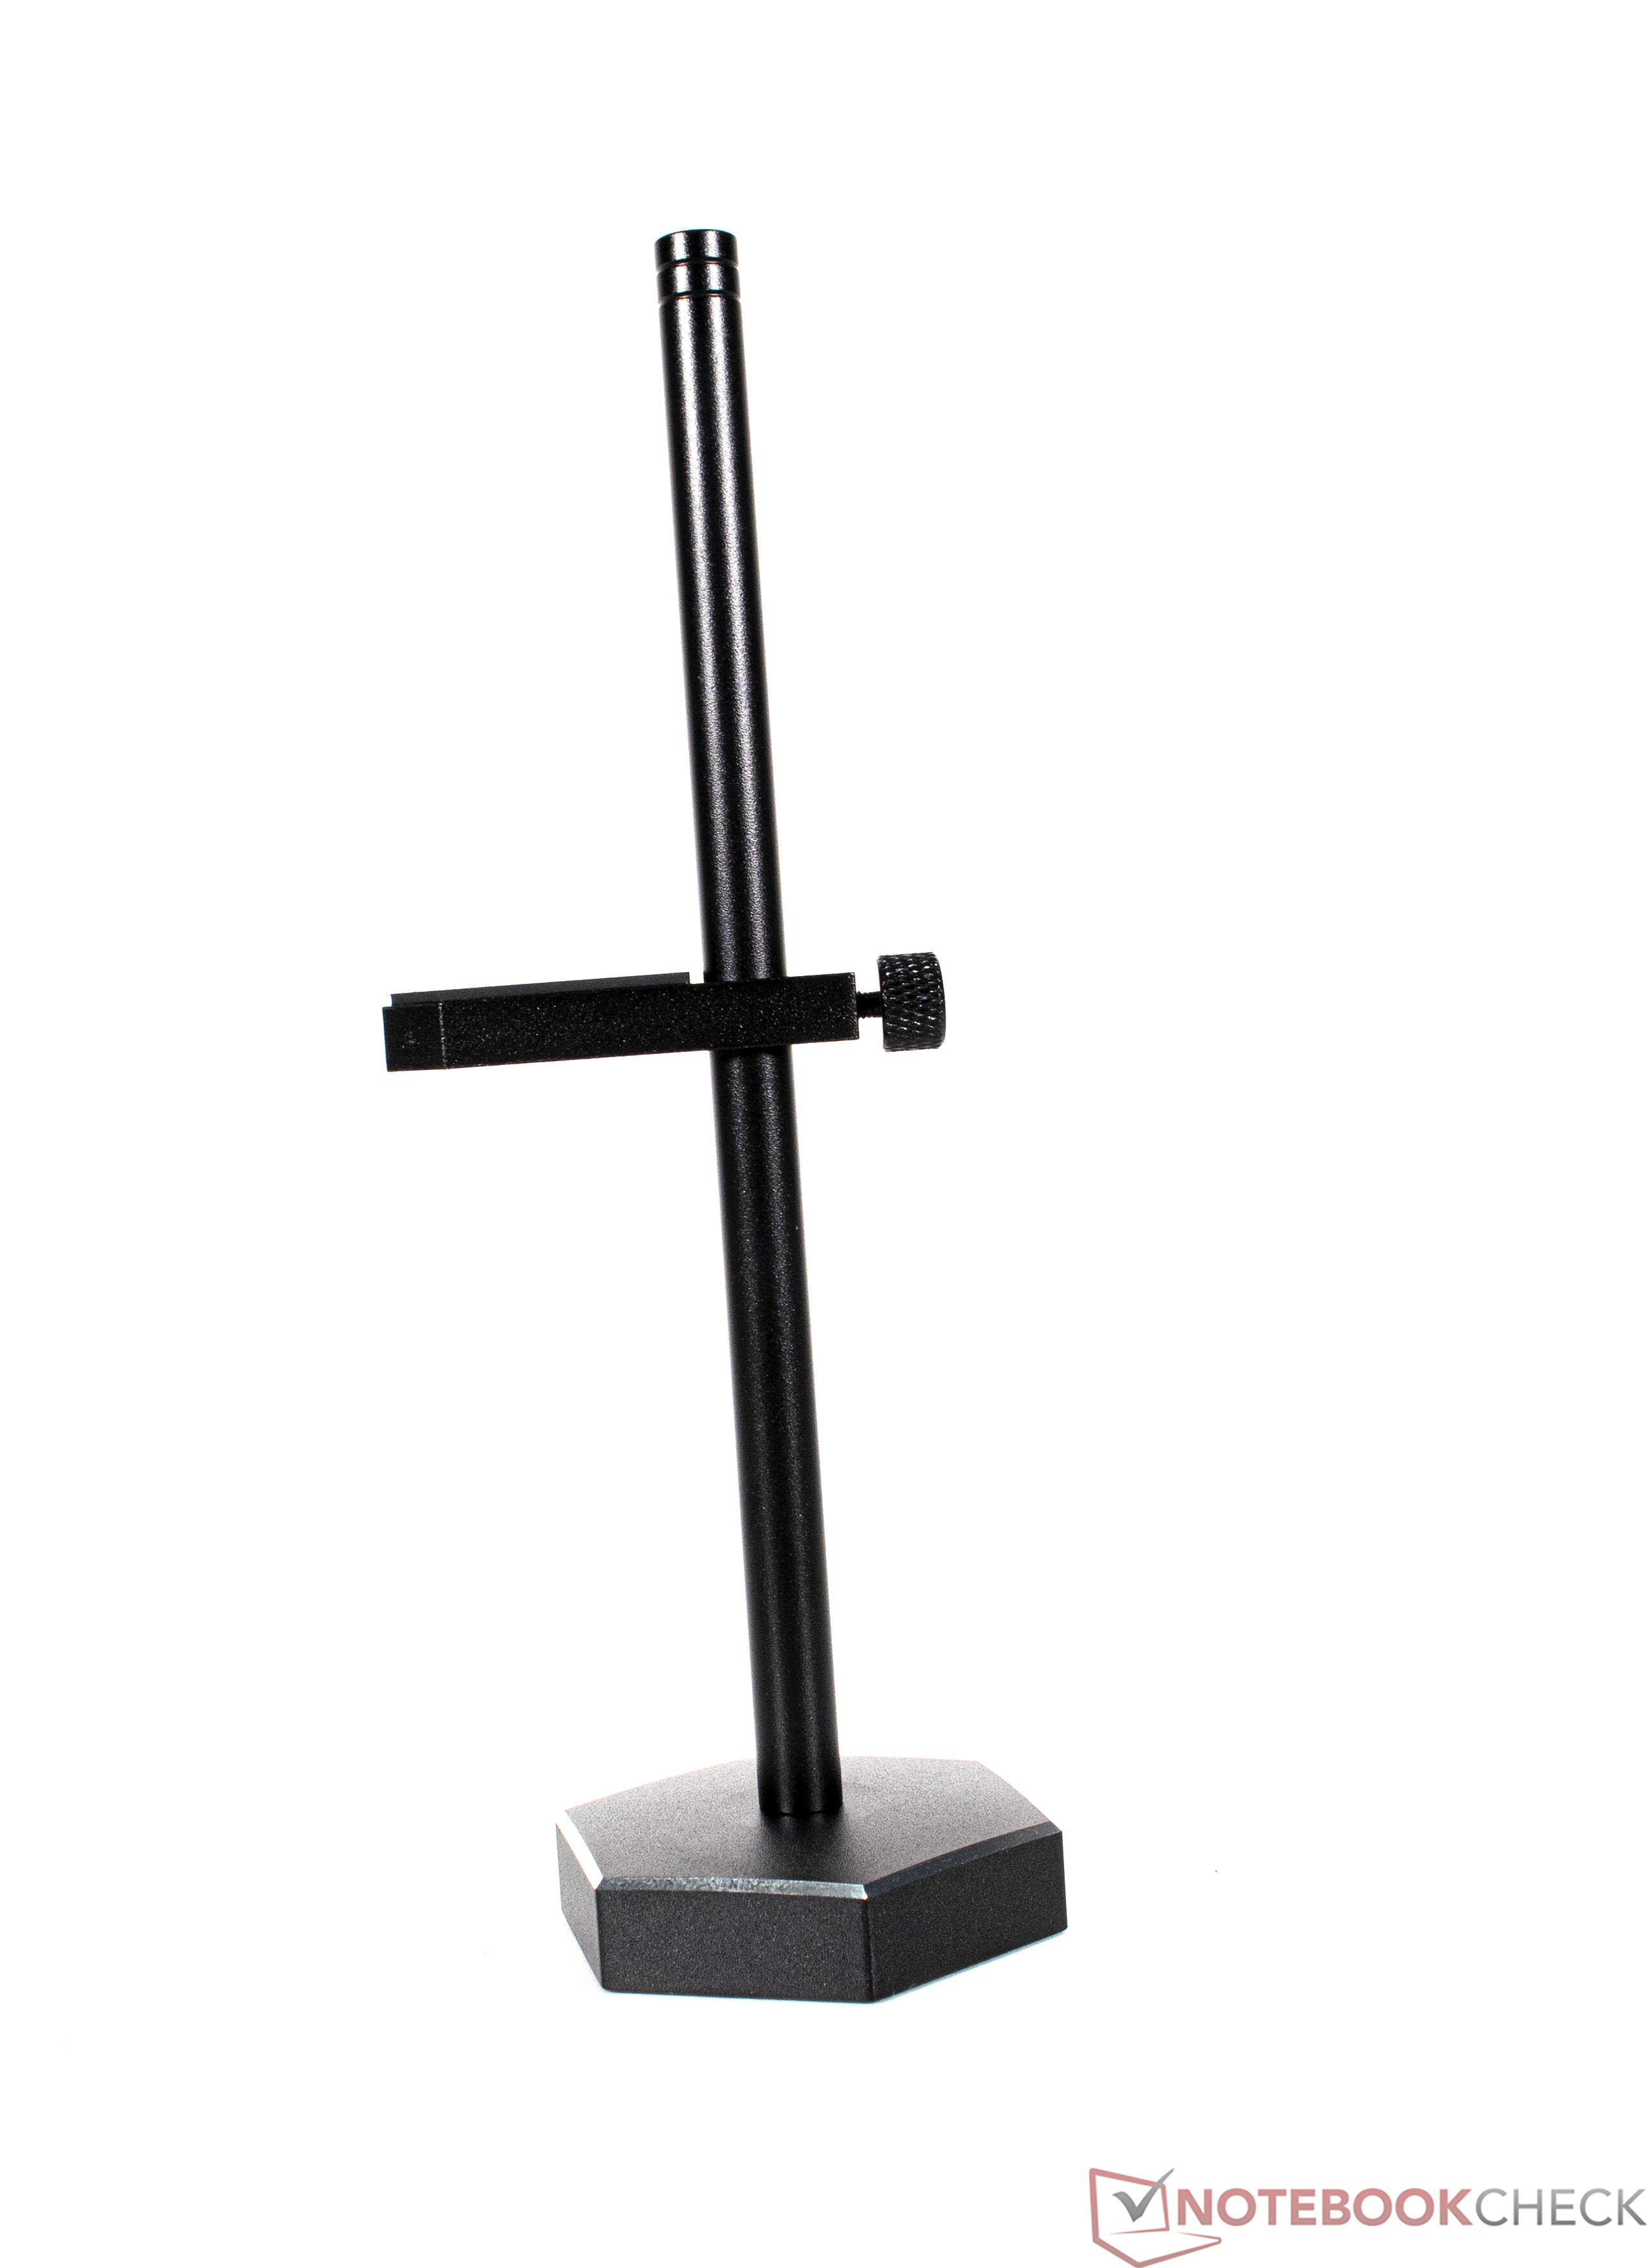
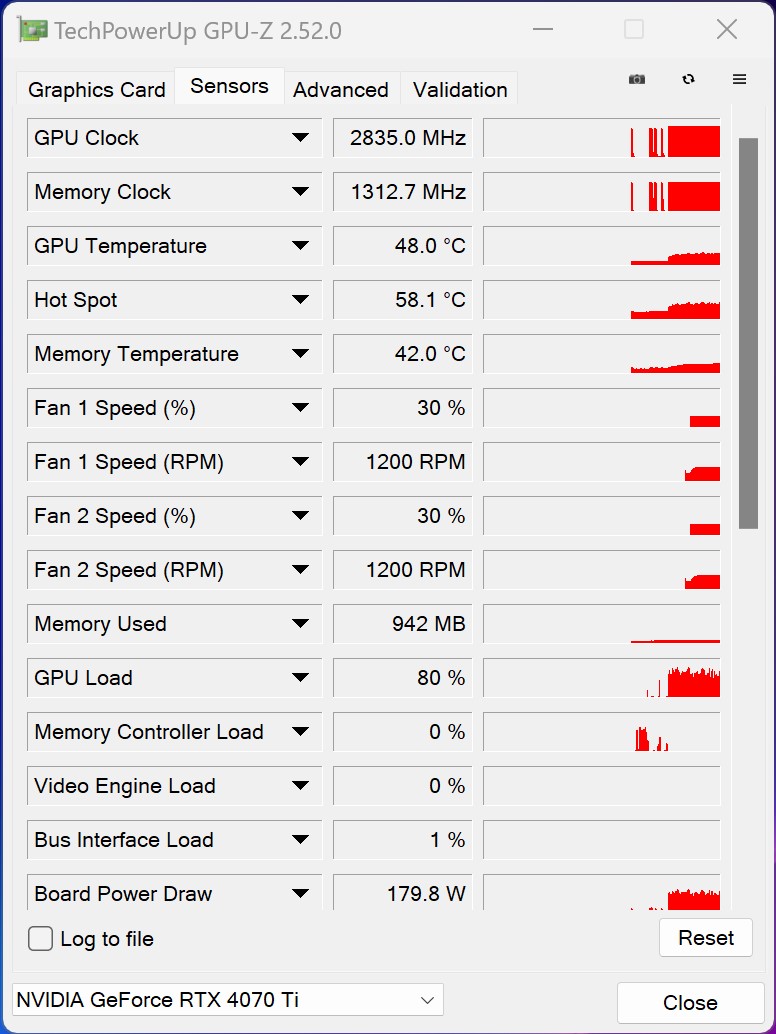
KFA2 has slightly modified the clock speeds of the GeForce RTX 4070 Ti SG compared with Nvidia's specifications. But it is worth noting that there is no Founders Edition of the RTX 4070 Ti. Whilst the base clock remains unchanged, the boost clock on the KFA2 GeForce RTX 4070 Ti SG has been increased by 60 MHz. In practice, this supposed advantage doesn't really have much of an impact. This is because the GPU clock speeds were between 2,775 and 2,835 MHz on average during our gaming tests. The GPU comes with an optional fan that can be installed on the backplate of the unit. Unfortunately, this additional fan is incompatible with our motherboard, thus preventing us from using it in our review. You can avoid this problem by mounting the graphics card vertically. Despite being a very large card, the KFA2 GeForce RTX 4070 Ti SG is relatively lightweight at just 1.5 kg (3.3 lb). Nevertheless, the manufacturer has included a GPU bracket with the card.
Synthetic benchmarks
In the first comparison, we are taking a closer look at how the KFA2 GeForce RTX 4070 Ti SG performs in synthetic benchmarks. As expected, our review unit is ranked below the Nvidia GeForce RTX 4080. It has roughly 20 per cent less performance than the card one tier above it in the RTX 40 Series. The GeForce RTX 4090 is even up to 50 per cent faster than the KFA2 GeForce RTX 4070 Ti SG. That said, you have to keep in mind that these cards are designed for different use cases. As for AMD's lineup, our review unit is comparable to a Radeon RX 7900 XT in terms of performance, though the AMD card is about 10 per cent faster.
Moving on to compute performance: Nvidia takes the lead in some cases, whilst AMD is superior in other instances. There is no clear winner when it comes to pure performance. If high compute performance is your main focus, you should do some research beforehand to determine what software programs you intend to use and which card performs better in those particular applications. As such, we are unable to definitively recommend any particular product.
| Performance rating - Percent | |
| Palit GeForce RTX 4090 GameRock OC | |
| KFA2 GeForce RTX 4090 SG | |
| AMD Radeon RX 7900 XTX | |
| KFA2 GeForce RTX 4080 SG | |
| AMD Radeon RX 7900 XT | |
| KFA2 GeForce RTX 4070 Ti SG | |
| MSI Radeon RX 6950 XT Gaming X Trio | |
| ASUS TUF Gaming GeForce RTX 3080 Ti OC | |
| NVIDIA GeForce RTX 3090 Founders Edition | |
| Sapphire AMD Radeon RX 6950 XT Nitro+ Pure | |
| KFA2 GeForce RTX 3080 SG | |
| Nvidia Titan RTX | |
| KFA2 GeForce RTX 3070 Ti SG | |
| Unigine Heaven 4.0 | |
| Extreme Preset DX11 | |
| Palit GeForce RTX 4090 GameRock OC | |
| KFA2 GeForce RTX 4090 SG | |
| KFA2 GeForce RTX 4080 SG | |
| AMD Radeon RX 7900 XTX | |
| AMD Radeon RX 7900 XT | |
| KFA2 GeForce RTX 4070 Ti SG | |
| MSI Radeon RX 6950 XT Gaming X Trio | |
| ASUS TUF Gaming GeForce RTX 3080 Ti OC | |
| NVIDIA GeForce RTX 3090 Founders Edition | |
| Sapphire AMD Radeon RX 6950 XT Nitro+ Pure | |
| KFA2 GeForce RTX 3080 SG | |
| Nvidia Titan RTX | |
| KFA2 GeForce RTX 3070 Ti SG | |
| Extreme Preset OpenGL | |
| Palit GeForce RTX 4090 GameRock OC | |
| KFA2 GeForce RTX 4090 SG | |
| KFA2 GeForce RTX 4080 SG | |
| AMD Radeon RX 7900 XTX | |
| AMD Radeon RX 7900 XT | |
| KFA2 GeForce RTX 4070 Ti SG | |
| ASUS TUF Gaming GeForce RTX 3080 Ti OC | |
| NVIDIA GeForce RTX 3090 Founders Edition | |
| MSI Radeon RX 6950 XT Gaming X Trio | |
| KFA2 GeForce RTX 3080 SG | |
| Sapphire AMD Radeon RX 6950 XT Nitro+ Pure | |
| KFA2 GeForce RTX 3070 Ti SG | |
| Nvidia Titan RTX | |
| Unigine Valley 1.0 | |
| 1920x1080 Extreme HD DirectX AA:x8 | |
| KFA2 GeForce RTX 4090 SG | |
| Palit GeForce RTX 4090 GameRock OC | |
| AMD Radeon RX 7900 XTX | |
| KFA2 GeForce RTX 4080 SG | |
| AMD Radeon RX 7900 XT | |
| MSI Radeon RX 6950 XT Gaming X Trio | |
| ASUS TUF Gaming GeForce RTX 3080 Ti OC | |
| NVIDIA GeForce RTX 3090 Founders Edition | |
| KFA2 GeForce RTX 4070 Ti SG | |
| Sapphire AMD Radeon RX 6950 XT Nitro+ Pure | |
| KFA2 GeForce RTX 3080 SG | |
| KFA2 GeForce RTX 3070 Ti SG | |
| Nvidia Titan RTX | |
| 1920x1080 Extreme HD Preset OpenGL AA:x8 | |
| Palit GeForce RTX 4090 GameRock OC | |
| KFA2 GeForce RTX 4090 SG | |
| AMD Radeon RX 7900 XTX | |
| KFA2 GeForce RTX 4080 SG | |
| AMD Radeon RX 7900 XT | |
| ASUS TUF Gaming GeForce RTX 3080 Ti OC | |
| NVIDIA GeForce RTX 3090 Founders Edition | |
| KFA2 GeForce RTX 4070 Ti SG | |
| MSI Radeon RX 6950 XT Gaming X Trio | |
| KFA2 GeForce RTX 3080 SG | |
| Sapphire AMD Radeon RX 6950 XT Nitro+ Pure | |
| KFA2 GeForce RTX 3070 Ti SG | |
| Nvidia Titan RTX | |
| 3DMark 11 | |
| 1280x720 Performance GPU | |
| Palit GeForce RTX 4090 GameRock OC | |
| KFA2 GeForce RTX 4090 SG | |
| KFA2 GeForce RTX 4080 SG | |
| AMD Radeon RX 7900 XTX | |
| AMD Radeon RX 7900 XT | |
| KFA2 GeForce RTX 4070 Ti SG | |
| MSI Radeon RX 6950 XT Gaming X Trio | |
| Sapphire AMD Radeon RX 6950 XT Nitro+ Pure | |
| NVIDIA GeForce RTX 3090 Founders Edition | |
| ASUS TUF Gaming GeForce RTX 3080 Ti OC | |
| KFA2 GeForce RTX 3080 SG | |
| Nvidia Titan RTX | |
| KFA2 GeForce RTX 3070 Ti SG | |
| 1280x720 Performance | |
| Palit GeForce RTX 4090 GameRock OC | |
| KFA2 GeForce RTX 4090 SG | |
| KFA2 GeForce RTX 4080 SG | |
| KFA2 GeForce RTX 4070 Ti SG | |
| AMD Radeon RX 7900 XTX | |
| AMD Radeon RX 7900 XT | |
| MSI Radeon RX 6950 XT Gaming X Trio | |
| ASUS TUF Gaming GeForce RTX 3080 Ti OC | |
| NVIDIA GeForce RTX 3090 Founders Edition | |
| Nvidia Titan RTX | |
| Sapphire AMD Radeon RX 6950 XT Nitro+ Pure | |
| KFA2 GeForce RTX 3070 Ti SG | |
| KFA2 GeForce RTX 3080 SG | |
Compute benchmarks and professional applications
| LuxMark v2.0 64Bit | |
| Sala GPUs-only | |
| Sapphire AMD Radeon RX 6950 XT Nitro+ Pure | |
| Palit GeForce RTX 4090 GameRock OC | |
| KFA2 GeForce RTX 4090 SG | |
| KFA2 GeForce RTX 4080 SG | |
| KFA2 GeForce RTX 4070 Ti SG | |
| ASUS TUF Gaming GeForce RTX 3080 Ti OC | |
| AMD Radeon RX 7900 XTX | |
| NVIDIA GeForce RTX 3090 Founders Edition | |
| KFA2 GeForce RTX 3080 SG | |
| AMD Radeon RX 7900 XT | |
| MSI Radeon RX 6950 XT Gaming X Trio | |
| KFA2 GeForce RTX 3070 Ti SG | |
| Nvidia Titan RTX | |
| Room GPUs-only | |
| Palit GeForce RTX 4090 GameRock OC | |
| KFA2 GeForce RTX 4090 SG | |
| KFA2 GeForce RTX 4080 SG | |
| KFA2 GeForce RTX 4070 Ti SG | |
| NVIDIA GeForce RTX 3090 Founders Edition | |
| ASUS TUF Gaming GeForce RTX 3080 Ti OC | |
| KFA2 GeForce RTX 3080 SG | |
| AMD Radeon RX 7900 XTX | |
| Sapphire AMD Radeon RX 6950 XT Nitro+ Pure | |
| Nvidia Titan RTX | |
| KFA2 GeForce RTX 3070 Ti SG | |
| AMD Radeon RX 7900 XT | |
| MSI Radeon RX 6950 XT Gaming X Trio | |
| Blender | |
| v3.3 Classroom CUDA | |
| KFA2 GeForce RTX 3070 Ti SG | |
| Nvidia Titan RTX | |
| ASUS TUF Gaming GeForce RTX 3080 Ti OC | |
| v3.3 Classroom OPTIX/RTX | |
| Nvidia Titan RTX | |
| KFA2 GeForce RTX 3070 Ti SG | |
| ASUS TUF Gaming GeForce RTX 3080 Ti OC | |
| KFA2 GeForce RTX 4070 Ti SG | |
| KFA2 GeForce RTX 4080 SG | |
| Geekbench 5.5 | |
| OpenCL Score | |
| Palit GeForce RTX 4090 GameRock OC | |
| KFA2 GeForce RTX 4090 SG | |
| KFA2 GeForce RTX 4080 SG | |
| NVIDIA GeForce RTX 3090 Founders Edition | |
| KFA2 GeForce RTX 4070 Ti SG | |
| KFA2 GeForce RTX 3080 SG | |
| Sapphire AMD Radeon RX 6950 XT Nitro+ Pure | |
| Nvidia Titan RTX | |
| Vulkan Score 5.5 | |
| Palit GeForce RTX 4090 GameRock OC | |
| KFA2 GeForce RTX 4090 SG | |
| KFA2 GeForce RTX 4070 Ti SG | |
| Nvidia Titan RTX | |
| NVIDIA GeForce RTX 3090 Founders Edition | |
| Sapphire AMD Radeon RX 6950 XT Nitro+ Pure | |
| KFA2 GeForce RTX 3080 SG | |
| V-Ray 5 Benchmark | |
| GPU CUDA | |
| Palit GeForce RTX 4090 GameRock OC | |
| KFA2 GeForce RTX 4090 SG | |
| KFA2 GeForce RTX 4080 SG | |
| KFA2 GeForce RTX 4070 Ti SG | |
| NVIDIA GeForce RTX 3090 Founders Edition | |
| ASUS TUF Gaming GeForce RTX 3080 Ti OC | |
| KFA2 GeForce RTX 3070 Ti SG | |
| KFA2 GeForce RTX 3080 SG | |
| Sapphire AMD Radeon RX 6950 XT Nitro+ Pure | |
| GPU RTX | |
| Palit GeForce RTX 4090 GameRock OC | |
| KFA2 GeForce RTX 4090 SG | |
| KFA2 GeForce RTX 4080 SG | |
| KFA2 GeForce RTX 4070 Ti SG | |
| NVIDIA GeForce RTX 3090 Founders Edition | |
| ASUS TUF Gaming GeForce RTX 3080 Ti OC | |
| KFA2 GeForce RTX 3070 Ti SG | |
| Affinity Photo 2 - Combined (Single / Multi GPU) | |
| KFA2 GeForce RTX 4070 Ti SG | |
| Palit GeForce RTX 4090 GameRock OC | |
| KFA2 GeForce RTX 4080 SG | |
| ASUS TUF Gaming GeForce RTX 3080 Ti OC | |
| KFA2 GeForce RTX 3070 Ti SG | |
| Nvidia Titan RTX | |
| MSI Radeon RX 6950 XT Gaming X Trio | |
| AMD Radeon RX 7900 XTX | |
| AMD Radeon RX 7900 XT | |
* ... smaller is better
Gaming benchmarks
Our gaming tests encompass everything from older titles released in 2015 to recent games. The performance of the KFA2 GeForce RTX 4070 Ti SG (which we have already seen during the synthetic benchmarks) was likewise well utilised during our realistic gaming tests. The performance gap between the review unit and the faster models (RTX 4080 and RTX 4090) is sometimes very obvious and widens considerably at resolutions above 1440p. The reason for this is the comparably low memory bandwidth owing to the 192-bit memory bus. We think the RTX 4070 Ti is more suited to gaming at Full HD or QHD. The KFA2 GeForce RTX 4070 Ti SG can likewise deliver WQHD gaming with ease. This is where the RTX 4070 Ti feels most at home, and the performance hits caused by the narrow memory bus are negligible in this case. When it comes to AMD cards, the small Ada Lovelace GPU is competing more or less with a Radeon RX 7900 XT. The AMD graphics card has a slight edge over the RTX 4070 Ti, but the difference always depends on the game in question. For instance, Call of Duty: Modern Warfare 2 (2022) runs exceptionally well on AMD graphics cards, whereas the Nvidia is ahead in F1 22. We didn't notice any immediate drawbacks caused by the lower amount of VRAM in the RTX 4070 Ti. Nevertheless, having 20 GB of memory affords the Radeon RX 7900 XT substantially more headroom for it to potentially outperform its Nvidia competitors in future.
Once we enable lighting effects like ray tracing, the situation changes somewhat. We found that the RTX 4070 Ti delivered great performance – sometimes even better than what the Radeon RX 7900 XTX is capable of. That said, this similarly depends heavily on the game in question. Enabling DLSS 3.0 (including Frame Generation) can further increase the performance of Nvidia cards by a significant margin in a lot of games. Click here to see a list of games that support DLSS 3.0 now or will support the feature in future. FSR 3.0, AMD's answer to DLSS, is scheduled to arrive this year and should likewise provide a substantial performance boost. But this is just pure speculation right now, and ultimately tests must be performed to determine whether AMD can catch up with Nvidia. At this point, though, Nvidia undoubtedly offers the better overall concept with the current RTX 40 Series GPUs and is simply in a league of its own when it comes to ray tracing.
| The Witcher 3 | |
| 3840x2160 High Graphics & Postprocessing (Nvidia HairWorks Off) | |
| KFA2 GeForce RTX 4090 SG | |
| KFA2 GeForce RTX 4080 SG | |
| AMD Radeon RX 7900 XTX | |
| AMD Radeon RX 7900 XT | |
| NVIDIA GeForce RTX 3090 Founders Edition | |
| ASUS TUF Gaming GeForce RTX 3080 Ti OC | |
| KFA2 GeForce RTX 4070 Ti SG | |
| MSI Radeon RX 6950 XT Gaming X Trio | |
| KFA2 GeForce RTX 3070 Ti SG | |
| Nvidia Titan RTX | |
| AMD Radeon RX 6800 | |
| 1920x1080 Ultra Graphics & Postprocessing (HBAO+) | |
| KFA2 GeForce RTX 4090 SG | |
| AMD Radeon RX 7900 XTX | |
| KFA2 GeForce RTX 4080 SG | |
| AMD Radeon RX 7900 XT | |
| MSI Radeon RX 6950 XT Gaming X Trio | |
| KFA2 GeForce RTX 4070 Ti SG | |
| NVIDIA GeForce RTX 3090 Founders Edition | |
| ASUS TUF Gaming GeForce RTX 3080 Ti OC | |
| AMD Radeon RX 6800 | |
| Nvidia Titan RTX | |
| KFA2 GeForce RTX 3070 Ti SG | |
| Metro Exodus | |
| 3840x2160 Ultra Quality AF:16x | |
| KFA2 GeForce RTX 4090 SG | |
| KFA2 GeForce RTX 4080 SG | |
| AMD Radeon RX 7900 XTX | |
| AMD Radeon RX 7900 XT | |
| KFA2 GeForce RTX 4070 Ti SG | |
| MSI Radeon RX 6950 XT Gaming X Trio | |
| ASUS TUF Gaming GeForce RTX 3080 Ti OC | |
| NVIDIA GeForce RTX 3090 Founders Edition | |
| Nvidia Titan RTX | |
| AMD Radeon RX 6800 | |
| KFA2 GeForce RTX 3070 Ti SG | |
| 2560x1440 Ultra Quality AF:16x | |
| KFA2 GeForce RTX 4090 SG | |
| AMD Radeon RX 7900 XTX | |
| KFA2 GeForce RTX 4080 SG | |
| AMD Radeon RX 7900 XT | |
| KFA2 GeForce RTX 4070 Ti SG | |
| MSI Radeon RX 6950 XT Gaming X Trio | |
| ASUS TUF Gaming GeForce RTX 3080 Ti OC | |
| NVIDIA GeForce RTX 3090 Founders Edition | |
| AMD Radeon RX 6800 | |
| Nvidia Titan RTX | |
| KFA2 GeForce RTX 3070 Ti SG | |
| 1920x1080 Ultra Quality AF:16x | |
| KFA2 GeForce RTX 4090 SG | |
| AMD Radeon RX 7900 XTX | |
| KFA2 GeForce RTX 4080 SG | |
| AMD Radeon RX 7900 XT | |
| KFA2 GeForce RTX 4070 Ti SG | |
| MSI Radeon RX 6950 XT Gaming X Trio | |
| ASUS TUF Gaming GeForce RTX 3080 Ti OC | |
| NVIDIA GeForce RTX 3090 Founders Edition | |
| Nvidia Titan RTX | |
| AMD Radeon RX 6800 | |
| KFA2 GeForce RTX 3070 Ti SG | |
| Far Cry 5 | |
| 3840x2160 Ultra Preset AA:T | |
| KFA2 GeForce RTX 4090 SG | |
| AMD Radeon RX 7900 XTX | |
| KFA2 GeForce RTX 4080 SG | |
| AMD Radeon RX 7900 XT | |
| MSI Radeon RX 6950 XT Gaming X Trio | |
| KFA2 GeForce RTX 4070 Ti SG | |
| ASUS TUF Gaming GeForce RTX 3080 Ti OC | |
| NVIDIA GeForce RTX 3090 Founders Edition | |
| AMD Radeon RX 6800 | |
| Nvidia Titan RTX | |
| KFA2 GeForce RTX 3070 Ti SG | |
| 2560x1440 Ultra Preset AA:T | |
| KFA2 GeForce RTX 4090 SG | |
| KFA2 GeForce RTX 4080 SG | |
| KFA2 GeForce RTX 4070 Ti SG | |
| ASUS TUF Gaming GeForce RTX 3080 Ti OC | |
| NVIDIA GeForce RTX 3090 Founders Edition | |
| AMD Radeon RX 7900 XTX | |
| AMD Radeon RX 7900 XT | |
| MSI Radeon RX 6950 XT Gaming X Trio | |
| AMD Radeon RX 6800 | |
| KFA2 GeForce RTX 3070 Ti SG | |
| Nvidia Titan RTX | |
| 1920x1080 Ultra Preset AA:T | |
| KFA2 GeForce RTX 4090 SG | |
| NVIDIA GeForce RTX 3090 Founders Edition | |
| KFA2 GeForce RTX 4070 Ti SG | |
| KFA2 GeForce RTX 4080 SG | |
| ASUS TUF Gaming GeForce RTX 3080 Ti OC | |
| Nvidia Titan RTX | |
| KFA2 GeForce RTX 3070 Ti SG | |
| AMD Radeon RX 6800 | |
| AMD Radeon RX 7900 XTX | |
| MSI Radeon RX 6950 XT Gaming X Trio | |
| AMD Radeon RX 7900 XT | |
| F1 2021 | |
| 3840x2160 Ultra High Preset + Raytracing AA:T AF:16x | |
| KFA2 GeForce RTX 4090 SG (874931) | |
| KFA2 GeForce RTX 4080 SG (874931) | |
| AMD Radeon RX 7900 XTX (874931) | |
| KFA2 GeForce RTX 4070 Ti SG (874931) | |
| AMD Radeon RX 7900 XT (874931) | |
| ASUS TUF Gaming GeForce RTX 3080 Ti OC (874931) | |
| NVIDIA GeForce RTX 3090 Founders Edition (874931) | |
| MSI Radeon RX 6950 XT Gaming X Trio (874931) | |
| KFA2 GeForce RTX 3070 Ti SG (874931) | |
| AMD Radeon RX 6800 (874931) | |
| Nvidia Titan RTX (874931) | |
| 2560x1440 Ultra High Preset + Raytracing AA:T AF:16x | |
| KFA2 GeForce RTX 4090 SG (874931) | |
| KFA2 GeForce RTX 4080 SG (874931) | |
| AMD Radeon RX 7900 XTX (874931) | |
| KFA2 GeForce RTX 4070 Ti SG (874931) | |
| AMD Radeon RX 7900 XT (874931) | |
| ASUS TUF Gaming GeForce RTX 3080 Ti OC (874931) | |
| MSI Radeon RX 6950 XT Gaming X Trio (874931) | |
| NVIDIA GeForce RTX 3090 Founders Edition (874931) | |
| KFA2 GeForce RTX 3070 Ti SG (874931) | |
| AMD Radeon RX 6800 (874931) | |
| Nvidia Titan RTX (874931) | |
| 1920x1080 Ultra High Preset + Raytracing AA:T AF:16x | |
| KFA2 GeForce RTX 4090 SG (874931) | |
| AMD Radeon RX 7900 XTX (874931) | |
| KFA2 GeForce RTX 4080 SG (874931) | |
| AMD Radeon RX 7900 XT (874931) | |
| KFA2 GeForce RTX 4070 Ti SG (874931) | |
| MSI Radeon RX 6950 XT Gaming X Trio (874931) | |
| ASUS TUF Gaming GeForce RTX 3080 Ti OC (874931) | |
| NVIDIA GeForce RTX 3090 Founders Edition (874931) | |
| KFA2 GeForce RTX 3070 Ti SG (874931) | |
| AMD Radeon RX 6800 (874931) | |
| Nvidia Titan RTX (874931) | |
| Cyberpunk 2077 1.6 | |
| 3840x2160 Ultra Preset | |
| KFA2 GeForce RTX 4090 SG (1.61) | |
| AMD Radeon RX 7900 XTX (1.61) | |
| KFA2 GeForce RTX 4080 SG (1.61) | |
| AMD Radeon RX 7900 XT (1.61) | |
| ASUS TUF Gaming GeForce RTX 3080 Ti OC (1.61) | |
| MSI Radeon RX 6950 XT Gaming X Trio (1.61) | |
| KFA2 GeForce RTX 4070 Ti SG (1.5) | |
| AMD Radeon RX 6800 (1.61) | |
| KFA2 GeForce RTX 3070 Ti SG (1.61) | |
| 2560x1440 Ultra Preset | |
| KFA2 GeForce RTX 4090 SG (1.61) | |
| AMD Radeon RX 7900 XTX (1.61) | |
| KFA2 GeForce RTX 4080 SG (1.61) | |
| AMD Radeon RX 7900 XT (1.61) | |
| MSI Radeon RX 6950 XT Gaming X Trio (1.61) | |
| KFA2 GeForce RTX 4070 Ti SG (1.5) | |
| ASUS TUF Gaming GeForce RTX 3080 Ti OC (1.61) | |
| AMD Radeon RX 6800 (1.61) | |
| KFA2 GeForce RTX 3070 Ti SG (1.61) | |
| 1920x1080 Ultra Preset | |
| KFA2 GeForce RTX 4090 SG (1.61) | |
| AMD Radeon RX 7900 XTX (1.61) | |
| KFA2 GeForce RTX 4080 SG (1.61) | |
| AMD Radeon RX 7900 XT (1.61) | |
| KFA2 GeForce RTX 4070 Ti SG (1.5) | |
| MSI Radeon RX 6950 XT Gaming X Trio (1.61) | |
| ASUS TUF Gaming GeForce RTX 3080 Ti OC (1.61) | |
| AMD Radeon RX 6800 (1.61) | |
| KFA2 GeForce RTX 3070 Ti SG (1.61) | |
| A Plague Tale Requiem | |
| 3840x2160 Ultra Preset | |
| KFA2 GeForce RTX 4090 SG | |
| AMD Radeon RX 7900 XTX | |
| KFA2 GeForce RTX 4080 SG | |
| AMD Radeon RX 7900 XT | |
| KFA2 GeForce RTX 4070 Ti SG | |
| MSI Radeon RX 6950 XT Gaming X Trio | |
| ASUS TUF Gaming GeForce RTX 3080 Ti OC | |
| KFA2 GeForce RTX 3070 Ti SG | |
| AMD Radeon RX 6800 | |
| Nvidia Titan RTX | |
| 2560x1440 Ultra Preset | |
| KFA2 GeForce RTX 4090 SG | |
| AMD Radeon RX 7900 XTX | |
| KFA2 GeForce RTX 4080 SG | |
| AMD Radeon RX 7900 XT | |
| KFA2 GeForce RTX 4070 Ti SG | |
| MSI Radeon RX 6950 XT Gaming X Trio | |
| ASUS TUF Gaming GeForce RTX 3080 Ti OC | |
| KFA2 GeForce RTX 3070 Ti SG | |
| Nvidia Titan RTX | |
| AMD Radeon RX 6800 | |
| 1920x1080 Ultra Preset | |
| KFA2 GeForce RTX 4090 SG | |
| KFA2 GeForce RTX 4080 SG | |
| AMD Radeon RX 7900 XTX | |
| AMD Radeon RX 7900 XT | |
| KFA2 GeForce RTX 4070 Ti SG | |
| ASUS TUF Gaming GeForce RTX 3080 Ti OC | |
| MSI Radeon RX 6950 XT Gaming X Trio | |
| KFA2 GeForce RTX 3070 Ti SG | |
| Nvidia Titan RTX | |
| AMD Radeon RX 6800 | |
| Need for Speed Unbound | |
| 3840x2160 Ultra Preset | |
| KFA2 GeForce RTX 4080 SG | |
| AMD Radeon RX 7900 XTX | |
| KFA2 GeForce RTX 4070 Ti SG | |
| ASUS TUF Gaming GeForce RTX 3080 Ti OC | |
| AMD Radeon RX 7900 XT | |
| MSI Radeon RX 6950 XT Gaming X Trio | |
| Nvidia Titan RTX | |
| KFA2 GeForce RTX 3070 Ti SG | |
| AMD Radeon RX 6800 | |
| 2560x1440 Ultra Preset | |
| KFA2 GeForce RTX 4080 SG | |
| KFA2 GeForce RTX 4070 Ti SG | |
| ASUS TUF Gaming GeForce RTX 3080 Ti OC | |
| AMD Radeon RX 7900 XTX | |
| AMD Radeon RX 7900 XT | |
| MSI Radeon RX 6950 XT Gaming X Trio | |
| KFA2 GeForce RTX 3070 Ti SG | |
| Nvidia Titan RTX | |
| AMD Radeon RX 6800 | |
| 1920x1080 Ultra Preset | |
| AMD Radeon RX 7900 XTX | |
| KFA2 GeForce RTX 4080 SG | |
| ASUS TUF Gaming GeForce RTX 3080 Ti OC | |
| KFA2 GeForce RTX 4070 Ti SG | |
| AMD Radeon RX 7900 XT | |
| KFA2 GeForce RTX 3070 Ti SG | |
| Nvidia Titan RTX | |
| MSI Radeon RX 6950 XT Gaming X Trio | |
| AMD Radeon RX 6800 | |
| Spider-Man Miles Morales | |
| 3840x2160 Very High Preset AA:T | |
| KFA2 GeForce RTX 4090 SG | |
| KFA2 GeForce RTX 4080 SG | |
| AMD Radeon RX 7900 XTX | |
| KFA2 GeForce RTX 4070 Ti SG | |
| AMD Radeon RX 7900 XT | |
| ASUS TUF Gaming GeForce RTX 3080 Ti OC | |
| MSI Radeon RX 6950 XT Gaming X Trio | |
| Nvidia Titan RTX | |
| KFA2 GeForce RTX 3070 Ti SG | |
| AMD Radeon RX 6800 | |
| 2560x1440 Very High Preset AA:T | |
| KFA2 GeForce RTX 4080 SG | |
| KFA2 GeForce RTX 4090 SG | |
| AMD Radeon RX 7900 XTX | |
| KFA2 GeForce RTX 4070 Ti SG | |
| AMD Radeon RX 7900 XT | |
| ASUS TUF Gaming GeForce RTX 3080 Ti OC | |
| MSI Radeon RX 6950 XT Gaming X Trio | |
| KFA2 GeForce RTX 3070 Ti SG | |
| Nvidia Titan RTX | |
| AMD Radeon RX 6800 | |
| 1920x1080 Very High Preset AA:T | |
| KFA2 GeForce RTX 4090 SG | |
| KFA2 GeForce RTX 4070 Ti SG | |
| ASUS TUF Gaming GeForce RTX 3080 Ti OC | |
| AMD Radeon RX 7900 XTX | |
| KFA2 GeForce RTX 4080 SG | |
| AMD Radeon RX 7900 XT | |
| KFA2 GeForce RTX 3070 Ti SG | |
| MSI Radeon RX 6950 XT Gaming X Trio | |
| Nvidia Titan RTX | |
| AMD Radeon RX 6800 | |
| God of War | |
| 3840x2160 Ultra Preset | |
| KFA2 GeForce RTX 4090 SG | |
| AMD Radeon RX 7900 XTX | |
| KFA2 GeForce RTX 4080 SG | |
| AMD Radeon RX 7900 XT | |
| KFA2 GeForce RTX 4070 Ti SG | |
| ASUS TUF Gaming GeForce RTX 3080 Ti OC | |
| NVIDIA GeForce RTX 3090 Founders Edition | |
| MSI Radeon RX 6950 XT Gaming X Trio | |
| Nvidia Titan RTX | |
| KFA2 GeForce RTX 3070 Ti SG | |
| AMD Radeon RX 6800 | |
| 2560x1440 Ultra Preset | |
| KFA2 GeForce RTX 4090 SG | |
| AMD Radeon RX 7900 XTX | |
| AMD Radeon RX 7900 XT | |
| KFA2 GeForce RTX 4080 SG | |
| MSI Radeon RX 6950 XT Gaming X Trio | |
| KFA2 GeForce RTX 4070 Ti SG | |
| NVIDIA GeForce RTX 3090 Founders Edition | |
| ASUS TUF Gaming GeForce RTX 3080 Ti OC | |
| Nvidia Titan RTX | |
| AMD Radeon RX 6800 | |
| KFA2 GeForce RTX 3070 Ti SG | |
| 1920x1080 Ultra Preset | |
| KFA2 GeForce RTX 4090 SG | |
| AMD Radeon RX 7900 XTX | |
| AMD Radeon RX 7900 XT | |
| KFA2 GeForce RTX 4080 SG | |
| MSI Radeon RX 6950 XT Gaming X Trio | |
| KFA2 GeForce RTX 4070 Ti SG | |
| NVIDIA GeForce RTX 3090 Founders Edition | |
| ASUS TUF Gaming GeForce RTX 3080 Ti OC | |
| Nvidia Titan RTX | |
| AMD Radeon RX 6800 | |
| KFA2 GeForce RTX 3070 Ti SG | |
| GTA V | |
| 3840x2160 Highest AA:4xMSAA + FX AF:16x | |
| KFA2 GeForce RTX 4090 SG | |
| AMD Radeon RX 7900 XTX | |
| ASUS TUF Gaming GeForce RTX 3080 Ti OC | |
| NVIDIA GeForce RTX 3090 Founders Edition | |
| KFA2 GeForce RTX 4080 SG | |
| MSI Radeon RX 6950 XT Gaming X Trio | |
| AMD Radeon RX 7900 XT | |
| KFA2 GeForce RTX 4070 Ti SG | |
| KFA2 GeForce RTX 3070 Ti SG | |
| Nvidia Titan RTX | |
| AMD Radeon RX 6800 | |
| 3840x2160 High/On (Advanced Graphics Off) AA:FX AF:8x | |
| KFA2 GeForce RTX 4090 SG | |
| AMD Radeon RX 7900 XTX | |
| KFA2 GeForce RTX 4080 SG | |
| ASUS TUF Gaming GeForce RTX 3080 Ti OC | |
| NVIDIA GeForce RTX 3090 Founders Edition | |
| MSI Radeon RX 6950 XT Gaming X Trio | |
| AMD Radeon RX 7900 XT | |
| KFA2 GeForce RTX 4070 Ti SG | |
| KFA2 GeForce RTX 3070 Ti SG | |
| Nvidia Titan RTX | |
| AMD Radeon RX 6800 | |
| Call of Duty Modern Warfare 2 2022 | |
| 3840x2160 Extreme Quality Preset AA:T2X Filmic SM | |
| KFA2 GeForce RTX 4090 SG | |
| AMD Radeon RX 7900 XTX | |
| AMD Radeon RX 7900 XT | |
| KFA2 GeForce RTX 4080 SG | |
| MSI Radeon RX 6950 XT Gaming X Trio | |
| KFA2 GeForce RTX 4070 Ti SG | |
| ASUS TUF Gaming GeForce RTX 3080 Ti OC | |
| AMD Radeon RX 6800 | |
| KFA2 GeForce RTX 3070 Ti SG | |
| Nvidia Titan RTX | |
| 2560x1440 Extreme Quality Preset AA:T2X Filmic SM | |
| AMD Radeon RX 7900 XTX | |
| KFA2 GeForce RTX 4090 SG | |
| AMD Radeon RX 7900 XT | |
| KFA2 GeForce RTX 4080 SG | |
| MSI Radeon RX 6950 XT Gaming X Trio | |
| KFA2 GeForce RTX 4070 Ti SG | |
| ASUS TUF Gaming GeForce RTX 3080 Ti OC | |
| AMD Radeon RX 6800 | |
| KFA2 GeForce RTX 3070 Ti SG | |
| Nvidia Titan RTX | |
| 1920x1080 Extreme Quality Preset AA:T2X Filmic SM | |
| AMD Radeon RX 7900 XTX | |
| AMD Radeon RX 7900 XT | |
| KFA2 GeForce RTX 4090 SG | |
| KFA2 GeForce RTX 4080 SG | |
| MSI Radeon RX 6950 XT Gaming X Trio | |
| KFA2 GeForce RTX 4070 Ti SG | |
| AMD Radeon RX 6800 | |
| ASUS TUF Gaming GeForce RTX 3080 Ti OC | |
| KFA2 GeForce RTX 3070 Ti SG | |
| Nvidia Titan RTX | |
| The Quarry | |
| 3840x2160 Ultra Preset | |
| KFA2 GeForce RTX 4080 SG | |
| KFA2 GeForce RTX 4090 SG | |
| AMD Radeon RX 7900 XTX | |
| AMD Radeon RX 7900 XT | |
| KFA2 GeForce RTX 4070 Ti SG | |
| ASUS TUF Gaming GeForce RTX 3080 Ti OC | |
| NVIDIA GeForce RTX 3090 Founders Edition | |
| MSI Radeon RX 6950 XT Gaming X Trio | |
| AMD Radeon RX 6800 | |
| KFA2 GeForce RTX 3070 Ti SG | |
| Nvidia Titan RTX | |
| 2560x1440 Ultra Preset | |
| KFA2 GeForce RTX 4090 SG | |
| KFA2 GeForce RTX 4080 SG | |
| AMD Radeon RX 7900 XTX | |
| KFA2 GeForce RTX 4070 Ti SG | |
| AMD Radeon RX 7900 XT | |
| ASUS TUF Gaming GeForce RTX 3080 Ti OC | |
| NVIDIA GeForce RTX 3090 Founders Edition | |
| MSI Radeon RX 6950 XT Gaming X Trio | |
| KFA2 GeForce RTX 3070 Ti SG | |
| Nvidia Titan RTX | |
| AMD Radeon RX 6800 | |
| 1920x1080 Ultra Preset | |
| KFA2 GeForce RTX 4090 SG | |
| KFA2 GeForce RTX 4080 SG | |
| AMD Radeon RX 7900 XTX | |
| KFA2 GeForce RTX 4070 Ti SG | |
| AMD Radeon RX 7900 XT | |
| MSI Radeon RX 6950 XT Gaming X Trio | |
| ASUS TUF Gaming GeForce RTX 3080 Ti OC | |
| NVIDIA GeForce RTX 3090 Founders Edition | |
| KFA2 GeForce RTX 3070 Ti SG | |
| Nvidia Titan RTX | |
| AMD Radeon RX 6800 | |
| Spider-Man Miles Morales - 1920x0180 Very High Preset + Ray-Tracing AA:T | |
| KFA2 GeForce RTX 4090 SG | |
| KFA2 GeForce RTX 4080 SG | |
| KFA2 GeForce RTX 4070 Ti SG | |
| AMD Radeon RX 7900 XTX | |
| ASUS TUF Gaming GeForce RTX 3080 Ti OC | |
| AMD Radeon RX 7900 XT | |
| MSI Radeon RX 6950 XT Gaming X Trio | |
| KFA2 GeForce RTX 3070 Ti SG | |
| Nvidia Titan RTX | |
| AMD Radeon RX 6800 | |
| Metro Exodus - 1920x1080 Ultra Quality DXR AF:16x | |
| KFA2 GeForce RTX 4090 SG | |
| KFA2 GeForce RTX 4080 SG | |
| AMD Radeon RX 7900 XTX | |
| KFA2 GeForce RTX 4070 Ti SG | |
| AMD Radeon RX 7900 XT | |
| ASUS TUF Gaming GeForce RTX 3080 Ti OC | |
| NVIDIA GeForce RTX 3090 Founders Edition | |
| AMD Ryzen 9 7950X | |
| MSI Radeon RX 6950 XT Gaming X Trio | |
| KFA2 GeForce RTX 3070 Ti SG | |
| Nvidia Titan RTX | |
| Far Cry 6 - 1920x1080 Ultra Graphics Quality + HD Textures + DXR AA:T | |
| AMD Radeon RX 7900 XTX | |
| AMD Radeon RX 7900 XT | |
| KFA2 GeForce RTX 4090 SG | |
| KFA2 GeForce RTX 4070 Ti SG | |
| MSI Radeon RX 6950 XT Gaming X Trio | |
| ASUS TUF Gaming GeForce RTX 3080 Ti OC | |
| NVIDIA GeForce RTX 3090 Founders Edition | |
| KFA2 GeForce RTX 4080 SG | |
| AMD Ryzen 9 7950X | |
| AMD Radeon RX 6800 | |
| Nvidia Titan RTX | |
| KFA2 GeForce RTX 3070 Ti SG | |
| Cyberpunk 2077 1.6 | |
| 3840x2160 Ray Tracing Ultra Preset (DLSS off) | |
| KFA2 GeForce RTX 4090 SG (1.61) | |
| KFA2 GeForce RTX 4080 SG (1.61) | |
| KFA2 GeForce RTX 4070 Ti SG (1.5) | |
| AMD Ryzen 9 7950X (1.6) | |
| AMD Radeon RX 7900 XTX (1.61) | |
| ASUS TUF Gaming GeForce RTX 3080 Ti OC (1.61) | |
| AMD Radeon RX 7900 XT (1.61) | |
| MSI Radeon RX 6950 XT Gaming X Trio (1.61) | |
| AMD Radeon RX 6800 (1.61) | |
| KFA2 GeForce RTX 3070 Ti SG (1.61) | |
| 1920x1080 Ray Tracing Ultra Preset (DLSS off) | |
| KFA2 GeForce RTX 4090 SG (1.61) | |
| KFA2 GeForce RTX 4080 SG (1.61) | |
| KFA2 GeForce RTX 4070 Ti SG (1.5) | |
| ASUS TUF Gaming GeForce RTX 3080 Ti OC (1.61) | |
| AMD Ryzen 9 7950X (1.6) | |
| AMD Radeon RX 7900 XTX (1.61) | |
| AMD Radeon RX 7900 XT (1.61) | |
| MSI Radeon RX 6950 XT Gaming X Trio (1.61) | |
| KFA2 GeForce RTX 3070 Ti SG (1.61) | |
| AMD Radeon RX 6800 (1.61) | |
| The Callisto Protocol - 1920x1080 Ultra Preset (without FSR Upscaling) + Full Ray-Tracing | |
| AMD Radeon RX 7900 XTX | |
| AMD Radeon RX 7900 XT | |
| KFA2 GeForce RTX 4080 SG | |
| MSI Radeon RX 6950 XT Gaming X Trio | |
| KFA2 GeForce RTX 4070 Ti SG | |
| ASUS TUF Gaming GeForce RTX 3080 Ti OC | |
| AMD Radeon RX 6800 | |
| KFA2 GeForce RTX 3070 Ti SG | |
| Nvidia Titan RTX | |
| low | med. | high | ultra | QHD | 4K DLSS | 4K | |
|---|---|---|---|---|---|---|---|
| GTA V (2015) | 187.9 | 187.8 | 187.3 | 163.3 | 152.8 | 171.7 | |
| The Witcher 3 (2015) | 791 | 677 | 462 | 224 | 149.3 | ||
| Dota 2 Reborn (2015) | 293.6 | 261.5 | 248.9 | 232.7 | 224.6 | ||
| Final Fantasy XV Benchmark (2018) | 235 | 238 | 207 | 163.3 | 87.1 | ||
| Far Cry 5 (2018) | 241 | 212 | 203 | 189 | 181 | 111 | |
| Strange Brigade (2018) | 702 | 564 | 475 | 414 | 281 | 139.8 | |
| Shadow of the Tomb Raider (2018) | 336 | 297 | 287 | 264 | 197.7 | 103.3 | |
| Far Cry New Dawn (2019) | 197 | 172 | 167 | 150 | 148 | 112 | |
| Metro Exodus (2019) | 297 | 237 | 193.5 | 156.9 | 129 | 82.8 | |
| Control (2019) | 240 | 240 | 200 | 100 | 66.2 | ||
| Borderlands 3 (2019) | 238 | 207 | 191.4 | 171.9 | 136.3 | 72.5 | |
| F1 2020 (2020) | 552 | 461 | 448 | 353 | 275 | 160.6 | |
| F1 2021 (2021) | 640 | 599 | 472 | 247 | 201 | 114.7 | |
| New World (2021) | 229 | 191.7 | 174.9 | 164.9 | 153.7 | 81.4 | |
| Far Cry 6 (2021) | 213 | 186.7 | 167.6 | 159.7 | 148.3 | 88.3 | |
| Forza Horizon 5 (2021) | 312 | 244 | 228 | 167 | 146 | 102 | |
| God of War (2022) | 269 | 231 | 183.6 | 132.5 | 112 | 78.1 | |
| GRID Legends (2022) | 343 | 311 | 278 | 249 | 199.9 | 138.4 | |
| Cyberpunk 2077 1.6 (2022) | 239 | 229 | 202 | 166.6 | 102.9 | 46.6 | |
| Ghostwire Tokyo (2022) | 287 | 283 | 283 | 282 | 208 | 98 | |
| Tiny Tina's Wonderlands (2022) | 382 | 312 | 238 | 189.5 | 131.9 | 69.4 | |
| F1 22 (2022) | 419 | 414 | 362 | 142.5 | 92.5 | 46.6 | |
| The Quarry (2022) | 336 | 255 | 214 | 169.9 | 118.8 | 62 | |
| FIFA 23 (2022) | 338 | 290 | 272 | 271 | 267 | 178.1 | |
| A Plague Tale Requiem (2022) | 177.5 | 169 | 132.7 | 105.6 | 77.7 | 43.1 | |
| Uncharted Legacy of Thieves Collection (2022) | 140.5 | 140 | 135.2 | 133.2 | 105.3 | 62.6 | |
| Call of Duty Modern Warfare 2 2022 (2022) | 262 | 237 | 183 | 175 | 126 | 123 | 79 |
| Spider-Man Miles Morales (2022) | 208 | 186.2 | 179.3 | 171.2 | 141.6 | 89.1 | |
| The Callisto Protocol (2022) | 214.6 | 196.3 | 149.6 | 149.3 | 115.4 | 67.9 | |
| Need for Speed Unbound (2022) | 178.6 | 173 | 159.2 | 139.4 | 133.8 | 83 | |
| The Witcher 3 v4 (2023) | 261 | 232 | 216 | 194.5 | 167.8 | 97.2 |
Emissions from the KFA2 GeForce RTX 4070 Ti SG
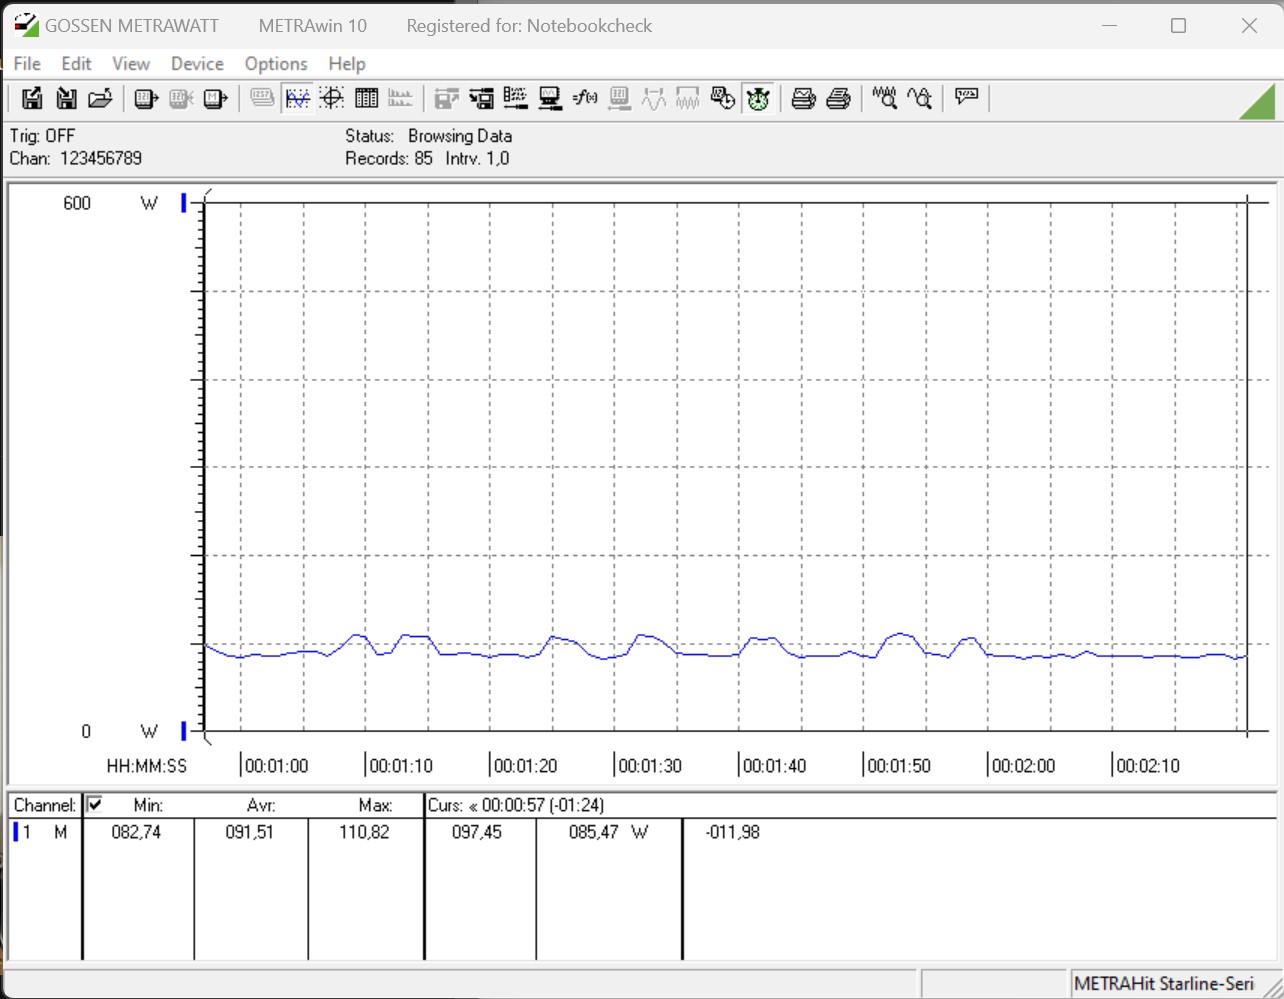
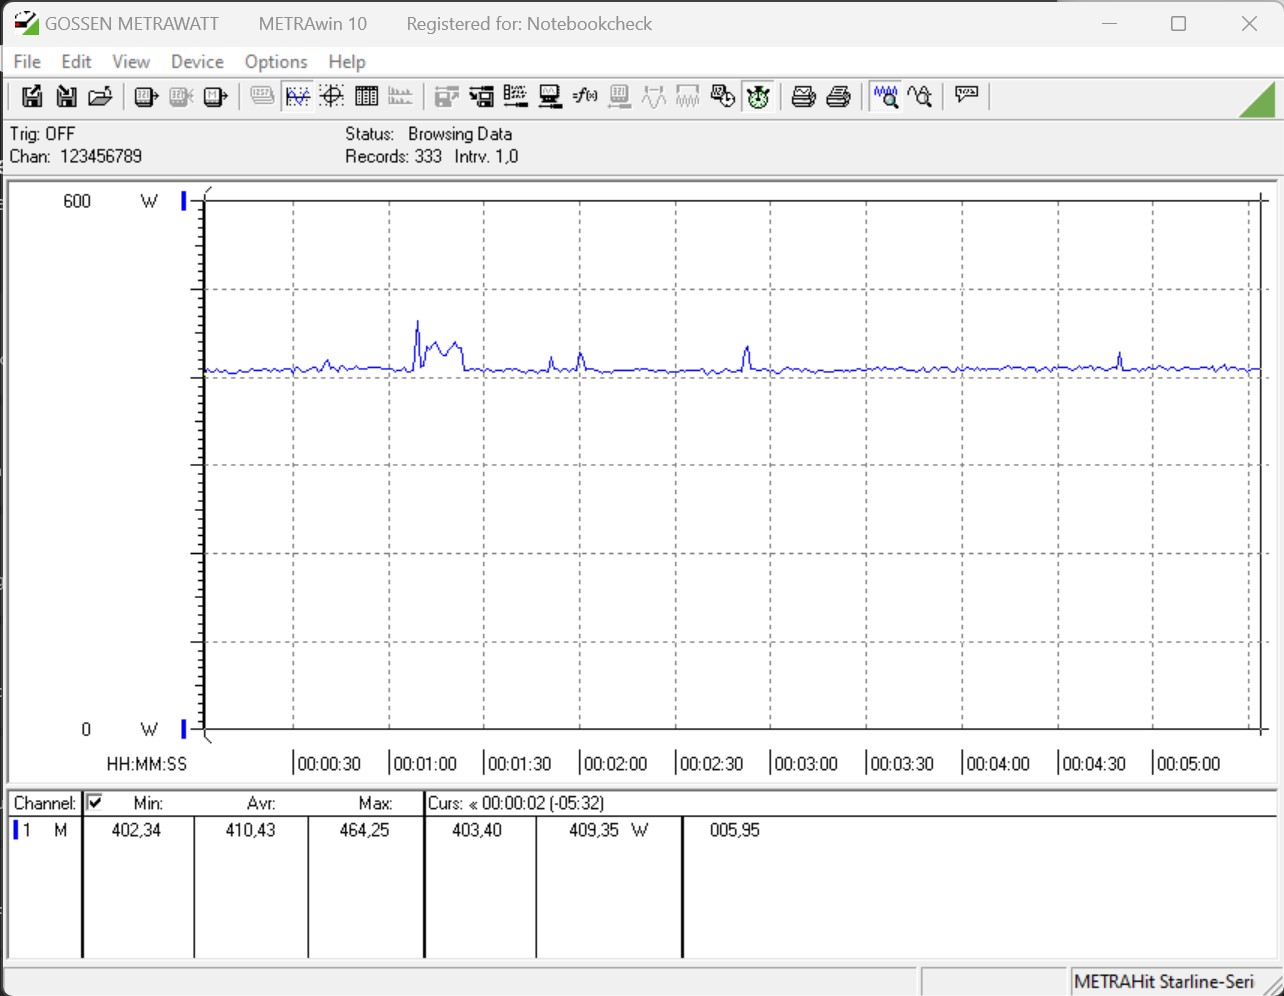
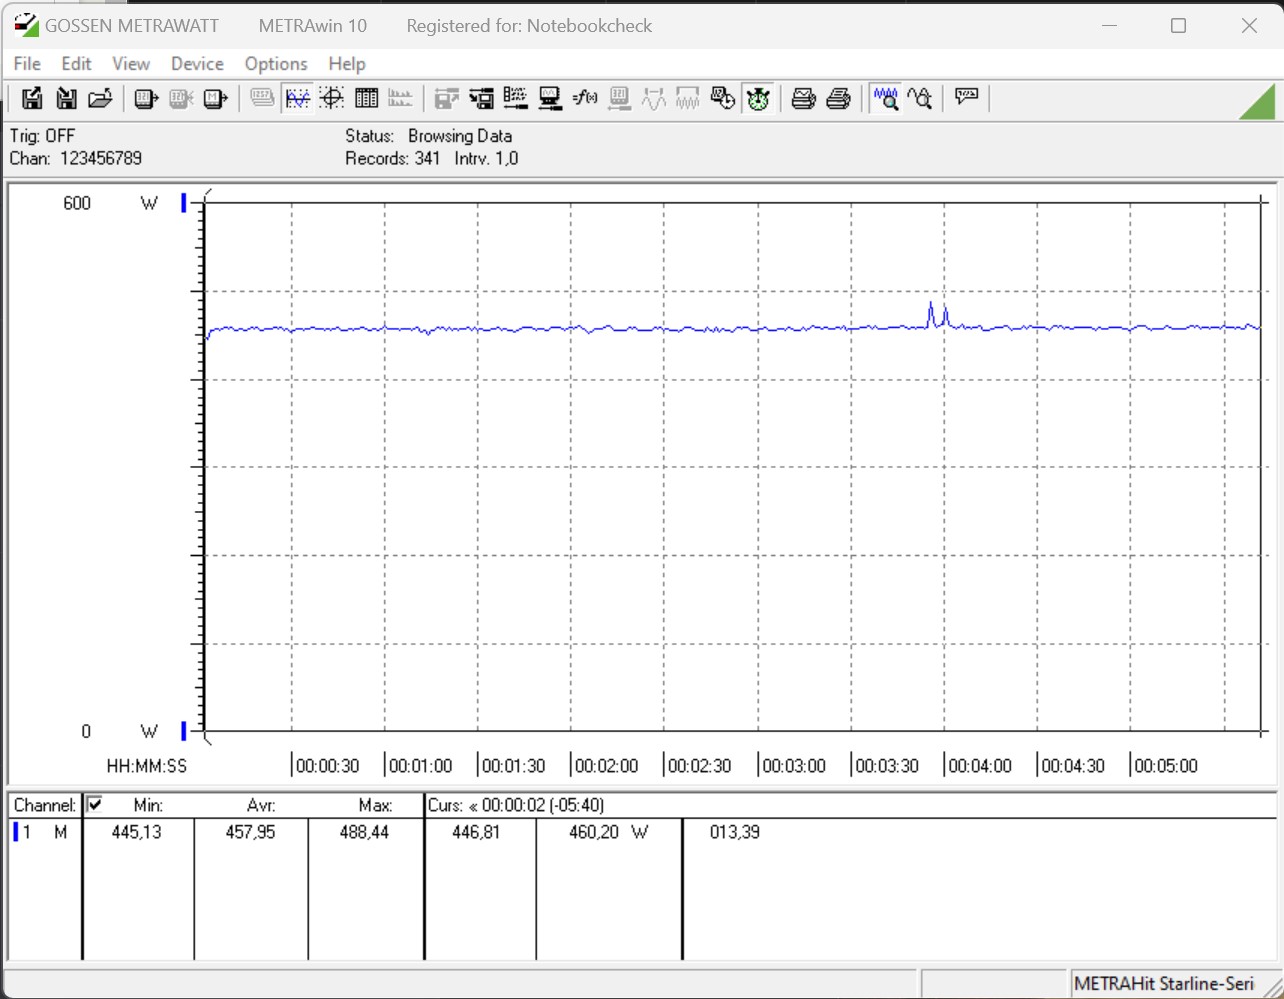
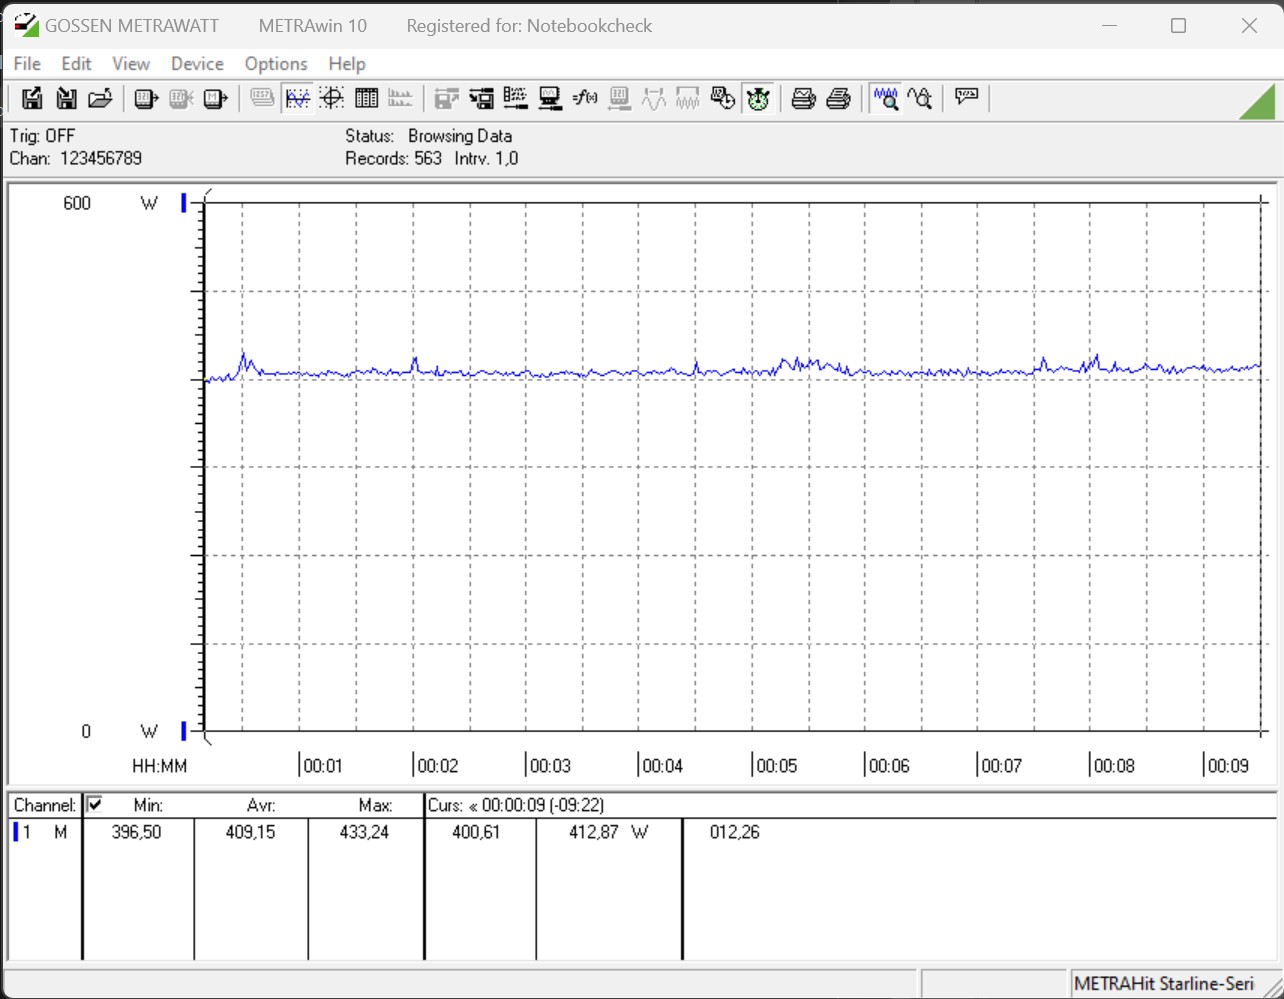
The KFA2 GeForce RTX 4070 Ti SG is extremely efficient and offers a significant improvement over the RTX 3070 Ti in this department. Both cards draw almost the same amount of power under load, yet the RTX 4070 Ti has 30 to 50 per cent more 3D performance than its predecessor. We were very positively surprised when reviewing the GeForce RTX 4080 and RTX 4090, and the RTX 4070 Ti follows in their footsteps without a hitch. In numerical terms, our entire test system (without factoring in the monitor) consumed roughly 410 watts of power when gaming and during our stress test. Our electricity usage monitor indicated that power consumption was 11 to 15 per cent higher with the GeForce RTX 3070 Ti in our otherwise identical test system. Similarly, AMD failed to outdo Nvidia with the RX 7900 XT and the new RDN3 architecture. Based on our measurements, the RX 7900 XT required about 12 to 25 per cent more power than our review unit from KFA2.
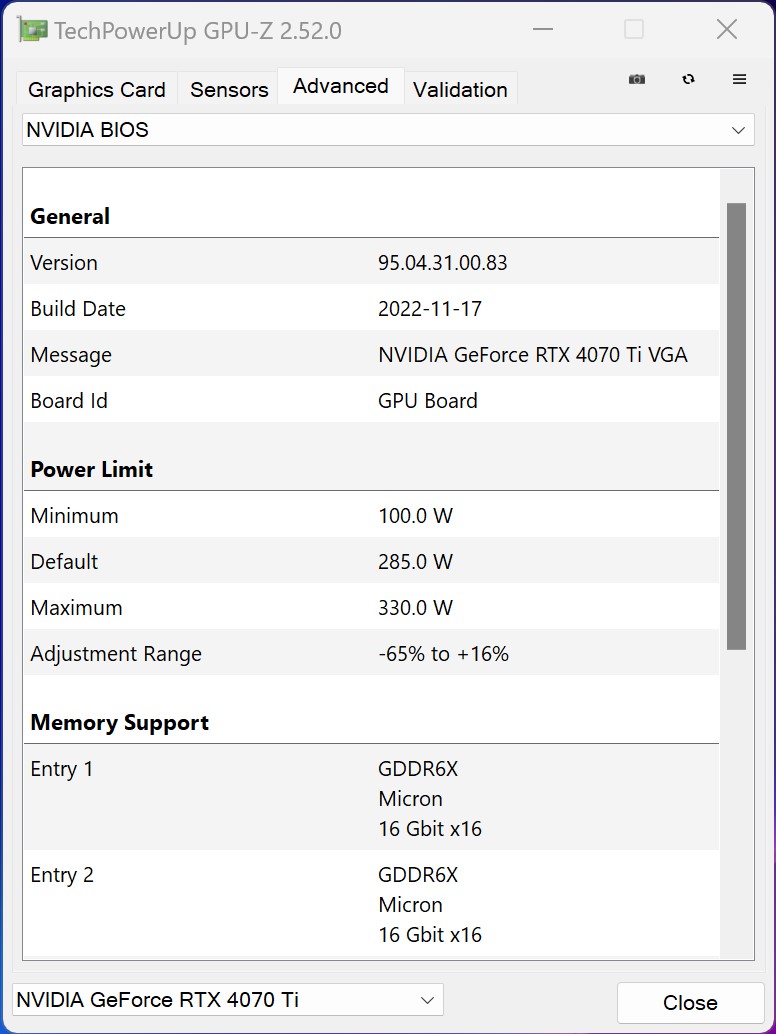
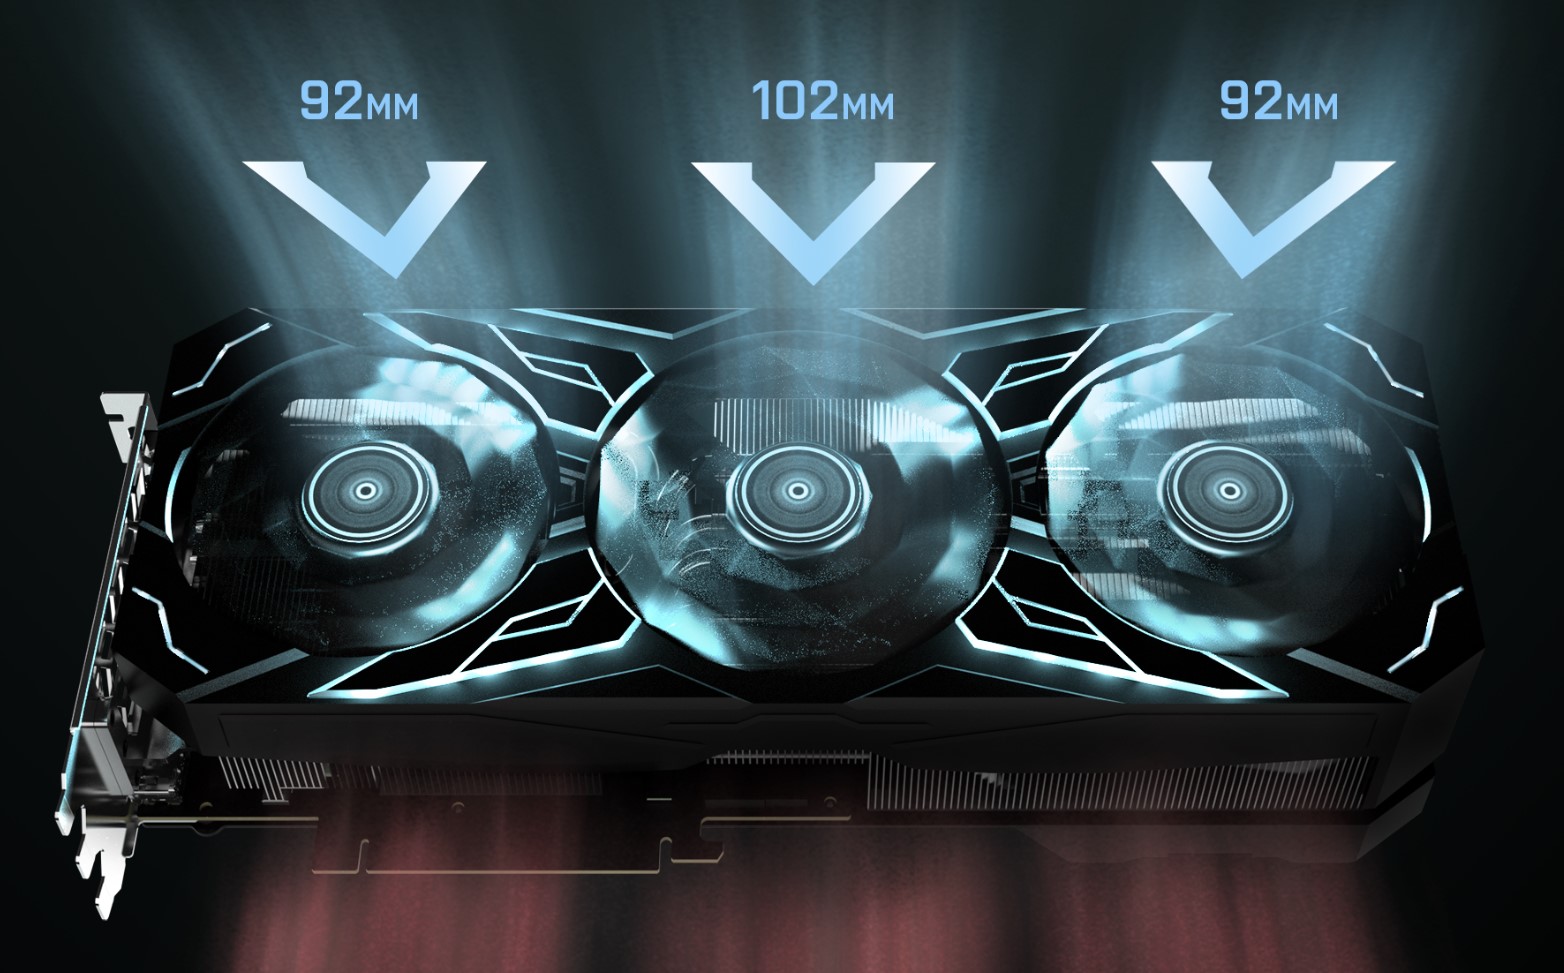
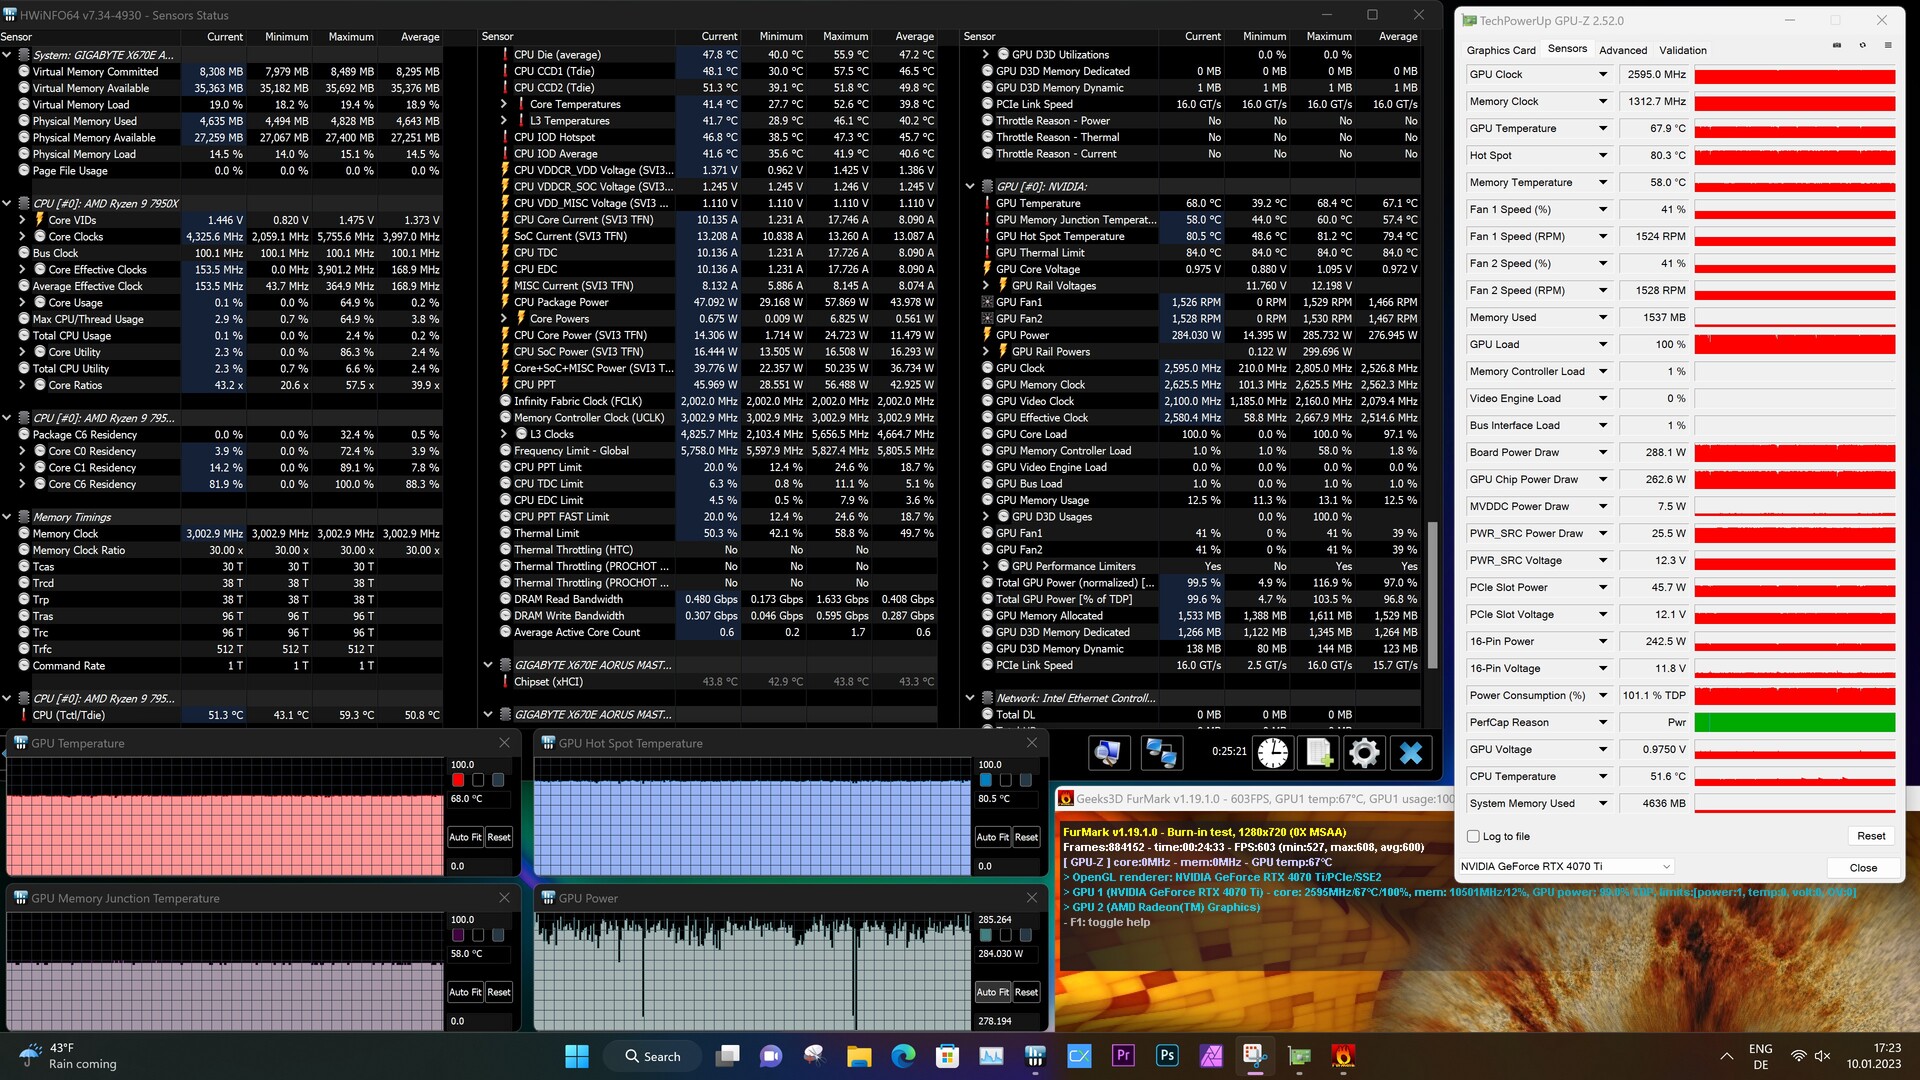
The KFA2 GeForce RTX 4070 Ti SG is equipped with a huge cooler that takes up three slots in a computer case. We have already seen a similar design used on the RTX 4080 and RTX 4090 models from the same company. But the coolers on the faster models are even larger because these cards consume much more power (up to 450 watts). The KFA2 GeForce RTX 4070 Ti SG is able to manage its max power draw of 285 watts very well. During the stress test, it effortlessly reached 285 watts while keeping temperatures at no higher than 68.4°C (155.1°F) – far from the maximum safe operating temperature. To keep its components cool, the KFA2 GeForce RTX 4070 Ti SG uses the same fan blade design as the one seen on the "larger" models. However, the card features fans of different sizes. As you can see in the images, the two outer fans have a diameter of 92 mm (3.6"), whereas the middle fan measures 102 mm (4") across. We didn't notice any negative impact on the fan noise measured. During our testing, the fans produced a soft whirring noise that didn't get any louder than 35.7 dB(A), which was audible through the closed PC case. Raising the power limit to 330 watts caused the GPU noise level to increase to 37 dB(A) according to our measurement. During gaming (The Witcher 3 at 1080p and Ultra preset), our setup produced a pleasant 33.5 dB(A) of noise. What's more, the KFA2 GeForce RTX 4070 Ti SG is completely silent when running 2D applications. We didn't hear any annoying coil whine on our review unit.
The manufacturer recommends having at least a 700-watt PSU. This recommendation is based on a system with an AMD Ryzen 9 5900X. However, if you are running a system with a Ryzen 9 7000 Series processor or a high-end Intel Raptor Lake processor, you should take into account the high power requirement of these CPUs under load. Therefore, we suggest going for an 800-watt PSU.
Noise level
| Idle |
| 30.7 / 30.7 / 30.7 dB(A) |
| Load |
| 30.8 / 35.7 dB(A) |
 | ||
30 dB silent 40 dB(A) audible 50 dB(A) loud |
||
min: | ||
| Power Consumption / The Witcher 3 ultra (external Monitor) | |
| MSI Radeon RX 6950 XT Gaming X Trio (Idle: 79.6 W) | |
| AMD Ryzen 7 5800X3D (Idle: 102 W) | |
| KFA2 GeForce RTX 4090 SG | |
| AMD Radeon RX 7900 XTX (Idle: 86.5 W) | |
| NVIDIA GeForce RTX 3090 Founders Edition | |
| ASUS TUF Gaming GeForce RTX 3080 Ti OC (Idle: 78.2 W) | |
| KFA2 GeForce RTX 3080 SG | |
| AMD Radeon RX 6900 XT (Idle: 99.15 W) | |
| KFA2 GeForce RTX 4080 SG (Idle: 86.4 W) | |
| AMD Radeon RX 7900 XT (Idle: 84.6 W) | |
| KFA2 GeForce RTX 3070 Ti SG (Idle: 88.9 W) | |
| KFA2 GeForce RTX 4070 Ti SG (Idle: 91.5 W) | |
| Power Consumption / FurMark 1.19 GPU Stress Test (external Monitor) | |
| KFA2 GeForce RTX 4090 SG | |
| MSI Radeon RX 6950 XT Gaming X Trio (Idle: 79.6 W) | |
| AMD Radeon RX 7900 XTX (Idle: 86.5 W) | |
| NVIDIA GeForce RTX 3090 Founders Edition | |
| ASUS TUF Gaming GeForce RTX 3080 Ti OC (Idle: 78.2 W) | |
| AMD Radeon RX 7900 XT (Idle: 84.6 W) | |
| KFA2 GeForce RTX 3080 SG | |
| KFA2 GeForce RTX 3070 Ti SG (Idle: 88.9 W) | |
| KFA2 GeForce RTX 4080 SG (Idle: 86.4 W) | |
| AMD Radeon RX 6900 XT (Idle: 99.15 W) | |
| KFA2 GeForce RTX 4070 Ti SG (Idle: 91.5 W) | |
| Power Consumption / Witcher 3 ultra Efficiency (external Monitor) | |
| KFA2 GeForce RTX 4080 SG | |
| AMD Radeon RX 7900 XT | |
| KFA2 GeForce RTX 4090 SG | |
| AMD Radeon RX 7900 XTX | |
| KFA2 GeForce RTX 4070 Ti SG | |
| MSI Radeon RX 6950 XT Gaming X Trio | |
| NVIDIA GeForce RTX 3090 Founders Edition | |
| ASUS TUF Gaming GeForce RTX 3080 Ti OC | |
| AMD Ryzen 7 5800X3D | |
| AMD Radeon RX 6900 XT | |
| KFA2 GeForce RTX 3070 Ti SG | |
| KFA2 GeForce RTX 3080 SG | |
* ... smaller is better
Power consumption with external monitor
Pros
Cons
Verdict - Quiet and highly efficient


The KFA2 GeForce RTX 4070 Ti SG is the smallest GPU model based on the Ada Lovelace architecture that we have put through our gauntlet of tests. As expected, the GeForce RTX 4070 Ti trails far behind a GeForce RTX 4080, though the performance difference is less drastic at 1080p and 1440p than at 2160p. If you intend to game only at UHD, it is better to grab an RTX 4080 or RTX 4090 right now instead. Compared with AMD’s offerings, the KFA2 GeForce RTX 4070 Ti SG isn’t always able to hold its own against the Radeon RX 7900 XT. That said, the Nvidia GPU has a lot going for it. Features like DLSS and ray tracing work well, and AMD currently can’t keep up with Nvidia in this regard.
The KFA2 model in this review is fitted with a massive three-slot cooler that performed amazingly well during our testing and does an excellent job at cooling the card’s components. In 2D applications, the card is even completely silent thanks to its fan stop mode. With a TDP of 285 watts, the graphics card doesn’t require much more power than its predecessor (RTX 3070 Ti), but the increase in performance is immense and very noticeable in all the games we tested.
The KFA2 GeForce RTX 4070 Ti SG offers great performance for 1440p gaming. But the 12 GB of VRAM could pose a challenge when it comes to future-proofing your system.
Power is supplied to the graphics card via a 12VHPWR connector, which we have already seen on other cards. It is up you to decide whether this is a good thing or not. But the trend of using this connector is probably going to turn into the new standard that we have to live with in future. In our case, we didn’t encounter any power delivery issues with the KFA2 GeForce RTX 4070 Ti SG. However, we do have a complain here: in our opinion, the manufacturer didn't choose a good spot for the power connector. The large cooler makes it really hard to access the retention clip when you want to remove the cable.
The biggest competitor of the RTX 4070 Ti is undoubtedly the AMD Radeon RX 7900 XT. The GPU from team red often manages to outperform the KFA2 GeForce RTX 4070 Ti SG. Price-wise, there isn’t a huge difference between these two cards. Some manufacturers are actually offering the RTX 4070 Ti at its RRP of €899 (US$799). But our review model will set you back €949 (US$1,028), which is the official RRP set by KFA2.

