Intel NUC 13 Extreme Raptor Canyon mini PC with Core i9-13900K and GeForce RTX 3080 Ti in review
")
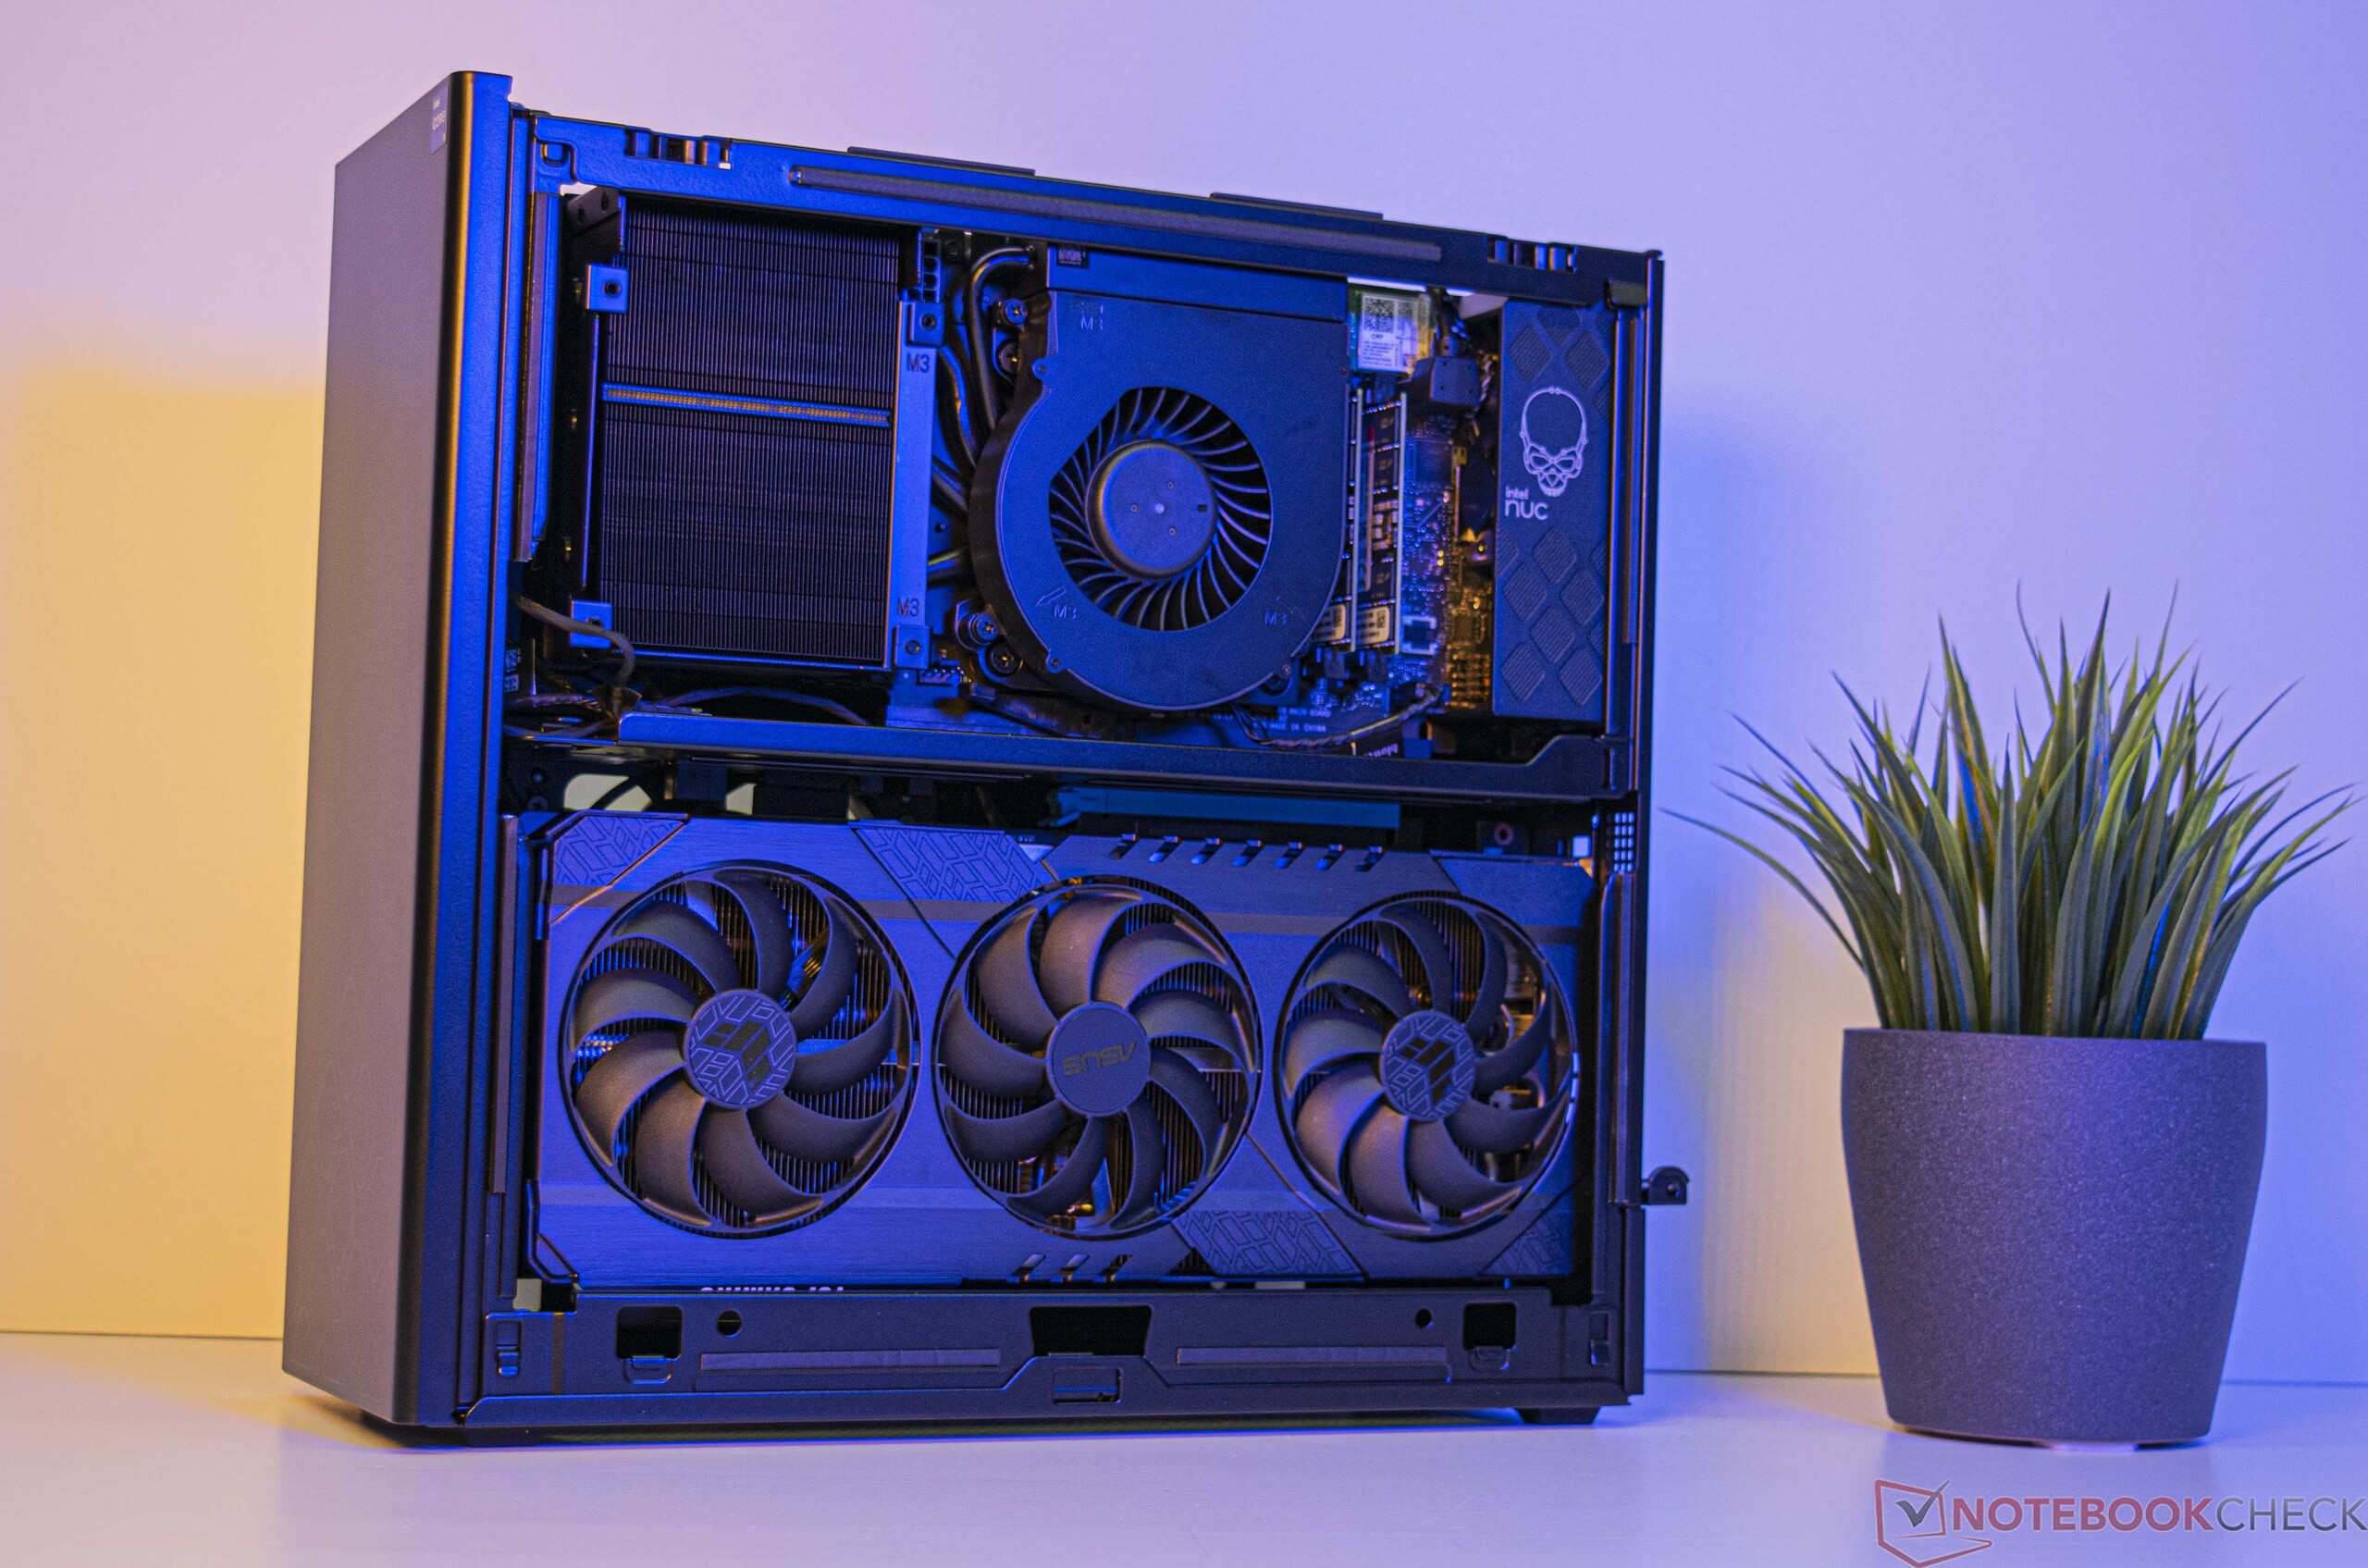
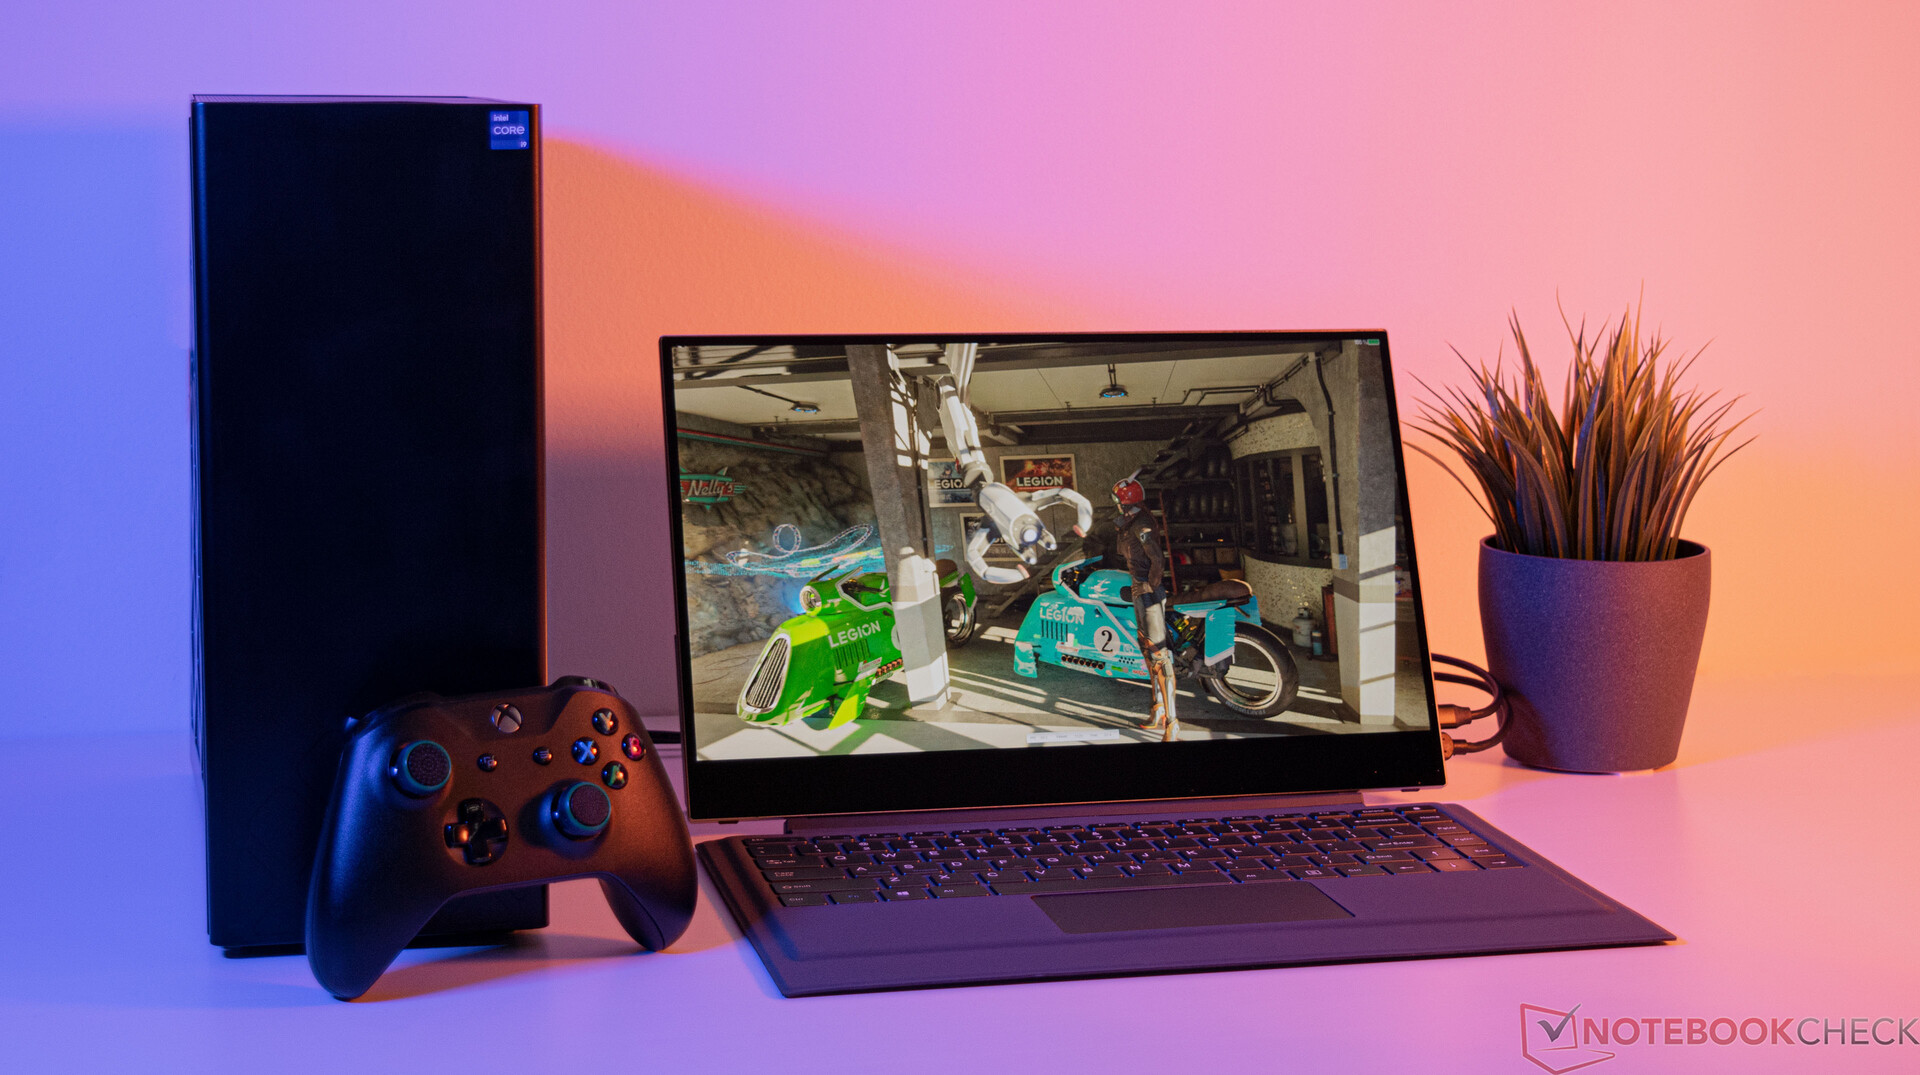
Following Beast Canyon and Dragon Canyon, Intel's latest Raptor Canyon NUC Extreme Kit significantly deviates from the design of its predecessors. However, Intel still aims for a very compact PC that leaves barely anything to be desired. Furthermore, a full-size graphics card can be installed. For the CPU, models from Intel's current Raptor Lake lineup are available. Users can of course also choose their own CPU, since the processor is not soldered. In this review, our NUC 13 Extreme Raptor Canyon uses an Intel Core i9-13900K. Additionally, the Nvidia GeForce RTX 3080 Ti provides sufficient 3D performance even for demanding gamers.
It should be noted that the Intel NUC 13 Extreme Kit is a barebone system that comes without an SSD, RAM, or a graphics card. The price depends on the included CPU. The base model with the Intel Core i5-13600K costs 1179 USD, while the highest-end configuration is available for 1549 USD.
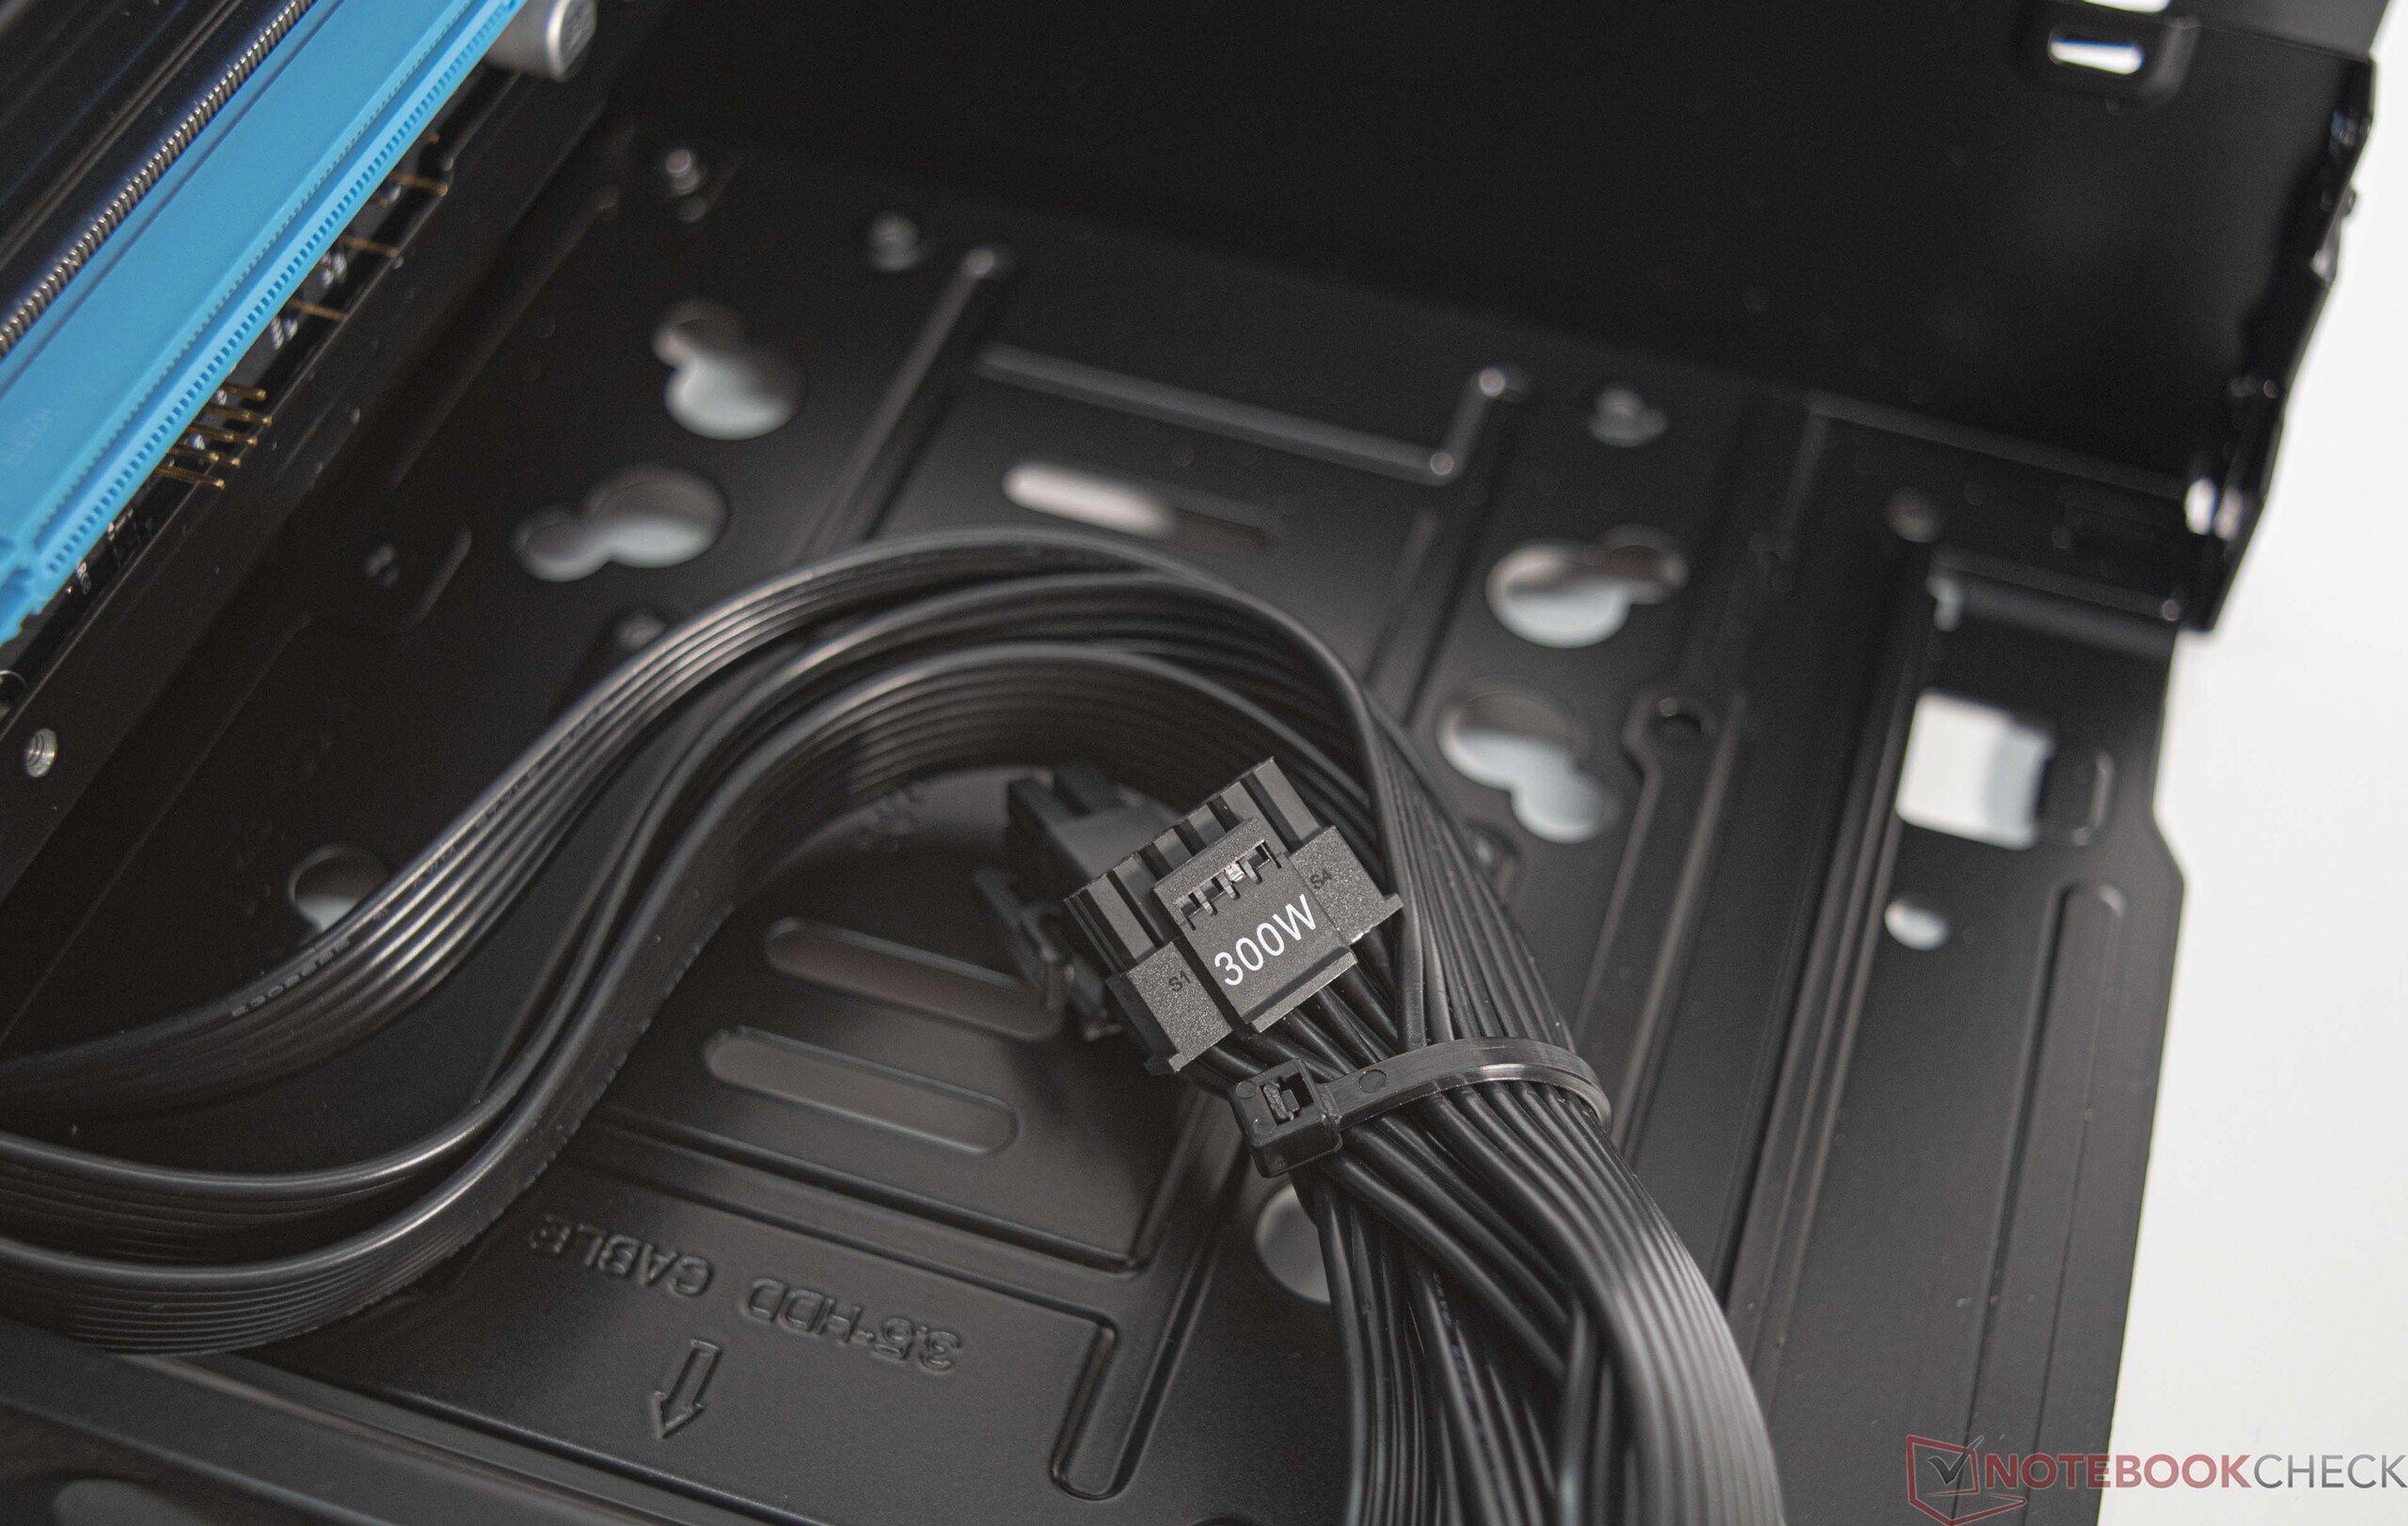
Dedicated graphics solutions with a maximum length of 31 cm (~12 in) are supported. Thanks to the included 750-watt SFX power supply, even current high-end GPU models can be used. Theoretically, it is possible to fit even an Nvidia GeForce RTX 4090 FE. The problem is the 12VHPWR cable, which can only supply up to 300 watts. Since the power supply only comes with three 6+2 cables for the GPU, the power budget is limited to 450 watts anyway.
Intel NUC 13 Extreme Raptor Canyon
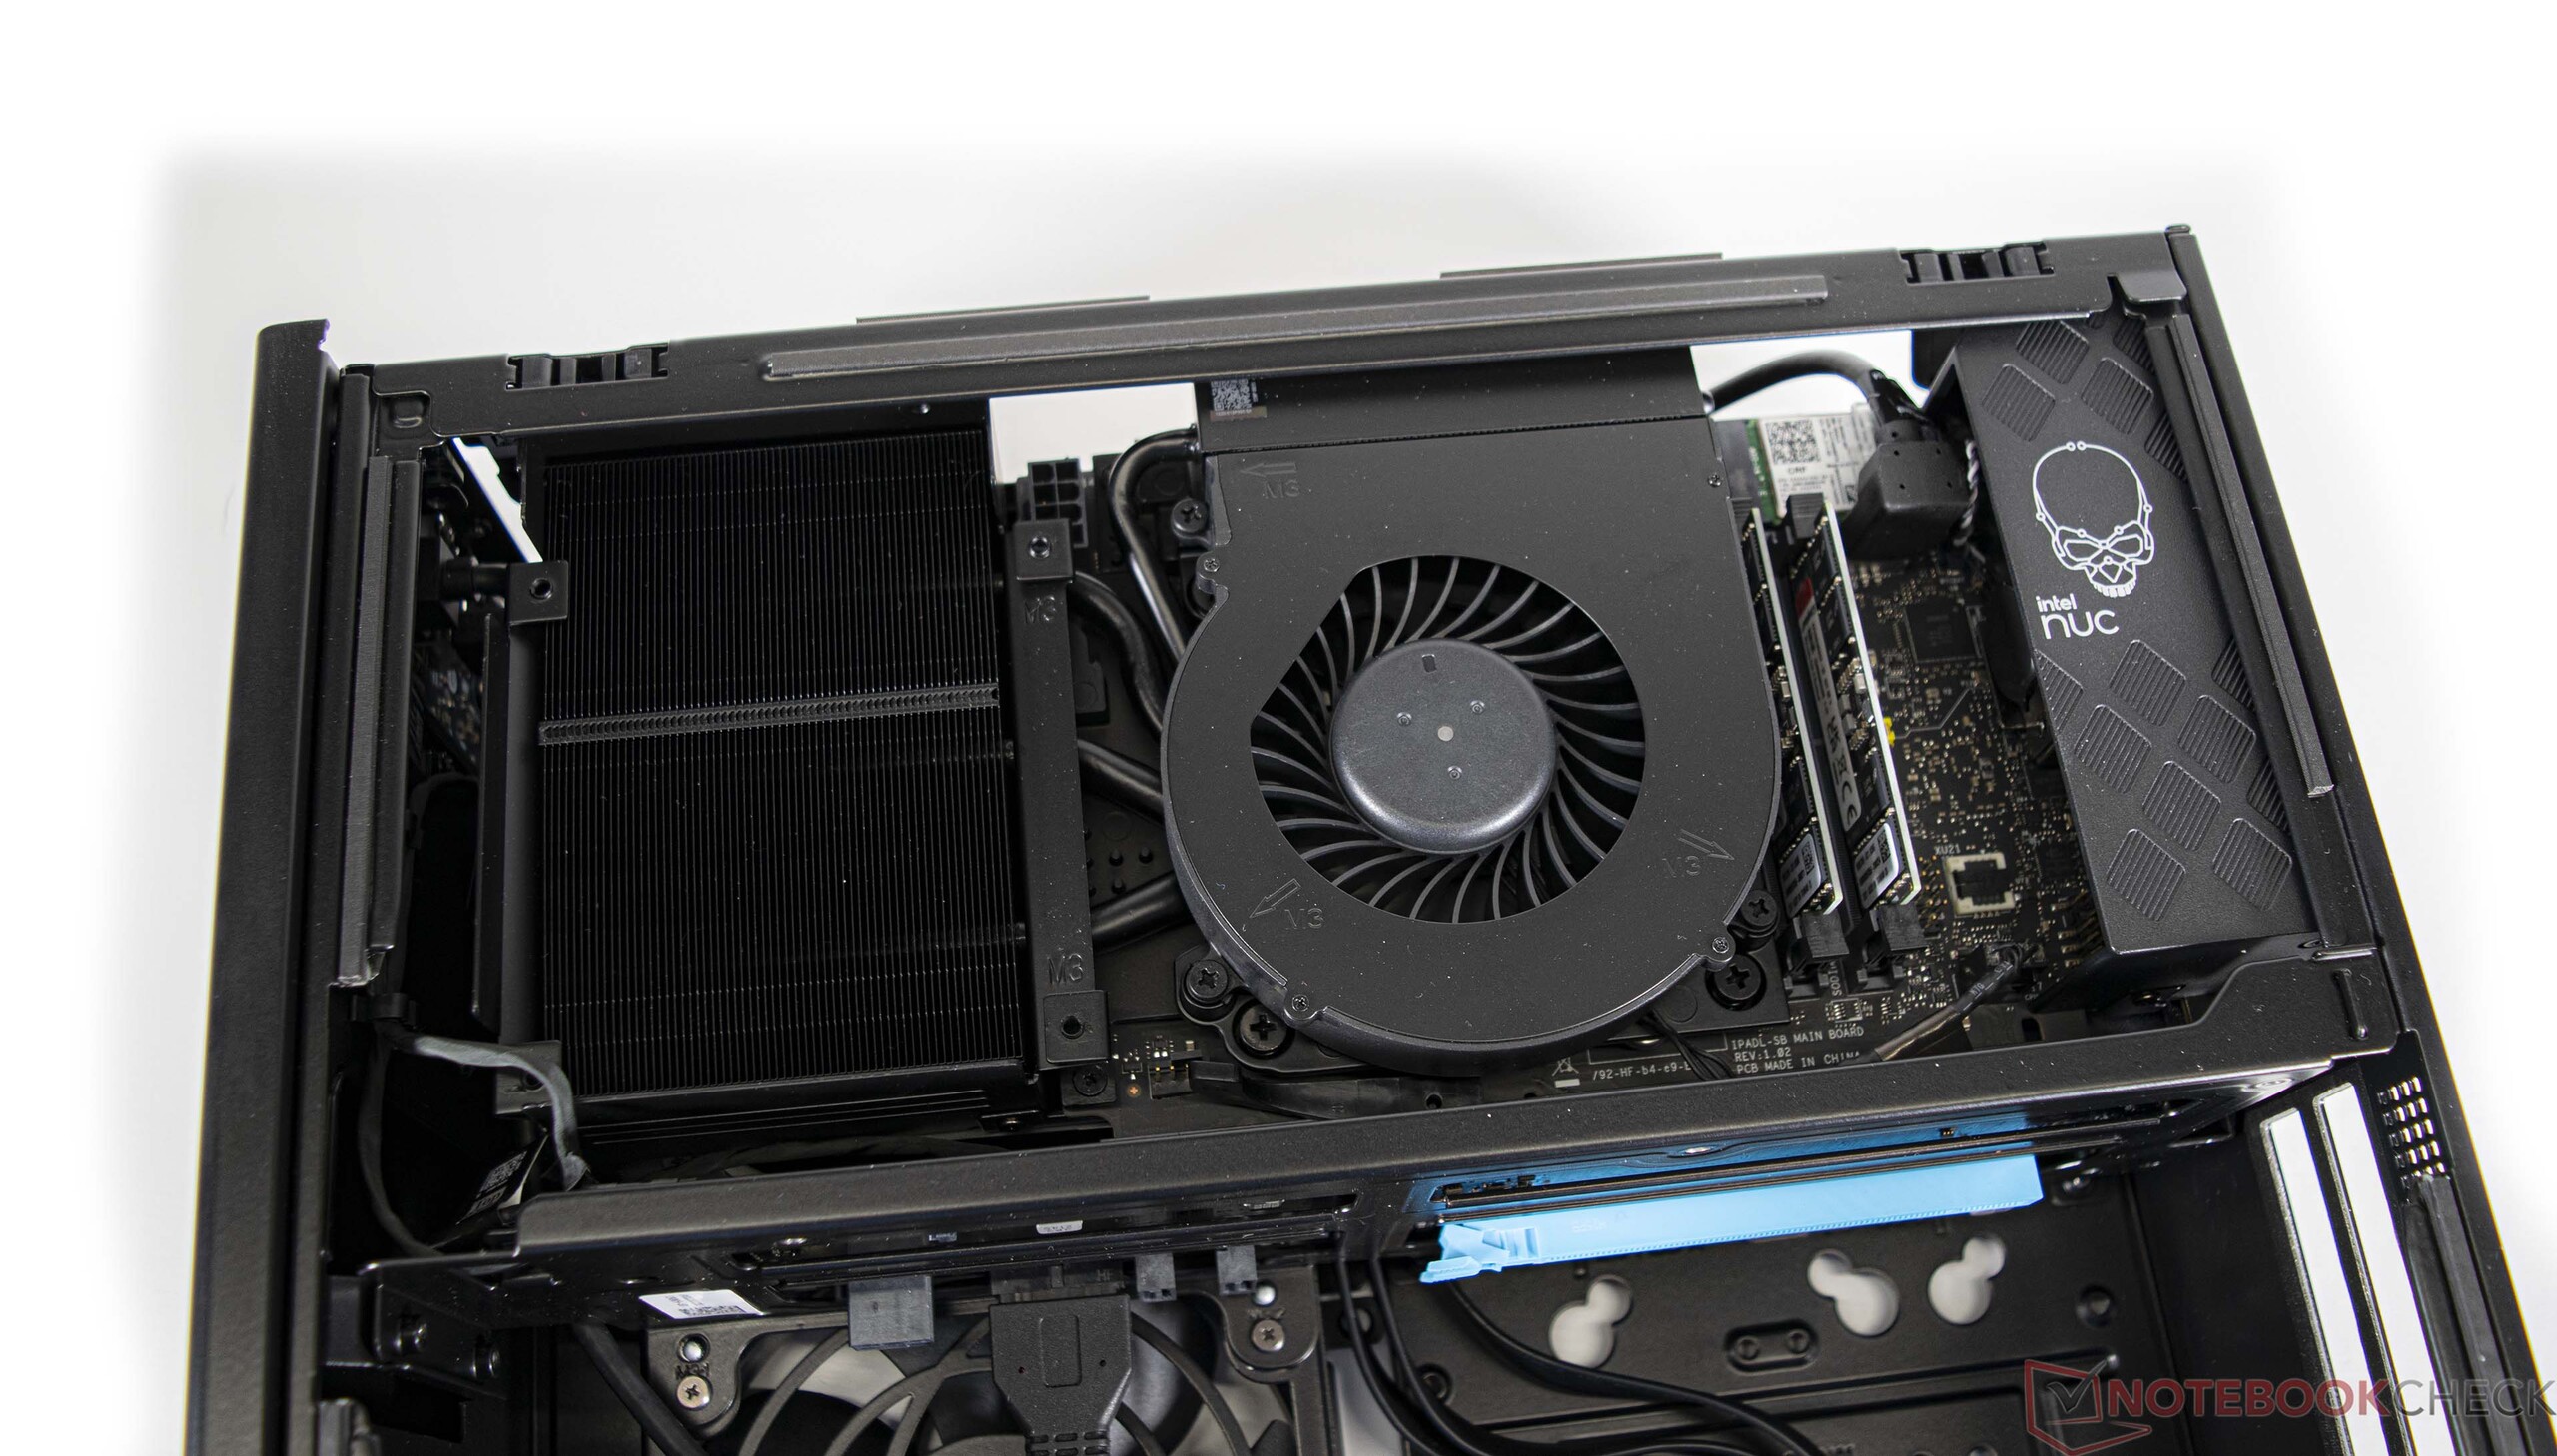

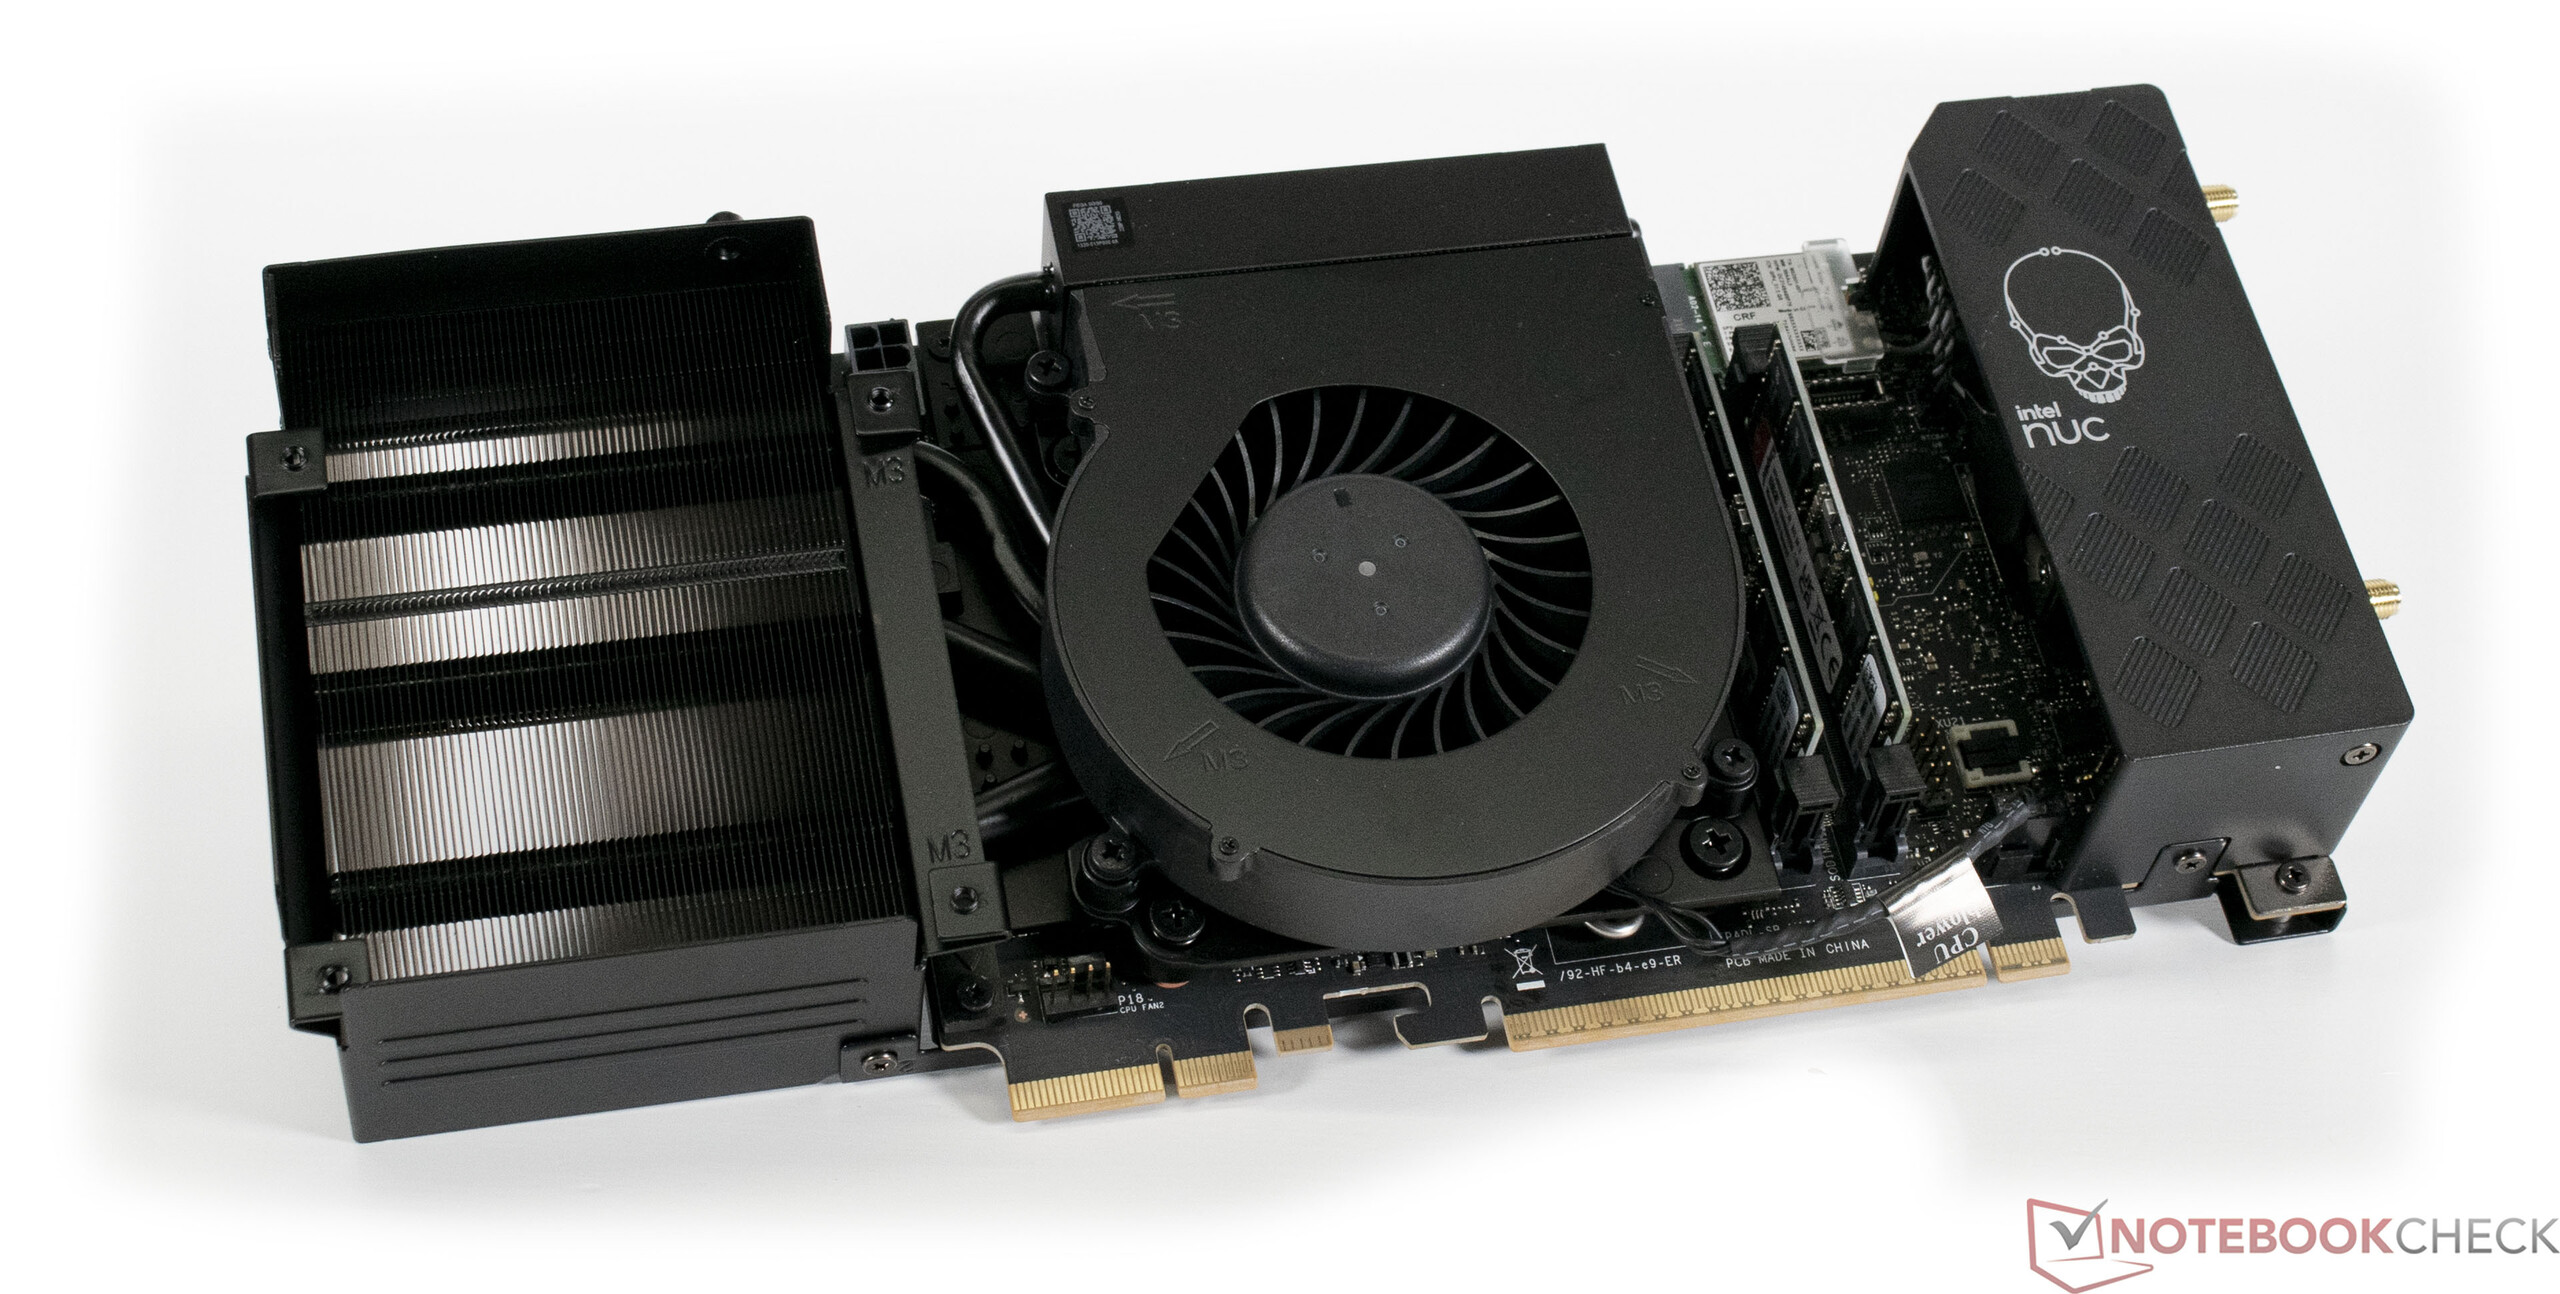
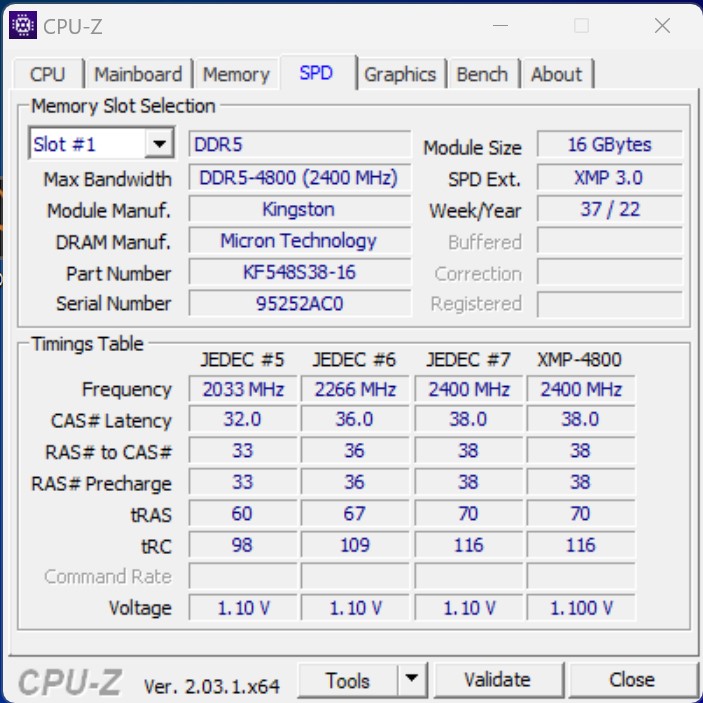
Intel NUC 13 Extreme Compute Element in Detail
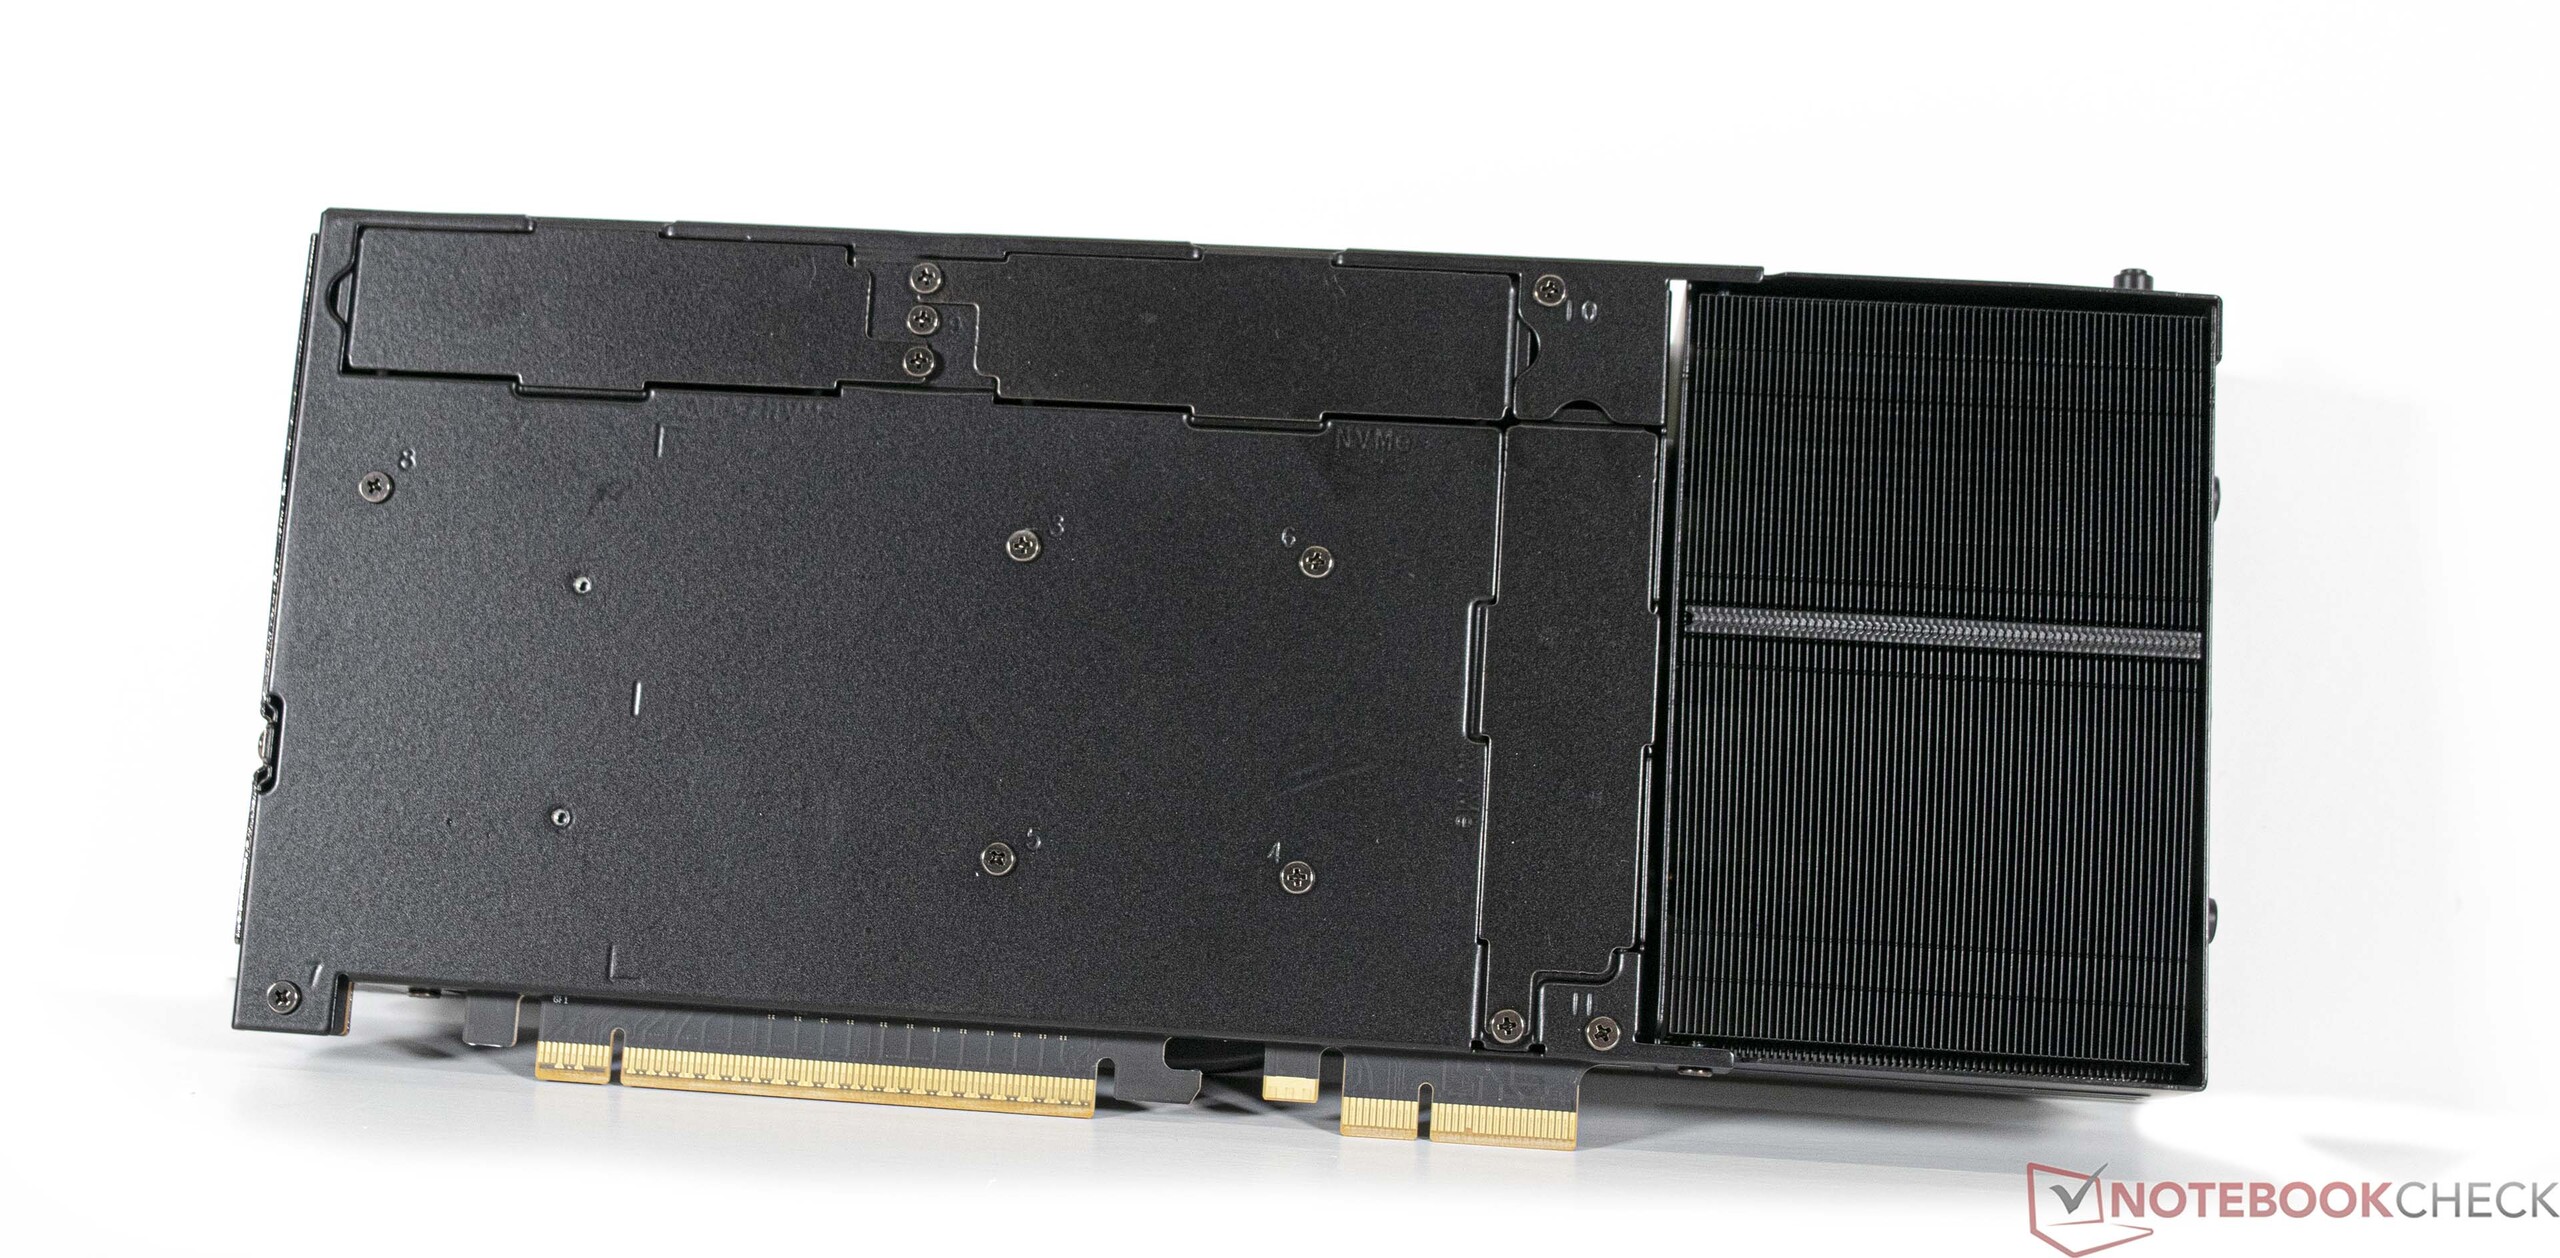
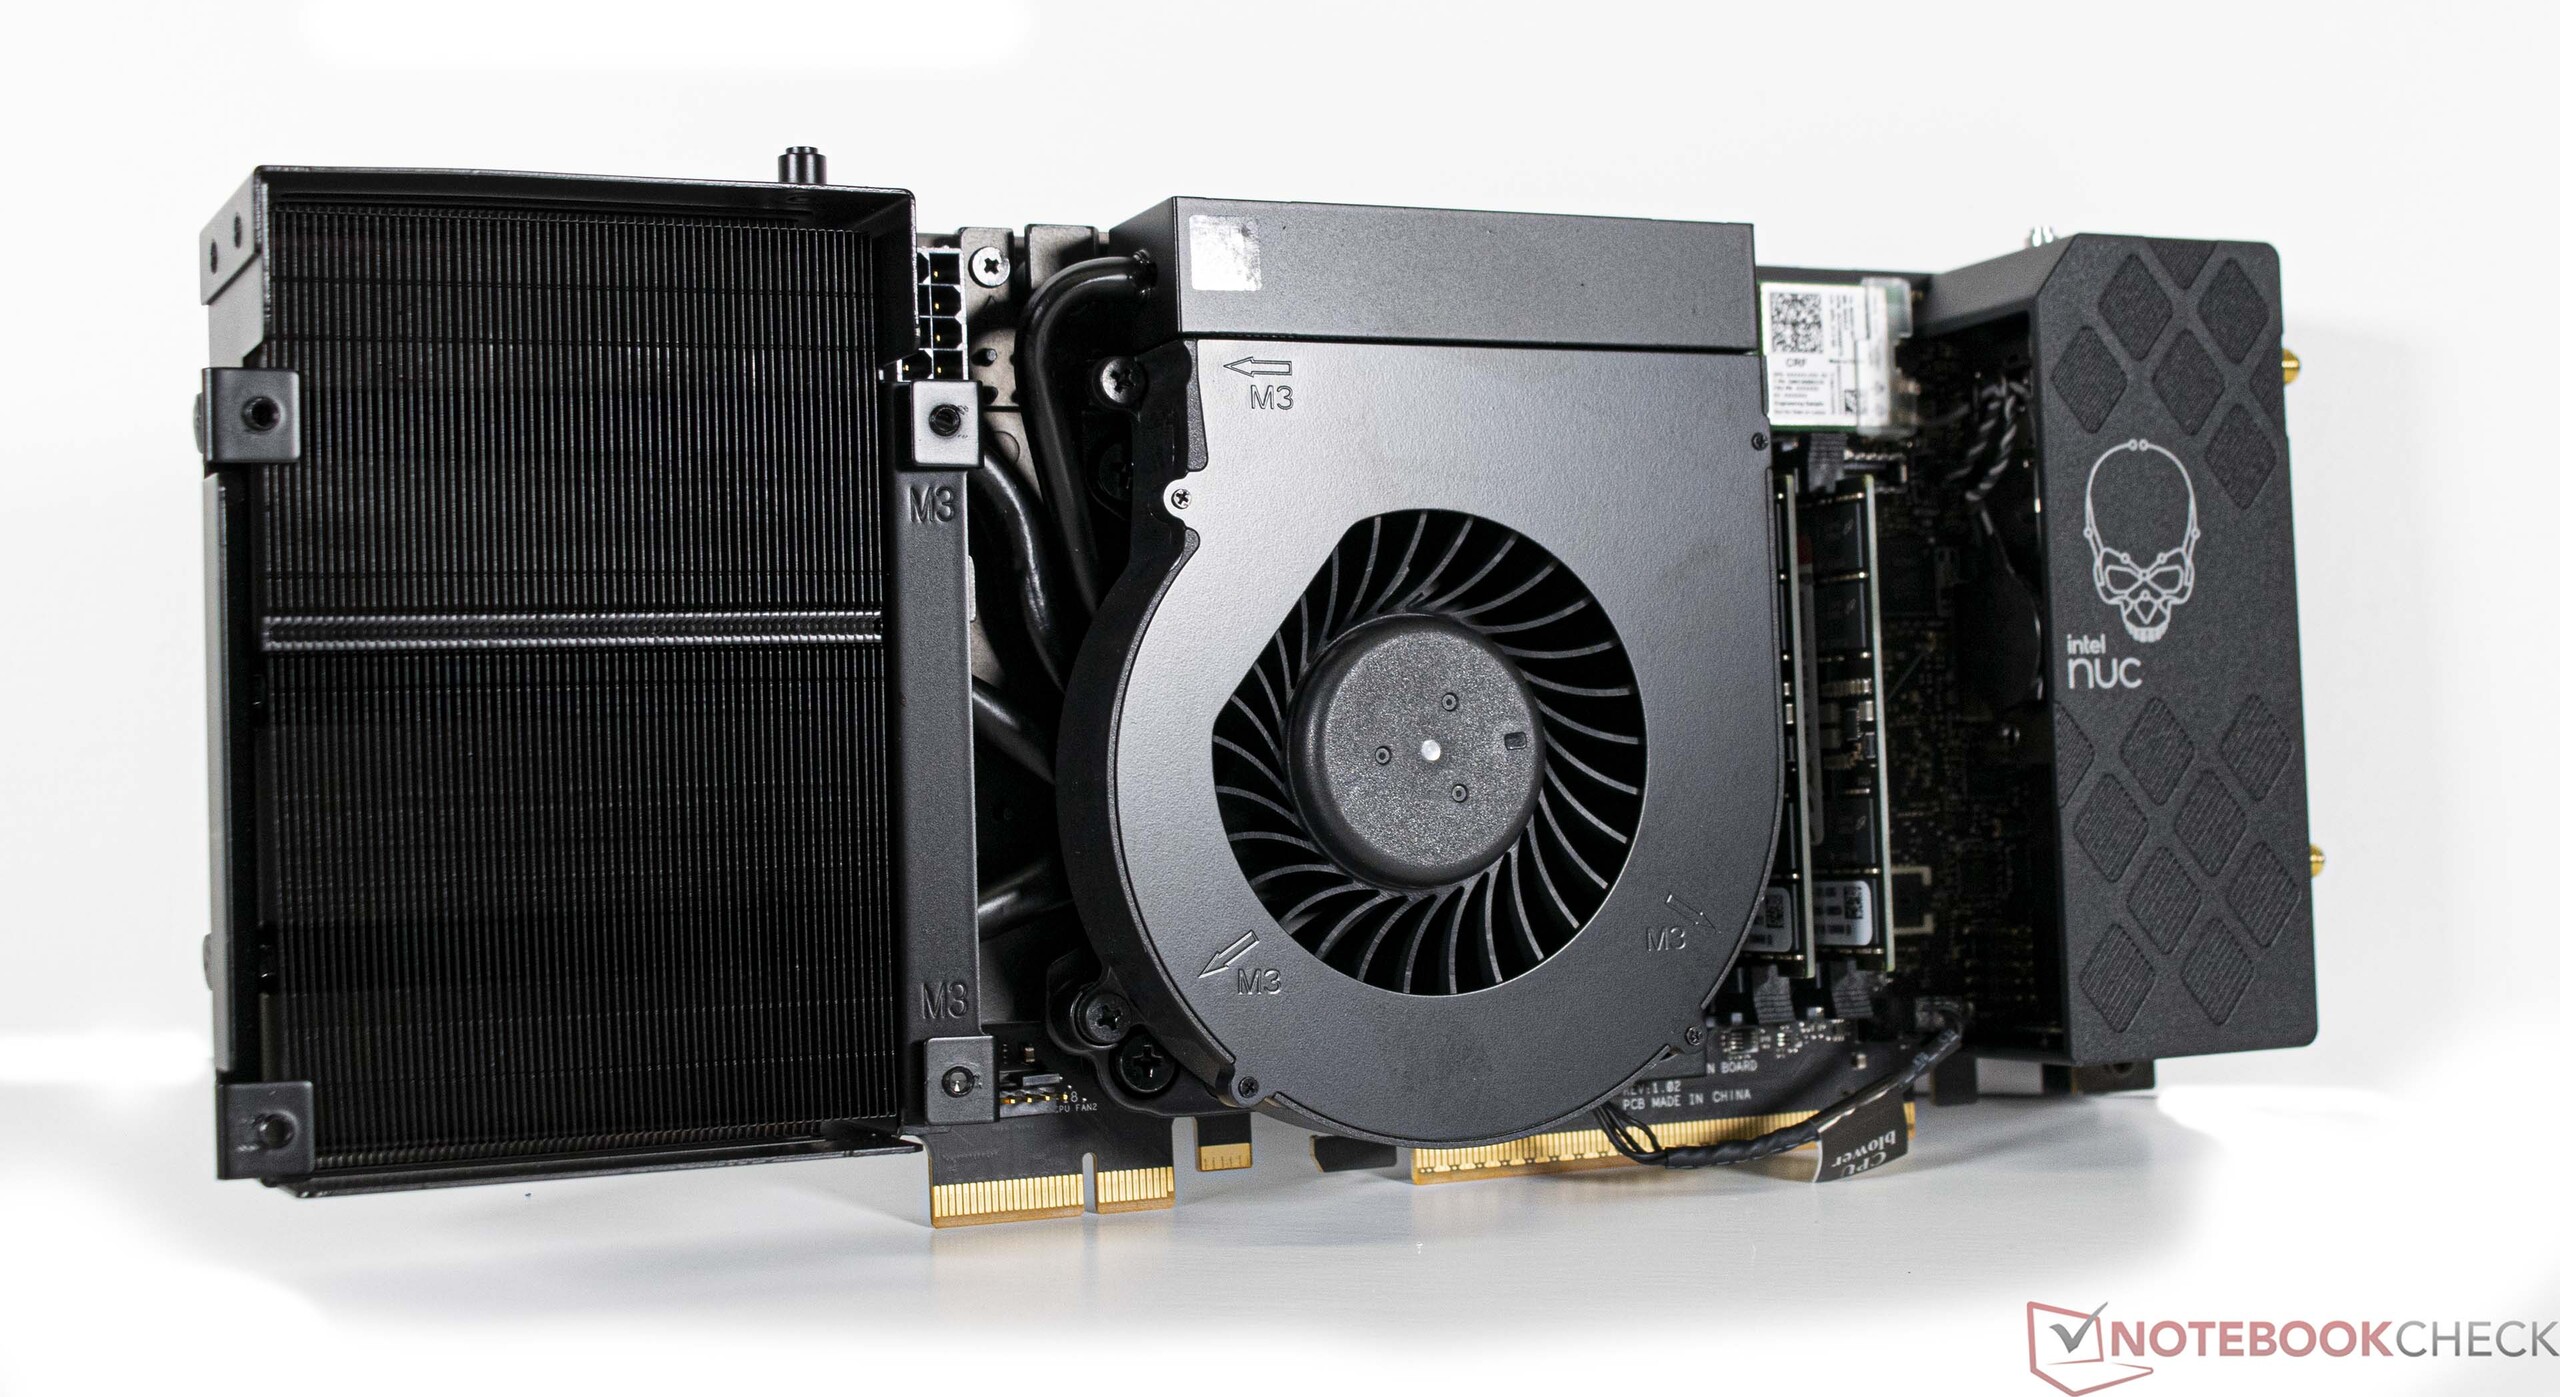
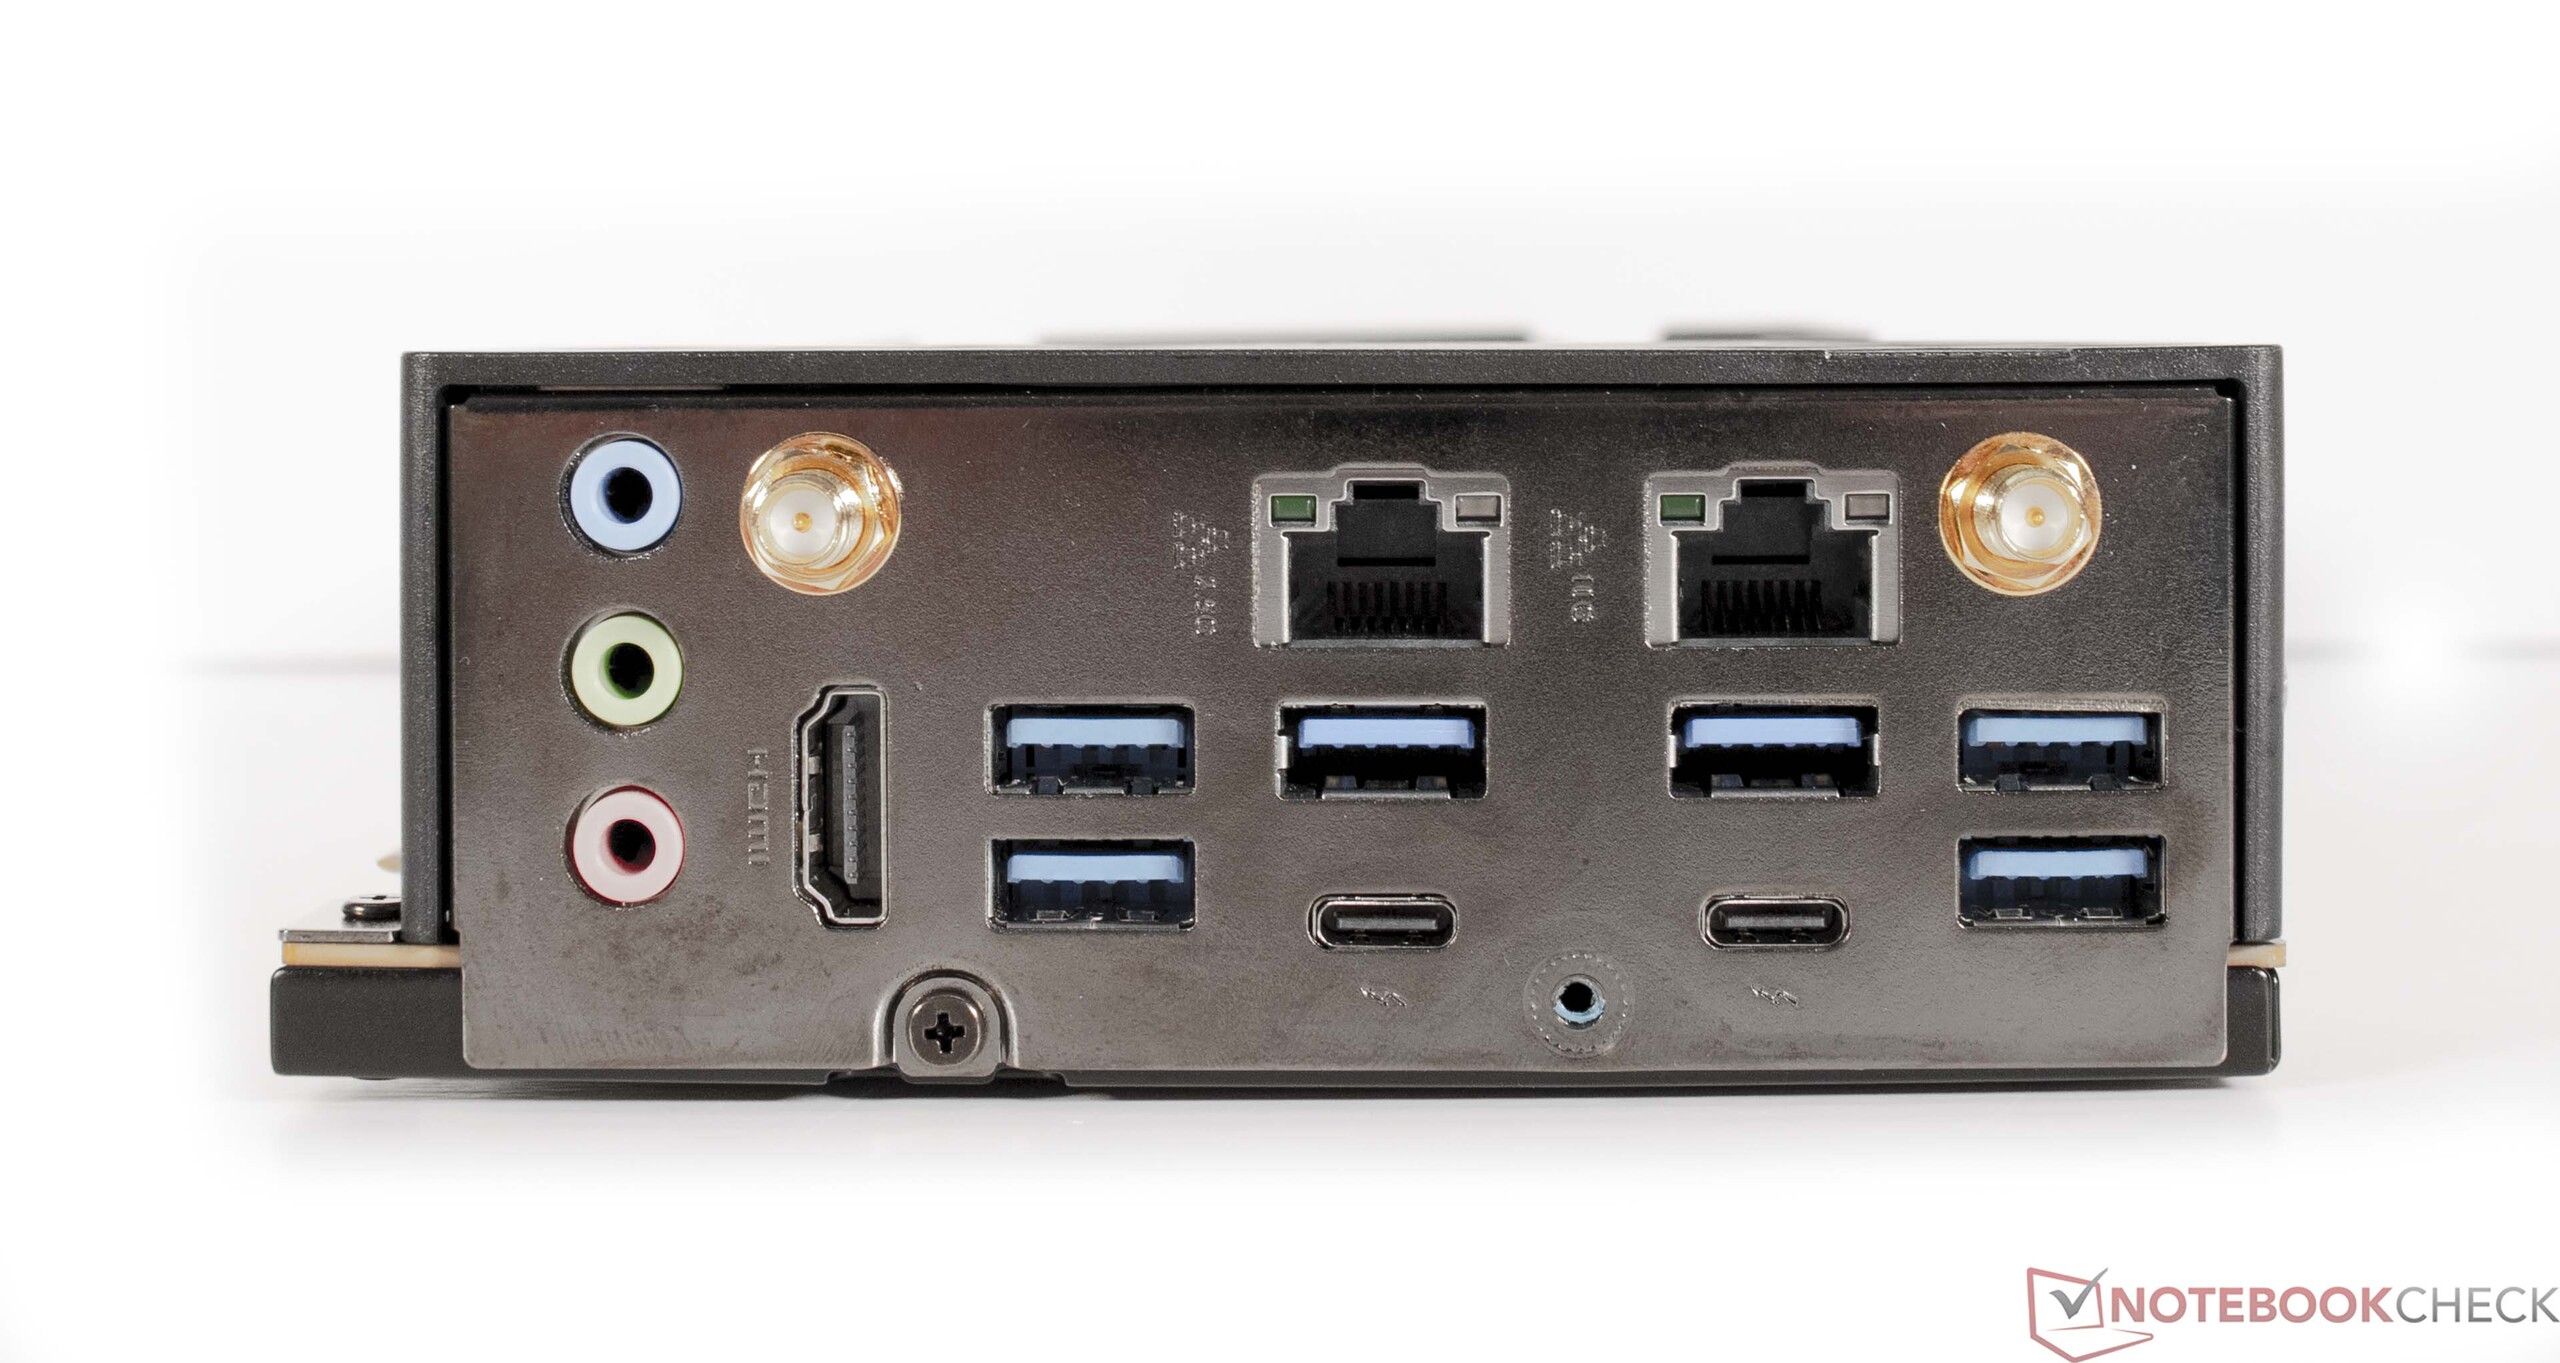
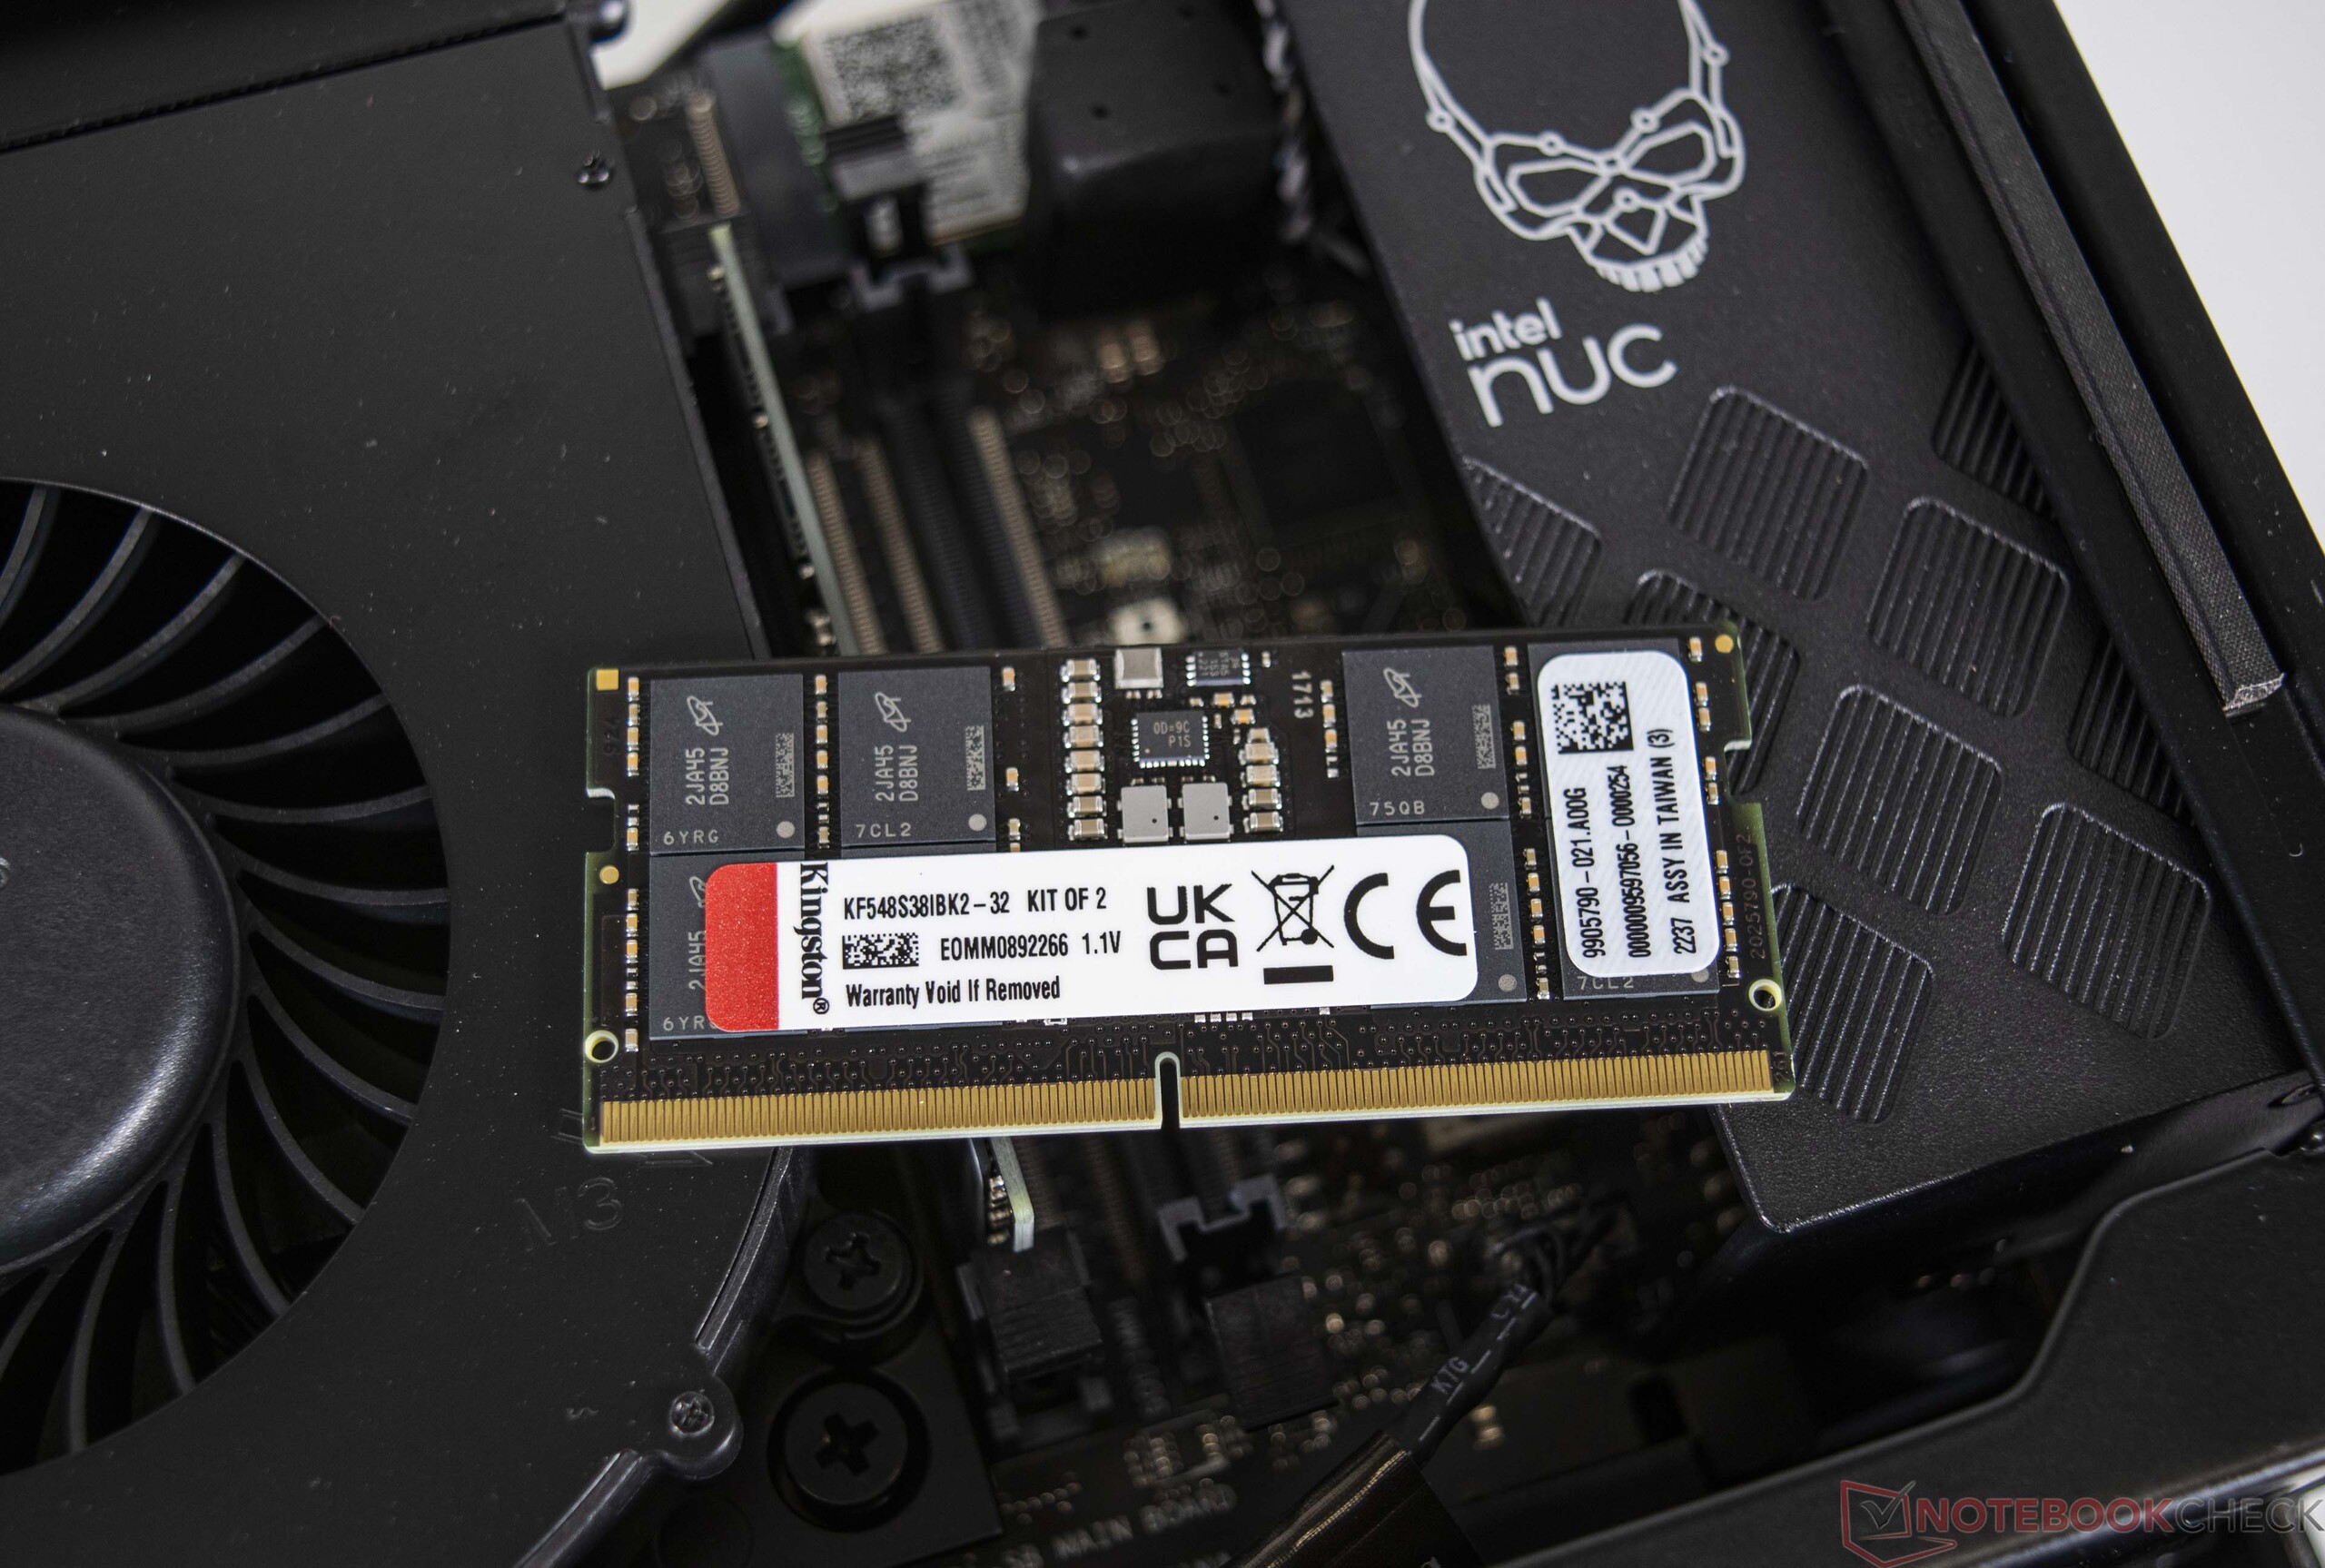
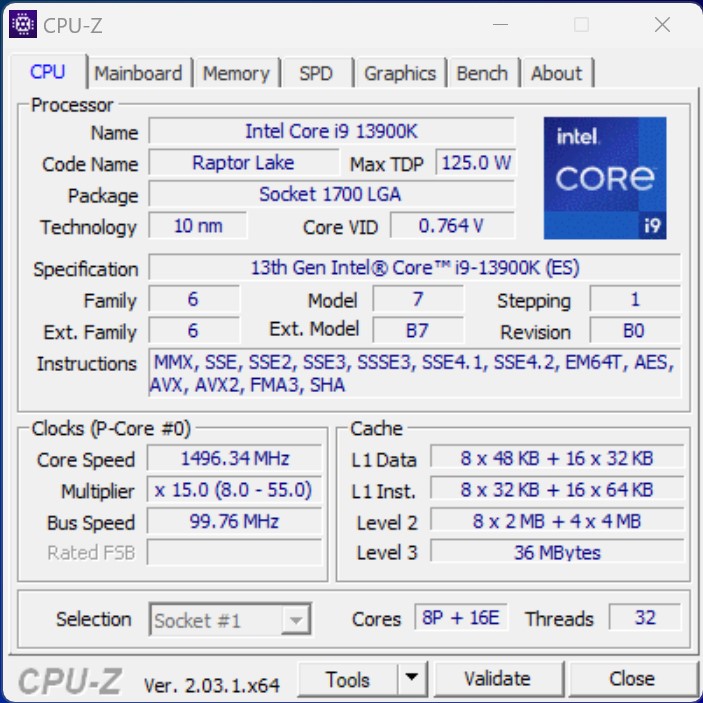
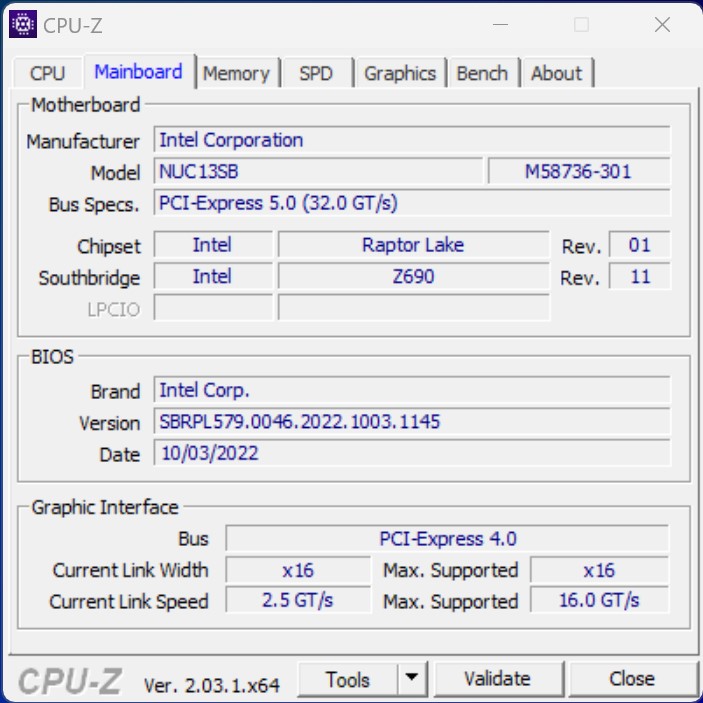
With the Intel Core i9-13900K, our configuration of the Intel NUC 13 Extreme comes with the fastest gaming CPU available right now. It has a total of 24 cores and 32 threads. It has become common knowledge that the Raptor Lake generation CPUs use a hybrid design featuring E and P cores. Like on the Intel NUC 12 Extreme, its predecessor also includes a standard desktop processor. Additionally, the Compute Element comes with all the necessary ports. There are three NVMe SSD slots on the bottom of the PCB and all external interfaces on the side.
Wi-Fi Performance
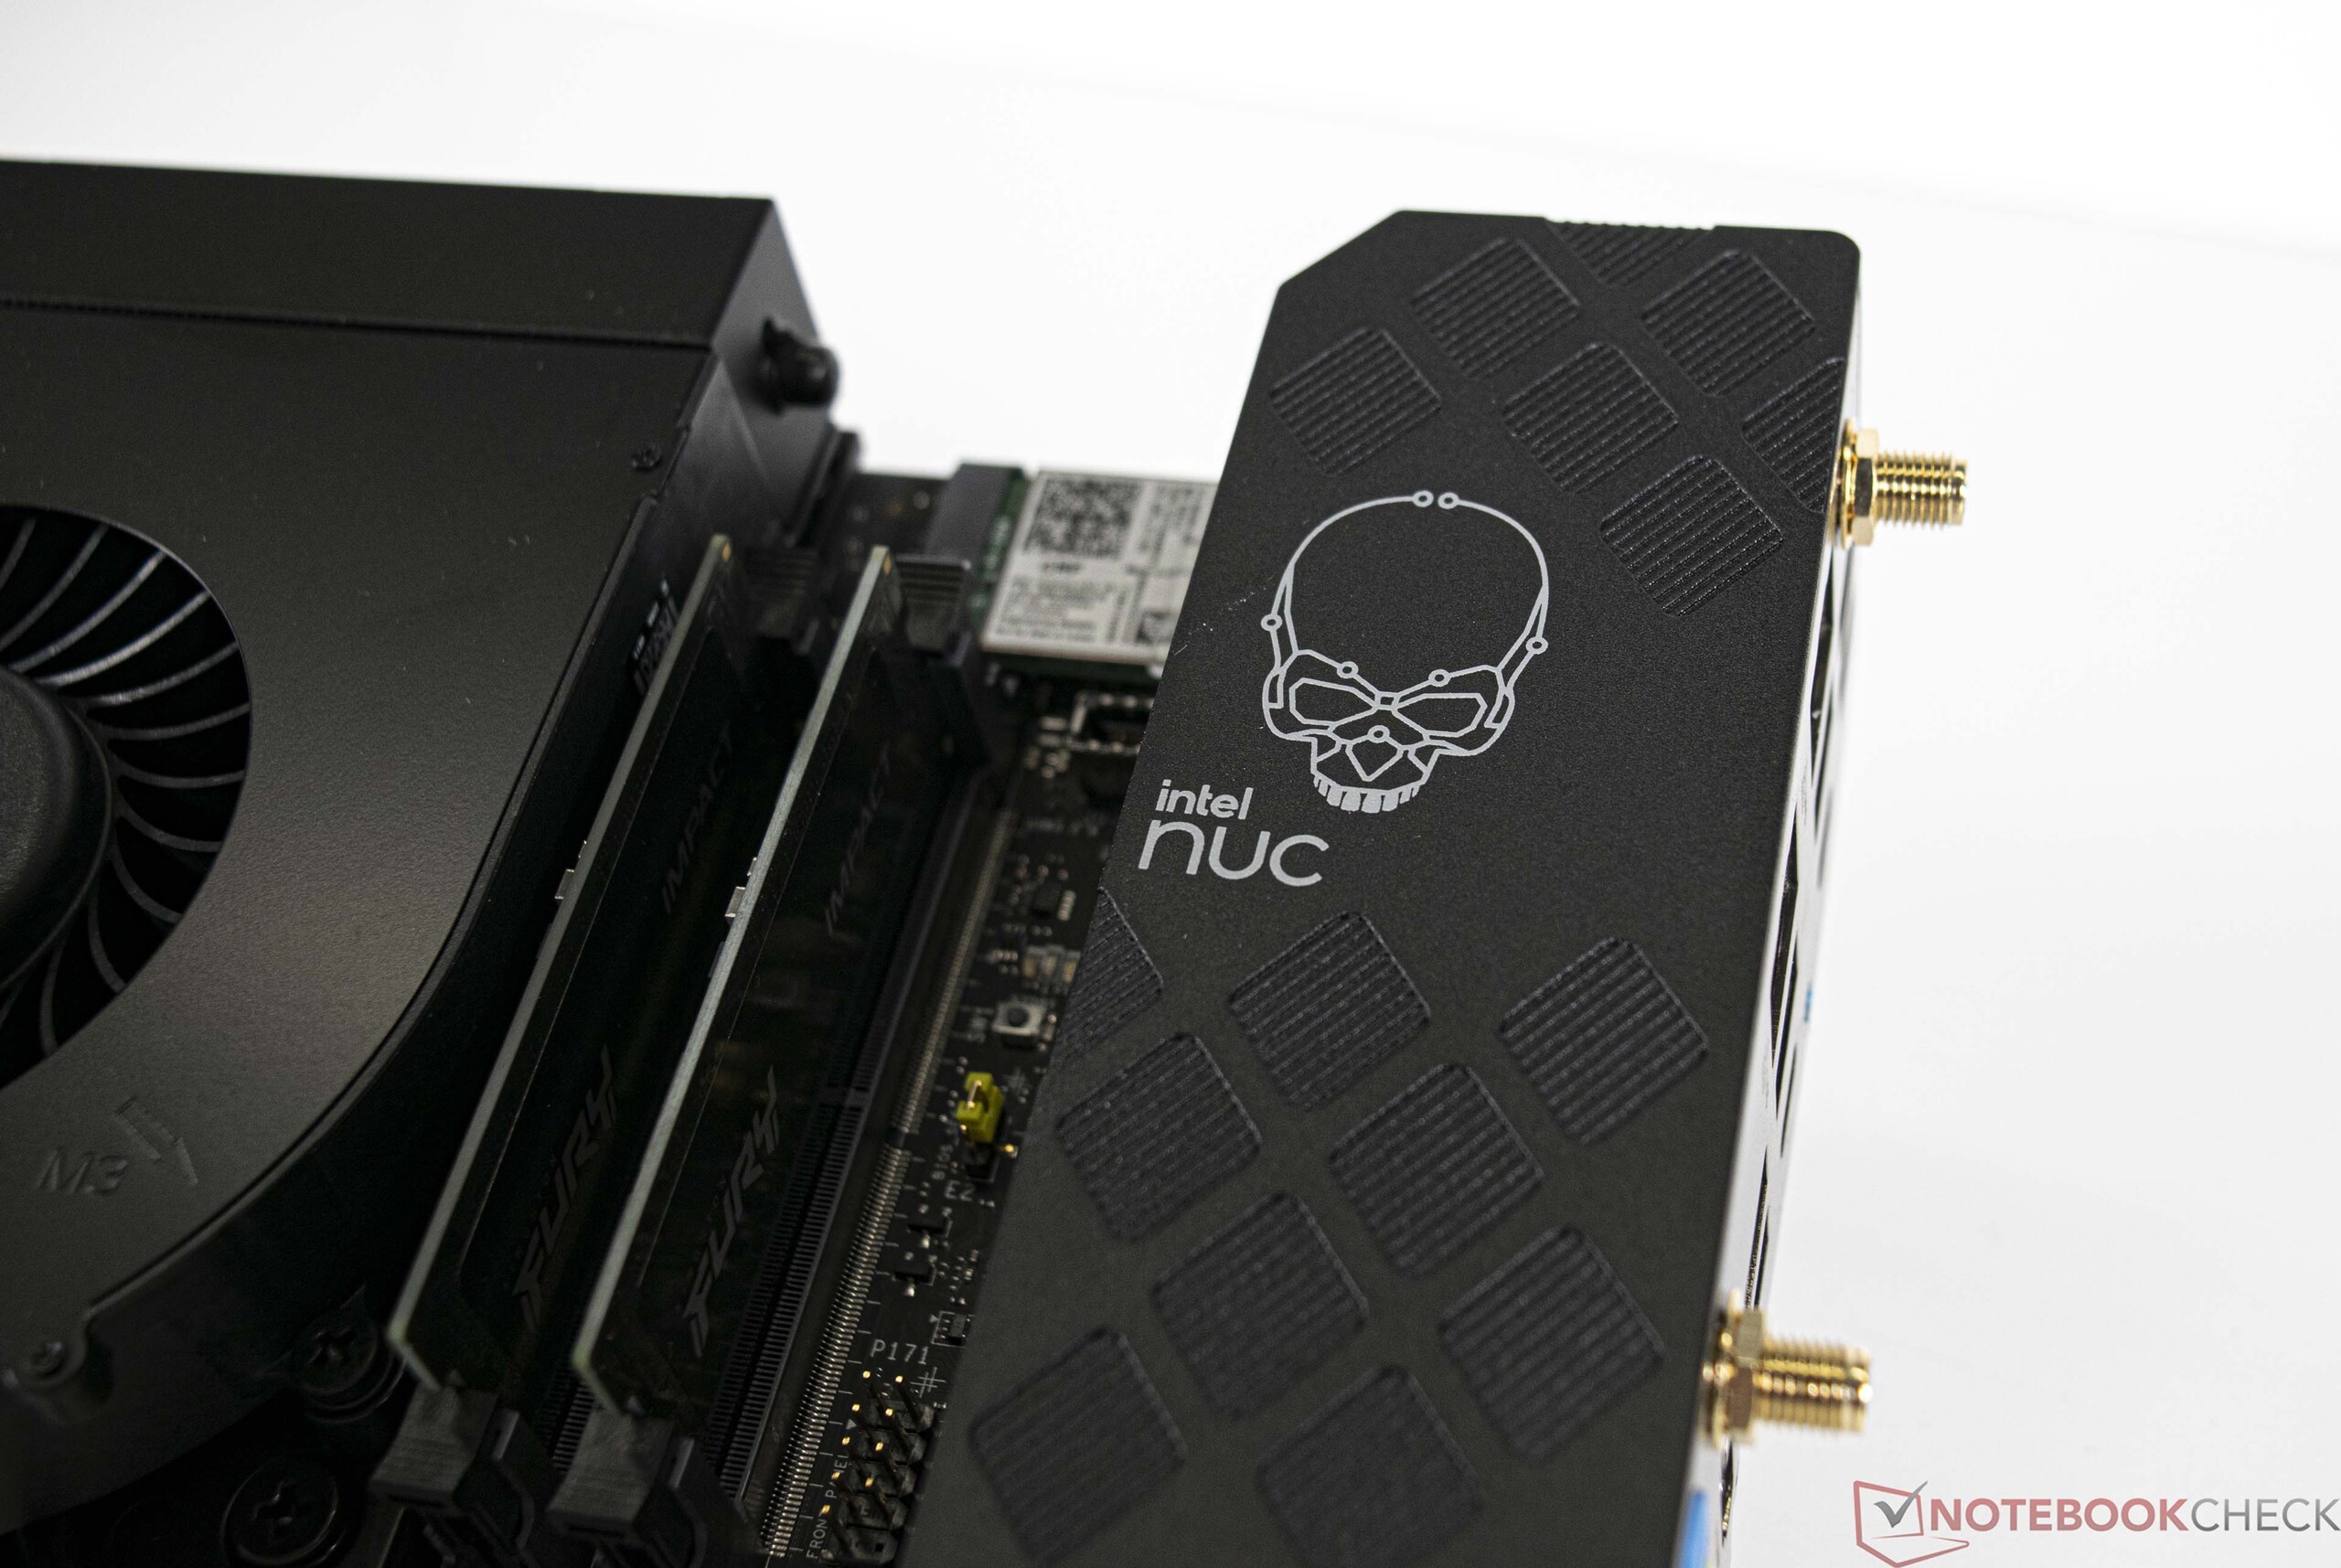
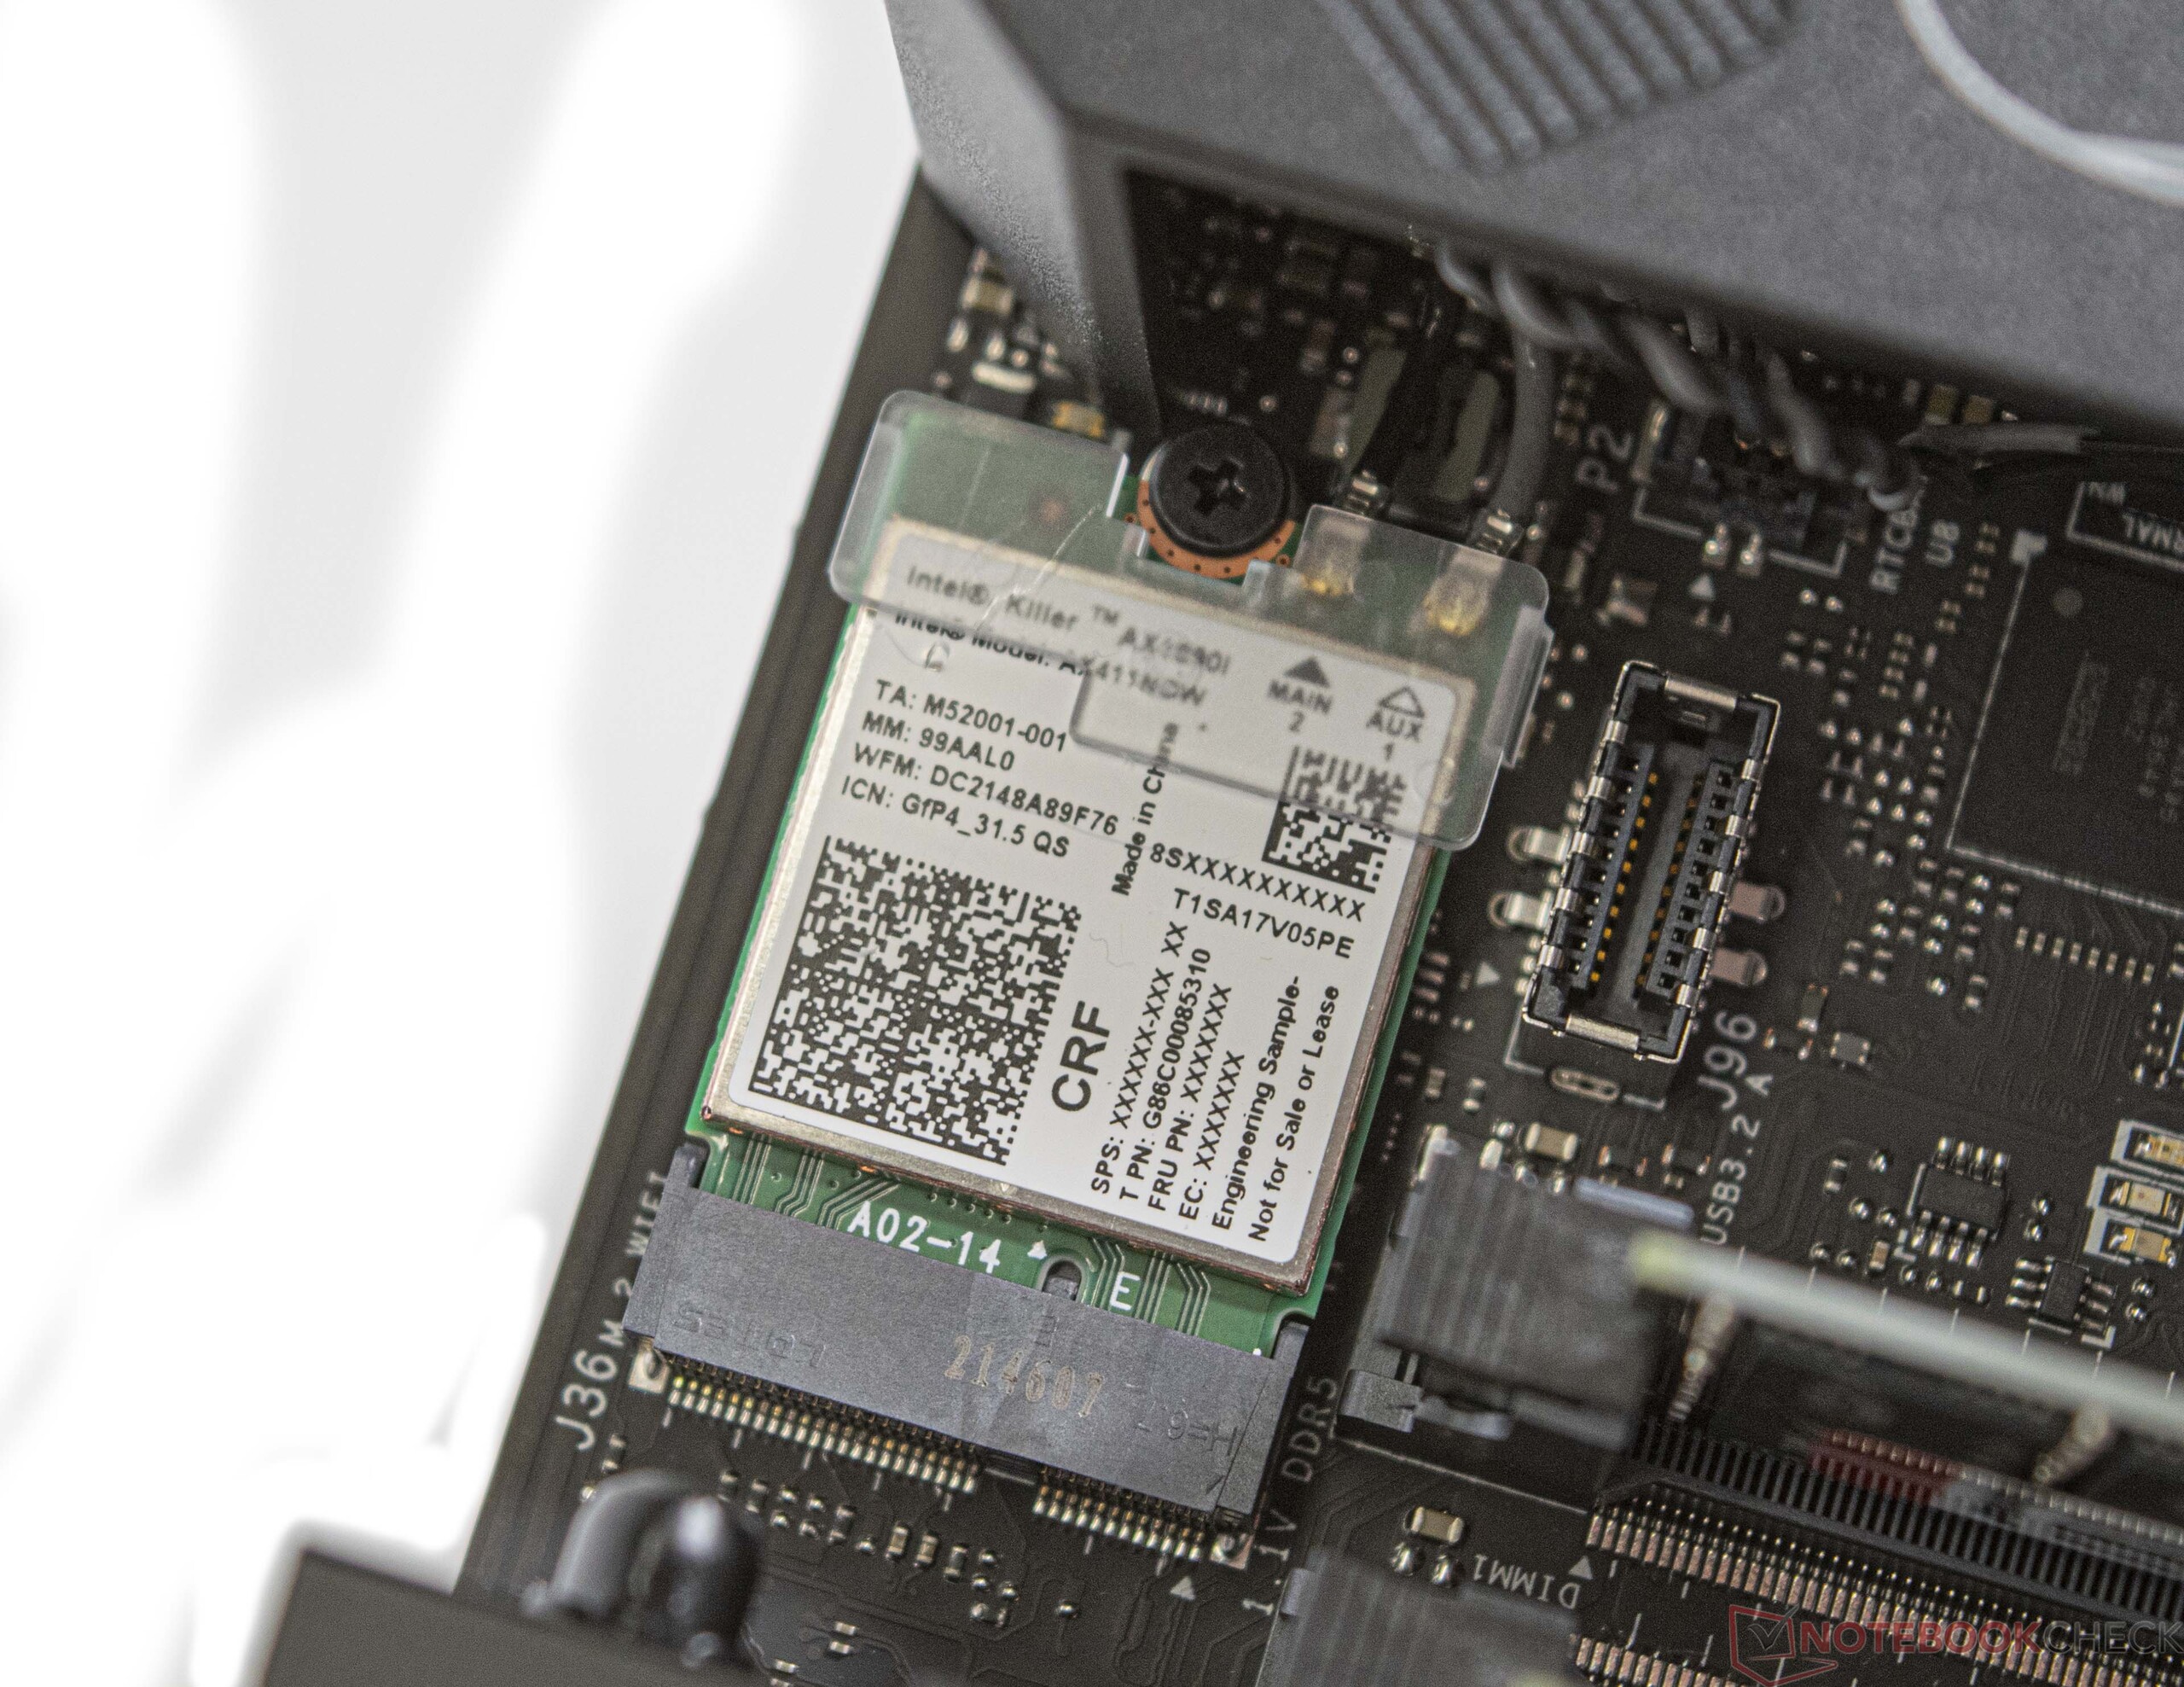
The Intel NUC 13 Extreme Raptor Canyon integrates the Killer Wi-Fi 6E AX1690i Wi-Fi module. In conjunction with our Asus ROG Rapture GT-AXE11000 reference router, we measure good upload and download speeds. The Wi-Fi unit is a module on the Compute Element and thus user replaceable. For wired communication, both a 10Gb/s and a 2.5Gb/s interface is available.
Note:
We were unable to get a stable Wi-Fi 6G connection with our test device. Updating the components with the latest drivers and firmware updates for the Intel NUC 13 Extreme Raptor Canyon as well as our test router did not improve things. We will revise this part of the review if the situation changes within the next couple of days before we have to return the device.
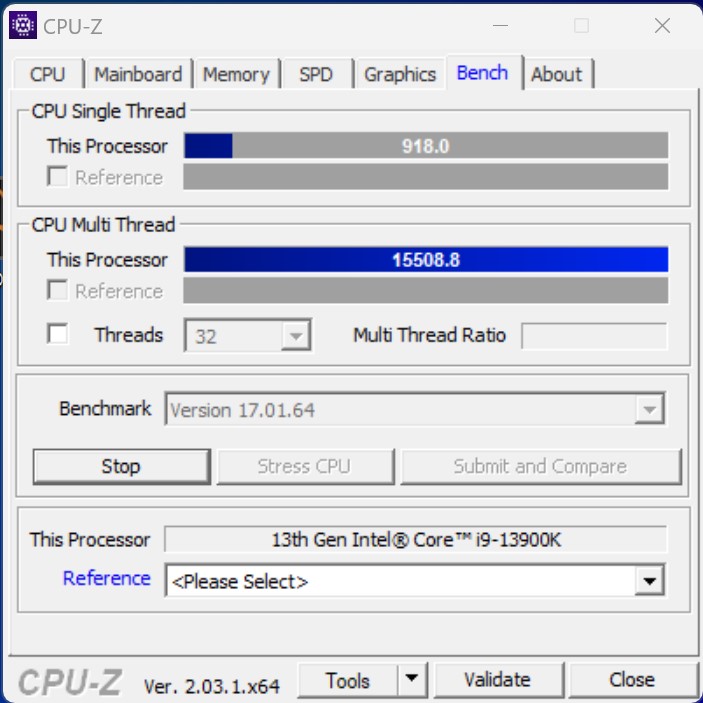
Processor Benchmarks
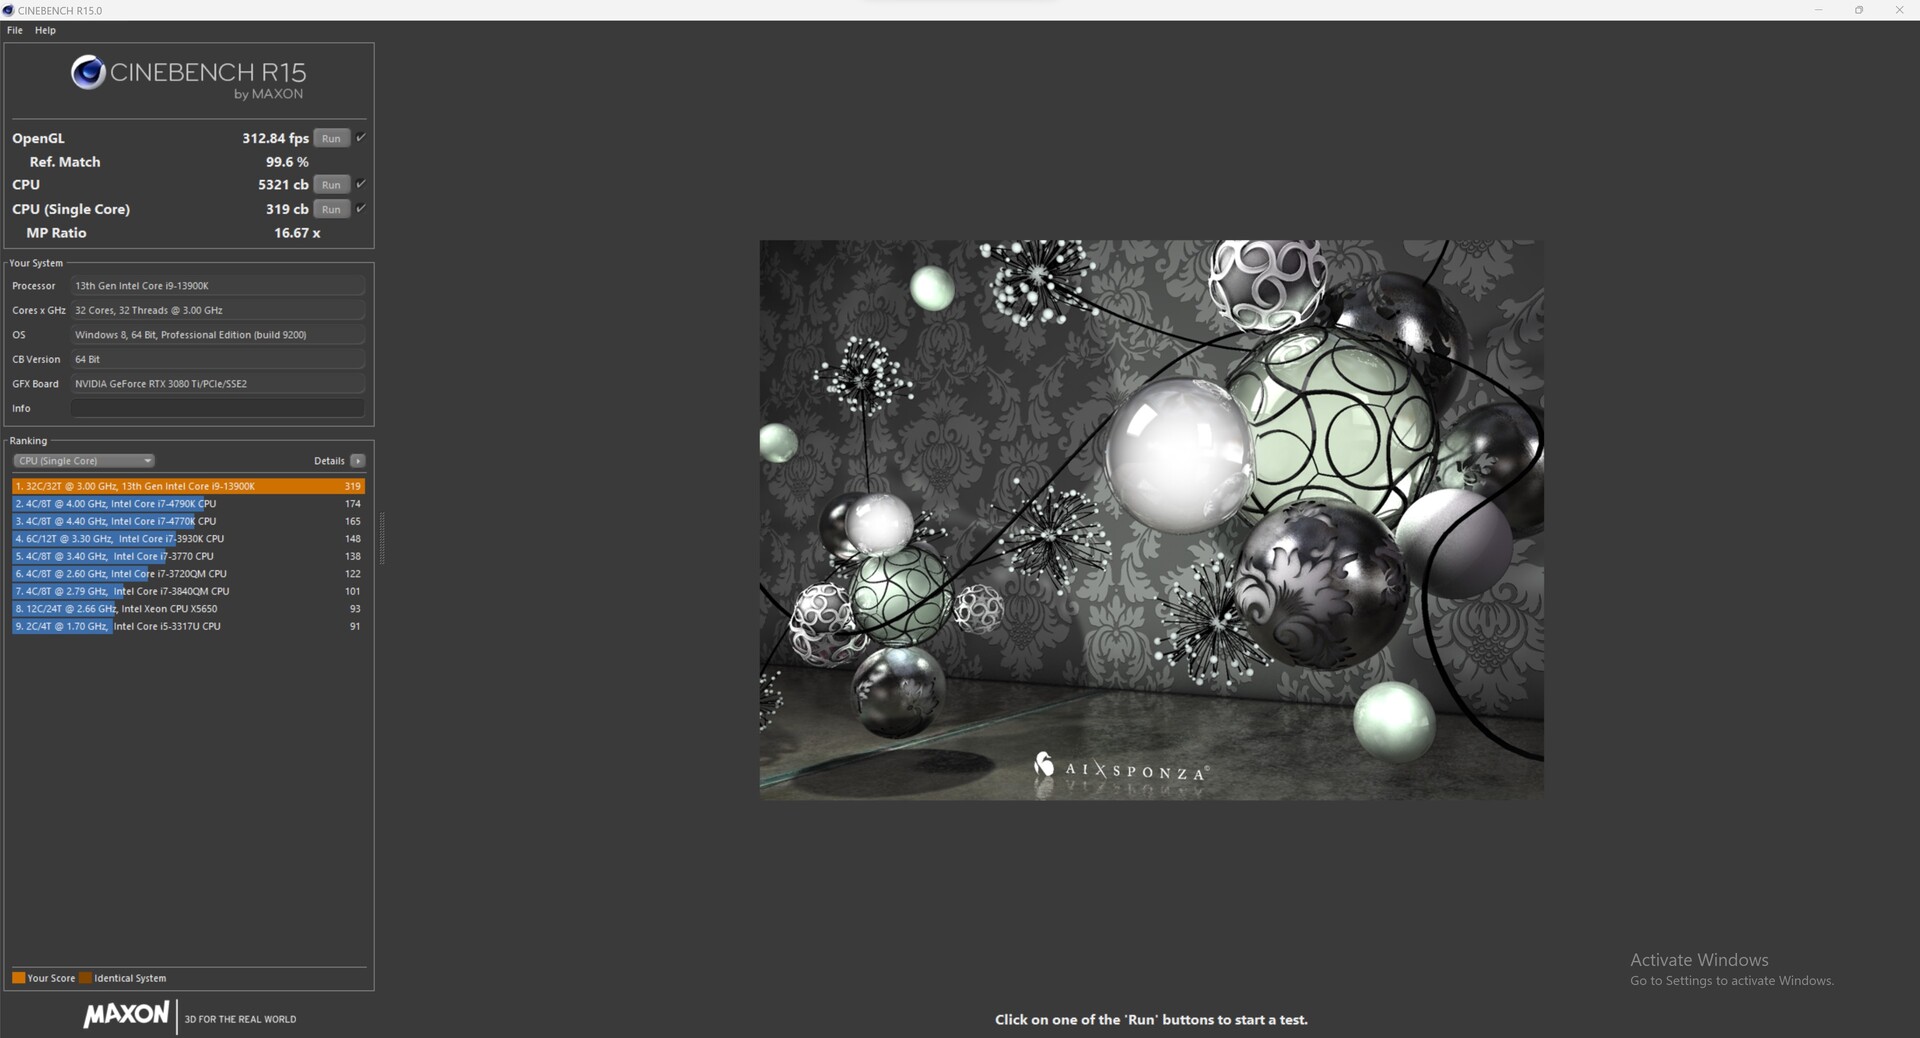
With the Intel Core i9-13900K, the Intel NUC 13 Extreme Raptor Canyon uses Intel's fastest gaming CPU. As such, the good benchmark results match our expectations. Despite the relatively small cooling solution, we measure a performance deficit of only 7 % compared to a different desktop system with a powerful liquid cooler.
In terms of the power limits there are some small limitations and the 150-watt limit explains the small difference. Most applications will not make use of the full 250 watts. When combining the Intel NUC 13 Extreme Raptor Canyon with the less powerful Intel Core i5-13600K, the performance level should match the results in our comparison table. The lower PL2 (181 watts) will likely compensate part of the deficit under full load.
More processor benchmarks can be found here.
| Performance rating - Percent | |
| Intel Core i9-13900K | |
| AMD Ryzen 9 7950X | |
| Intel Core i9-13900K | |
| AMD Ryzen 9 7900X | |
| Intel Core i9-12900K | |
| Intel Core i5-13600K | |
| AMD Ryzen 5 7600X | |
| Intel Core i5-12600K | |
| Cinebench R15 | |
| CPU Single 64Bit | |
| AMD Ryzen 9 7950X | |
| Intel Core i9-13900K | |
| AMD Ryzen 9 7900X | |
| Intel Core i9-13900K | |
| AMD Ryzen 5 7600X | |
| Intel Core i5-13600K | |
| Intel Core i9-12900K | |
| Intel Core i5-12600K | |
| CPU Multi 64Bit | |
| AMD Ryzen 9 7950X | |
| Intel Core i9-13900K | |
| Intel Core i9-13900K | |
| AMD Ryzen 9 7900X | |
| Intel Core i9-12900K | |
| Intel Core i5-13600K | |
| Intel Core i5-12600K | |
| AMD Ryzen 5 7600X | |
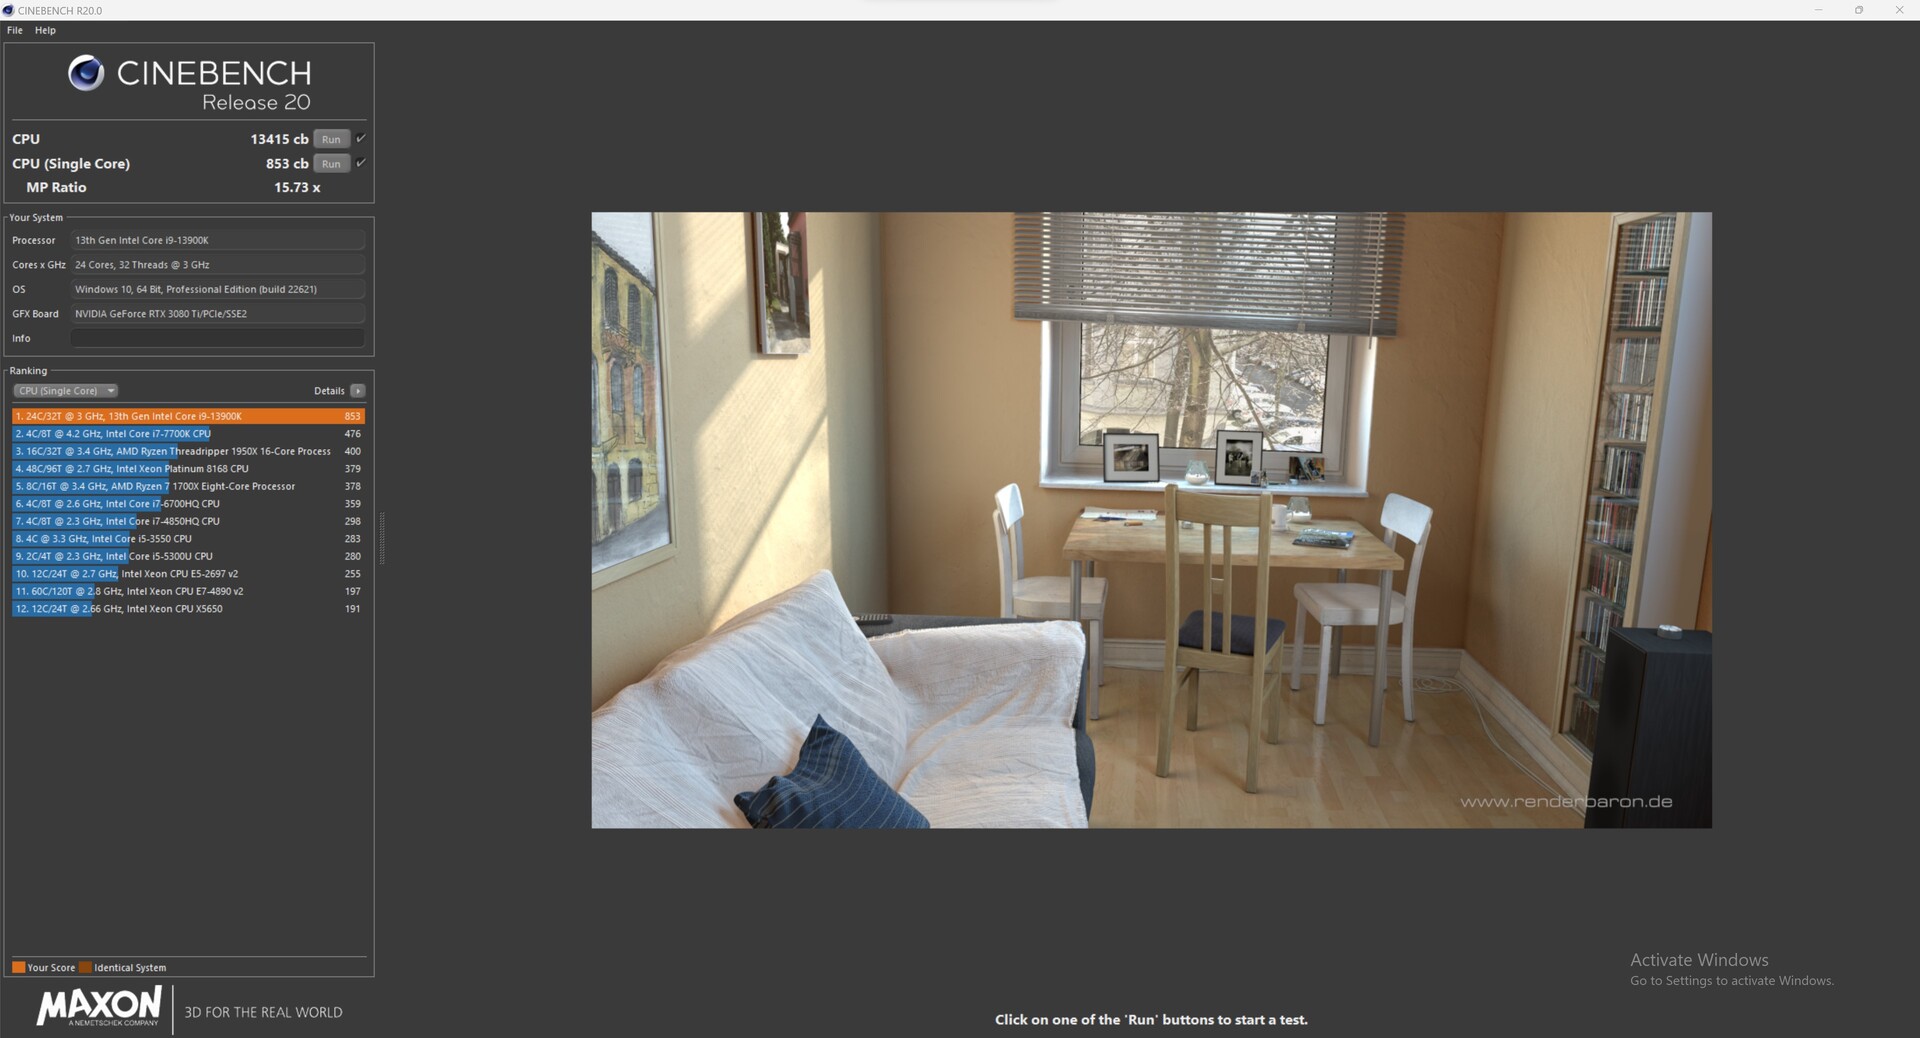
| Cinebench R20 | |
| CPU (Single Core) | |
| Intel Core i9-13900K | |
| Intel Core i9-13900K | |
| AMD Ryzen 9 7950X | |
| AMD Ryzen 9 7900X | |
| Intel Core i5-13600K | |
| Intel Core i9-12900K | |
| AMD Ryzen 5 7600X | |
| Intel Core i5-12600K | |
| CPU (Multi Core) | |
| Intel Core i9-13900K | |
| AMD Ryzen 9 7950X | |
| Intel Core i9-13900K | |
| AMD Ryzen 9 7900X | |
| Intel Core i9-12900K | |
| Intel Core i5-13600K | |
| Intel Core i5-12600K | |
| AMD Ryzen 5 7600X | |
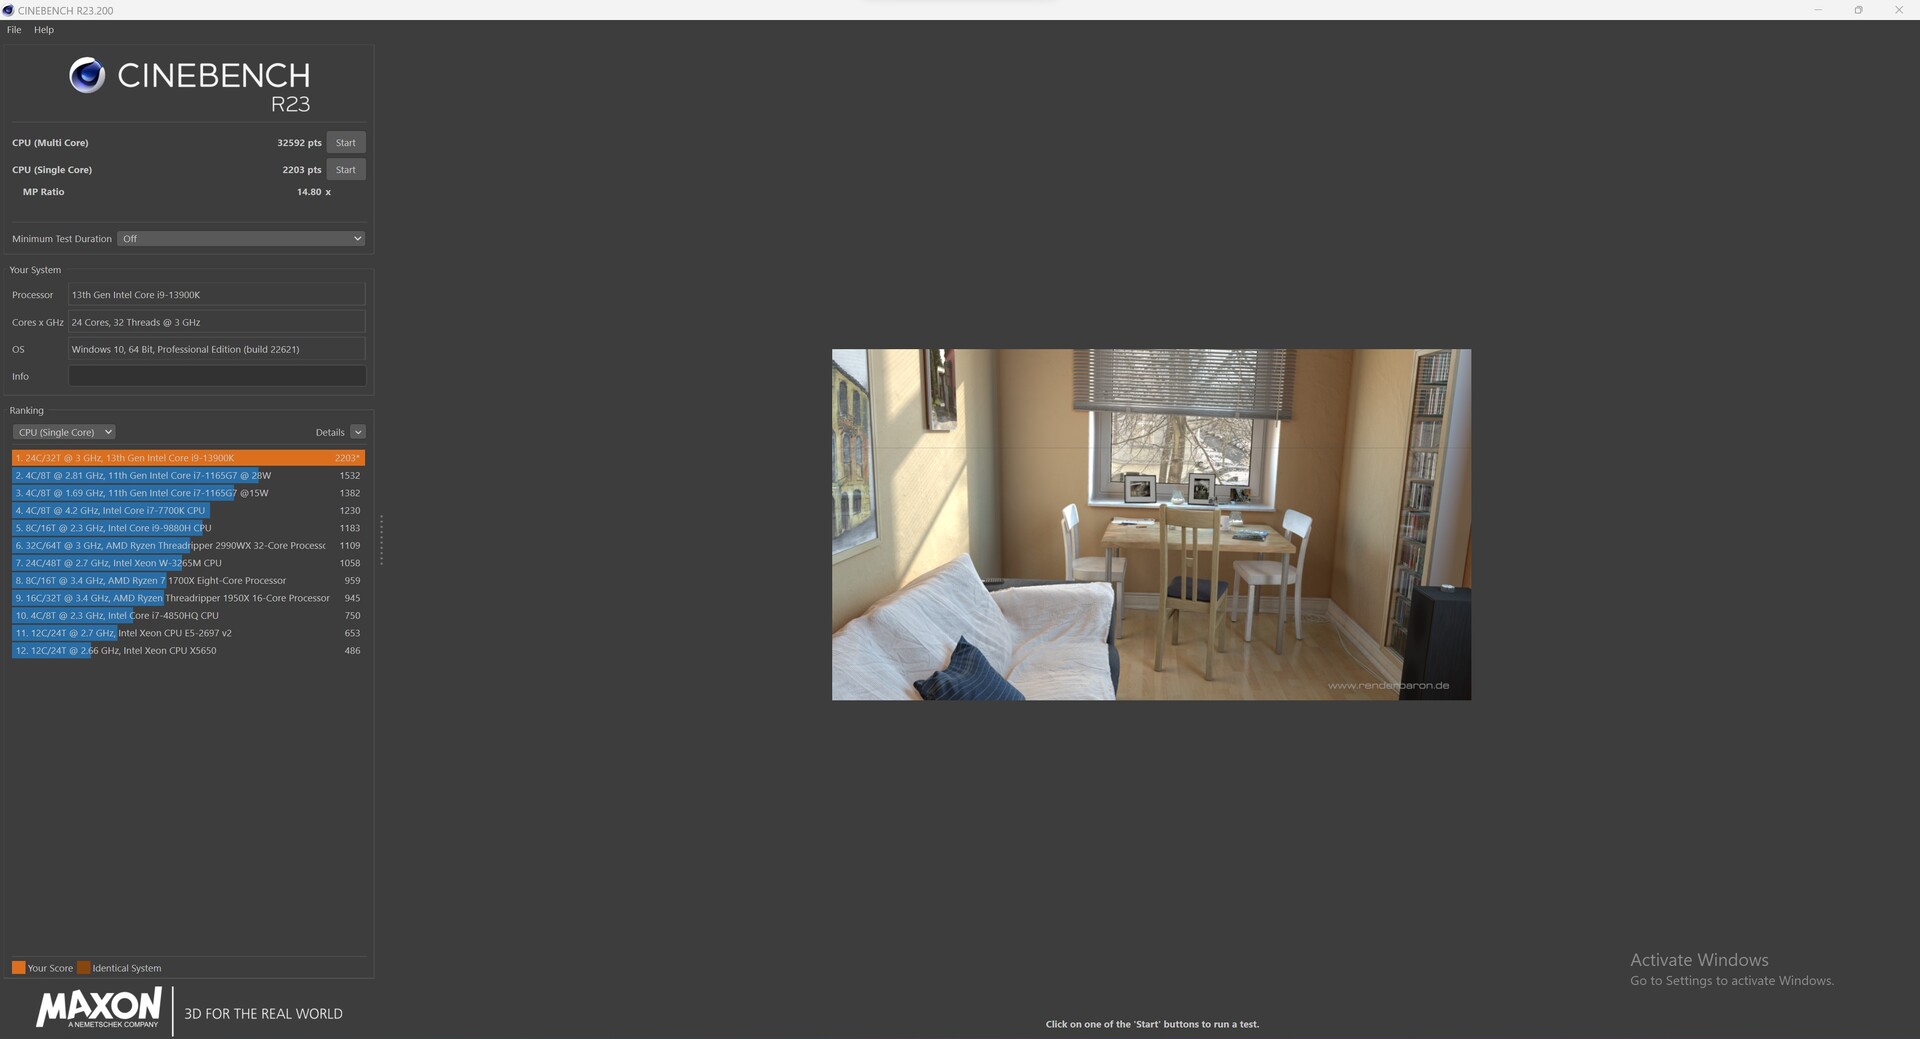
| Cinebench R23 | |
| Single Core | |
| Intel Core i9-13900K | |
| Intel Core i9-13900K | |
| AMD Ryzen 9 7950X | |
| AMD Ryzen 9 7900X | |
| Intel Core i5-13600K | |
| Intel Core i9-12900K | |
| AMD Ryzen 5 7600X | |
| Intel Core i5-12600K | |
| Multi Core | |
| Intel Core i9-13900K | |
| AMD Ryzen 9 7950X | |
| Intel Core i9-13900K | |
| AMD Ryzen 9 7900X | |
| Intel Core i9-12900K | |
| Intel Core i5-13600K | |
| Intel Core i5-12600K | |
| AMD Ryzen 5 7600X | |
| Cinebench R11.5 | |
| CPU Single 64Bit | |
| Intel Core i9-13900K | |
| AMD Ryzen 9 7950X | |
| AMD Ryzen 9 7900X | |
| Intel Core i9-13900K | |
| AMD Ryzen 5 7600X | |
| Intel Core i9-12900K | |
| Intel Core i5-13600K | |
| Intel Core i5-12600K | |
| CPU Multi 64Bit | |
| Intel Core i9-13900K | |
| AMD Ryzen 9 7950X | |
| Intel Core i9-13900K | |
| AMD Ryzen 9 7900X | |
| Intel Core i9-12900K | |
| Intel Core i5-13600K | |
| Intel Core i5-12600K | |
| AMD Ryzen 5 7600X | |
| Cinebench R10 | |
| Rendering Single CPUs 64Bit | |
| Intel Core i9-13900K | |
| Intel Core i9-13900K | |
| AMD Ryzen 9 7900X | |
| AMD Ryzen 9 7950X | |
| Intel Core i5-13600K | |
| Intel Core i9-12900K | |
| AMD Ryzen 5 7600X | |
| Intel Core i5-12600K | |
| Rendering Multiple CPUs 64Bit | |
| Intel Core i9-13900K | |
| Intel Core i9-13900K | |
| AMD Ryzen 9 7950X | |
| AMD Ryzen 9 7900X | |
| Intel Core i9-12900K | |
| Intel Core i5-13600K | |
| AMD Ryzen 5 7600X | |
| Intel Core i5-12600K | |
| Blender - v2.79 BMW27 CPU | |
| AMD Ryzen 5 7600X | |
| Intel Core i5-12600K | |
| Intel Core i5-13600K | |
| Intel Core i9-12900K | |
| AMD Ryzen 9 7900X | |
| Intel Core i9-13900K | |
| AMD Ryzen 9 7950X | |
| Intel Core i9-13900K | |
| X264 HD Benchmark 4.0 | |
| Pass 1 | |
| Intel Core i9-13900K | |
| Intel Core i9-13900K | |
| Intel Core i5-13600K | |
| AMD Ryzen 9 7950X | |
| AMD Ryzen 9 7900X | |
| Intel Core i9-12900K | |
| AMD Ryzen 5 7600X | |
| Intel Core i5-12600K | |
| Pass 2 | |
| Intel Core i9-13900K | |
| AMD Ryzen 9 7950X | |
| Intel Core i9-13900K | |
| AMD Ryzen 9 7900X | |
| Intel Core i9-12900K | |
| Intel Core i5-13600K | |
| Intel Core i5-12600K | |
| AMD Ryzen 5 7600X | |
| WinRAR - Result | |
| AMD Ryzen 9 7900X | |
| AMD Ryzen 9 7950X | |
| AMD Ryzen 5 7600X | |
| Intel Core i9-13900K | |
| Intel Core i9-13900K | |
| Intel Core i5-13600K | |
| Intel Core i9-12900K | |
| Intel Core i5-12600K | |
| TrueCrypt | |
| AES Mean 100MB | |
| AMD Ryzen 9 7950X | |
| Intel Core i9-13900K | |
| Intel Core i9-13900K | |
| Intel Core i5-13600K | |
| Intel Core i9-12900K | |
| AMD Ryzen 9 7900X | |
| AMD Ryzen 5 7600X | |
| Intel Core i5-12600K | |
| Twofish Mean 100MB | |
| Intel Core i9-13900K | |
| Intel Core i9-13900K | |
| AMD Ryzen 9 7950X | |
| Intel Core i9-12900K | |
| Intel Core i5-13600K | |
| AMD Ryzen 9 7900X | |
| Intel Core i5-12600K | |
| AMD Ryzen 5 7600X | |
| Serpent Mean 100MB | |
| Intel Core i9-13900K | |
| AMD Ryzen 9 7950X | |
| Intel Core i9-13900K | |
| Intel Core i9-12900K | |
| Intel Core i5-13600K | |
| AMD Ryzen 9 7900X | |
| Intel Core i5-12600K | |
| AMD Ryzen 5 7600X | |
| Geekbench 5.5 | |
| Multi-Core | |
| AMD Ryzen 9 7950X | |
| Intel Core i9-13900K | |
| Intel Core i9-13900K | |
| AMD Ryzen 9 7900X | |
| Intel Core i9-12900K | |
| Intel Core i5-13600K | |
| Intel Core i5-12600K | |
| AMD Ryzen 5 7600X | |
| Single-Core | |
| AMD Ryzen 9 7950X | |
| Intel Core i9-13900K | |
| AMD Ryzen 9 7900X | |
| AMD Ryzen 5 7600X | |
| Intel Core i9-13900K | |
| Intel Core i9-12900K | |
| Intel Core i5-13600K | |
| Intel Core i5-12600K | |
| Geekbench 5.0 | |
| 5.0 Multi-Core | |
| AMD Ryzen 9 7950X | |
| Intel Core i9-13900K | |
| Intel Core i9-13900K | |
| AMD Ryzen 9 7900X | |
| Intel Core i9-12900K | |
| Intel Core i5-13600K | |
| Intel Core i5-12600K | |
| AMD Ryzen 5 7600X | |
| 5.0 Single-Core | |
| AMD Ryzen 9 7950X | |
| Intel Core i9-13900K | |
| AMD Ryzen 9 7900X | |
| Intel Core i9-13900K | |
| AMD Ryzen 5 7600X | |
| Intel Core i9-12900K | |
| Intel Core i5-13600K | |
| Intel Core i5-12600K | |
| Geekbench 4.4 | |
| 64 Bit Single-Core Score | |
| Intel Core i9-13900K | |
| AMD Ryzen 9 7950X | |
| Intel Core i9-13900K | |
| AMD Ryzen 9 7900X | |
| AMD Ryzen 5 7600X | |
| Intel Core i9-12900K | |
| Intel Core i5-13600K | |
| Intel Core i5-12600K | |
| 64 Bit Multi-Core Score | |
| AMD Ryzen 9 7950X | |
| Intel Core i9-13900K | |
| Intel Core i9-13900K | |
| AMD Ryzen 9 7900X | |
| Intel Core i9-12900K | |
| Intel Core i5-13600K | |
| AMD Ryzen 5 7600X | |
| Intel Core i5-12600K | |
| 3DMark 11 - 1280x720 Performance Physics | |
| Intel Core i9-13900K | |
| Intel Core i5-13600K | |
| Intel Core i9-13900K | |
| AMD Ryzen 9 7900X | |
| AMD Ryzen 9 7950X | |
| Intel Core i9-12900K | |
| AMD Ryzen 5 7600X | |
| Intel Core i5-12600K | |
| HWBOT x265 Benchmark v2.2 - 4k Preset | |
| AMD Ryzen 9 7950X | |
| Intel Core i9-13900K | |
| AMD Ryzen 9 7900X | |
| Intel Core i9-13900K | |
| Intel Core i5-12600K | |
| Intel Core i9-12900K | |
| Intel Core i5-13600K | |
| AMD Ryzen 5 7600X | |
| R Benchmark 2.5 - Overall mean | |
| Intel Core i5-12600K | |
| Intel Core i9-12900K | |
| Intel Core i5-13600K | |
| Intel Core i9-13900K | |
| AMD Ryzen 5 7600X | |
| AMD Ryzen 9 7900X | |
| AMD Ryzen 9 7950X | |
| Intel Core i9-13900K | |
| LibreOffice - 20 Documents To PDF | |
| Intel Core i5-12600K | |
| Intel Core i9-13900K | |
| Intel Core i9-12900K | |
| AMD Ryzen 5 7600X | |
| Intel Core i9-13900K | |
| AMD Ryzen 9 7950X | |
| Intel Core i5-13600K | |
| AMD Ryzen 9 7900X | |
| WebXPRT 3 - Overall | |
| AMD Ryzen 9 7900X | |
| AMD Ryzen 9 7950X | |
| AMD Ryzen 5 7600X | |
| Intel Core i9-13900K | |
| Intel Core i9-13900K | |
| Intel Core i5-13600K | |
| Intel Core i9-12900K | |
| Intel Core i5-12600K | |
| Mozilla Kraken 1.1 - Total | |
| Intel Core i5-12600K | |
| Intel Core i9-12900K | |
| Intel Core i5-13600K | |
| AMD Ryzen 5 7600X | |
| Intel Core i9-13900K | |
| AMD Ryzen 9 7950X | |
| Intel Core i9-13900K | |
| AMD Ryzen 9 7900X | |
| 3DMark | |
| 3840x2160 Fire Strike Ultra Physics | |
| Intel Core i9-13900K | |
| Intel Core i9-13900K | |
| AMD Ryzen 9 7900X | |
| AMD Ryzen 9 7950X | |
| Intel Core i9-12900K | |
| Intel Core i5-13600K | |
| AMD Ryzen 5 7600X | |
| Intel Core i5-12600K | |
| 1920x1080 Fire Strike Physics | |
| Intel Core i9-13900K | |
| Intel Core i9-13900K | |
| AMD Ryzen 9 7900X | |
| AMD Ryzen 9 7950X | |
| Intel Core i9-12900K | |
| Intel Core i5-13600K | |
| AMD Ryzen 5 7600X | |
| Intel Core i5-12600K | |
| 2560x1440 Time Spy CPU | |
| Intel Core i9-13900K | |
| Intel Core i9-12900K | |
| Intel Core i5-13600K | |
| AMD Ryzen 9 7900X | |
| AMD Ryzen 9 7950X | |
| Intel Core i9-13900K | |
| Intel Core i5-12600K | |
| AMD Ryzen 5 7600X | |
* ... smaller is better
AIDA64: FP32 Ray-Trace | FPU Julia | CPU SHA3 | CPU Queen | FPU SinJulia | FPU Mandel | CPU AES | CPU ZLib | FP64 Ray-Trace | CPU PhotoWorxx
| Performance rating | |
| AMD Ryzen 9 7950X | |
| Intel Core i9-13900K | |
| AMD Ryzen 9 7900X | |
| Average of class Desktop | |
| Intel Core i9-13900K | |
| Intel Core i5-13600K | |
| Intel Core i9-12900K | |
| AMD Ryzen 5 7600X | |
| AMD Ryzen 9 5900HX | |
| Intel Core i5-12600K | |
| Intel Core i7-11800H | |
| AIDA64 / FP32 Ray-Trace | |
| AMD Ryzen 9 7950X | |
| Average of class Desktop (12248 - 84577, n=15, last 2 years) | |
| Intel Core i9-13900K | |
| AMD Ryzen 9 7900X | |
| Intel Core i9-13900K | |
| Intel Core i5-13600K | |
| AMD Ryzen 5 7600X | |
| AMD Ryzen 9 5900HX | |
| Intel Core i9-12900K | |
| Intel Core i7-11800H | |
| Intel Core i5-12600K | |
| AIDA64 / FPU Julia | |
| AMD Ryzen 9 7950X | |
| AMD Ryzen 9 7900X | |
| Intel Core i9-13900K | |
| Average of class Desktop (65152 - 246125, n=15, last 2 years) | |
| Intel Core i9-13900K | |
| Intel Core i5-13600K | |
| AMD Ryzen 5 7600X | |
| AMD Ryzen 9 5900HX | |
| Intel Core i9-12900K | |
| Intel Core i7-11800H | |
| Intel Core i5-12600K | |
| AIDA64 / CPU SHA3 | |
| AMD Ryzen 9 7950X | |
| Intel Core i9-13900K | |
| AMD Ryzen 9 7900X | |
| Intel Core i9-13900K | |
| Average of class Desktop (2982 - 10804, n=15, last 2 years) | |
| Intel Core i5-13600K | |
| Intel Core i9-12900K | |
| Intel Core i7-11800H | |
| AMD Ryzen 5 7600X | |
| AMD Ryzen 9 5900HX | |
| Intel Core i5-12600K | |
| AIDA64 / CPU Queen | |
| AMD Ryzen 9 7950X | |
| AMD Ryzen 9 7900X | |
| Intel Core i9-13900K | |
| Intel Core i9-13900K | |
| Average of class Desktop (76512 - 187912, n=15, last 2 years) | |
| Intel Core i5-13600K | |
| Intel Core i9-12900K | |
| AMD Ryzen 5 7600X | |
| AMD Ryzen 9 5900HX | |
| Intel Core i7-11800H | |
| Intel Core i5-12600K | |
| AIDA64 / FPU SinJulia | |
| AMD Ryzen 9 7950X | |
| AMD Ryzen 9 7900X | |
| Intel Core i9-13900K | |
| Average of class Desktop (6443 - 35251, n=15, last 2 years) | |
| Intel Core i9-13900K | |
| Intel Core i9-12900K | |
| AMD Ryzen 5 7600X | |
| AMD Ryzen 9 5900HX | |
| Intel Core i5-13600K | |
| Intel Core i7-11800H | |
| Intel Core i5-12600K | |
| AIDA64 / FPU Mandel | |
| AMD Ryzen 9 7950X | |
| AMD Ryzen 9 7900X | |
| Intel Core i9-13900K | |
| Average of class Desktop (31697 - 129745, n=15, last 2 years) | |
| Intel Core i9-13900K | |
| Intel Core i5-13600K | |
| AMD Ryzen 9 5900HX | |
| AMD Ryzen 5 7600X | |
| Intel Core i9-12900K | |
| Intel Core i7-11800H | |
| Intel Core i5-12600K | |
| AIDA64 / CPU AES | |
| AMD Ryzen 9 7950X | |
| Intel Core i9-13900K | |
| AMD Ryzen 9 7900X | |
| Intel Core i5-13600K | |
| Average of class Desktop (57777 - 513073, n=15, last 2 years) | |
| AMD Ryzen 5 7600X | |
| AMD Ryzen 9 5900HX | |
| Intel Core i9-13900K | |
| Intel Core i7-11800H | |
| Intel Core i9-12900K | |
| Intel Core i5-12600K | |
| AIDA64 / CPU ZLib | |
| Intel Core i9-13900K | |
| AMD Ryzen 9 7950X | |
| Intel Core i9-13900K | |
| AMD Ryzen 9 7900X | |
| Average of class Desktop (887 - 2674, n=15, last 2 years) | |
| Intel Core i9-12900K | |
| Intel Core i5-13600K | |
| Intel Core i5-12600K | |
| AMD Ryzen 5 7600X | |
| AMD Ryzen 9 5900HX | |
| Intel Core i7-11800H | |
| AIDA64 / FP64 Ray-Trace | |
| AMD Ryzen 9 7950X | |
| Average of class Desktop (6471 - 44013, n=15, last 2 years) | |
| Intel Core i9-13900K | |
| AMD Ryzen 9 7900X | |
| Intel Core i9-13900K | |
| Intel Core i5-13600K | |
| AMD Ryzen 5 7600X | |
| Intel Core i9-12900K | |
| AMD Ryzen 9 5900HX | |
| Intel Core i7-11800H | |
| Intel Core i5-12600K | |
| AIDA64 / CPU PhotoWorxx | |
| Intel Core i9-13900K | |
| Intel Core i5-12600K | |
| Intel Core i5-13600K | |
| Intel Core i9-12900K | |
| Average of class Desktop (38071 - 55966, n=15, last 2 years) | |
| Intel Core i9-13900K | |
| AMD Ryzen 9 7950X | |
| AMD Ryzen 9 7900X | |
| AMD Ryzen 5 7600X | |
| Intel Core i7-11800H | |
| AMD Ryzen 9 5900HX | |
Intel NUC 13 Extreme Kit: Cinebench R15 Multi Loop
Our Cinebench R15 Multi loop shows a significant performance decline after the first loop. Due to the compact cooling solution and the power limits, we observe a lower performance level compared to an Intel Core i9-13900K in an alternate system with the Intel Core i9-13900K under continuous CPU stress. That being said, the result of 4779 points is still substantially higher than that of the Intel Dragon Canyon NUC.
System Performance
When it comes to synthetic benchmarks, the Intel NUC 13 Extreme Raptor Canyon shines with a very fast system performance. Here, the Intel Core i9-13900K with better cooling still has a small lead. Competitors from Minisforum and direct predecessors from the NUC series do not stand a chance, however. Subjectively, our test system is very quick and responsive and there are no noticeable delays.
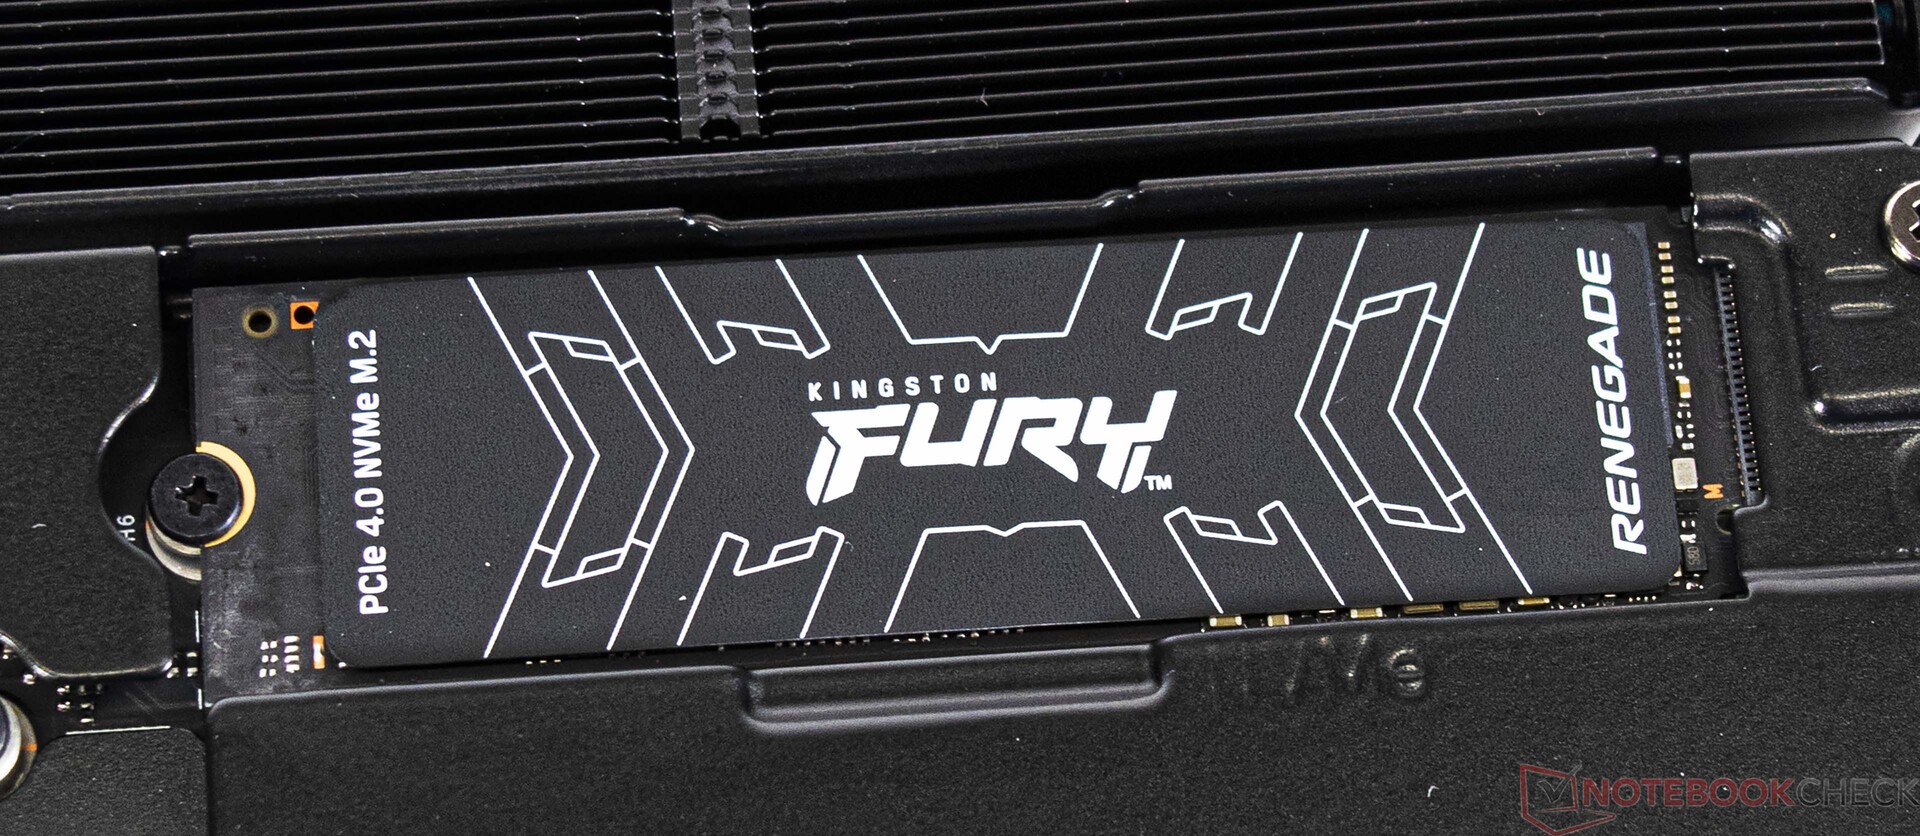
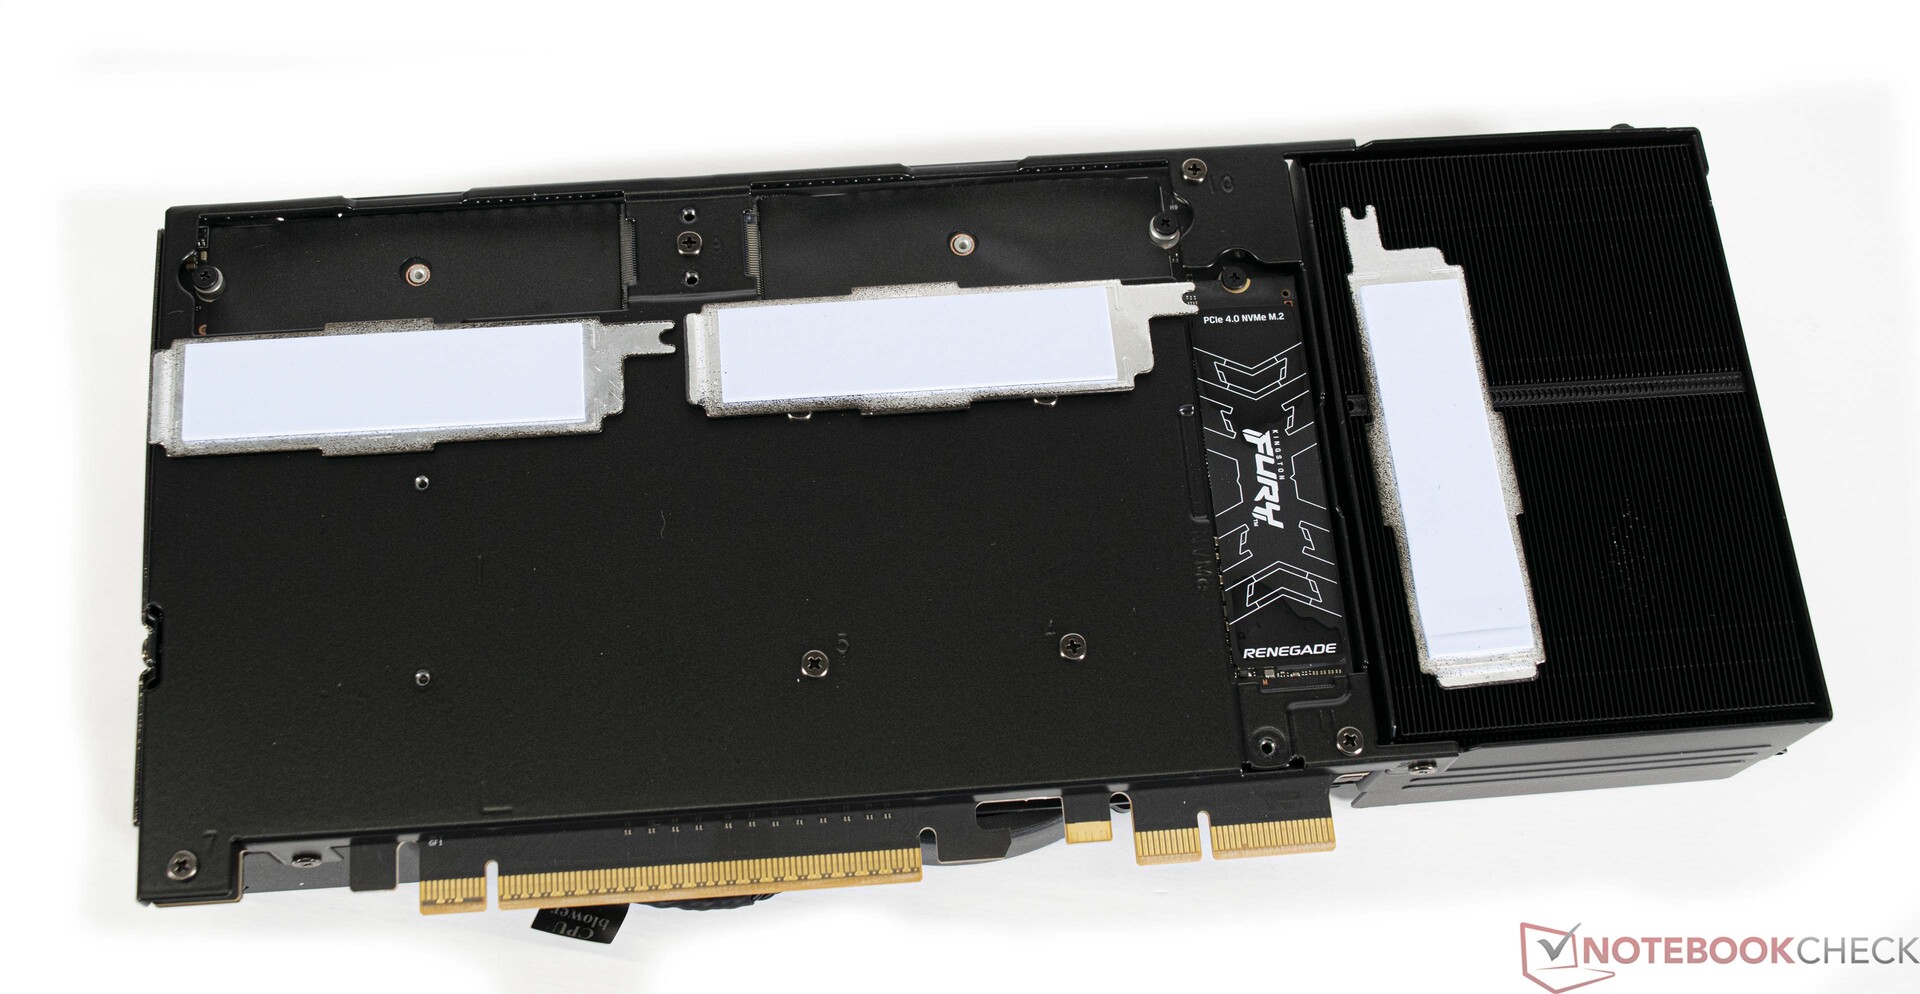
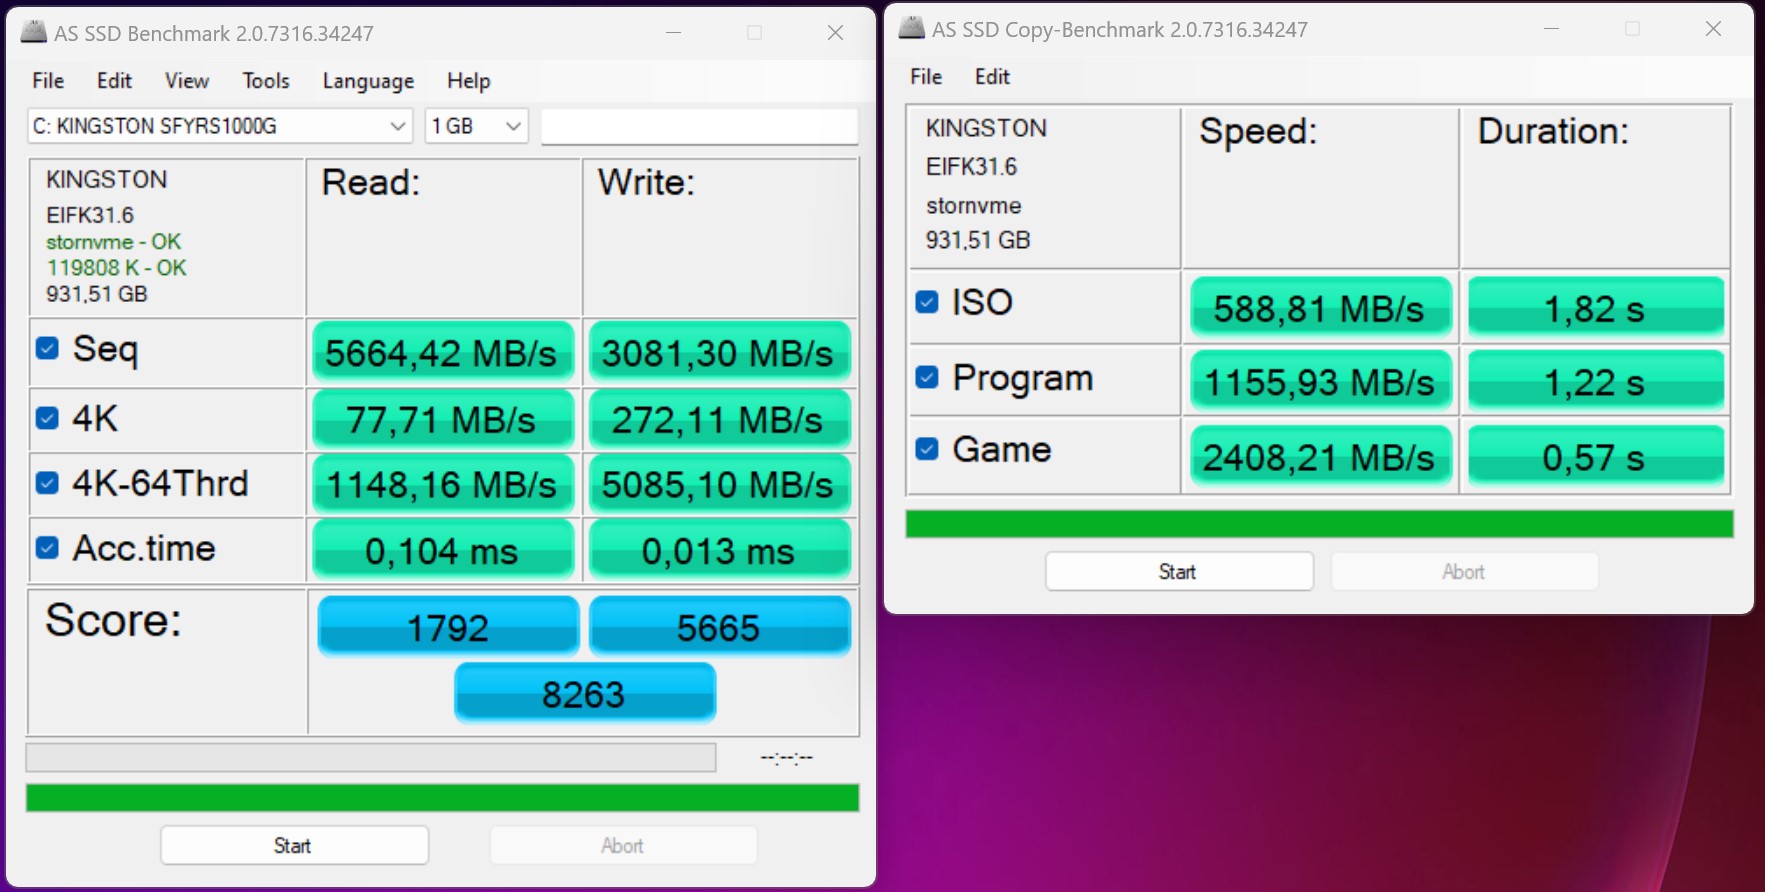
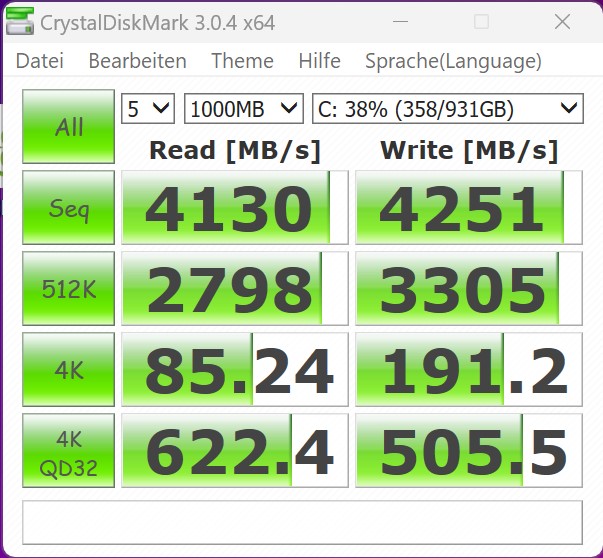
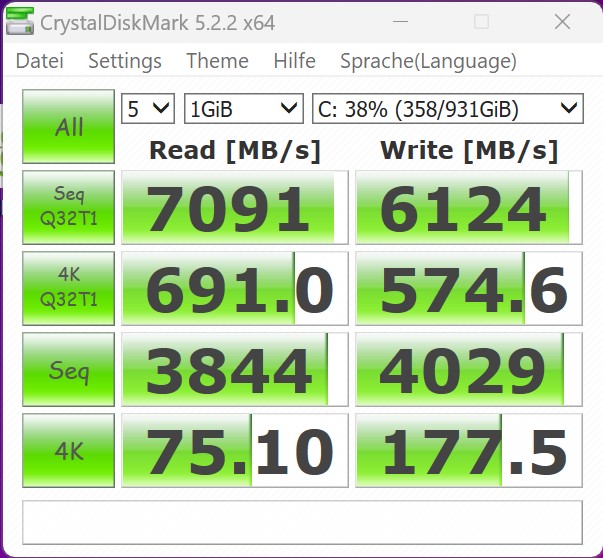
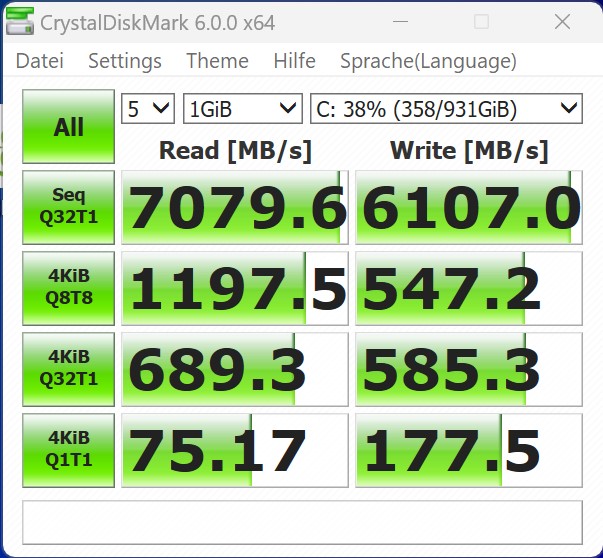
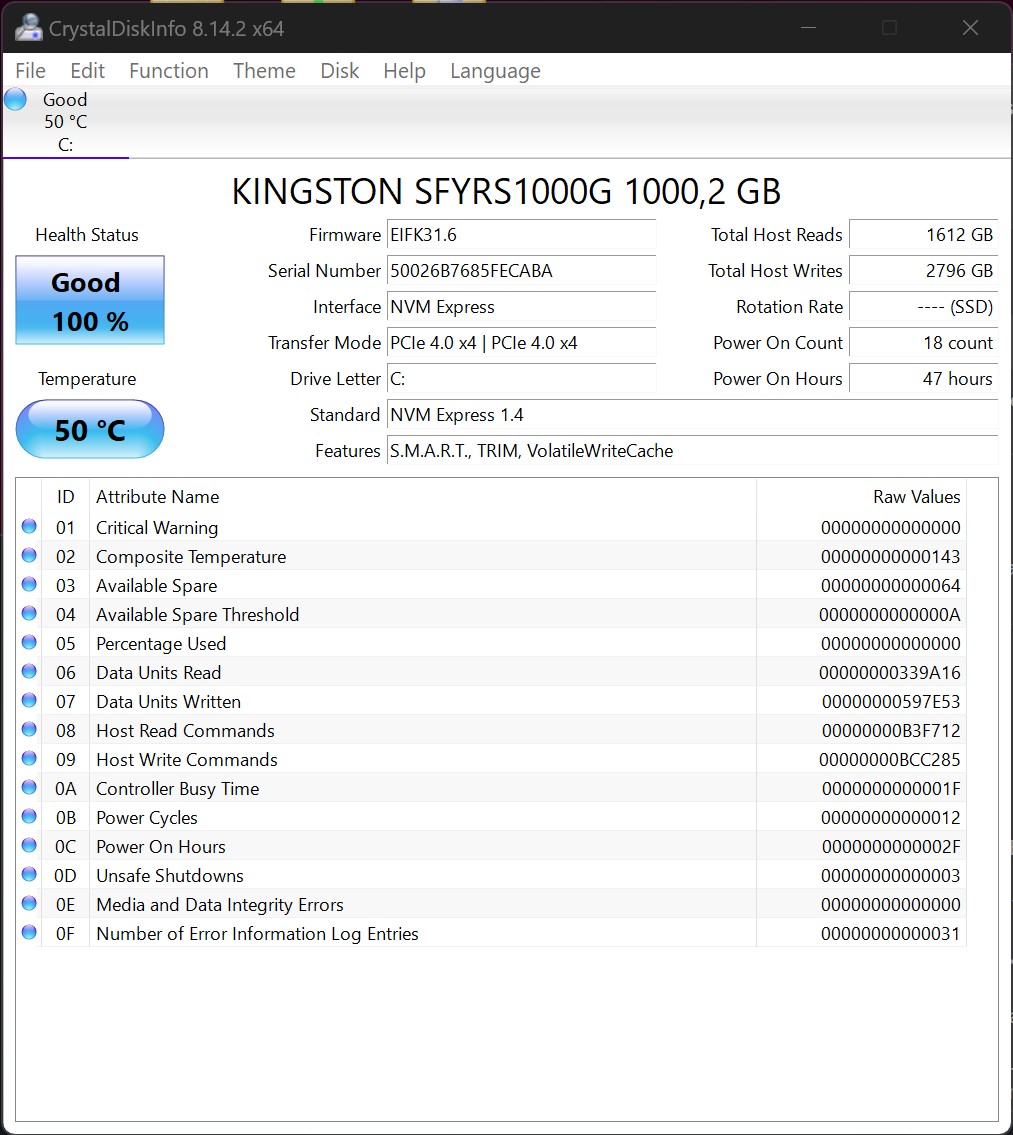
Storage Solution
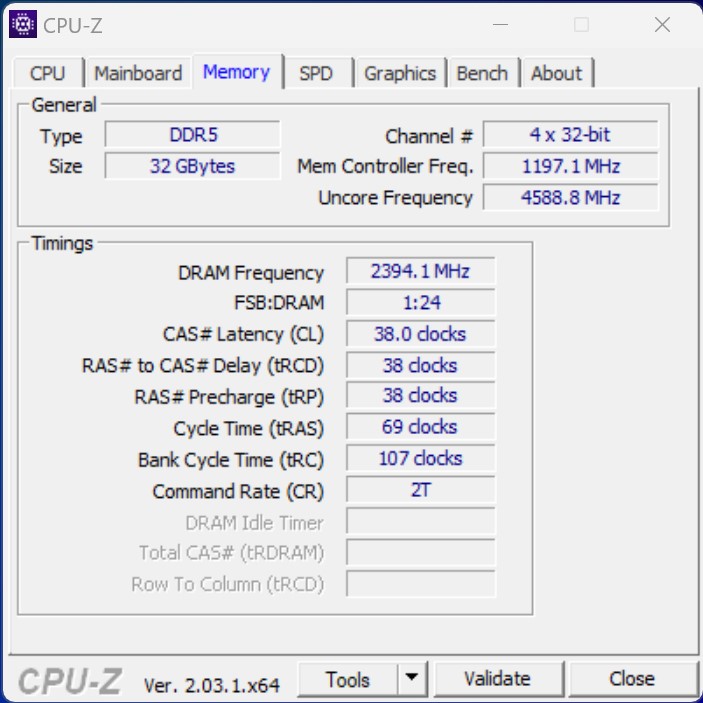
Our test sample uses a very fast Kingston NVMe SSD as the system drive. The model performs very well, achieving blazing-fast transfer speeds in both AS SSD and DiskSpd. Since the Intel NUC 13 Extreme Raptor Canyon is a barebone system, users can choose which SSD drive they want to install. The Compute Element supports up to three M.2 SSDs in total. Installing the SSDs is a bit of a hassle, since the Compute Element first needs to be completely removed from the NUC 13.
More comparisons and benchmarks can be found in our comparison table.

* ... smaller is better
Disk Throttling: DiskSpd Read Loop, Queue Depth 8
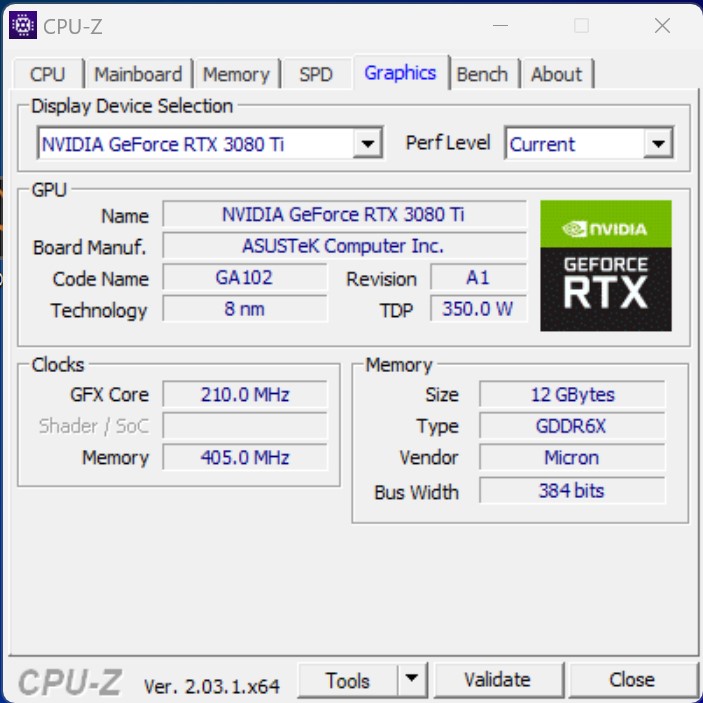
GPU Performance
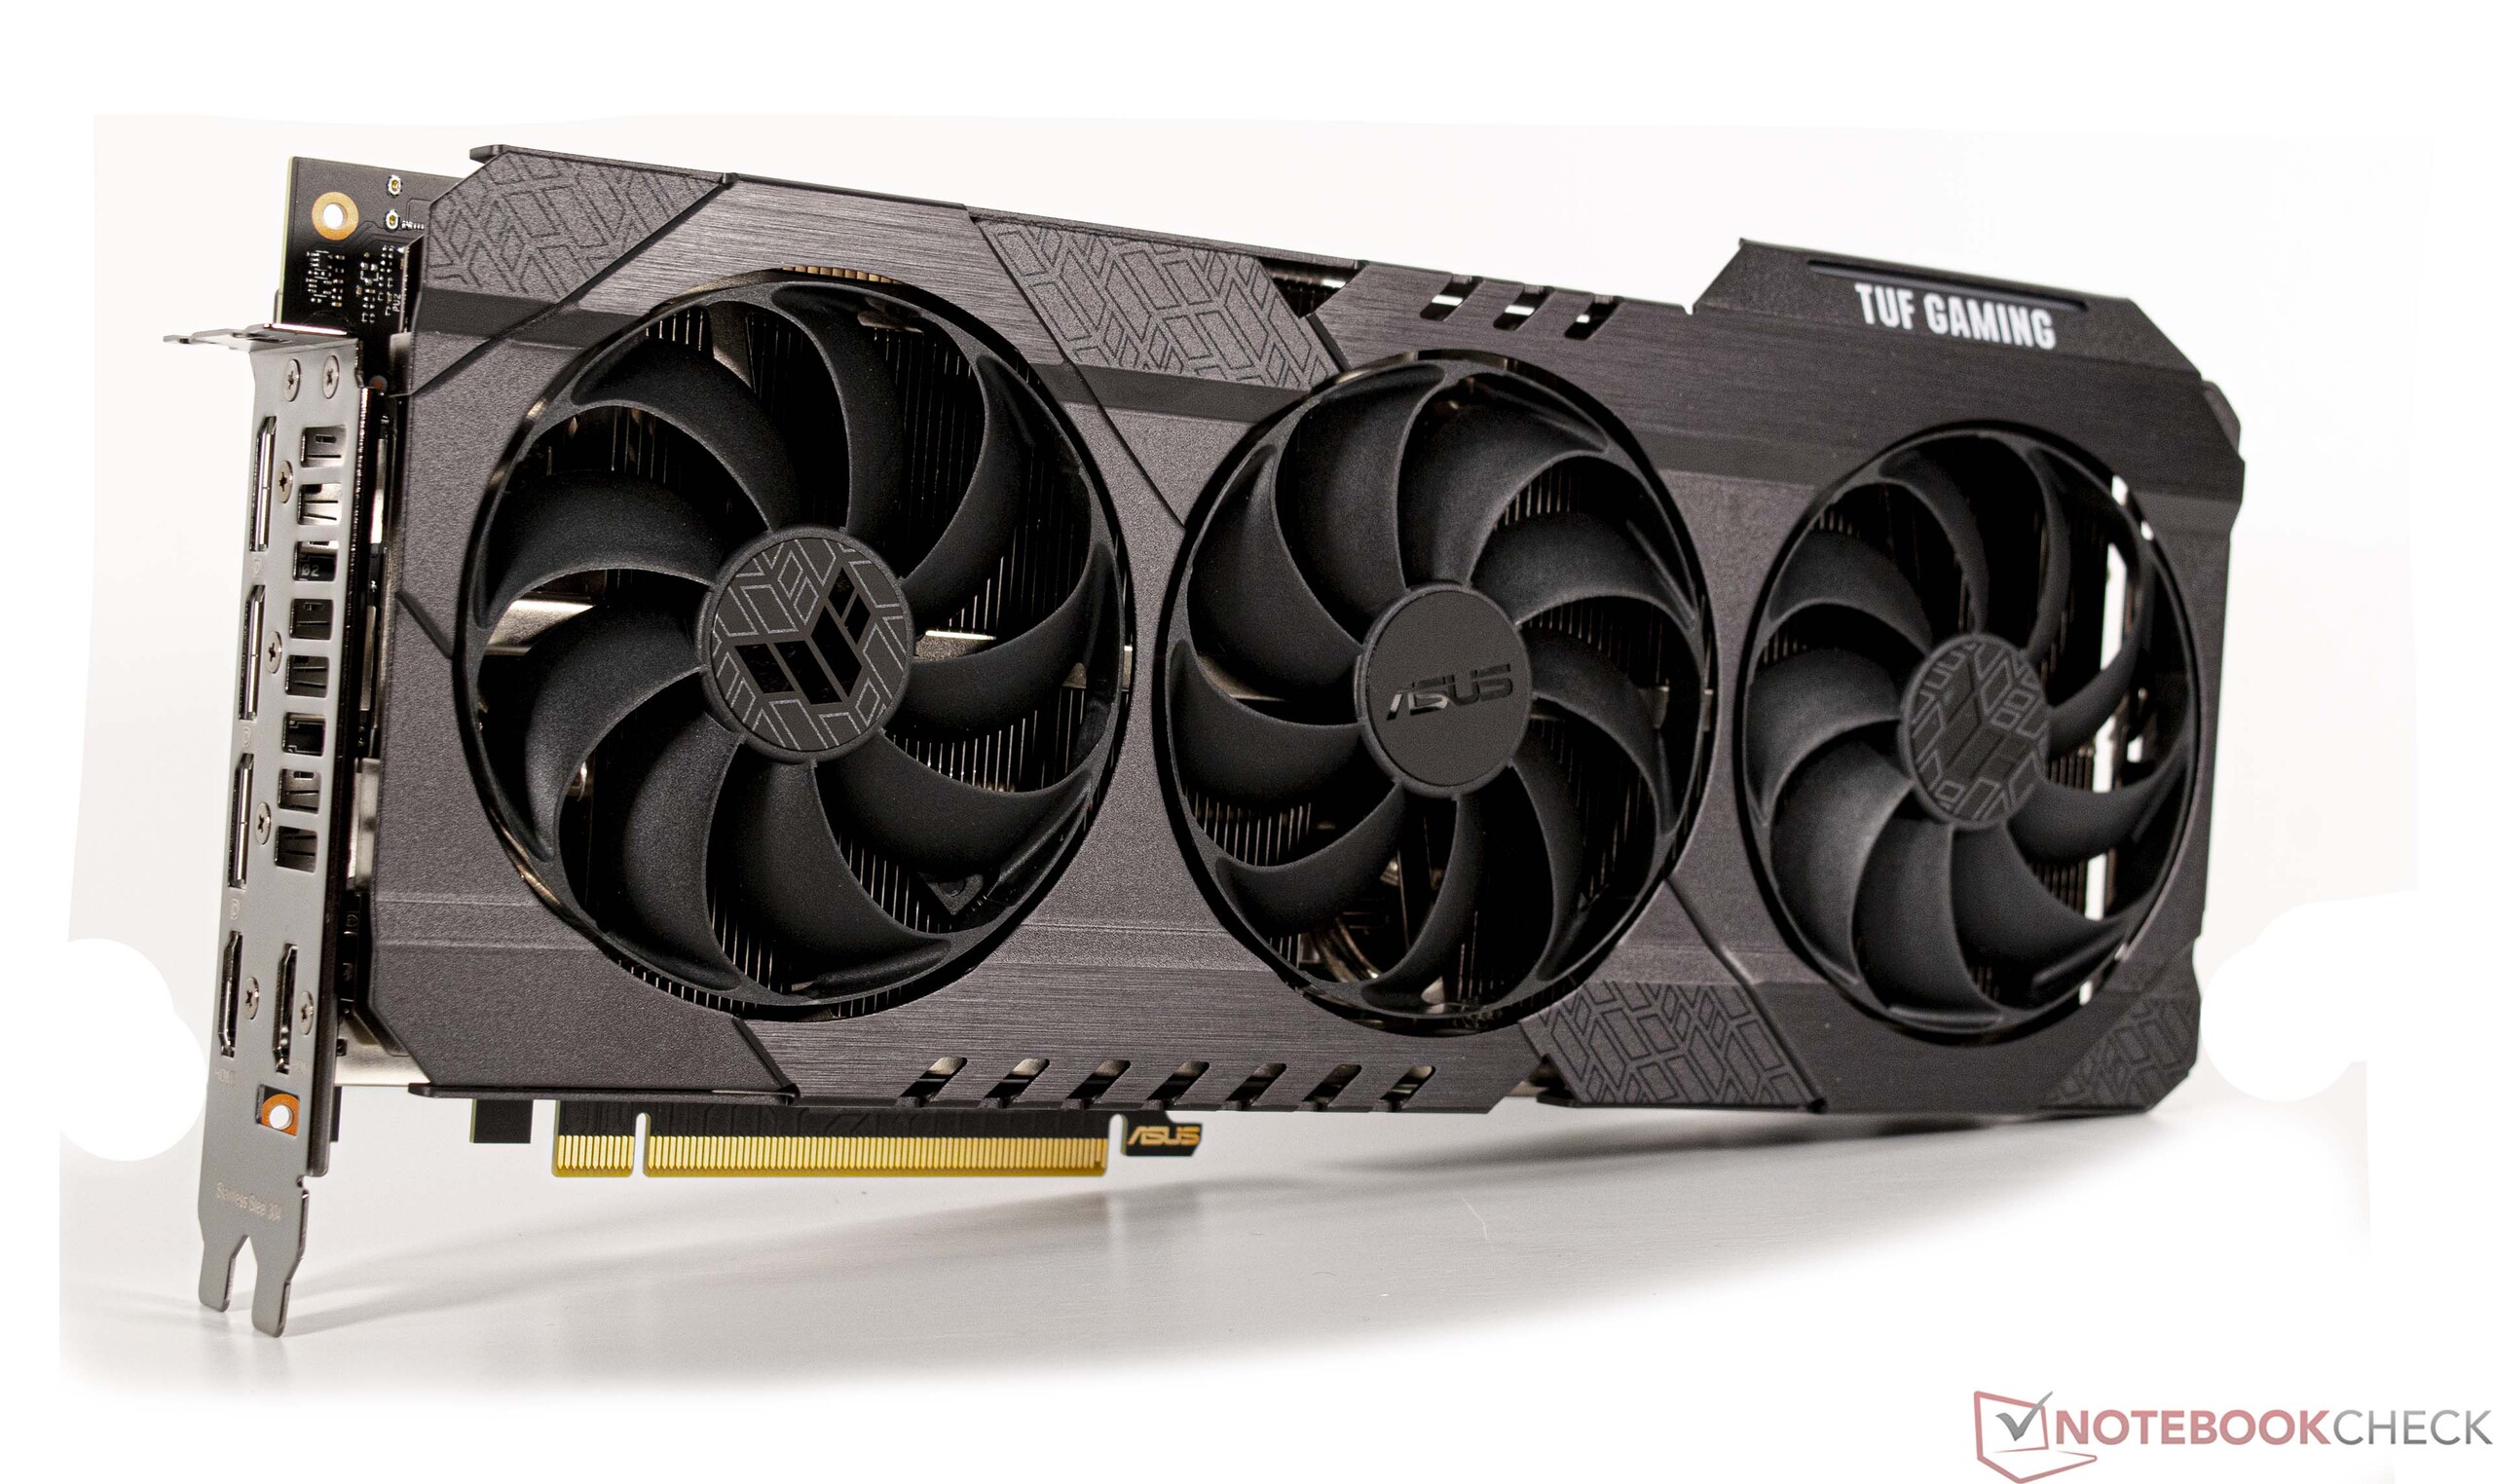
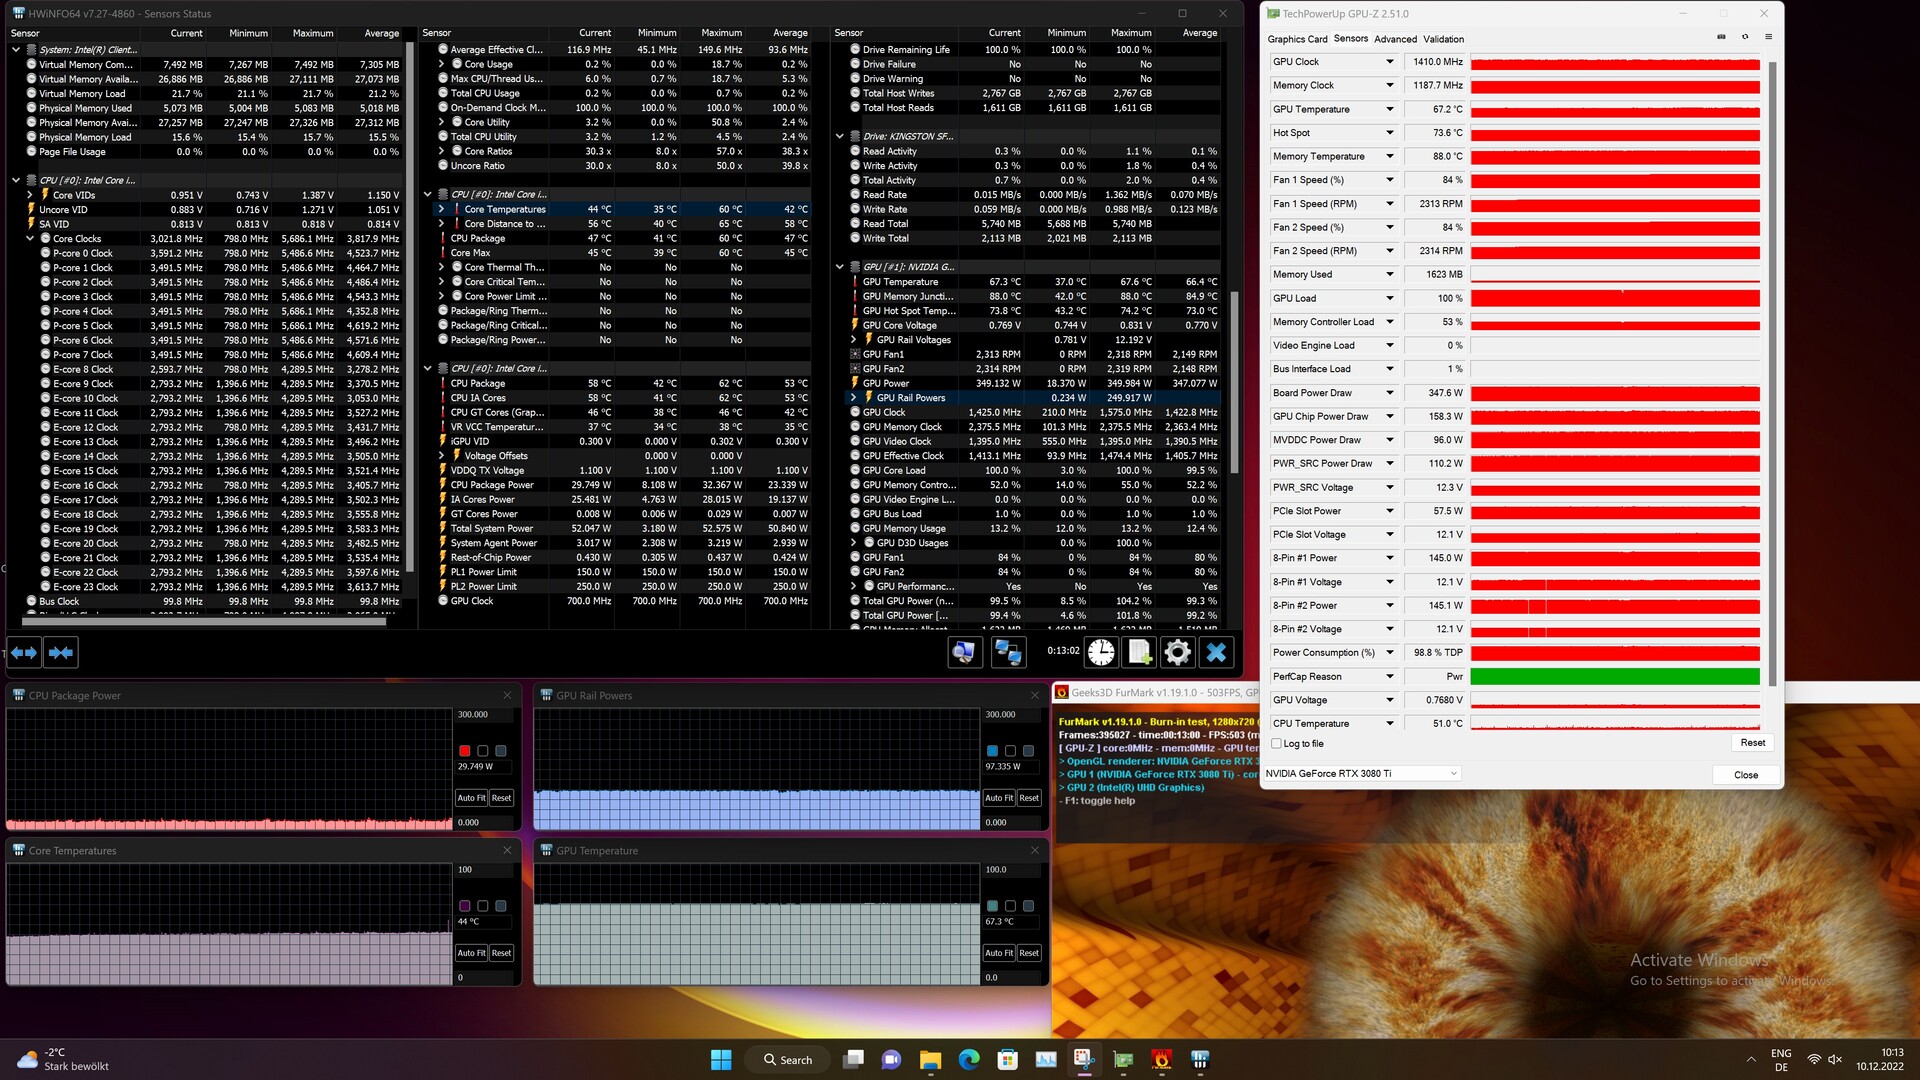
Intel equips our test sample with an Nvidia GeForce RTX 3080 Ti. The GPU offers great performance and almost matches the Nvidia GeForce RTX 3090. Although at 12 GB of VRAM, it comes with half the VRAM of the RTX 3090, this is still sufficient in most cases. With 350 watts, the installed model is running at the limit of what we would consider reasonable and we do not recommend using even more bigger GPUs in the compact system. This only applies to the power draw, since the system physically supports even the Nvidia GeForce RTX 4090. Users who insist on a GeForce-RTX-4000-series card may be better off with an Nvidia GeForce RTX 4080. With a TGP of up to 320 watts, it is more economical and substantially faster than our GeForce RTX 3080 Ti from Asus.
More comparisons and benchmarks can be found on our GPU page.
| 3DMark 05 Standard | 82816 points | |
| 3DMark 06 Standard Score | 71555 points | |
| 3DMark Vantage P Result | 118753 points | |
| 3DMark 11 Performance | 46806 points | |
| 3DMark Ice Storm Standard Score | 288716 points | |
| 3DMark Cloud Gate Standard Score | 76027 points | |
| 3DMark Fire Strike Score | 37178 points | |
| 3DMark Fire Strike Extreme Score | 23232 points | |
| 3DMark Time Spy Score | 18822 points | |
Help | ||
Gaming Performance
Although the Nvidia GeForce RTX 3080 Ti is no longer one of the latest graphics cards, the model certainly is not a bad choice. A combination of the Intel Core i9-13900K and the GeForce RTX 3080 Ti still makes a lot of sense, since it is able to display even recent games smoothly at maximum settings. The performance deficit compared to the faster Nvidia GeForce RTX 3090 is marginal. In a system based on the AMD Ryzen 9 7950X, which we built for comparison purposes, the same Nvidia GeForce RTX 3080 Ti does not achieve a major performance jump, since the performance of the processor becomes less important when the GPU is near full load.
When it comes to choosing a graphics card, we recommend users to verify their favorite model's compability, since the supported maximum length is limited. Graphics solutions may not exceed the maximum length of 31.3 cm (~12.32 in). In terms of thickness, the case allows for up to three slots.
| The Witcher 3 | |
| 1920x1080 Ultra Graphics & Postprocessing (HBAO+) | |
| ASUS TUF Gaming GeForce RTX 3080 Ti OC | |
| Corsair One i300 | |
| Intel Core i9-13900K | |
| Intel NUC13 Raptor Canyon | |
| Minisforum NUCX i7 | |
| Intel Dragon Canyon NUC - RTX 3060 | |
| Minisforum Neptune Series HX90G | |
| 3840x2160 High Graphics & Postprocessing (Nvidia HairWorks Off) | |
| Intel NUC13 Raptor Canyon | |
| ASUS TUF Gaming GeForce RTX 3080 Ti OC | |
| Intel Core i9-13900K | |
| Corsair One i300 | |
| Minisforum NUCX i7 | |
| Intel Dragon Canyon NUC - RTX 3060 | |
| Minisforum Neptune Series HX90G | |
| Far Cry 6 | |
| 1920x1080 Ultra Graphics Quality + HD Textures AA:T | |
| ASUS TUF Gaming GeForce RTX 3080 Ti OC | |
| Intel Core i9-13900K | |
| Corsair One i300 | |
| Intel NUC13 Raptor Canyon | |
| Minisforum NUCX i7 | |
| Intel Dragon Canyon NUC - RTX 3060 | |
| Intel Beast Canyon NUC | |
| Minisforum Neptune Series HX90G | |
| 3840x2160 Ultra Graphics Quality + HD Textures AA:T | |
| ASUS TUF Gaming GeForce RTX 3080 Ti OC | |
| Intel NUC13 Raptor Canyon | |
| Intel Core i9-13900K | |
| Corsair One i300 | |
| Intel Dragon Canyon NUC - RTX 3060 | |
| Intel Beast Canyon NUC | |
| Minisforum Neptune Series HX90G | |
| F1 2021 | |
| 1920x1080 Ultra High Preset + Raytracing AA:T AF:16x | |
| ASUS TUF Gaming GeForce RTX 3080 Ti OC | |
| Intel NUC13 Raptor Canyon | |
| Intel Core i9-13900K | |
| Corsair One i300 | |
| Minisforum NUCX i7 | |
| Intel Beast Canyon NUC | |
| Intel Dragon Canyon NUC - RTX 3060 | |
| Minisforum Neptune Series HX90G | |
| 3840x2160 Ultra High Preset + Raytracing AA:T AF:16x | |
| ASUS TUF Gaming GeForce RTX 3080 Ti OC | |
| Intel Core i9-13900K | |
| Intel NUC13 Raptor Canyon | |
| Corsair One i300 | |
| Minisforum NUCX i7 | |
| Intel Beast Canyon NUC | |
| Intel Dragon Canyon NUC - RTX 3060 | |
| Minisforum Neptune Series HX90G | |
| low | med. | high | ultra | QHD | 4K | |
|---|---|---|---|---|---|---|
| GTA V (2015) | 187.6 | 187.4 | 187 | 161.5 | 152.8 | 182 |
| The Witcher 3 (2015) | 702 | 564 | 374 | 179.1 | 156.8 | |
| Dota 2 Reborn (2015) | 278.9 | 242.4 | 234.1 | 216.6 | 211.1 | |
| Final Fantasy XV Benchmark (2018) | 234 | 229 | 180.6 | 141 | 84.2 | |
| X-Plane 11.11 (2018) | 232 | 202 | 148.8 | 127.3 | ||
| Far Cry 5 (2018) | 239 | 208 | 198 | 186 | 176 | 109 |
| Strange Brigade (2018) | 613 | 489 | 407 | 359 | 269 | 161 |
| Far Cry New Dawn (2019) | 200 | 174 | 167 | 150 | 144 | 109 |
| Metro Exodus (2019) | 241 | 200 | 165.8 | 134 | 115 | 76.5 |
| Borderlands 3 (2019) | 229 | 195.3 | 179.7 | 160 | 128.7 | 74 |
| F1 2020 (2020) | 520 | 448 | 419 | 310 | 240 | 145.2 |
| F1 2021 (2021) | 615 | 525 | 428 | 225 | 174.3 | 103.2 |
| Far Cry 6 (2021) | 211 | 180.4 | 160.6 | 120.7 | 136 | 86 |
| Forza Horizon 5 (2021) | 256 | 191 | 182 | 129 | 117 | 87 |
| God of War (2022) | 229 | 200 | 166.6 | 119.6 | 105.8 | 77.5 |
| Tiny Tina's Wonderlands (2022) | 355 | 291 | 211 | 168.5 | 123.1 | 70 |
| F1 22 (2022) | 367 | 342 | 321 | 128.8 | 85.6 | 43 |
Emissions
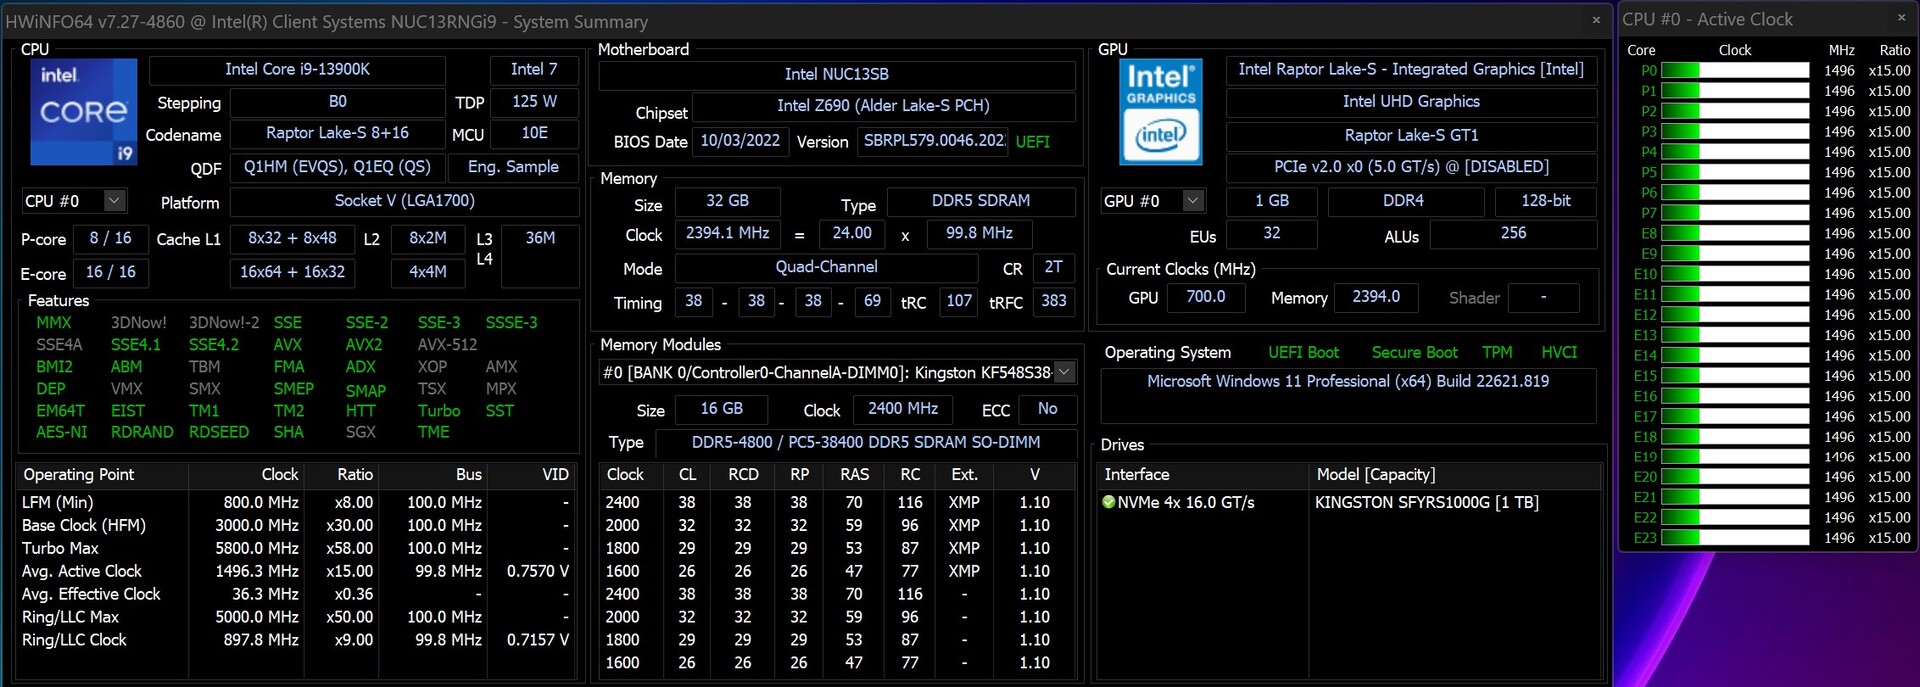
Temperatures and System Noise
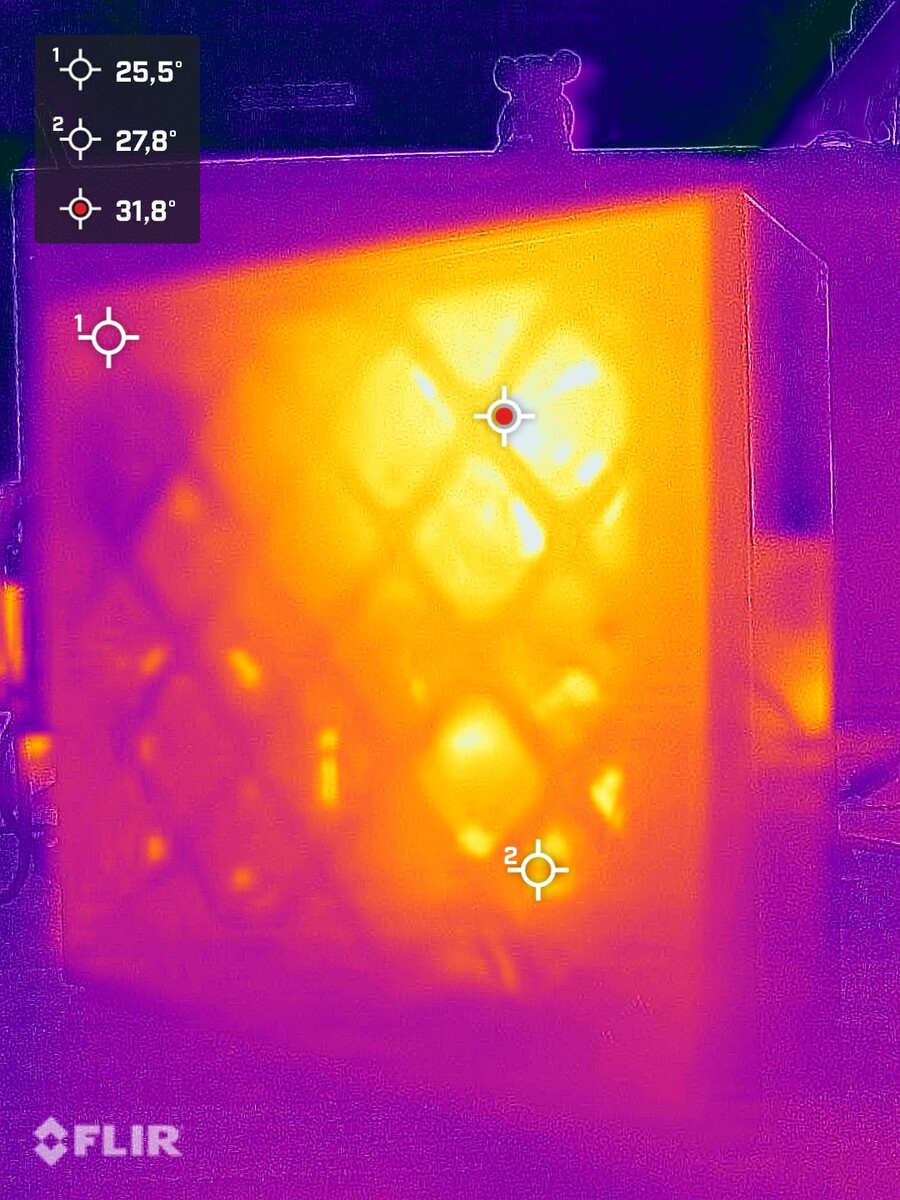
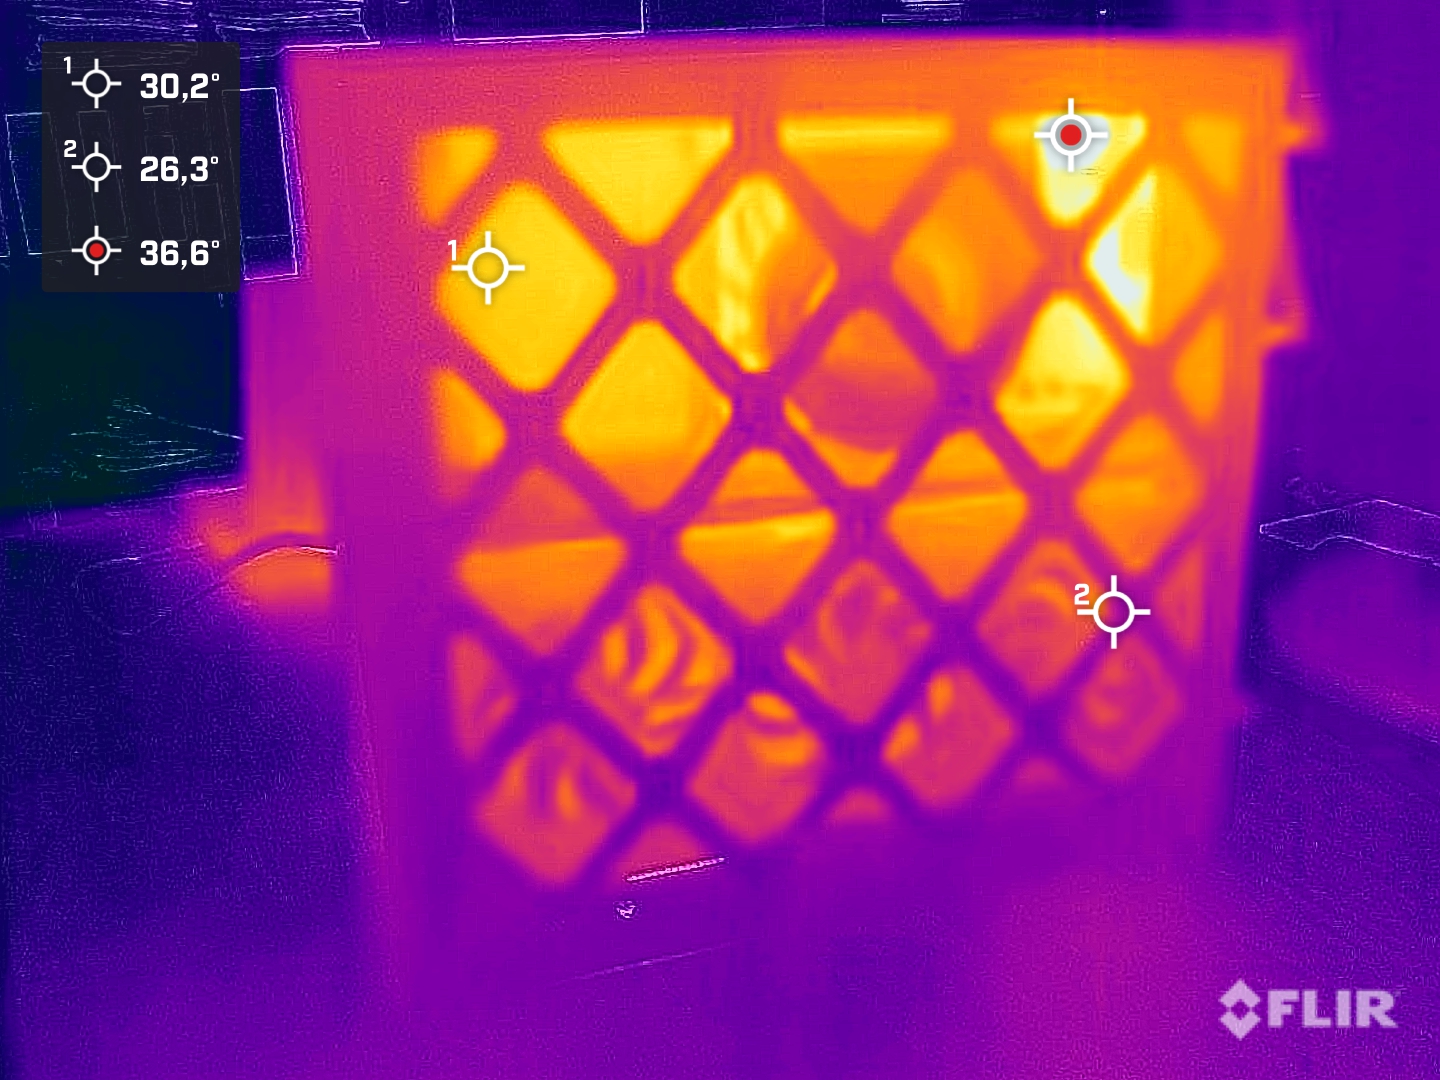
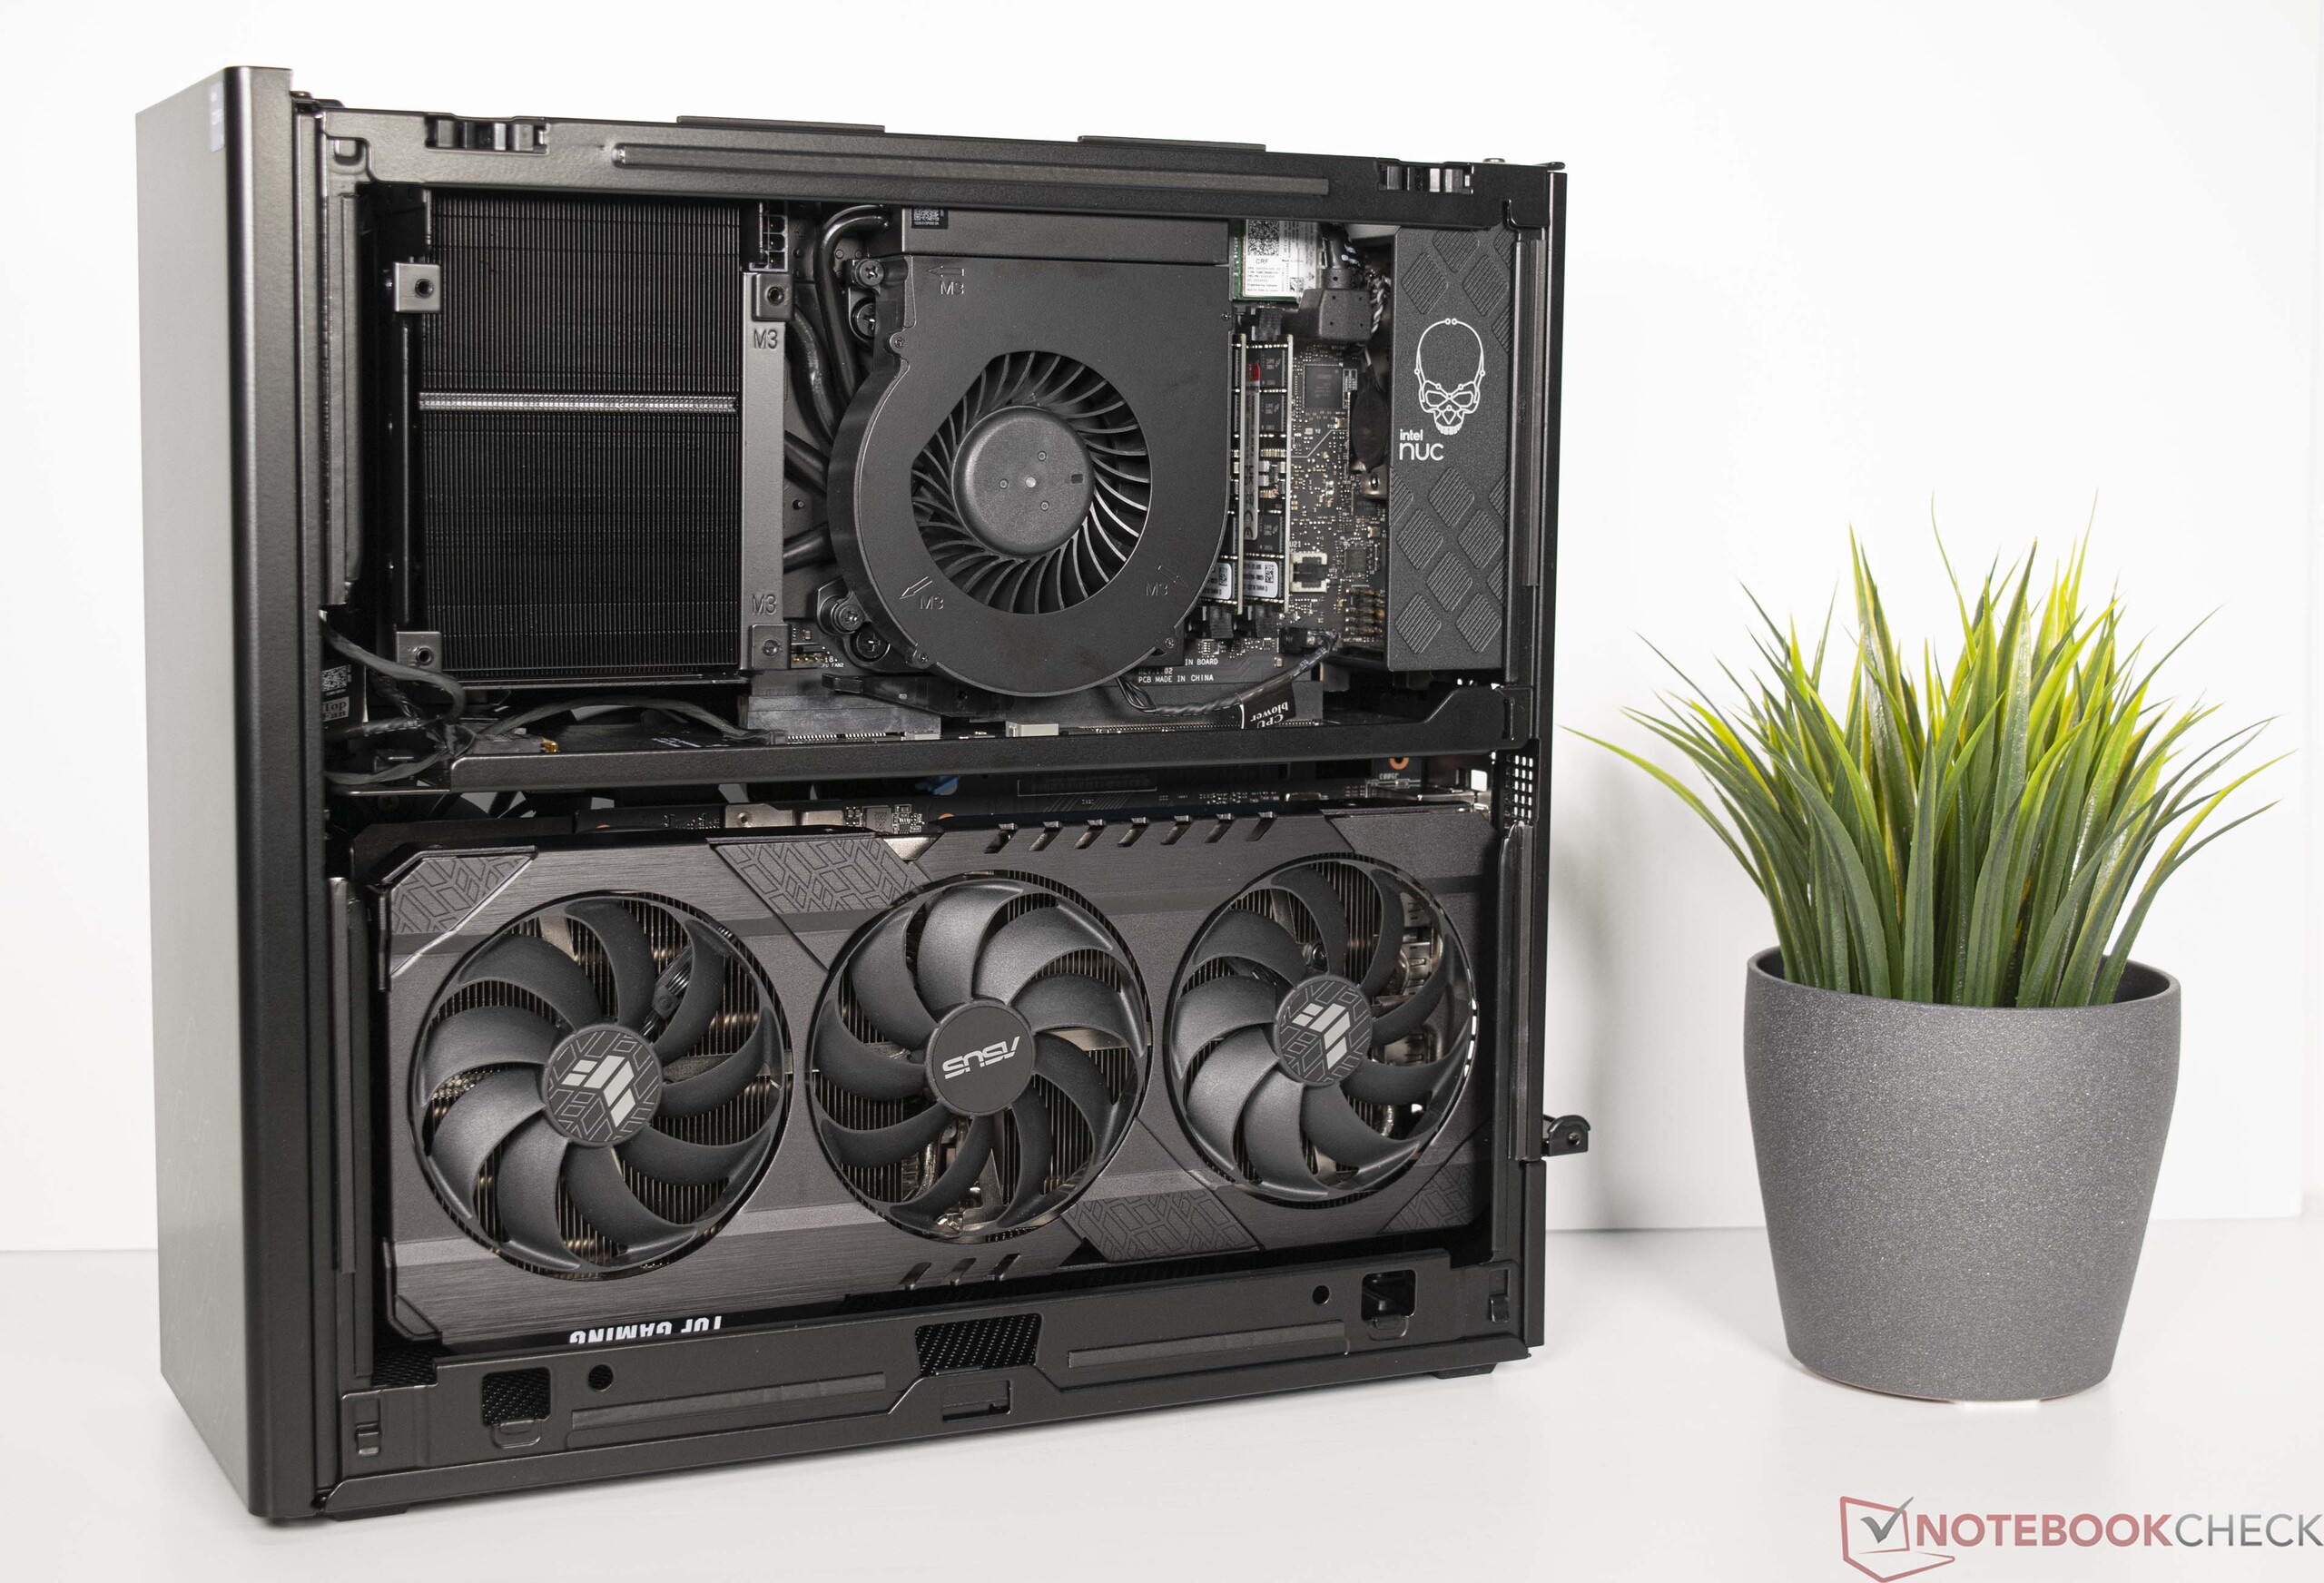
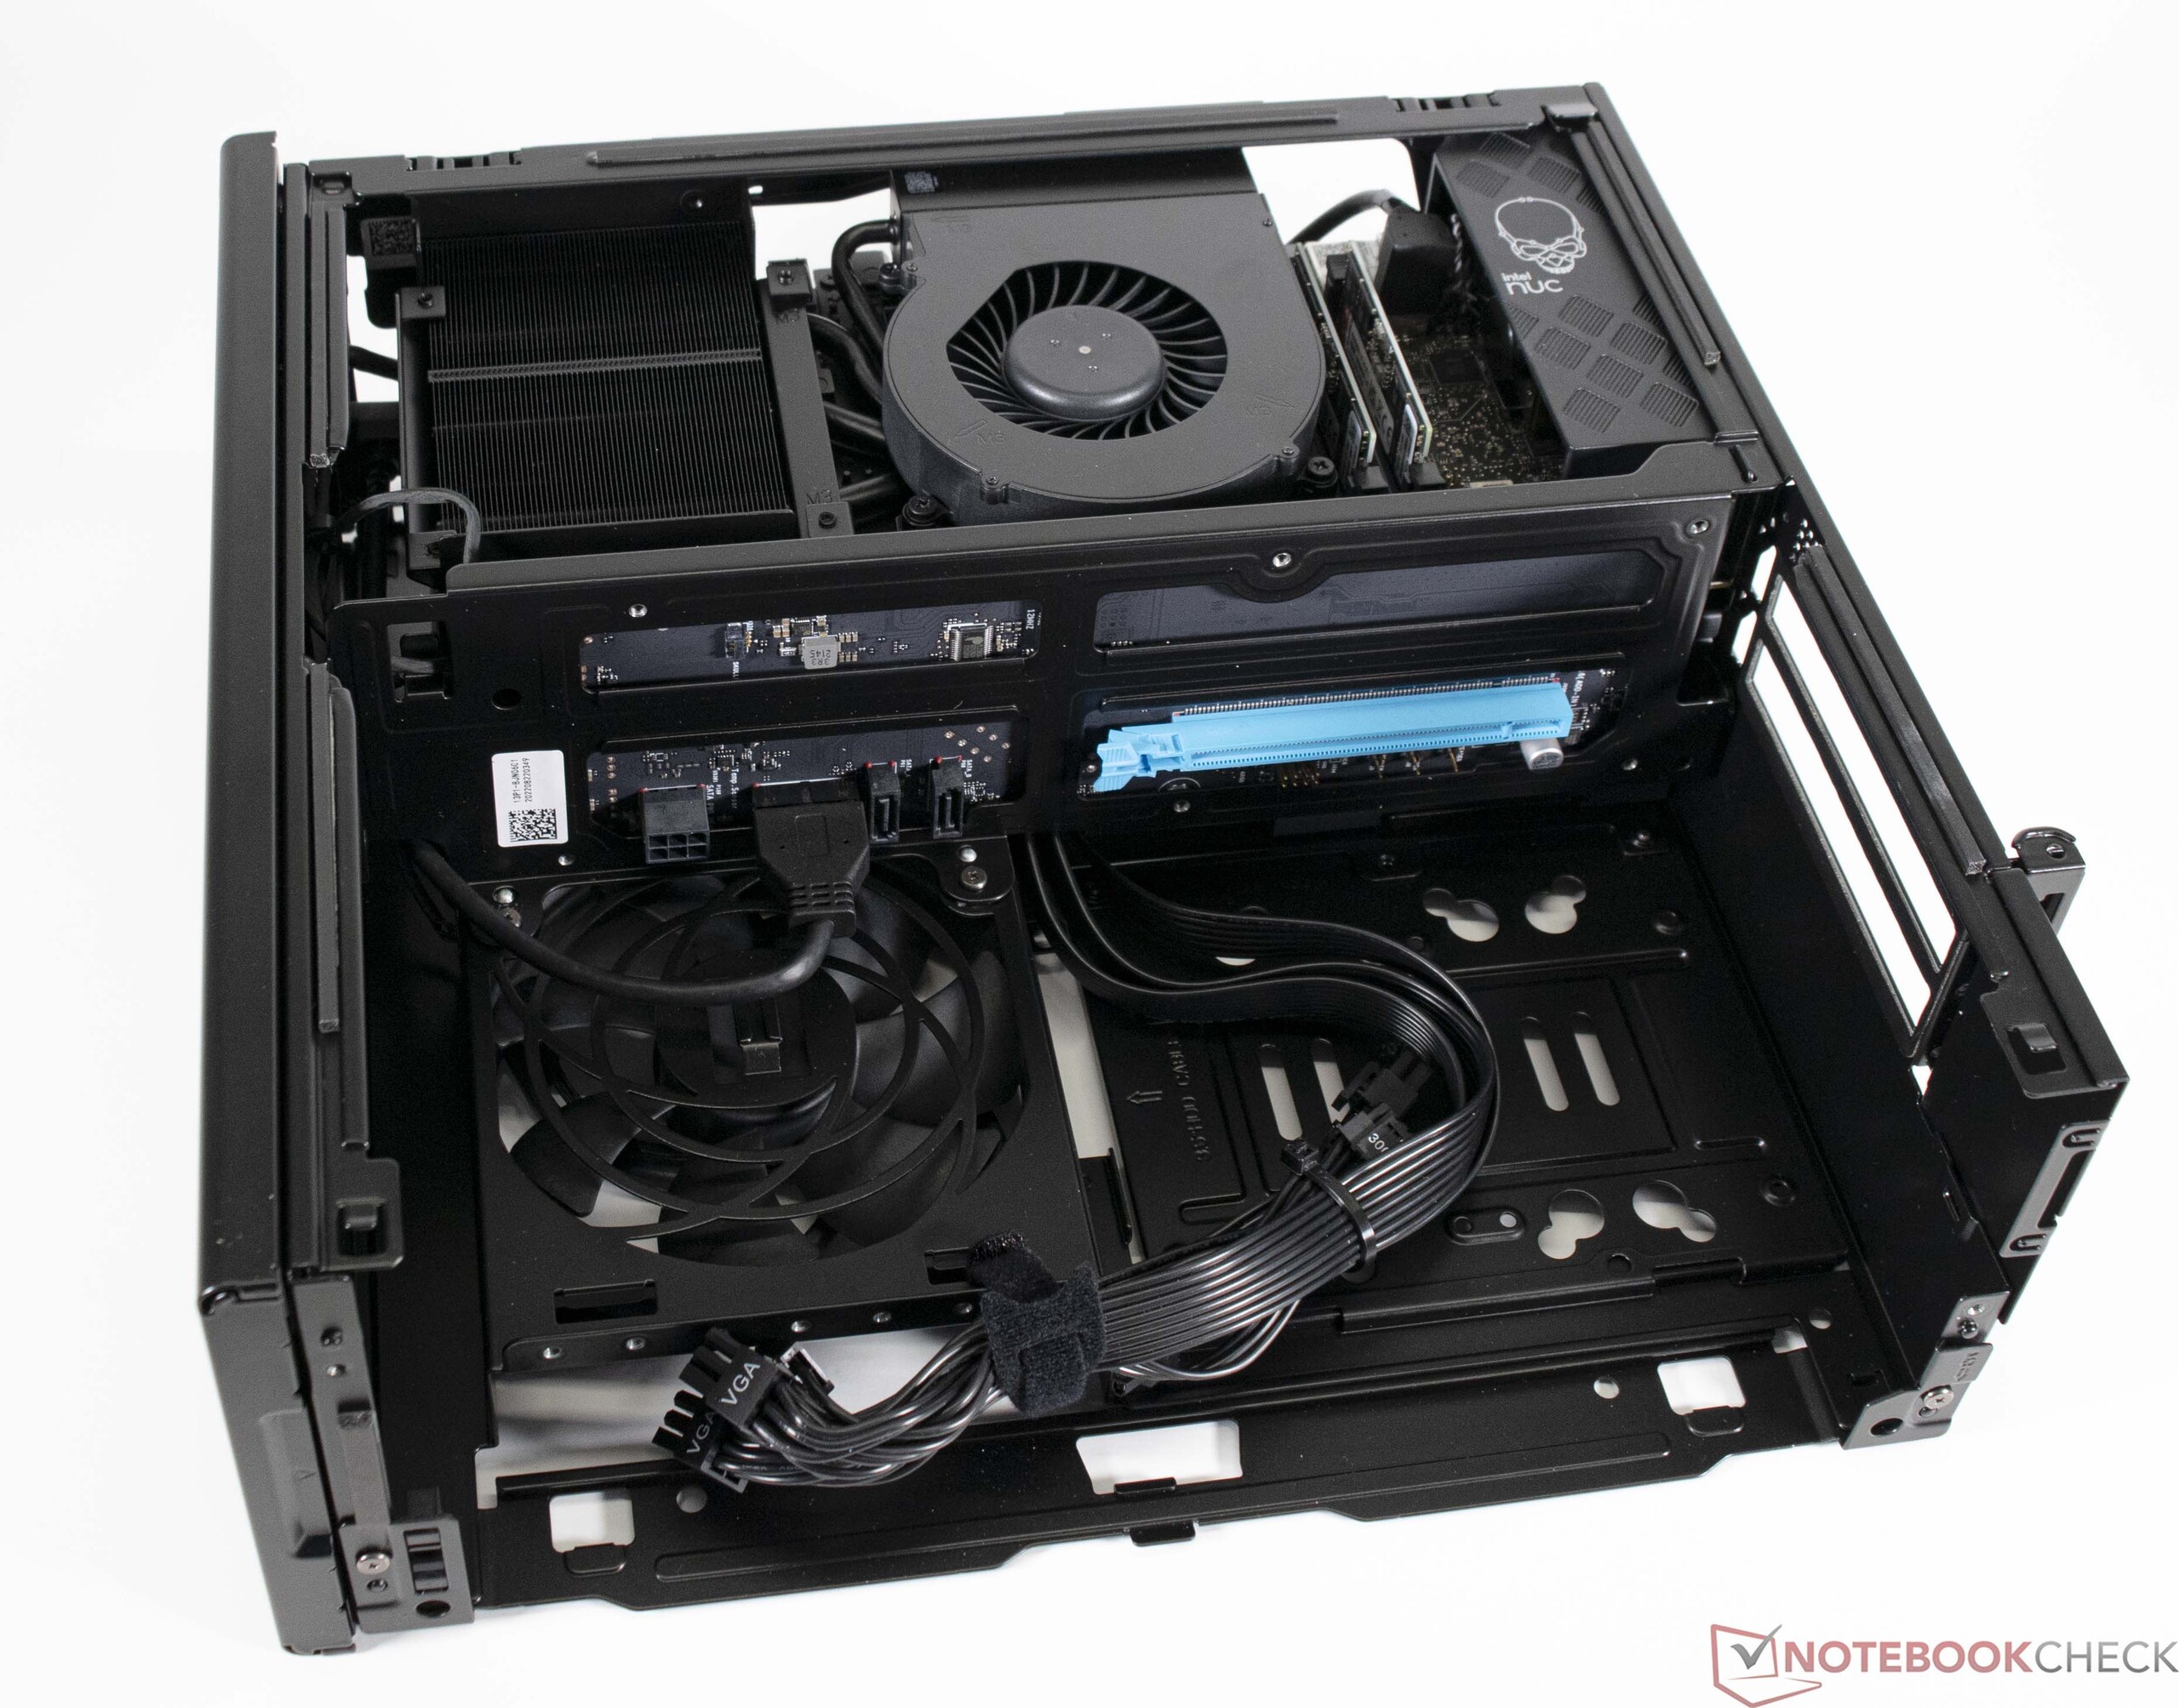
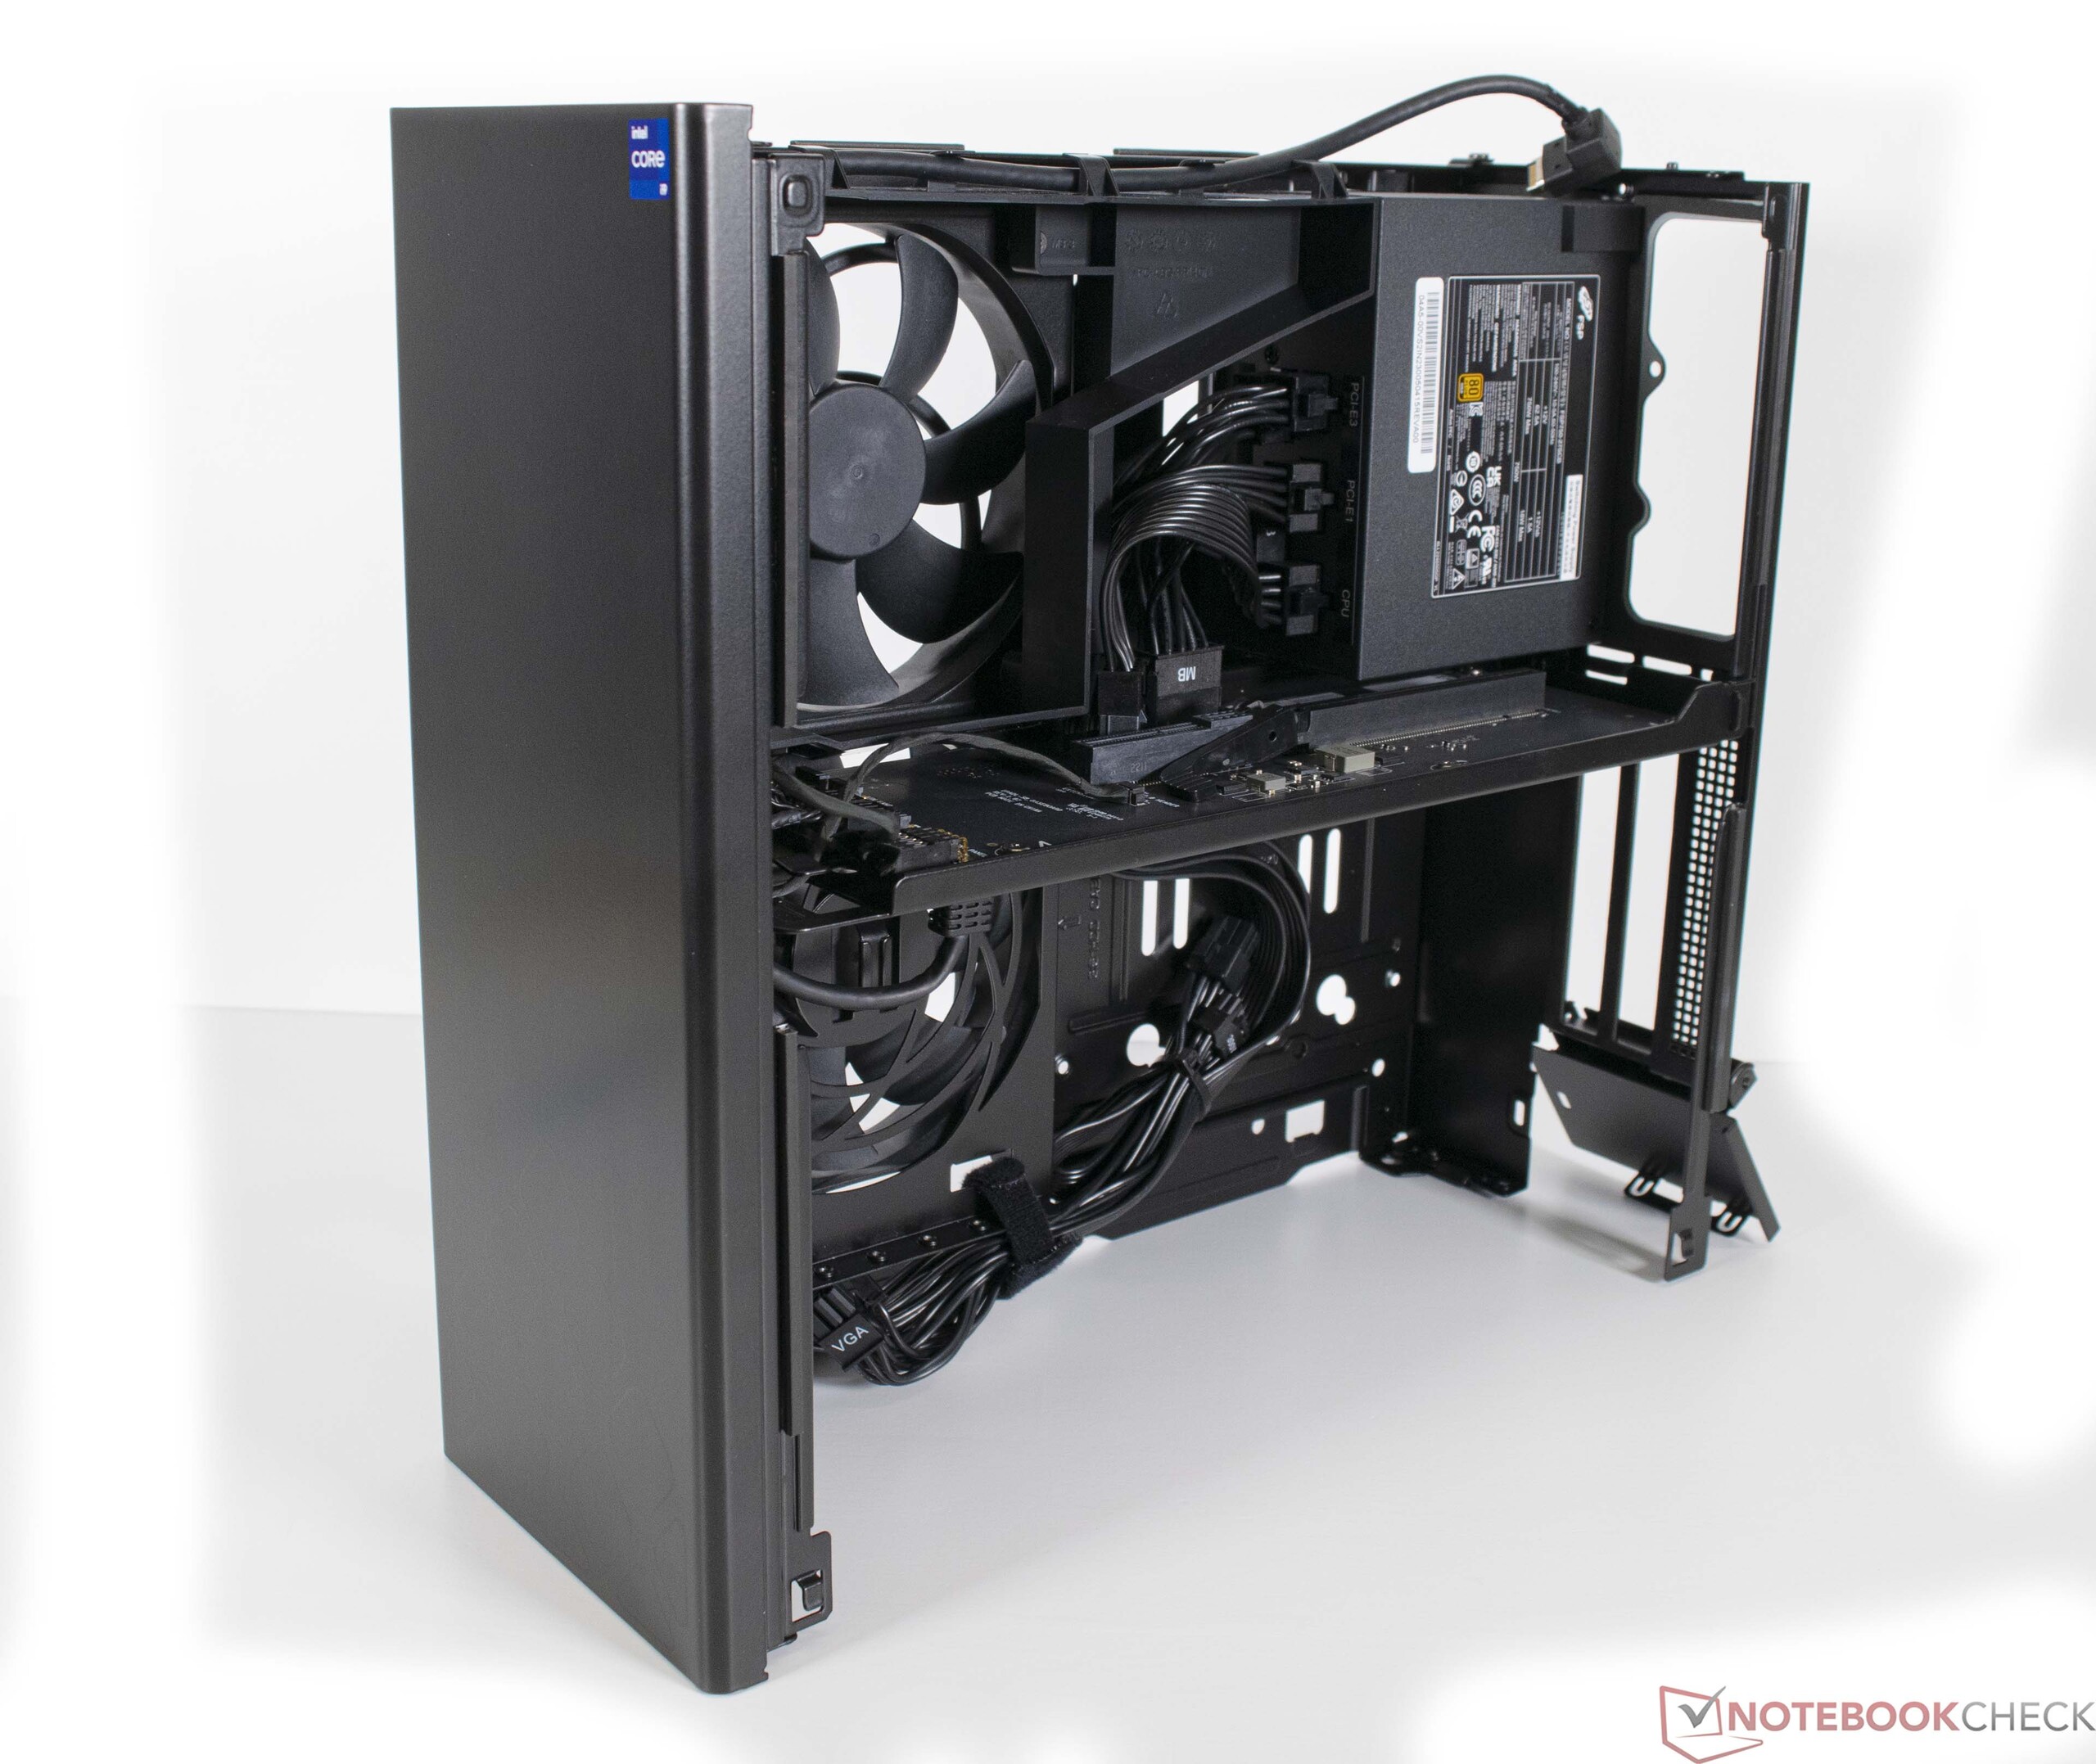
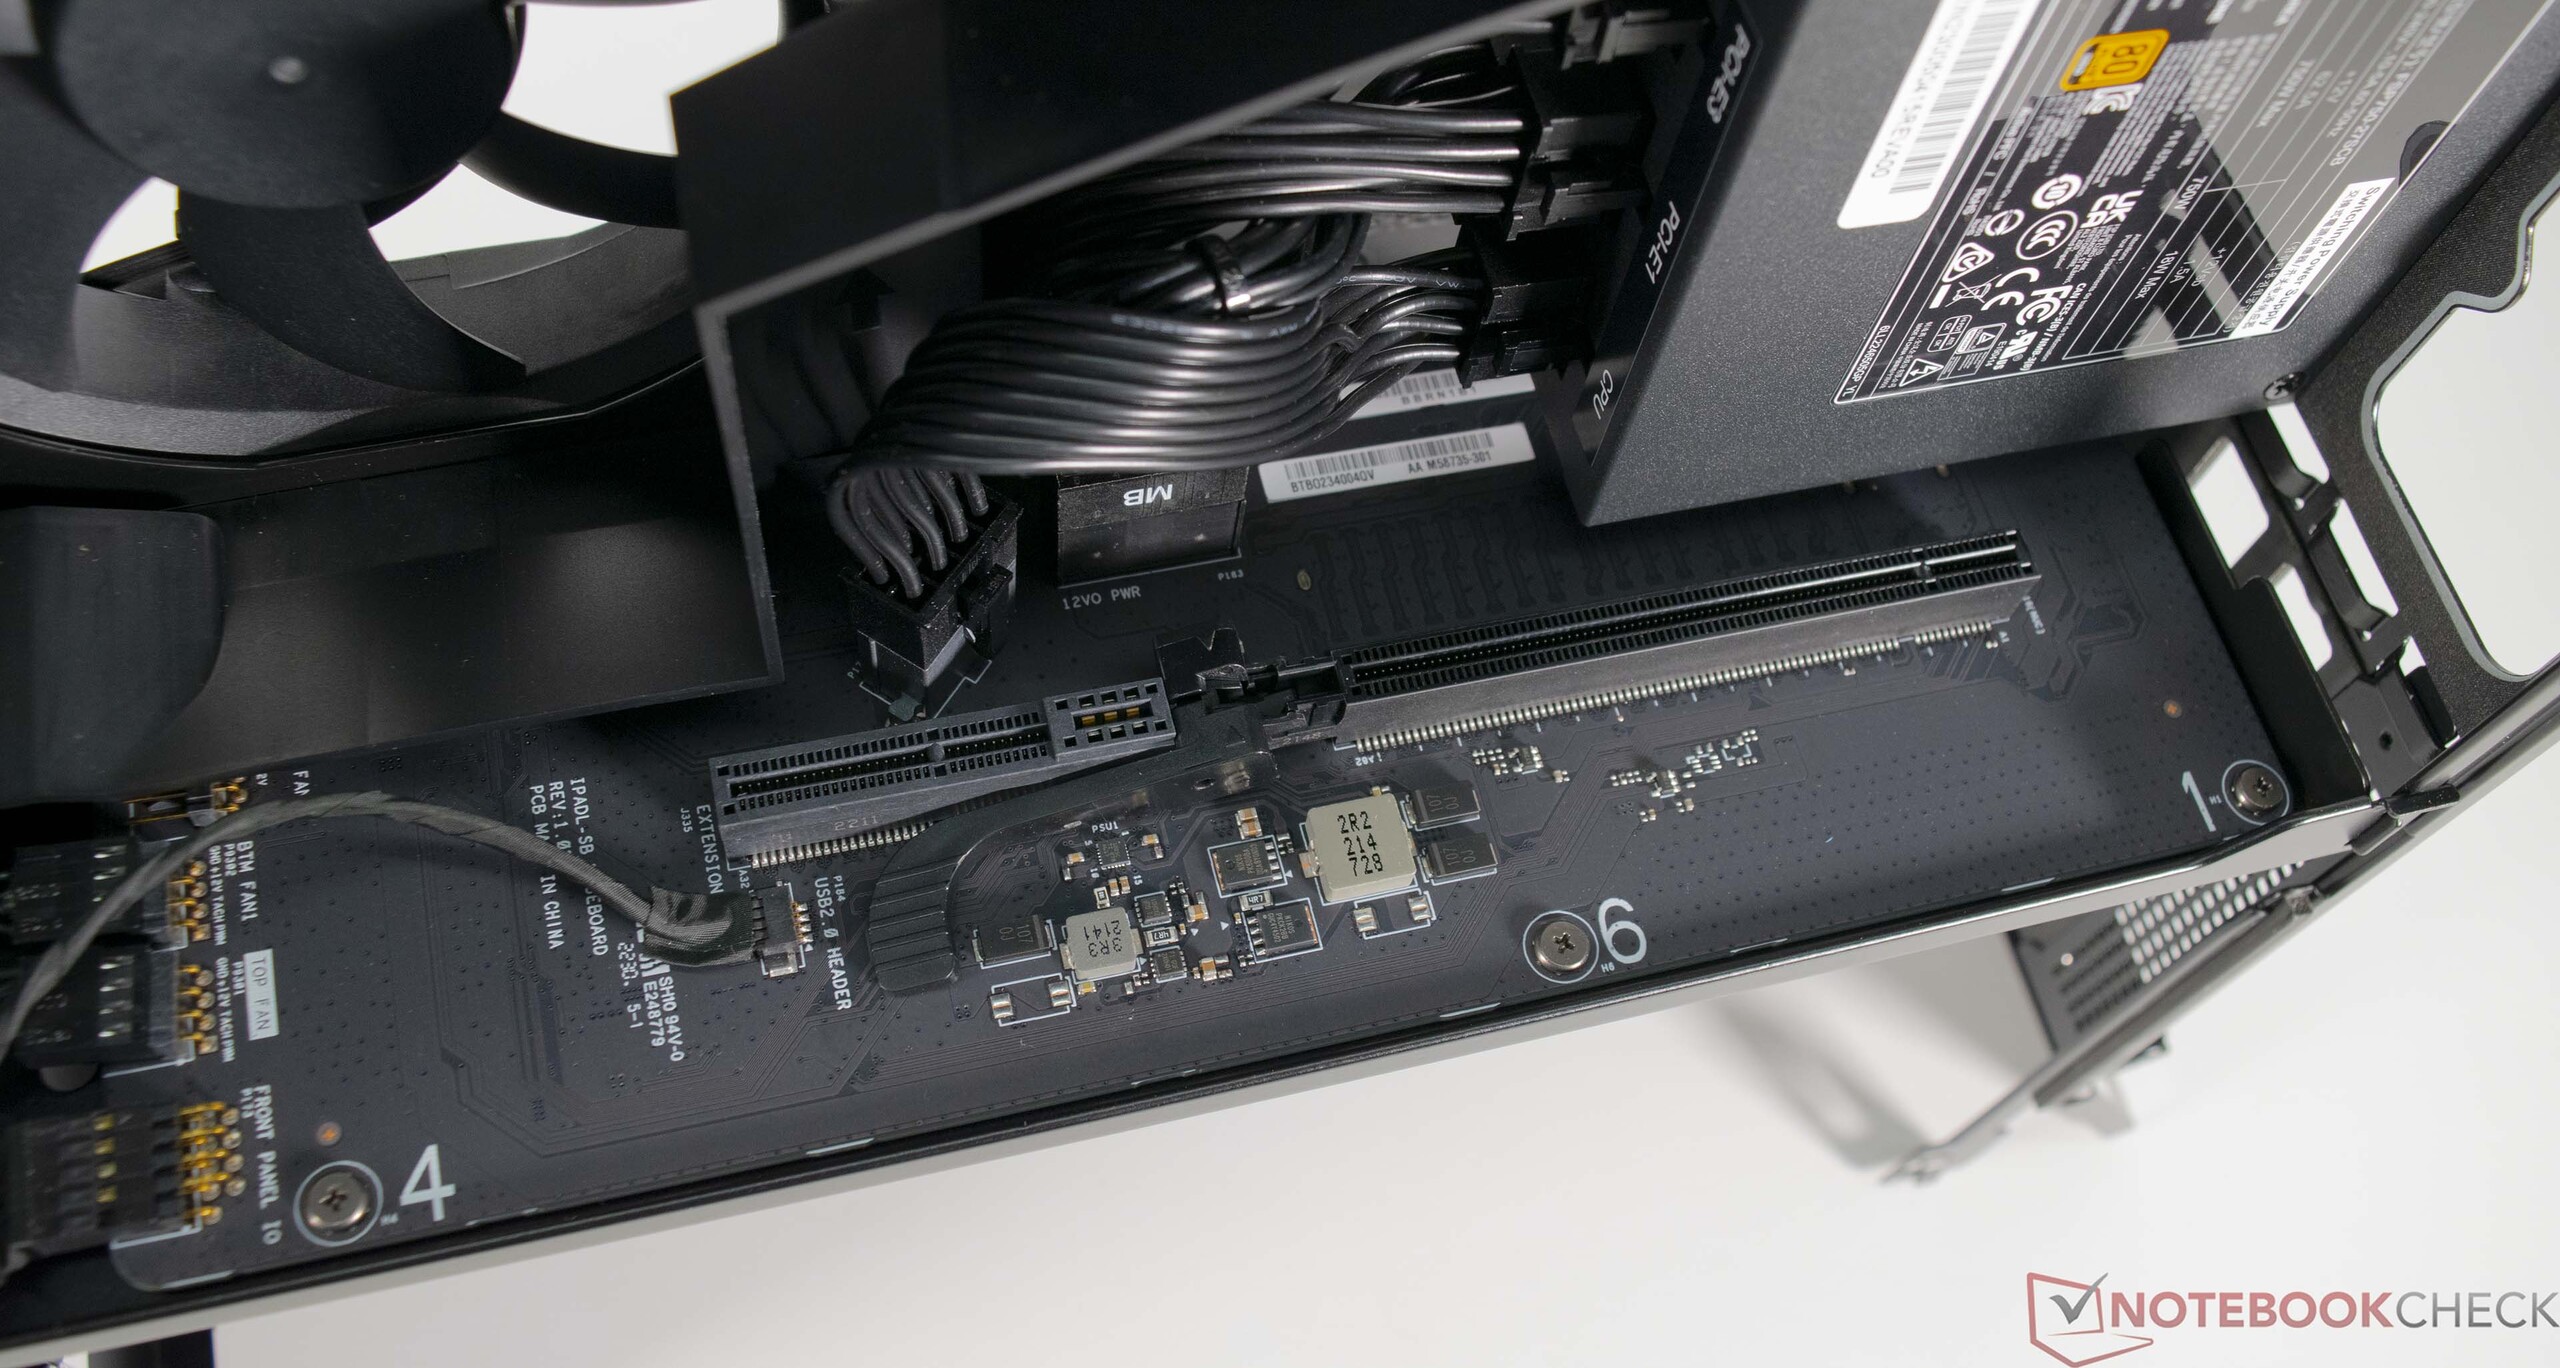
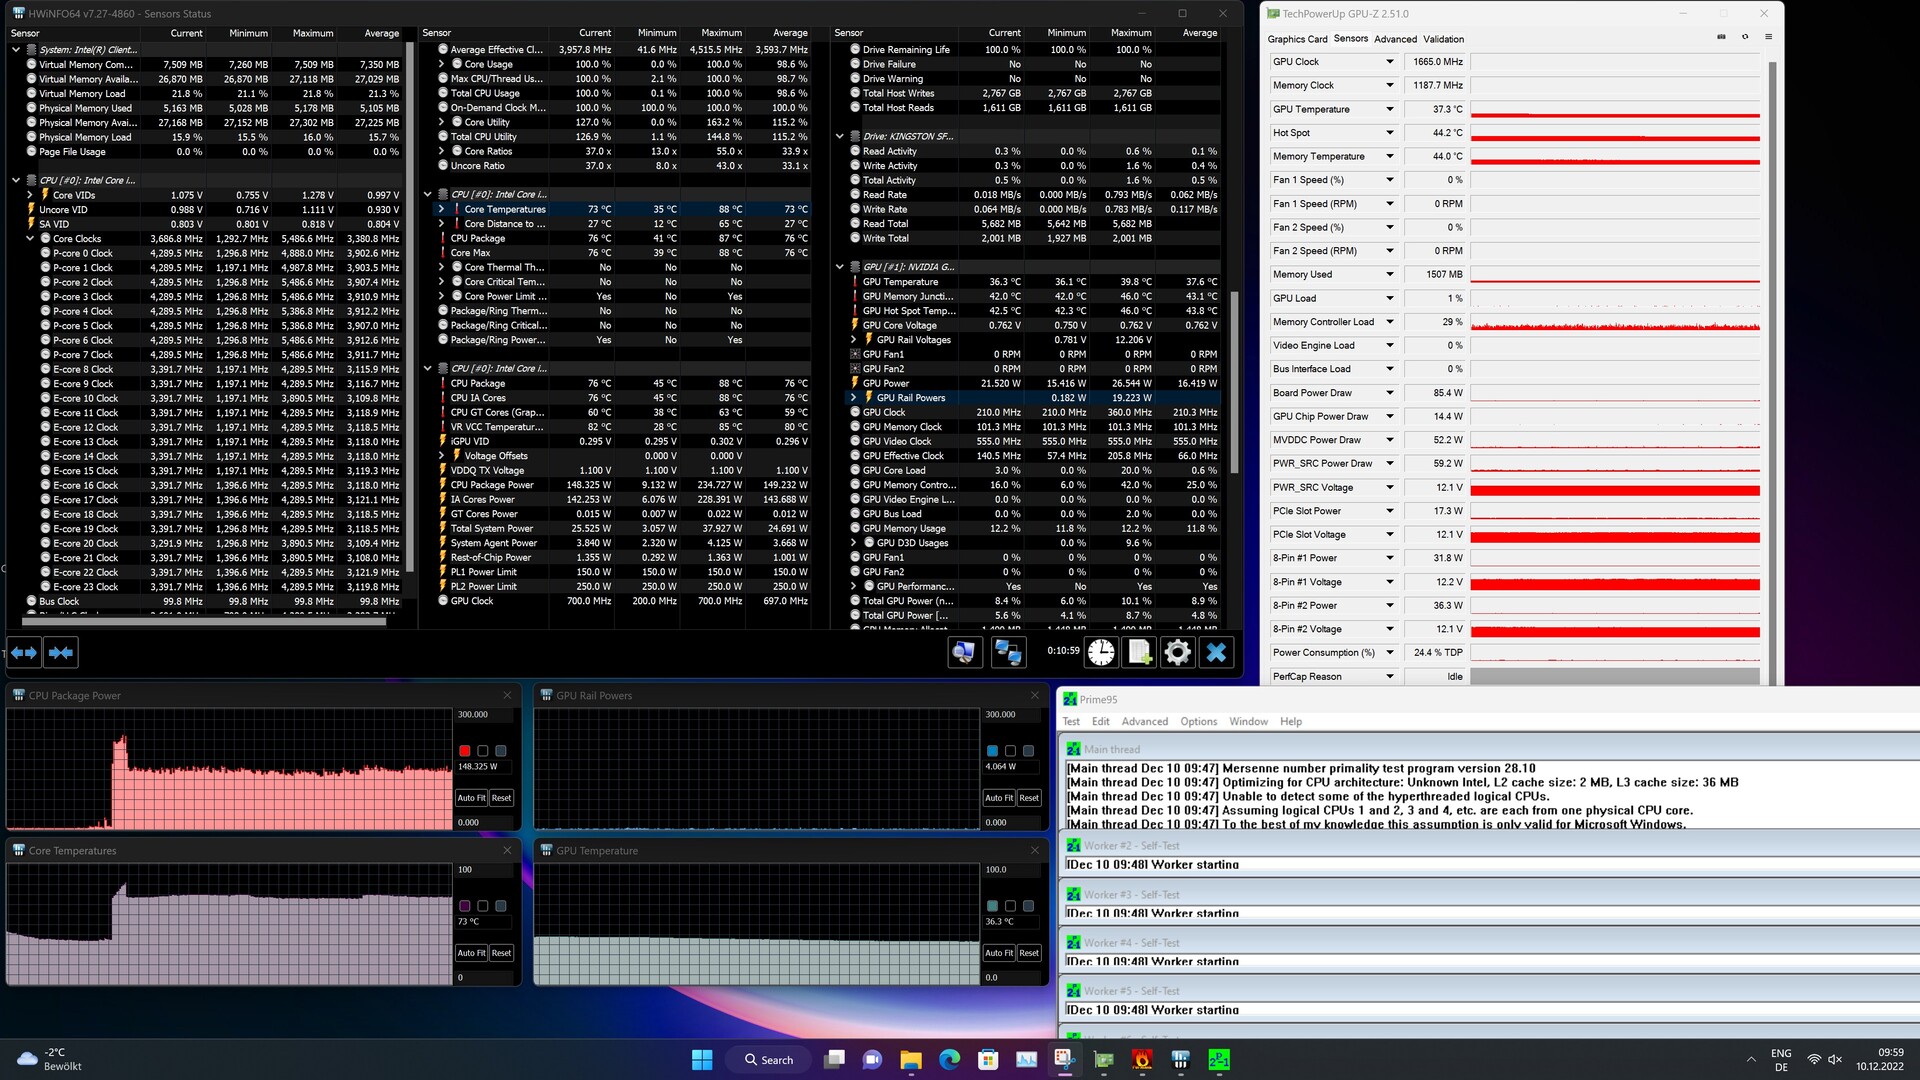
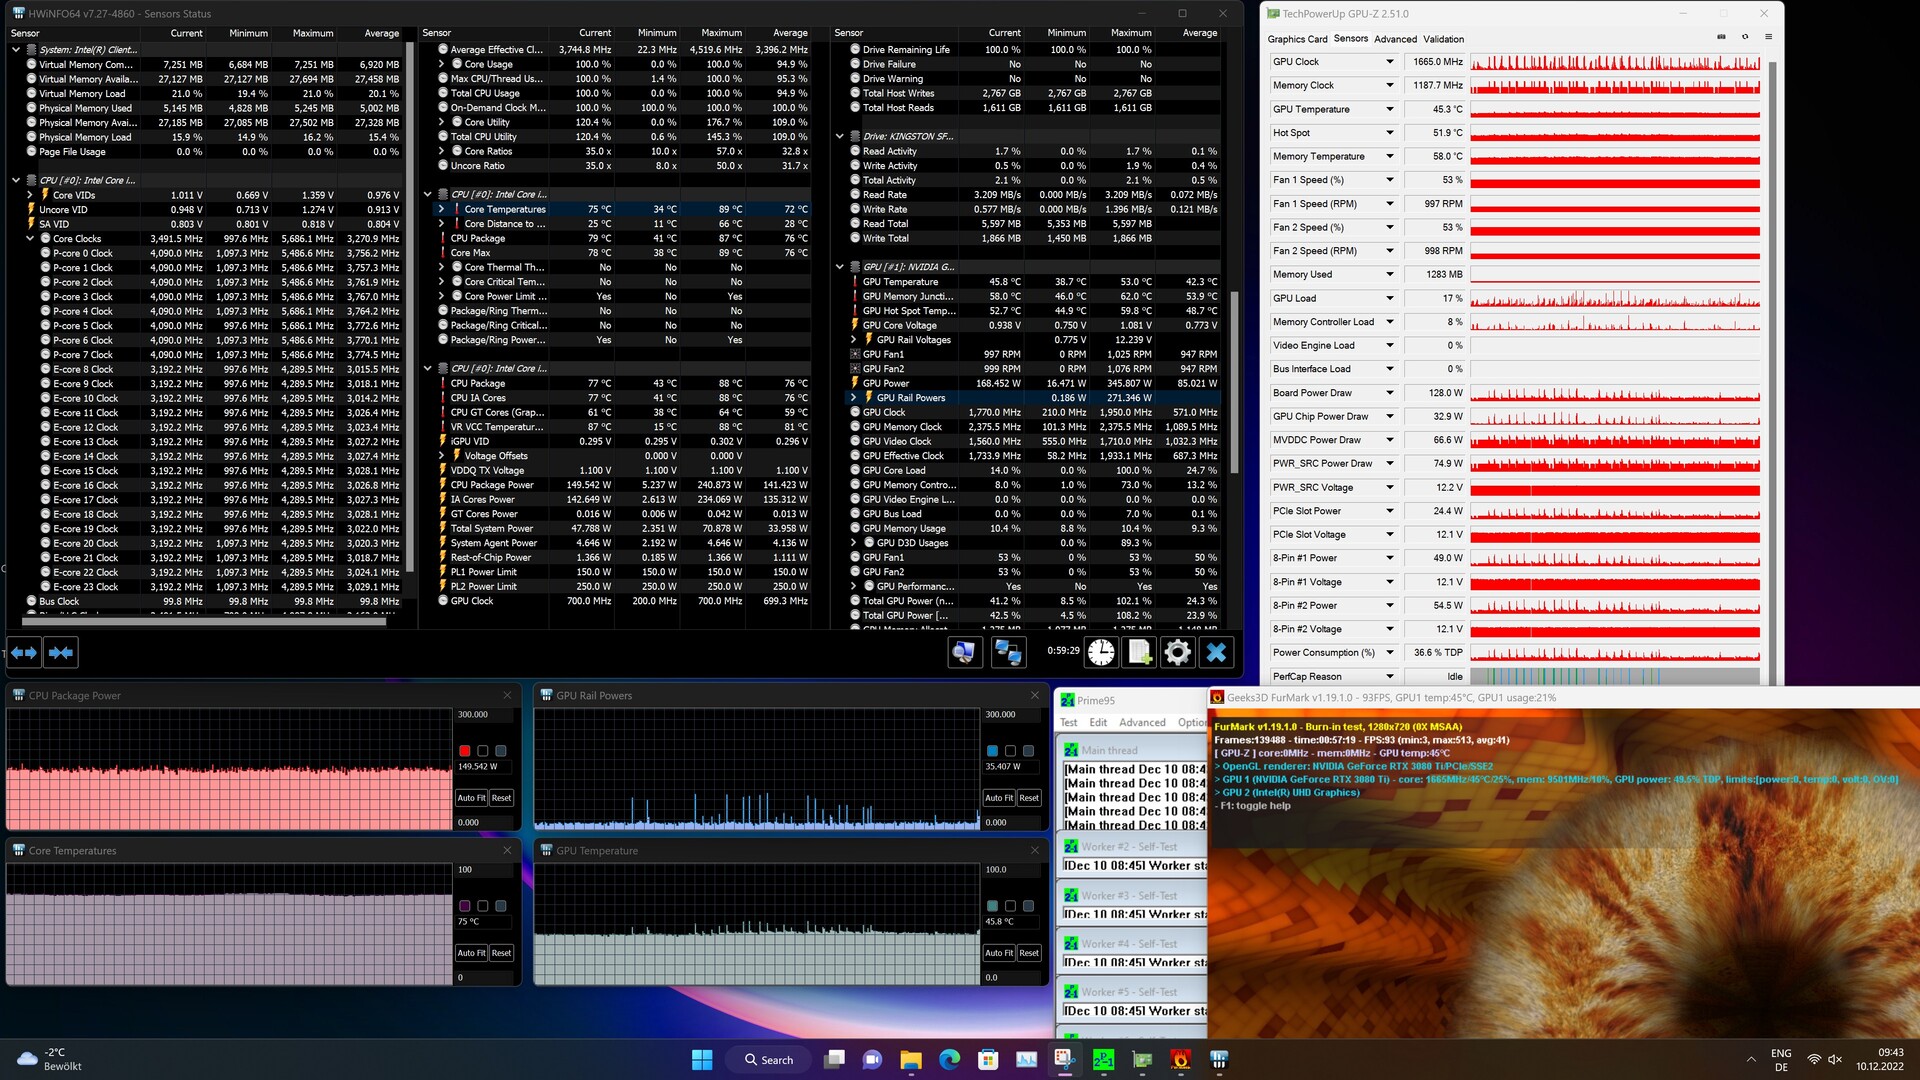
The case of the Intel NUC 13 Extreme Raptor Canyon is split into two chambers. The top part houses the Compute Element, which includes the CPU, RAM, and SSD as well as the power supply, while the bottom is reserved entirely for a dedicated graphics card. Although this concept works out well in practice, the PL2 of the Intel Core i9-13900K can only be maintained for a short time. The CPU inevitably reaches 100 °C under load. That being said, however, the CPU only rarely reaches this temperature for very short periods. On average, the CPU temperature stabilizes between 60 and 90 °C, depending on the scenario.
When it comes to the noise emissions, our configuration of the system remains relatively quiet. Although at 39 dB(A), the system noise is noticeable under full load, it is still far from being a nuisance. We measure a similar value of just above 38 dB(A) while gaming. Thus, the installed graphics card is the main source of noise under load. It is possible to create a very quiet system with a quieter model.
Noise level
| Idle |
| 32.1 / 32.1 / 32.1 dB(A) |
| Load |
| 33.4 / 39 dB(A) |
 | ||
30 dB silent 40 dB(A) audible 50 dB(A) loud |
||
min: | ||
Energy Consumption
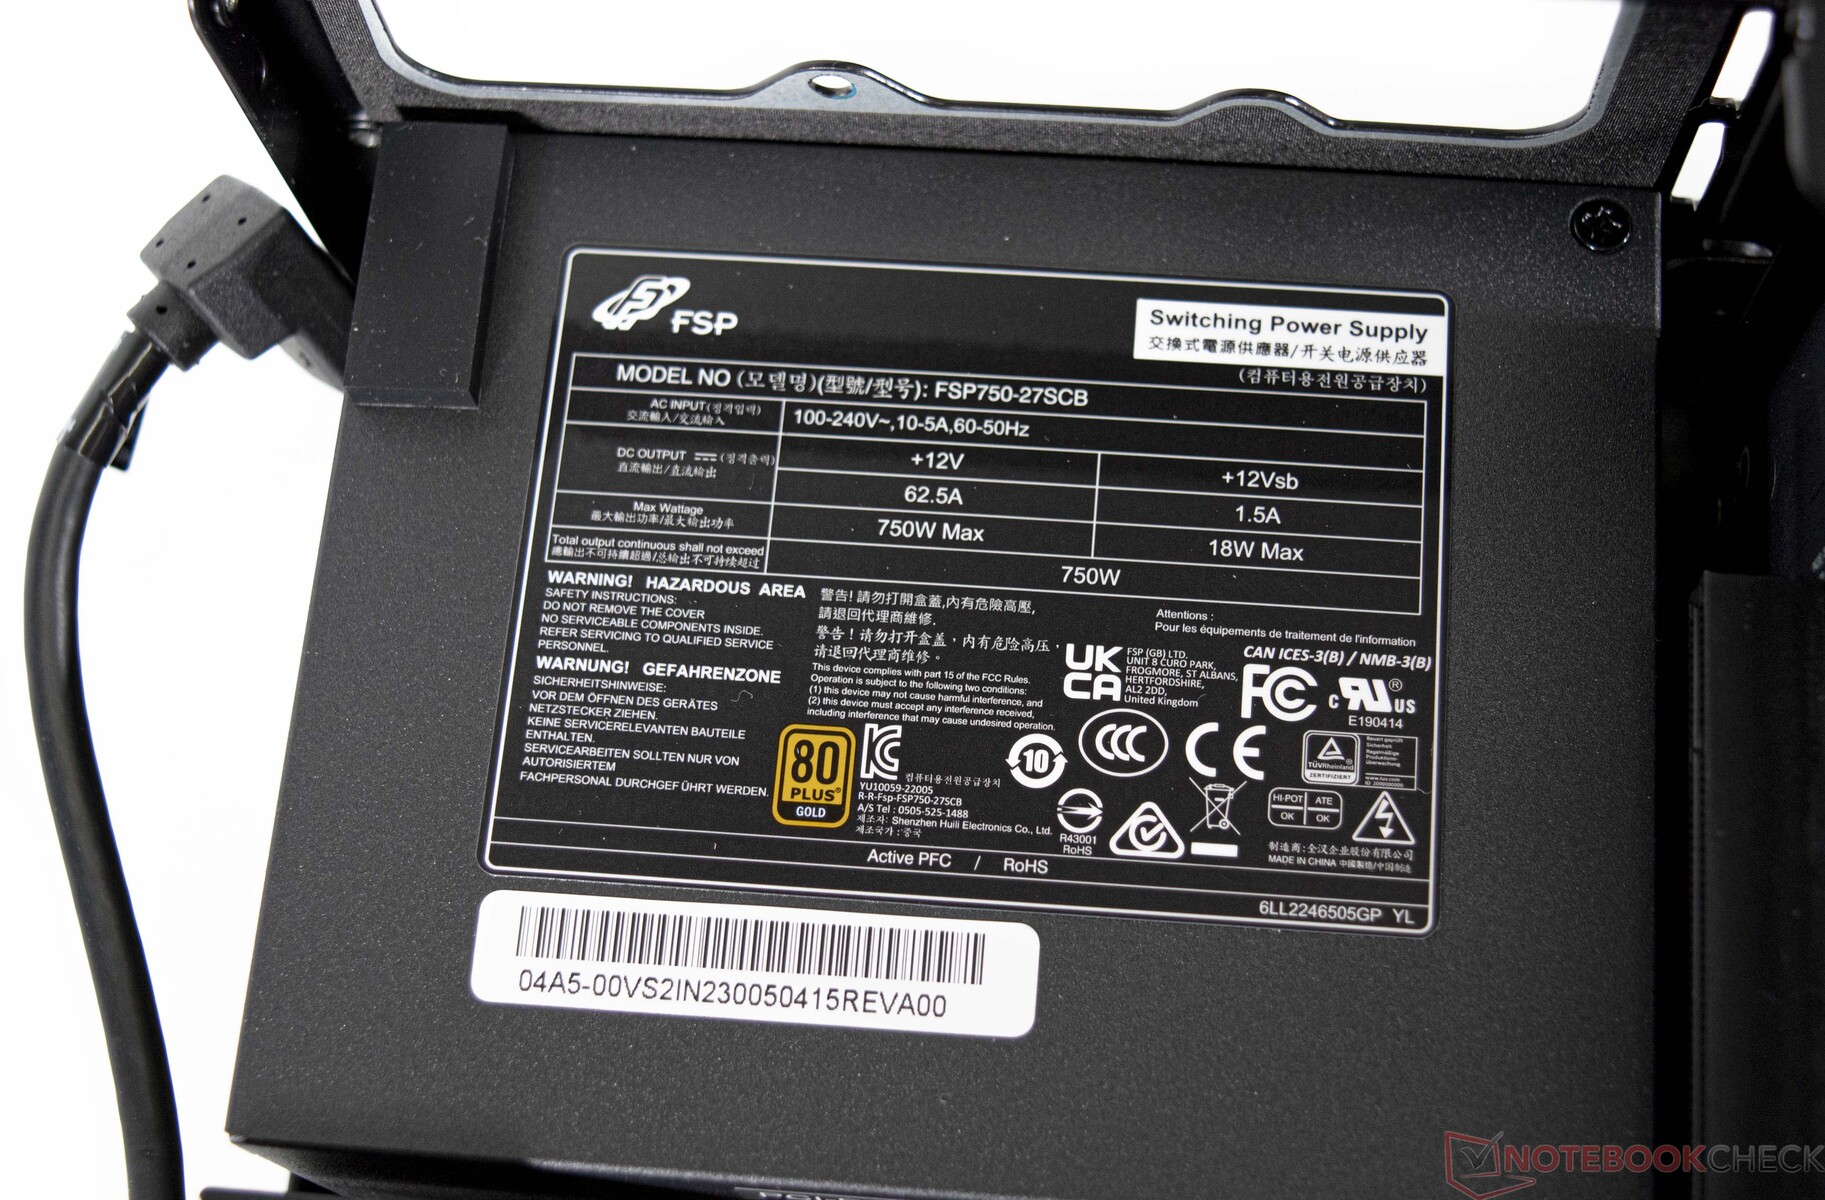
A 750-watt SFX power supply handles AC conversion. Since we measured a maximum power draw of 499 watts while gaming, users will not have to worry even when the system is under full load. We also observed 544-watt peaks in our testing, which did not lead to any issues. With 350 watts, the graphics card consumes the lion share of power while gaming. We advise against using GPUs with an even higher TGP. The new 21VHPWR cable can only supply up to 300 watts anyway - at least according to the legend on the plug. In total, there are three 6+2-PCIe cables.
| Intel NUC13 Raptor Canyon i9-13900K, GeForce RTX 3080 Ti | Minisforum Neptune Series HX90G R9 5900HX, Radeon RX 6600M | Minisforum NUCX i7 i7-11800H, GeForce RTX 3070 Laptop GPU | Average NVIDIA GeForce RTX 3080 Ti | Average of class Desktop | |
|---|---|---|---|---|---|
| Power Consumption | 51% | 36% | 0% | 40% | |
| Idle Minimum * (Watt) | 39 | 17.8 54% | 28.2 28% | 39 ? -0% | 17.9 ? 54% |
| Idle Average * (Watt) | 42 | 17.9 57% | 29.9 29% | 42 ? -0% | 37.2 ? 11% |
| Idle Maximum * (Watt) | 52 | 18.1 65% | 36.2 30% | 52 ? -0% | 41.3 ? 21% |
| Load Average * (Watt) | 228 | 82.1 64% | 83.2 64% | 228 ? -0% | 96.7 ? 58% |
| Load Maximum * (Watt) | 308 | 262 15% | 215.7 30% | 308 ? -0% | 141.6 ? 54% |
| Witcher 3 ultra * (Watt) | 167 | ||||
| Cyberpunk 2077 ultra external monitor * (Watt) | 177 |
* ... smaller is better
| Off / Standby | |
| Idle | |
| Load |
|
Key:
min: | |
Consumption External Monitor
Pros
Cons
Verdict - Lots of Improvements and Significantly More Performance

The Intel NUC 13 Extreme Raptor Canyon does well in many regards. With the current Raptor Lake models, the manufacturer not only updates the hardware but also overhauls the case. It is now significantly larger than before. As a result, we no longer consider this system to be a mini PC, even though Intel may disagree. At a volume of 14 liters, the Intel NUC 13 Extreme Raptor Canyon competes against the Corsair-One-i300 series, which is slightly more compact at 12 liters.
Our configuration of the system comes with sufficient performance for all recent titles at 2160p. Due to the barebone nature of the NUC 13 Raptor Canyon, the device can be customized according to the user's requirements and preferences. The Intel Core i9-13900K performs exceptionally well, which is something we did not expect. Furthermore, the device remains relatively quiet even under load.
The Intel NUC 13 Extreme Kit is based on the Intel Core i9-13900K and offers very fast performance. Paired with an appropriate GPU, it can be a great gaming system or a high-end workstation.
The system, which includes the CPU, currently costs 1550 USD. Adding RAM, an SSD, and a GPU can quickly propel the price into staggering heights. That being said, competitors such as the aforementioned Corsair One i300 are also priced at up to around 5000 USD.
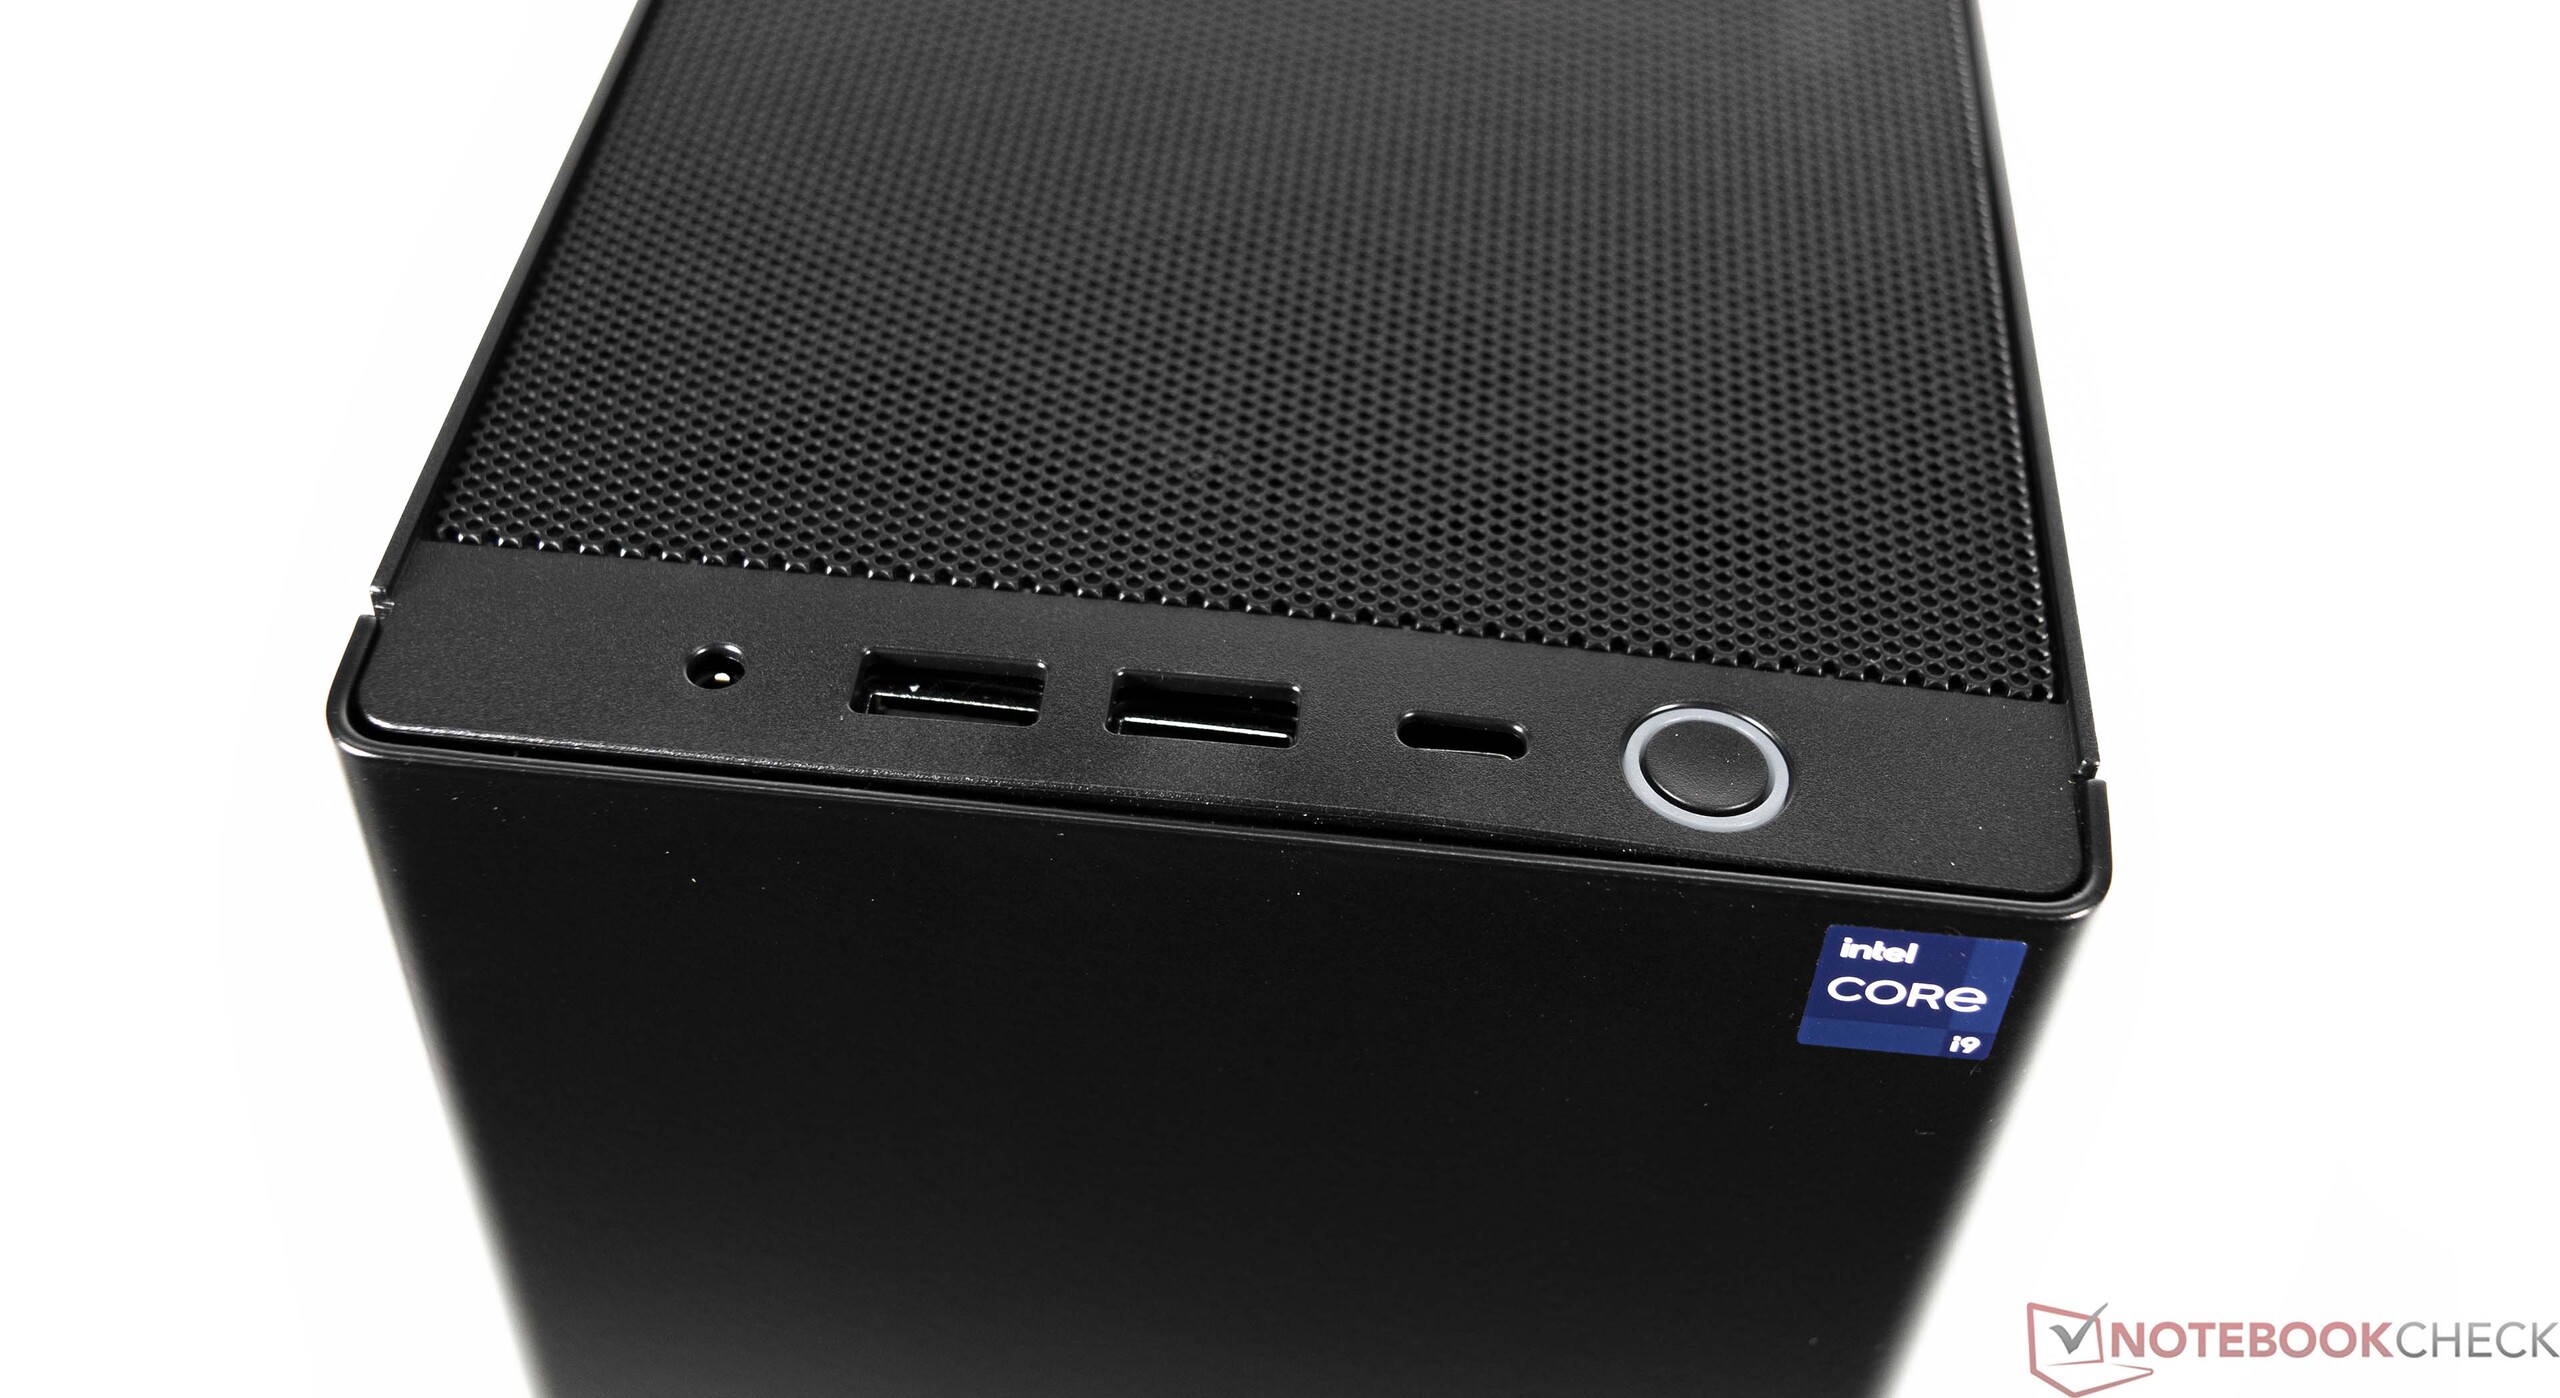
The new case looks sleek and feels robust thanks to the premium materials. Additionally, it features a functional design, which benefits the cooling capabilities. Regardless, there are drawbacks such as the difficult-to-reach SSDs and the lack of a card reader. Last years model still included the latter, offering fast UHS-II speeds.
Price and Availability
In China, the Intel NUC 13 Extreme Raptor Canyon will be released in Q4 2022. A global launch will follow in Q1 2023. Depending on the configuration, the NUC 13 Extreme costs between 1179 USD and 1549 USD without a GPU, RAM, or SSD - this is normal for NUCs. The Compute Element is also available separately without the PC case for 760 to 1100 USD.
Intel has provided us with the Intel NUC 13 Extreme Raptor Canyon for the duration of this review.

