

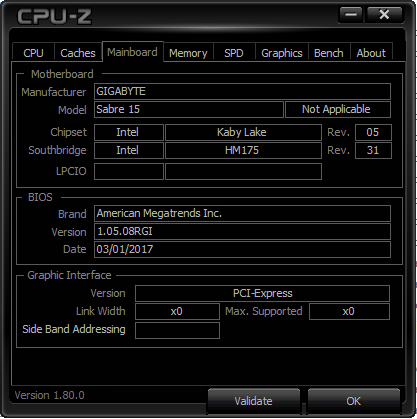
Gigabyte Sabre 15 (i7-7700HQ, GTX 1050) Laptop Review
Gigabyte publicly unveiled its entry-level Sabre series at CES 2017 in the sea of higher-end Aorus notebooks and the arguably more popular Aero series. Unlike these costlier options, the Sabre aims to bring affordable gaming to gamers on a tighter budget by utilizing the mainstream GTX 1050 and 1050 Ti instead of the costlier GTX 1060 series and up.
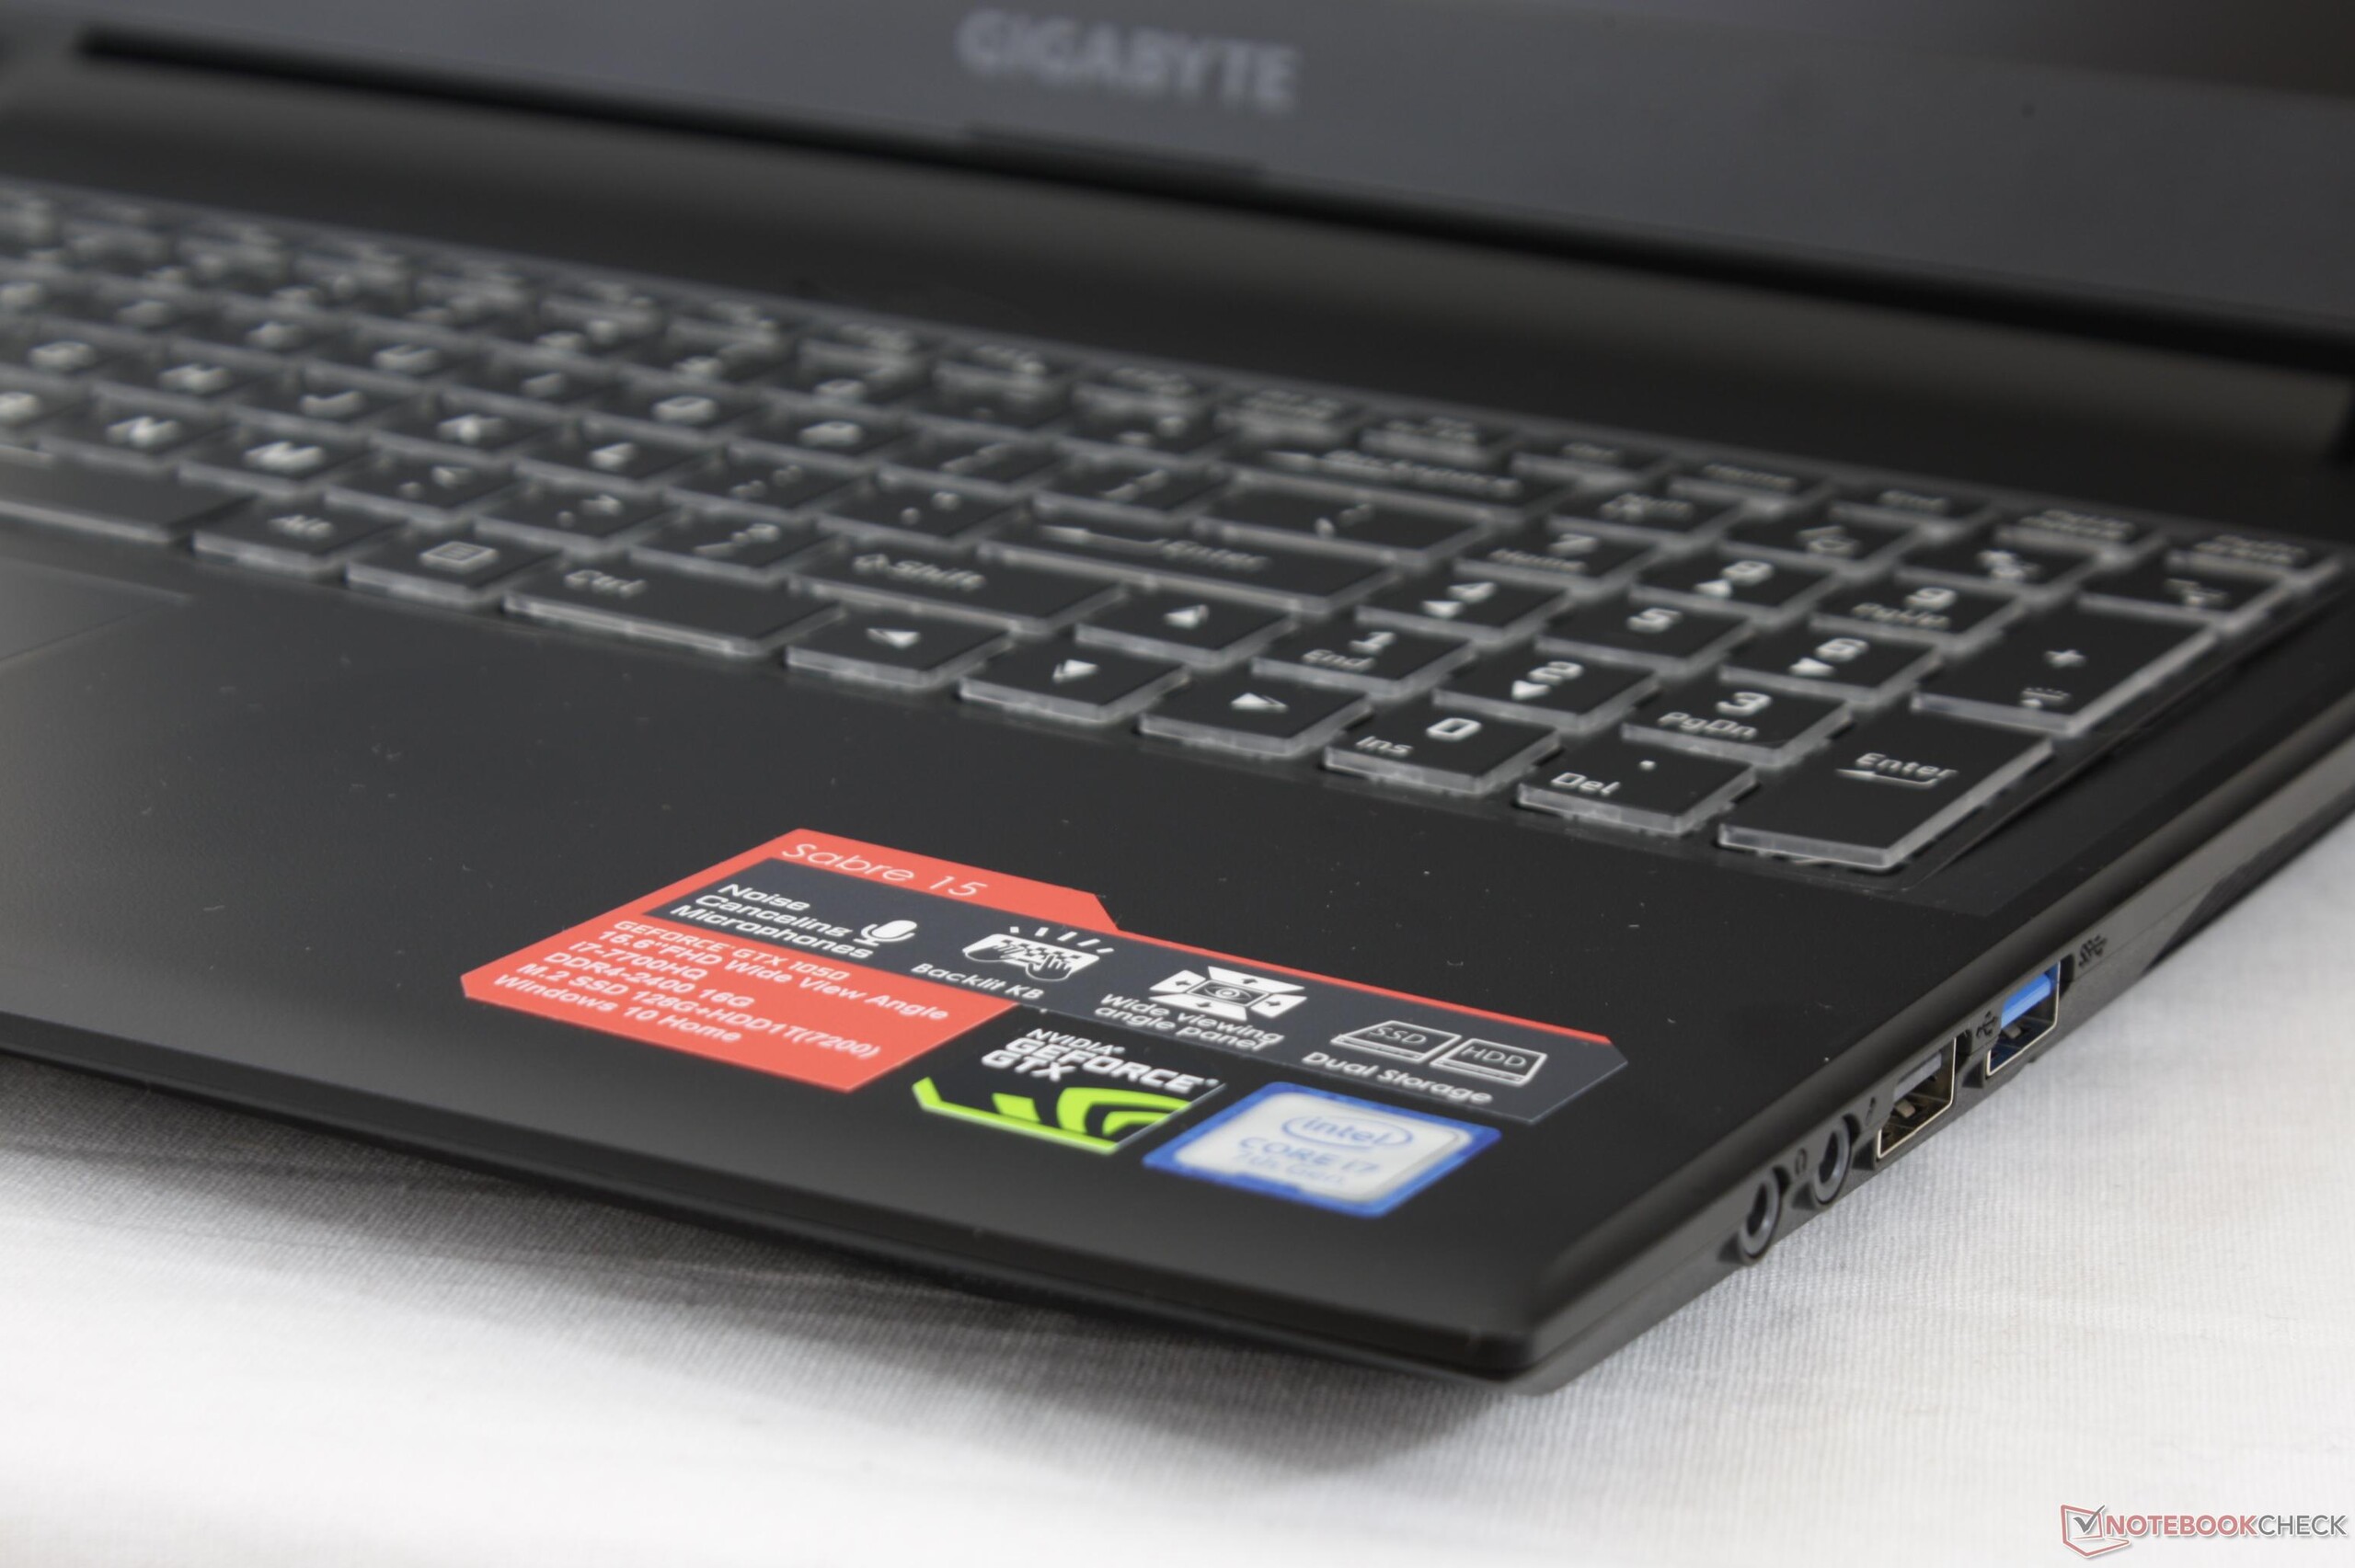
Just two SKUs of the Sabre are available at the time of writing including the Sabre 15G and Sabre 15K. Both configurations are equipped with an identical Core i7-7700HQ CPU, 16 GB DDR4 RAM, 1080p IPS display, and set of chassis features. The only difference is that the 15G ships with a 2 GB GTX 1050 GPU with a 128 GB SSD for $1000 USD while the 15K ships with a 4 GB GTX 1050 Ti GPU with double the primary storage capacity for $1200 USD. Our test model today is the former configuration that competes directly with other mainstream gaming systems like the HP Omen 15, HP Pavilion 15 Power, Samsung Odyssey, Lenovo Yoga 720, Lenovo Legion Y520, Asus FX553/GL553, Acer Aspire VX5, and the MSI GL62M. All of these alternatives ship with GTX 1050 or 1050 Ti options and the same i7-7700HQ CPU to be essentially identical to our Sabre 15 in raw horsepower.
A higher-end Sabre Pro 15 SKU with the GTX 1060 is also in the works. Such a configuration is expected to cost $400 to $500 more than our Sabre 15G.
Gigabyte, of course, is not a newcomer to the world of notebook gaming. Our existing reviews on the past few dozen of their gaming systems reveal that the manufacturer has always had a strong focus on performance and connectivity with very thin and often fragile designs.
Case
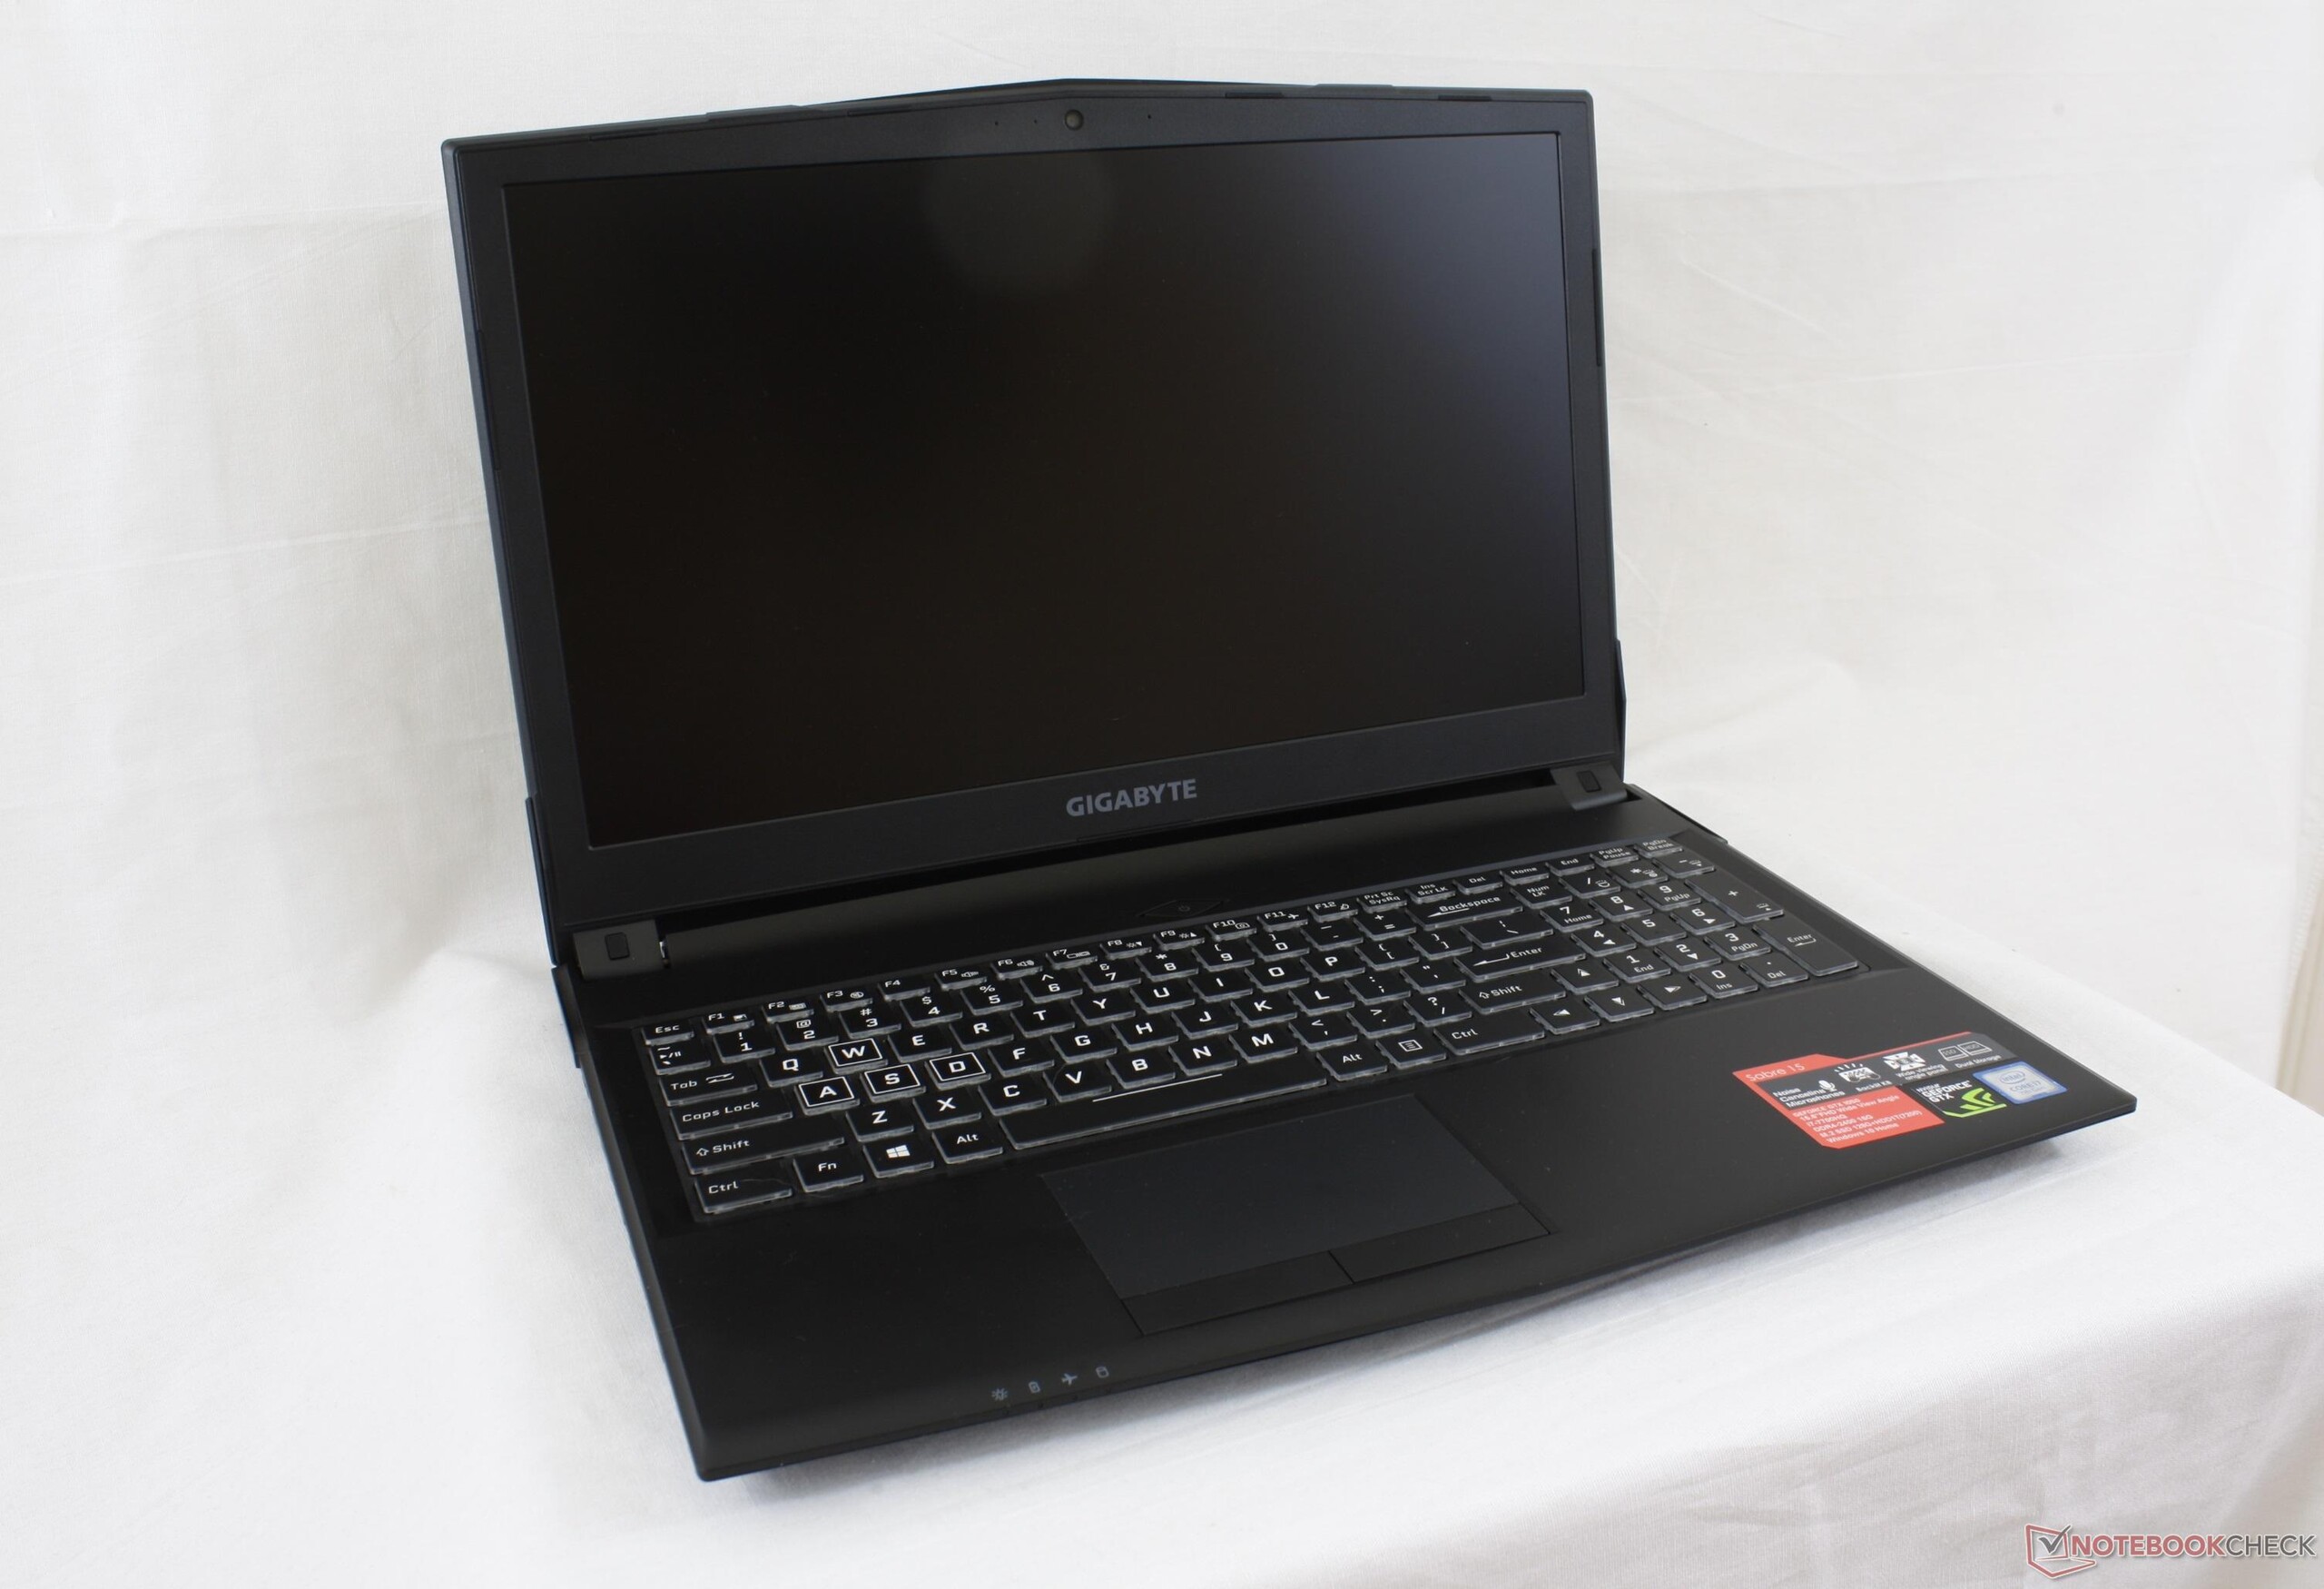
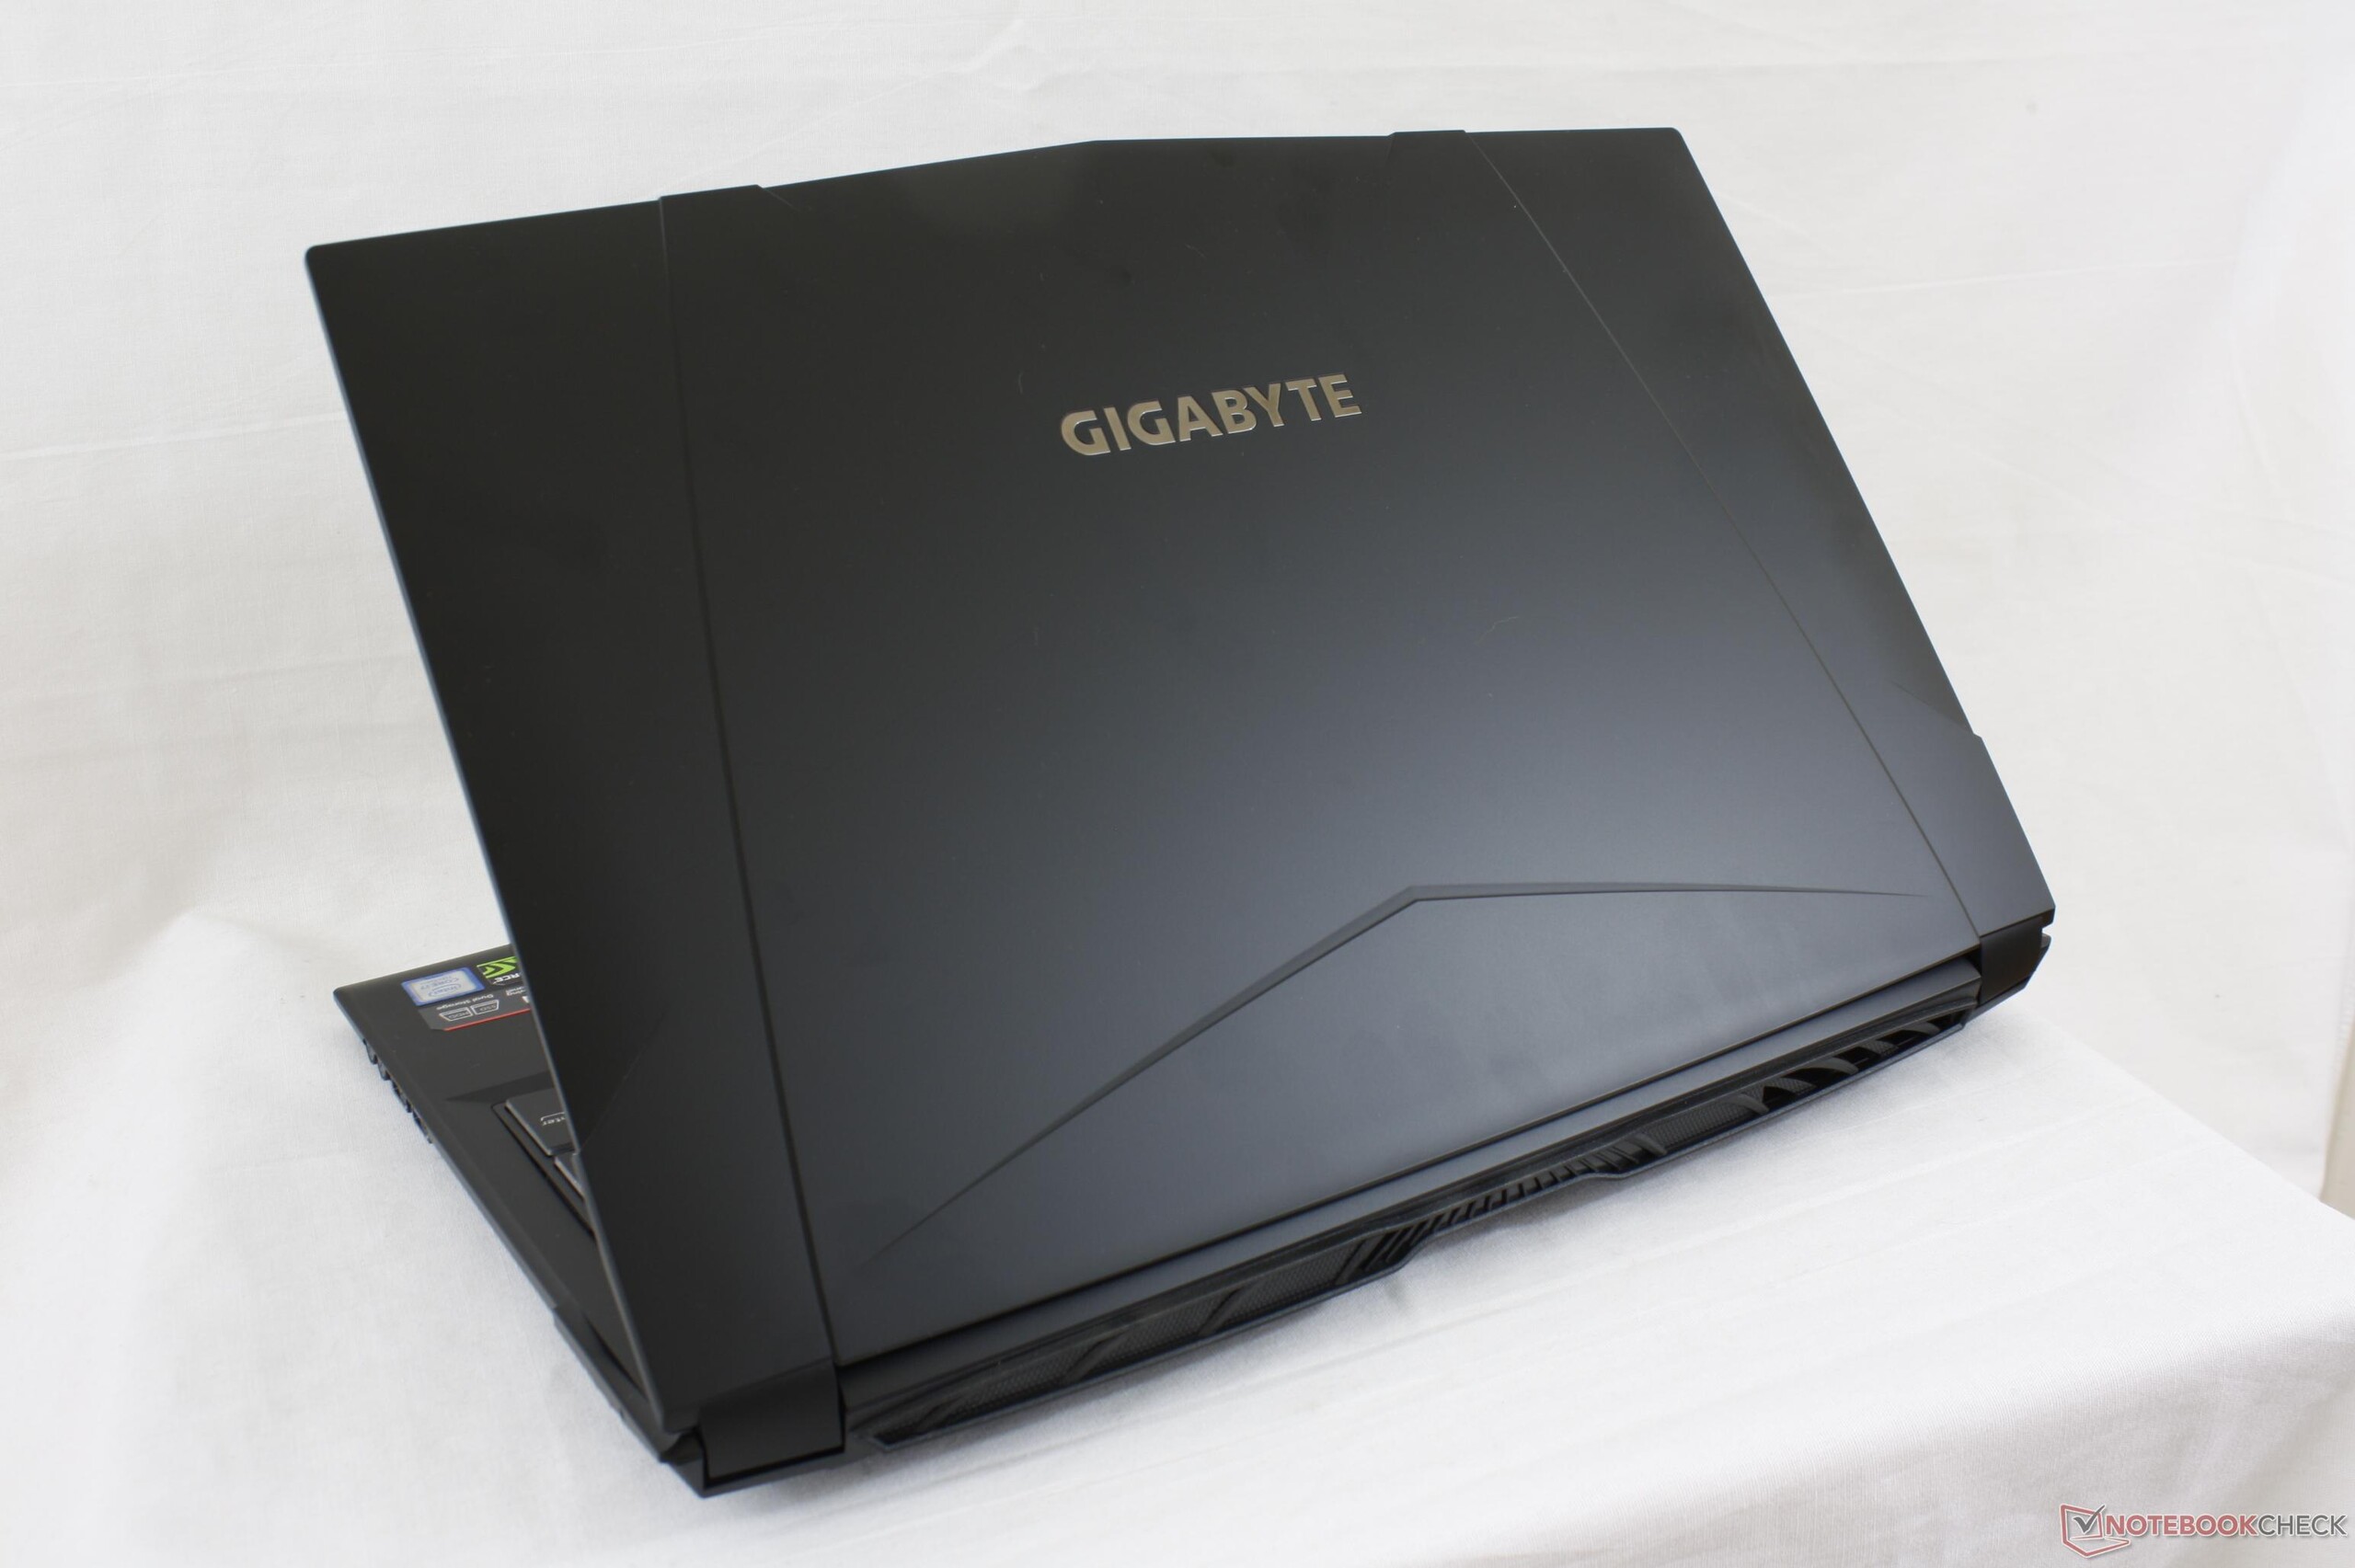
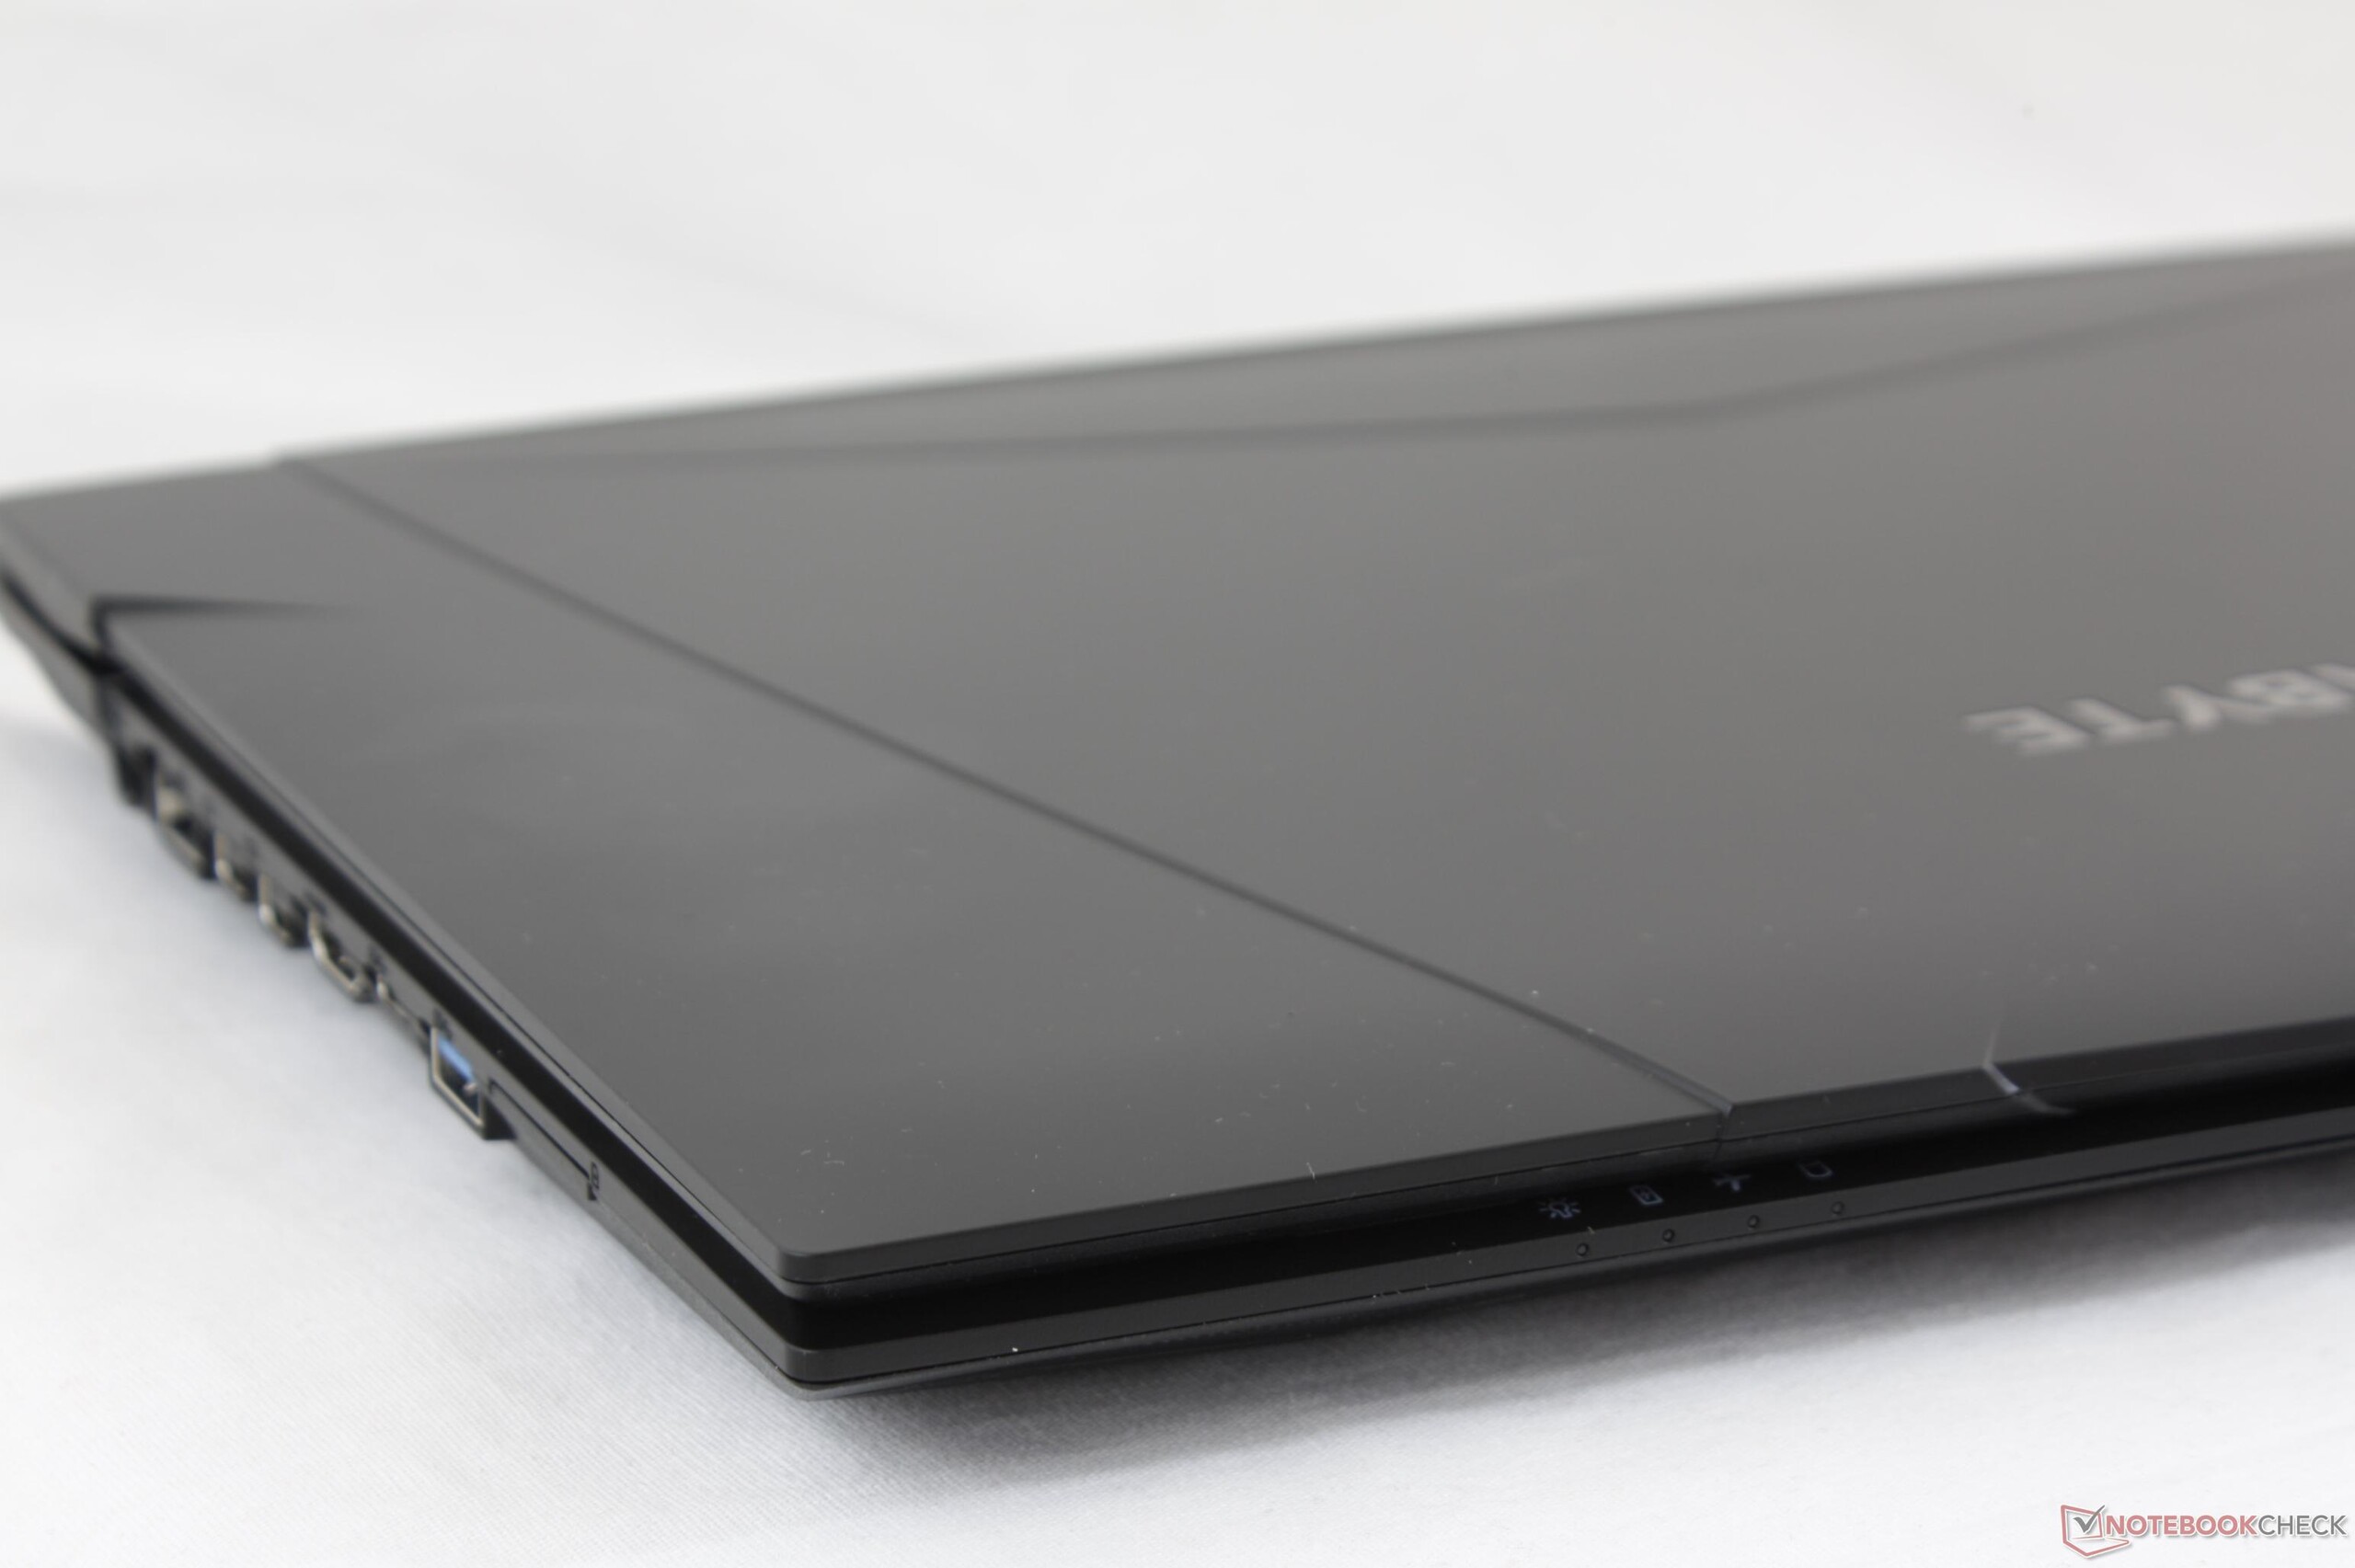
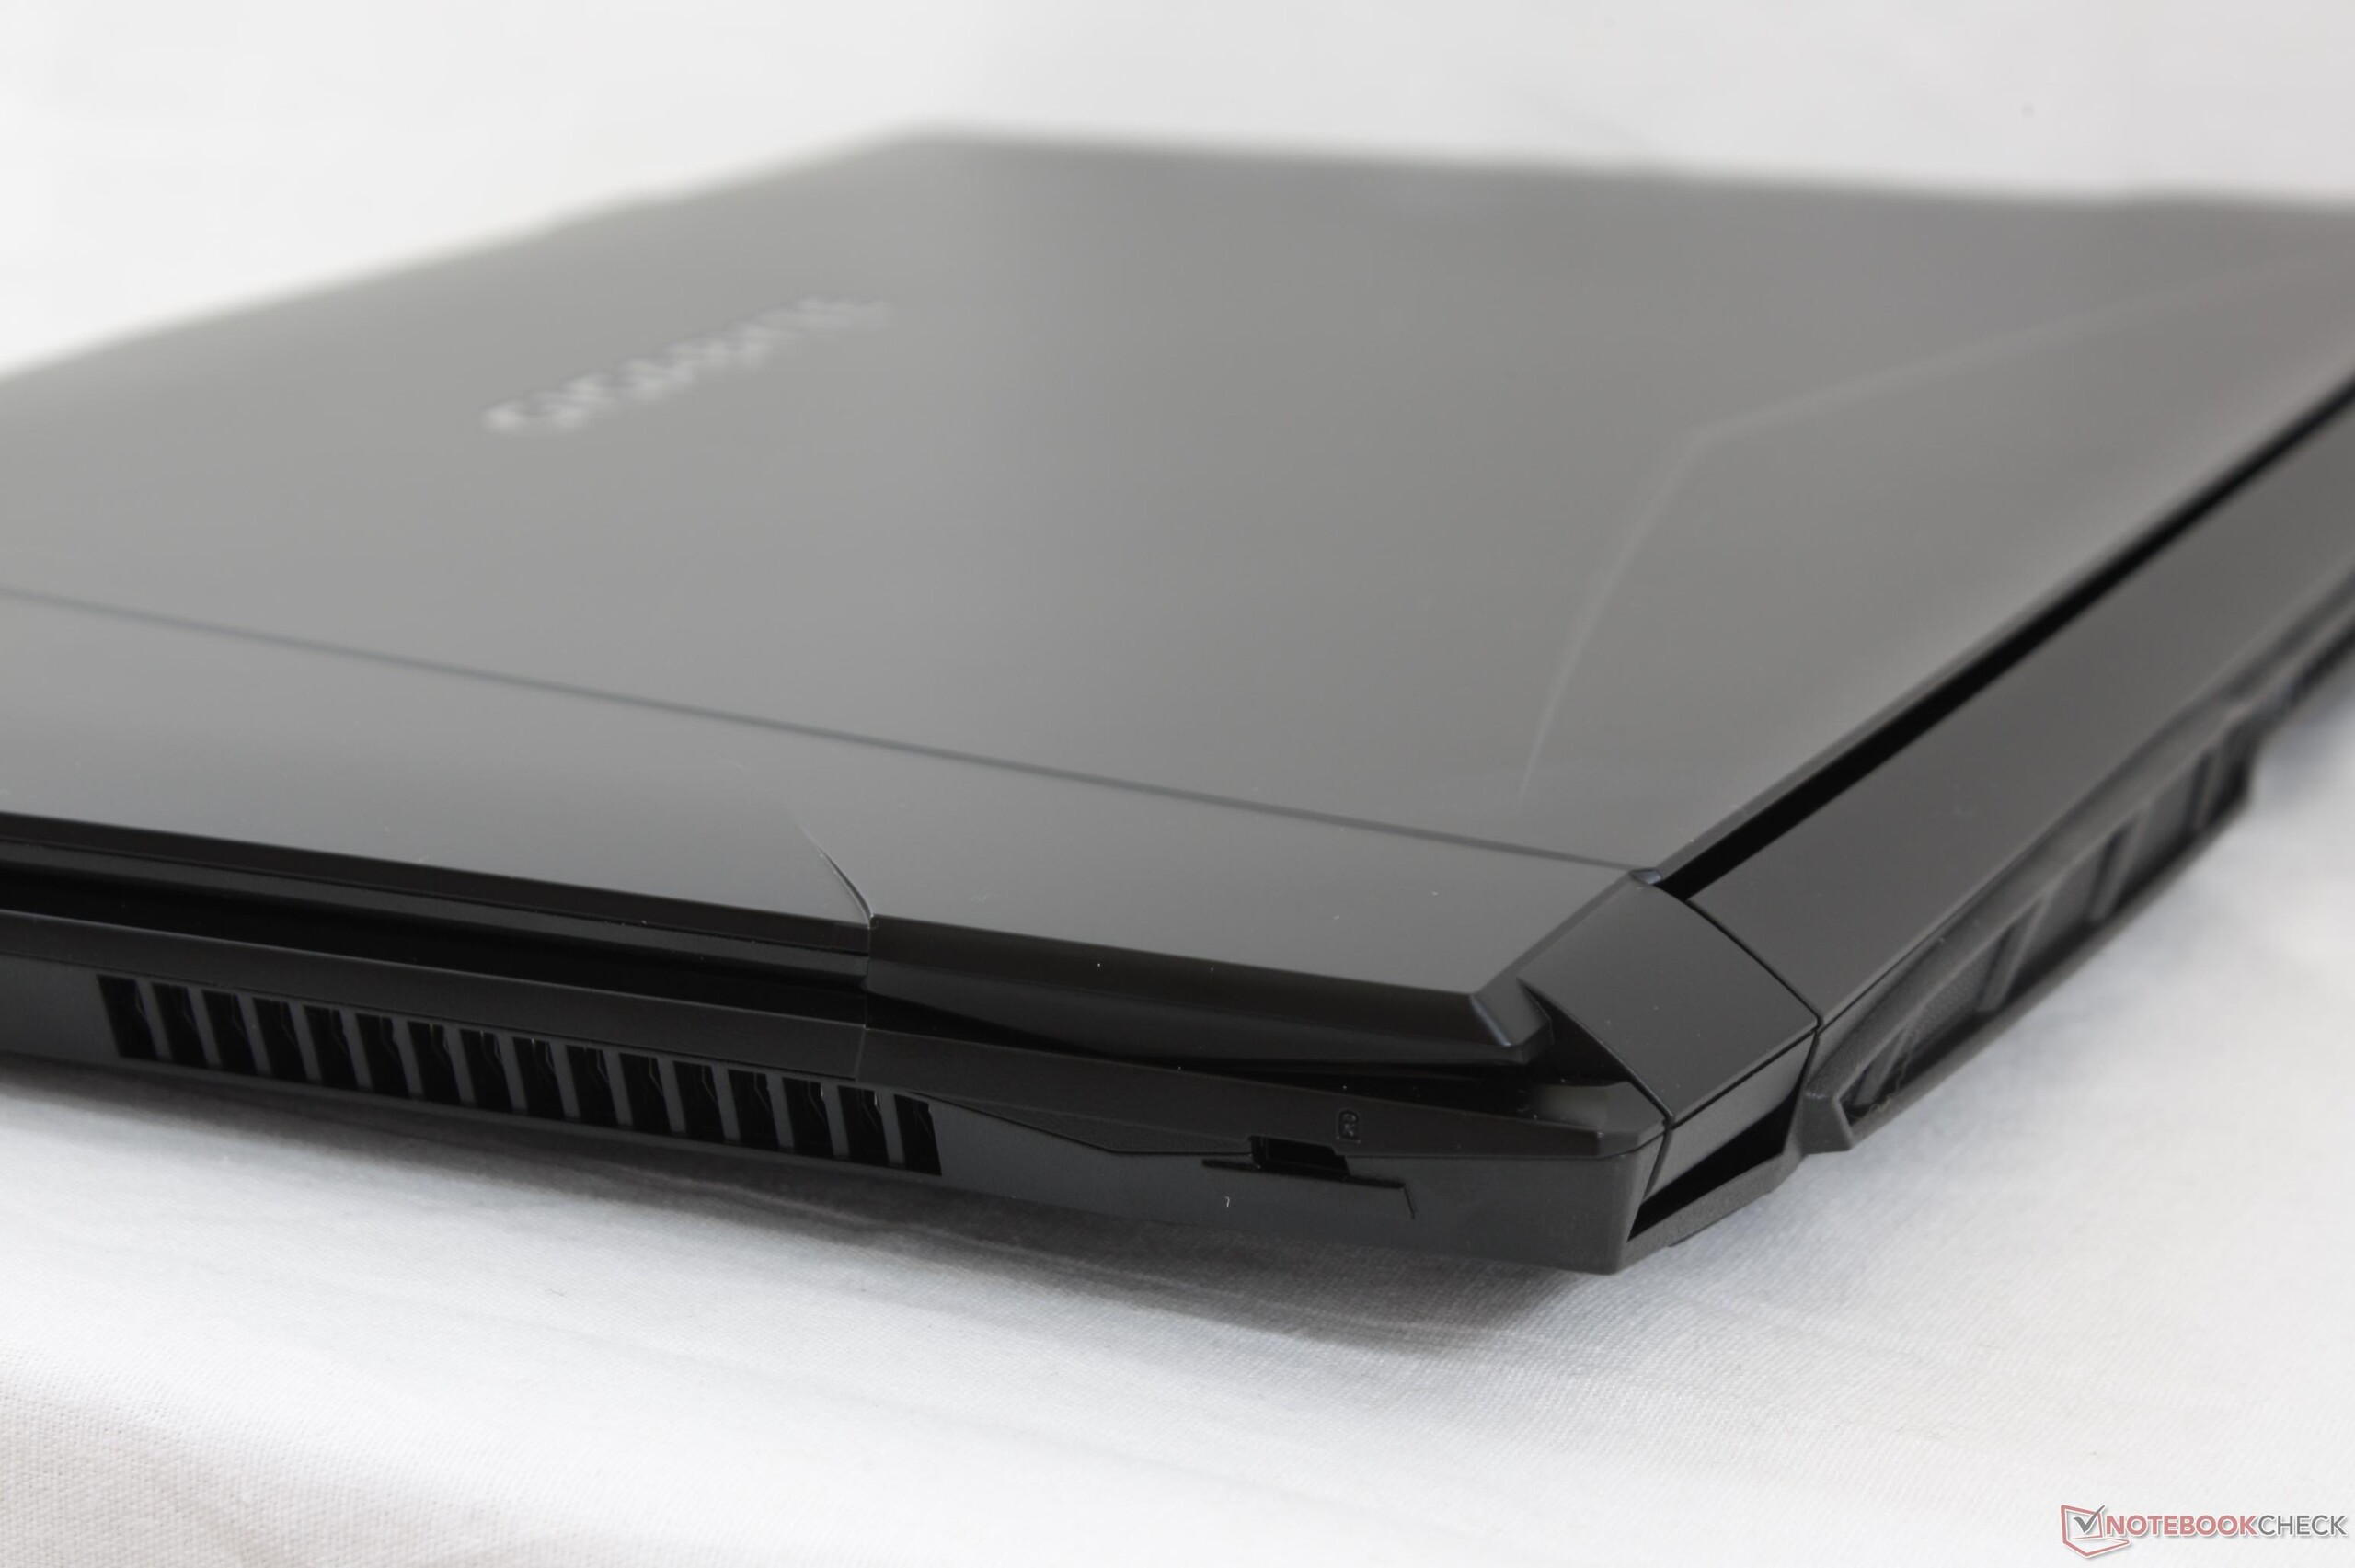
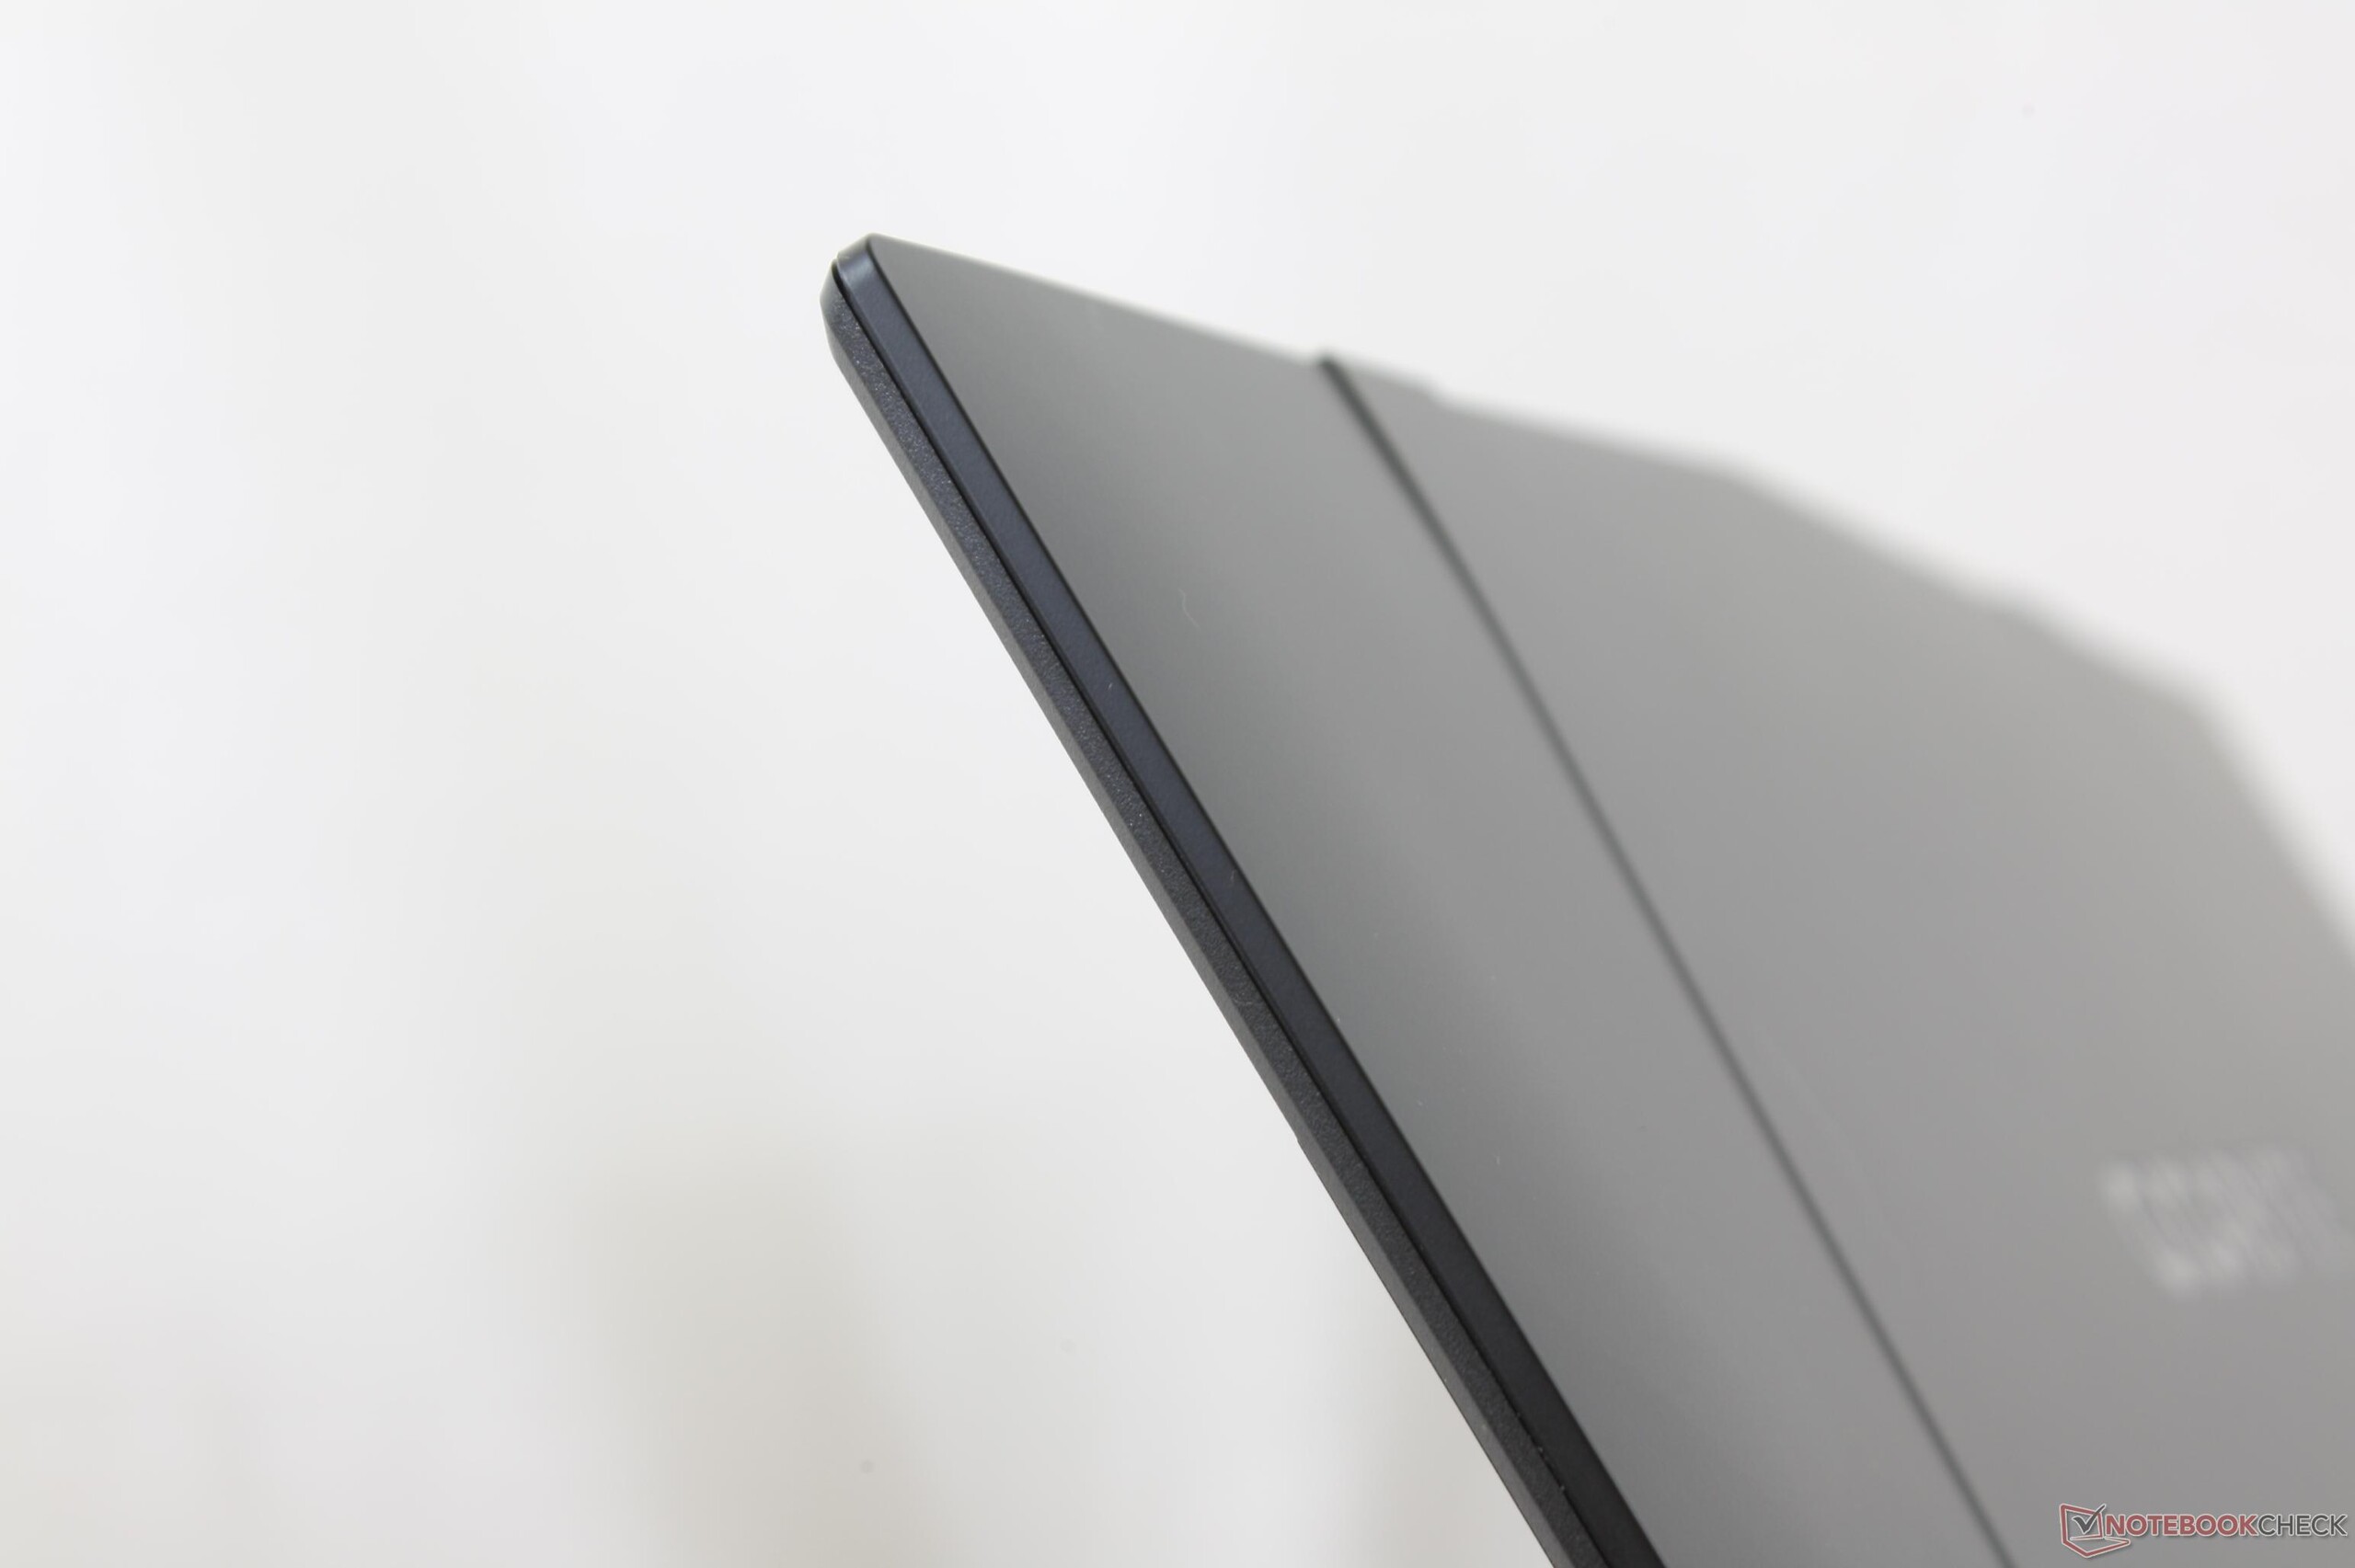
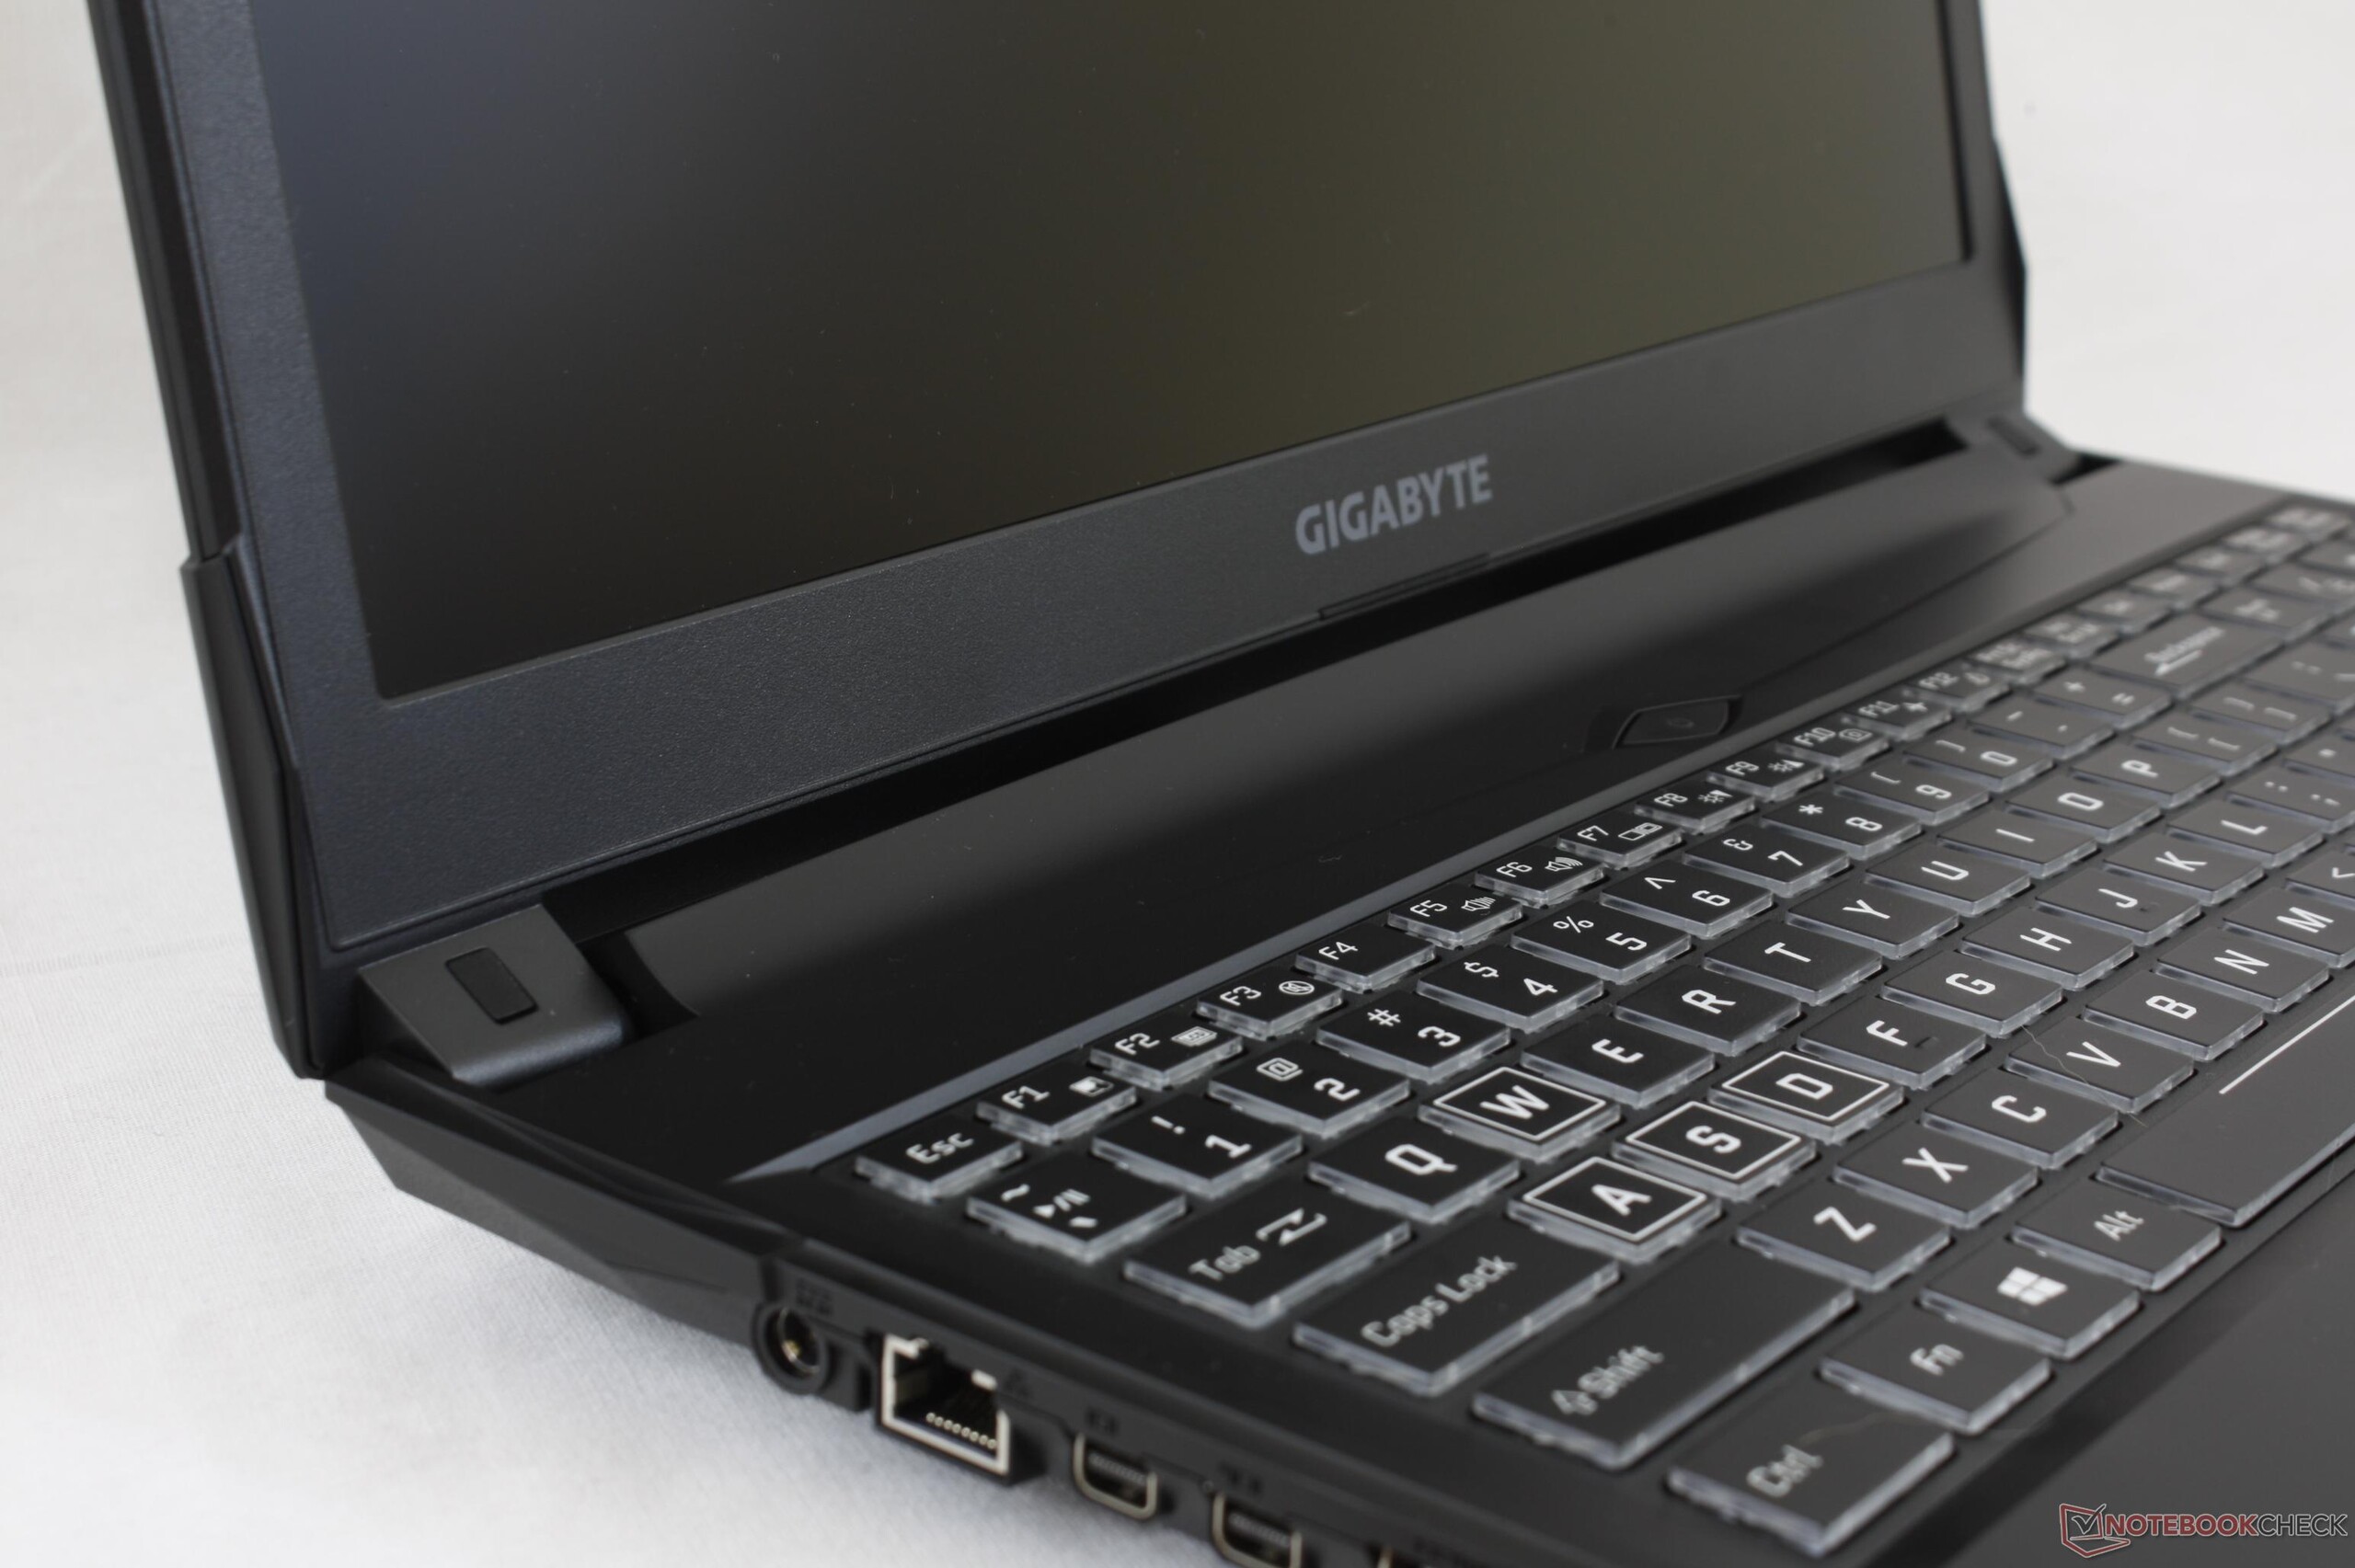
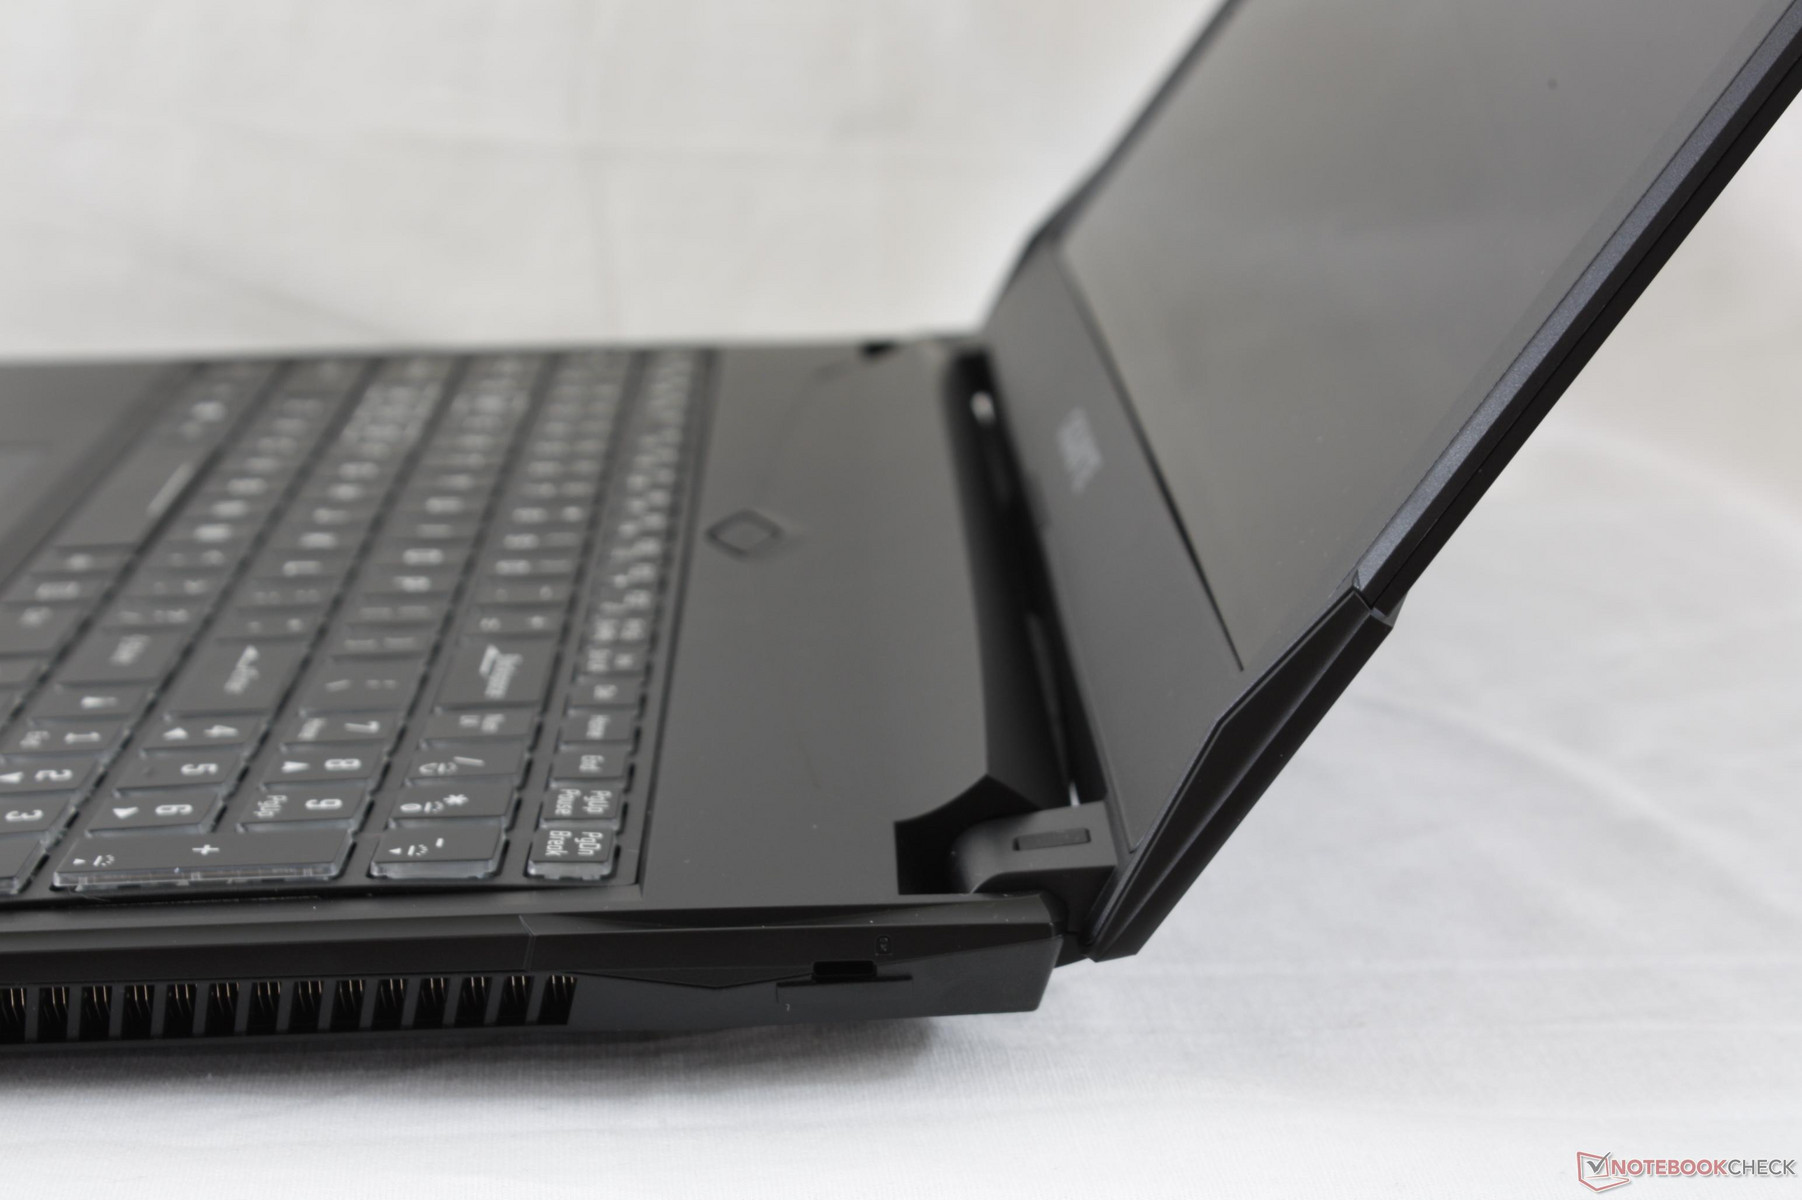
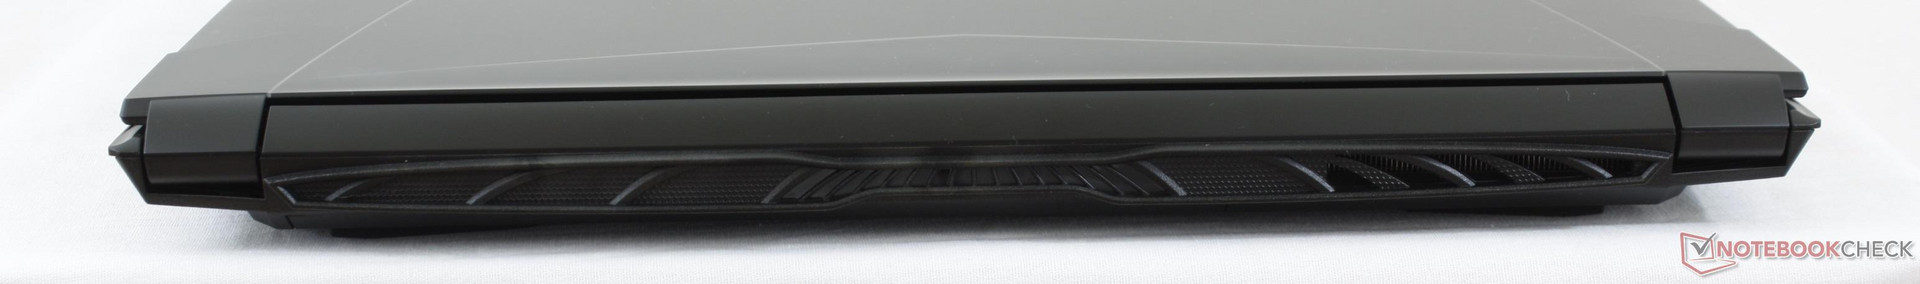
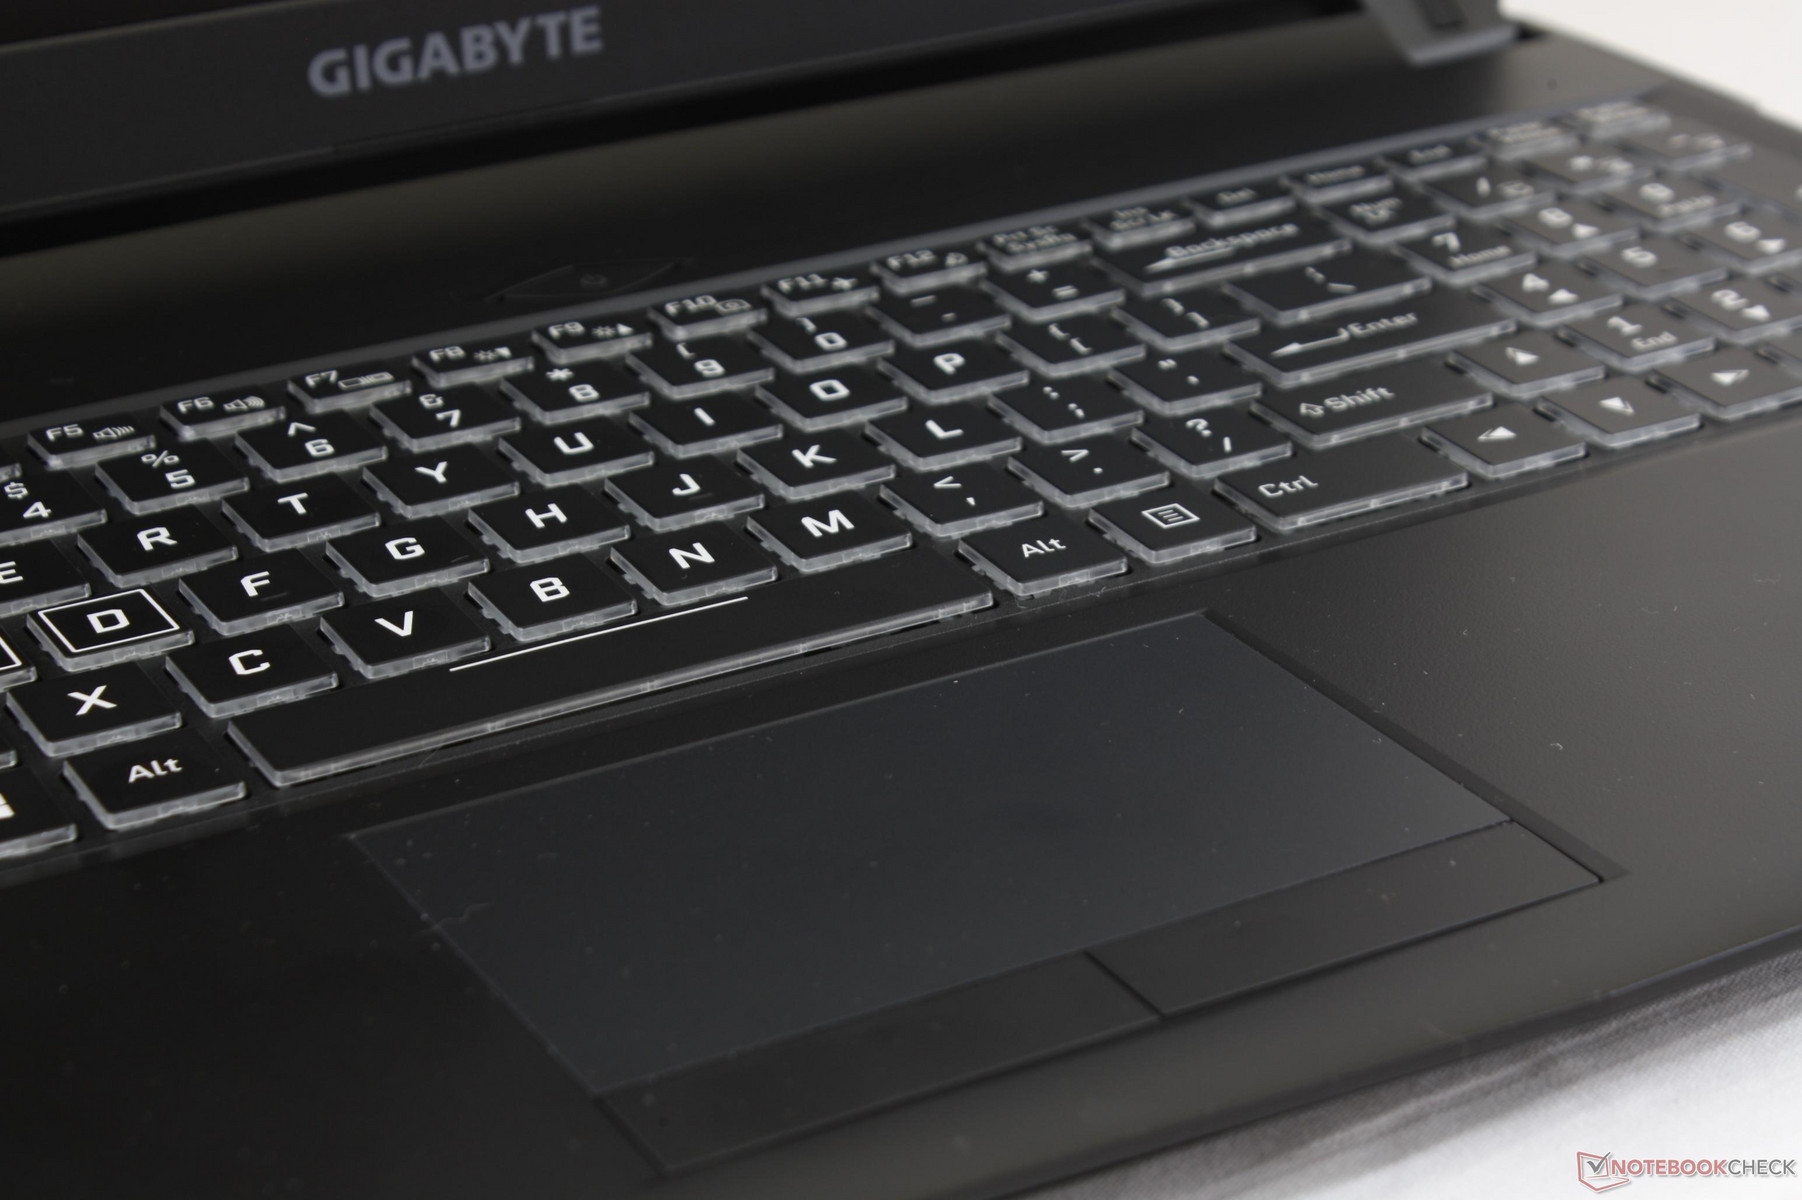
The Sabre series takes a sharper and sleeker design philosophy that could almost pass as an Aorus notebook when compared to the super-thin Gigabyte P37 series. Edges and corners are well defined with accent marks all around the base and outer lid purely for aesthetics. The two rear ventilation grilles mimic the "jet engine" style of larger Asus ROG notebooks, but the symmetry is again largely aesthetic since only the left grilles are functioning as an actual exhaust port. Unlike the pricier Aorus and Aero series, however, the base and lid of the system are matte plastic and not aluminum for a less luxurious feel. Surfaces are slightly roughened and will attract grease and fingerprints very quickly. As the system ages, it's entirely possible that the palm rests and outer lid will become permanently glossy similar to how commonly used keyboard keys can appear greasy after years of use. Nonetheless, the Sabre 15 certainly looks more powerful and dynamic than the Odyssey 15 or Pavilion Power.
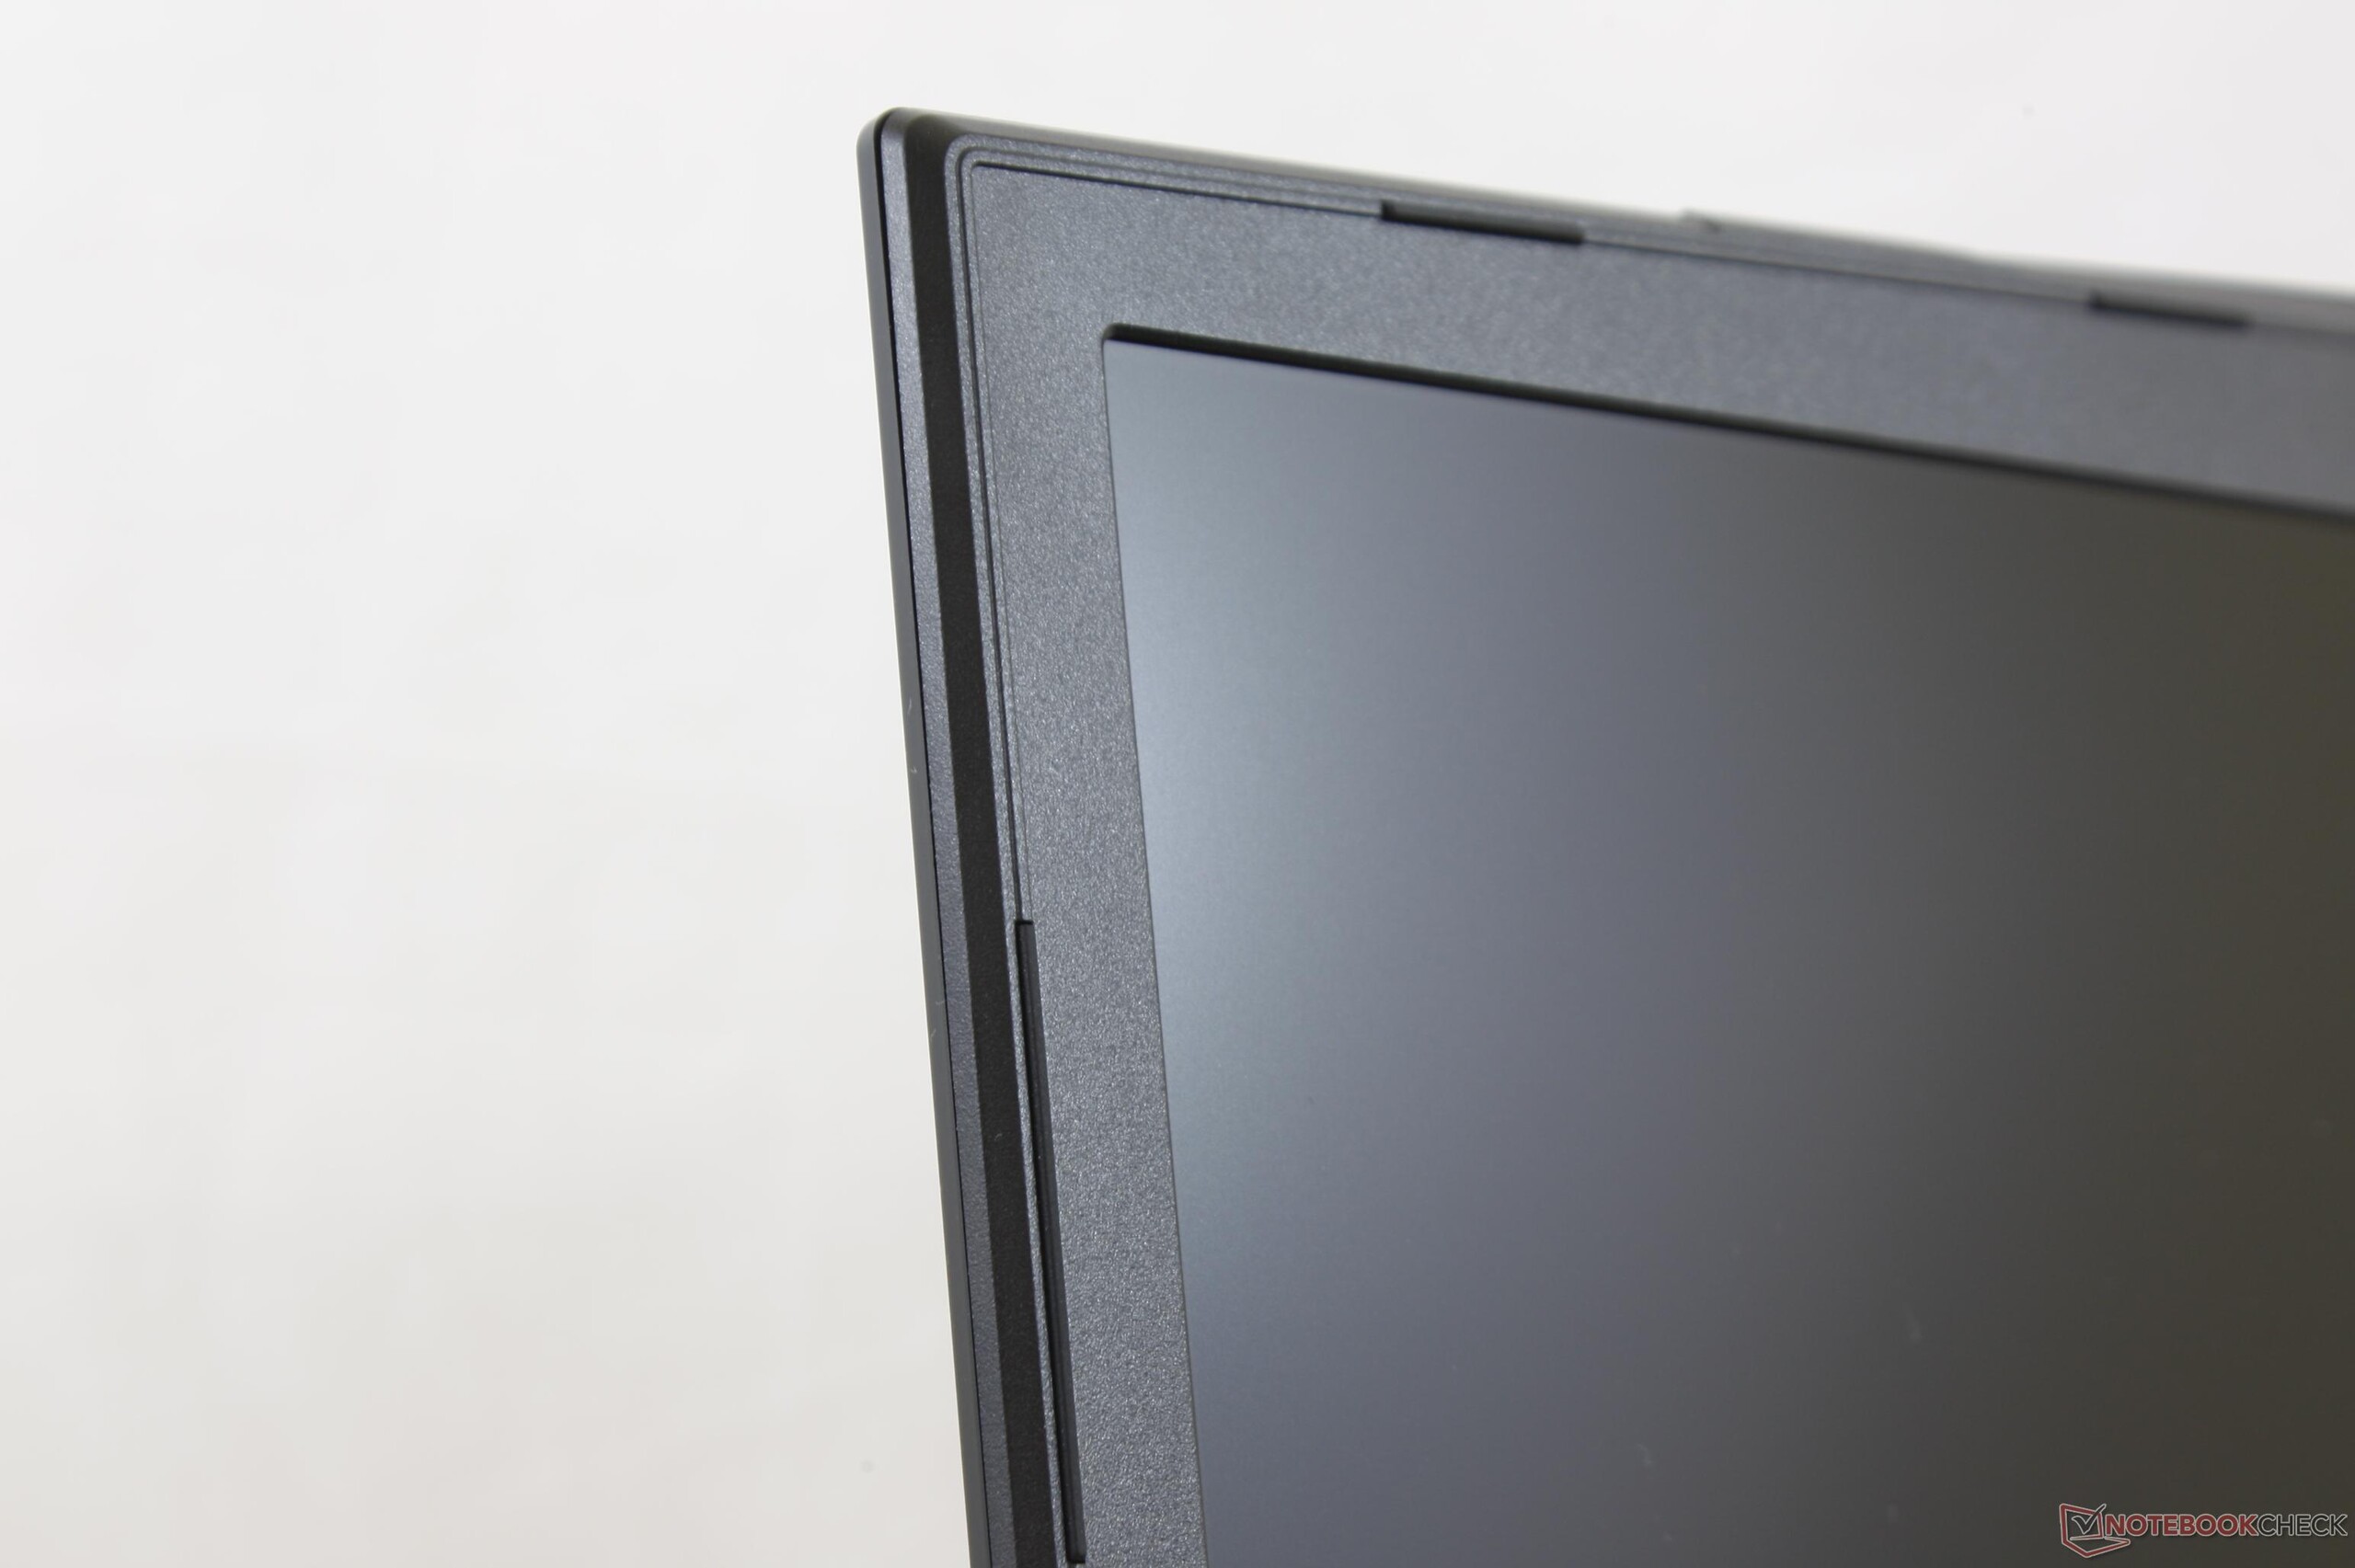
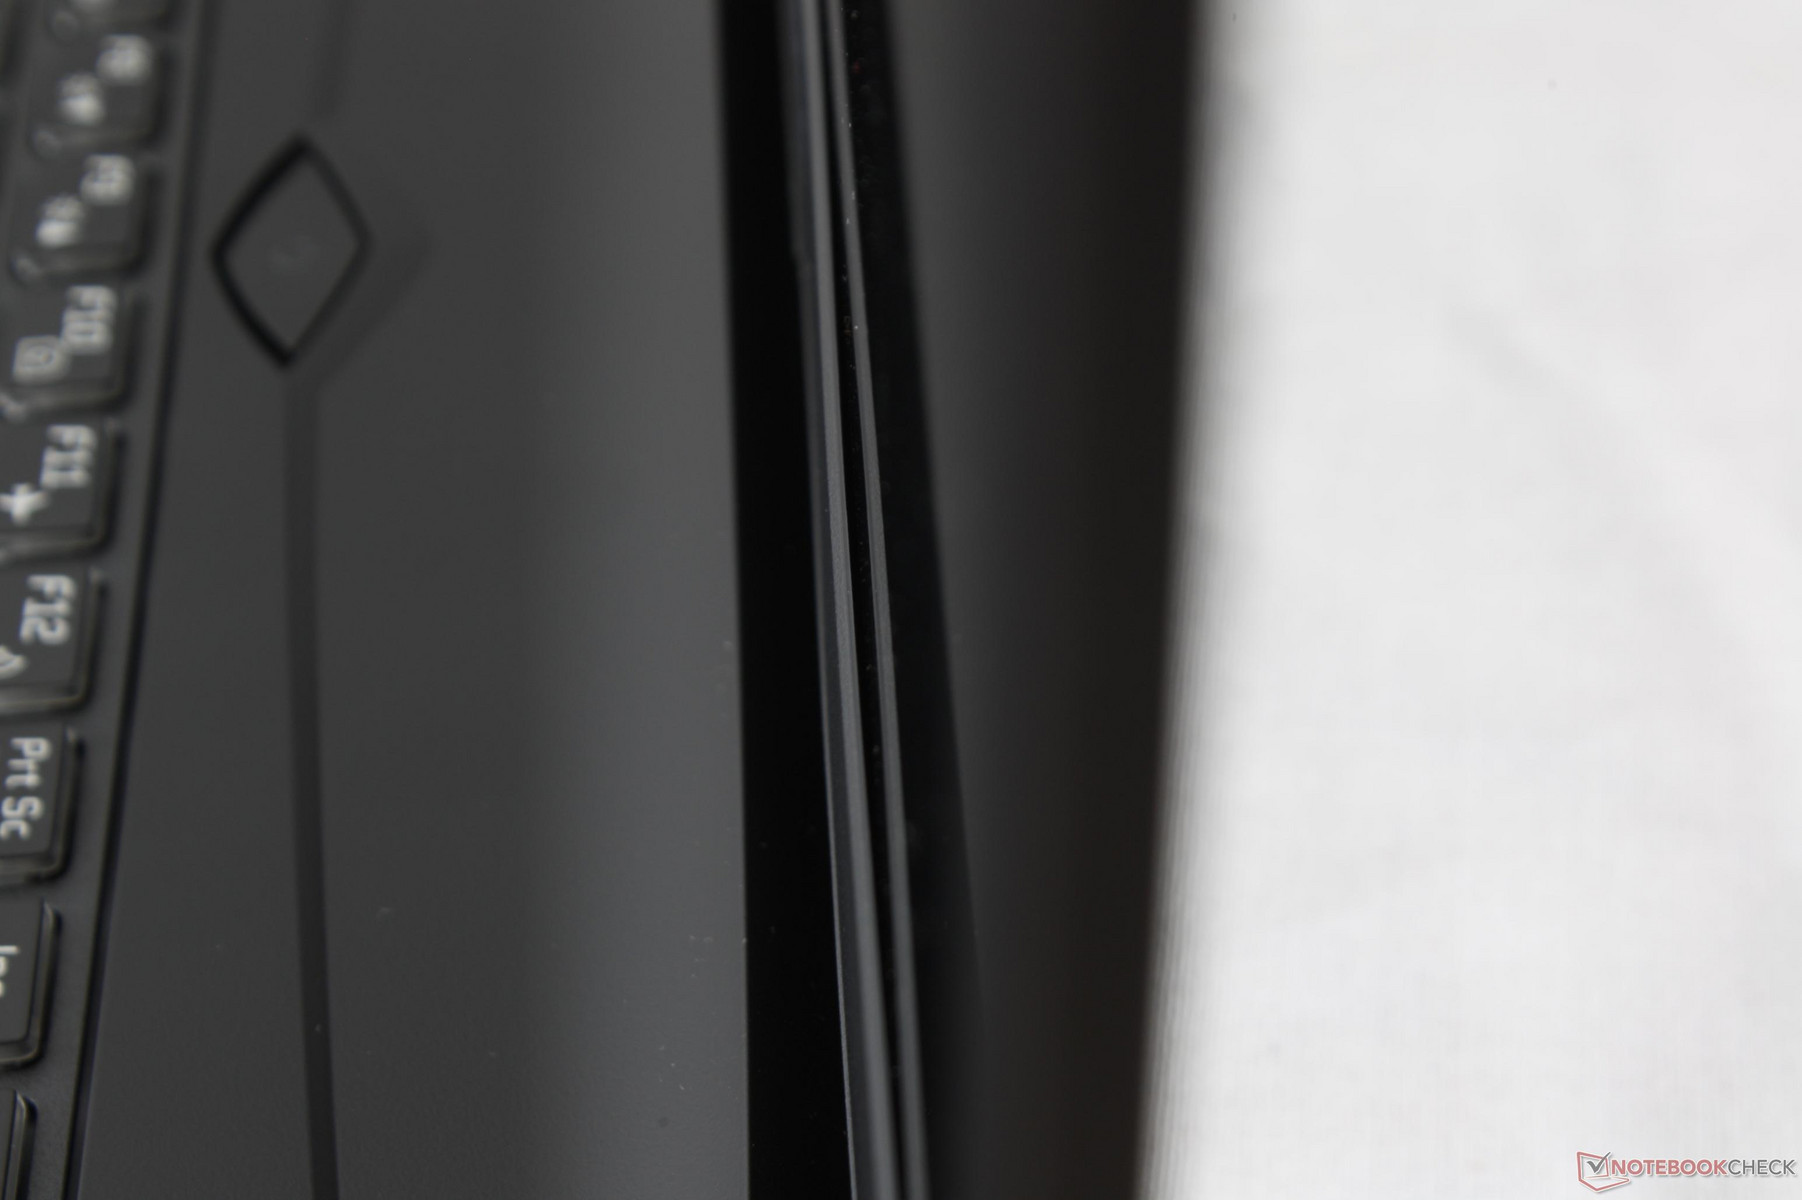
Case quality is excellent around the base with no major warping or depressions when attempting to twist or bend the unit. The palm rests, trackpad, and keyboard center are rigid and exhibit very little creaking. Like a lot of notebook designs, however, the lid is less impressive. In this case, the lid shows just average resistance to twisting and will teeter slightly when typing. Construction quality is not perfect around the inner bezel of our test unit as the plastic is not sitting perfectly flat against the edge of the screen. Our picture below illustrates just how much the plastic bezel is protruding unevenly around the bottom edge.
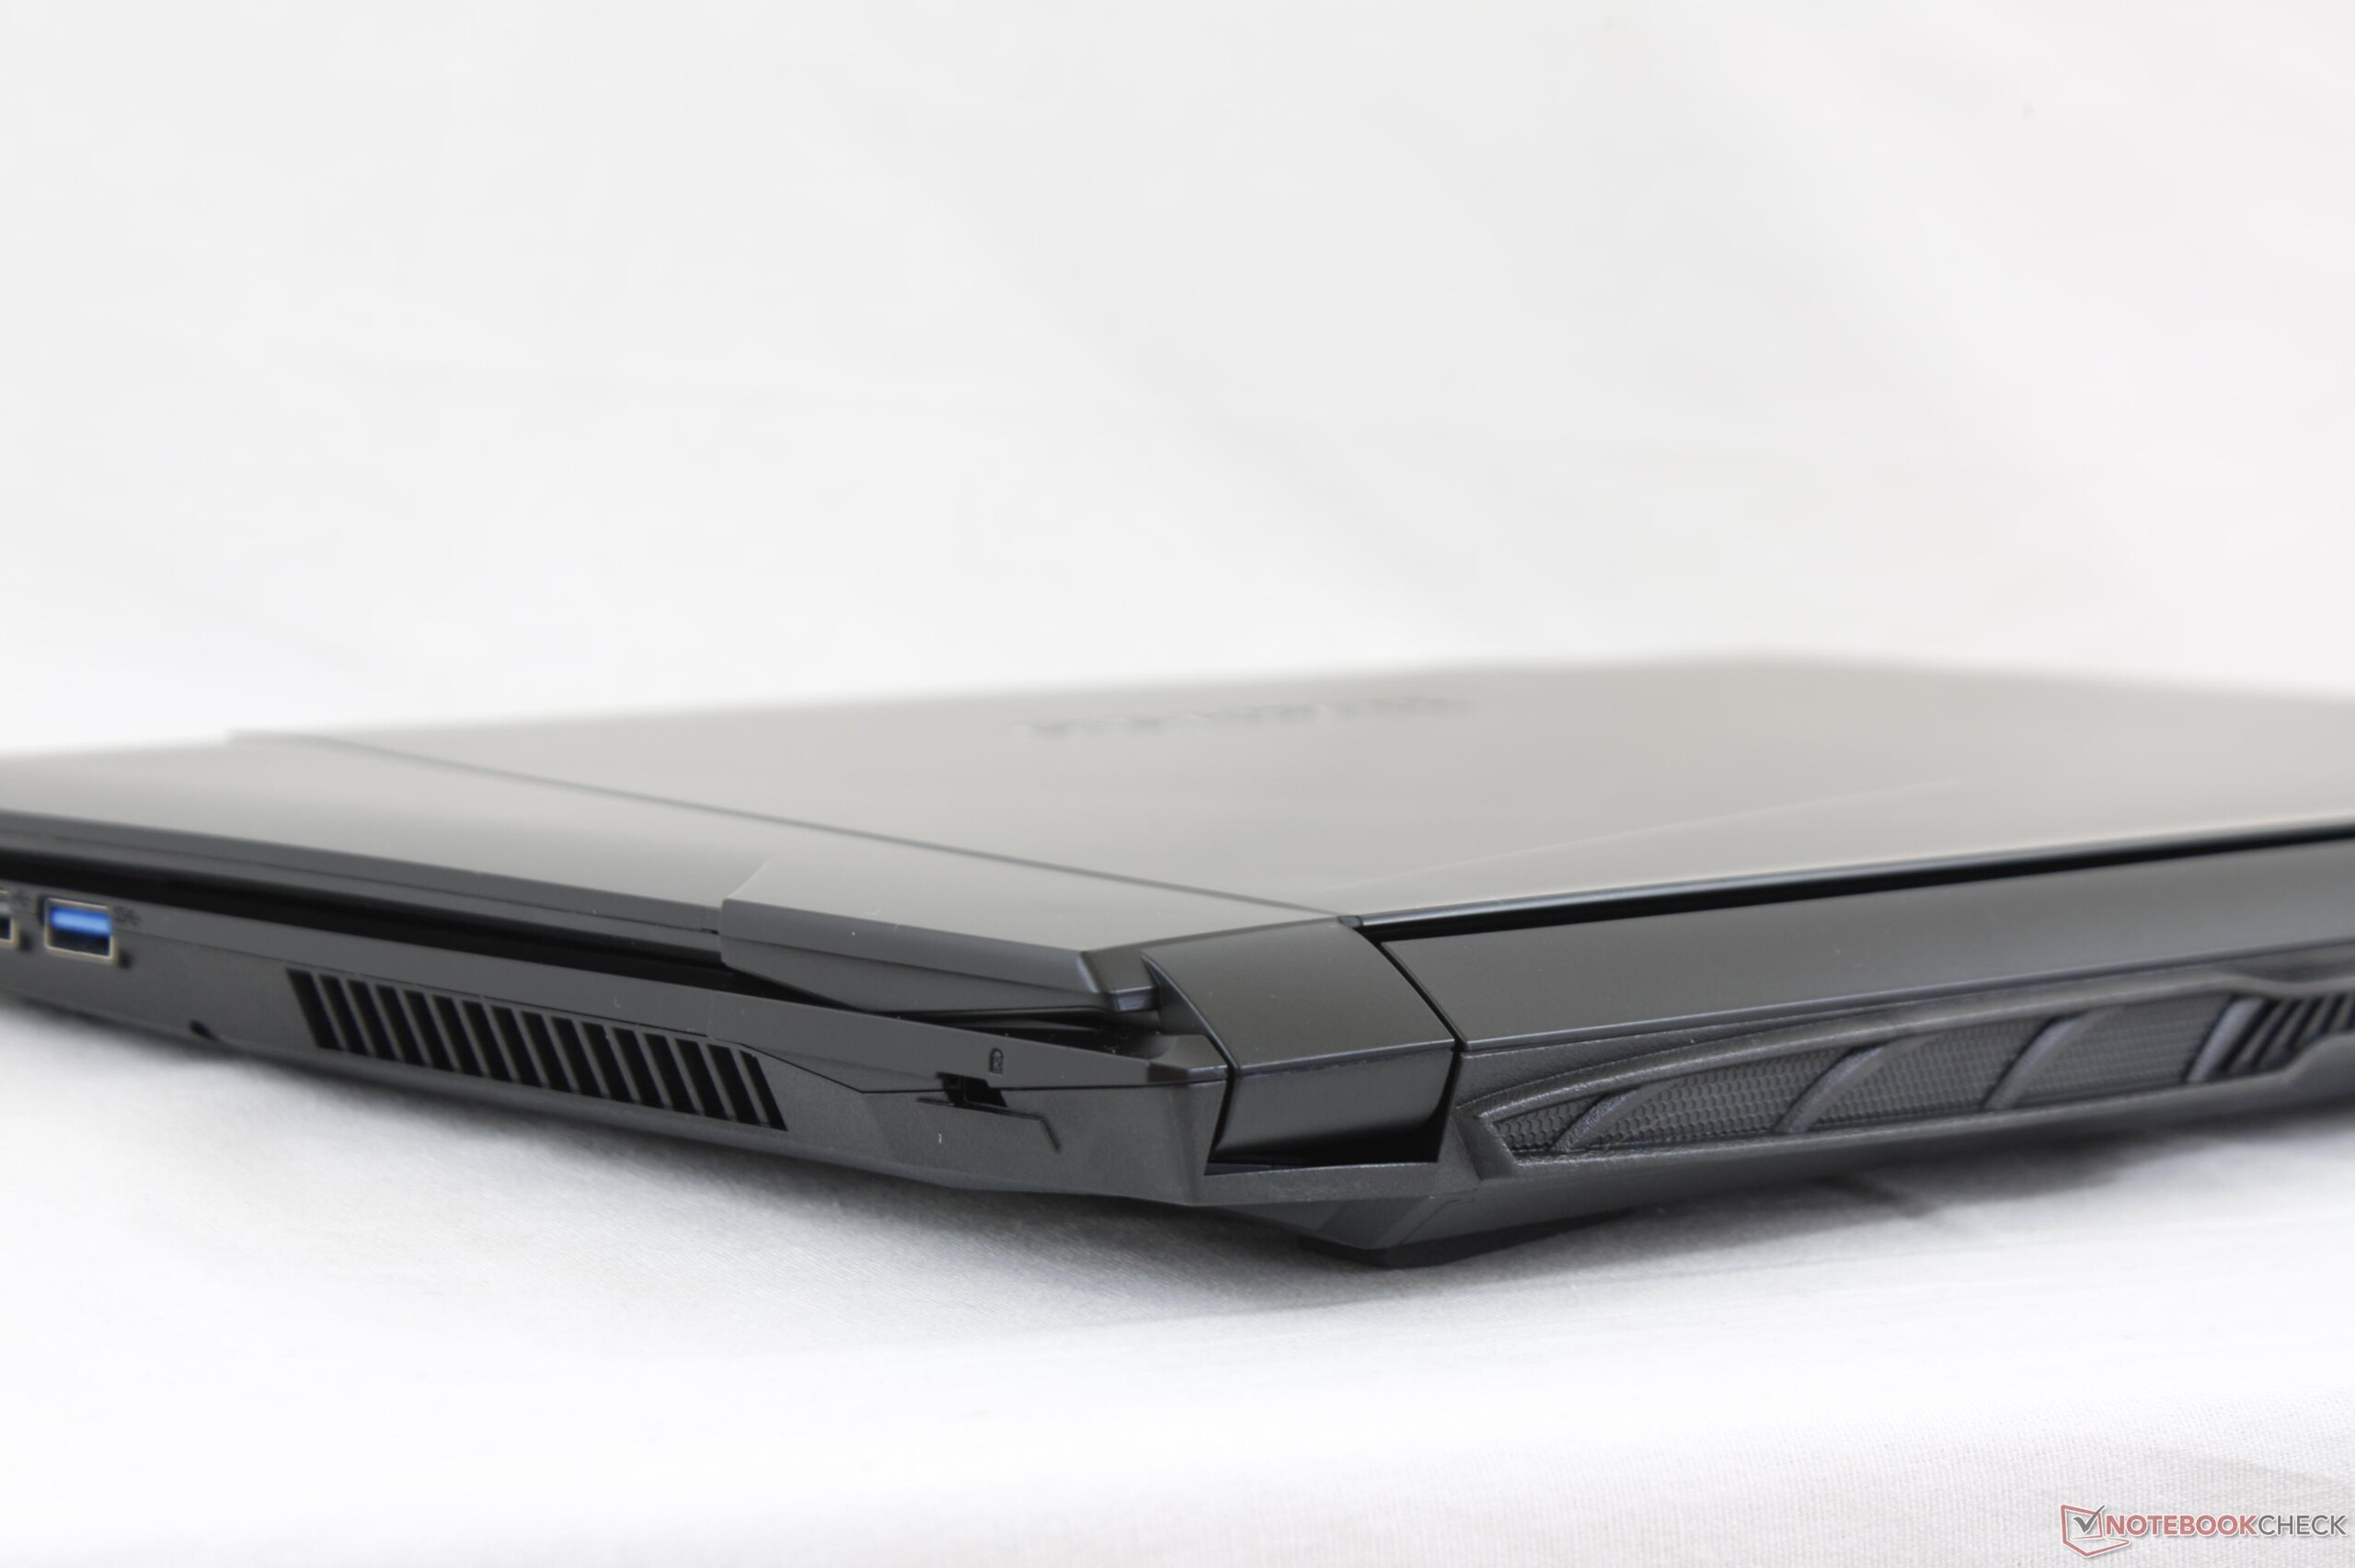
In terms of size and weight, the Sabre 15 is nearly identical to the Omen 15 and Odyssey 15. The system sits comfortably between thicker and heavier 15-inch gaming notebooks like the GT62VR and Predator 15 and the much smaller alternatives like the XPS 15 and Aero 15 since the Sabre design is not utilizing narrow bezels. As a result, portability is merely average.
Connectivity
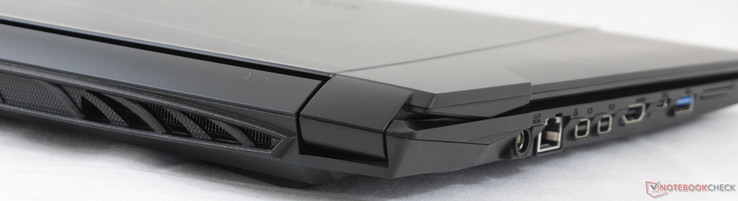
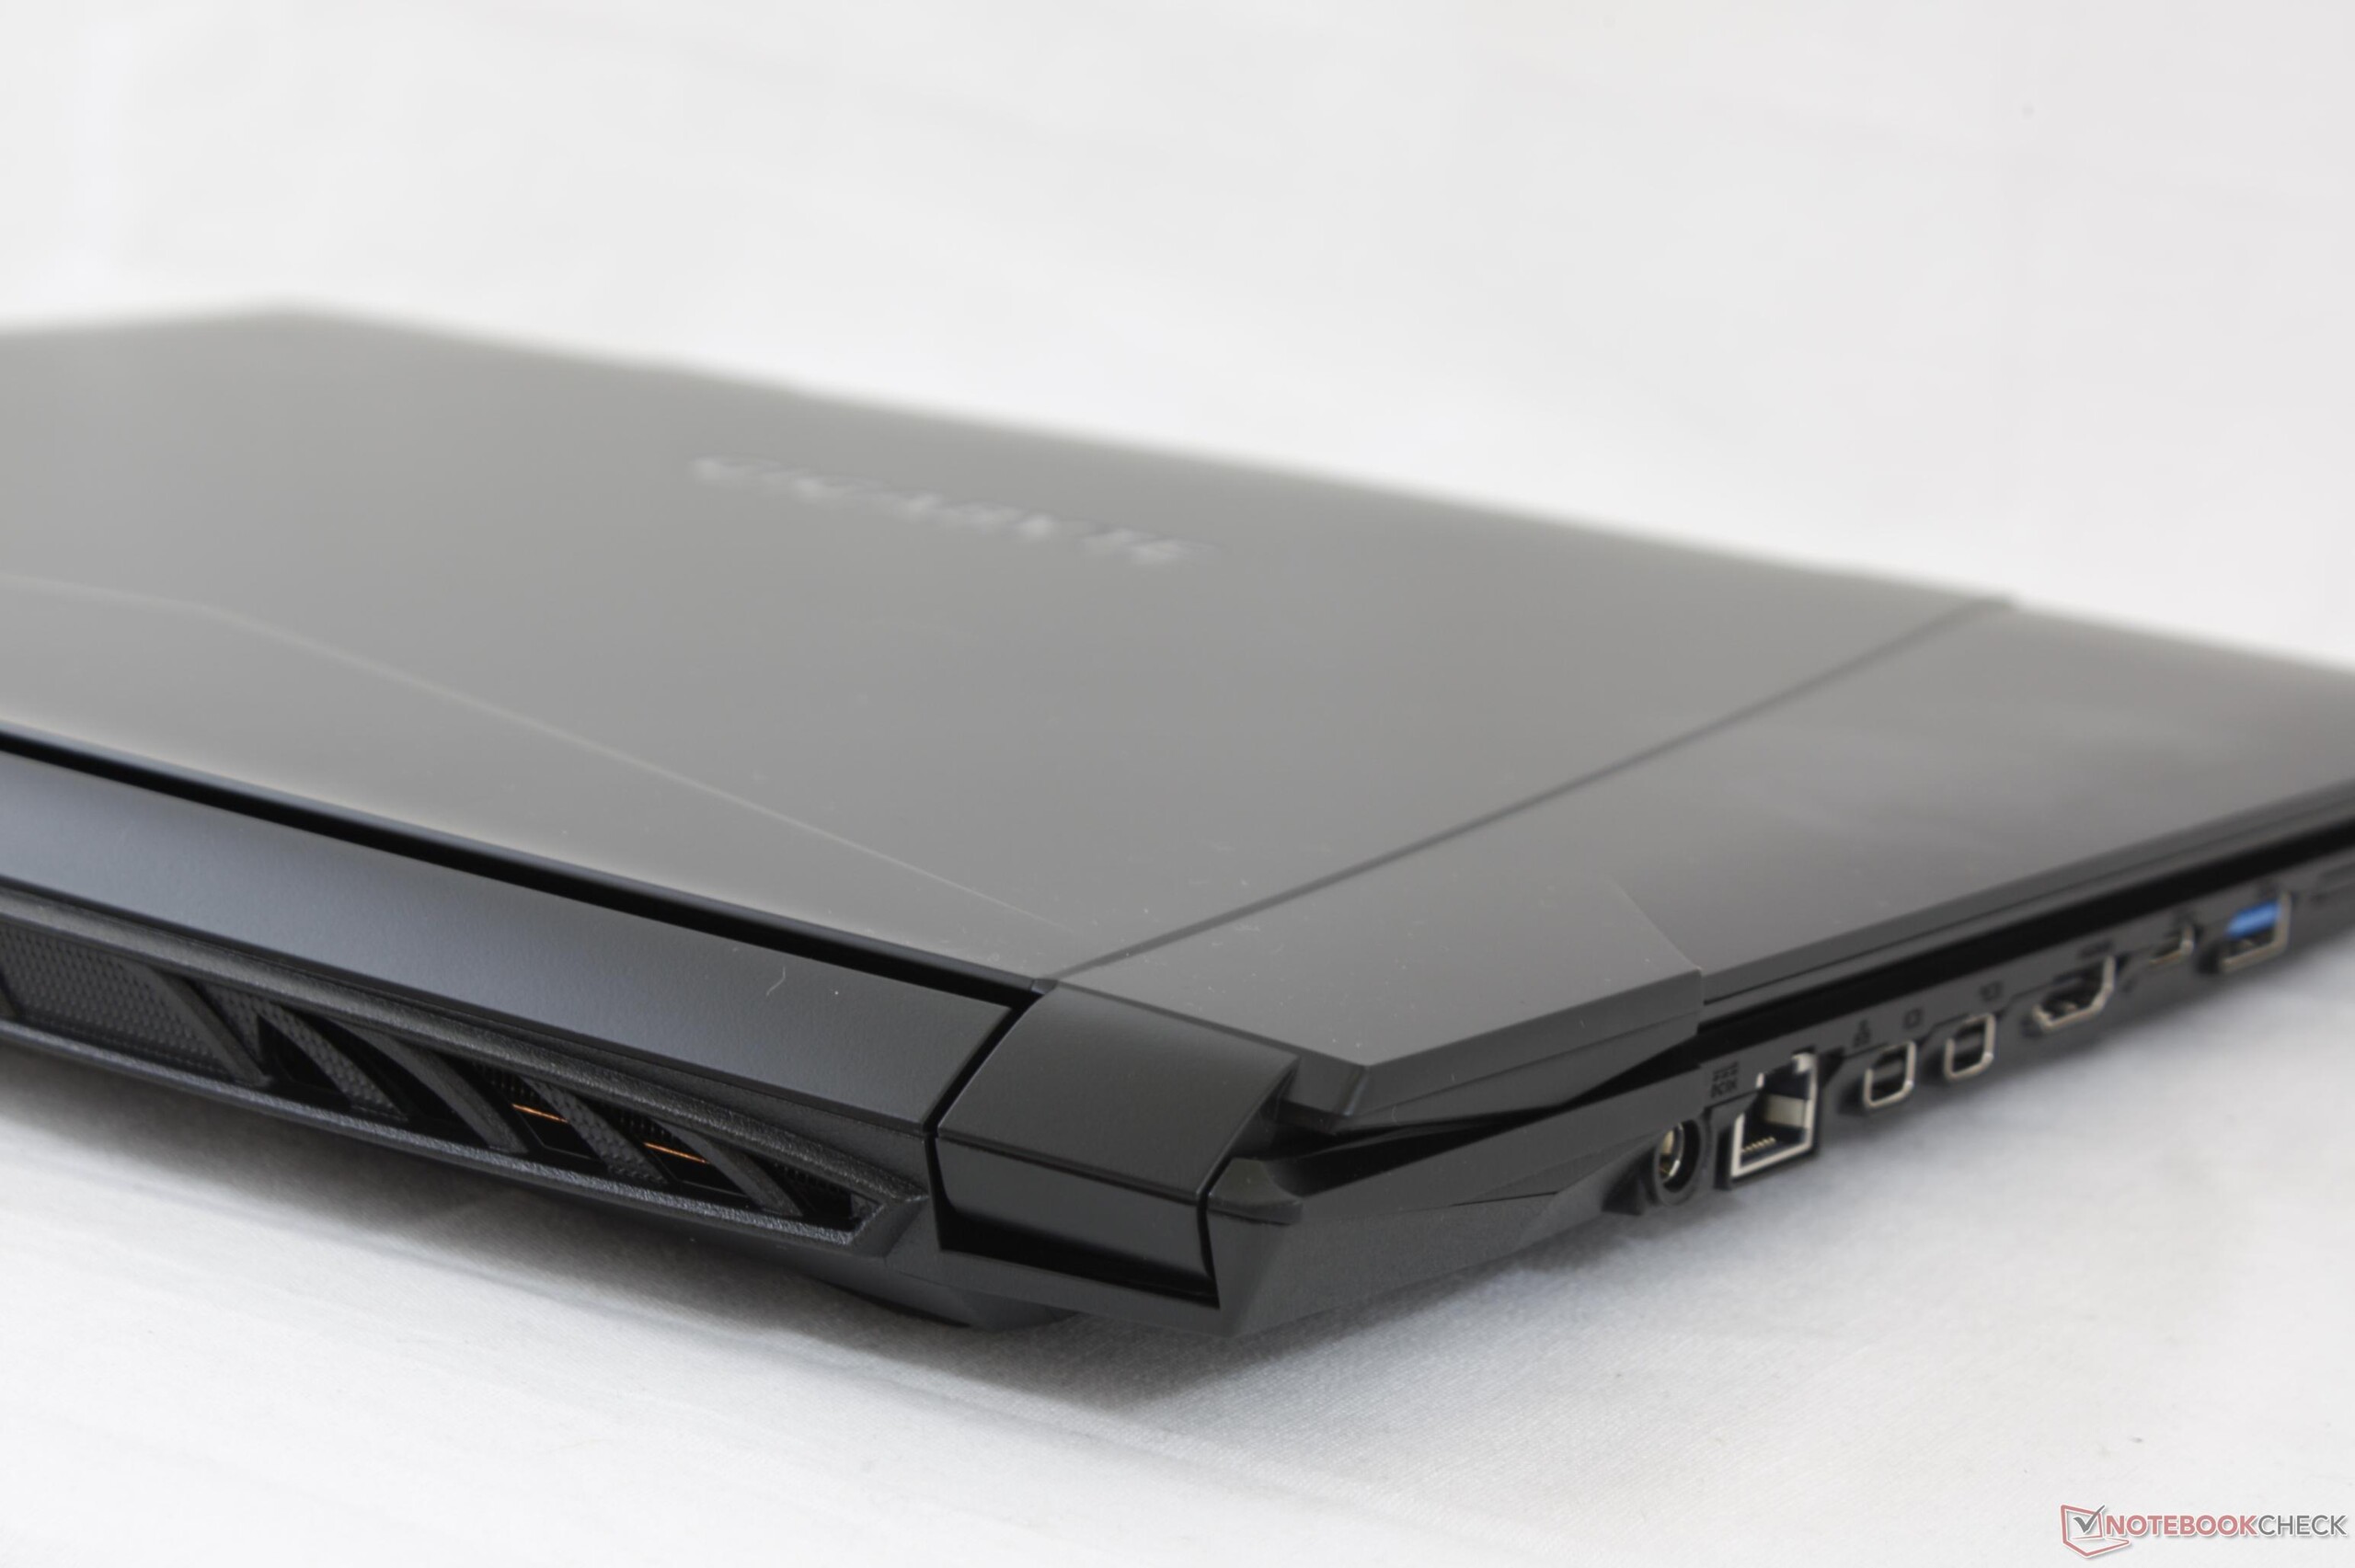
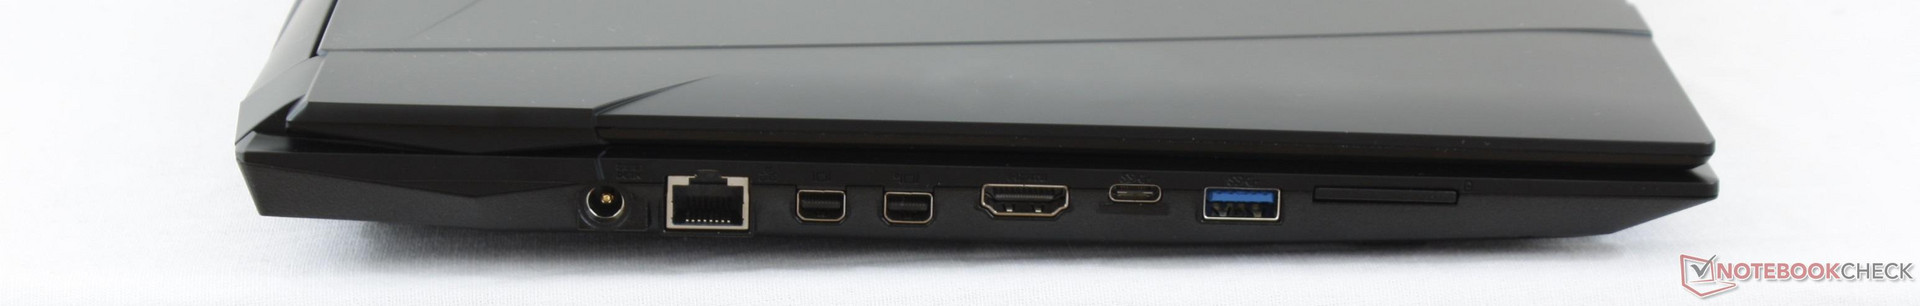
Available ports are plentiful including 3x video-out ports to support up to three external monitors simultaneously. The dual mDP ports are not identical in version and the HDMI port is limited to 4K at 30 FPS, so users who want 4K60 playback must use the mDP 1.3 port.
Port placement is a mixed bag as the ports are easy to reach at the cost of being very close to the front edge. Cables on either side of the notebook can easily entangle and occupy valuable desk space.
July 30, 2017 update: The Sabre 15 is equipped with USB Type-C Gen. 2 for 10 Gbps transfer rates and not Gen. 1 as previously stated. Thanks to Gigabyte for the correction!

Software
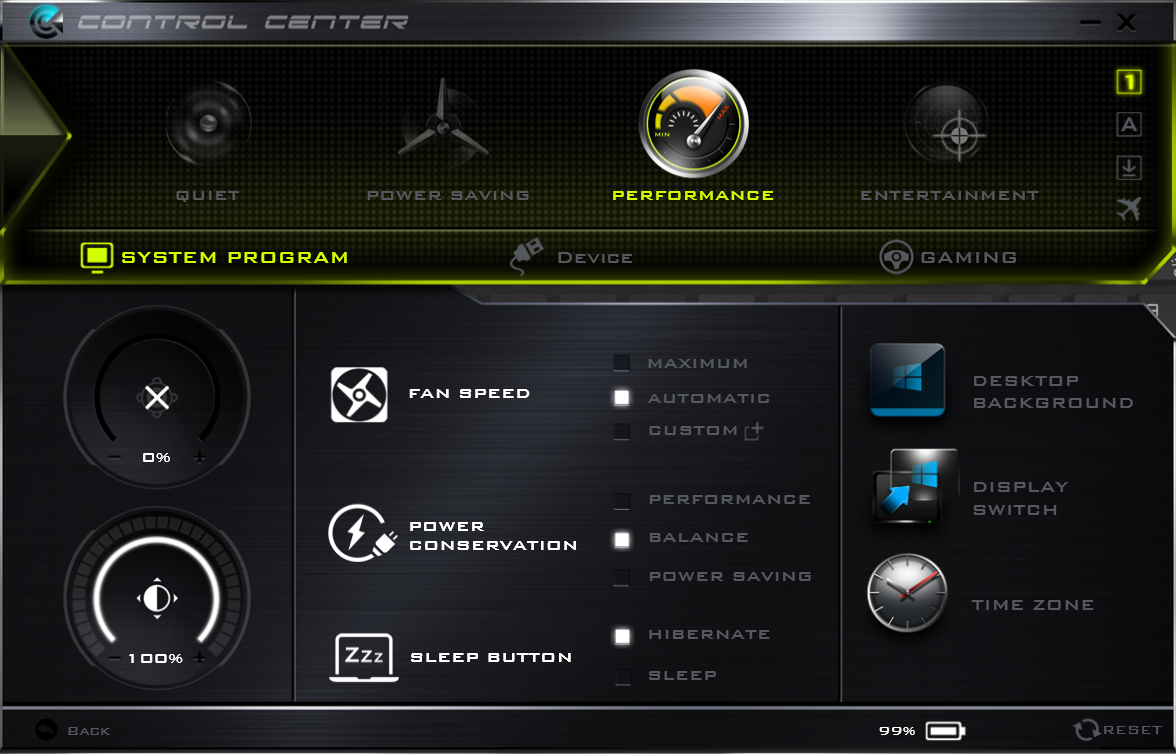
Pre-installed software include Control Center and FlexiKey that can also be found on most newer Clevo notebooks. It's interesting to see Gigabyte go this route as the Aorus and P series have traditionally been using Gigabyte's own in-house system monitor software instead. The software here is relatively barebones compared to the MSI or Alienware alternatives as there is no UI for monitoring real-time fan RPMs, core temperatures, clock rates, and other vitals that gamers are typically interested in.
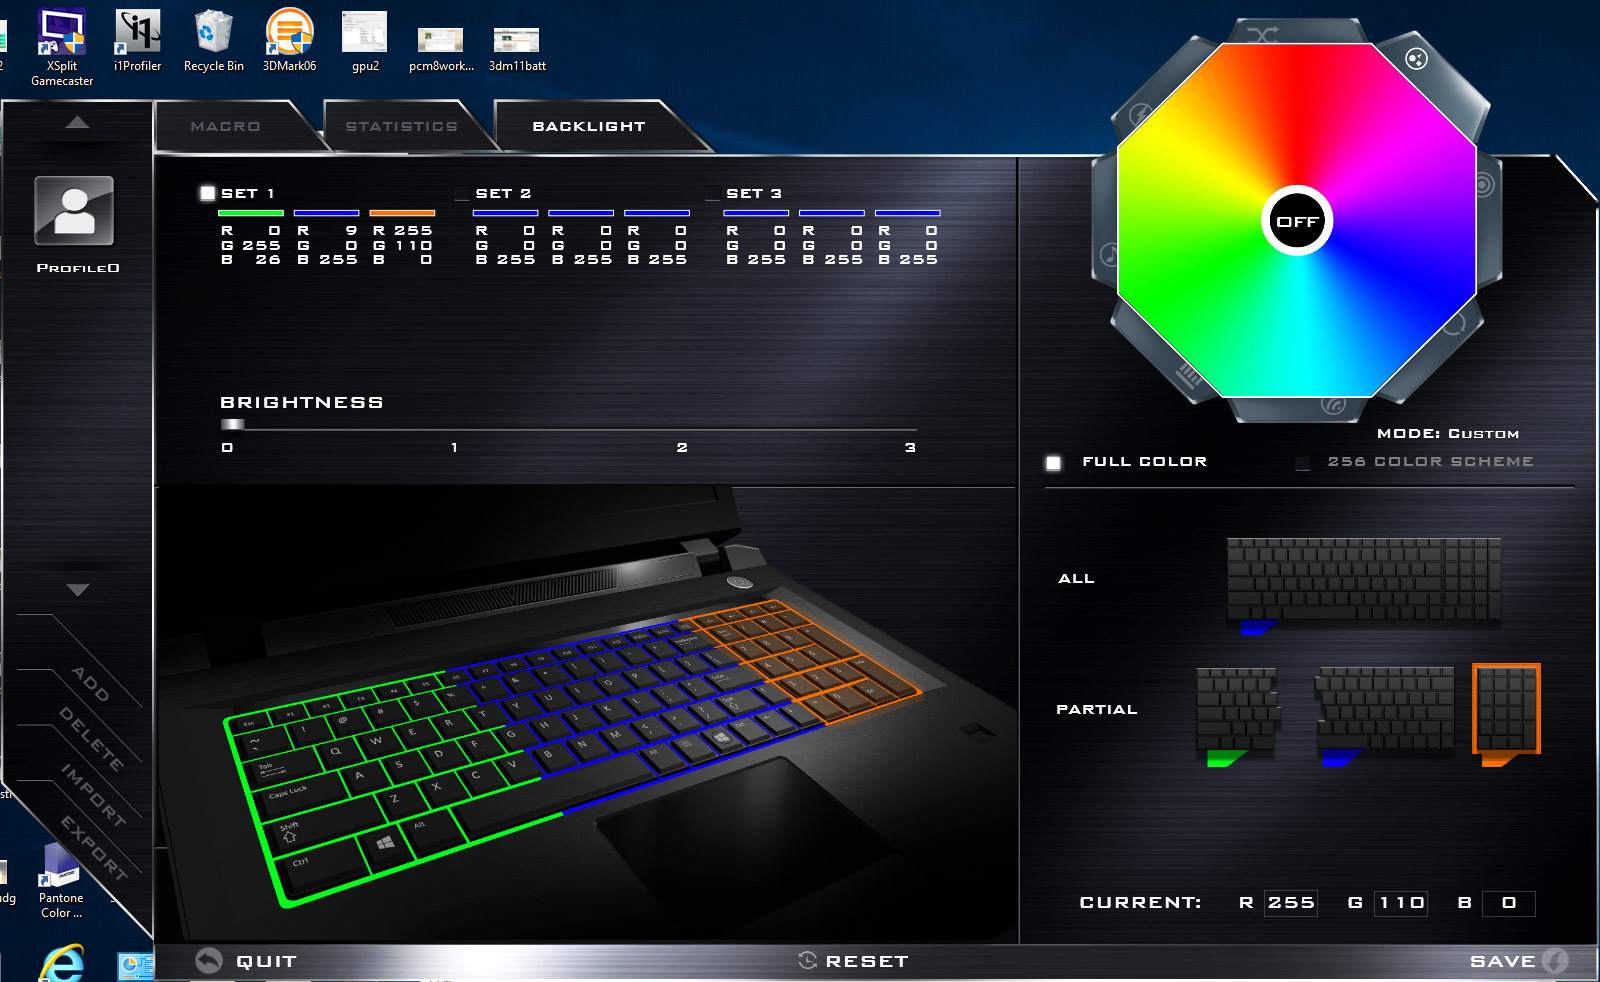
The FlexiKey software features Macro settings, key recording features, and a three-zone 16.8 million RGB keyboard backlight. Users who want per-key lighting will have to move a couple steps higher to the Aorus family.
SD Card Reader
The spring-loaded SD card reader returns average transfer rates with our Toshiba UHS-II SDXC test card. Transferring 1 GB worth of images from our card to desktop takes about 13 seconds compared to 8 seconds on the XPS 15 9560 or MSI GT series. A fully inserted card protrudes by about 1 to 2 mm to make transporting safe and removal easier.
| SD Card Reader | |
| average JPG Copy Test (av. of 3 runs) | |
| Dell XPS 15 9560 (i7-7700HQ, UHD) | |
| Gigabyte Sabre 15G | |
| Gigabyte Aero 15 | |
| maximum AS SSD Seq Read Test (1GB) | |
| Dell XPS 15 9560 (i7-7700HQ, UHD) | |
| Gigabyte Aero 15 | |
| Gigabyte Sabre 15G | |
Communication
WLAN is provided by a 1x1 Intel 3168 module with integrated Bluetooth 4.2. A real-world test standing one meter away from our Linksys EA8500 test router reveals an average transfer rate of 319 Mbps against the advertised 433 Mbps maximum. Other gaming notebooks with the Killer 1535 are capable of much faster transfer rates with additional software advantages.
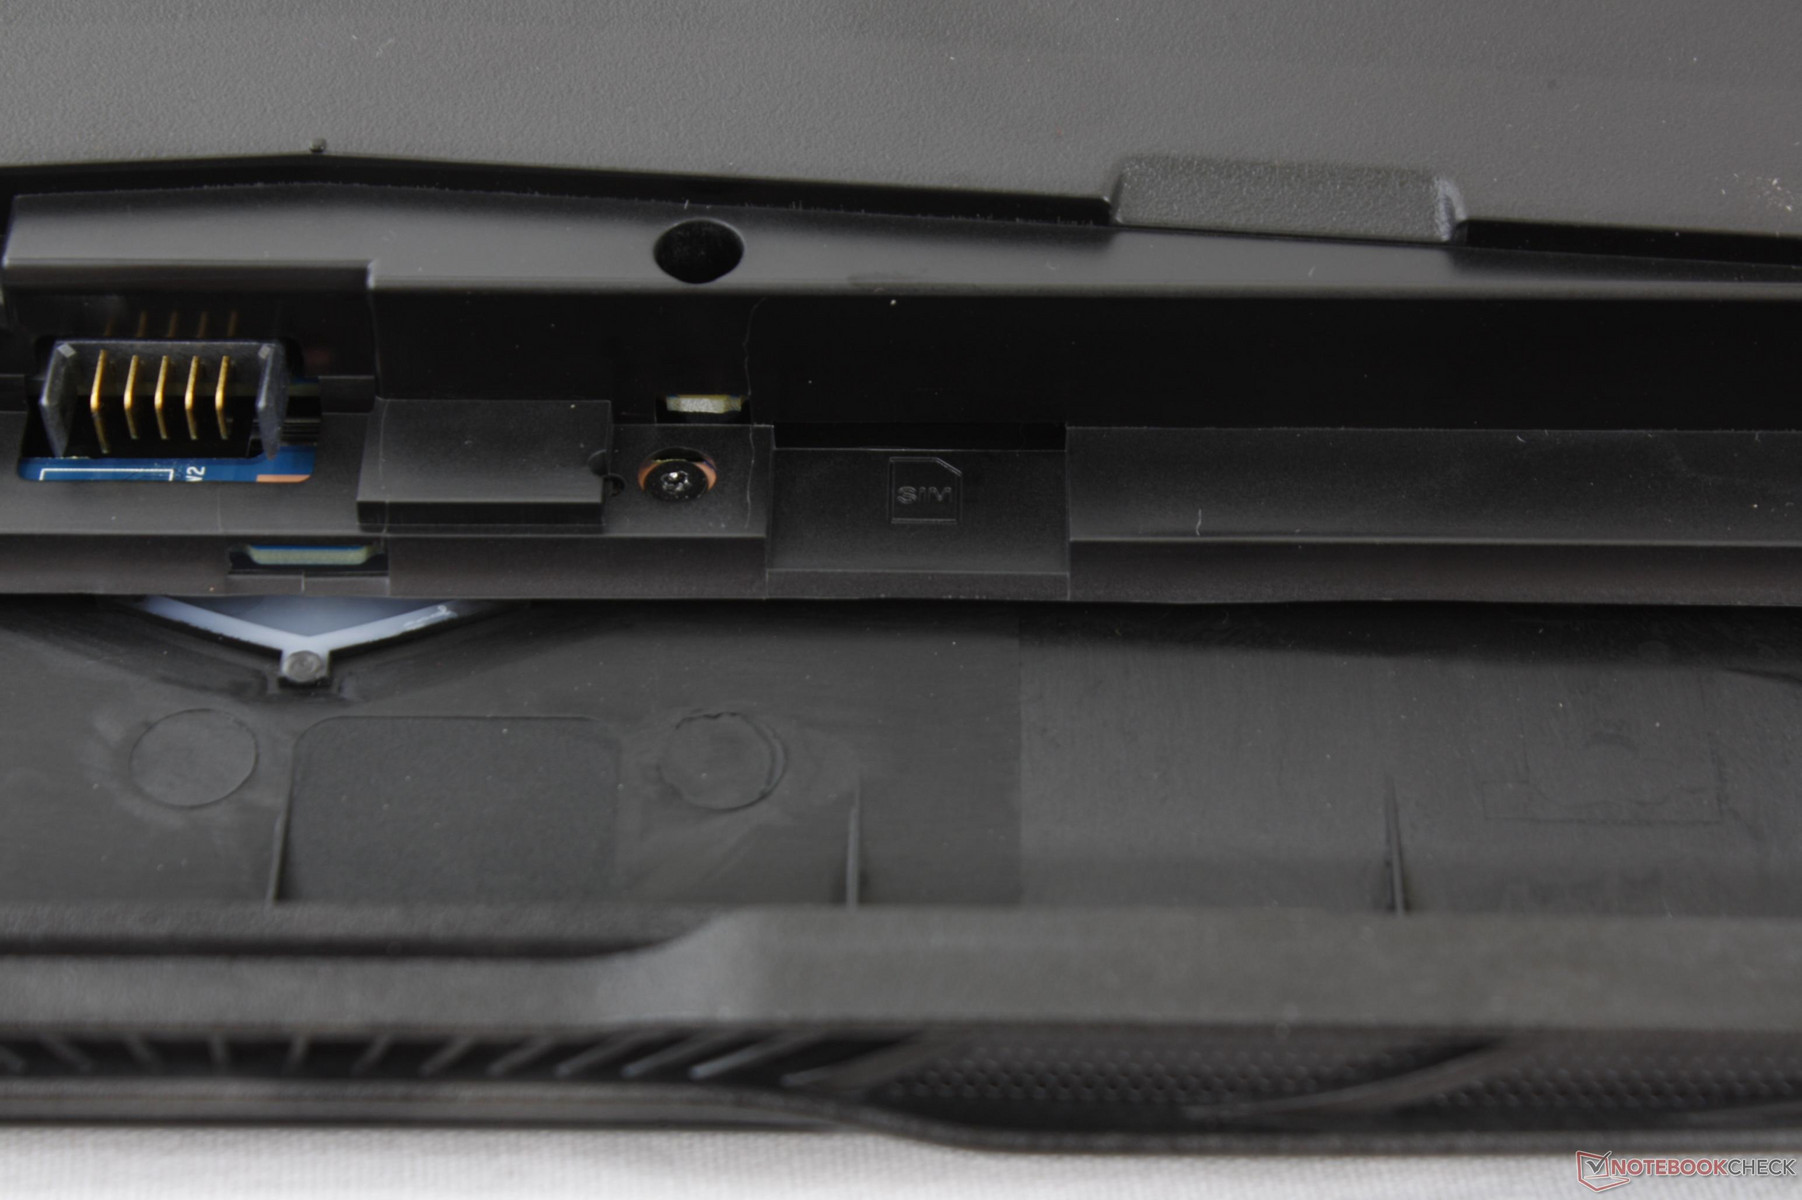
There is an unused SIM slot underneath the battery recess on our unit. No current SKUs in the US utilize this slot, but the Sabre 15 overseas may be capable of WAN if this is any indication. If so, the Sabre 15 would be one of the very few gaming notebooks with integrated SIM functionality.
| Networking | |
| iperf3 transmit AX12 | |
| Dell XPS 15 9560 (i7-7700HQ, UHD) | |
| Samsung Odyssey NP800G5M-X01US | |
| Gigabyte Sabre 15G | |
| iperf3 receive AX12 | |
| Dell XPS 15 9560 (i7-7700HQ, UHD) | |
| Samsung Odyssey NP800G5M-X01US | |
| Gigabyte Sabre 15G | |
Accessories
Included extras are a Drivers disc, PowerDVD 12 disc, warranty card, and user's manual. The discs are a curious addition as the Sabre 15 does not integrate an optical drive and will thus require an external drive to use. A cleaning cloth may have been a more appropriate inclusion since the chassis is quite the fingerprint magnet.
Maintenance
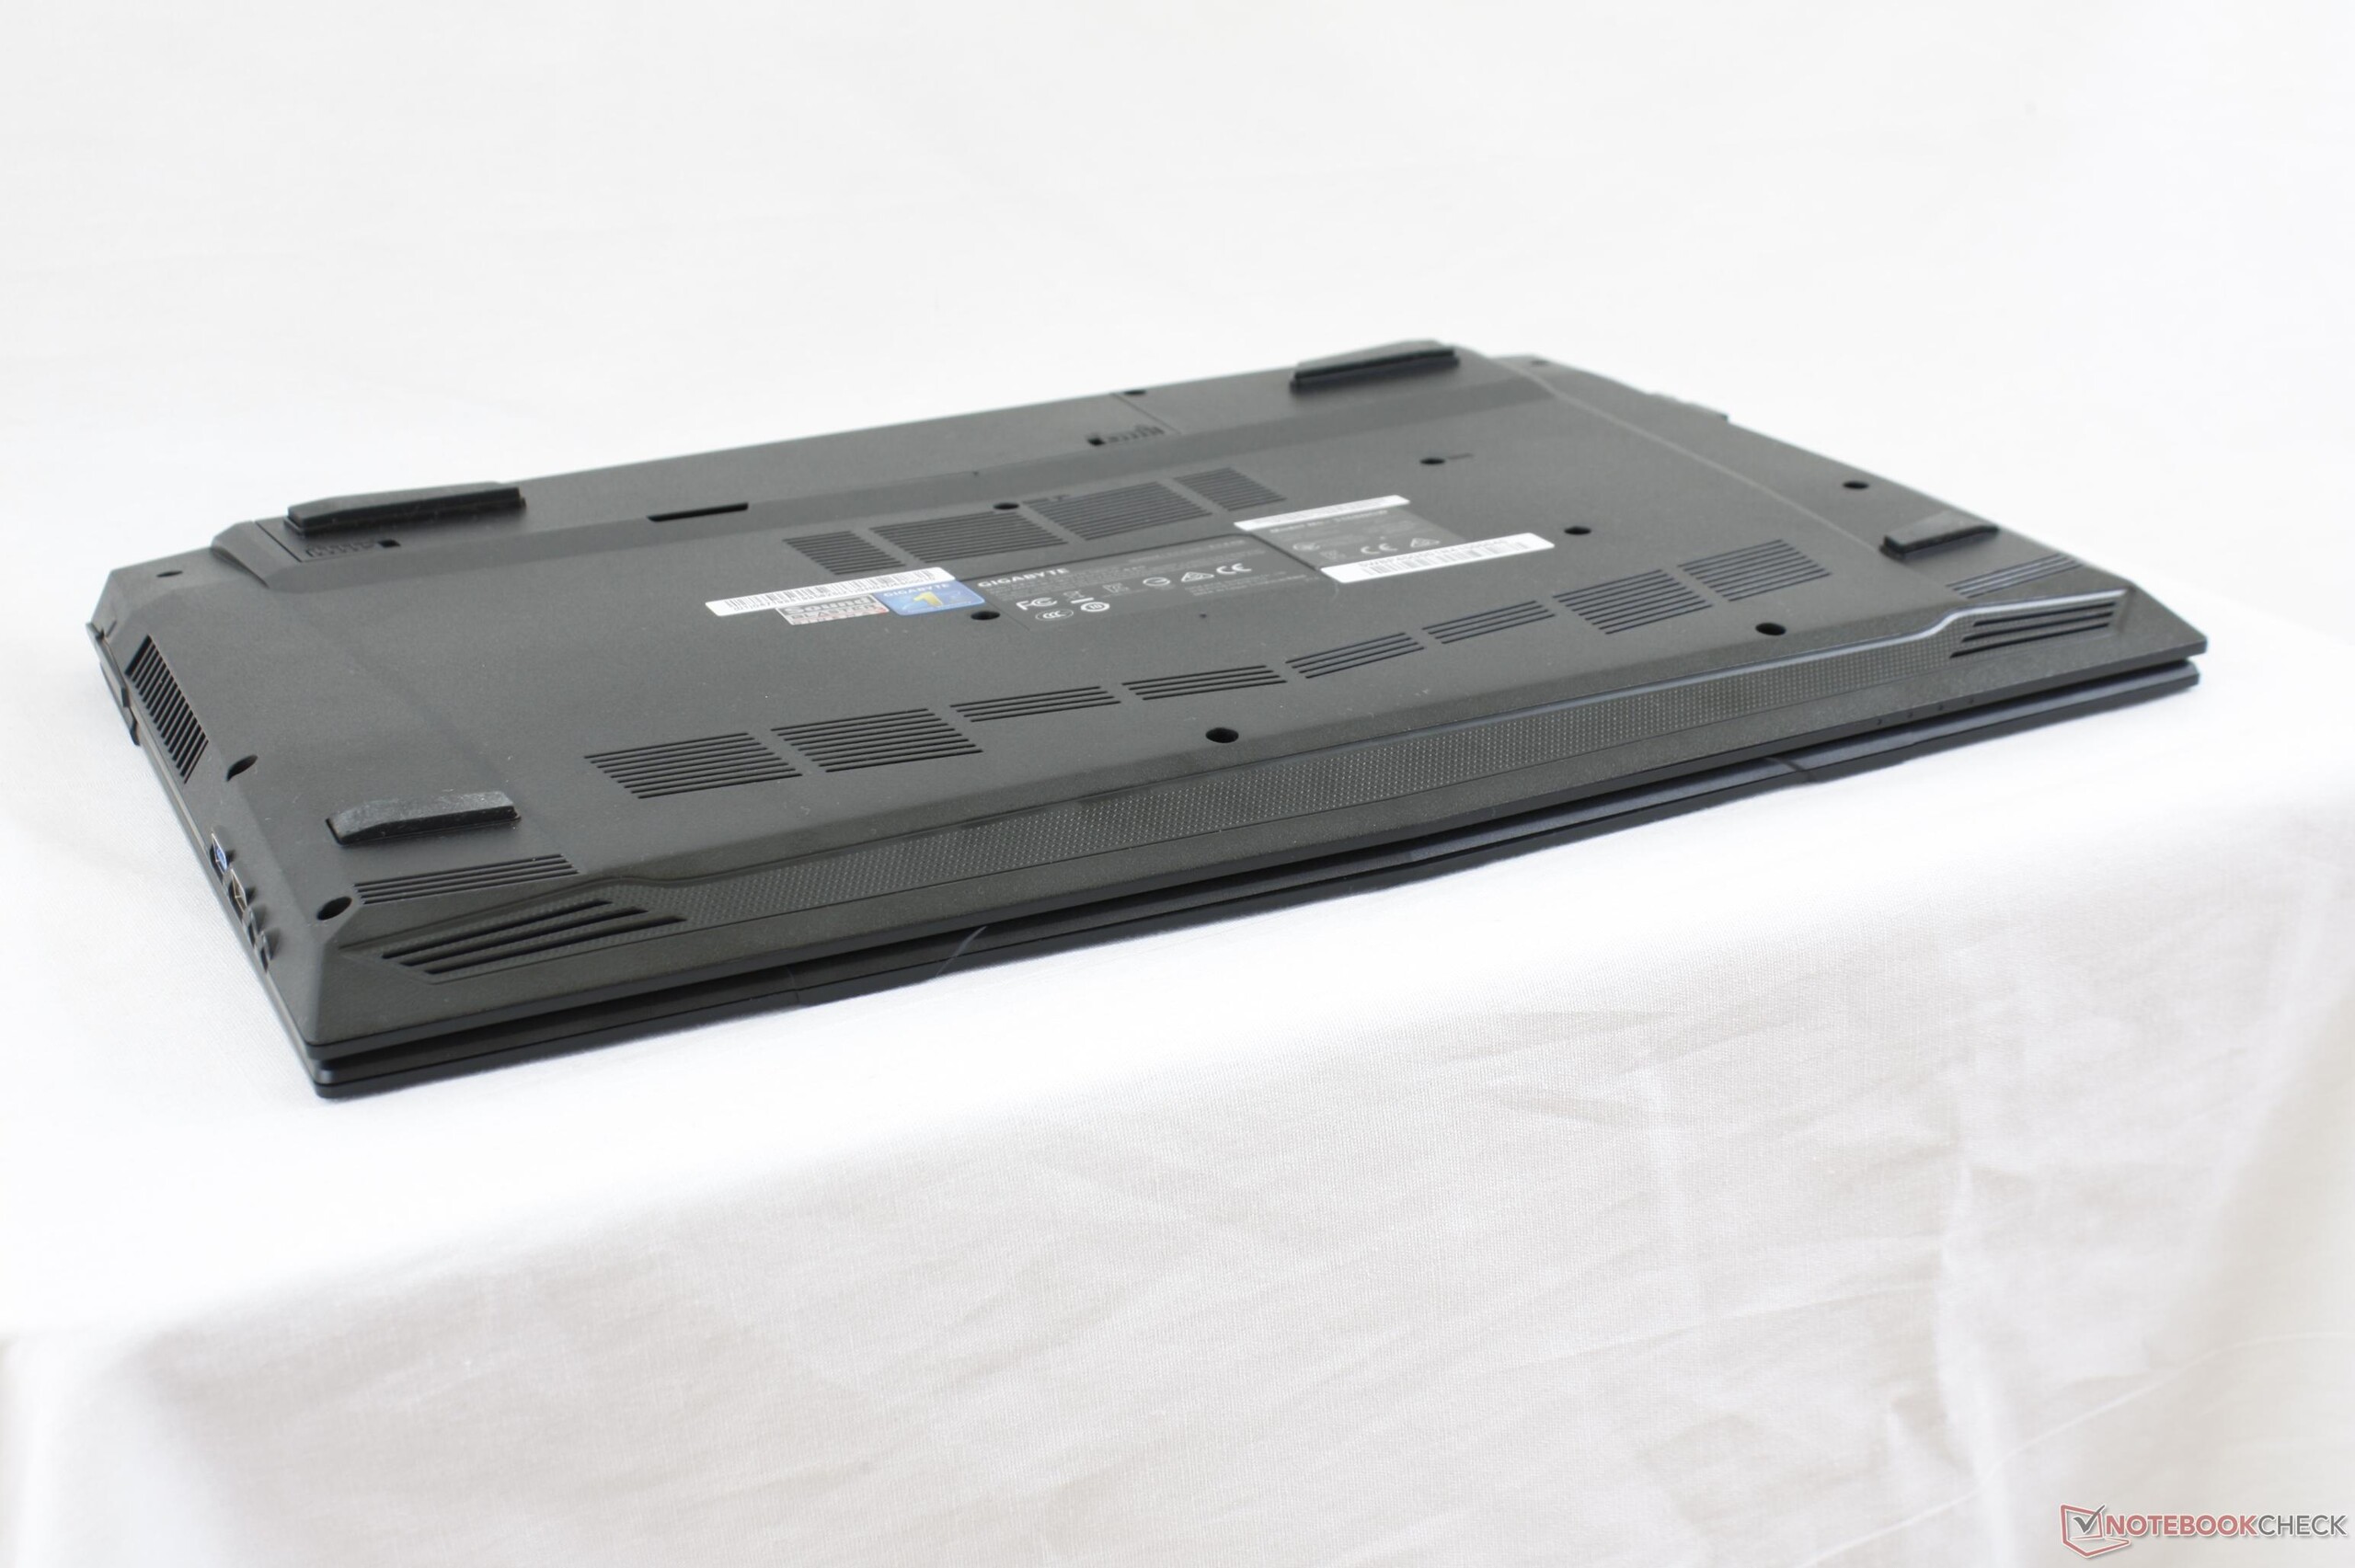
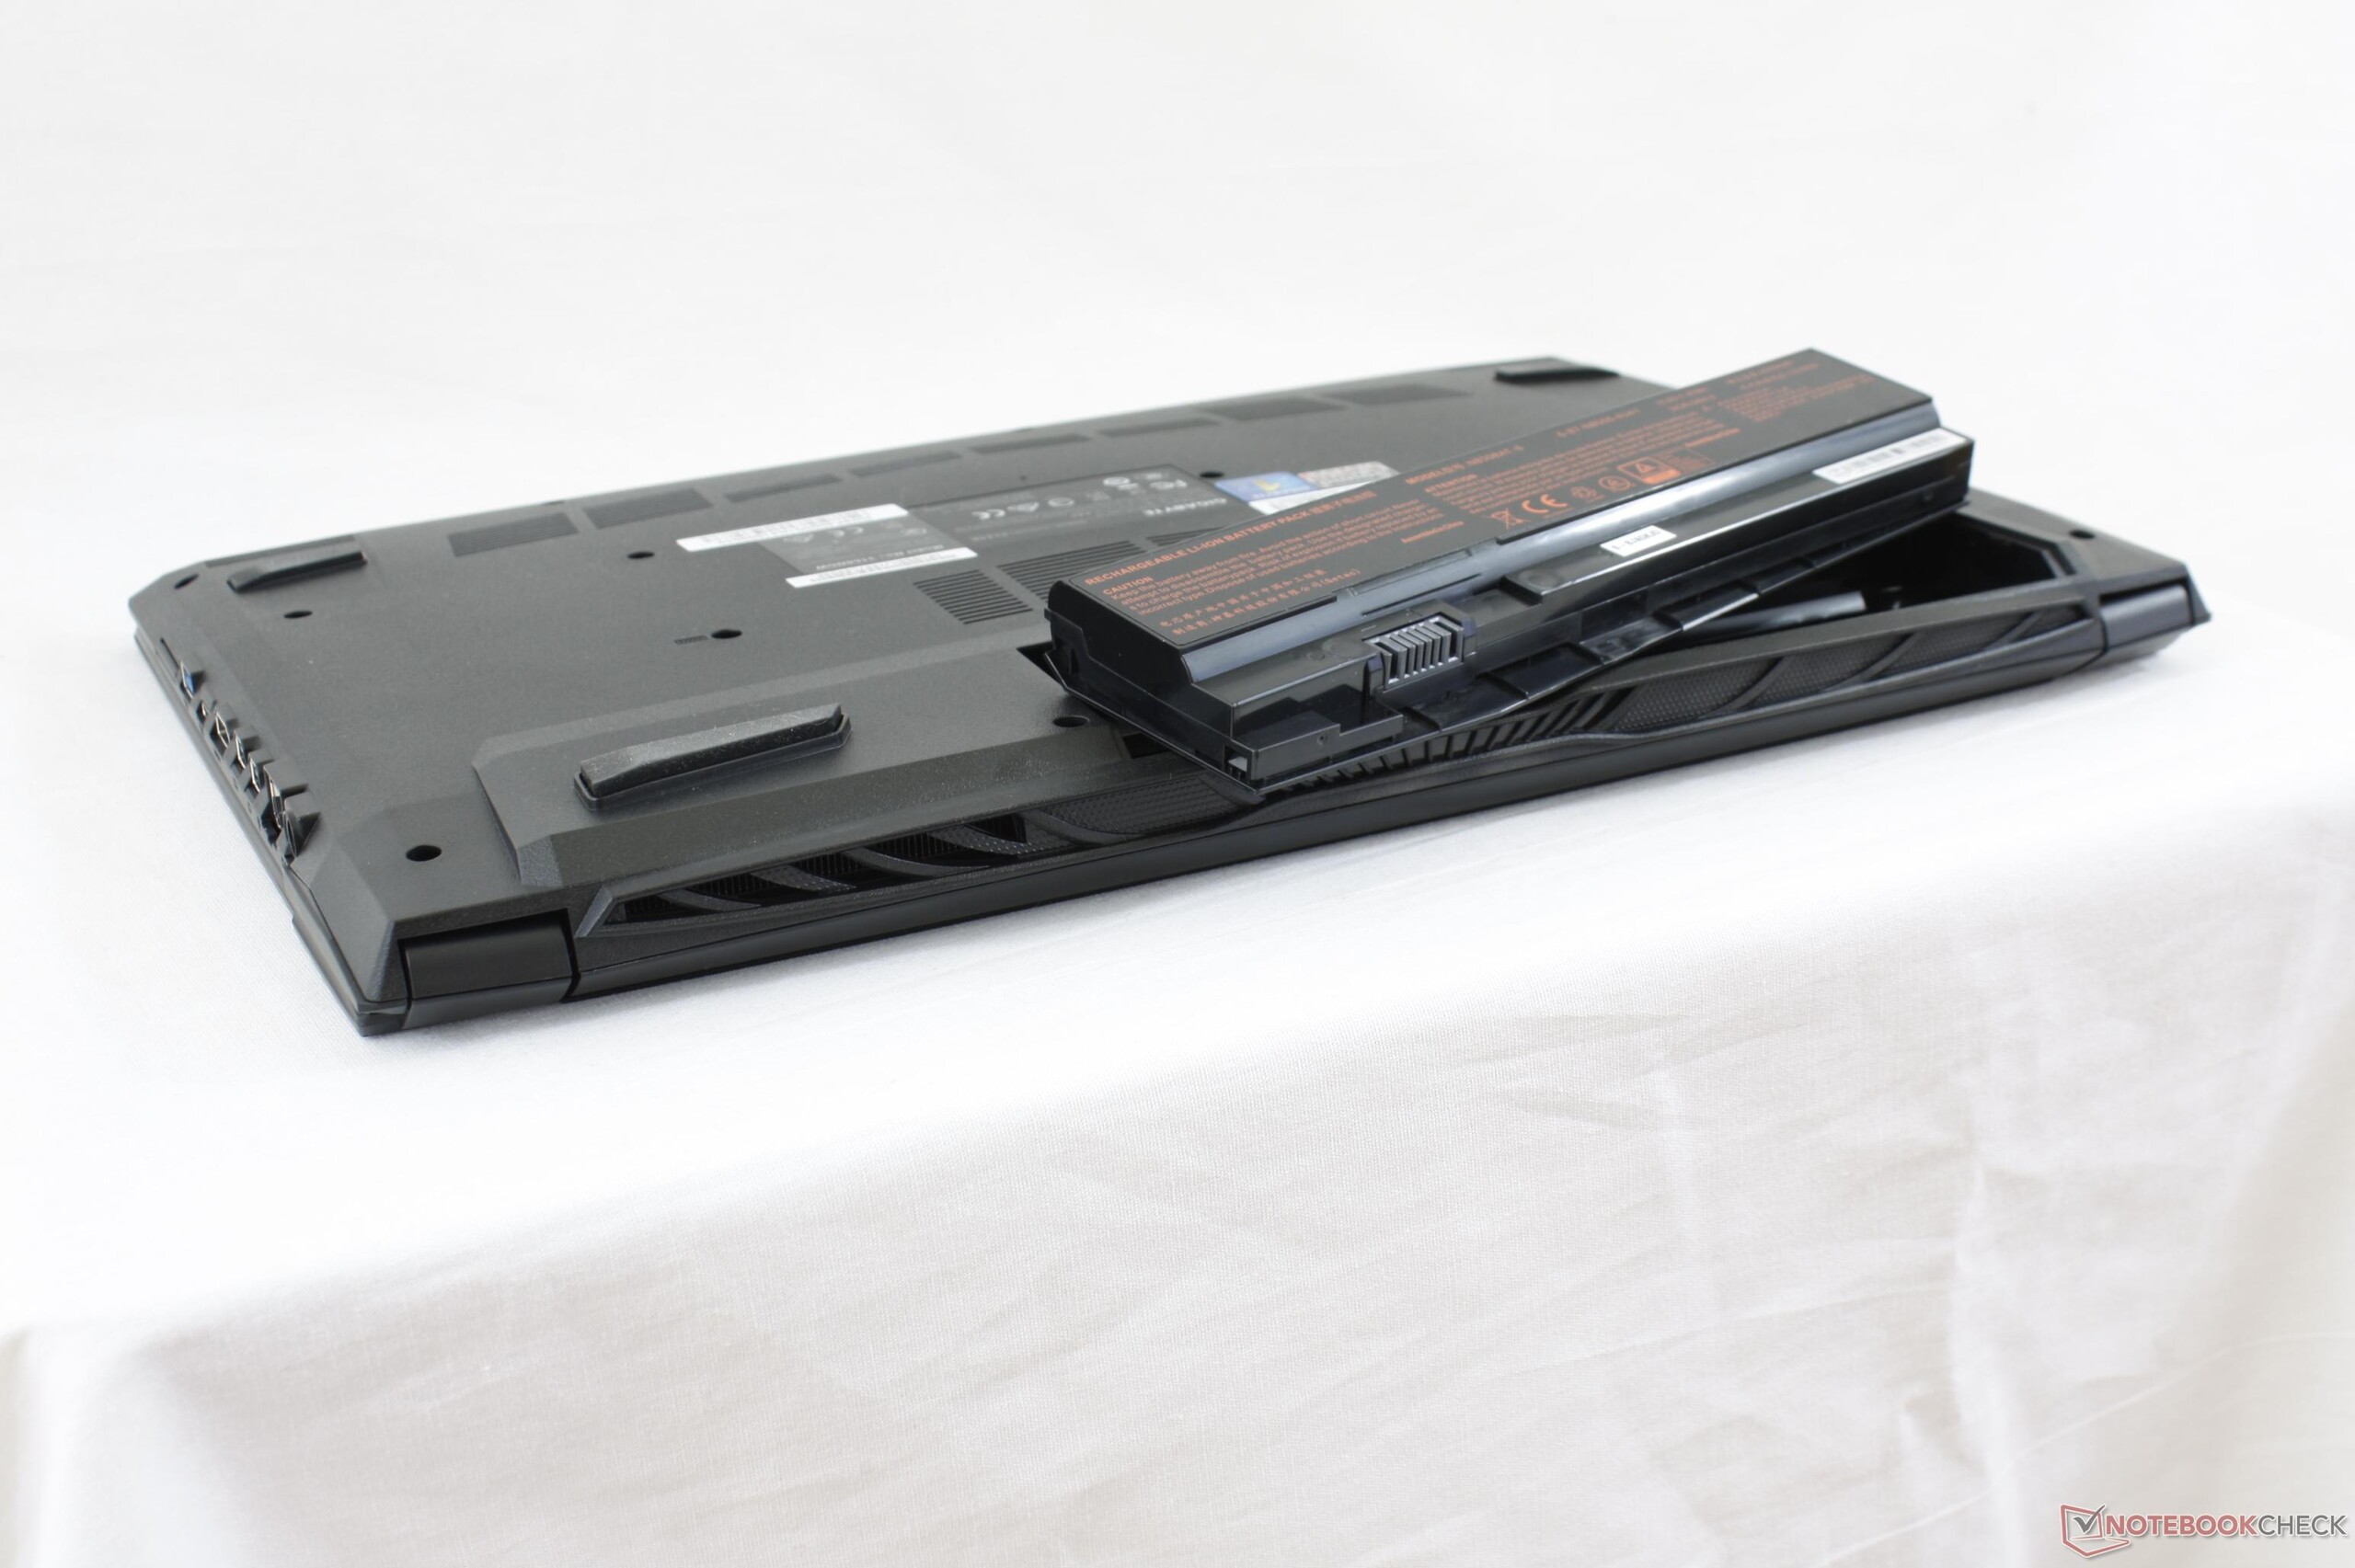
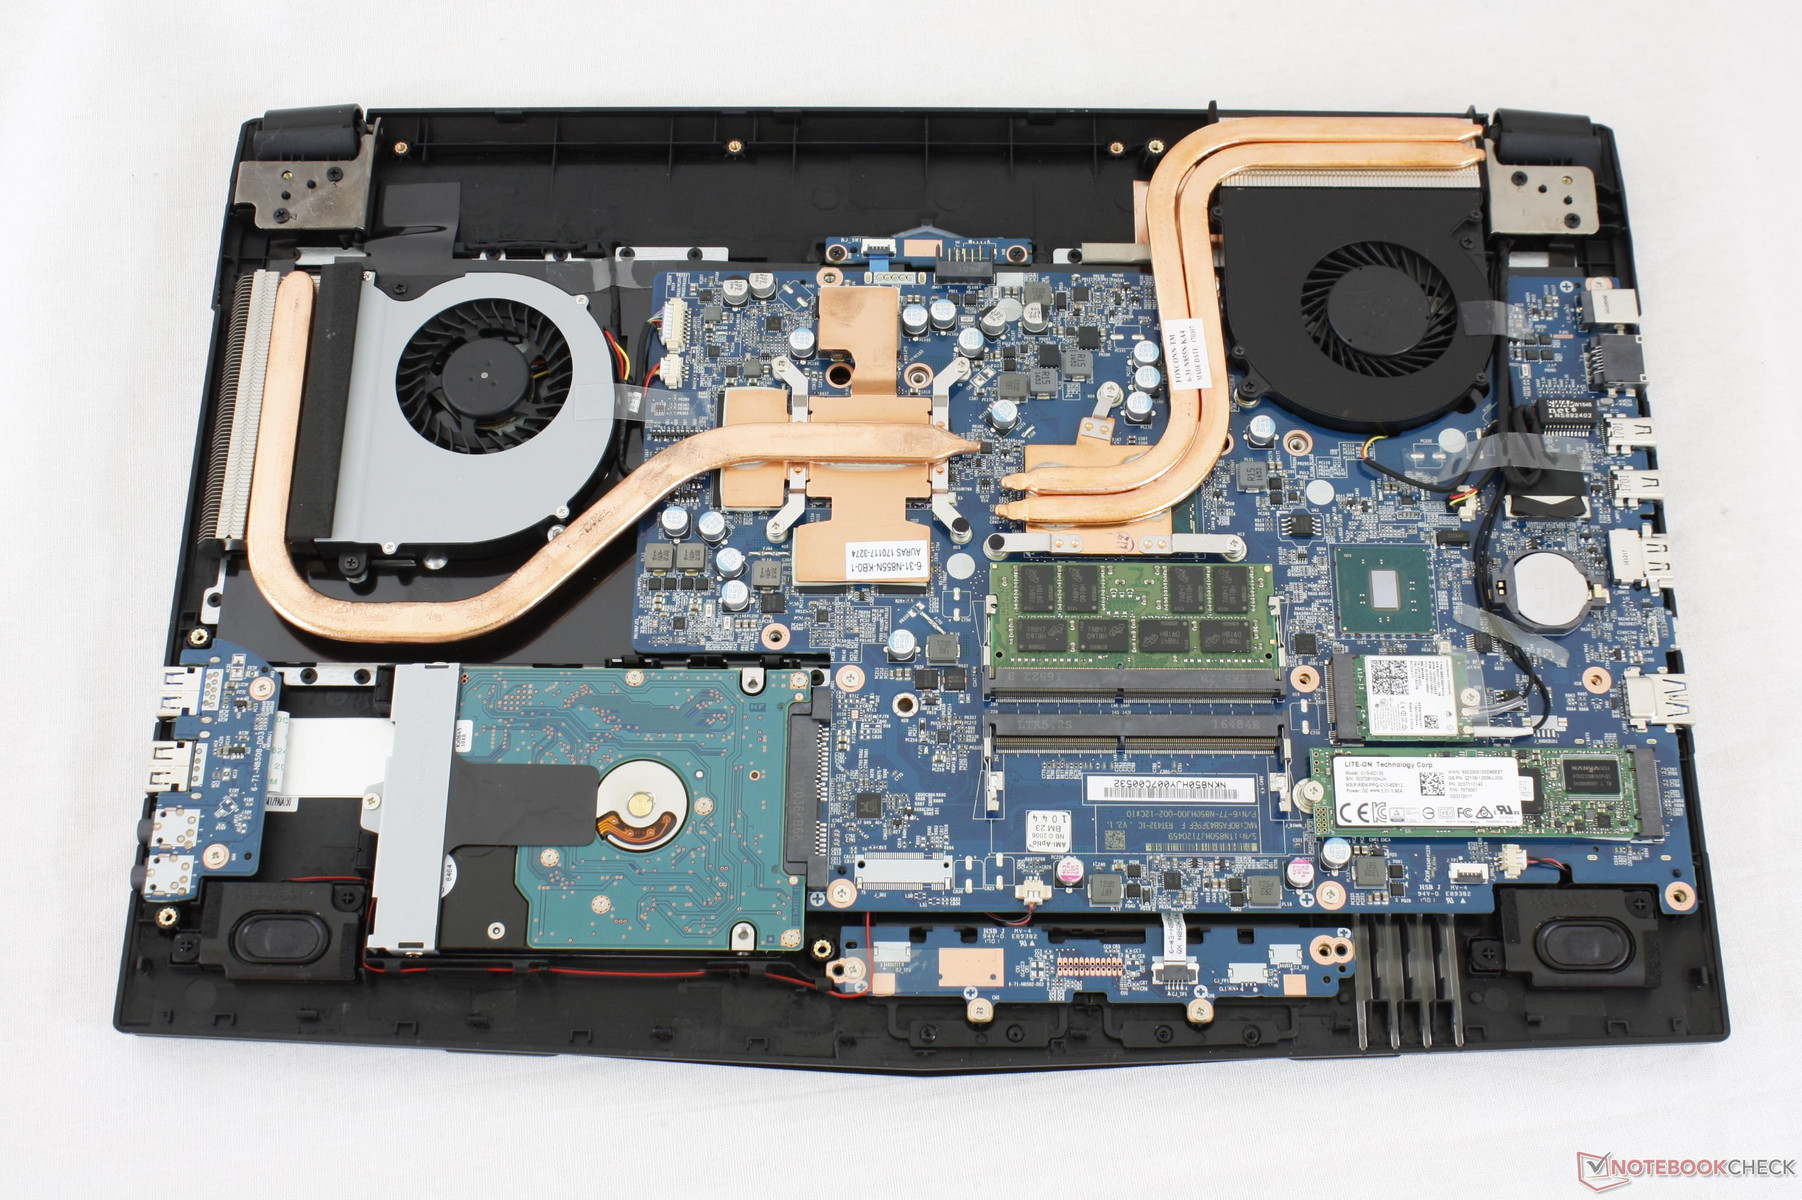
The bottom panel is secured by more Philips screws (17 in total) and delicate latches when compared to Aorus and Gigabyte P notebooks. While not difficult to service, the large number of screws makes it a chore. Users have direct access to both storage bays, both DDR4 SODIMM slots, WLAN module, and the BIOS battery.
Warranty
Gigabyte advertises a 24-month limited warranty as standard online, but the actual warranty sticker on our unit says one year only. We've reached out to Gigabyte on the actual length of the standard warranty for more information. Please see our Guarantees, Return policies and Warranties FAQ for country-specific information.
July 27, 2017 update: Gigabyte has confirmed with us that the base warranty is one year and not two years because the Sabre family is an entry-level series. Higher-end options like the Aero or Aorus series may come with two years warranty as standard.
Input Devices
Keyboard
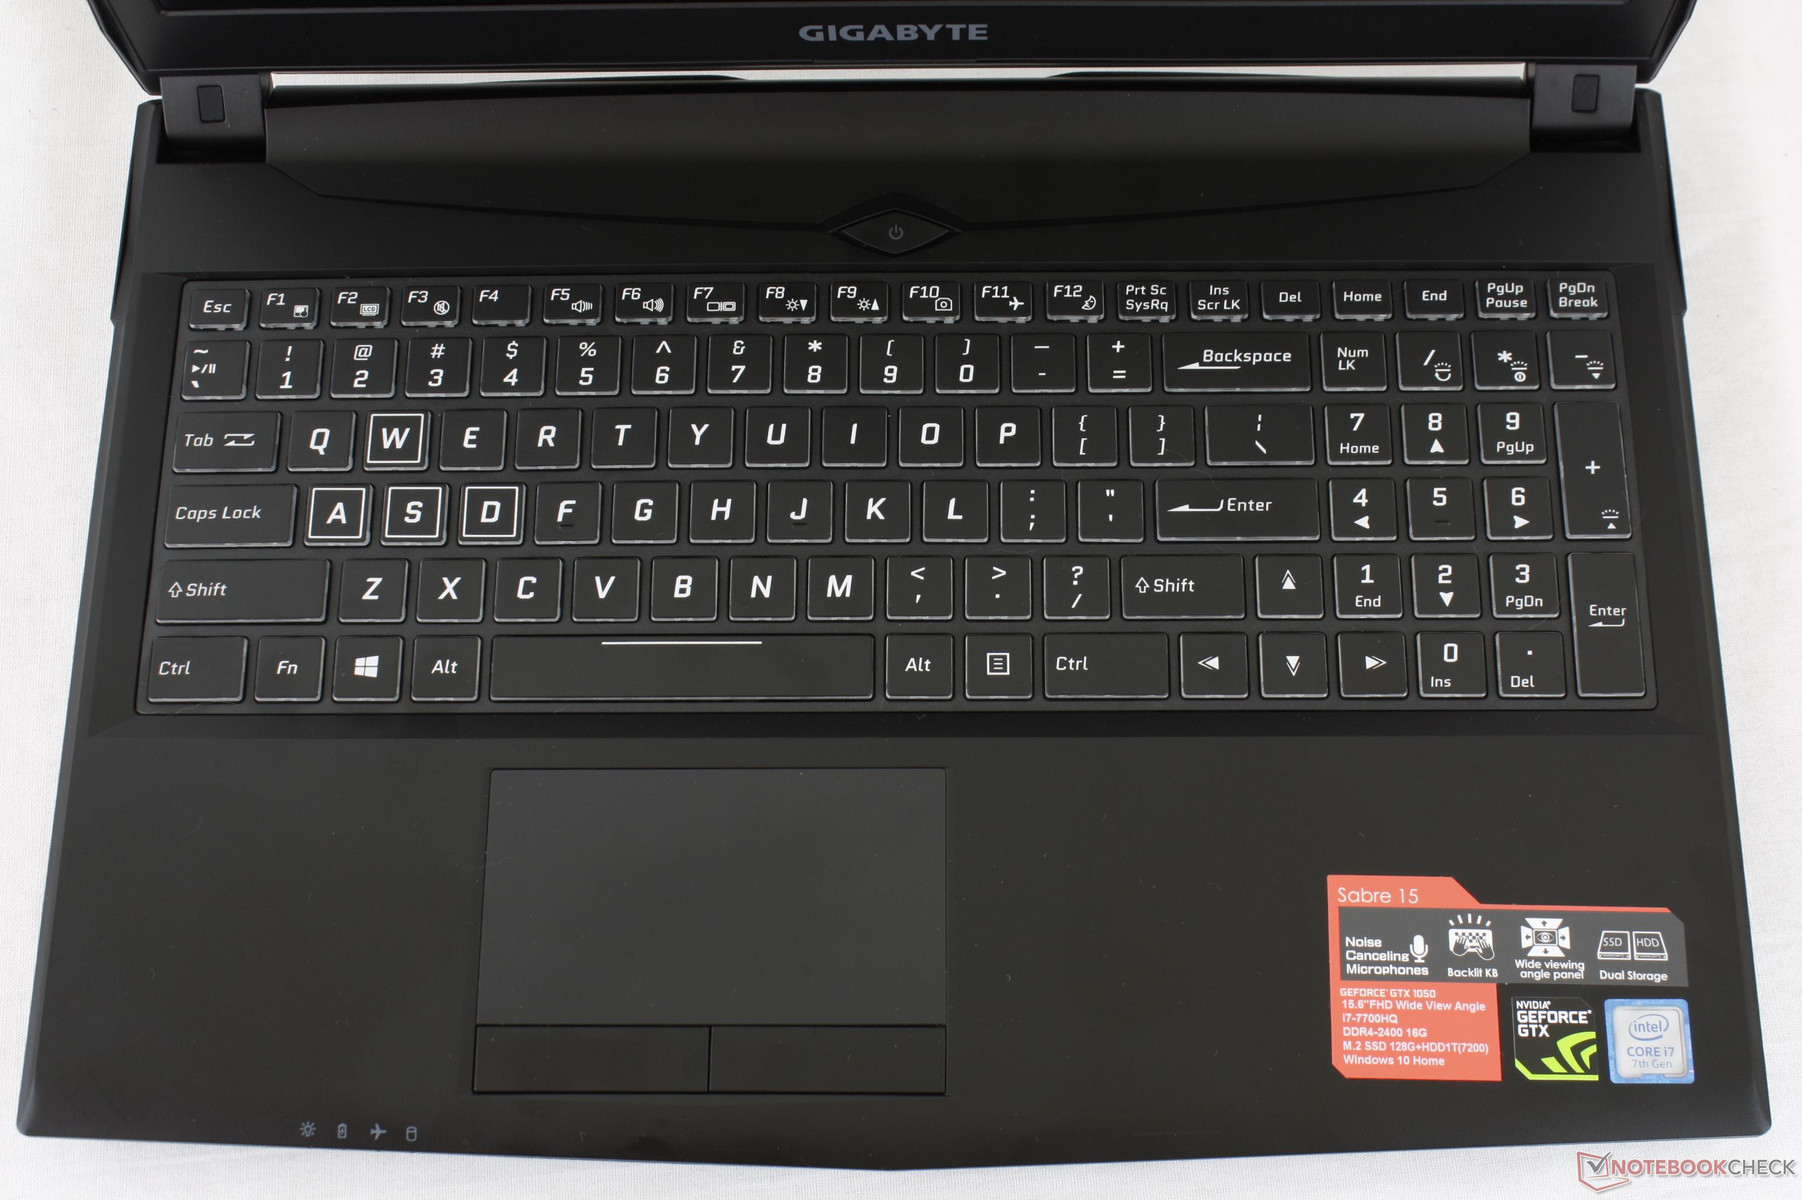
The keyboard (~34.2 x 10.5 cm) is visually very similar to the SteelSeries keyboards on the MSI GT series. The 2 mm key travel is deeper than on most Ultrabooks for a weightier typing experience. Feedback is slightly on the soft side while clatter is louder compared to the MSI GT series, but this is typical of a Gigabyte notebook. Tactile feedback is uniform across all the keys because of the firm foundation and large size.
One small annoyance is the lack of a light indicator for Caps Lock. Unless if FlexiKey is opened, there is no indication whatsoever - onscreen or otherwise - for the Caps Lock function.
Touchpad
The trackpad is small in size (10.2 x 5.8 cm) compared to the XPS 15 (10.5 x 8.5 cm) and Aero 15 (10.5 x 7 cm), but it makes up for the reduced surface area with dedicated mouse keys unlike the aforementioned alternatives. Its surface is slightly roughened and almost indistinguishable from the palm rests in terms of texture. Applying pressure on the very center will depress it only slightly for a firm and even glide overall.
Unlike the trackpad, the mouse keys feel cheaper and lighter to use. The audible click is weak, feedback is spongy and not as firm as on the MSI GT series, and travel is very shallow. They are still more comfortable to use than the integrated mouse keys on most Ultrabooks, but we were expecting a bit more from a dedicated set.
Display
Current Sabre 15 SKUs ship with a standard 1080p display and no other resolution options or gaming-centric features. This means the series lacks the higher 120 Hz refresh rate, faster 5 ms response times, and proprietary G-Sync technology found on many higher gaming systems. While we can live without the 120 Hz refresh and higher resolution options considering the GPU class, the Sabre series would still benefit greatly from G-Sync and faster response times.
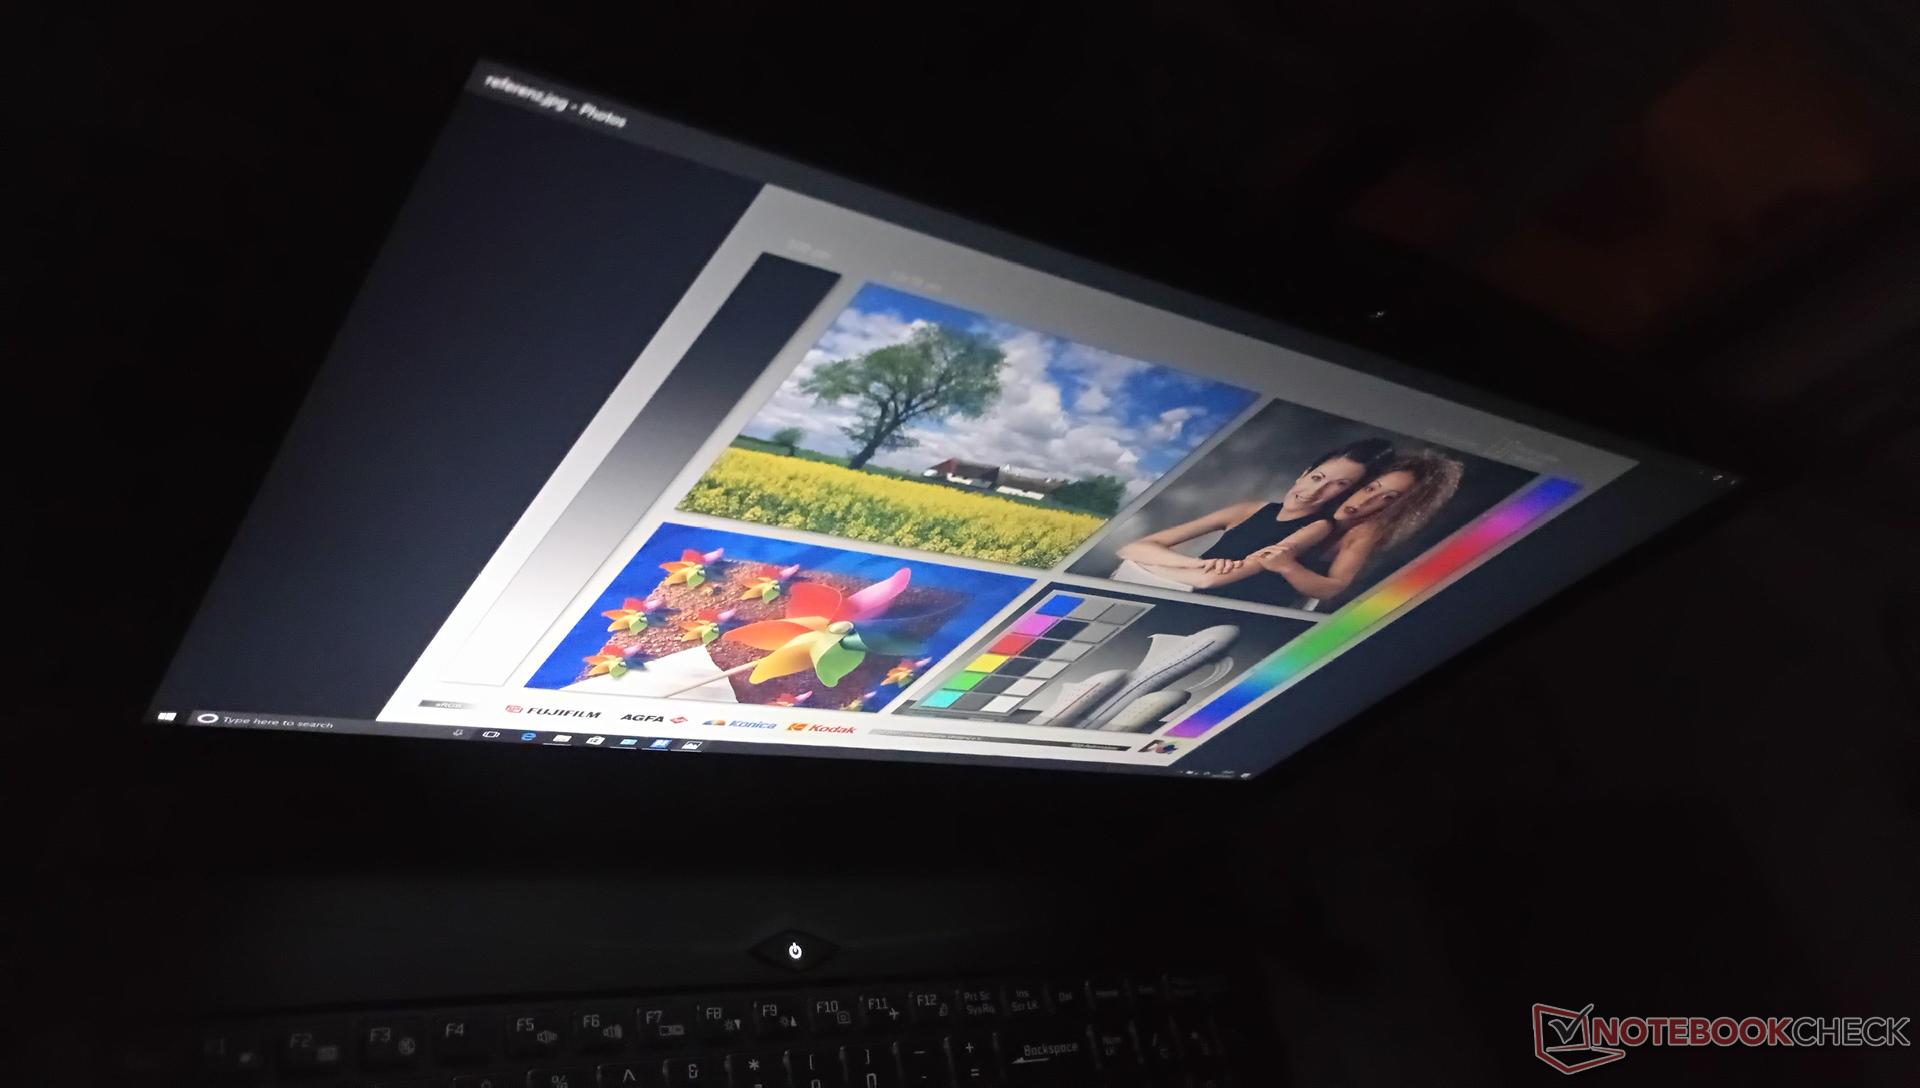
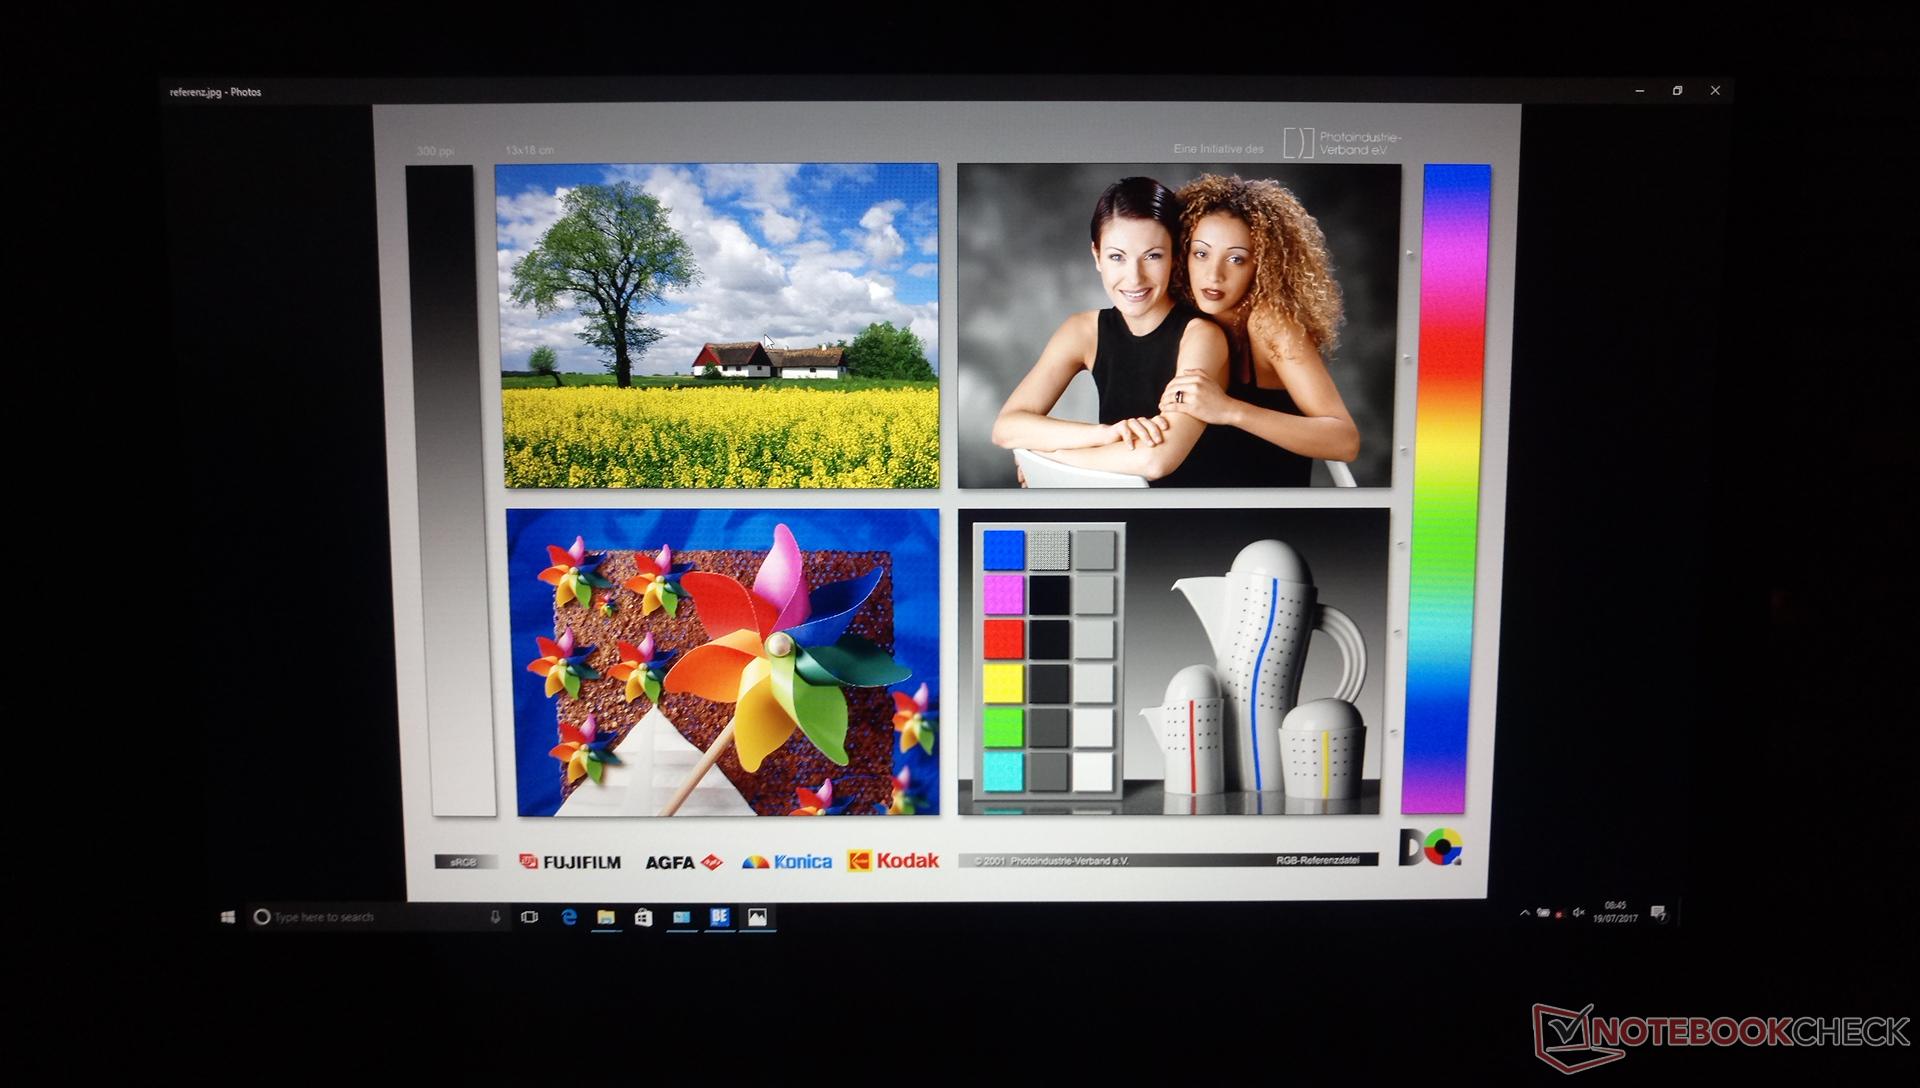
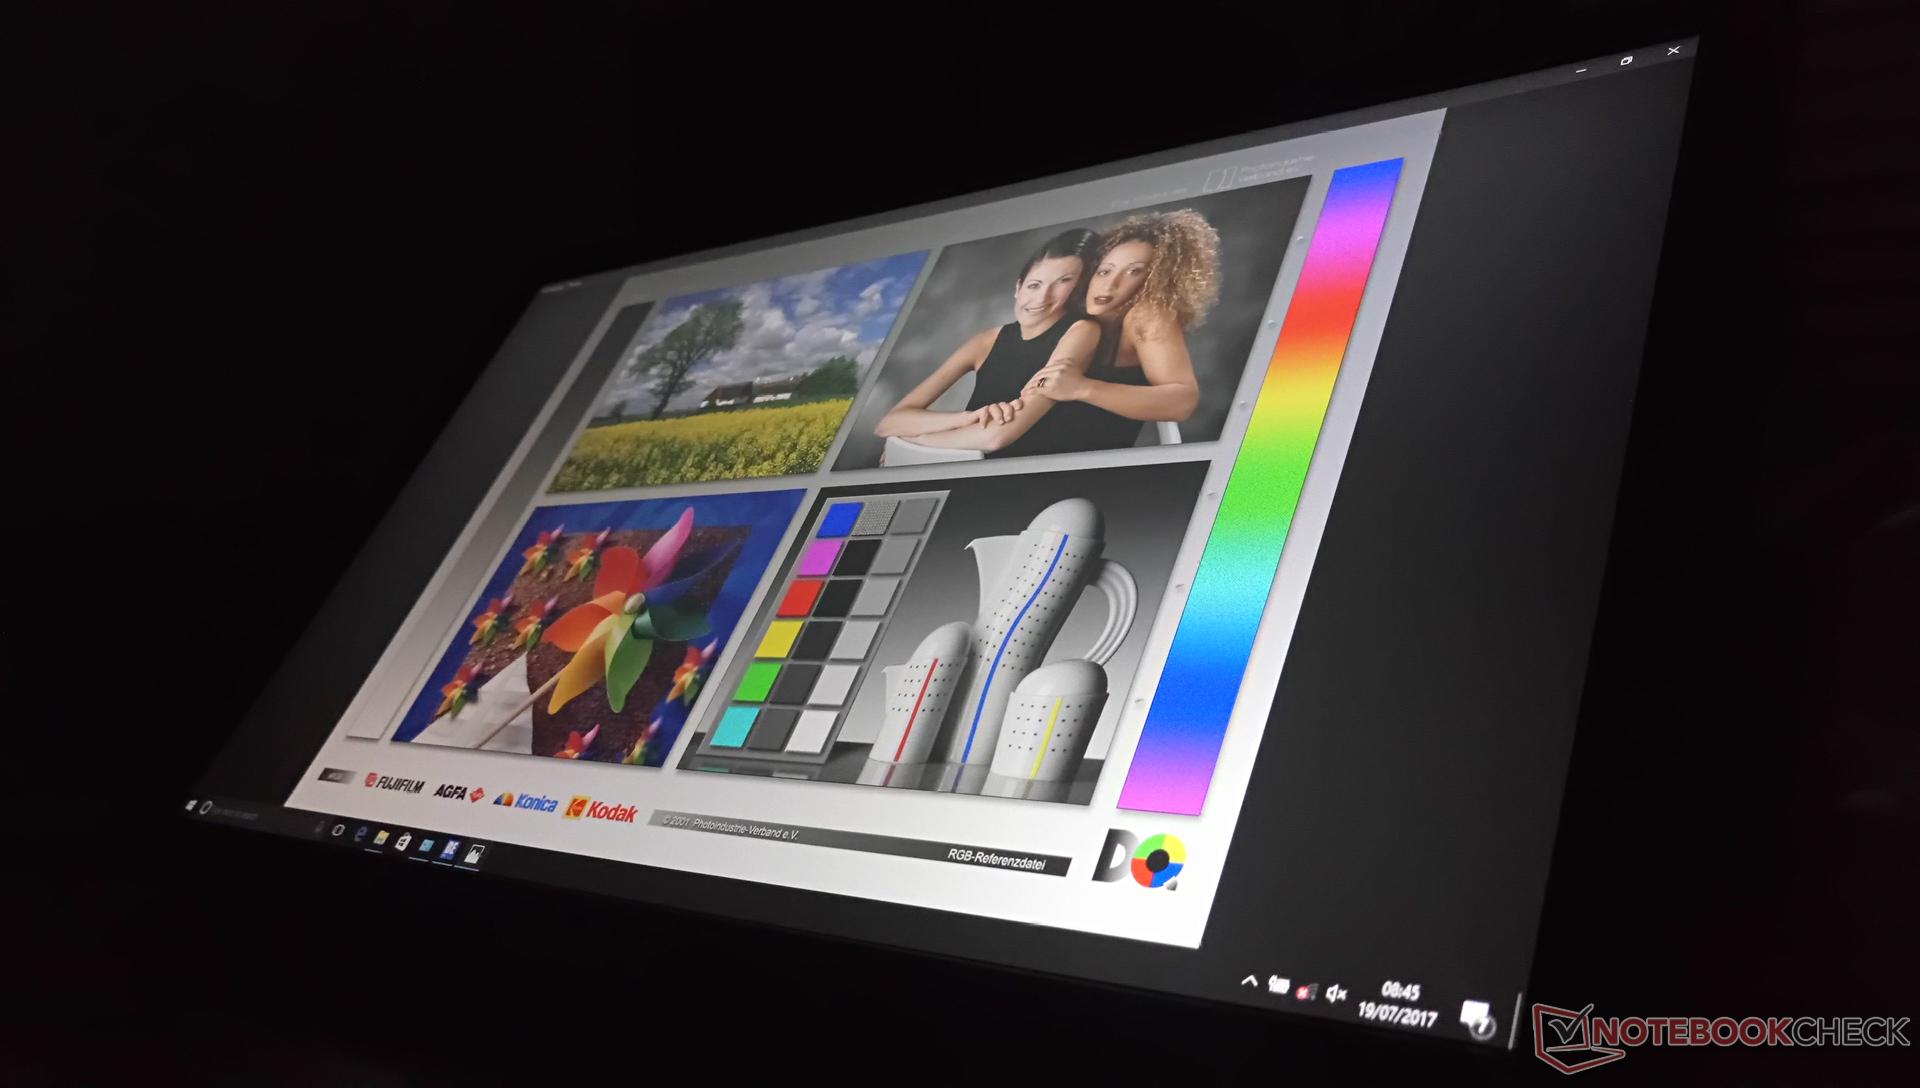
The LG Philips LGD0533 IPS panel here is identical to the panel on the 15.6-inch Lenovo Y720. Consequently, the displays between our Gigabyte and Lenovo notebooks share similar characteristics such as gamut, contrast, and black-white response times. Display brightness is average for a gaming notebook at about 240 nits with a respectable contrast level of about 800:1. More interestingly, we can detect a very high pulse-width modulation frequency that a small percentage of users may be sensitive to on all brightness settings except maximum.
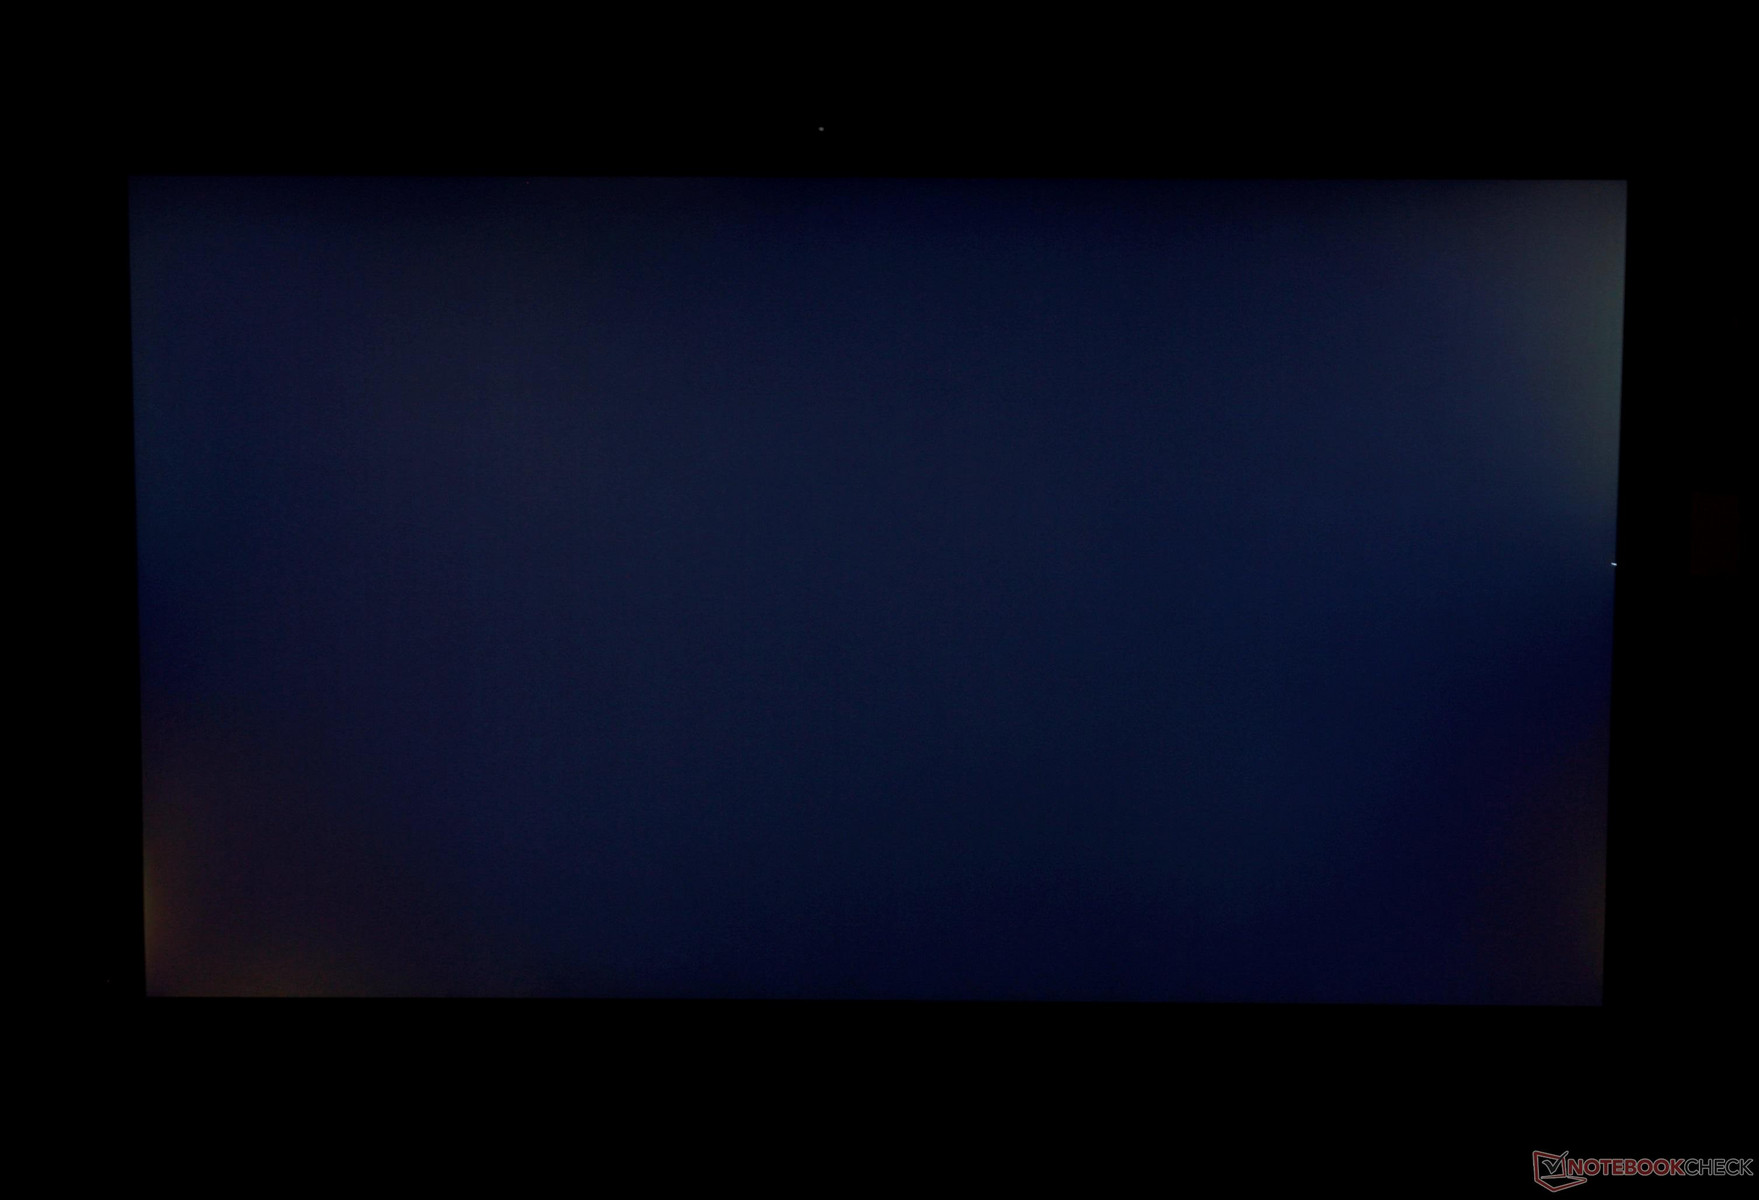
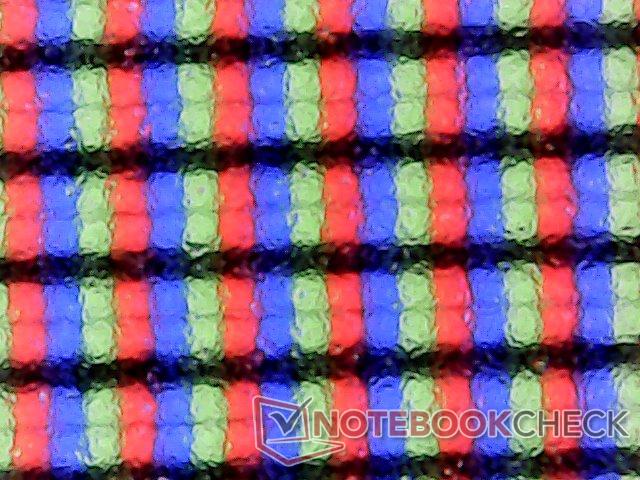
Our unit suffers from light-moderate backlight bleeding on the top right corner that can be noticeable during movie playback with black borders. Fortunately, the matte panel is crisp with no extreme graininess that can plague other matte screens like on the cheaper Pavilion 17z.
| |||||||||||||||||||||||||
Brightness Distribution: 84 %
Center on Battery: 248.4 cd/m²
Contrast: 828:1 (Black: 0.3 cd/m²)
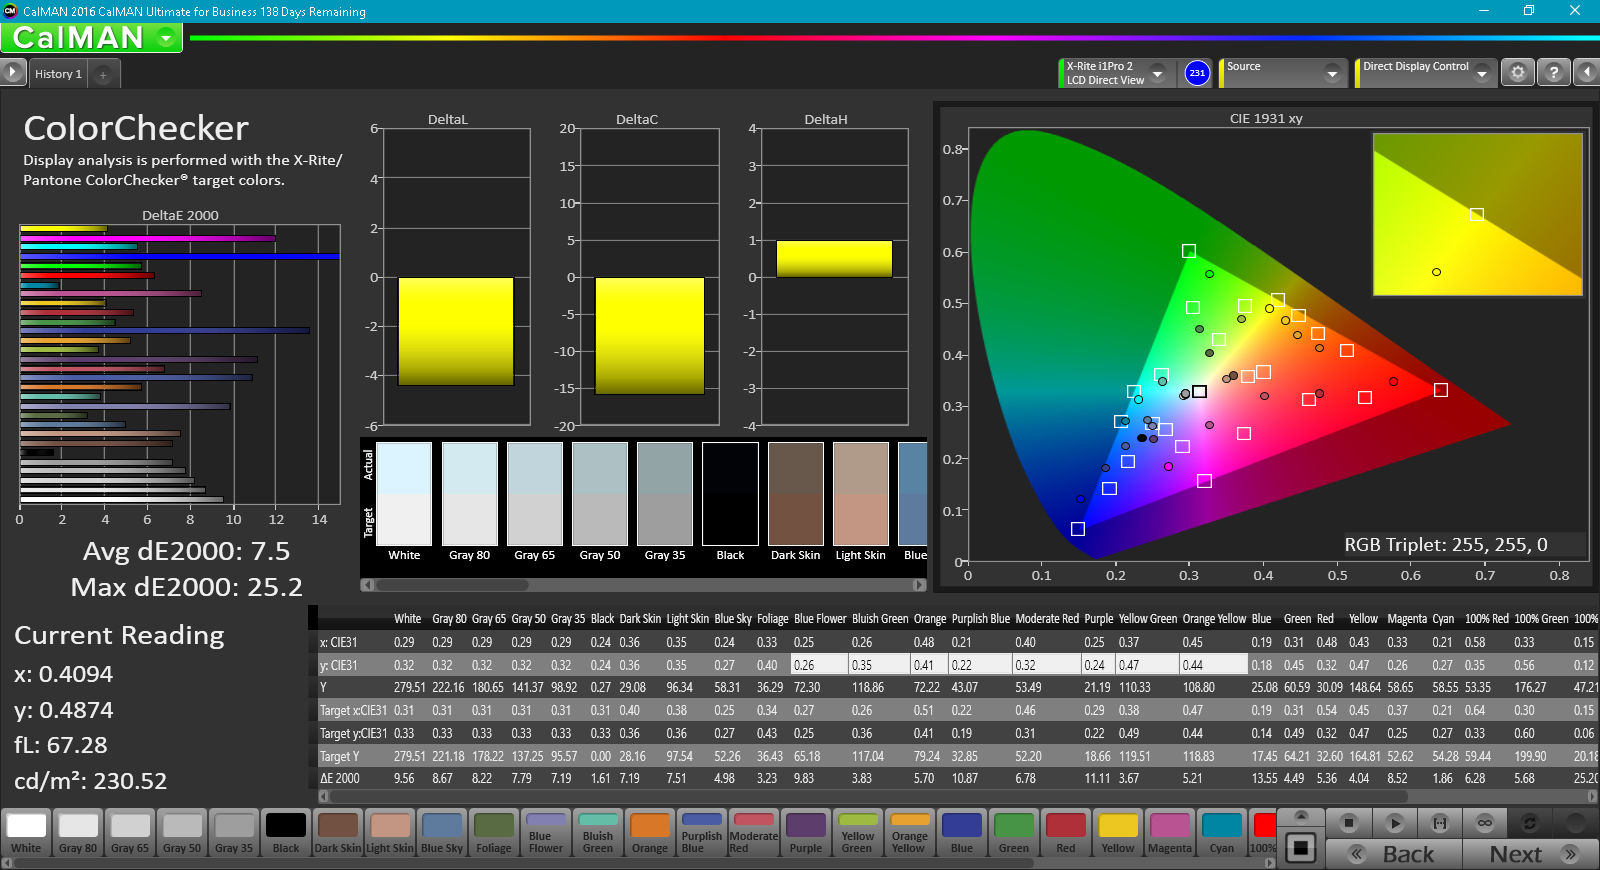
ΔE ColorChecker Calman: 7.5 | ∀{0.5-29.43 Ø4.78}
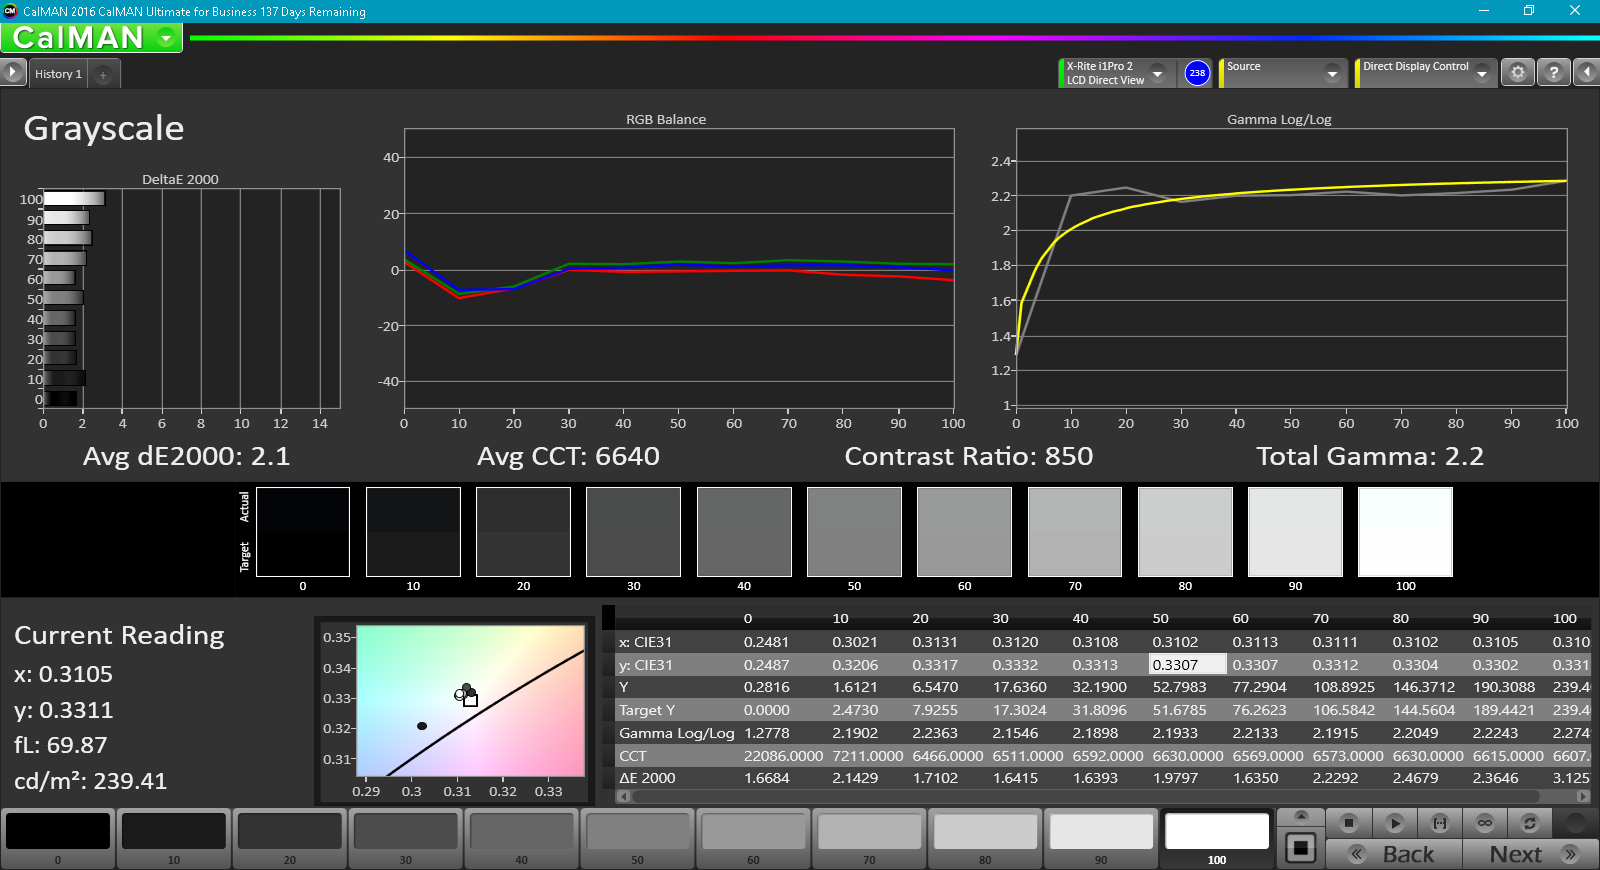
ΔE Greyscale Calman: 6.5 | ∀{0.09-98 Ø5}
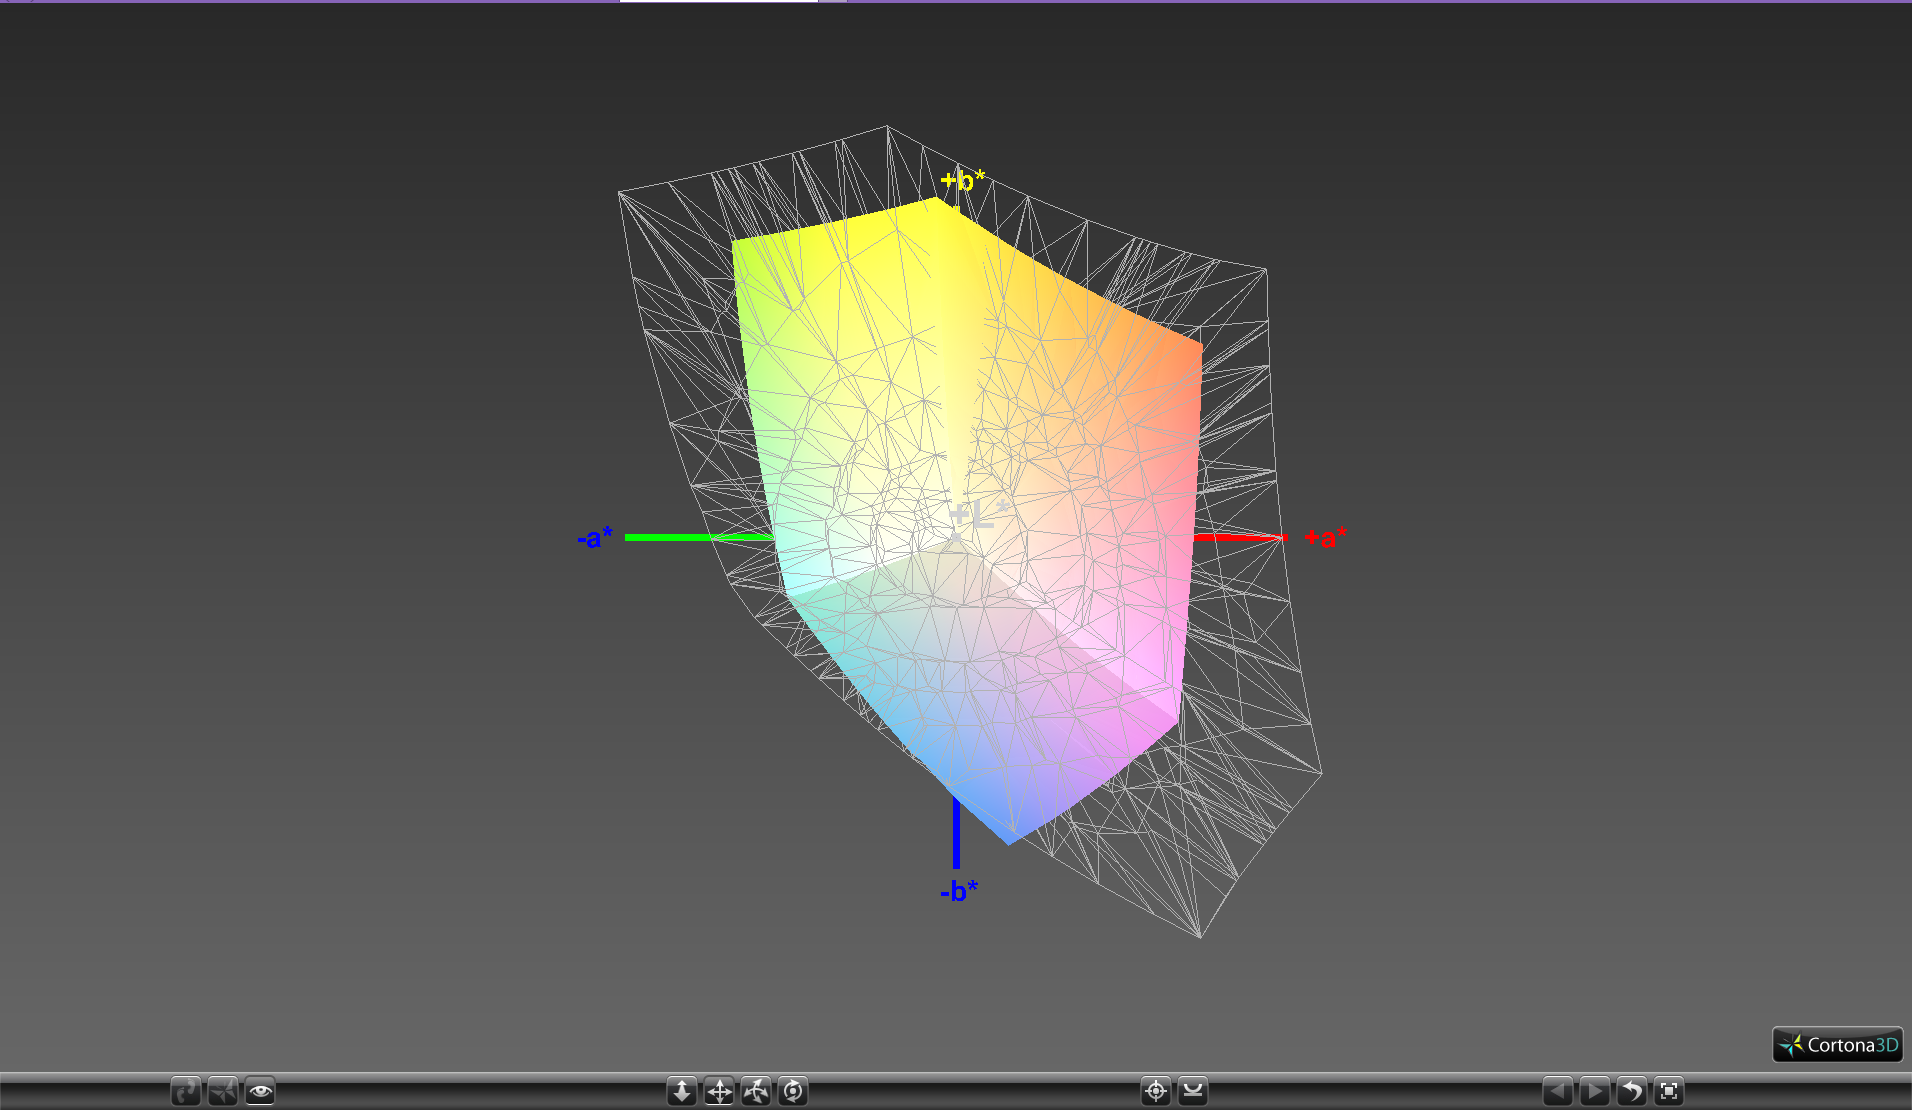
57.9% sRGB (Argyll 1.6.3 3D)
37% AdobeRGB 1998 (Argyll 1.6.3 3D)
40.3% AdobeRGB 1998 (Argyll 3D)
58.2% sRGB (Argyll 3D)
38.97% Display P3 (Argyll 3D)
Gamma: 2.19
CCT: 7852 K
| Gigabyte Sabre 15G ID: LGD0533, Name: LG Display LP156WF6-SPK3, IPS, 15.6", 1920x1080 | Dell XPS 15 9560 (i7-7700HQ, UHD) IGZO IPS, 15.6", 3840x2160 | Gigabyte Aero 15 N156HCA-EA1 (CMN15D7), IPS, 15.6", 1920x1080 | HP Omen 15-ce002ng AUO42ED, IPS, 15.6", 1920x1080 | Samsung Odyssey NP800G5M-X01US IPS, 15.6", 1920x1080 | MSI GT62VR 7RE-223 LG Philips LP156WF6 (LGD046F), IPS, 15.6", 1920x1080 | |
|---|---|---|---|---|---|---|
| Display | 117% | 64% | 63% | 21% | 53% | |
| Display P3 Coverage (%) | 38.97 | 89.7 130% | 65.2 67% | 65.8 69% | 47.11 21% | 63.9 64% |
| sRGB Coverage (%) | 58.2 | 100 72% | 92.5 59% | 90.9 56% | 70.4 21% | 83.1 43% |
| AdobeRGB 1998 Coverage (%) | 40.3 | 100 148% | 66.5 65% | 66.5 65% | 48.71 21% | 60.8 51% |
| Response Times | -66% | -30% | -29% | -26% | -7% | |
| Response Time Grey 50% / Grey 80% * (ms) | 32 ? | 57.2 ? -79% | 42.8 ? -34% | 43.2 ? -35% | 38.8 ? -21% | 37 ? -16% |
| Response Time Black / White * (ms) | 25.6 ? | 39.2 ? -53% | 32 ? -25% | 31.2 ? -22% | 33.6 ? -31% | 25 ? 2% |
| PWM Frequency (Hz) | 20000 ? | 962 | 26000 ? | 19230 ? | ||
| Screen | 43% | 28% | 40% | 2% | 30% | |
| Brightness middle (cd/m²) | 248.4 | 370.1 49% | 320 29% | 304 22% | 255.9 3% | 310 25% |
| Brightness (cd/m²) | 241 | 356 48% | 316 31% | 289 20% | 249 3% | 311 29% |
| Brightness Distribution (%) | 84 | 87 4% | 90 7% | 86 2% | 90 7% | 85 1% |
| Black Level * (cd/m²) | 0.3 | 0.37 -23% | 0.36 -20% | 0.26 13% | 0.48 -60% | 0.3 -0% |
| Contrast (:1) | 828 | 1000 21% | 889 7% | 1169 41% | 533 -36% | 1033 25% |
| Colorchecker dE 2000 * | 7.5 | 5.3 29% | 4.62 38% | 3.46 54% | 5.9 21% | 4.82 36% |
| Colorchecker dE 2000 max. * | 25.2 | 9.9 61% | 9.75 61% | 7.72 69% | 18.9 25% | 10.14 60% |
| Greyscale dE 2000 * | 6.5 | 4.6 29% | 6 8% | 2.46 62% | 5.6 14% | 3.94 39% |
| Gamma | 2.19 100% | 2.31 95% | 2.46 89% | 2.38 92% | 2.21 100% | 2.45 90% |
| CCT | 7852 83% | 6284 103% | 6761 96% | 6915 94% | 7250 90% | 6877 95% |
| Color Space (Percent of AdobeRGB 1998) (%) | 37 | 88.3 139% | 60 62% | 59 59% | 44.8 21% | 54 46% |
| Color Space (Percent of sRGB) (%) | 57.9 | 100 73% | 92 59% | 91 57% | 70.1 21% | 83 43% |
| Total Average (Program / Settings) | 31% /
43% | 21% /
28% | 25% /
35% | -1% /
2% | 25% /
30% |
* ... smaller is better
Color coverage is underwhelming for a gaming notebook at just 37 percent and 58 percent of the AdobeRGB and sRGB standards, respectively. Competing systems such as the Omen 15 and Samsung Odyssey cover more of the sRGB space with some notebooks offering full coverage like the XPS 15 9560 and Razer Blade. Professional graphics artists may want to avoid working on the Sabre 15 and consider the Aero 15 instead if accurate colors are of utmost concern.
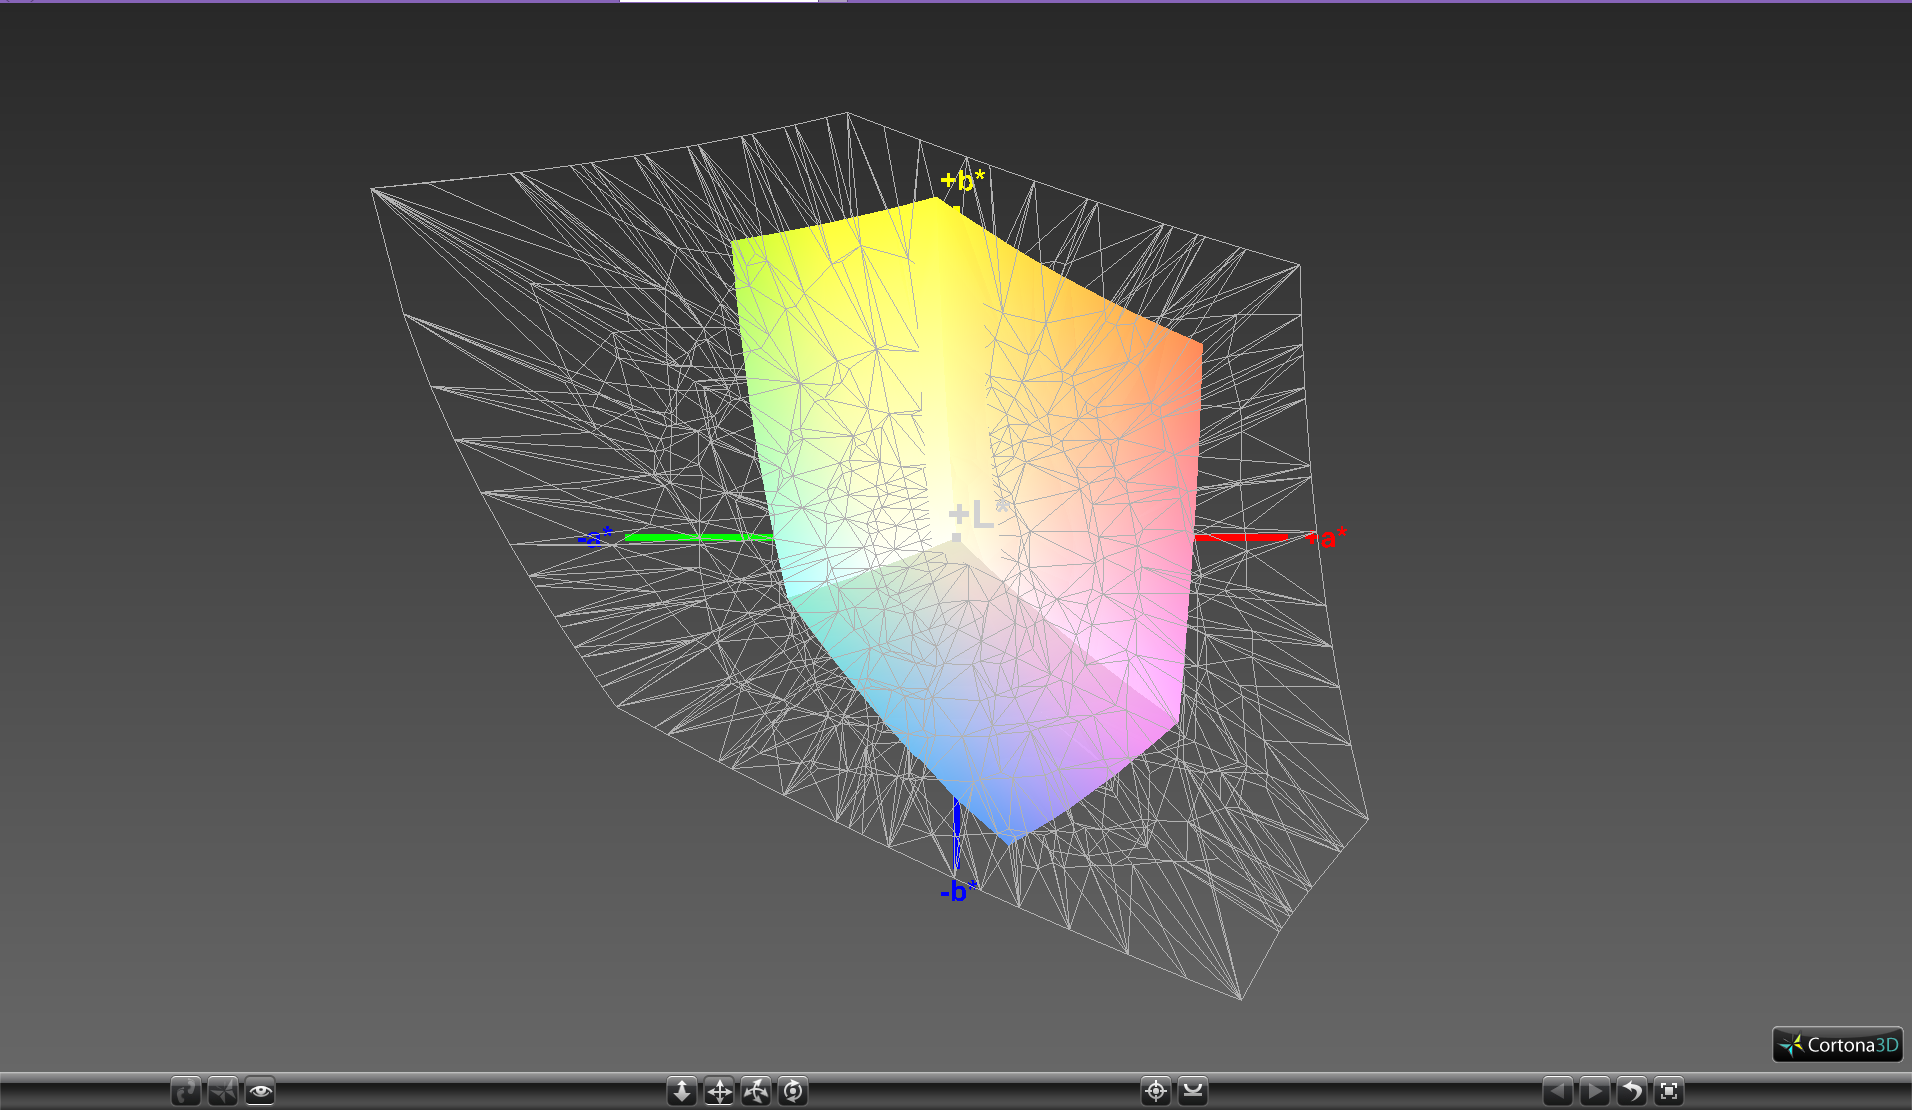
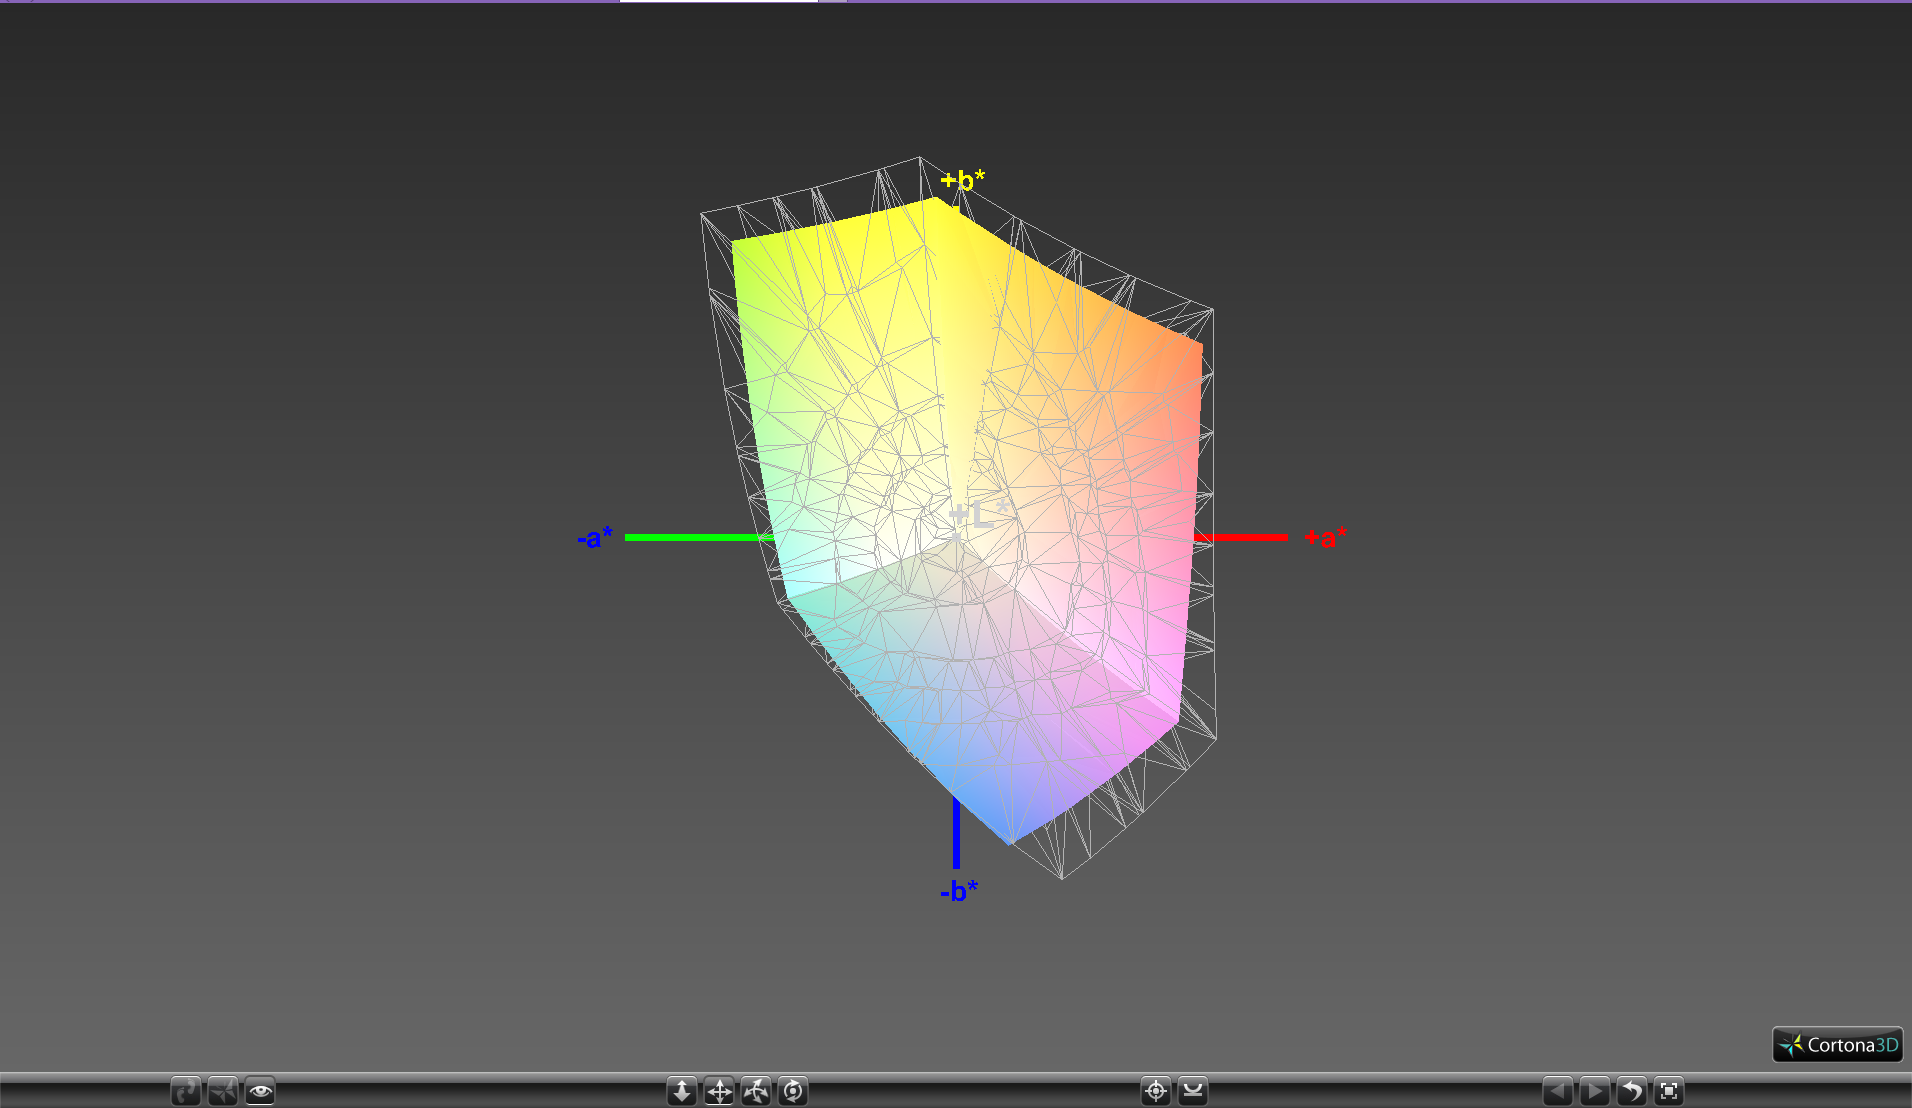
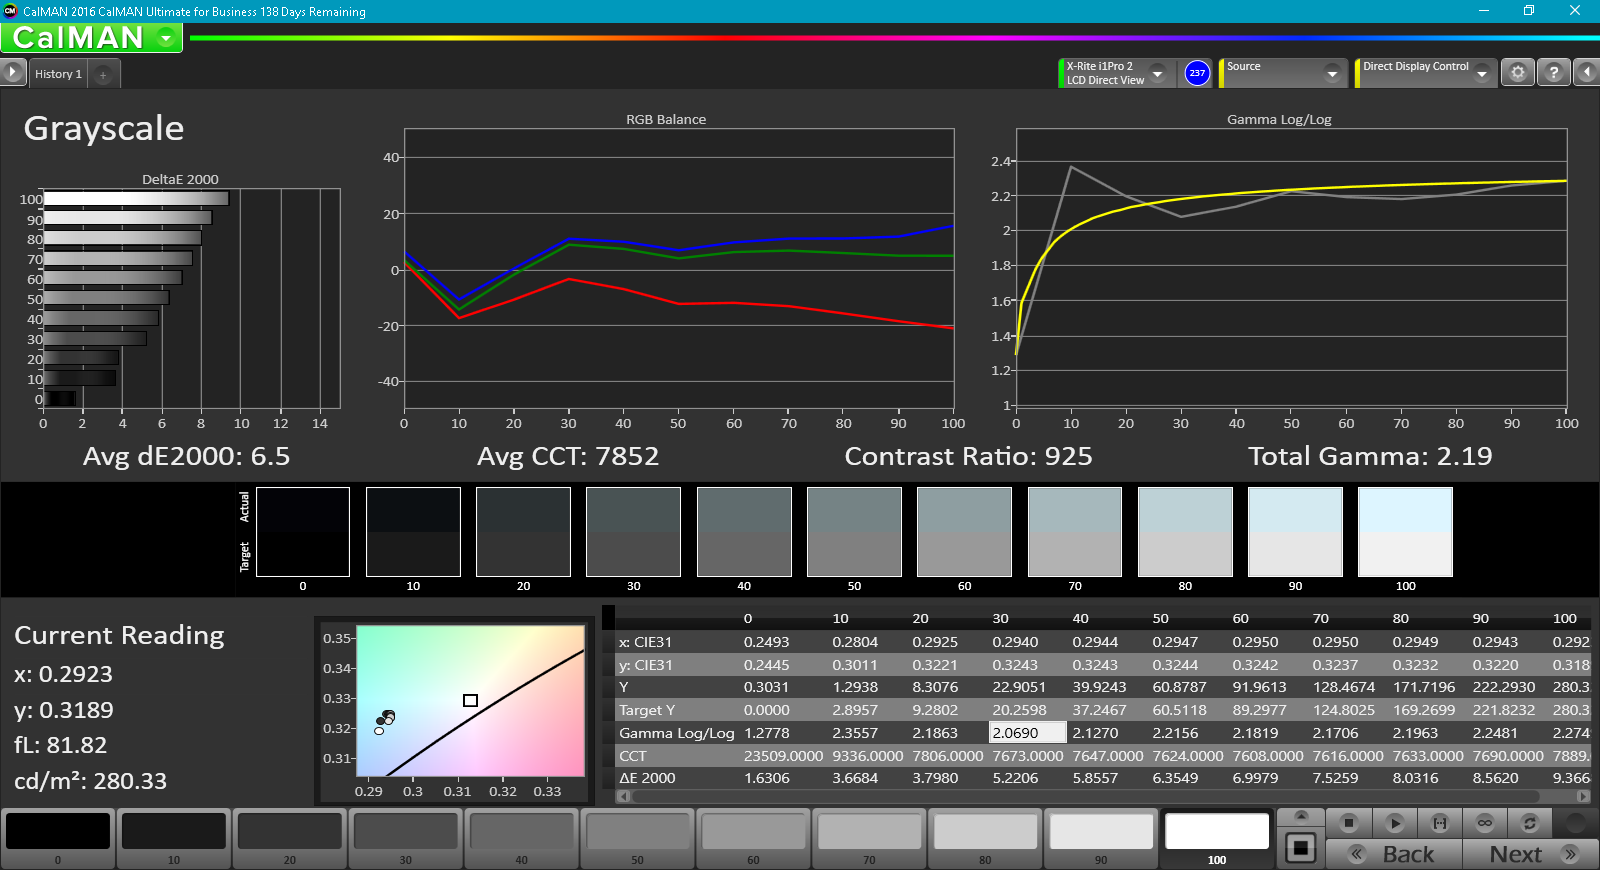
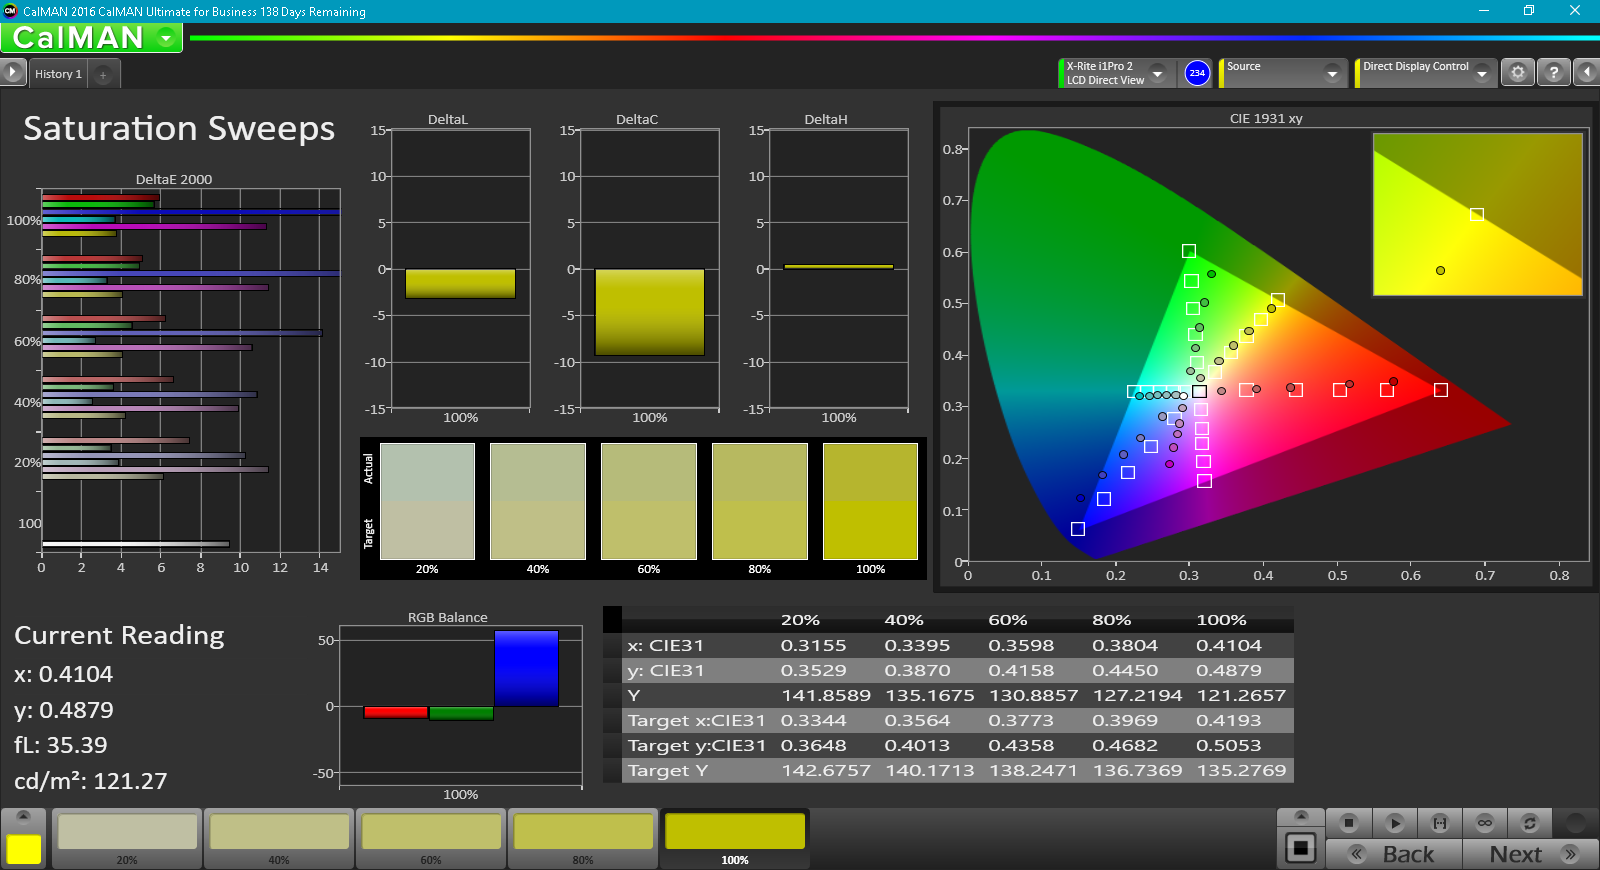
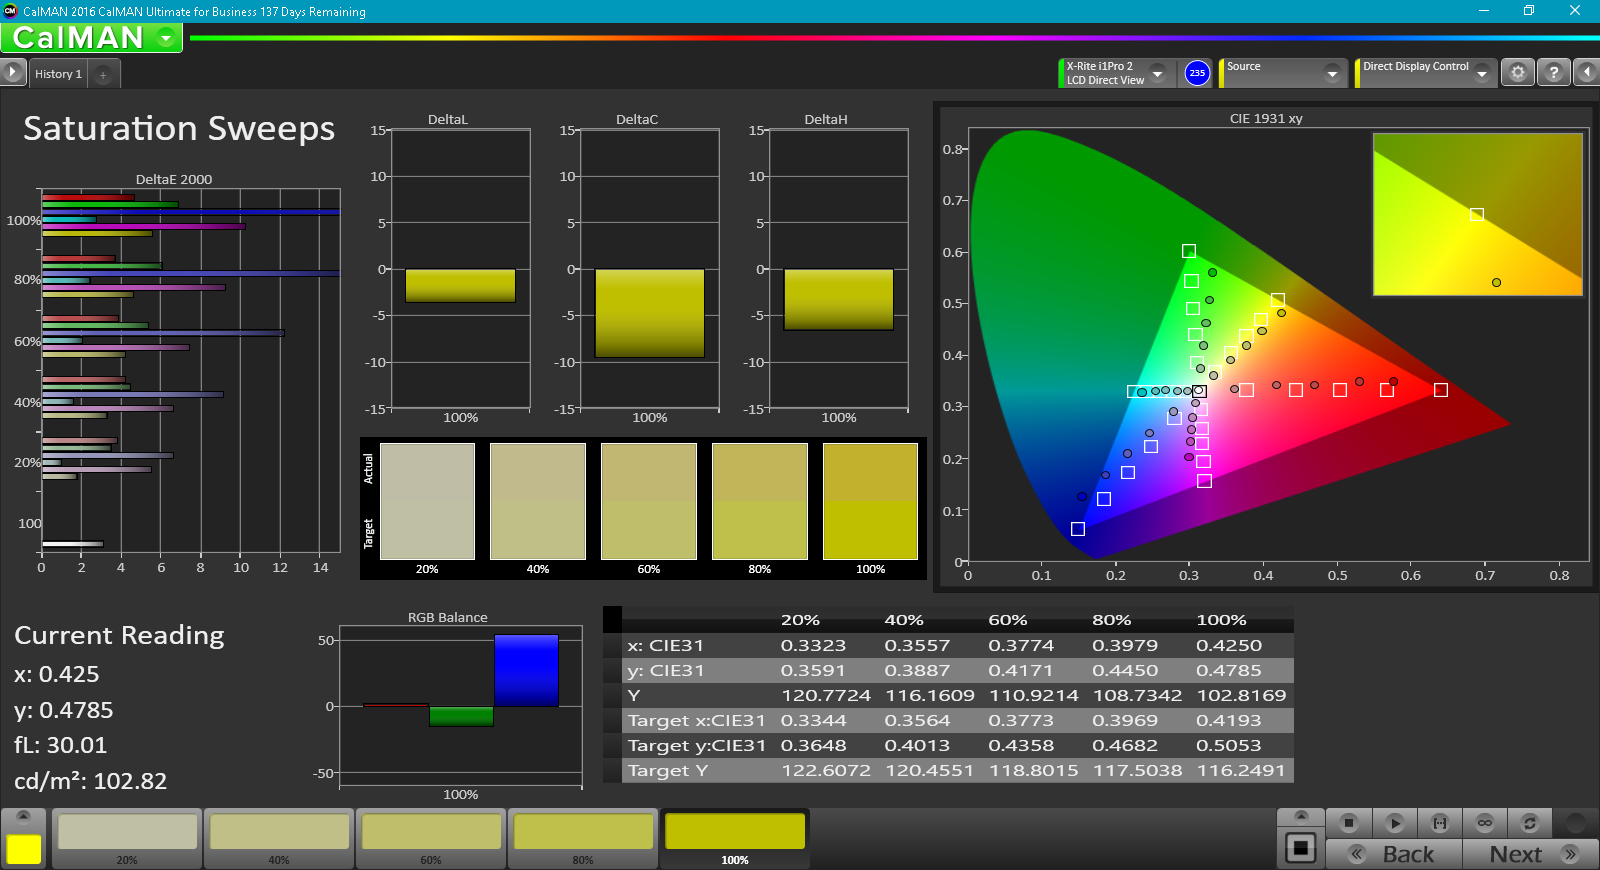
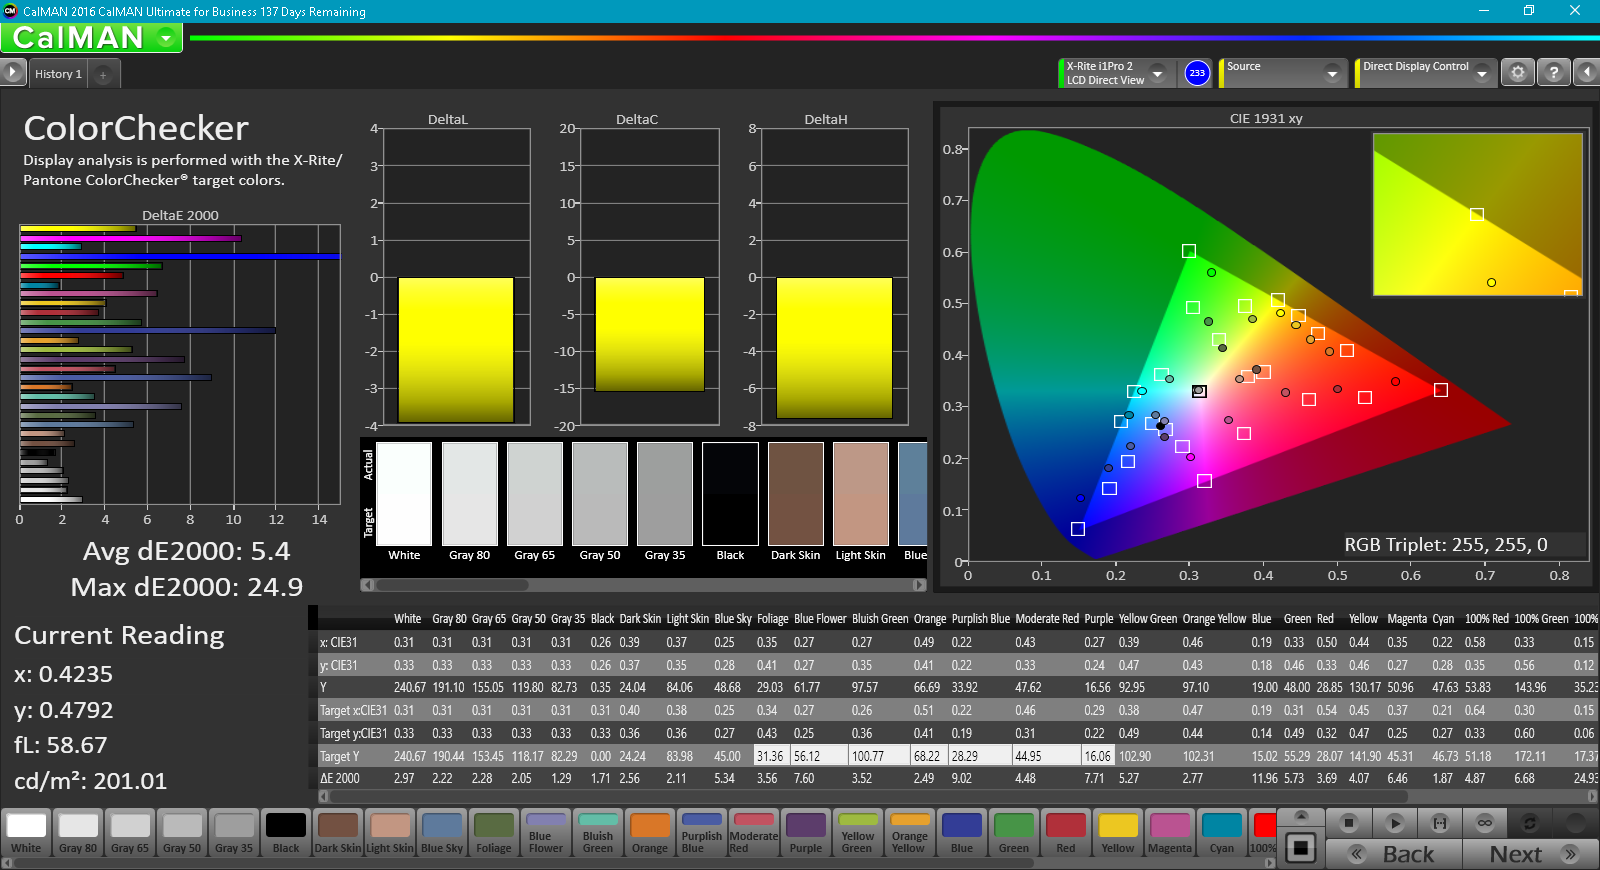
Further measurements with an X-Rite spectrophotometer reveal generally inaccurate grayscale and colors out of the box with an overly cool color temperature. Our calibration efforts drastically improve grayscale and colors in lower saturation levels as shown by our CalMAN data below. Colors still become increasingly inaccurate at higher saturation levels because of the limited gamut of the panel. Blue and Magenta colors in particular are not represented as accurately as others.
Display Response Times
| ↔ Response Time Black to White | ||
|---|---|---|
| 25.6 ms ... rise ↗ and fall ↘ combined | ↗ 15.6 ms rise | 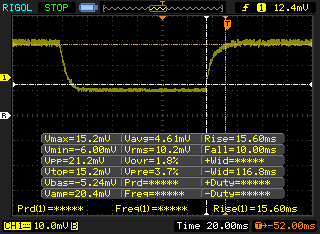 |
| ↘ 10 ms fall | ||
| The screen shows relatively slow response rates in our tests and may be too slow for gamers. In comparison, all tested devices range from 0.1 (minimum) to 240 (maximum) ms. » 60 % of all devices are better. This means that the measured response time is worse than the average of all tested devices (20.2 ms). | ||
| ↔ Response Time 50% Grey to 80% Grey | ||
| 32 ms ... rise ↗ and fall ↘ combined | ↗ 16.4 ms rise | 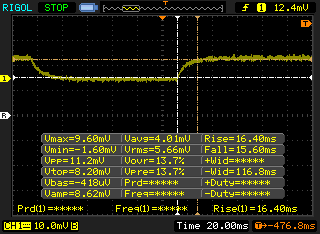 |
| ↘ 15.6 ms fall | ||
| The screen shows slow response rates in our tests and will be unsatisfactory for gamers. In comparison, all tested devices range from 0.165 (minimum) to 636 (maximum) ms. » 42 % of all devices are better. This means that the measured response time is similar to the average of all tested devices (31.6 ms). | ||
Screen Flickering / PWM (Pulse-Width Modulation)
| Screen flickering / PWM detected | 20000 Hz | ≤ 99 % brightness setting | 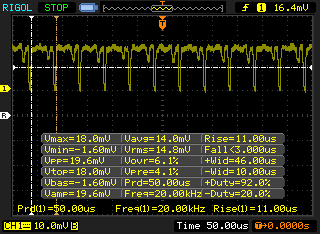 |
The display backlight flickers at 20000 Hz (worst case, e.g., utilizing PWM) Flickering detected at a brightness setting of 99 % and below. There should be no flickering or PWM above this brightness setting. The frequency of 20000 Hz is quite high, so most users sensitive to PWM should not notice any flickering. In comparison: 53 % of all tested devices do not use PWM to dim the display. If PWM was detected, an average of 8111 (minimum: 5 - maximum: 343500) Hz was measured. | |||
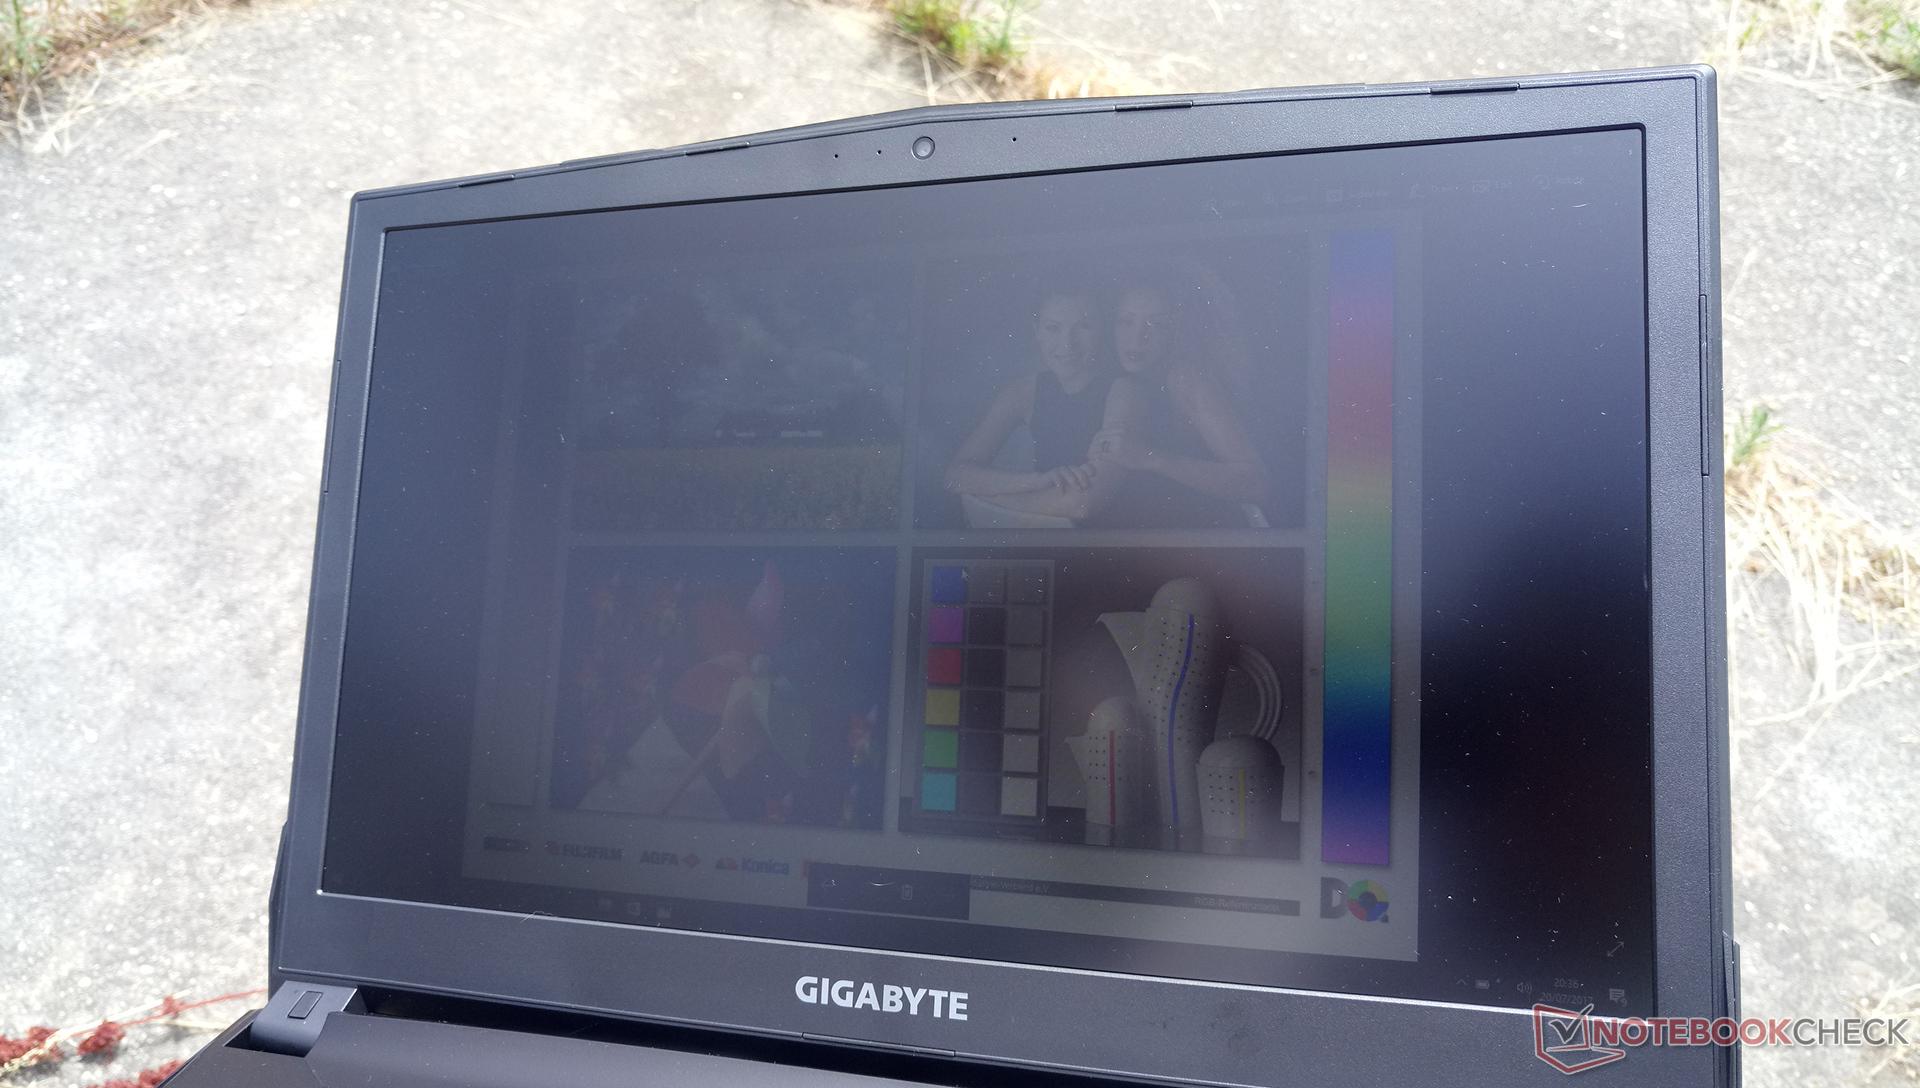
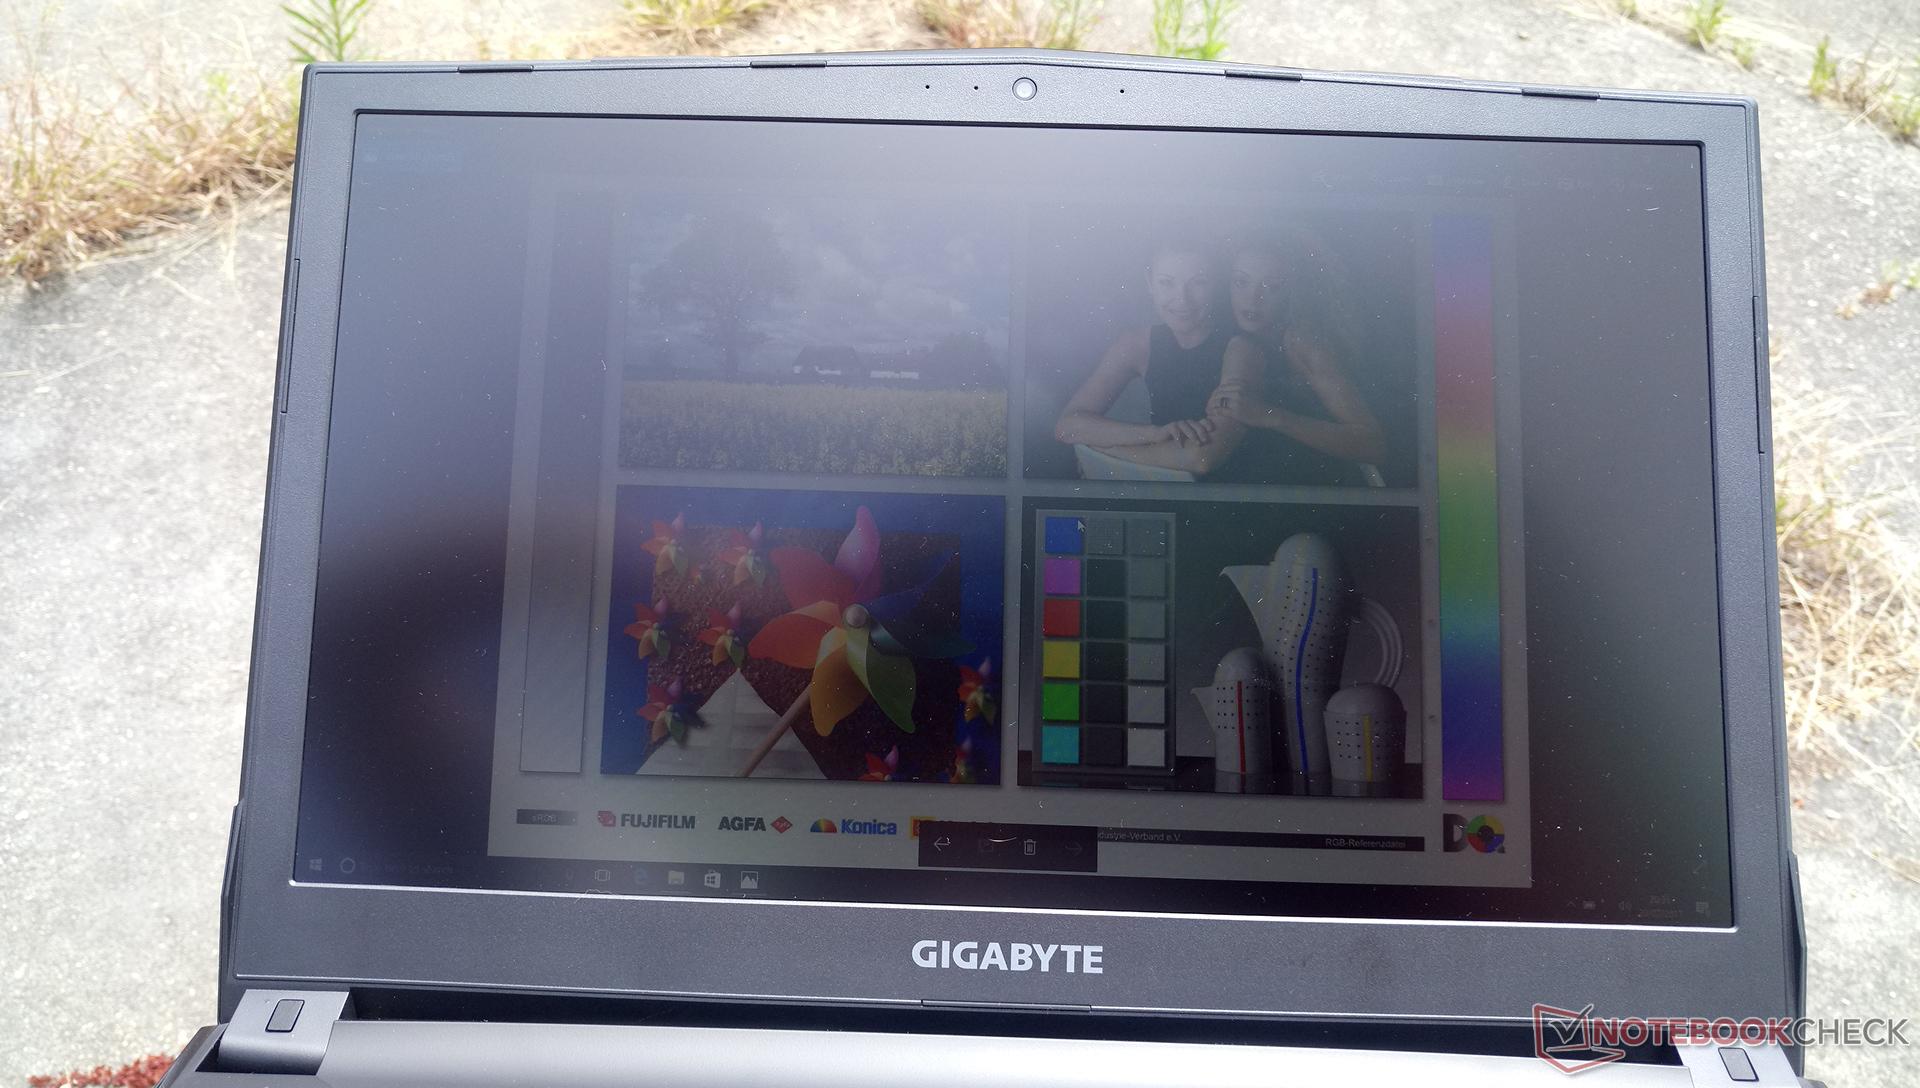
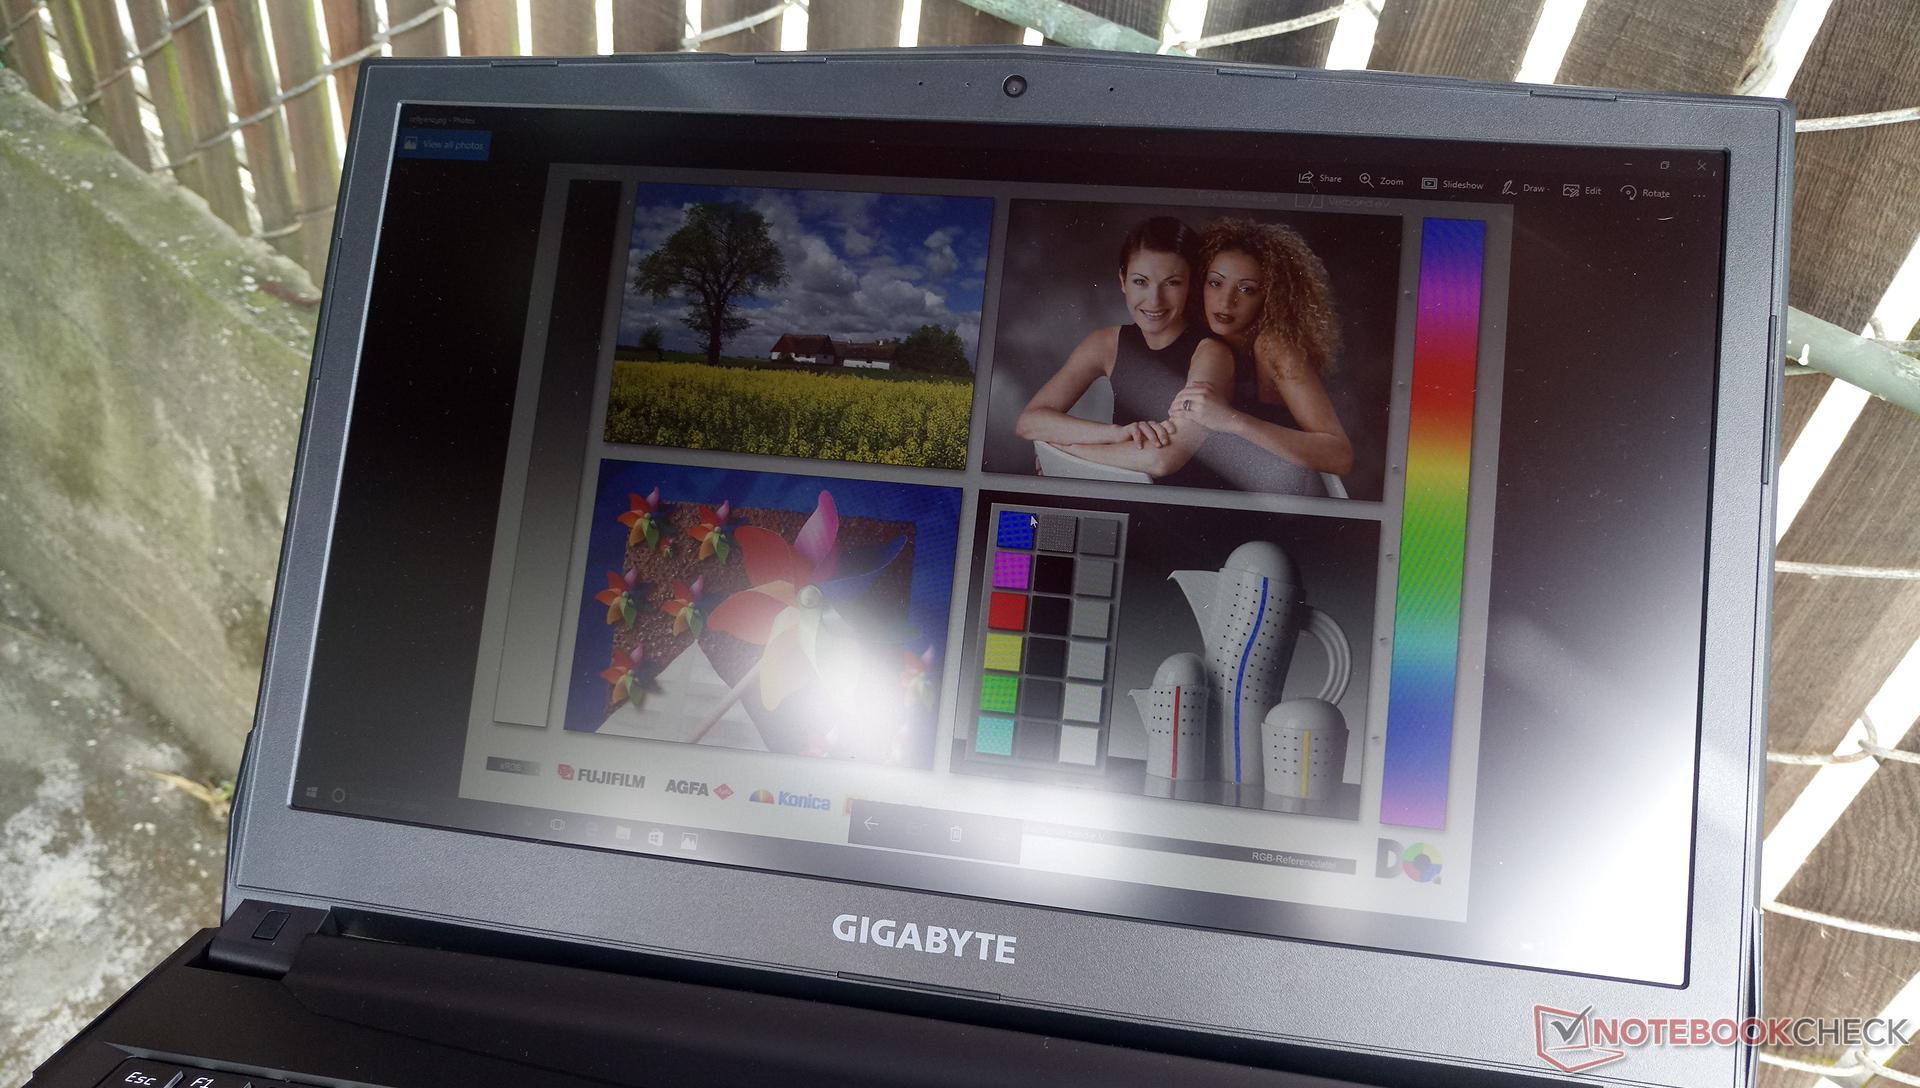
Outdoor visibility is below average due to the insufficient backlight. Colors and contrast become washed out even when under shade despite the glare-free matte panel and wide IPS viewing angles. The Sabre 15 was not designed for extended outdoor use.
Performance
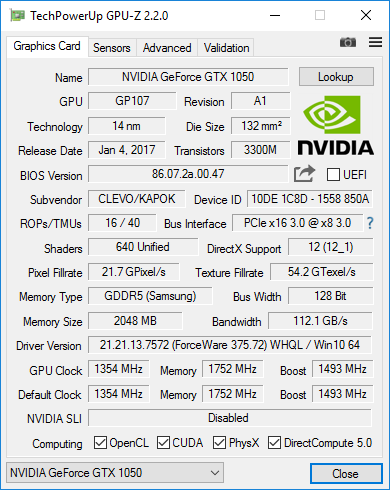
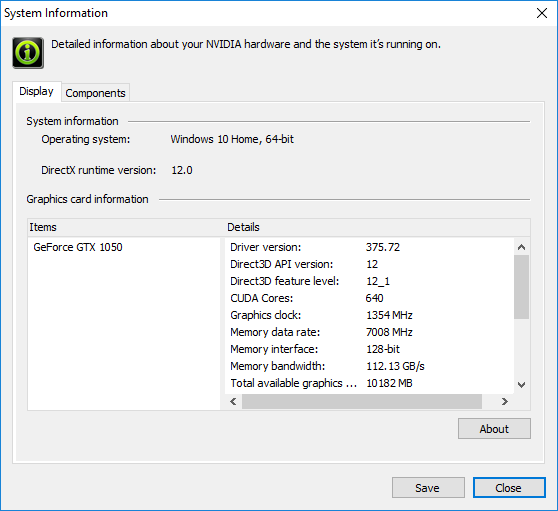
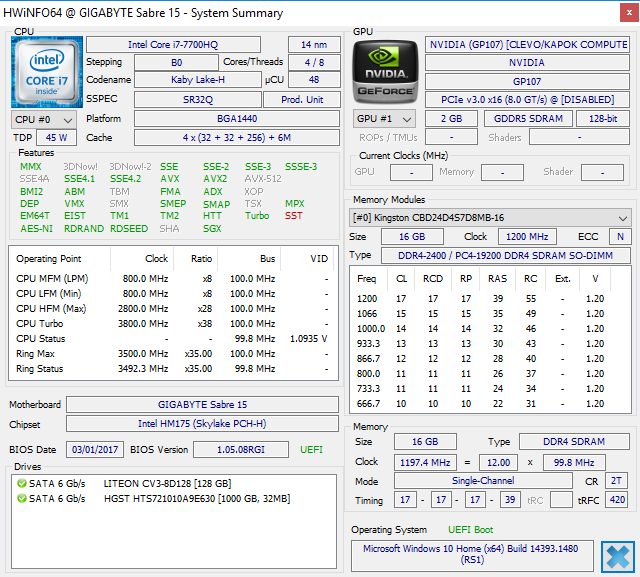
The system comes fixed with the very common i7-7700HQ CPU and FHD IPS display. SKU options include the GTX 1050 with 2 GB of VRAM or GTX 1050 Ti with 4 GB of VRAM. It's a bit disappointing to see no GTX 1050 with 4 GB of VRAM like on the Inspiron 15 7000 Gaming, but the halved capacity is generally unnoticeable in practice for most games at the native 1080p resolution. Optimus comes standard with power-saving features and automatic graphics switching.
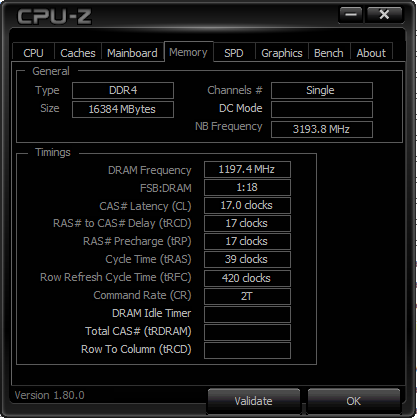
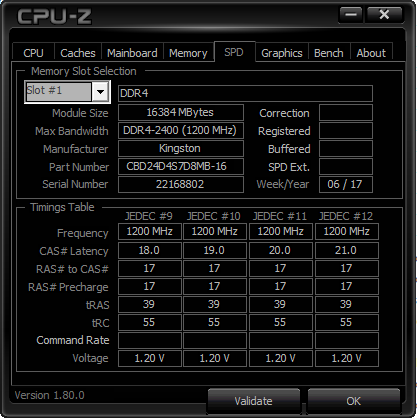
Another aspect of our specific configuration is the 16 GB of single-channel DDR4 RAM. This is uncommon on gaming notebooks where dual-channel offerings are essentially the norm. Nonetheless, users can always purchase a second DDR4 SODIMM module for dual-channel performance if desired.
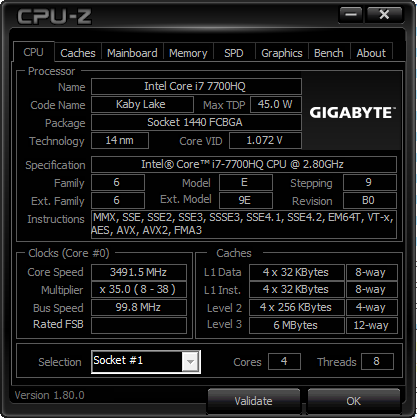
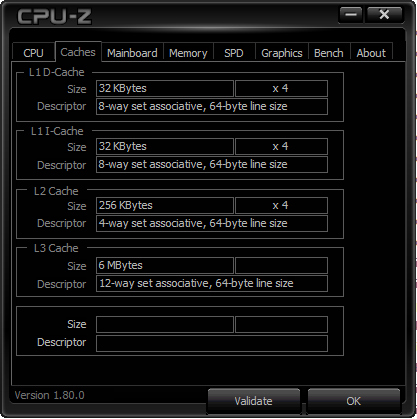
Processor
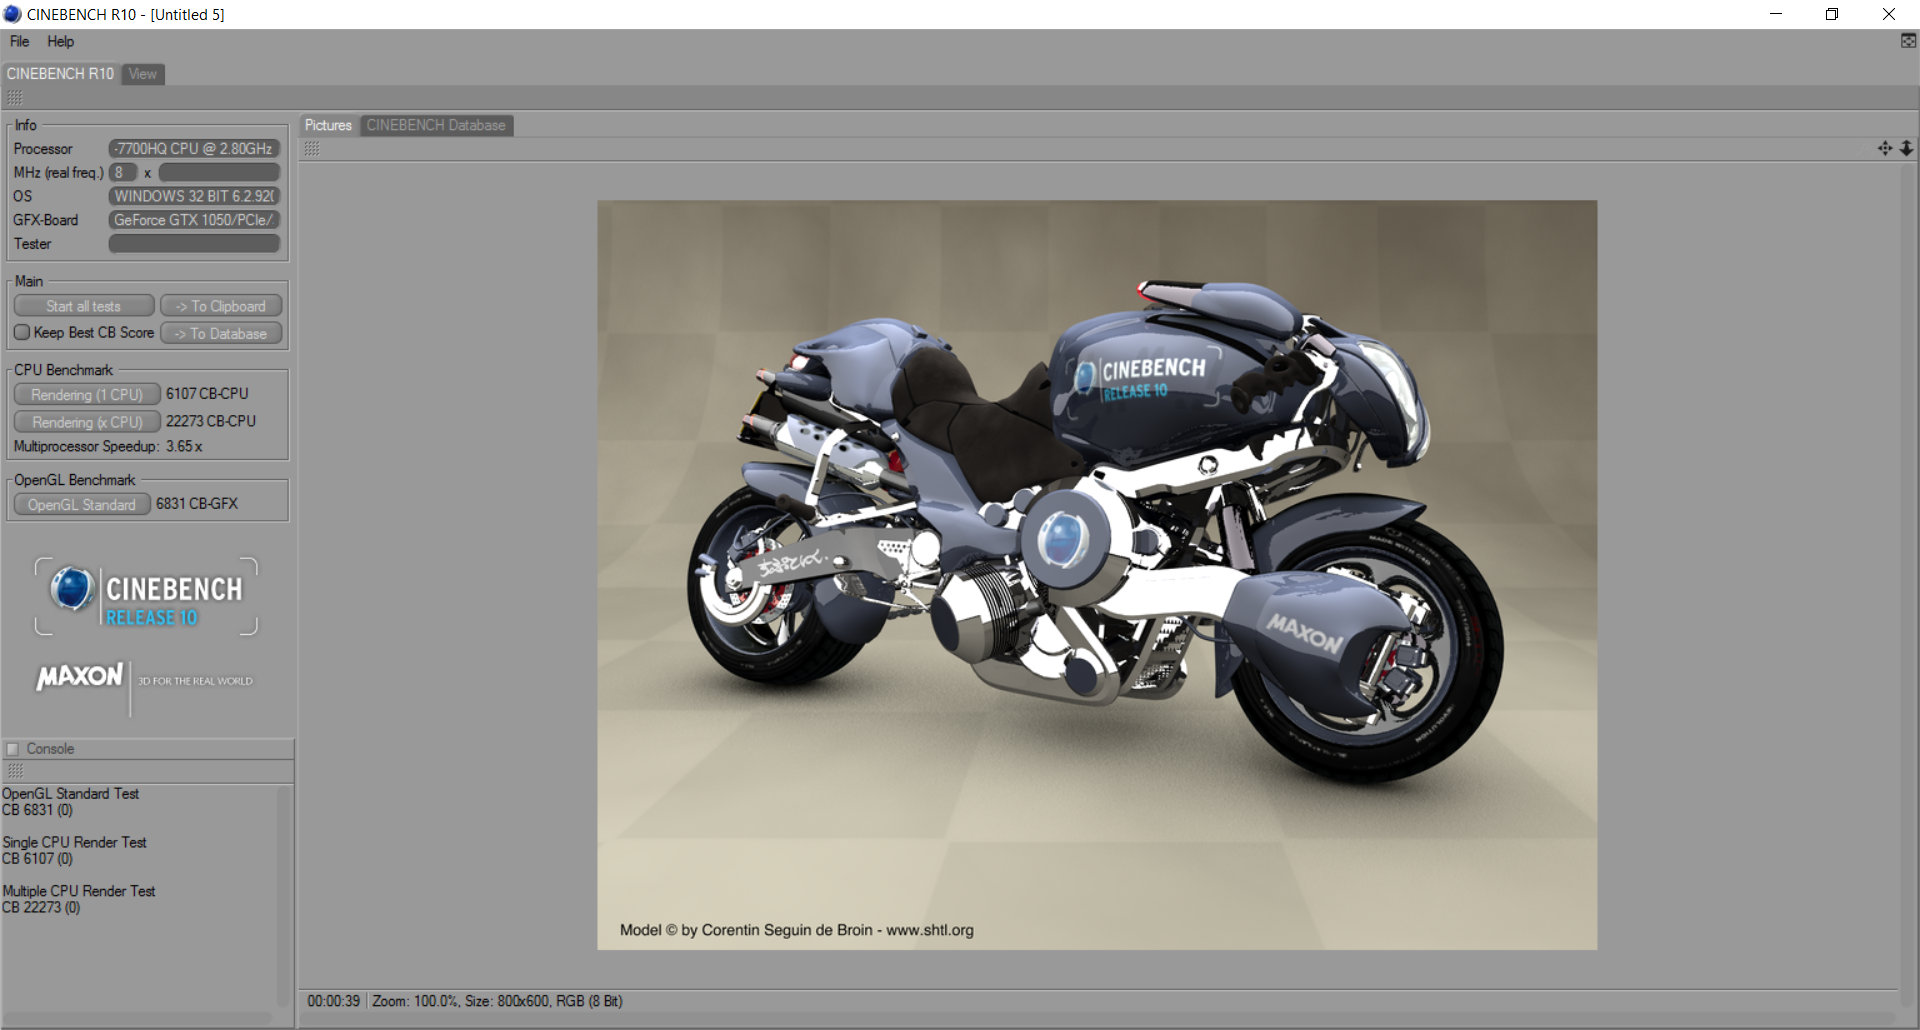
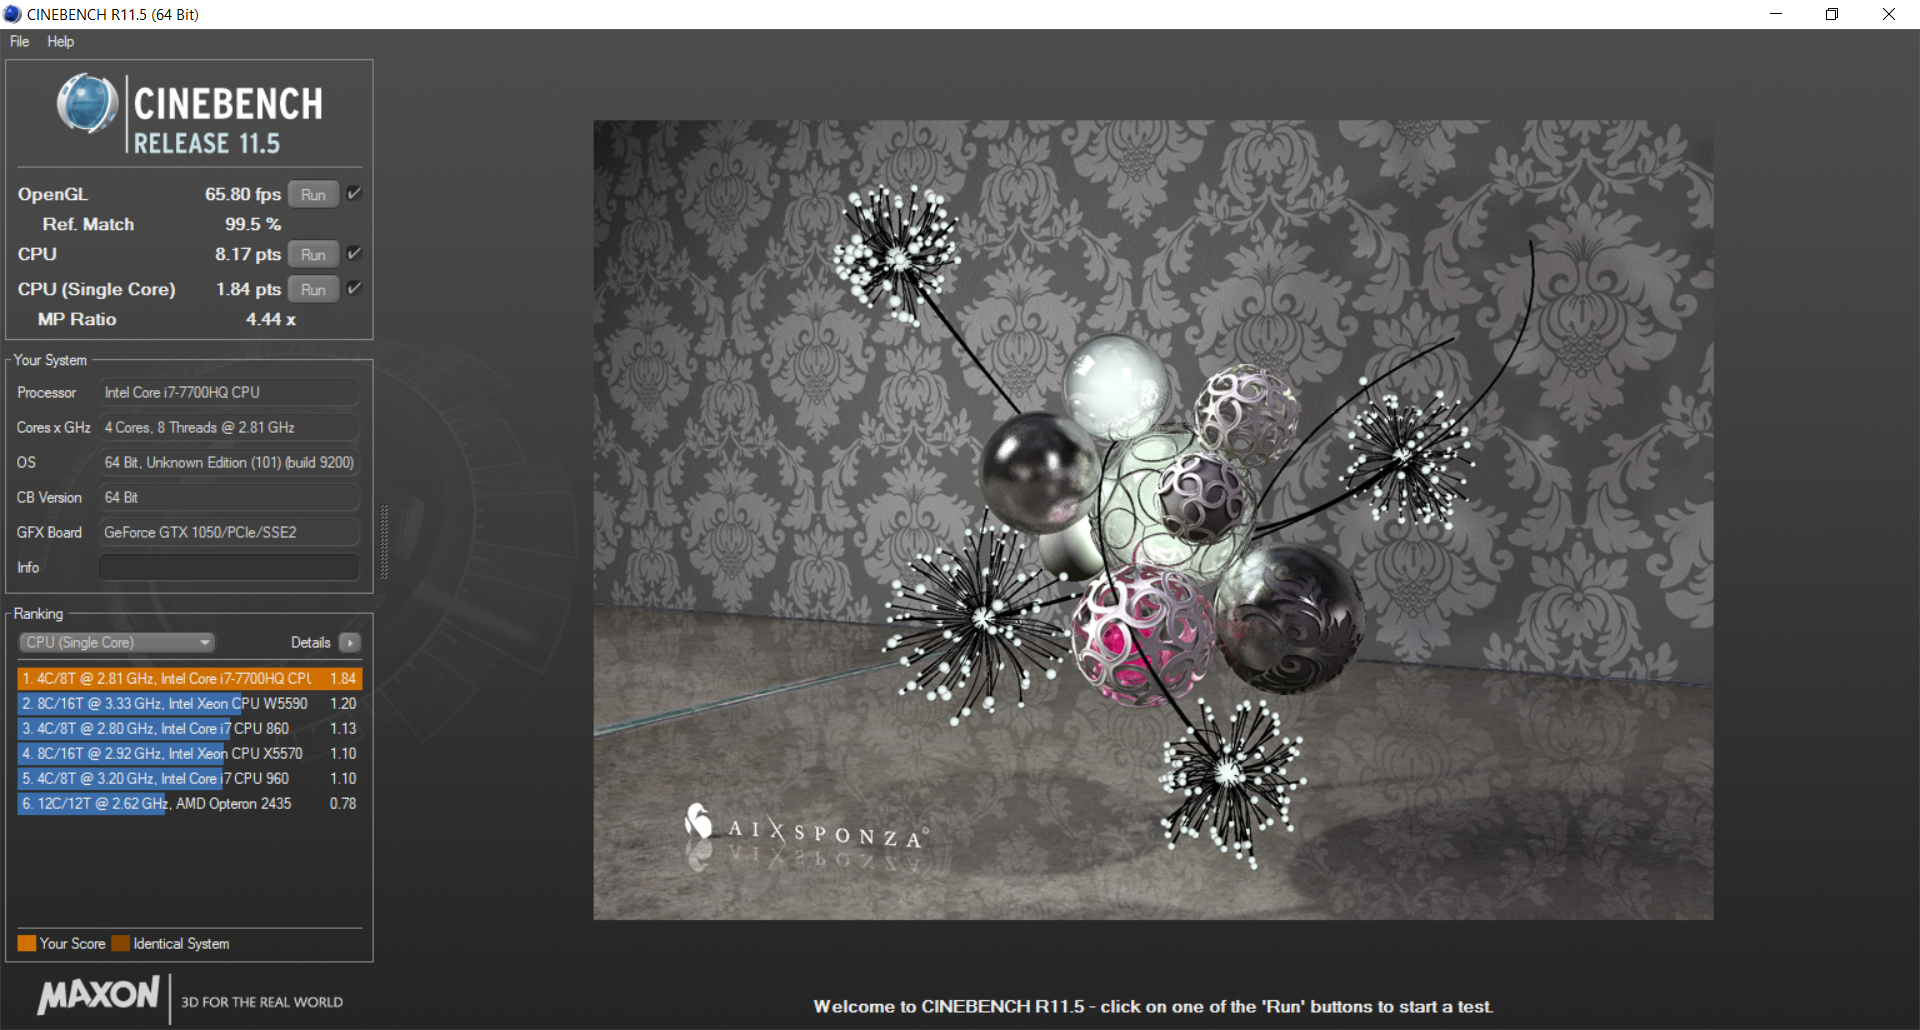
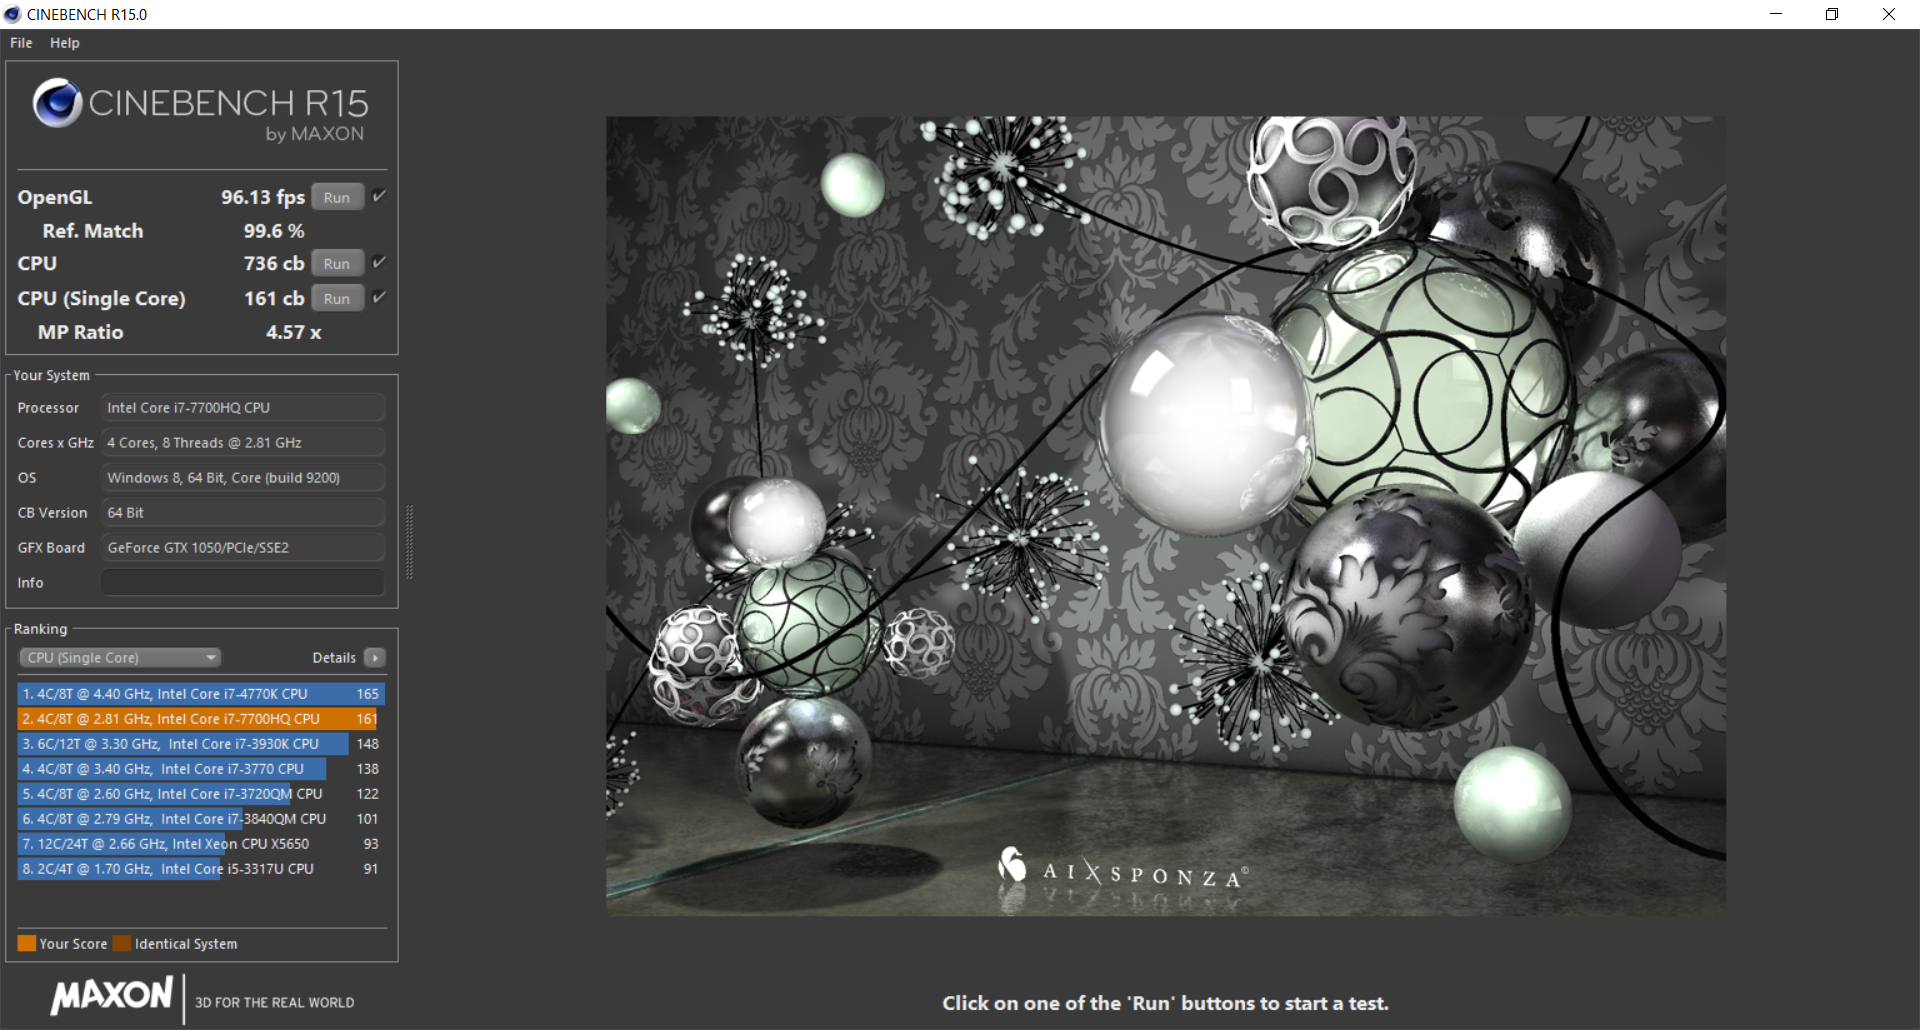
CPU performance from the Core i7-7700HQ is in line with other notebooks sporting the same processor. Our CineBench results below show it to be one the fastest consumer-class mobile processors available with just marginal upticks from the older Skylake i7-6700HQ and Broadwell i7-5700HQ.
Performance sustainability is where the Sabre 15 falters. While the initial score of 736 points in CineBench R15 Multi-Thread is promising, this can fall to as low as 672 points after the fourth or fifth loop. The 9 to 10 percent dip in performance echos what we observed on the MSI GS73VR a few months back and is a rather disappointing sight to see on a gaming notebooks. In comparison, the Samsung Odyssey is able to maintain a CineBench R15 Multi-Thread score of about 732 points throughout our same loop test.
See our dedicated CPU page on the i7-7700HQ for more technical information and benchmarks.
| wPrime 2.10 - 1024m | |
| Lenovo IdeaPad Y50 | |
| Gigabyte Sabre 15G | |
| Eurocom Sky MX5 R3 | |
| Gigabyte P55 V4 | |
| Eurocom Tornado F5 | |
* ... smaller is better
System Performance
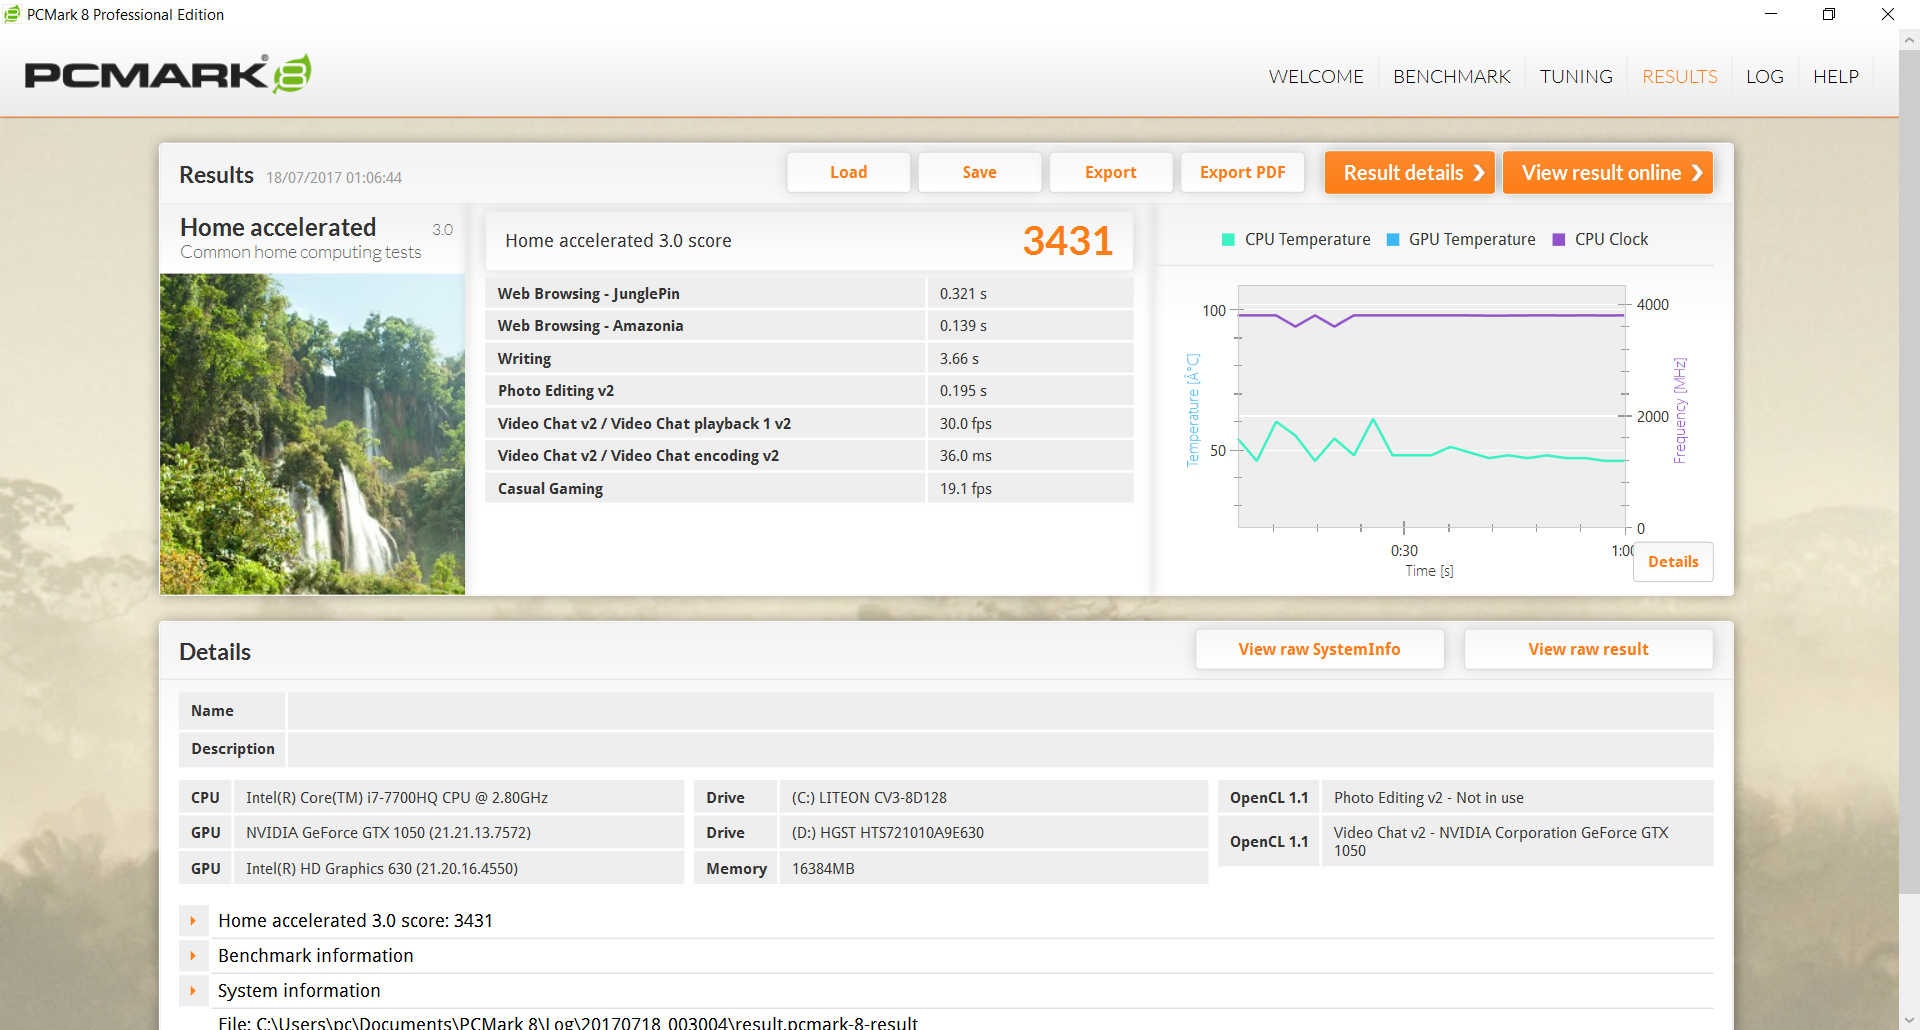
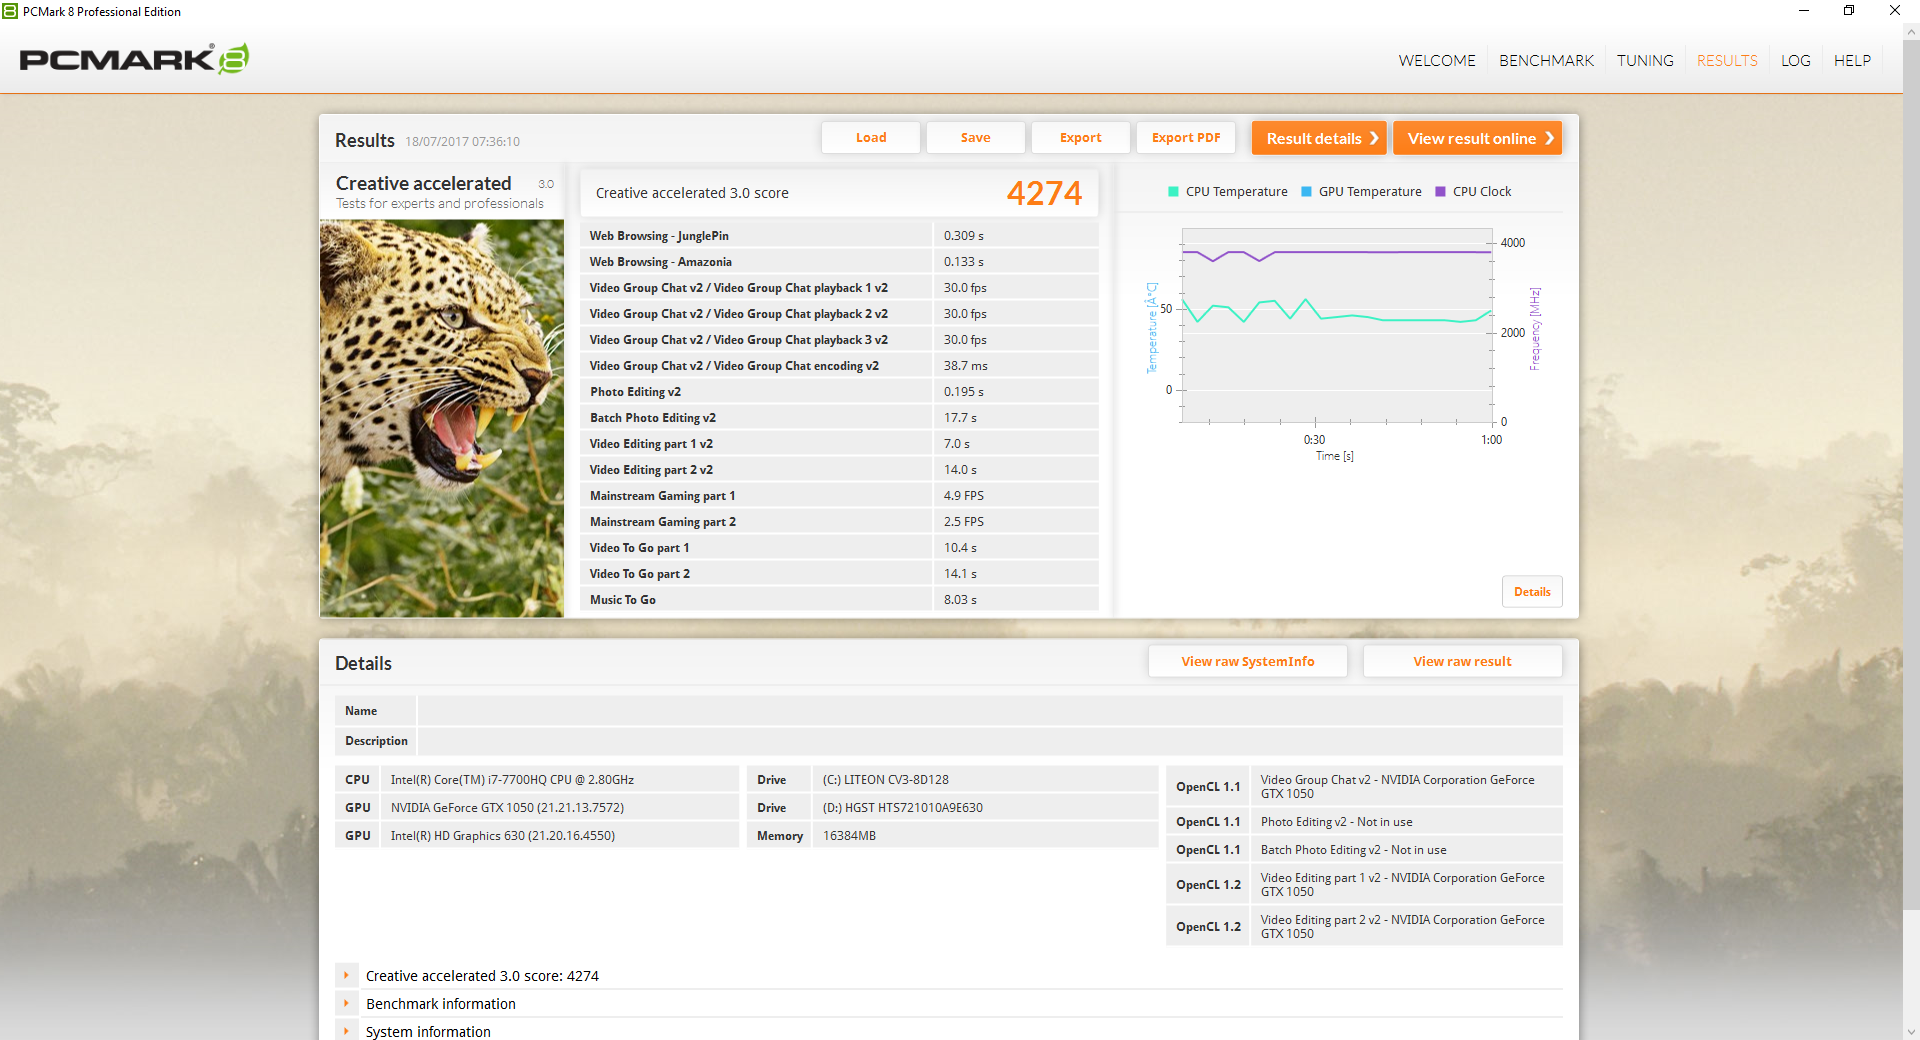
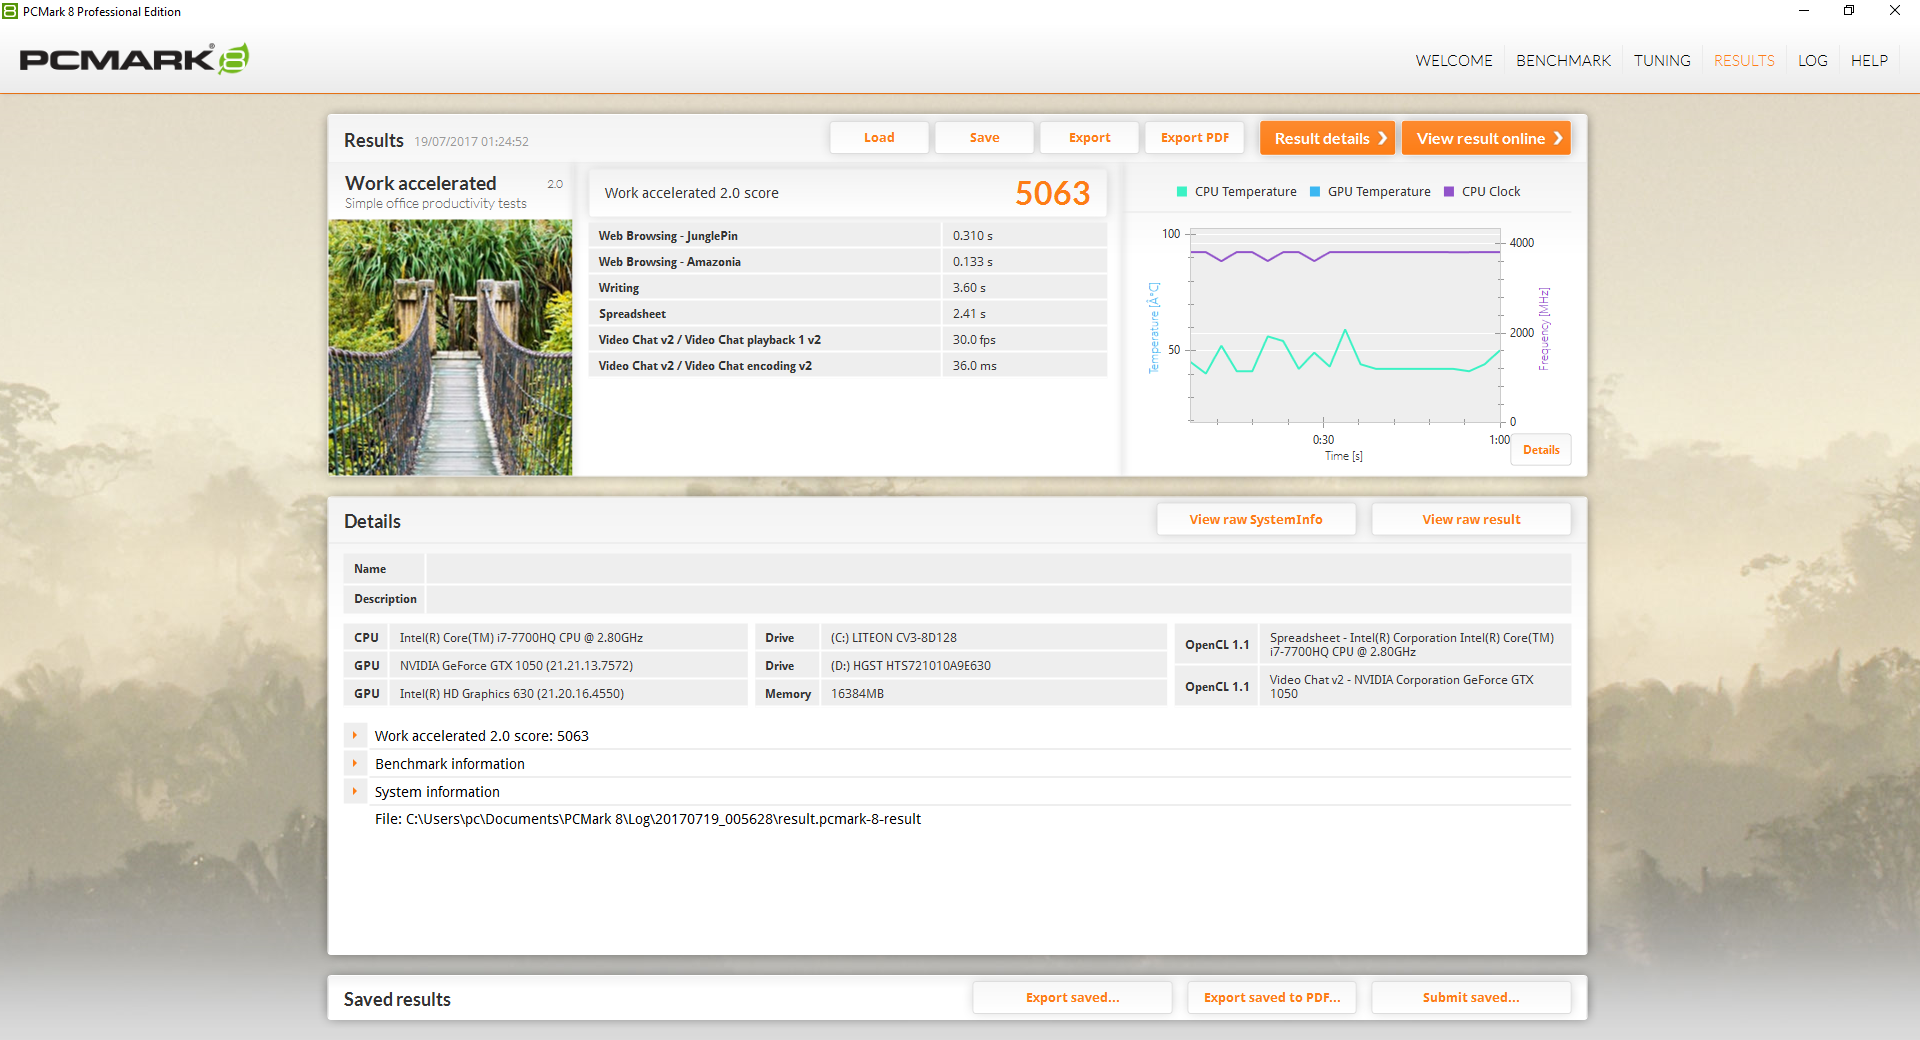
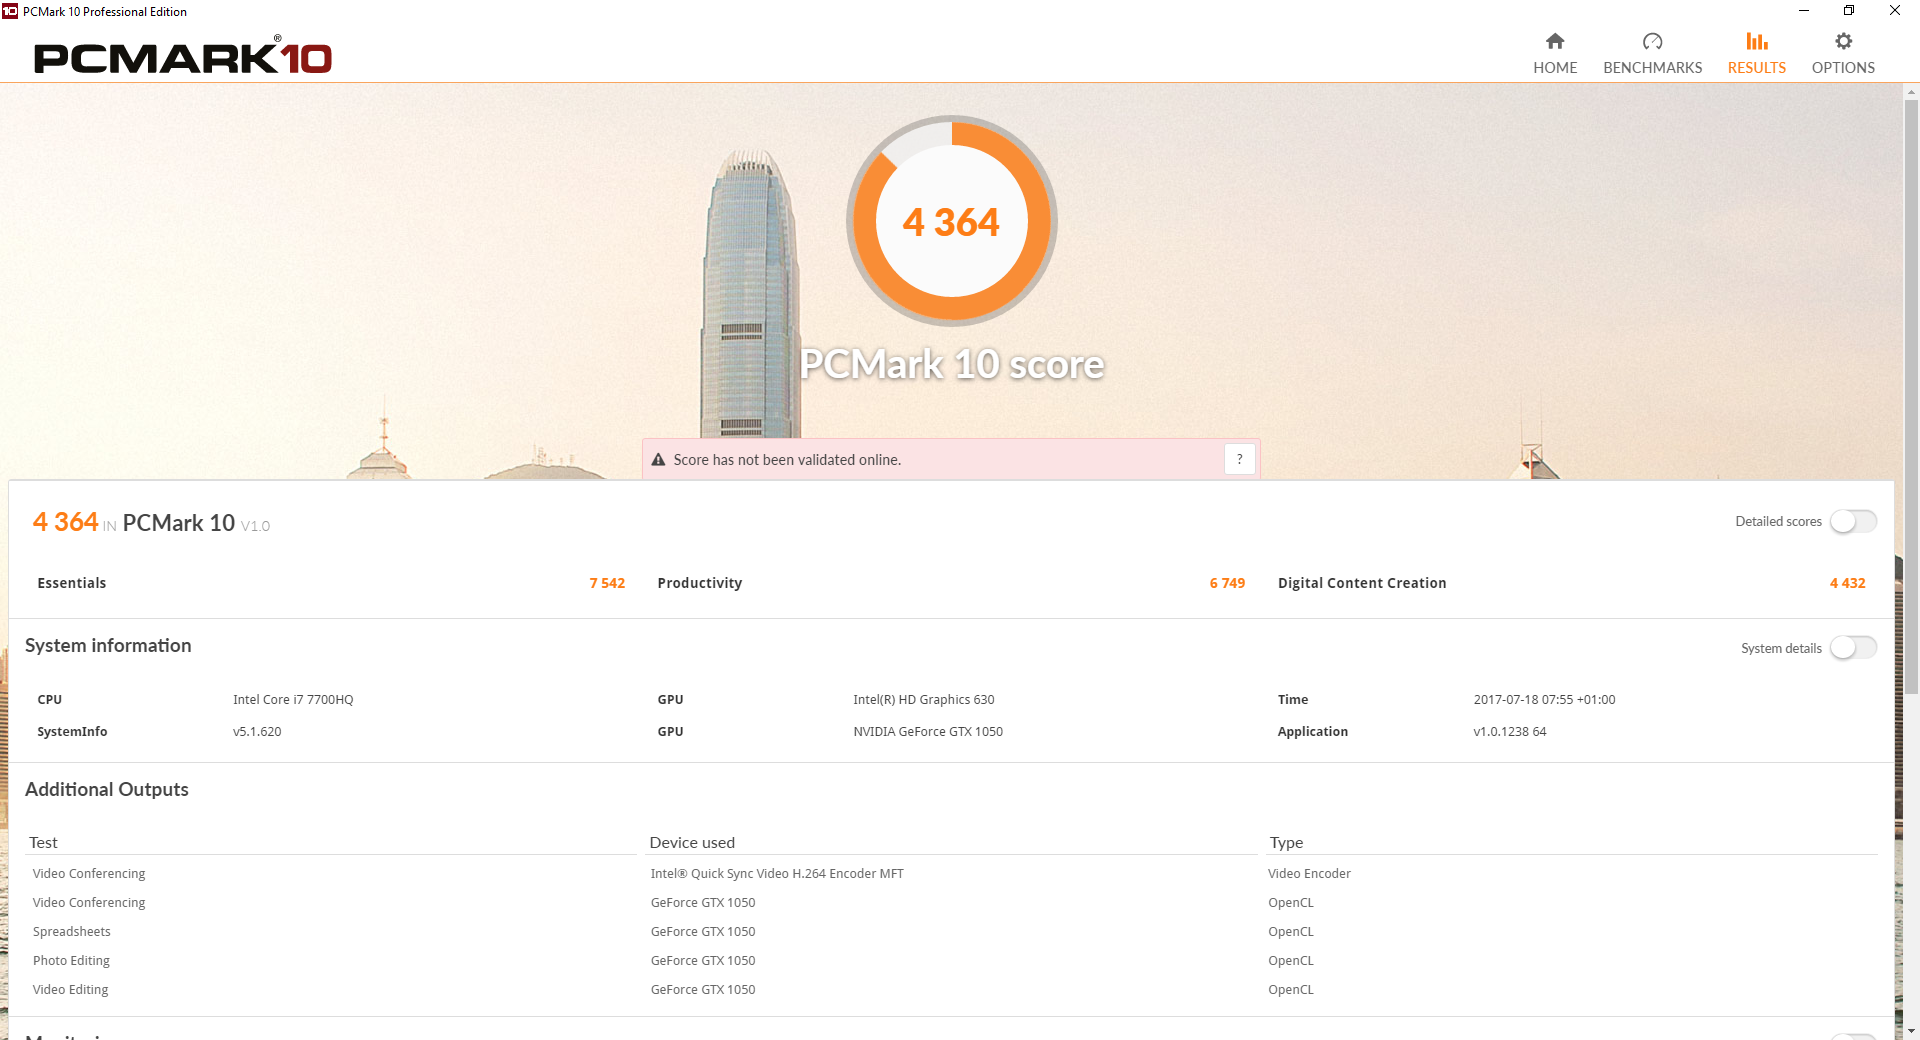
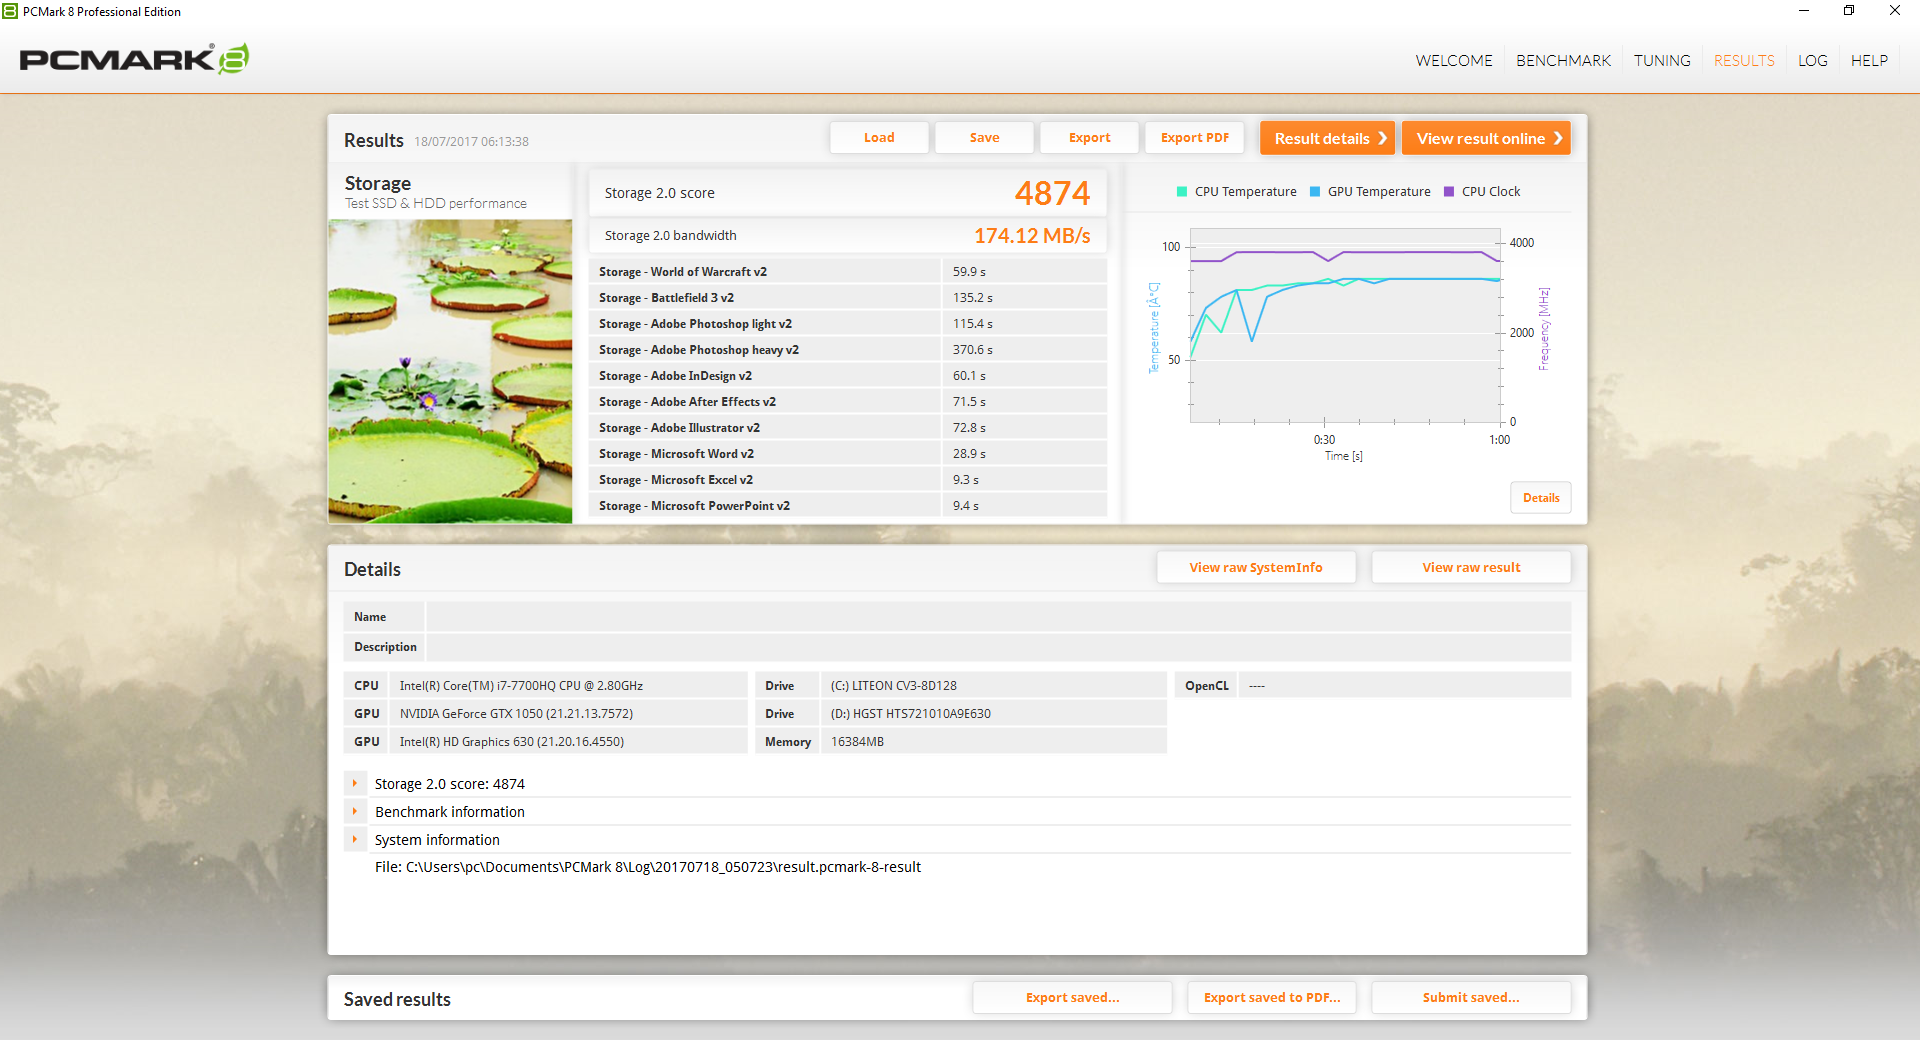
PCMark results are generally lower than other gaming notebooks with primary NVMe SSDs. Subjectively, however, the system feels just as snappy and responsive to use.
We experienced three fatal onscreen freezes requiring reboots with no BSOD errors during our time with the test unit. We were unable to reliably repeat them, however.
| PCMark 8 | |
| Home Score Accelerated v2 | |
| Eurocom Sky MX5 R3 | |
| Gigabyte Aero 15 | |
| Samsung Odyssey NP800G5M-X01US | |
| Dell XPS 15 9560 (i7-7700HQ, UHD) | |
| Gigabyte Sabre 15G | |
| Work Score Accelerated v2 | |
| Samsung Odyssey NP800G5M-X01US | |
| Gigabyte Aero 15 | |
| Eurocom Sky MX5 R3 | |
| Gigabyte Sabre 15G | |
| Dell XPS 15 9560 (i7-7700HQ, UHD) | |
| Creative Score Accelerated v2 | |
| Eurocom Sky MX5 R3 | |
| Samsung Odyssey NP800G5M-X01US | |
| Dell XPS 15 9560 (i7-7700HQ, UHD) | |
| Gigabyte Sabre 15G | |
| PCMark 8 Home Score Accelerated v2 | 3431 points | |
| PCMark 8 Creative Score Accelerated v2 | 4274 points | |
| PCMark 8 Work Score Accelerated v2 | 5063 points | |
| PCMark 10 Score | 4364 points | |
Help | ||
Storage Devices
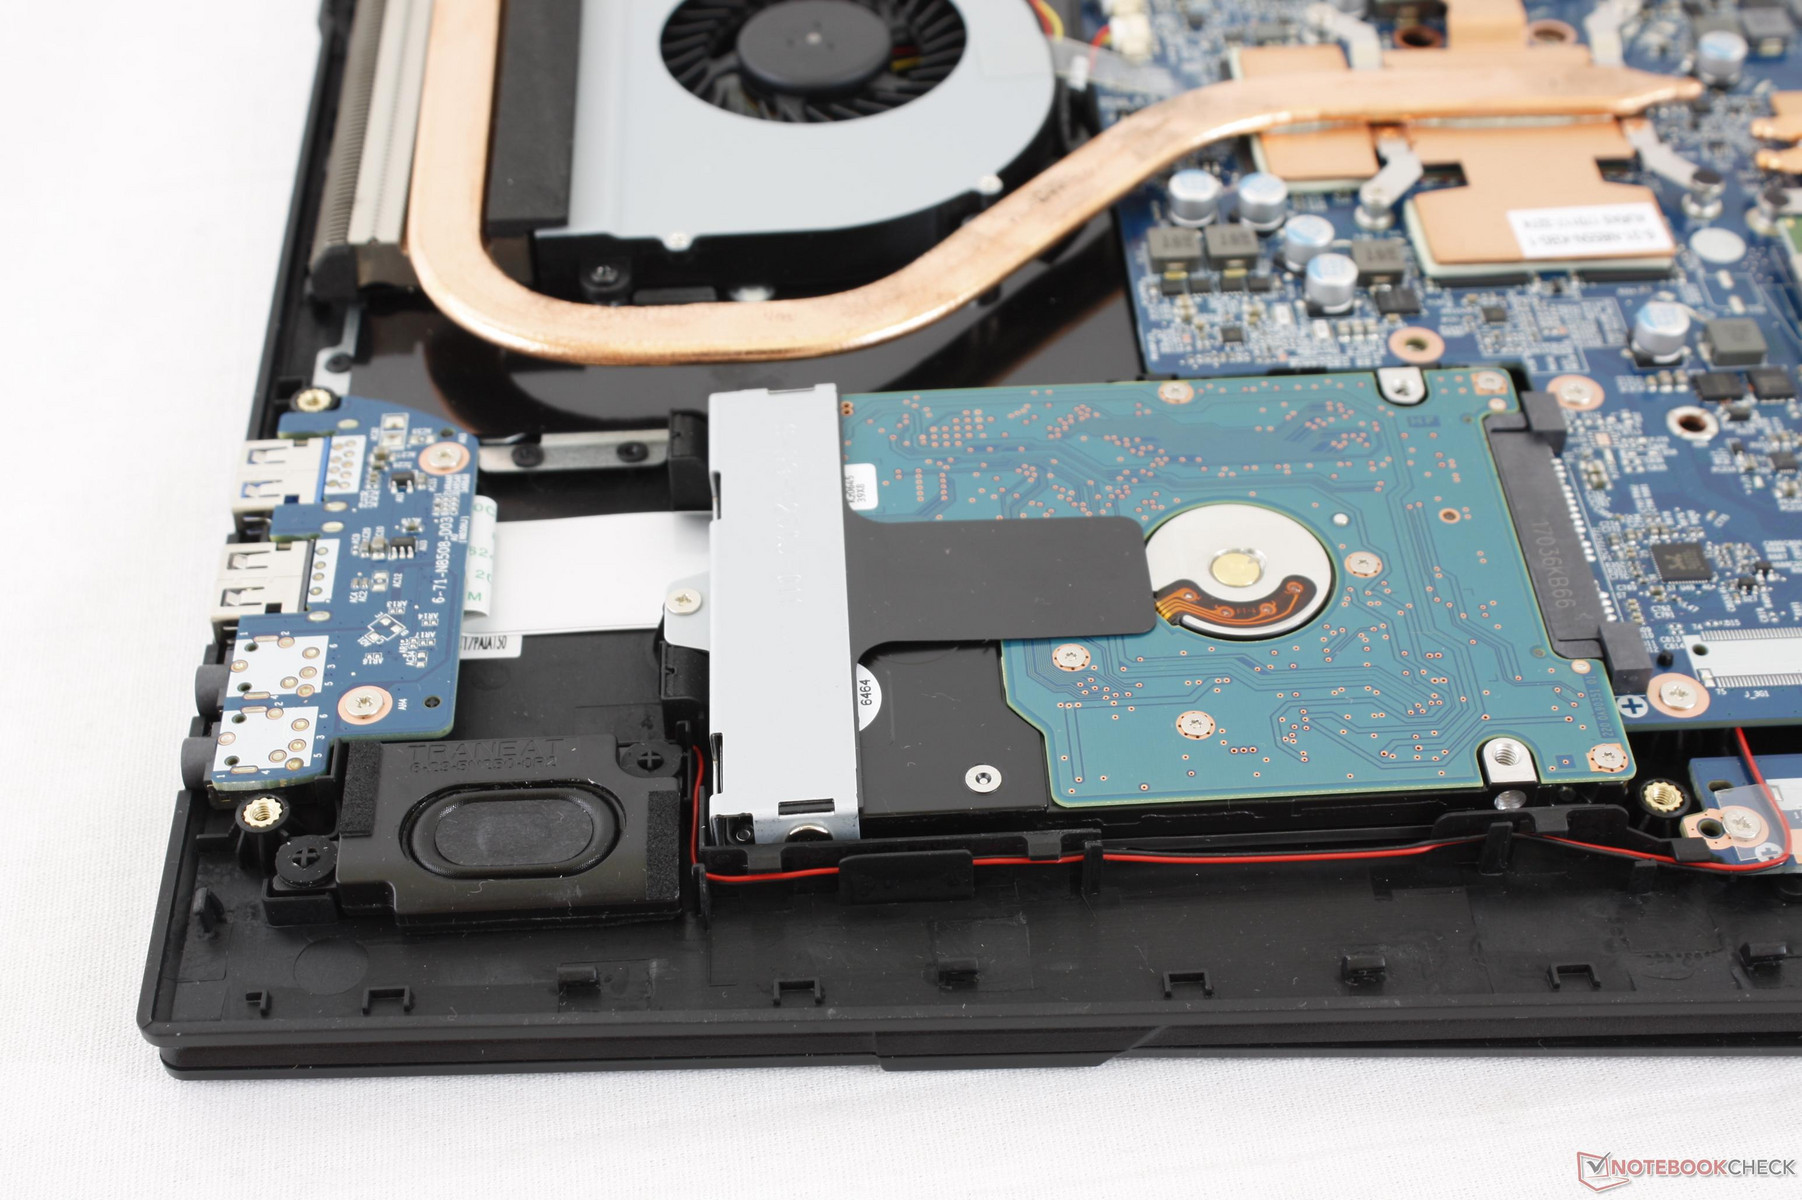
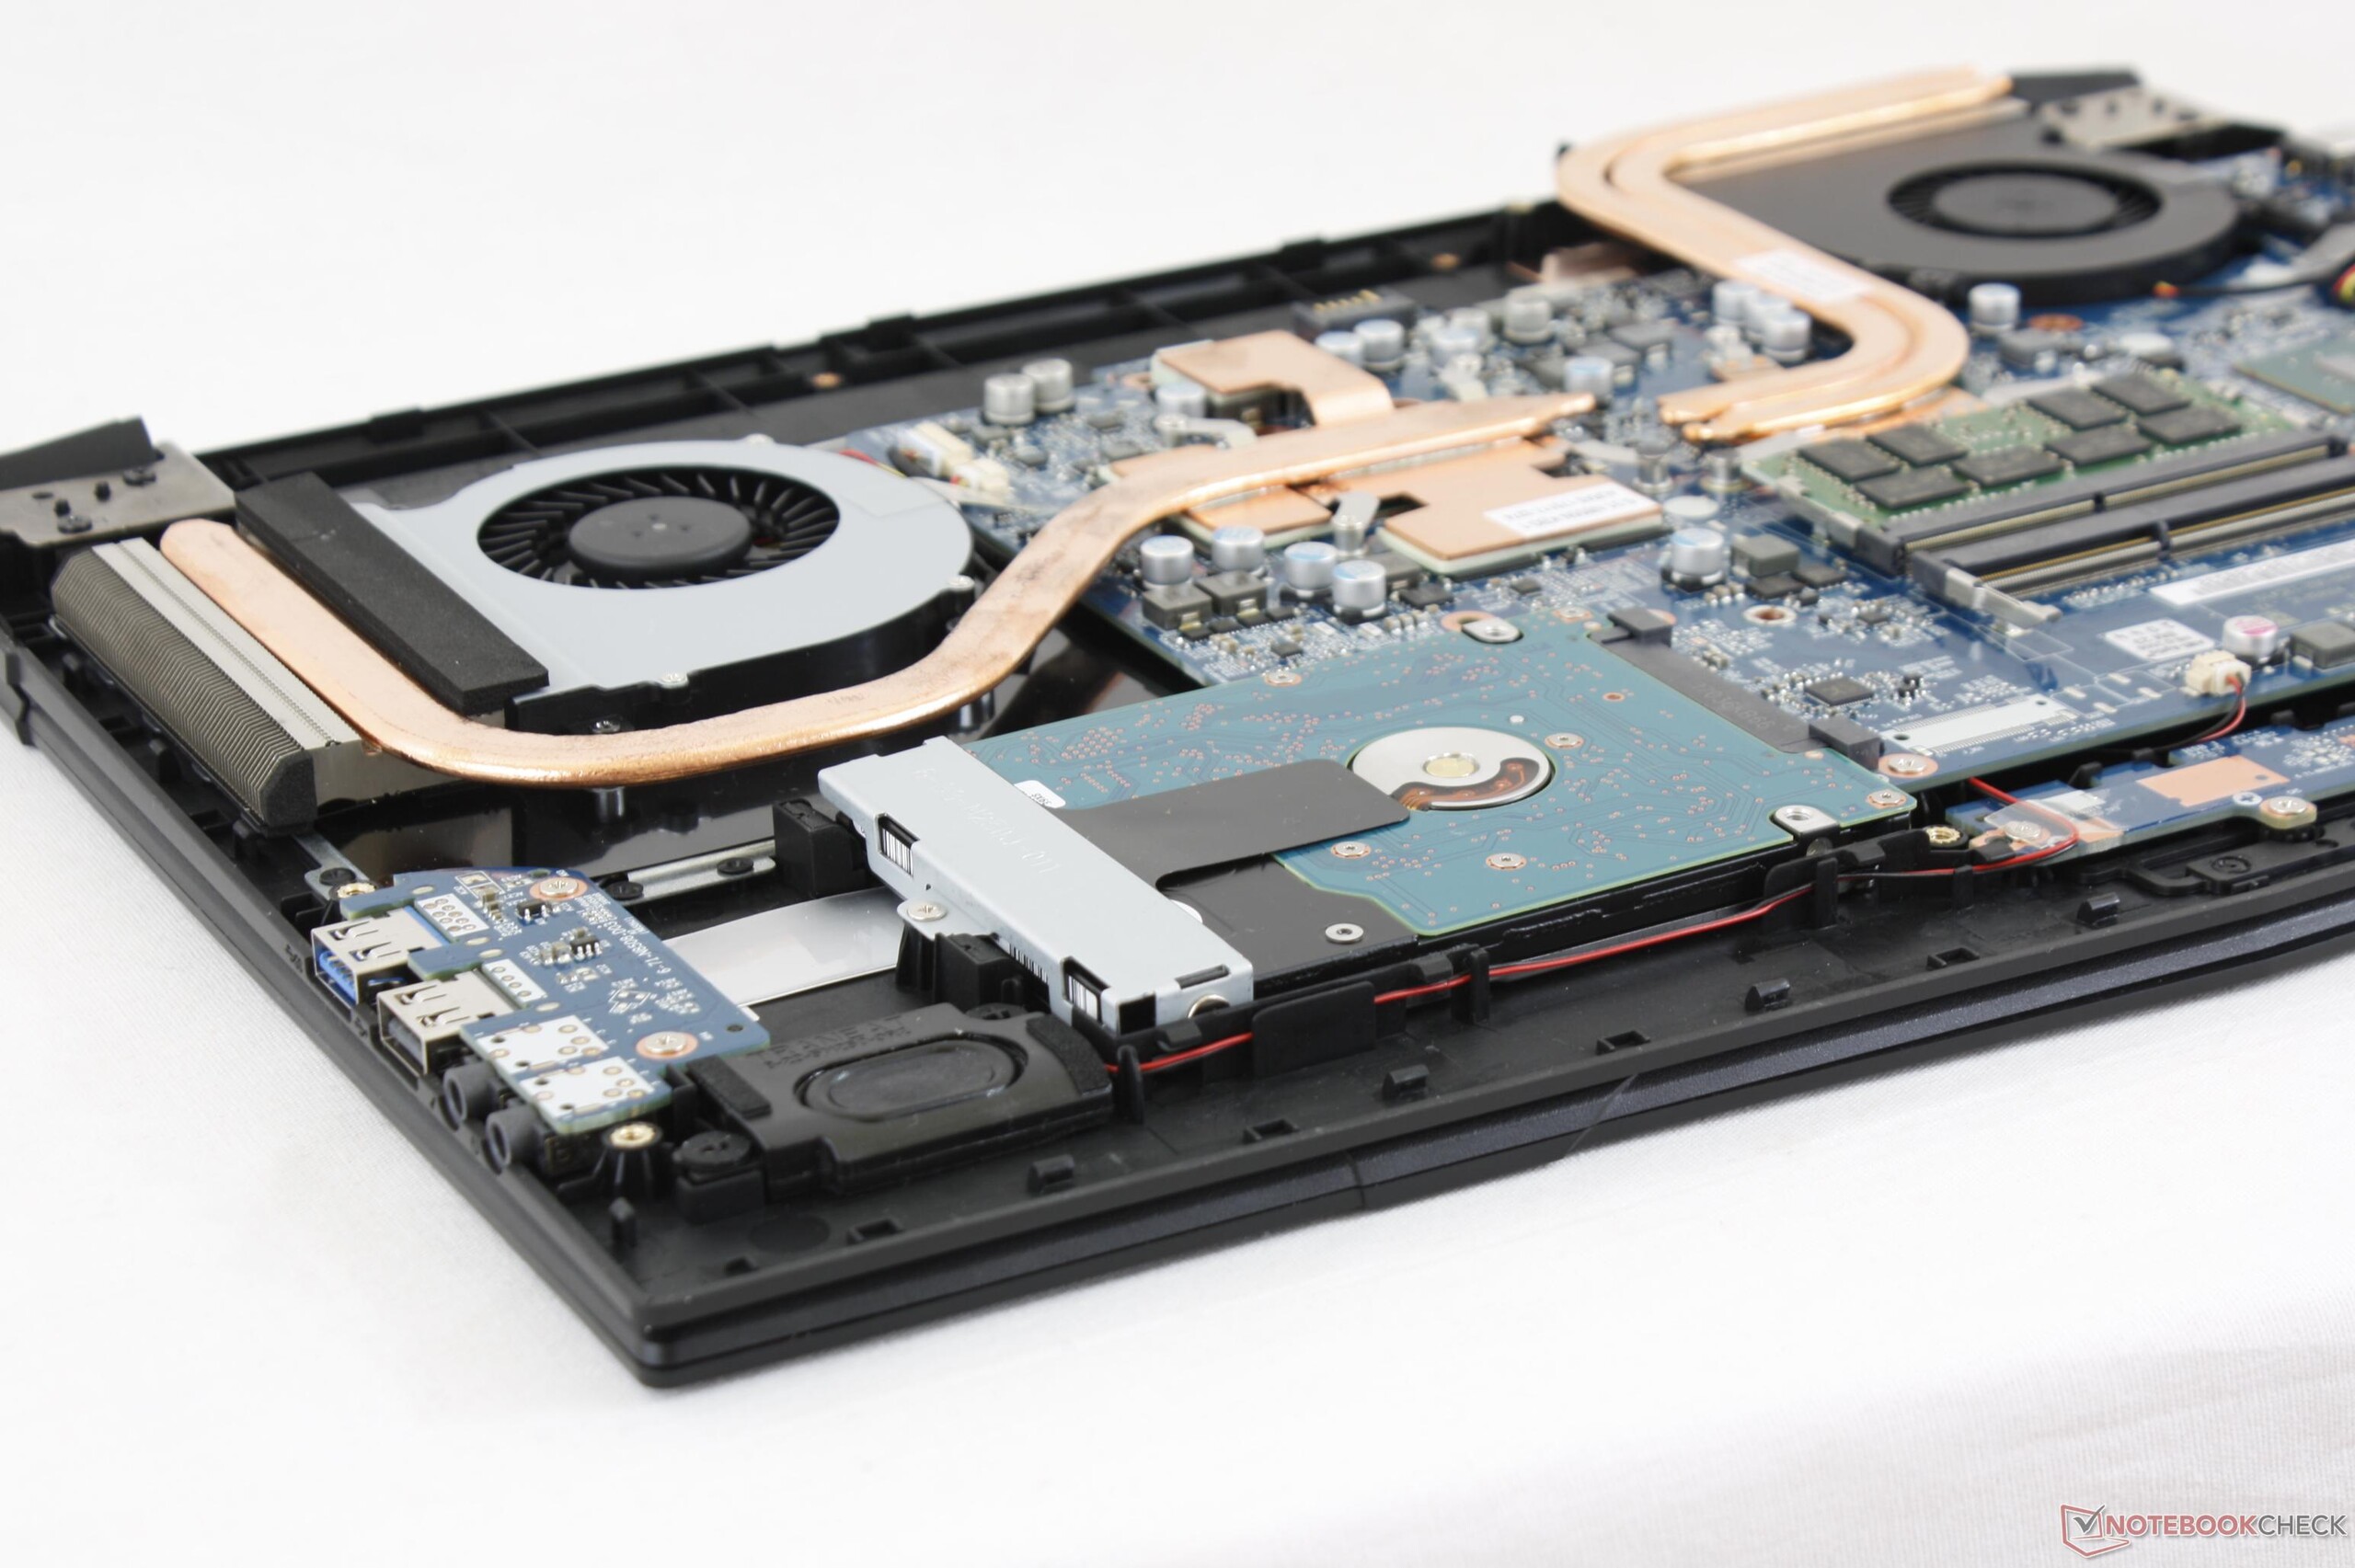
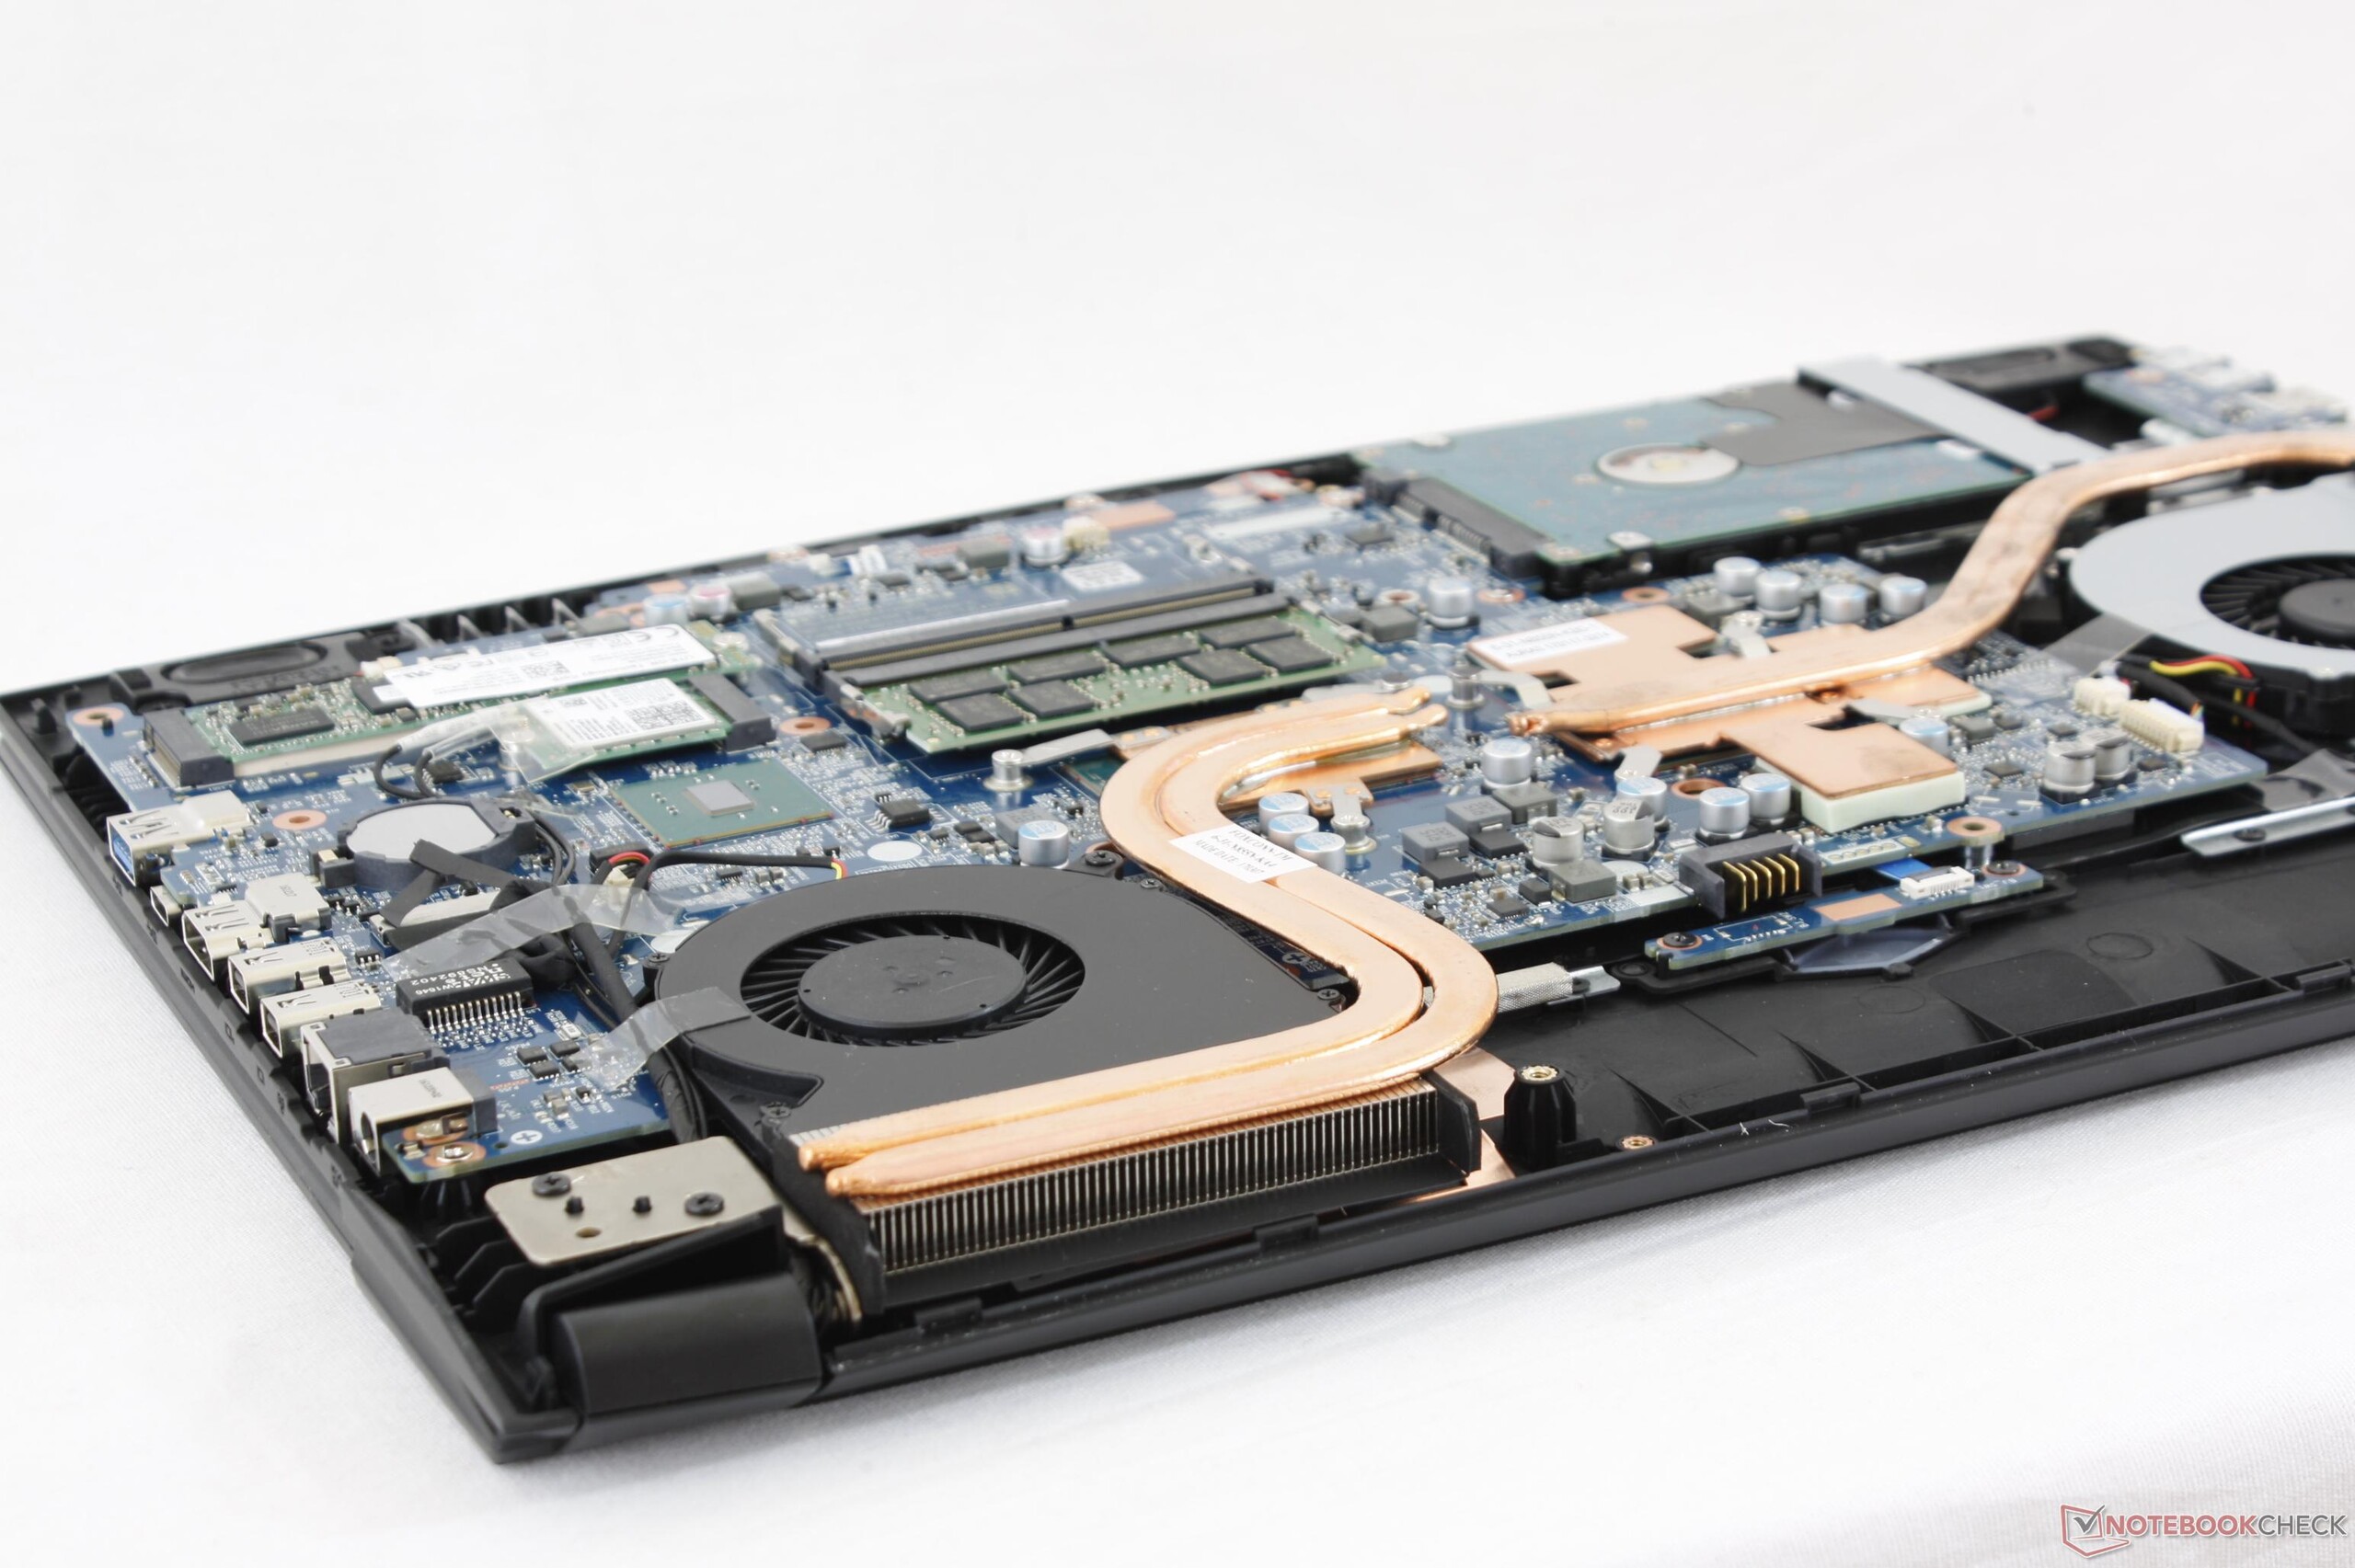
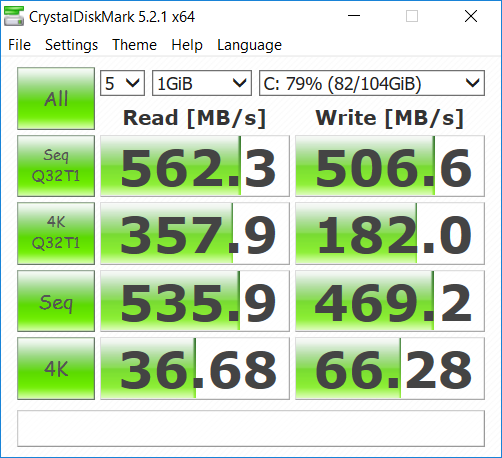
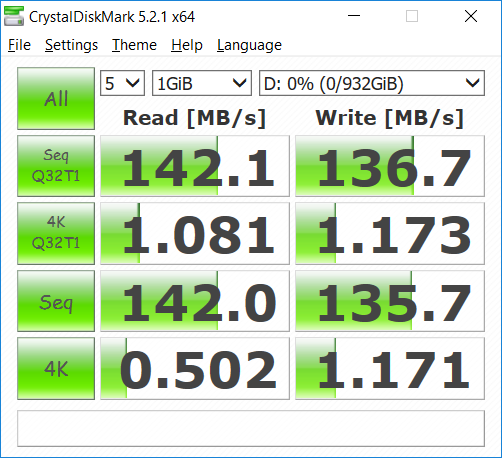
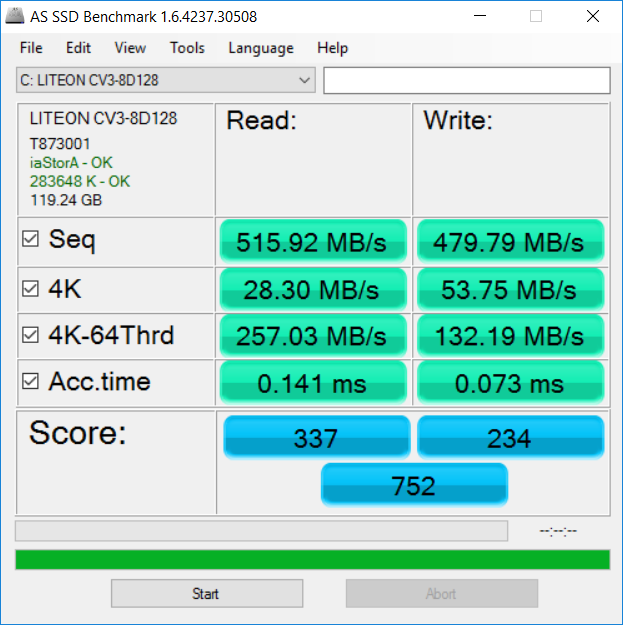
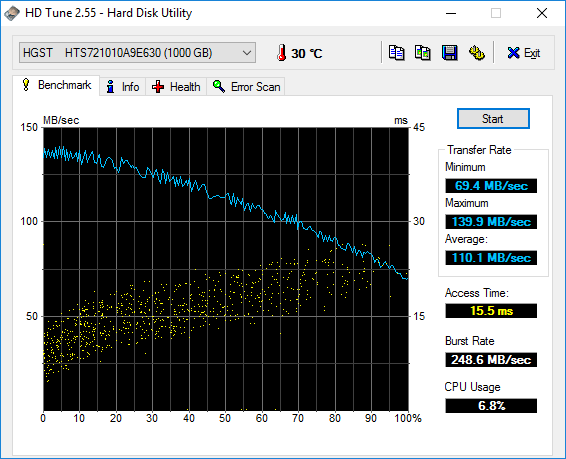
Two accessible storage bays are available in the form of M.2 2280 and 2.5-inch SATA III. Our test unit includes a primary 128 GB Lite-On CV3-8D128 M.2 SSD plus secondary 1 TB Hitachi HGST HTS721010A9E630. RAID 0/1/5/10, NVMe, and 9.5 mm-thick HDDs are supported.
The primary Lite-On drive returns excellent sequential read and write rates for a SATA III SSD topping around the 500 MB/s limit. Performance with smaller 4K blocks, however, is slower than expected when compared to a Samsung PM871. Meanwhile, the secondary 7200 RPM HDD provides fast average transfer rates of about 110 MB/s according to HD Tune compared to 80 MB/s on some slower 5400 RPM HDDs.
See our table of HDDs and SSDs for more benchmark comparisons.
| Gigabyte Sabre 15G Liteonit CV3-8D128 | Dell XPS 15 9560 (i7-7700HQ, UHD) Lite-On CX2-8B512-Q11 | Samsung Odyssey NP800G5M-X01US Samsung PM961 NVMe MZVLW128HEGR | MSI GT62VR 7RE-223 Samsung SSD PM871a MZNLN256HMHQ | Aorus X5 v6 Samsung SM951 MZVPV256 m.2 | |
|---|---|---|---|---|---|
| AS SSD | 195% | 106% | 25% | 98% | |
| Copy Game MB/s (MB/s) | 323.5 | 540 67% | 240.5 -26% | 377.8 17% | 1073 232% |
| Copy Program MB/s (MB/s) | 195.3 | 411.5 111% | 299.5 53% | 199 2% | 351.5 80% |
| Copy ISO MB/s (MB/s) | 446.8 | 1272 185% | 1560 249% | 354.7 -21% | 351.1 -21% |
| Score Total (Points) | 752 | 2810 274% | 1592 112% | 1019 36% | 1630 117% |
| Score Write (Points) | 234 | 1022 337% | 376 61% | 304 30% | 514 120% |
| Score Read (Points) | 337 | 1206 258% | 852 153% | 472 40% | 756 124% |
| Access Time Write * (ms) | 0.073 | 0.034 53% | 0.031 58% | 0.037 49% | 0.025 66% |
| Access Time Read * (ms) | 0.141 | 0.034 76% | 0.066 53% | 0.1 29% | 0.367 -160% |
| 4K-64 Write (MB/s) | 132.2 | 789 497% | 176.4 33% | 171.6 30% | 272.5 106% |
| 4K-64 Read (MB/s) | 257 | 962 274% | 564 119% | 383.4 49% | 521 103% |
| 4K Write (MB/s) | 53.8 | 112.2 109% | 124.1 131% | 104 93% | 131.3 144% |
| 4K Read (MB/s) | 28.3 | 41.34 46% | 44.75 58% | 37.2 31% | 44.6 58% |
| Seq Write (MB/s) | 479.8 | 1207 152% | 752 57% | 288.2 -40% | 1099 129% |
| Seq Read (MB/s) | 516 | 2026 293% | 2433 372% | 510 -1% | 1904 269% |
* ... smaller is better

GPU Performance
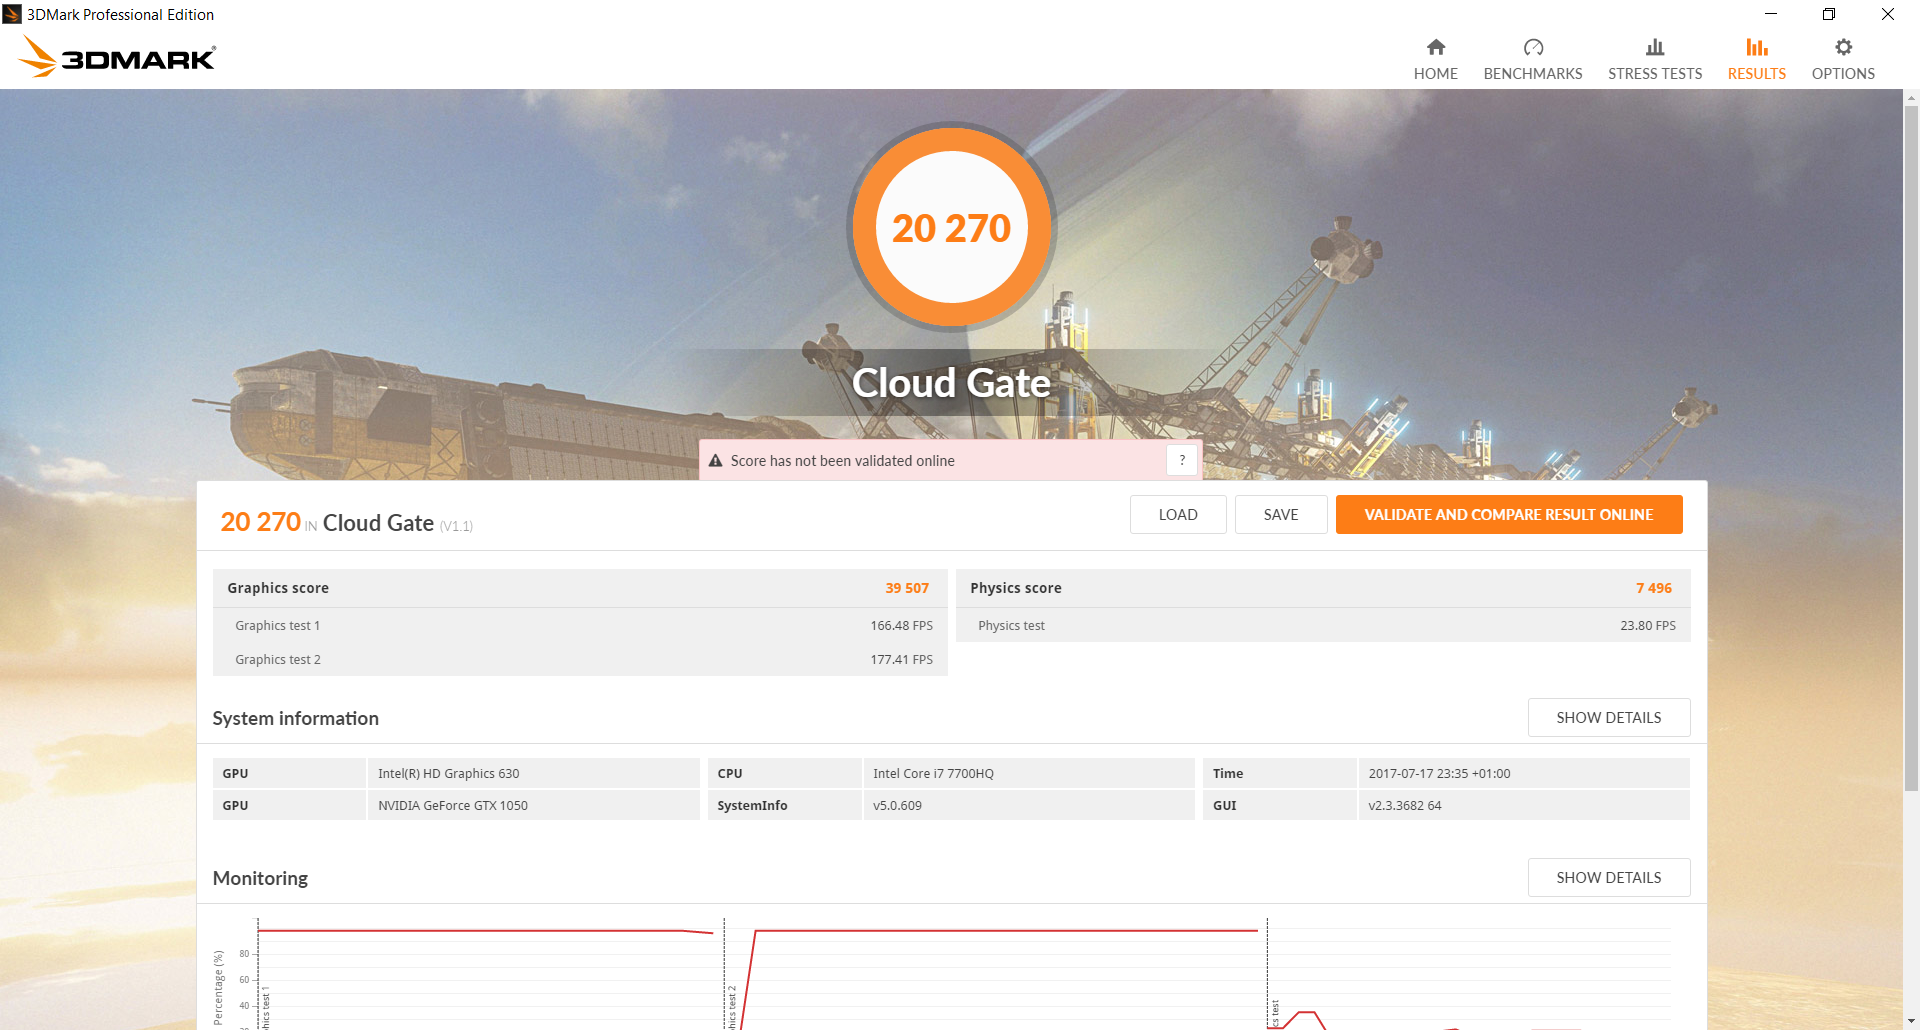
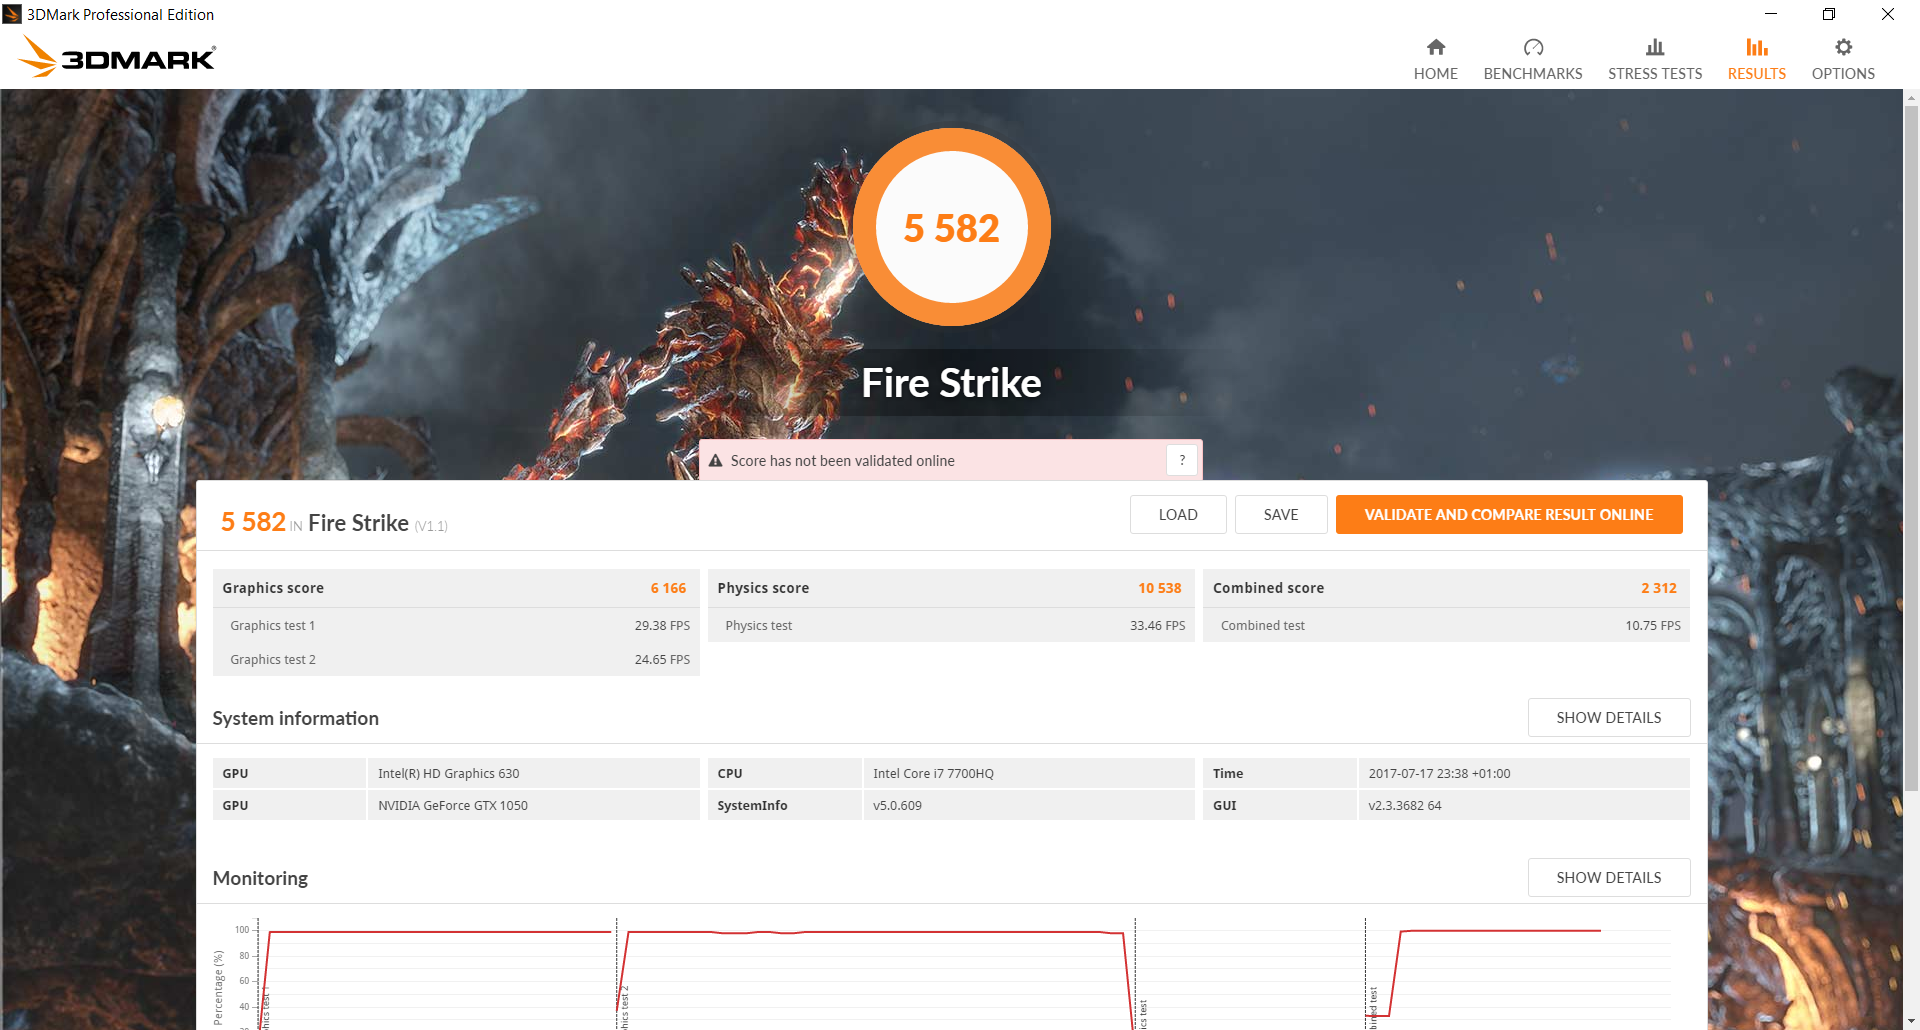
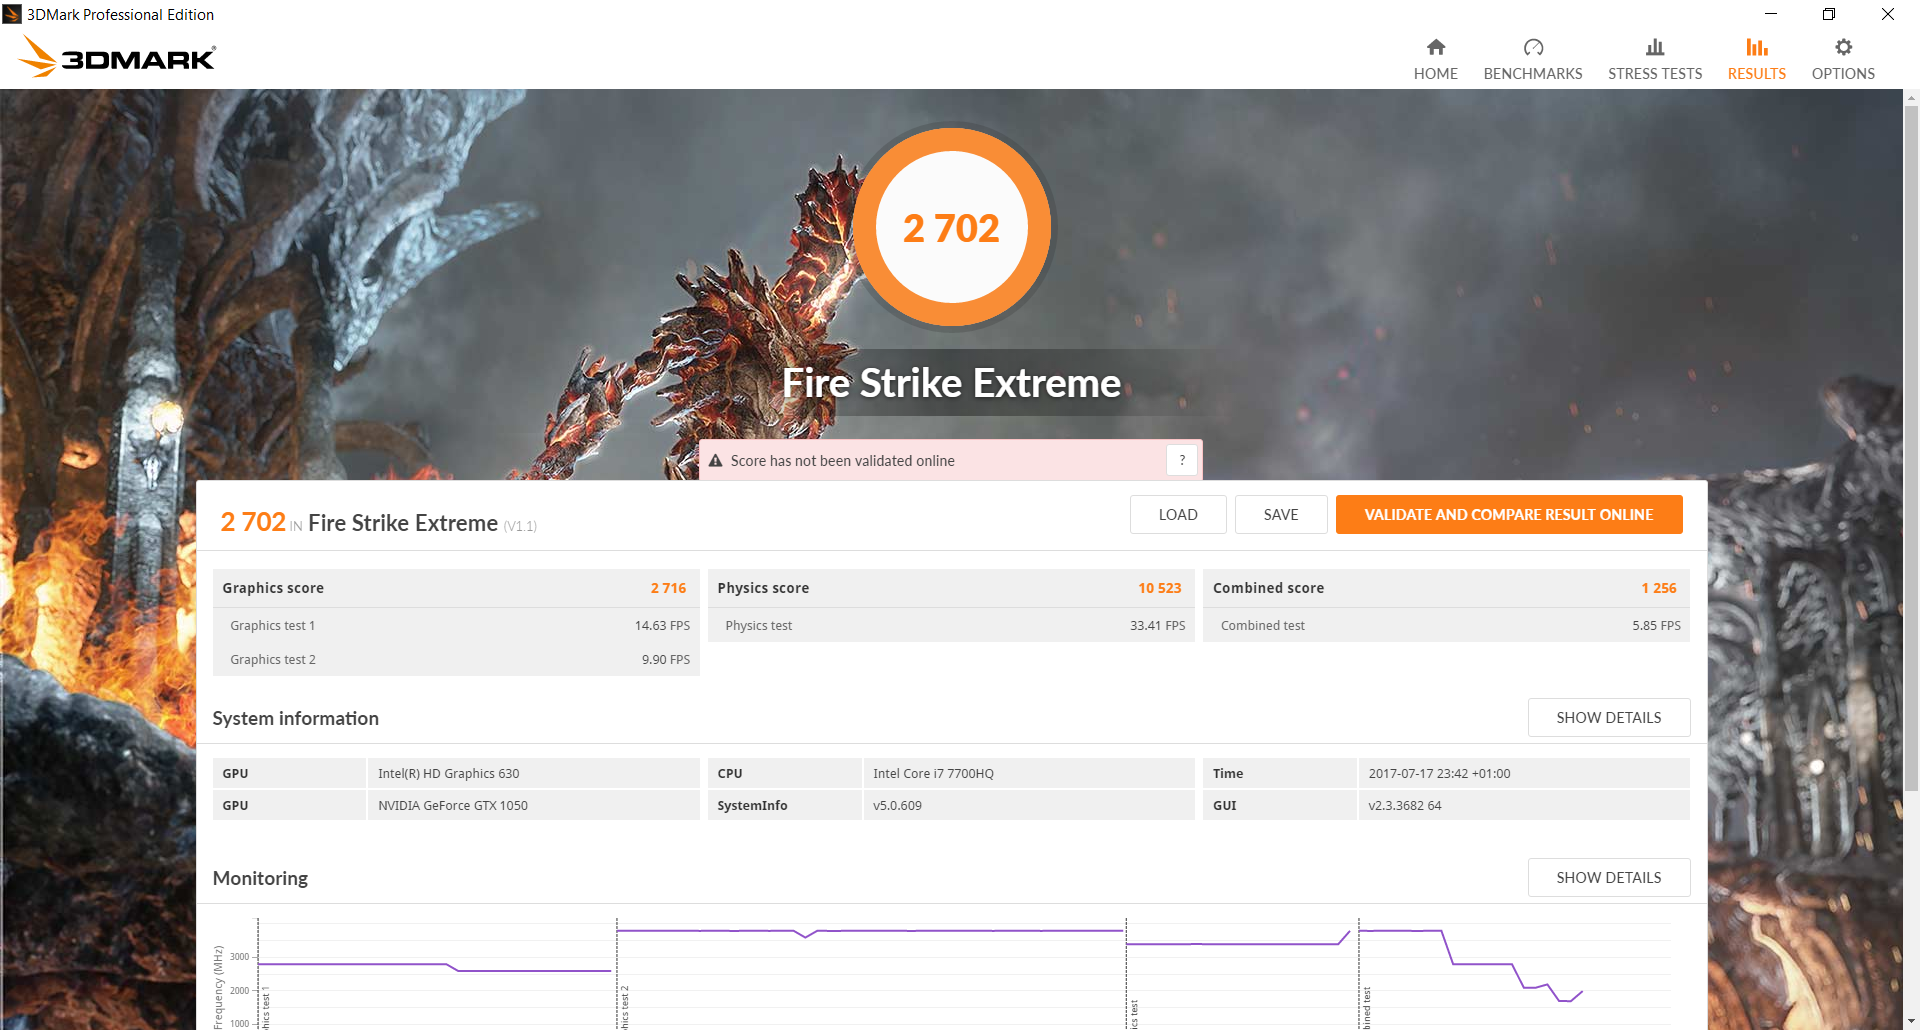
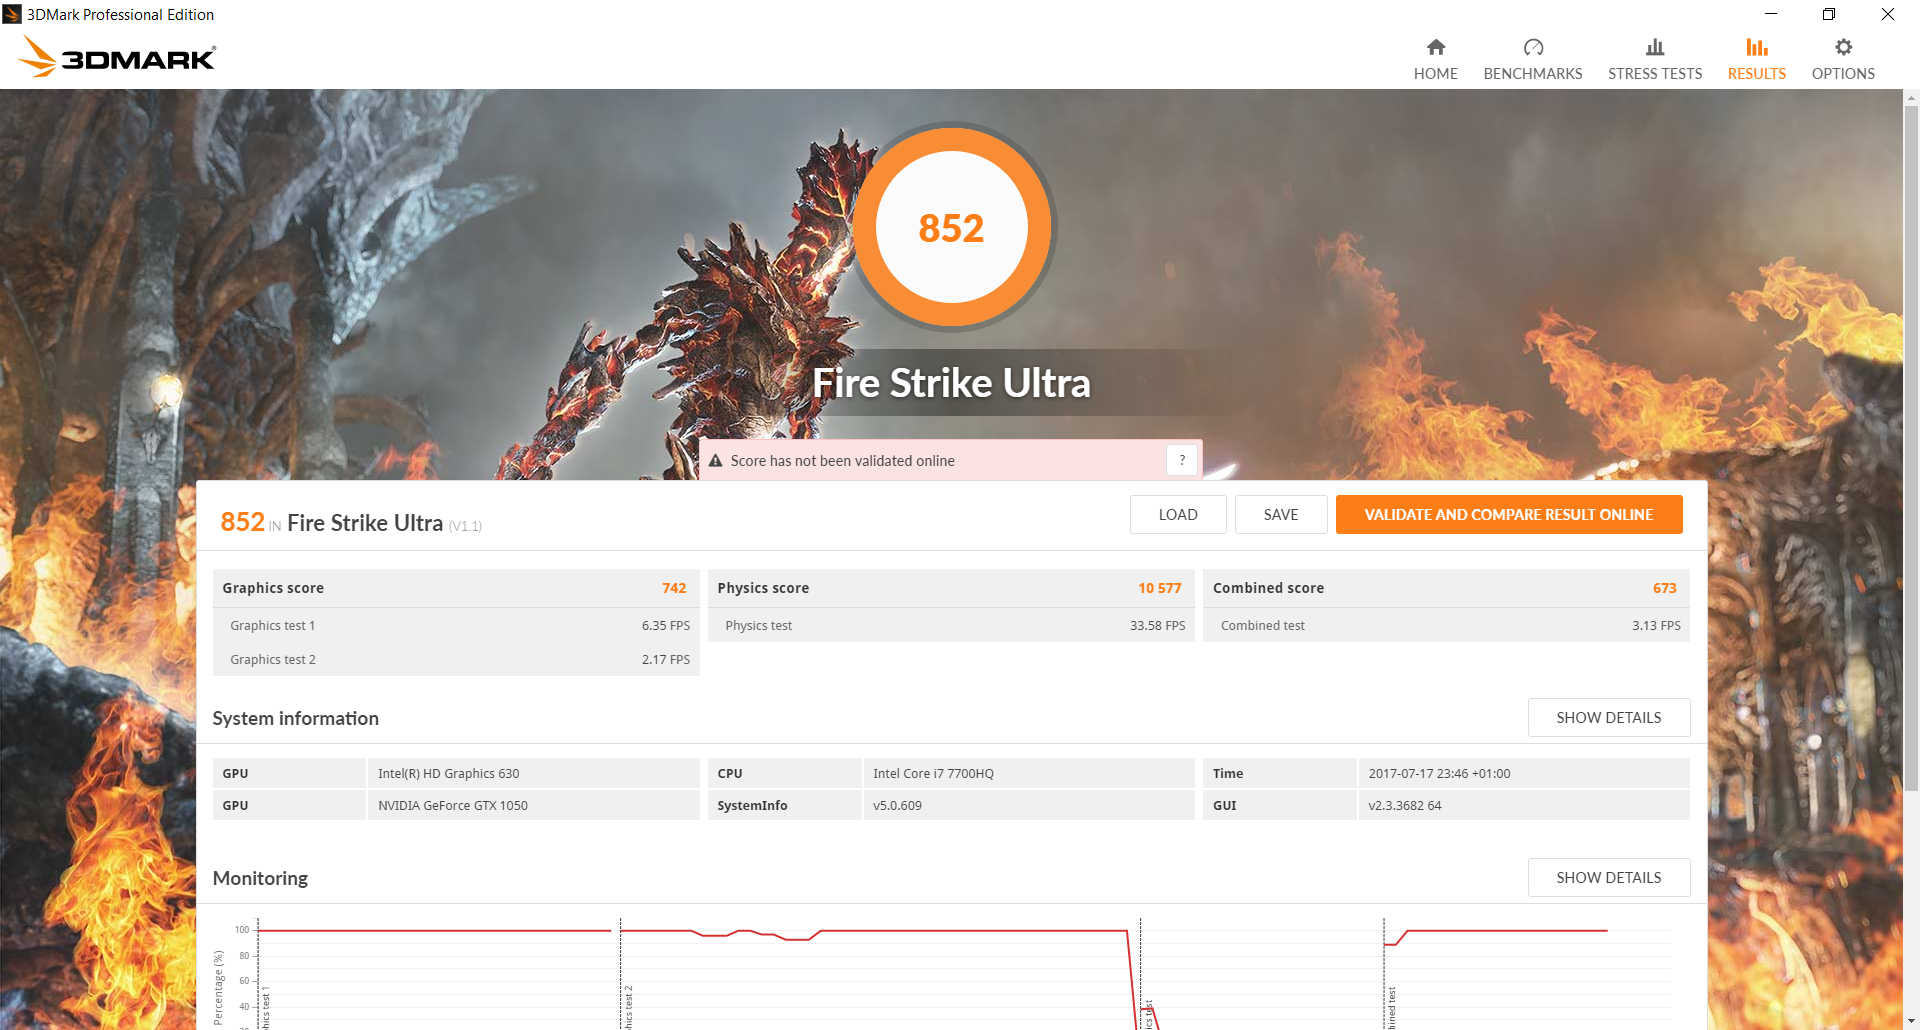
The 2 GB GTX 1050 returns nearly identical 3DMark scores as the 4 GB GTX 1050 in our XPS 15 9560. The only exception is on Fire Strike Ultra where the 4K UHD test proves to be too much for our 2 GB configuration and the final Graphics score is significantly lower as a result. Subsequently, users gaming in 1080p or lower should see little to no frame rate disadvantages on most titles.
In general, the GTX 1050 provides a 35 percent graphics boost over the popular GTX 960M while the GTX 1050 Ti provides yet another 35 percent boost over the GTX 1050. Notebooks with the GTX 970M will still outperform the GTX 1050 by about 20 to 30 percent.
See our full review on the desktop GTX 1050 for more technical information.
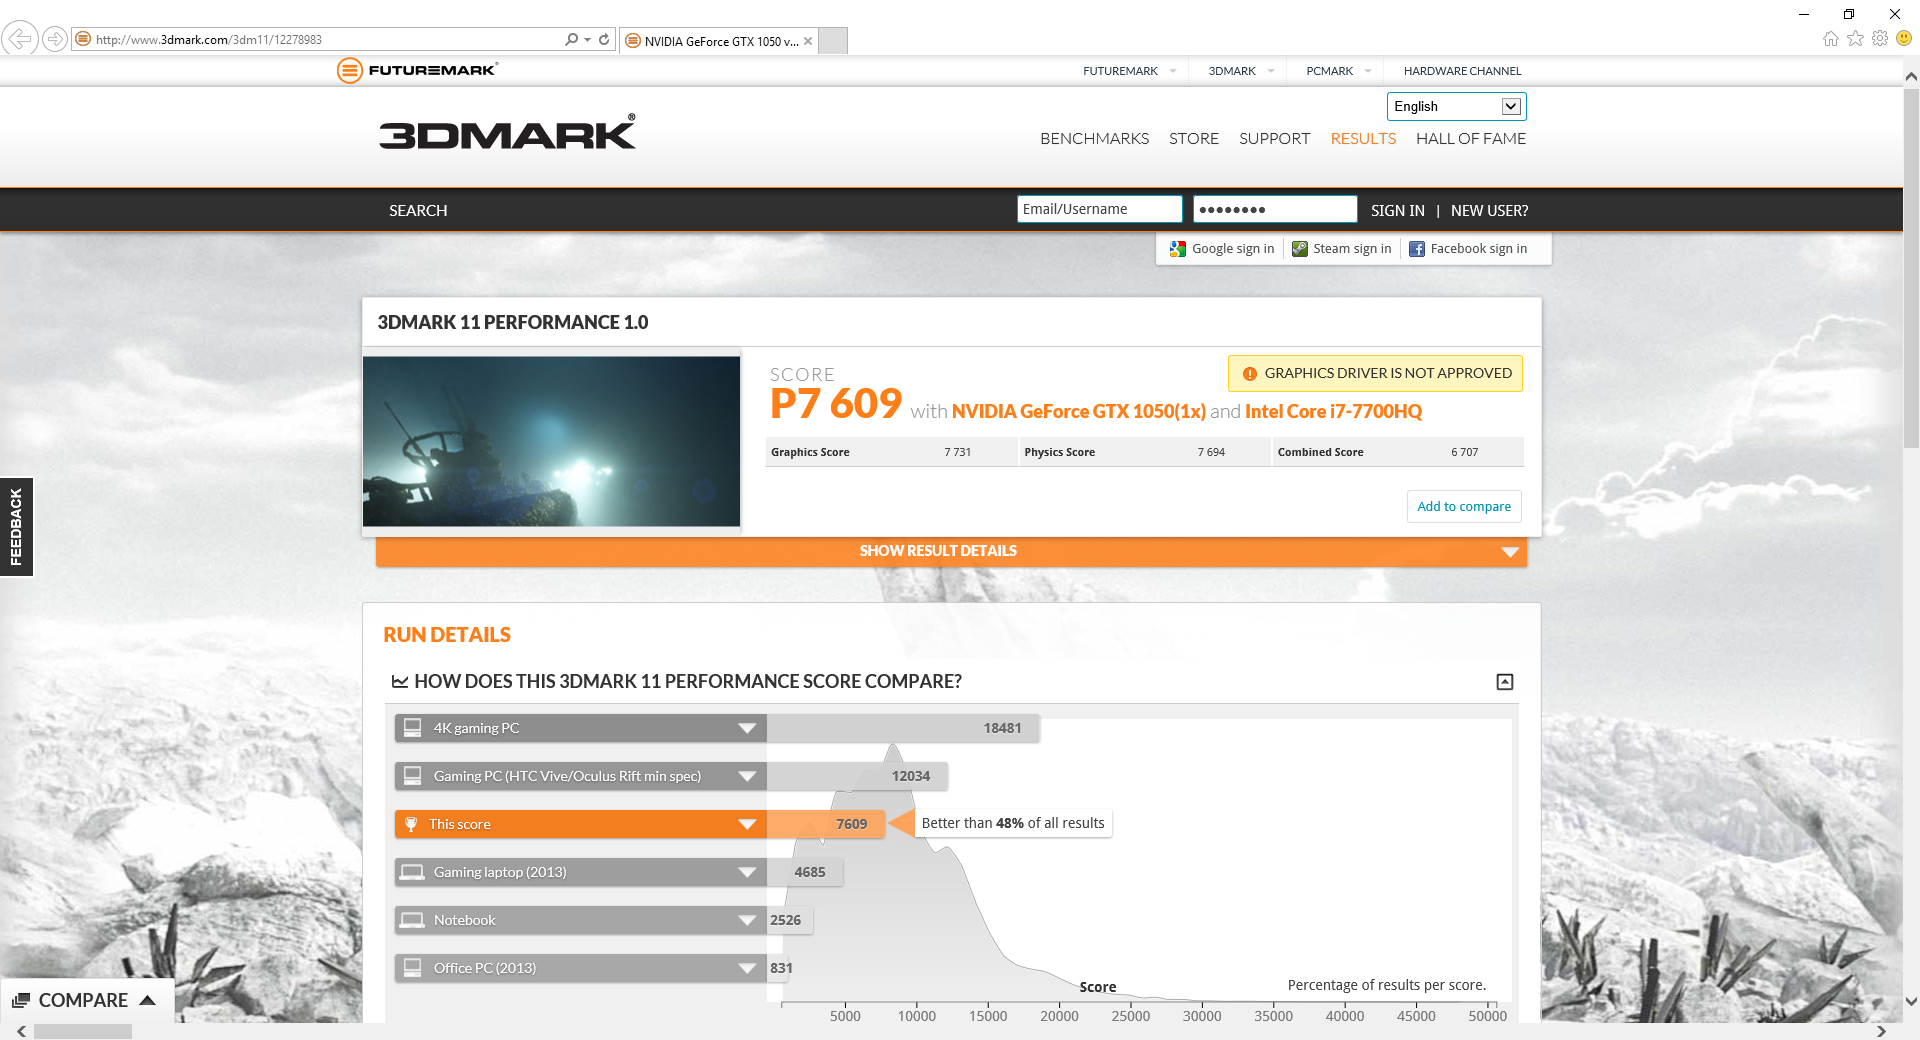
| 3DMark 11 Performance | 7609 points | |
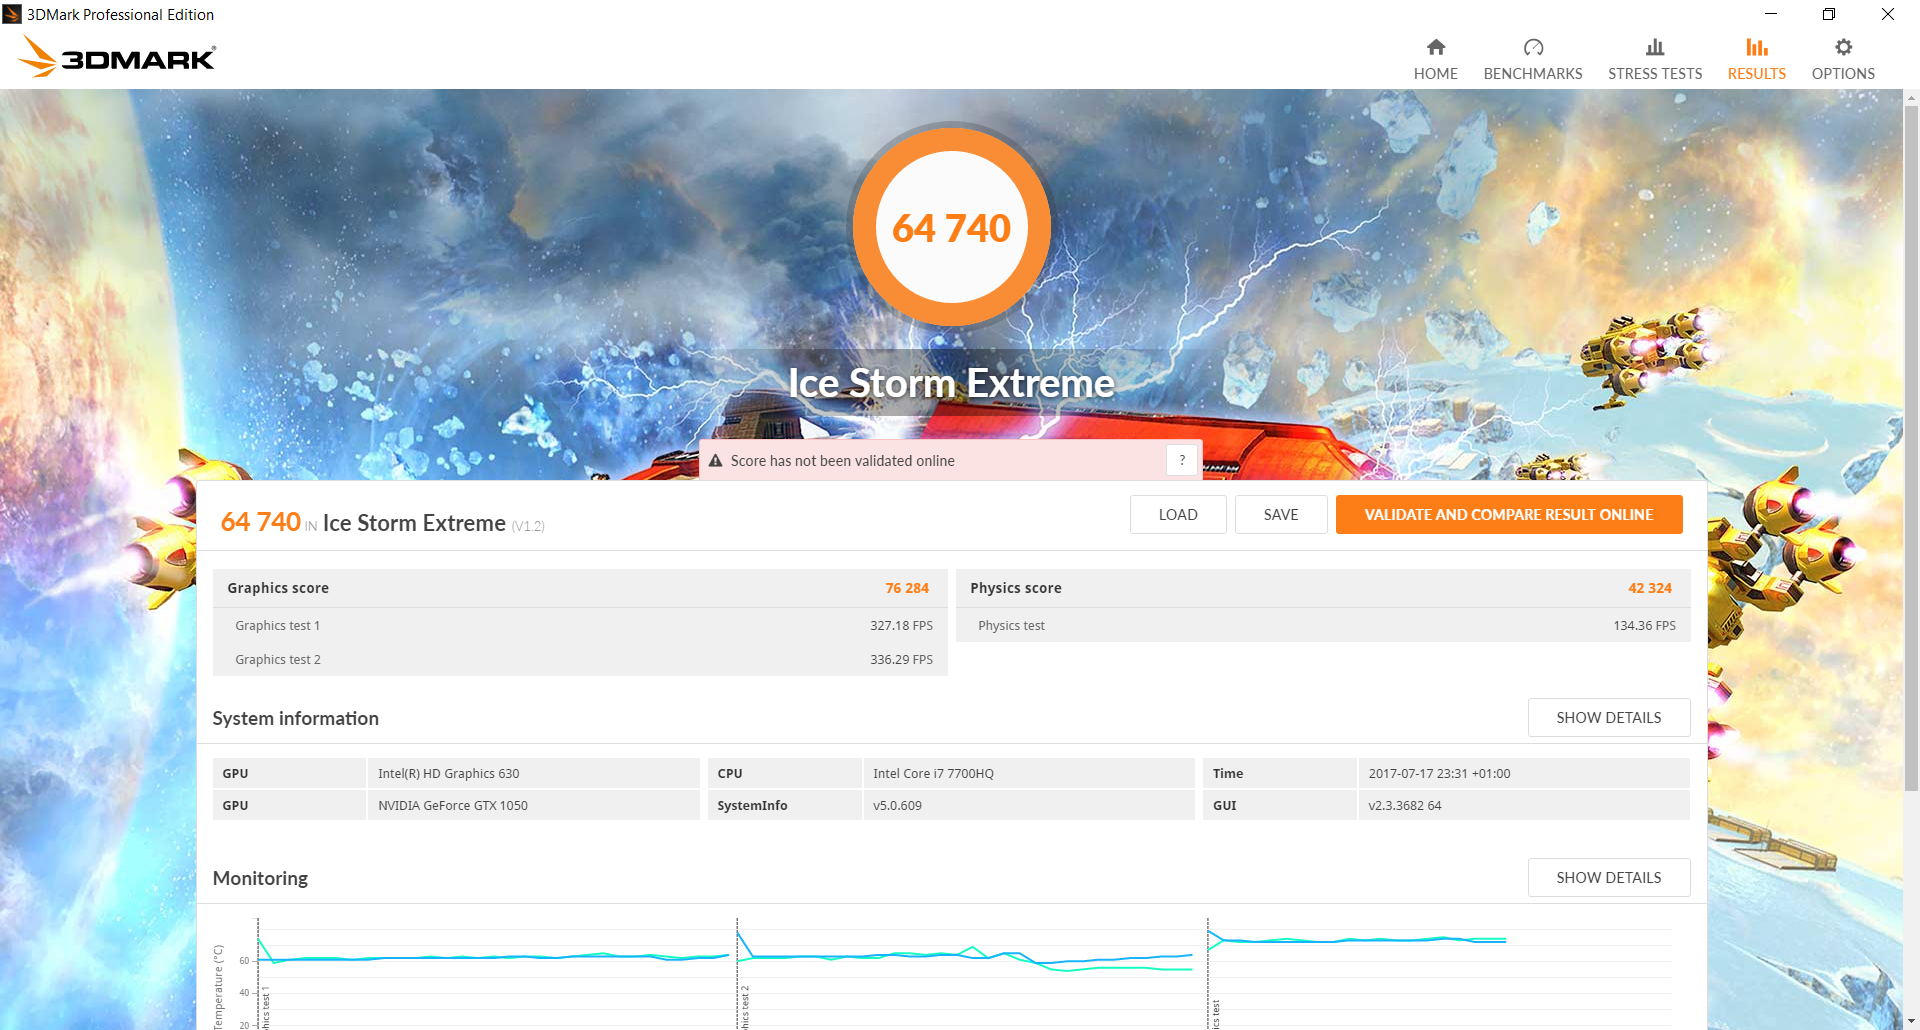
| 3DMark Ice Storm Standard Score | 73178 points | |
| 3DMark Cloud Gate Standard Score | 20270 points | |
| 3DMark Fire Strike Score | 5582 points | |
| 3DMark Fire Strike Extreme Score | 2702 points | |
Help | ||
Gaming Performance
Most titles are playable on maximum 1080p settings at steady frame rates in the 35 to 55 FPS range. A few titles run slower on our 2 GB Sabre 15 when compared to the 4 GB XPS 15 9560 including Doom and Batman Arkham Knight at the highest graphical settings. Overall gaming performance is otherwise very similar to the GTX 965M.
See our GTX 1050 GPU page for more benchmark comparisons.
| Batman: Arkham Knight | |
| 1920x1080 High / On (Interactive Smoke & Paper Debris Off) AA:SM AF:8x | |
| EVGA SC15 | |
| DogHouse Systems Mobius SS | |
| Lenovo Legion Y520-15IKBN-80WK001KUS | |
| Gigabyte P55W v5 | |
| Dell XPS 15 9560 (i7-7700HQ, UHD) | |
| Gigabyte Sabre 15G | |
| HP Pavilion 17 FHD V3A33AV | |
| 1920x1080 High / On AA:SM AF:16x | |
| EVGA SC15 | |
| DogHouse Systems Mobius SS | |
| Lenovo Legion Y520-15IKBN-80WK001KUS | |
| Gigabyte P55W v5 | |
| Dell XPS 15 9560 (i7-7700HQ, UHD) | |
| Gigabyte Sabre 15G | |
| HP Pavilion 17 FHD V3A33AV | |
| Rise of the Tomb Raider | |
| 1920x1080 High Preset AA:FX AF:4x | |
| DogHouse Systems Mobius SS | |
| Lenovo Legion Y520-15IKBN-80WK001KUS | |
| Gigabyte P55W v5 | |
| Dell XPS 15 9560 (i7-7700HQ, UHD) | |
| Gigabyte Sabre 15G | |
| HP Pavilion 17 FHD V3A33AV | |
| 1920x1080 Very High Preset AA:FX AF:16x | |
| EVGA SC15 | |
| DogHouse Systems Mobius SS | |
| Lenovo Legion Y520-15IKBN-80WK001KUS | |
| Gigabyte P55W v5 | |
| Gigabyte Sabre 15G | |
| Dell XPS 15 9560 (i7-7700HQ, UHD) | |
| HP Pavilion 17 FHD V3A33AV | |
| BioShock Infinite - 1920x1080 Ultra Preset, DX11 (DDOF) | |
| EVGA SC15 | |
| DogHouse Systems Mobius SS | |
| Lenovo Legion Y520-15IKBN-80WK001KUS | |
| Gigabyte P55W v5 | |
| Dell XPS 15 9560 (i7-7700HQ, UHD) | |
| Gigabyte Sabre 15G | |
| HP Pavilion 17 FHD V3A33AV | |
| low | med. | high | ultra | |
|---|---|---|---|---|
| BioShock Infinite (2013) | 130 | 61 | ||
| Metro: Last Light (2013) | 79 | 44 | ||
| Thief (2014) | 69.2 | 42.8 | ||
| The Witcher 3 (2015) | 41 | 22 | ||
| Batman: Arkham Knight (2015) | 78 | 46 | 25 | |
| Metal Gear Solid V (2015) | 60 | 53.2 | ||
| Fallout 4 (2015) | 42.8 | 35.5 | ||
| Rise of the Tomb Raider (2016) | 38.6 | 34.2 | ||
| Ashes of the Singularity (2016) | 34.1 | 29.4 | ||
| Doom (2016) | 48 | 42 | ||
| Overwatch (2016) | 59 | |||
| Mafia 3 (2016) | 38.3 | |||
| Prey (2017) | 62.2 | 54.4 |
Stress Test
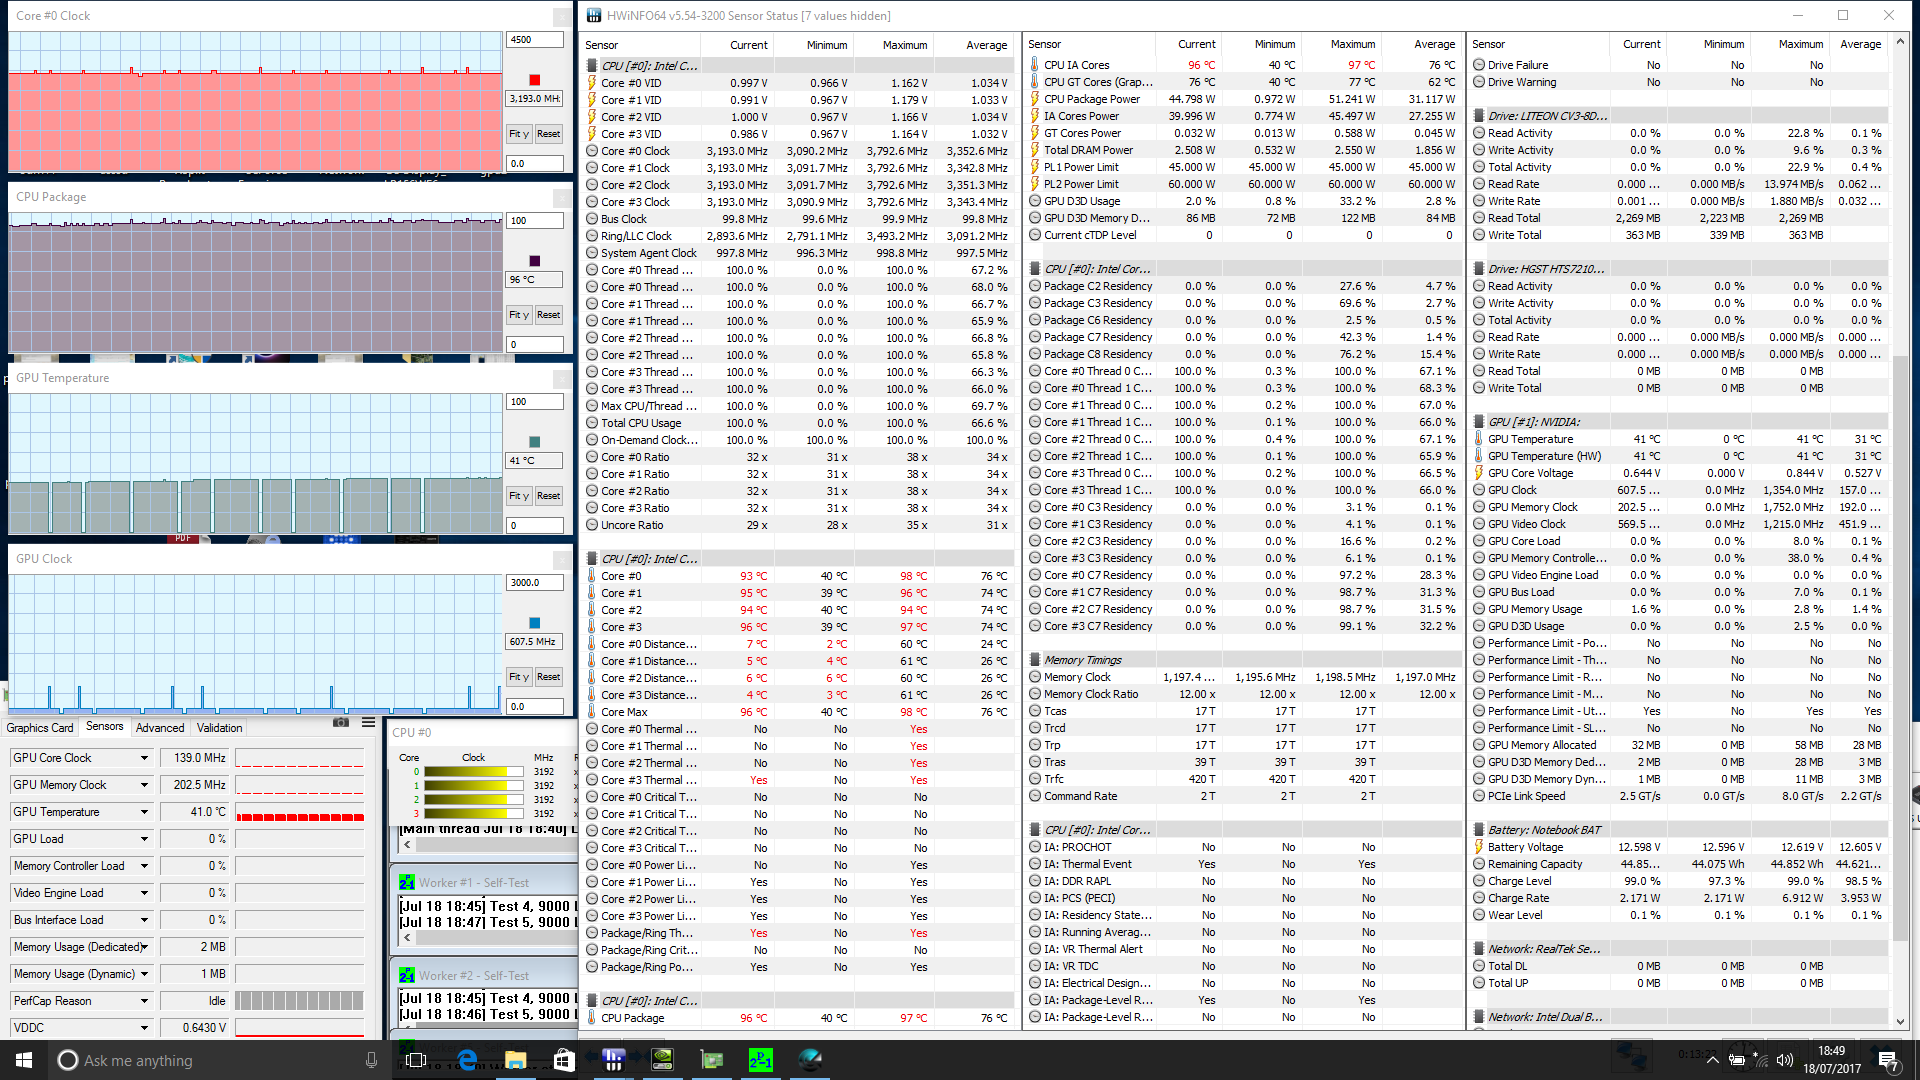
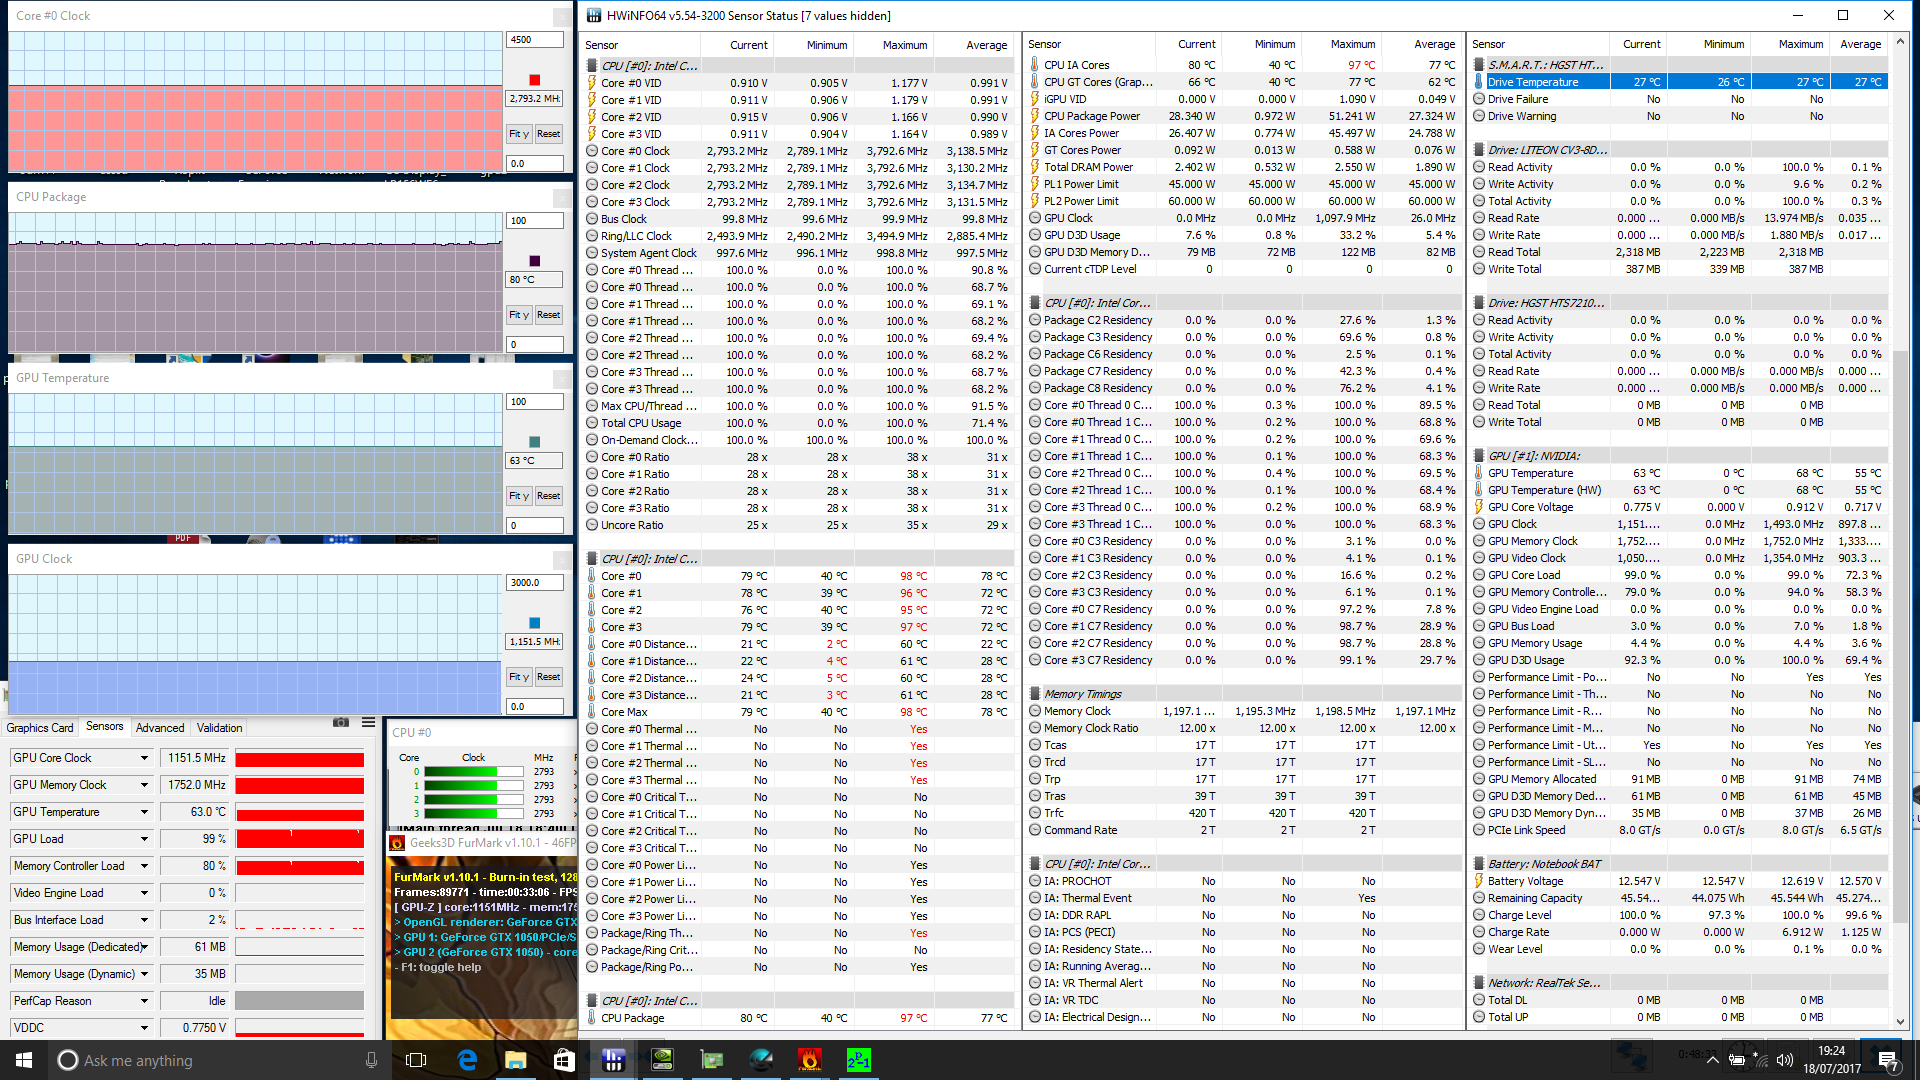
We stress the notebook with synthetic benchmarks to identify for any throttling or stability issues. When only Prime95 is active, we can observe the CPU running at the maximum quad-core Turbo Boost of 3.4 GHz for the first minute or so before falling down to a steady 3.2 GHz or 400 MHz above the base clock rate. The i7-7700HQ in the Sabre 15 is subsequently unable to maintain the maximum rated Turbo Boost when under extreme load. Core temperature averages a very high 96 C compared to just 65 C on thicker gaming notebooks like the GT72VR when under similar Prime95 conditions. Running Prime95 and FurMark simultaneously will strip the CPU of any Turbo Boost benefits for a steady base clock rate of 2.8 GHz.
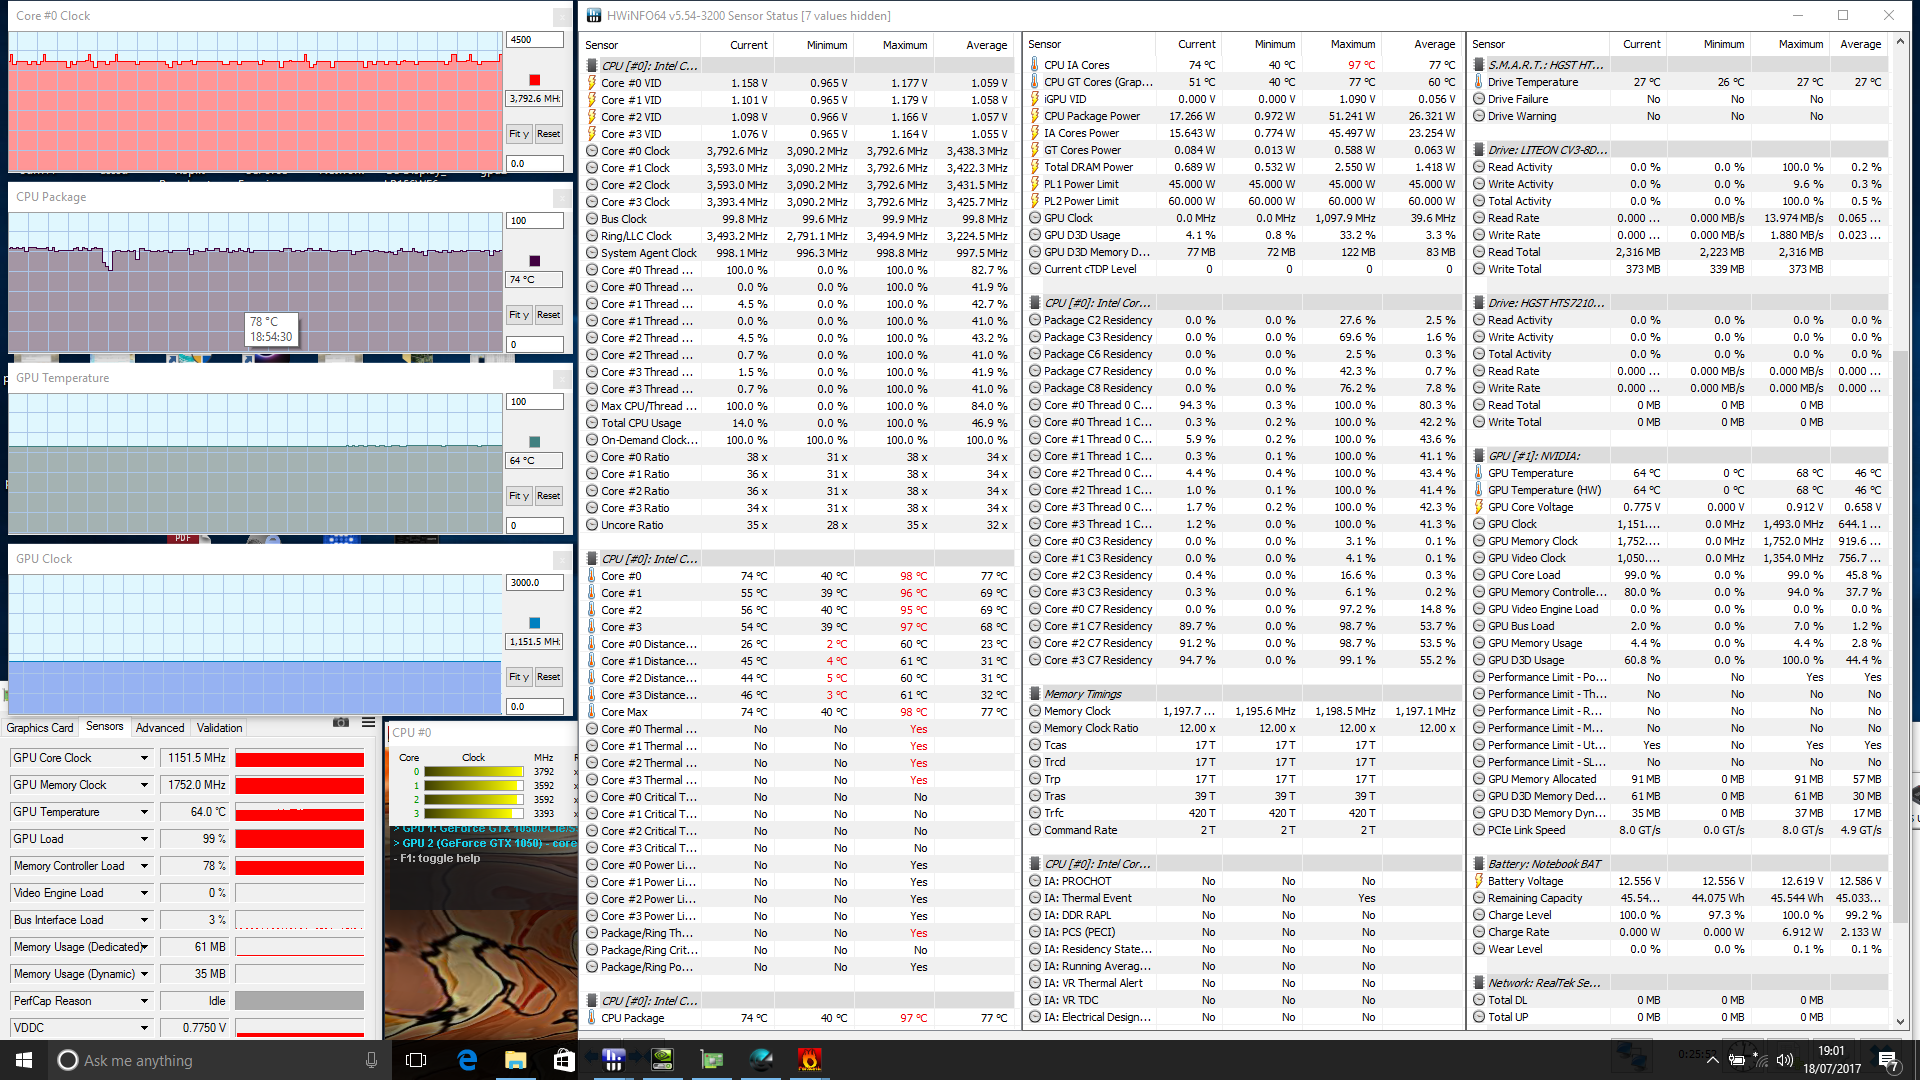
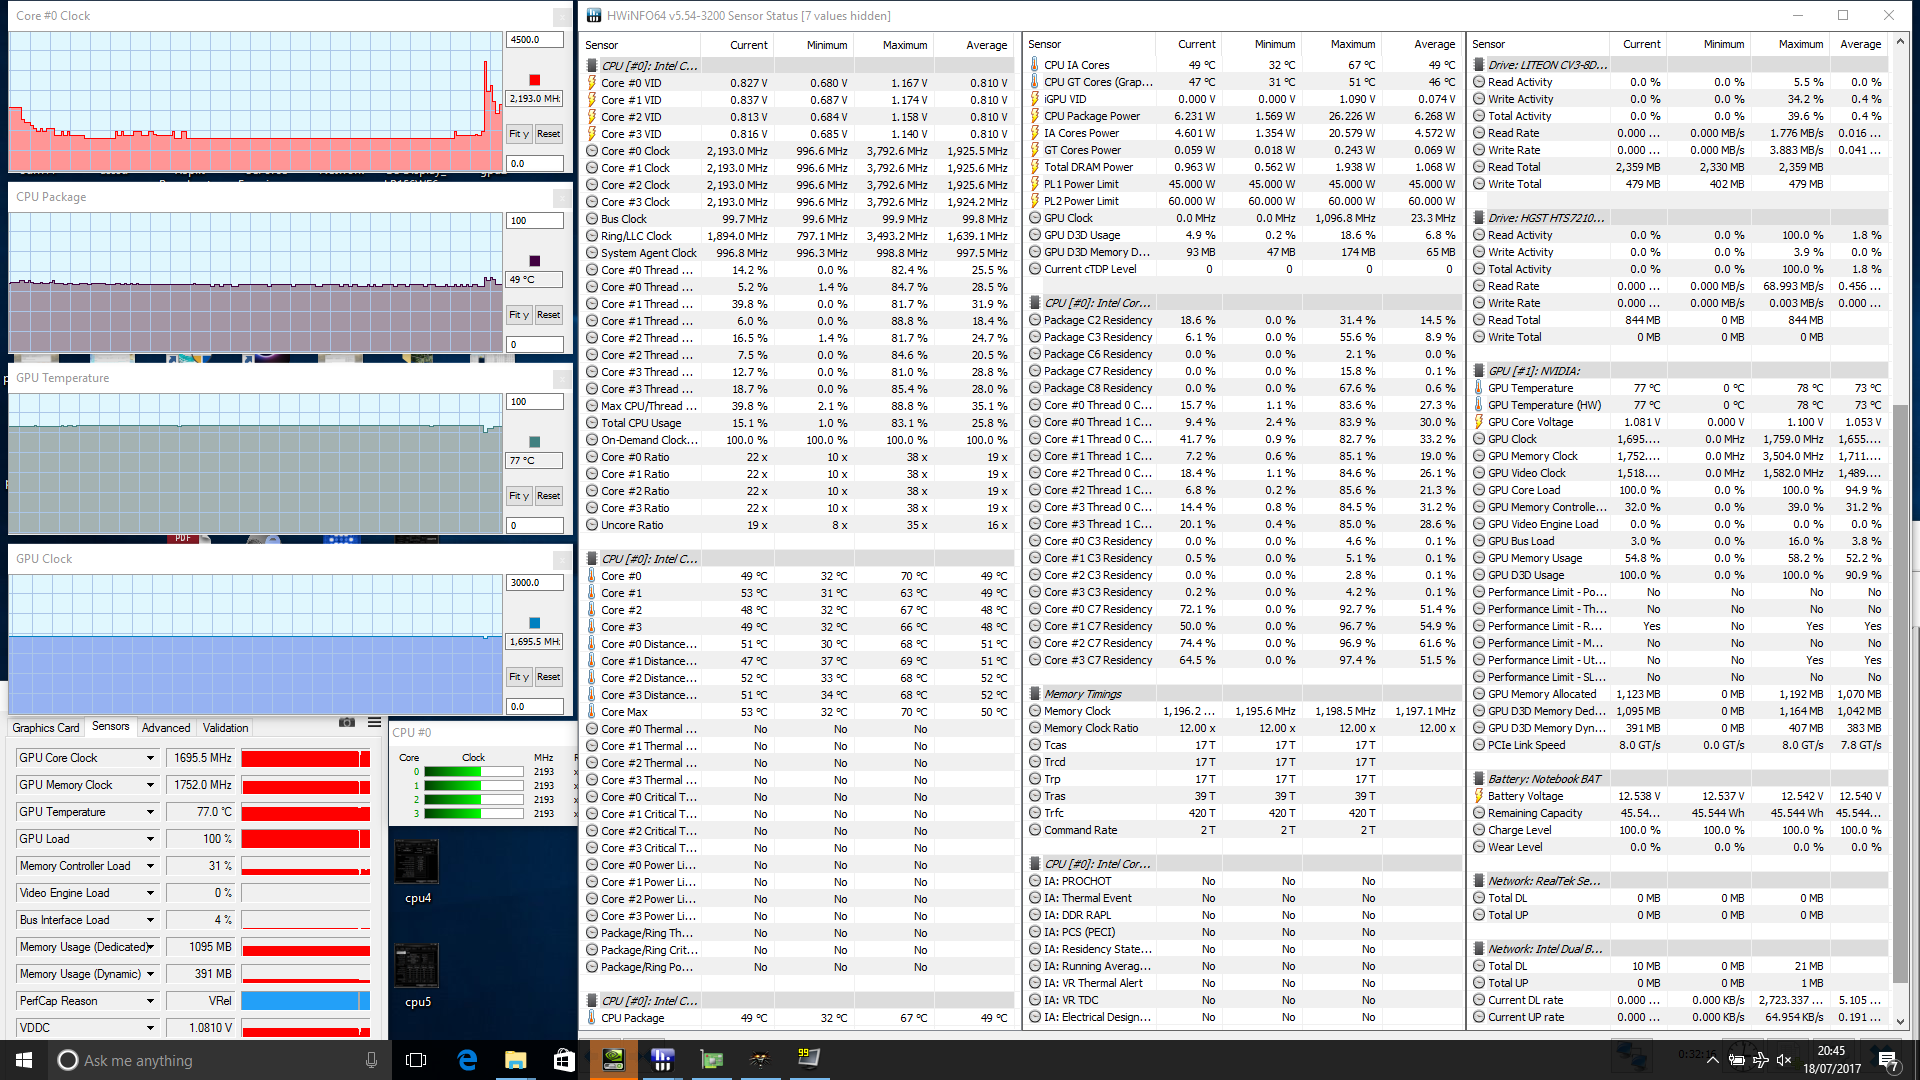
Witcher 3 stress puts GPU at a steady 1696 MHz against a base clock rate of 1354 MHz. GPU temperature is relatively warm at 78 C, but this is not unusual for a gaming notebook. CPU clock rates fluctuate between 1.0 GHz to 2.7 GHz in the low 50 C range.
Running on batteries will limit both CPU and GPU performances. 3DMark 11 on batteries returns Physics and Graphics scores of 4974 and 6771 points, respectively, compared to 7694 and 7731 points when on mains.
| CPU Clock (GHz) | GPU Clock (MHz) | Average CPU Temperature (°C) | Average GPU Temperature (°C) | |
| Prime95 Stress | 3.2 | -- | 96 | -- |
| FurMark Stress | -- | 1152 | -- | 64 |
| Prime95 + FurMark Stress | 2.8 | 1152 | 80 | 63 |
| Witcher 3 Stress | 1.0 - 2.8 | 1696 | 49 - 55 | 78 |
Emissions
System Noise
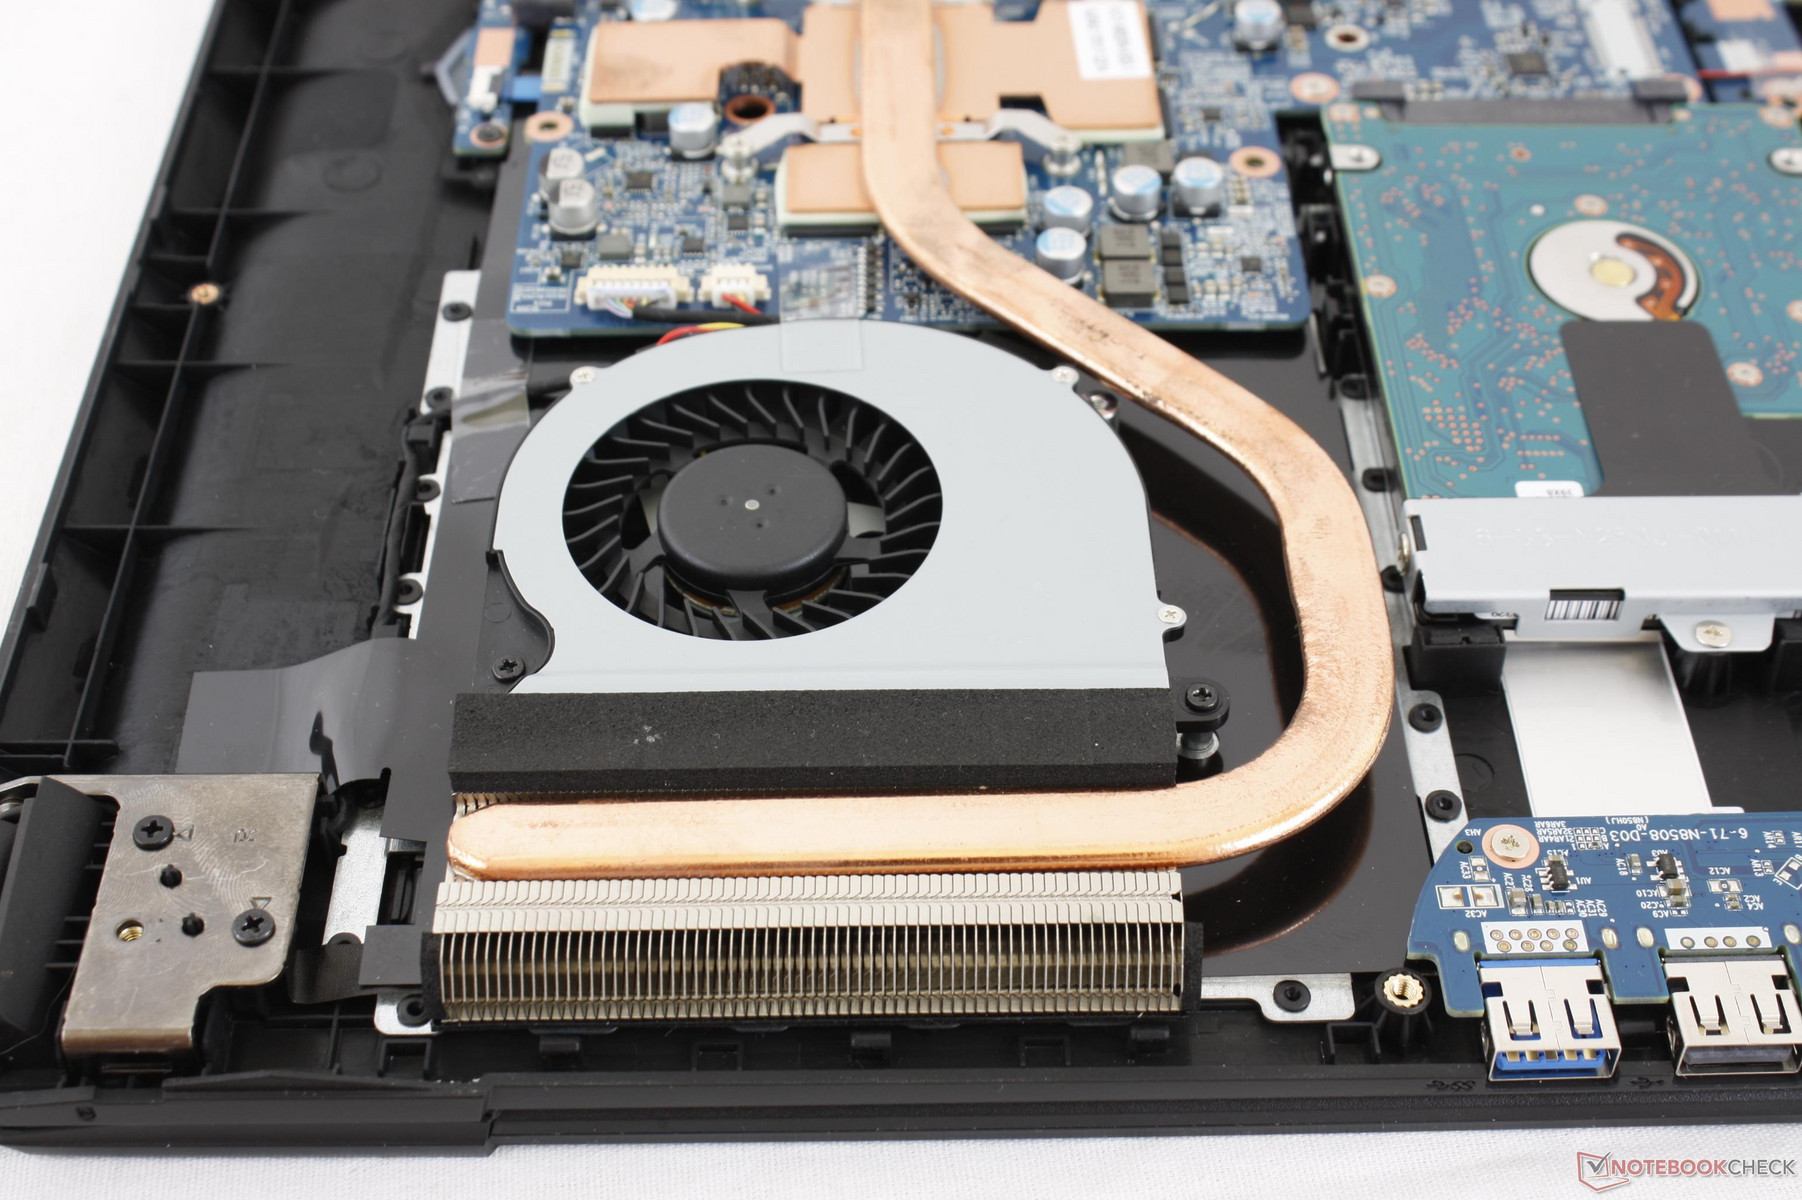
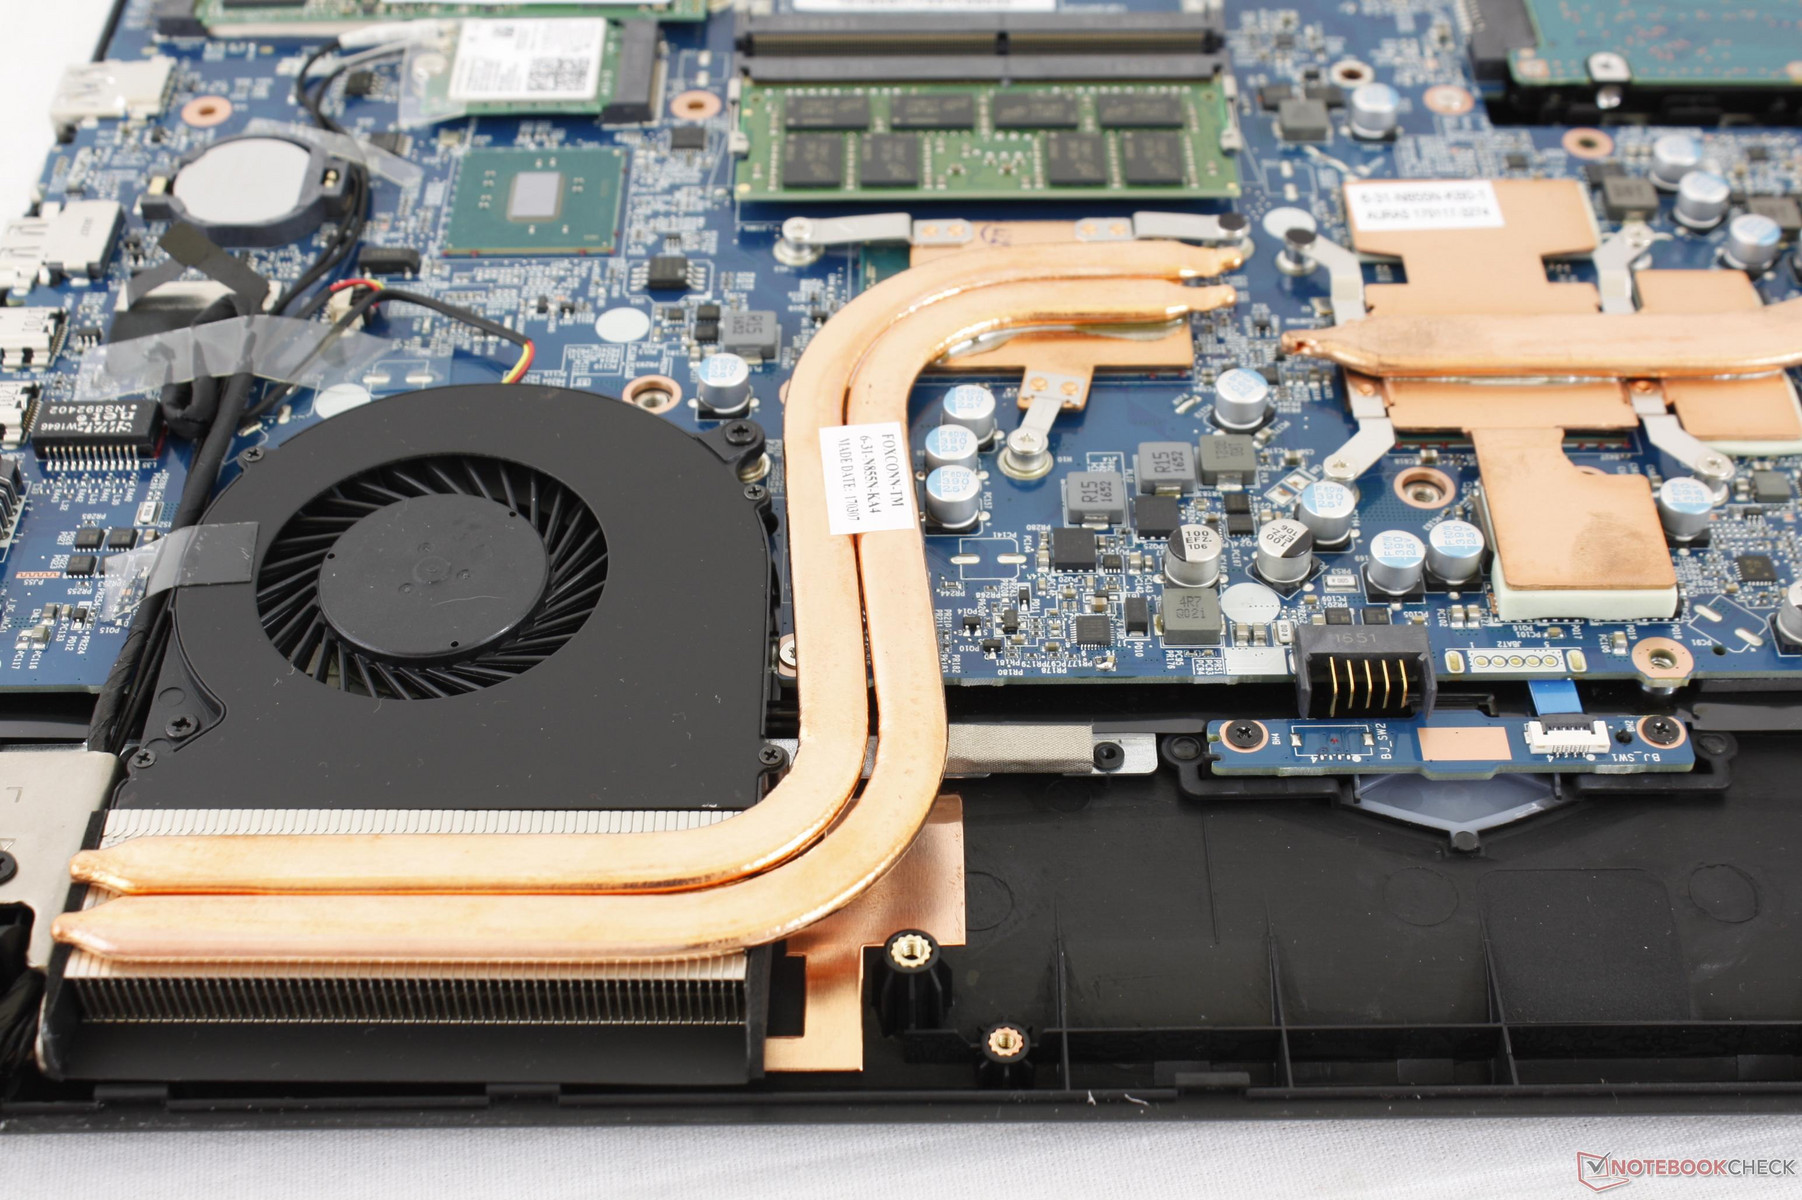
The cooling system consists of dual ~50 mm fans and three asymmetric heat pipes. Interestingly, Gigabyte has opted to keep CPU and GPU cooling mutually exclusive whereas most other notebooks have at least one heat pipe shared between the two processors. This design explains how the CPU can run as as cool as 50 C while the GPU can be much warmer at 78 C when under gaming stress.
Unfortunately, this approach does not appear to have any benefits in terms of fan noise. The fans are always active no matter the load and are generally louder than even the XPS 15 during low loads like streaming and browsing. The fans will infrequently but periodically pulse to a louder 34.7 dB(A) before quickly falling back down to its base 33 dB(A). We highly recommend running on Power Saver mode if not gaming in order to keep fan noise at a minimum.
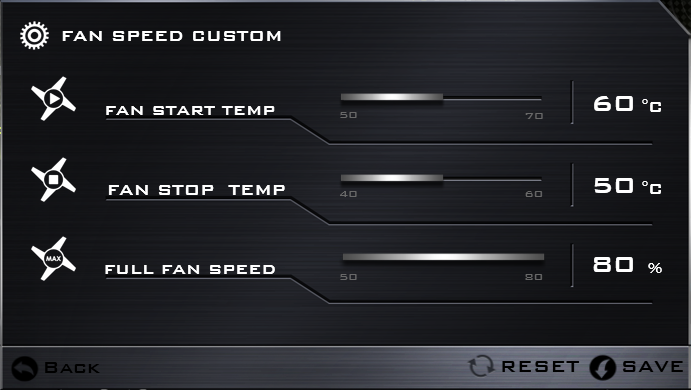
Medium load with 3DMark06 will bump the fans to 44.5 dB(A) after just two loops of the first "Return to Proxycon" scene to be significantly louder than even the more powerful Aero 15. Running Witcher 3 will bump fan noise even louder to a steady 49.2 dB(A). We find the high 40 dB(A) range to be very distracting when gaming to the point where headphones are recommended for a better experience. Setting the fan speed to "Maximum" through the Control Center menu will drive fan noise to 52.8 dB(A) with no benefits to CPU or GPU clock rates. This feature is not necessary for gaming purposes and was disabled during our benchmark tests.
Noise level
| Idle |
| 33 / 33.3 / 34.7 dB(A) |
| Load |
| 44.5 / 52.8 dB(A) |
 | ||
30 dB silent 40 dB(A) audible 50 dB(A) loud |
||
min: | ||
| Gigabyte Sabre 15G GeForce GTX 1050 Mobile, i7-7700HQ, Liteonit CV3-8D128 | Dell XPS 15 9560 (i7-7700HQ, UHD) GeForce GTX 1050 Mobile, i7-7700HQ, Lite-On CX2-8B512-Q11 | Gigabyte Aero 15 GeForce GTX 1060 Mobile, i7-7700HQ, Lite-On CX2-8B512-Q11 | HP Omen 15-ce002ng GeForce GTX 1060 Max-Q, i7-7700HQ, Samsung PM961 MZVLW256HEHP | Samsung Odyssey NP800G5M-X01US GeForce GTX 1050 Mobile, i7-7700HQ, Samsung PM961 NVMe MZVLW128HEGR | MSI GT62VR 7RE-223 GeForce GTX 1070 Mobile, i7-7700HQ, Samsung SSD PM871a MZNLN256HMHQ | |
|---|---|---|---|---|---|---|
| Noise | 4% | 4% | 4% | 7% | 1% | |
| off / environment * (dB) | 28.2 | 28.4 -1% | 31 -10% | 30 -6% | 28.1 -0% | 30 -6% |
| Idle Minimum * (dB) | 33 | 29 12% | 32 3% | 30 9% | 28.1 15% | 34 -3% |
| Idle Average * (dB) | 33.3 | 29 13% | 33 1% | 33 1% | 29.1 13% | 35 -5% |
| Idle Maximum * (dB) | 34.7 | 32.2 7% | 34 2% | 37 -7% | 29.1 16% | 36 -4% |
| Load Average * (dB) | 44.5 | 47.1 -6% | 39 12% | 41 8% | 49.2 -11% | 40 10% |
| Witcher 3 ultra * (dB) | 49.2 | 52 -6% | 43 13% | 42 15% | ||
| Load Maximum * (dB) | 52.8 | 47.1 11% | 50 5% | 50 5% | 49.2 7% | 46 13% |
* ... smaller is better
Temperature
Surface temperatures are flat on both sides if not slightly warmer than on other notebooks when idling on desktop. Note, however, that the right palm rest will always be warmer than the left because of the HDD underneath. We don't recommend running off of a primary HDD in order to avoid higher and potentially more uncomfortable temperature differences between the two palm rests.
Maximum load with both Prime95 and FurMark will cause the area around the "P" key to be as warm as 42 C while the palm rests, WASD and NumPad areas are cooler for a comfortable gaming experience. Surfaces immediately adjacent to the two ventilation grilles can also grow very warm, but these areas are thankfully easy to avoid during normal use. This is stark contrast to the Samsung Odyssey where a larger temperature discrepancy exists between the left and right sides of the notebook for an uneven gaming experience.
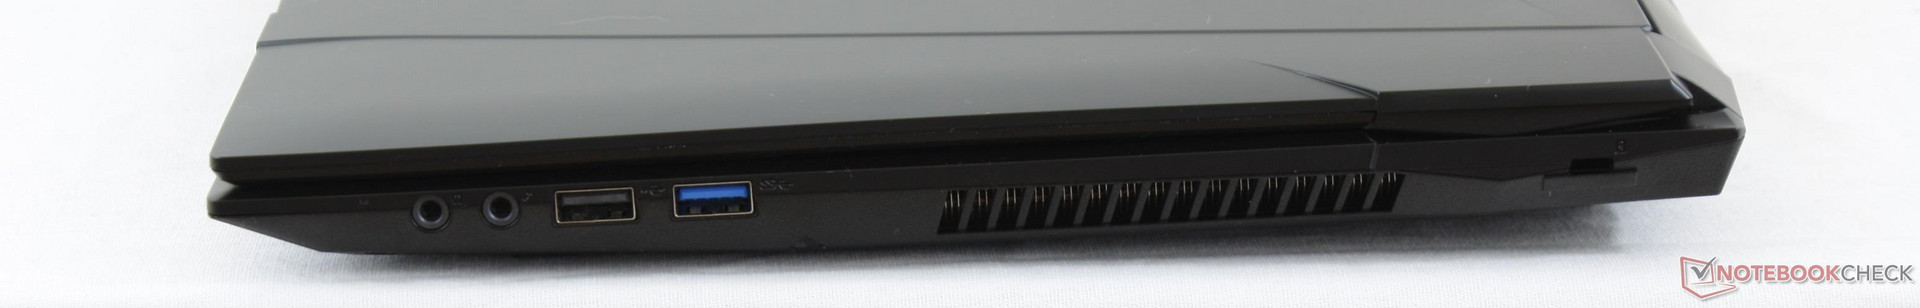
Right-handed mouse users may not like the fact that the GPU ventilation grilles are on the right edge of the notebook. This can lead to a sweaty hand from the constant warm air exhaust.
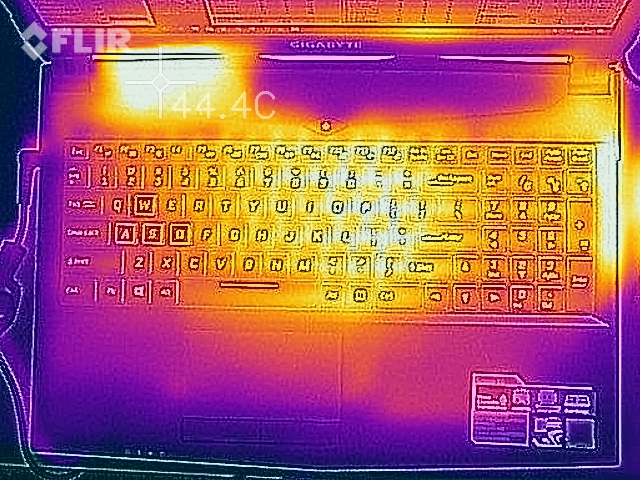
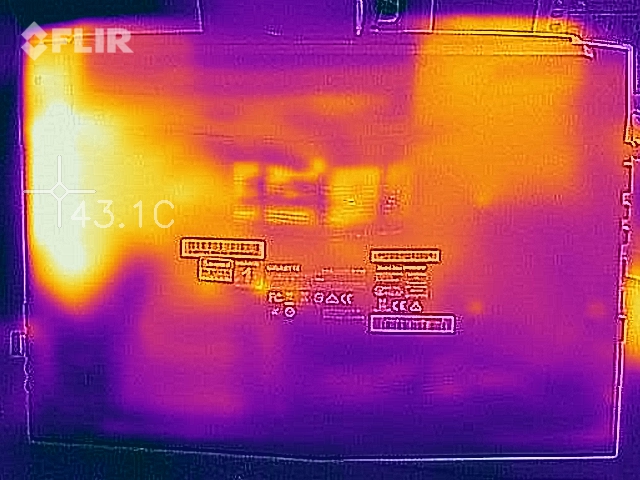
(±) The maximum temperature on the upper side is 43.6 °C / 110 F, compared to the average of 40.4 °C / 105 F, ranging from 21.2 to 68.8 °C for the class Gaming.
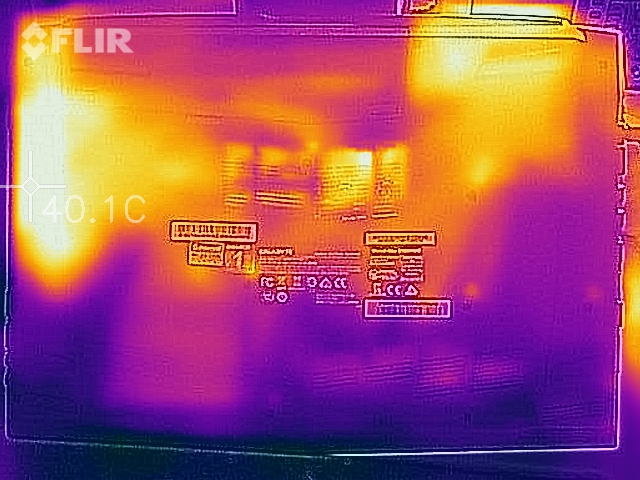
(±) The bottom heats up to a maximum of 40.2 °C / 104 F, compared to the average of 43.3 °C / 110 F
(+) In idle usage, the average temperature for the upper side is 26.4 °C / 80 F, compared to the device average of 33.9 °C / 93 F.
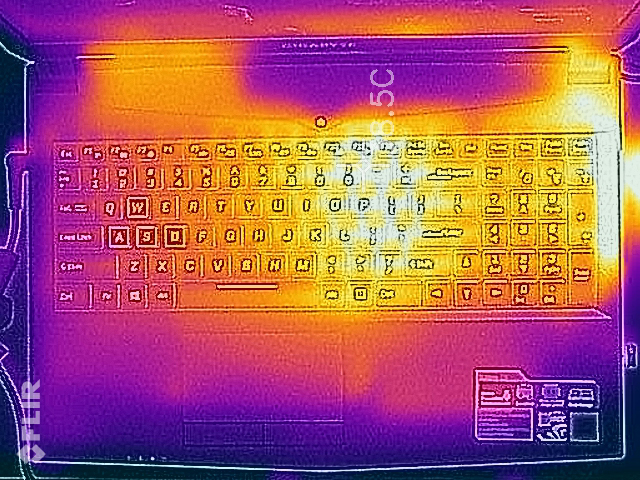
(+) Playing The Witcher 3, the average temperature for the upper side is 27.8 °C / 82 F, compared to the device average of 33.9 °C / 93 F.
(+) The palmrests and touchpad are cooler than skin temperature with a maximum of 30.4 °C / 86.7 F and are therefore cool to the touch.
(±) The average temperature of the palmrest area of similar devices was 28.9 °C / 84 F (-1.5 °C / -2.7 F).
Speakers

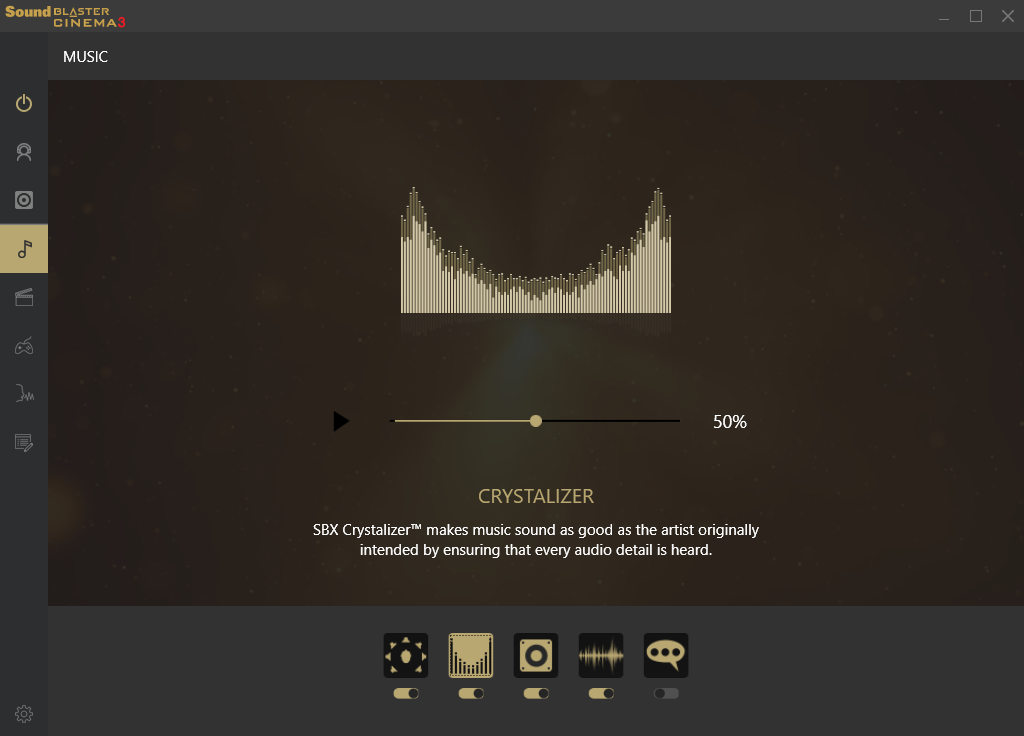
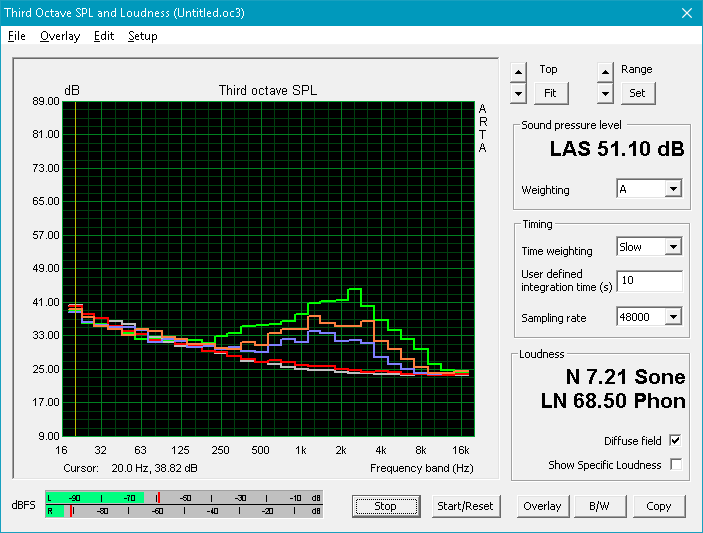
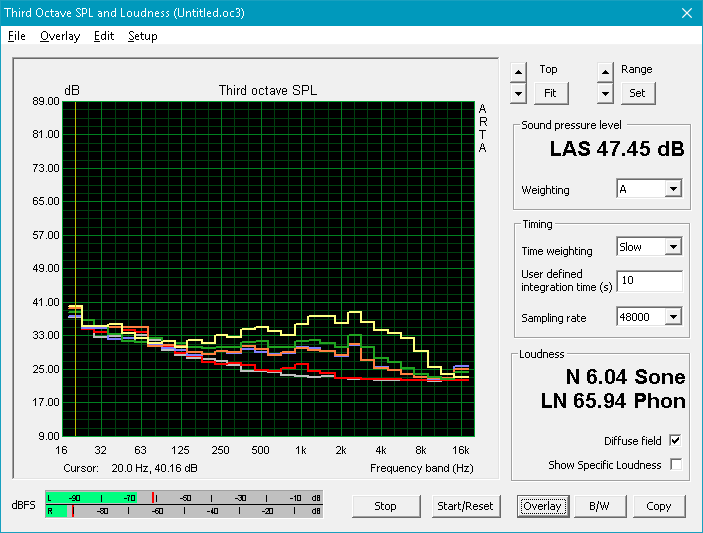
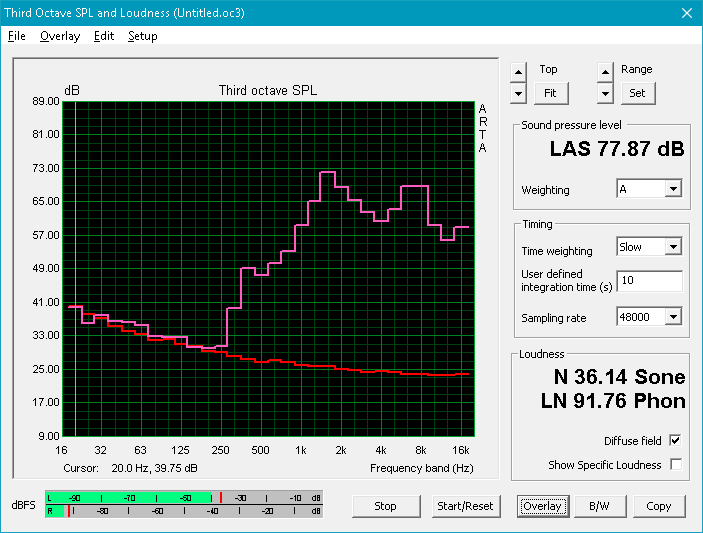
The 2 W stereo speakers are poor for a multimedia or gaming notebook. Bass reproduction is well below average and treble frequencies are overemphasized for a very unbalanced audio experience. We attempted to adjust the audio settings through the Sound Blaster Cinema 3 software, but none of our changes improved bass or quality by any sigificant extent. Our pink noise measurements below confirm the imbalance when compared to the more even curves of the Odyssey 15 or larger Eurocom X7E2. Headphones or external solutions are recommended if possible when gaming or during movie/music playback. On the plus side, maximum volume is sufficiently loud for a small room and will not introduce any static or chassis reverberations.

Gigabyte Sabre 15G audio analysis
(±) | speaker loudness is average but good (72 dB)
Bass 100 - 315 Hz
(-) | nearly no bass - on average 26.3% lower than median
(+) | bass is linear (6.3% delta to prev. frequency)
Mids 400 - 2000 Hz
(±) | reduced mids - on average 8.2% lower than median
(±) | linearity of mids is average (14.6% delta to prev. frequency)
Highs 2 - 16 kHz
(±) | higher highs - on average 5.1% higher than median
(±) | linearity of highs is average (11.2% delta to prev. frequency)
Overall 100 - 16.000 Hz
(-) | overall sound is not linear (36.7% difference to median)
Compared to same class
» 99% of all tested devices in this class were better, 0% similar, 1% worse
» The best had a delta of 6%, average was 18%, worst was 132%
Compared to all devices tested
» 94% of all tested devices were better, 1% similar, 5% worse
» The best had a delta of 4%, average was 24%, worst was 134%
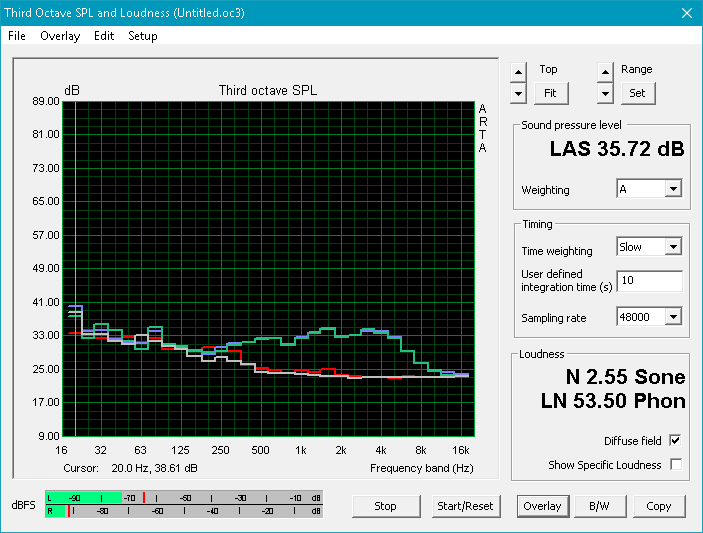
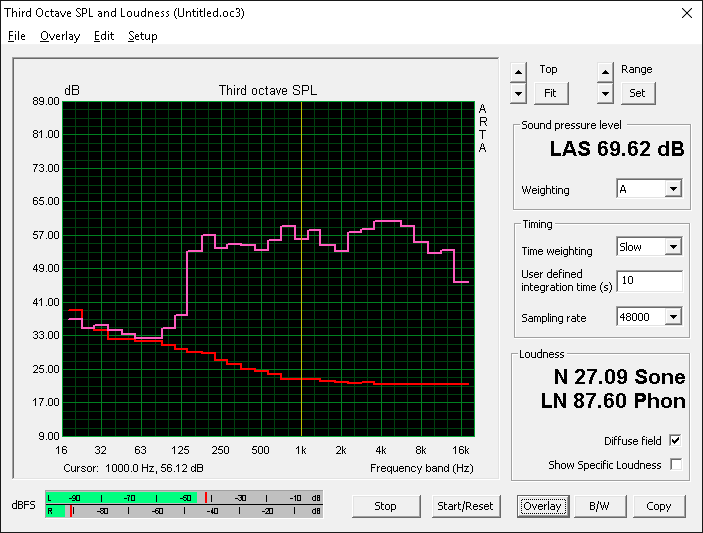
Apple MacBook 12 (Early 2016) 1.1 GHz audio analysis
(+) | speakers can play relatively loud (83.6 dB)
Bass 100 - 315 Hz
(±) | reduced bass - on average 11.3% lower than median
(±) | linearity of bass is average (14.2% delta to prev. frequency)
Mids 400 - 2000 Hz
(+) | balanced mids - only 2.4% away from median
(+) | mids are linear (5.5% delta to prev. frequency)
Highs 2 - 16 kHz
(+) | balanced highs - only 2% away from median
(+) | highs are linear (4.5% delta to prev. frequency)
Overall 100 - 16.000 Hz
(+) | overall sound is linear (10.2% difference to median)
Compared to same class
» 7% of all tested devices in this class were better, 2% similar, 91% worse
» The best had a delta of 5%, average was 18%, worst was 53%
Compared to all devices tested
» 4% of all tested devices were better, 1% similar, 94% worse
» The best had a delta of 4%, average was 24%, worst was 134%
Frequency Comparison (Checkbox selectable!)
Graph 1: Pink Noise 100% Vol.; Graph 2: Audio off
Energy Management
Power Consumption
The system is very efficient when idling on desktop at just 8 W to 11 W depending on the Windows Profile setting and brightness level. Overall power consumption is still very similar to the Samsung Odyssey at about 94 W each when gaming compared to 96 W and 111 W on our Omen 15 (Max-Q GTX 1060) and Aero 15 (GTX 1060), respectively.
Maximum load with both Prime95 and FurMark will draw about 106 W from the small power adapter (~15 x 7.5 x 2.5 cm) rated for up 120 W. While the power overhead is acceptable for our SKU, the higher-end Sabre 15 configuration with the GTX 1050 Ti will likely push the adapter closer to its limits. We would have preferred a higher capacity 140 W or 150 W AC adapter as a result.
| Off / Standby | |
| Idle | |
| Load |
|
Key:
min: | |
| Gigabyte Sabre 15G i7-7700HQ, GeForce GTX 1050 Mobile, Liteonit CV3-8D128, IPS, 1920x1080, 15.6" | Dell XPS 15 9560 (i7-7700HQ, UHD) i7-7700HQ, GeForce GTX 1050 Mobile, Lite-On CX2-8B512-Q11, IGZO IPS, 3840x2160, 15.6" | Gigabyte Aero 15 i7-7700HQ, GeForce GTX 1060 Mobile, Lite-On CX2-8B512-Q11, IPS, 1920x1080, 15.6" | HP Omen 15-ce002ng i7-7700HQ, GeForce GTX 1060 Max-Q, Samsung PM961 MZVLW256HEHP, IPS, 1920x1080, 15.6" | Samsung Odyssey NP800G5M-X01US i7-7700HQ, GeForce GTX 1050 Mobile, Samsung PM961 NVMe MZVLW128HEGR, IPS, 1920x1080, 15.6" | MSI GT62VR 7RE-223 i7-7700HQ, GeForce GTX 1070 Mobile, Samsung SSD PM871a MZNLN256HMHQ, IPS, 1920x1080, 15.6" | |
|---|---|---|---|---|---|---|
| Power Consumption | -35% | -41% | -78% | 3% | -104% | |
| Idle Minimum * (Watt) | 8 | 11.9 -49% | 12 -50% | 18 -125% | 6.7 16% | 20 -150% |
| Idle Average * (Watt) | 10.9 | 17.1 -57% | 15 -38% | 23 -111% | 8.9 18% | 24 -120% |
| Idle Maximum * (Watt) | 11 | 17.3 -57% | 20 -82% | 30 -173% | 10.8 2% | 29 -164% |
| Load Average * (Watt) | 76.7 | 94.7 -23% | 82 -7% | 85 -11% | 81.8 -7% | 82 -7% |
| Witcher 3 ultra * (Watt) | 94.9 | 104.8 -10% | 111 -17% | 96 -1% | 92.2 3% | |
| Load Maximum * (Watt) | 106.4 | 122 -15% | 161 -51% | 158 -48% | 122.7 -15% | 193 -81% |
* ... smaller is better
Battery Life
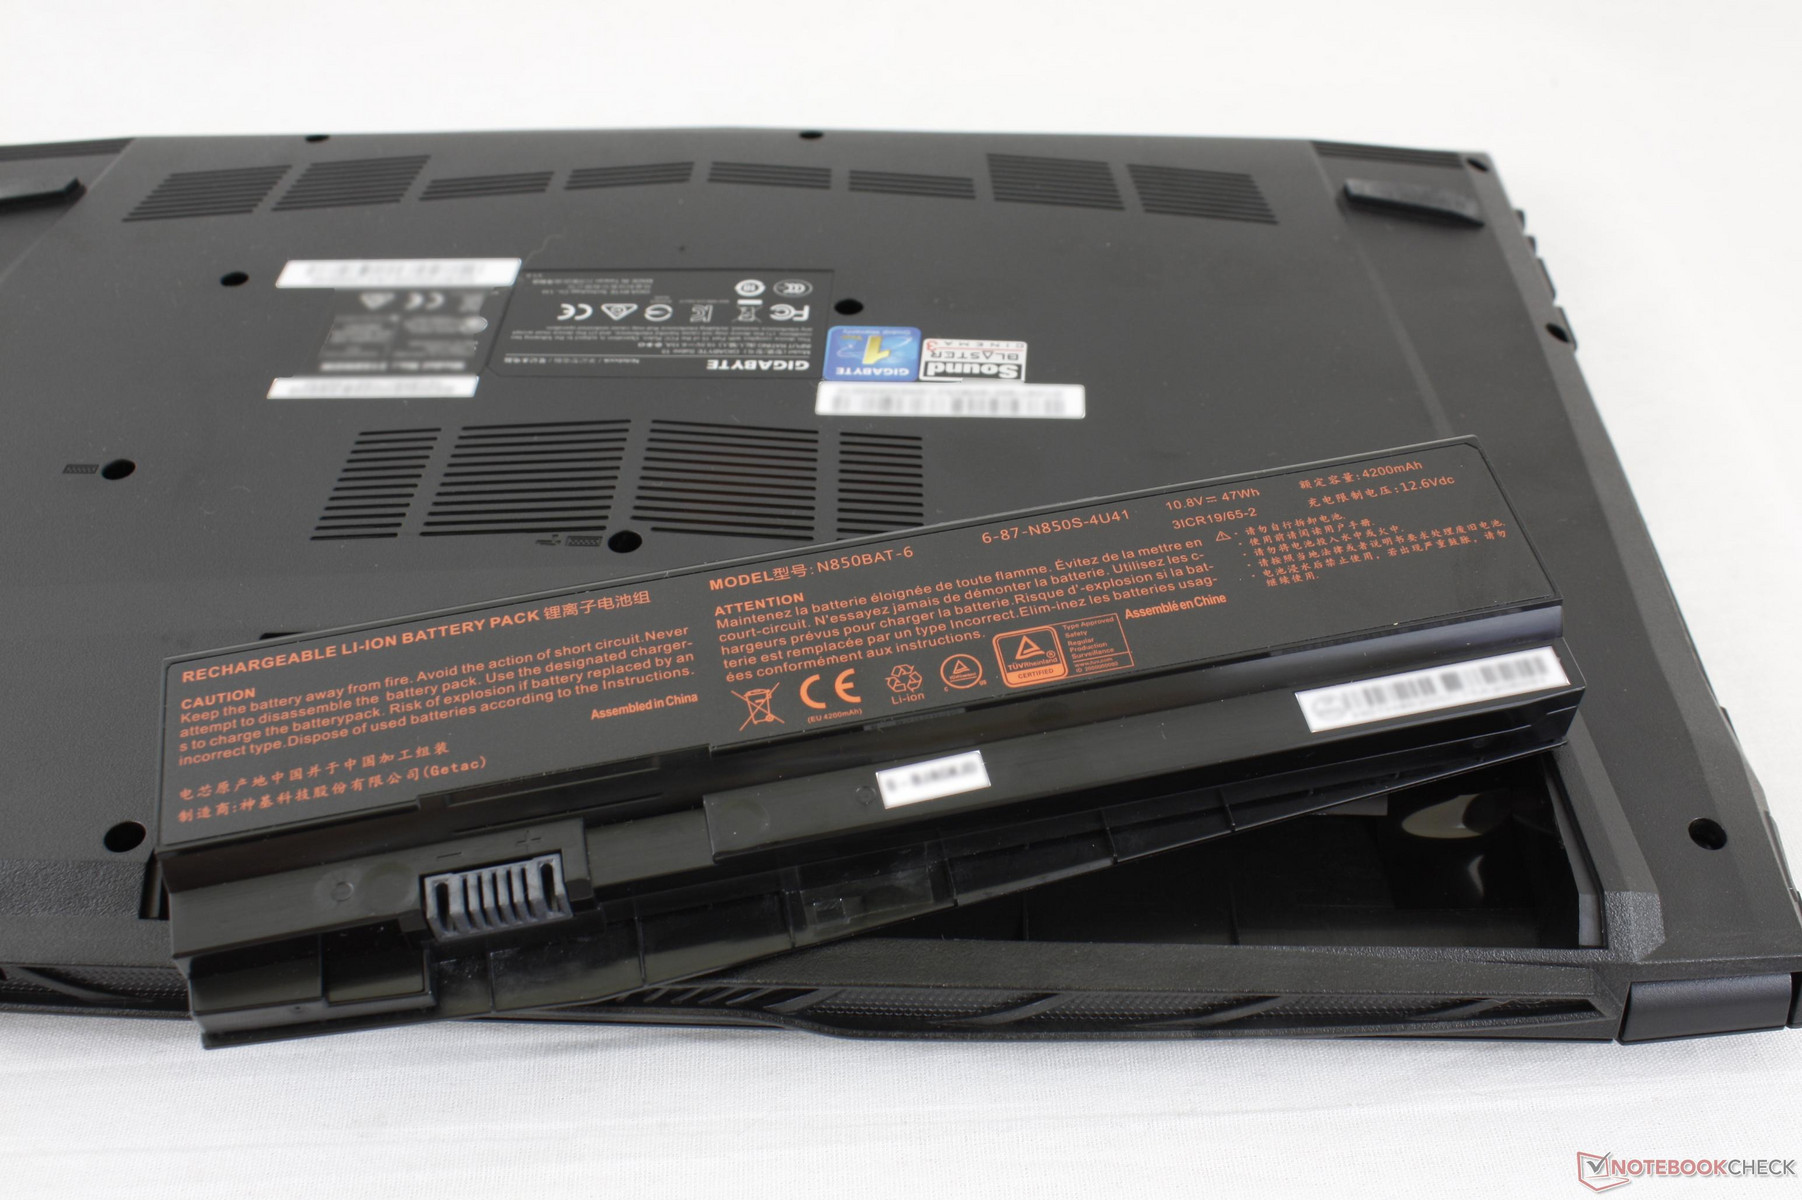
Runtimes from the 47 Wh Li-Ion battery are average at just under 4.5 hours during real-world WLAN conditions (Windows Balanced profile + Nvidia Auto-Select graphics profile). Users should be able to squeeze out another hour or so if simply word processing on the Power Saver profile, but the battery capacity is rather small compared to other 15-inch notebooks like the XPS 15 (97 Wh), Aero 15 (94 Wh), and Omen 15 (70 Wh). The similarly equipped Dell and Aero 15, for example, can last for over 7 hours each under similar WLAN loads.
We applaud the manufacturer for incorporating a removable battery into the Sabre design whereas most gaming notebooks have integrated Li-Ion polymer batteries. The easy battery swapping should come in handy for backup and pain-free warranty replacements if necessary. Charging from near empty to full capacity will take just 1.5 hours.
| Gigabyte Sabre 15G i7-7700HQ, GeForce GTX 1050 Mobile, 47 Wh | Dell XPS 15 9560 (i7-7700HQ, UHD) i7-7700HQ, GeForce GTX 1050 Mobile, 97 Wh | Gigabyte Aero 15 i7-7700HQ, GeForce GTX 1060 Mobile, 94.24 Wh | HP Omen 15-ce002ng i7-7700HQ, GeForce GTX 1060 Max-Q, 70 Wh | Samsung Odyssey NP800G5M-X01US i7-7700HQ, GeForce GTX 1050 Mobile, 43 Wh | MSI GT62VR 7RE-223 i7-7700HQ, GeForce GTX 1070 Mobile, 75 Wh | |
|---|---|---|---|---|---|---|
| Battery runtime | 55% | 45% | -24% | 8% | -2% | |
| Reader / Idle (h) | 8.2 | 13.9 70% | 10.6 29% | 4.3 -48% | 10.2 24% | 6.3 -23% |
| WiFi v1.3 (h) | 4.4 | 7.2 64% | 7 59% | 3.3 -25% | 4.4 0% | 4.1 -7% |
| Load (h) | 1.3 | 1.7 31% | 1.9 46% | 1.3 0% | 1.3 0% | 1.6 23% |
Pros
Cons
Verdict
Gigabyte's new Sabre 15 brings a lot of features for an entry-level gaming notebook. The deep 2 mm key travel, three-zone full RGB backlight, triple video-out ports, double storage bays, and energetic design are all compelling reasons to purchase the Sabre over other budget gaming notebooks like the Pavilion 15 Power, Samsung Odyssey, or Asus FX553 at the same price range. It's a strong first impression that we believe is key when introducing a new model and series.
There are still lots of room for improvement especially in terms of fan noise and audio. The GTX 1050 is less powerful than the GTX 1050 Ti and GTX 1060 yet the Sabre 15 runs more loudly than notebooks sporting more powerful GPUs. Combine the loud fan noise with the poor bass reproduction and you have a subpar sound experience if not wearing a good pair of headphones. The base is solid and firmer than on both the Asus FX553 and Odyssey, but the lid could definitely be better by reducing the uneven backlight bleeding and addressing the protruding inner bezels. We're hoping that future revisions will add even more hardware options like 120 Hz refresh, 5 ms response times, G-Sync, and Thunderbolt 3.
If the small form factor is a must, then the Sabre 15 is one of the better budget gaming notebooks available with its respectable set of features. Thicker 15-inch gaming notebooks like the GT62VR are still recommended for quieter fan noise and better speakers.
Gigabyte Sabre 15G
- 07/24/2017 v6 (old)
Allen Ngo
Price comparison
