 Deutsch
 English
 Español
 Français
 Italiano
 Nederlands
 Polski
 Português
 Русский
 Türkçe
 Svenska
 Chinese
 Magyar
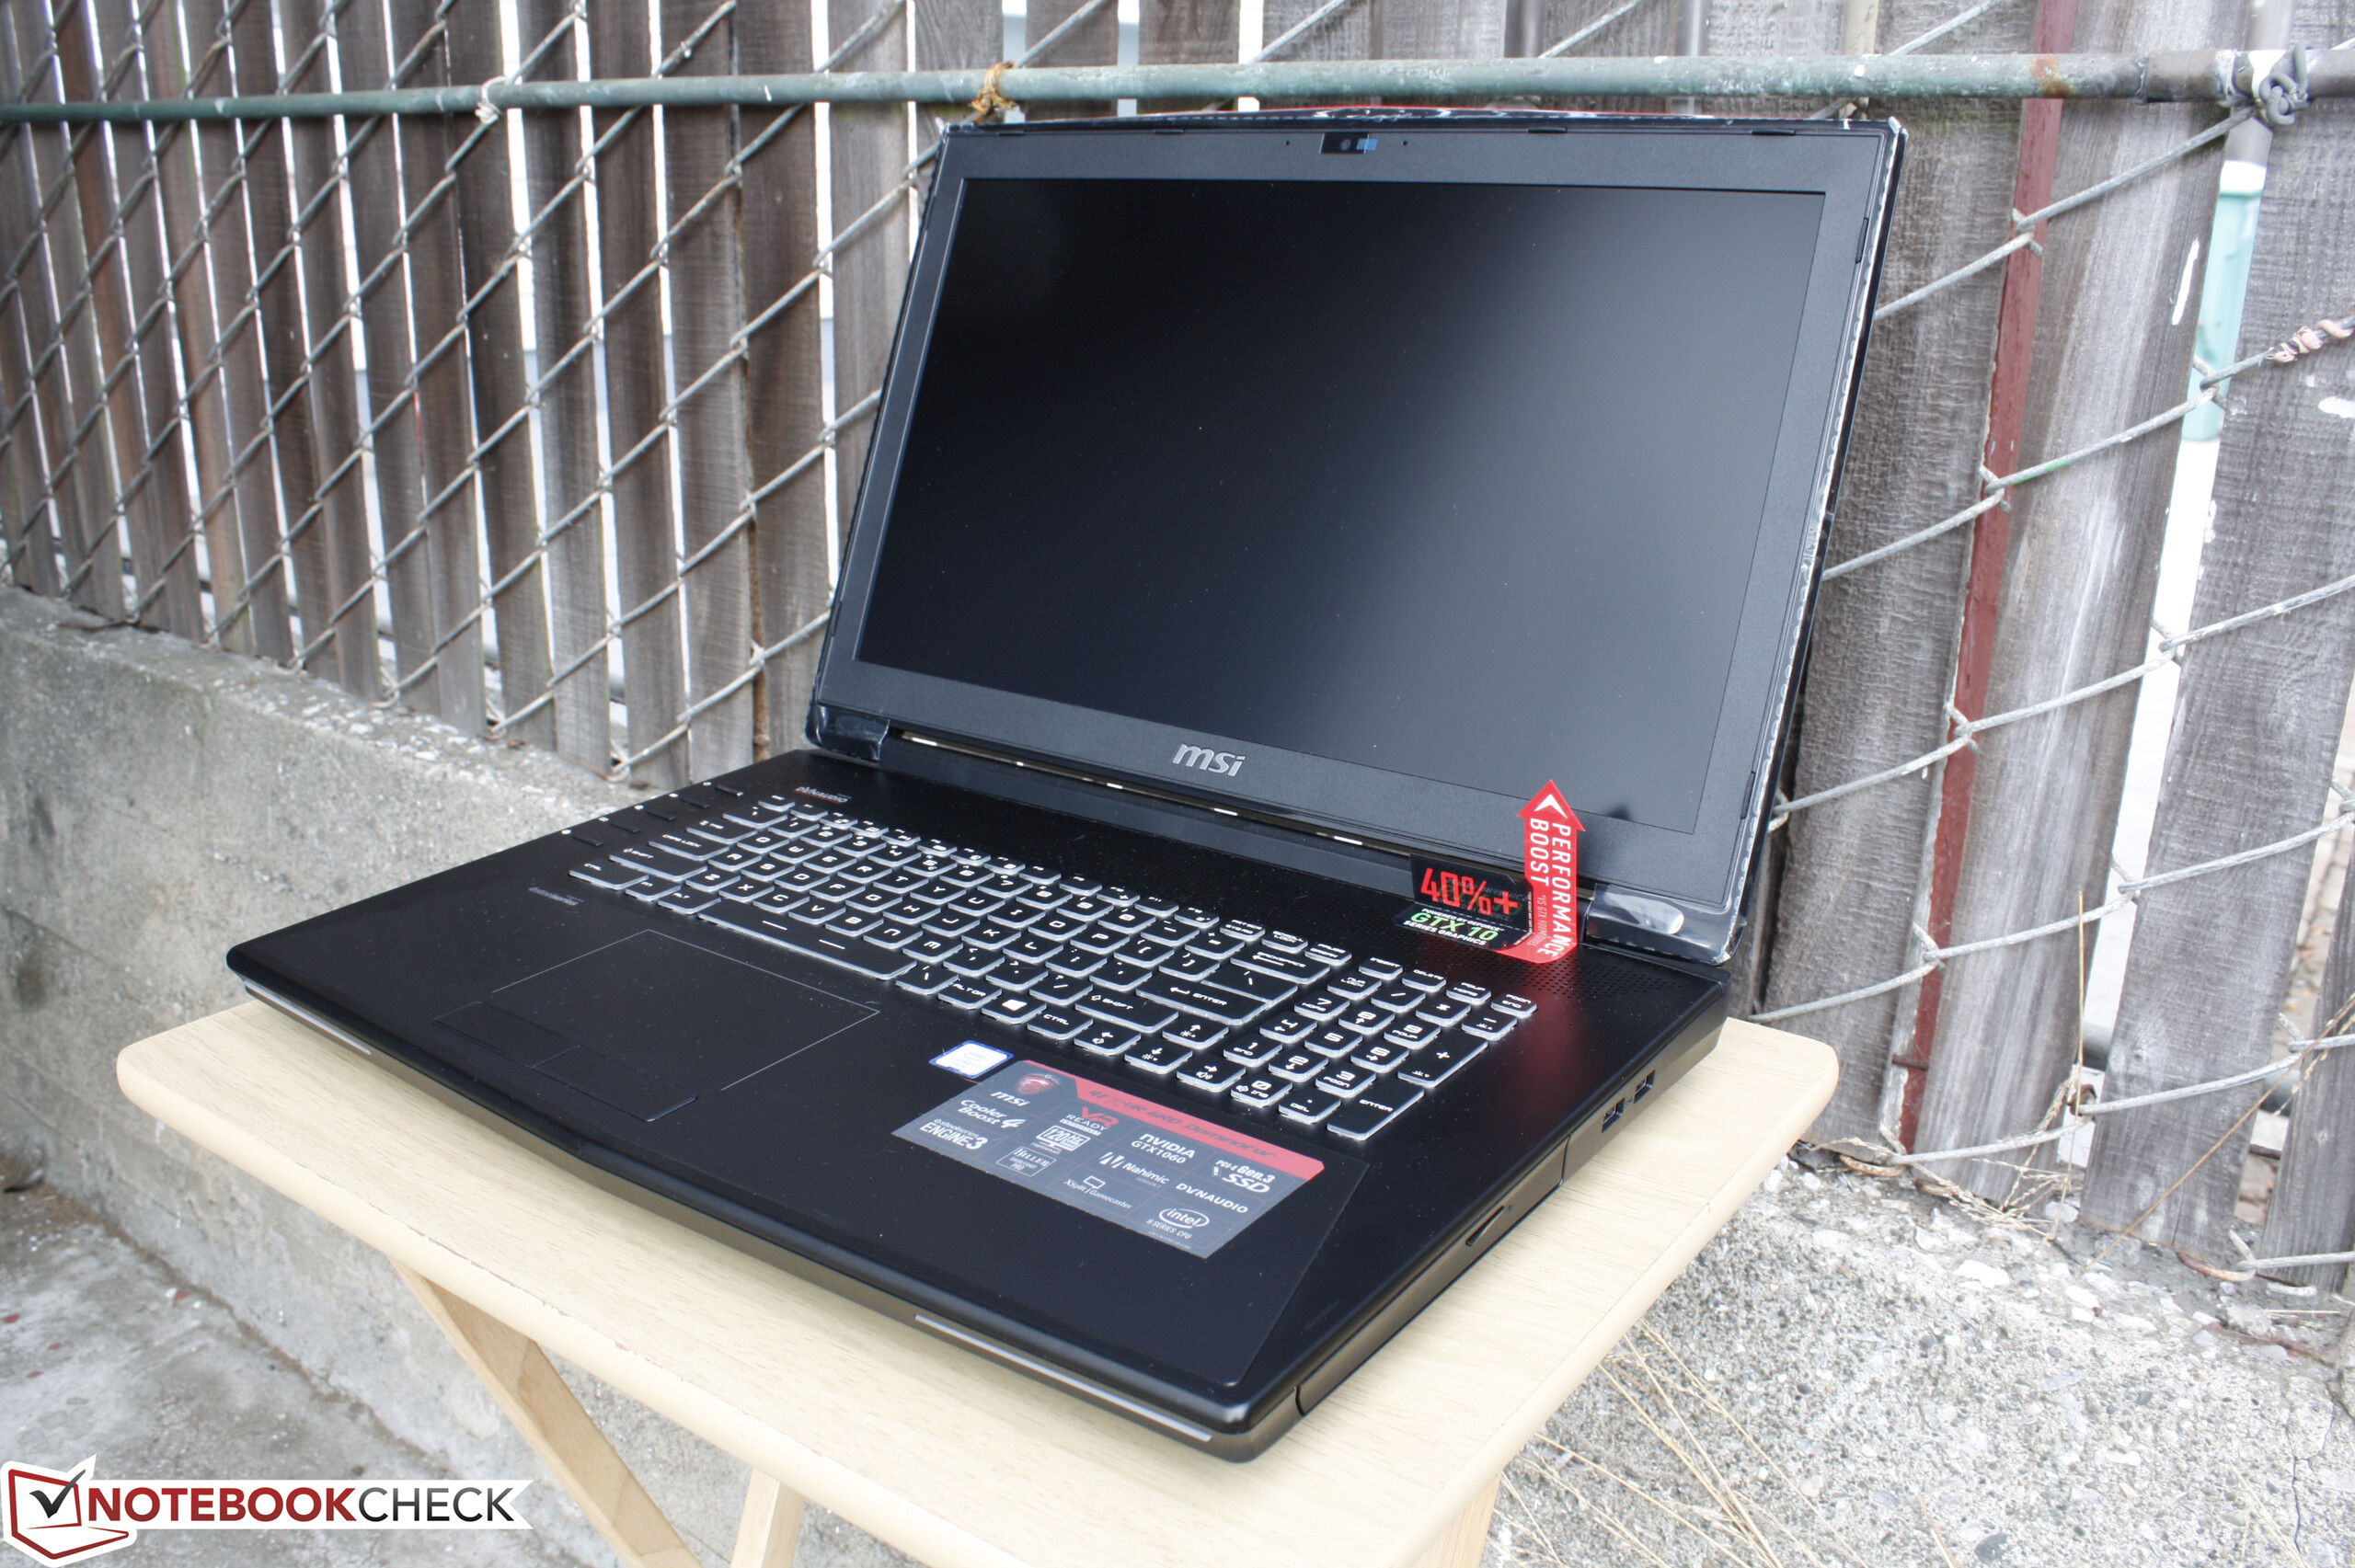
MSI GT72VR 6RD Dominator Pro Notebook Review

The MSI GT series is the manufacturer's premier lineup in its family of gaming notebooks, so it's only natural that we cover multiple SKUs of the same chassis. This time, we check out the GT72VR 6RD equipped with the GTX 1060 GPU whereas our previous GT72VR 6RE shipped with the GTX 1070. We recommend reading up on our full review of the GT72VR 6RE and even our older GT72 pages for more details on the chassis and its features.
The GT72VR with GTX 1060 starts at around $1600 USD while the GT72VR with GTX 1070 starts at $2000 USD. The GT72 series has been succeeded by the recent GT73VR, but MSI is keeping the GT72 series alive with Pascal and new display options ranging from 120 Hz 1080p panels to 4K UHD with full sRGB coverage. Does this lesser-equipped configuration run any cooler or quieter than its GTX 1070 SKU?
Case
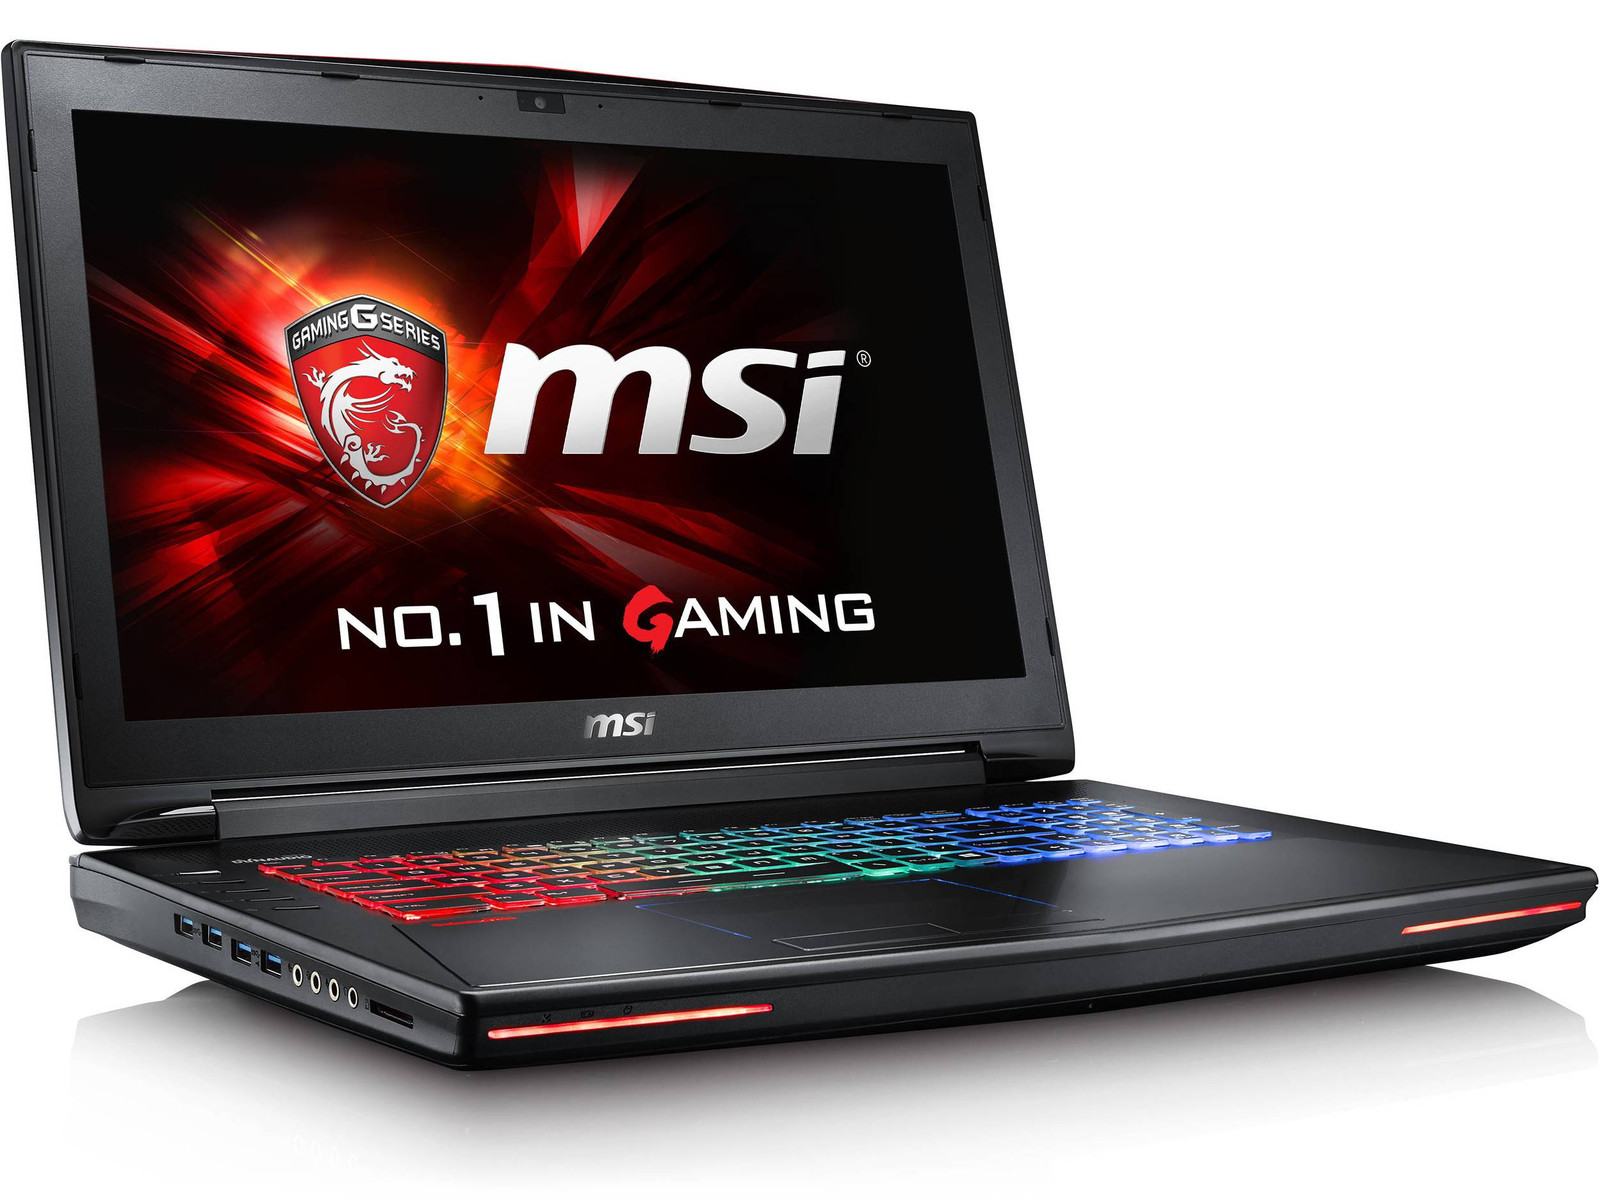
The tried-and-true GT72 chassis makes its return unscathed as the GT72VR. Workmanship is excellent on our test unit from top to bottom as can notice no unintended gaps between edges and corners and there is only minimal creaking and flexing when applying pressure around the base. Perhaps more importantly, the inner display bezel sits properly and evenly against the edge of the screen unlike on our previous GT72VR test unit. The weakest part of the chassis relative to the rigid base continues to be the lid, which naturally bends more easily around its center and front corners. The display is slightly more susceptible to twists than on the Asus G752 series.
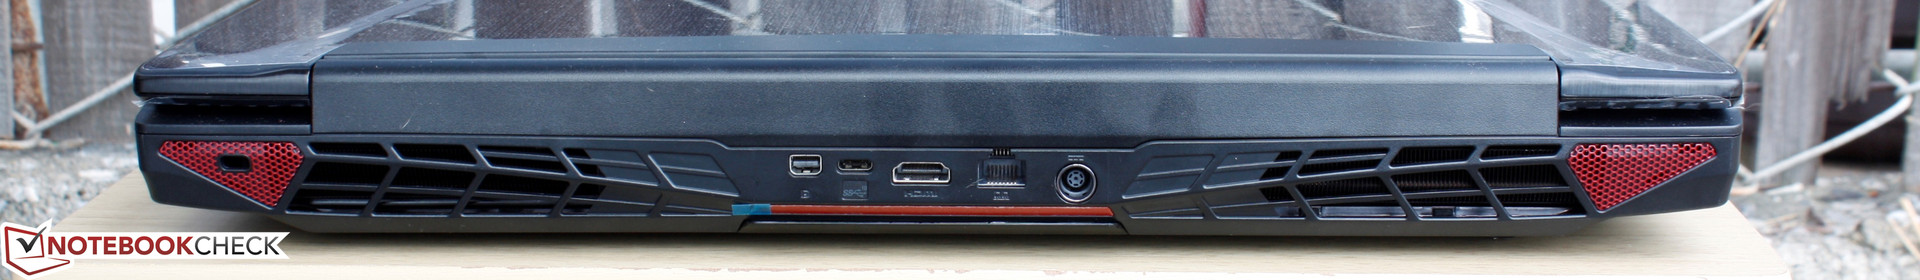
Connectivity
The system has a healthy number of connectivity features including a total of six USB Type-A ports, four dedicated audio ports, and two video-out ports. Other gaming notebooks may include Thunderbolt 3 and/or HDMI 2.0, both of which are missing on the GT72VR. MSI has confirmed with us that external monitors with G-Sync are supported via the HDMI and mDP ports.


SD Card Reader
Transfer rates are very fast on the GT72 series at nearly 200 MB/s according to AS SSD compared to 90 MB/s on most high-end notebooks and Ultrabooks or even 30 MB/s on some other MSI notebooks like the GS43VR.
| SD Card Reader | |
| average JPG Copy Test (av. of 3 runs) | |
| MSI GT72VR 6RD-063US | |
| Acer Predator 17 G9-793-77LG | |
| MSI GS73VR 6RF | |
| maximum AS SSD Seq Read Test (1GB) | |
| MSI GT72VR 6RD-063US | |
| Acer Predator 17 G9-793-77LG | |
| MSI GS73VR 6RF | |
Communication
WLAN is provided by an Atheros/Qualcomm QCA6174 M.2 module capable of transfer rates of up to 867 Mbps on an 802.11ac network. A real-world test using Jperf settings as shown below reveal an average transfer rate of about 530 Mbps when connected to our Linksys EA8500 test router. We experienced no connectivity issues during our time with the test unit.


| Networking | |
| iperf Server (receive) TCP 1 m 512KB | |
| MSI GS43VR 6RE-006US | |
| MSI GT72VR 6RD-063US | |
| iperf Client (transmit) TCP 1 m 512KB | |
| MSI GT72VR 6RD-063US | |
| MSI GS43VR 6RE-006US | |
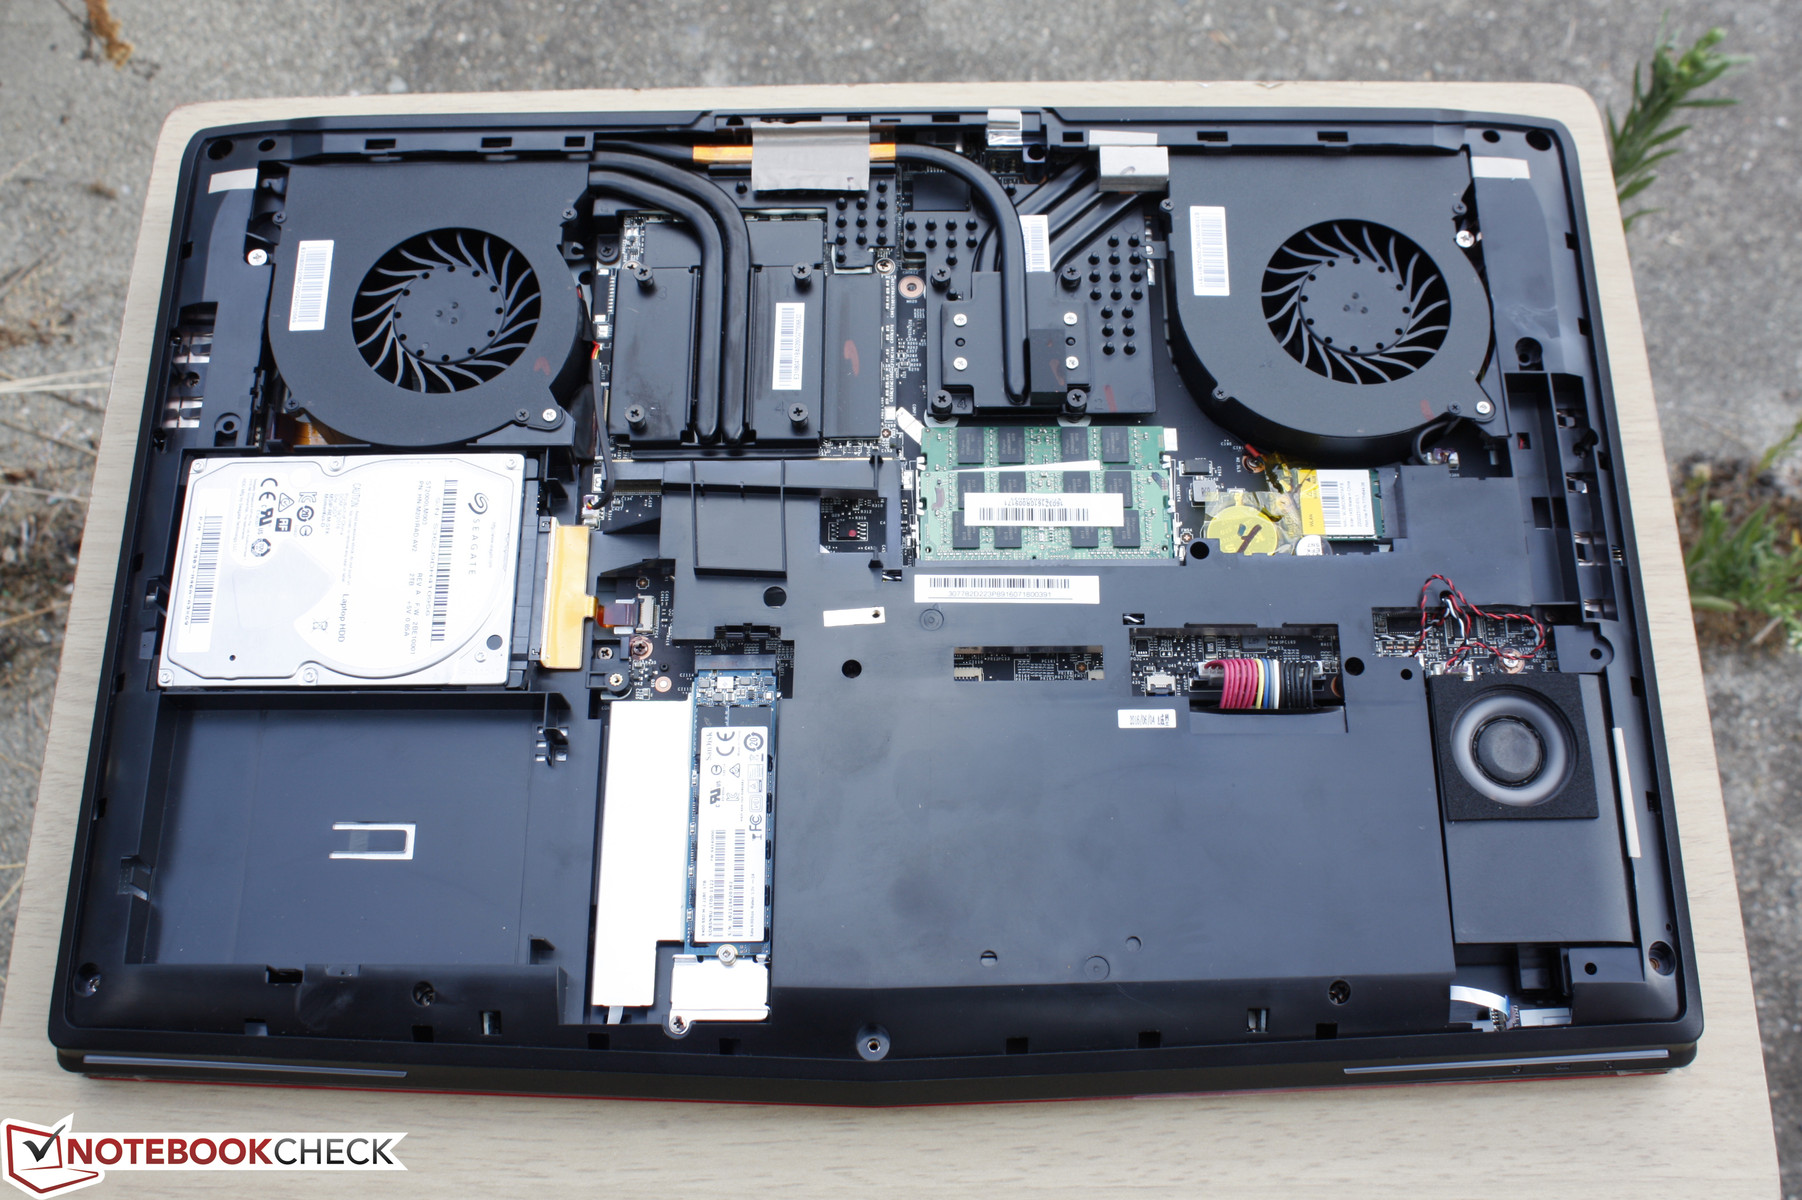
Maintenance
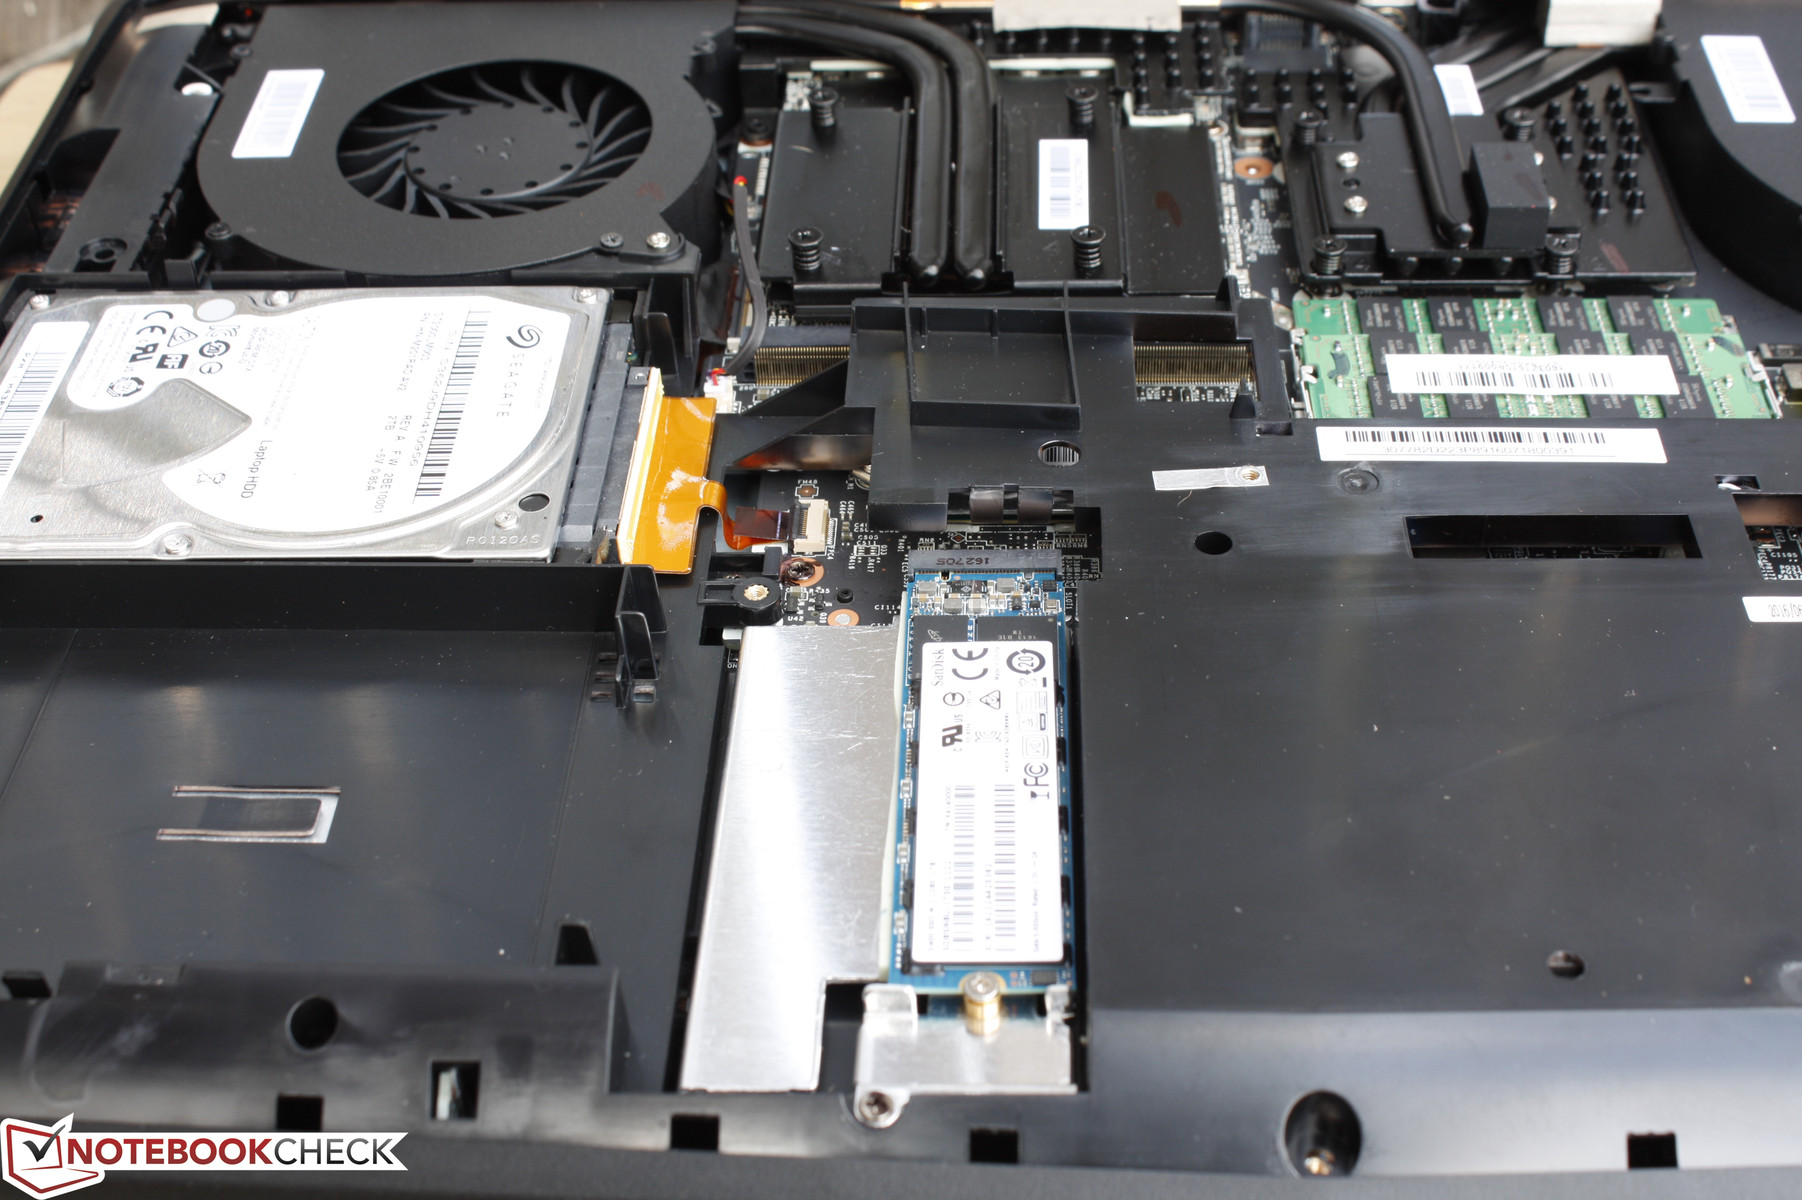
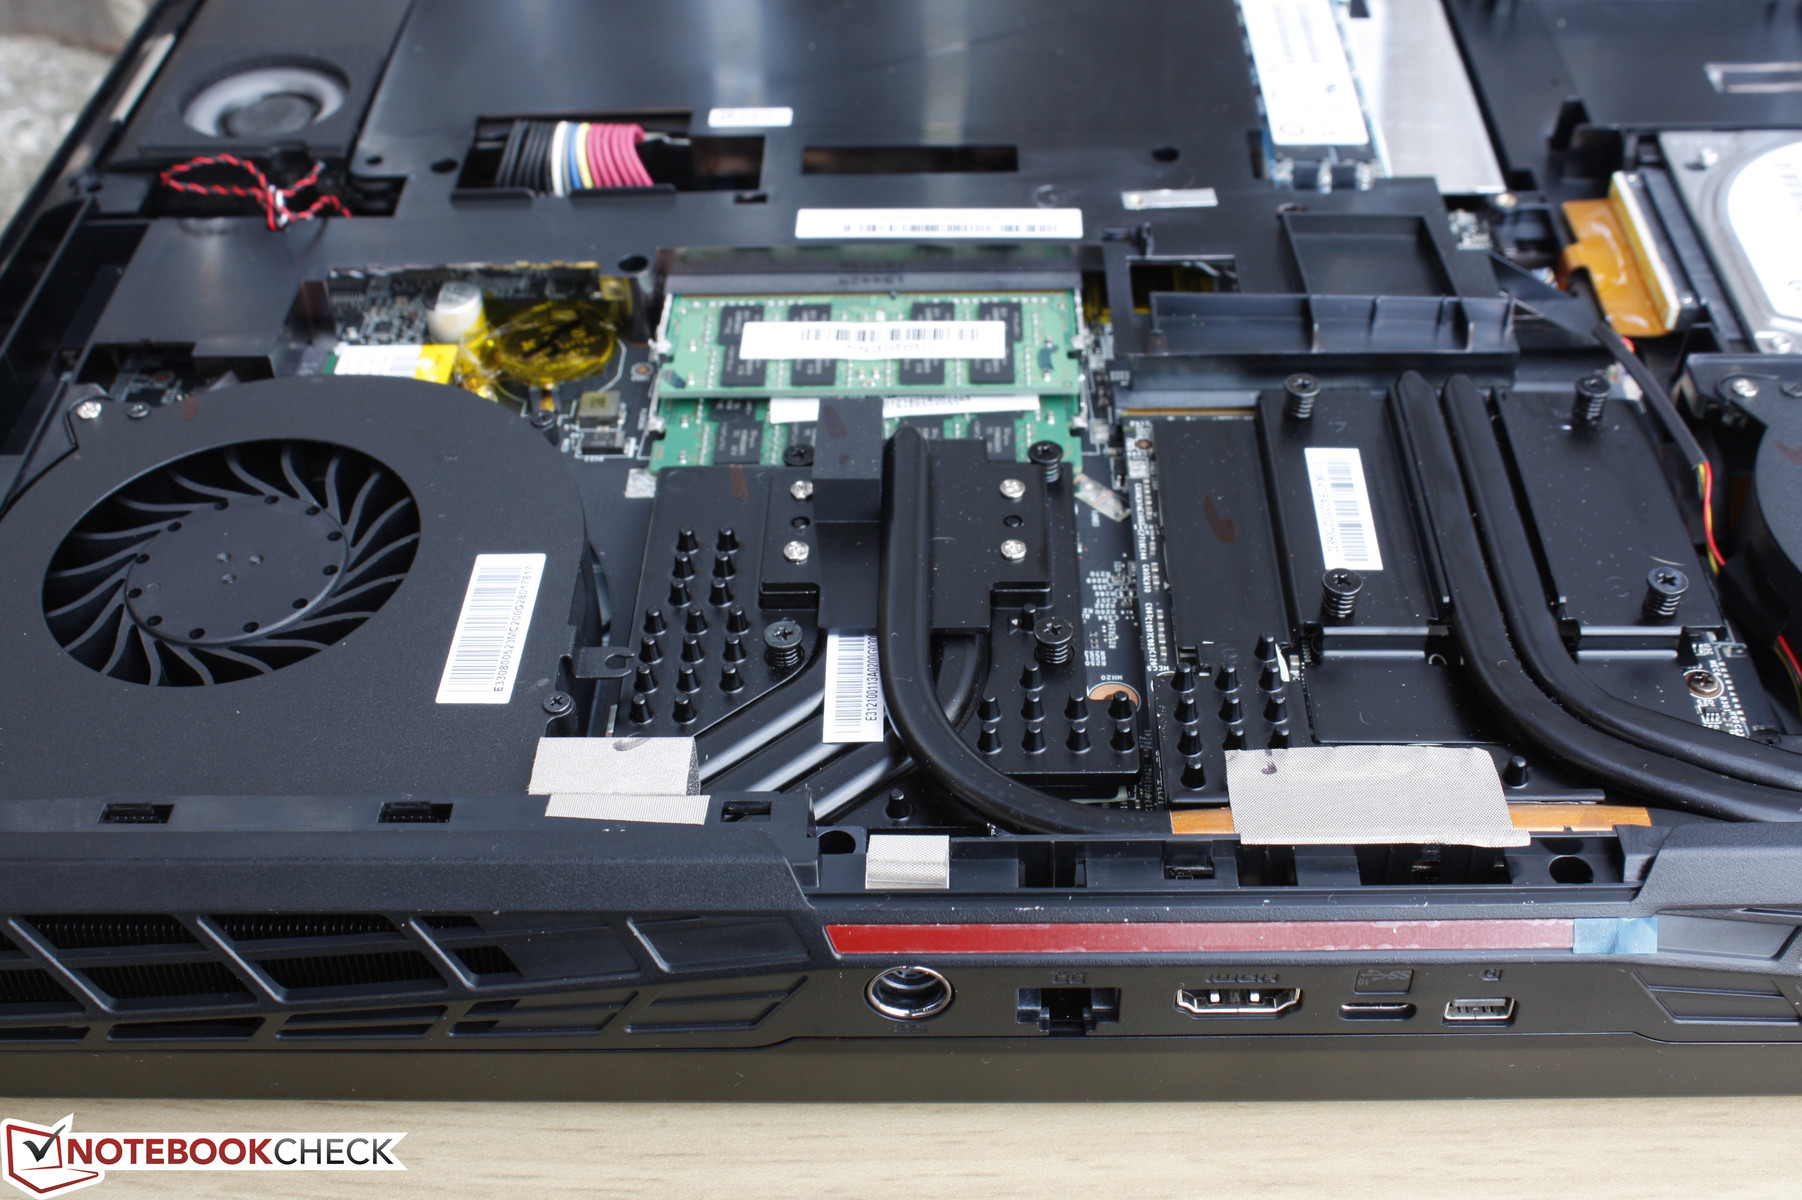
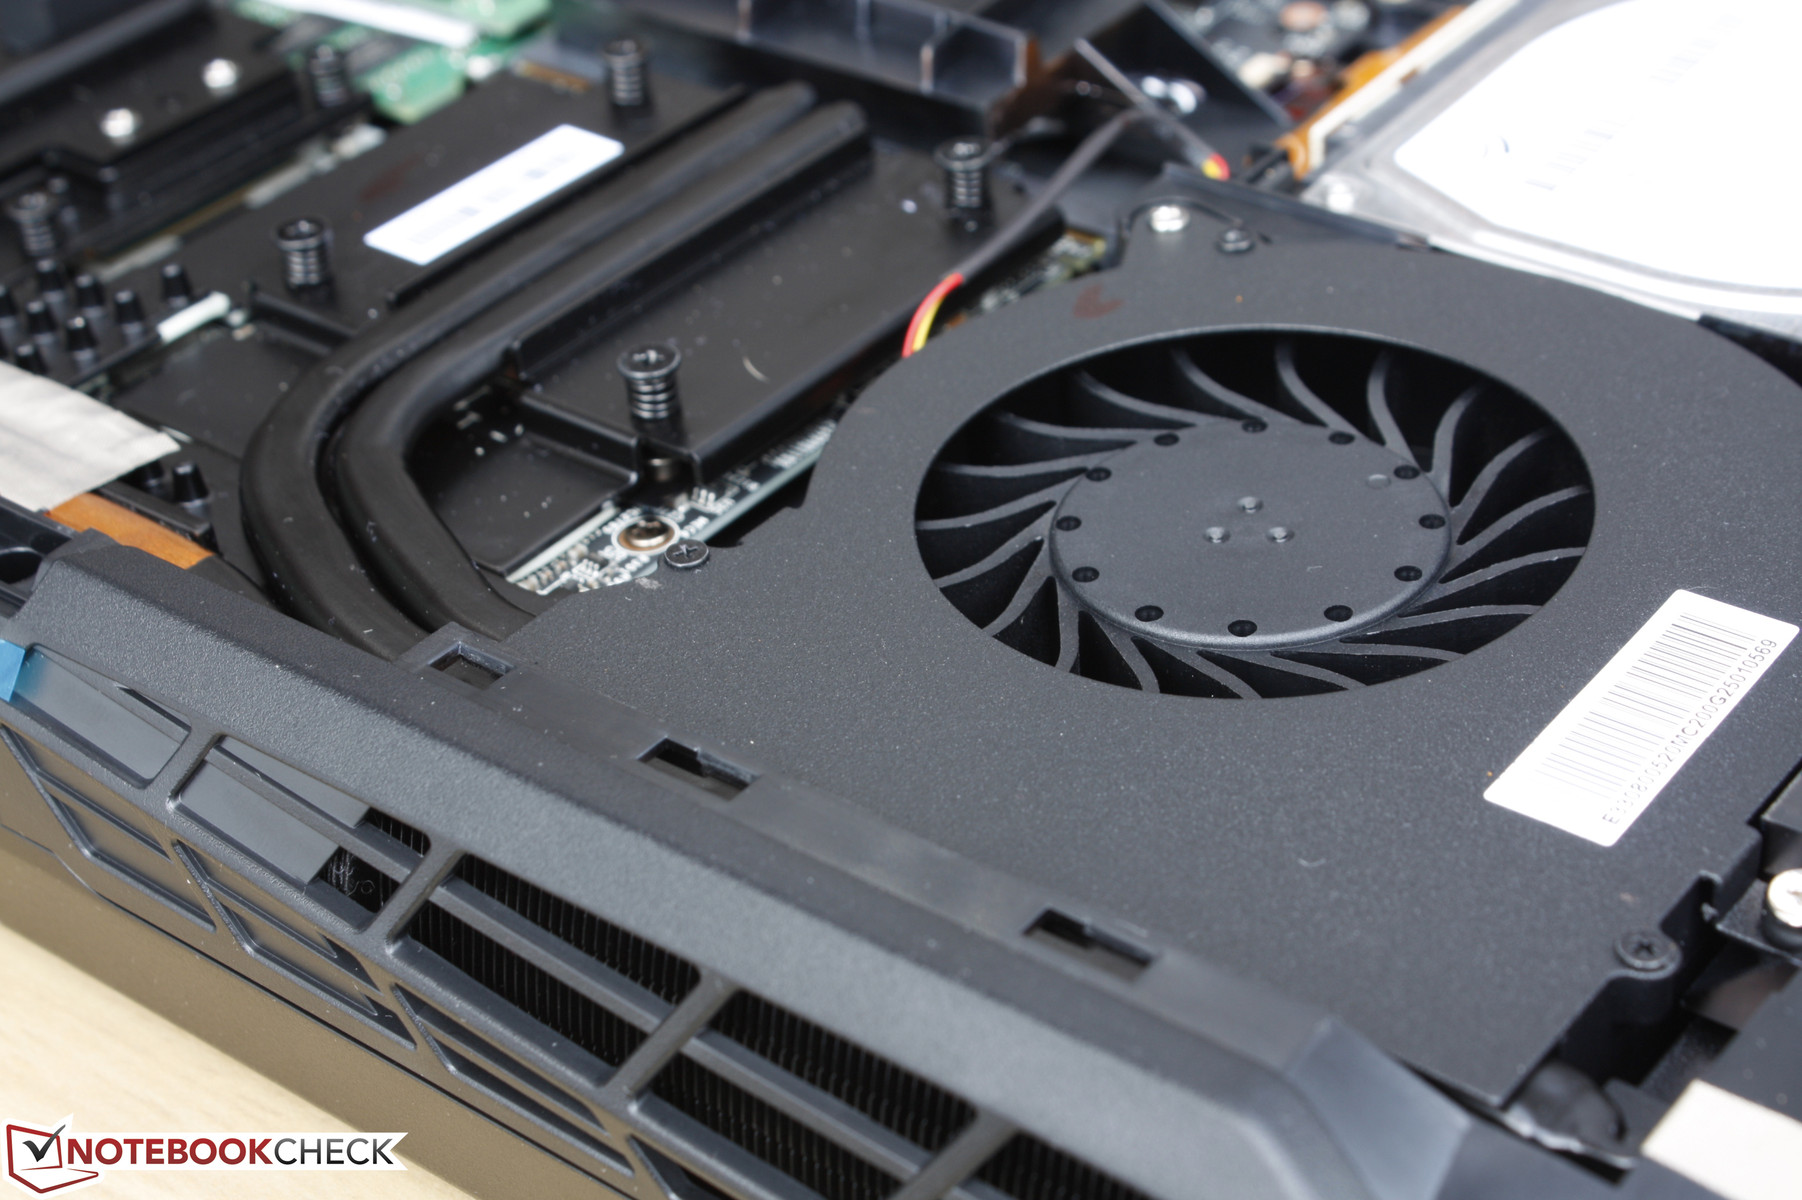
MSI has a habit of making its G series of gaming notebooks easily serviceable and the GT72 series is no different. The bottom panel comes off easily with just a Philips screwdriver to reveal the cooling solution and most other upgradeable components including the removable GPU. Additional disassembly is required to access the last two SODIMM slots.
Note that removing the panel may void the manufacturer warranty. The configuration of the heat pipes are different than on the GT72VR 6RE with the faster GTX 1070 GPU.
Warranty
MSI offers the a two-year limited warranty as standard with three additional months for users who choose to register their notebooks with the manufacturer. CUKUSA covers any hardware installed by the reseller for up to three years including storage drives and RAM modules.
Input Devices
Keyboard & Touchpad
The SteelSeries chiclet keyboard and touchpad are consistent across MSI's 15-inch and 17-inch gaming notebooks with RGB backlighting and a firm but surprisingly quiet stroke. Key layout is spacious and agreeable, but the G series as a whole continues to lack dedicated Macro keys that many competitors have including the Asus G752 or Aorus X7 and individually-lit keys like on the Lenovo Y900. The touchpad is completely flushed with the palm rests for a smoother look, but some users may not like that there is no tactile separation between where the edges of the touchpad begin or end.

Display
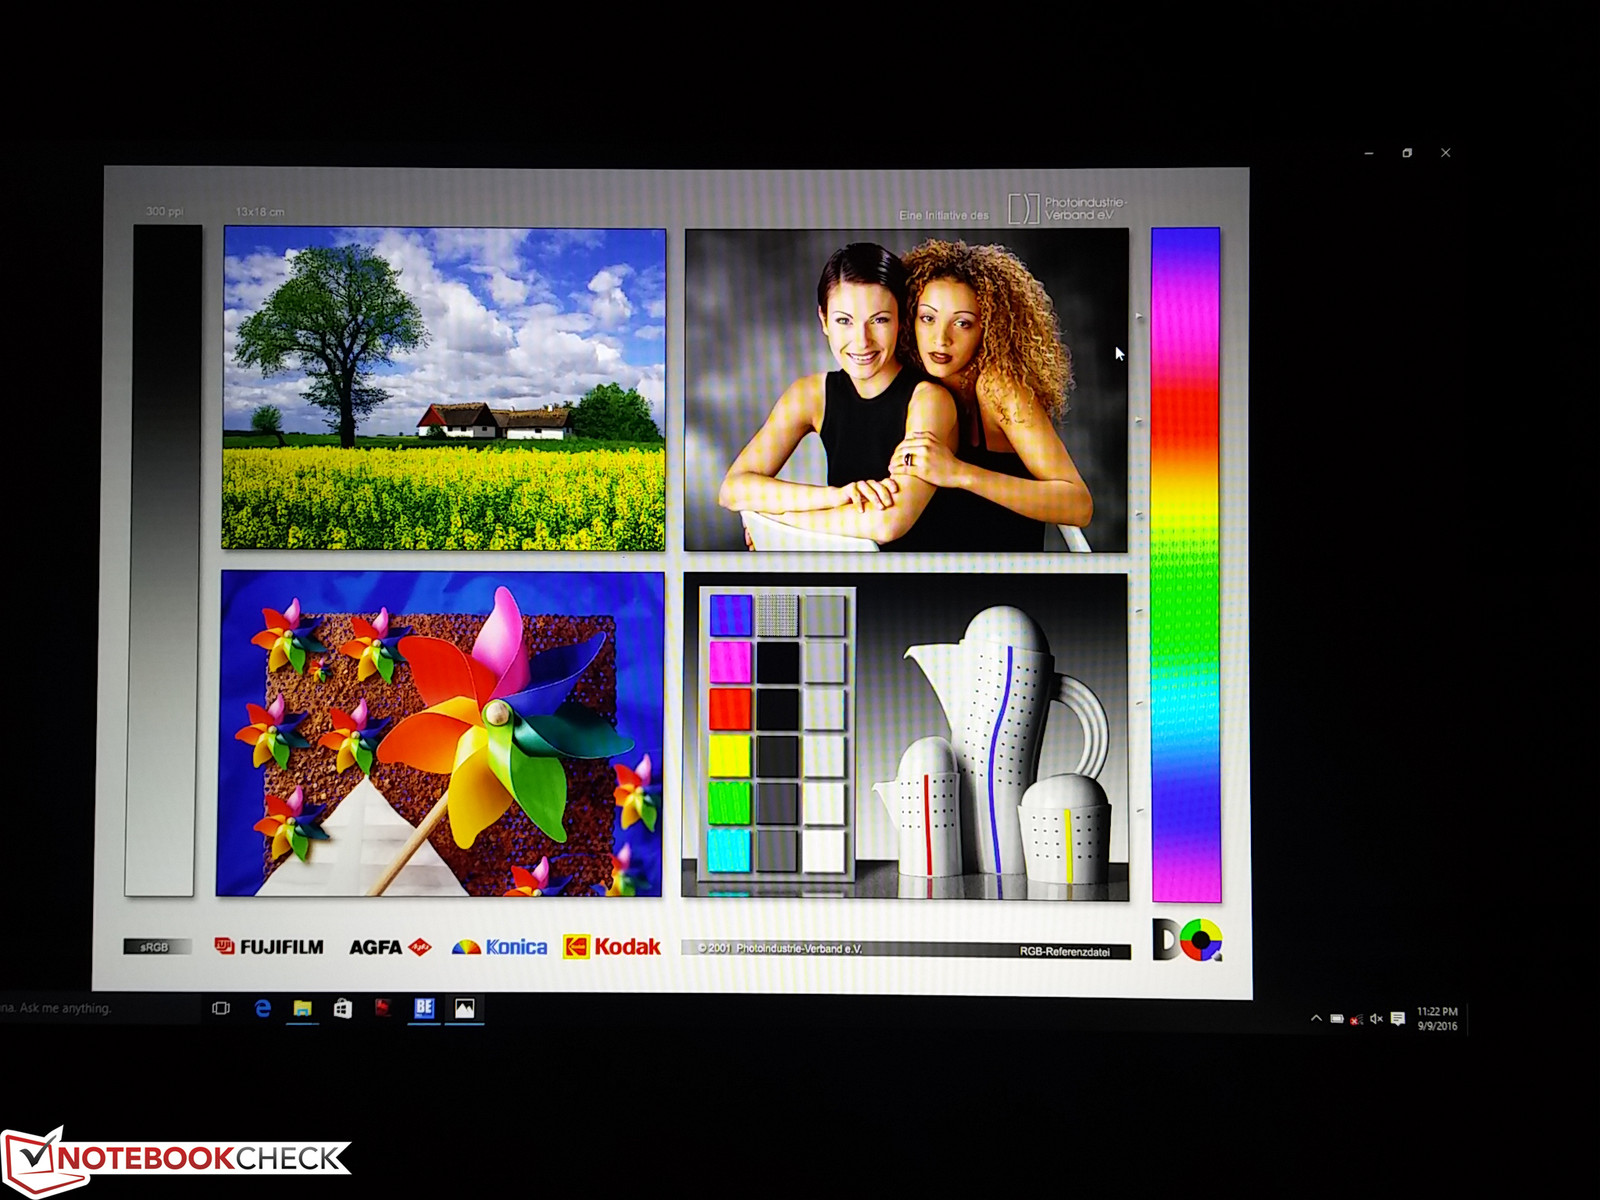
Our GT72VR 6RD uses the same 1080p LG Philips LGD046E panel as the GT72VR 6RE, so our measurements between them are similar with the usual small deviations. The screen is comparable to the new Asus G752VS and the Acer Predator 17 G9 in terms of response times and color accuracy with the Acer edging out both in contrast ratio.
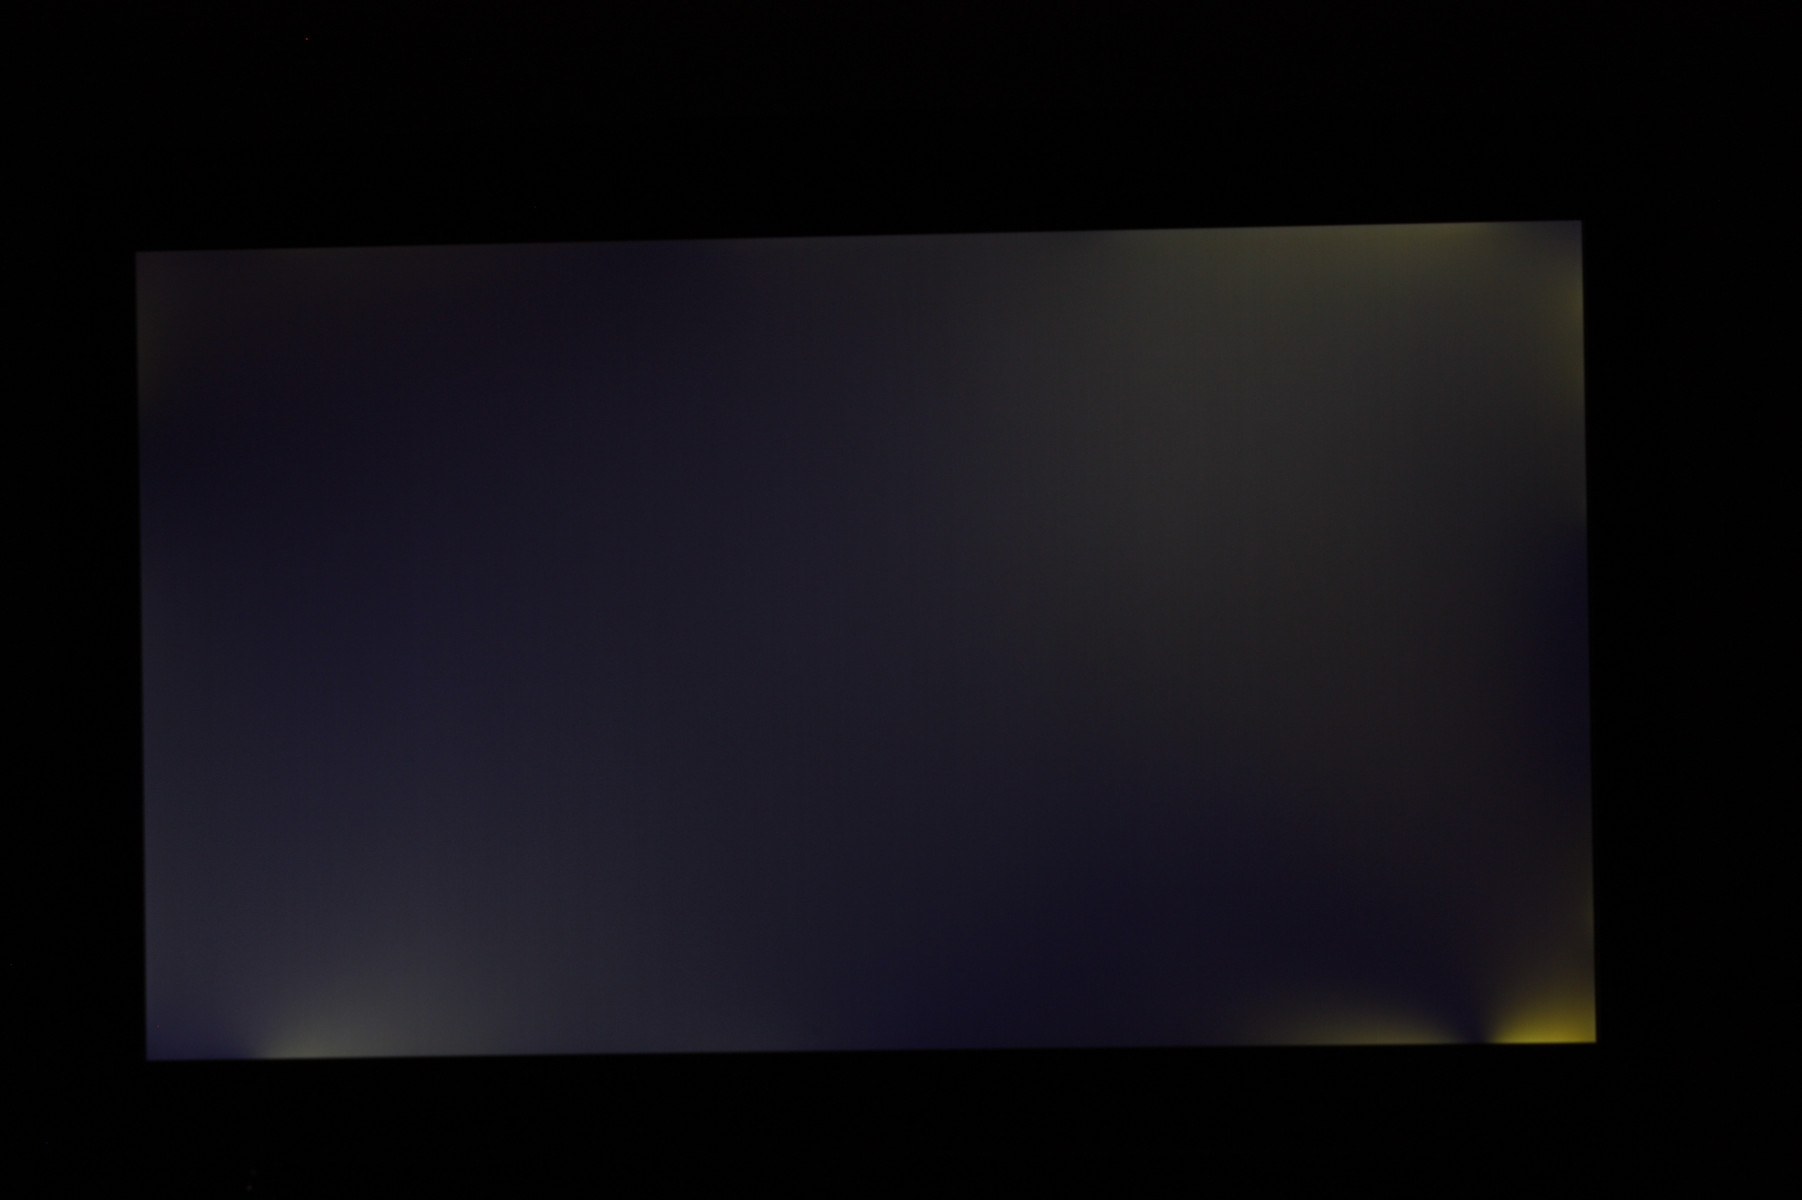
Unfortunately, our test unit suffers from major backlight bleeding especially on the bottom right corner. The uneven lighting here is severe enough that it is noticeable on the Windows taskbar during regular use. We encountered backlight bleeding on some of other MSI notebooks as well, though this is the most critical we've seen it.

| |||||||||||||||||||||||||
Brightness Distribution: 91 %
Center on Battery: 351.7 cd/m²
Contrast: 951:1 (Black: 0.37 cd/m²)
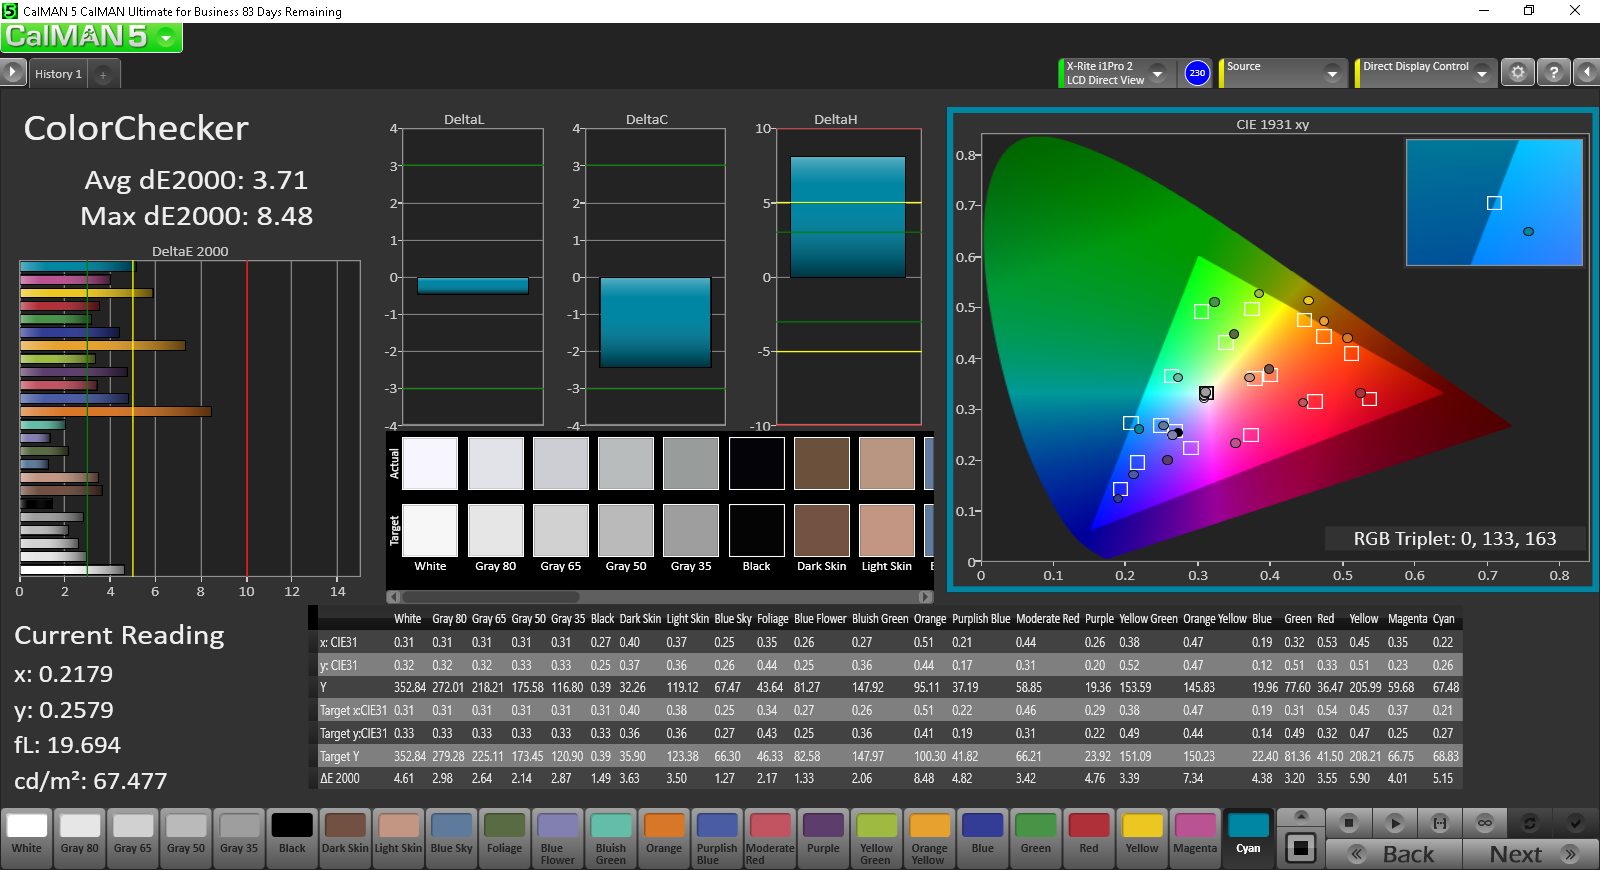
ΔE Color 3.71 | 0.5-29.43 Ø5
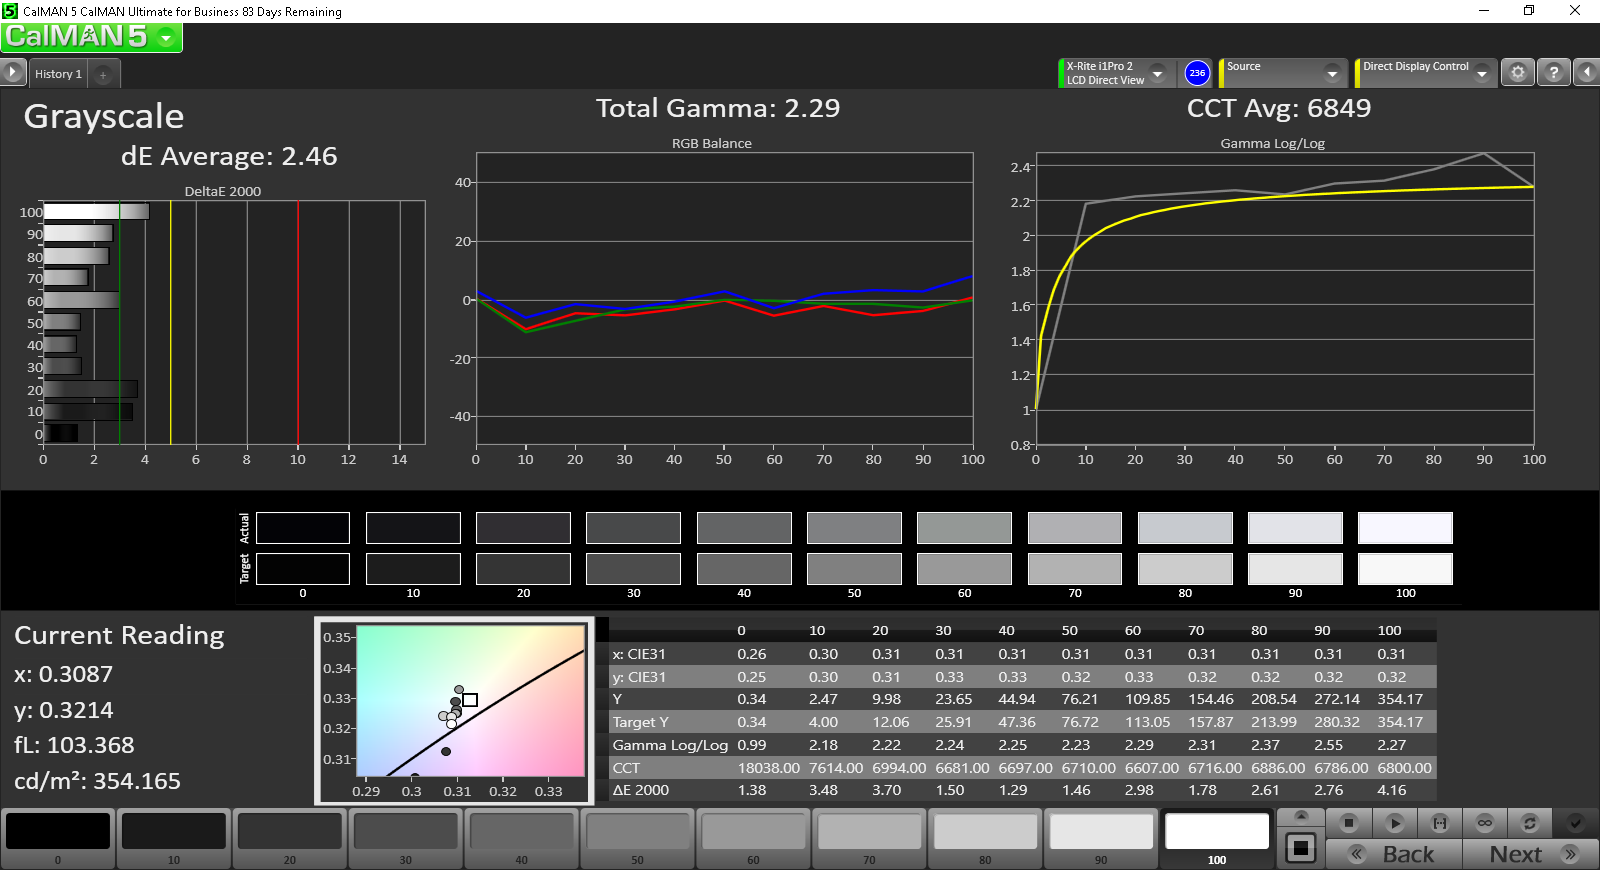
ΔE Greyscale 2.46 | 0.57-98 Ø5.3
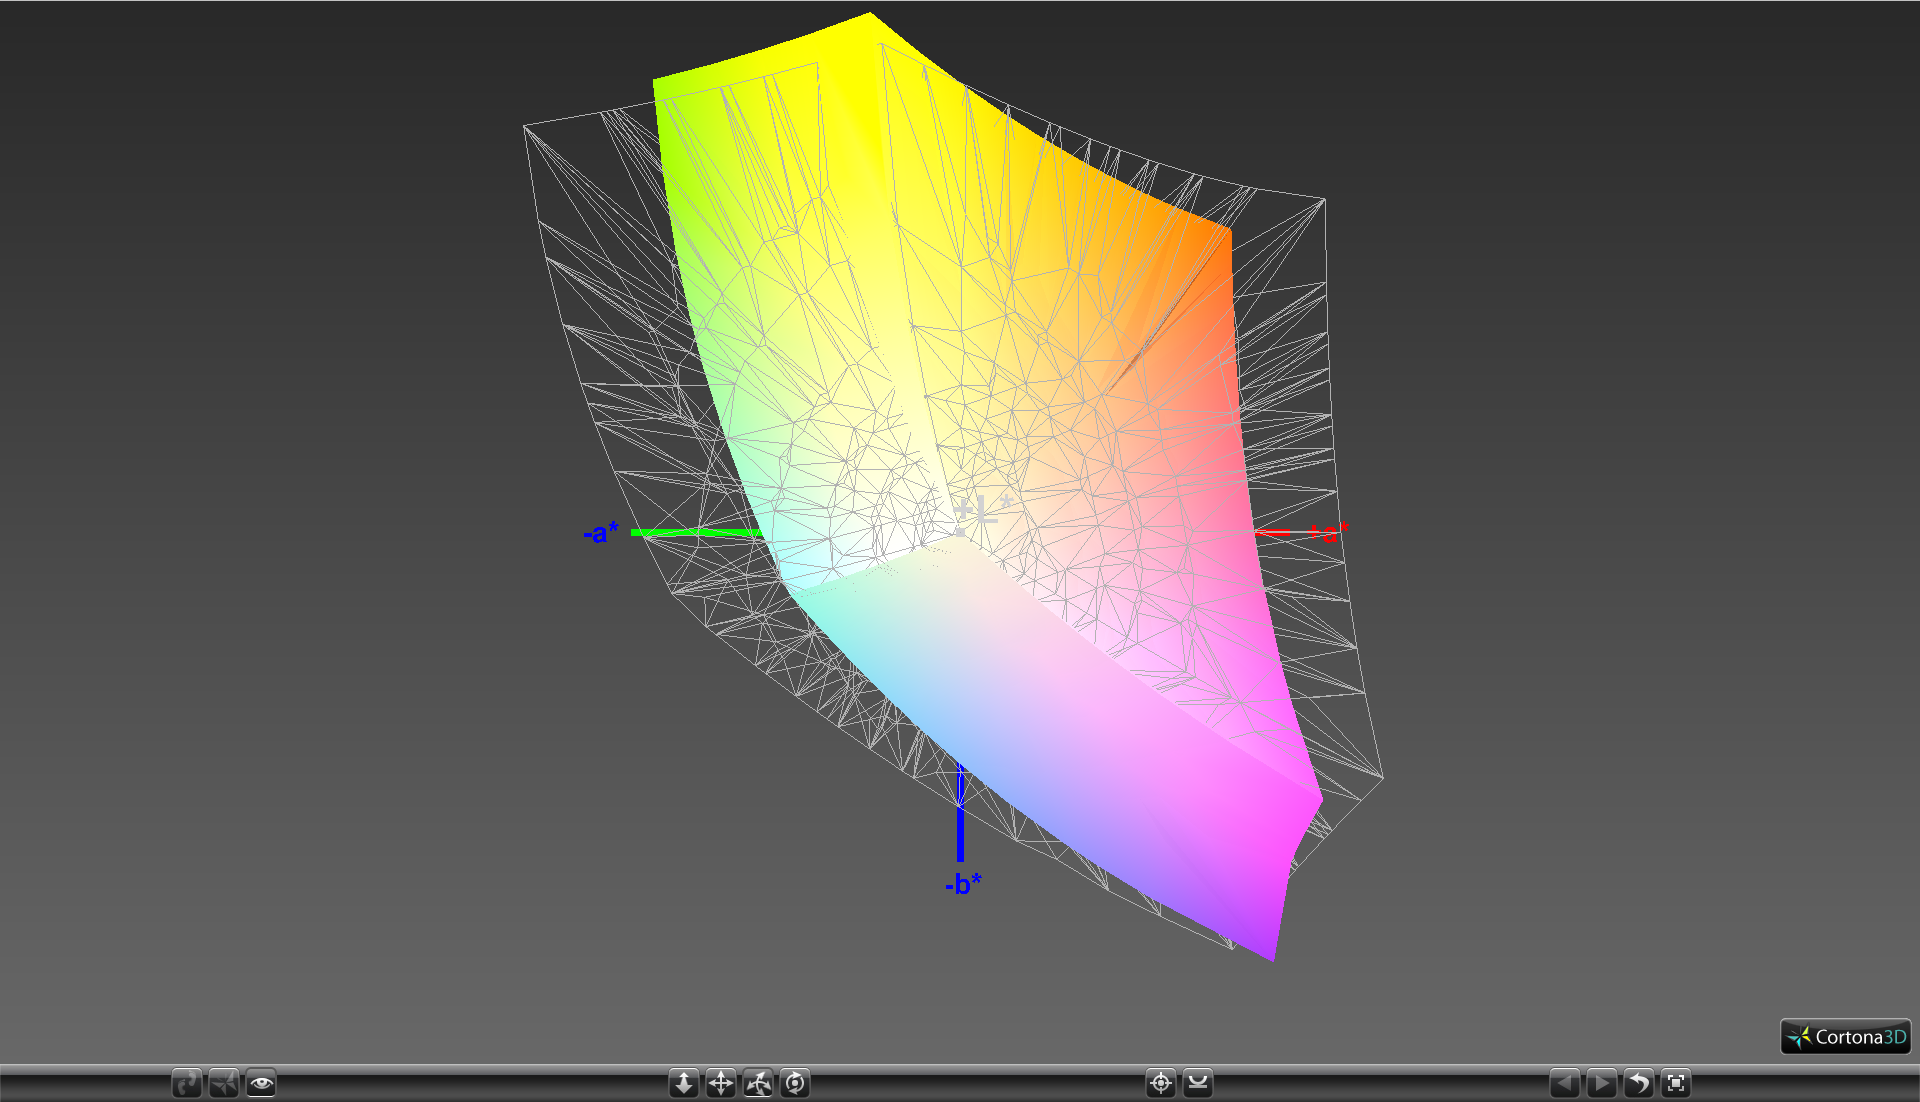
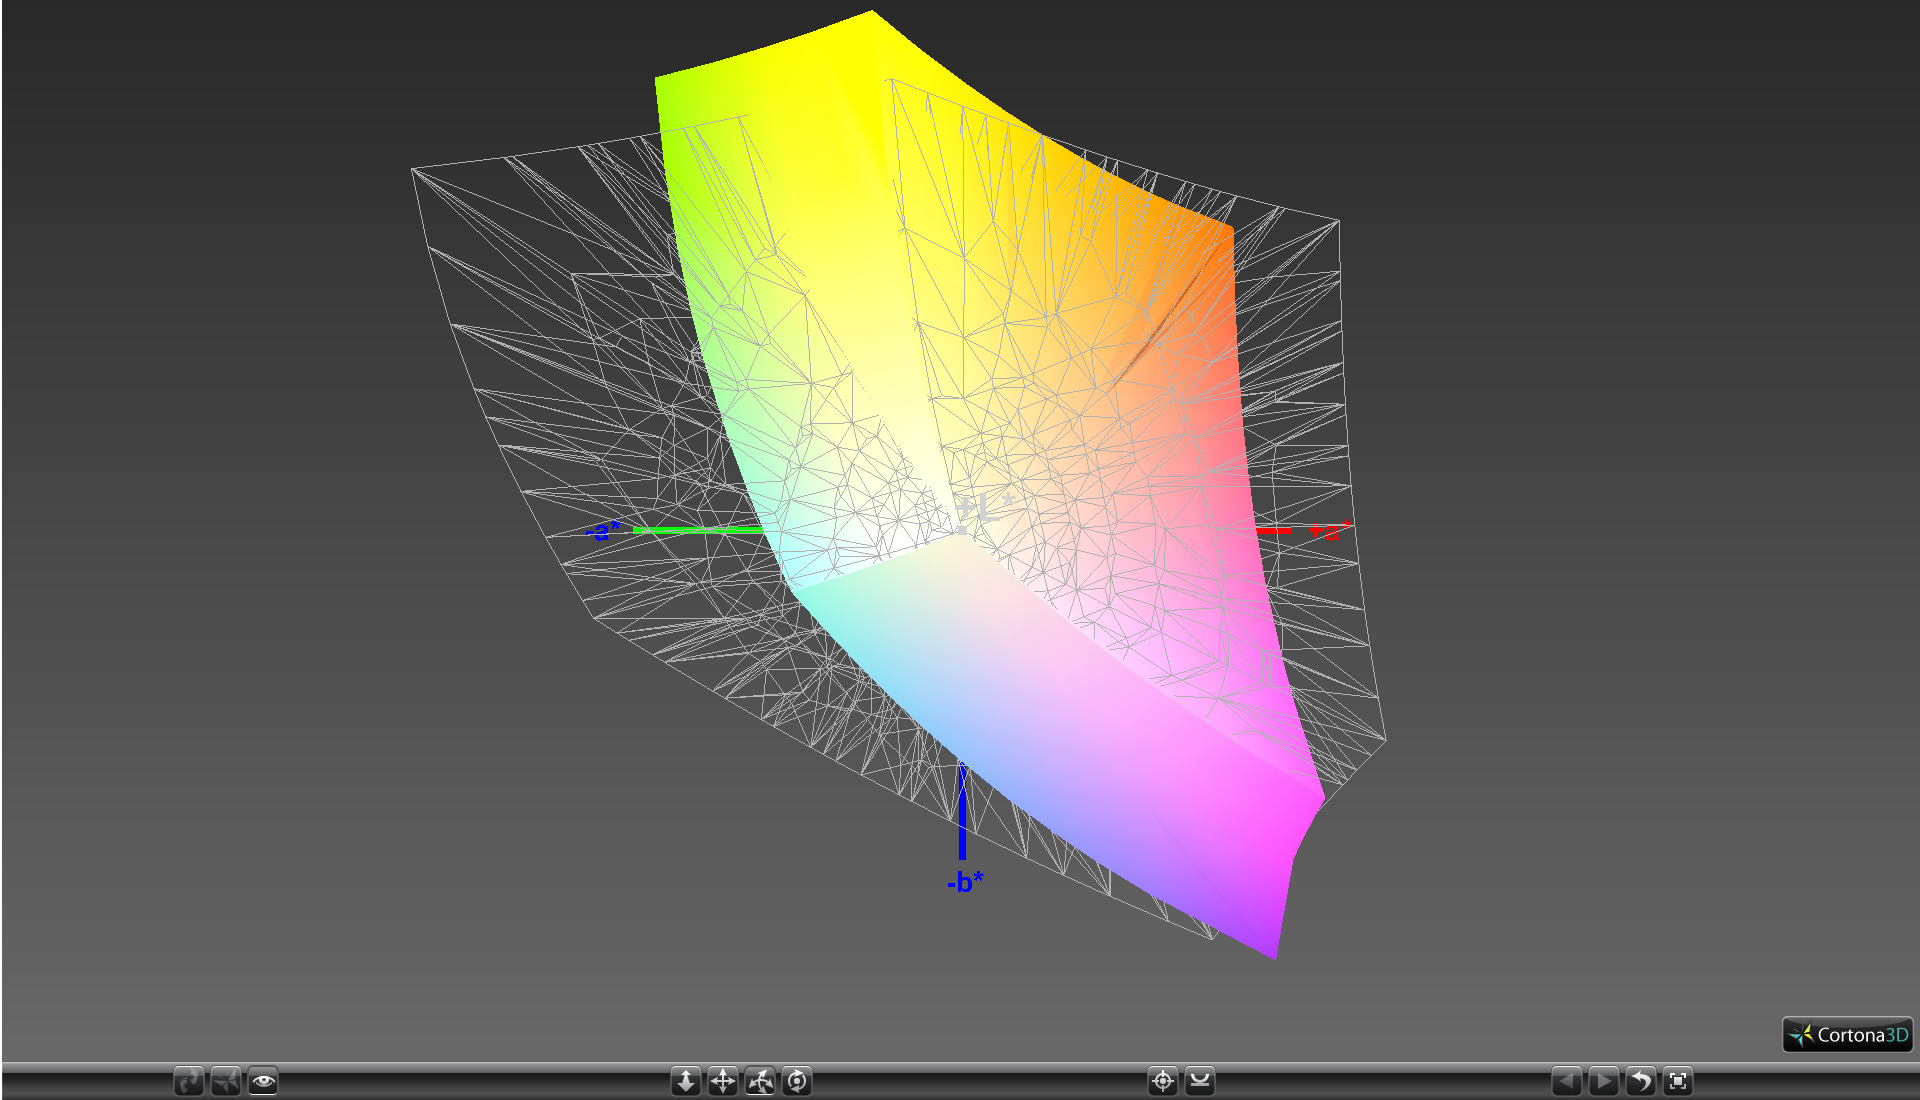
86.1% sRGB (Argyll 1.6.3 3D)
56.6% AdobeRGB 1998 (Argyll 1.6.3 3D)
63% AdobeRGB 1998 (Argyll 2.2.0 3D)
86.2% sRGB (Argyll 2.2.0 3D)
67.6% Display P3 (Argyll 2.2.0 3D)
Gamma: 2.29
| MSI GT72VR 6RD-063US LG Philips LGD046E, IPS, 17.30, 1920x1080 | Acer Predator 17 G9-793-77LG AU Optronics B173ZAN01.0 (AUO109B), IPS, 17.30, 3840x2160 | MSI GT73VR-6RE16SR451 N173HHE-G32 (CMN1747), TN, 17.30, 1920x1080 | Asus G752VS-XB78K LG Philips LP173WF4-SPF3 (LGD04E8), IPS, 17.30, 1920x1080 | Asus G701VO-CS74K IPS, 17.30, 1920x1080 | |
|---|---|---|---|---|---|
| Display | 34% | 29% | -1% | 2% | |
| Display P3 Coverage | 67.6 | 86.9 29% | 91.2 35% | 66.9 -1% | 68.8 2% |
| sRGB Coverage | 86.2 | 100 16% | 100 16% | 85.2 -1% | 87.7 2% |
| AdobeRGB 1998 Coverage | 63 | 99.4 58% | 84.9 35% | 62.3 -1% | 64.1 2% |
| Response Times | 1% | 49% | 4% | 8% | |
| Response Time Grey 50% / Grey 80% * | 34.4 ? | 37 ? -8% | 26 ? 24% | 38 ? -10% | 29.2 ? 15% |
| Response Time Black / White * | 26.4 ? | 24 ? 9% | 6.8 ? 74% | 22 ? 17% | 26.4 ? -0% |
| PWM Frequency | |||||
| Screen | 7% | -43% | 0% | -6% | |
| Brightness middle | 351.7 | 336 -4% | 314 -11% | 328 -7% | 368.1 5% |
| Brightness | 339 | 320 -6% | 294 -13% | 317 -6% | 349 3% |
| Brightness Distribution | 91 | 88 -3% | 89 -2% | 88 -3% | 86 -5% |
| Black Level * | 0.37 | 0.25 32% | 0.23 38% | 0.3 19% | 0.365 1% |
| Contrast | 951 | 1344 41% | 1365 44% | 1093 15% | 1008 6% |
| Colorchecker dE 2000 * | 3.71 | 3.61 3% | 9.74 -163% | 3.74 -1% | 4.16 -12% |
| Colorchecker dE 2000 max. * | 8.48 | 6.02 29% | 15.71 -85% | 8.97 -6% | 8.7 -3% |
| Greyscale dE 2000 * | 2.46 | 4.78 -94% | 9.58 -289% | 2.67 -9% | 3.86 -57% |
| Gamma | 2.29 96% | 2.32 95% | 2.5 88% | 2.41 91% | 2.19 100% |
| CCT | 6849 95% | 6185 105% | 11854 55% | 6861 95% | 6892 94% |
| Color Space (Percent of AdobeRGB 1998) | 56.6 | 88 55% | 76 34% | 56 -1% | 57.6 2% |
| Color Space (Percent of sRGB) | 86.1 | 100 16% | 100 16% | 85 -1% | 87.6 2% |
| Total Average (Program / Settings) | 14% /
12% | 12% /
-16% | 1% /
0% | 1% /
-2% |
* ... smaller is better
Color space is very good at approximately 86 percent and 57 percent of the sRGB and AdobeRGB standards, respectively. In comparison, cheaper panels on budget notebooks may cover only 60 percent of sRGB or less than 40 percent of AdobeRGB. For gaming purposes, however, accurate colors and wide gamuts are not imperative.


Colors and grayscale are accurate without any calibration needed when set to sRGB mode using the MSI True Color utility. This is different from what we've experienced on our other GS73VR and GT73VR test units, both of which have the same True Color software but with different panels. We performed a quick calibration on the GT72VR anyway and saw slight improvements to both RGB balance and grayscale.


Display Response Times
| ↔ Response Time Black to White | ||
|---|---|---|
| 26.4 ms ... rise ↗ and fall ↘ combined | ↗ 4.4 ms rise |  |
| ↘ 22 ms fall | ||
| The screen shows relatively slow response rates in our tests and may be too slow for gamers. In comparison, all tested devices range from 0.1 (minimum) to 240 (maximum) ms. » 61 % of all devices are better. This means that the measured response time is worse than the average of all tested devices (21.4 ms). | ||
| ↔ Response Time 50% Grey to 80% Grey | ||
| 34.4 ms ... rise ↗ and fall ↘ combined | ↗ 14.8 ms rise | 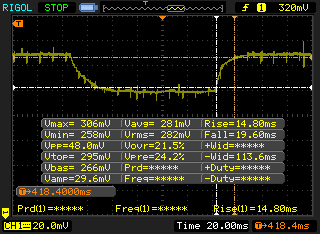 |
| ↘ 19.6 ms fall | ||
| The screen shows slow response rates in our tests and will be unsatisfactory for gamers. In comparison, all tested devices range from 0.2 (minimum) to 636 (maximum) ms. » 42 % of all devices are better. This means that the measured response time is similar to the average of all tested devices (33.7 ms). | ||
Screen Flickering / PWM (Pulse-Width Modulation)
| Screen flickering / PWM not detected |  | ||
In comparison: 53 % of all tested devices do not use PWM to dim the display. If PWM was detected, an average of 17844 (minimum: 5 - maximum: 3846000) Hz was measured. | |||
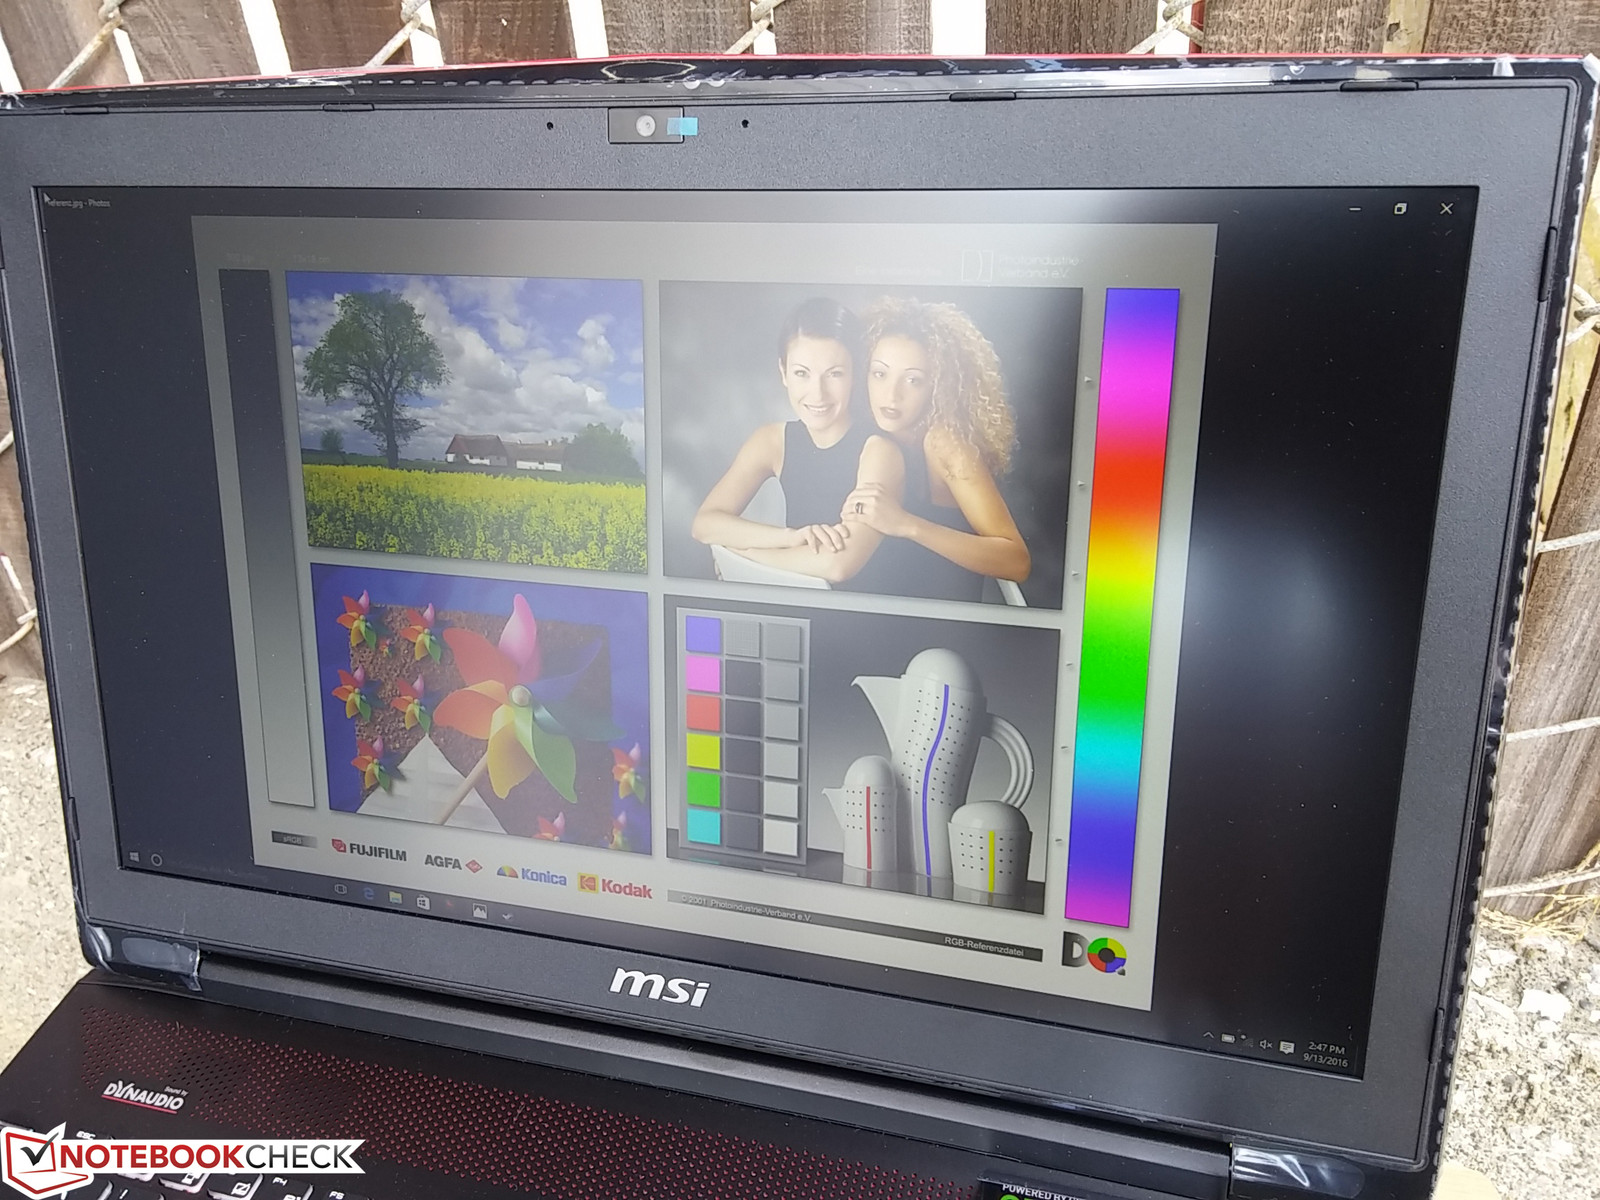
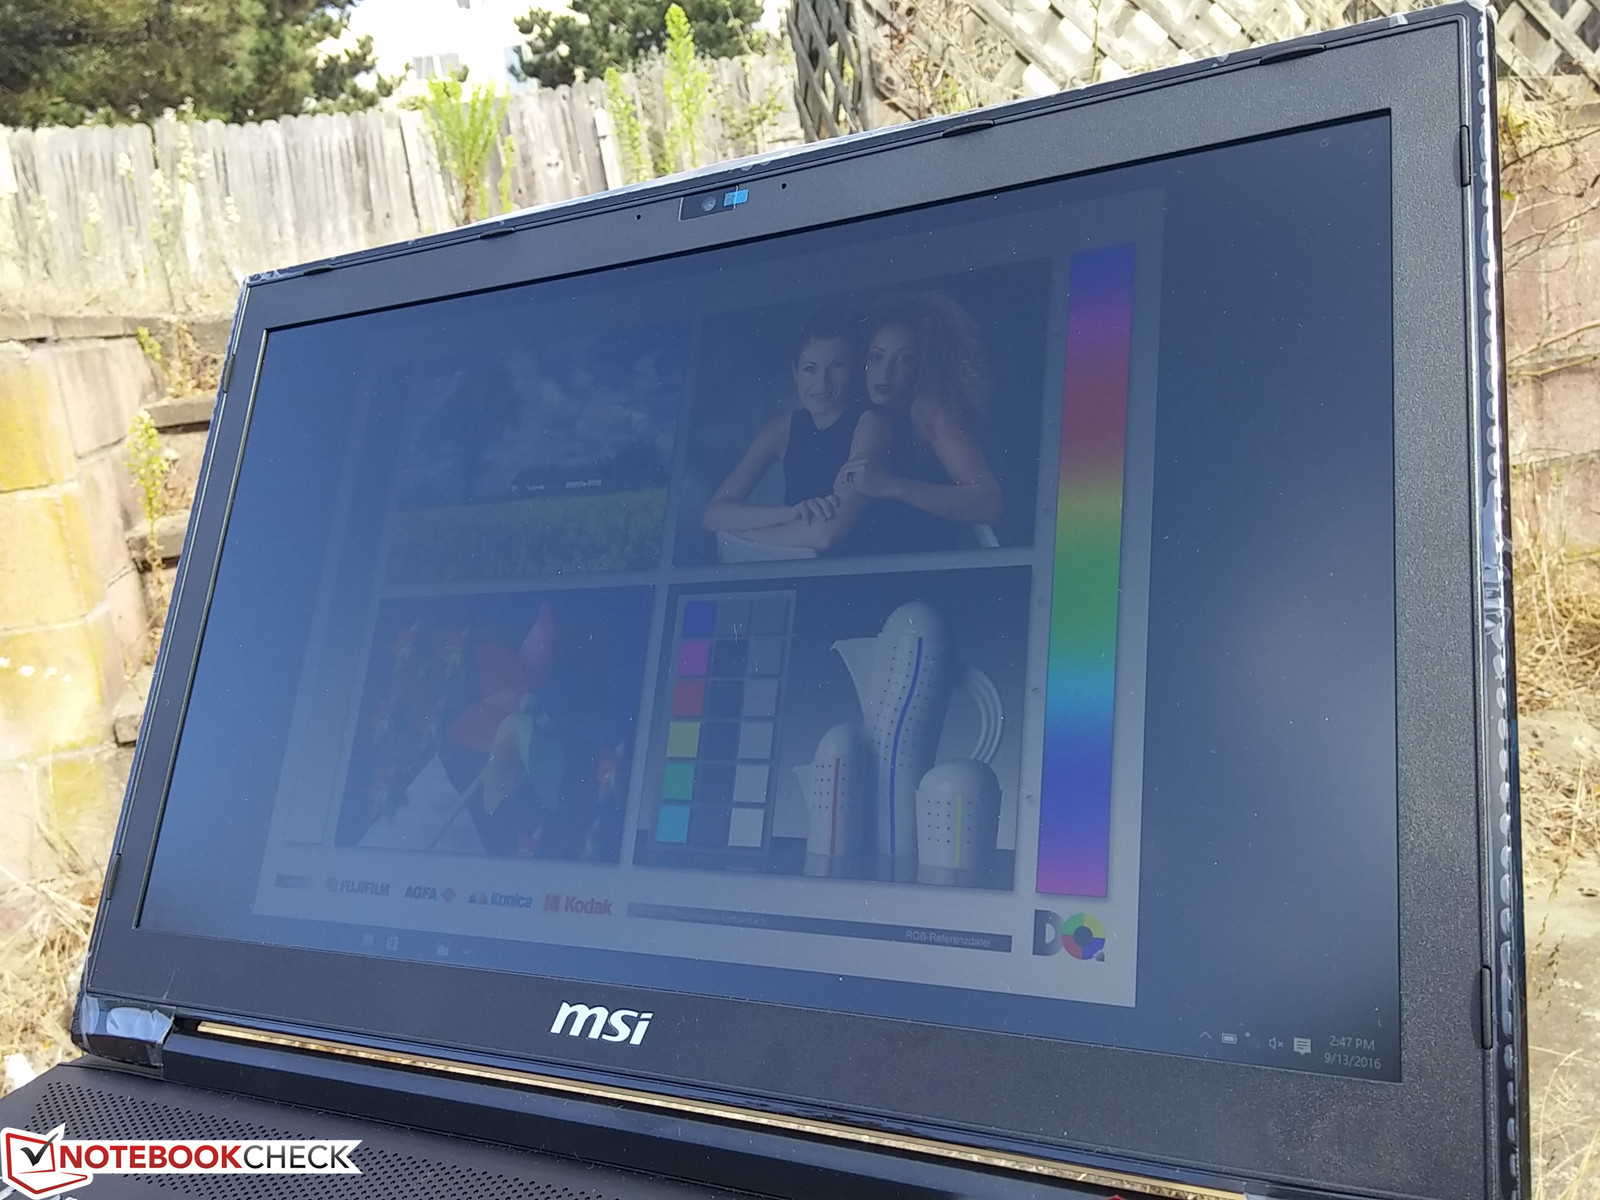
Outdoor visibility is acceptable when under shade, but anything brighter and onscreen content becomes washed out. The wide IPS viewing angles, matte panel, and 180-degree hinges all help to reduce glare as much as possible.


Performance
The GT72 chassis is very versatile due to its accessibility, large cooling system, and MXM 3.0 slot for GPU upgradeability. Nonetheless, configurations for the GT72VR are narrow in terms of CPU and GPU options with the Core i7-6700HQ and either the GTX 1060 or GTX 1070. Display options have expanded to include 120 Hz 1080p panels with 5 ms response times and 4K UHD panels with wider color coverage, so users should pick wisely as these panels will impact the gaming experience just as much as the choice of GPU.


Processor
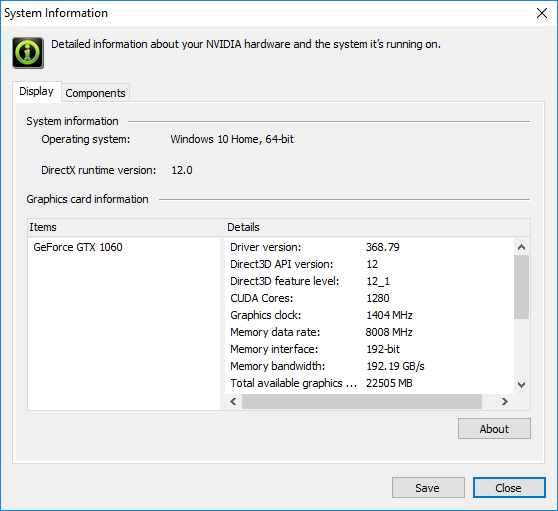
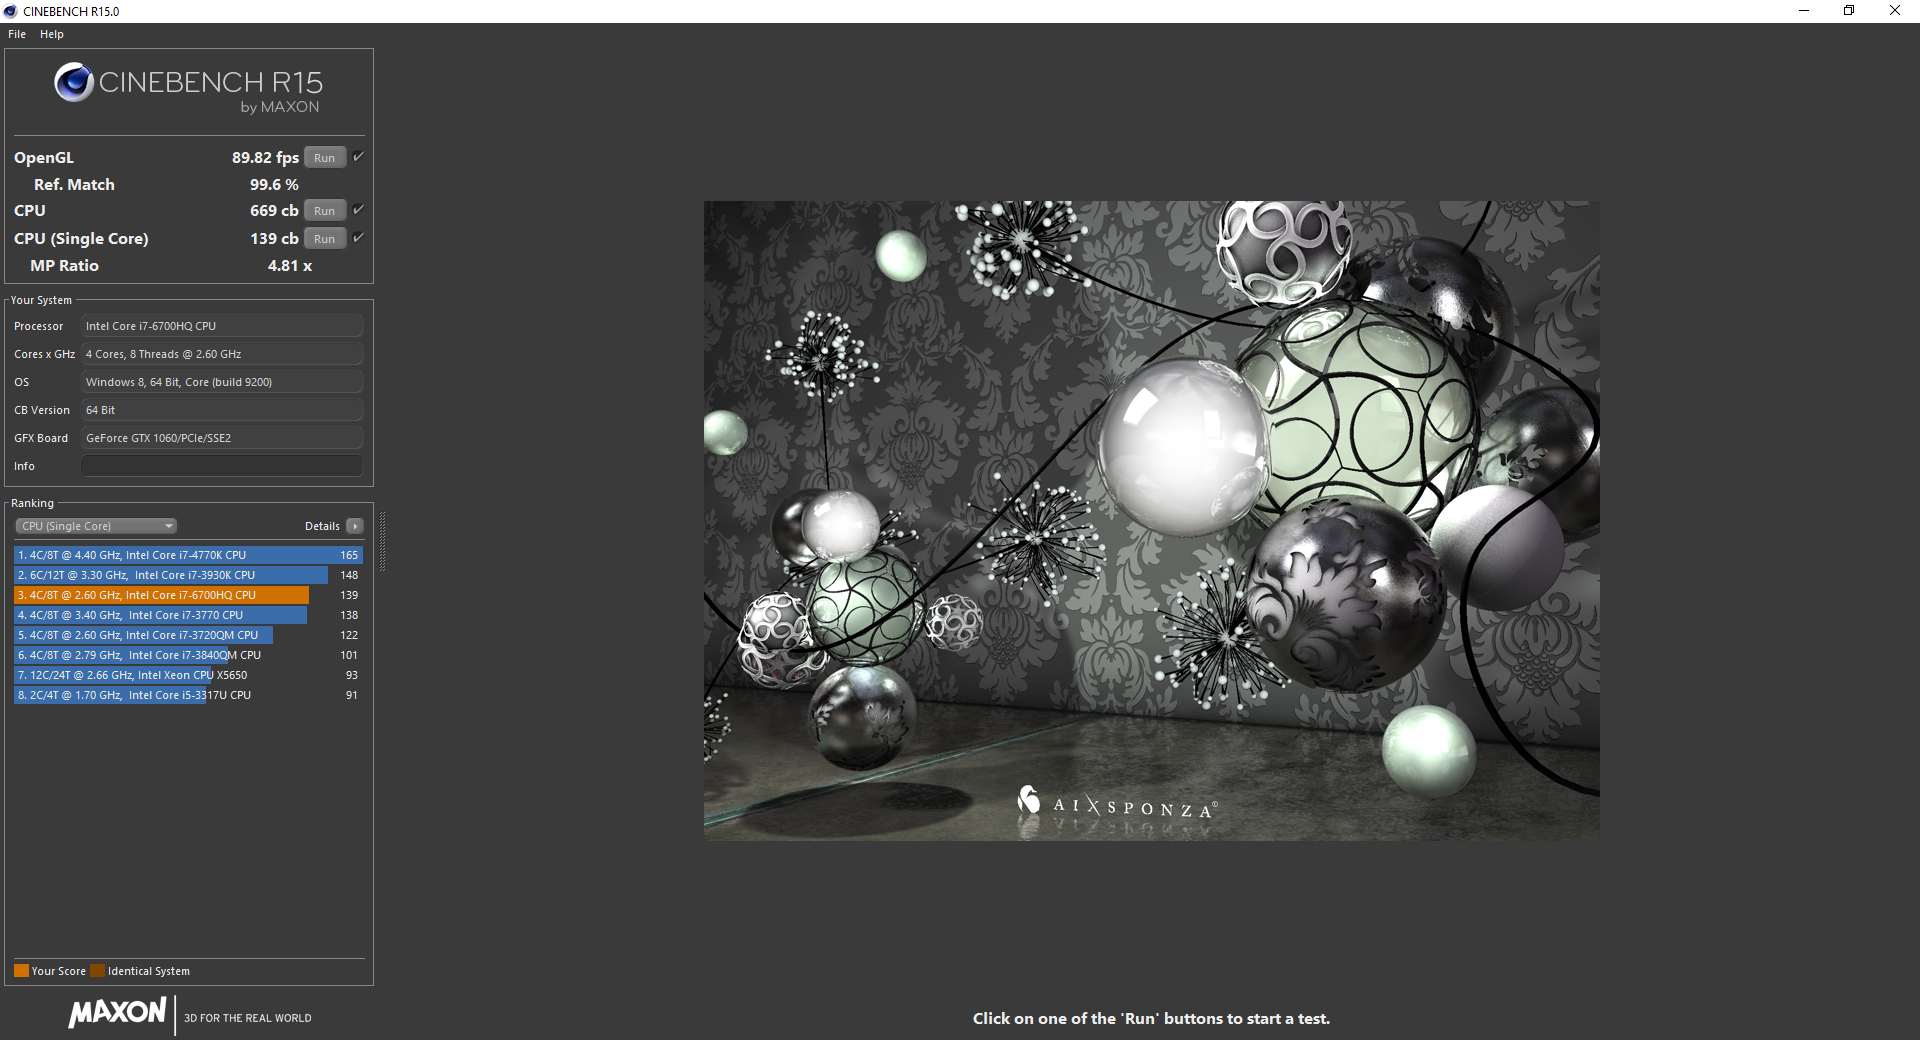
Raw CPU performance from the Skylake Core i7-6700HQ is not significantly higher than the previous generation Broadwell i7-5700HQ or the Haswell i7-4720HQ according to CineBench benchmarks. Results are otherwise exactly where we expect the MSI to perform based on the average i7-6700HQ according to our database. Moving up to the desktop-class i7-6700K will bring a 20 to 30 percent performance boost for single-threaded and multi-threaded workloads.
See our dedicated CPU page on the Core i7-6700HQ for more technical information and benchmark comparisons.


| Cinebench R15 | |
| CPU Single 64Bit | |
| DogHouse Systems Mobius SS | |
| Asus G701VO-CS74K | |
| MSI GE62 2QC-468XPL | |
| MSI GT72VR 6RD-063US | |
| Lenovo IdeaPad Y50 | |
| CPU Multi 64Bit | |
| DogHouse Systems Mobius SS | |
| MSI GE62 2QC-468XPL | |
| Asus G701VO-CS74K | |
| MSI GT72VR 6RD-063US | |
| Lenovo IdeaPad Y50 | |
| Cinebench R11.5 | |
| CPU Single 64Bit | |
| DogHouse Systems Mobius SS | |
| Asus G701VO-CS74K | |
| MSI GE62 2QC-468XPL | |
| MSI GT72VR 6RD-063US | |
| Lenovo IdeaPad Y50 | |
| CPU Multi 64Bit | |
| DogHouse Systems Mobius SS | |
| MSI GE62 2QC-468XPL | |
| Asus G701VO-CS74K | |
| MSI GT72VR 6RD-063US | |
| Lenovo IdeaPad Y50 | |
| Cinebench R10 | |
| Rendering Multiple CPUs 32Bit | |
| DogHouse Systems Mobius SS | |
| MSI GE62 2QC-468XPL | |
| Asus G701VO-CS74K | |
| MSI GT72VR 6RD-063US | |
| Lenovo IdeaPad Y50 | |
| Rendering Single 32Bit | |
| DogHouse Systems Mobius SS | |
| Asus G701VO-CS74K | |
| MSI GE62 2QC-468XPL | |
| MSI GT72VR 6RD-063US | |
| Lenovo IdeaPad Y50 | |
| wPrime 2.10 - 1024m | |
| Lenovo IdeaPad Y50 | |
| MSI GT72VR 6RD-063US | |
| Asus G701VO-CS74K | |
| MSI GE62 2QC-468XPL | |
| DogHouse Systems Mobius SS | |
| Super Pi Mod 1.5 XS 32M - 32M | |
| MSI GT72VR 6RD-063US | |
| MSI GE62 2QC-468XPL | |
| Lenovo IdeaPad Y50 | |
| Asus G701VO-CS74K | |
| DogHouse Systems Mobius SS | |
* ... smaller is better
System Performance
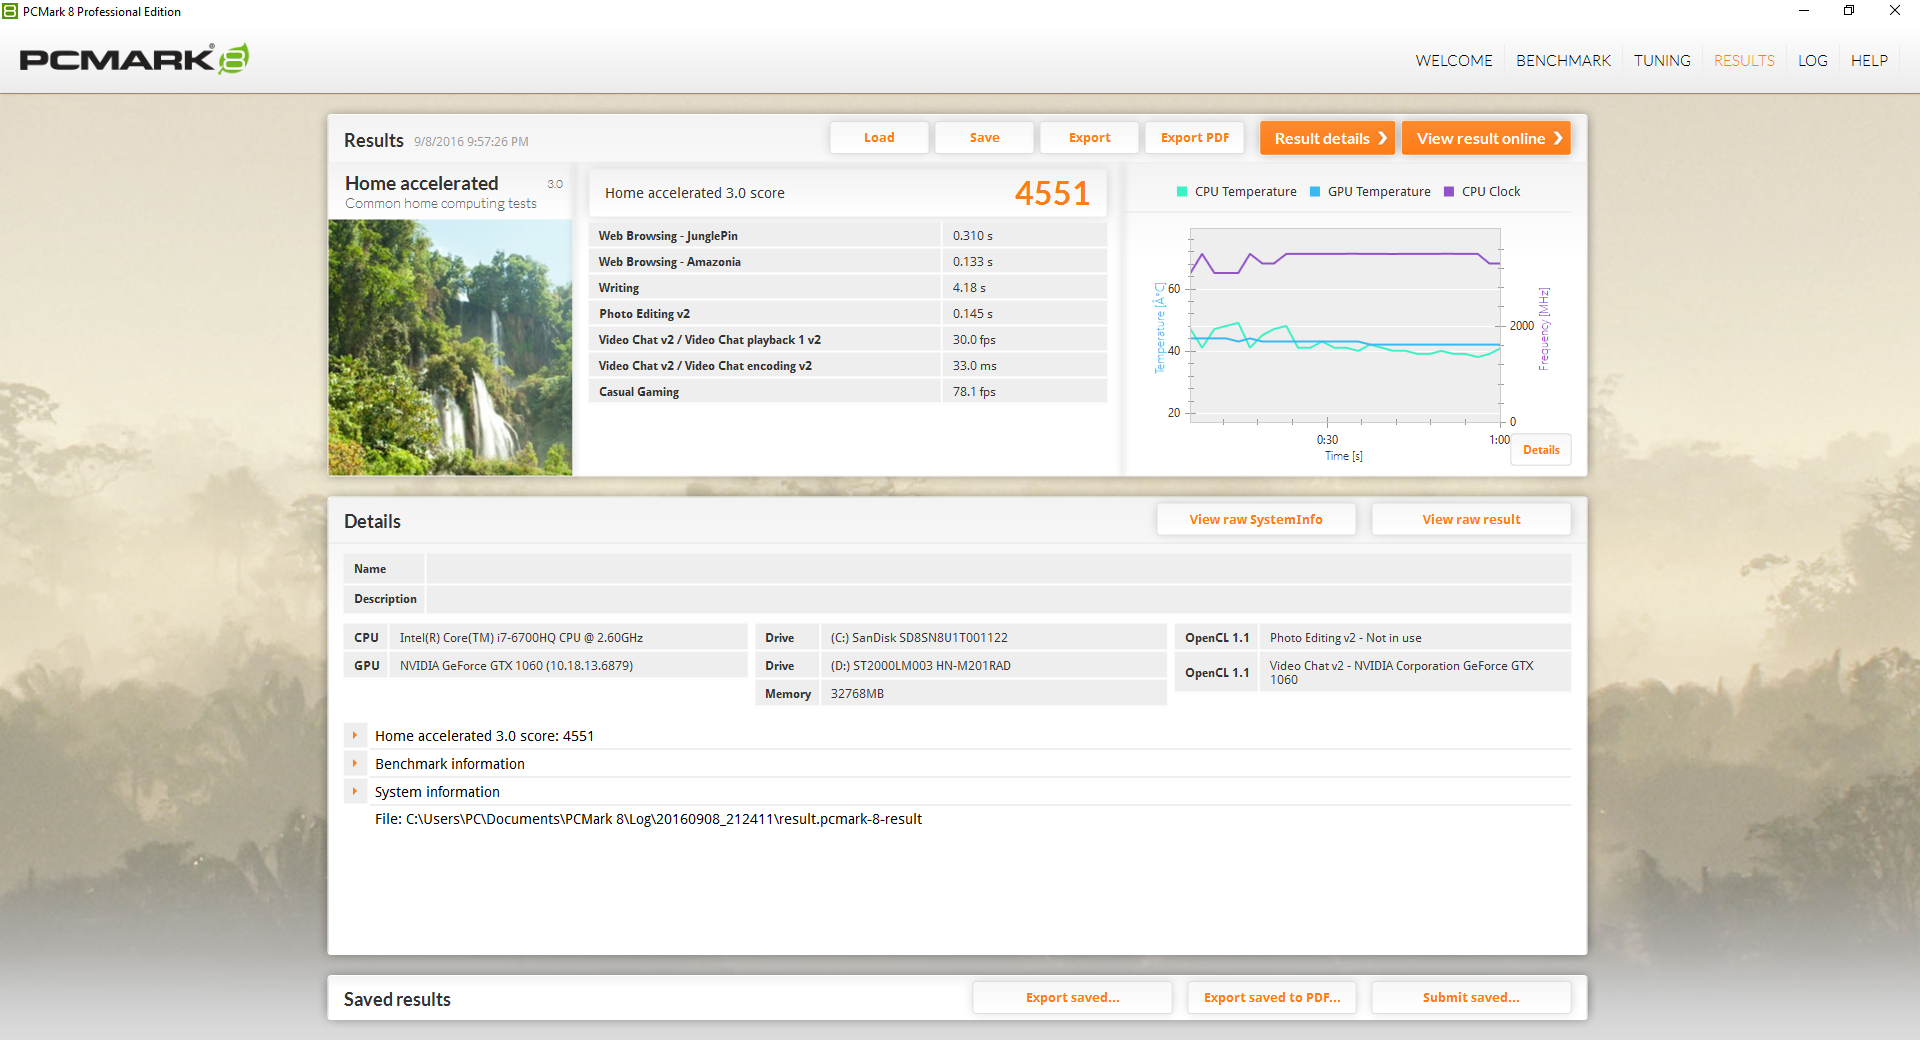
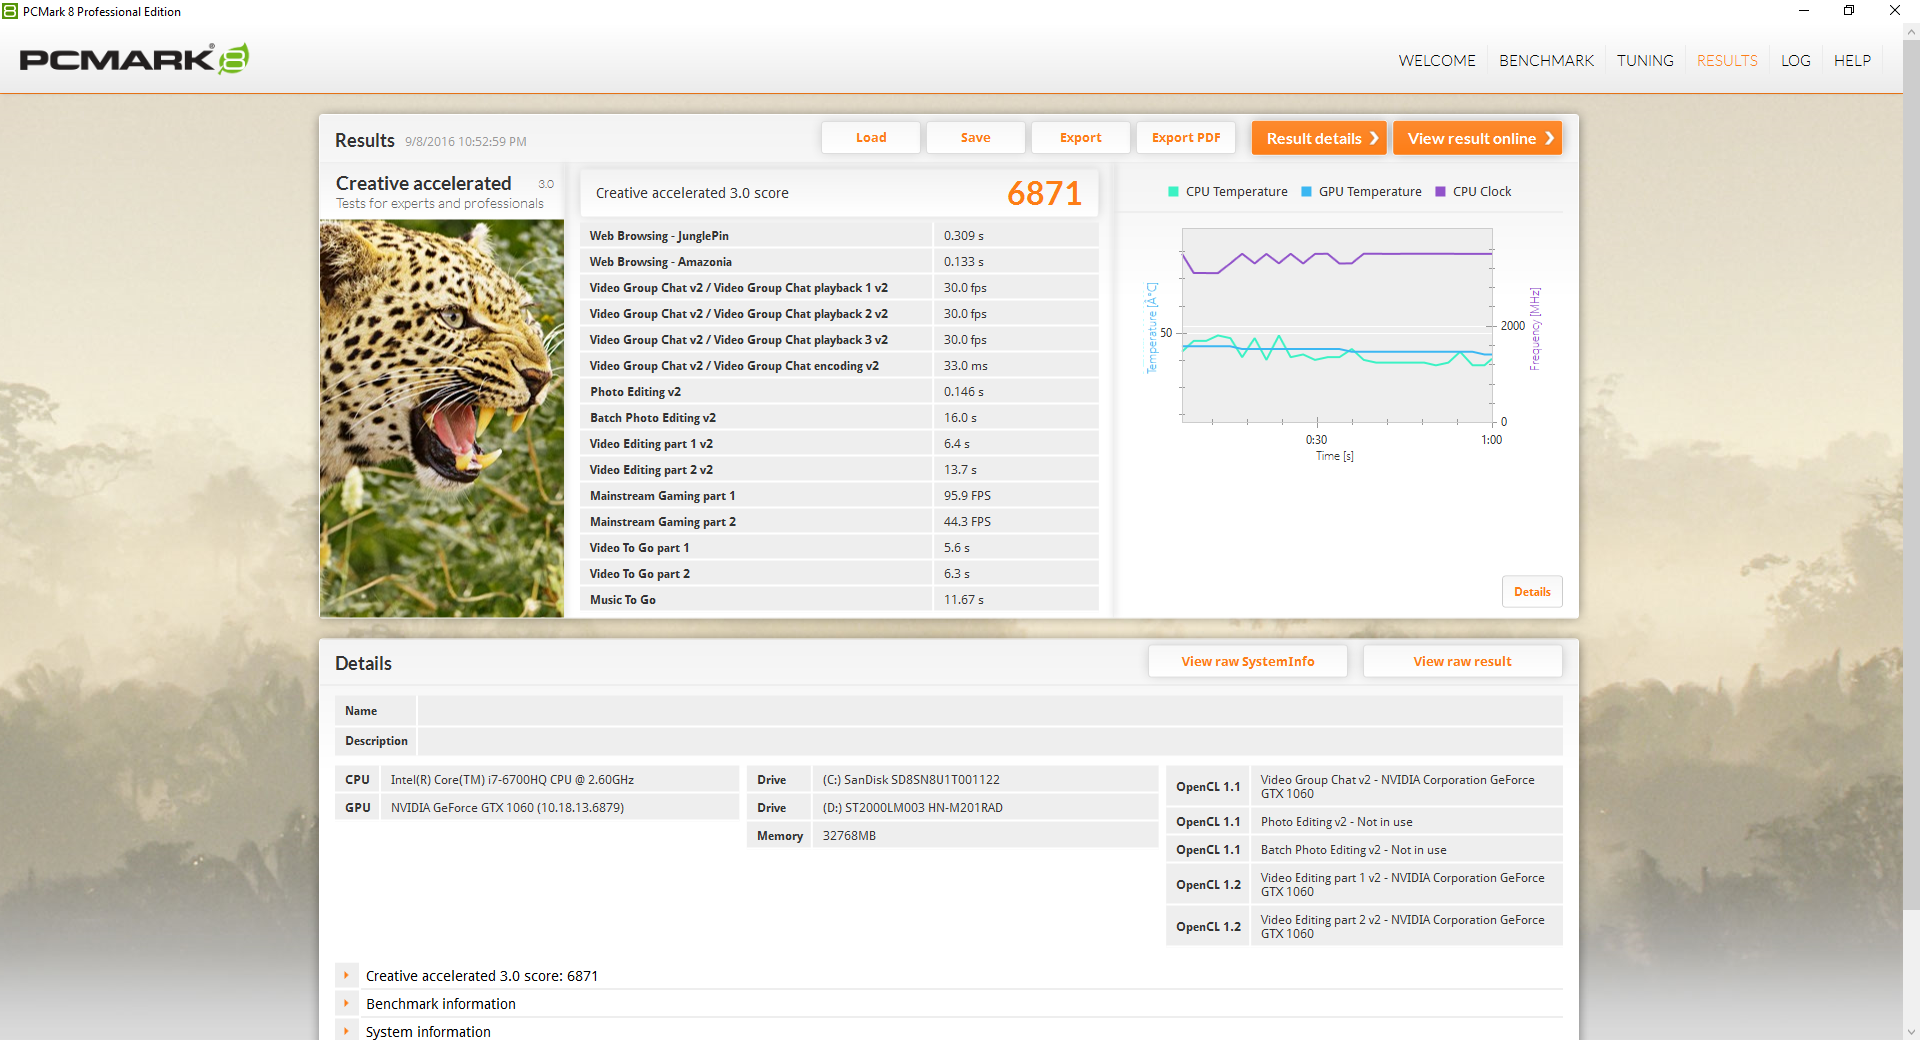
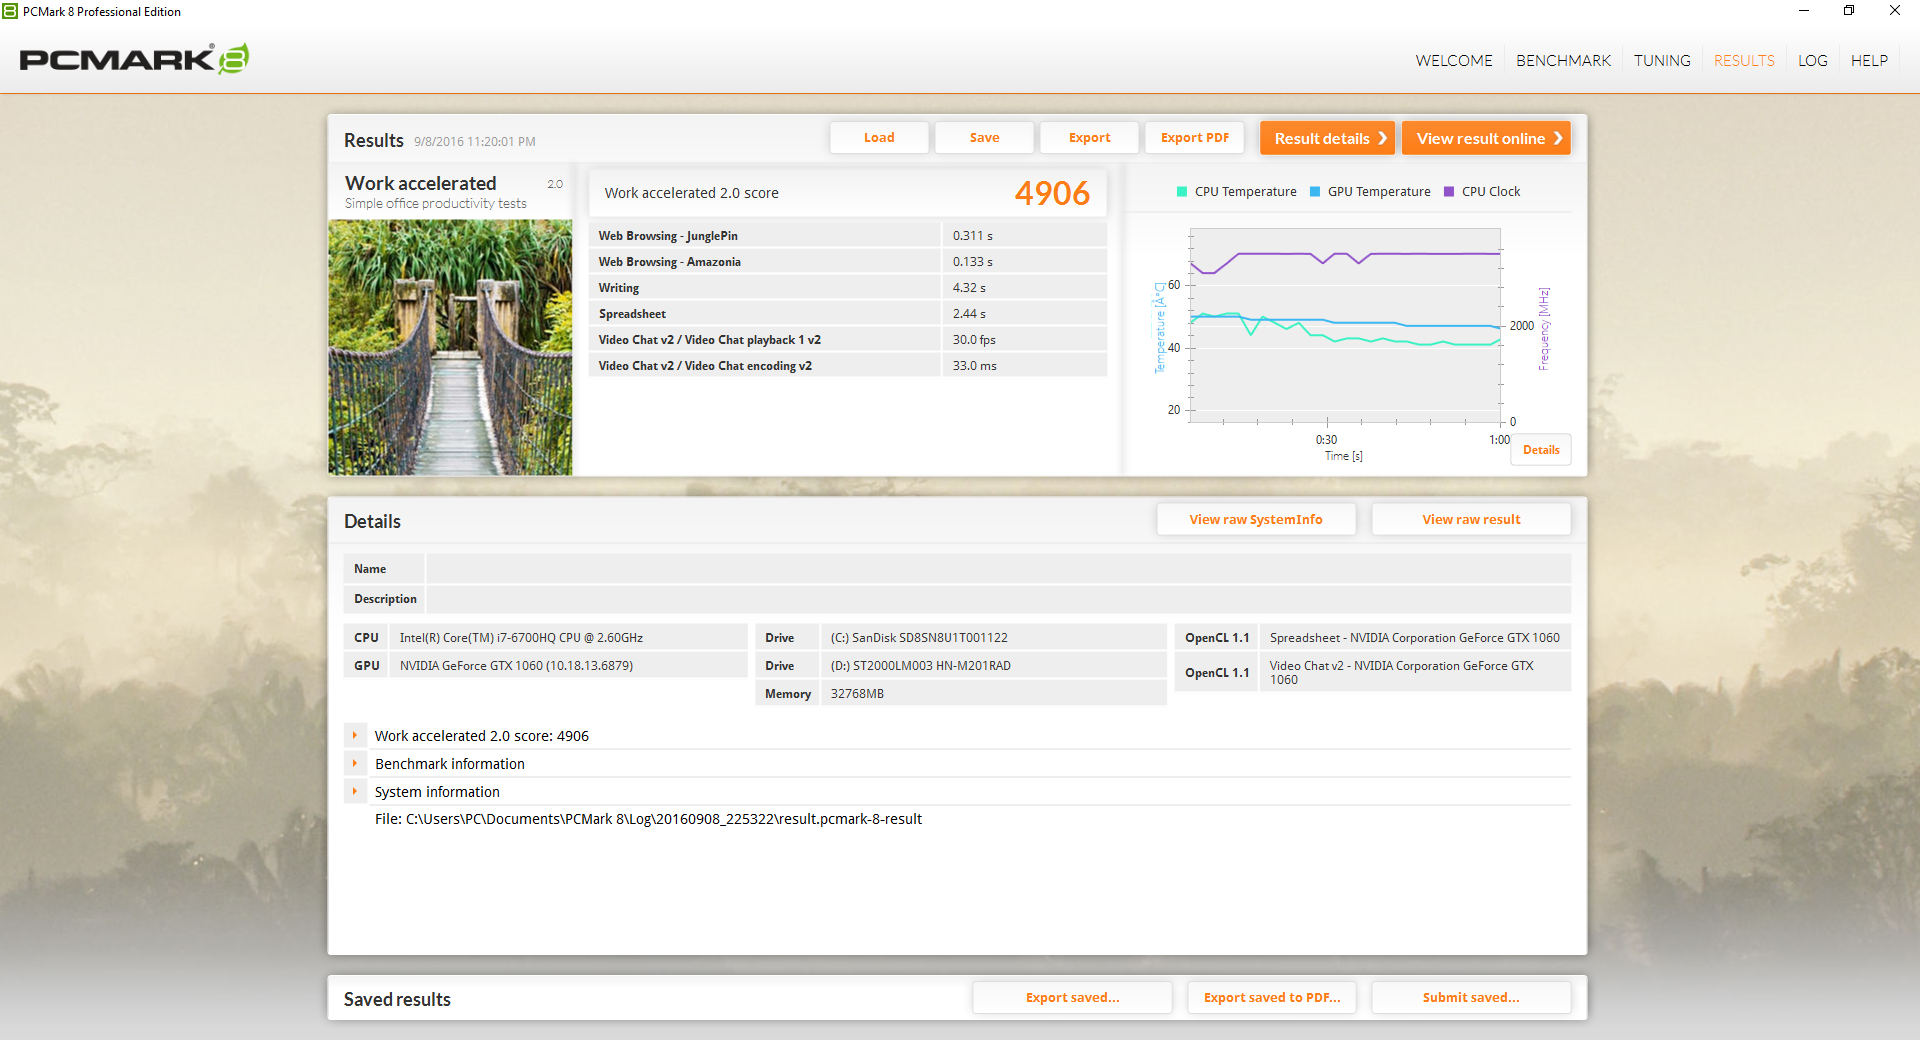
PCMark benchmarks rank our MSI just slightly below the GT73VR and G752VS with faster GTX 1070 GPUs and NVMe SSDs. We experienced no abnormal system behavior during our time with the GT72VR.
| PCMark 8 | |
| Home Score Accelerated v2 | |
| Asus G752VS-XB78K | |
| MSI GT73VR-6RE16SR451 | |
| MSI GT72VR 6RD-063US | |
| Acer Predator 17 G9-793-77LG | |
| Work Score Accelerated v2 | |
| Asus G752VS-XB78K | |
| MSI GT73VR-6RE16SR451 | |
| MSI GT72VR 6RD-063US | |
| Creative Score Accelerated v2 | |
| Asus G752VS-XB78K | |
| MSI GT72VR 6RD-063US | |
| Acer Predator 17 G9-793-77LG | |
| PCMark 8 Home Score Accelerated v2 | 4551 points | |
| PCMark 8 Creative Score Accelerated v2 | 6871 points | |
| PCMark 8 Work Score Accelerated v2 | 4906 points | |
Help | ||
Storage Devices
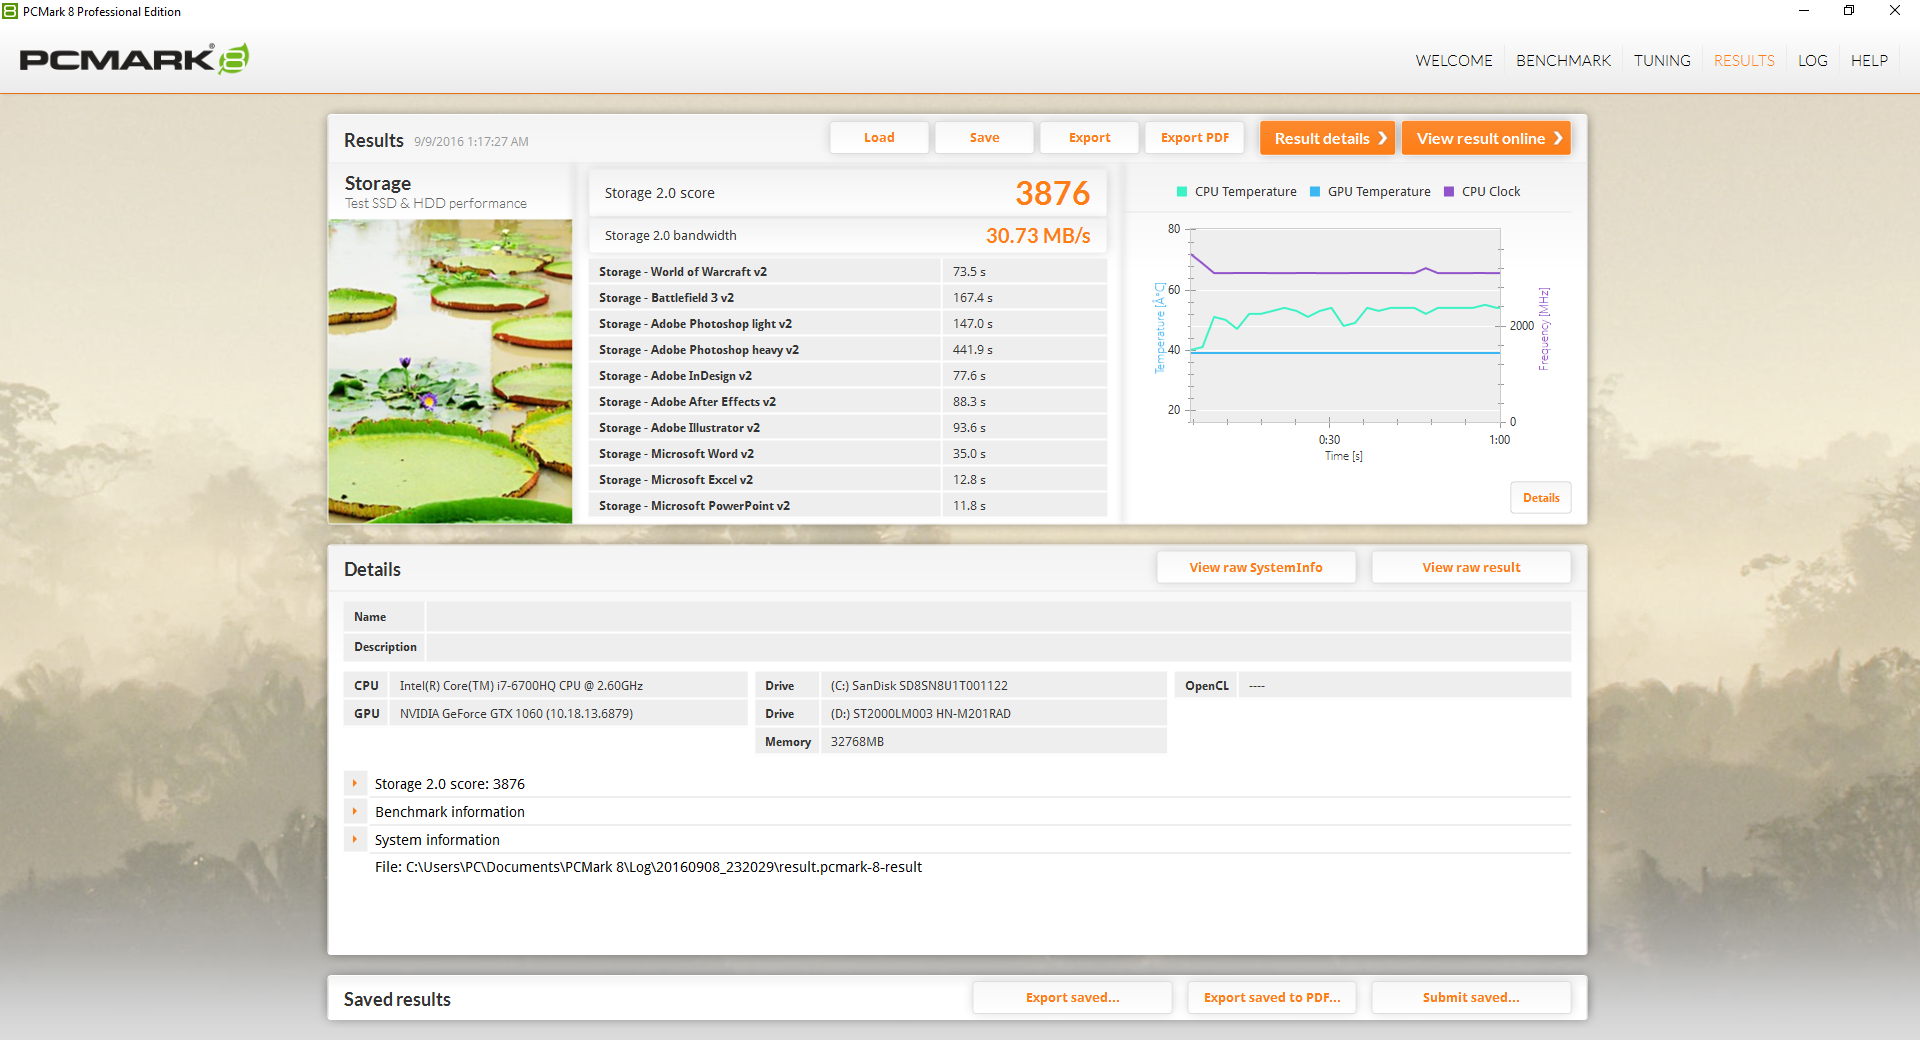
While our previous GT72VR 6RE test unit carried a 256 GB SanDisk M.2 SSD, our GT72VR 6RD houses the 1 TB version of the same SanDisk SSD series. Sequential read and write rates average in the mid 400 MB/s range not unlike most other SSDs limited by the SATA III interface. Unlike some GT72 SKUs or competing flagship gaming systems, however, the GT72VR does not support NVMe or RAID.
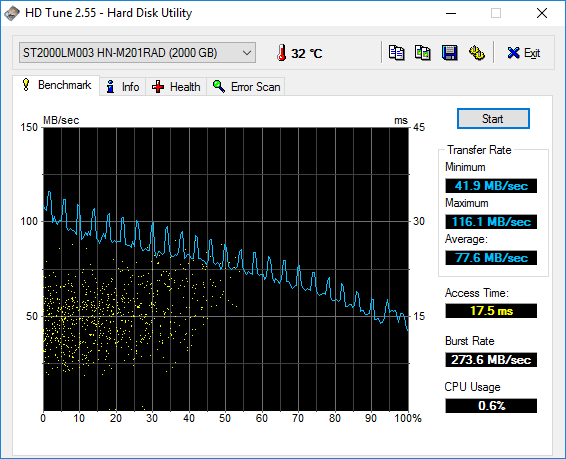
Average transfer rate from the secondary 2 TB Seagate ST2000LM003 HDD is below average at just 77.6 MB/s according to HD Tune. Most 5400 RPM Hitachi HDDs average in the 80 or 90 MB/s range according to our benchmark comparison table of HDDs and SSDs.


| MSI GT72VR 6RD-063US SanDisk SD8SN8U1T001122 | MSI GT72VR 6RE-015US SanDisk SD8SNAT256G1122 | MSI GT73VR-6RE16SR451 2x Samsung SM951 MZVPV256HDGL (RAID 0) | Asus G752VS-XB78K Toshiba NVMe THNSN5512GPU7 | Asus G701VO-CS74K 2x Samsung SM951 MZVPV512HDGL (RAID 0) | |
|---|---|---|---|---|---|
| CrystalDiskMark 3.0 | -4% | 319% | 194% | 283% | |
| Read Seq | 469.8 | 529 13% | 3285 599% | 1718 266% | 3067 553% |
| Write Seq | 435.2 | 338.5 -22% | 2560 488% | 1305 200% | 2434 459% |
| Read 512 | 312.6 | 288.9 -8% | 1775 468% | 1250 300% | 1582 406% |
| Write 512 | 367.3 | 319.2 -13% | 2327 534% | 1438 292% | 2255 514% |
| Read 4k | 28.21 | 23.1 -18% | 52.2 85% | 44.42 57% | 47.25 67% |
| Write 4k | 59 | 99.4 68% | 153.1 159% | 154.4 162% | 110.7 88% |
| Read 4k QD32 | 339.7 | 147.5 -57% | 627 85% | 744 119% | 584 72% |
| Write 4k QD32 | 225.6 | 236.9 5% | 527 134% | 578 156% | 463.3 105% |

GPU Performance
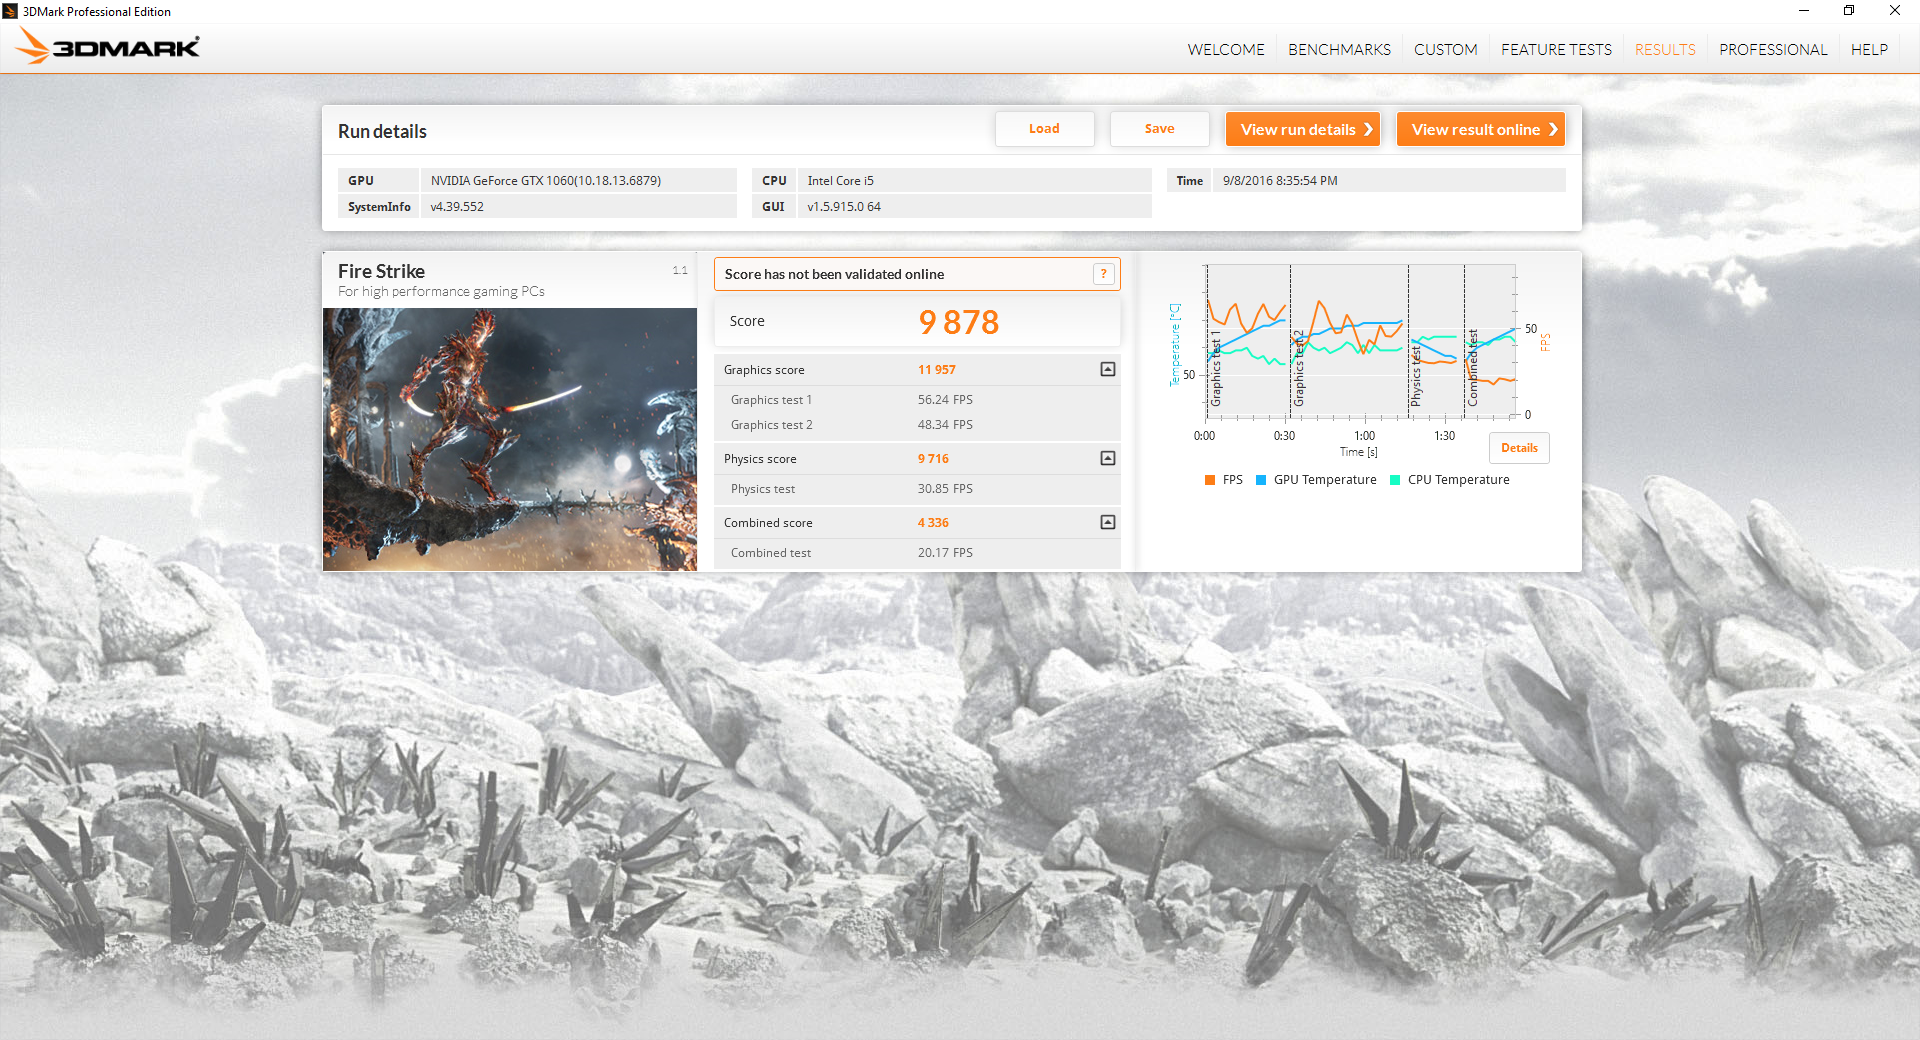
3DMark Fire Strike shows the GTX 1060 consistently outperforming the GTX 980M by about 20 percent while the GTX 1070 is another 60 to 70 percent over the GTX 1060. The previous generation Maxwell GTX 960M and 970M pale in comparison to the GTX 1060.


| 3DMark | |
| 1920x1080 Fire Strike Graphics | |
| MSI GT73VR-6RE16SR451 | |
| Aorus X7 Pro v5 | |
| MSI GT72VR 6RD-063US | |
| Asus Strix GL502VY-DS71 | |
| Asus Strix GL502VT-DS74 | |
| HP Pavilion 17 FHD V3A33AV | |
| Fire Strike Extreme Graphics | |
| MSI GT72VR 6RD-063US | |
| Asus Strix GL502VY-DS71 | |
| Asus Strix GL502VT-DS74 | |
| HP Pavilion 17 FHD V3A33AV | |
| 3840x2160 Fire Strike Ultra Graphics | |
| MSI GT73VR-6RE16SR451 | |
| MSI GT72VR 6RD-063US | |
| Asus Strix GL502VY-DS71 | |
| HP Pavilion 17 FHD V3A33AV | |
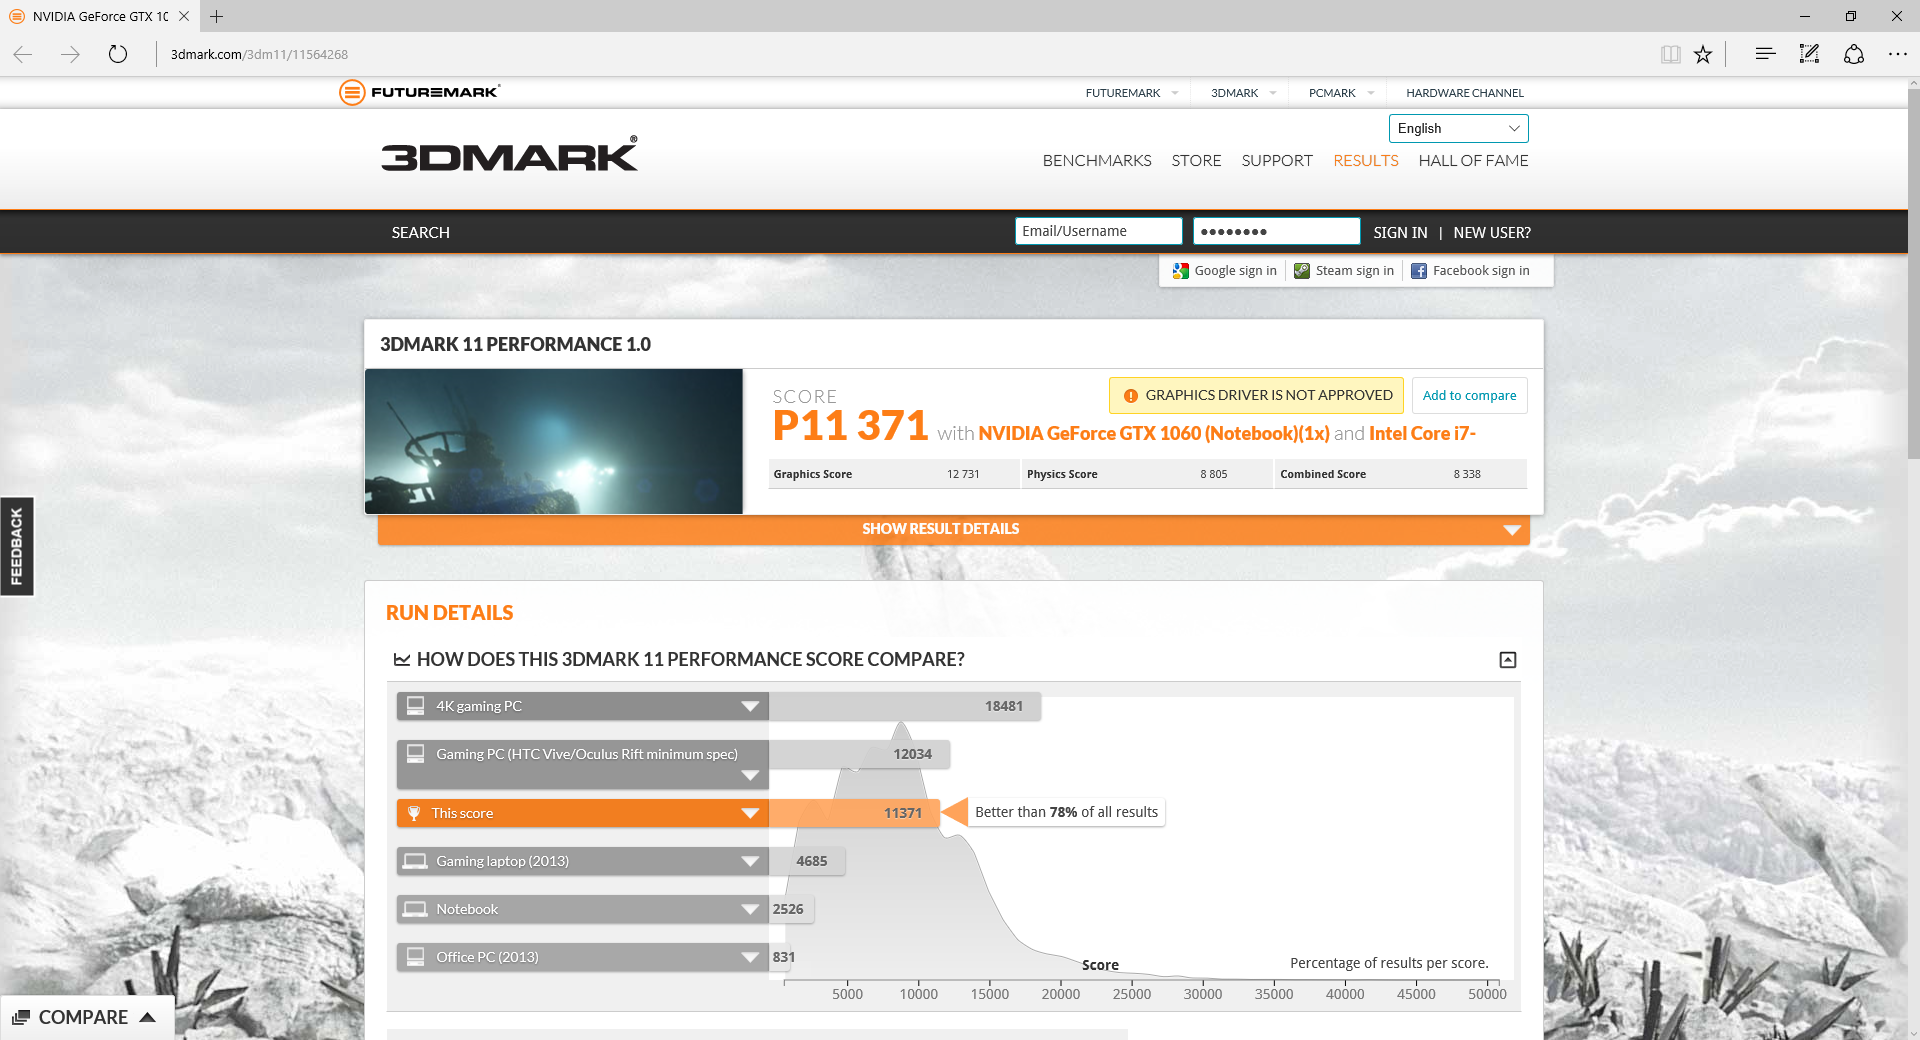
| 3DMark 11 Performance | 11371 points | |
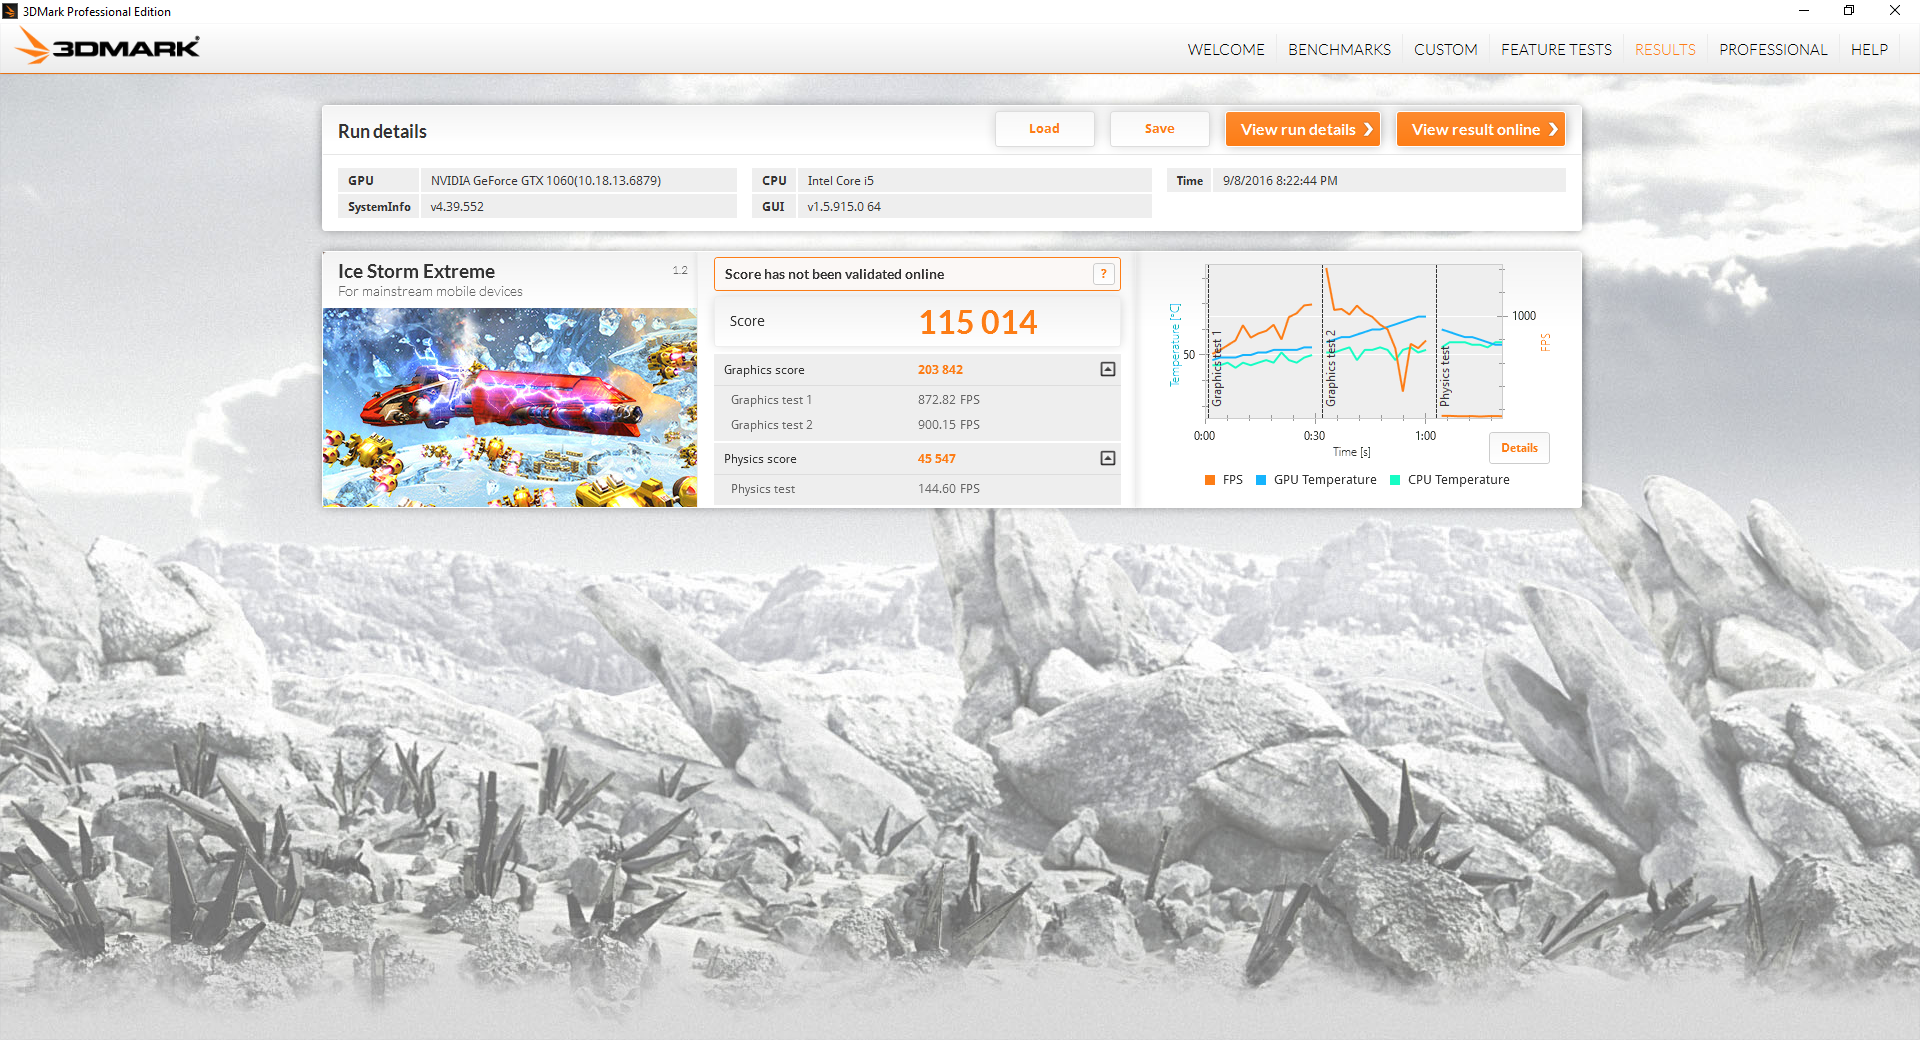
| 3DMark Ice Storm Standard Score | 118421 points | |
| 3DMark Cloud Gate Standard Score | 24051 points | |
| 3DMark Fire Strike Score | 9878 points | |
| 3DMark Fire Strike Extreme Score | 5206 points | |
Help | ||
Gaming Performance
Users can expect GTX 980M-level graphics or even faster depending on the title from the GTX 1060. We were able to play all tested games below on maximum settings at the native 1080p resolution with the exception of Guild Wars 2 and its Supersampling option. Screen tears are kept to a minimum if titles dip below 60 FPS due to G-Sync, though this comes at the cost of integrated Optimus for automatic graphics switching.
See our dedicated GPU page on the GTX 1060 for more technical information and benchmark comparisons.
| low | med. | high | ultra | |
| Guild Wars 2 (2012) | 52.9 | |||
| BioShock Infinite (2013) | 105.5 | |||
| Metro: Last Light (2013) | 82.1 | |||
| Thief (2014) | 72.4 | |||
| Batman: Arkham Knight (2015) | 85 | 62 | ||
| Metal Gear Solid V (2015) | 60 | |||
| Fallout 4 (2015) | 71.6 | |||
| Rise of the Tomb Raider (2016) | 63.5 | |||
| Doom (2016) | 96.5 | |||
| Overwatch (2016) | 106.3 |
Stress Test
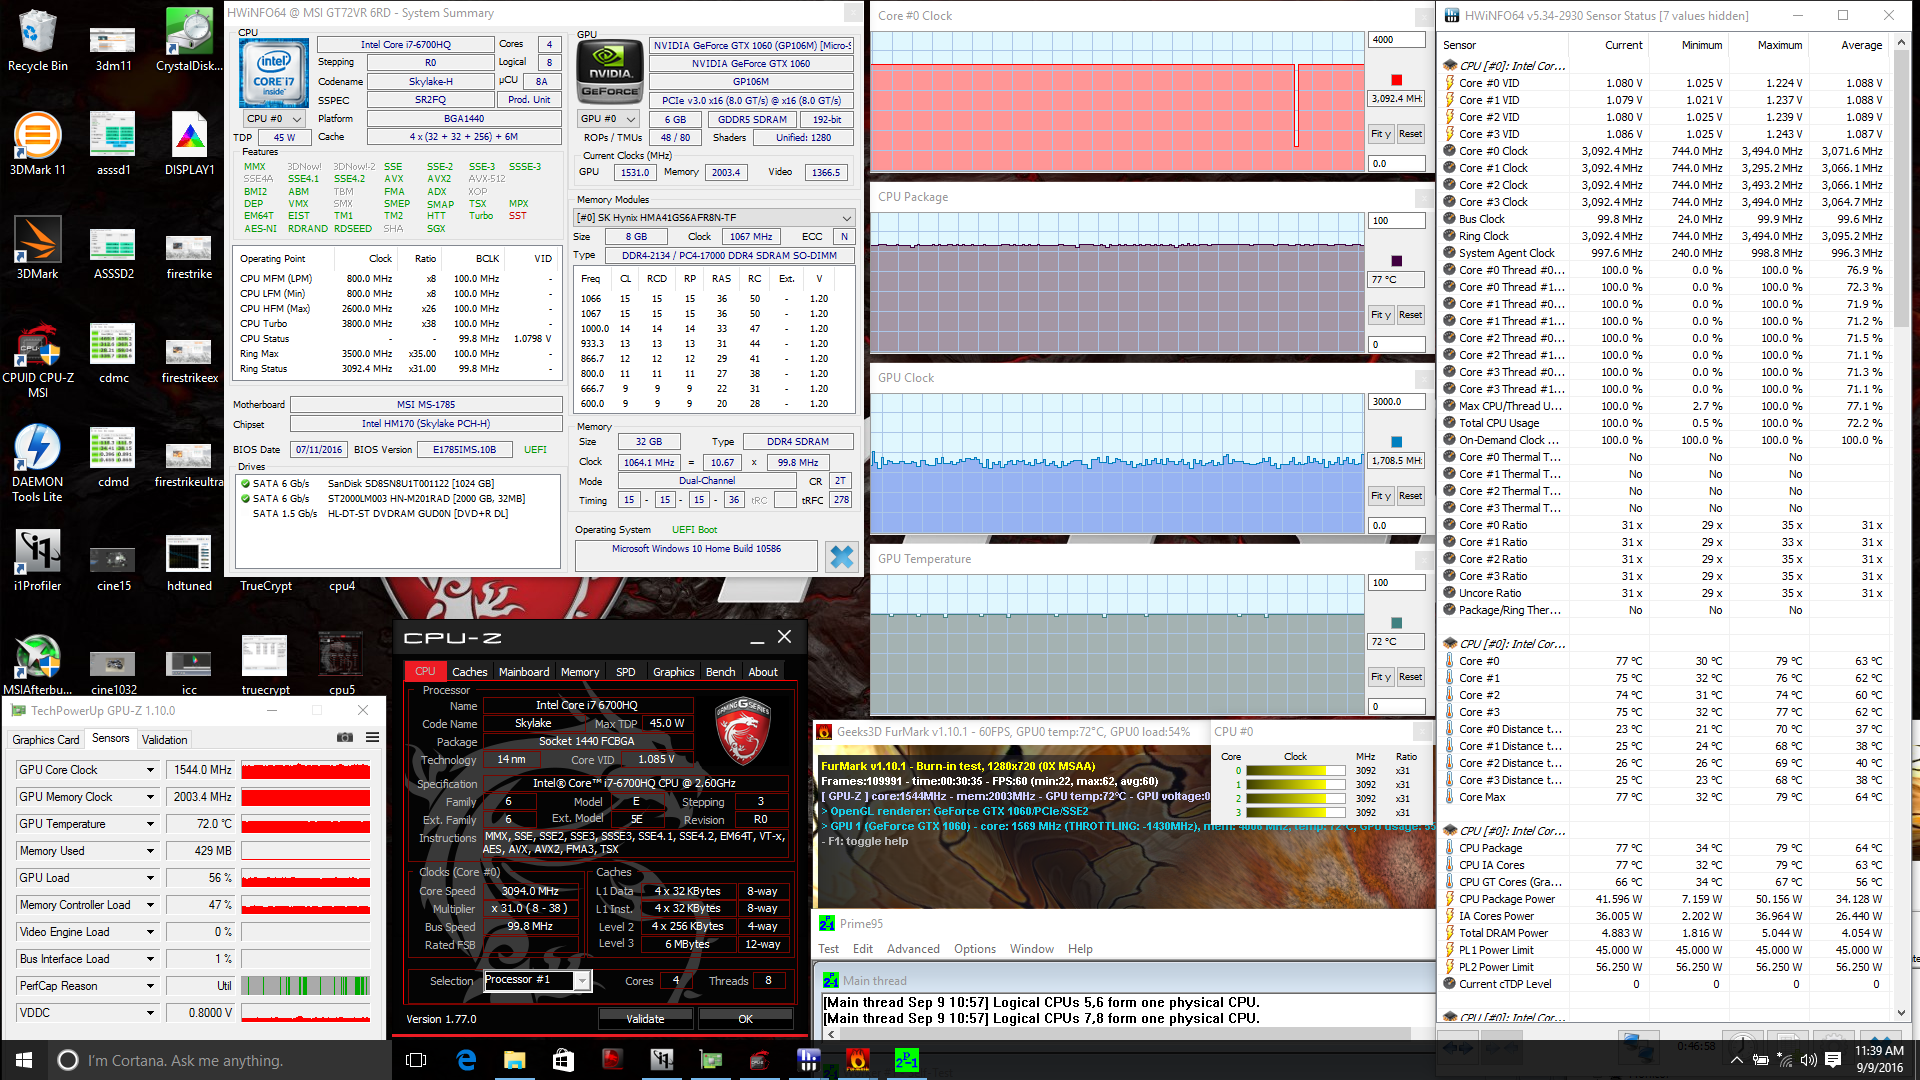
Unsurprisingly, the MSI system performs very well when subjected to extreme loads as both the CPU and GPU never throttle and are able to maintain their respective Turbo Boost speeds. Core temperatures are lower across the board compared to the MSI GT72VR 6RE and its GTX 1070 by at least a few degrees C, so users shouldn't expect a dramatically cooler system out of the GT72VR 6RD. The ultra-thin GS73VR uses the same GTX 1060 GPU and runs warmer under gaming loads at about 83 C versus just 71 C here.
Running on battery power will not throttle the system on its default settings. A 3DMark 11 run on batteries returns Physics and Graphics scores of 8518 and 13784 points, respectively, compared top 8428 and 14904 points when on mains.


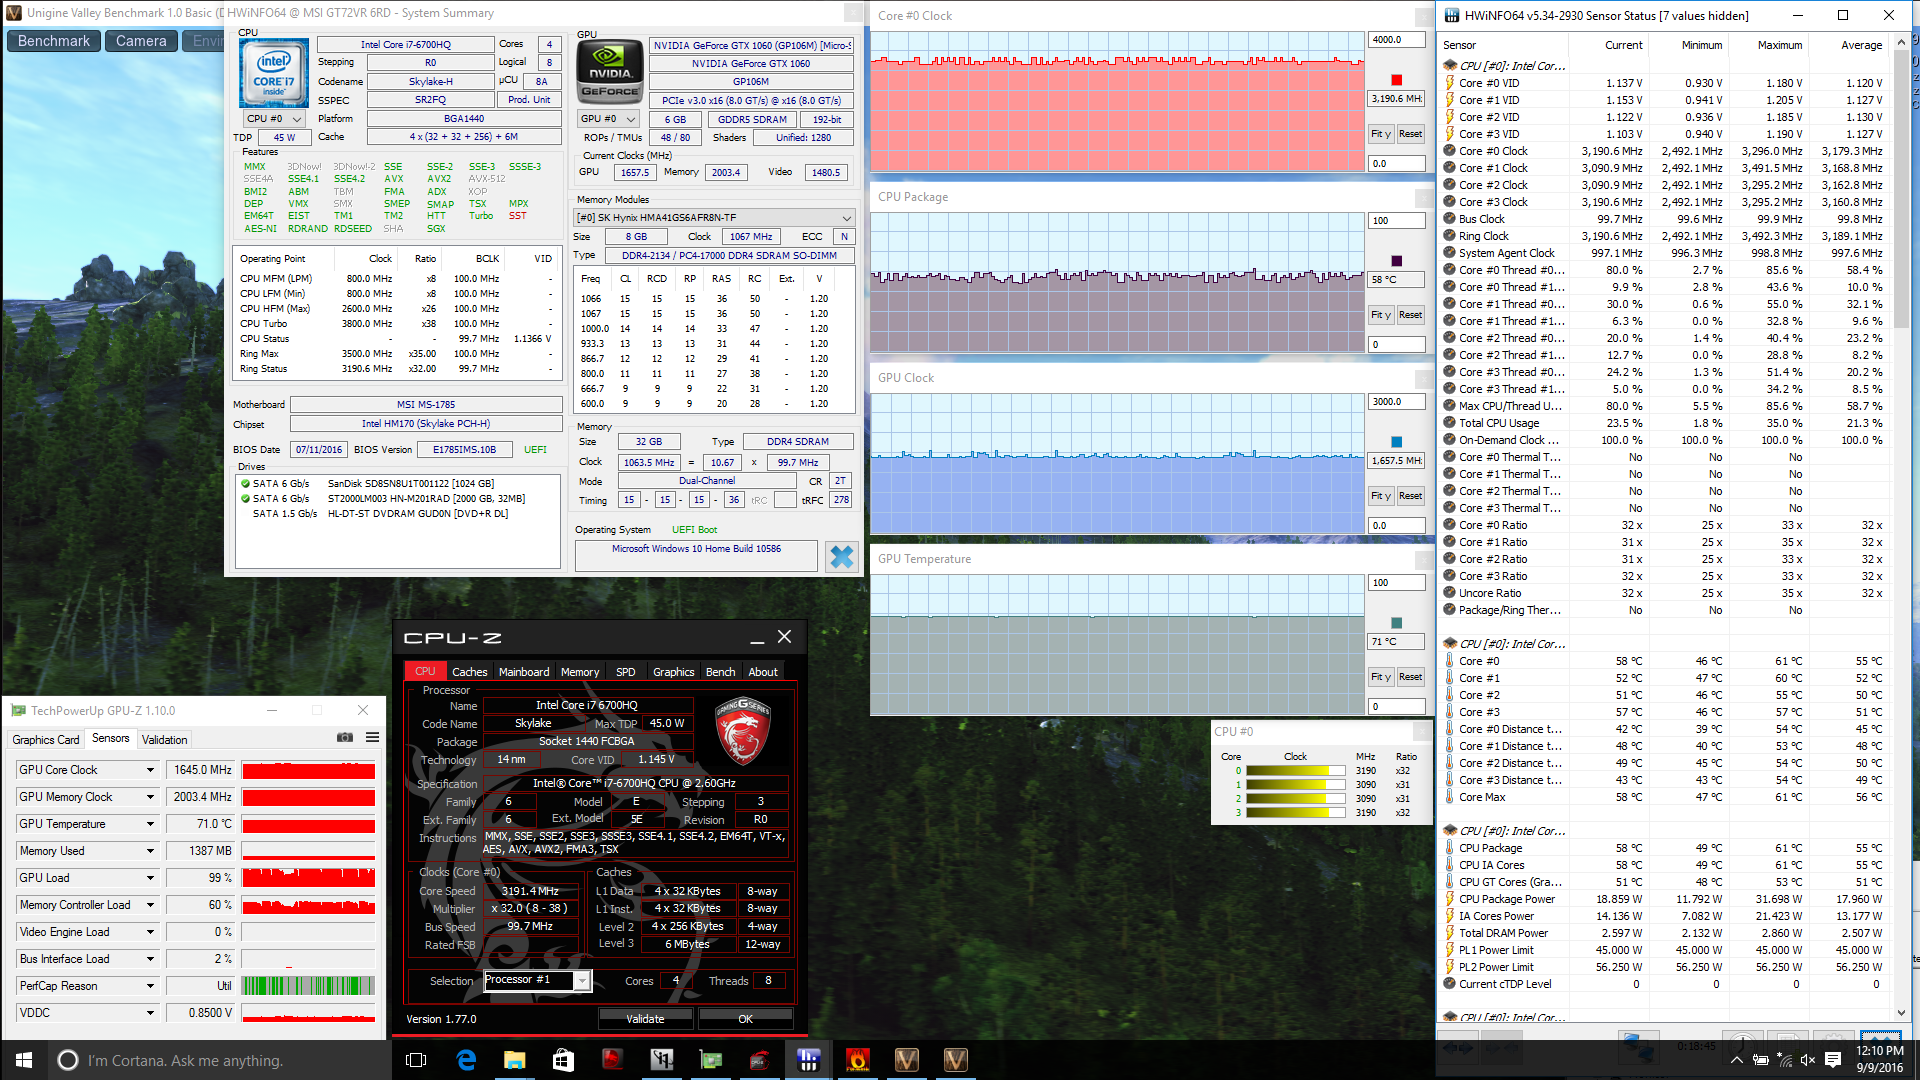
| CPU Clock (GHz) | GPU Clock (MHz) | Average CPU Temperature (°C) | Average GPU Temperature (°C) | |
| Prime95 Stress | 2.9 - 3.0 | -- | 65 | 43 |
| FurMark Stress | -- | 1569 - 1645 | 47 | 68 |
| Prime95 + FurMark Stress | 3.1 | 1544 - 1709 | 77 | 72 |
| Unigine Valley Stress | 3.1+ | 1645 - 1658 | 58 | 71 |
Emissions
System Noise
The cooling solution for the GT72VR 6RD is unchanged from the GT72VR 6RE, so we essentially have a chassis designed for GPUs with higher TDPs than our equipped GTX 1060. Is fan noise any quieter as a result?
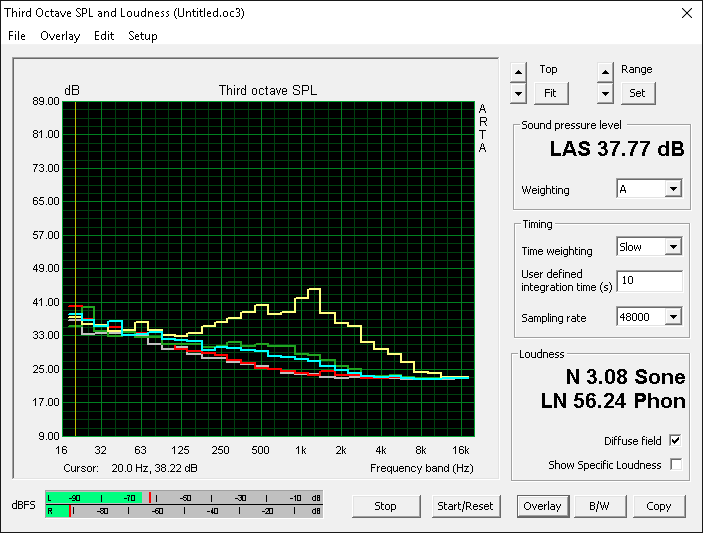
Our measurements show fan noise to be just slightly quieter under all tested loads from idling to maximum stress. The fans pulsate during low loads from about 31 to 32 dB(A), but this happens extremely infrequently and is largely unnoticeable. Fan noise when gaming ranges from 37 to 38 dB(A) compared to the low-to-mid 40 dB(A) range on most enthusiast gaming notebooks or the high 40 dB(A) range on very thin designs. As shown by our fan noise data, the Loudness graph has a very broad peak at lower frequency ranges for a lower-pitched and less distracting hum. This is compared to thinner systems with higher-pitched fans like on the GS73VR.
Noise Level
| Idle |
| 30.8 / 30.8 / 32 dB(A) |
| Load |
| 37.2 / 51.5 dB(A) |
 | ||
30 dB silent 40 dB(A) audible 50 dB(A) loud |
||
min: | ||
| MSI GT72VR 6RD-063US GeForce GTX 1060 Mobile, 6700HQ, SanDisk SD8SN8U1T001122 | MSI GT72VR 6RE-015US GeForce GTX 1070 Mobile, 6700HQ, SanDisk SD8SNAT256G1122 | MSI GT73VR-6RE16SR451 GeForce GTX 1070 Mobile, 6820HK, 2x Samsung SM951 MZVPV256HDGL (RAID 0) | Asus G752VS-XB78K GeForce GTX 1070 Mobile, 6820HK, Toshiba NVMe THNSN5512GPU7 | Asus G701VO-CS74K GeForce GTX 980 (Laptop), 6820HK, 2x Samsung SM951 MZVPV512HDGL (RAID 0) | |
|---|---|---|---|---|---|
| Noise | -3% | -2% | -2% | -3% | |
| off / environment * | 28.6 | 28.9 -1% | 30 -5% | 30 -5% | 29.1 -2% |
| Idle Minimum * | 30.8 | 32.4 -5% | 32 -4% | 31 -1% | 29.1 6% |
| Idle Average * | 30.8 | 32.4 -5% | 33 -7% | 32 -4% | 31.9 -4% |
| Idle Maximum * | 32 | 32.4 -1% | 35 -9% | 33 -3% | 31.9 -0% |
| Load Average * | 37.2 | 39.4 -6% | 35 6% | 40 -8% | 46 -24% |
| Load Maximum * | 51.5 | 52 -1% | 49 5% | 47 9% | 47.5 8% |
* ... smaller is better
Temperature
Surface temperatures are cooler than on the GT72VR with GTX 1070 as a direct consequence of the lower running temperatures as described on our Stress Test section above. The warmest spots on the GT72VR 6RD, for example, are 37.4 C and 54.4 C compared to 40.4 C and 59.4 C on the GT72VR 6RE. The keyboard and palm rests will never reach uncomfortable temperatures even when subjected to unrealistically high loads to make this one of the cooler gaming notebooks in its size category with the same or equivalent GPU.


(+) The maximum temperature on the upper side is 37.4 °C / 99 F, compared to the average of 40.4 °C / 105 F, ranging from 21.2 to 68.8 °C for the class Gaming.
(-) The bottom heats up to a maximum of 54 °C / 129 F, compared to the average of 43.2 °C / 110 F
(+) In idle usage, the average temperature for the upper side is 26.3 °C / 79 F, compared to the device average of 33.8 °C / 93 F.
(+) The palmrests and touchpad are cooler than skin temperature with a maximum of 25.4 °C / 77.7 F and are therefore cool to the touch.
(+) The average temperature of the palmrest area of similar devices was 28.9 °C / 84 F (+3.5 °C / 6.3 F).
Speakers
Sound quality is very good from the stereo 3 W speakers and 5 W subwoofer with a great balance between treble and bass frequencies across the entire volume range. We can notice no static or major reverberations when set to its maximum volume. Like on other MSI VR models, the GT72VR uses the same Nahimic 2 software for configuring audio settings. The GT72VR model is lacking the HiFi Sabre DAC, but it at least carries dedicated 3.5 mm ports for microphone, earphones, line-in, and line-out.

")
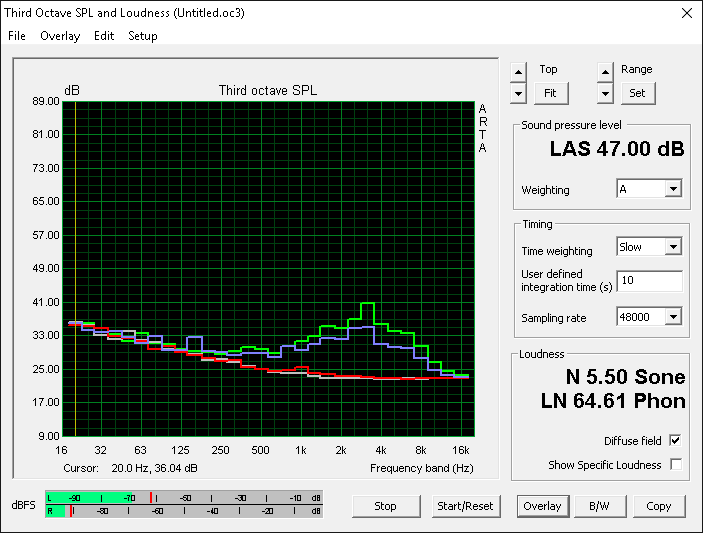
MSI GT72VR 6RD-063US audio analysis
(±) | speaker loudness is average but good (72.9 dB)
Bass 100 - 315 Hz
(+) | good bass - only 3.2% away from median
(±) | linearity of bass is average (14% delta to prev. frequency)
Mids 400 - 2000 Hz
(+) | balanced mids - only 3.5% away from median
(±) | linearity of mids is average (9.2% delta to prev. frequency)
Highs 2 - 16 kHz
(+) | balanced highs - only 2.4% away from median
(+) | highs are linear (5.4% delta to prev. frequency)
Overall 100 - 16.000 Hz
(+) | overall sound is linear (14.5% difference to median)
Compared to same class
» 25% of all tested devices in this class were better, 7% similar, 68% worse
» The best had a delta of 6%, average was 18%, worst was 132%
Compared to all devices tested
» 15% of all tested devices were better, 4% similar, 82% worse
» The best had a delta of 4%, average was 25%, worst was 134%
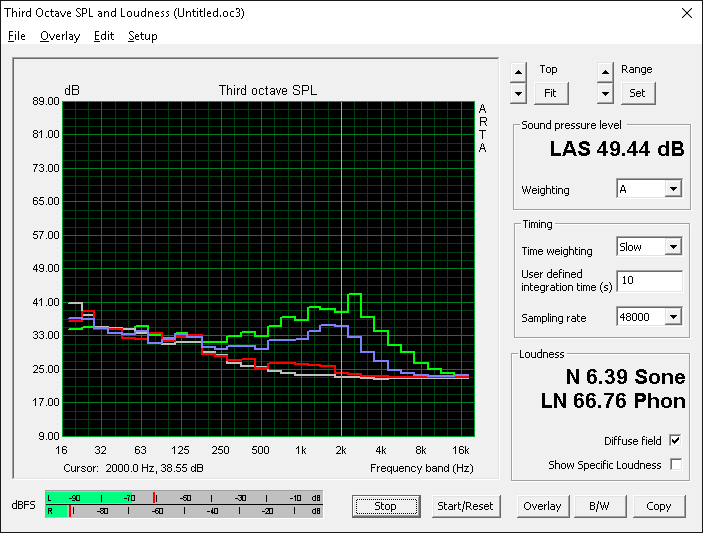
Apple MacBook 12 (Early 2016) 1.1 GHz audio analysis
(+) | speakers can play relatively loud (83.6 dB)
Bass 100 - 315 Hz
(±) | reduced bass - on average 11.3% lower than median
(±) | linearity of bass is average (14.2% delta to prev. frequency)
Mids 400 - 2000 Hz
(+) | balanced mids - only 2.4% away from median
(+) | mids are linear (5.5% delta to prev. frequency)
Highs 2 - 16 kHz
(+) | balanced highs - only 2% away from median
(+) | highs are linear (4.5% delta to prev. frequency)
Overall 100 - 16.000 Hz
(+) | overall sound is linear (10.2% difference to median)
Compared to same class
» 5% of all tested devices in this class were better, 2% similar, 93% worse
» The best had a delta of 5%, average was 19%, worst was 53%
Compared to all devices tested
» 3% of all tested devices were better, 1% similar, 96% worse
» The best had a delta of 4%, average was 25%, worst was 134%
Frequency Comparison (Checkbox selectable!)
Graph 1: Pink Noise 100% Vol.; Graph 2: Audio off
Energy Management
Power Consumption
The system demands just over 24 W when set to its low-power idling state and almost 120 W when under gaming loads. This is compared to 152 W on the GT72VR 6RE, so it's a 30 W to 40 W increase for a raw GPU performance boost of about 50 to 70 percent when moving up to the more powerful SKU. Maximum load with both Prime95 and FurMark demands about 163 W against a power adapter rated for 230 W.
| Off / Standby | |
| Idle | |
| Load |
|
| MSI GT72VR 6RD-063US 6700HQ, GeForce GTX 1060 Mobile, SanDisk SD8SN8U1T001122, IPS, 1920x1080, 17.30 | MSI GT72VR 6RE-015US 6700HQ, GeForce GTX 1070 Mobile, SanDisk SD8SNAT256G1122, IPS, 1920x1080, 17.30 | MSI GT73VR-6RE16SR451 6820HK, GeForce GTX 1070 Mobile, 2x Samsung SM951 MZVPV256HDGL (RAID 0), TN, 1920x1080, 17.30 | Asus G752VS-XB78K 6820HK, GeForce GTX 1070 Mobile, Toshiba NVMe THNSN5512GPU7, IPS, 1920x1080, 17.30 | Asus G701VO-CS74K 6820HK, GeForce GTX 980 (Laptop), 2x Samsung SM951 MZVPV512HDGL (RAID 0), IPS, 1920x1080, 17.30 | |
|---|---|---|---|---|---|
| Power Consumption | -6% | -19% | -4% | -14% | |
| Idle Minimum * | 24.4 | 22.3 9% | 31 -27% | 24 2% | 28.2 -16% |
| Idle Average * | 26.6 | 27.3 -3% | 35 -32% | 31 -17% | 32 -20% |
| Idle Maximum * | 36.4 | 30 18% | 40 -10% | 36 1% | 32.6 10% |
| Load Average * | 117 | 152.2 -30% | 106 9% | 94 20% | 162.2 -39% |
| Load Maximum * | 163.6 | 204.2 -25% | 218 -33% | 204 -25% | 173.5 -6% |
* ... smaller is better
Battery Life
Runtimes are nearly identical to our previous GT72VR 6RE at about 3.5 hours of real-world WLAN use. This is also similar to other 17-inch gaming notebooks like the Asus G752VS or the G701VO. Thus, users expecting longer battery life from the GTX 1060 version of the GT72VR will be disappointed.
Charging from near empty to full capacity will take roughly 2.5 hours.
| MSI GT72VR 6RD-063US 6700HQ, GeForce GTX 1060 Mobile, 83 Wh | MSI GT72VR 6RE-015US 6700HQ, GeForce GTX 1070 Mobile, 83 Wh | MSI GT73VR-6RE16SR451 6820HK, GeForce GTX 1070 Mobile, 75.2 Wh | Asus G752VS-XB78K 6820HK, GeForce GTX 1070 Mobile, 90 Wh | Asus G701VO-CS74K 6820HK, GeForce GTX 980 (Laptop), 93 Wh | |
|---|---|---|---|---|---|
| Battery Runtime | -2% | -13% | -6% | -13% | |
| Reader / Idle | 323 | 322 0% | 290 -10% | 311 -4% | 242 -25% |
| WiFi v1.3 | 221 | 224 1% | 206 -7% | 210 -5% | 202 -9% |
| Load | 93 | 86 -8% | 72 -23% | 84 -10% | 89 -4% |
Pros
Cons
Verdict

The GT72 chassis may be aging, but its hardware and versatility shouldn't be overlooked. Its cooling system can handle GPUs far more power-hungry than the GTX 1060, so the GT72VR 6RD runs cooler and quieter than other gaming systems with the same Pascal GPU. Combine this with its unique 120 Hz/5 ms display and 4K UHD options and the system becomes much easier to recommend over others.
The model's trump card is its removable GPU. It should be relatively simple for a gamer to upgrade the GTX 1060 to the GTX 1070 and this option alone may make the GT72VR 6RD more attractive. Serviceability is easier than on an equivalent Asus and is comparable to a barebones unit, so users can simply purchase the lower-end GT72VR SKU (or even an older GT72) and upgrade at a future date should the GTX 1060 become insufficient.
We are also hoping that there will be better quality control regarding the display. We've had two GT72VR units come in so far and both have shown either uneven bezels or very noticeable backlight bleeding. It's recommended that users check the display for any discrepancies before or immediately after purchase.
The GT72VR series is kept relevant by its MXM 3.0b slot and easy serviceability even if it has already been succeeded by the GT73VR.
MSI GT72VR 6RD-063US
-
09/15/2016 v5.1(old)
Allen Ngo
Pricecompare
