Gigabyte P55W v7 Notebook Review

For the original German review, see here.
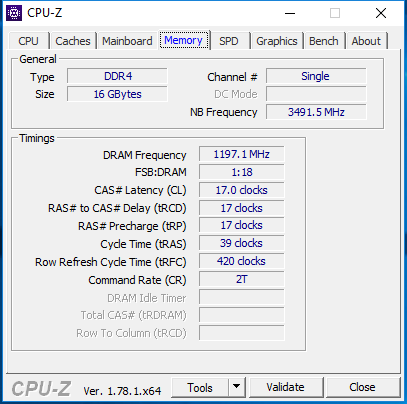
After testing Gigabyte's P55W v6 in late January, the Kaby Lake successor dubbed P55W v7 is now already waiting in the wings. It is - surprise - the seventh iteration of the relatively low-priced 15.6-inch gaming laptop. The modifications made to the casing are limited to some new interfaces and different positioning. Furthermore, a new screen is used for the first time since the P55W v4. The 128 GB SSD by Transcend has been replaced by a 256 GB model by Liteon. While 16 GB of DDR4 RAM operate in dual-channel mode in the v6, the 16 GB in the v7 is only connected via one memory channel (1 RAM slot empty).
The most important innovation is, of course, the brand new Intel Core i7-7700HQ that replaces the very similar but somewhat slower i7-6700HQ in the v6. Gigabyte again relies on Nvidia's GeForce GTX 1060 with 6 GB of dedicated vRAM introduced in the v6 model. The screen is still IPS and Full HD. A DVD burner is also installed for users who still use digital optical disc storage. The reason that the P55W v7 can be offered for a lower price (approximately 1700 Euros (~$1802) at test time) than many rivals based on the same CPU and graphics card is the lack of a metal casing, subwoofer, 4K or WQHD, Thunderbolt 3, and G-Sync. In return, Nvidia's Optimus promises lower power consumption and longer battery runtimes.
We primarily focused on size, price, and power components while choosing comparison laptops for this test. Like the predecessor, the other comparison laptops are furnished with an i7-6700HQ, GTX 1060, and SSD. The participants are:
Case
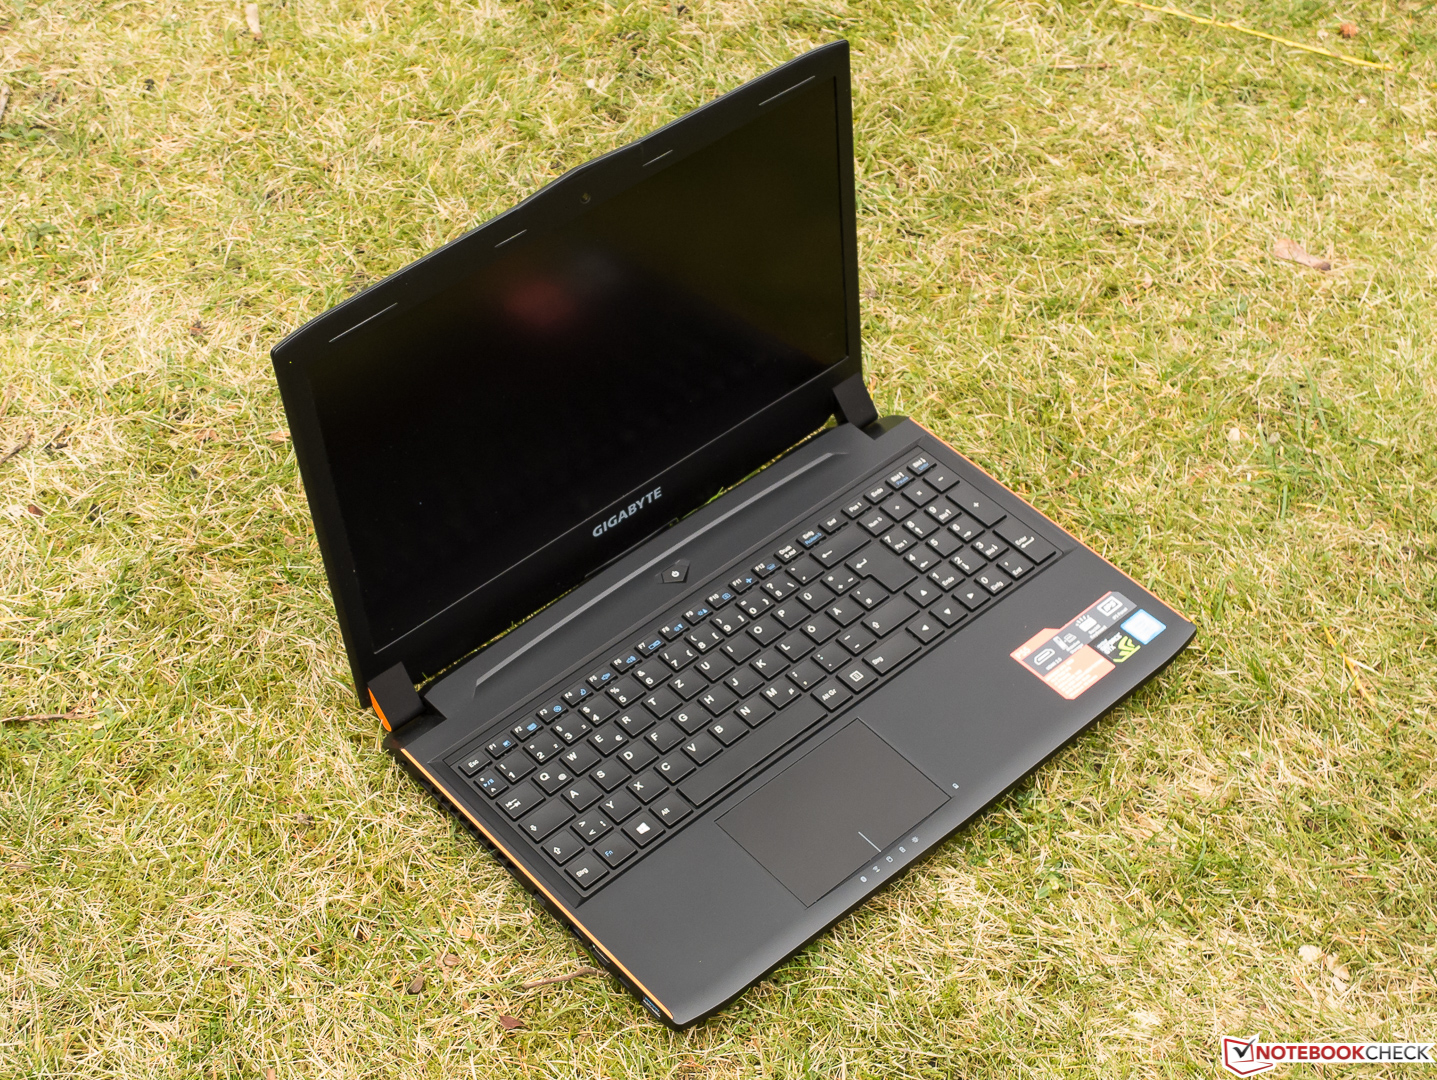
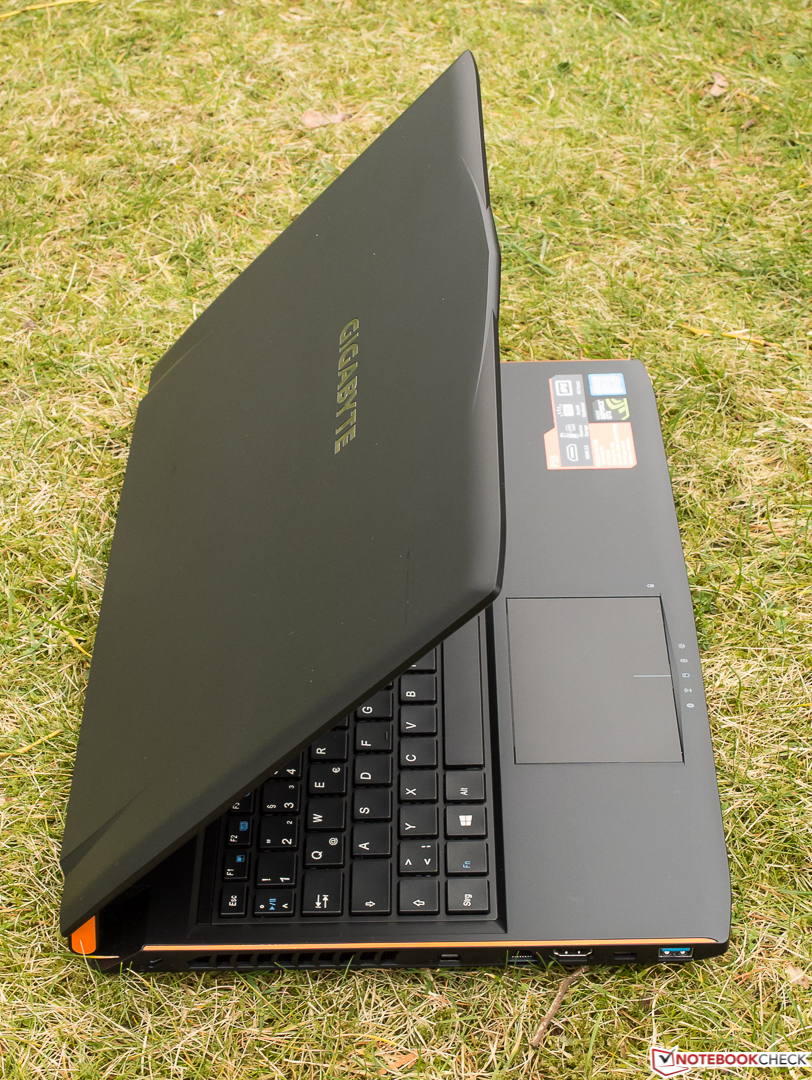
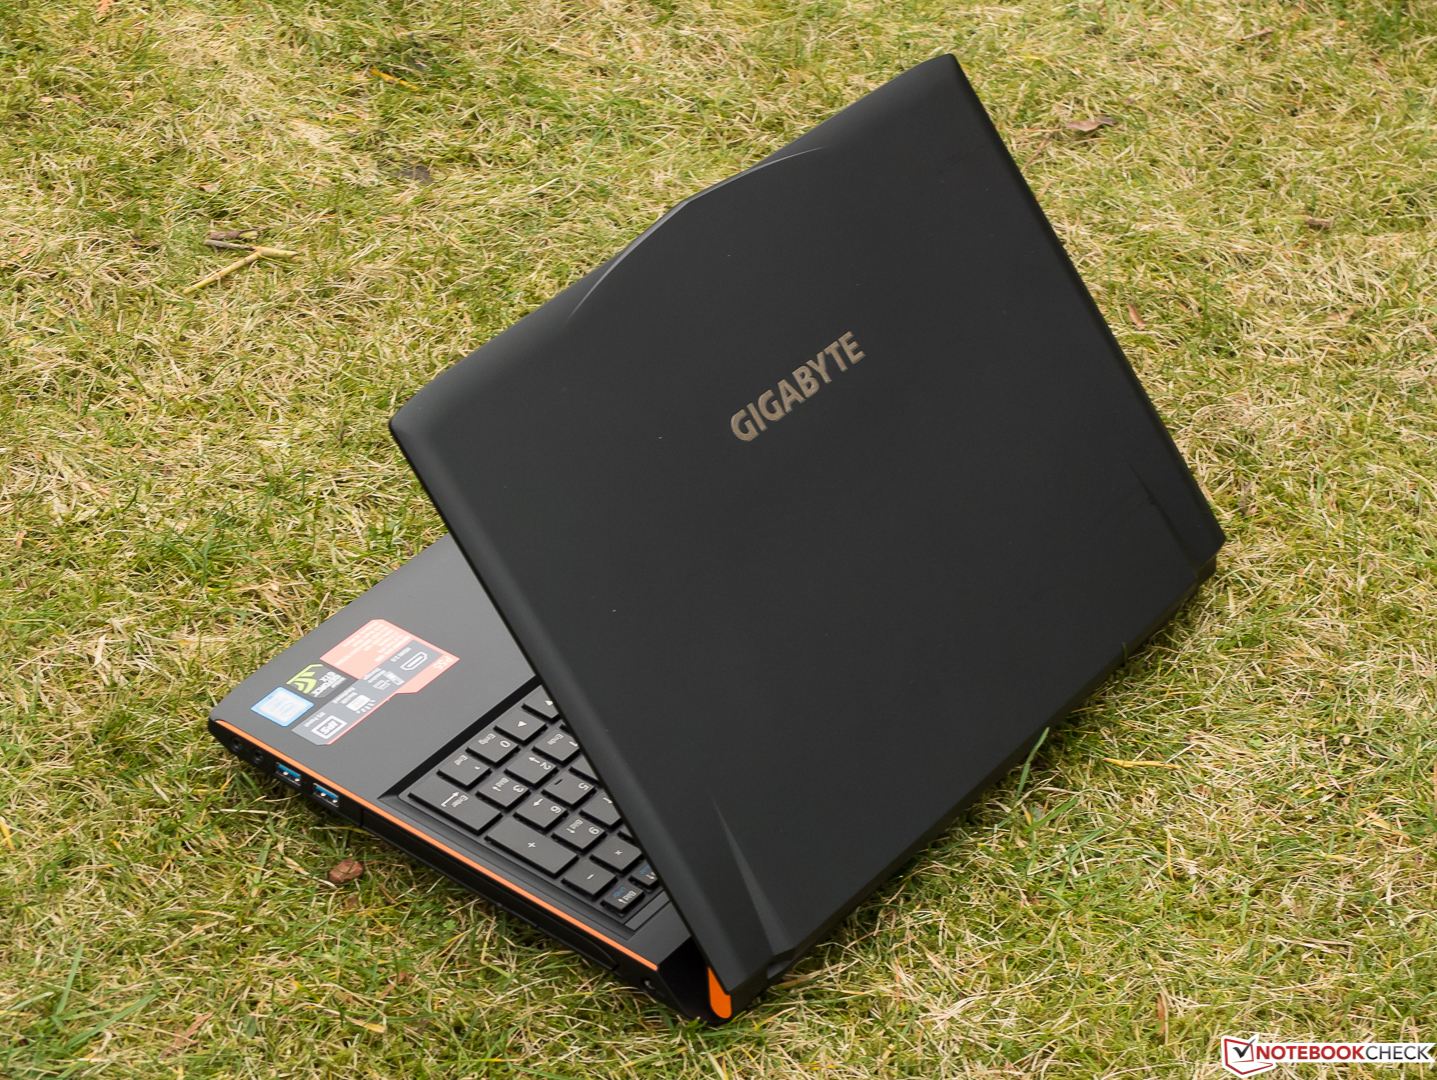
Gigabyte is again continuous with the casing and only modifies the interfaces compared with the former P55W v4 and v5. The futuristic sharp-edged and sooner masculine design with eye-catching orange trims on the base's lateral upper edges and the non-slip but still fingerprint-susceptible soft-touch surfaces are not stale. However, they are not as flashy as in Asus' ROG or Alienware's gaming laptops.
Since plastic is again used exclusively, the overall solid-looking base can be warped to a small degree with a lot of effort. It produces a loud cracking noise that we located in the vent's area. The lid is much easier to twist. Its pressure resistance has apparently been improved as image distortions can only be provoked using high pin-point pressure. Very good: Although the lid can be opened easily with one hand, it stays in its position when the laptop is jerked and only rocks for a moment.
We did not find any manufacturing flaws. The gaps look even and the edges do not protrude anywhere. In total, the casing makes a good impression.


None of the laptops in the test is a member of the especially compact, 15.6-inch gaming-laptop genre, such as MSI's GS63VR-6RF16H22 Stealth Pro (1.9 kg, 18 mm height). Schenker presents its relatively prominent yet also quite slim XMG P507. MSI's GE62VR has the smallest surface area, and like Asus' Strix, it belongs to the lightest devices in the test at "just" 2.5 kg. Like the predecessor with identical dimensions, our review sample's height of 34 mm is striking.
Connectivity
Interfaces
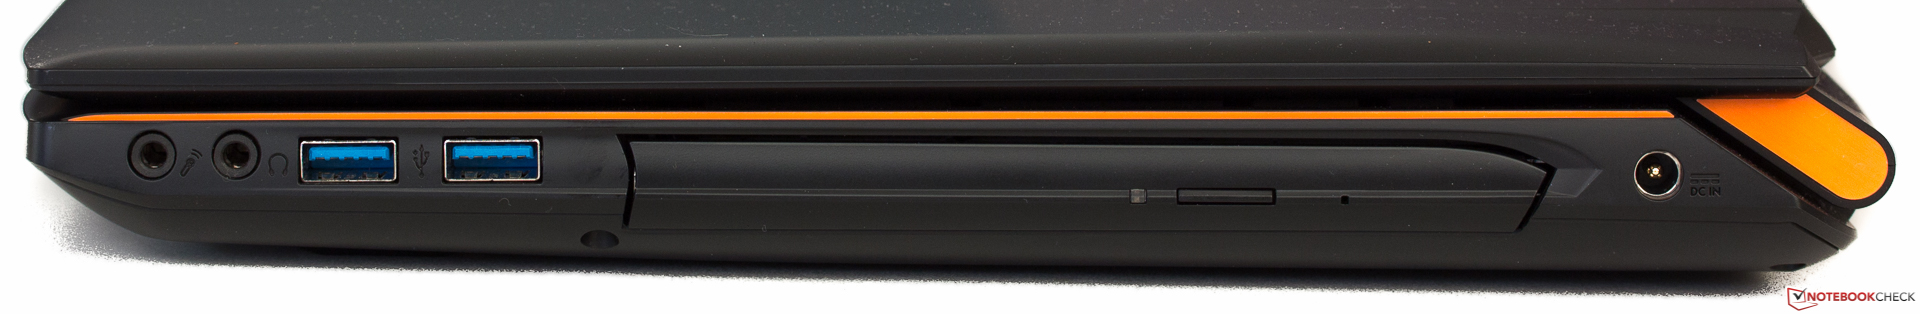
While premium-priced gaming laptops now regularly feature Thunderbolt 3, this cannot be expected in the price range of our review sample. Consequently, all comparison devices do not sport this versatile and fast interface. In return, USB 3.1 Type-C Gen2 is present. Thanks to HDMI 2.0 and mini-DisplayPort, external 4K screens can be used at their full 60 Hz. Only a few potential buyers will miss the absence of the old-fashioned VGA.
The card reader is on the front. Unfortunately, Gigabyte has placed all sufficiently spaced ports, including Ethernet for stationary use, on the front sides where inserted cables and flash drives could interfere with using an external mouse.

SD-Card Reader
Like all participants in this test, except for MSI's sluggish GE62VR in this aspect, Gigabyte's P55W v7 achieves mediocre transfer rates with our Toshiba Exceria Pro SDXC 64 GB UHS-II reference SD card. This points to a USB 3.0 interface and does not differ much from the other comparison laptops. By comparison: The average transfer rates of all SD-card readers that we have tested to date is approximately 63 MB/s; very fast models achieve more than twice the speed at up to 213 MB/s.
| SD Card Reader | |
| average JPG Copy Test (av. of 3 runs) | |
| Schenker XMG P507 | |
| Gigabyte P55W v7 | |
| Asus Strix GL502VM-FY039T | |
| Gigabyte P55W v6 | |
| MSI GE62VR 6RF-001US | |
| maximum AS SSD Seq Read Test (1GB) | |
| Gigabyte P55W v7 | |
| Gigabyte P55W v6 | |
| Schenker XMG P507 | |
| Asus Strix GL502VM-FY039T | |
| MSI GE62VR 6RF-001US | |
Communication
Mobile Internet access is not wanted and not present, either. Gigabyte relies on Intel's tried and fast module Wireless-AC 8260 (MIMO 2x2) that transmits in the 802.11 standard and, above all, in the less frequented 5 GHz band. Thanks to two antennas, a theoretical gross rate of 867 MBit/s can be achieved. After deducting the unavoidable overhead, a very good 663 MBit/s in receive and a good 470 MBit/s in transmit were achieved under ideal conditions (1 meter away from the Linksys EA8500 test router). The comparably configured rivals in the test are on par.
| Networking | |
| iperf3 transmit AX12 | |
| Asus Strix GL502VM-FY039T | |
| Gigabyte P55W v6 | |
| Gigabyte P55W v7 | |
| iperf3 receive AX12 | |
| Asus Strix GL502VM-FY039T | |
| Gigabyte P55W v7 | |
| Gigabyte P55W v6 | |
Accessories
Besides a user manual and two DVDs with OS, software, and drivers, only the compulsory power supply is found in the box. Gigabyte does not offer any accessories made specifically for the P55 lineup.
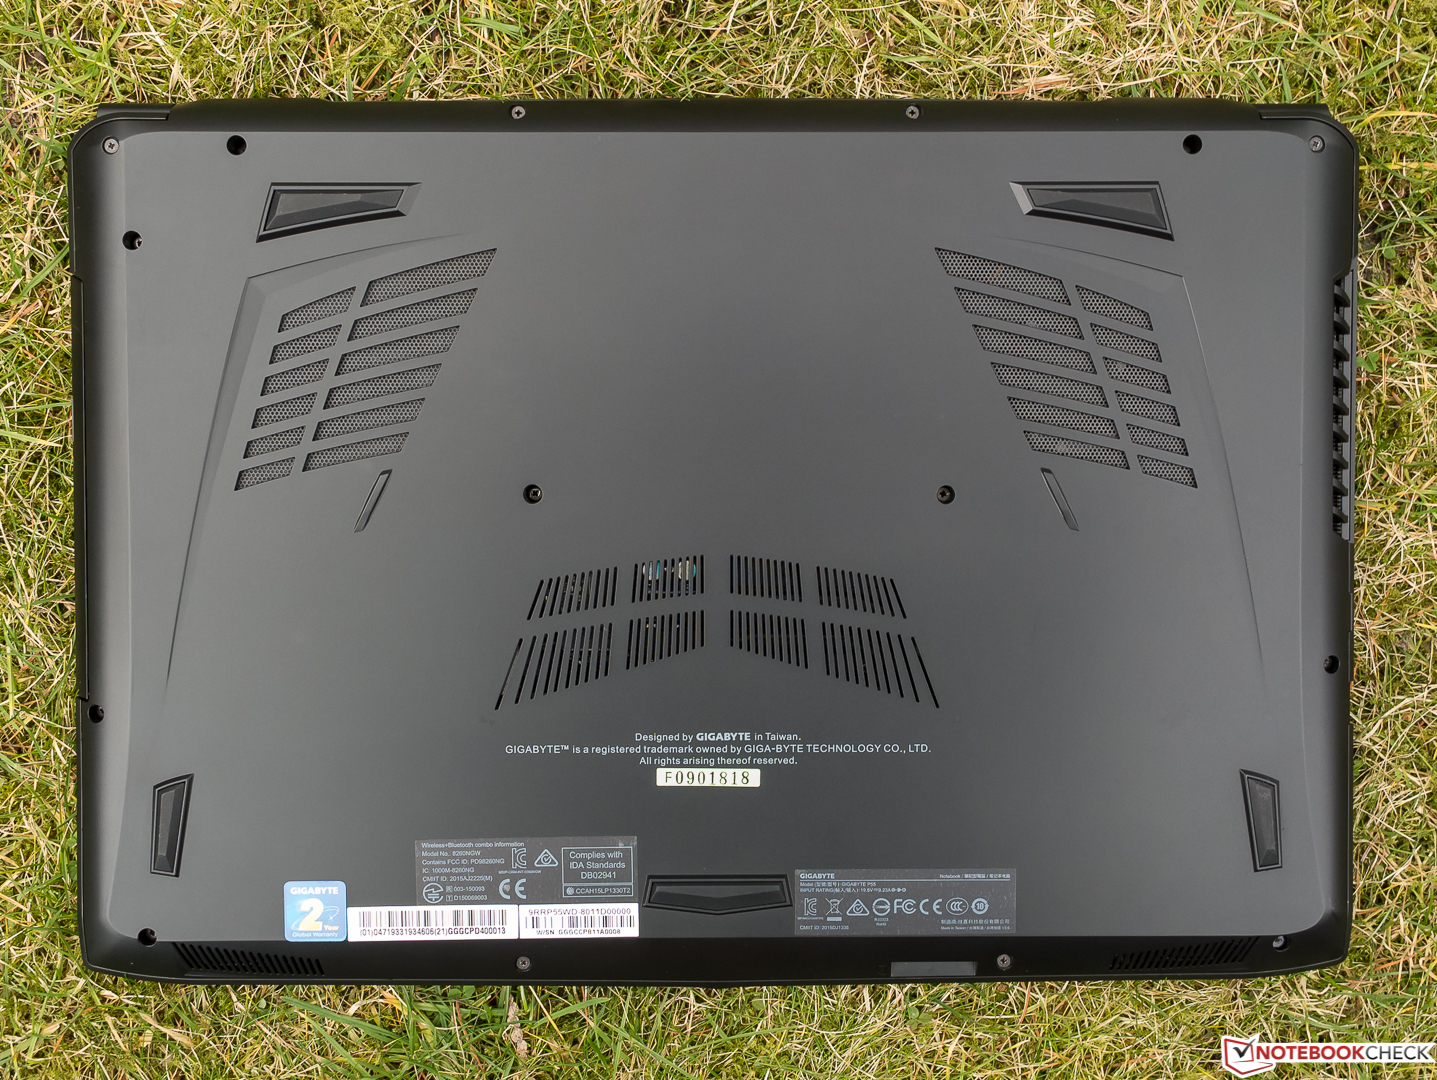
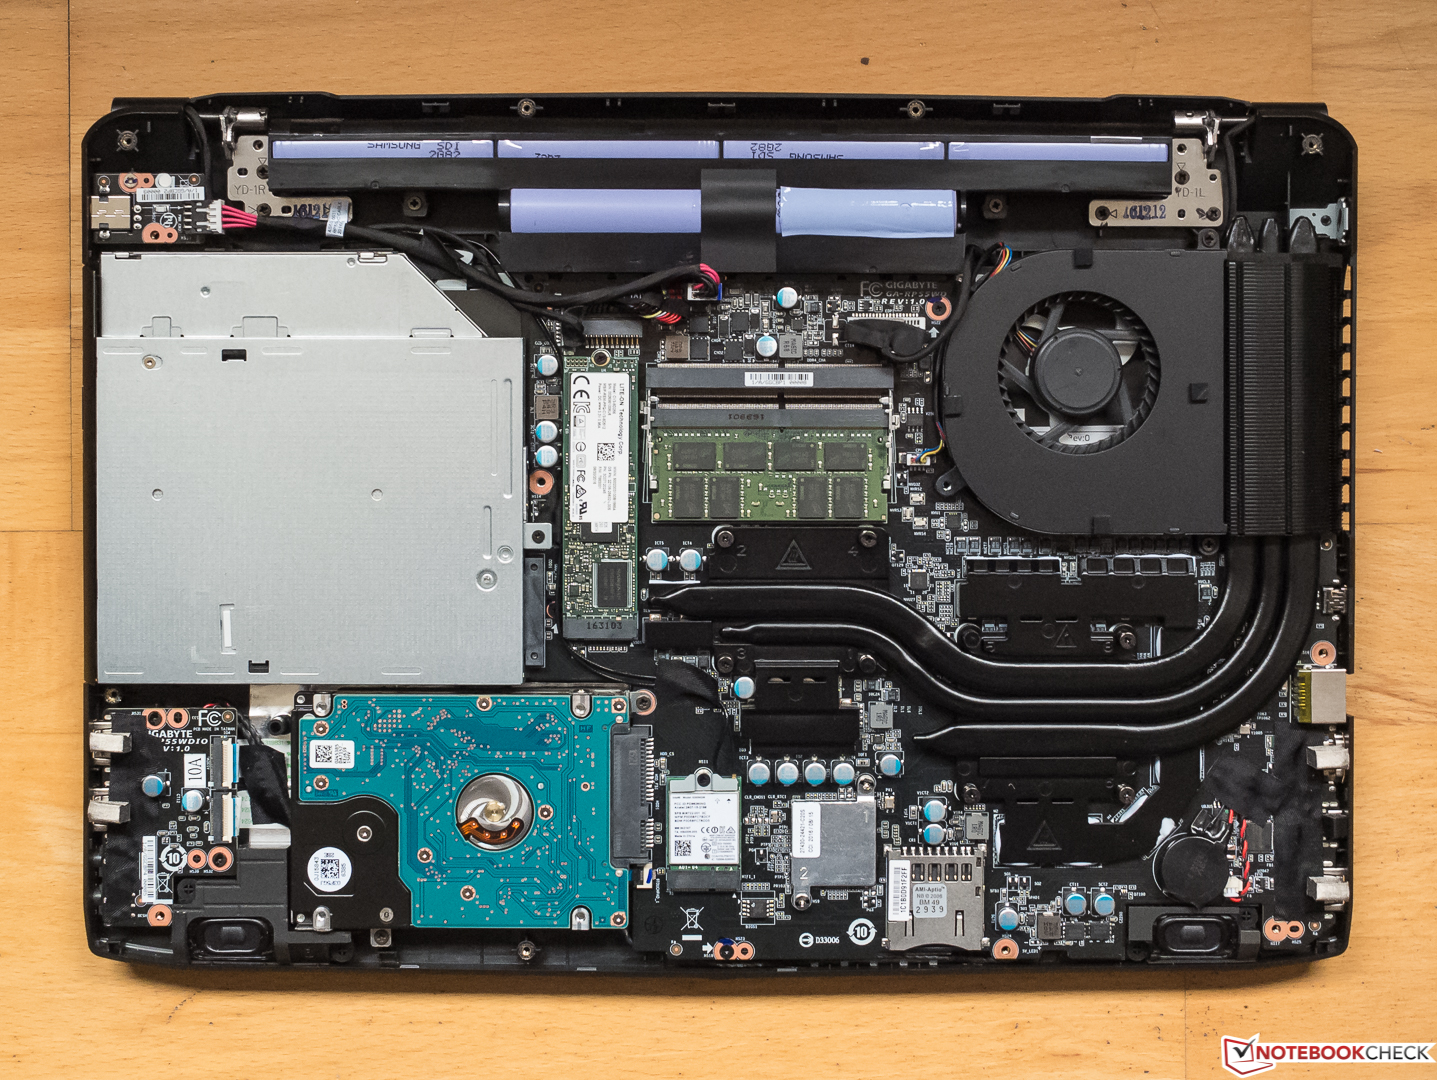
Maintenance
A maintenance hatch is not available. However, it is relatively easy to remove the base plate after releasing 15 Philips screws. The battery, fan, storage device, RAM banks, and Wi-Fi module can then be accessed, not leaving much if anything to be desired in terms of maintenance.
Warranty
While US buyers will be pleased about the manufacturer's three-year warranty, the period is limited to only two years in Germany (one year on battery and power supply). Details can be found here. Gigabyte does not seem to offer any warranty upgrades. In addition to this warranty, the legal retailer warranty of two years applies. Please see our Guarantees, Return Policies and Warranties FAQ for country-specific information.
Input Devices
Keyboard
Gigabyte has not made any changes to the two-level, backlit chiclet keyboard since the P55W v4 - and this is good. The width of the main field is roughly identical with that of a standard desktop keyboard. The key size and spacing do not thwart touch typing. The manufacturer does not install dedicated macro keys or the usual extra column of keys with special functions as found in bigger gaming laptops. The mostly standard layout does not present any surprises.
The non-slip and impeccably lettered keys, some of which are slightly concave, have a long drop and well-palpable pressure point. Their stop is not too soft, making them perfect in the tester's opinion. This results in a pleasing typing feel with good feedback. In contrast to the small keys, the big keys, like space and return, clatter audibly, which forbids extensive typing sessions in noise-sensitive environments. The homogeneous yet somewhat too dark backlight also has to be criticized. The lowered keyboard is fitted flush, and it hardly dents.
Touchpad
The ClickPad without dedicated keys is used for a third time in the P55W v7. It is unusual that the area of both replacement keys marked by a vertical line does not respond to swipe gestures. Only the surface above it is intended for this. It is a bit small and has a relatively wide area at the sides that does not respond to touch, either. We nevertheless had enough room for gestures in practice.
The gliding properties of the absolutely sleek surface are good, but very moist fingers sometimes tend to stutter. While the pinpoint accuracy is without reproach, very fast gestures are sometimes ignored. The tester would have wished for a slightly deeper drop and a bit less resistance for the replacement mouse keys. The crisp pressure point provides tactile and acoustic feedback. Gestures for up to three fingers can be configured in the Elan Smart Pad menu, but it does not offer many options.

Display
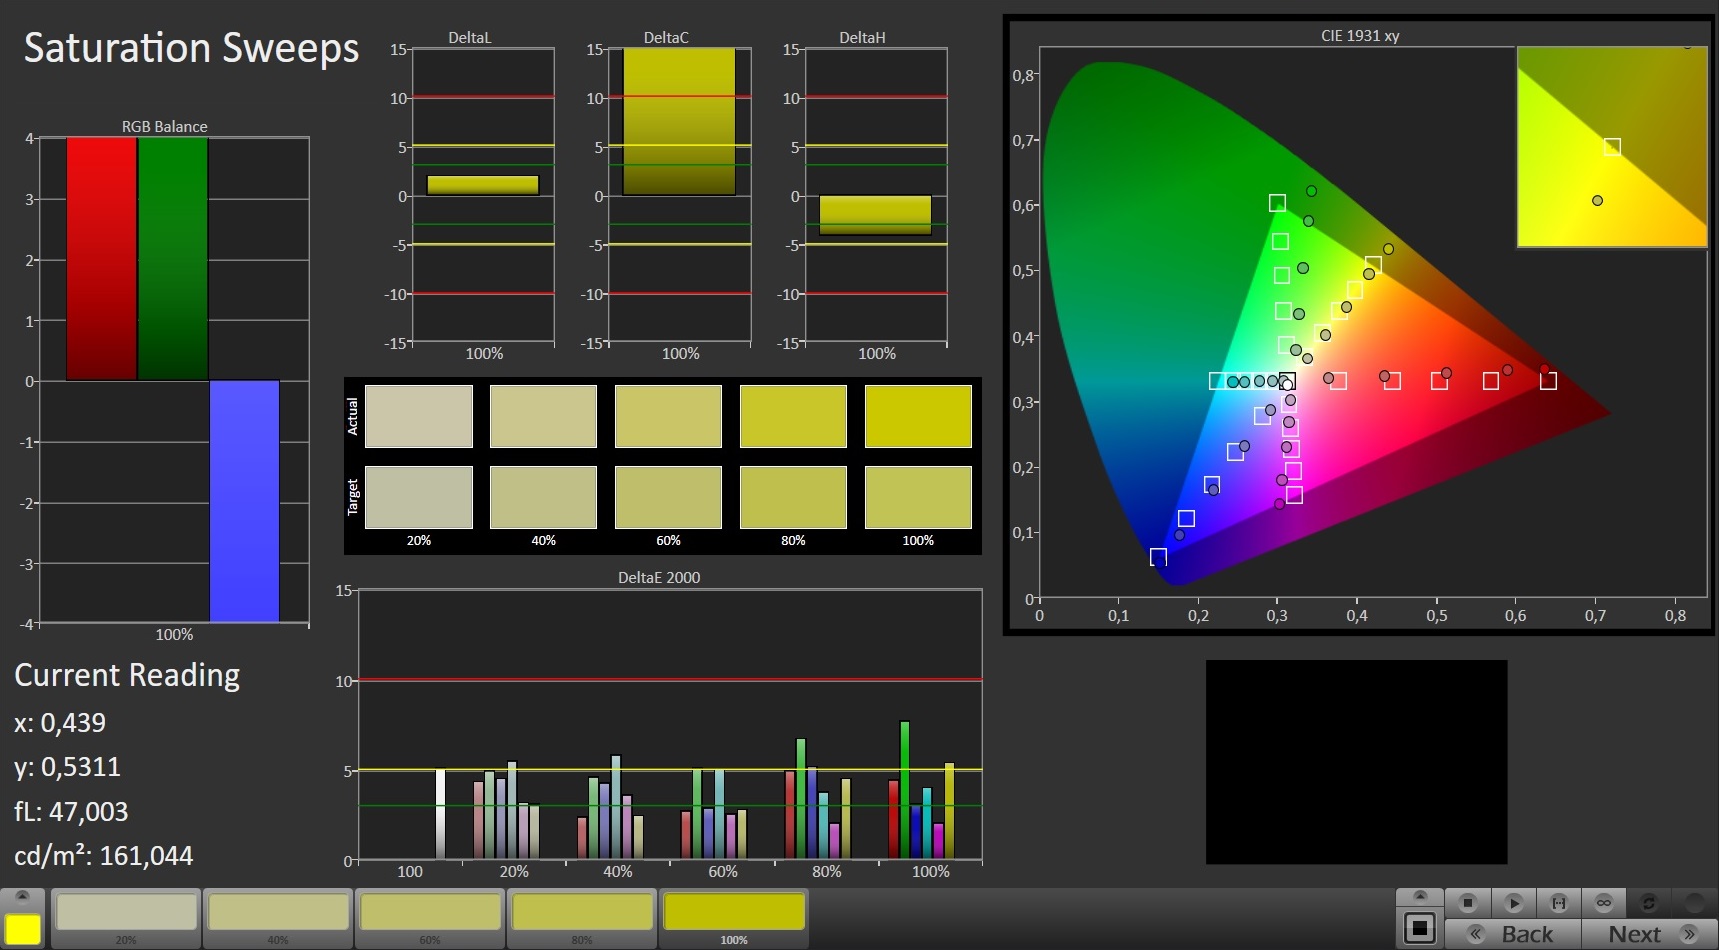
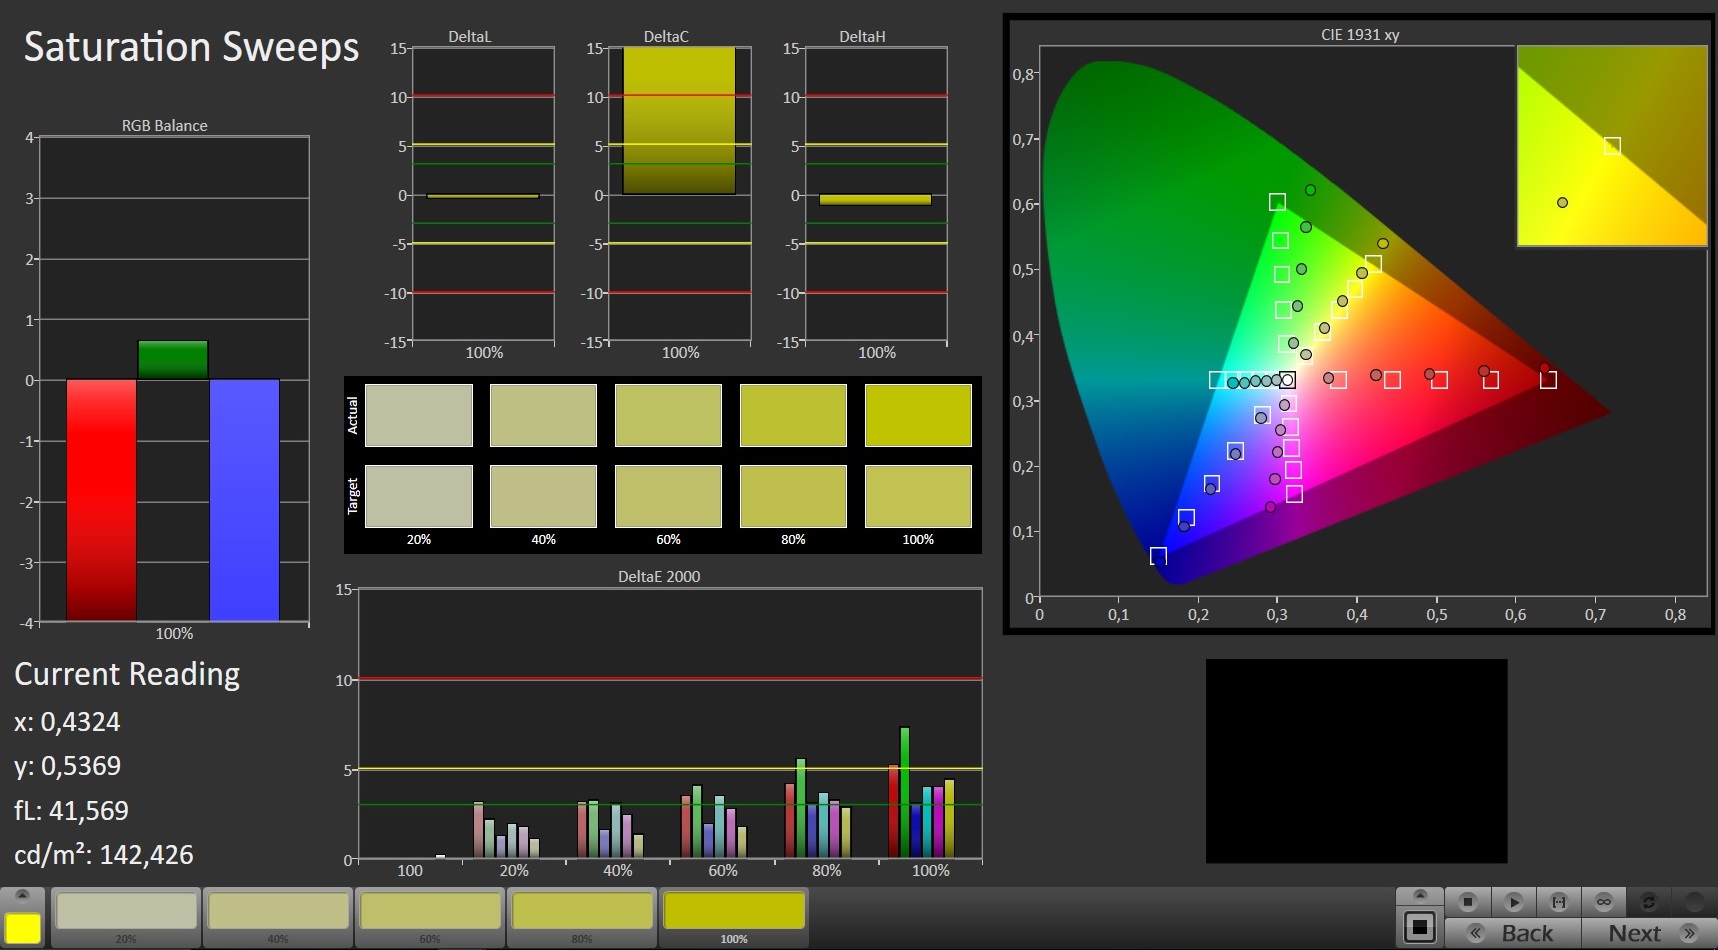
The 1920x1080 pixel, 15.6-inch screen of the former v4, v5 and v6 is called LG Philips LP156WF4. The v7 comes with LG Philips LP156WF6. Both screen models are matte, based on IPS, and they are illuminated with LEDs. We performed our measurements using the "Native Color" Smart Color mode that can be selected in Gigabyte's proprietary Smart Manager in the former models. Gigabyte does not offer alternative screens.
Both panels achieve very similar rates in many sub-categories, such as brightness, illumination, and color reproduction. However, a very evident improvement can be ascertained in the LP156WF6: The black level is much lower and the brightness consequently higher, and the too long response times of the v6 are now on the normal market level in the new v7. We could not criticize the image sharpness.
| |||||||||||||||||||||||||
Brightness Distribution: 87 %
Center on Battery: 287 cd/m²
Contrast: 990:1 (Black: 0.29 cd/m²)
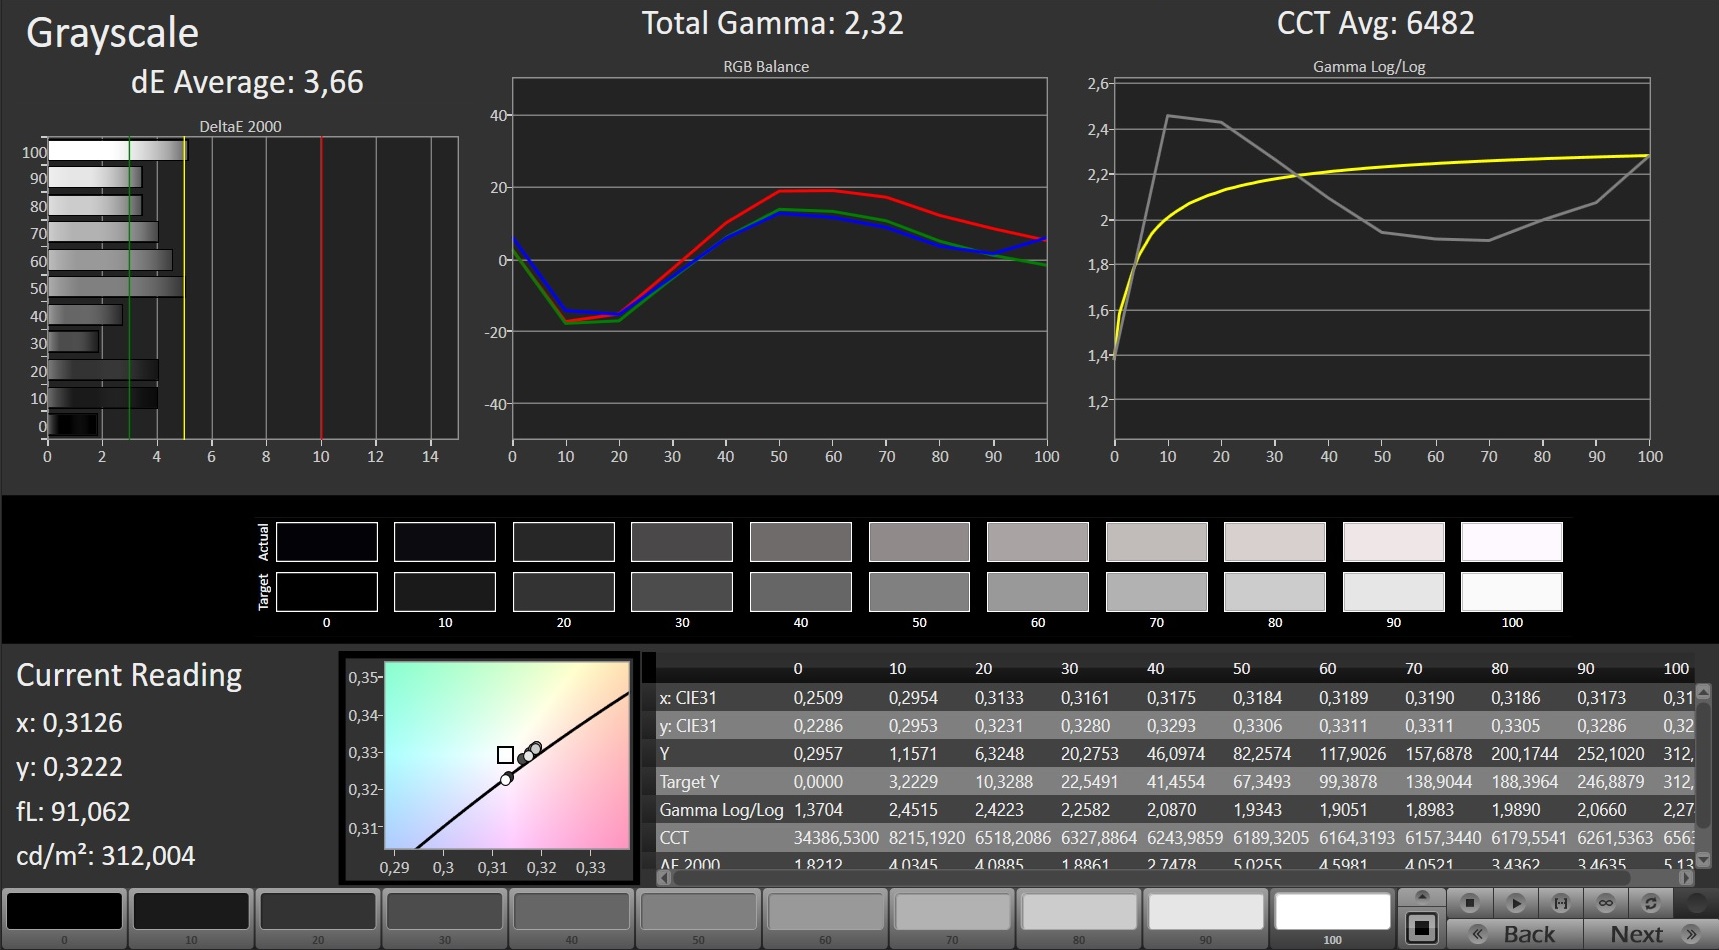
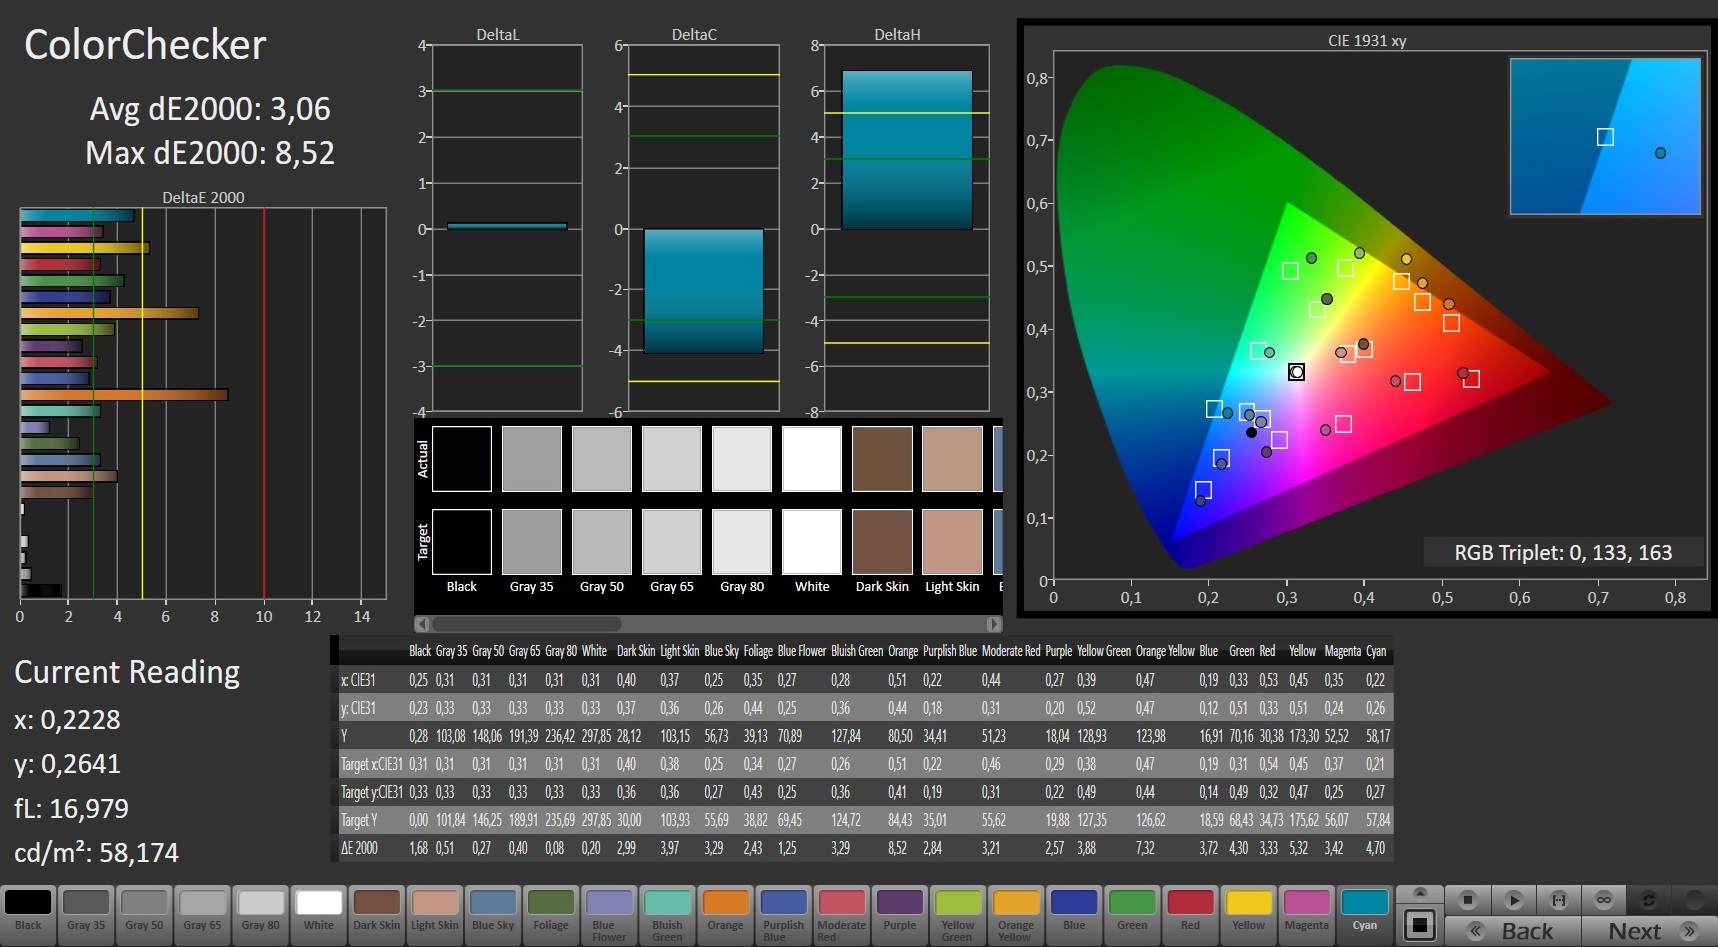
ΔE ColorChecker Calman: 4.92 | ∀{0.5-29.43 Ø4.76}
ΔE Greyscale Calman: 3.66 | ∀{0.09-98 Ø5}
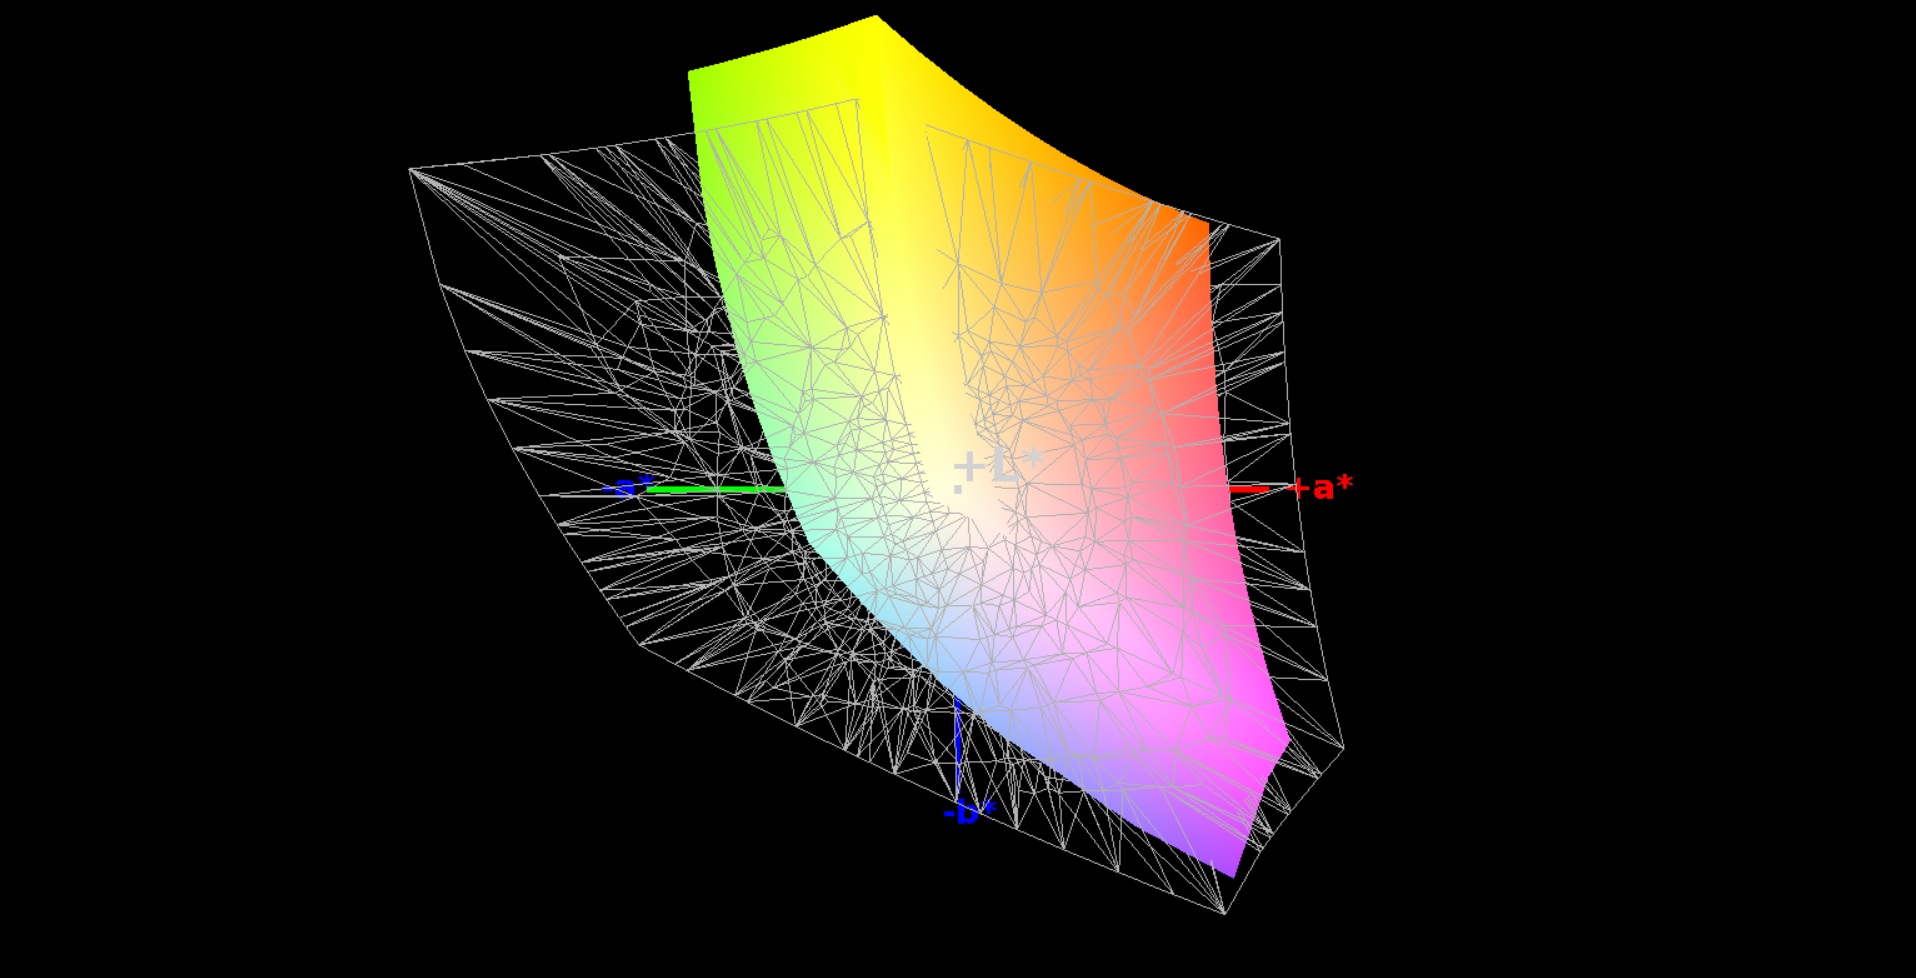
82% sRGB (Argyll 1.6.3 3D)
54% AdobeRGB 1998 (Argyll 1.6.3 3D)
59.9% AdobeRGB 1998 (Argyll 3D)
82% sRGB (Argyll 3D)
63.5% Display P3 (Argyll 3D)
Gamma: 2.32
CCT: 6482 K
| Gigabyte P55W v7 LG Philips LP156WF6 (LGD046F), 1920x1080, 15.6" | Asus Strix GL502VM-FY039T LG Philips LP156WF6-SPB6 (LGD046F), 1920x1080, 15.6" | MSI GE62VR 6RF-001US 1920x1080, 15.6" | Schenker XMG P507 LG Philips LP156WF6 (LGD046F), 1920x1080, 15.6" | Gigabyte P55W v6 LG Philips LP156WF4 (LGD040E), 1920x1080, 15.6" | |
|---|---|---|---|---|---|
| Display | 2% | 3% | 2% | -1% | |
| Display P3 Coverage (%) | 63.5 | 64.5 2% | 65.6 3% | 64.5 2% | 63.2 0% |
| sRGB Coverage (%) | 82 | 83.4 2% | 84.3 3% | 83.4 2% | 80.6 -2% |
| AdobeRGB 1998 Coverage (%) | 59.9 | 60.9 2% | 61.7 3% | 61 2% | 59 -2% |
| Response Times | -4% | -3% | 6% | -38% | |
| Response Time Grey 50% / Grey 80% * (ms) | 37 ? | 40 ? -8% | 36.8 ? 1% | 36 ? 3% | 56 ? -51% |
| Response Time Black / White * (ms) | 25 ? | 25 ? -0% | 26.4 ? -6% | 23 ? 8% | 31 ? -24% |
| PWM Frequency (Hz) | |||||
| Screen | 3% | 16% | -1% | -6% | |
| Brightness middle (cd/m²) | 287 | 321 12% | 302 5% | 288 0% | 280 -2% |
| Brightness (cd/m²) | 289 | 296 2% | 303 5% | 292 1% | 294 2% |
| Brightness Distribution (%) | 87 | 88 1% | 87 0% | 87 0% | 82 -6% |
| Black Level * (cd/m²) | 0.29 | 0.33 -14% | 0.169 42% | 0.3 -3% | 0.46 -59% |
| Contrast (:1) | 990 | 973 -2% | 1787 81% | 960 -3% | 609 -38% |
| Colorchecker dE 2000 * | 4.92 | 4.42 10% | 4.61 6% | 5.1 -4% | 4.48 9% |
| Colorchecker dE 2000 max. * | 11 | 9.78 11% | 9.98 9% | 9.44 14% | 10.16 8% |
| Greyscale dE 2000 * | 3.66 | 3.34 9% | 3.32 9% | 4.43 -21% | 2.69 27% |
| Gamma | 2.32 95% | 2.4 92% | 2.24 98% | 2.46 89% | 2.37 93% |
| CCT | 6482 100% | 6213 105% | 6358 102% | 6687 97% | 6455 101% |
| Color Space (Percent of AdobeRGB 1998) (%) | 54 | 55 2% | 55.4 3% | 55 2% | 53 -2% |
| Color Space (Percent of sRGB) (%) | 82 | 83 1% | 84.4 3% | 83 1% | 80 -2% |
| Total Average (Program / Settings) | 0% /
2% | 5% /
11% | 2% /
0% | -15% /
-9% |
* ... smaller is better
A black image does not look particularly black at least not in a dark room, but it looks largely homogeneous. Although screen bleeding is not an issue, the backlight seems to shine through marginally at the lower edge. This is not at all noticed in practice, though.
Overall, all rates measured in the newcomer are on a good to very good if not excellent level. Gigabyte's P55W v7 is not suitable for dedicated image editing due to the not quite ideal color shifts in delivery state (ideal: DeltaE < 3, color profile linked in the box above), and primarily due to the just 54% coverage of the professional AdobeRGB color space (sRGB: 82%). Users susceptible to screen flickering will be pleased to hear that Gigabyte again does not use PWM.


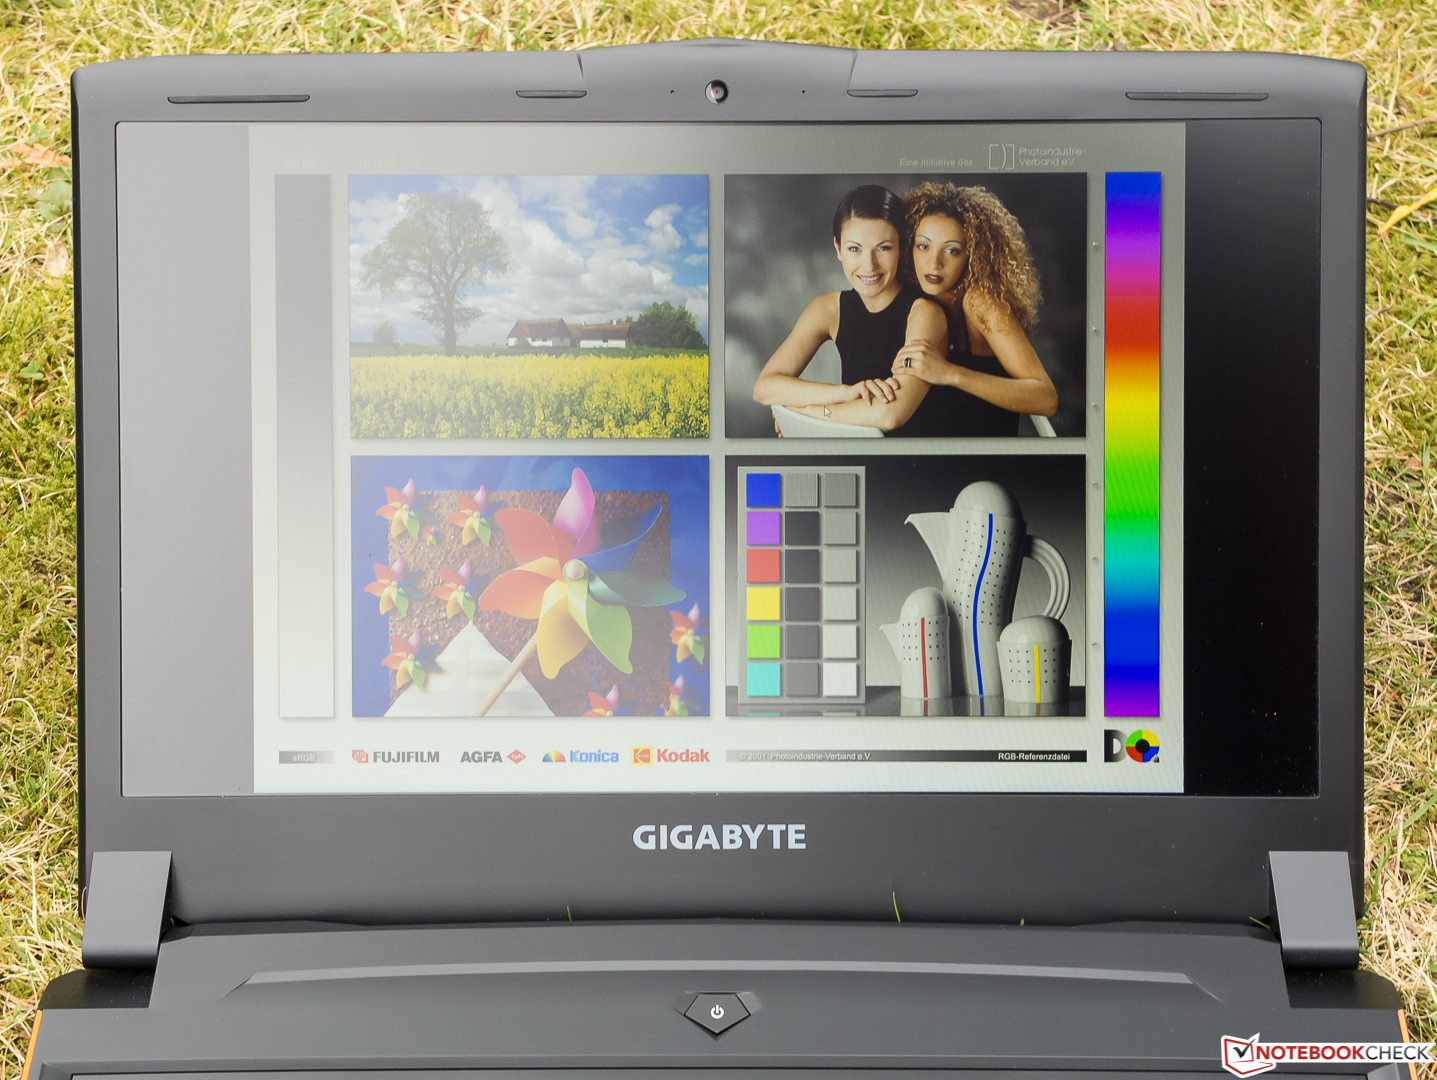

Gigabyte's P55W v7 does a good job outdoors at least on cloudy days. We aligned the screen to the sky in the left screenshot; the shadow on the right is the photographer. Although the legibility of content suffers, it can still be recognized. The right screenshot illustrates the so-to-speak best case scenario with the doorway in the back. The bright and matte screen should make it possible to find a shadowy place that does not affect ergonomics too strongly even on sunny days.
Display Response Times
| ↔ Response Time Black to White | ||
|---|---|---|
| 25 ms ... rise ↗ and fall ↘ combined | ↗ 5 ms rise | 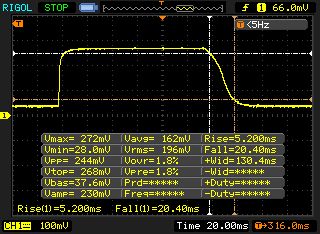 |
| ↘ 20 ms fall | ||
| The screen shows relatively slow response rates in our tests and may be too slow for gamers. In comparison, all tested devices range from 0.1 (minimum) to 240 (maximum) ms. » 58 % of all devices are better. This means that the measured response time is worse than the average of all tested devices (20.1 ms). | ||
| ↔ Response Time 50% Grey to 80% Grey | ||
| 37 ms ... rise ↗ and fall ↘ combined | ↗ 15 ms rise | 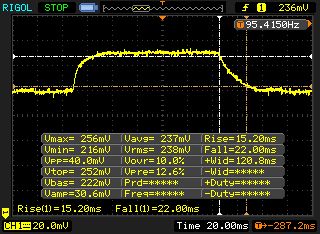 |
| ↘ 22 ms fall | ||
| The screen shows slow response rates in our tests and will be unsatisfactory for gamers. In comparison, all tested devices range from 0.165 (minimum) to 636 (maximum) ms. » 52 % of all devices are better. This means that the measured response time is worse than the average of all tested devices (31.5 ms). | ||
Screen Flickering / PWM (Pulse-Width Modulation)
| Screen flickering / PWM not detected | 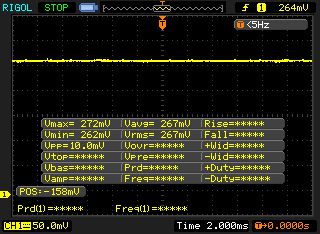 | ||
In comparison: 53 % of all tested devices do not use PWM to dim the display. If PWM was detected, an average of 8023 (minimum: 5 - maximum: 343500) Hz was measured. | |||
IPS panels are very superior to their lower-priced (and decreasing in demand) TN counterparts in terms of viewing-angle stability. However, there are also differences here. The model in our review sample is in the midfield of current IPS panels. Minor color deviations are at most seen when two levels of view are shifted (corner screenshots), but not when looking from the sides or from below or above. Slight brightness and contrast losses are observed starting at angles of approximately 45 °.

Performance
Modern gaming laptops with a high-performance quad-core CPU, plenty of storage, a fast Pascal graphics card, and SSD like in the review sample cope with all commercial software easily. According to the manufacturer's website, it is possible to select Windows 10, only 8 GB of RAM and/or a Blu-ray drive. 8 GB does not make much if any sense for gamers, though.


Processor
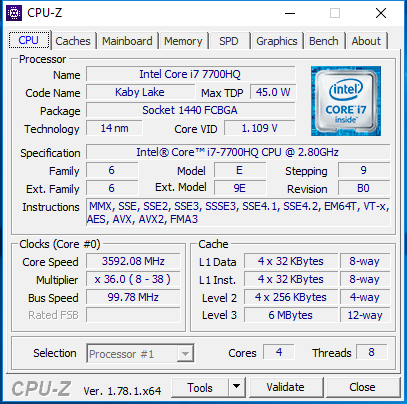
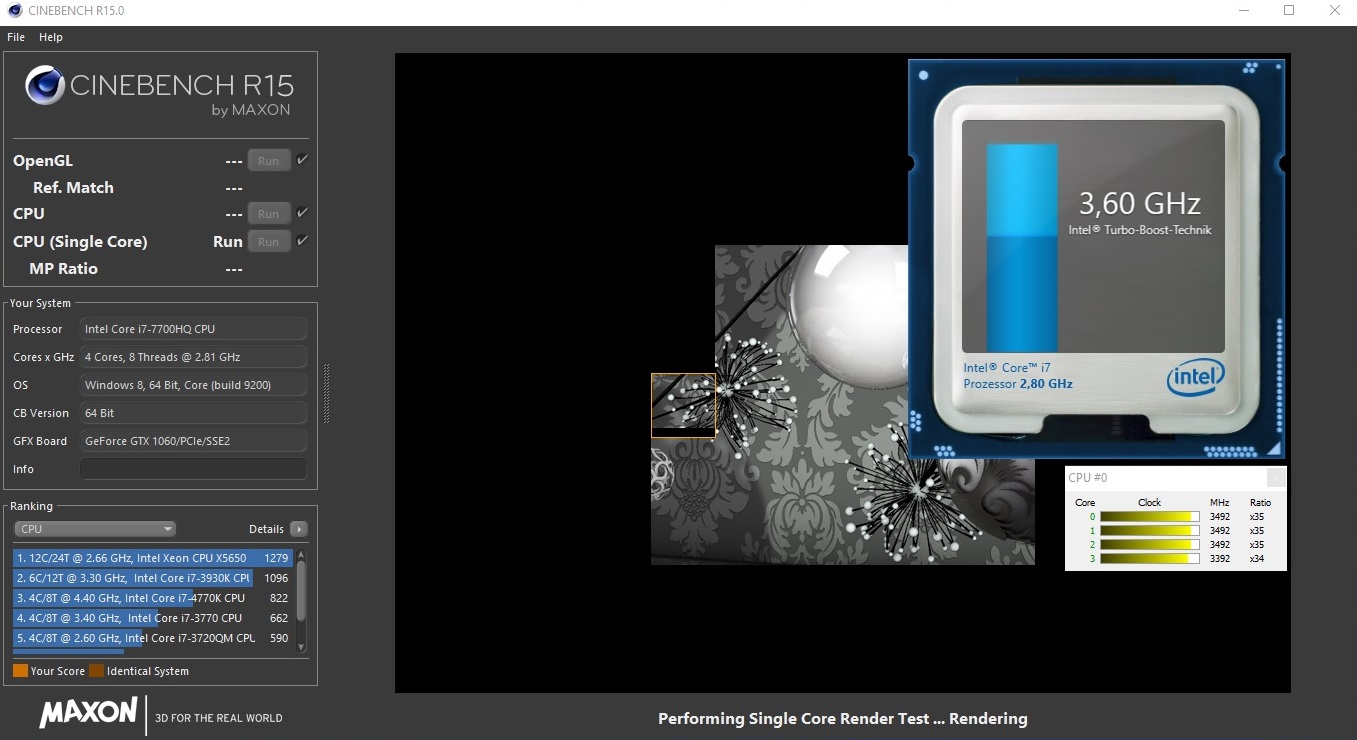
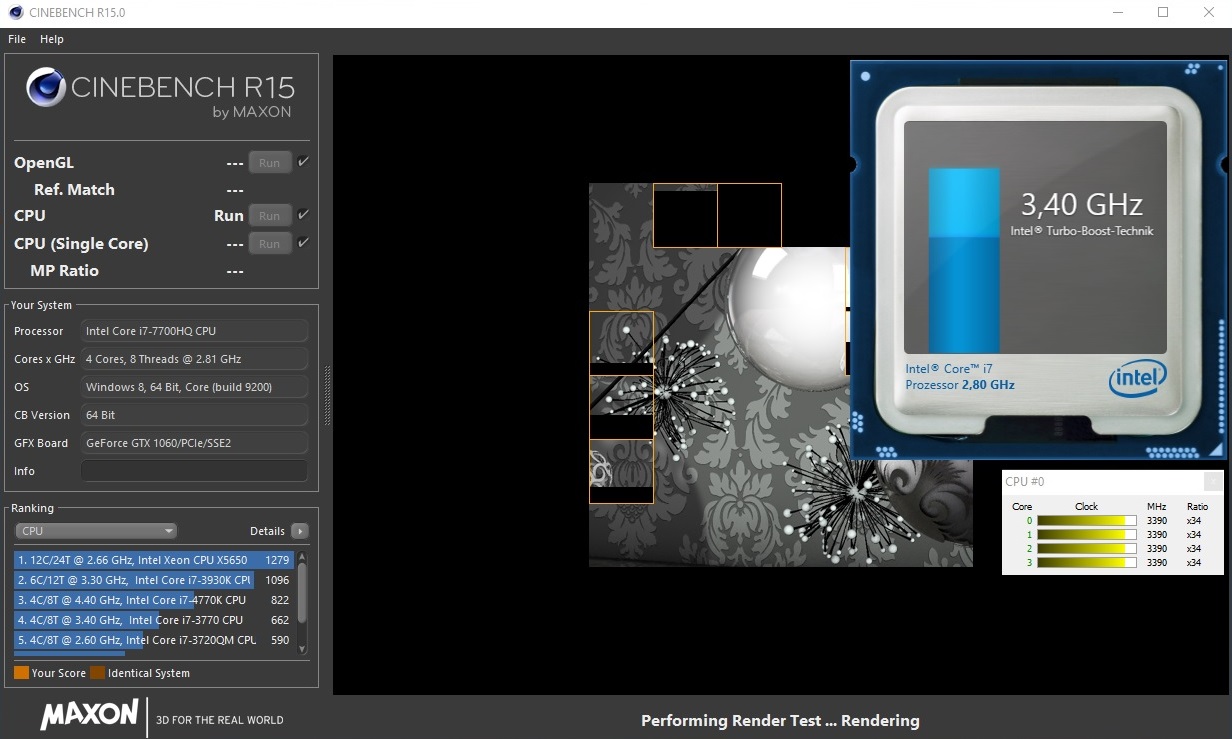
Intel's Core i7-7700HQ (4x 2.8-3.8 GHz, Hyper-Threading, TDP: 45 W) is the Kaby Lake successor of the i7-6700HQ Skylake chip (4x 2.6-3.5 GHz, Hyper-Threading, TDP: 45 W) that is very popular in the gaming sector. As can be seen, Intel has decided to increase the clock speeds by 200 (base) and 300 MHz (boost) while largely keeping the former architecture, which actually results in a higher performance that is not as insignificant as often was the case before.
The lightning-fast processor whose TDP can be reduced from 45 watts to 35 watts, which then involves performance losses, is sooner made for bulkier laptops such as in this test. We do not know any games that push the Core i7-7700HQ or even the one in the predecessor to its limits. More information about the CPU can be found by following the link at the beginning of this chapter and in our Kaby Lake article.
Compared with other laptops based on the same CPU, the Cinebench scores are within the expected range and 5 to 13% higher than all rivals furnished with an i7-6700HQ in this test. 3.4 GHz could be maintained stably in our Cinebench loop in both AC and battery modes.
System Performance
It is no surprise that our P55W v7 can place itself at the top of the test field in the PCMark 8 Work benchmark although it only uses one memory channel. The standoff in the Home benchmark with MSI and the former P55W v6 can be explained with variance in measurements, but then why can Asus take an 18% lead here? Since the performance components do not give reason for this difference, it must be due to the faster SSD in the GL502M that is sometimes considerably superior to that in the review sample especially in write performance. Subjectively, handling is perfectly smooth and loading times are extremely short.
| PCMark 8 | |
| Home Score Accelerated v2 | |
| Asus Strix GL502VM-FY039T | |
| MSI GE62VR 6RF-001US | |
| Gigabyte P55W v6 | |
| Gigabyte P55W v7 | |
| Work Score Accelerated v2 | |
| Gigabyte P55W v7 | |
| Asus Strix GL502VM-FY039T | |
| MSI GE62VR 6RF-001US | |
| Gigabyte P55W v6 | |
| PCMark 8 Home Score Accelerated v2 | 4013 points | |
| PCMark 8 Work Score Accelerated v2 | 5317 points | |
Help | ||
Storage Devices
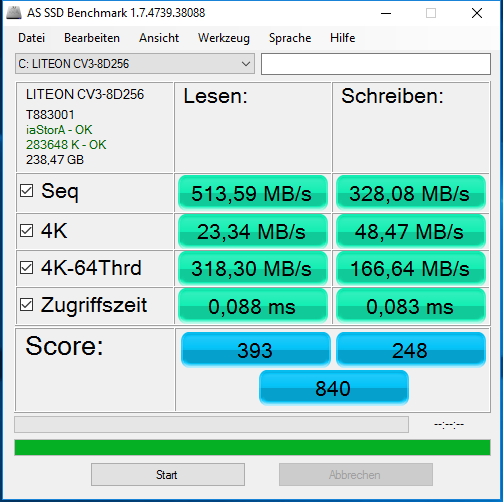
The M.2 slot is fitted with a 256 GB Liteon SSD connected via SATA III. Faster and more expensive NVMe SSDs can also be inserted. Gigabyte additionally installs a conventional 1 TB, 7200 RPM hard drive.
The SSD's performance did not really convince us. It is better to look at the sequential read performance, that can be important for launching large games, and it does not drop significantly below the interface limit of a good 500 MB/s. The entire write performance that is also considerably less relevant for practice is disappointing. The review sample always ends up in one of the last two places compared with its rivals. The 4K read performance (4K read), especially important for opening programs and booting the OS, of approximately 23 and 25 MB/s is only just acceptable.


| Gigabyte P55W v7 Liteonit CV3-8D256 | Asus Strix GL502VM-FY039T Micron SSD 1100 (MTFDDAV256TBN) | MSI GE62VR 6RF-001US Samsung SM951 MZVPV512HDGL m.2 PCI-e | Schenker XMG P507 Samsung SM951 MZVPV256HDGL m.2 PCI-e | Gigabyte P55W v6 Transcend MTS800 128GB M.2 (TS128GMTS800) | |
|---|---|---|---|---|---|
| CrystalDiskMark 3.0 | 28% | 249% | 227% | -6% | |
| Read Seq (MB/s) | 466.2 | 462.5 -1% | 1696 264% | 1857 298% | 511 10% |
| Write Seq (MB/s) | 261.9 | 462.7 77% | 1584 505% | 1240 373% | 161.1 -38% |
| Read 512 (MB/s) | 252.5 | 335 33% | 1044 313% | 971 285% | 338 34% |
| Write 512 (MB/s) | 254.8 | 407.1 60% | 1562 513% | 1239 386% | 160.8 -37% |
| Read 4k (MB/s) | 25.4 | 25.61 1% | 50.8 100% | 54.1 113% | 26.2 3% |
| Write 4k (MB/s) | 55 | 86.3 57% | 139.2 153% | 167.4 204% | 76.7 39% |
| Read 4k QD32 (MB/s) | 358.5 | 246.7 -31% | 591 65% | 695 94% | 264.7 -26% |
| Write 4k QD32 (MB/s) | 240.1 | 301.5 26% | 422.8 76% | 386.8 61% | 160.3 -33% |

Graphics Card
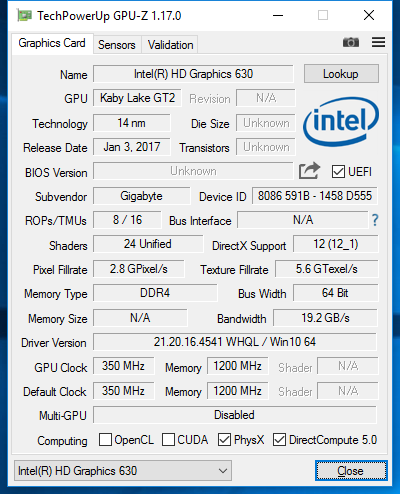
Nvidia's DirectX 12 GeForce GTX 1060 Pascal scion introduced in August 2016 takes the third place behind the GTX 1080 and GTX 1070 among mobile graphics cards. The card has a 6 GB GDDR5 memory that clocks at 8000 MHz effectively and is connected via a 192-bit interface. The GTX 1060 clocks at 1506 to 1708 MHz (Turbo) by default. According to GPU-Z, Gigabyte has opted for a clock range of 1405 to 1671 MHz.
Besides hardware-based decoding and encoding of H.265 videos, DisplayPort 1.4, and HDMI 2.0 are supported, making it possible to display 4K materials on external playback devices at the full 60 Hz. More information concerning the high-end card's features can be found in our special article about the Pascal architecture.
Gigabyte's P55W v7 can keep up well in the 3DMark 11 and 2013 (Fire Strike) benchmarks, and it only lags behind the present GTX 1060 leader in our database, MSI's GE62VR 6RF-001US, by 4 to 5%.
| 3DMark - 1920x1080 Fire Strike Graphics | |
| MSI GE62VR 6RF-001US | |
| Asus Strix GL502VM-FY039T | |
| Gigabyte P55W v7 | |
| Gigabyte P55W v6 | |
| Schenker XMG P507 | |
| 3DMark 11 - 1280x720 Performance GPU | |
| MSI GE62VR 6RF-001US | |
| Asus Strix GL502VM-FY039T | |
| Gigabyte P55W v6 | |
| Gigabyte P55W v7 | |
| Schenker XMG P507 | |
| 3DMark 11 Performance | 11778 points | |
| 3DMark Cloud Gate Standard Score | 21839 points | |
| 3DMark Fire Strike Score | 9669 points | |
Help | ||
Gaming Performance
The GTX 1060's Full HD power is enough to smoothly render almost all up-to-date games regardless of their hardware requirements using maximum settings and enabled graphics enhancements and anti-aliasing. Exceptions are, for example, Deus Ex Mankind Divided and XCOM 2. The player sometimes has to be happy with high presets in WQHD (2540x1440). Users who want to regularly play in the 4K resolution will need a GTX 1070 at minimum.
| low | med. | high | ultra | |
|---|---|---|---|---|
| The Witcher 3 (2015) | 70.4 | 38.4 | ||
| Rise of the Tomb Raider (2016) | 72.6 | 61.8 | ||
| Battlefield 1 (2016) | 77.6 | 73.6 | ||
| Dishonored 2 (2016) | 80.2 | 60.2 | 46.5 | |
| Resident Evil 7 (2017) | 98.5 | 83 |
Emissions
System Noise
We set the fan to "Normal" in the Smart Manager setting for all noise measurements. The CPU fan is always on even in idle mode here. This can be prevented by setting the mode to "Quiet". Then, the running P55W v7 is only just audible when concentrating on it in a quiet private office at a distance of one meter. Light load with sporadic peaks does not change this.
After initiating the stress test (Prime95 + Furmark), the P55W v7's fan speeds up gradually so that an audible noise is heard even a few meters away from the laptop. Unfortunately, it is accompanied by high-pitched side noises at faster speeds. It is difficult to say whether this is fan whistling or coil whining. However, the writer did not find this very present noise too annoying. As is true for most high-end gaming laptops, it is recommendable to use headphones.

Noise level
| Idle |
| 33 / 34 / 35 dB(A) |
| HDD |
| 34 dB(A) |
| DVD |
| 37 / dB(A) |
| Load |
| 39 / 50 dB(A) |
 | ||
30 dB silent 40 dB(A) audible 50 dB(A) loud |
||
min: | ||
Temperature
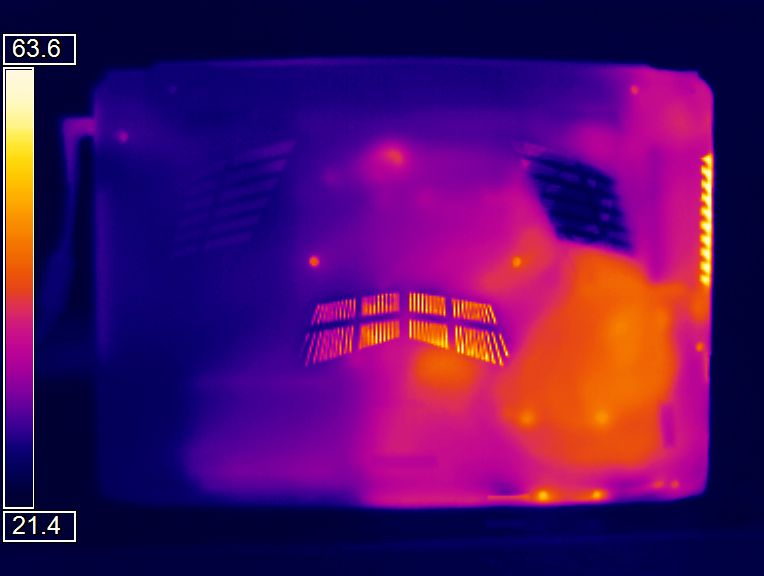
The underside will heat up to an unpleasant 48 °C for some users when the P55W v7 is placed on the lap for gaming. However, the laptop will likely be used on a table in most cases, and thus the temperatures in the wrist rest area are more important. It is unusual even for a gaming laptop that the corresponding areas of our full load visualization below are not completely blue, which points to problematic temperatures of up to 45 °C. Sensitive users will have to look for another laptop. In return, everything is okay in idle mode.
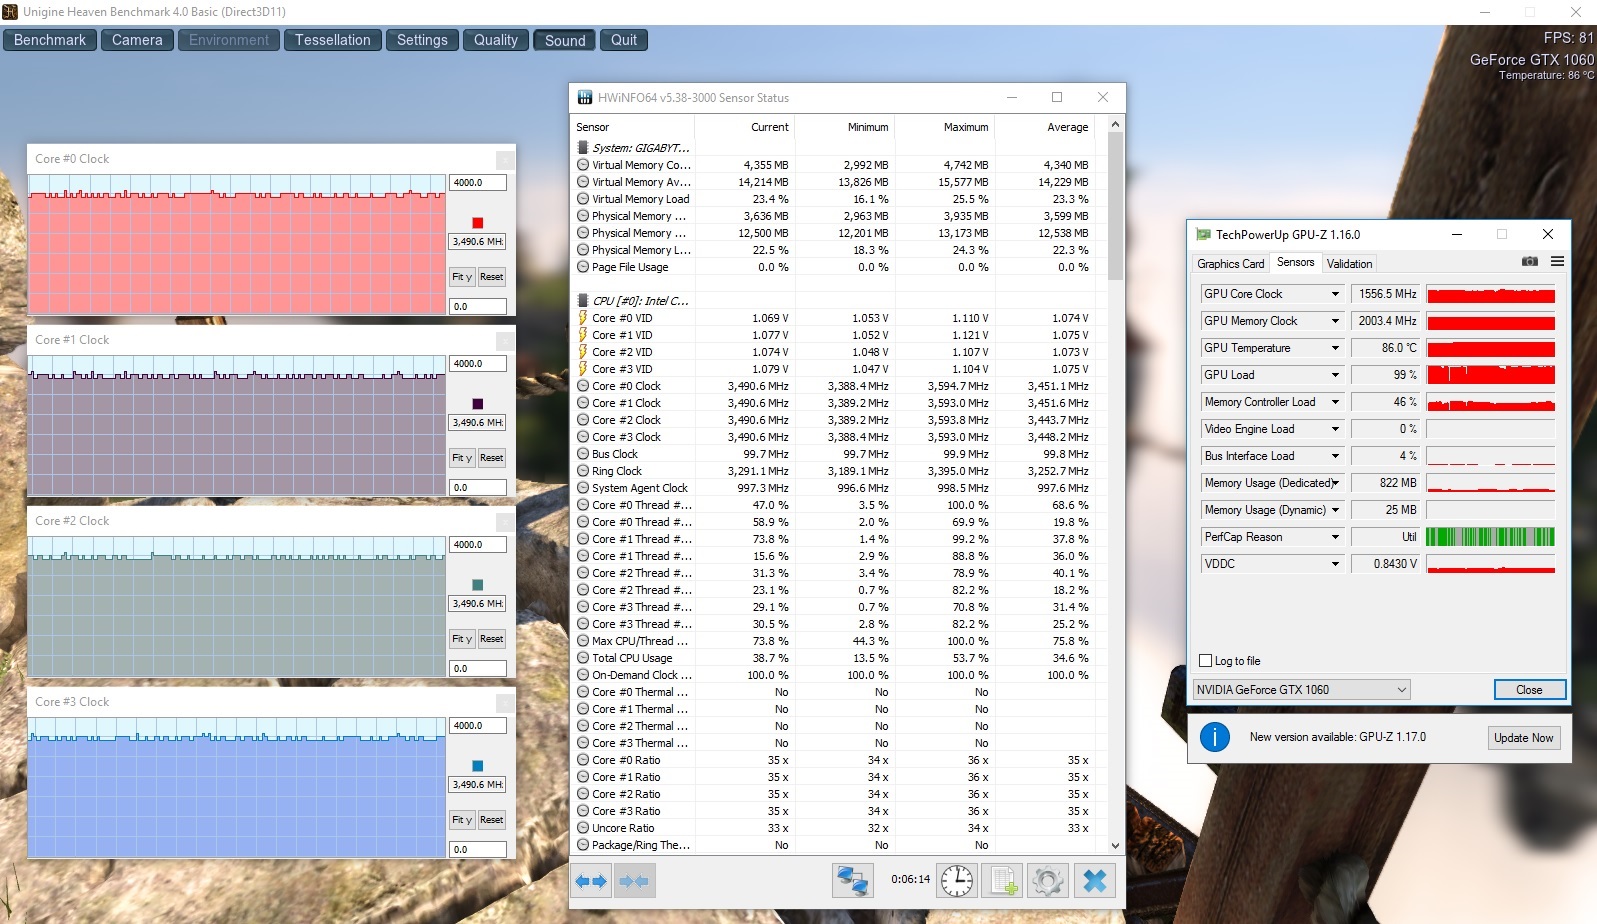
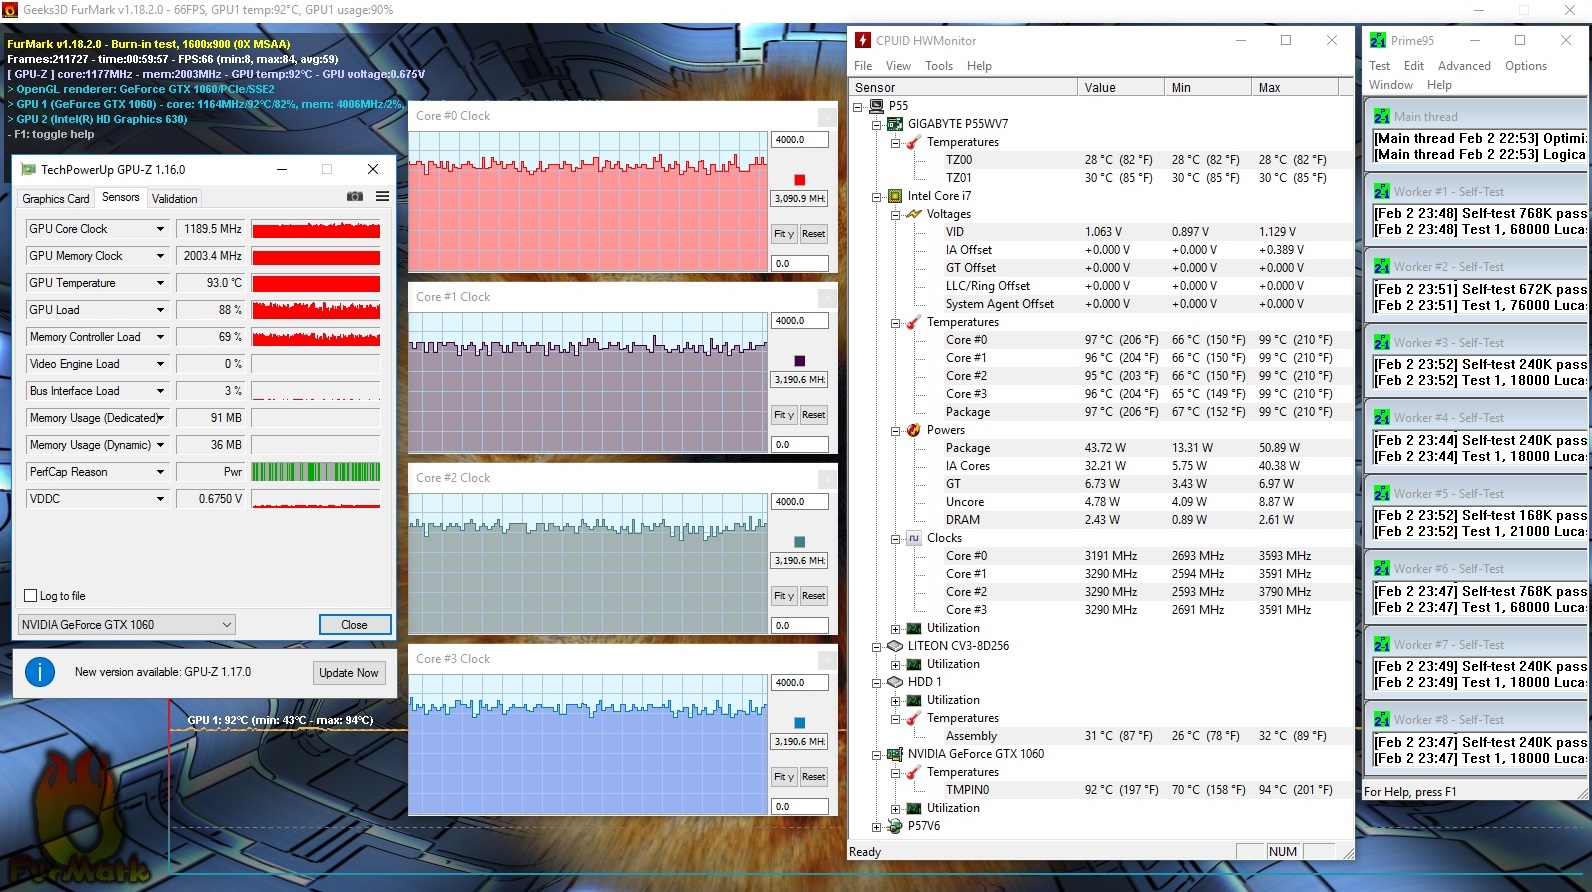
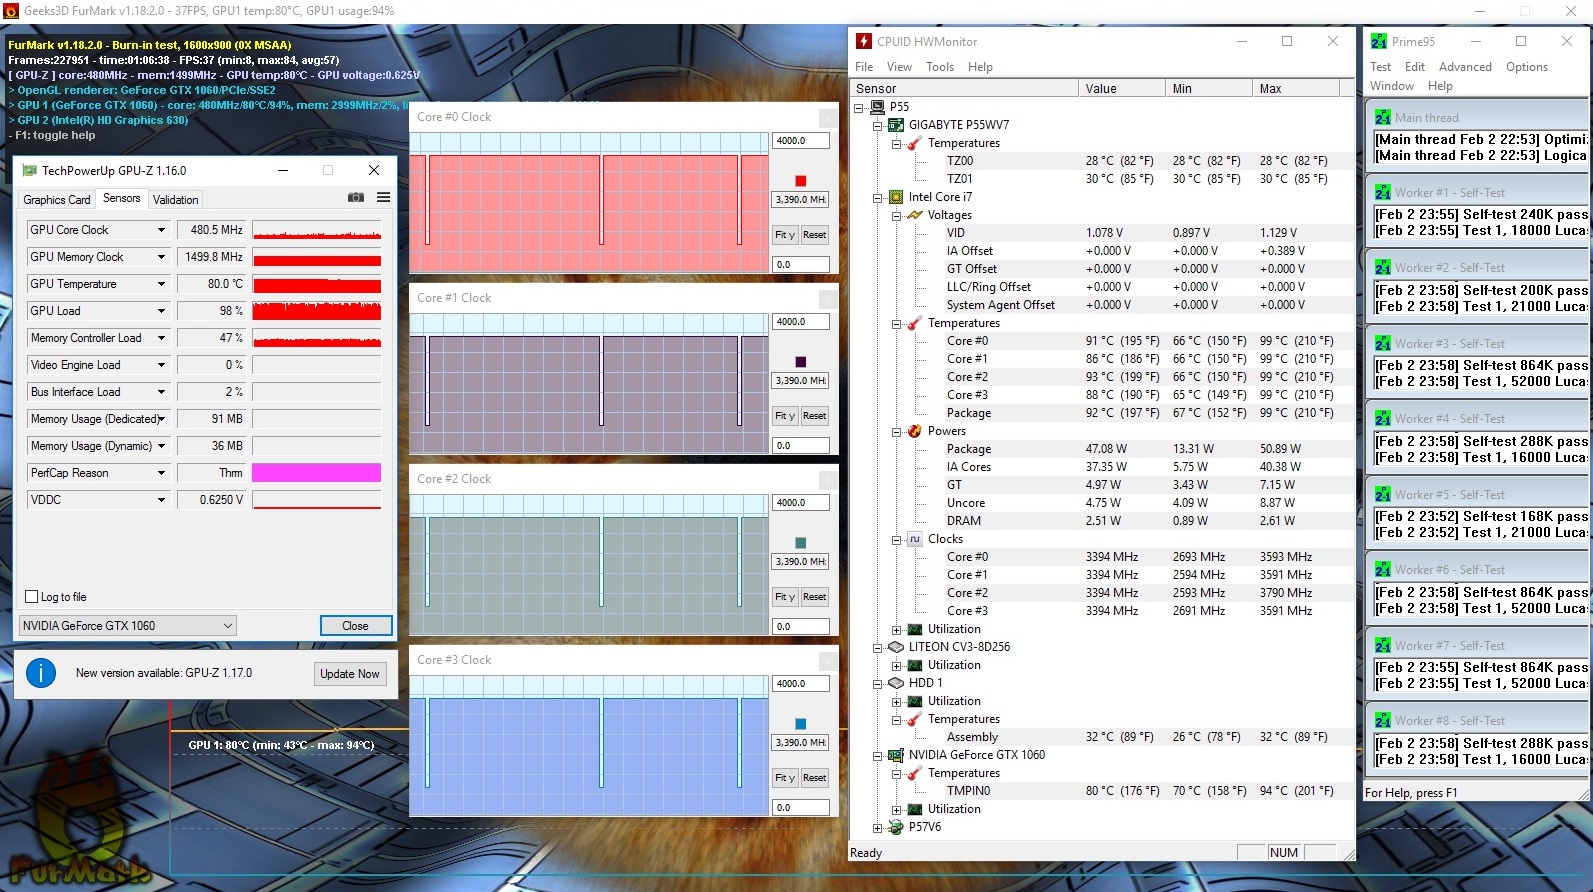
Now we look at the clock speed development in the unrealistic stress test (Prime95 + Furmark). The CPU's speeds varied from 2.6 to 3.8 GHz and the GPU reached approximately 1200 MHz in phase I. In phase II, the GPU's clock speeds dropped to almost 480 MHz (memory: 1500 vs. 2000 MHz), while the processor settled to a consistent 3.4 GHz. Thus, CPU and, above all, GPU throttling is an issue in this artificial scenario.
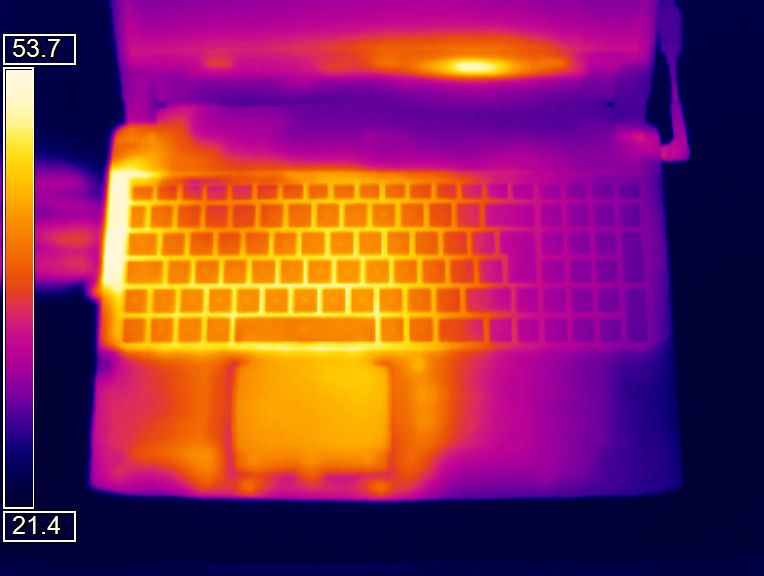
(-) The maximum temperature on the upper side is 49.6 °C / 121 F, compared to the average of 40.4 °C / 105 F, ranging from 21.2 to 68.8 °C for the class Gaming.
(-) The bottom heats up to a maximum of 47.7 °C / 118 F, compared to the average of 43.3 °C / 110 F
(+) In idle usage, the average temperature for the upper side is 22.8 °C / 73 F, compared to the device average of 33.9 °C / 93 F.
(-) The palmrests and touchpad can get very hot to the touch with a maximum of 45.1 °C / 113.2 F.
(-) The average temperature of the palmrest area of similar devices was 28.8 °C / 83.8 F (-16.3 °C / -29.4 F).
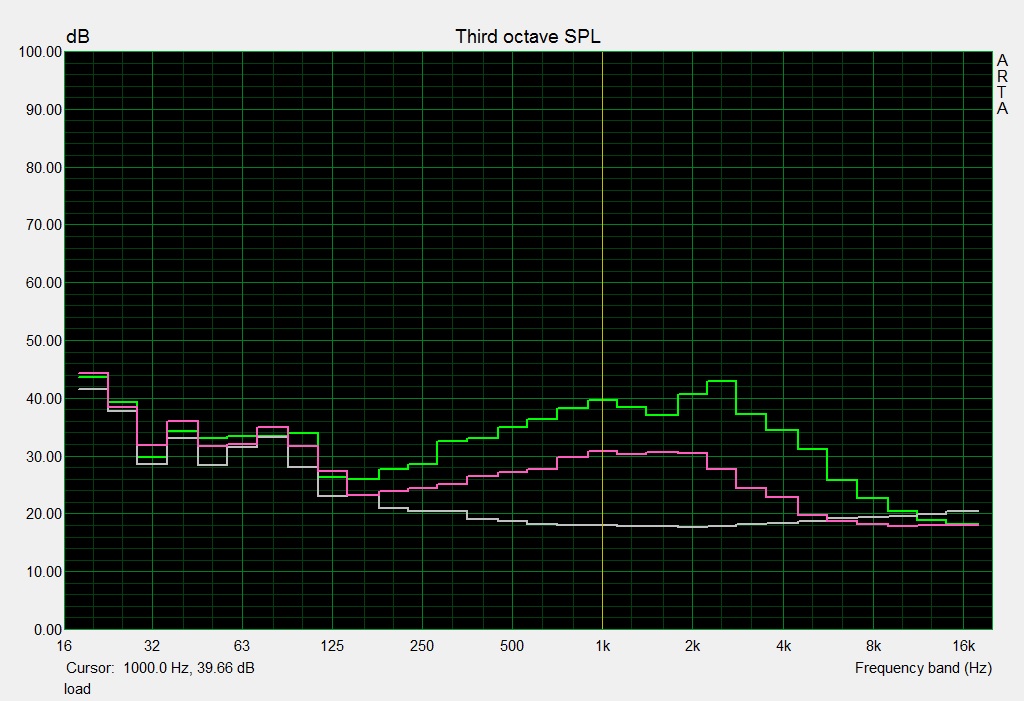
Speakers
Like in the predecessors, Gigabyte again does not install a subwoofer as has almost become standard in higher-priced gaming laptops. This naturally affects the sound. The bass-free, low-dynamic and very mid-heavy sound is hollow and tinny in the Dolby Music preset at maximum volume, which is at most loud enough to fill medium-sized rooms. Although minor distortions are rarely heard, the playback is never piercing and does not suffer from volume fluctuations.
While the sound system still copes quite well with light pop music, it decreases at consistently high volumes in metal music and slightly blends the instruments. Voice is well intelligible and sounds more natural than music. We recommend using headphones for real oomph when playing games.
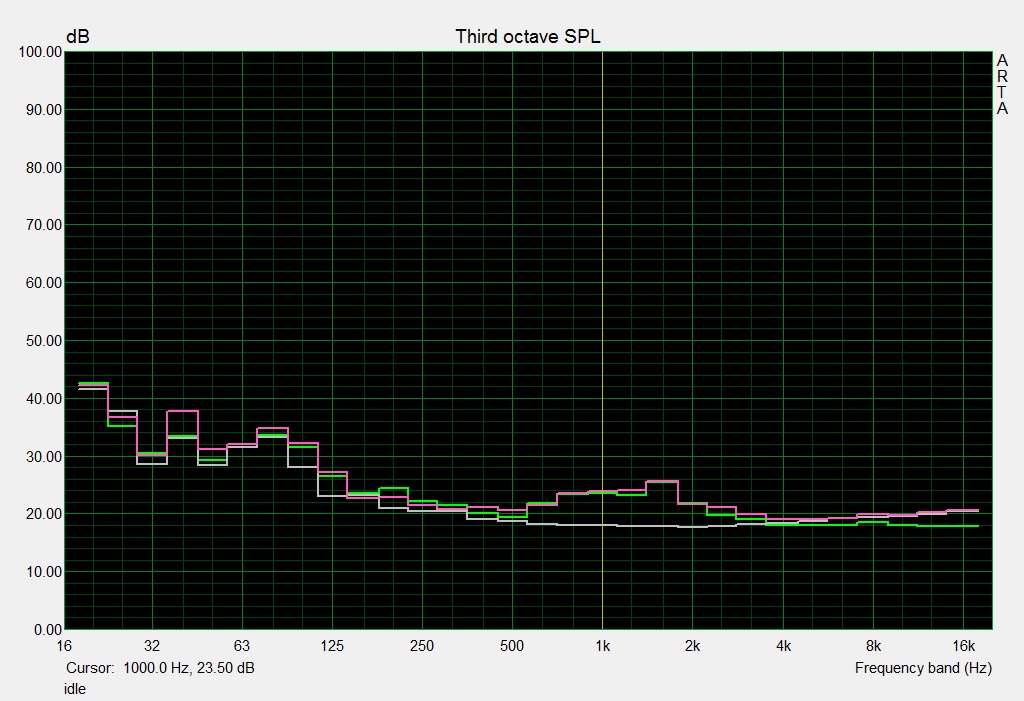
Gigabyte P55W v7 audio analysis
(±) | speaker loudness is average but good (79 dB)
Bass 100 - 315 Hz
(-) | nearly no bass - on average 15.9% lower than median
(±) | linearity of bass is average (11.3% delta to prev. frequency)
Mids 400 - 2000 Hz
(+) | balanced mids - only 4.7% away from median
(±) | linearity of mids is average (8.8% delta to prev. frequency)
Highs 2 - 16 kHz
(+) | balanced highs - only 3.6% away from median
(±) | linearity of highs is average (10.1% delta to prev. frequency)
Overall 100 - 16.000 Hz
(±) | linearity of overall sound is average (18.8% difference to median)
Compared to same class
» 62% of all tested devices in this class were better, 8% similar, 30% worse
» The best had a delta of 6%, average was 18%, worst was 132%
Compared to all devices tested
» 43% of all tested devices were better, 8% similar, 49% worse
» The best had a delta of 4%, average was 24%, worst was 134%
Asus Strix GL502VM-FY039T audio analysis
(±) | speaker loudness is average but good (76 dB)
Bass 100 - 315 Hz
(-) | nearly no bass - on average 19.1% lower than median
(-) | bass is not linear (18.1% delta to prev. frequency)
Mids 400 - 2000 Hz
(+) | balanced mids - only 2.9% away from median
(+) | mids are linear (4% delta to prev. frequency)
Highs 2 - 16 kHz
(±) | higher highs - on average 5.6% higher than median
(±) | linearity of highs is average (8% delta to prev. frequency)
Overall 100 - 16.000 Hz
(±) | linearity of overall sound is average (23% difference to median)
Compared to same class
» 83% of all tested devices in this class were better, 5% similar, 12% worse
» The best had a delta of 6%, average was 18%, worst was 132%
Compared to all devices tested
» 68% of all tested devices were better, 6% similar, 26% worse
» The best had a delta of 4%, average was 24%, worst was 134%
MSI GE62VR 6RF-001US audio analysis
(±) | speaker loudness is average but good (76.9 dB)
Bass 100 - 315 Hz
(±) | reduced bass - on average 13.1% lower than median
(±) | linearity of bass is average (12% delta to prev. frequency)
Mids 400 - 2000 Hz
(+) | balanced mids - only 3% away from median
(±) | linearity of mids is average (12% delta to prev. frequency)
Highs 2 - 16 kHz
(+) | balanced highs - only 4.4% away from median
(±) | linearity of highs is average (10.1% delta to prev. frequency)
Overall 100 - 16.000 Hz
(±) | linearity of overall sound is average (18.6% difference to median)
Compared to same class
» 60% of all tested devices in this class were better, 9% similar, 31% worse
» The best had a delta of 6%, average was 18%, worst was 132%
Compared to all devices tested
» 42% of all tested devices were better, 8% similar, 51% worse
» The best had a delta of 4%, average was 24%, worst was 134%
Schenker XMG P507 audio analysis
(±) | speaker loudness is average but good (75 dB)
Bass 100 - 315 Hz
(-) | nearly no bass - on average 20.7% lower than median
(±) | linearity of bass is average (8.8% delta to prev. frequency)
Mids 400 - 2000 Hz
(+) | balanced mids - only 2.2% away from median
(±) | linearity of mids is average (7.6% delta to prev. frequency)
Highs 2 - 16 kHz
(+) | balanced highs - only 2.3% away from median
(+) | highs are linear (5.3% delta to prev. frequency)
Overall 100 - 16.000 Hz
(±) | linearity of overall sound is average (19% difference to median)
Compared to same class
» 63% of all tested devices in this class were better, 8% similar, 29% worse
» The best had a delta of 6%, average was 18%, worst was 132%
Compared to all devices tested
» 44% of all tested devices were better, 8% similar, 48% worse
» The best had a delta of 4%, average was 24%, worst was 134%
Frequency diagram in comparison (checkboxes above can be turned on/off!)
Energy Management
Power Consumption
Since all laptops in the test have an i7-6700HQ or i7-7700HQ, a GeForce GTX 1060 and an SSD, their power consumption can be compared nicely. First, the very high consumption of the overclocked MSI in all load states except maximum is striking. The review sample is the most economic device in all three idle load states and consumes 43 to 69% (!) less power. The P55W v7 also drains the least power from the outlet during full load. However, Schenker's XMG P507, as the "leader", consumes just 18% more energy.
| Off / Standby | |
| Idle | |
| Load |
|
Key:
min: | |
| Gigabyte P55W v7 i7-7700HQ, GeForce GTX 1060 Mobile | Asus Strix GL502VM-FY039T 6700HQ, GeForce GTX 1060 Mobile | MSI GE62VR 6RF-001US 6700HQ, GeForce GTX 1060 Mobile | Schenker XMG P507 6700HQ, GeForce GTX 1060 Mobile | Gigabyte P55W v6 6700HQ, GeForce GTX 1060 Mobile | |
|---|---|---|---|---|---|
| Power Consumption | -35% | -97% | -21% | -0% | |
| Idle Minimum * (Watt) | 8 | 16 -100% | 25.4 -218% | 11 -38% | 8 -0% |
| Idle Average * (Watt) | 13 | 19 -46% | 30.3 -133% | 16 -23% | 13 -0% |
| Idle Maximum * (Watt) | 18 | 23 -28% | 31.5 -75% | 21 -17% | 17 6% |
| Load Average * (Watt) | 76 | 68 11% | 111.8 -47% | 80 -5% | 71 7% |
| Load Maximum * (Watt) | 143 | 157 -10% | 163.2 -14% | 174 -22% | 165 -15% |
* ... smaller is better
Battery Runtimes
Disregarding MSI's GE62VR due to its rather small 51 Wh battery and unusually high power consumption, a comparison within the test field again seems logical in view of the very similar battery capacities of 60 to 64 Wh. Our P55W v7 lasts particularly long especially in idle mode and in the practical Wi-Fi test at medium brightness (our test criteria) and is only defeated by the XMG P507. The Asus Strix presents a relatively weak runtime.
| Gigabyte P55W v7 i7-7700HQ, GeForce GTX 1060 Mobile, 63 Wh | Asus Strix GL502VM-FY039T 6700HQ, GeForce GTX 1060 Mobile, 64 Wh | MSI GE62VR 6RF-001US 6700HQ, GeForce GTX 1060 Mobile, 51 Wh | Schenker XMG P507 6700HQ, GeForce GTX 1060 Mobile, 60 Wh | Gigabyte P55W v6 6700HQ, GeForce GTX 1060 Mobile, 63 Wh | |
|---|---|---|---|---|---|
| Battery runtime | -34% | -72% | -13% | -7% | |
| Reader / Idle (h) | 13.2 | 5.3 -60% | 2.3 -83% | 6.8 -48% | 10.2 -23% |
| WiFi v1.3 (h) | 5.8 | 3.7 -36% | 1.7 -71% | 4.6 -21% | 5.9 2% |
| Load (h) | 1.6 | 1.5 -6% | 0.6 -63% | 2.1 31% | 1.6 0% |
| H.264 (h) | 3.9 | 5.6 |
Pros
Cons
Verdict
Gigabyte has again made cutbacks in the right places and sends an overall decent gaming laptop into the race with the P55W v7. Omitting features, such as Thunderbolt 3 and G-Sync, makes it possible for buyers to save a few hundred Euros - and this without compromises in performance.
Just in view of the relatively low price, we particularly liked the input devices and, with some restrictions, the IPS panel. This also applies to the solid plastic casing with its easy to remove base plate. The interface positioning, relatively slow screen response times, and the as before not really convincing SSD are not as favorable. The high-pitched side noises during load are the only shortcoming of Gigabyte's P55W v7. However, this phenomenon could be a unique case. Thus, it easily achieves a purchase recommendation but with a sound-check clause.
Gigabyte P55W v7
- 02/28/2017 v6 (old)
Sven Kloevekorn
Price comparison
