 Deutsch
 English
 Español
 Français
 Italiano
 Nederlands
 Polski
 Português
 Русский
 Türkçe
 Svenska
 Chinese
 Magyar
Gigabyte Aero 14 (7700HQ, GTX 1060) Laptop Review

For the original German review, see here.
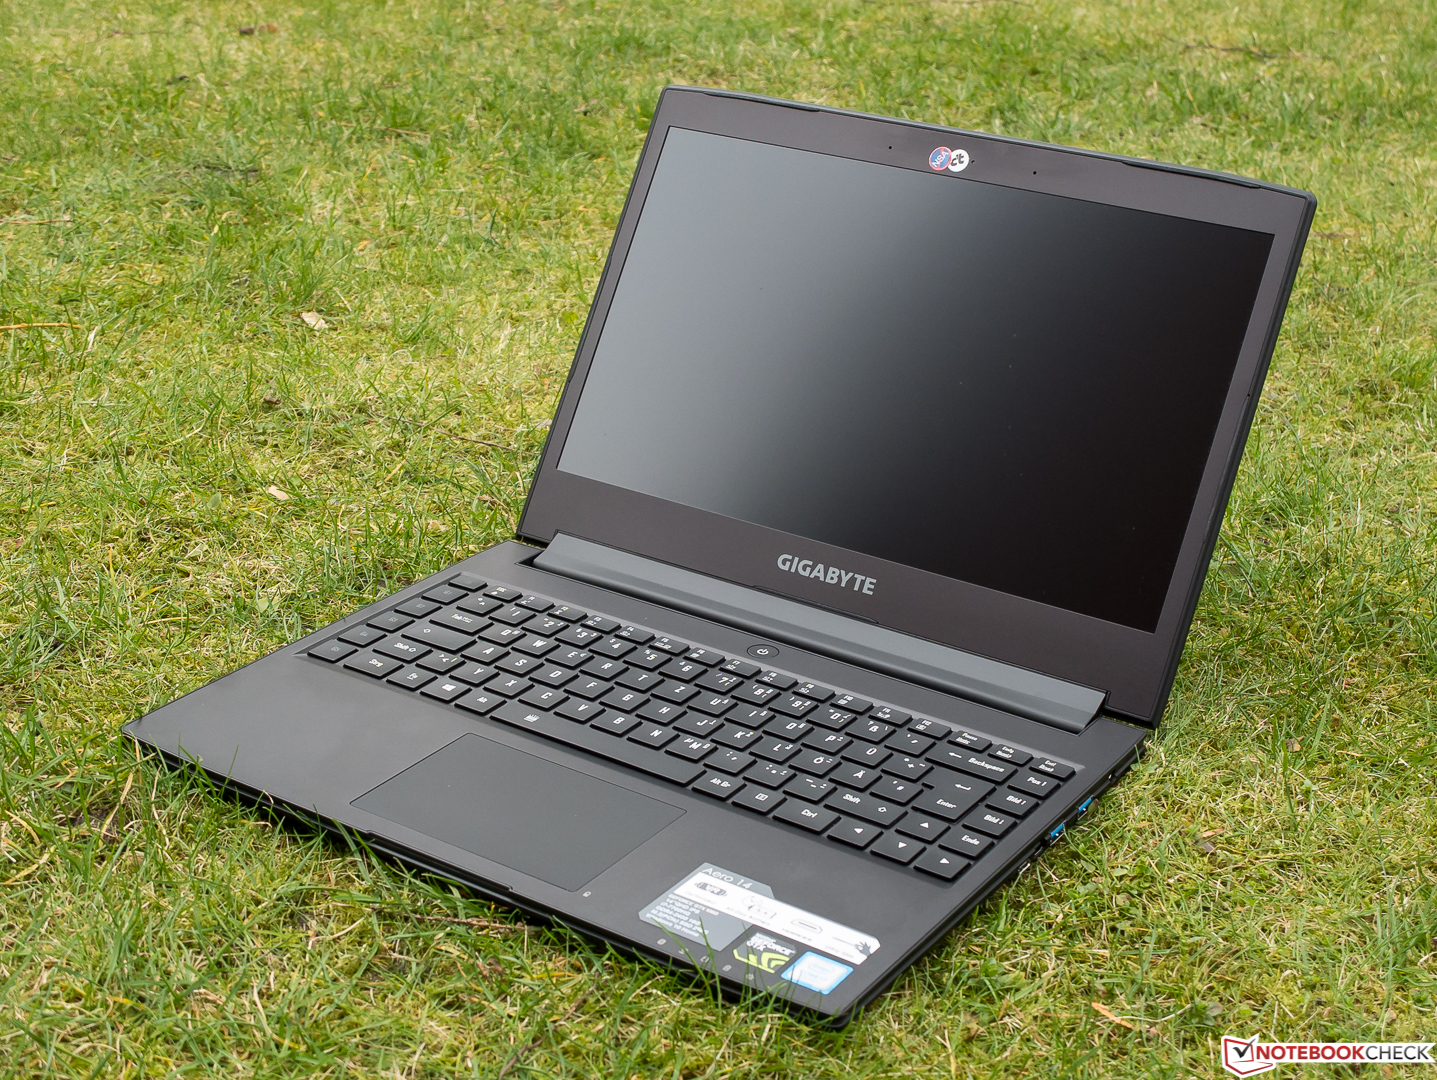
The name says it all. The Aero 14 is Gigabyte's first compact and light highly mobile gaming notebook. This market segment has been left to the likes of Schenker, MSI, and Razer, which to no surprise constitute our test group. Improved manufacturing processes and other optimizations have had a very positive effect on power consumption and heat dissipation of both the CPU and GPU, and they made compact cases such as the one our review unit is equipped with possible.
With its fast Intel Core i7-7700HQ quad-core CPU and the Nvidia GTX 1060 with 6 GB of video RAM Gigabyte isn't taking any chances. In addition, the manufacturer also adds 16 GB of RAM, a WQHD IPS display, a 256 GB SSD, and Windows 10 Home. The 95 Wh battery is surprisingly capable, and Gigabyte is asking for 2000 Euros (~$2118) in return for its roughly 1.9 kg / 4.2 lbs heavy laptop.
Given that we haven't tested too many 14-inch gaming laptops yet we had to limit ourselves to form and performance when assembling our test group, and this is what we came up with:
All three are equipped with either Intel's i7-7700HQ or its slightly slower predecessor, the i7-6700HQ, as well as a GTX 1060 GPU, except for the Schenker which comes with a GTX 1050 Ti graphics chip. Display resolutions vary from Full HD (MSI, Schenker) and our review unit's 2560x1440 to the Razer Blade's QHD+ panel (of which we have also tested the Full HD model recently). The price range starts at $1,500 (MSI) at the lower end, and ends at 2,600 Euros (~$2753) for the Razer Blade (which is currently available for approximately 2,300 Euros, ~$2435).
Case
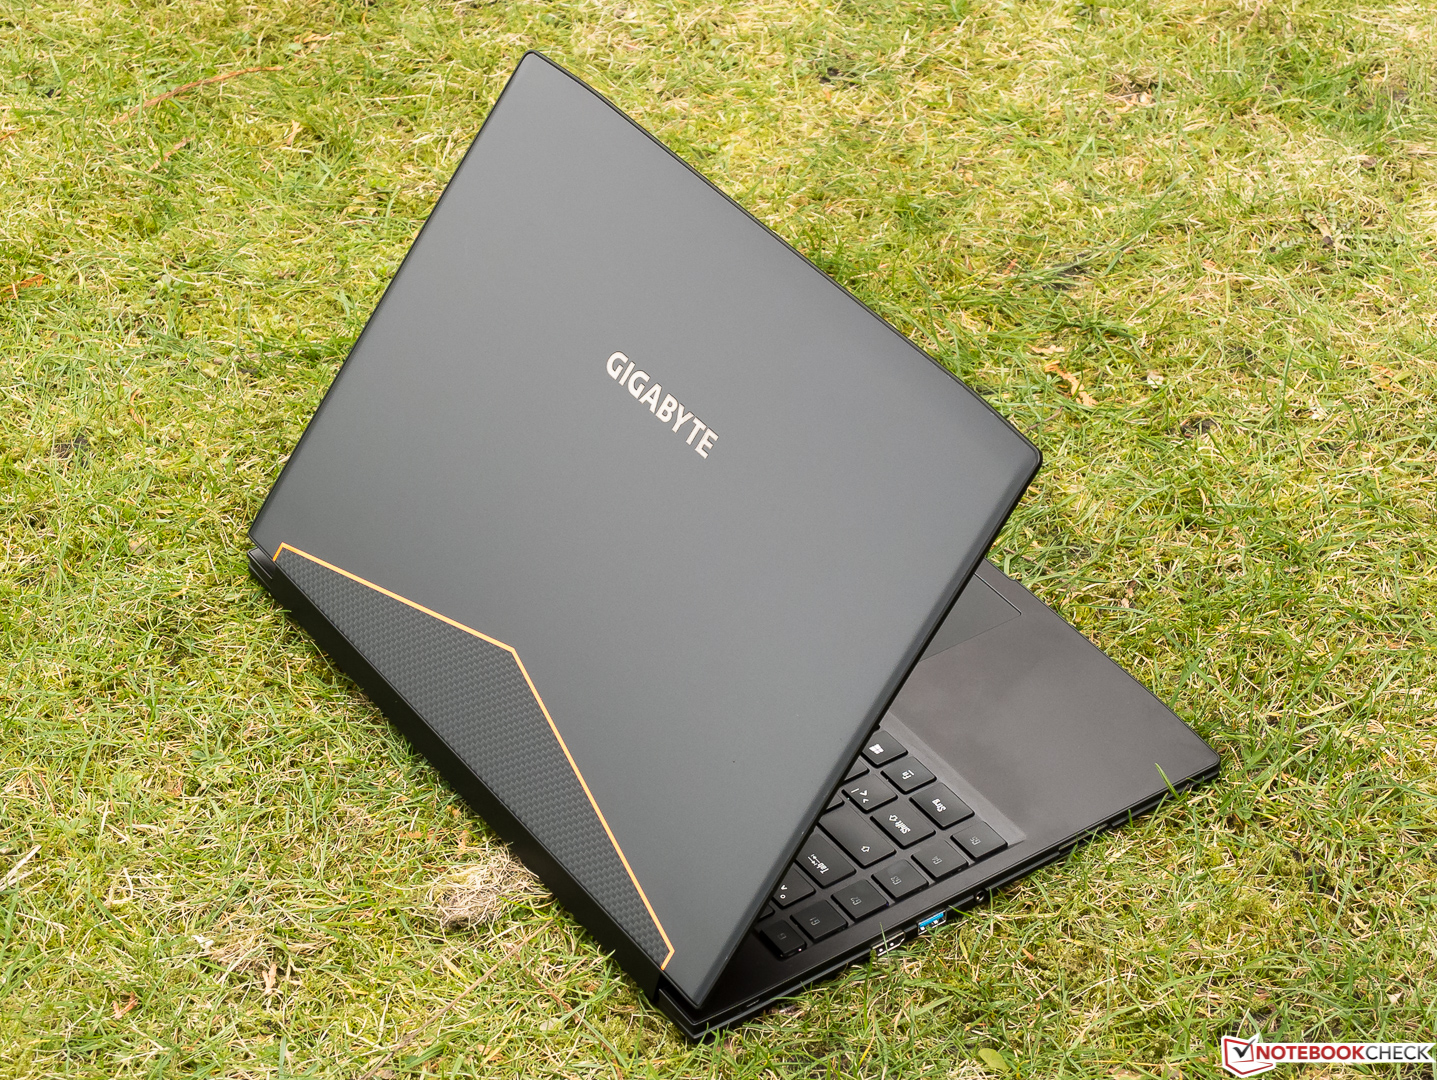
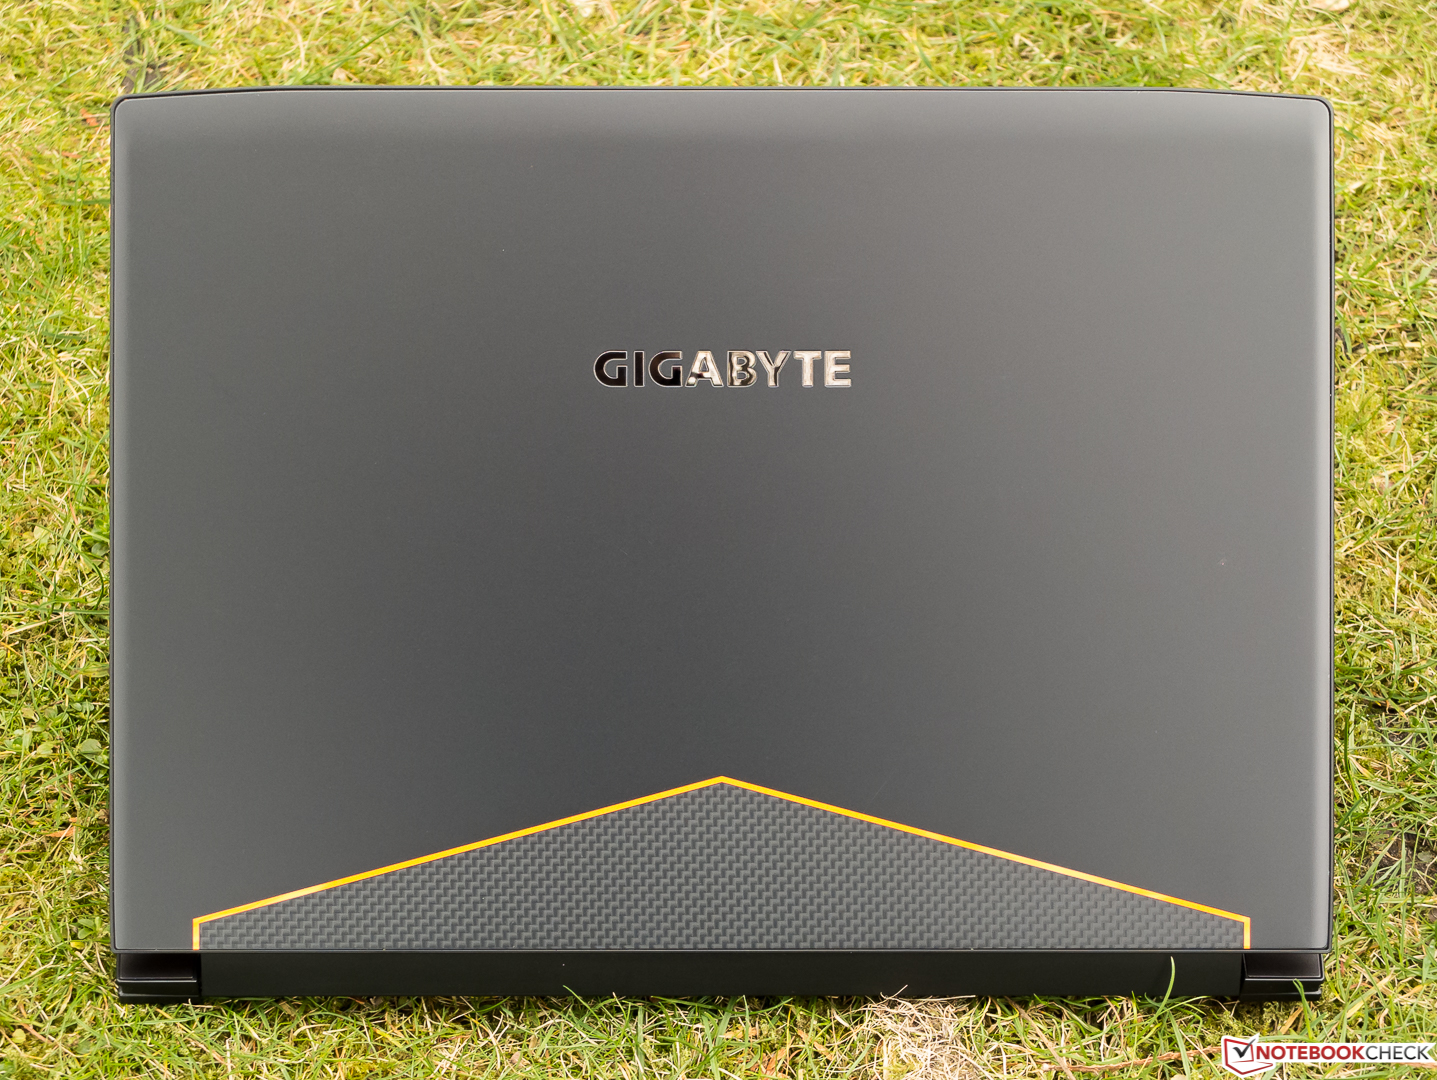
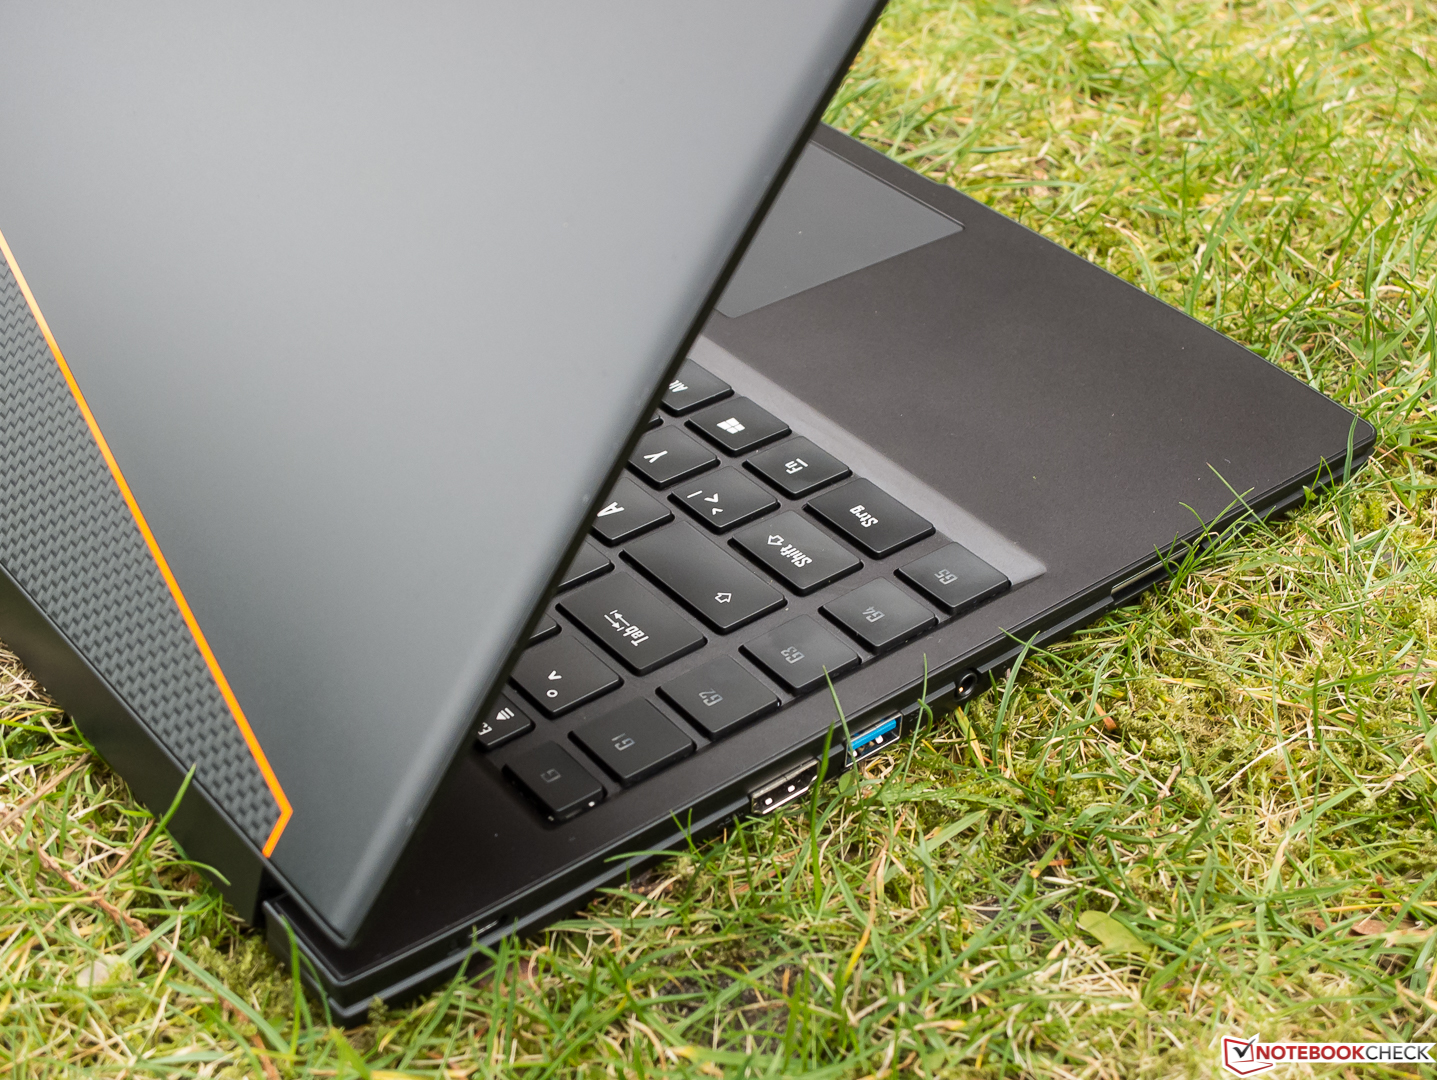
The plain, simple, and somewhat nonslip almost entirely matte black case is available in green and orange as well, and it is not particularly susceptible to fingerprints. We do expect this to be a non-issue with the brighter colors. Its molded base and the red embellishments surrounded by an accentuated decoration on the back cover define the laptop’s optical characteristics. As can be seen in the photos our review unit suffered from a spotted area around the touchpad which even dish-washing liquid failed to eliminate.
Gigabyte’s website makes different claims regarding the material used for the Aero 14. On the one hand, they claim an “original metallic feel”, and on the other they say it’s an “all aluminum robust shell”. On inquiry, Gigabyte confirmed that it is indeed metal, except for the lid which feels like it’s made of plastic. This is further reinforced by the fact that we were unable to warp the case even under intense pressure, and it did not creak during our tests at all. The lid can be opened one-handed, remains in position once opened, and it bounces back for around two seconds.
The Gigabyte Aero 14’s high quality does do its high price justice. Gaps are flush and even and we found neither sharp nor overhanging edges. Despite all this the Razer Blade does have the better case overall, though.
At only 18 mm the Razer Blade is also the thinnest and most compact laptop. The Aero 14 is only 2 mm thicker and slightly narrower but a full centimeter deeper. Both, the Schenker XMG P407 and the MSI GS43VR are slightly wider and thicker, but they are not as deep as our review unit. At only 1.9 kg / 4.2 lbs the Gigabyte Aero and the MSI G43VR are the lightest, with the Razer Blade and the Schenker clocking in at roughly 2 and 2.1 kg, respectively.
Connectivity
Ports
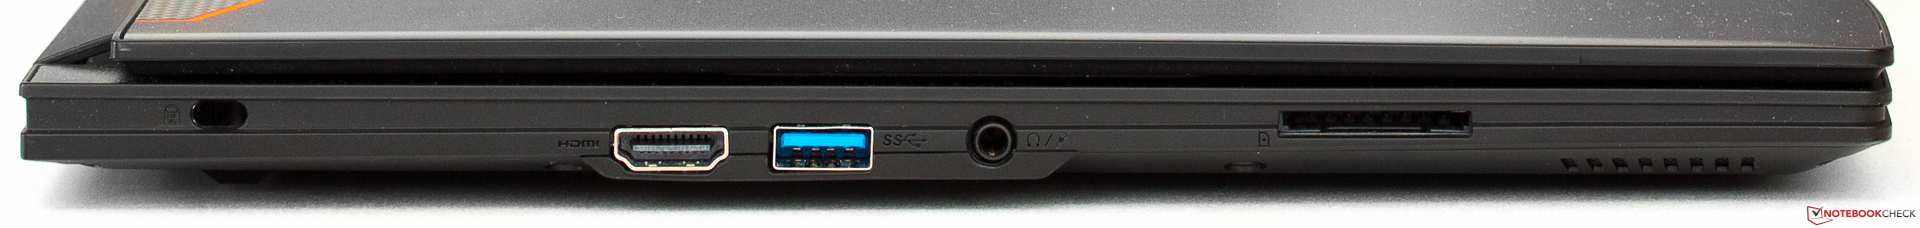
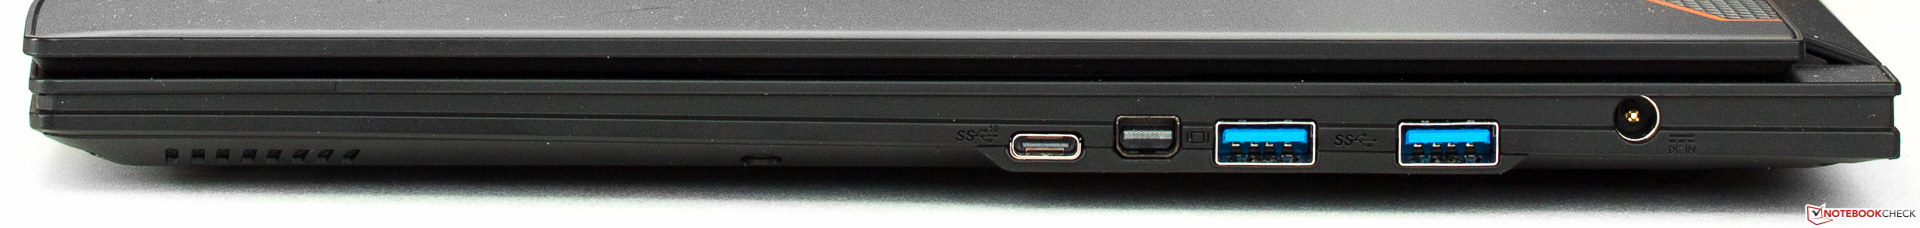
Despite its compact size Gigabyte went all out in regards to ports. In addition to three USB 3.0 Type-A ports the notebook also features a USB 3.1 Type-C connector, HDMI 2.0, and a Mini DisplayPort. This means it fully supports 4K video at 60 Hz. Unfortunately, it lacks Thunderbolt 3.0. Port spacing is sufficient, and the ports are located mostly in the middle on the left and towards the rear on the right-hand side - perfect for right-handed external mouse use.
SD-Card Reader
Ever since we first tested a card reader’s performance all the contestants have tended to fall into one of three groups. The first group, defined by slow USB 2.0 connected card readers that barely reach 30 MB/s, is represented by the MSI laptop. The vast majority fall into the middle group with speeds equivalent to those of the Gigabyte or Schenker notebooks. These, at least, are connected via USB 3.0 instead of the much slower 2.0. The third and final group is comprised of incredibly fast, 200 MB/s card readers. Our reference card is a 64 GB Toshiba Exceria Pro SDXC UHS-II SD card.
| SD Card Reader | |
| average JPG Copy Test (av. of 3 runs) | |
| SCHENKER XMG P407 | |
| Gigabyte Aero 14 | |
| MSI GS43VR 6RE-006US | |
| maximum AS SSD Seq Read Test (1GB) | |
| SCHENKER XMG P407 | |
| Gigabyte Aero 14 | |
| MSI GS43VR 6RE-006US | |
Communication
Even though it lacks a dedicated Ethernet port a USB-Ethernet adapter is included in the box. Gigabyte chose Intel’s Wireless-AC 8260 module (MIMO 2x2), which offers a theoretical maximum data rate of 867 MBit/s and also supports the less frequently used 5 GHz 802.11 ac/n band. Bluetooth 4.2 and Intel’s Wireless Display are included as well.
Tested with our Linksys EA8500 reference router we measured a very good 684 MBit/s when receiving and a good 503 MBit/s when sending data. Taking unavoidable overhead into consideration the data rates are very good. We only had data for two of our equally MIMO 2x2 equipped contestants, and while the XMG P407 falls behind significantly the Razer Blade only managed to be faster than the Aero 14 when sending data.
| Networking | |
| iperf3 transmit AX12 | |
| Razer Blade (2016) | |
| Gigabyte Aero 14 | |
| SCHENKER XMG P407 | |
| iperf3 receive AX12 | |
| Gigabyte Aero 14 | |
| Razer Blade (2016) | |
| SCHENKER XMG P407 | |
Security
Given its focus on mobility Gigabyte has included a TPM 2.0 chip.
Accessories
In addition to the charger, a set of recovery DVDs, a manual, and a warranty card, Gigabyte also includes a USB-Ethernet adapter. While we are positively surprised unfortunately we don’t expect this to catch on.
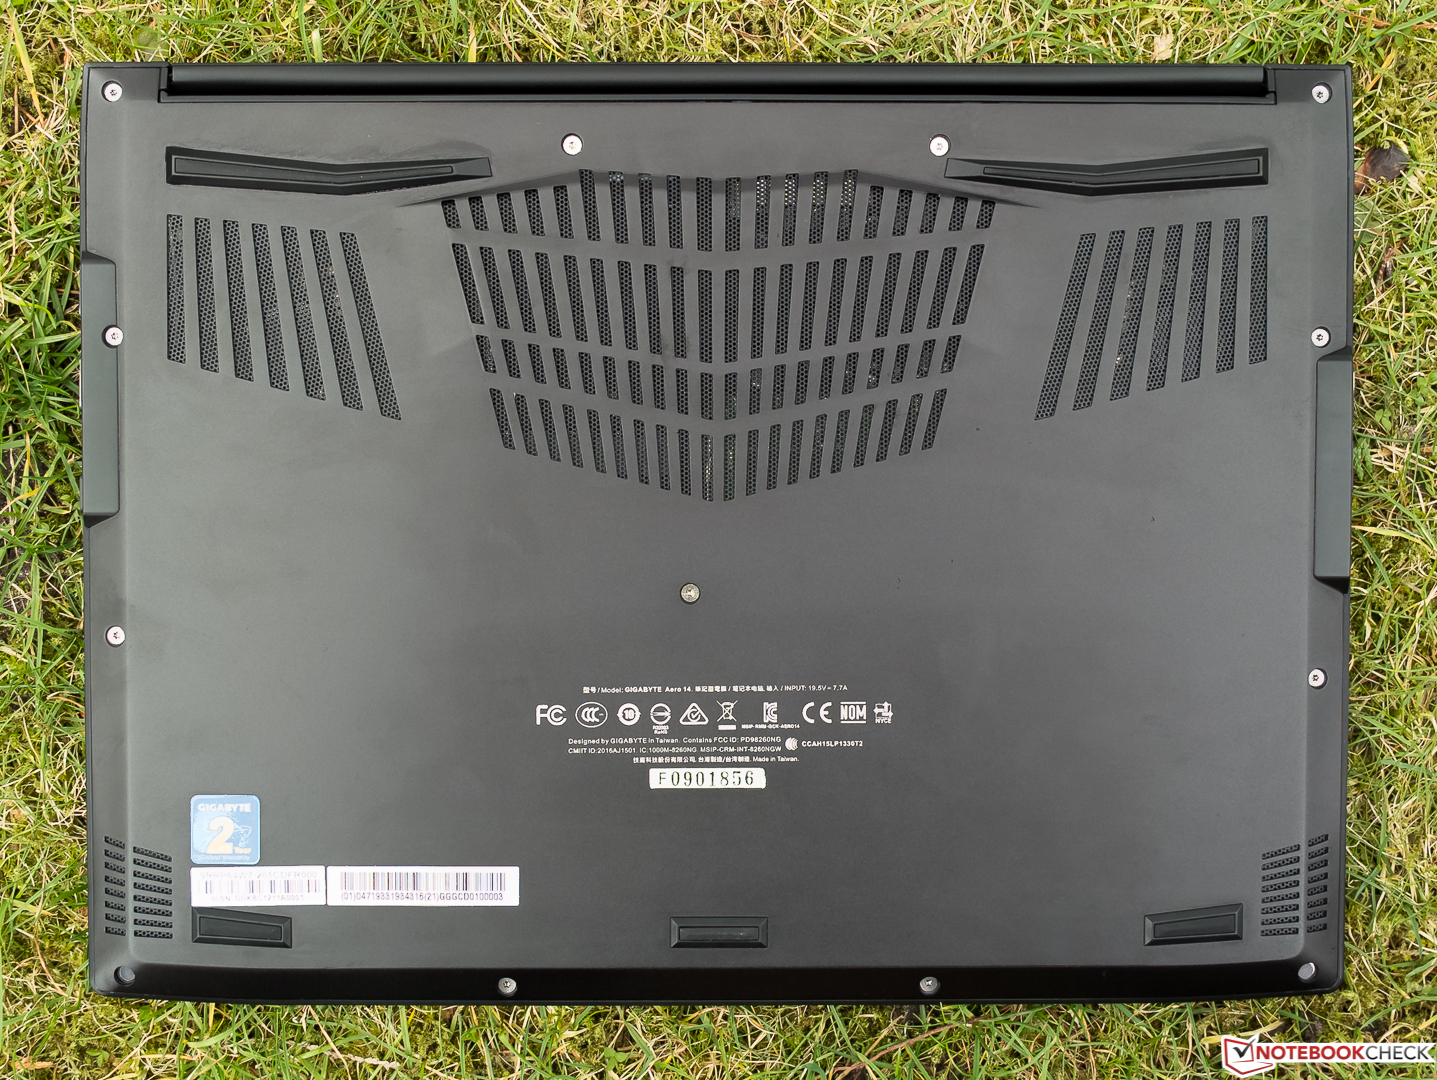
Maintenance
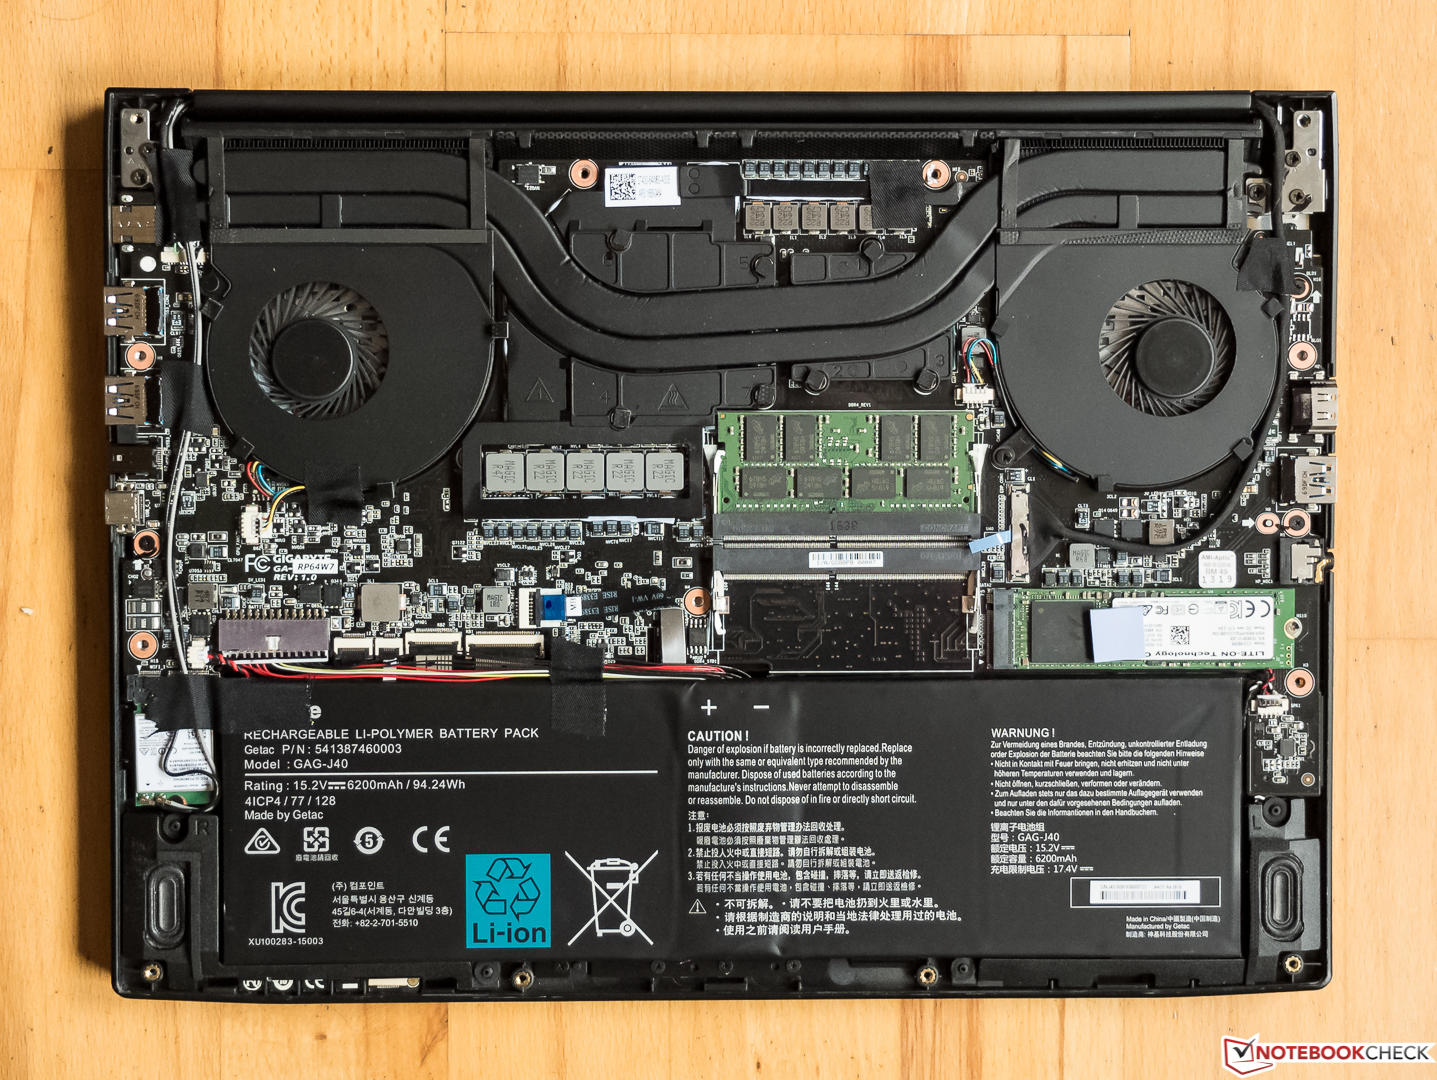
Since the laptop lacks dedicated openings for maintenance, and the battery is non removable as well, disassembly of the base cover necessitates the time-consuming removal of 13 torx screws. Since not all screws are created equal this makes for a rather interesting reassembly if you happen to forget to take notes. All components are readily accessible once the cover has been removed. However, we should warn you that some of the screws are sealed, and removing the base cover most likely voids your warranty.
Warranty
Speaking of which, Gigabyte includes a two-year warranty on the laptop itself, and a one-year warranty on the battery and charger. We were unable to locate optional extended warranties for purchase. In addition to this warranty by Gigabyte itself a laptop purchased in Germany obviously also comes with the standard two-year implied warranty.
Please see our Guarantees, Return Policies and Warranties FAQ for country-specific information.
Input Devices
Keyboard
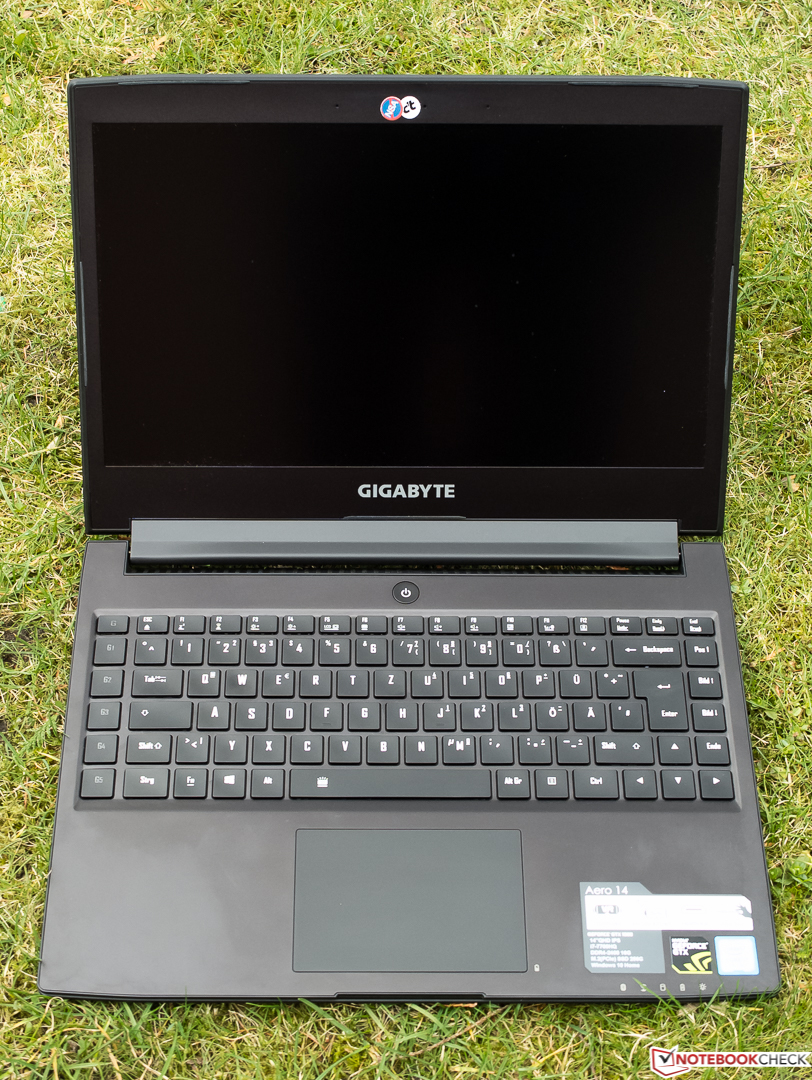
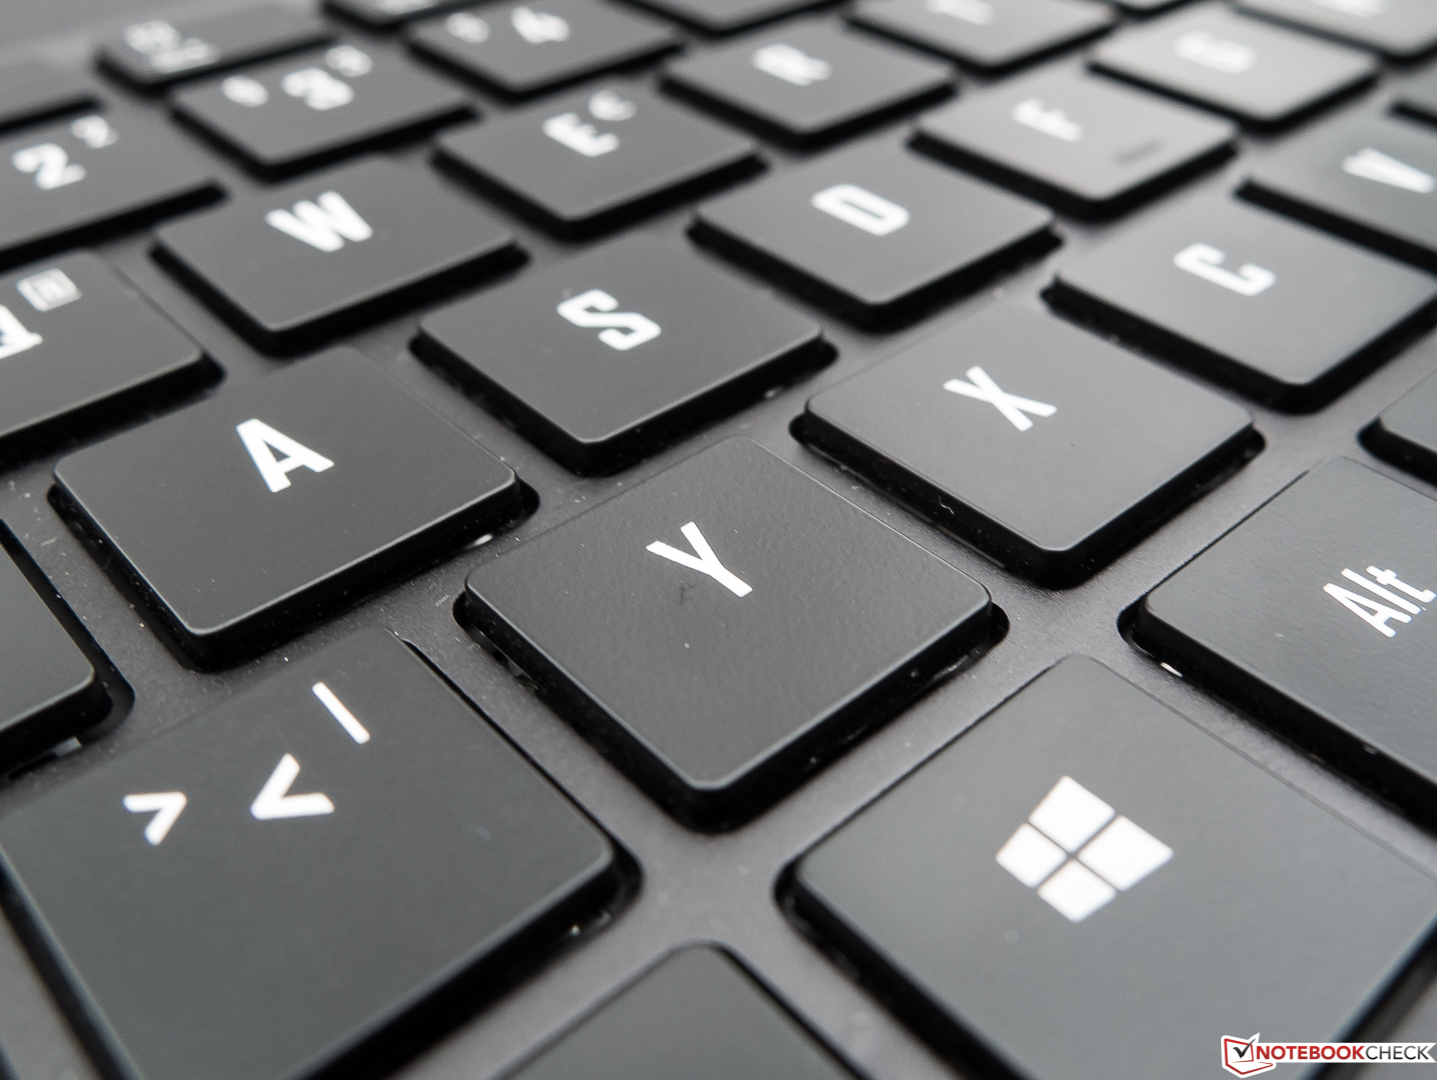
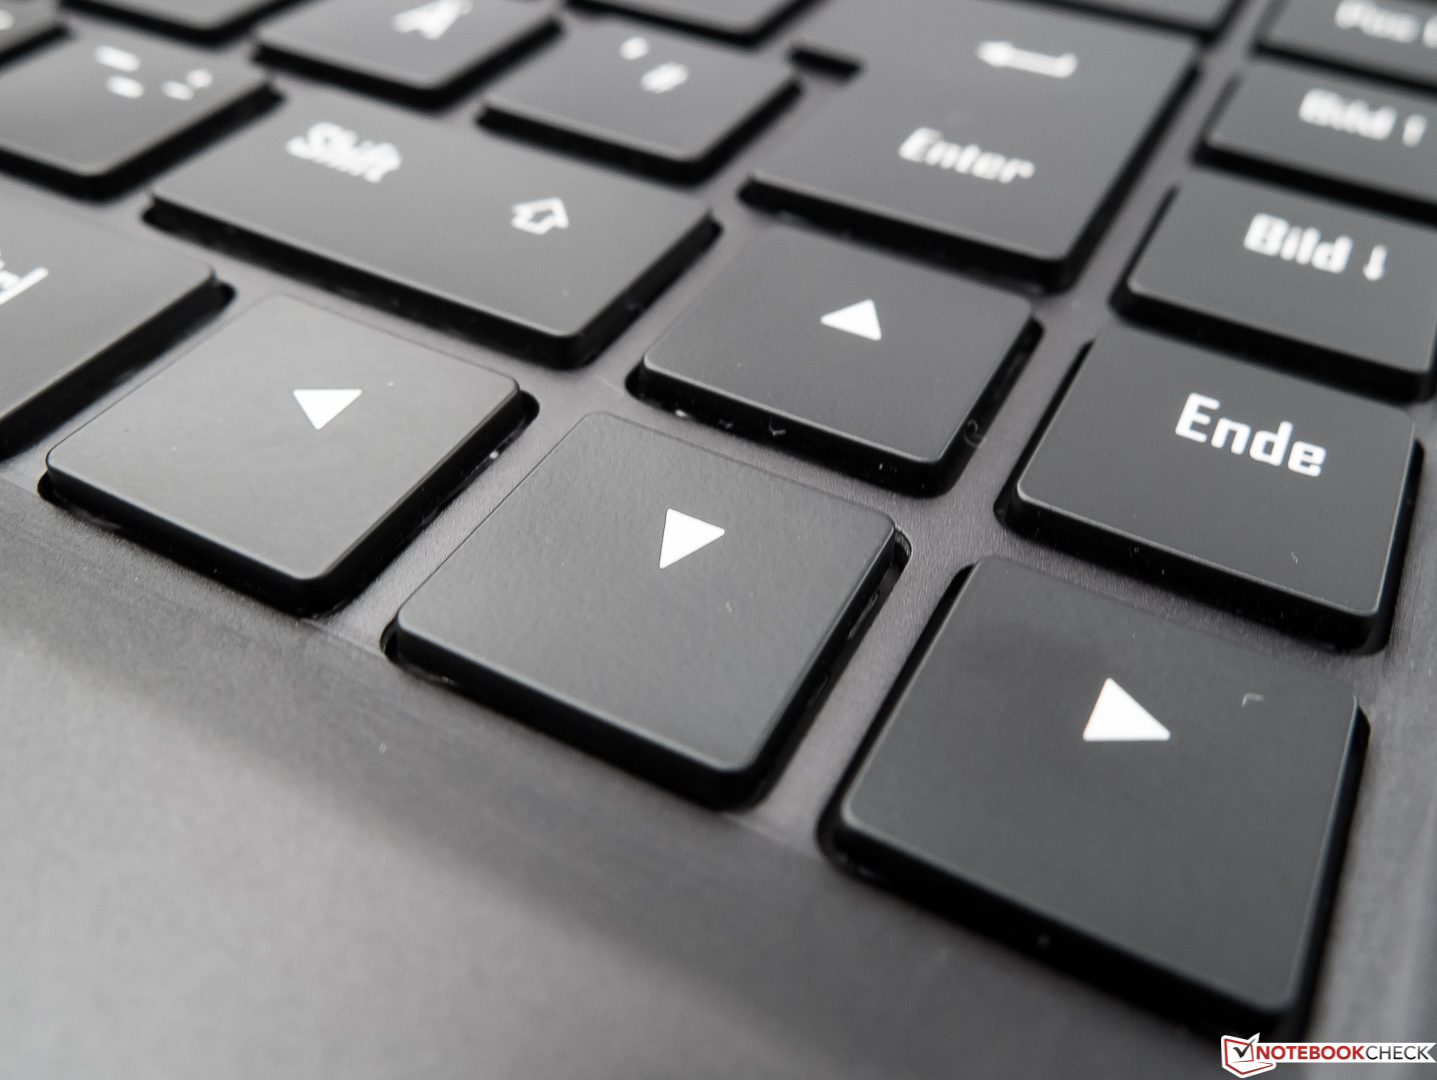
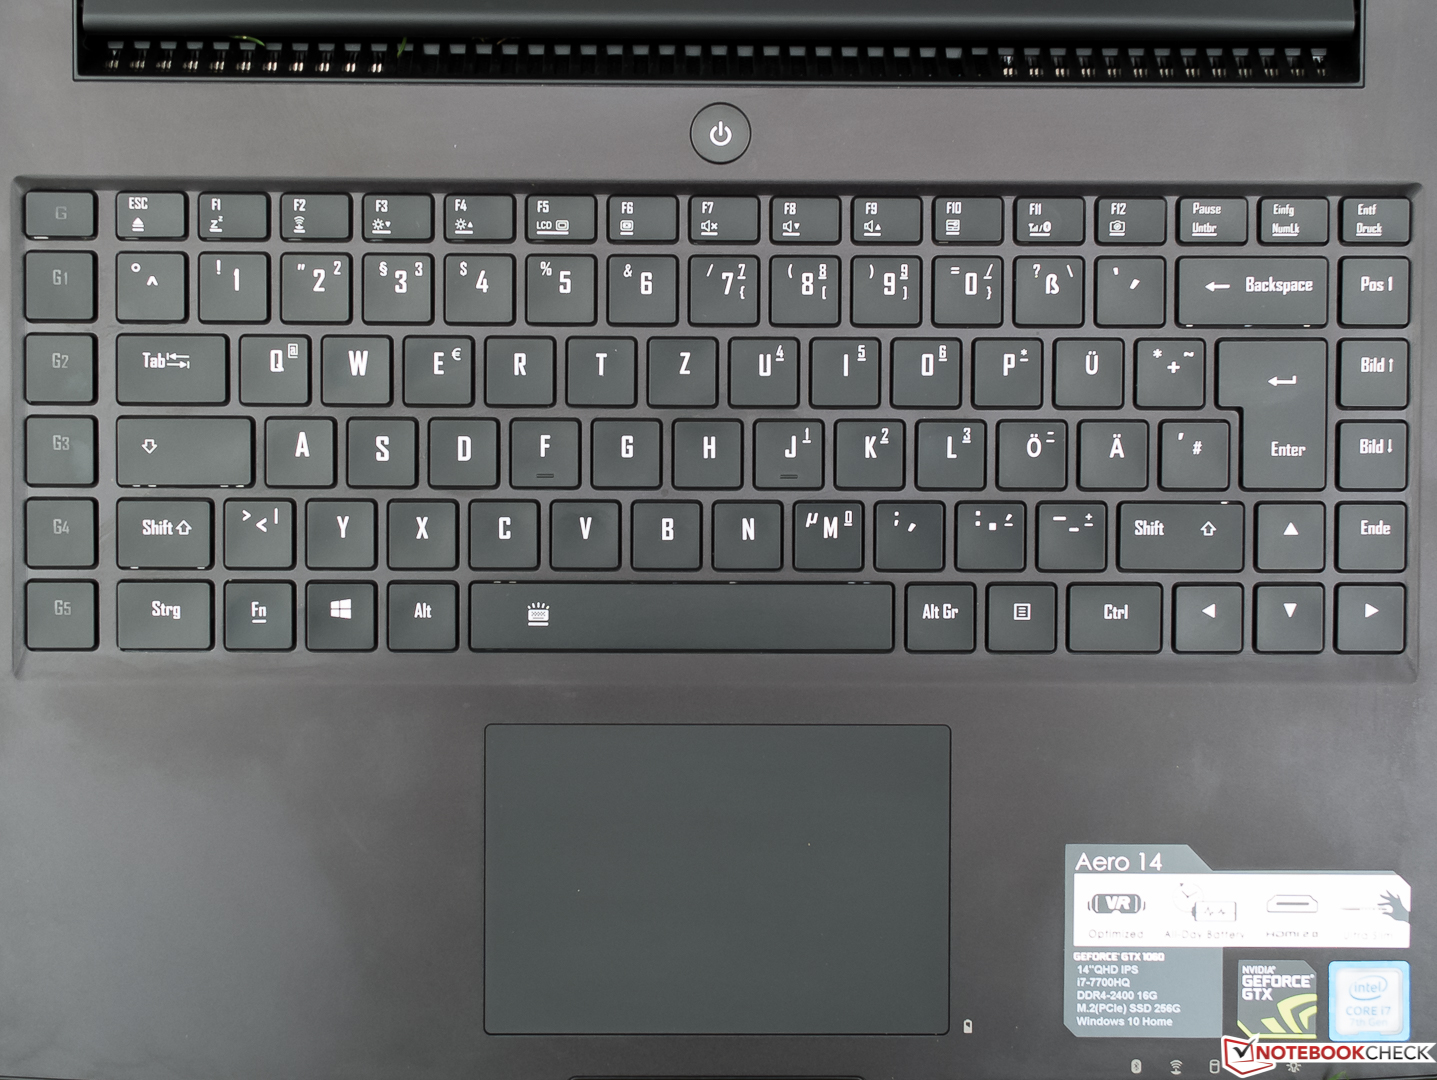
The slightly lowered chiclet-style keyboard definitely takes some getting used to due to its significantly modified layout: it features extra columns on both sides. The left side offers six additional macro keys, the uppermost of which is illuminated and can be used to cycle through programmed macros for the five keys below. On the right-hand side we find keys which are usually found around the top right corner of a keyboard, such as Home or End. On both sides this is a problem for touch typists who, for example, are used to moving their left hand to the top left corner for the ESC key, or simply moving their right hand over to the far right for the Return or Shift keys: in both cases those keys aren’t where you would expect them to be.
The key legends are a double-edged sword. On the one hand the font looks funny; on the other it drastically reduces readability. In addition, the font size for the uppermost row is too small. No complaints regarding the two-stage backlight – it’s bright and evenly distributed.
Key size and spacing are okay, but it felt somewhat cramped sometimes. We did like the feel of the moderately concave keys: short key travel, very concise actuation point, and only lightly sprung keyboard stroke. The keyboard doesn’t flex or bend even under intense pressure, yet the larger keys do rattle noticeably, which renders the laptop unusable in quiet environments.
Touchpad
The large, button-less touchpad detected our fingers right to the very edges, and its slightly roughened surface offers decent slippage. That said, sweaty fingers will have trouble with upward vertical movements. Precision and sensitivity are top-notch – quick movements and drag & drop via touch were detected reliably and worked as expected.
We would have wished for better haptic and acoustic feedback from the extremely low-travel ClickPad. Up to three-finger-gestures can be easily configured in Elan’s touchpad settings.
Display
Even though we would have preferred a Full HD panel in a 14-inch laptop Gigabyte chose a 2560x1440 QHD panel instead. Whether or not the resulting 221 dpi pixel density will be noticeable from standard viewing distances is arguable. More importantly, the matte IPS panel does not suffer from PWM and offers great viewing angles. Sharpness is crisp and clear, and Gigabyte does not offer any other displays to choose from.
With its average brightness of only 257 nits the Gigabyte Aero 14 falls short of its target price range. Given the 2,000-Euro (~$2118) price tag we would have expected at least 50 nits more than that. That said, it should work well indoors, and its Schenker and MSI competitors aren’t necessarily that much brighter. Only the Razor Blade trumps all three of its competitors by a significant margin. Light distribution is mediocre at best (79%) and blacks are generally deep and homogenous except for some minimal and mostly insignificant backlight-bleeding at the very bottom of the screen.
| |||||||||||||||||||||||||
Brightness Distribution: 79 %
Center on Battery: 290 cd/m²
Contrast: 967:1 (Black: 0.3 cd/m²)
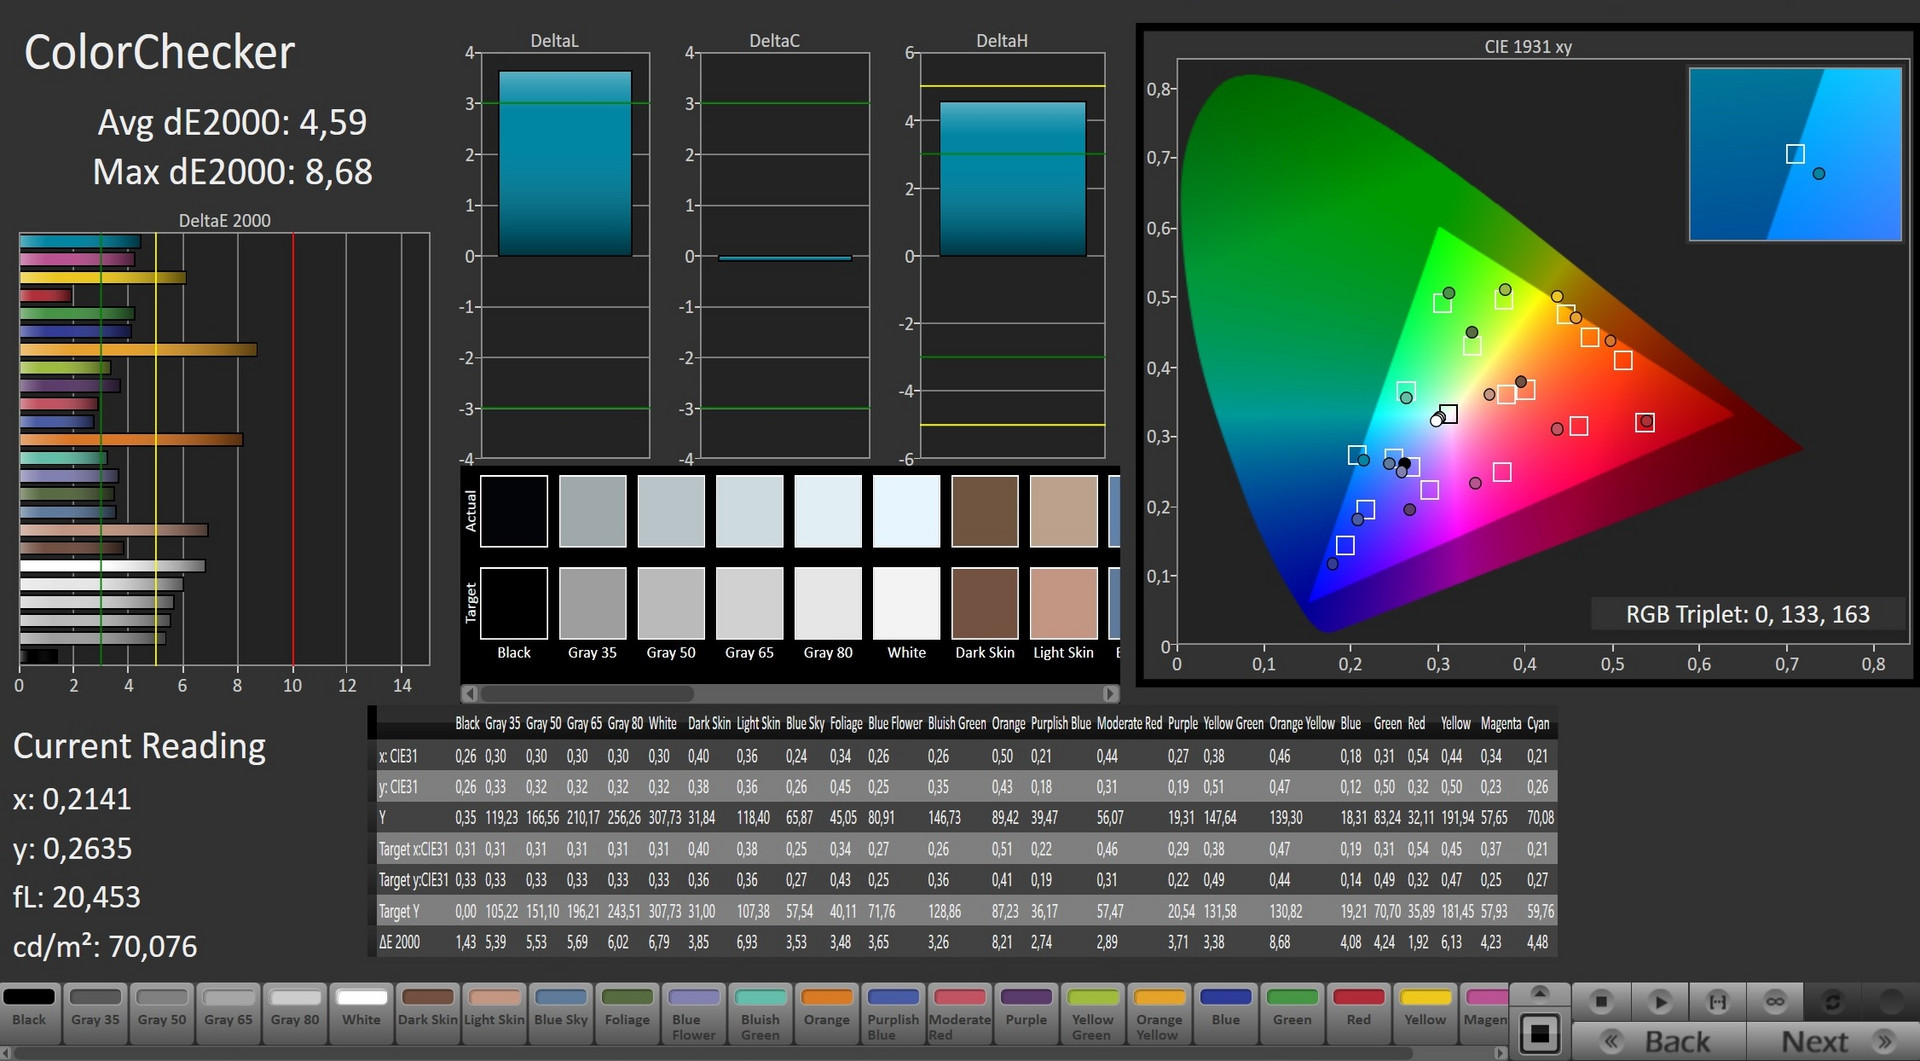
ΔE Color 4.59 | 0.5-29.43 Ø5
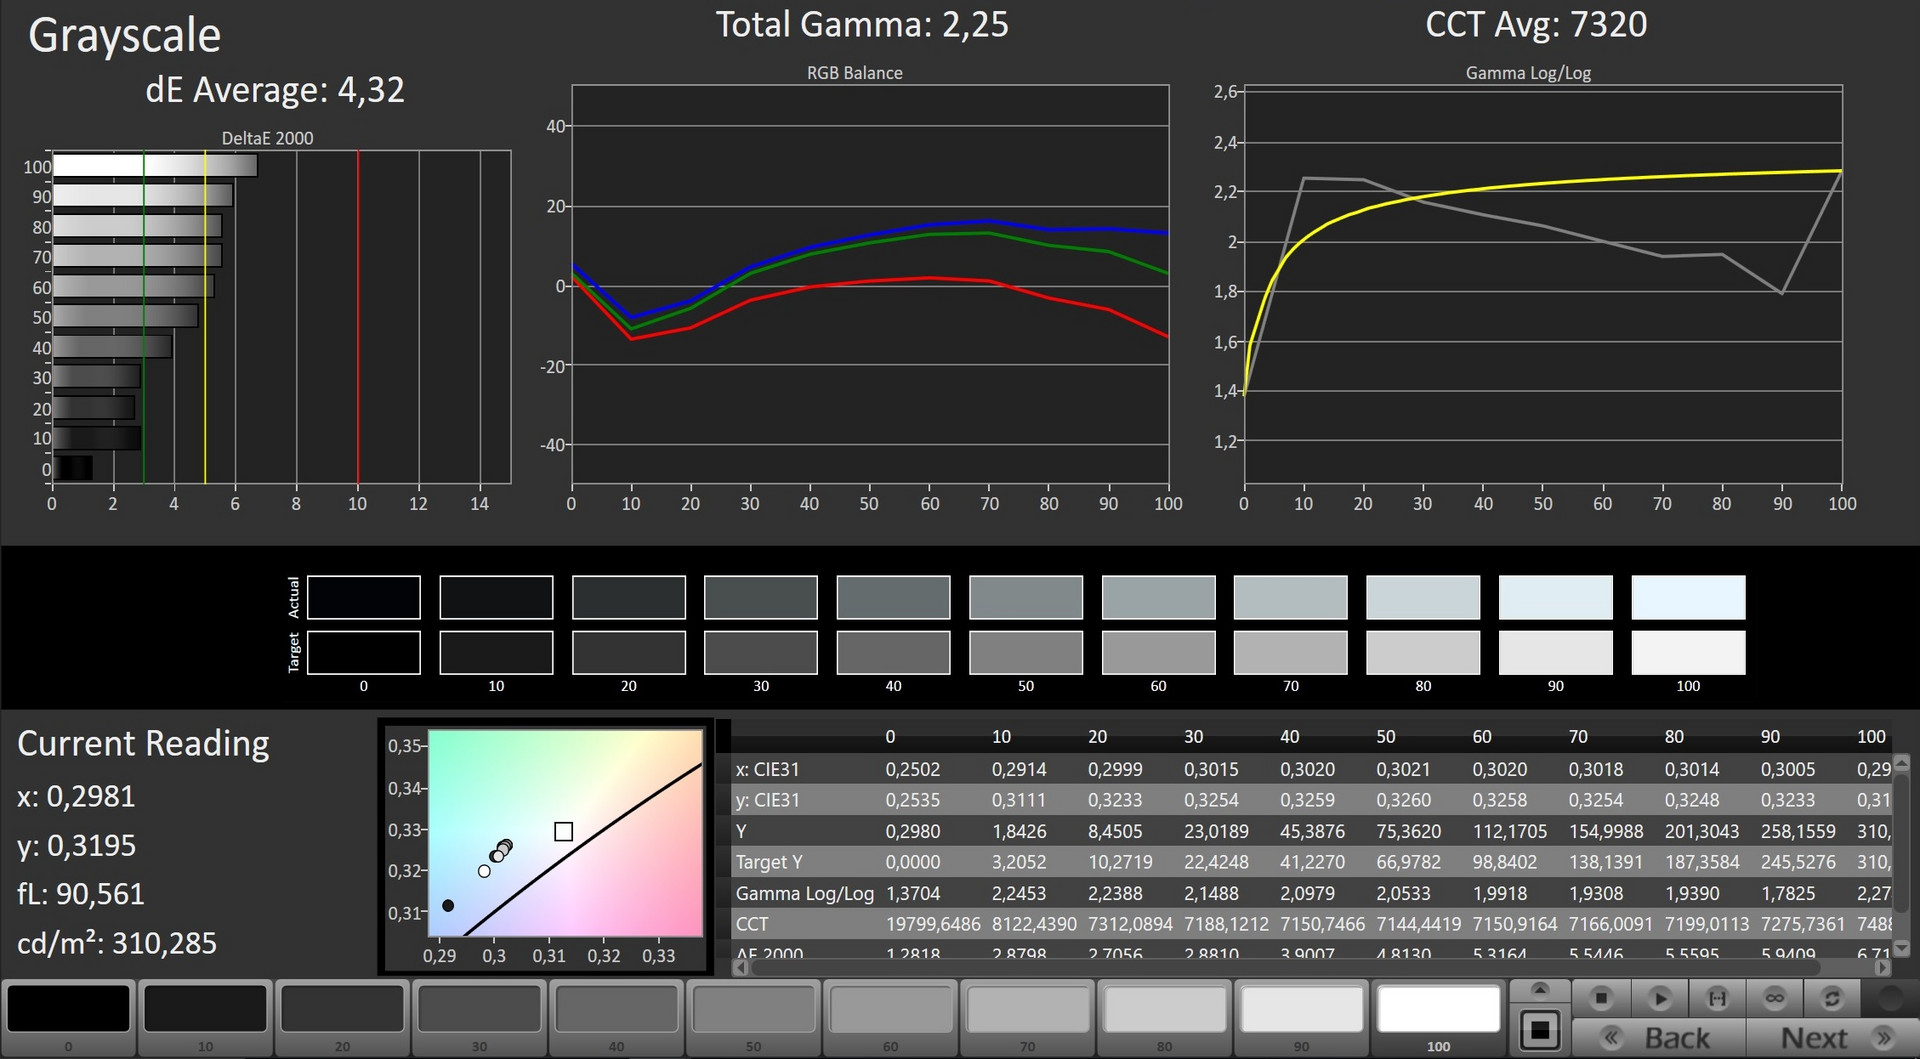
ΔE Greyscale 4.32 | 0.57-98 Ø5.3
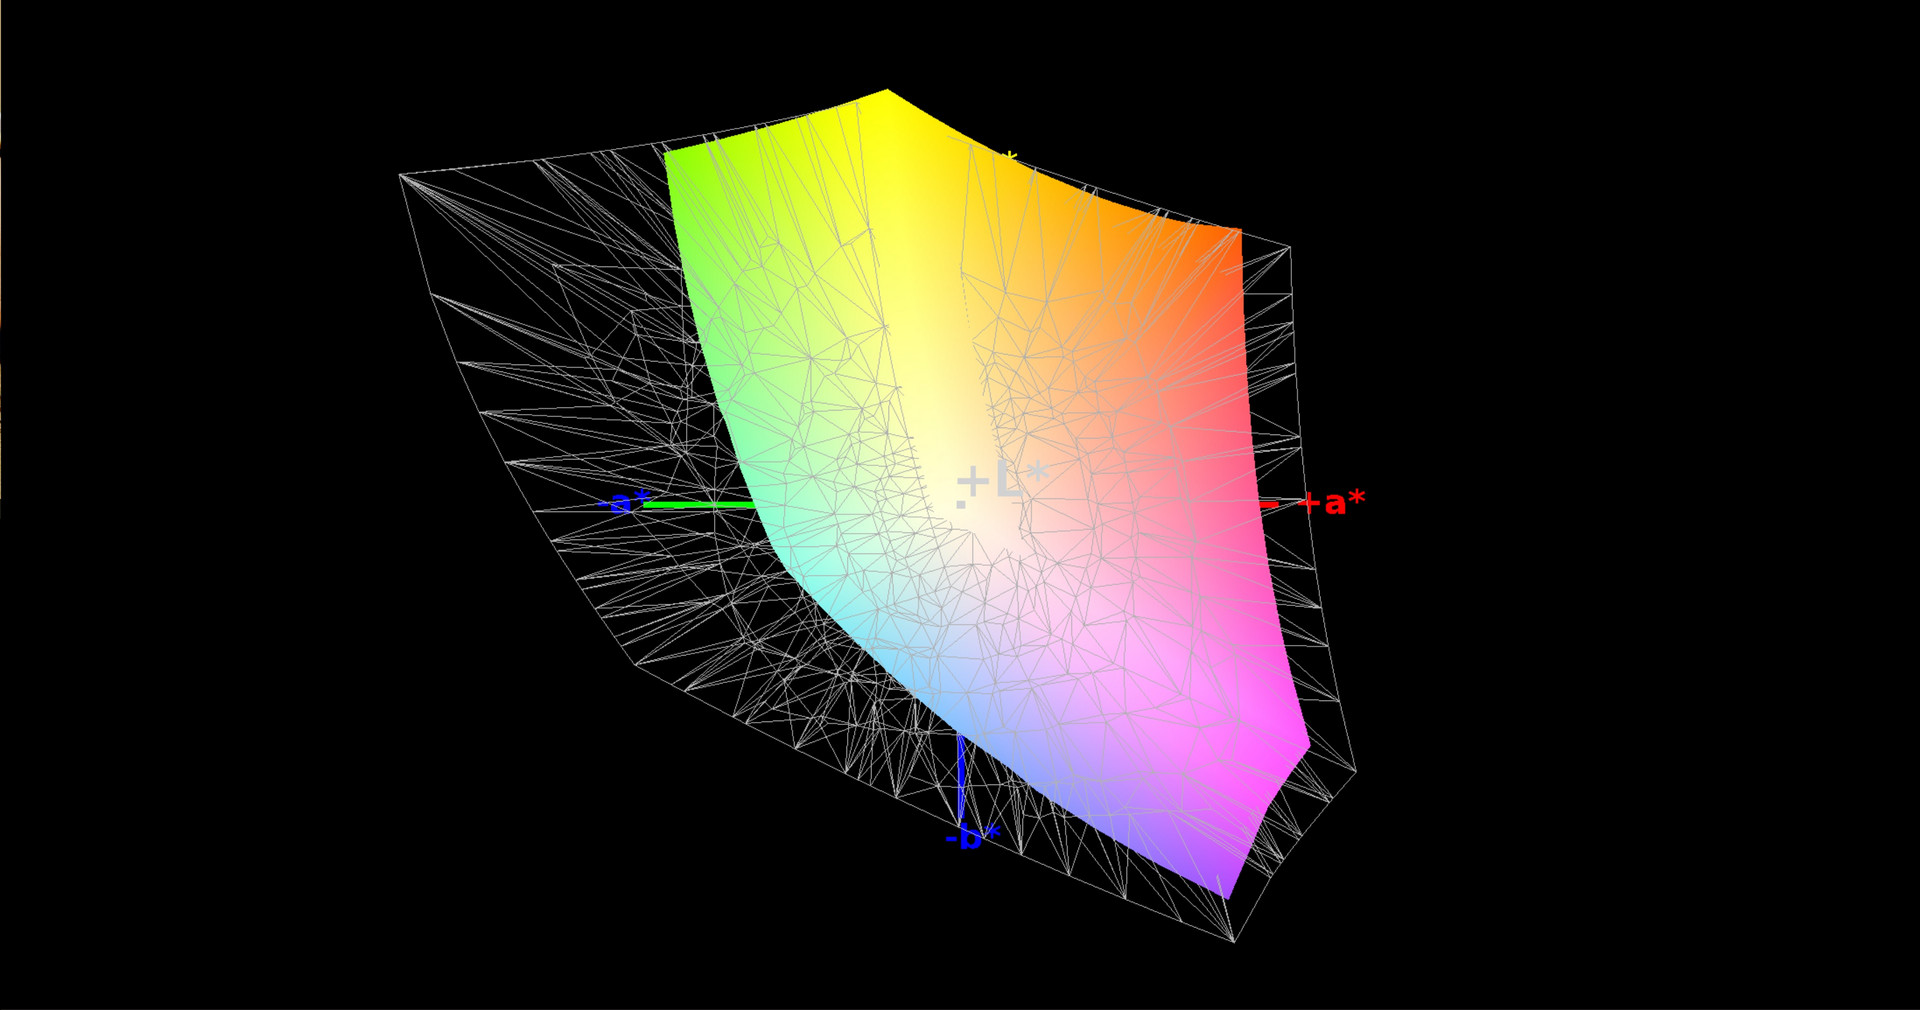
92% sRGB (Argyll 1.6.3 3D)
59% AdobeRGB 1998 (Argyll 1.6.3 3D)
65.5% AdobeRGB 1998 (Argyll 2.2.0 3D)
91.8% sRGB (Argyll 2.2.0 3D)
64.4% Display P3 (Argyll 2.2.0 3D)
Gamma: 2.25
| Gigabyte Aero 14 LG Philips LP140QH1-SPF1 (LGD049A), , 2560x1440, 14.00 | MSI GS43VR 6RE-006US Name: LG Philips LP140WF3-SPD1, ID: LGD046D, , 1920x1080, 14.00 | SCHENKER XMG P407 LG Philips LP140WF3-SPD1 (LGD046D), , 1920x1080, 14.00 | Razer Blade (2016) Sharp LQ140Z1JW01 (SHP1401), , 3200x1800, 14.00 | |
|---|---|---|---|---|
| Display | -3% | -6% | 4% | |
| Display P3 Coverage | 64.4 | 65.5 2% | 64.5 0% | 66.9 4% |
| sRGB Coverage | 91.8 | 86.4 -6% | 82.1 -11% | 96.8 5% |
| AdobeRGB 1998 Coverage | 65.5 | 63.1 -4% | 60 -8% | 68.2 4% |
| Response Times | 13% | -12% | -24% | |
| Response Time Grey 50% / Grey 80% * | 41 ? | 31.6 ? 23% | 47 ? -15% | 41 ? -0% |
| Response Time Black / White * | 25 ? | 24.4 ? 2% | 27 ? -8% | 37 ? -48% |
| PWM Frequency | 200 ? | |||
| Screen | 10% | 3% | 30% | |
| Brightness middle | 290 | 288.4 -1% | 298 3% | 328 13% |
| Brightness | 257 | 282 10% | 282 10% | 328 28% |
| Brightness Distribution | 79 | 83 5% | 80 1% | 69 -13% |
| Black Level * | 0.3 | 0.35 -17% | 0.27 10% | 0.22 27% |
| Contrast | 967 | 824 -15% | 1104 14% | 1491 54% |
| Colorchecker dE 2000 * | 4.59 | 2.61 43% | 4.42 4% | 1.91 58% |
| Colorchecker dE 2000 max. * | 8.68 | 7.34 15% | 8.57 1% | 3.23 63% |
| Greyscale dE 2000 * | 4.32 | 1.18 73% | 4.11 5% | 1.69 61% |
| Gamma | 2.25 98% | 2.24 98% | 2.5 88% | 2.3 96% |
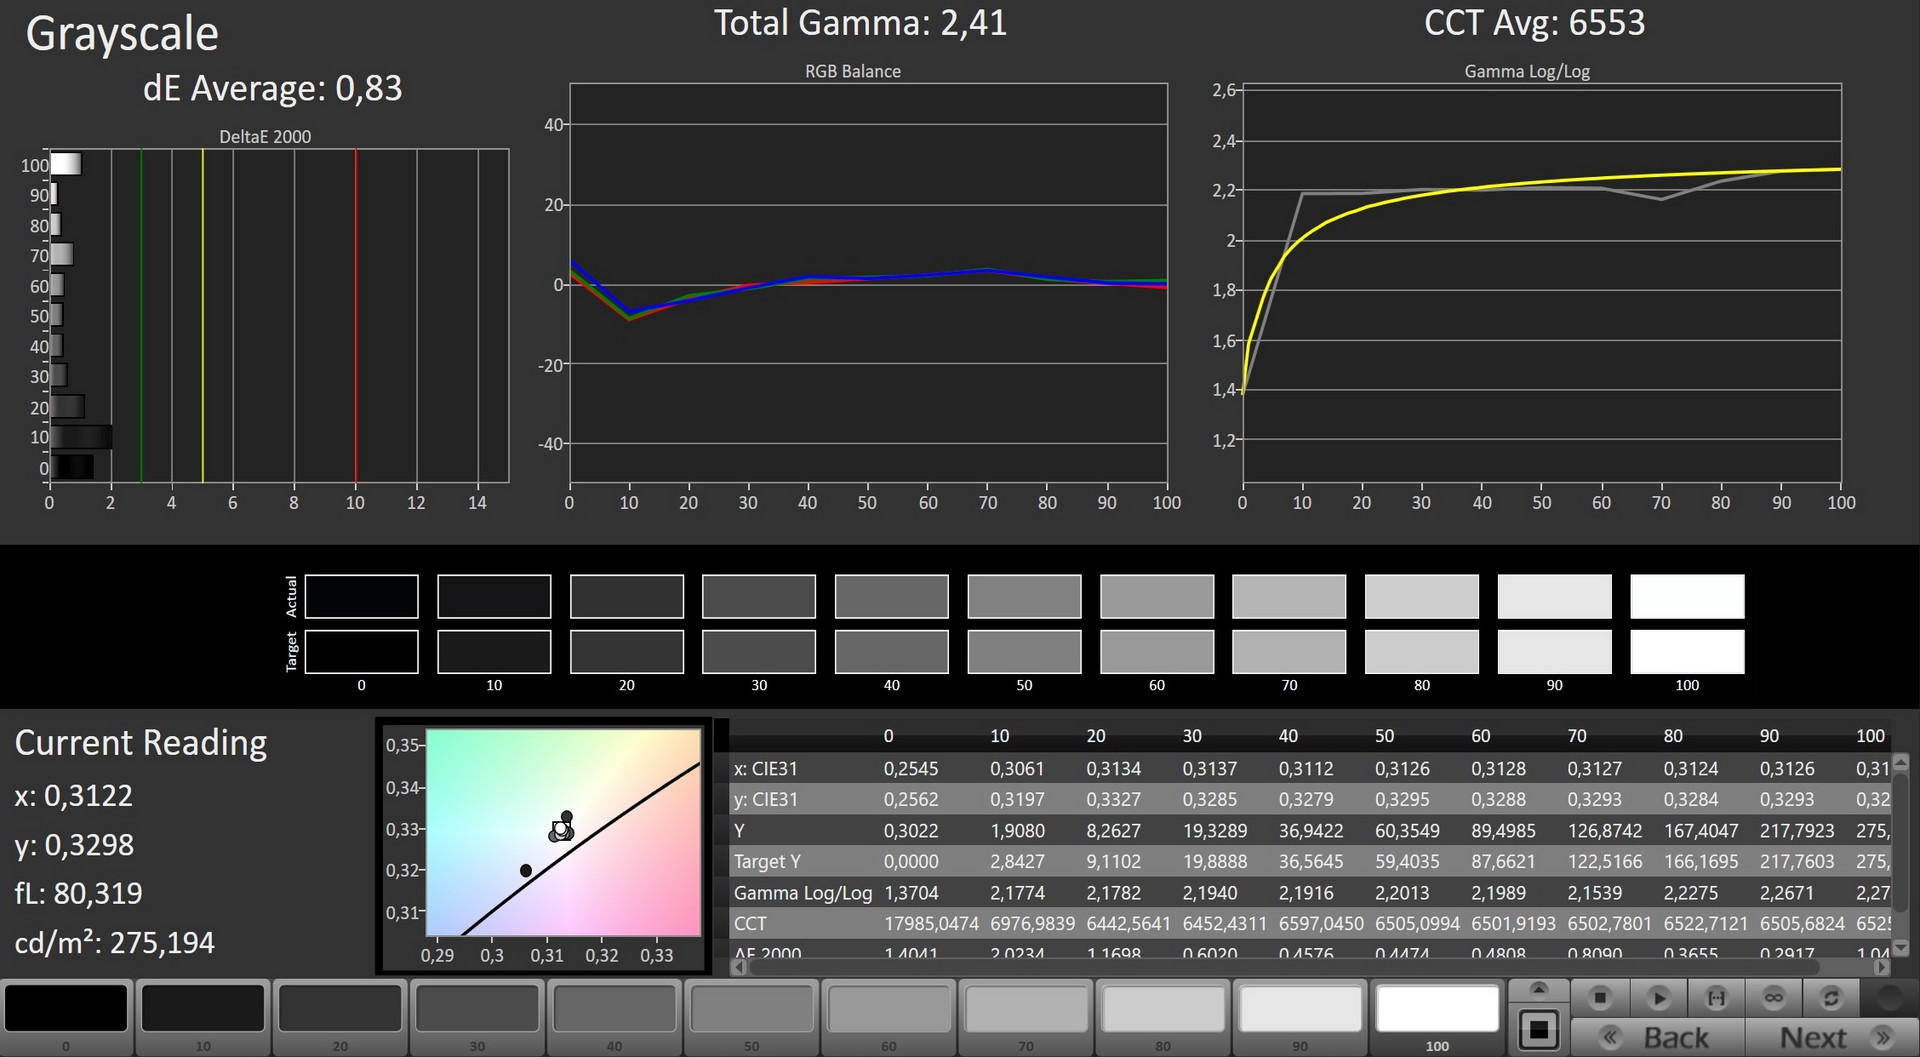
| CCT | 7320 89% | 6506 100% | 6329 103% | 6418 101% |
| Color Space (Percent of AdobeRGB 1998) | 59 | 56.4 -4% | 54 -8% | 63 7% |
| Color Space (Percent of sRGB) | 92 | 86.4 -6% | 82 -11% | 97 5% |
| Total Average (Program / Settings) | 7% /
8% | -5% /
-1% | 3% /
18% |
* ... smaller is better
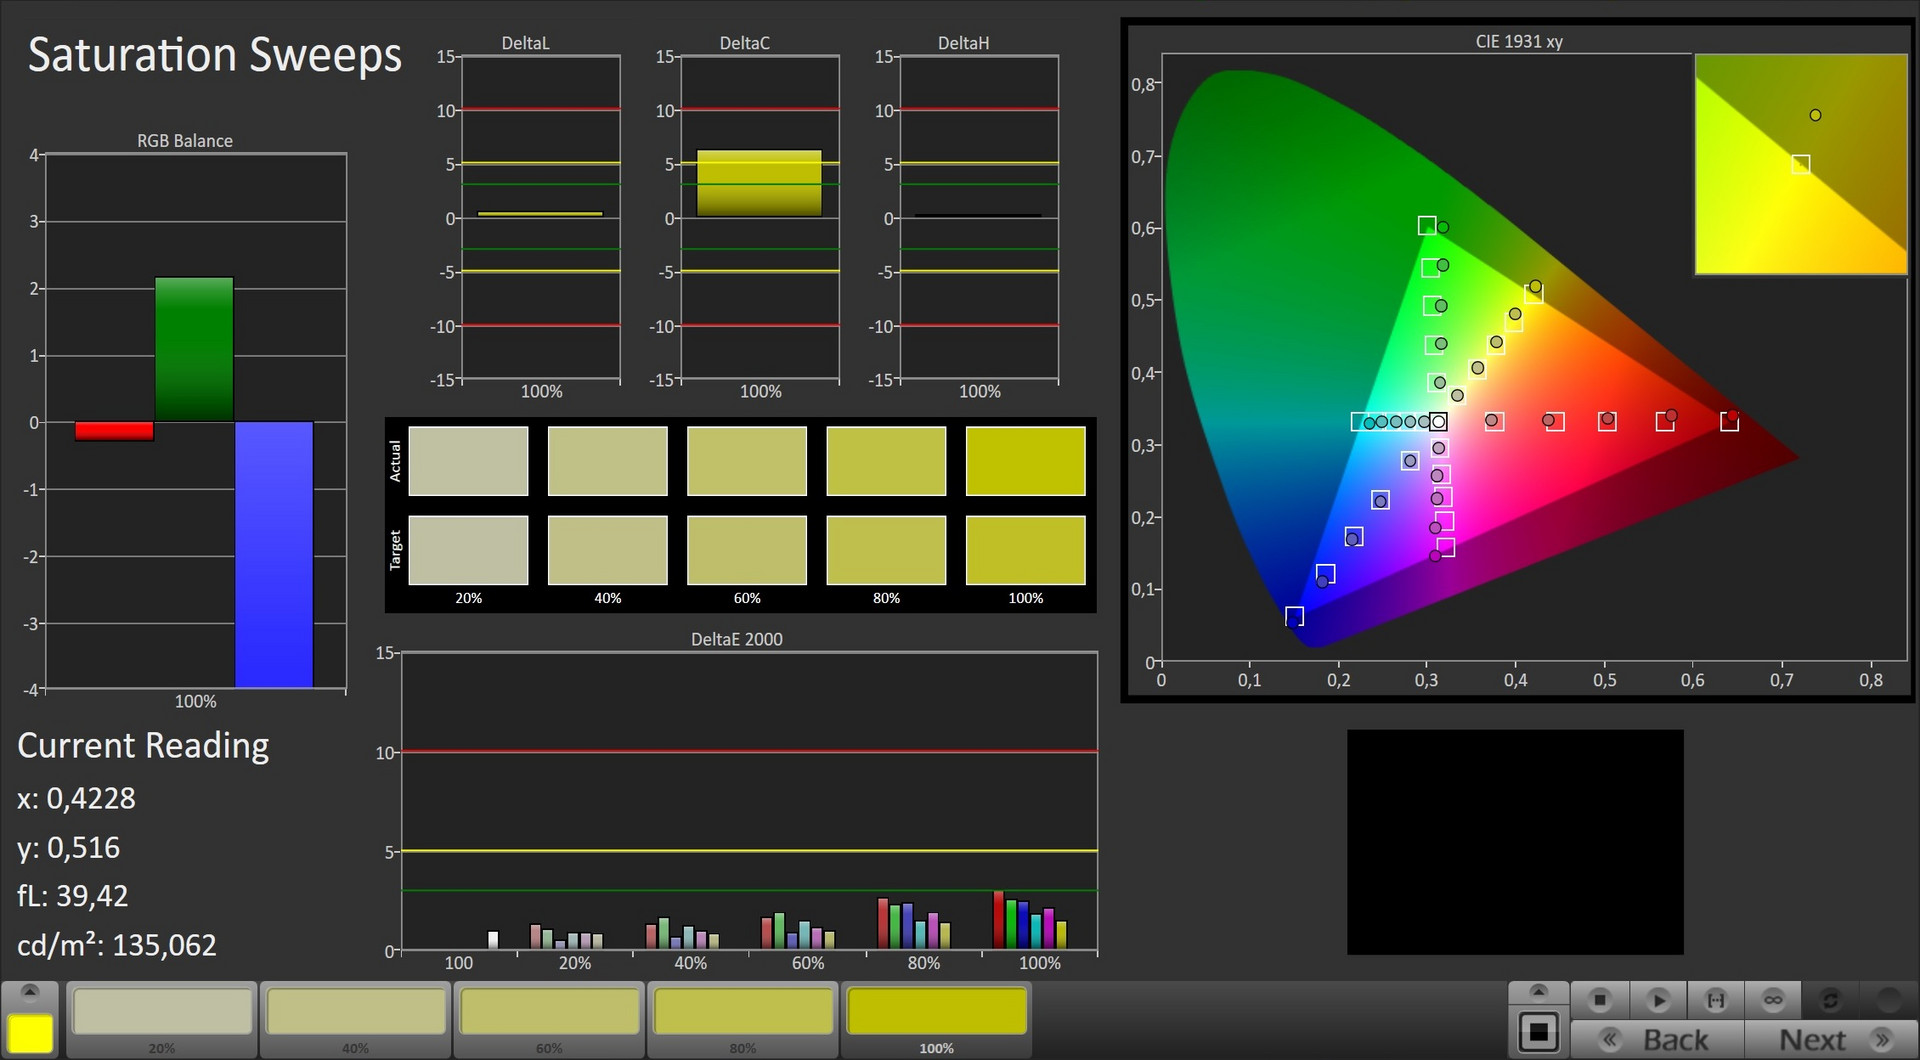
For the purpose of our color accuracy tests we've set the color mode to “native color” in Smart Manager. The measured black level of 0.3 is impressive and results in a contrast ratio of almost 1000:1. Both the Schenker and the Razer laptop offer an even lower black level, but their respective higher contrast ratios can be traced back chiefly to their brighter displays.
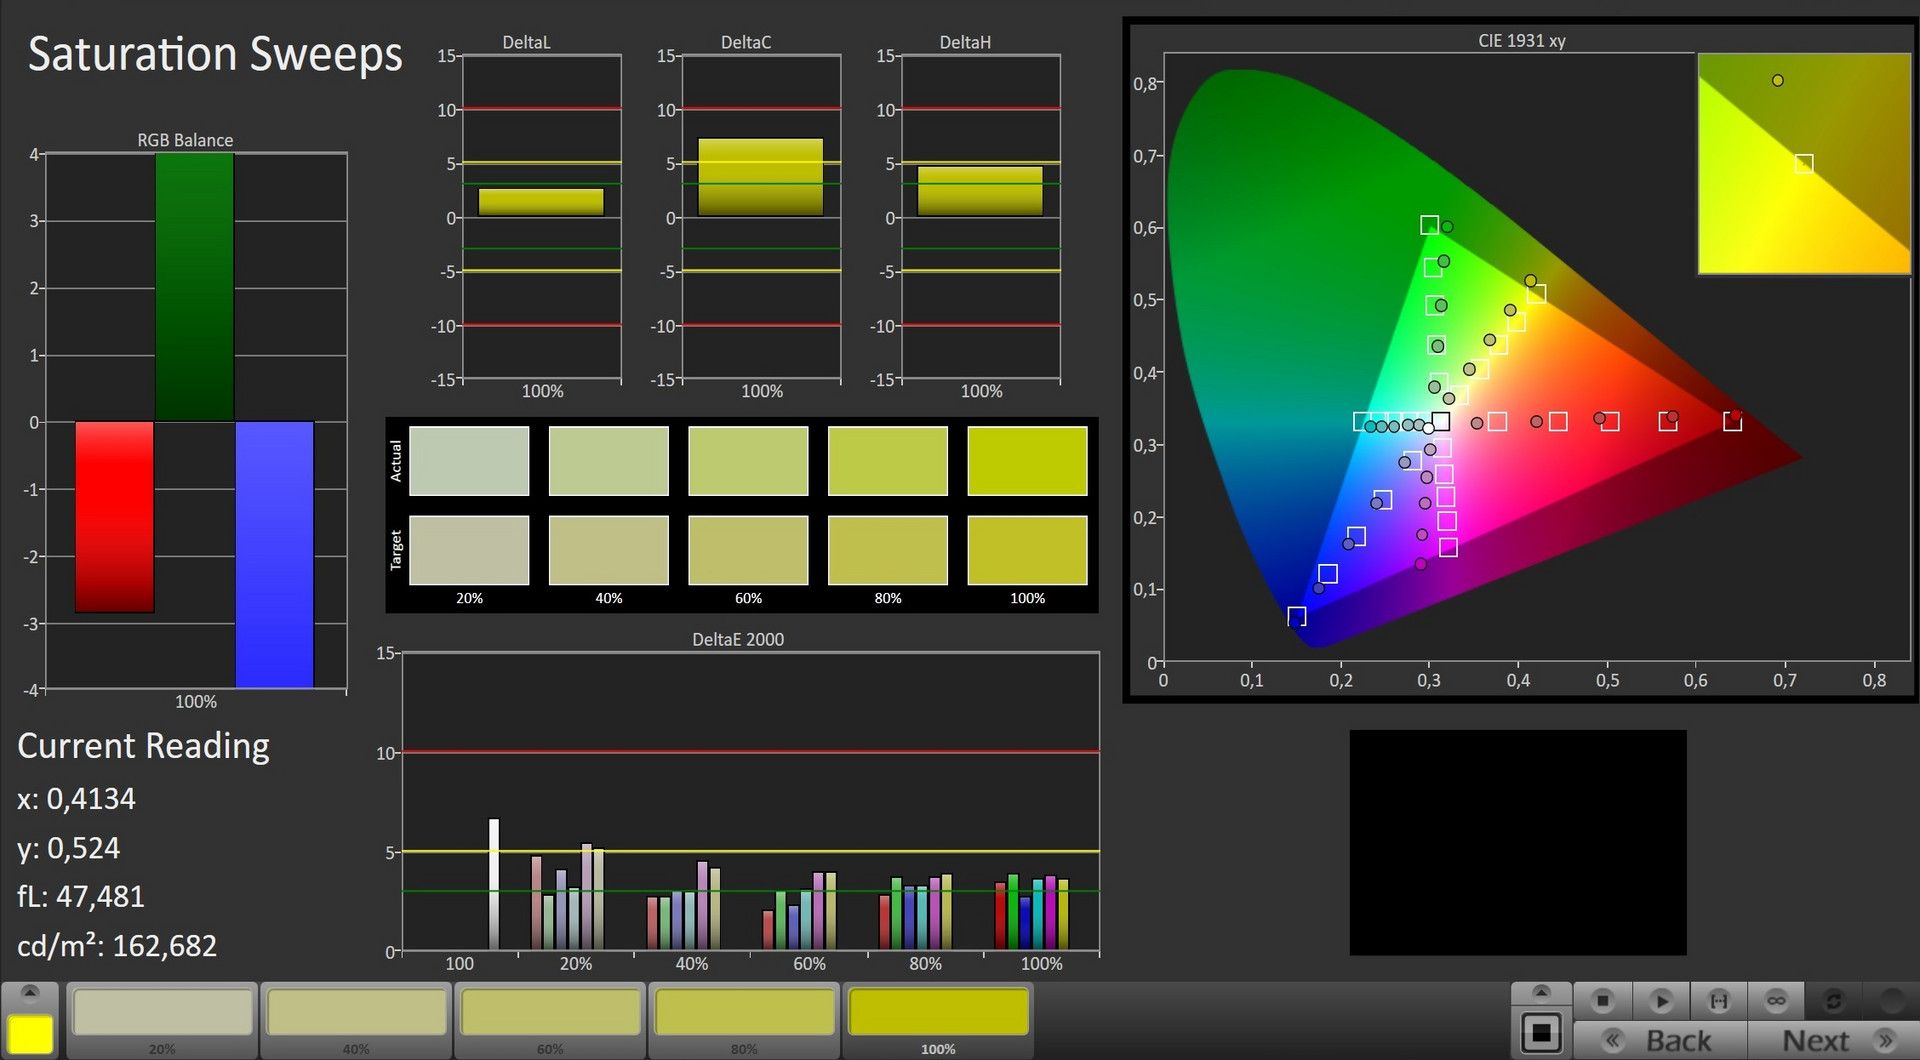
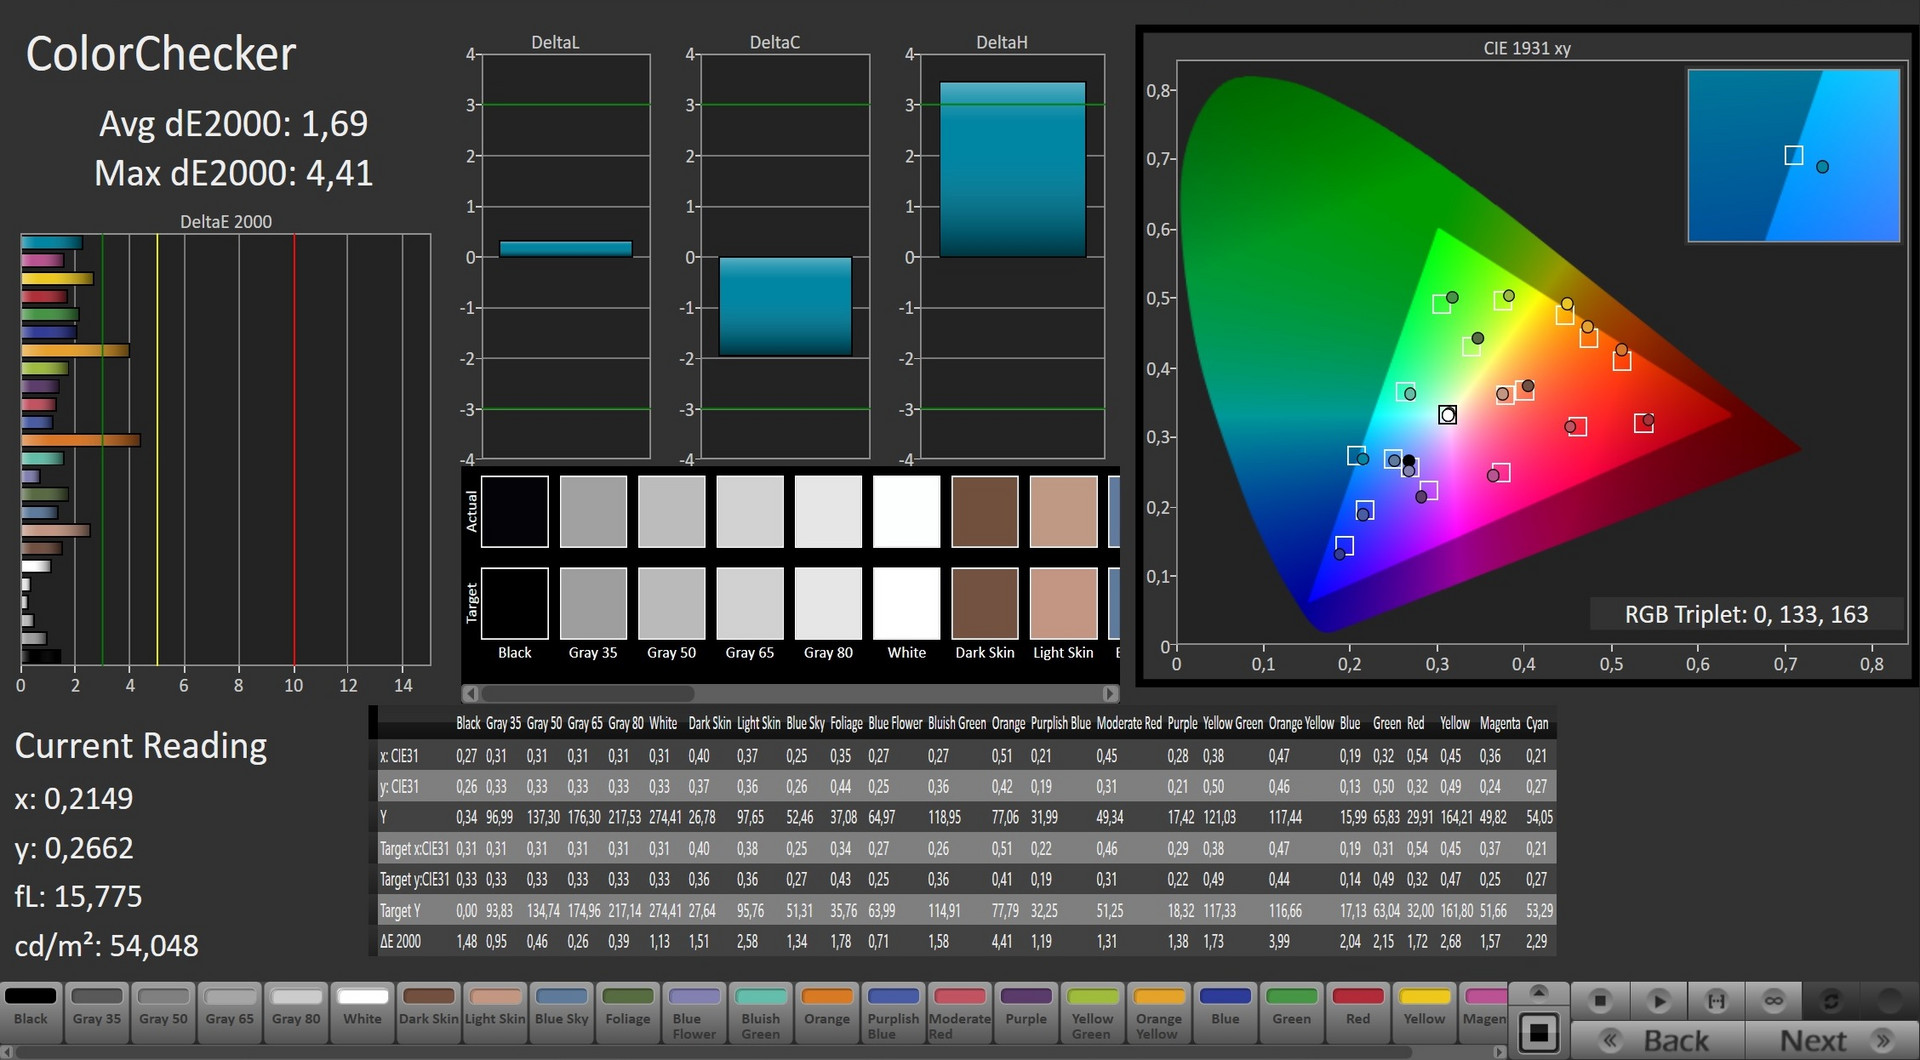
Color accuracy isn’t the laptop’s strong point, and the measured Delta-E values of between 4 and 5 (comparable to the Schenker notebook) are higher than the optimum of less than 3. Our ICC profile alleviates this shift in accuracy and the resulting blue-green tint somewhat and can, as usual, be found in the box above. All things considered, out of the box the MSI and Razer display are better suited for (semi-) professional photo editing despite their similarly low sRGB coverage.

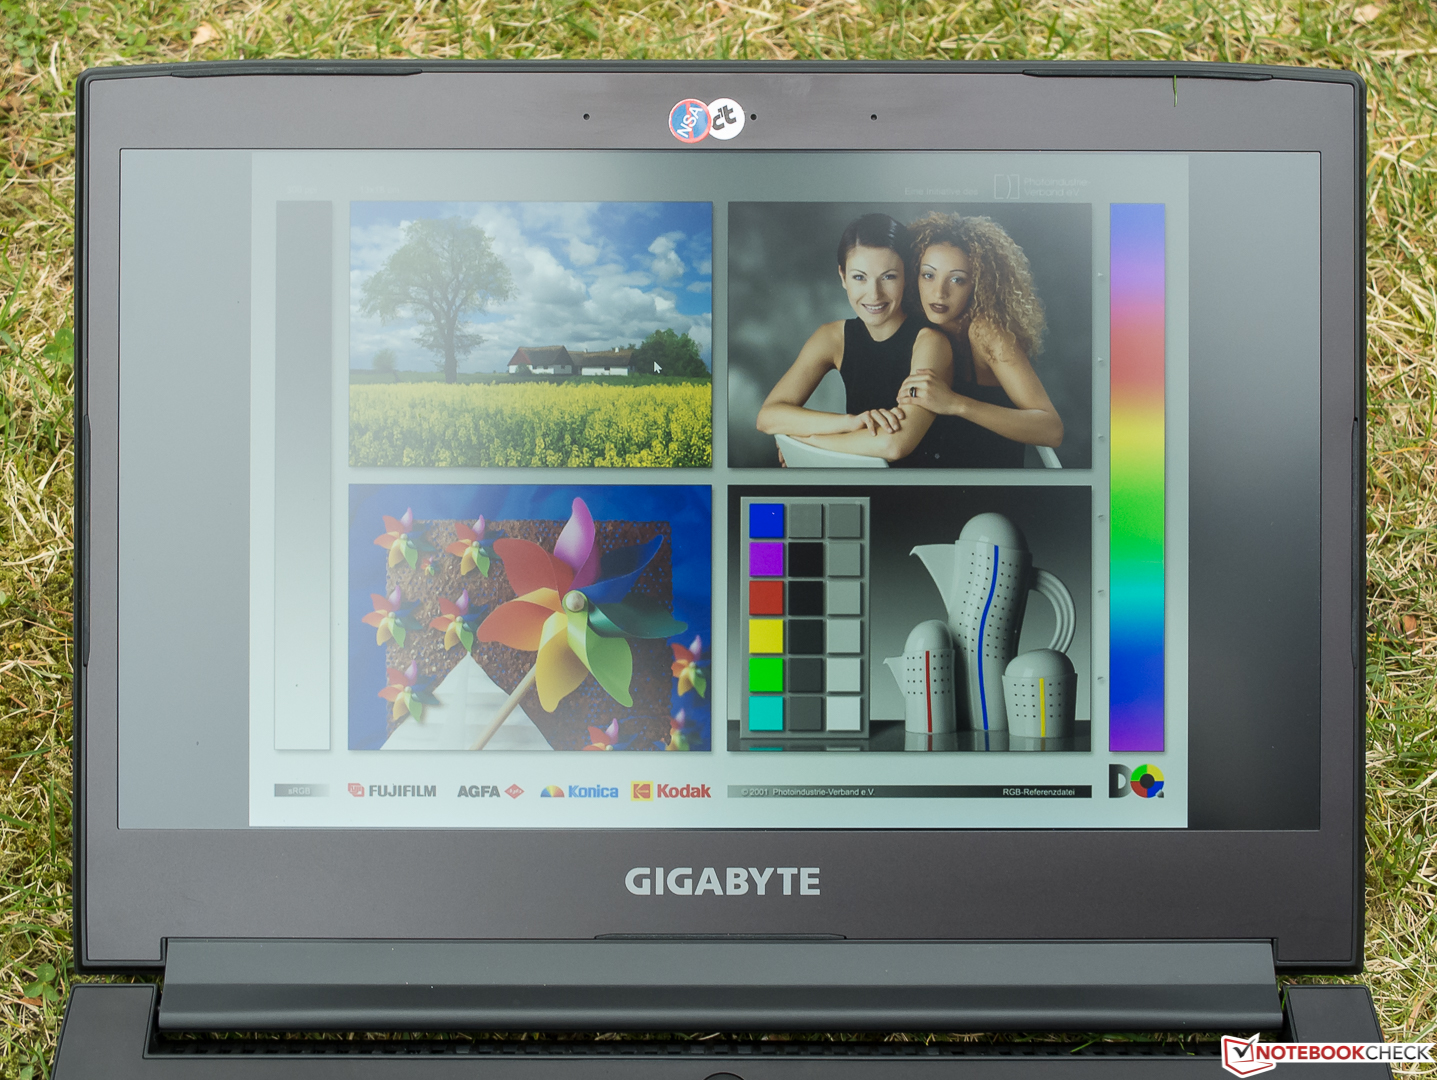
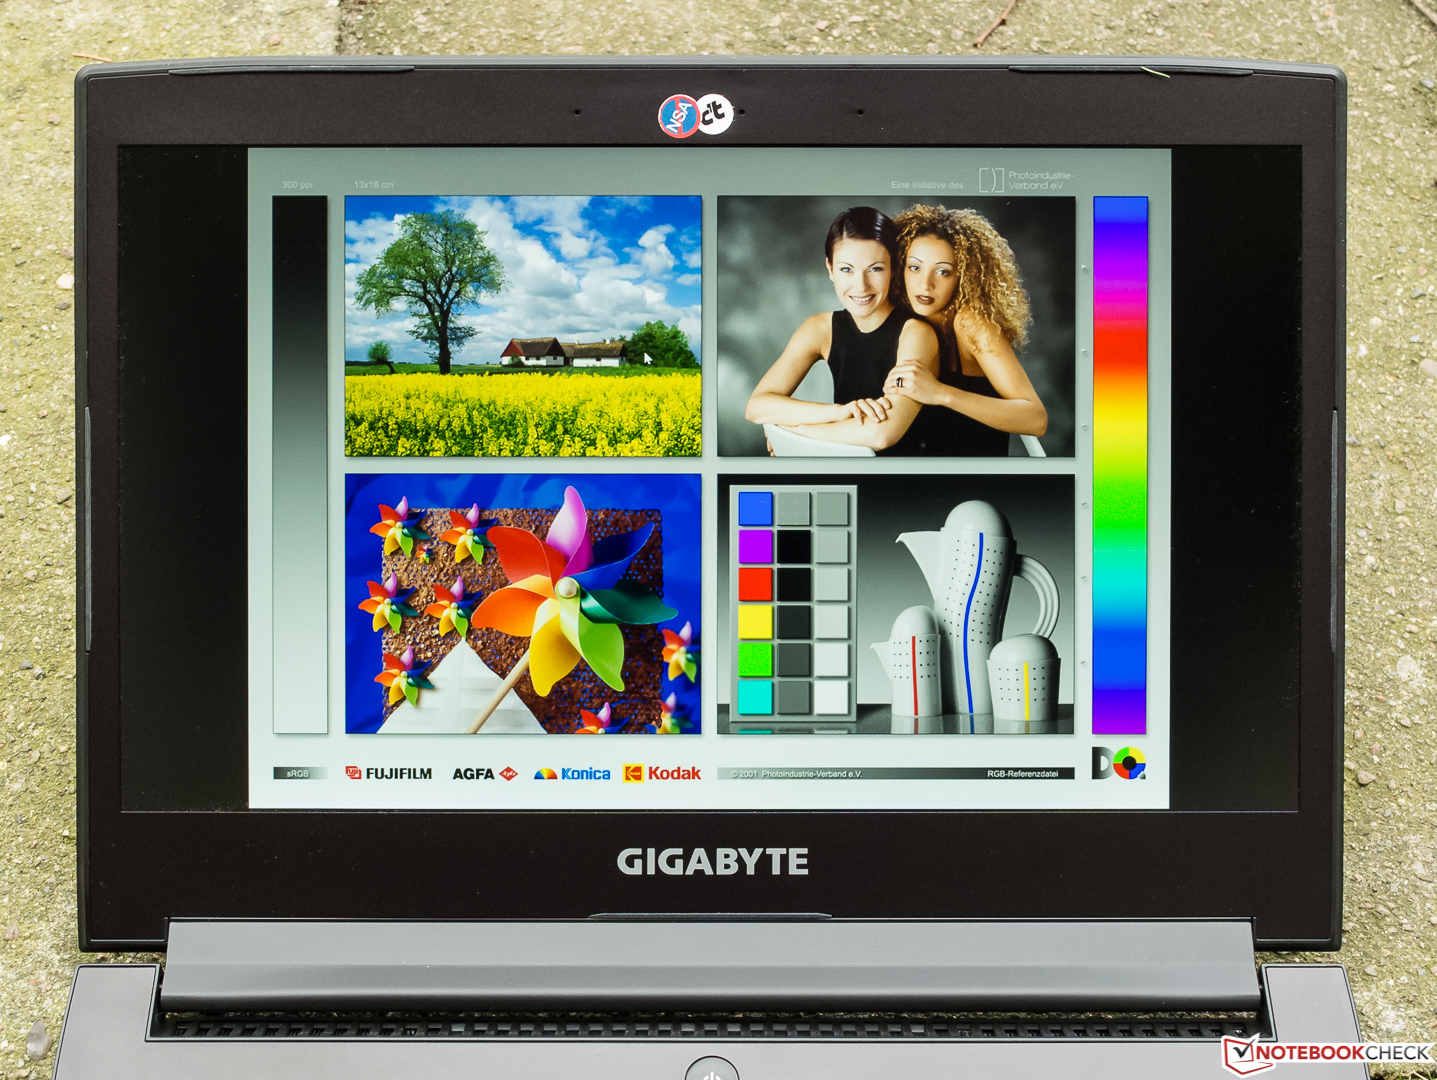
Due to overcast skies we were unable to perform our outdoor tests in direct sunlight. Tilted backwards pointing directly at the sky the display was still somewhat readable (left picture), but direct sunlight would have rendered it useless despite its matte finish. The photo on the right side was taken with a building entrance behind us and would have looked similar in bright sunlight.
Display Response Times
| ↔ Response Time Black to White | ||
|---|---|---|
| 25 ms ... rise ↗ and fall ↘ combined | ↗ 4 ms rise | 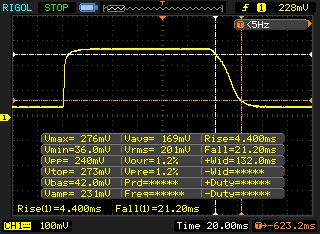 |
| ↘ 21 ms fall | ||
| The screen shows relatively slow response rates in our tests and may be too slow for gamers. In comparison, all tested devices range from 0.1 (minimum) to 240 (maximum) ms. » 53 % of all devices are better. This means that the measured response time is worse than the average of all tested devices (21.5 ms). | ||
| ↔ Response Time 50% Grey to 80% Grey | ||
| 41 ms ... rise ↗ and fall ↘ combined | ↗ 17 ms rise | 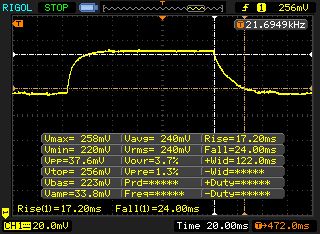 |
| ↘ 24 ms fall | ||
| The screen shows slow response rates in our tests and will be unsatisfactory for gamers. In comparison, all tested devices range from 0.2 (minimum) to 636 (maximum) ms. » 60 % of all devices are better. This means that the measured response time is worse than the average of all tested devices (33.7 ms). | ||
Screen Flickering / PWM (Pulse-Width Modulation)
| Screen flickering / PWM not detected | 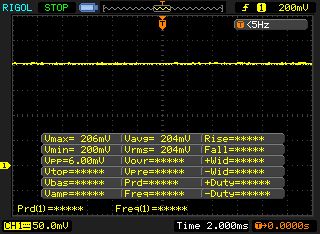 | ||
In comparison: 53 % of all tested devices do not use PWM to dim the display. If PWM was detected, an average of 17900 (minimum: 5 - maximum: 3846000) Hz was measured. | |||
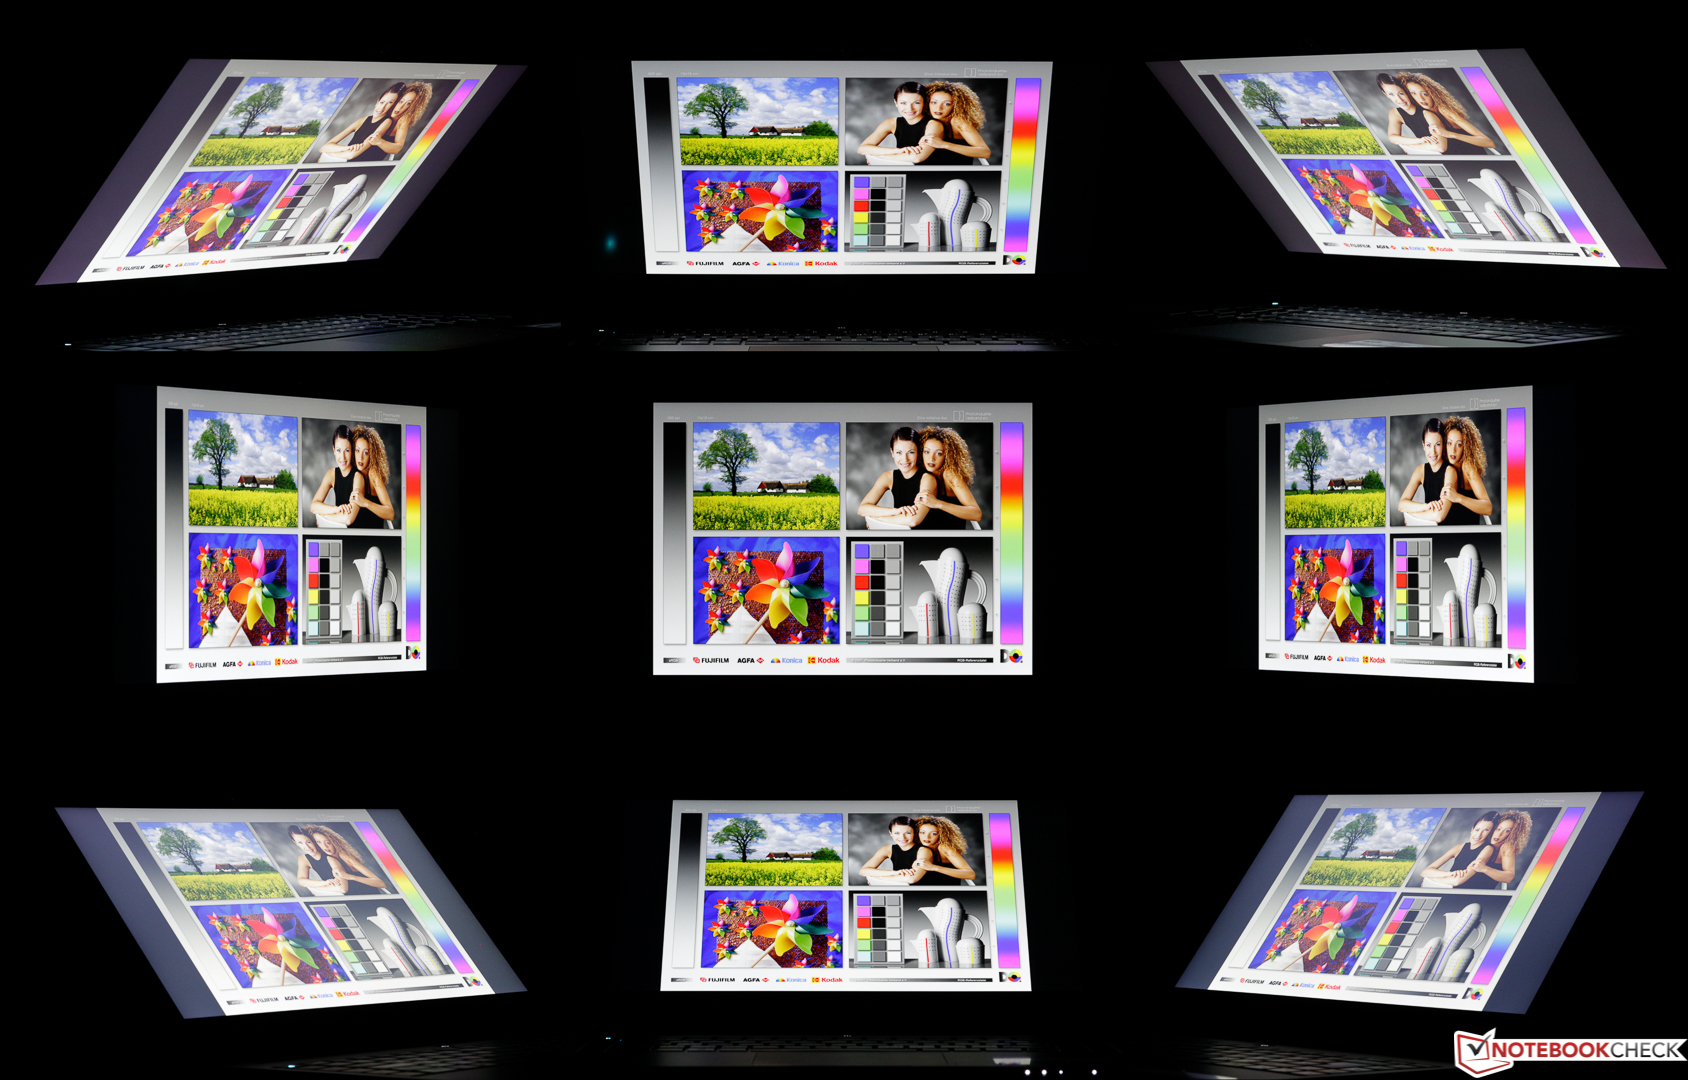
Compared to other IPS panels tested in the last few months we found the vertical viewing angles of the LG-Philips display to be superb even from extreme angles. Horizontally there is a considerable drop in brightness and contrast at around 45 degrees and higher. Colors remain unchanged, which means that overall we do consider the viewing angles to be above-average.
Performance
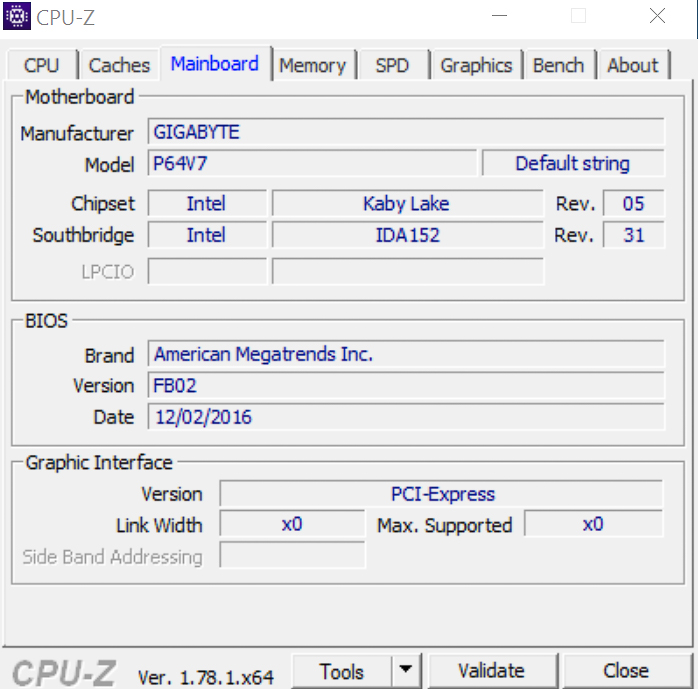
Thanks to their fast quad-core processors with Hyper-Threading, their huge amounts of memory, their extremely fast graphics cards, and their SSDs, high-end laptops such as the Gigabyte Aero 14 run most modern applications effortlessly. According to the Gigabyte website various i7-CPUs are available for the Aero 14, and so are models with Nvidia's GeForce GTX 970M and 965M. Neither of those was available at the time of writing.
Processor
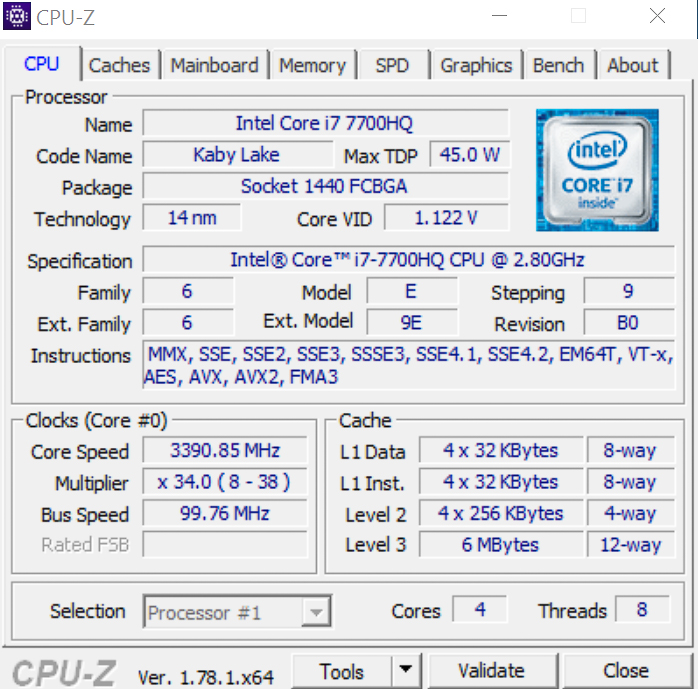
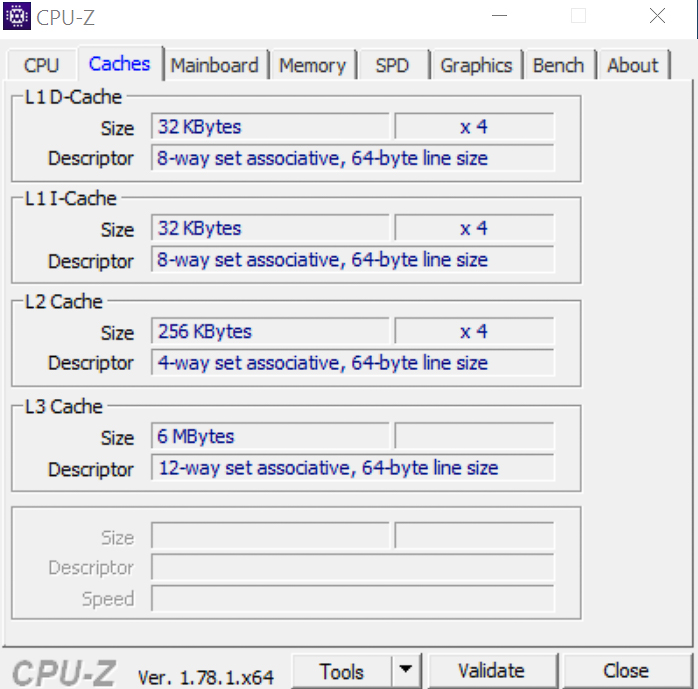
Compared to its 4x 2.6 – 3.5 GHz i7-6700HQ predecessor, Intel managed to increase the Kaby Lake quad-core i7-7700HQ (Hyper-Threading, 45 W TDP) processor’s clock speed significantly, to now 4x 2.8 – 3.8 GHz. This yields an almost 10% increase in actual performance. Even with its predecessor most high-end gaming laptops’ bottleneck was the graphics card, not the CPU. More info on the CPU and its architecture can be found in our Kaby Lake article.
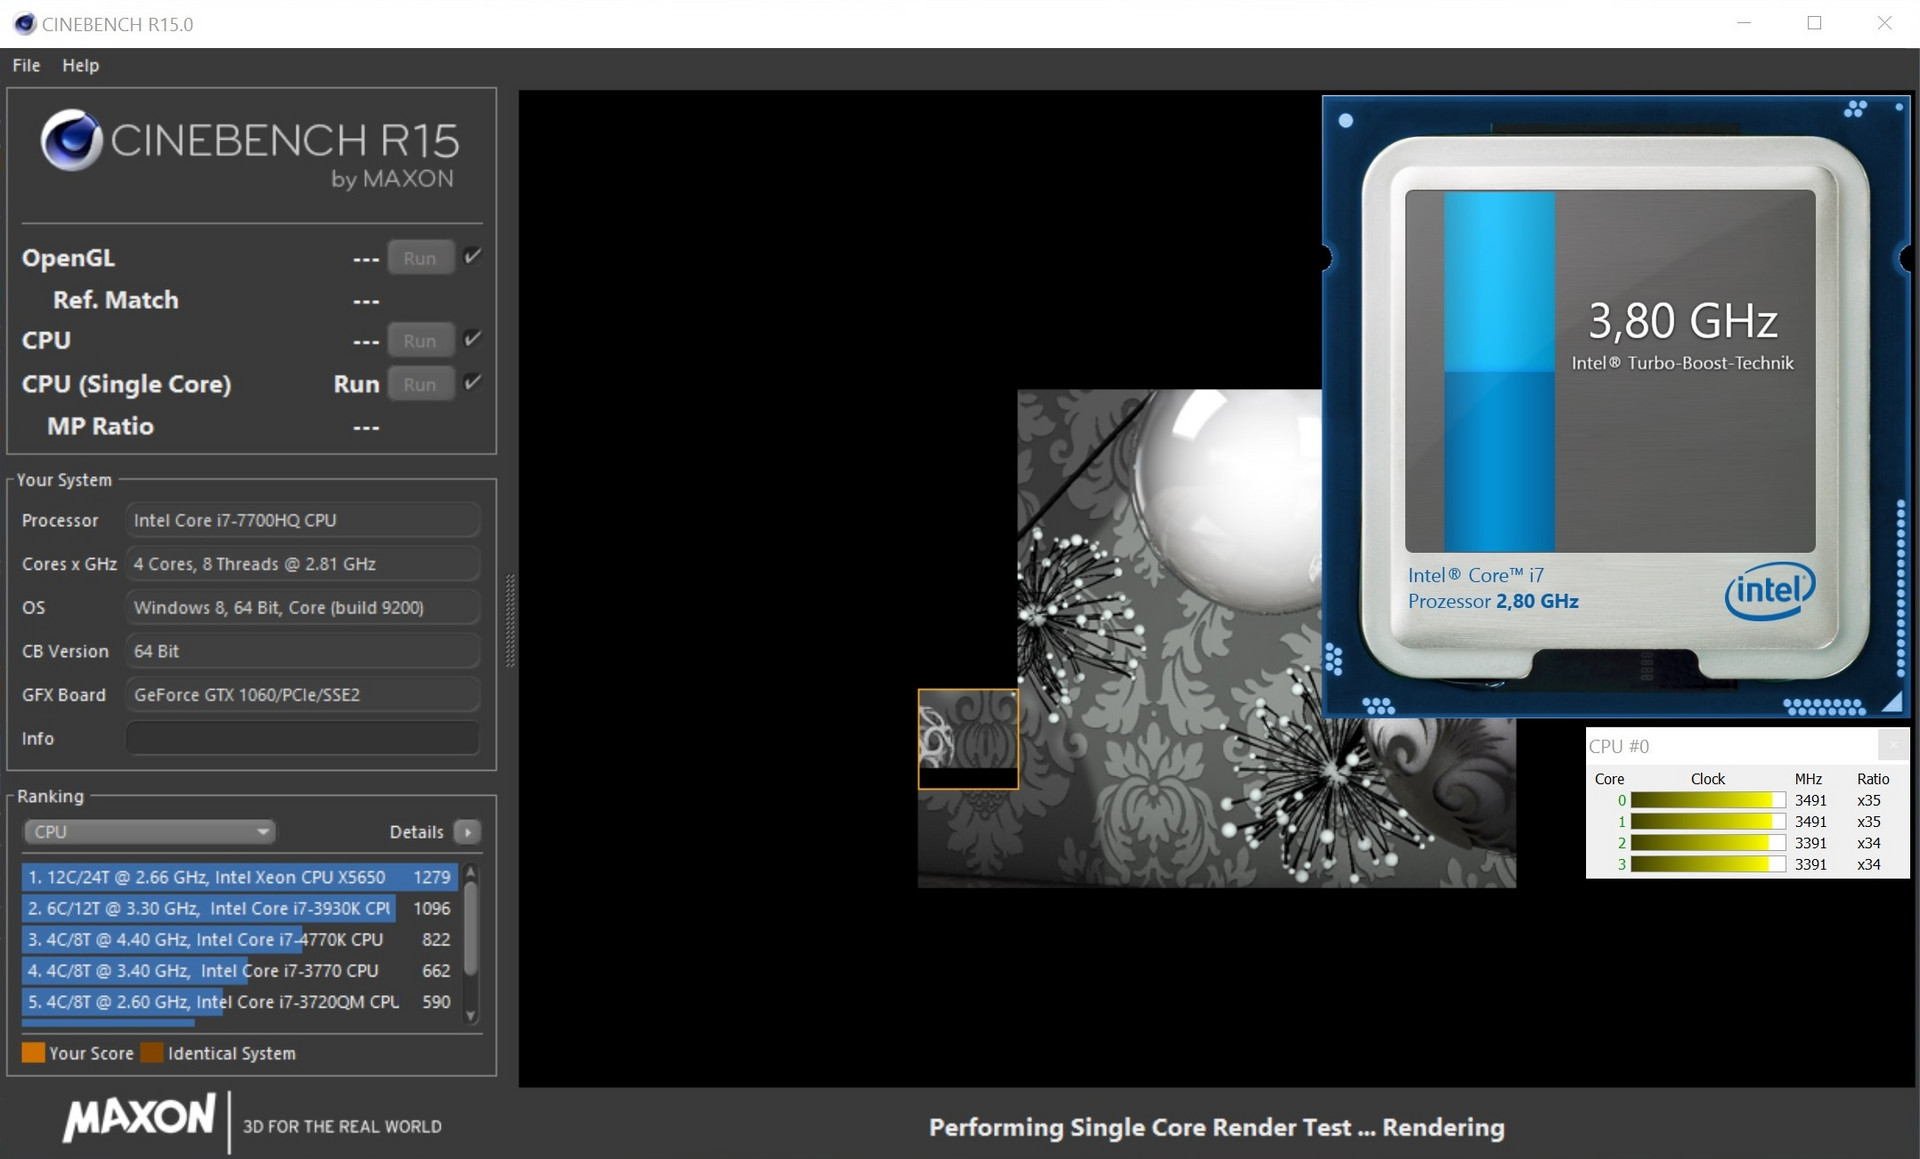
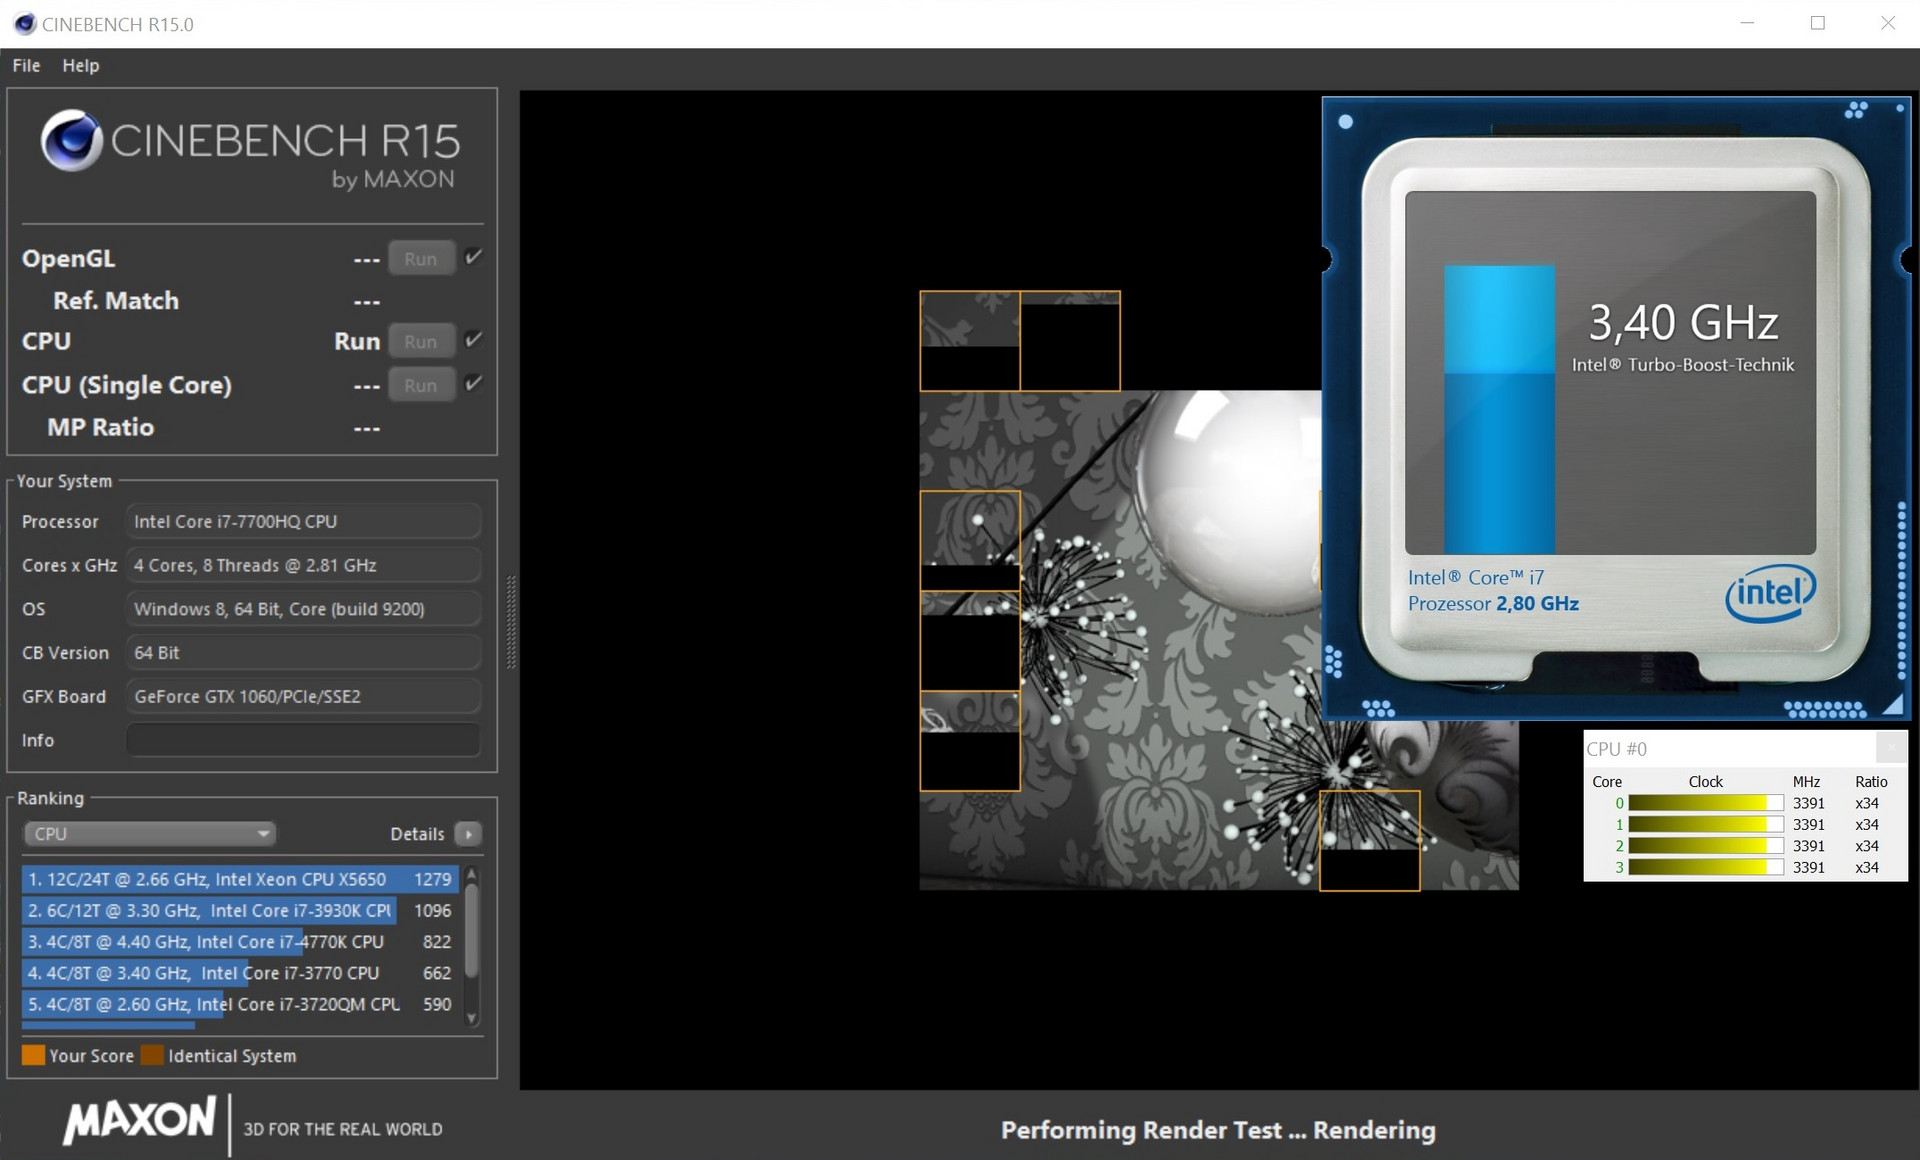
In our test group, the newer processors are a tad faster than the older ones. Performance is obviously en par compared to other laptops equipped with the same CPU. The graph above shows the results of 30 minutes of Cinebench R15, and as you can see they are very consistent and indicate a proper and steady use of the processor’s turbo boost frequency. On battery, the results were slightly lower at 661 points.
| Cinebench R15 | |
| CPU Single 64Bit | |
| Gigabyte Aero 14 | |
| SCHENKER XMG P407 | |
| Razer Blade (2016) | |
| MSI GS43VR 6RE-006US | |
| CPU Multi 64Bit | |
| SCHENKER XMG P407 | |
| Gigabyte Aero 14 | |
| MSI GS43VR 6RE-006US | |
| Razer Blade (2016) | |
System Performance
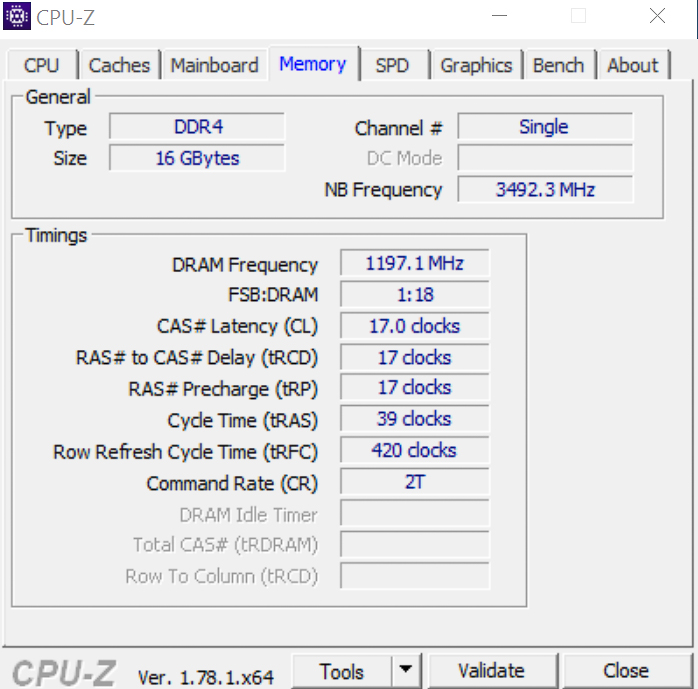
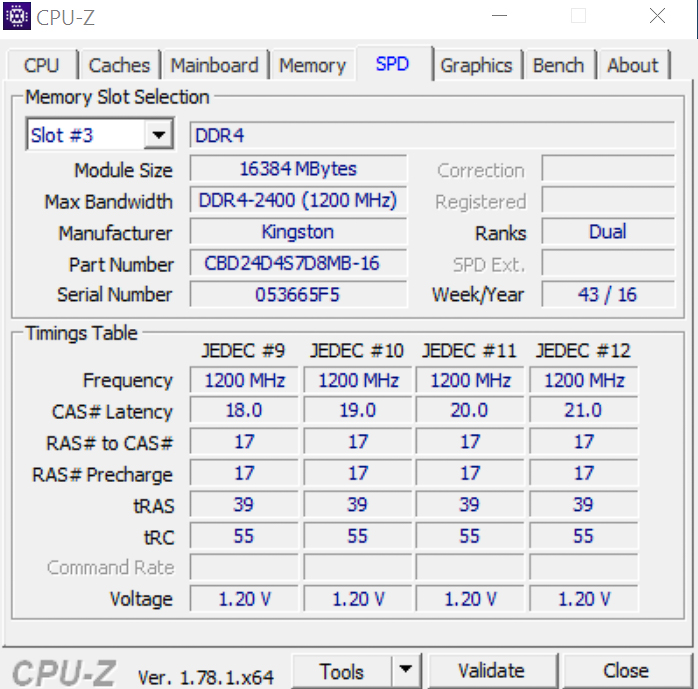
The fact that the device is trailing behind somewhat in PCMark 8 can be attributed to its single-channel memory configuration since neither CPU nor GPU nor SSD can have caused the dip in performance compared to the MSI and the Schenker notebooks. The Razer Blade comes in last in this test, which, however, has been addressed by Razer with an EC fix after we ran our tests.
Subjectively, this deficit does not show, and thanks to instantaneous application start times and fast boot times the laptop feels snappy and very responsive at all times.
| PCMark 8 | |
| Home Score Accelerated v2 | |
| SCHENKER XMG P407 | |
| MSI GS43VR 6RE-006US | |
| Gigabyte Aero 14 | |
| Razer Blade (2016) | |
| Work Score Accelerated v2 | |
| SCHENKER XMG P407 | |
| MSI GS43VR 6RE-006US | |
| Gigabyte Aero 14 | |
| Razer Blade (2016) | |
| PCMark 8 Home Score Accelerated v2 | 3717 points | |
| PCMark 8 Work Score Accelerated v2 | 4702 points | |
Help | ||
Storage Devices
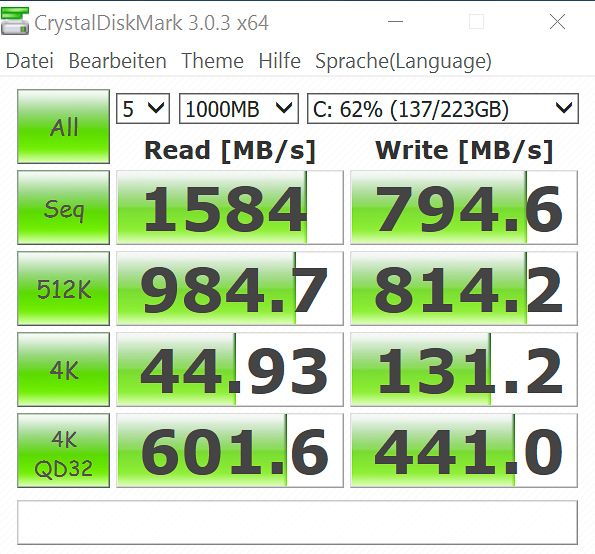
Since AS SSD once again fails to deliver we’ve decided to focus on CrystalDiskMark 3.0 instead. With the MSI GS43VR’s SanDisk SSD delivering a performance that might have awed us five years ago, the Gigabyte’s 256 GB Liteon NVMe SSD is at eye level with the Samsung SM961-equipped Schenker XMG P407. Sequential read speeds are important for loading large games into memory. For starting applications and boot times in general random 4K read performance is much more important, and the Aero 14’s 45 MB/s isn't half bad. Write performance – where Samsung’s SM961 shines – is usually less important.
| Gigabyte Aero 14 LiteOn CX2-8B256 | MSI GS43VR 6RE-006US SanDisk SD8SN8U1T001122 | SCHENKER XMG P407 Samsung SM961 MZVPW256 m.2 PCI-e | Razer Blade (2016) Samsung PM951 NVMe MZVLV512 | |
|---|---|---|---|---|
| CrystalDiskMark 3.0 | -68% | 19% | -12% | |
| Read Seq | 1584 | 335.3 -79% | 1345 -15% | 1296 -18% |
| Write Seq | 795 | 299 -62% | 1502 89% | 603 -24% |
| Read 512 | 985 | 223 -77% | 320.3 -67% | 655 -34% |
| Write 512 | 814 | 246.7 -70% | 1276 57% | 604 -26% |
| Read 4k | 44.93 | 17.68 -61% | 58.9 31% | 42.22 -6% |
| Write 4k | 131.2 | 35.31 -73% | 171 30% | 139.6 6% |
| Read 4k QD32 | 602 | 247.4 -59% | 625 4% | 573 -5% |
| Write 4k QD32 | 441 | 156.3 -65% | 539 22% | 480 9% |

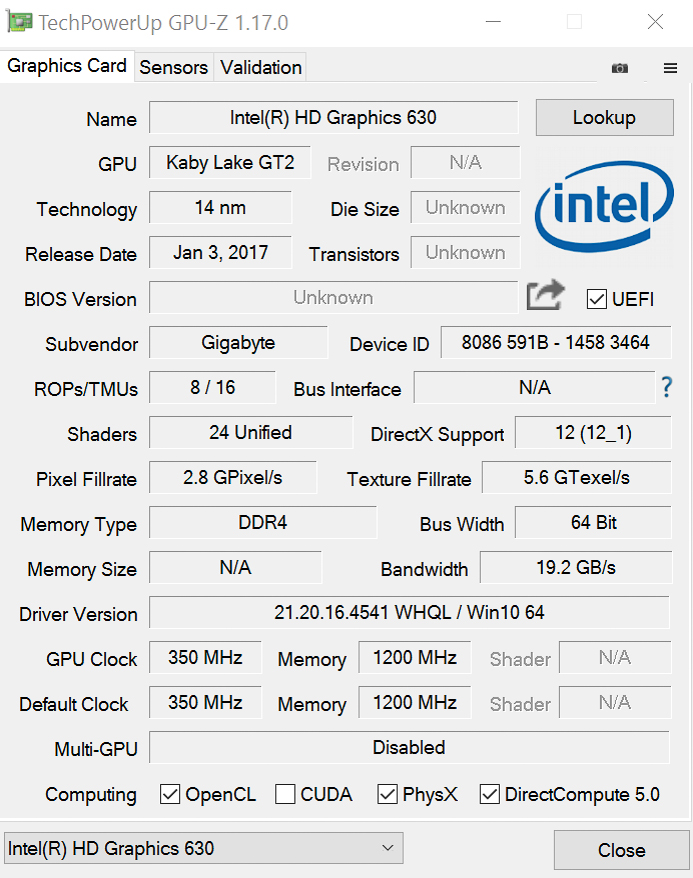
Graphics Card
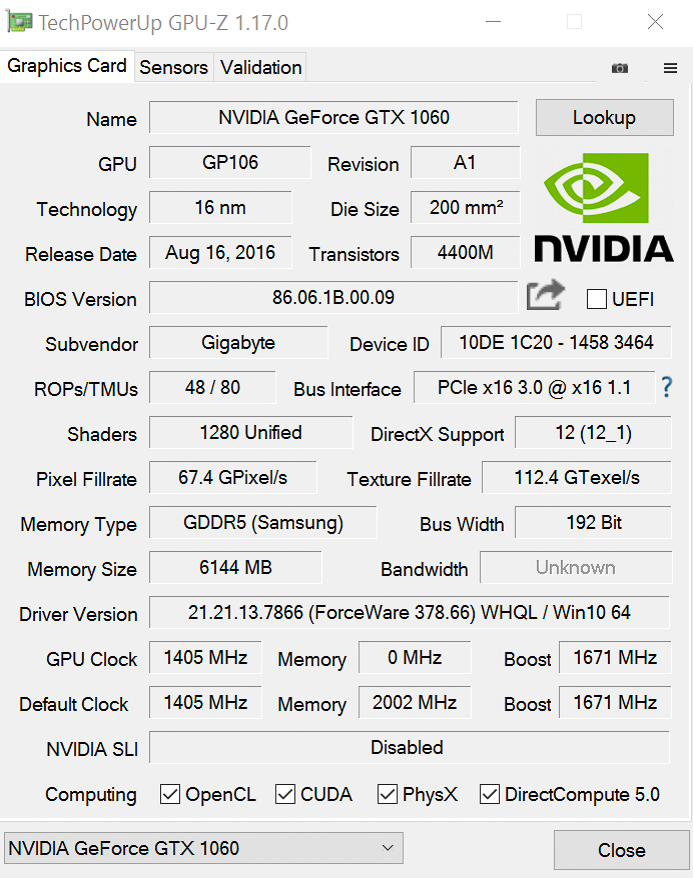
The GTX 1060 (GP106) is currently Nvidia’s slowest high-end GPU, accompanied by the faster GTX 1070 and GTX 1080 (both GP104) GPUs, respectively. However, it is also the only Pascal GPU that can be fitted into a 14-inch laptop without turning it into a mobile oven. The faster GP104 GPUs are commonly only found in much larger 15 and 17-inch laptops, such as the Asus GL502VS. Its 6 GB of 192-bit bandwidth VRAM running at effectively 8,000 MHz should suffice for ever growing memory requirements of modern games. You are much more likely to run out of processing power than video memory. Besides improved H.265 en- and decoding capabilities (PlayReady 3.0) the graphics card also offers modern HDMI 2.0b and DisplayPort 1.4 ports.
Gigabyte keeps the GPU running at between 1,405 and a turbo-boosted 1,671 MHz, and graphics performance is very decent. It scores only 3% less than other GTX 1060 GPUs in 3DMark 2013’s Fire Strike benchmark and only 5% less in 3DMark 11. As expected, the older Cloud Gate benchmark has problems once more and scores even worse than the Schenker’s much less capable GTX 1050 Ti. Thus, we don’t read too much into it.
| 3DMark - 1920x1080 Fire Strike Graphics | |
| MSI GS43VR 6RE-006US | |
| Gigabyte Aero 14 | |
| Razer Blade (2016) | |
| SCHENKER XMG P407 | |
| 3DMark 11 - 1280x720 Performance GPU | |
| MSI GS43VR 6RE-006US | |
| Gigabyte Aero 14 | |
| Razer Blade (2016) | |
| SCHENKER XMG P407 | |
| 3DMark 11 Performance | 11868 points | |
| 3DMark Cloud Gate Standard Score | 20574 points | |
| 3DMark Fire Strike Score | 9778 points | |
Help | ||
Gaming Performance
Not many games are capable of bringing a GTX 1060 GPU to its knees at Full HD with maximum details and improvement algorithms such as anti-aliasing enabled just yet. The inefficient Anno 2205 or XCOM 2 come to mind, but even those ran at more than sufficient 30 – 40 frames per second. It’s not unlikely that a few years from now games of the future will require details to be reduced to medium settings. The WQHD display’s native 2560x1440 resolution is already the crux of the matter in some games, and a native Full HD panel would have suited the system much better. 4K is limited to the higher end GTX 1070 and GTX 1080 models.
We’ve replaced our rather unrealistic stress test with a The Witcher 3 frame-rate test, and we kept the game running for a full hour on ultra-high settings (see how we test). The fluctuation is a moderate 3 frames per second, and the average frame rate never drops by more than 1 - 2 frames per second. Gaming can thus be enjoyed over long periods of time, and The Witcher 3 still produces a respectable 31 frames per second and thus 81% of its peak performance when run on battery.
| The Witcher 3 - 1920x1080 Ultra Graphics & Postprocessing (HBAO+) | |
| Gigabyte Aero 14 | |
| Razer Blade (2016) | |
| low | med. | high | ultra | |
| The Witcher 3 (2015) | 38.3 | |||
| Anno 2205 (2015) | 77.5 | 29 | ||
| The Division (2016) | 46.9 | 37.8 | ||
| For Honor (2017) | 56 () | 42 () | ||
| Ghost Recon Wildlands (2017) | 66.2 | 60.1 | 35.7 |
Emissions
System Noise
For the purpose of our noise, temperature, and power consumption tests we’ve set the fan tweak mode to “Normal” in Smart Manager.
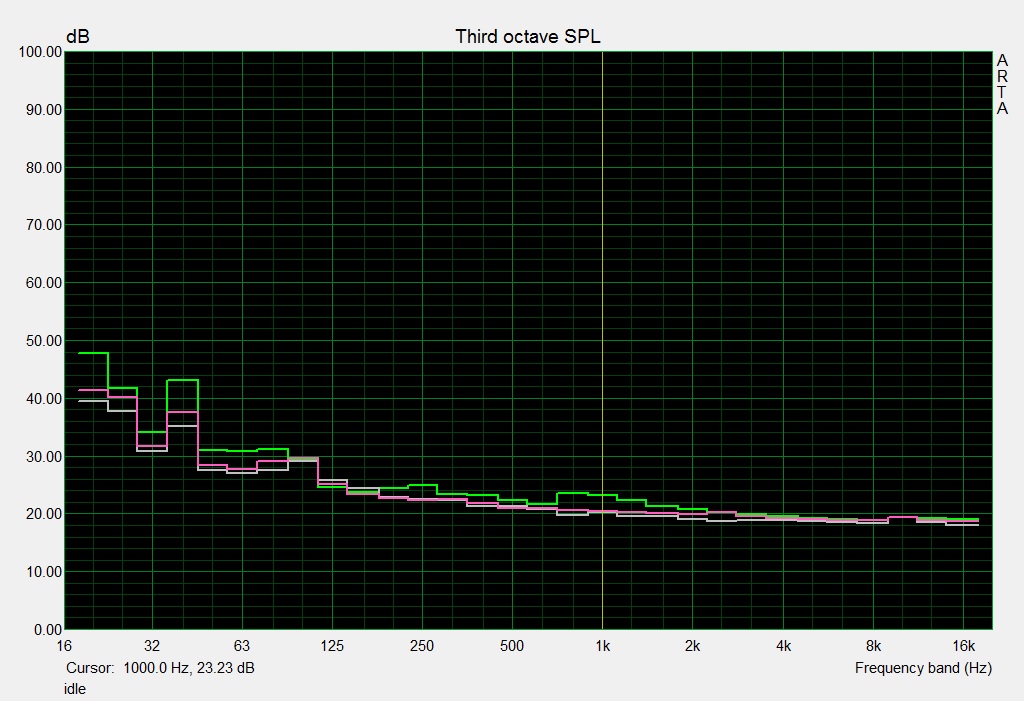
When idle the Aero’s fan is always running but barely audible when sitting in front of the laptop. The same can be said for browsing the web and causing occasional high load peaks. When running our Kraken 1.1 browser benchmark the fans did rev up every now and then but remained quiet overall so they never really bothered us. Suffice it to say that we expect the laptop to be very quiet when running less-demanding applications.
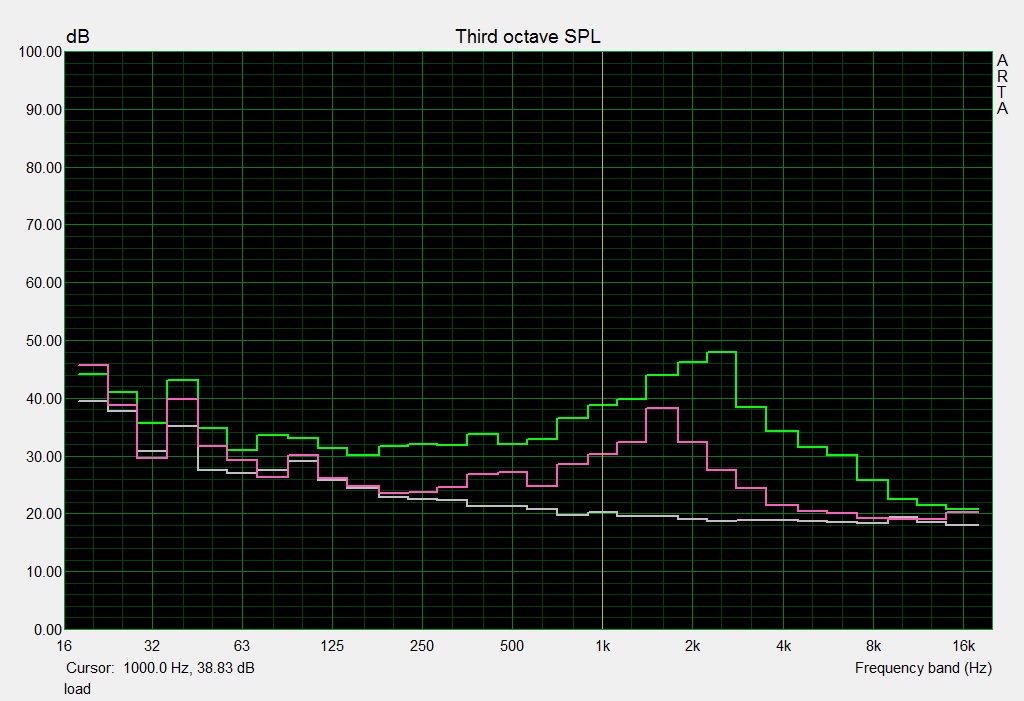
Maximum load, caused by running Prime95 and Furmark simultaneously, is a whole different story and the fans ramps up almost instantaneously. Once on full speed they are clearly noticeable even from 5 m / 15 ft away. We found the fan noise when playing games less irritating than the very annoying whining they emitted at medium revs. Some users may find this irritating enough to resort to using headphones, which we recommend anyway.
Noise Level
| Idle |
| 31 / 32 / 33 dB(A) |
| Load |
| 42 / 53 dB(A) |
 | ||
30 dB silent 40 dB(A) audible 50 dB(A) loud |
||
min: | ||
Temperature
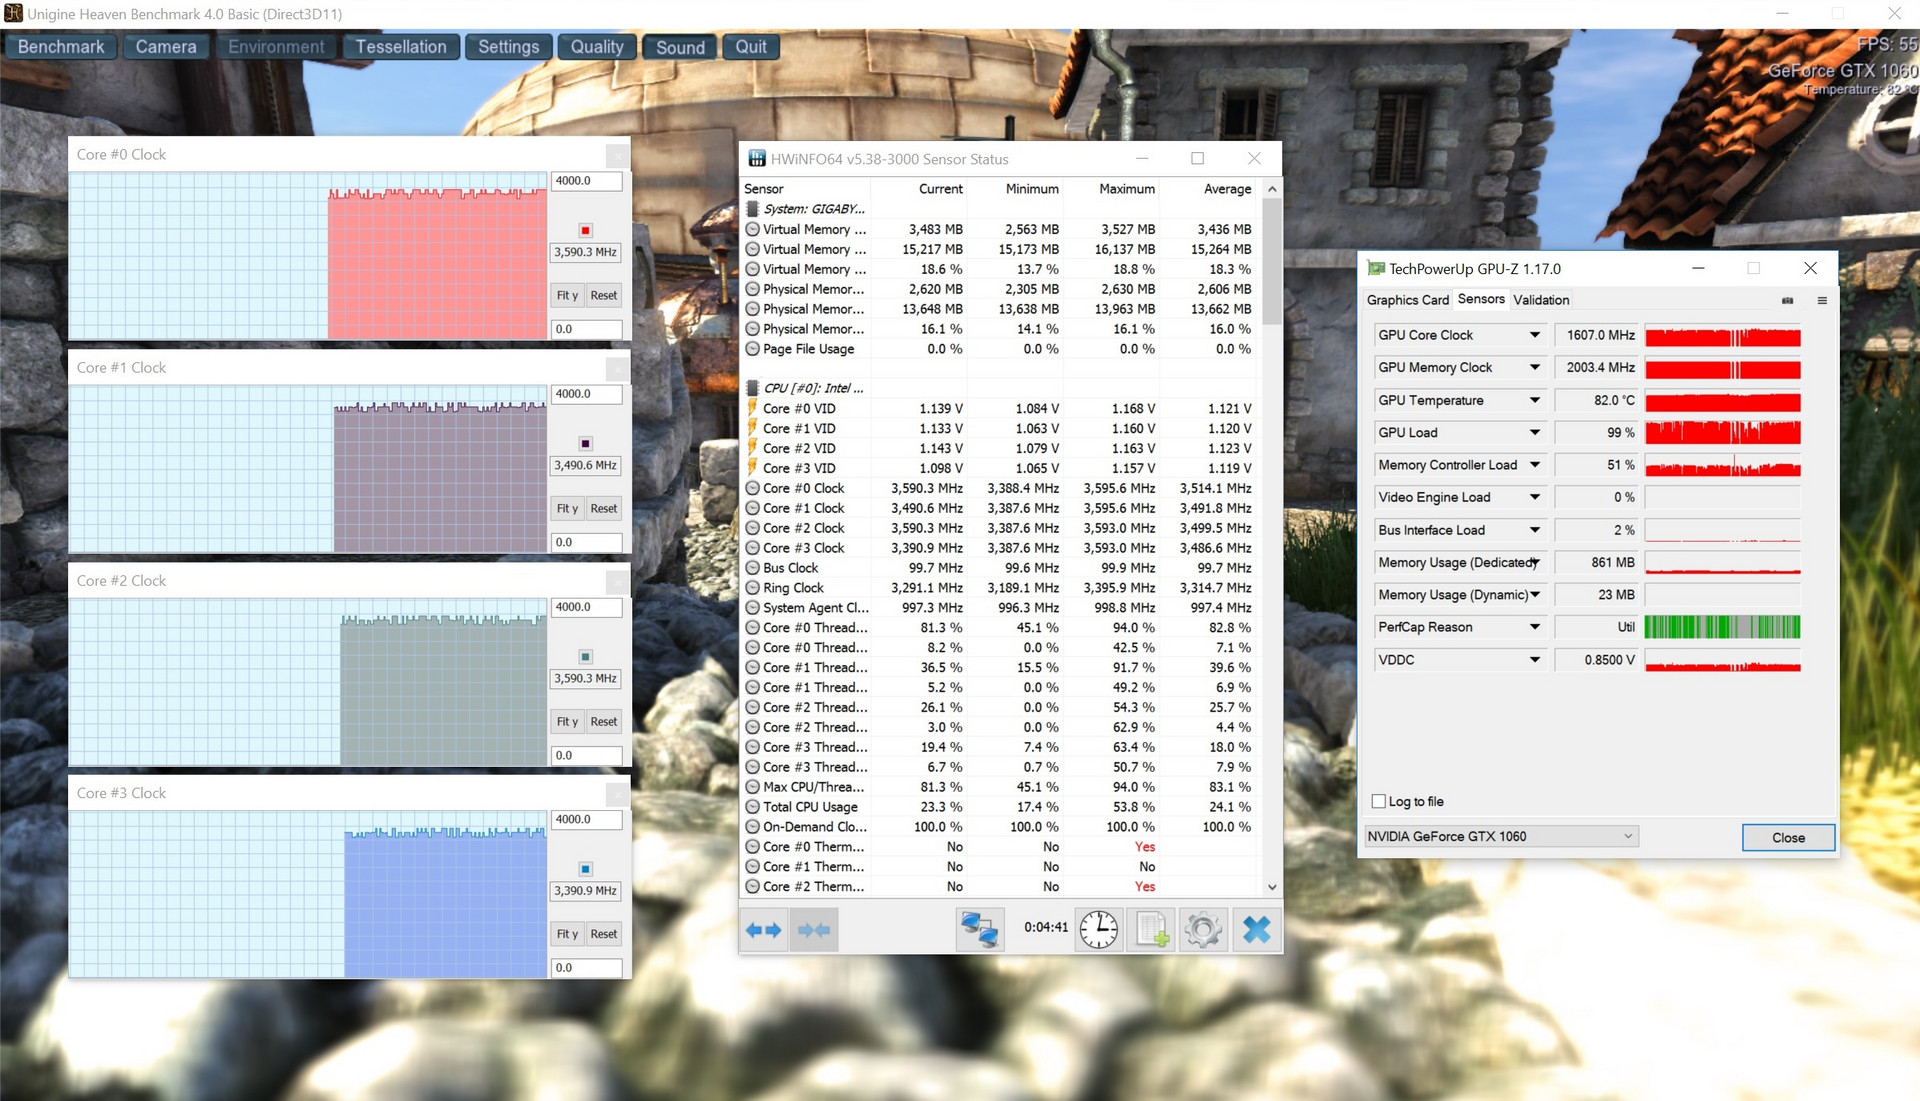
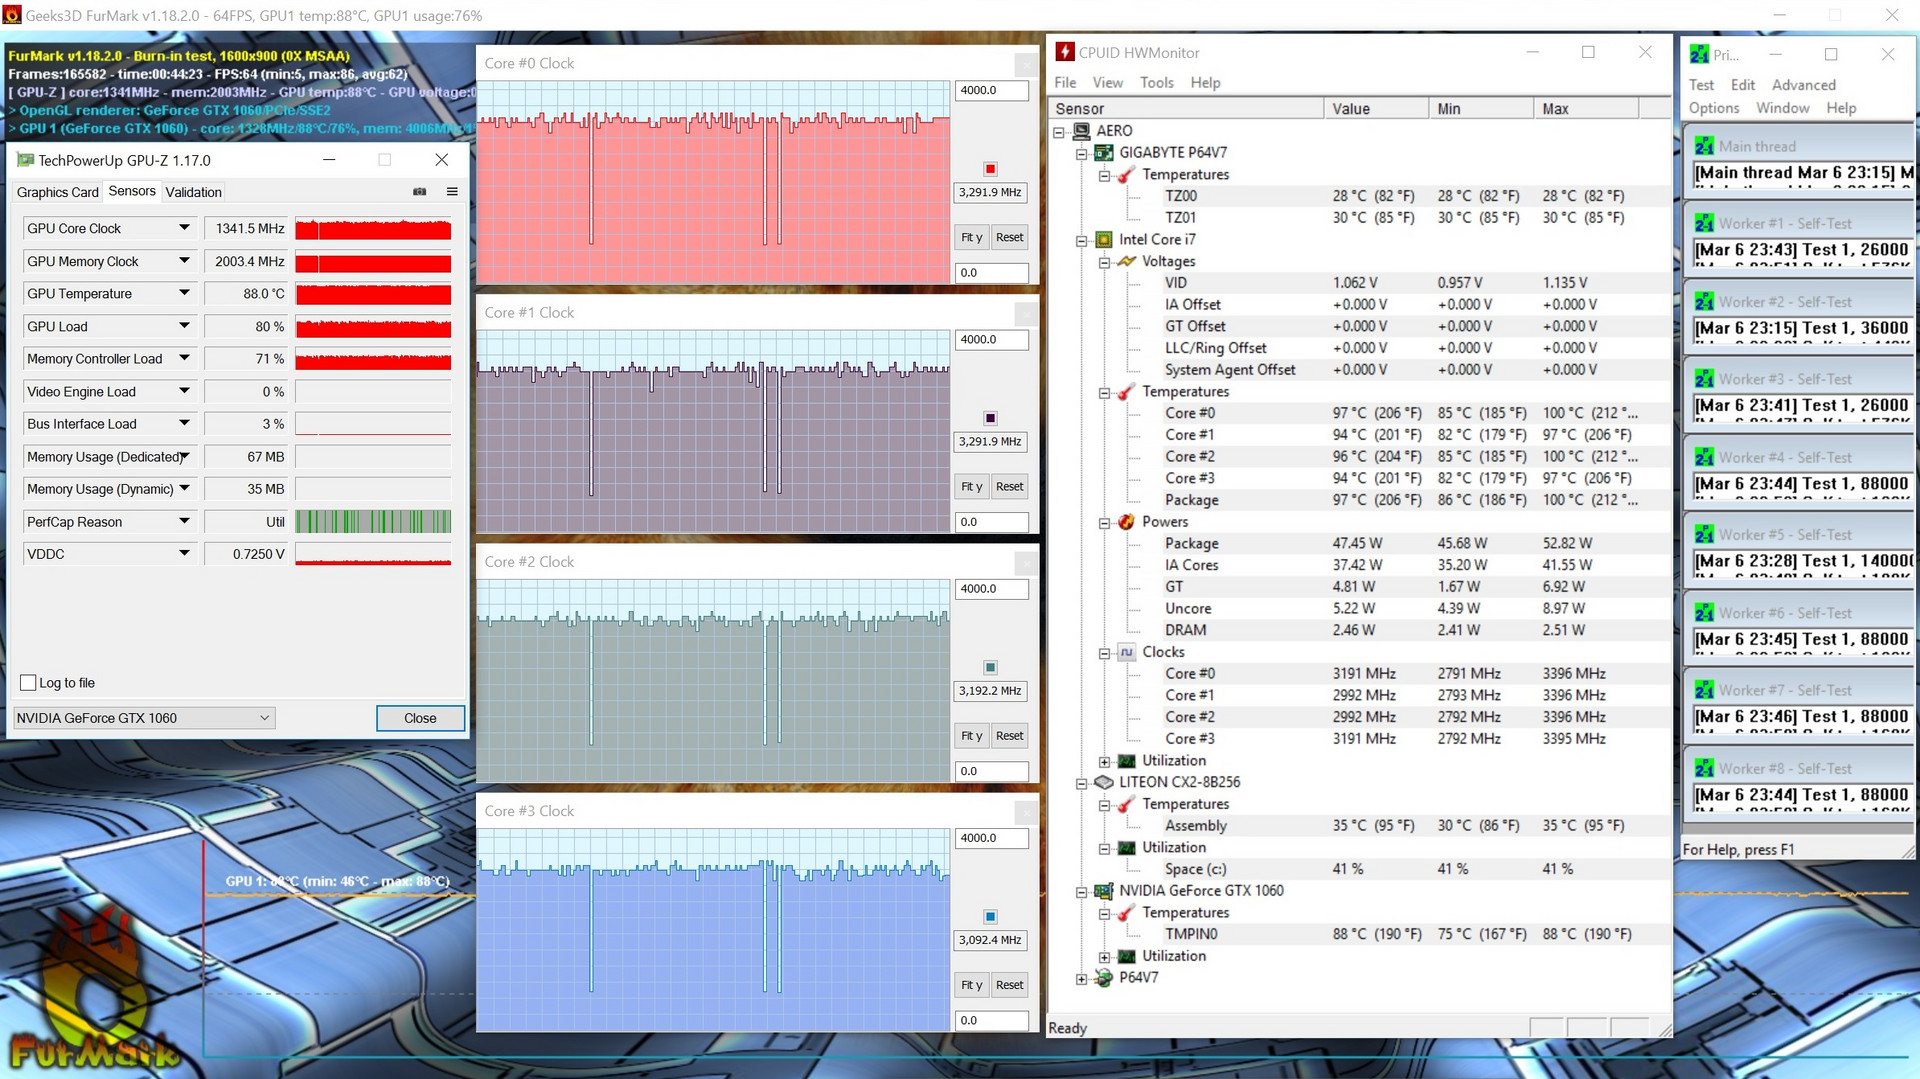
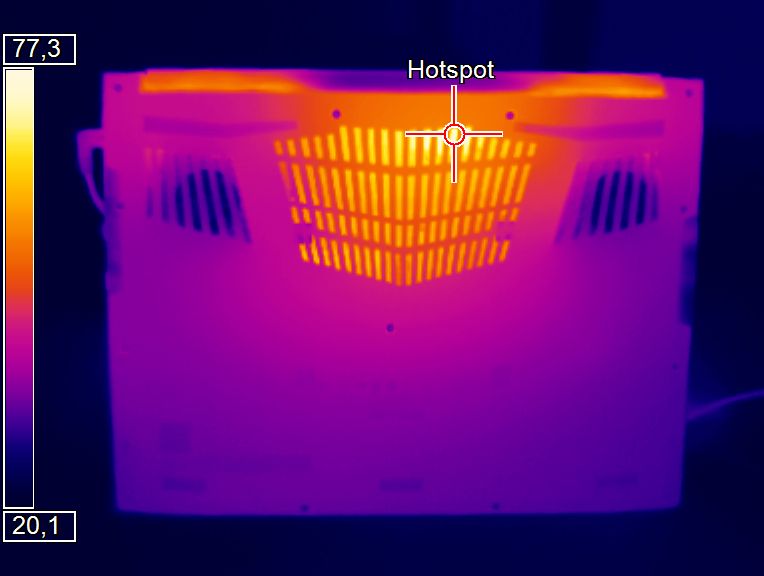
Idle temperatures were only slightly above ambient temperatures. Running games heats up the bottom side to the point where it reached upwards of 54 °C / 130 F, effectively preventing you from using the laptop on your lap while playing games. The palm rest remained cool enough and almost never reached body temperature levels. The screenshot below shows CPU frequency as well as CPU and GPU temperatures.
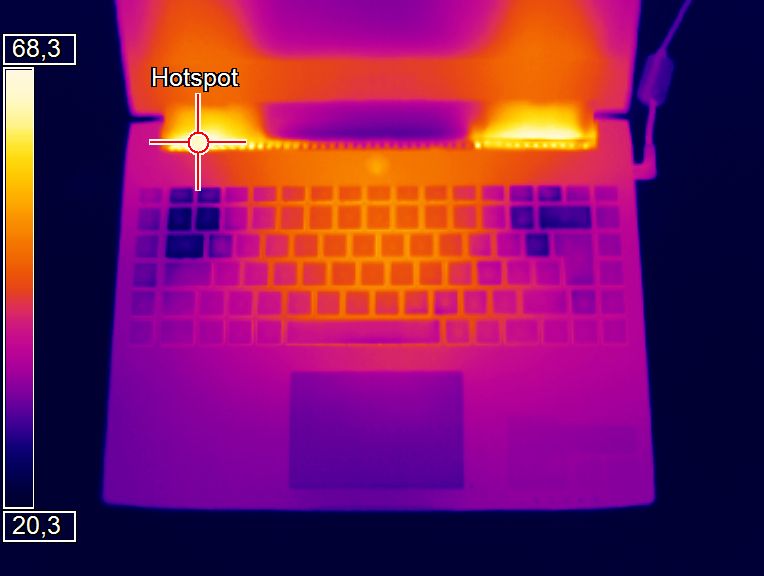
(-) The maximum temperature on the upper side is 58.3 °C / 137 F, compared to the average of 36.9 °C / 98 F, ranging from 21.1 to 71 °C for the class Multimedia.
(-) The bottom heats up to a maximum of 59.8 °C / 140 F, compared to the average of 39.1 °C / 102 F
(+) In idle usage, the average temperature for the upper side is 22.9 °C / 73 F, compared to the device average of 31.2 °C / 88 F.
(-) Playing The Witcher 3, the average temperature for the upper side is 40.7 °C / 105 F, compared to the device average of 31.2 °C / 88 F.
(+) The palmrests and touchpad are reaching skin temperature as a maximum (34.5 °C / 94.1 F) and are therefore not hot.
(-) The average temperature of the palmrest area of similar devices was 28.8 °C / 83.8 F (-5.7 °C / -10.3 F).
Speakers
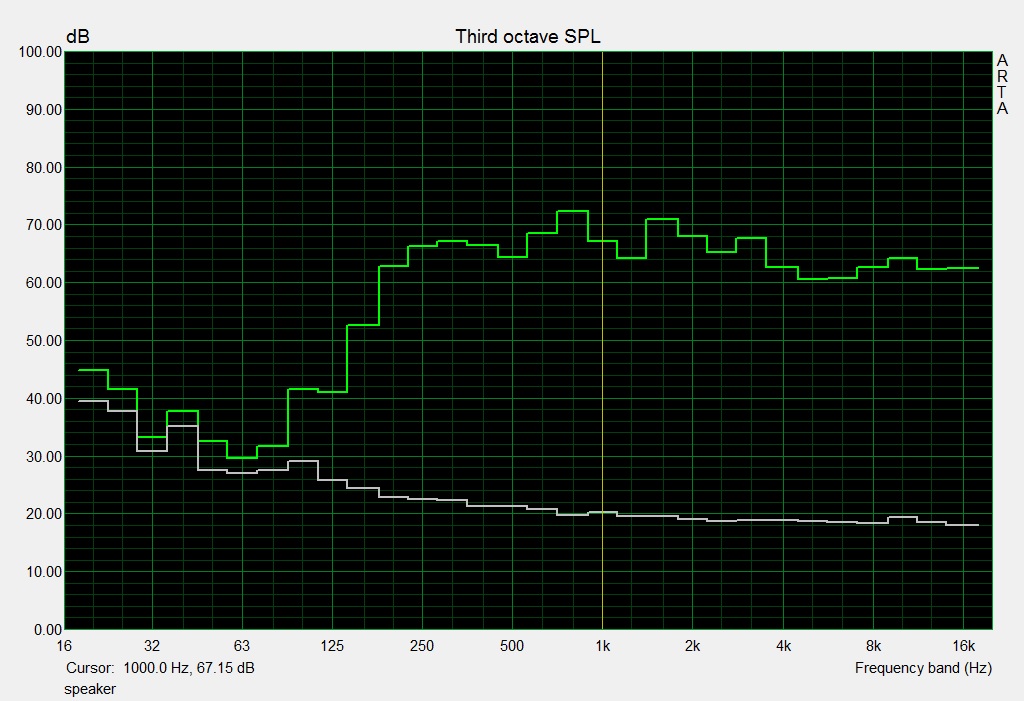
The Aero’s Dolby sound system is only loud enough to fill a medium-sized room with sound at maximum volume. Even so it already distorts system sounds at that level, which isn’t particularly uncommon. Mids and highs are too pronounced when playing music and the overall sound is a bit tinny as well, albeit a certain degree of dynamic range and ambience is detectable. Distortion is a problem here as well, but at least the sound is neither shrill nor erratic. Metal music with its constant highs is a serious challenge to the speakers, and the instruments end up sounding very mushy and soft. All-in-all, sound quality is okay for a notebook, but for an acoustically engaging gaming experience we highly recommend using headphones.
Gigabyte Aero 14 audio analysis
(±) | speaker loudness is average but good (79 dB)
Bass 100 - 315 Hz
(±) | reduced bass - on average 10.6% lower than median
(±) | linearity of bass is average (13.7% delta to prev. frequency)
Mids 400 - 2000 Hz
(+) | balanced mids - only 3.6% away from median
(±) | linearity of mids is average (8% delta to prev. frequency)
Highs 2 - 16 kHz
(+) | balanced highs - only 2.1% away from median
(+) | highs are linear (5.1% delta to prev. frequency)
Overall 100 - 16.000 Hz
(+) | overall sound is linear (12.8% difference to median)
Compared to same class
» 17% of all tested devices in this class were better, 5% similar, 78% worse
» The best had a delta of 5%, average was 18%, worst was 45%
Compared to all devices tested
» 9% of all tested devices were better, 2% similar, 89% worse
» The best had a delta of 4%, average was 25%, worst was 134%
Razer Blade (2016) audio analysis
(±) | speaker loudness is average but good (79 dB)
Bass 100 - 315 Hz
(±) | reduced bass - on average 8.4% lower than median
(±) | linearity of bass is average (11.2% delta to prev. frequency)
Mids 400 - 2000 Hz
(+) | balanced mids - only 4.6% away from median
(+) | mids are linear (4.3% delta to prev. frequency)
Highs 2 - 16 kHz
(+) | balanced highs - only 4.3% away from median
(+) | highs are linear (5.5% delta to prev. frequency)
Overall 100 - 16.000 Hz
(±) | linearity of overall sound is average (17.1% difference to median)
Compared to same class
» 43% of all tested devices in this class were better, 12% similar, 45% worse
» The best had a delta of 6%, average was 18%, worst was 132%
Compared to all devices tested
» 26% of all tested devices were better, 8% similar, 66% worse
» The best had a delta of 4%, average was 25%, worst was 134%
MSI GS43VR 6RE-006US audio analysis
(±) | speaker loudness is average but good (76.7 dB)
Bass 100 - 315 Hz
(-) | nearly no bass - on average 17.5% lower than median
(±) | linearity of bass is average (12% delta to prev. frequency)
Mids 400 - 2000 Hz
(+) | balanced mids - only 3.9% away from median
(±) | linearity of mids is average (9.5% delta to prev. frequency)
Highs 2 - 16 kHz
(±) | higher highs - on average 6.4% higher than median
(±) | linearity of highs is average (8.5% delta to prev. frequency)
Overall 100 - 16.000 Hz
(±) | linearity of overall sound is average (28.9% difference to median)
Compared to same class
» 94% of all tested devices in this class were better, 2% similar, 5% worse
» The best had a delta of 6%, average was 18%, worst was 132%
Compared to all devices tested
» 84% of all tested devices were better, 3% similar, 13% worse
» The best had a delta of 4%, average was 25%, worst was 134%
SCHENKER XMG P407 audio analysis
(±) | speaker loudness is average but good (78 dB)
Bass 100 - 315 Hz
(-) | nearly no bass - on average 19.2% lower than median
(±) | linearity of bass is average (11% delta to prev. frequency)
Mids 400 - 2000 Hz
(+) | balanced mids - only 4.4% away from median
(±) | linearity of mids is average (9.6% delta to prev. frequency)
Highs 2 - 16 kHz
(+) | balanced highs - only 3.7% away from median
(+) | highs are linear (5.5% delta to prev. frequency)
Overall 100 - 16.000 Hz
(±) | linearity of overall sound is average (20.5% difference to median)
Compared to same class
» 70% of all tested devices in this class were better, 5% similar, 25% worse
» The best had a delta of 6%, average was 18%, worst was 132%
Compared to all devices tested
» 49% of all tested devices were better, 8% similar, 43% worse
» The best had a delta of 4%, average was 25%, worst was 134%
Frequency comparison (checkboxes are selectable!)
Energy Management
Power Consumption
Unless under extreme load our review unit was one of the two most economical gaming laptops of our test group. The MSI GS43VR was the least efficient unit in all load scenarios. The included 150 W charger is sufficient for the Aero 14.
| Off / Standby | |
| Idle | |
| Load |
|
| Gigabyte Aero 14 i7-7700HQ, GeForce GTX 1060 Mobile | MSI GS43VR 6RE-006US 6700HQ, GeForce GTX 1060 Mobile | SCHENKER XMG P407 i7-7700HQ, GeForce GTX 1050 Ti Mobile | Razer Blade (2016) 6700HQ, GeForce GTX 1060 Mobile | |
|---|---|---|---|---|
| Power Consumption | -28% | -10% | -2% | |
| Idle Minimum * | 8 | 12.1 -51% | 10 -25% | 9 -13% |
| Idle Average * | 13 | 19 -46% | 15 -15% | 14 -8% |
| Idle Maximum * | 20 | 19.5 2% | 24 -20% | 22 -10% |
| Load Average * | 78 | 106.7 -37% | 82 -5% | 72 8% |
| Witcher 3 ultra * | 110 | |||
| Load Maximum * | 146 | 159 -9% | 124 15% | 124 15% |
* ... smaller is better
Battery Life
In terms of battery life the Aero 14 humiliated the competition thanks to its astonishingly large 95 Wh battery, compared to batteries ranging from 45 Wh (XMG P407) to 70 Wh (Razer Blade). Normalized battery life attested to its incredible energy efficiency, and it squeezed out a considerably longer runtime per Wh than all of its competitors. Our Wi-Fi test proved that the Aero 14 will comfortably last all day when used as a mobile office device, a unique feature for a gaming laptop and case in point for its versatility.
| Gigabyte Aero 14 i7-7700HQ, GeForce GTX 1060 Mobile, 94 Wh | MSI GS43VR 6RE-006US 6700HQ, GeForce GTX 1060 Mobile, 61 Wh | SCHENKER XMG P407 i7-7700HQ, GeForce GTX 1050 Ti Mobile, 45 Wh | Razer Blade (2016) 6700HQ, GeForce GTX 1060 Mobile, 70 Wh | |
|---|---|---|---|---|
| Battery Runtime | -42% | -45% | -54% | |
| Reader / Idle | 909 | 577 -37% | 443 -51% | |
| WiFi v1.3 | 524 | 261 -50% | 241 -54% | 243 -54% |
| Load | 129 | 78 -40% | 92 -29% | |
| H.264 | 213 |
Verdict
Pros
Cons
So, is everything hunky-dory? Well, almost. Most of the items on our cons list will probably be irrelevant to the typical Aero 14 consumer. However, the constant fan whining at medium revs is very annoying, and Gigabyte urgently needs to address this issue.
Other than that, the Aero 14 left a very good overall impression. Despite its massive battery the aluminum case is compact and lightweight; apart from its non-standard keyboard layout the input devices, while clearly designed with gamers in mind (re: macro keys), are still decent enough even for office laptops; and there are more ports than we could wish for, including a USB-Ethernet adaptor already included in the box. Also, we have no complaints regarding its performance.
Its enormous battery and the resulting battery life are surely a unique feature of Gigabyte’s Aero 14 among its mobile-gaming laptop brethren. This, however, is overshadowed by the fan’s overly annoying high-frequency whining noise, which is why we simply cannot recommend this laptop.
Gigabyte Aero 14
-
06/30/2017 v6(old)
Sven Kloevekorn
Pricecompare

