 Deutsch
 English
 Español
 Français
 Italiano
 Nederlands
 Polski
 Português
 Русский
 Türkçe
 Svenska
 Chinese
 Magyar
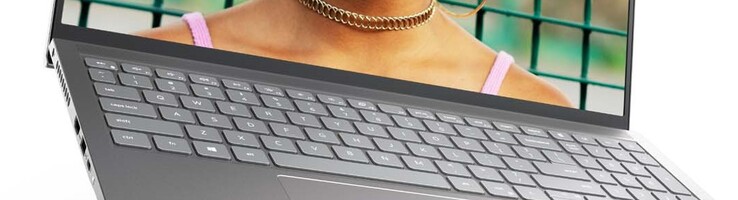
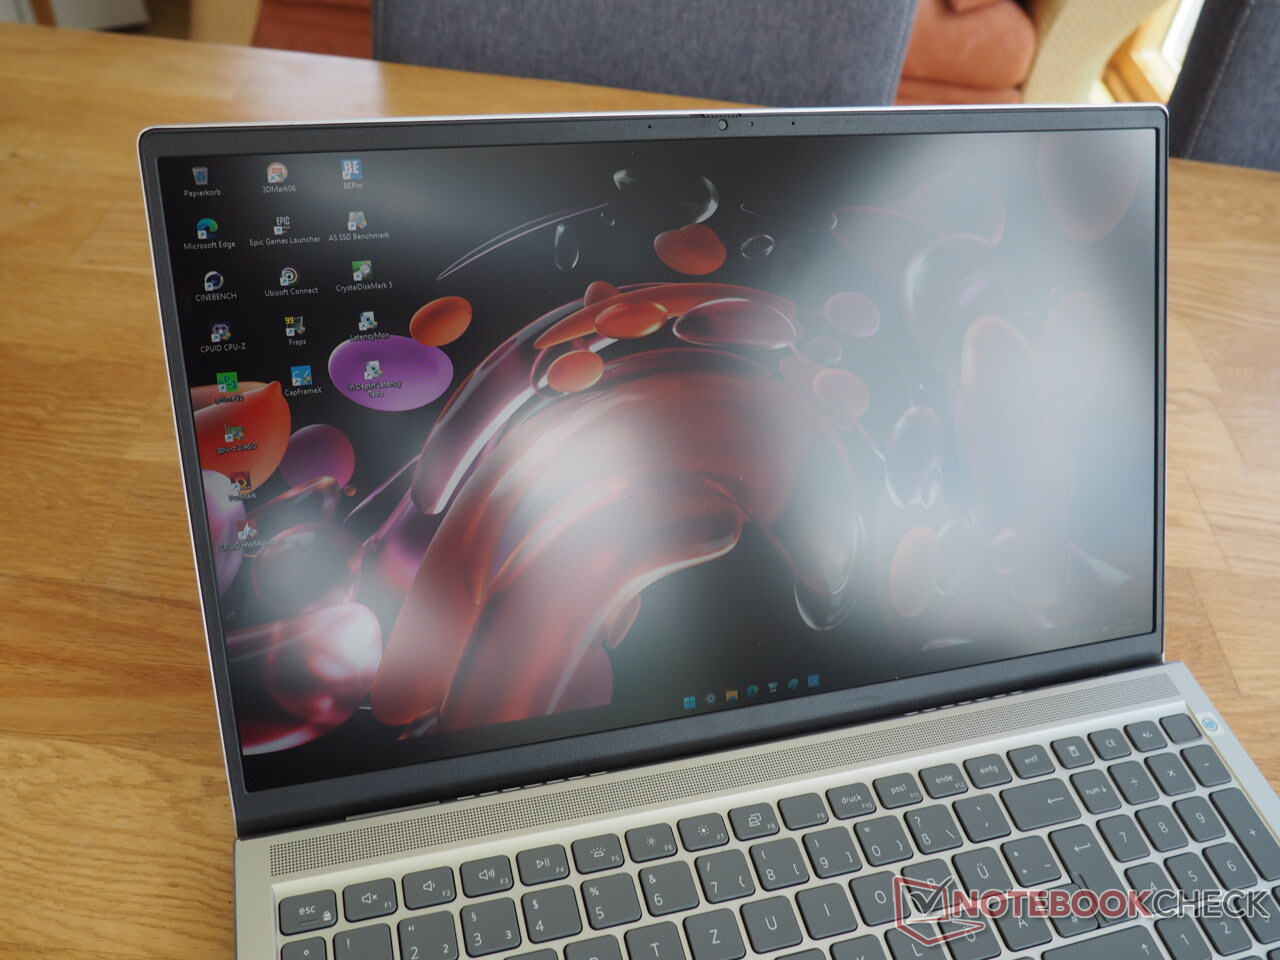
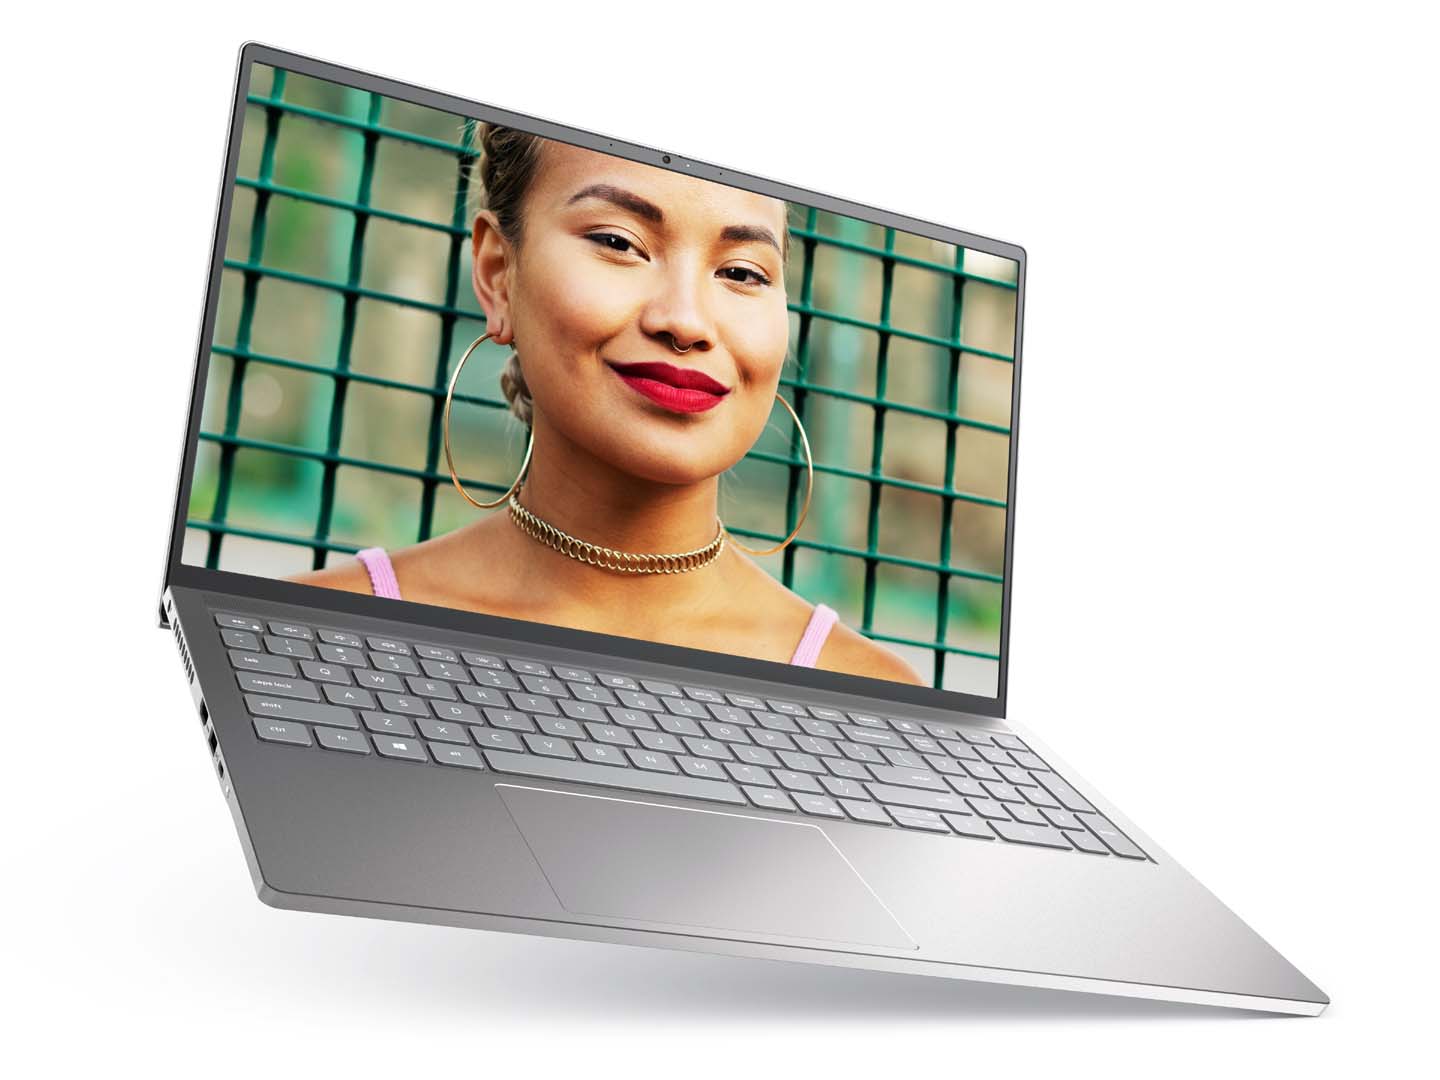
Dell Inspiron 15 Plus laptop review: Close to being the perfect all-rounder
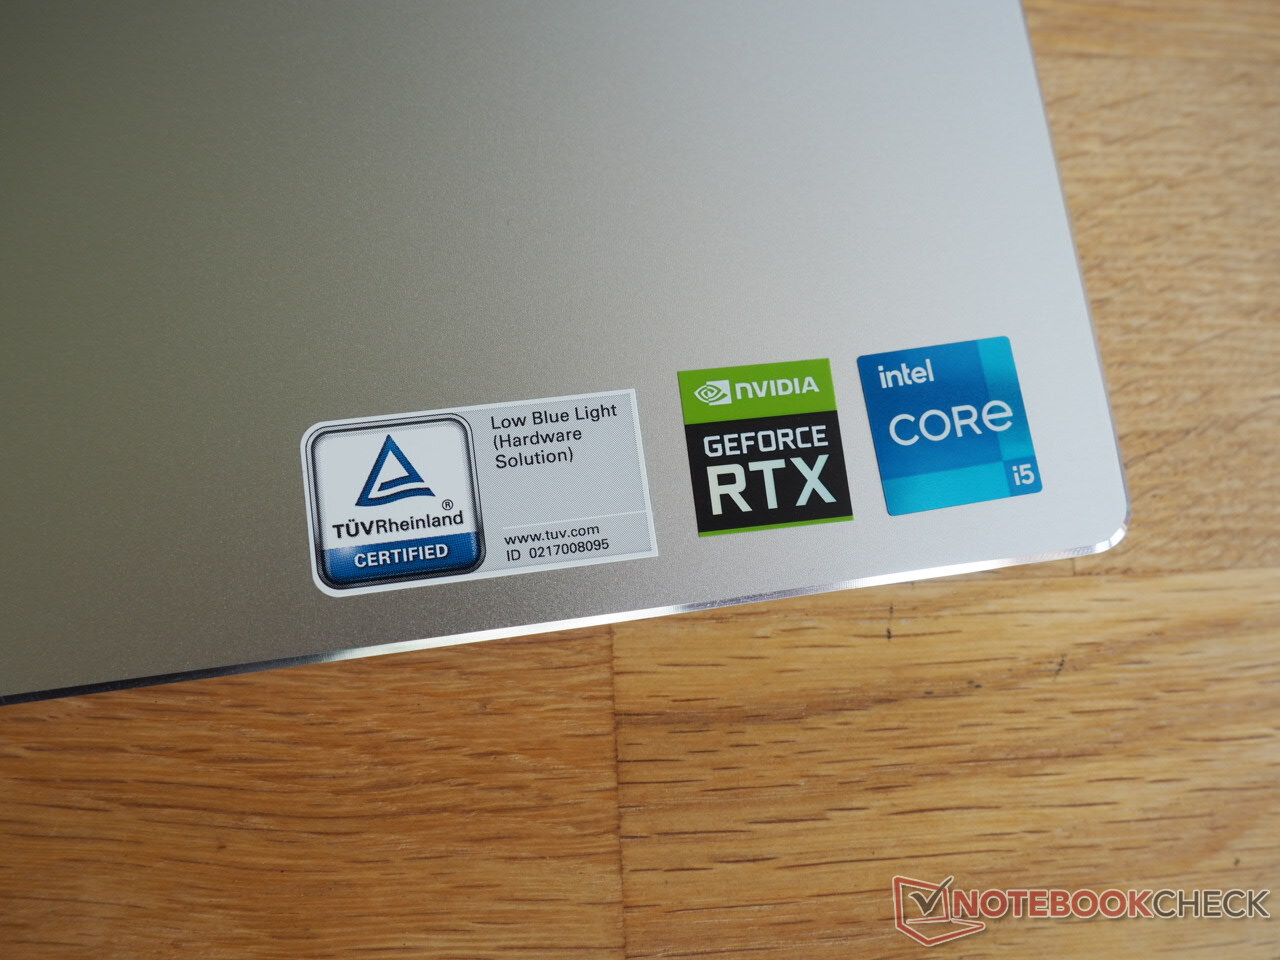
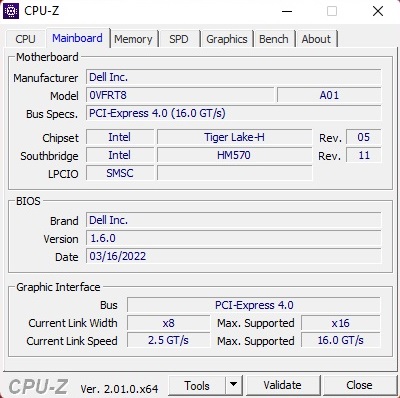
There are currently two variants of the Inspiron 15 Plus 7510 available on Dell's German website. The first is our review version, which includes a Core i5-11400H as well as a GeForce RTX 3050, and costs just under 850 Euros (~$852). In addition, a variant with the GeForce RTX 3050 Ti and the Core i7-11800H is available for around 1,000 Euros (~$1,002). However, the latter is rather "overpowered" considering its form factor and graphics performance.
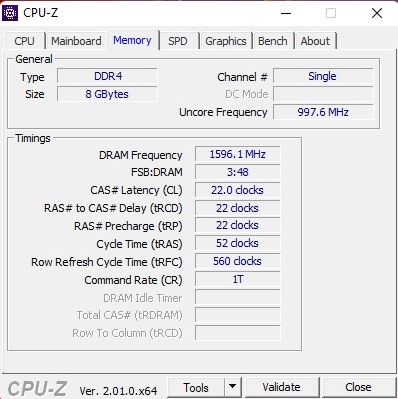
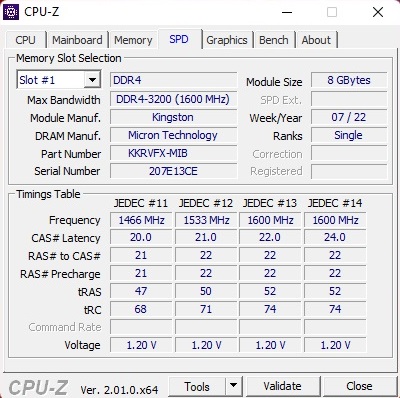
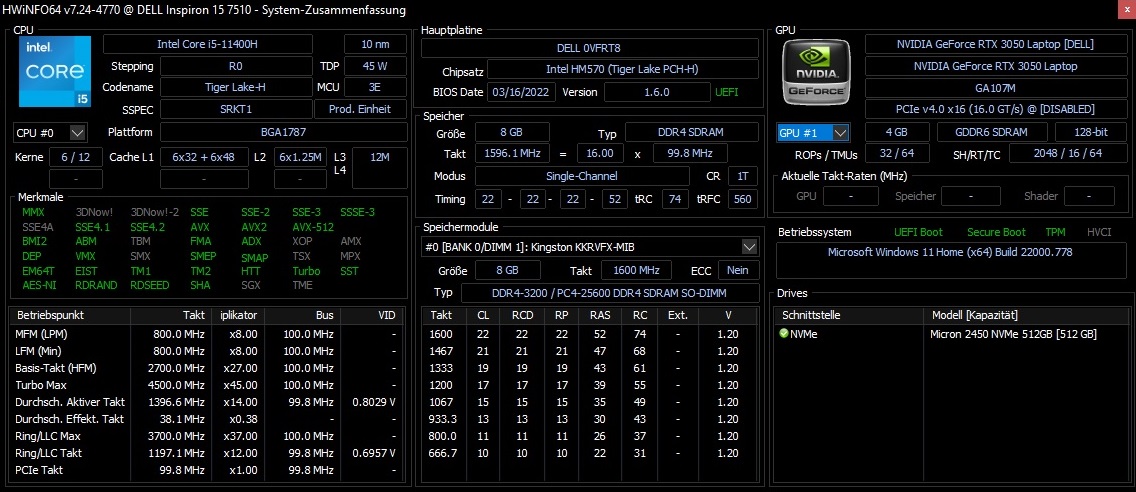
Both models have a matte wide-view panel with a refresh rate of 60 Hz and a resolution of 1,920x1,080 pixels in common. A 512 GB NVMe SSD serves as storage, and there's only a meager 8 GB of RAM in single-channel mode (we'll explain the drawbacks later). There are no surprises in terms of the operating system, which is Windows 11 Home.
The Inspiron 15 Plus' competitors include other multimedia laptops with the GeForce RTX 3050 (Ti), such as the Asus VivoBook 15 Pro, the Asus Zenbook Pro 15, or the in-house Dell XPS 15 9510, but some of them are considerably more expensive. Our comparison charts also include the 16-inch sibling model, the Inspiron 16 Plus.
Possible contenders in comparison
Rating | Date | Model | Weight | Height | Size | Resolution | Best Price |
|---|---|---|---|---|---|---|---|
| 83.5 % | 07/2022 | Dell Inspiron 15 Plus i5-11400H, GeForce RTX 3050 4GB Laptop GPU | 1.9 kg | 19 mm | 15.60" | 1920x1080 | |
| 86.7 % | 08/2021 | Dell Inspiron 16 Plus 7610 i7-11800H, GeForce RTX 3050 4GB Laptop GPU | 2 kg | 18.99 mm | 16.00" | 3072x1920 | |
| 85.9 % | 11/2021 | Asus VivoBook 15 Pro M3500QC-L1062 R5 5600H, GeForce RTX 3050 4GB Laptop GPU | 1.7 kg | 19.9 mm | 15.60" | 1920x1080 | |
| 88.4 % | 08/2021 | Dell XPS 15 9510 11800H RTX 3050 Ti OLED i7-11800H, GeForce RTX 3050 Ti Laptop GPU | 1.9 kg | 18 mm | 15.60" | 3456x2160 | |
| 87.7 % | 05/2022 | Asus Zenbook Pro 15 OLED UM535Q R9 5900HX, GeForce RTX 3050 Ti Laptop GPU | 1.9 kg | 18 mm | 15.60" | 1920x1080 |
Case
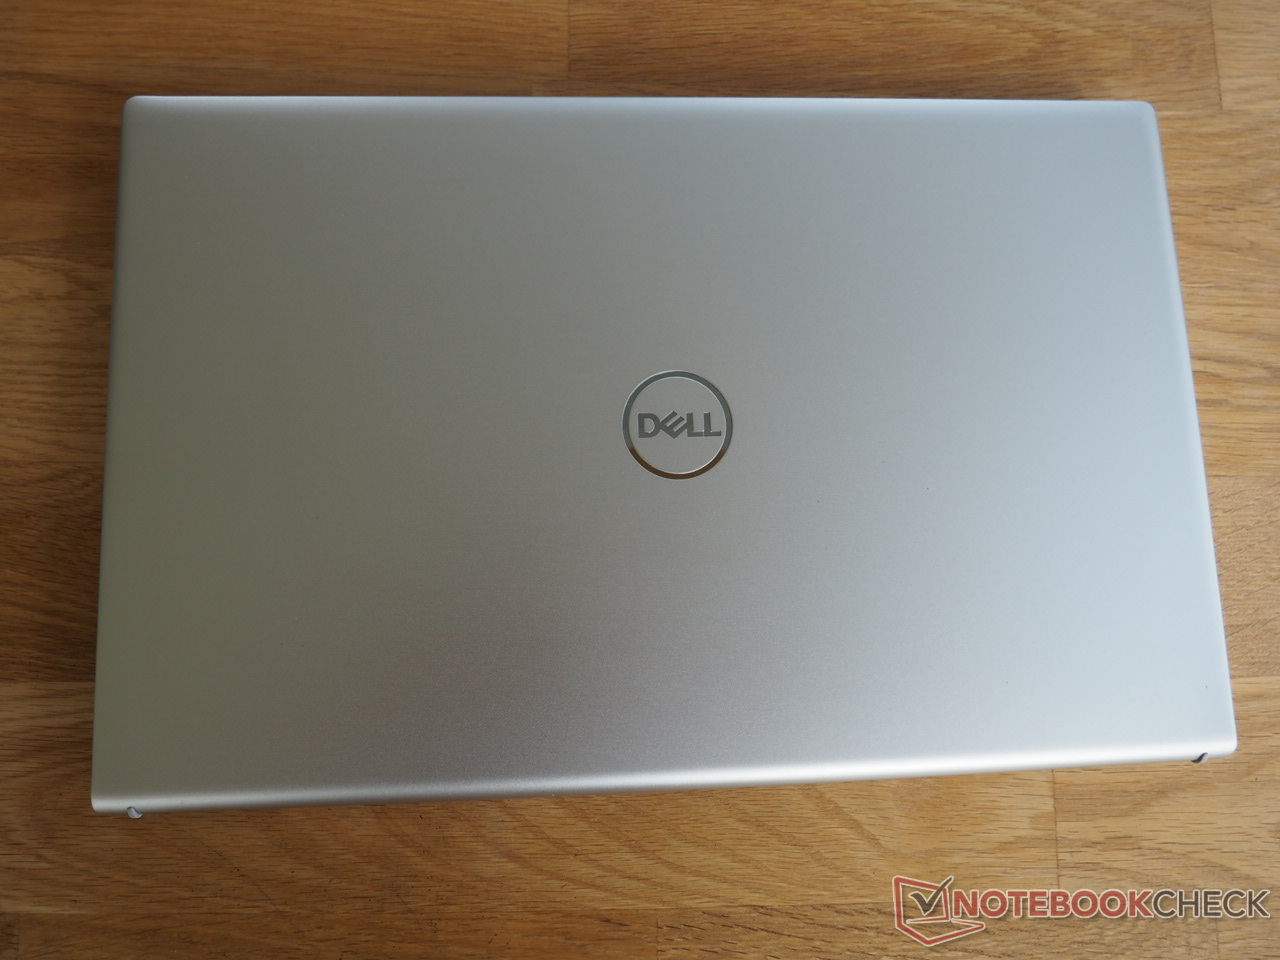
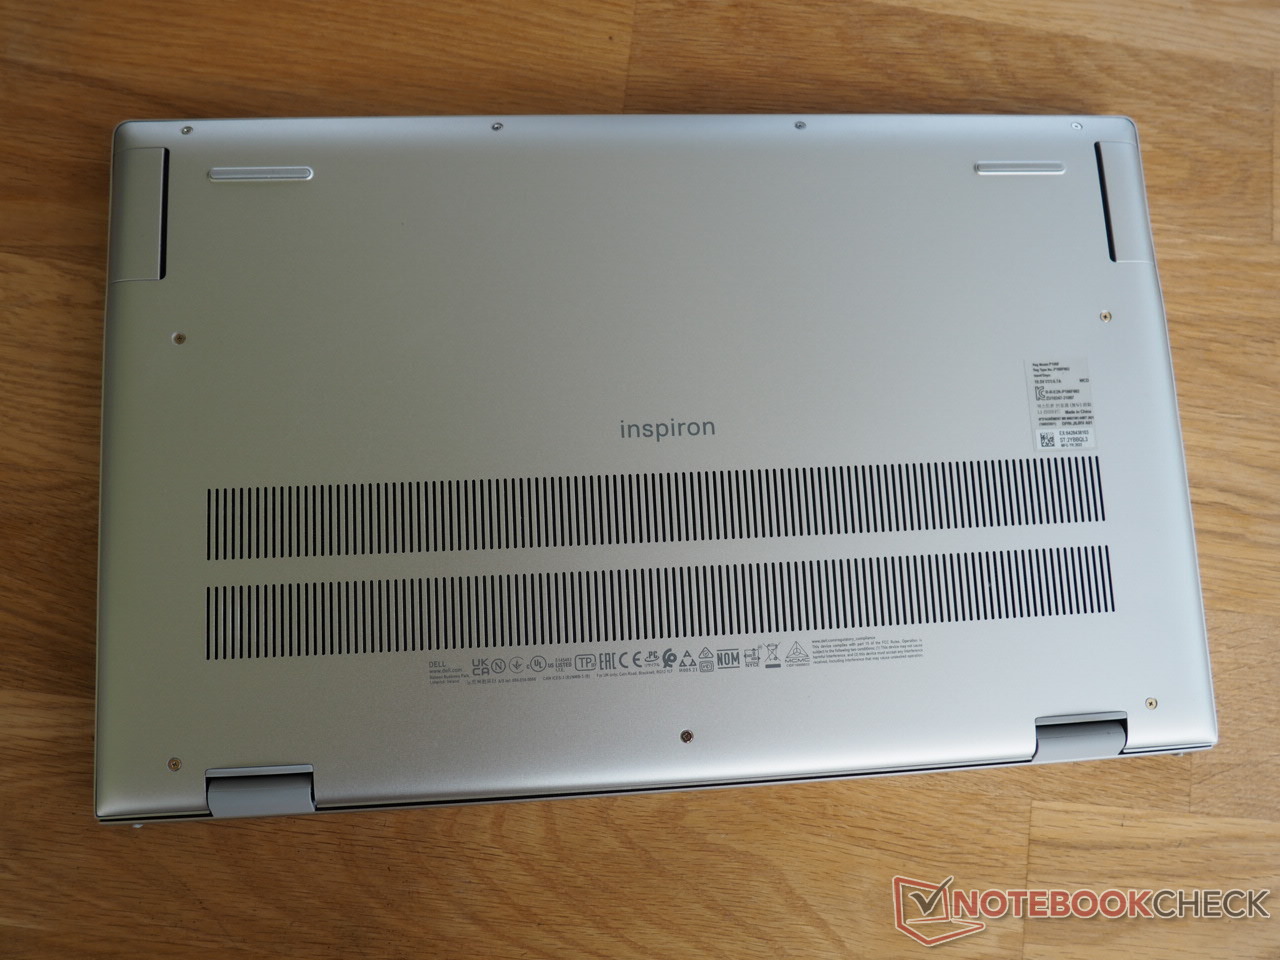
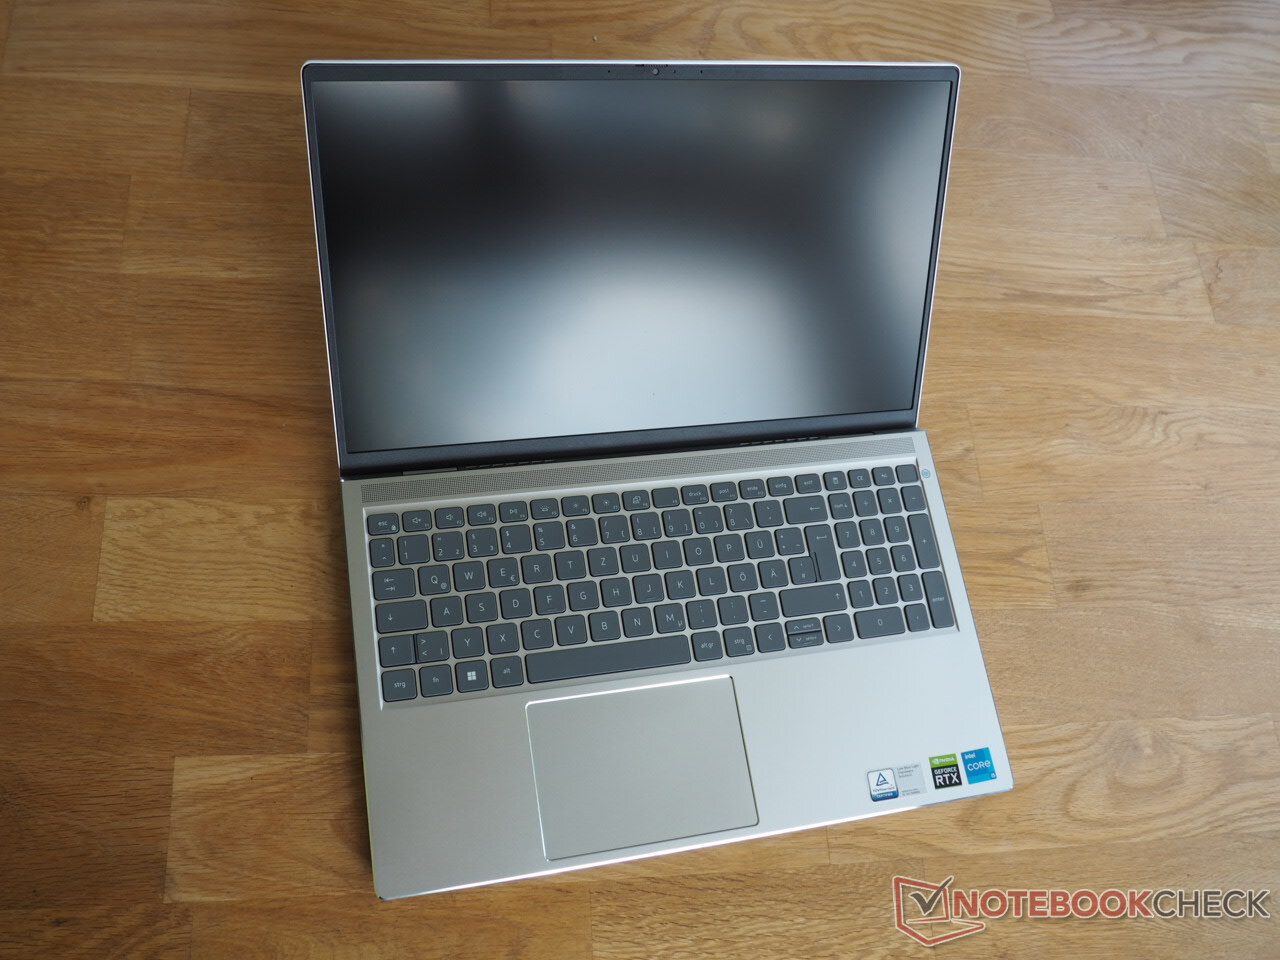
With a footprint of just 35.6 x 22.9 cm (~14.0 x 9.0 in), the Inspiron 15 Plus is among the more compact all-rounder laptops. A build height of 1.9 cm (~0.8 in) is also quite low, giving the Dell device a slim appearance. The situation is similar when it comes to weight: 1.9 kg (~4.2 lb) is very moderate for a 15-inch device, and it can (still) be transported comfortably. However, the case's biggest strength is its stylish design: The silver surfaces, which are partly made of metal (lid, top), look sleek and elegant at the same time, and they cut a fine figure in any situation or environment (office, university, etc.).
The Inspiron 15 Plus doesn't perform quite as well in terms of workmanship. Unfortunately, a few inconsistencies can be identified in the details. For example, the touchpad in our review sample didn't fit perfectly, and the lower right corner protruded a bit. Moreover, the lid's paint was already slightly damaged out of the box. Dell should improve its quality control accordingly (in our experience, the manufacturer often has problems here).
There's little to complain about in terms of sturdiness. Although the base unit can bend in the middle area under strong pressure, the "case flex" is kept within limits during normal use. The lid offers a tolerable degree of stability.
The hinges do a good job. Opening the lid, which raises the base unit (better air flow), also works with one hand. The lid is held firmly in place when open, and it's relatively unaffected by vibrations on the surface.
Connectivity
Ports
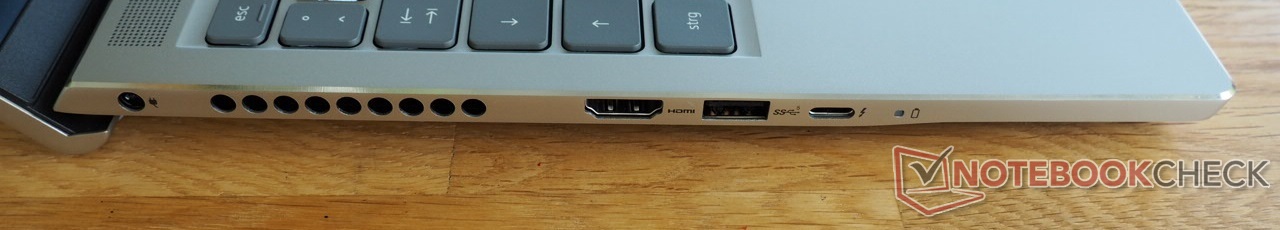
The port configuration makes a mixed impression. On the one hand, the Inspiron 15 Plus offers a modern Thunderbolt 4 port (USB-C with DisplayPort support and Power Delivery), but on the other hand, the 15-incher lacks an RJ45 port and a Kensington Lock. A total of three USB ports (2x Type-A 3.2 Gen 1), and one audio jack is also a bit limited. At least the Dell device is equipped with a full-fledged - if very slow - SD card reader.
The distribution of the interfaces isn't optimal. Since the back doesn't contain any ports because of the device's design and hinges, and the rear area of the sides is occupied by air vents, the ports are located quite far to the front, which can lead to motion restrictions when using an external mouse on both the left and right sides.
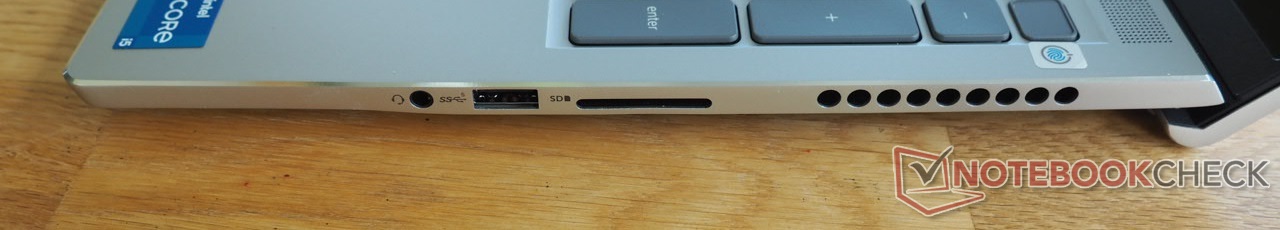
SD card reader
As mentioned before, Dell has installed an extremely slow card reader. Around 21 MB/s for transferring photos isn't even on par with USB 2.0, and together with its 16-inch sibling, our review unit ranks at the bottom of the test field. In comparison: The Zenbook Pro 15 achieves a solid 81 MB/s, and the XPS 15 a first-class 224 MB/s.
| SD Card Reader - average JPG Copy Test (av. of 3 runs) | |
| Dell XPS 15 9510 11800H RTX 3050 Ti OLED (AV Pro V60) | |
| Average of class Multimedia (17.6 - 205, n=66, last 2 years) | |
| Asus Zenbook Pro 15 OLED UM535Q (Toshiba Exceria Pro SDXC 64 GB UHS-II) | |
| Asus VivoBook 15 Pro M3500QC-L1062 (AV Pro V60) | |
| Dell Inspiron 15 Plus (AV PRO microSD 128 GB V60) | |
| Dell Inspiron 16 Plus 7610 (AV PRO microSD 128 GB V60) | |
Communication
The Inspiron 15 Plus does very well when it comes to Wi-Fi performance. At a distance of one meter (~3.3 ft) from our new reference router, the Asus ROG Rapture GT-AXE11000, the Intel Wi-Fi 6 module (AX201) achieved a good average rate of 1,413 Mb/s in our reception test.
| Networking - iperf3 receive AXE11000 | |
| Average Intel Wi-Fi 6 AX201 (390 - 1734, n=72) | |
| Average of class Multimedia (701 - 1789, n=78, last 2 years) | |
| Dell Inspiron 15 Plus | |
Webcam
In terms of quality, the 720p webcam isn't anything out of the ordinary. As is often the case, there are problems with color accuracy as well as image sharpness. However, the privacy shutter should be praised: The webcam can be conveniently covered using the slider.


Security
As a security feature, the Inspiron 15 Plus comes with a fingerprint sensor that is conveniently integrated into the power button.
Accessories
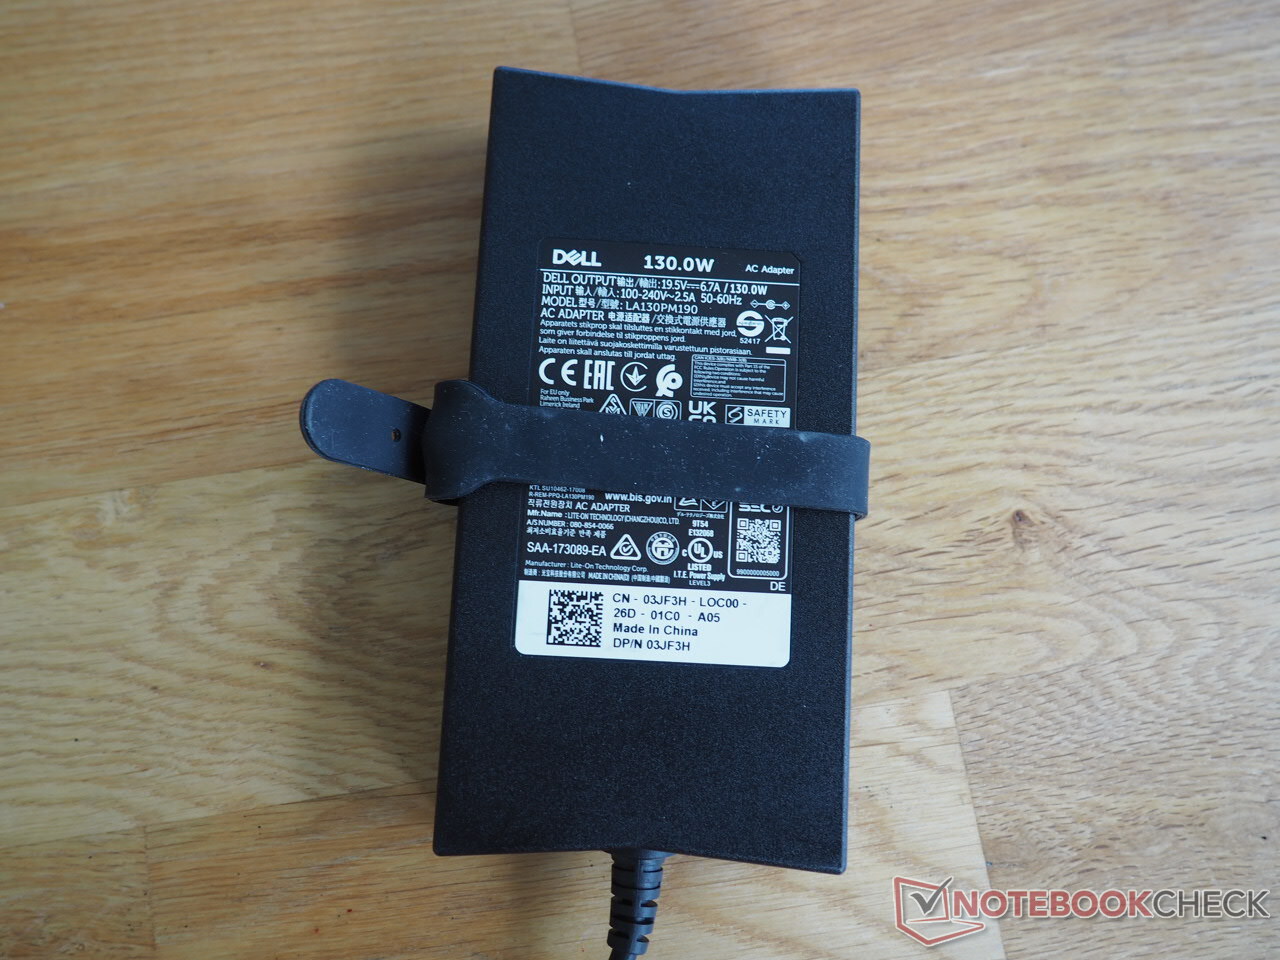
In addition to some info booklets, the laptop is of course accompanied by a mandatory power adapter. The 130-watt model weighs just under 400 grams (~0.9 lb), and its size of 15 x 7.5 x 2.5 cm (~5.9 x 3.0 x 1.0 in) isn't overly bulky.
Maintenance
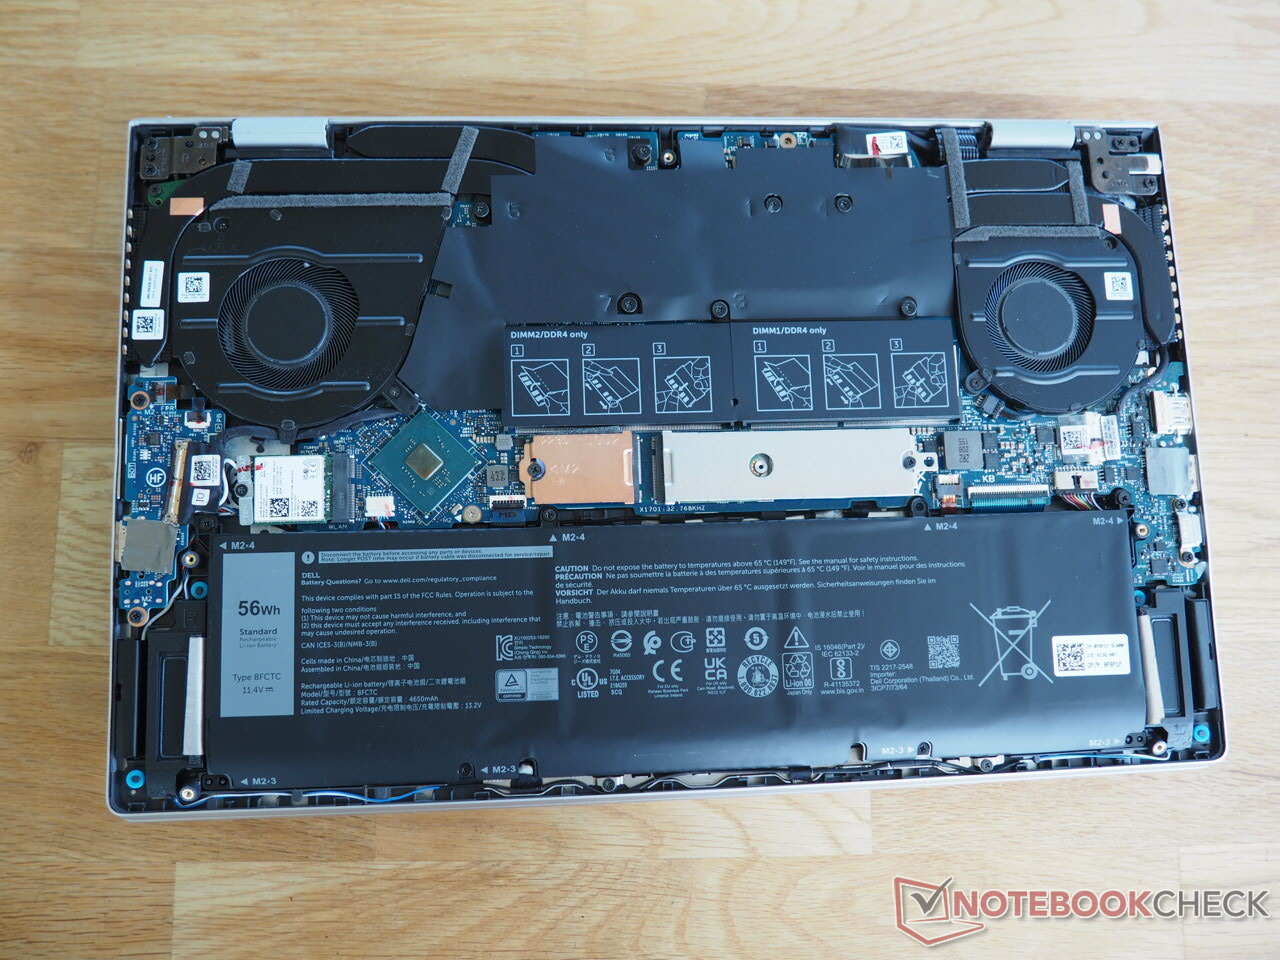
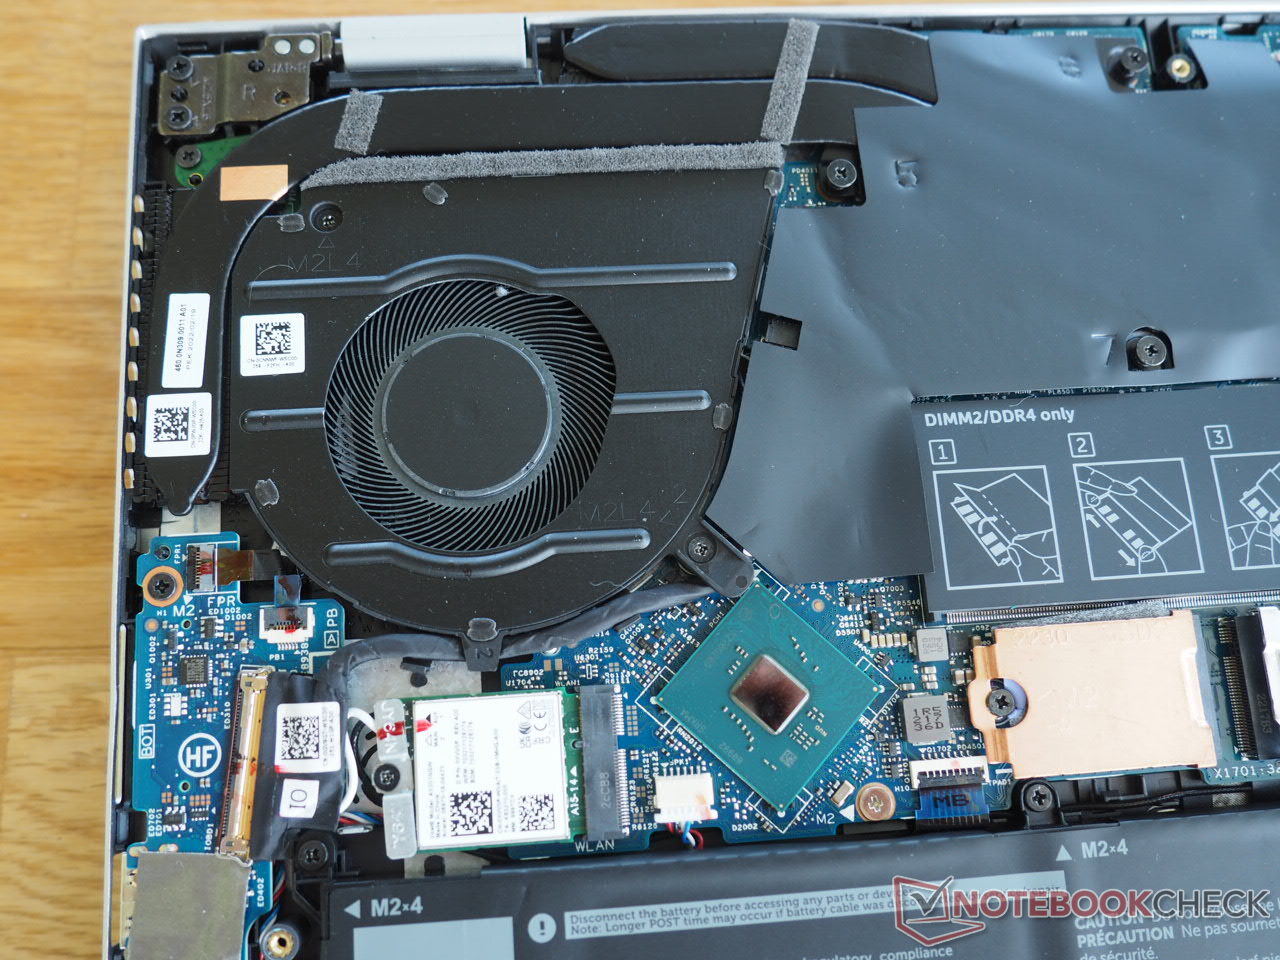
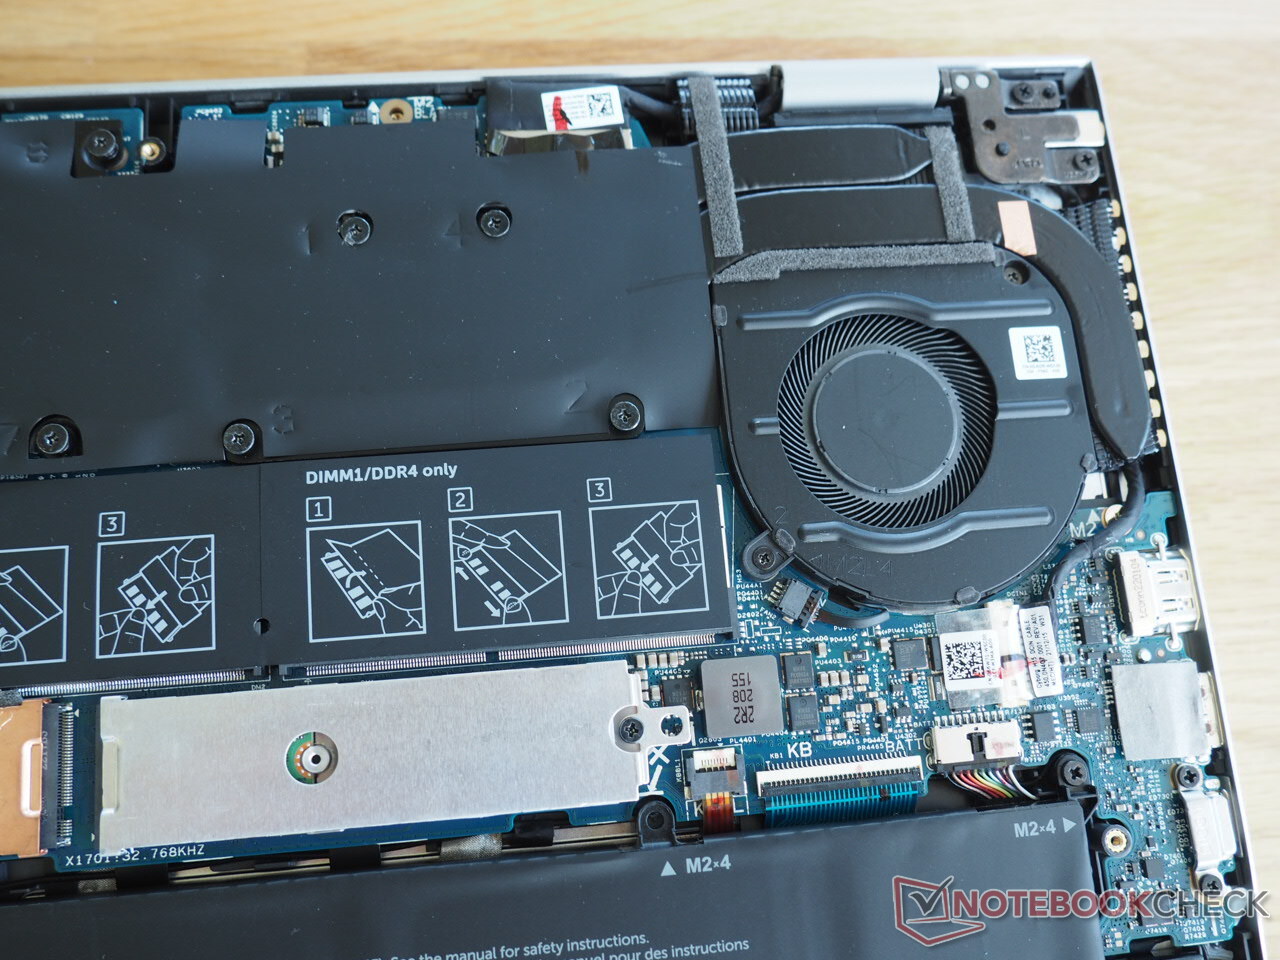
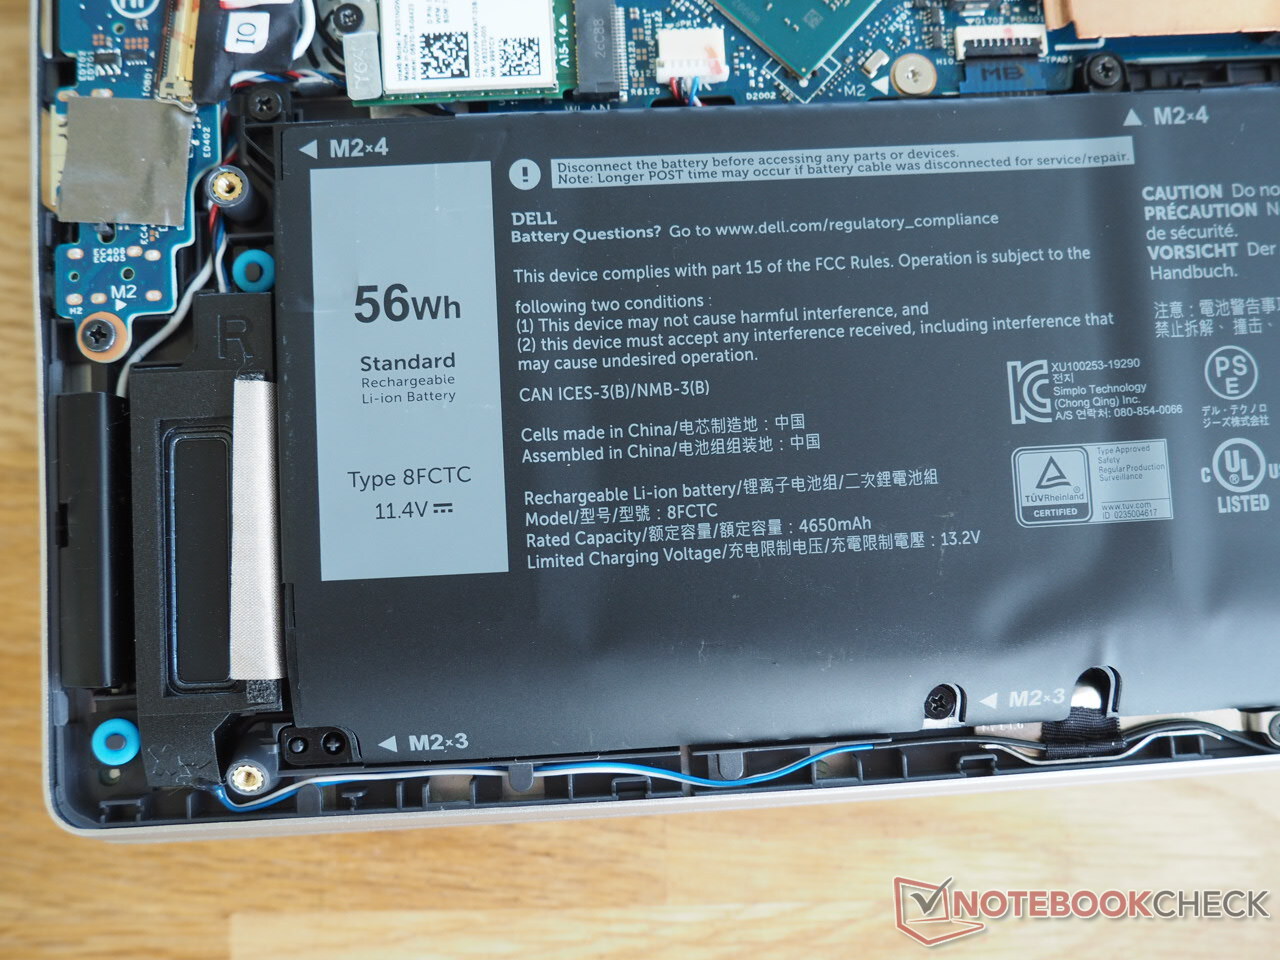
Users who want to access the interior of the Inspiron 15 Plus first have to remove nine small cross-head screws and pry the bottom cover out of its anchoring. The picture under the hood is the usual one: The Wi-Fi module, RAM slots (2x SO-DIMM DDR4), and mass storage slots (1x M.2 2230, 1x M.2 2280) are just as accessible as the battery and the cooling system (see photos).
Warranty
The base warranty only covers 12 months. When configuring the laptop, however, this period can be extended to up to three years for an additional charge, and Premium or Premium Plus support can be added.
Input devices
Keyboard
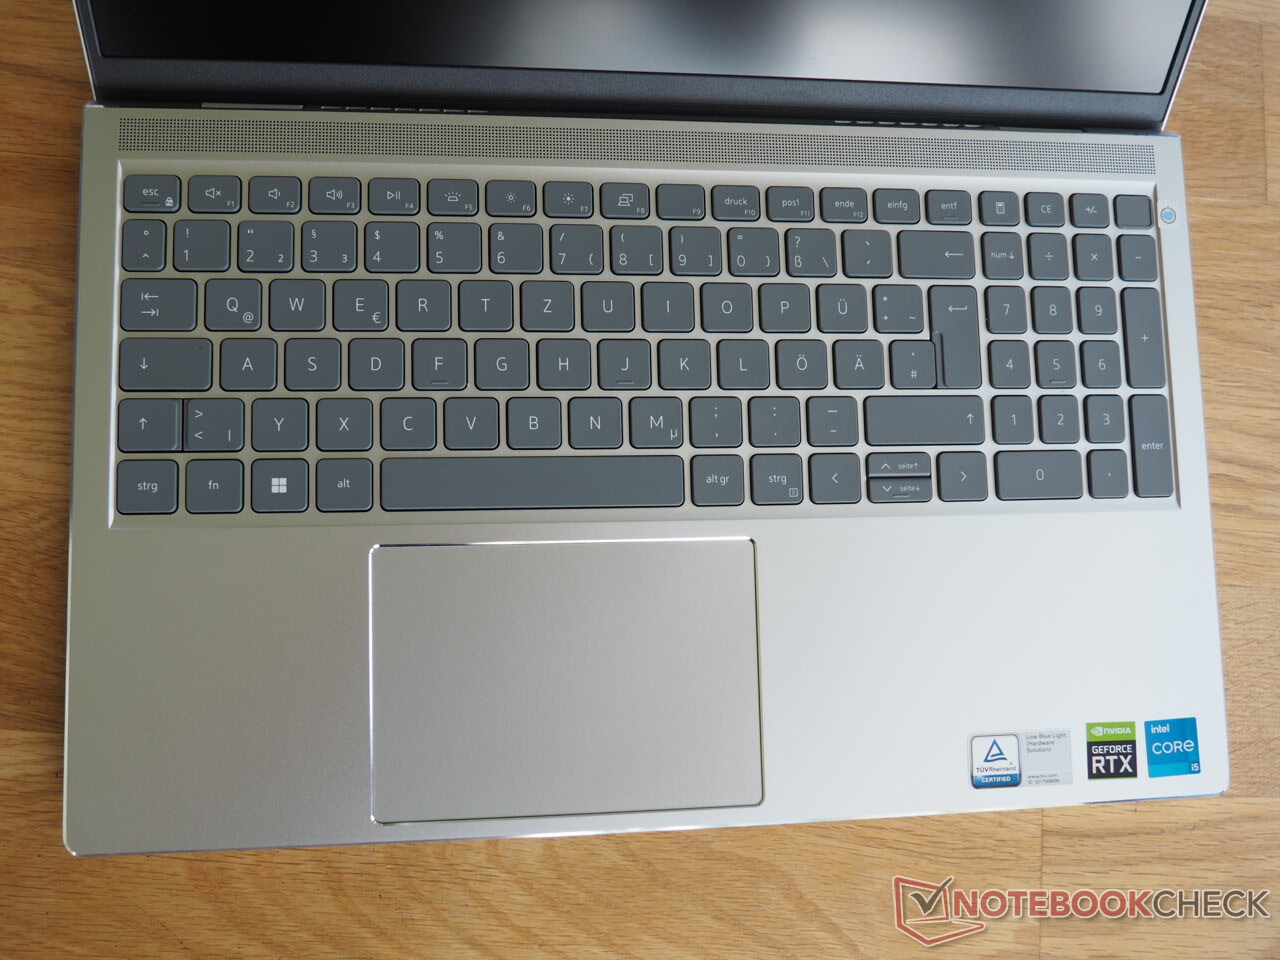
The input devices of the Inspiron 15 Plus make a good impression. This starts with the keyboard, which has the typical laptop chiclet design and dark gray keys. We would describe the typing experience as pretty crisp and suitable for everyday use, although the author would've liked a slightly firmer stroke. Moreover, the keyboard isn't particularly quiet when you press the keys more strongly.
The well-designed layout is a plus point. With the exception of the tiny middle directional arrows, all the keys offer a decent size and are, for the most part, reasonably positioned. Furthermore, some buyers will be pleased to see that a full-fledged numeric keypad has been included. The white backlight, which can be adjusted in two levels, is especially helpful in dark environments.
Touchpad
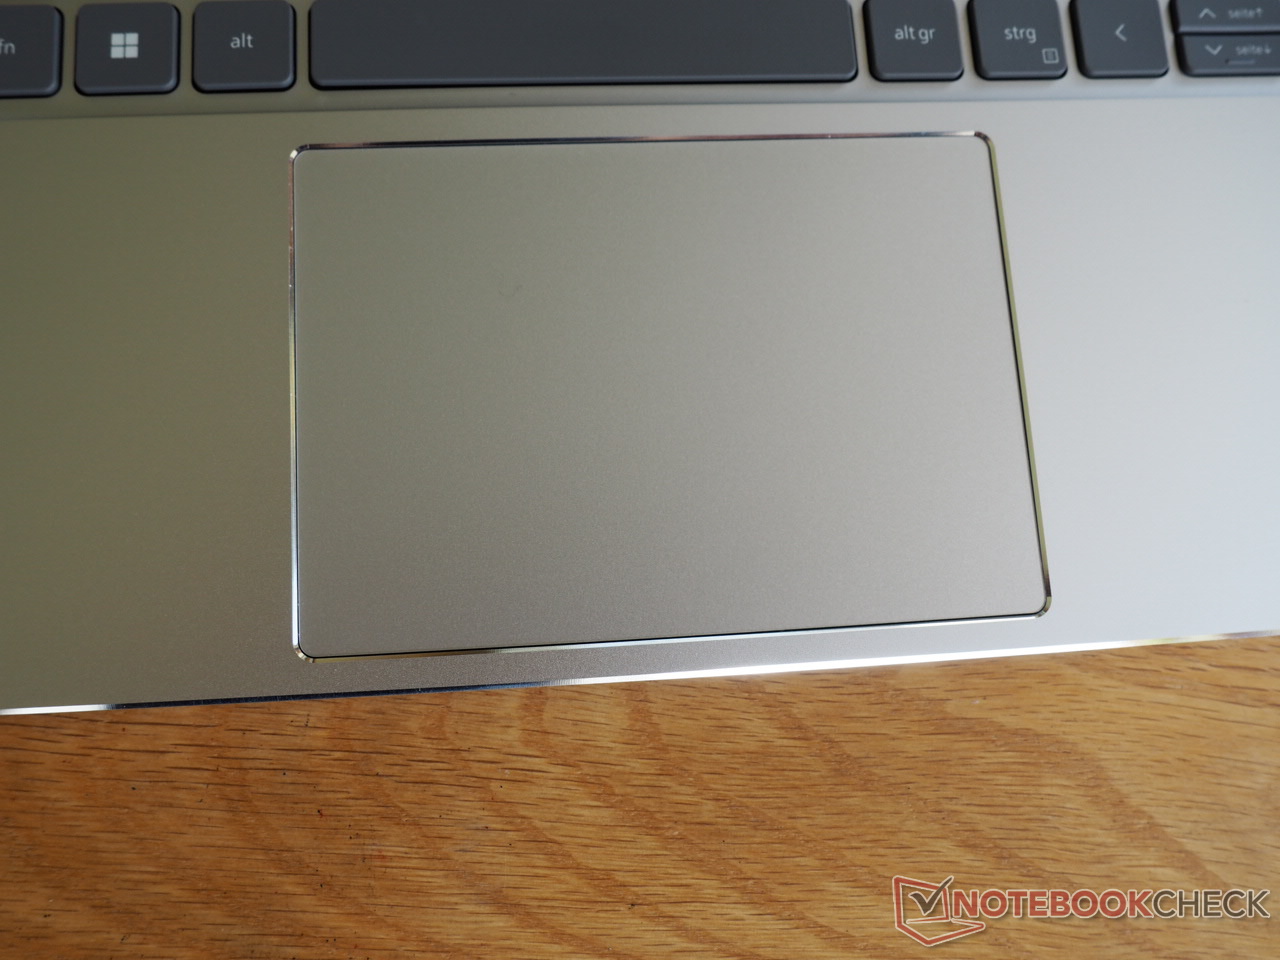
Apart from the aforementioned workmanship flaws, there is hardly anything to criticize about the touchpad. A surface of 11.5 x 8 cm (~4.5 x 3.2 in) is quite a lot for a 15-inch device, and it also allows you to move the cursor across longer spaces without having to reset your finger. The rather smooth finish chosen by Dell also ensures good gliding properties. The pad's precision is satisfactory as well.
The only thing that Dell should polish is the multitouch support. The gestures supported (e.g. zooming) were occasionally a bit awkward and sloppy in the test. Finally, the two click surfaces at the bottom draw attention with a strong, but also quite loud feedback.
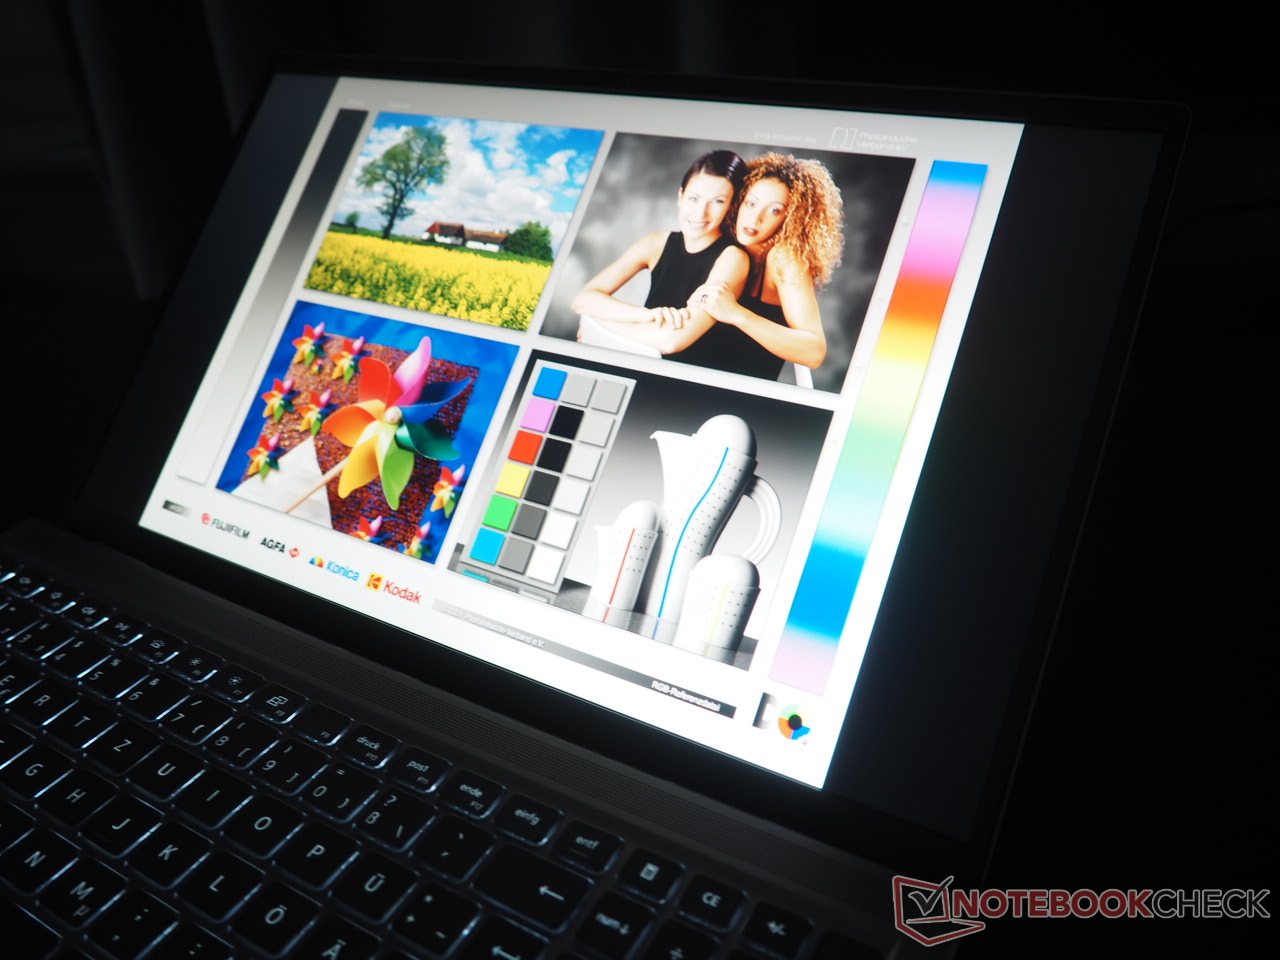
Display
While several other budget all-rounders show significant weaknesses when it comes to image quality, the Inspiron 15 Plus features a decent display.
| |||||||||||||||||||||||||
Brightness Distribution: 86 %
Center on Battery: 298 cd/m²
Contrast: 745:1 (Black: 0.4 cd/m²)
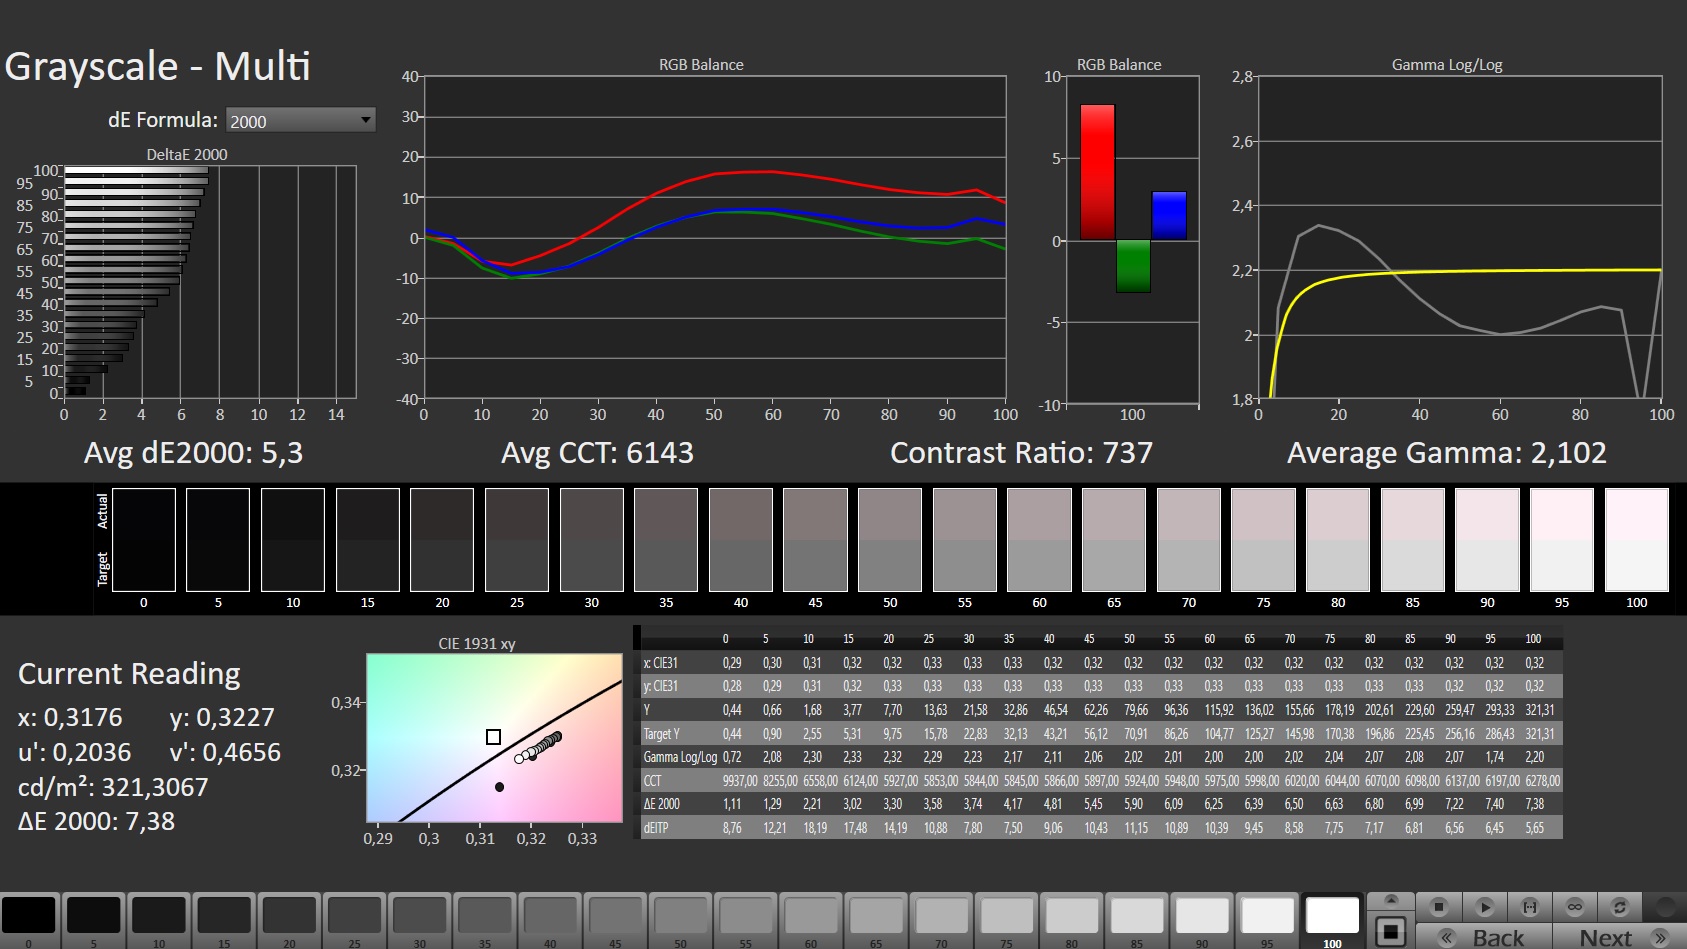
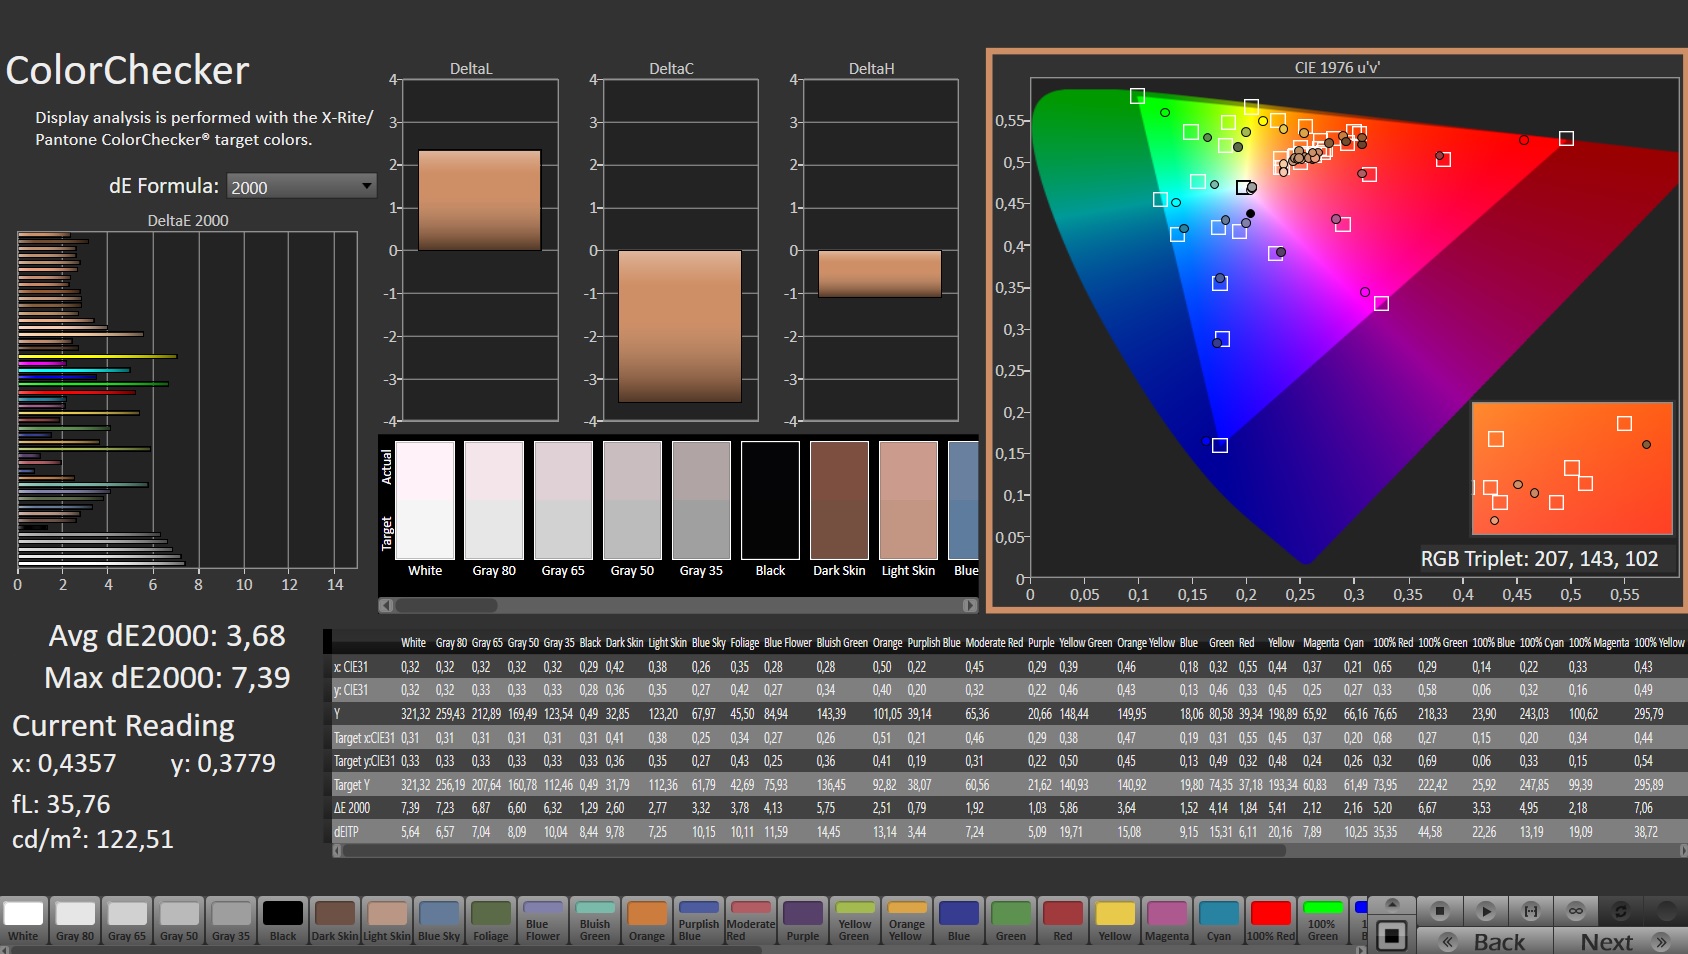
ΔE Color 3.68 | 0.5-29.43 Ø5, calibrated: 2.61
ΔE Greyscale 5.3 | 0.57-98 Ø5.3
66.2% AdobeRGB 1998 (Argyll 2.2.0 3D)
92.8% sRGB (Argyll 2.2.0 3D)
64.1% Display P3 (Argyll 2.2.0 3D)
Gamma: 2.102
| Dell Inspiron 15 Plus Dell INSPIRON LGD06A6, IPS, 1920x1080, 15.60 | Dell Inspiron 16 Plus 7610 AU Optronics B160QAN, IPS, 3072x1920, 16.00 | Asus VivoBook 15 Pro M3500QC-L1062 ATNA56YX03-0, AMOLED, 1920x1080, 15.60 | Dell XPS 15 9510 11800H RTX 3050 Ti OLED SDC414D, OLED, 3456x2160, 15.60 | Asus Zenbook Pro 15 OLED UM535Q Samsung ATNA56YX03-0, OLED, 1920x1080, 15.60 | |
|---|---|---|---|---|---|
| Display | 13% | 36% | 37% | 20% | |
| Display P3 Coverage | 64.1 | 74.1 16% | 99.9 56% | 99.9 56% | 79.3 24% |
| sRGB Coverage | 92.8 | 99.4 7% | 99.9 8% | 100 8% | 95.6 3% |
| AdobeRGB 1998 Coverage | 66.2 | 75.8 15% | 95.8 45% | 98.1 48% | 87.3 32% |
| Response Times | -63% | 88% | 88% | 91% | |
| Response Time Grey 50% / Grey 80% * | 31.6 ? | 49.2 ? -56% | 3.2 ? 90% | 3.6 ? 89% | 2.1 ? 93% |
| Response Time Black / White * | 21.6 ? | 36.8 ? -70% | 3.2 ? 85% | 2.8 ? 87% | 2.3 ? 89% |
| PWM Frequency | 60.2 ? | 59.5 ? | 60.2 | ||
| Screen | 32% | 40% | 114% | 32% | |
| Brightness middle | 298 | 296.8 0% | 396 33% | 362 21% | 342.9 15% |
| Brightness | 285 | 292 2% | 397 39% | 367 29% | 346 21% |
| Brightness Distribution | 86 | 87 1% | 99 15% | 97 13% | 98 14% |
| Black Level * | 0.4 | 0.21 47% | 0.06 85% | ||
| Contrast | 745 | 1413 90% | 6033 710% | ||
| Colorchecker dE 2000 * | 3.68 | 2.56 30% | 2 46% | 2.1 43% | 2.42 34% |
| Colorchecker dE 2000 max. * | 7.39 | 4.76 36% | 4.8 35% | 4.1 45% | 4.05 45% |
| Colorchecker dE 2000 calibrated * | 2.61 | 1.86 29% | 1.8 31% | 2.5 4% | |
| Greyscale dE 2000 * | 5.3 | 2.6 51% | 1 81% | 1.4 74% | 2.1 60% |
| Gamma | 2.102 105% | 2.07 106% | 2.17 101% | 2.18 101% | 2.21 100% |
| CCT | 6143 106% | 6628 98% | 6608 98% | 6608 98% | 6364 102% |
| Total Average (Program / Settings) | -6% /
14% | 55% /
47% | 80% /
94% | 48% /
39% |
* ... smaller is better
Although a contrast ratio of 745:1 and an average brightness of 286 cd/m² are rather poor (a minimum of 350 cd/m² is required for outdoor use), the Full HD display doesn't show any other major shortcomings. A 93% sRGB coverage and a 22 to 32 ms response time are okay for a budget multimedia laptop. The same goes for color accuracy. If you exclude the subtle red tint, which can be corrected via calibration (our ICC file is linked above next to the brightness chart), the panel offers a solid color reproduction.
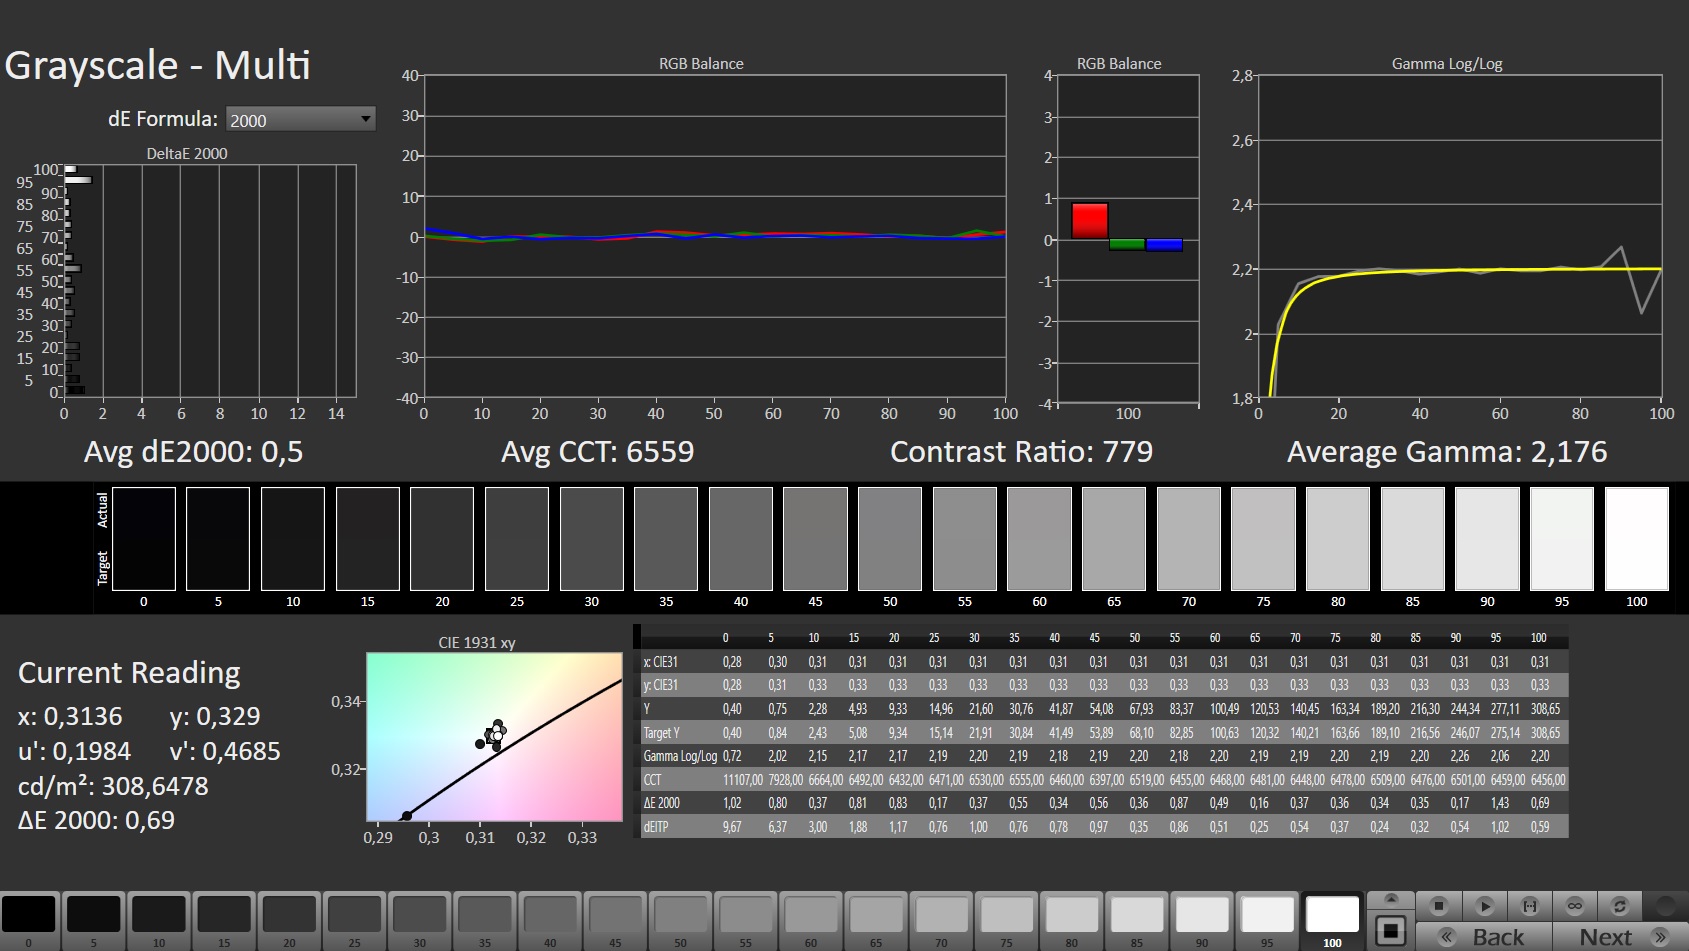
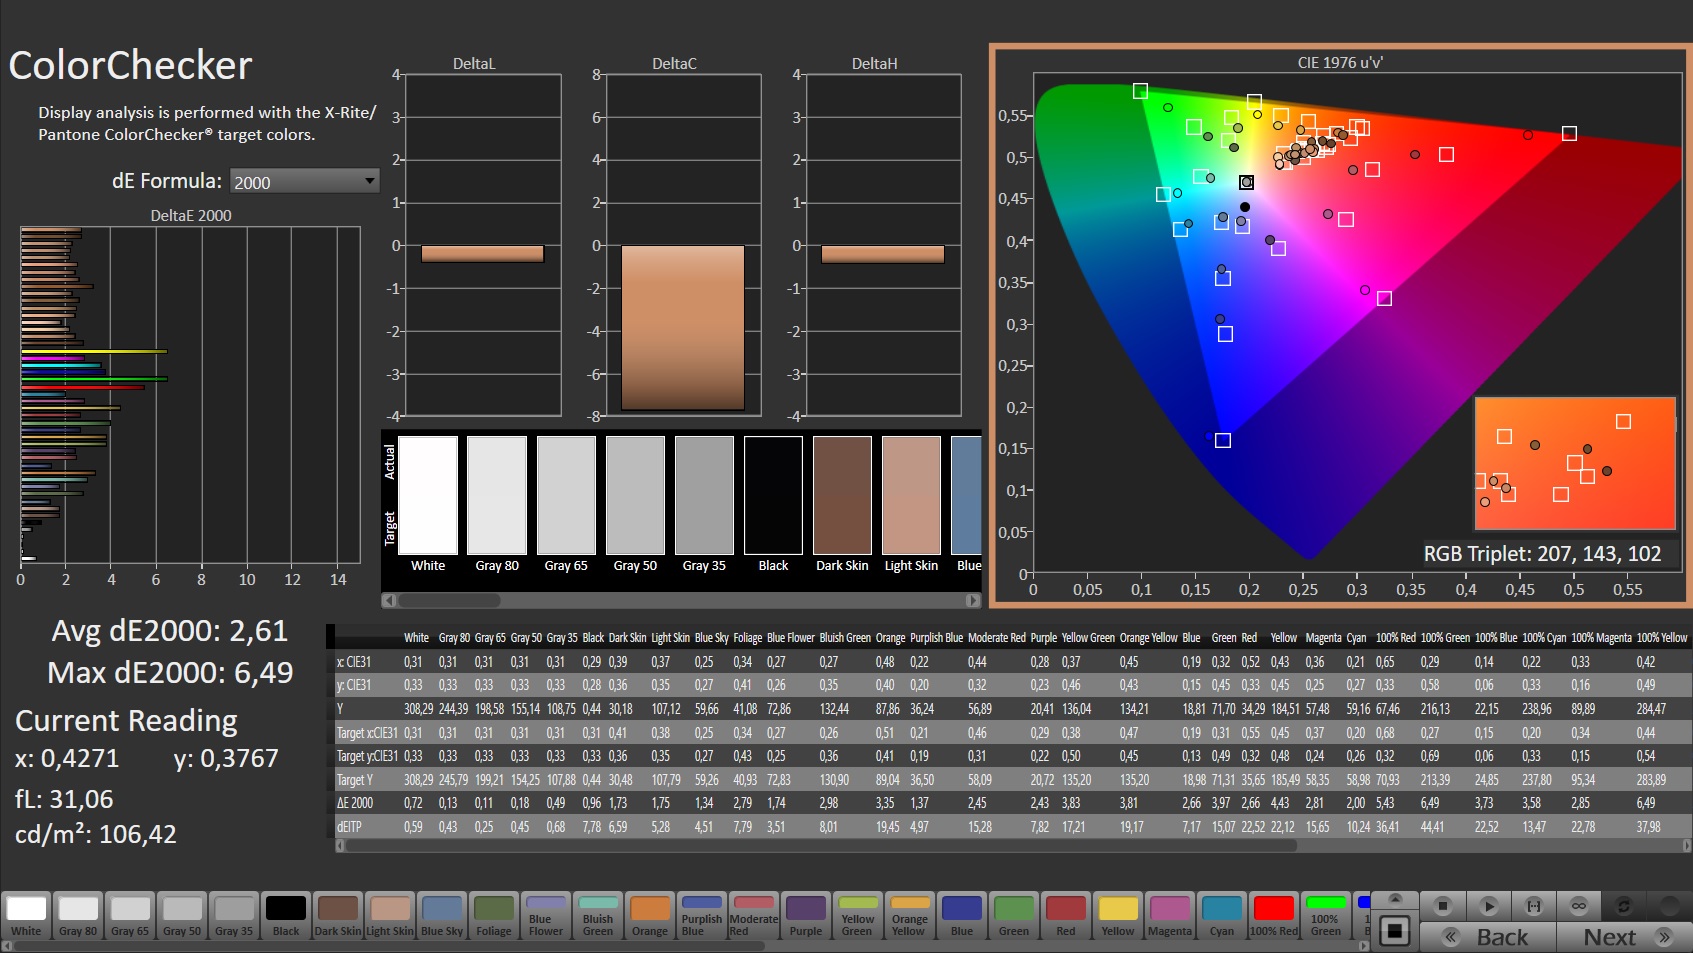
Viewing angles are on the typical IPS level, which means that they're still quite stable even from oblique positions.
The VivoBook 15 Pro, the Zenbook Pro 15, and the XPS 15 show that it can be worth spending more money in this regard: Their OLED displays score better in almost all disciplines - be it color space, response times, color reproduction, brightness, black level, or contrast. In return, the Inspiron doesn't need PWM/flickering.
Display Response Times
| ↔ Response Time Black to White | ||
|---|---|---|
| 21.6 ms ... rise ↗ and fall ↘ combined | ↗ 11.1 ms rise | 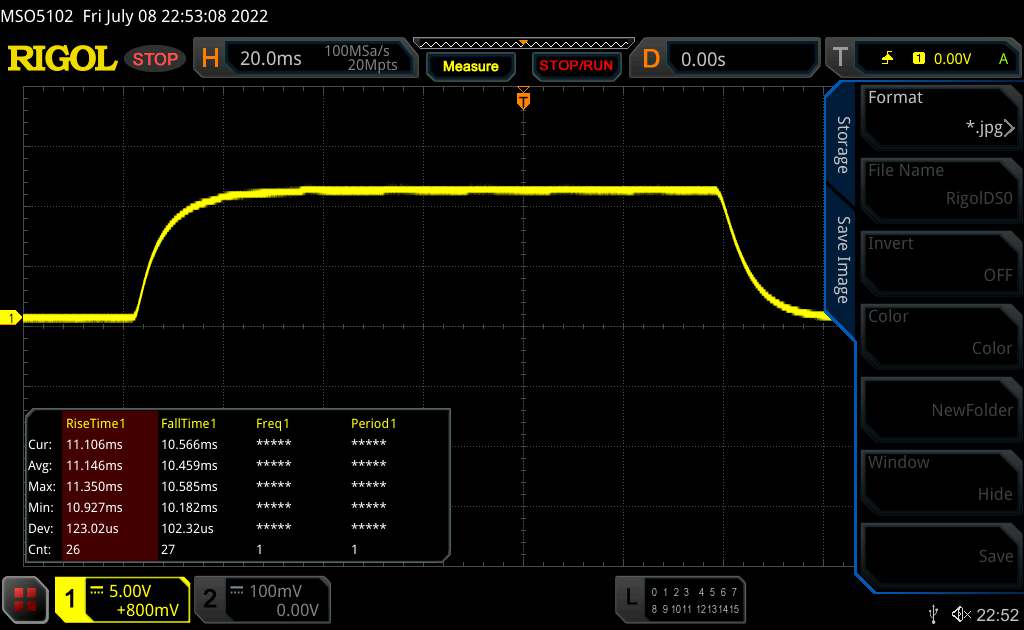 |
| ↘ 10.5 ms fall | ||
| The screen shows good response rates in our tests, but may be too slow for competitive gamers. In comparison, all tested devices range from 0.1 (minimum) to 240 (maximum) ms. » 41 % of all devices are better. This means that the measured response time is similar to the average of all tested devices (21.5 ms). | ||
| ↔ Response Time 50% Grey to 80% Grey | ||
| 31.6 ms ... rise ↗ and fall ↘ combined | ↗ 14.4 ms rise | 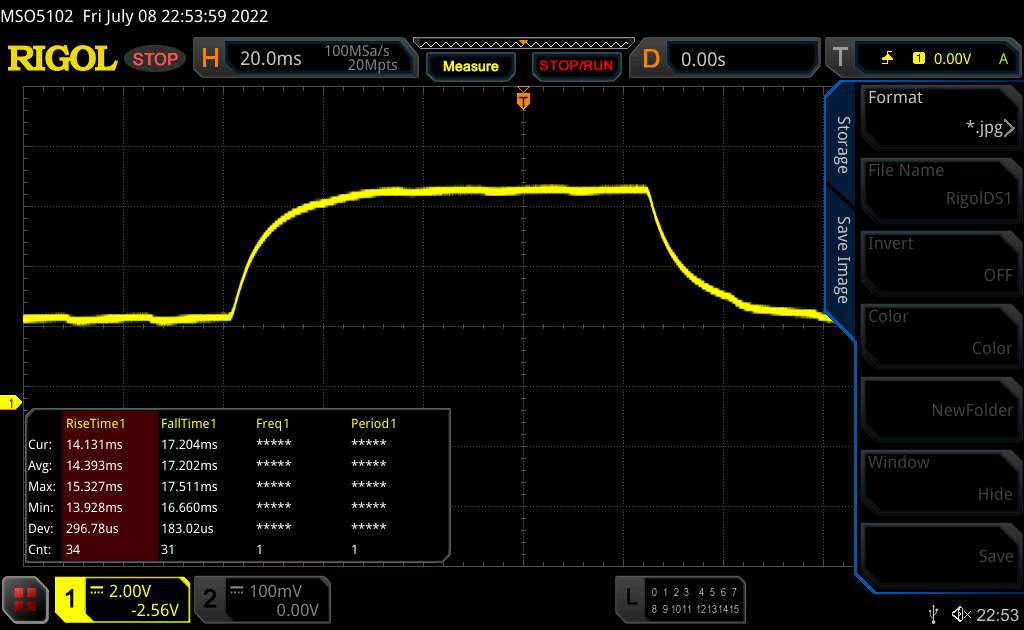 |
| ↘ 17.2 ms fall | ||
| The screen shows slow response rates in our tests and will be unsatisfactory for gamers. In comparison, all tested devices range from 0.2 (minimum) to 636 (maximum) ms. » 36 % of all devices are better. This means that the measured response time is similar to the average of all tested devices (33.7 ms). | ||
Screen Flickering / PWM (Pulse-Width Modulation)
| Screen flickering / PWM not detected | 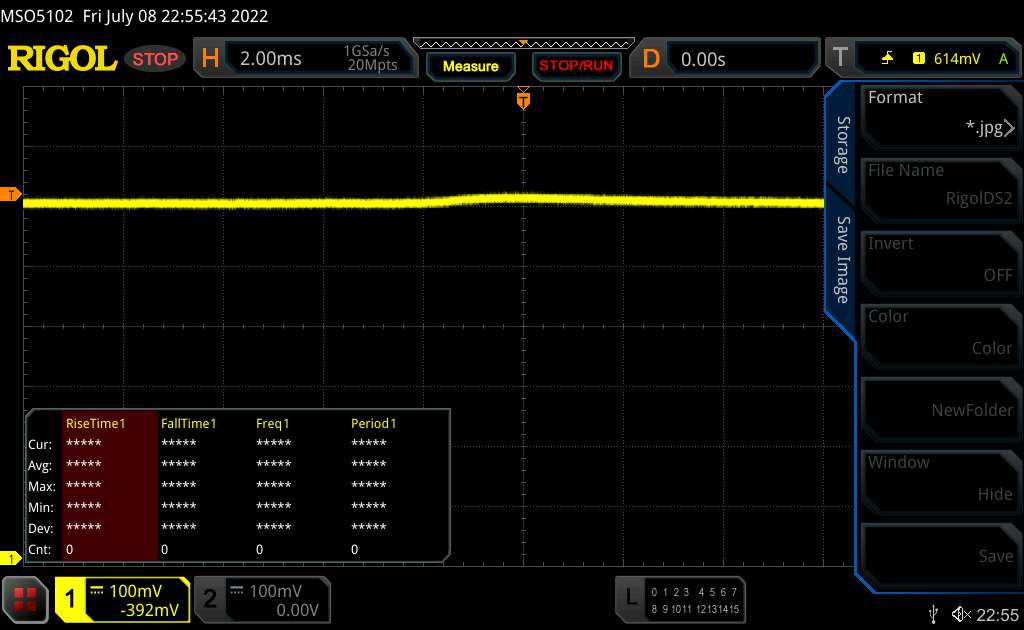 | ||
In comparison: 53 % of all tested devices do not use PWM to dim the display. If PWM was detected, an average of 17900 (minimum: 5 - maximum: 3846000) Hz was measured. | |||
Performance
The 15 Plus is a true mid-range laptop. The components are well balanced in the case of our review configuration, although only offering 8 GB of RAM is already reaching the limits, and it would be best to expand it to 16 GB of dual-channel RAM.
Test conditions
Different profiles are hidden in the preinstalled "My Dell" software under "Performance", "Settings", "Thermals". All of our measurements were performed using the "Optimized" mode, which is active by default. Optionally, the "Cool", "Quiet" and "Ultra Performance" modes are still available.
Processor
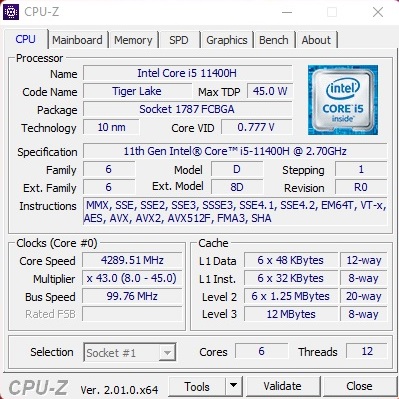
The low-priced version of the Inspiron 15 Plus is equipped with a hexa-core processor (12 threads via Hyper-Threading). The Core i5-11400H is based on Intel's Tiger Lake generation, which is no longer completely up to date. It has 12 MB of L3 cache and a maximum clock rate of 4.5 GHz.
Although speeds remain fairly constant in the Cinebench R15 loop test, the Core i5-11400H can't match the hexa-core competitor from AMD, the Ryzen 5 5600H, in terms of performance. As expected, the more expensive Core i7-11800H octa-core chip is completely out of reach. The same happens with the Ryzen 9 5900HX. However, the Core i5-11400H is perfectly sufficient for typical multimedia tasks, and it delivers a balanced performance.
Cinebench R15 Multi endurance test
* ... smaller is better
AIDA64: FP32 Ray-Trace | FPU Julia | CPU SHA3 | CPU Queen | FPU SinJulia | FPU Mandel | CPU AES | CPU ZLib | FP64 Ray-Trace | CPU PhotoWorxx
| Performance Rating | |
| Asus Zenbook Pro 15 OLED UM535Q | |
| Average of class Multimedia | |
| Asus VivoBook 15 Pro M3500QC-L1062 | |
| Average Intel Core i5-11400H | |
| Dell Inspiron 15 Plus | |
| Dell Inspiron 16 Plus 7610 -9! | |
| Dell XPS 15 9510 11800H RTX 3050 Ti OLED -9! | |
| AIDA64 / FP32 Ray-Trace | |
| Asus Zenbook Pro 15 OLED UM535Q | |
| Average of class Multimedia (3804 - 27411, n=88, last 2 years) | |
| Asus VivoBook 15 Pro M3500QC-L1062 | |
| Average Intel Core i5-11400H (9569 - 10878, n=4) | |
| Dell Inspiron 15 Plus | |
| AIDA64 / FPU Julia | |
| Asus Zenbook Pro 15 OLED UM535Q | |
| Asus VivoBook 15 Pro M3500QC-L1062 | |
| Average of class Multimedia (16379 - 136048, n=88, last 2 years) | |
| Average Intel Core i5-11400H (40926 - 45602, n=4) | |
| Dell Inspiron 15 Plus | |
| AIDA64 / CPU SHA3 | |
| Asus Zenbook Pro 15 OLED UM535Q | |
| Average of class Multimedia (1099 - 6681, n=88, last 2 years) | |
| Average Intel Core i5-11400H (2692 - 3103, n=4) | |
| Dell Inspiron 15 Plus | |
| Asus VivoBook 15 Pro M3500QC-L1062 | |
| AIDA64 / CPU Queen | |
| Asus Zenbook Pro 15 OLED UM535Q | |
| Average of class Multimedia (21547 - 134321, n=88, last 2 years) | |
| Asus VivoBook 15 Pro M3500QC-L1062 | |
| Average Intel Core i5-11400H (69196 - 70253, n=4) | |
| Dell Inspiron 15 Plus | |
| AIDA64 / FPU SinJulia | |
| Asus Zenbook Pro 15 OLED UM535Q | |
| Average of class Multimedia (3099 - 15484, n=88, last 2 years) | |
| Asus VivoBook 15 Pro M3500QC-L1062 | |
| Average Intel Core i5-11400H (7038 - 7214, n=4) | |
| Dell Inspiron 15 Plus | |
| AIDA64 / FPU Mandel | |
| Asus Zenbook Pro 15 OLED UM535Q | |
| Asus VivoBook 15 Pro M3500QC-L1062 | |
| Average of class Multimedia (9602 - 68591, n=88, last 2 years) | |
| Average Intel Core i5-11400H (24039 - 27242, n=4) | |
| Dell Inspiron 15 Plus | |
| AIDA64 / CPU AES | |
| Asus Zenbook Pro 15 OLED UM535Q | |
| Average Intel Core i5-11400H (99449 - 107459, n=4) | |
| Dell Inspiron 15 Plus | |
| Asus VivoBook 15 Pro M3500QC-L1062 | |
| Average of class Multimedia (23702 - 169946, n=88, last 2 years) | |
| AIDA64 / CPU ZLib | |
| Average of class Multimedia (302 - 1901, n=88, last 2 years) | |
| Asus Zenbook Pro 15 OLED UM535Q | |
| Asus VivoBook 15 Pro M3500QC-L1062 | |
| Dell Inspiron 15 Plus | |
| Average Intel Core i5-11400H (531 - 593, n=5) | |
| Dell XPS 15 9510 11800H RTX 3050 Ti OLED | |
| Dell Inspiron 16 Plus 7610 | |
| AIDA64 / FP64 Ray-Trace | |
| Asus Zenbook Pro 15 OLED UM535Q | |
| Average of class Multimedia (1996 - 14590, n=88, last 2 years) | |
| Asus VivoBook 15 Pro M3500QC-L1062 | |
| Average Intel Core i5-11400H (5293 - 5884, n=4) | |
| Dell Inspiron 15 Plus | |
| AIDA64 / CPU PhotoWorxx | |
| Average of class Multimedia (7419 - 53918, n=88, last 2 years) | |
| Asus Zenbook Pro 15 OLED UM535Q | |
| Average Intel Core i5-11400H (8770 - 24104, n=4) | |
| Asus VivoBook 15 Pro M3500QC-L1062 | |
| Dell Inspiron 15 Plus | |
System performance
The poor memory configuration is one of the reasons why the system performance is only good enough for the last place in the test field. Thanks to a faster CPU and 16 instead of 8 GB of RAM, the 16-inch Inspiron 16 Plus sibling model is more than 20% ahead in PCMark 10.
CrossMark: Overall | Productivity | Creativity | Responsiveness
| PCMark 10 / Score | |
| Asus Zenbook Pro 15 OLED UM535Q | |
| Average of class Multimedia (4635 - 8670, n=85, last 2 years) | |
| Dell Inspiron 16 Plus 7610 | |
| Dell XPS 15 9510 11800H RTX 3050 Ti OLED | |
| Asus VivoBook 15 Pro M3500QC-L1062 | |
| Average Intel Core i5-11400H, NVIDIA GeForce RTX 3050 4GB Laptop GPU (5136 - 5895, n=2) | |
| Dell Inspiron 15 Plus | |
| PCMark 10 / Essentials | |
| Average of class Multimedia (8480 - 12420, n=85, last 2 years) | |
| Asus Zenbook Pro 15 OLED UM535Q | |
| Asus VivoBook 15 Pro M3500QC-L1062 | |
| Dell Inspiron 16 Plus 7610 | |
| Dell XPS 15 9510 11800H RTX 3050 Ti OLED | |
| Average Intel Core i5-11400H, NVIDIA GeForce RTX 3050 4GB Laptop GPU (8610 - 9155, n=2) | |
| Dell Inspiron 15 Plus | |
| PCMark 10 / Productivity | |
| Asus Zenbook Pro 15 OLED UM535Q | |
| Average of class Multimedia (5845 - 11186, n=85, last 2 years) | |
| Asus VivoBook 15 Pro M3500QC-L1062 | |
| Dell Inspiron 16 Plus 7610 | |
| Dell XPS 15 9510 11800H RTX 3050 Ti OLED | |
| Average Intel Core i5-11400H, NVIDIA GeForce RTX 3050 4GB Laptop GPU (8149 - 8506, n=2) | |
| Dell Inspiron 15 Plus | |
| PCMark 10 / Digital Content Creation | |
| Average of class Multimedia (4688 - 13548, n=85, last 2 years) | |
| Asus Zenbook Pro 15 OLED UM535Q | |
| Dell Inspiron 16 Plus 7610 | |
| Dell XPS 15 9510 11800H RTX 3050 Ti OLED | |
| Asus VivoBook 15 Pro M3500QC-L1062 | |
| Average Intel Core i5-11400H, NVIDIA GeForce RTX 3050 4GB Laptop GPU (5242 - 7140, n=2) | |
| Dell Inspiron 15 Plus | |
| CrossMark / Overall | |
| Average of class Multimedia (1009 - 2146, n=91, last 2 years) | |
| Asus Zenbook Pro 15 OLED UM535Q | |
| CrossMark / Productivity | |
| Average of class Multimedia (971 - 2064, n=91, last 2 years) | |
| Asus Zenbook Pro 15 OLED UM535Q | |
| CrossMark / Creativity | |
| Average of class Multimedia (1054 - 2865, n=91, last 2 years) | |
| Asus Zenbook Pro 15 OLED UM535Q | |
| CrossMark / Responsiveness | |
| Average of class Multimedia (926 - 2171, n=91, last 2 years) | |
| Asus Zenbook Pro 15 OLED UM535Q | |
| PCMark 10 Score | 5136 points | |
Help | ||
| AIDA64 / Memory Copy | |
| Average of class Multimedia (20513 - 94254, n=88, last 2 years) | |
| Asus Zenbook Pro 15 OLED UM535Q | |
| Asus VivoBook 15 Pro M3500QC-L1062 | |
| Average Intel Core i5-11400H (20513 - 42471, n=4) | |
| Dell Inspiron 15 Plus | |
| AIDA64 / Memory Read | |
| Average of class Multimedia (22917 - 90142, n=88, last 2 years) | |
| Asus VivoBook 15 Pro M3500QC-L1062 | |
| Asus Zenbook Pro 15 OLED UM535Q | |
| Average Intel Core i5-11400H (23172 - 48221, n=4) | |
| Dell Inspiron 15 Plus | |
| AIDA64 / Memory Write | |
| Average of class Multimedia (20226 - 95196, n=88, last 2 years) | |
| Asus Zenbook Pro 15 OLED UM535Q | |
| Asus VivoBook 15 Pro M3500QC-L1062 | |
| Average Intel Core i5-11400H (21862 - 45893, n=4) | |
| Dell Inspiron 15 Plus | |
| AIDA64 / Memory Latency | |
| Average of class Multimedia (75 - 346, n=87, last 2 years) | |
| Asus Zenbook Pro 15 OLED UM535Q | |
| Dell Inspiron 15 Plus | |
| Asus VivoBook 15 Pro M3500QC-L1062 | |
| Average Intel Core i5-11400H (73.3 - 95.9, n=5) | |
| Dell XPS 15 9510 11800H RTX 3050 Ti OLED | |
| Dell Inspiron 16 Plus 7610 | |
* ... smaller is better
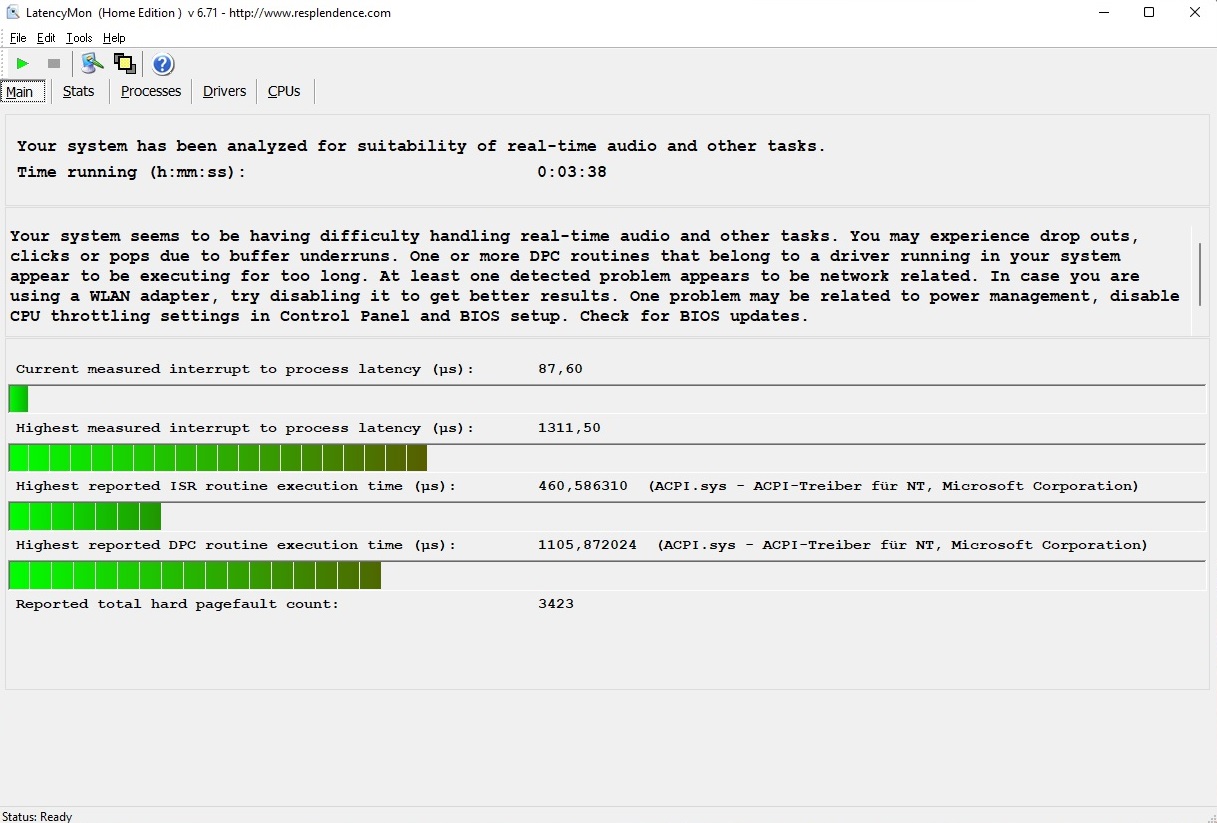
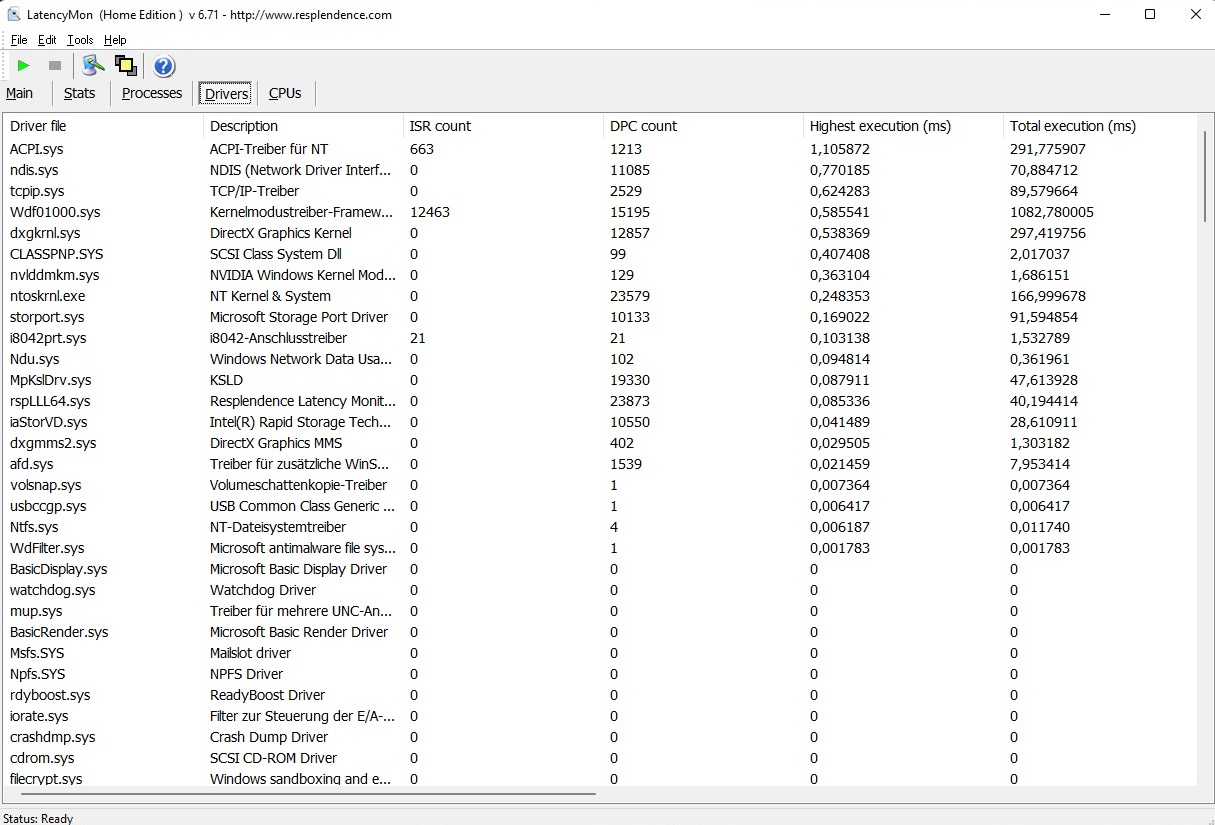
DPC latencies
The 15-incher settles comfortably between its competitors in the latency test. According to the LatencyMon tool, the Inspiron 15 Plus isn't ideal for real-time audio and video editing unless adjustments are made.
| DPC Latencies / LatencyMon - interrupt to process latency (max), Web, Youtube, Prime95 | |
| Dell XPS 15 9510 11800H RTX 3050 Ti OLED | |
| Dell Inspiron 16 Plus 7610 | |
| Dell Inspiron 15 Plus | |
| Asus VivoBook 15 Pro M3500QC-L1062 | |
| Asus Zenbook Pro 15 OLED UM535Q | |
* ... smaller is better
Storage
As expected for a modern laptop, an M.2-based NVMe SSD is used for mass storage. The 512 GB version of the built-in Micron 2450 delivers a decent performance in our benchmark course. In an ideal scenario, sequential speeds of over 2,100 MB/s (read) and 1,300 MB/s (write), respectively, are possible. Users who need more storage space in the long run can add a second M.2 drive to the device.

* ... smaller is better
Continuous load read: DiskSpd Read Loop, Queue Depth 8
Graphics card
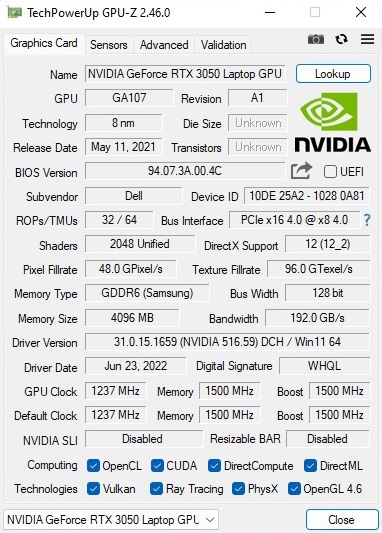
The Nvidia GeForce RTX 3050 is a good graphics card for multimedia laptops. The DirectX 12 model based on the Ampere generation has 2,048 shaders and 4 GB of GDDR6 video memory. Like you would expect from the current Nvidia chips, performance is extremely dependent on the TGP settings. At 65 watts (including Dynamic Boost), Dell has chosen a value that is neither high nor low; instead, it targets the mid-range, which is in line with the overall concept.
There were no irregularities or surprises in the graphics benchmarks. The GPU scores of the 3DMark benchmarks prove that the Inspiron 15 Plus offers a solid performance that is roughly on par with the competition.
Note: We subsequently added a second 8 GB module to the laptop in order to achieve a 16 GB dual-channel configuration for testing purposes. The Physics and Combined scores increased massively as a result in 3DMark 11, and the overall score improved by more than 10% (GPU score almost unchanged).
| 3DMark 11 Performance | 12990 points | |
| 3DMark Cloud Gate Standard Score | 28274 points | |
| 3DMark Fire Strike Score | 10953 points | |
| 3DMark Time Spy Score | 4508 points | |
Help | ||
Gaming performance
The GeForce RTX 3050's gaming performance varies greatly depending on the title, resolution, and quality level. While older or less demanding games like Strange Brigade and Vampire Bloodhunt run smoothly in the native Full HD resolution, even with maximum details, the Inspiron 15 Plus reaches its limits quickly in CPU-intensive or VRAM-heavy games like God of War and Cyberpunk 2077, so that details have to be reduced to a medium level.
In general, you shouldn't expect ray tracing from the RTX 3050. F1 22, for example, stutters heavily at full RT. The poor single-channel RAM becomes apparent once again at moderate settings and resolutions. Other RTX 3050 laptops with a comparable TGP are noticeably ahead in some cases.
| The Witcher 3 | |
| 1920x1080 High Graphics & Postprocessing (Nvidia HairWorks Off) | |
| Average of class Multimedia (11.2 - 290, n=92, last 2 years) | |
| Dell Inspiron 16 Plus 7610 | |
| Asus Zenbook Pro 15 OLED UM535Q | |
| Average NVIDIA GeForce RTX 3050 4GB Laptop GPU (53.5 - 105.1, n=17) | |
| Dell Inspiron 15 Plus | |
| 1920x1080 Ultra Graphics & Postprocessing (HBAO+) | |
| Dell Inspiron 16 Plus 7610 | |
| Average of class Multimedia (8 - 143.2, n=99, last 2 years) | |
| Asus Zenbook Pro 15 OLED UM535Q | |
| Average NVIDIA GeForce RTX 3050 4GB Laptop GPU (31.5 - 55.8, n=21) | |
| Dell Inspiron 15 Plus | |
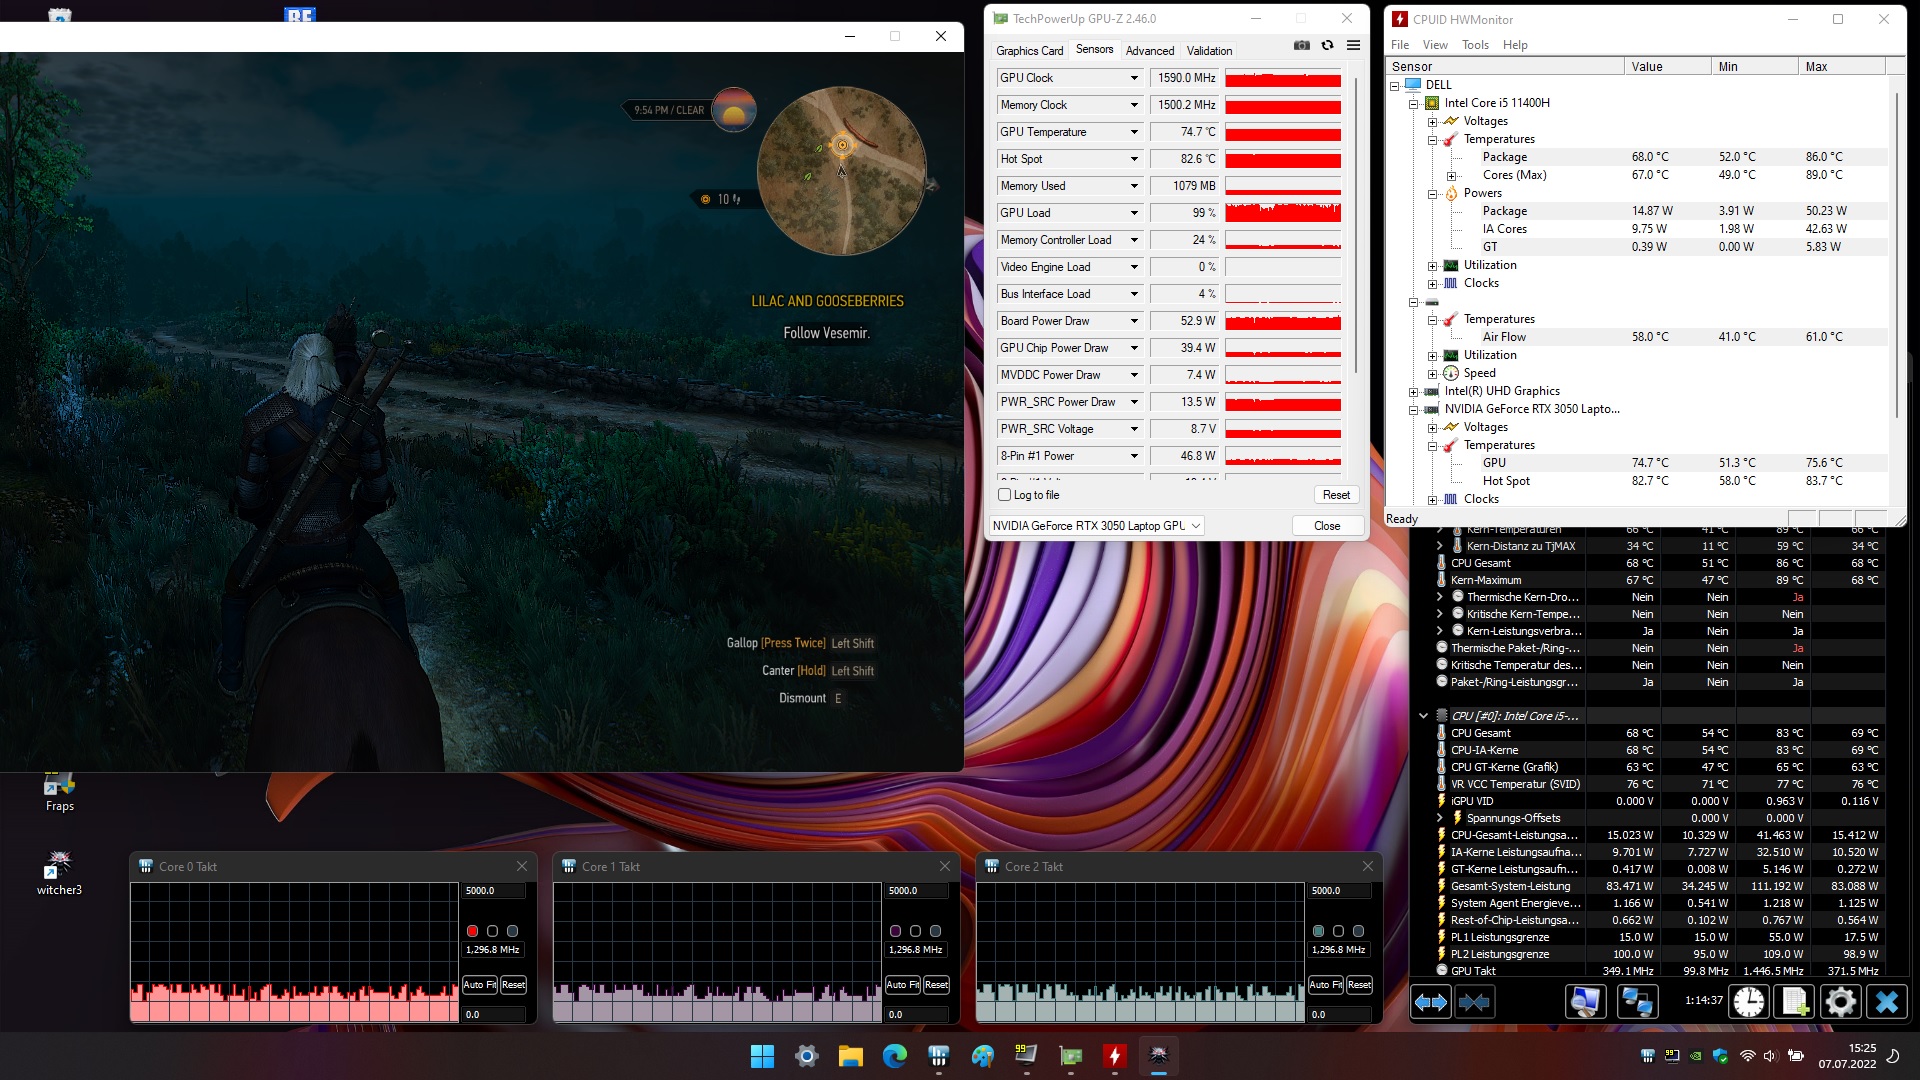
In order to evaluate how 3D performance behaves over a prolonged period of time, we ran the role-playing game The Witcher 3 at maximum settings for a good 60 minutes. You can see from the graph that there were short performance drops or stutters from time to time. A curious fact: After an hour, when the FPS measurement was already over, the CPU also started to throttle (compare with the screenshot in the stress test section).
The Witcher 3 FPS diagram
| low | med. | high | ultra | |
| GTA V (2015) | 117.3 | 96.2 | 58.6 | |
| The Witcher 3 (2015) | 125 | 73.3 | 43.9 | |
| Dota 2 Reborn (2015) | 91.1 | 90.3 | 84 | 82.8 |
| Final Fantasy XV Benchmark (2018) | 51.9 | 40 | ||
| X-Plane 11.11 (2018) | 83.8 | 68.3 | 56 | |
| Far Cry 5 (2018) | 64 | 62 | 58 | |
| Strange Brigade (2018) | 120 | 95.7 | 82.3 | |
| God of War (2022) | 42 | 34.8 | 23.4 | |
| Rainbow Six Extraction (2022) | 87 | 84 | 56 | |
| Dying Light 2 (2022) | 33.7 | 28.5 | ||
| GRID Legends (2022) | 72.4 | 66.4 | 58.8 | |
| Elden Ring (2022) | 38.8 | 37.9 | 37.8 | |
| Cyberpunk 2077 1.6 (2022) | 41.7 | 30.7 | 27.7 | |
| Elex 2 (2022) | 36.9 | 35.9 | 33.2 | |
| Tiny Tina's Wonderlands (2022) | 60 | 46.4 | 35.8 | |
| Vampire Bloodhunt (2022) | 86.7 | 77.2 | 76.6 | |
| F1 22 (2022) | 70 | 61 | 22 | |
| The Quarry (2022) | 49 | 40.3 | 31.7 |
Emissions
Noise emissions
Fan control isn't exactly Dell's best skill. The Inspiron 15 Plus also shows room for improvement here. Although the fans often operate constantly at a decent level for long periods of time in idle usage or are even completely off, the laptop fluctuates between silent/quiet and audible phases (= unnecessary increase in speed) when performing presumably harmless tasks like those related to office work, videos, and web browsing, which might annoy some buyers.
The 15-incher is generally very audible under load. Between 46 and 48 dB(A) represent a clearly audible level, which is somewhat disappointing for a mid-range laptop with the RTX 3050. We would've expected a lower noise level here like with the Asus VivoBook 15 Pro or the Dell XPS 15.
Noise Level
| Idle |
| 26 / 28 / 32 dB(A) |
| Load |
| 47 / 48 dB(A) |
 | ||
30 dB silent 40 dB(A) audible 50 dB(A) loud |
||
min: | ||
| Dell Inspiron 15 Plus i5-11400H, GeForce RTX 3050 4GB Laptop GPU | Dell Inspiron 16 Plus 7610 i7-11800H, GeForce RTX 3050 4GB Laptop GPU | Asus VivoBook 15 Pro M3500QC-L1062 R5 5600H, GeForce RTX 3050 4GB Laptop GPU | Dell XPS 15 9510 11800H RTX 3050 Ti OLED i7-11800H, GeForce RTX 3050 Ti Laptop GPU | Asus Zenbook Pro 15 OLED UM535Q R9 5900HX, GeForce RTX 3050 Ti Laptop GPU | |
|---|---|---|---|---|---|
| Noise | 5% | 9% | 17% | 12% | |
| off / environment * | 26 | 24.4 6% | 24.8 5% | 23.8 8% | 22.8 12% |
| Idle Minimum * | 26 | 24.4 6% | 24.8 5% | 23.8 8% | 22.9 12% |
| Idle Average * | 28 | 24.4 13% | 24.8 11% | 23.8 15% | 22.9 18% |
| Idle Maximum * | 32 | 24.4 24% | 26.4 17% | 23.8 26% | 22.9 28% |
| Load Average * | 47 | 48.3 -3% | 42.8 9% | 36 23% | 33.2 29% |
| Witcher 3 ultra * | 46 | 48.9 -6% | 42.8 7% | 36 22% | 47.3 -3% |
| Load Maximum * | 48 | 48.9 -2% | 42.8 11% | 38.2 20% | 52.8 -10% |
* ... smaller is better
Temperature
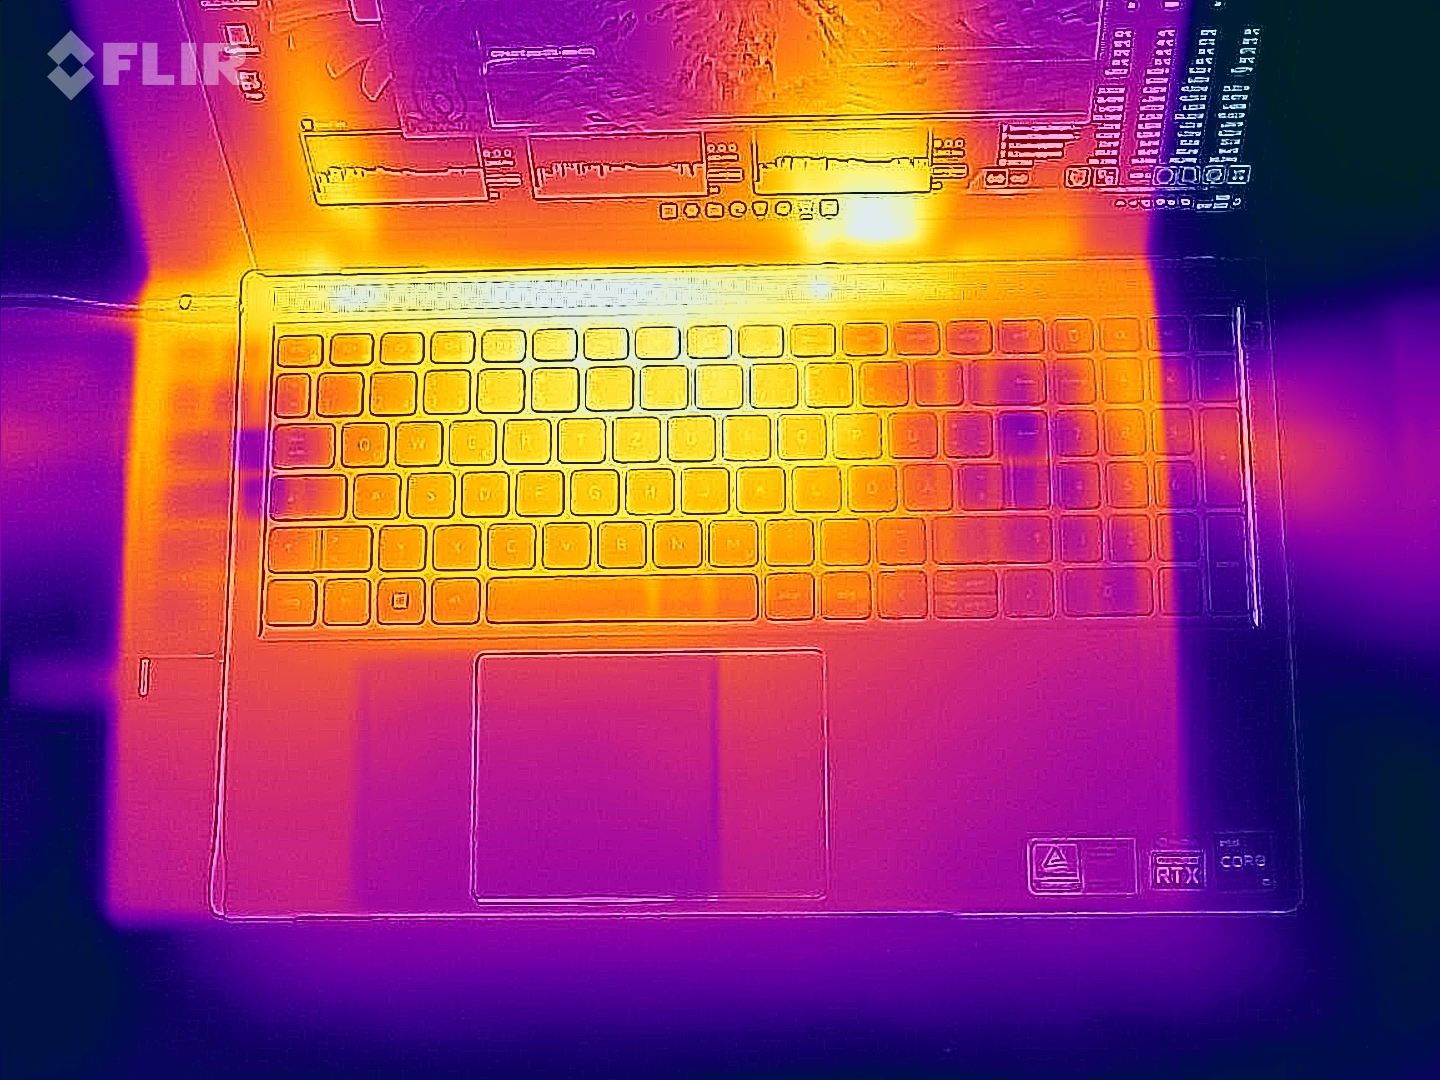
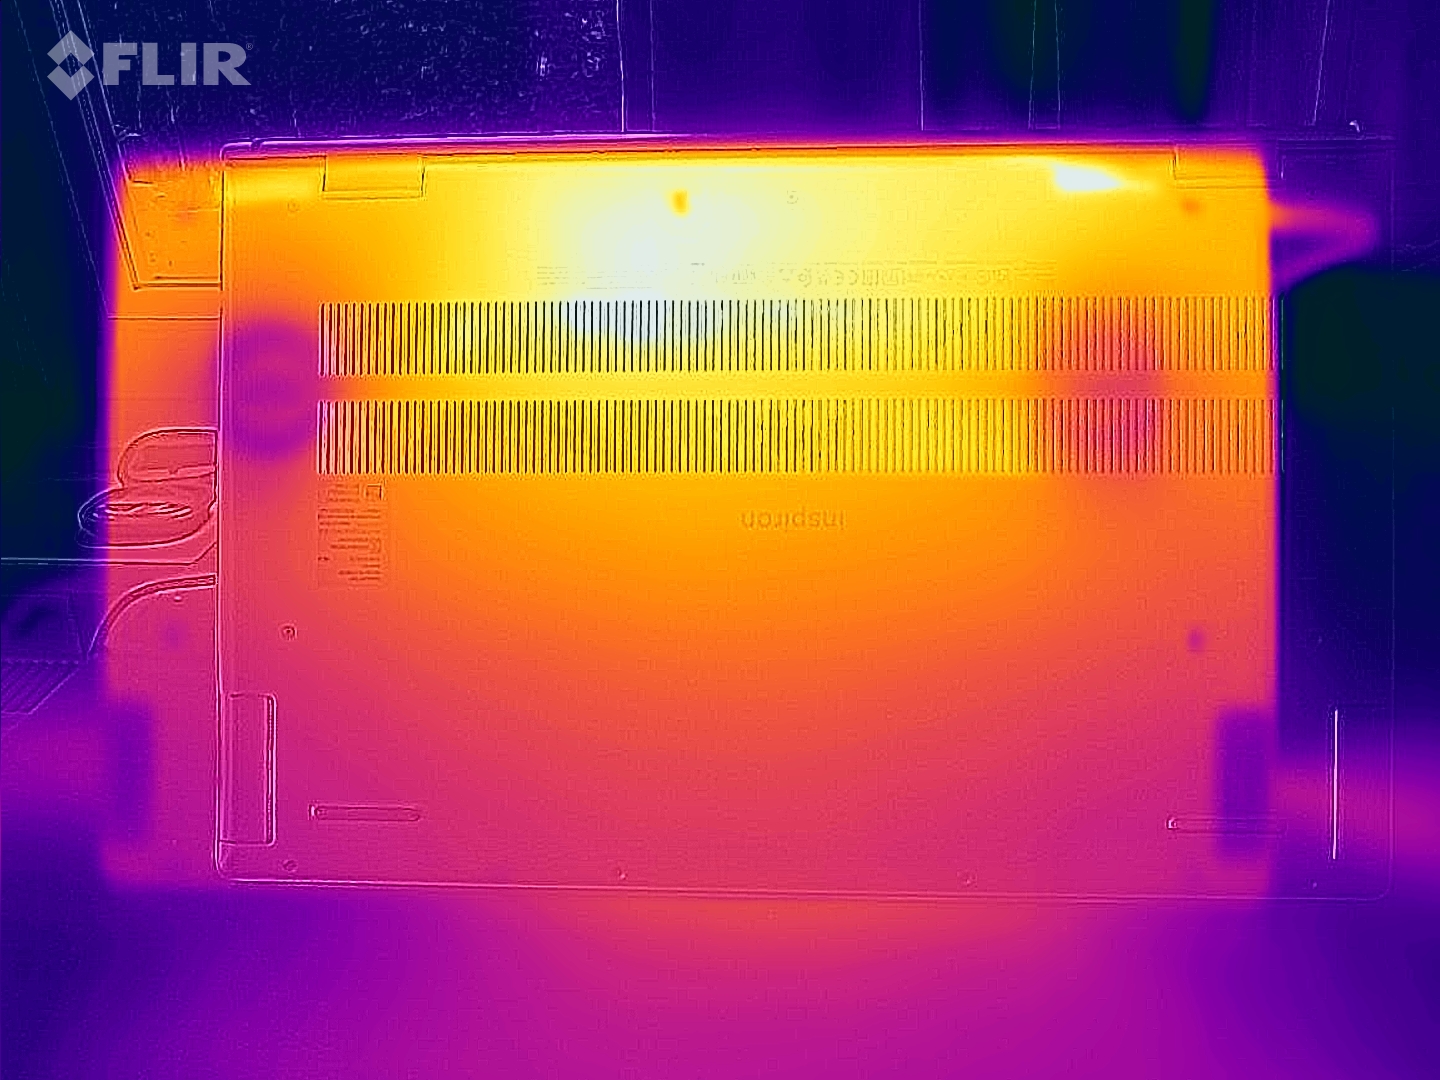
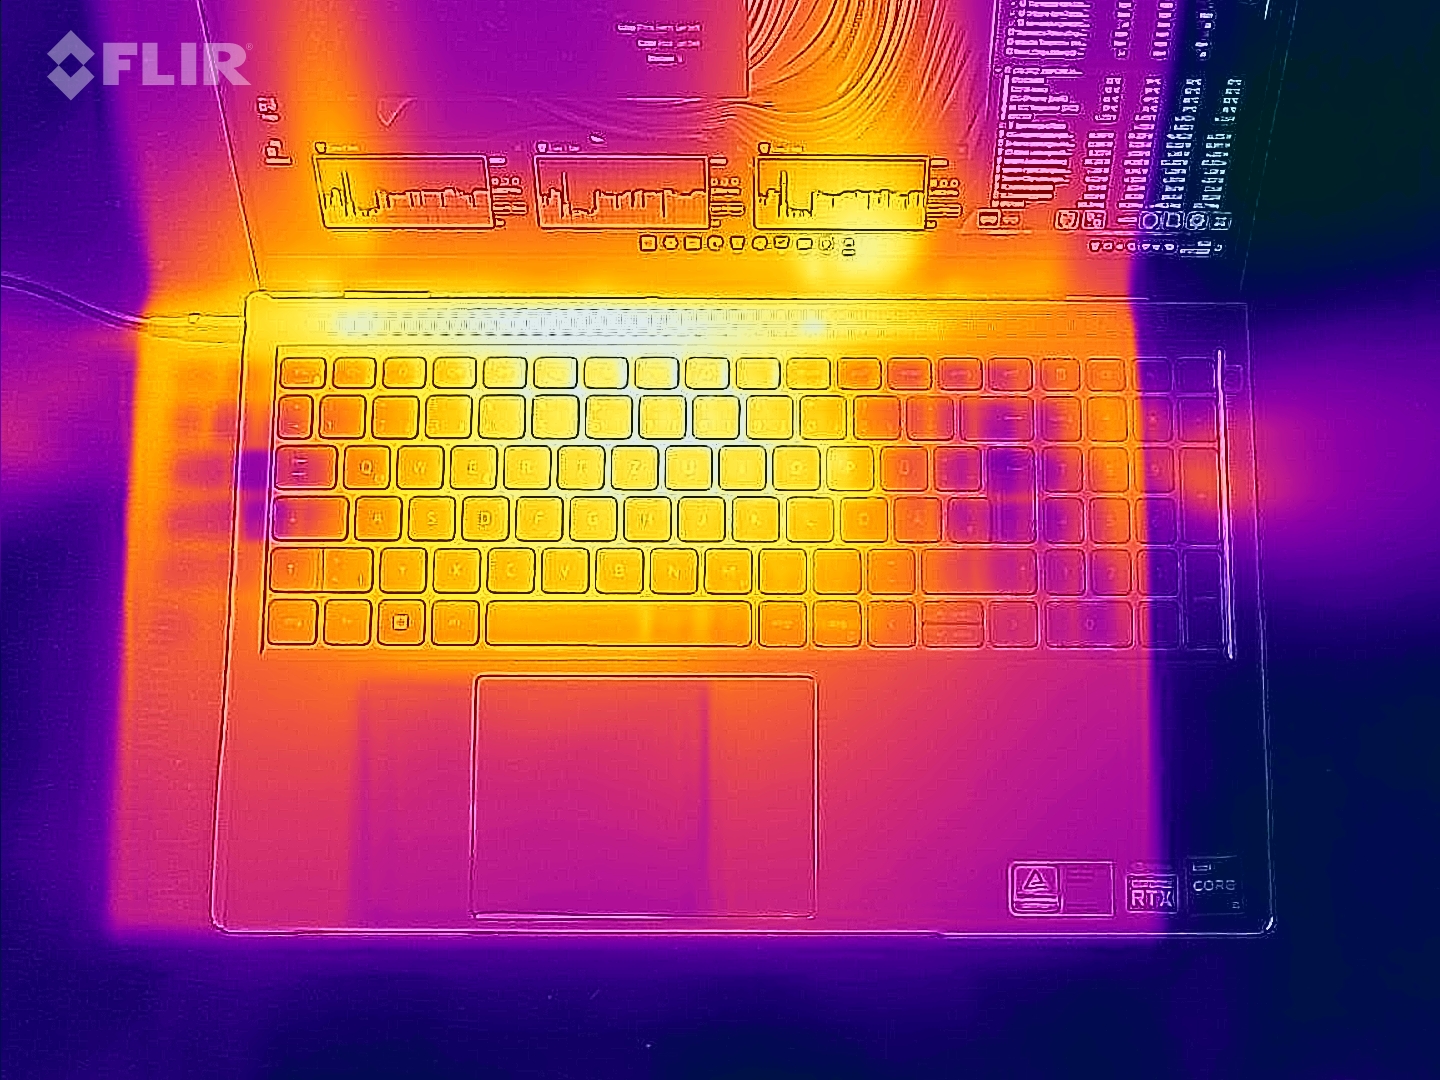
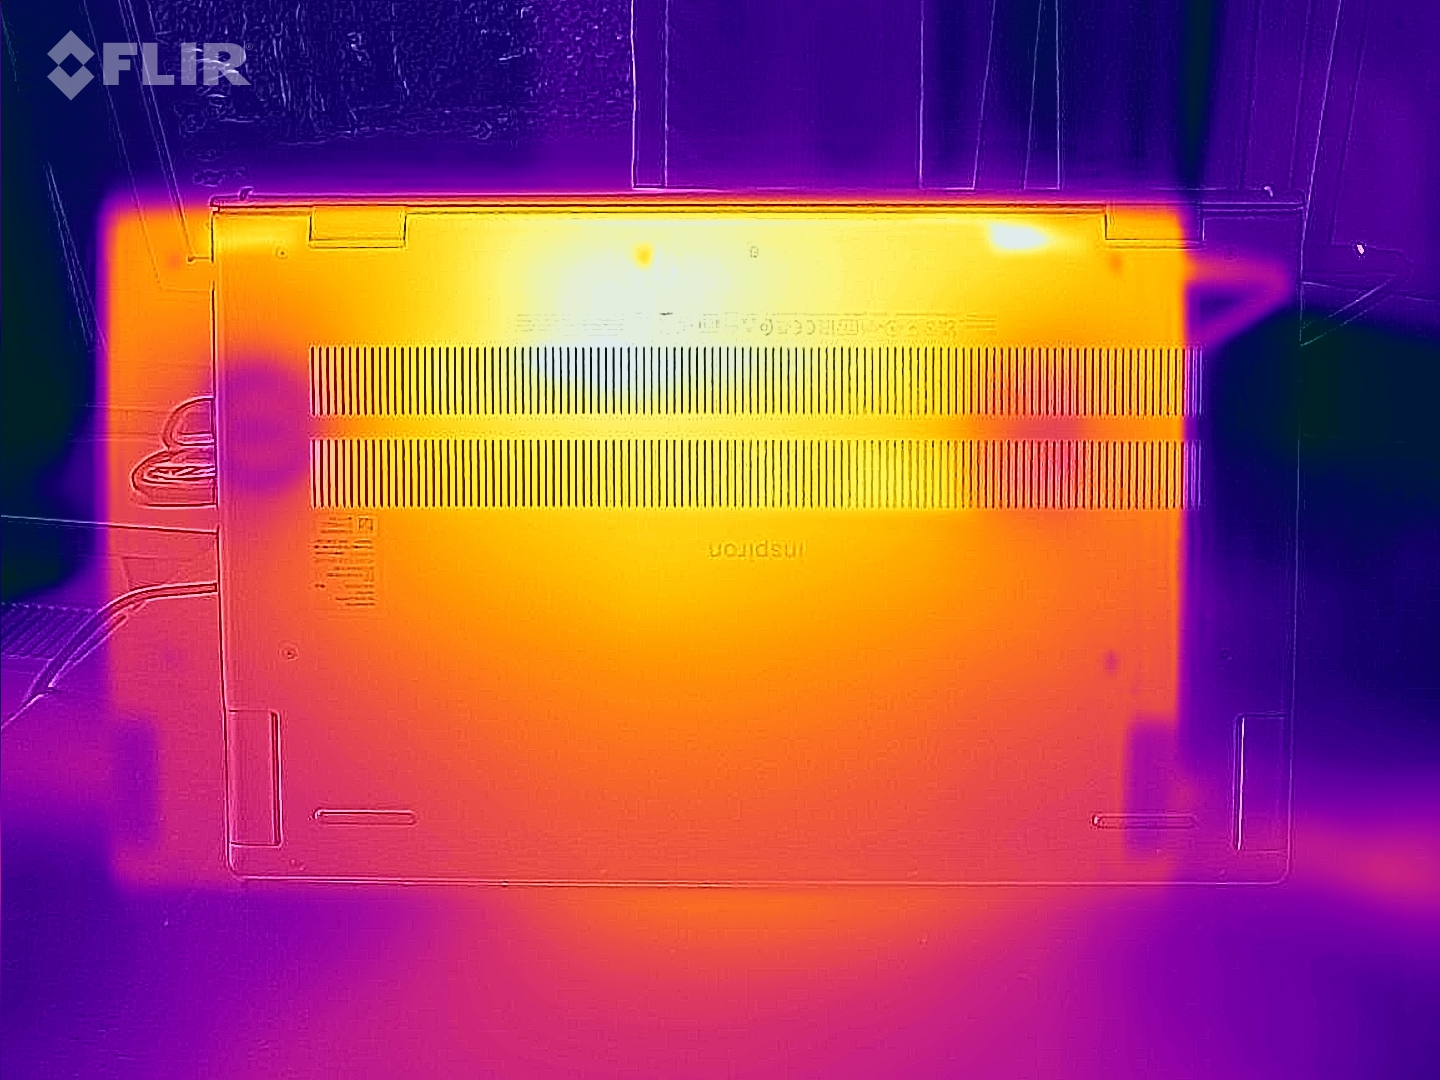
The case temperatures are also above average compared to the competition - and that despite the weaker CPU. In the stress test with the FurMark and Prime95 tools, the top side reached up to 50 °C (~122 °F), and the bottom side up to 51 °C (~124 °F). The idle temperatures of the chassis aren't optimal, either, at 30 °C (~86 °F) to 38 °C (~100 °F).
(-) The maximum temperature on the upper side is 50 °C / 122 F, compared to the average of 36.9 °C / 98 F, ranging from 21.1 to 71 °C for the class Multimedia.
(-) The bottom heats up to a maximum of 51 °C / 124 F, compared to the average of 39.1 °C / 102 F
(±) In idle usage, the average temperature for the upper side is 33.8 °C / 93 F, compared to the device average of 31.2 °C / 88 F.
(-) Playing The Witcher 3, the average temperature for the upper side is 43.8 °C / 111 F, compared to the device average of 31.2 °C / 88 F.
(±) The palmrests and touchpad can get very hot to the touch with a maximum of 37 °C / 98.6 F.
(-) The average temperature of the palmrest area of similar devices was 28.8 °C / 83.8 F (-8.2 °C / -14.8 F).
| Dell Inspiron 15 Plus i5-11400H, GeForce RTX 3050 4GB Laptop GPU | Dell Inspiron 16 Plus 7610 i7-11800H, GeForce RTX 3050 4GB Laptop GPU | Asus VivoBook 15 Pro M3500QC-L1062 R5 5600H, GeForce RTX 3050 4GB Laptop GPU | Dell XPS 15 9510 11800H RTX 3050 Ti OLED i7-11800H, GeForce RTX 3050 Ti Laptop GPU | Asus Zenbook Pro 15 OLED UM535Q R9 5900HX, GeForce RTX 3050 Ti Laptop GPU | |
|---|---|---|---|---|---|
| Heat | 4% | 24% | 19% | 7% | |
| Maximum Upper Side * | 50 | 46.4 7% | 37.8 24% | 45.5 9% | 36 28% |
| Maximum Bottom * | 51 | 54.8 -7% | 48.4 5% | 44.2 13% | 47.2 7% |
| Idle Upper Side * | 38 | 31.4 17% | 24 37% | 27 29% | 37 3% |
| Idle Bottom * | 36 | 36.6 -2% | 25.1 30% | 26.7 26% | 39.2 -9% |
* ... smaller is better
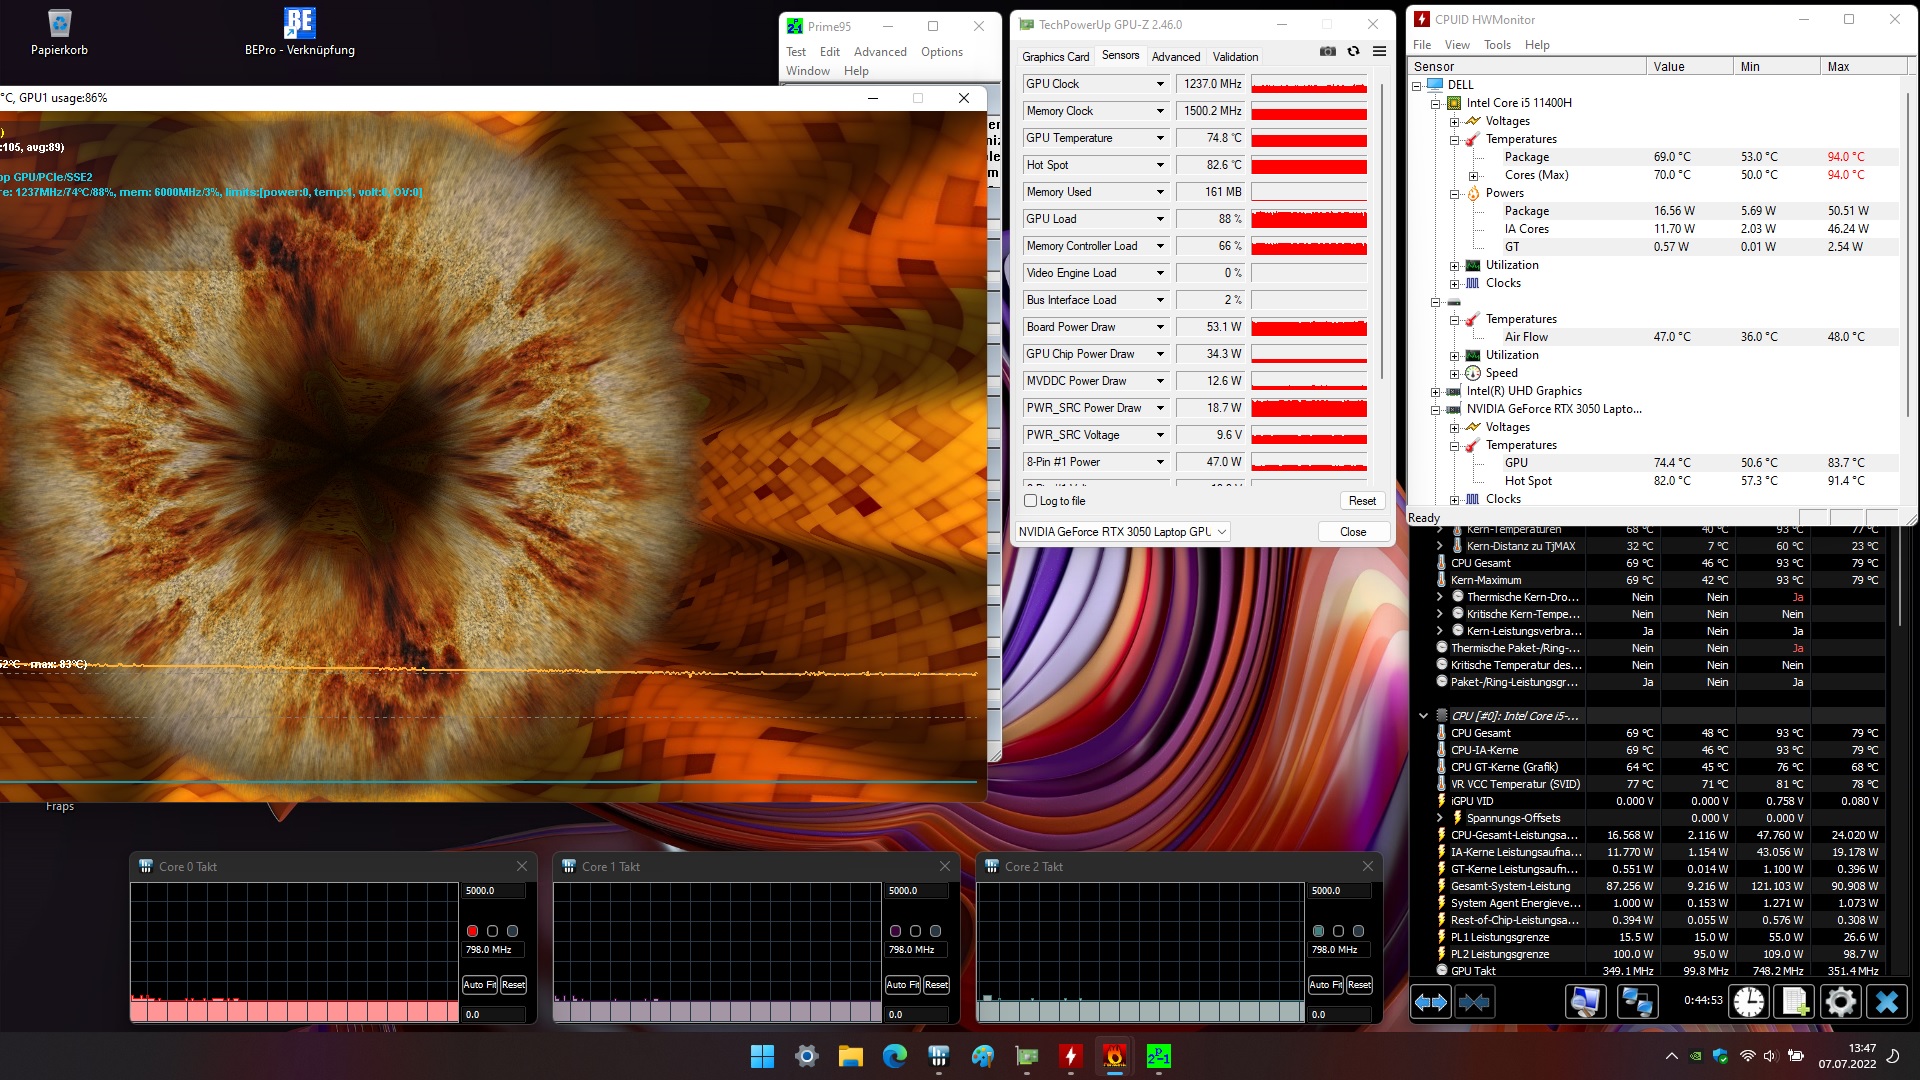
Stress test
A few more words regarding the components: While the GPU clock speed didn't reveal any major fluctuations in the stress test, the CPU throttled down to 800 MHz.
Speakers
With the exception of low tones (weak bass), the Inspiron 15 Plus' sound is definitely respectable. According to our audio analysis, the sound ranks in the upper midfield among multimedia laptops. The maximum volume of 78 dB(A) is decent.
Dell Inspiron 15 Plus audio analysis
(±) | speaker loudness is average but good (78 dB)
Bass 100 - 315 Hz
(-) | nearly no bass - on average 20% lower than median
(±) | linearity of bass is average (8.3% delta to prev. frequency)
Mids 400 - 2000 Hz
(+) | balanced mids - only 3.1% away from median
(+) | mids are linear (5.5% delta to prev. frequency)
Highs 2 - 16 kHz
(+) | balanced highs - only 2.5% away from median
(+) | highs are linear (5.1% delta to prev. frequency)
Overall 100 - 16.000 Hz
(±) | linearity of overall sound is average (17.6% difference to median)
Compared to same class
» 44% of all tested devices in this class were better, 8% similar, 48% worse
» The best had a delta of 5%, average was 18%, worst was 45%
Compared to all devices tested
» 29% of all tested devices were better, 8% similar, 63% worse
» The best had a delta of 4%, average was 25%, worst was 134%
Dell Inspiron 16 Plus 7610 audio analysis
(±) | speaker loudness is average but good (75.3 dB)
Bass 100 - 315 Hz
(±) | reduced bass - on average 14.4% lower than median
(±) | linearity of bass is average (8.4% delta to prev. frequency)
Mids 400 - 2000 Hz
(±) | higher mids - on average 5.6% higher than median
(±) | linearity of mids is average (7.9% delta to prev. frequency)
Highs 2 - 16 kHz
(+) | balanced highs - only 3.9% away from median
(±) | linearity of highs is average (7.2% delta to prev. frequency)
Overall 100 - 16.000 Hz
(±) | linearity of overall sound is average (19.3% difference to median)
Compared to same class
» 57% of all tested devices in this class were better, 9% similar, 34% worse
» The best had a delta of 5%, average was 18%, worst was 45%
Compared to all devices tested
» 41% of all tested devices were better, 8% similar, 51% worse
» The best had a delta of 4%, average was 25%, worst was 134%
Energy management
Energy consumption
Dell still needs to optimize the laptop's energy consumption. 9 to 15 watts in idle usage is a bit more than the competition. Even under load, the 15-incher isn't particularly frugal for a laptop with this configuration.
| Off / Standby | |
| Idle | |
| Load |
|
| Dell Inspiron 15 Plus i5-11400H, GeForce RTX 3050 4GB Laptop GPU | Dell Inspiron 16 Plus 7610 i7-11800H, GeForce RTX 3050 4GB Laptop GPU | Asus VivoBook 15 Pro M3500QC-L1062 R5 5600H, GeForce RTX 3050 4GB Laptop GPU | Dell XPS 15 9510 11800H RTX 3050 Ti OLED i7-11800H, GeForce RTX 3050 Ti Laptop GPU | Asus Zenbook Pro 15 OLED UM535Q R9 5900HX, GeForce RTX 3050 Ti Laptop GPU | Average of class Multimedia | |
|---|---|---|---|---|---|---|
| Power Consumption | -1% | 28% | 15% | 21% | 8% | |
| Idle Minimum * | 9 | 7.7 14% | 4.7 48% | 7.6 16% | 5.5 39% | 7.29 ? 19% |
| Idle Average * | 11 | 10.7 3% | 9.4 15% | 9.9 10% | 7.4 33% | 11.8 ? -7% |
| Idle Maximum * | 15 | 16.8 -12% | 10 33% | 10.8 28% | 14.9 1% | 14.6 ? 3% |
| Load Average * | 97 | 100.39 -3% | 74.3 23% | 81 16% | 78.2 19% | 77.7 ? 20% |
| Witcher 3 ultra * | 100.1 | 108 -8% | 67.7 32% | 76.2 24% | 80.1 20% | |
| Load Maximum * | 129 | 129 -0% | 106.9 17% | 131 -2% | 110.9 14% | 121 ? 6% |
* ... smaller is better
Energy consumption during The Witcher 3 / stress test
Energy consumption with an external monitor
Battery life
Although the Inspiron 15 Plus features graphics switching (Nvidia Optimus), battery life is only moderate. The combination of above-average power consumption and modest battery capacity prevent the device from achieving compelling rates. It's impossible to squeeze more than 9 hours out of a single charge under ideal conditions (no load, minimum brightness).
In real-world scenarios, such as Internet browsing over Wi-Fi (brightness reduced to 150 cd/m²), you can expect around 6 hours - not a great result, either. The 16-inch sibling model manages around 10 hours thanks to its larger battery (86 Wh vs 56 Wh).
| Dell Inspiron 15 Plus i5-11400H, GeForce RTX 3050 4GB Laptop GPU, 56 Wh | Dell Inspiron 16 Plus 7610 i7-11800H, GeForce RTX 3050 4GB Laptop GPU, 86 Wh | Asus VivoBook 15 Pro M3500QC-L1062 R5 5600H, GeForce RTX 3050 4GB Laptop GPU, 63 Wh | Dell XPS 15 9510 11800H RTX 3050 Ti OLED i7-11800H, GeForce RTX 3050 Ti Laptop GPU, 86 Wh | Asus Zenbook Pro 15 OLED UM535Q R9 5900HX, GeForce RTX 3050 Ti Laptop GPU, 96 Wh | Average of class Multimedia | |
|---|---|---|---|---|---|---|
| Battery Runtime | 123% | 21% | 31% | 168% | 57% | |
| Reader / Idle | 528 | 1230 133% | 1571 198% | 933 ? 77% | ||
| WiFi v1.3 | 356 | 591 66% | 498 40% | 420 18% | 766 115% | 572 ? 61% |
| Load | 74 | 199 169% | 75 1% | 106 43% | 215 191% | 97.7 ? 32% |
| H.264 | 725 | 624 | 710 ? | |||
| Witcher 3 ultra | 74 | 81.8 ? |
Pros
Cons
Verdict
The Dell Inspiron 15 Plus theoretically has the potential to be a jack of all trades.
Apart from the workmanship defects that our review sample had (paint damage, uneven touchpad edges), the high-quality case looks stylish, and it can be carried around quite well due to its moderate dimensions and reasonable weight. Most buyers will also be satisfied with the input devices and sound.
However, the fact that the final score is only "Good" and not "Very Good" is mainly due to the poor battery life. The connectivity, the fan control, and the rates under load (temperature, clock rate, ...) could be better as well.
Nevertheless, the Inspiron 15 Plus is recommended for budget-conscious users who are looking for a mobile and versatile all-rounder laptop (e.g. students).
Alternatively, it's worth taking a look at the Asus VivoBook 15 Pro with a (glossy) OLED display when it comes to the 1,000-Euro (~$1,008) range.
Price and availability
At the time of writing, the Dell Inspiron 15 Plus 7510 doesn't seem to be available in the United States. Nevertheless, you can keep an eye on sites like Amazon to see if the device pops up there.
Dell Inspiron 15 Plus
-
07/12/2022 v7
Florian Glaser
Pricecompare

