Asus TUF Gaming A14 FA401WV review: Zen 5 Ryzen 9 continues to impress

14-inch gaming laptops were relatively uncommon just a few years ago, but there are now a handful of options to choose from with many of them coming from Asus. The latest is the TUF Gaming A14 FA401 which ships with AMD Zen 5 CPU options. When compared to the flagship ROG Zephyrus G14 series, the midrange TUF Gaming A14 series doesn't include enthusiast-level GPU or display options in order to keep prices in check for budget-conscious gamers.
The TUF Gaming A14 is also the first 14-inch model in the TUF Gaming family to complement the larger 15.6-inch TUF Gaming A15, 16-inch TUF Gaming A16, and 17.3-inch TUF Gaming A17.
Our test unit is equipped with the Ryzen AI 9 HX 370 CPU, 100 W GeForce RTX 4060 GPU, and 2560 x 1600 165 Hz IPS display for approximately $1500. While a lesser Zen 4 Ryzen 7 8845HS configuration is available, the GPU, display, and 16 GB of soldered RAM are fixed across all options.
Alternatives include other 14-inch gaming laptops the Razer Blade 14, HP Omen Transcend 14, Acer Predator Helios Neo 14, or Lenovo Legion Slim 5 14.
More Asus reviews:
Potential Competitors in Comparison
Rating | Version | Date | Model | Weight | Height | Size | Resolution | Price |
|---|---|---|---|---|---|---|---|---|
| 80.3 % | v8 | 08 / 2024 | Asus TUF Gaming A14 FA401WV-WB94 Ryzen AI 9 HX 370, GeForce RTX 4060 Laptop GPU | 1.5 kg | 19.9 mm | 14.00" | 2560x1600 | |
| 93 % v7 (old) | v7 (old) | 02 / 2024 | Asus ROG Zephyrus G14 2024 GA403U R9 8945HS, GeForce RTX 4070 Laptop GPU | 1.5 kg | 16.3 mm | 14.00" | 2880x1800 | |
| 80.5 % | v8 | 08 / 2024 | Acer Predator Helios Neo 14 (2024) Ultra 9 185H, GeForce RTX 4070 Laptop GPU | 1.9 kg | 20.9 mm | 14.50" | 3072x1920 | |
| 88.5 % v7 (old) | v7 (old) | 03 / 2024 | HP Omen Transcend 14-fb0014 Ultra 7 155H, GeForce RTX 4060 Laptop GPU | 1.6 kg | 18 mm | 14.00" | 2880x1800 | |
| 89.7 % v7 (old) | v7 (old) | 02 / 2024 | Razer Blade 14 RZ09-0508 R9 8945HS, GeForce RTX 4070 Laptop GPU | 1.9 kg | 17.99 mm | 14.00" | 2560x1600 | |
| 87.7 % v7 (old) | v7 (old) | 09 / 2023 | Lenovo Legion Slim 5 14APH8 R7 7840HS, GeForce RTX 4060 Laptop GPU | 1.7 kg | 20.79 mm | 14.50" | 2880x1600 |
Hinweis: Wir haben unser Rating-System kürzlich aktualisiert und die Ergebnisse von Version 8 sind nicht mit den Ergebnissen von Version 7 vergleichbar. Weitere Informationen dazu sind hier verfügbar.
Note: We have recently updated our rating system and the results of version 8 are not comparable with the results of version 7. More information is available here .
Case — Built Ford TUF
The chassis utilizes plastic for the keyboard deck and palm rests while the bottom plate and outer lid are aluminum. This is in contrast to the pricier Blade 14 or Zephyrus G14 which are mostly metal. The plastic deck doesn't feel as luxurious as a result, but build quality is still excellent with no noticeable creaking and only minor twisting of the base.
The hinges could use some more work as they don't feel as strong as on the Blade 14. We can notice a bit of creaking and teetering when adjusting angles while the average rigidity may not fare well in the long term.
Interestingly, Asus has moved the four LED indicators to the rear of the system whereas they are almost always next to the Power button on most other laptops. This means that the indicators are only visible from behind which is not very helpful when you're in front of the screen.

The model is slightly thicker and larger than its pricier ROG Zephyrus G14 sibling. Even so, they actually weigh about the same despite their size differences which makes the TUF Gaming A14 one of the lighter 14-inch gaming laptops in the market regardless of price point. Alternatives like the 14.5-inch Lenovo Legion Slim 5 or HP Omen Transcend 14 are larger and heavier.


Connectivity
Port options and positioning are identical to the 2024 Zephyrus G14. We particularly appreciate the MicroSD reader to cater to content creators as many other 14-inch gaming laptops like the Blade 14 or Omen Transcend 14 lack the feature.
Note that only the left USB-C port supports Power Delivery while the right USB-C port is the slower 10 Gbps version with only DisplayPort.


SD Card Reader
The integrated MicroSD reader supports very fast transfer rates of over 200 MB/s, but real-world performance is much slower by almost one-fourth when moving 1 GB of photos from our UHS-II MicroSD card. Results would not improve even after multiple retests.

| SD Card Reader | |
| average JPG Copy Test (av. of 3 runs) | |
| Alienware x14 i7 RTX 3060 (Angelbird AV Pro V60) | |
| Asus ROG Zephyrus G14 2024 GA403U (Angelbird AV Pro V60) | |
| Lenovo Legion Slim 5 14APH8 (Toshiba Exceria Pro SDXC 64 GB UHS-II) | |
| Asus TUF Gaming A14 FA401WV-WB94 (Angelbird AV Pro V60) | |
| Acer Predator Helios Neo 14 (2024) (AV PRO microSD 128 GB V60) | |
| maximum AS SSD Seq Read Test (1GB) | |
| Asus TUF Gaming A14 FA401WV-WB94 (Angelbird AV Pro V60) | |
| Alienware x14 i7 RTX 3060 (Angelbird AV Pro V60) | |
| Asus ROG Zephyrus G14 2024 GA403U (Angelbird AV Pro V60) | |
| Lenovo Legion Slim 5 14APH8 (Toshiba Exceria Pro SDXC 64 GB UHS-II) | |
| Acer Predator Helios Neo 14 (2024) (AV PRO microSD 128 GB V60) | |
Communication
The MediaTek MT7922 comes standard for Wi-Fi 6E and Bluetooth 5.3 connectivity. Transfer rates are steady and reliable when testing Wi-Fi 6 and 6E networks, but speeds with the latter are noticeably faster.

Webcam
A 2 MP webcam and IR sensor come standard. There is no camera shutter unlike on most other laptops.


Maintenance
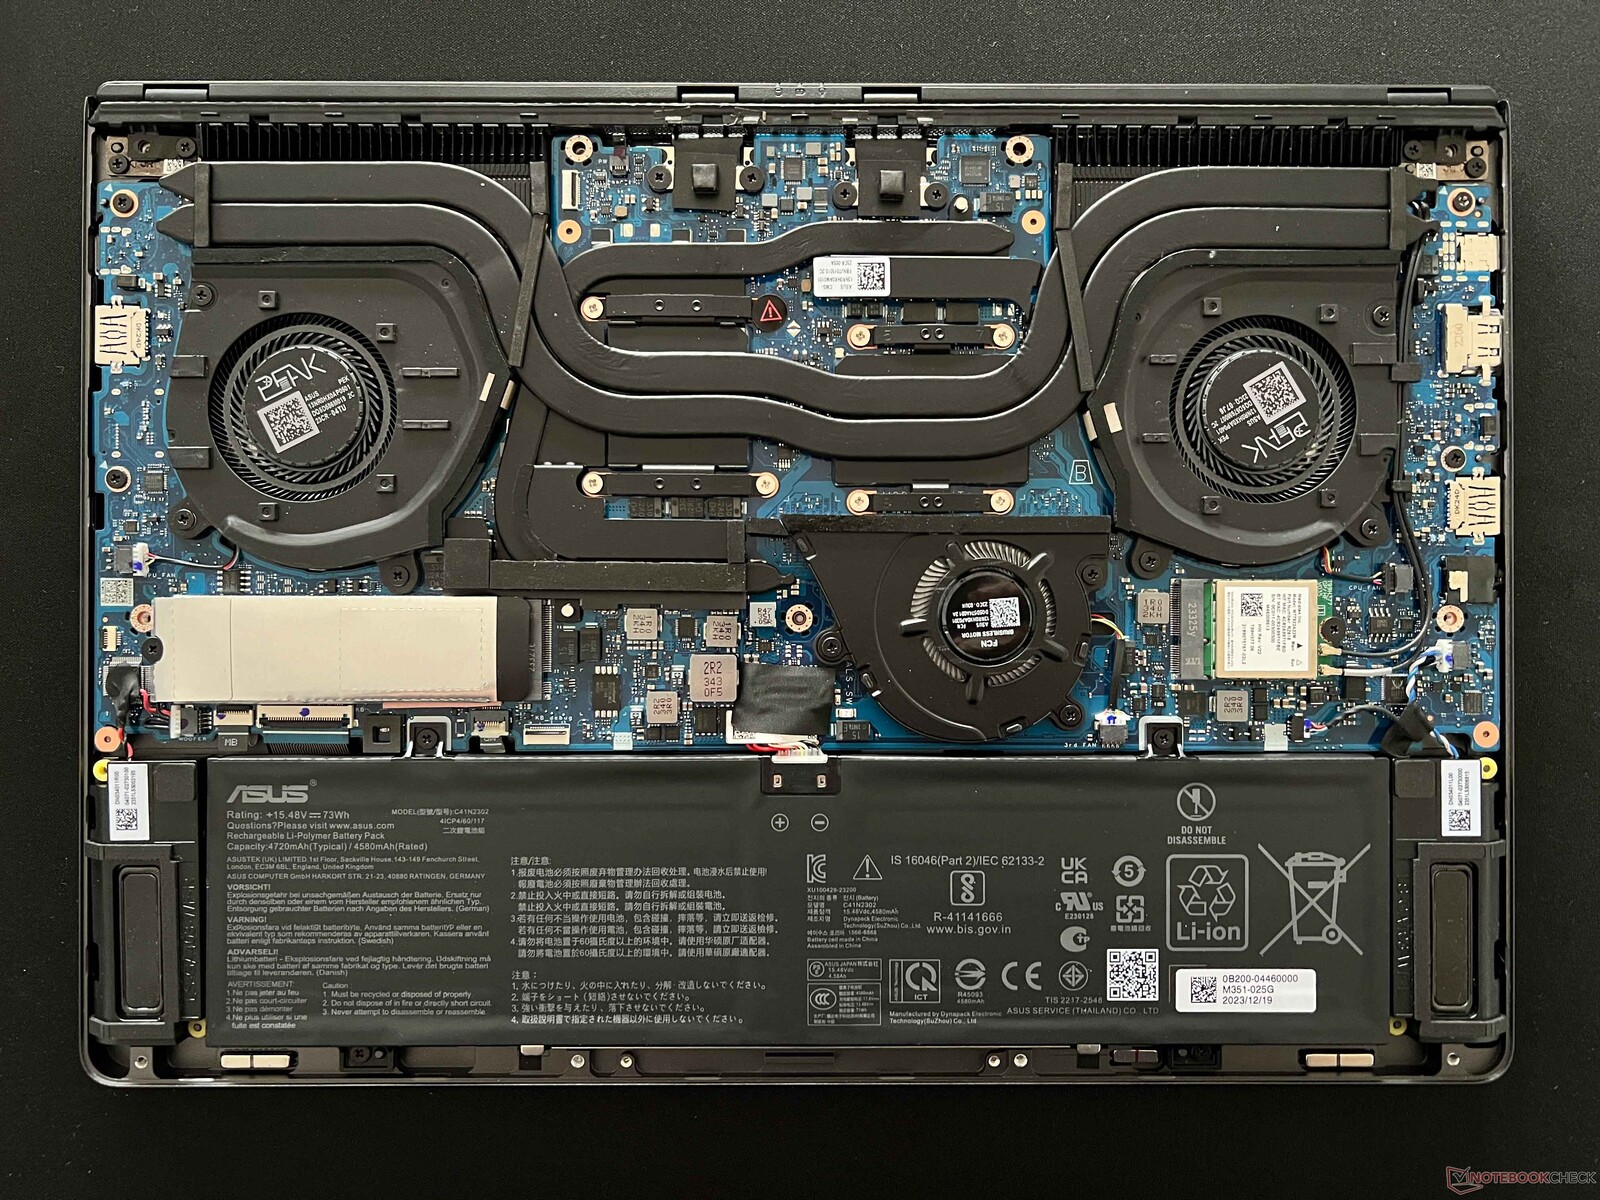
The bottom panel is secured by 11 Phillips screws for easy servicing. The motherboard layout has a lot in common with the recent 2024 Zephyrus G14 as shown by the comparison shots below, but the TUF model omits the third fan in favor of a second M.2 2280 PCIe4 x2 SSD expansion slot to be one of the very few 14-inch gaming laptops available to support two full-length M.2 SSDs. Based on our temperature observations, however, the system could have likely benefited from additional cooling.


Sustainability
The packaging is fully recyclable and mostly cardboard with some plastic wrapping for the AC adapter. We can find no information on CO2 emissions or use of recycled materials for manufacturing.
Accessories And Warranty
There are no extras in the box other than the AC adapter and paperwork. The usual one-year limited warranty applies if purchased in the US.
Input Devices — More Comfortable Than Expected
Keyboard
The keyboard is surprisingly more comfortable to type on than most traditional multimedia subnotebooks like the Lenovo IdeaPad Slim 5 or Dell XPS 14. This can be attributed to the relatively deep 1.7 mm key travel and sharp feedback especially from the Space and Enter keys. The font contrasts poorly with the black key caps, but this can fortunately be negated by toggling the backlight.
Single-zone white backlighting comes standard with no per-key RGB or even RGB options unlike on most other gaming laptops.
Touchpad
The glass clickpad is ever-so-slightly smaller than the one on the ROG Zephyrus G14 (12.7 x 7.8 cm vs. 12.7 x 8 cm), but it's still spacious for a 14-inch form factor. Traction is smooth with only a bit of sticking at slower speeds for more accurate clicking and dragging. Feedback when clicking is sharper and firmer than expected to be more satisfying to use than the softer but even larger clickpad on the Blade 14.


Display — Fit For Balanced Gaming
The BOE NE140QDM-NX7 IPS panel is similar to the one available on the Acer Predator Triton 14. You can tell that this panel was specifically designed for gaming because of its its high 165 Hz refresh rate and fast response times to reduce ghosting. It targets sRGB colors instead of AdobeRGB or P3 to keep costs down, but this won't impact the gaming experience for most users. Perhaps its biggest drawback is the lack of HDR support, but Asus wants you to upgrade to the ROG Zephyrus G14 for such advanced features.
While G-Sync is supported, Windows Variable Refresh Rate (VRR) is not. The 165 Hz and 60 Hz refresh rate settings are therefore fixed with no variable option to save on power.


| |||||||||||||||||||||||||
Brightness Distribution: 93 %
Center on Battery: 455.8 cd/m²
Contrast: 1199:1 (Black: 0.38 cd/m²)
ΔE ColorChecker Calman: 3.39 | ∀{0.5-29.43 Ø4.75}
calibrated: 1.67
ΔE Greyscale Calman: 3.9 | ∀{0.09-98 Ø5}
65.6% AdobeRGB 1998 (Argyll 3D)
94% sRGB (Argyll 3D)
65.1% Display P3 (Argyll 3D)
Gamma: 2.17
CCT: 7340 K
| Asus TUF Gaming A14 FA401WV-WB94 BOE NE140QDM-NX7, IPS, 2560x1600, 14", 165 Hz | Asus ROG Zephyrus G14 2024 GA403U ATNA40CU05-0, OLED, 2880x1800, 14", 120 Hz | HP Omen Transcend 14-fb0014 Samsung SDC4197, OLED, 2880x1800, 14", 120 Hz | Razer Blade 14 RZ09-0508 TL140ADXP04-0, IPS, 2560x1600, 14", 240 Hz | Lenovo Legion Slim 5 14APH8 Samsung SDC ATNA45AF02-2, OLED, 2880x1600, 14.5", 120 Hz | Alienware x14 i7 RTX 3060 SHP154D, IPS, 1920x1080, 14", 144 Hz | |
|---|---|---|---|---|---|---|
| Display | 32% | 35% | 28% | 35% | 31% | |
| Display P3 Coverage (%) | 65.1 | 99.6 53% | 99.6 53% | 96.9 49% | 99.9 53% | 99.6 53% |
| sRGB Coverage (%) | 94 | 100 6% | 100 6% | 99.8 6% | 100 6% | 100 6% |
| AdobeRGB 1998 Coverage (%) | 65.6 | 89.9 37% | 96.1 46% | 85 30% | 96.5 47% | 87.6 34% |
| Response Times | 92% | 89% | 14% | 90% | 2% | |
| Response Time Grey 50% / Grey 80% * (ms) | 10.7 ? | 0.62 ? 94% | 0.86 ? 92% | 6 ? 44% | 0.79 ? 93% | 9.6 ? 10% |
| Response Time Black / White * (ms) | 7.1 ? | 0.68 ? 90% | 0.99 ? 86% | 8.3 ? -17% | 1.01 ? 86% | 7.6 ? -7% |
| PWM Frequency (Hz) | 960 ? | 479 ? | 240.5 ? | |||
| Screen | 469% | 10% | 22% | 11% | 12% | |
| Brightness middle (cd/m²) | 455.8 | 423 -7% | 386.3 -15% | 484.1 6% | 377.5 -17% | 434 -5% |
| Brightness (cd/m²) | 436 | 424 -3% | 389 -11% | 466 7% | 381 -13% | 411 -6% |
| Brightness Distribution (%) | 93 | 98 5% | 98 5% | 89 -4% | 97 4% | 89 -4% |
| Black Level * (cd/m²) | 0.38 | 0.01 97% | 0.38 -0% | 0.25 34% | ||
| Contrast (:1) | 1199 | 42300 3428% | 1274 6% | 1736 45% | ||
| Colorchecker dE 2000 * | 3.39 | 0.7 79% | 4.03 -19% | 2.23 34% | 4.19 -24% | 3 12% |
| Colorchecker dE 2000 max. * | 7.3 | 1.8 75% | 6.69 8% | 4.57 37% | 7.02 4% | 7.1 3% |
| Colorchecker dE 2000 calibrated * | 1.67 | 1.07 36% | 0.74 56% | 0.81 51% | 0.7 58% | |
| Greyscale dE 2000 * | 3.9 | 0.8 79% | 1.2 69% | 1.6 59% | 1.2 69% | 5.1 -31% |
| Gamma | 2.17 101% | 2.18 101% | 2.25 98% | 2.24 98% | 2.22 99% | 2.19 100% |
| CCT | 7340 89% | 6505 100% | 6280 104% | 6816 95% | 6296 103% | 6204 105% |
| Total Average (Program / Settings) | 198% /
310% | 45% /
30% | 21% /
22% | 45% /
30% | 15% /
14% |
* ... smaller is better


The display does not come pre-calibrated and so color temperature is slightly too cool out of the box. Calibrating with our X-Rite colorimeter addresses this shortcoming to reduce grayscale and color deltaE values from 3.9 and 3.39 to 3.0 and 1.67, respectively. The improvements aren't particularly significant and so the display should be fine for most gaming and amateur editing purposes as is.


Display Response Times
| ↔ Response Time Black to White | ||
|---|---|---|
| 7.1 ms ... rise ↗ and fall ↘ combined | ↗ 3.9 ms rise |  |
| ↘ 3.2 ms fall | ||
| The screen shows very fast response rates in our tests and should be very well suited for fast-paced gaming. In comparison, all tested devices range from 0.1 (minimum) to 240 (maximum) ms. » 20 % of all devices are better. This means that the measured response time is better than the average of all tested devices (20.1 ms). | ||
| ↔ Response Time 50% Grey to 80% Grey | ||
| 10.7 ms ... rise ↗ and fall ↘ combined | ↗ 5 ms rise |  |
| ↘ 5.7 ms fall | ||
| The screen shows good response rates in our tests, but may be too slow for competitive gamers. In comparison, all tested devices range from 0.165 (minimum) to 636 (maximum) ms. » 24 % of all devices are better. This means that the measured response time is better than the average of all tested devices (31.4 ms). | ||
Screen Flickering / PWM (Pulse-Width Modulation)
| Screen flickering / PWM not detected |  | ||
In comparison: 53 % of all tested devices do not use PWM to dim the display. If PWM was detected, an average of 7996 (minimum: 5 - maximum: 343500) Hz was measured. | |||
Outdoor visibility is decent and most similar to the Blade 14 or Alienware x14 each equipped with IPS panels of similar maximum brightness levels. Overcast or brighter will wash out colors even if glare is a minimum.


Performance — Faster Than It Looks


Testing Conditions
We set Armoury Crate to Turbo mode and the graphics to dGPU mode prior to running the benchmarks below. Turbo mode is necessary to obtaining the full performance of the system as our tests will show. Owners are encouraged to become familiar with Armoury Crate as it is the hub for adjusting power profiles, GPU modes, lighting profiles, and more. More general settings related to the battery, diagnostics, or warranty can be found through the separate MyAsus app.
Both MUX and Advanced Optimus are supported. Nonetheless, switching between dGPU mode and MSHybrid mode still requires a reboot.


Processor
The Ryzen AI 9 HX 370 propels the TUF Gaming A14 to be one of the fastest 14-inch gaming laptops currently available besting even the Core Ultra 9 185H by a comfortable 30 percent margin. This is definitely alleviating after the disappointing mobile Ryzen 8000 H-series brought almost no gains over the mobile Ryzen 7000 H-series in terms of raw processor performance. Even more impressive is the CPU's ability to maintain high Turbo Core clock rates for extended periods resulting in almost no performance drops over time when stressed as demonstrated by our CineBench R15 xT loop test below.
Running on Performance mode instead of Turbo mode impacts CPU performance just marginally by a couple of percentage points as shown in our GPU Performance section.
Integrated NPU performance has been bumped up to 50 TOPS from just 16 TOPS on the outgoing Ryzen 9 8945HS. Even so, Co-Pilot+ integration remains exclusive to Snapdragon laptops at the time of writing and so the use cases for the new integrated AMD NPU remain narrow.
Cinebench R15 Multi Loop
Cinebench R23: Multi Core | Single Core
Cinebench R20: CPU (Multi Core) | CPU (Single Core)
Cinebench R15: CPU Multi 64Bit | CPU Single 64Bit
Blender: v2.79 BMW27 CPU
7-Zip 18.03: 7z b 4 | 7z b 4 -mmt1
Geekbench 6.5: Multi-Core | Single-Core
Geekbench 5.5: Multi-Core | Single-Core
HWBOT x265 Benchmark v2.2: 4k Preset
LibreOffice : 20 Documents To PDF
R Benchmark 2.5: Overall mean
* ... smaller is better
AIDA64: FP32 Ray-Trace | FPU Julia | CPU SHA3 | CPU Queen | FPU SinJulia | FPU Mandel | CPU AES | CPU ZLib | FP64 Ray-Trace | CPU PhotoWorxx
| AIDA64 / FP32 Ray-Trace | |
| Asus TUF Gaming A14 FA401WV-WB94 | |
| Average AMD Ryzen AI 9 HX 370 (24673 - 37804, n=25) | |
| Lenovo Legion Slim 5 14APH8 | |
| Razer Blade 14 RZ09-0508 | |
| Asus ROG Zephyrus G14 2024 GA403U | |
| Acer Predator Helios Neo 14 (2024) | |
| HP Omen Transcend 14-fb0014 | |
| Alienware x14 i7 RTX 3060 | |
| AIDA64 / FP64 Ray-Trace | |
| Asus TUF Gaming A14 FA401WV-WB94 | |
| Average AMD Ryzen AI 9 HX 370 (13665 - 20648, n=26) | |
| Razer Blade 14 RZ09-0508 | |
| Lenovo Legion Slim 5 14APH8 | |
| Asus ROG Zephyrus G14 2024 GA403U | |
| Acer Predator Helios Neo 14 (2024) | |
| HP Omen Transcend 14-fb0014 | |
| Alienware x14 i7 RTX 3060 | |
| AIDA64 / CPU PhotoWorxx | |
| HP Omen Transcend 14-fb0014 | |
| Average AMD Ryzen AI 9 HX 370 (36752 - 52671, n=26) | |
| Alienware x14 i7 RTX 3060 | |
| Acer Predator Helios Neo 14 (2024) | |
| Razer Blade 14 RZ09-0508 | |
| Asus ROG Zephyrus G14 2024 GA403U | |
| Asus TUF Gaming A14 FA401WV-WB94 | |
| Lenovo Legion Slim 5 14APH8 | |
Stress Test
The CPU does an excellent job at maintaining high Turbo Core clock rates even when stressed. When running Prime95, for example, the CPU would boost to 3.8 GHz and 80 W and then maintain those targets indefinitely. The main drawback is the very high core temperature of 92 C to be even warmer than the Ryzen 9 CPU in the Blade 14 by several degrees.
When running Cyberpunk 2077 to represent typical gaming loads, the GPU would stabilize at 2550 MHz core, 2025 MHz clock, 82 C, and 92 W power draw when set to Turbo mode. Dropping down to Performance mode would reduce all these values across the board as detailed in the following screenshots for slower performance which aligns with our observations in the GPU Performance section below. Thus, be sure to enable Turbo mode when gaming if you want to squeeze as much power from the system as possible even if it means maximizing fan noise. Otherwise, average core temperatures when gaming are similar to what we recorded on the Blade 14 and only slightly warmer than on the Lenovo Legion Slim 5 14.


| Average CPU Clock (GHz) | GPU Clock (MHz) | Average CPU Temperature (°C) | Average GPU Temperature (°C) | |
| System Idle | -- | -- | 39 | 39 |
| Prime95 Stress | 3.6 | -- | 92 | 65 |
| Prime95 + FurMark Stress | 2.6 | 1950 | 81 | 84 |
| Cyberpunk 2077 Stress (Windows Balanced mode) | 0.9 | 2235 | 73 | 77 |
| Cyberpunk 2077 Stress (Performance mode) | 0.9 | 2250 | 73 | 78 |
| Cyberpunk 2077 Stress (Turbo mode) | 1.0 | 2550 | 73 | 82 |
System Performance
PCMark results are excellent but also similar to other 14-inch gaming laptops running on older CPUs without AI acceleration. Thus, the TUF Gaming A14 isn't necessarily any faster when it comes to traditional PC tasks like web browsing, streaming, or light editing.
Memory performance is nevertheless very fast due to the 7500 MHz RAM compared to 6400 MHz or 5600 MHz on the Legion Slim 5 14 or Blade 14, respectively.

CrossMark: Overall | Productivity | Creativity | Responsiveness
WebXPRT 3: Overall
WebXPRT 4: Overall
Mozilla Kraken 1.1: Total
| PCMark 10 / Score | |
| Razer Blade 14 RZ09-0508 | |
| Lenovo Legion Slim 5 14APH8 | |
| Average AMD Ryzen AI 9 HX 370, NVIDIA GeForce RTX 4060 Laptop GPU (7645 - 7915, n=3) | |
| Asus TUF Gaming A14 FA401WV-WB94 | |
| Asus ROG Zephyrus G14 2024 GA403U | |
| Alienware x14 i7 RTX 3060 | |
| HP Omen Transcend 14-fb0014 | |
| PCMark 10 / Essentials | |
| Razer Blade 14 RZ09-0508 | |
| Lenovo Legion Slim 5 14APH8 | |
| Average AMD Ryzen AI 9 HX 370, NVIDIA GeForce RTX 4060 Laptop GPU (10140 - 10543, n=3) | |
| Alienware x14 i7 RTX 3060 | |
| Asus TUF Gaming A14 FA401WV-WB94 | |
| Asus ROG Zephyrus G14 2024 GA403U | |
| HP Omen Transcend 14-fb0014 | |
| PCMark 10 / Productivity | |
| Razer Blade 14 RZ09-0508 | |
| Average AMD Ryzen AI 9 HX 370, NVIDIA GeForce RTX 4060 Laptop GPU (9925 - 10030, n=3) | |
| Asus TUF Gaming A14 FA401WV-WB94 | |
| Lenovo Legion Slim 5 14APH8 | |
| Alienware x14 i7 RTX 3060 | |
| Asus ROG Zephyrus G14 2024 GA403U | |
| HP Omen Transcend 14-fb0014 | |
| PCMark 10 / Digital Content Creation | |
| Asus TUF Gaming A14 FA401WV-WB94 | |
| Razer Blade 14 RZ09-0508 | |
| Average AMD Ryzen AI 9 HX 370, NVIDIA GeForce RTX 4060 Laptop GPU (12351 - 13395, n=3) | |
| Lenovo Legion Slim 5 14APH8 | |
| Asus ROG Zephyrus G14 2024 GA403U | |
| Alienware x14 i7 RTX 3060 | |
| HP Omen Transcend 14-fb0014 | |
| CrossMark / Overall | |
| Alienware x14 i7 RTX 3060 | |
| Lenovo Legion Slim 5 14APH8 | |
| Razer Blade 14 RZ09-0508 | |
| Asus ROG Zephyrus G14 2024 GA403U | |
| Average AMD Ryzen AI 9 HX 370, NVIDIA GeForce RTX 4060 Laptop GPU (1710 - 1819, n=3) | |
| Asus TUF Gaming A14 FA401WV-WB94 | |
| HP Omen Transcend 14-fb0014 | |
| CrossMark / Productivity | |
| Lenovo Legion Slim 5 14APH8 | |
| Alienware x14 i7 RTX 3060 | |
| Razer Blade 14 RZ09-0508 | |
| Asus ROG Zephyrus G14 2024 GA403U | |
| Average AMD Ryzen AI 9 HX 370, NVIDIA GeForce RTX 4060 Laptop GPU (1574 - 1637, n=3) | |
| Asus TUF Gaming A14 FA401WV-WB94 | |
| HP Omen Transcend 14-fb0014 | |
| CrossMark / Creativity | |
| Average AMD Ryzen AI 9 HX 370, NVIDIA GeForce RTX 4060 Laptop GPU (2077 - 2264, n=3) | |
| Asus TUF Gaming A14 FA401WV-WB94 | |
| Alienware x14 i7 RTX 3060 | |
| Asus ROG Zephyrus G14 2024 GA403U | |
| Lenovo Legion Slim 5 14APH8 | |
| Razer Blade 14 RZ09-0508 | |
| HP Omen Transcend 14-fb0014 | |
| CrossMark / Responsiveness | |
| Alienware x14 i7 RTX 3060 | |
| Lenovo Legion Slim 5 14APH8 | |
| Razer Blade 14 RZ09-0508 | |
| Asus ROG Zephyrus G14 2024 GA403U | |
| Average AMD Ryzen AI 9 HX 370, NVIDIA GeForce RTX 4060 Laptop GPU (1226 - 1385, n=3) | |
| Asus TUF Gaming A14 FA401WV-WB94 | |
| HP Omen Transcend 14-fb0014 | |
| WebXPRT 3 / Overall | |
| Razer Blade 14 RZ09-0508 | |
| Lenovo Legion Slim 5 14APH8 | |
| Alienware x14 i7 RTX 3060 | |
| Asus ROG Zephyrus G14 2024 GA403U | |
| Asus TUF Gaming A14 FA401WV-WB94 | |
| Average AMD Ryzen AI 9 HX 370, NVIDIA GeForce RTX 4060 Laptop GPU (274 - 288, n=2) | |
| HP Omen Transcend 14-fb0014 | |
| WebXPRT 4 / Overall | |
| Razer Blade 14 RZ09-0508 | |
| Average AMD Ryzen AI 9 HX 370, NVIDIA GeForce RTX 4060 Laptop GPU (252 - 271, n=3) | |
| Lenovo Legion Slim 5 14APH8 | |
| Asus TUF Gaming A14 FA401WV-WB94 | |
| Asus ROG Zephyrus G14 2024 GA403U | |
| HP Omen Transcend 14-fb0014 | |
| Mozilla Kraken 1.1 / Total | |
| HP Omen Transcend 14-fb0014 | |
| Alienware x14 i7 RTX 3060 | |
| Asus ROG Zephyrus G14 2024 GA403U | |
| Lenovo Legion Slim 5 14APH8 | |
| Razer Blade 14 RZ09-0508 | |
| Asus TUF Gaming A14 FA401WV-WB94 | |
| Average AMD Ryzen AI 9 HX 370, NVIDIA GeForce RTX 4060 Laptop GPU (430 - 450, n=3) | |
* ... smaller is better
| PCMark 10 Score | 7645 points | |
Help | ||
| AIDA64 / Memory Copy | |
| HP Omen Transcend 14-fb0014 | |
| Asus TUF Gaming A14 FA401WV-WB94 | |
| Average AMD Ryzen AI 9 HX 370 (71902 - 93640, n=26) | |
| Alienware x14 i7 RTX 3060 | |
| Lenovo Legion Slim 5 14APH8 | |
| Asus ROG Zephyrus G14 2024 GA403U | |
| Razer Blade 14 RZ09-0508 | |
| AIDA64 / Memory Read | |
| Asus TUF Gaming A14 FA401WV-WB94 | |
| Average AMD Ryzen AI 9 HX 370 (81367 - 102937, n=26) | |
| HP Omen Transcend 14-fb0014 | |
| Alienware x14 i7 RTX 3060 | |
| Razer Blade 14 RZ09-0508 | |
| Lenovo Legion Slim 5 14APH8 | |
| Asus ROG Zephyrus G14 2024 GA403U | |
| AIDA64 / Memory Write | |
| Asus TUF Gaming A14 FA401WV-WB94 | |
| Average AMD Ryzen AI 9 HX 370 (78939 - 108954, n=26) | |
| Asus ROG Zephyrus G14 2024 GA403U | |
| Lenovo Legion Slim 5 14APH8 | |
| Razer Blade 14 RZ09-0508 | |
| HP Omen Transcend 14-fb0014 | |
| Alienware x14 i7 RTX 3060 | |
| AIDA64 / Memory Latency | |
| HP Omen Transcend 14-fb0014 | |
| Asus TUF Gaming A14 FA401WV-WB94 | |
| Lenovo Legion Slim 5 14APH8 | |
| Alienware x14 i7 RTX 3060 | |
| Asus ROG Zephyrus G14 2024 GA403U | |
| Average AMD Ryzen AI 9 HX 370 (86.7 - 119.4, n=26) | |
| Razer Blade 14 RZ09-0508 | |
* ... smaller is better
DPC Latency

4K video playback at 60 FPS is perfect with very low CPU utilization and no dropped frames recorded.
LatencyMon would fail to launch likely due to compatibility issues with the new Zen 5 CPU.
Storage Devices
Asus ships the same WD PC SN560 PCIe4 x4 NVMe SSD for both its TUF Gaming A14 and ROG Zephyrus G14 models. Strangely, the drive in our unit exhibits much slower read and write rates of smaller file sizes than the same drive in the Zephyrus G14 according to DiskSpd even though our drive space is more than half empty. The slower-than-expected transfer rates from our SD card test above may be related to this abnormality.


* ... smaller is better
Disk Throttling: DiskSpd Read Loop, Queue Depth 8
GPU Performance — 100 W TGP For A 14-inch Form Factor
Graphics performance from the 100 W GeForce RTX 4060 is where we expect it to be relative to the average laptop in our database with the same GPU. Most notably, it performs only up to 5 percent slower than our desktop KFA2 GeForce RTX 4060 reference card which is impressive given the 14-inch form factor. Our 100 W GPU compares favorably to the 65 W RTX 4060 in the competing Omen Transcend 14.
Users demanding even faster performance will have to consider the ROG Zephyrus G14 series instead. Asus purposefully excludes the RTX 4070, RTX 4080, and RTX 4090 from the TUF Gaming A14 lineup in order to better separate its two 14-inch gaming models.
| Power Profile | Graphics Score | Physics Score | Combined Score |
| Turbo Mode | 26679 | 31461 | 10609 |
| Performance Mode | 24526 (-8%) | 30803 (-2%) | 9899 (-7%) |
| Balanced Mode | 24393 (-9%) | 30687 (-3%) | 9830 (-7%) |
| Battery Power | 19047 (-29%) | 24466 (-22%) | 8615 (-19%) |
Dropping down to Performance mode from Turbo mode decreases graphics performance by almost 10 percent. Interestingly, dropping down again from Performance mode to Windows Balanced mode does not impact performance any further. These observations align with our findings in the Stress Test section above. Running on battery power decreases performance the most as one would expect.


| 3DMark 11 Performance | 30231 points | |
| 3DMark Cloud Gate Standard Score | 61850 points | |
| 3DMark Fire Strike Score | 23637 points | |
| 3DMark Time Spy Score | 10451 points | |
| 3DMark Steel Nomad Score | 2283 points | |
Help | ||
* ... smaller is better
Gaming Performance
The GeForce RTX 4060 pairs well with the 1440p native resolution. Unfortunately, aiming for stable frame rates of 165 or above to match the native refresh rate will be difficult on most titles and so 60 FPS is still the most realistic target.
Because of the very loud fan noise when running on Turbo mode, users may instead want to consider gaming on Performance mode even if it means taking a hit on frame rates. For example, running Cyberpunk 2077 at 1440p with DLSS Super Resolution active and on Ultra settings would result in an average frame rate of 74.1 on Turbo mode versus 64.5 if on the quieter Performance mode.
| Performance rating - Percent | |
| Razer Blade 14 RZ09-0508 -1! | |
| Lenovo Legion Slim 5 14APH8 -1! | |
| Asus TUF Gaming A14 FA401WV-WB94 | |
| Asus ROG Zephyrus G14 2024 GA403U | |
| HP Omen Transcend 14-fb0014 | |
| Alienware x14 i7 RTX 3060 -1! | |
| GTA V - 1920x1080 Highest AA:4xMSAA + FX AF:16x | |
| Asus TUF Gaming A14 FA401WV-WB94 | |
| Razer Blade 14 RZ09-0508 | |
| Lenovo Legion Slim 5 14APH8 | |
| HP Omen Transcend 14-fb0014 | |
| Asus ROG Zephyrus G14 2024 GA403U | |
| Alienware x14 i7 RTX 3060 | |
| Final Fantasy XV Benchmark - 1920x1080 High Quality | |
| Razer Blade 14 RZ09-0508 | |
| Lenovo Legion Slim 5 14APH8 | |
| Asus ROG Zephyrus G14 2024 GA403U | |
| Asus TUF Gaming A14 FA401WV-WB94 | |
| HP Omen Transcend 14-fb0014 | |
| Alienware x14 i7 RTX 3060 | |
| Strange Brigade - 1920x1080 ultra AA:ultra AF:16 | |
| Lenovo Legion Slim 5 14APH8 | |
| Asus TUF Gaming A14 FA401WV-WB94 | |
| Asus ROG Zephyrus G14 2024 GA403U | |
| HP Omen Transcend 14-fb0014 | |
| Alienware x14 i7 RTX 3060 | |
| Dota 2 Reborn - 1920x1080 ultra (3/3) best looking | |
| Alienware x14 i7 RTX 3060 | |
| Razer Blade 14 RZ09-0508 | |
| Asus TUF Gaming A14 FA401WV-WB94 | |
| Lenovo Legion Slim 5 14APH8 | |
| HP Omen Transcend 14-fb0014 | |
| Asus ROG Zephyrus G14 2024 GA403U | |
| X-Plane 11.11 - 1920x1080 high (fps_test=3) | |
| Lenovo Legion Slim 5 14APH8 | |
| Asus ROG Zephyrus G14 2024 GA403U | |
| HP Omen Transcend 14-fb0014 | |
| Razer Blade 14 RZ09-0508 | |
| Asus TUF Gaming A14 FA401WV-WB94 | |
Cyberpunk 2077 ultra FPS Chart
| low | med. | high | ultra | QHD | |
|---|---|---|---|---|---|
| GTA V (2015) | 181.7 | 175.9 | 168.6 | 110.8 | 85.4 |
| Dota 2 Reborn (2015) | 168.1 | 150.3 | 150.8 | 135 | |
| Final Fantasy XV Benchmark (2018) | 174.3 | 139.6 | 100.6 | 74.5 | |
| X-Plane 11.11 (2018) | 89.1 | 81.8 | 67.3 | ||
| Far Cry 5 (2018) | 143 | 129 | 121 | 114 | 93 |
| Strange Brigade (2018) | 388 | 277 | 222 | 193.5 | 130.3 |
| Tiny Tina's Wonderlands (2022) | 204.6 | 167.1 | 110.6 | 86.1 | 58.9 |
| F1 22 (2022) | 194.8 | 190.3 | 172.8 | 64.6 | 42 |
| Baldur's Gate 3 (2023) | 122.1 | 101.7 | 91 | 90.1 | 61.1 |
| Cyberpunk 2077 (2023) | 115.5 | 98.1 | 85.6 | 73.3 | 43.6 |
Emissions
System Noise — Hot And Loud When Gaming
Fan noise and behavior depend heavily on the selected power profile through Armoury Crate. If set to Silent mode, the fans tend to idle when browsing or streaming with only the occasional pulse up to 29 dB(A). If set to any other mode, however, the fans would pulse much more frequently and to higher RPMs even when running simple tasks like email. You may want to consider running on Silent mode if working in noise sensitive environments like classrooms or conference rooms.
Fan noise would stabilize at 43 dB(A) and 50.6 dB(A) when running Cyberpunk 2077 on Performance mode and Turbo mode, respectively. The difference is significant to the point where owners may want to consider gaming on Performance mode and take the -10 percent hit to graphics performance for the quieter fans. To be fair, the 50+ dB(A) range is shared across most 14-inch gaming laptops like the Blade 14, Legion Slim 5 14, or Alienware x14 and so it's not just a TUF Gaming A14 problem.


Noise level
| Idle |
| 22.9 / 28.3 / 28.8 dB(A) |
| Load |
| 37.3 / 50.6 dB(A) |
 | ||
30 dB silent 40 dB(A) audible 50 dB(A) loud |
||
min: | ||
| Asus TUF Gaming A14 FA401WV-WB94 GeForce RTX 4060 Laptop GPU, Ryzen AI 9 HX 370, WD PC SN560 SDDPNQE-1T00 | Asus ROG Zephyrus G14 2024 GA403U GeForce RTX 4070 Laptop GPU, R9 8945HS, WD PC SN560 SDDPNQE-1T00 | HP Omen Transcend 14-fb0014 GeForce RTX 4060 Laptop GPU, Ultra 7 155H, WDC PC SN810 1TB | Razer Blade 14 RZ09-0508 GeForce RTX 4070 Laptop GPU, R9 8945HS, Samsung PM9A1 MZVL21T0HCLR | Lenovo Legion Slim 5 14APH8 GeForce RTX 4060 Laptop GPU, R7 7840HS, SK Hynix HFS001TEJ9X115N | Alienware x14 i7 RTX 3060 GeForce RTX 3060 Laptop GPU, i7-12700H, WDC PC SN810 1TB | |
|---|---|---|---|---|---|---|
| Noise | 2% | 7% | 3% | -3% | -3% | |
| off / environment * (dB) | 22.9 | 23.9 -4% | 24.5 -7% | 24.3 -6% | 22.8 -0% | 24.7 -8% |
| Idle Minimum * (dB) | 22.9 | 23.9 -4% | 24.7 -8% | 25 -9% | 22.8 -0% | 24.7 -8% |
| Idle Average * (dB) | 28.3 | 23.9 16% | 24.7 13% | 25 12% | 27.3 4% | 24.7 13% |
| Idle Maximum * (dB) | 28.8 | 23.9 17% | 24.7 14% | 25 13% | 30.7 -7% | 30.9 -7% |
| Load Average * (dB) | 37.3 | 46.2 -24% | 25.2 32% | 33 12% | 41.6 -12% | 40 -7% |
| Cyberpunk 2077 ultra * (dB) | 50.6 | |||||
| Load Maximum * (dB) | 50.6 | 46.2 9% | 52 -3% | 51.9 -3% | 52.6 -4% | 51.5 -2% |
| Witcher 3 ultra * (dB) | 46.2 | 47 | 49.5 | 52.8 | 51.5 |
* ... smaller is better
Temperature
Surface temperatures are predictably very warm because of the high performance-per-volume. Hot spots on the keyboard deck and bottom panel can reach up to 50 C and 47 C, respectively, while the palm rests can reach a sweaty 35 C. Both the Lenovo Legion Slim 5 14 and Omen Transcend 14 run cooler than our Asus while the Predator Helios Neo 14 is even warmer. In practice, the high surface temperatures are noticeable but not distracting when gaming as the hottest spots are near the center and away from the WASD keys.


(-) The maximum temperature on the upper side is 49.8 °C / 122 F, compared to the average of 40.4 °C / 105 F, ranging from 21.2 to 68.8 °C for the class Gaming.
(-) The bottom heats up to a maximum of 46 °C / 115 F, compared to the average of 43.3 °C / 110 F
(+) In idle usage, the average temperature for the upper side is 27.6 °C / 82 F, compared to the device average of 33.9 °C / 93 F.
(±) 3: The average temperature for the upper side is 33.4 °C / 92 F, compared to the average of 33.9 °C / 93 F for the class Gaming.
(±) The palmrests and touchpad can get very hot to the touch with a maximum of 36.2 °C / 97.2 F.
(-) The average temperature of the palmrest area of similar devices was 28.8 °C / 83.8 F (-7.4 °C / -13.4 F).


| Asus TUF Gaming A14 FA401WV-WB94 AMD Ryzen AI 9 HX 370, NVIDIA GeForce RTX 4060 Laptop GPU | Asus ROG Zephyrus G14 2024 GA403U AMD Ryzen 9 8945HS, NVIDIA GeForce RTX 4070 Laptop GPU | Acer Predator Helios Neo 14 (2024) Intel Core Ultra 9 185H, NVIDIA GeForce RTX 4070 Laptop GPU | HP Omen Transcend 14-fb0014 Intel Core Ultra 7 155H, NVIDIA GeForce RTX 4060 Laptop GPU | Razer Blade 14 RZ09-0508 AMD Ryzen 9 8945HS, NVIDIA GeForce RTX 4070 Laptop GPU | Lenovo Legion Slim 5 14APH8 AMD Ryzen 7 7840HS, NVIDIA GeForce RTX 4060 Laptop GPU | |
|---|---|---|---|---|---|---|
| Heat | 5% | -13% | 15% | -4% | 5% | |
| Maximum Upper Side * (°C) | 49.8 | 46.6 6% | 57 -14% | 41.2 17% | 41.8 16% | 40.4 19% |
| Maximum Bottom * (°C) | 46 | 47.8 -4% | 55 -20% | 39 15% | 42.2 8% | 49.4 -7% |
| Idle Upper Side * (°C) | 30.2 | 26.7 12% | 32 -6% | 26.2 13% | 34.8 -15% | 28.2 7% |
| Idle Bottom * (°C) | 29.8 | 27.8 7% | 33 -11% | 25.4 15% | 37.4 -26% | 29.8 -0% |
* ... smaller is better
Speakers
The internal speakers are very weak which is arguably more problematic on a gaming laptop than a regular multimedia laptop because they must be louder to overcome the higher fan noise. Gaming on Turbo mode without a good pair of headphones to drown out the fan noise and make up for the weak speakers does not make for a good experience on this Asus machine.


Asus TUF Gaming A14 FA401WV-WB94 audio analysis
(±) | speaker loudness is average but good (75.2 dB)
Bass 100 - 315 Hz
(±) | reduced bass - on average 8.4% lower than median
(±) | linearity of bass is average (9.7% delta to prev. frequency)
Mids 400 - 2000 Hz
(±) | higher mids - on average 10% higher than median
(+) | mids are linear (4.2% delta to prev. frequency)
Highs 2 - 16 kHz
(+) | balanced highs - only 3.8% away from median
(+) | highs are linear (6.7% delta to prev. frequency)
Overall 100 - 16.000 Hz
(±) | linearity of overall sound is average (19.2% difference to median)
Compared to same class
» 64% of all tested devices in this class were better, 7% similar, 28% worse
» The best had a delta of 6%, average was 18%, worst was 132%
Compared to all devices tested
» 46% of all tested devices were better, 7% similar, 47% worse
» The best had a delta of 4%, average was 24%, worst was 134%
Apple MacBook Pro 16 2021 M1 Pro audio analysis
(+) | speakers can play relatively loud (84.7 dB)
Bass 100 - 315 Hz
(+) | good bass - only 3.8% away from median
(+) | bass is linear (5.2% delta to prev. frequency)
Mids 400 - 2000 Hz
(+) | balanced mids - only 1.3% away from median
(+) | mids are linear (2.1% delta to prev. frequency)
Highs 2 - 16 kHz
(+) | balanced highs - only 1.9% away from median
(+) | highs are linear (2.7% delta to prev. frequency)
Overall 100 - 16.000 Hz
(+) | overall sound is linear (4.6% difference to median)
Compared to same class
» 0% of all tested devices in this class were better, 0% similar, 100% worse
» The best had a delta of 5%, average was 17%, worst was 45%
Compared to all devices tested
» 0% of all tested devices were better, 0% similar, 100% worse
» The best had a delta of 4%, average was 24%, worst was 134%
Energy Management
Power Consumption
Overall consumption is relatively high even when idling on desktop depending on your settings. If on Battery Saver and MSHybrid modes, for example, consumption could be as low as 9 W. Enabling dGPU and Turbo modes would increase consumption to 23 W.
Consumption when gaming is close to what we recorded on the Lenovo Legion Slim 5 14 while being noticeably higher than on the Omen Transcend 14 all of which come with the same RTX 4060 GPU. This is expected as the GPU in the HP model targets a lower 65 W TGP and so its consumption is roughly 35 W less than our Asus.
It's worth noting that the Ryzen AI 9 demands much more power than the previous generation Ryzen 9 8945HS when at full load. When running Prime95, for example, system consumption would average 129 W versus just 95 W on the recent ROG Zephyrus G14. Performance-per-watt year-over-year has therefore not improved as much as raw performance.
We're able to record a temporary maximum draw of 198 W from the medium-sized (15.2 x 7.2 x 2.3 cm) 200 W AC adapter when both the CPU and GPU are at 100 percent utilization.


| Off / Standby | |
| Idle | |
| Load |
|
Key:
min: | |
| Asus TUF Gaming A14 FA401WV-WB94 Ryzen AI 9 HX 370, GeForce RTX 4060 Laptop GPU, WD PC SN560 SDDPNQE-1T00, IPS, 2560x1600, 14" | Asus ROG Zephyrus G14 2024 GA403U R9 8945HS, GeForce RTX 4070 Laptop GPU, WD PC SN560 SDDPNQE-1T00, OLED, 2880x1800, 14" | HP Omen Transcend 14-fb0014 Ultra 7 155H, GeForce RTX 4060 Laptop GPU, WDC PC SN810 1TB, OLED, 2880x1800, 14" | Razer Blade 14 RZ09-0508 R9 8945HS, GeForce RTX 4070 Laptop GPU, Samsung PM9A1 MZVL21T0HCLR, IPS, 2560x1600, 14" | Lenovo Legion Slim 5 14APH8 R7 7840HS, GeForce RTX 4060 Laptop GPU, SK Hynix HFS001TEJ9X115N, OLED, 2880x1600, 14.5" | Alienware x14 i7 RTX 3060 i7-12700H, GeForce RTX 3060 Laptop GPU, WDC PC SN810 1TB, IPS, 1920x1080, 14" | |
|---|---|---|---|---|---|---|
| Power Consumption | 28% | 8% | -51% | 19% | 14% | |
| Idle Minimum * (Watt) | 9.1 | 6.9 24% | 9.1 -0% | 20.9 -130% | 7.3 20% | 7.9 13% |
| Idle Average * (Watt) | 15.3 | 8.6 44% | 12.6 18% | 25.6 -67% | 9.6 37% | 11.1 27% |
| Idle Maximum * (Watt) | 22.6 | 9 60% | 27.4 -21% | 32.1 -42% | 17.3 23% | 11.8 48% |
| Load Average * (Watt) | 72.1 | 75.2 -4% | 63.5 12% | 72.7 -1% | 76.6 -6% | 107.4 -49% |
| Cyberpunk 2077 ultra external monitor * (Watt) | 141.7 | |||||
| Cyberpunk 2077 ultra * (Watt) | 144.7 | |||||
| Load Maximum * (Watt) | 198 | 161.6 18% | 135.3 32% | 228.4 -15% | 160.9 19% | 140.4 29% |
| Witcher 3 ultra * (Watt) | 109.7 | 118.9 | 182.1 | 152 | 111 |
* ... smaller is better
Power Consumption Cyberpunk / Stress Test
Power Consumption external Monitor
Battery Life

Battery capacity is identical to the Zephyrus G14 at 73 Wh. Runtime, however, is shorter by about two hours during our WLAN test even when set to MSHybrid mode and the Windows Balanced power profile. The 7+ hours of browser use is still pretty good for a 14-inch gaming laptop all things considered.
Charging from empty to full capacity is fast at just over 60 minutes compared to 90 minutes on most other laptops. Charging via third-party USB-C AC adapter is supported albeit at slower rates.
| Asus TUF Gaming A14 FA401WV-WB94 Ryzen AI 9 HX 370, GeForce RTX 4060 Laptop GPU, 73 Wh | Asus ROG Zephyrus G14 2024 GA403U R9 8945HS, GeForce RTX 4070 Laptop GPU, 73 Wh | Acer Predator Helios Neo 14 (2024) Ultra 9 185H, GeForce RTX 4070 Laptop GPU, 76 Wh | HP Omen Transcend 14-fb0014 Ultra 7 155H, GeForce RTX 4060 Laptop GPU, 71 Wh | Razer Blade 14 RZ09-0508 R9 8945HS, GeForce RTX 4070 Laptop GPU, 68 Wh | Lenovo Legion Slim 5 14APH8 R7 7840HS, GeForce RTX 4060 Laptop GPU, 73.6 Wh | |
|---|---|---|---|---|---|---|
| Battery runtime | -5% | 12% | -8% | -21% | -10% | |
| Reader / Idle (h) | 11 | 13.5 23% | 10.4 -5% | 8 -27% | 10.5 -5% | |
| WiFi v1.3 (h) | 7 | 9.3 33% | 8.7 24% | 8.6 23% | 7.1 1% | 7.5 7% |
| Load (h) | 1.9 | 1.1 -42% | 1.7 -11% | 1.1 -42% | 1.2 -37% | 1.3 -32% |
| H.264 (h) | 12.1 | 9.3 |
Pros
Cons
Verdict — A Great Alternative To The Pricey Zephyrus G14

The TUF Gaming A14 is a fitting alternative to the higher-end ROG Zephyrus G14 series. While it may lack certain luxurious features like a metal keyboard deck, RGB keyboard lighting, and OLED options, it makes up for them with good port variety, a surprisingly comfortable keyboard, and a very light weight. The model therefore works very well for those who want a subcompact gaming machine that can double as a classroom workhorse.
The TUF Gaming A14 offers almost as much as the ROG Zephyrus G14 but for several hundred dollars less. It balances productivity and gaming very well for the size, but be prepared for loud fans and warm temperatures if pushing the system to its limits.
Perhaps the biggest limitation of the model is its lack of GPU options greater than the GeForce RTX 4060. $1500 for a GeForce RTX 4060 PC is a tough ask especially now that the GPU is approaching two years old. Users who want to maximize gaming performance and don't mind giving up NPU performance can likely find an older 2023 ROG Zephyrus G14 with faster RTX 4070 graphics at around the same price as our TUF Gaming A14. The extra CPU performance from the Ryzen AI 9 is nice to have, but it can be overkill for gaming purposes when paired with the midrange RTX 4060.
Price and Availability
Walmart is currently shipping the Asus TUF Gaming A14 FA401WV as reviewed for $1500.
Note: We have recently updated our rating system and the results of version 8 are not comparable with the results of version 7. More information is available here .
Asus TUF Gaming A14 FA401WV-WB94
- 08/27/2024 v8
Allen Ngo
 Total Sustainability Score:
 Transparency
The selection of devices to be reviewed is made by our editorial team. The test sample was provided to the author as a loan by the manufacturer or retailer for the purpose of this review. The lender had no influence on this review, nor did the manufacturer receive a copy of this review before publication. There was no obligation to publish this review. As an independent media company, Notebookcheck is not subjected to the authority of manufacturers, retailers or publishers.
This is how Notebookcheck is testing
Every year, Notebookcheck independently reviews hundreds of laptops and smartphones using standardized procedures to ensure that all results are comparable. We have continuously developed our test methods for around 20 years and set industry standards in the process. In our test labs, high-quality measuring equipment is utilized by experienced technicians and editors. These tests involve a multi-stage validation process. Our complex rating system is based on hundreds of well-founded measurements and benchmarks, which maintains objectivity. Further information on our test methods can be found here.
Price comparison
