

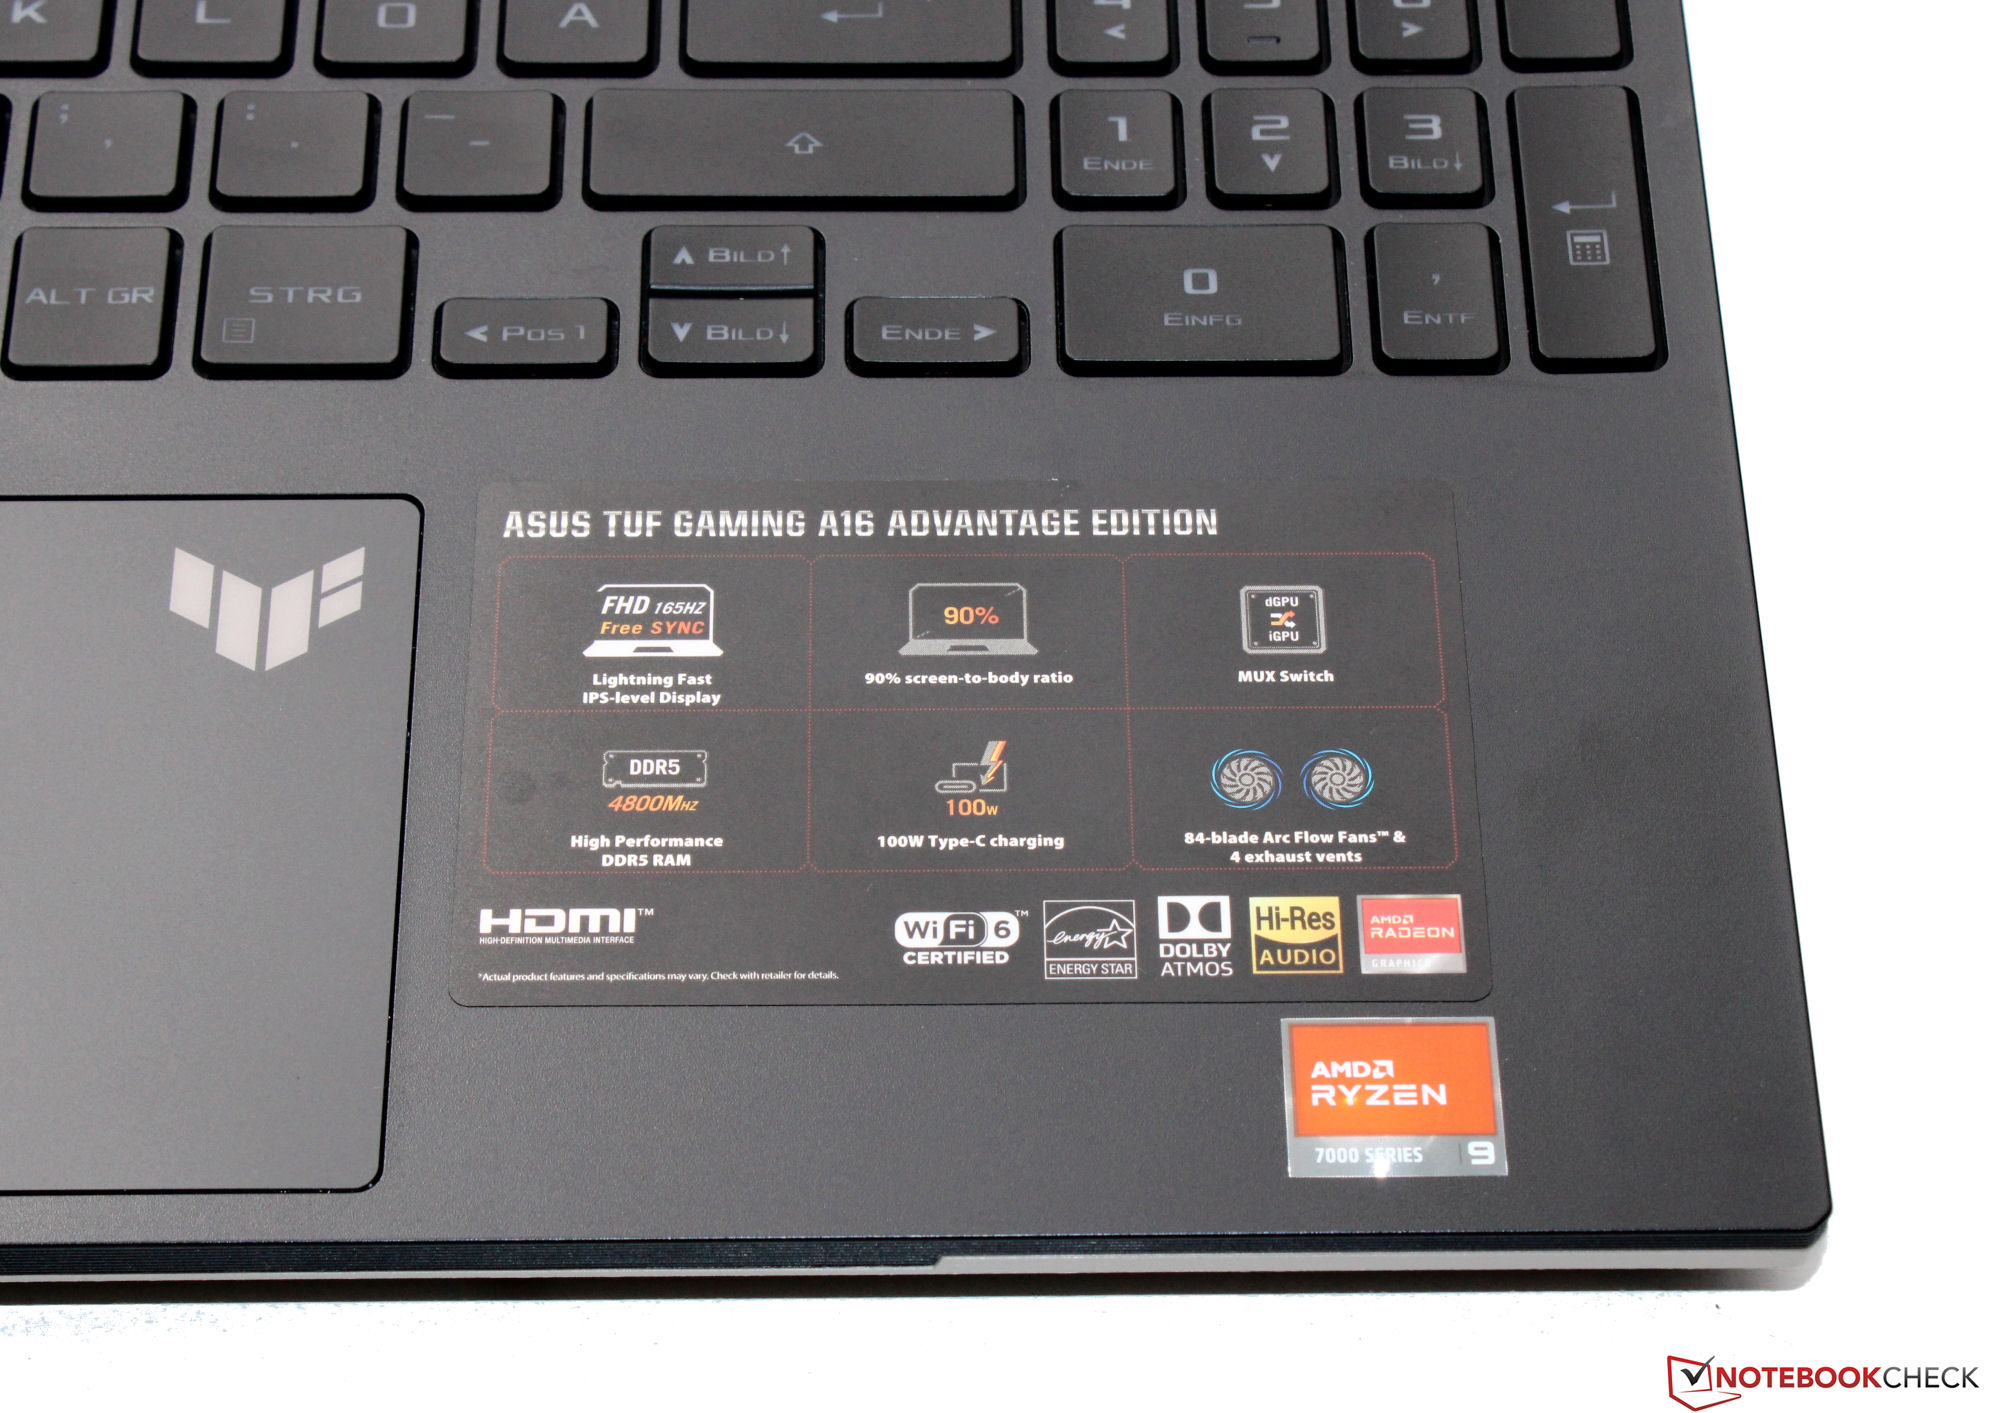
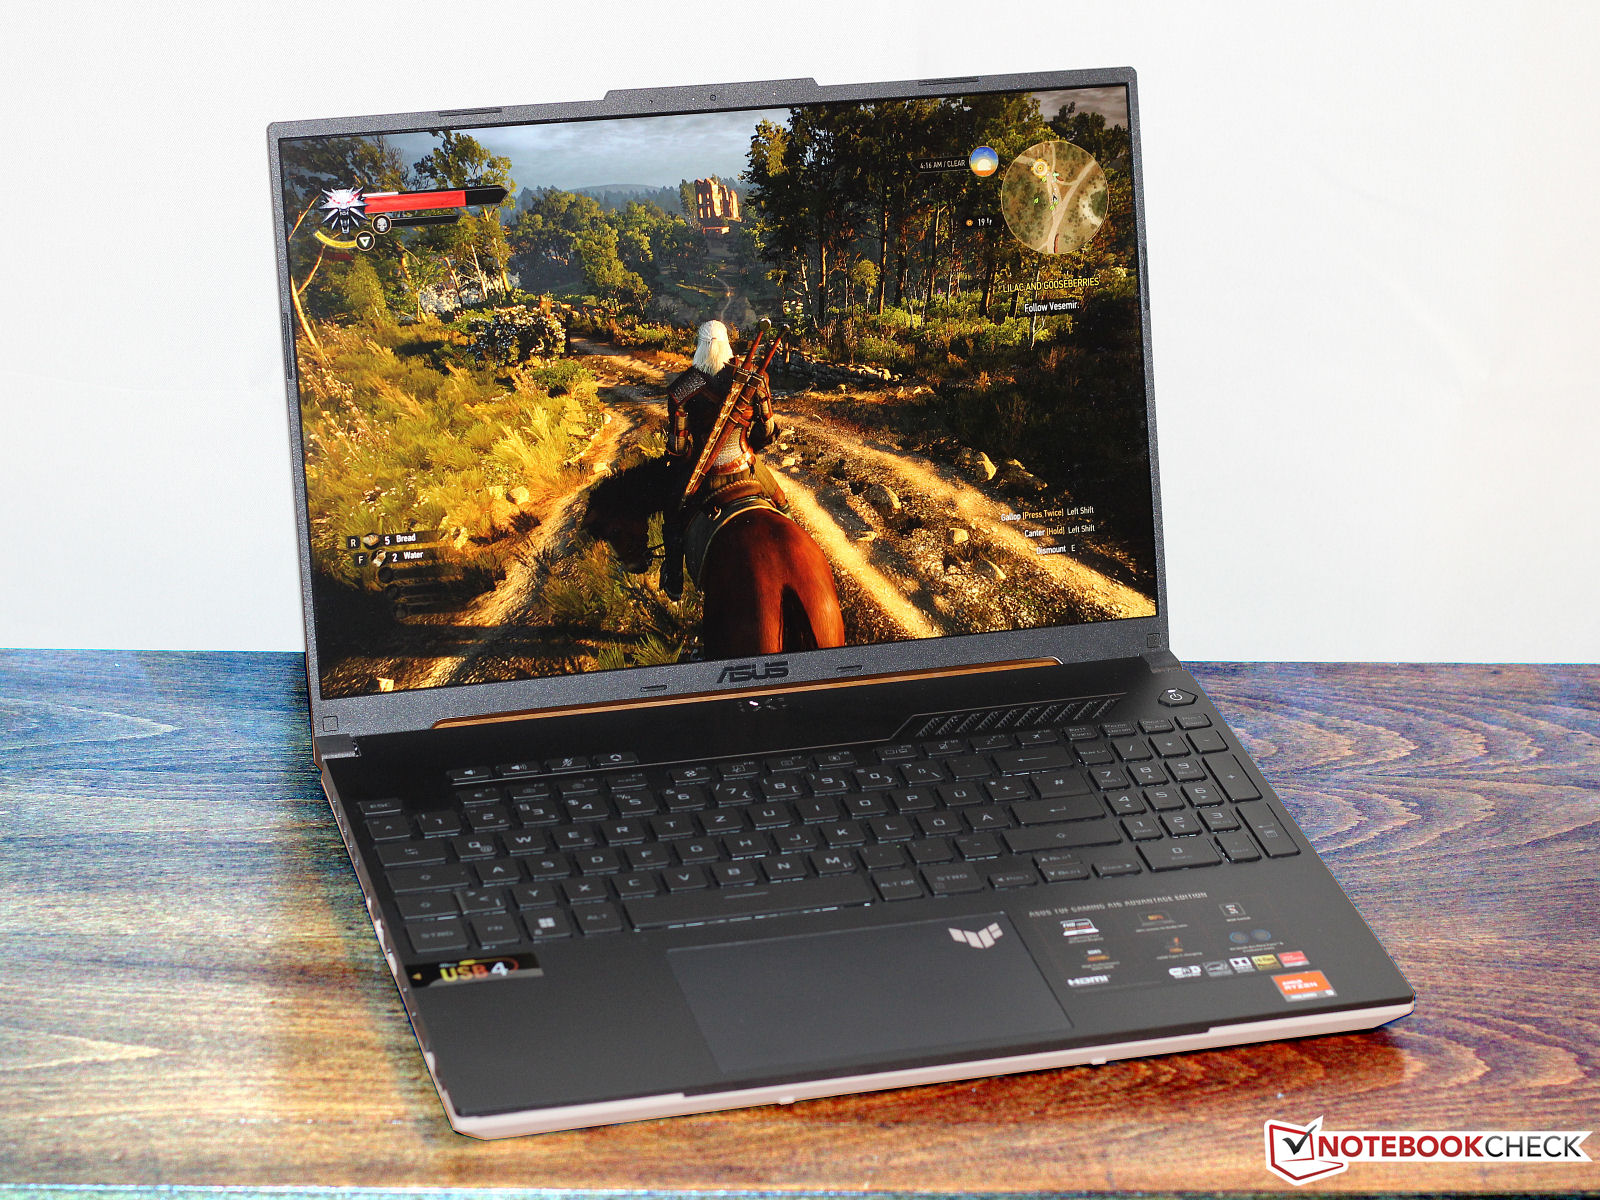
Asus TUF Gaming A16 Advantage Edition FA617XS review: The AMD laptop with up to 20-hour runtimes
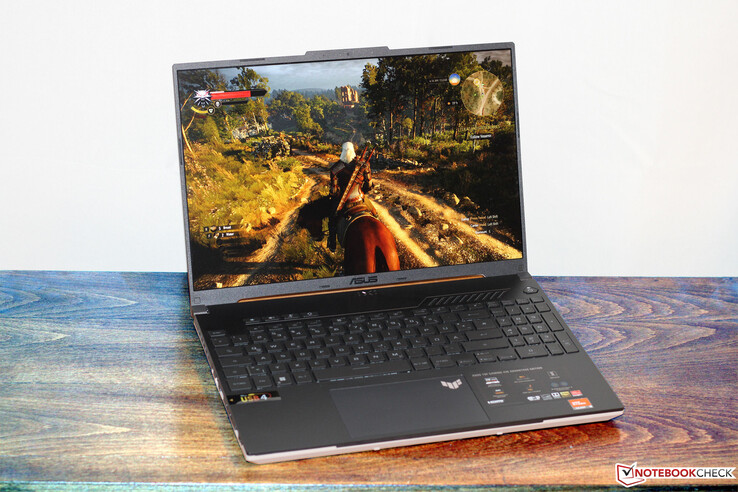
The Asus TUF Gaming A16 Advantage Edition - a mid-range gaming laptop - relies on AMD hardware: A Ryzen-9-7940HS APU and Radeon-RX-7600S GPU power the device. Competitors include the Lenovo Legion Pro 5 16IRX8, the MSI Katana 15 B12VEK, the Medion Erazer Defender P40 and the Gigabyte G5 KE.
For more detailed information on the laptop's case, connectivity and input devices, take a look at our review of the A16's identically-built sister model.
possible competitors compared
Rating | Date | Model | Weight | Height | Size | Resolution | Price |
|---|---|---|---|---|---|---|---|
| 86.9 % v7 (old) | 06 / 2023 | Asus TUF Gaming A16 FA617XS R9 7940HS, Radeon RX 7600S | 2.2 kg | 22.1 mm | 16.00" | 1920x1200 | |
| 87.9 % v7 (old) | 05 / 2023 | Lenovo Legion Pro 5 16IRX8 i7-13700HX, GeForce RTX 4060 Laptop GPU | 2.5 kg | 26.8 mm | 16.00" | 2560x1600 | |
| 82.9 % v7 (old) | 03 / 2023 | MSI Katana 15 B12VEK i7-12650H, GeForce RTX 4050 Laptop GPU | 2.3 kg | 24.9 mm | 15.60" | 1920x1080 | |
| 84.6 % v7 (old) | 05 / 2023 | Medion Erazer Defender P40 i7-13700HX, GeForce RTX 4060 Laptop GPU | 2.9 kg | 33 mm | 17.30" | 2560x1440 | |
| 81.8 % v7 (old) | 04 / 2023 | Gigabyte G5 KE i5-12500H, GeForce RTX 3060 Laptop GPU | 2 kg | 23.9 mm | 15.60" | 1920x1080 |
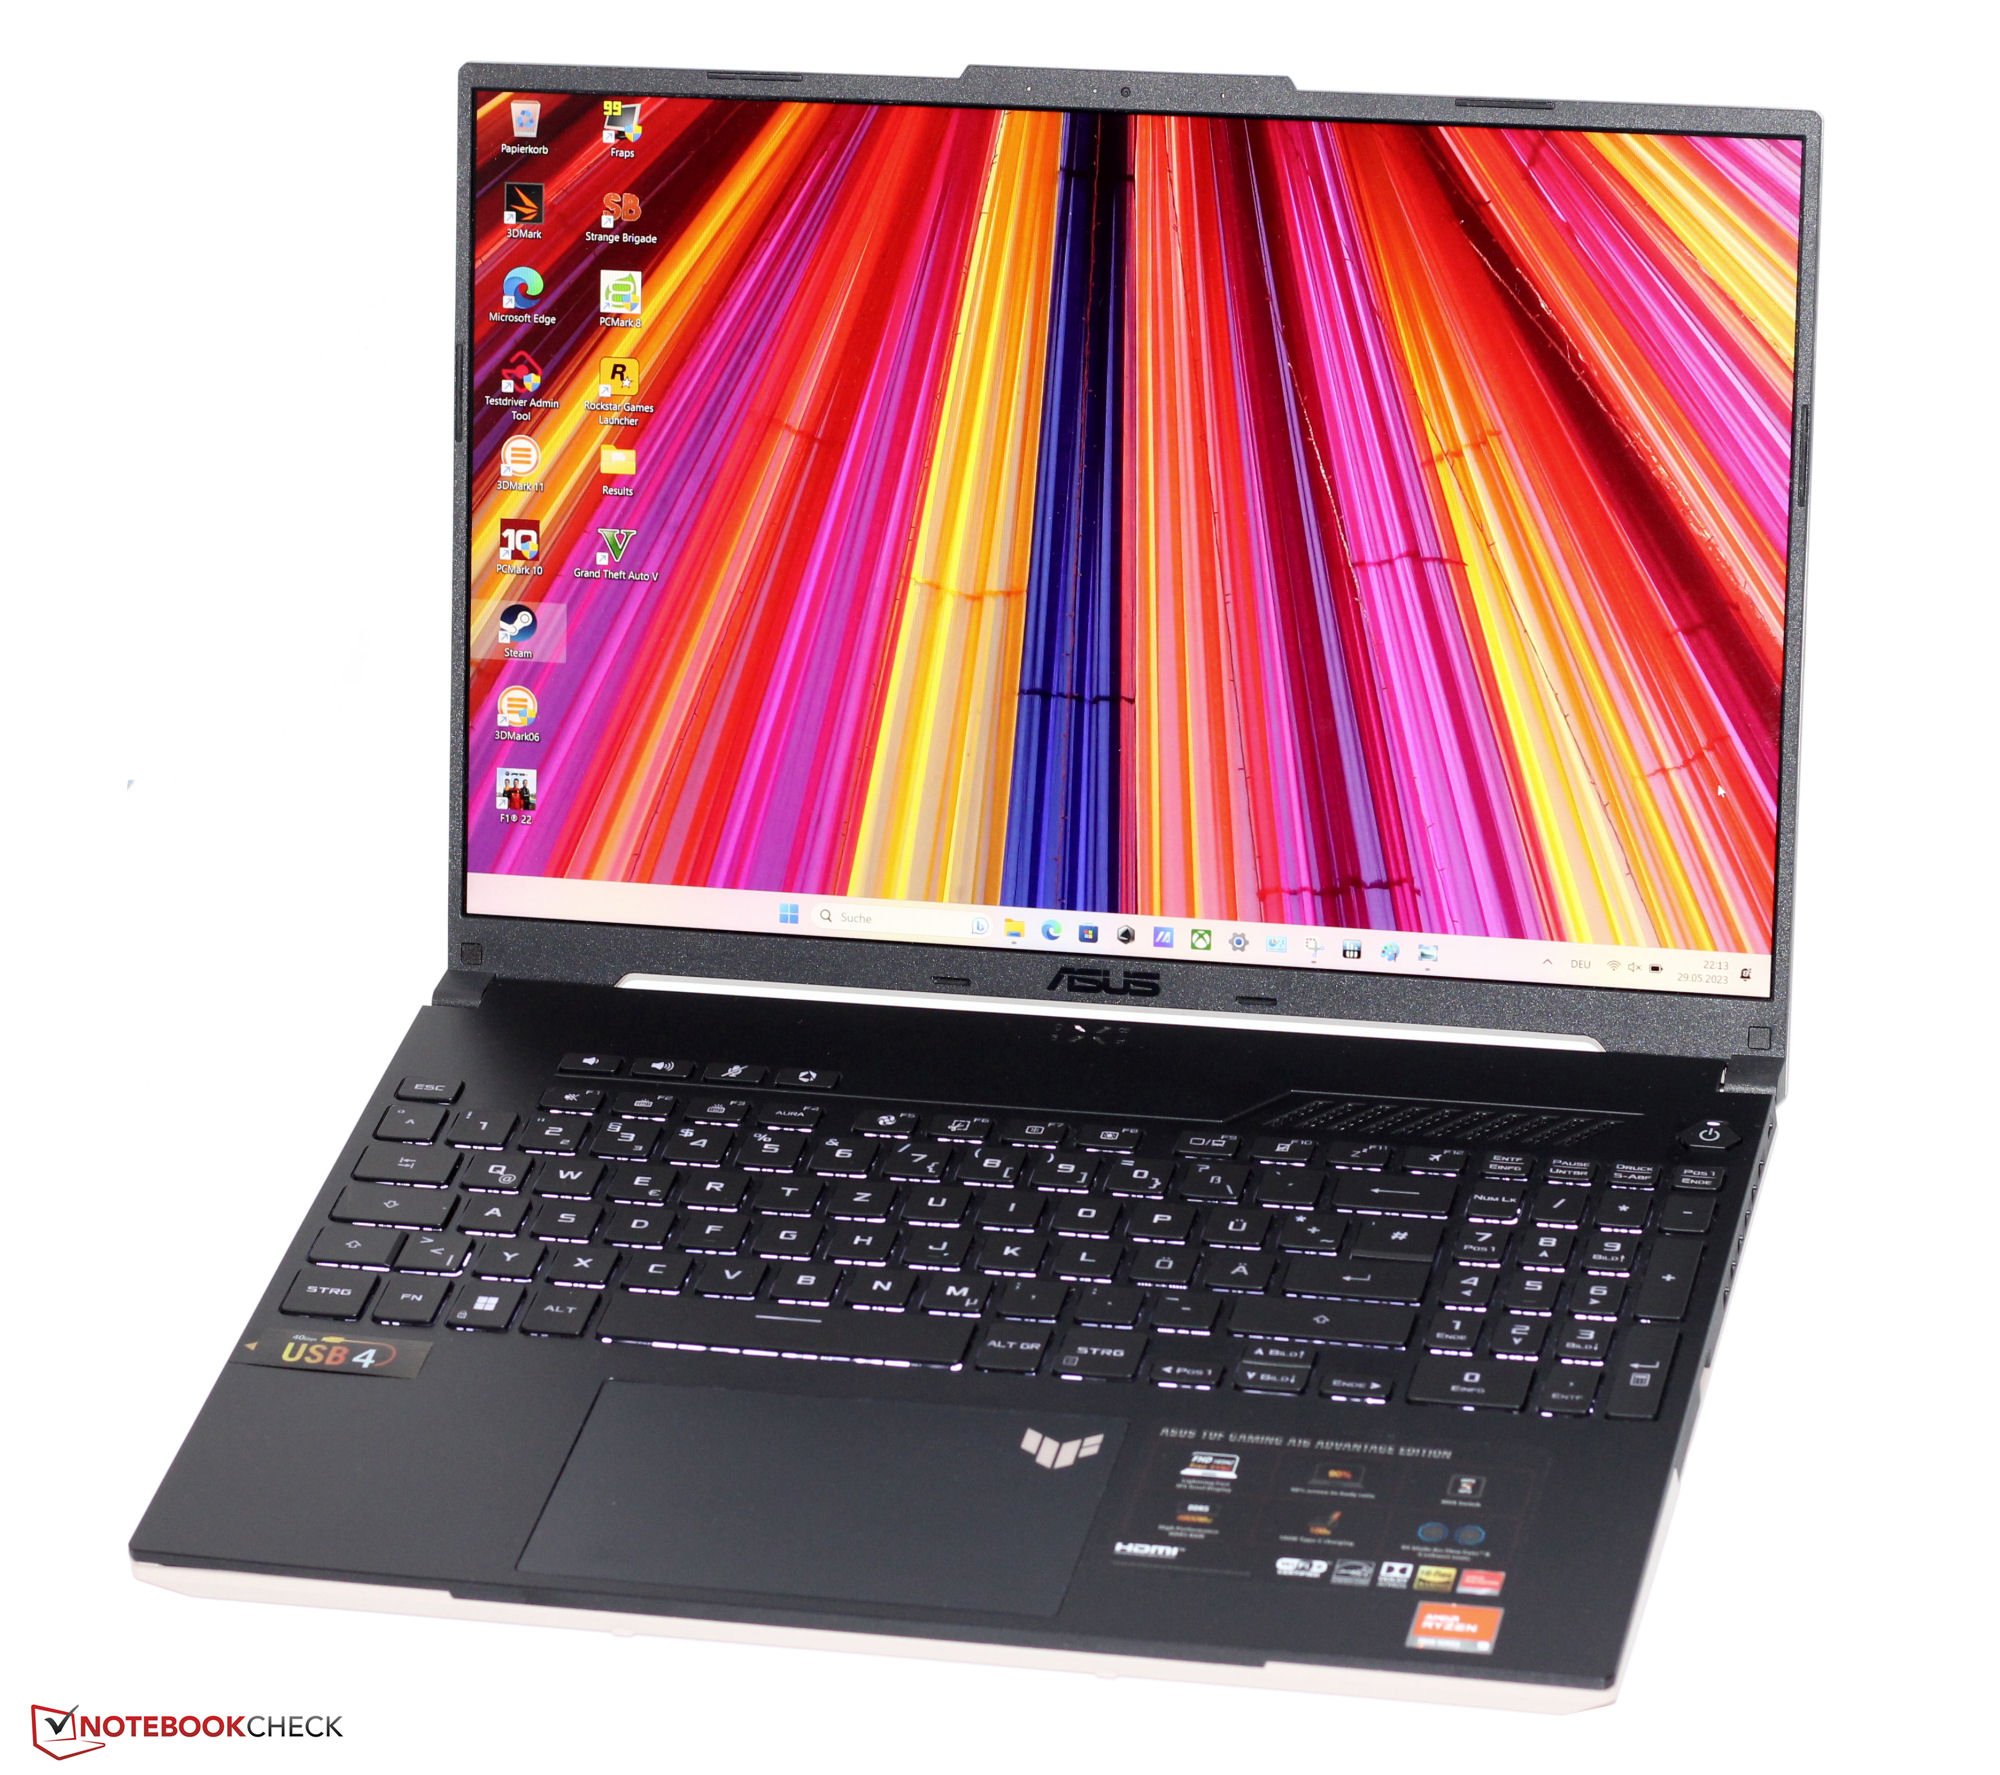
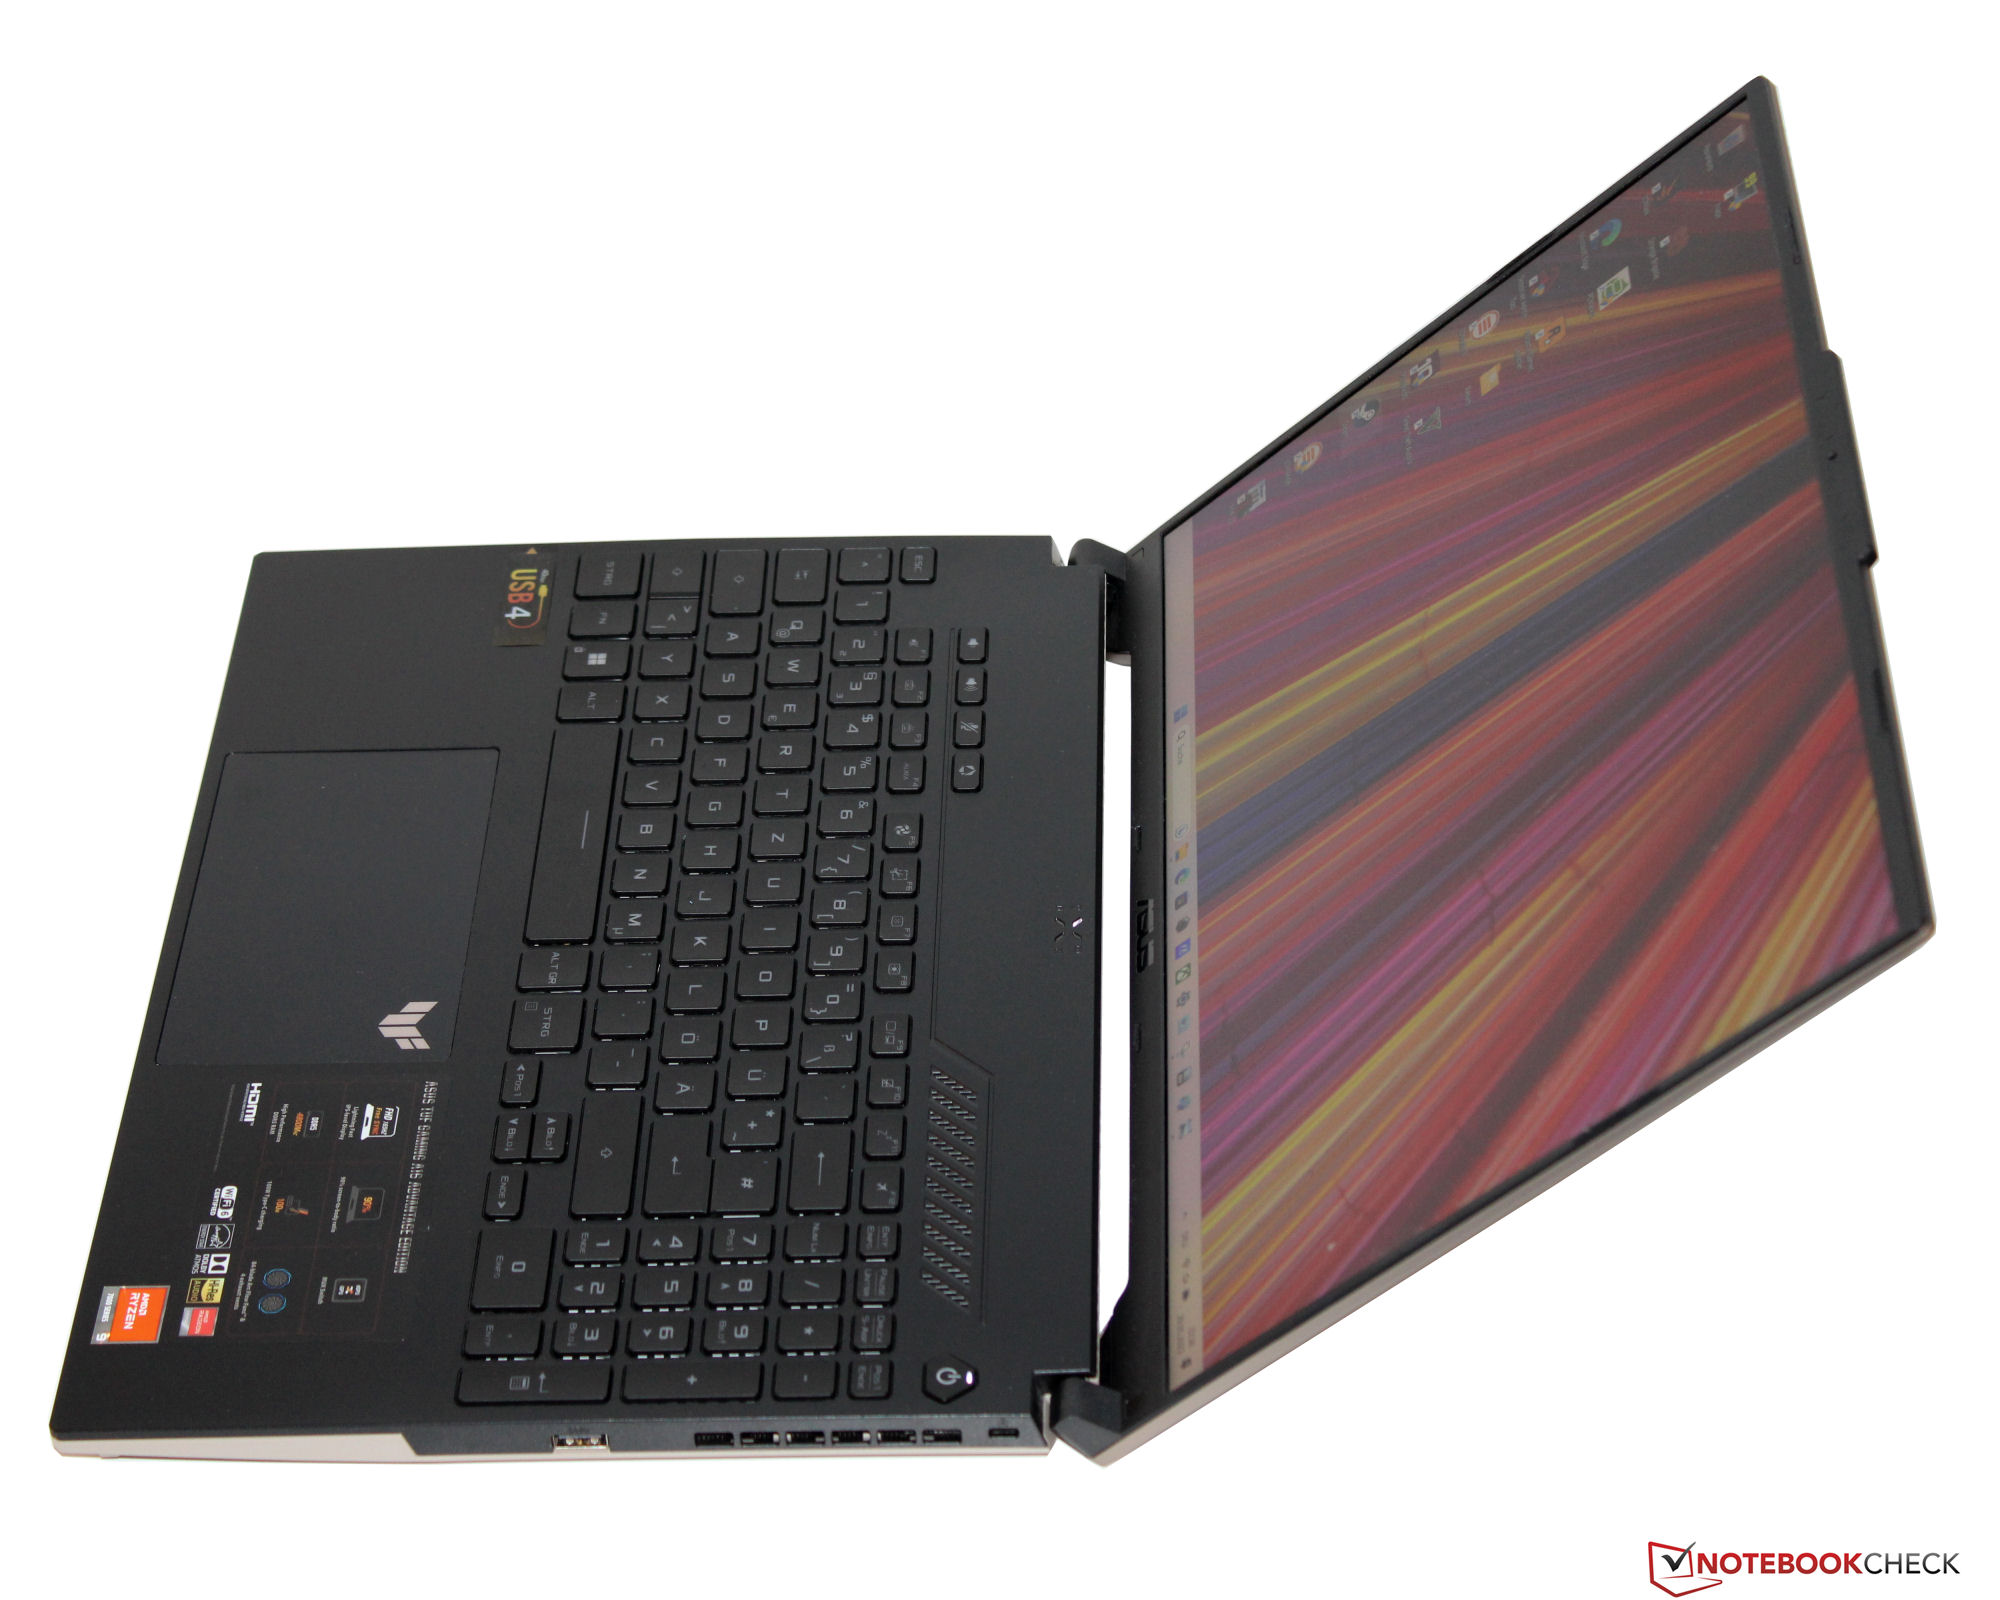
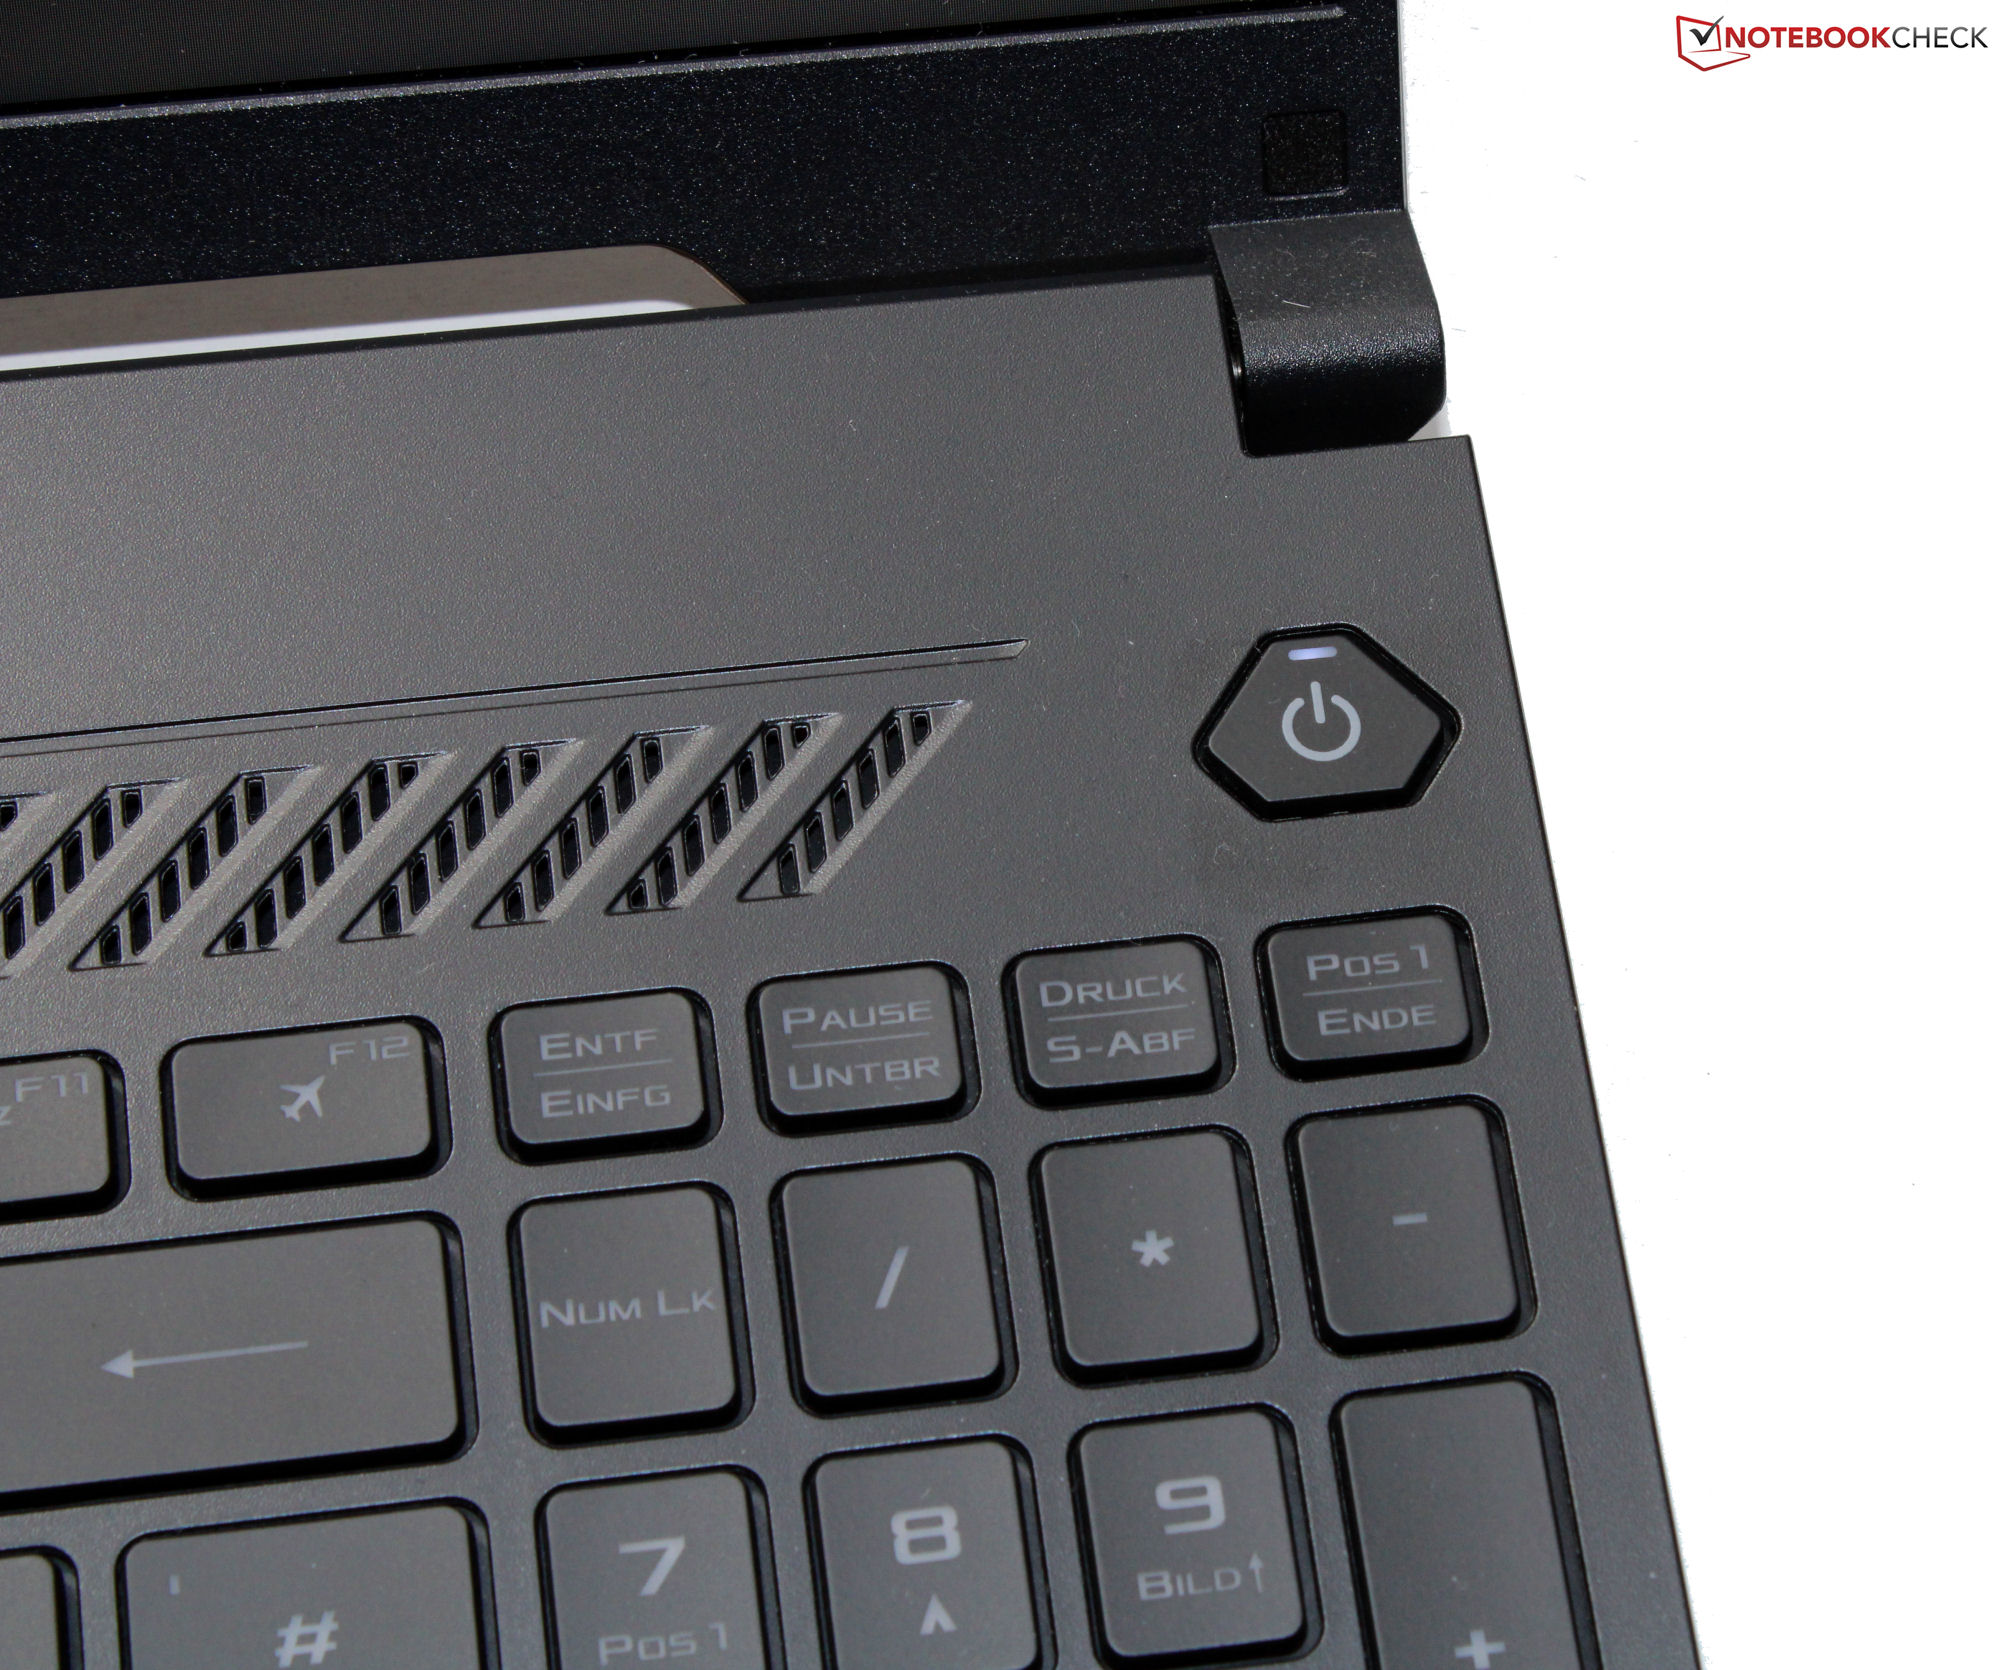
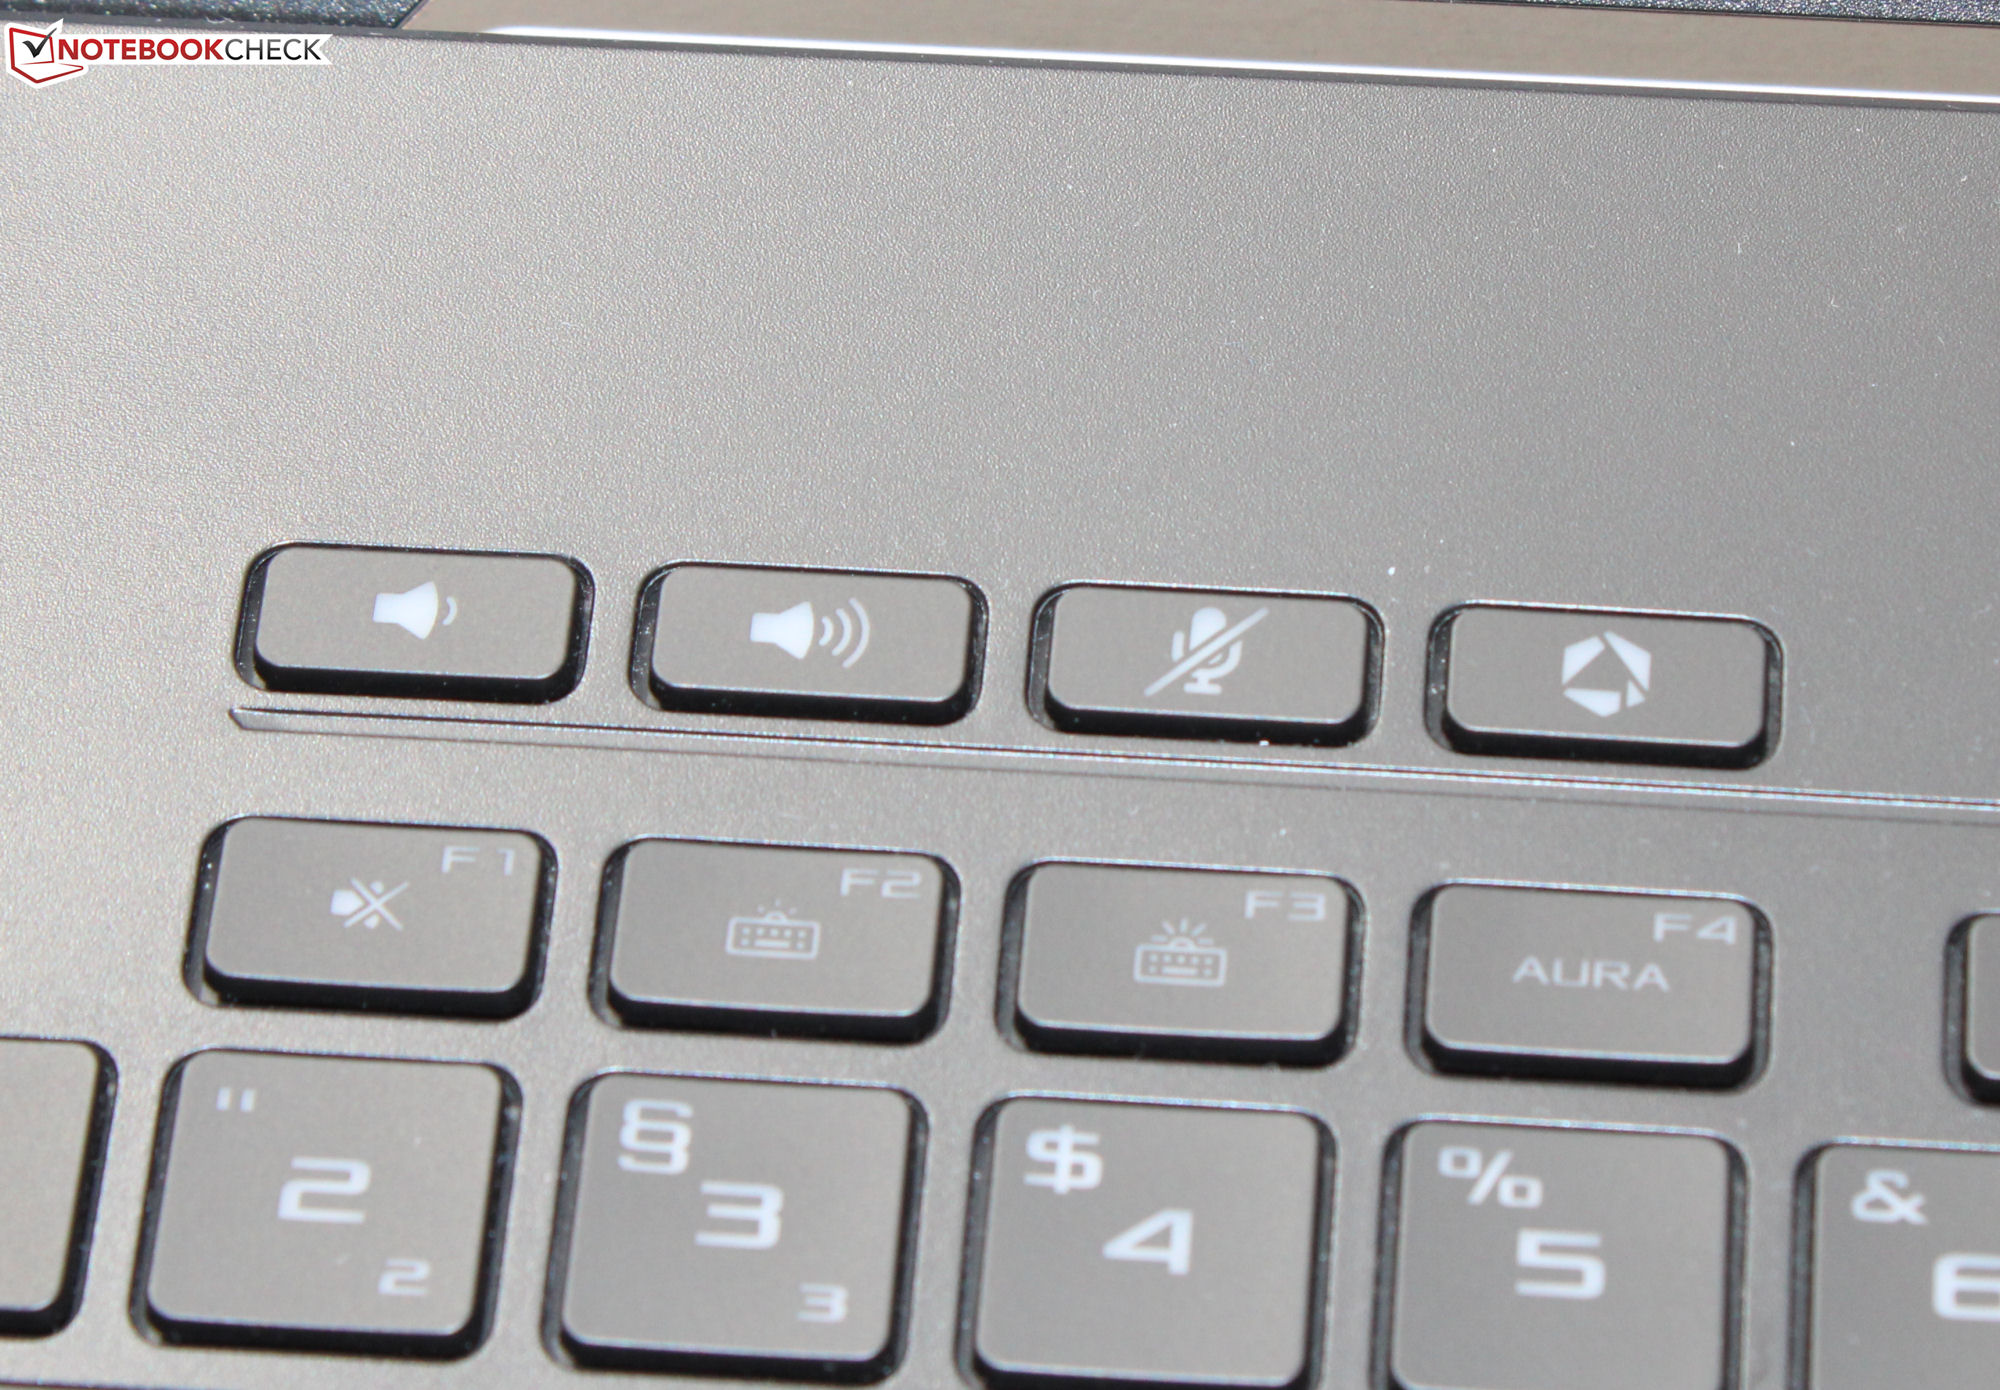
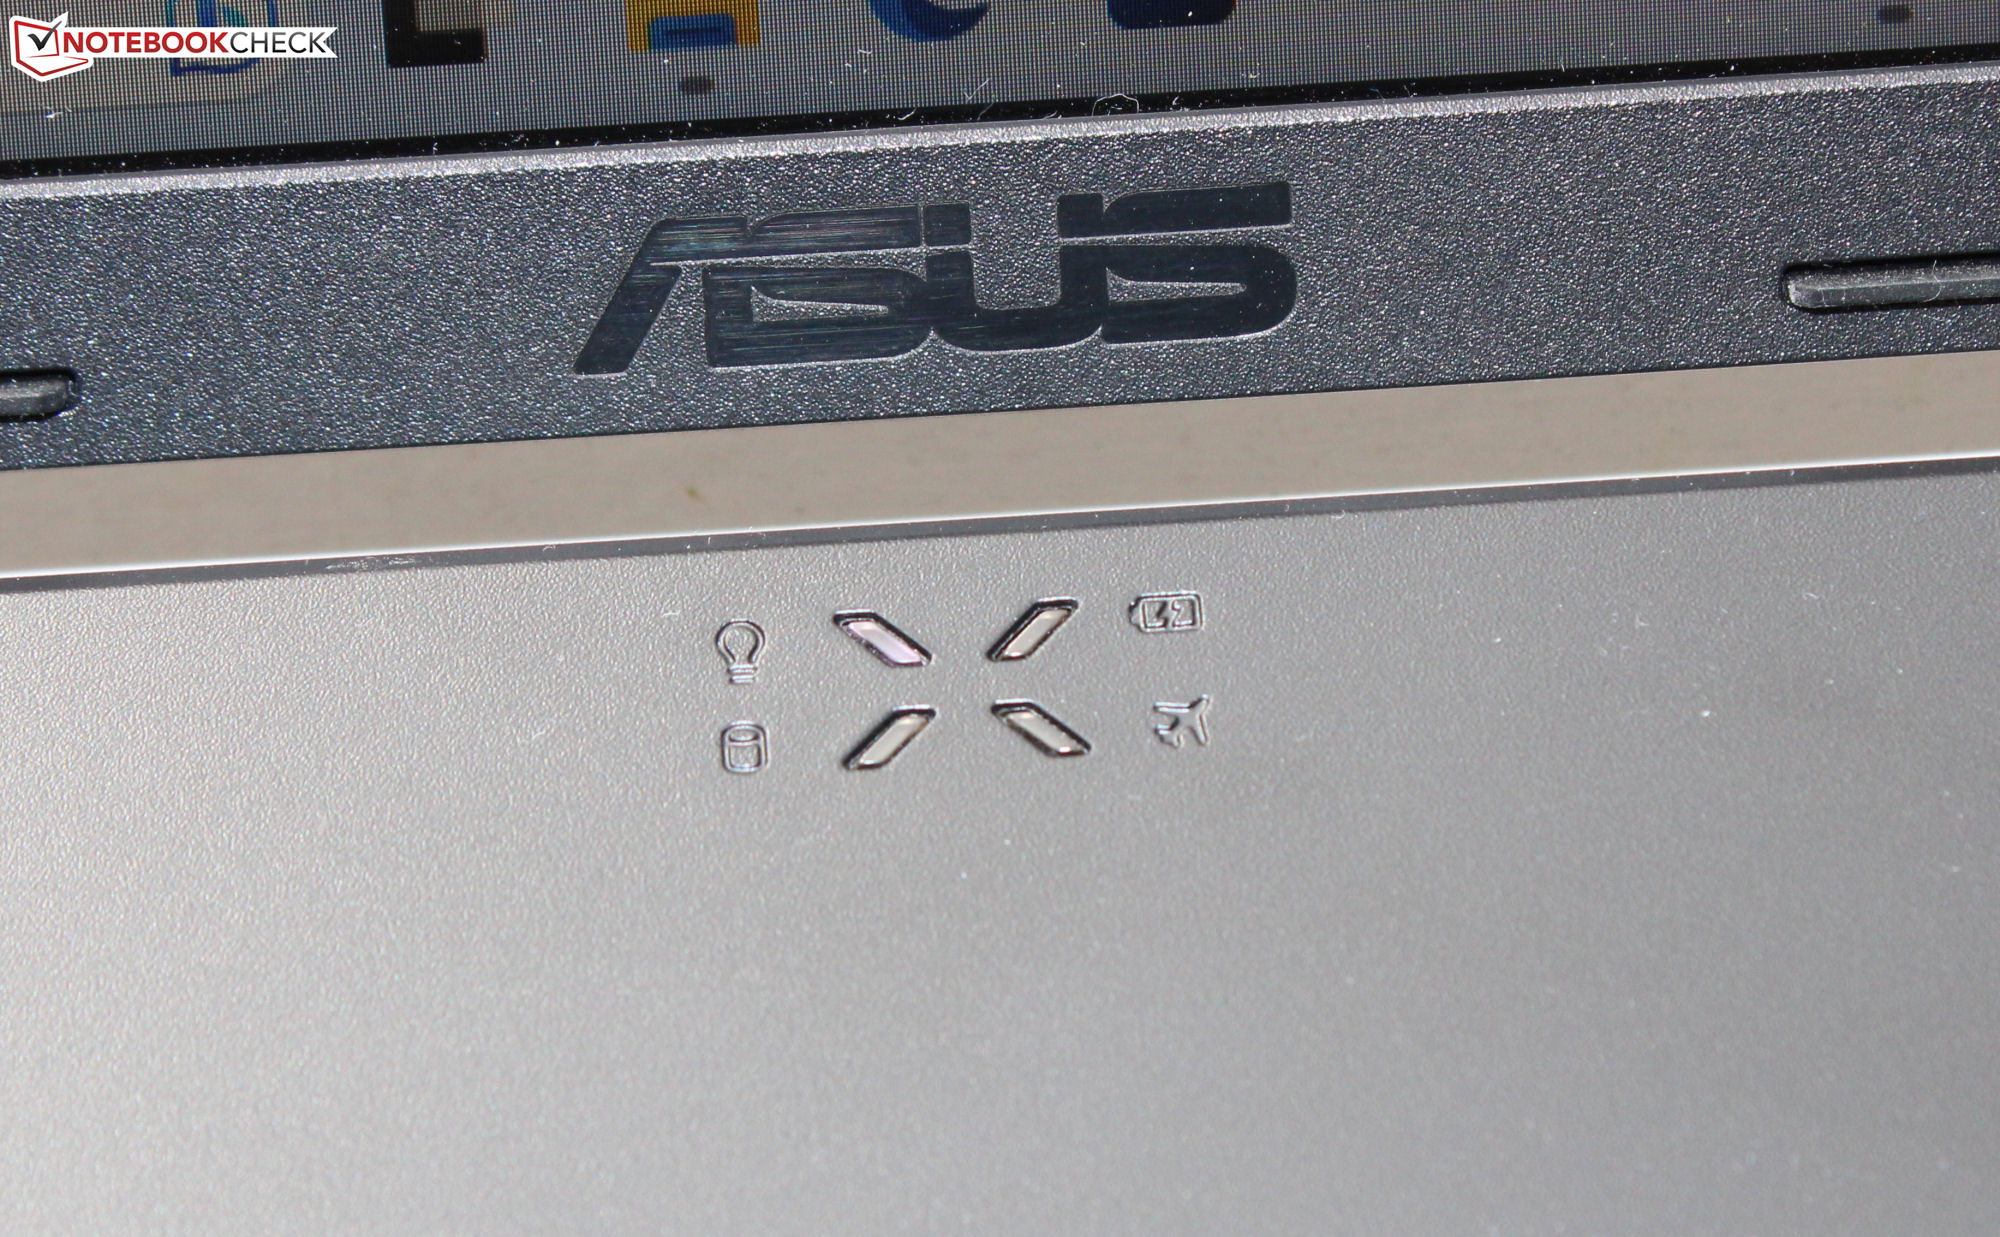
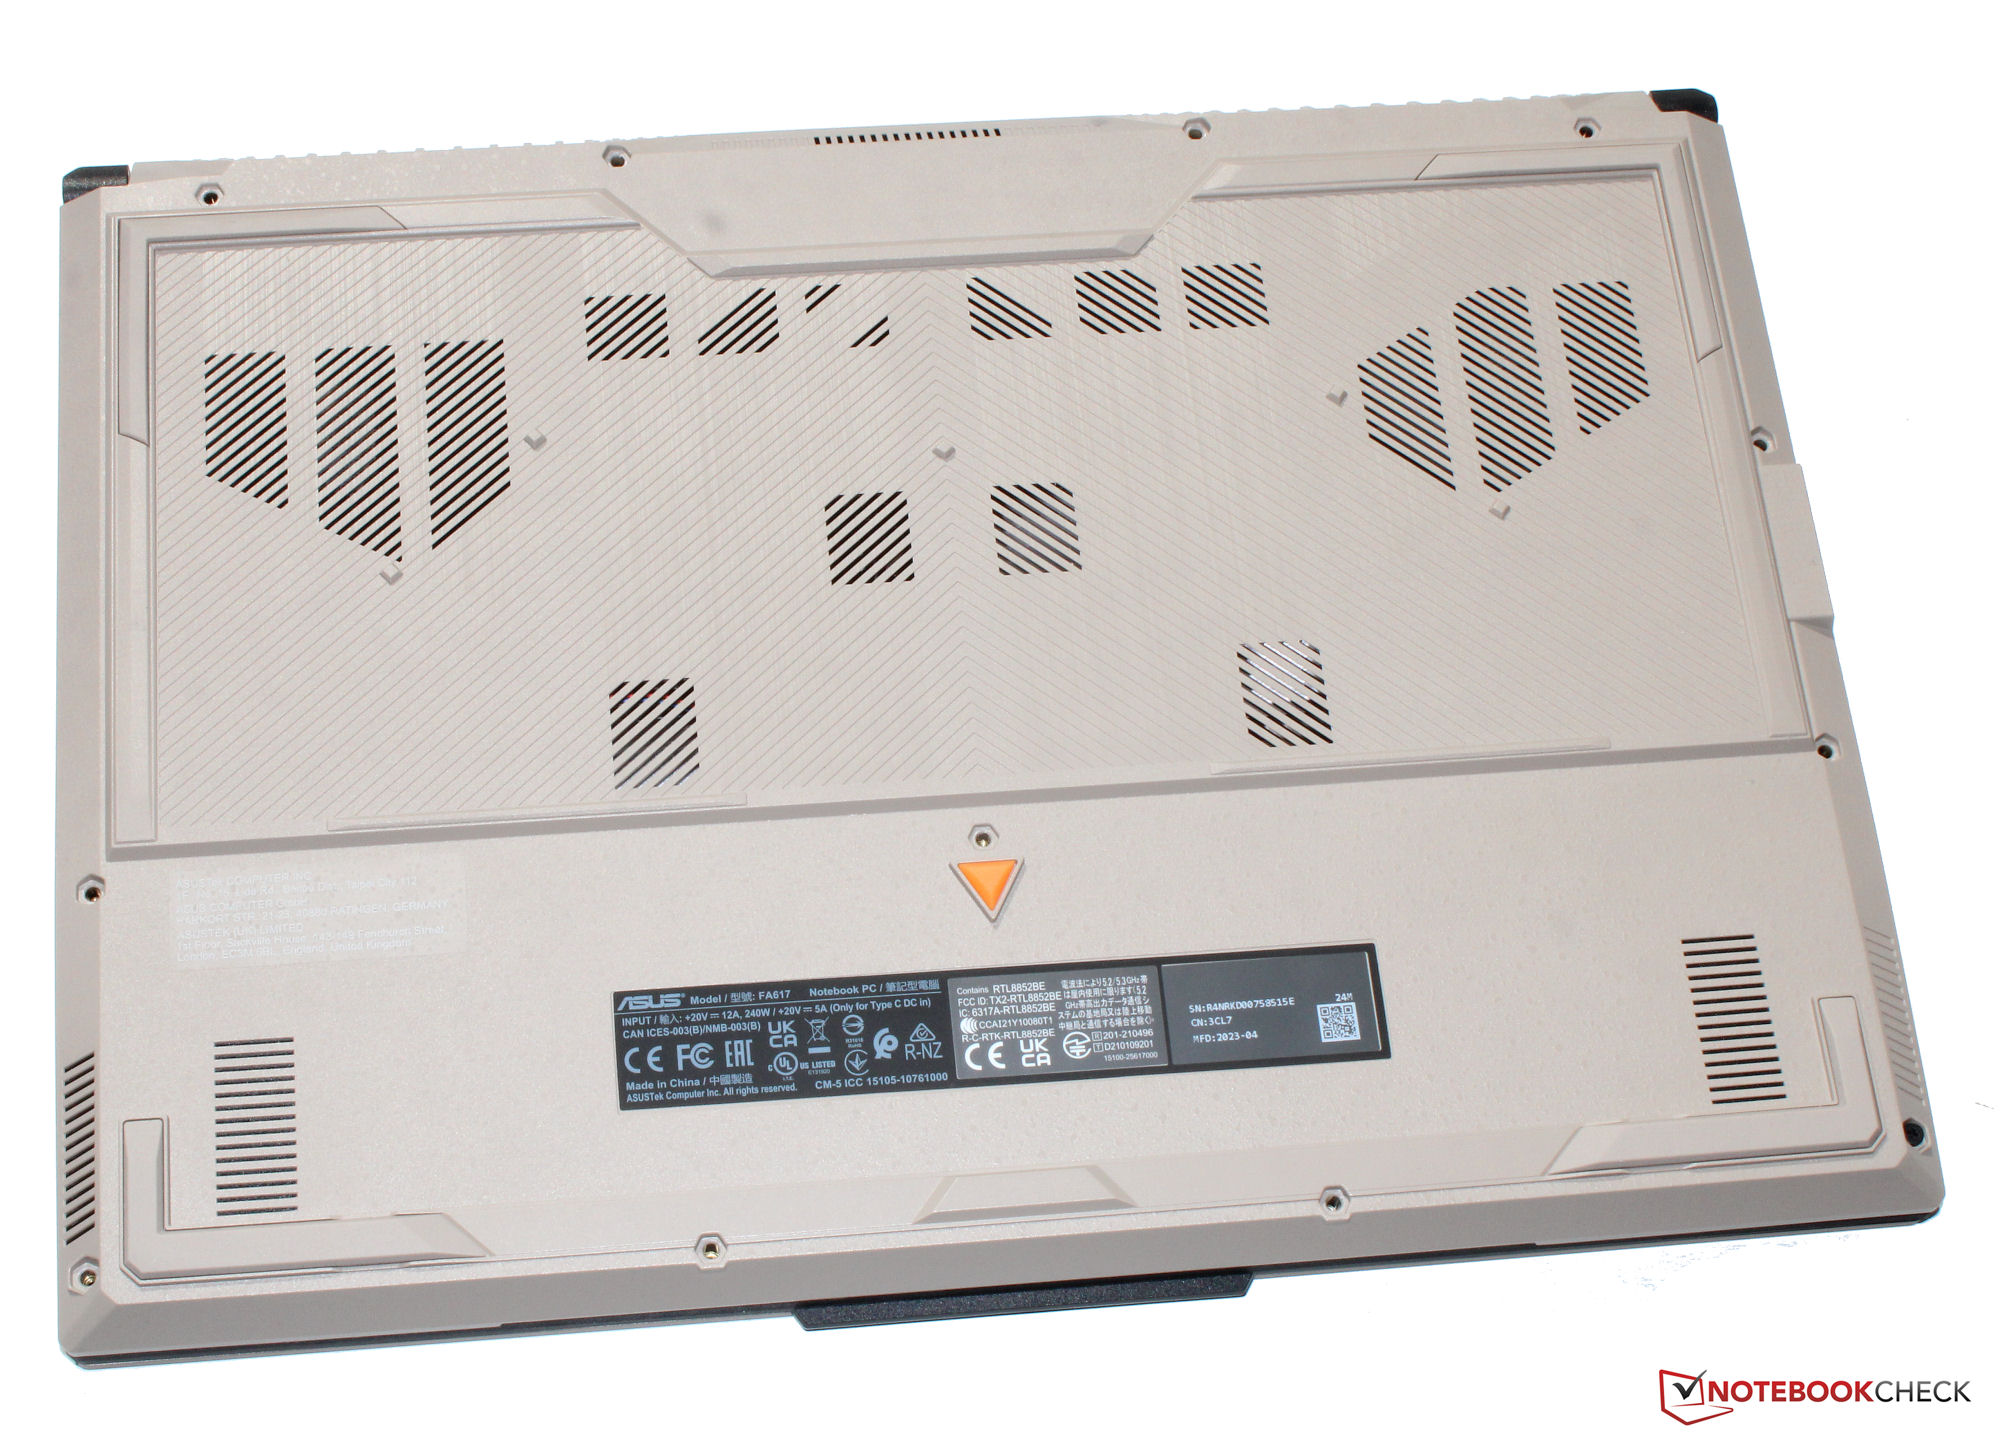
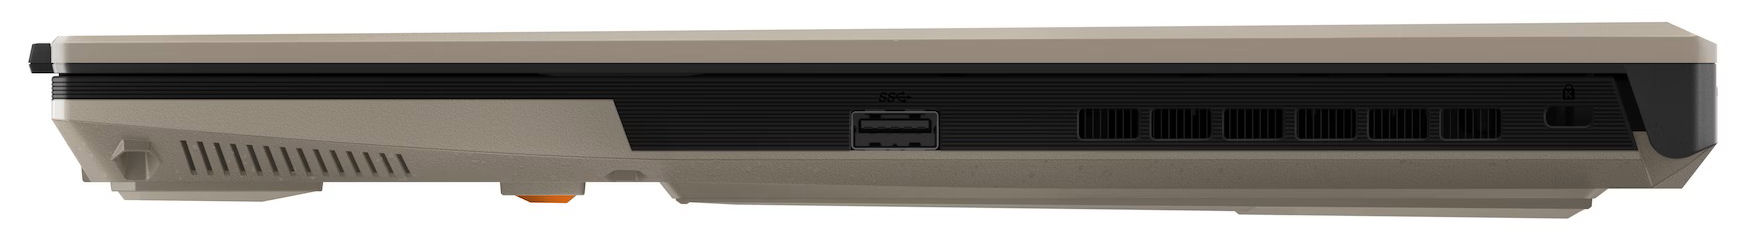
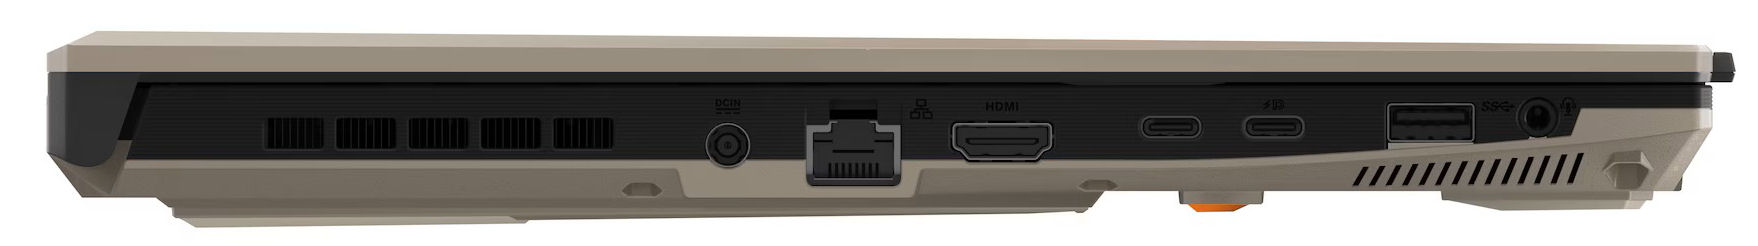
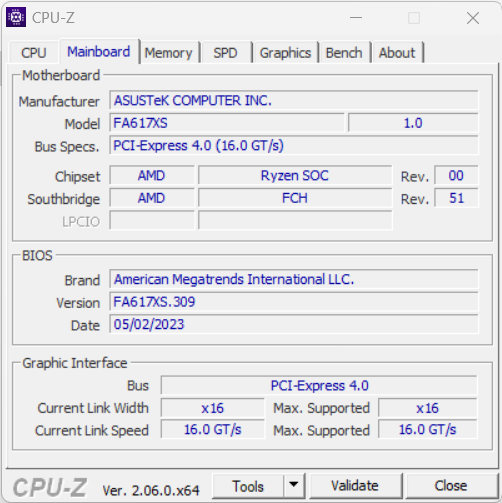
Case & connectivity - small changes compared to its sister model
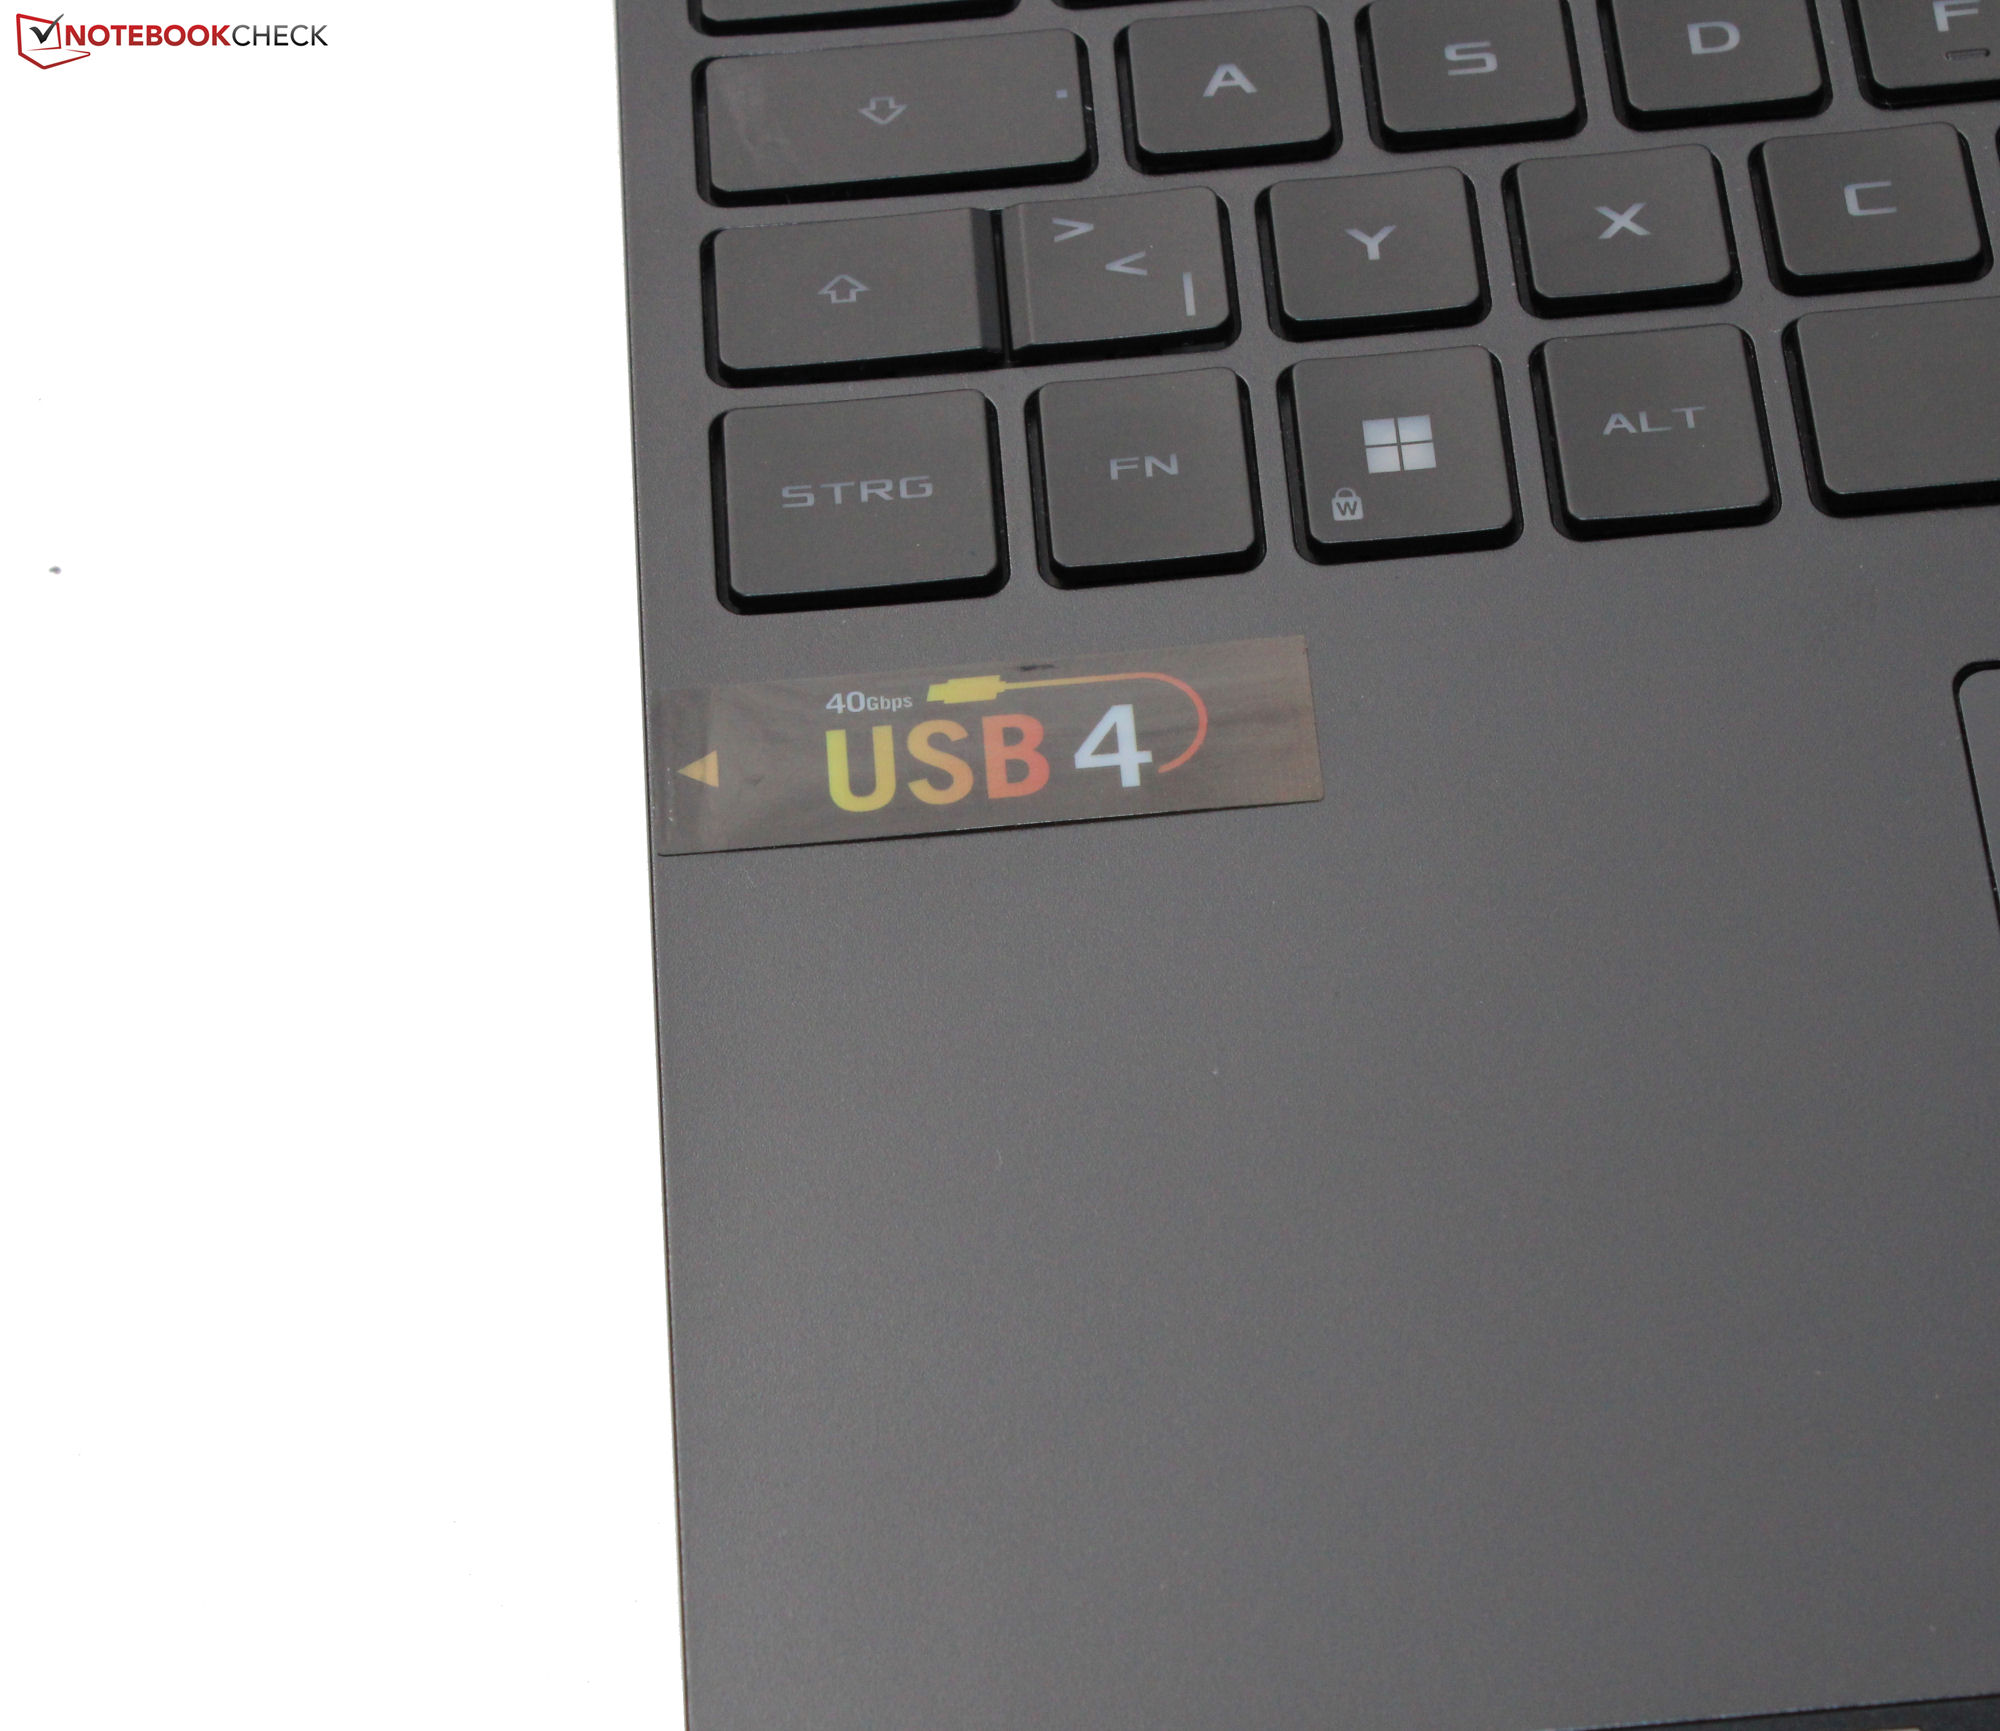
Compared to its sister model's well-known black case, the A16 has a two-toned case. The back of the lid and bottom of the case are a sandy color ("Sandstorm"). Connectivity options are also a little different: One of the two USB-C ports has been upgraded to USB-4 standard.


Display - 16:10 panel with sRGB coverage
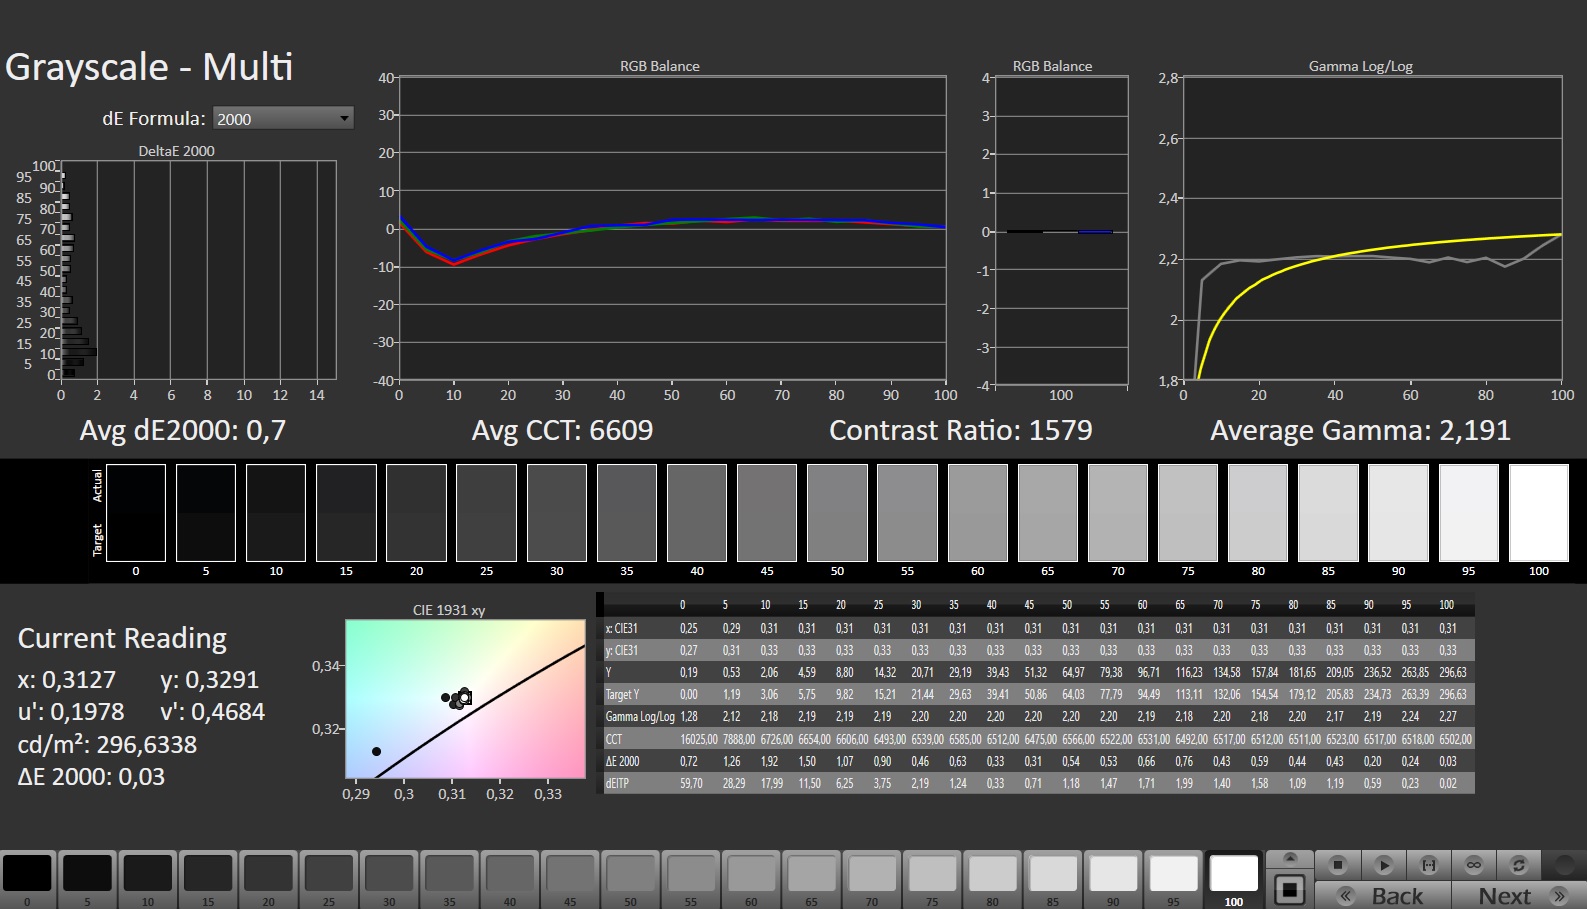
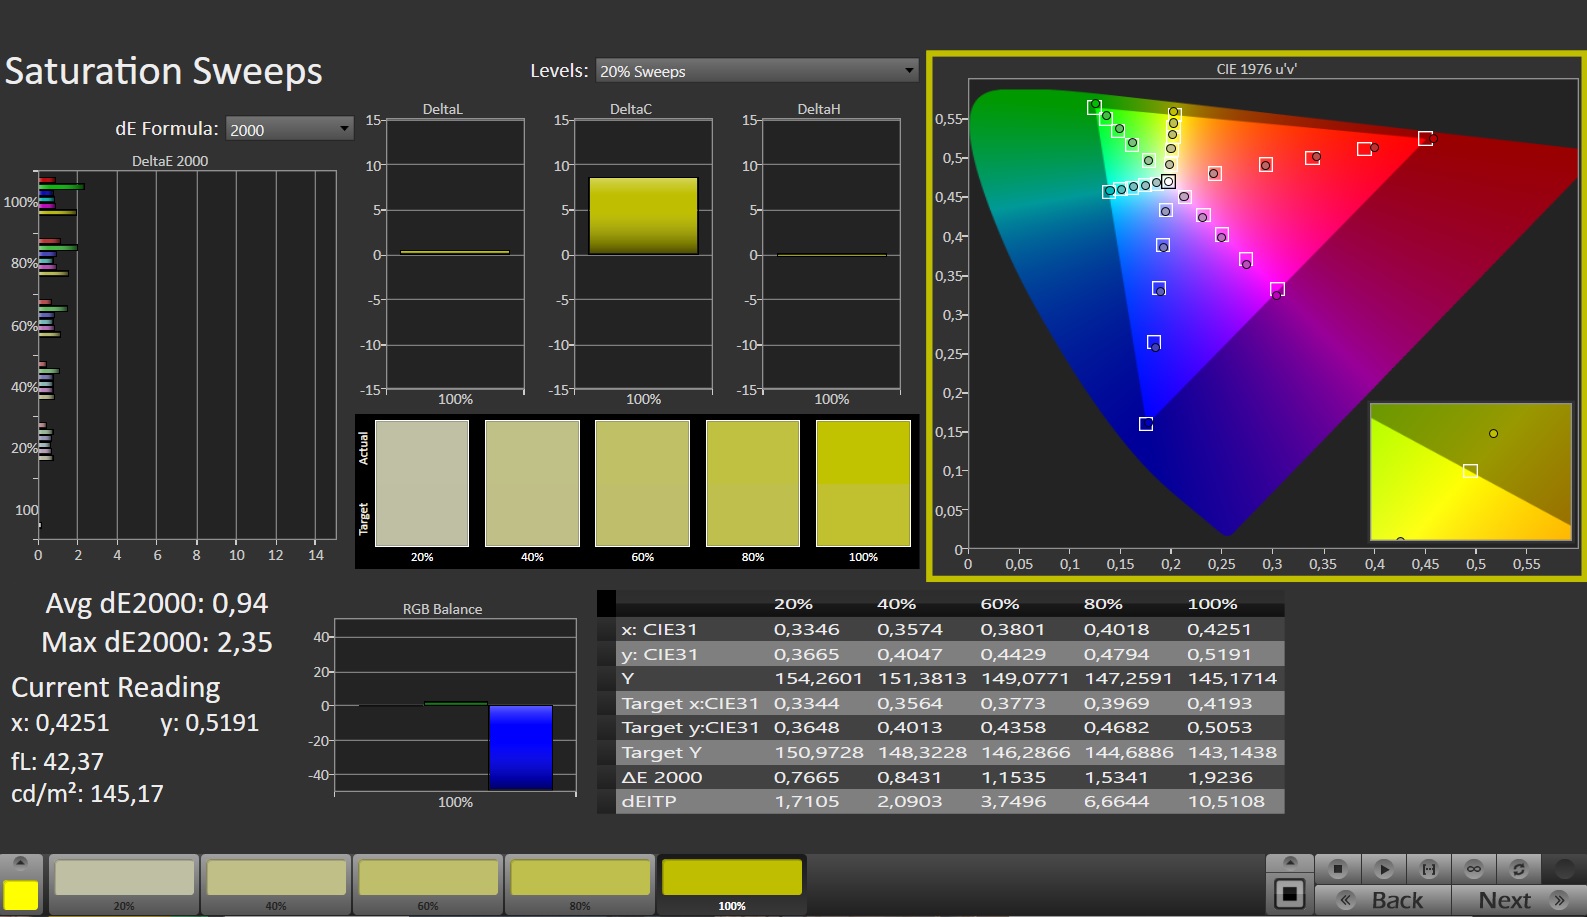
The A16 is equipped with the same 165-Hz panel that can be found on its sister model. Its matte 16-inch display (1,920 x 1,200 pixels, IPS) has a 16:10 format and it scores points thanks to its FreeSync support, lack of PWM flickering and quick reaction speeds. While its contrast is acceptable, its brightness could do with being a little better.
| |||||||||||||||||||||||||
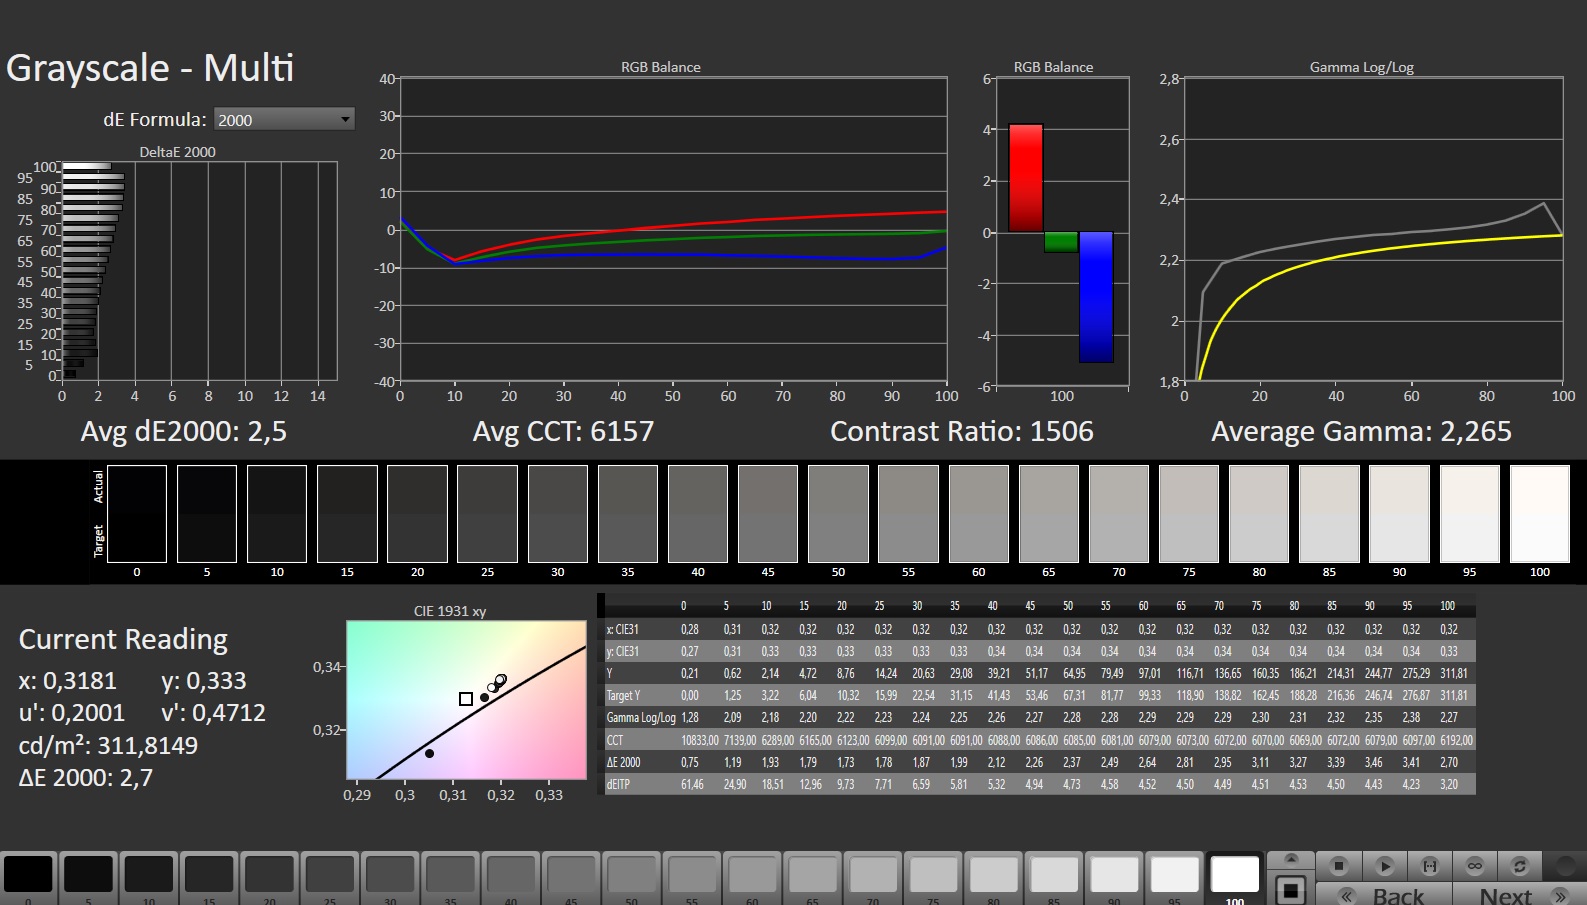
Brightness Distribution: 94 %
Center on Battery: 301 cd/m²
Contrast: 1433:1 (Black: 0.21 cd/m²)
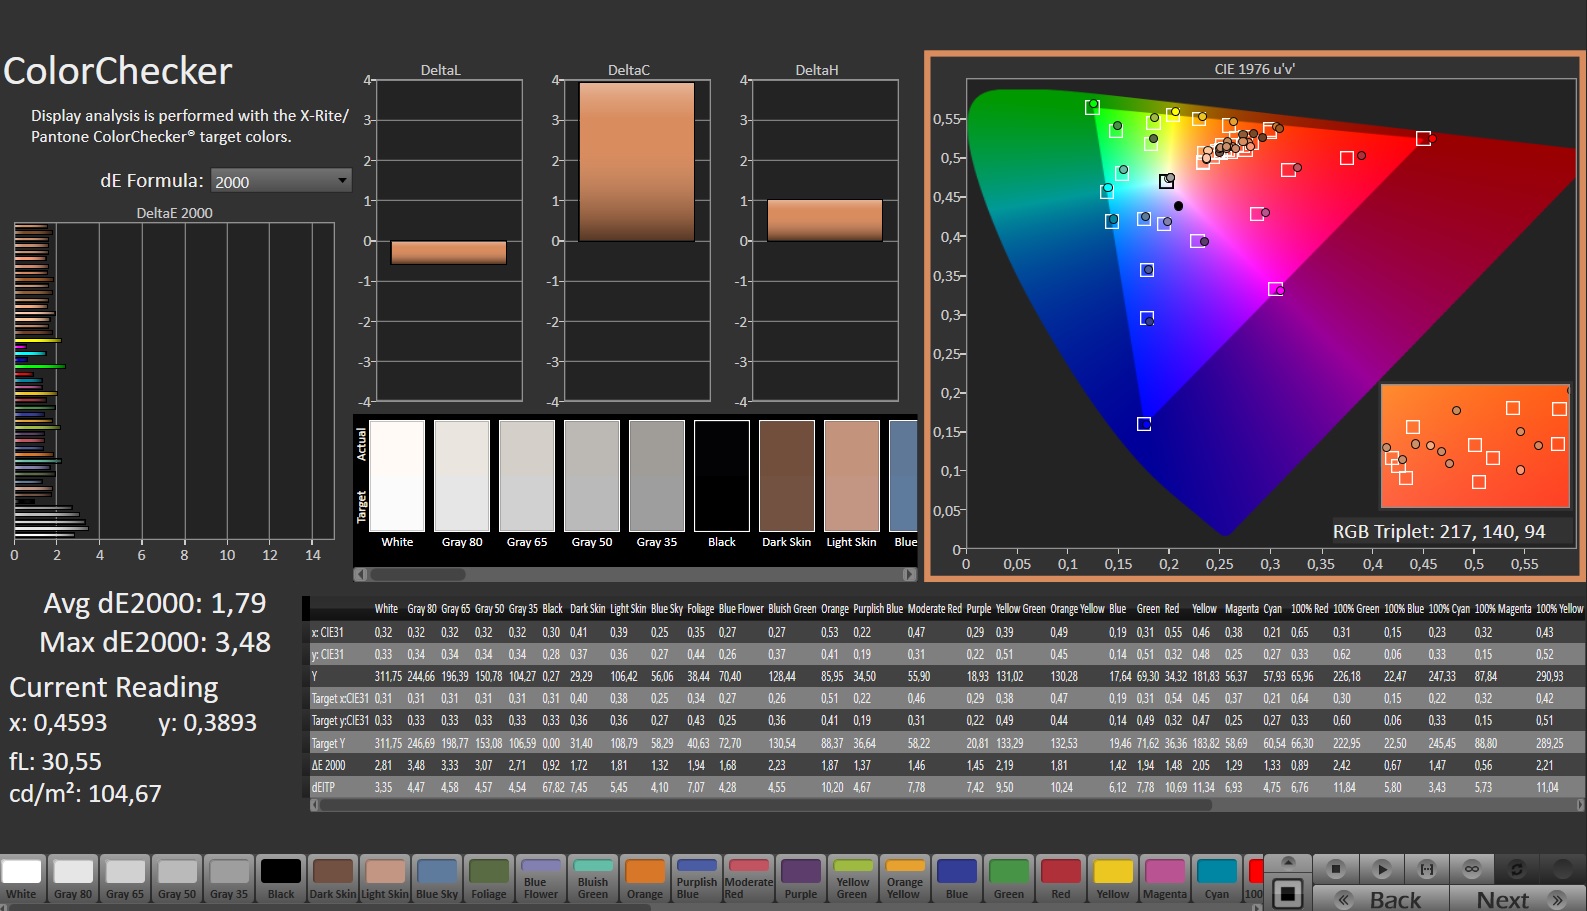
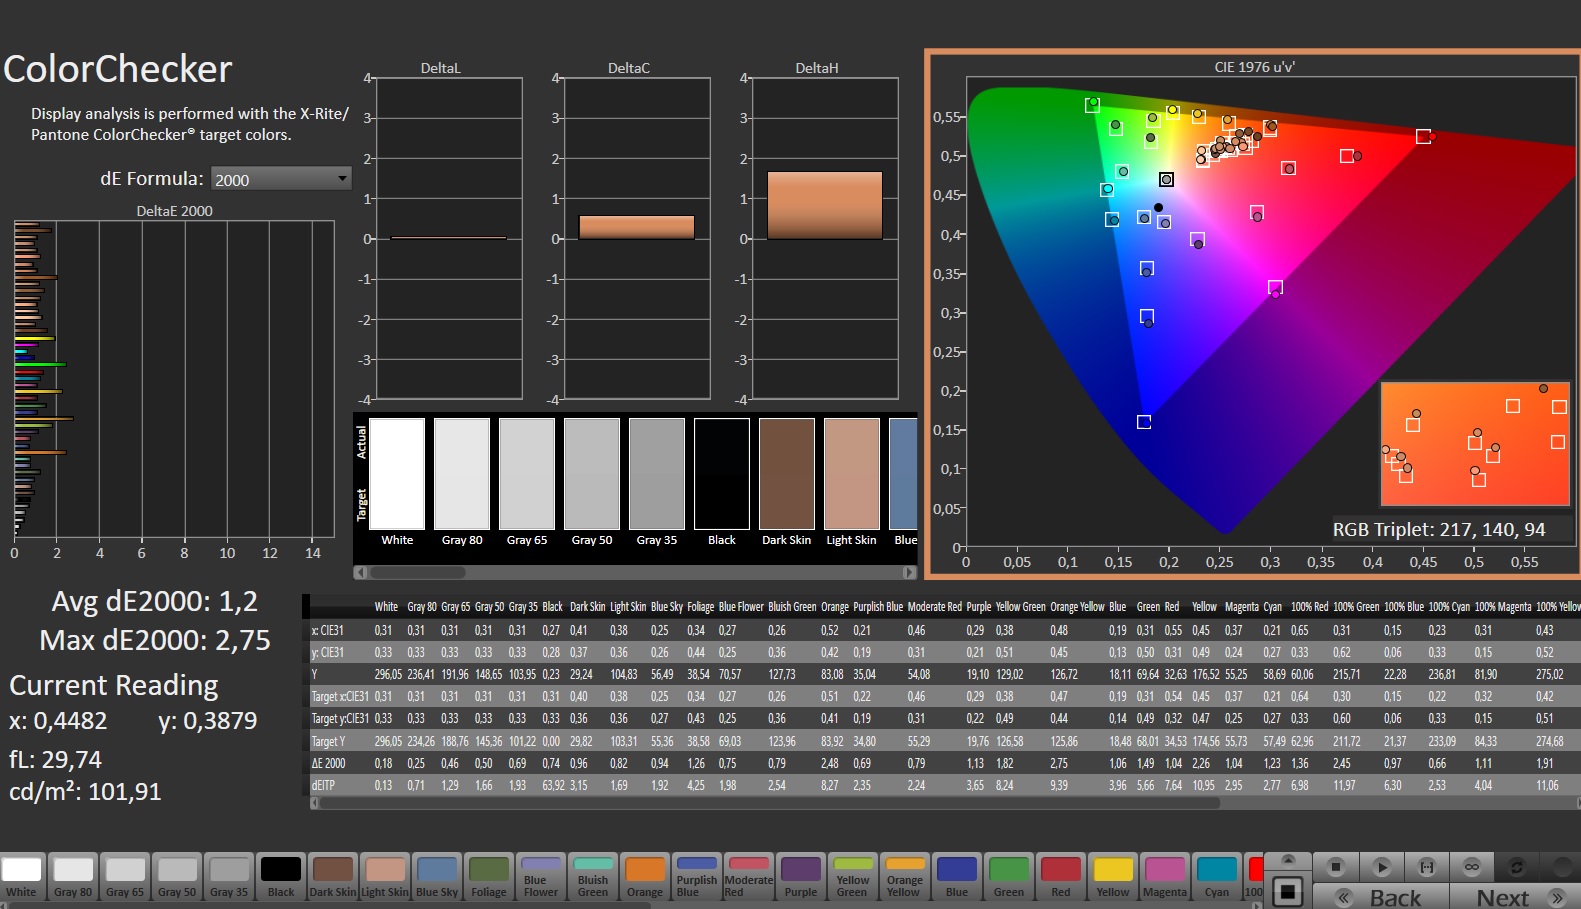
ΔE ColorChecker Calman: 1.79 | ∀{0.5-29.43 Ø4.78}
calibrated: 1.2
ΔE Greyscale Calman: 2.5 | ∀{0.09-98 Ø5}
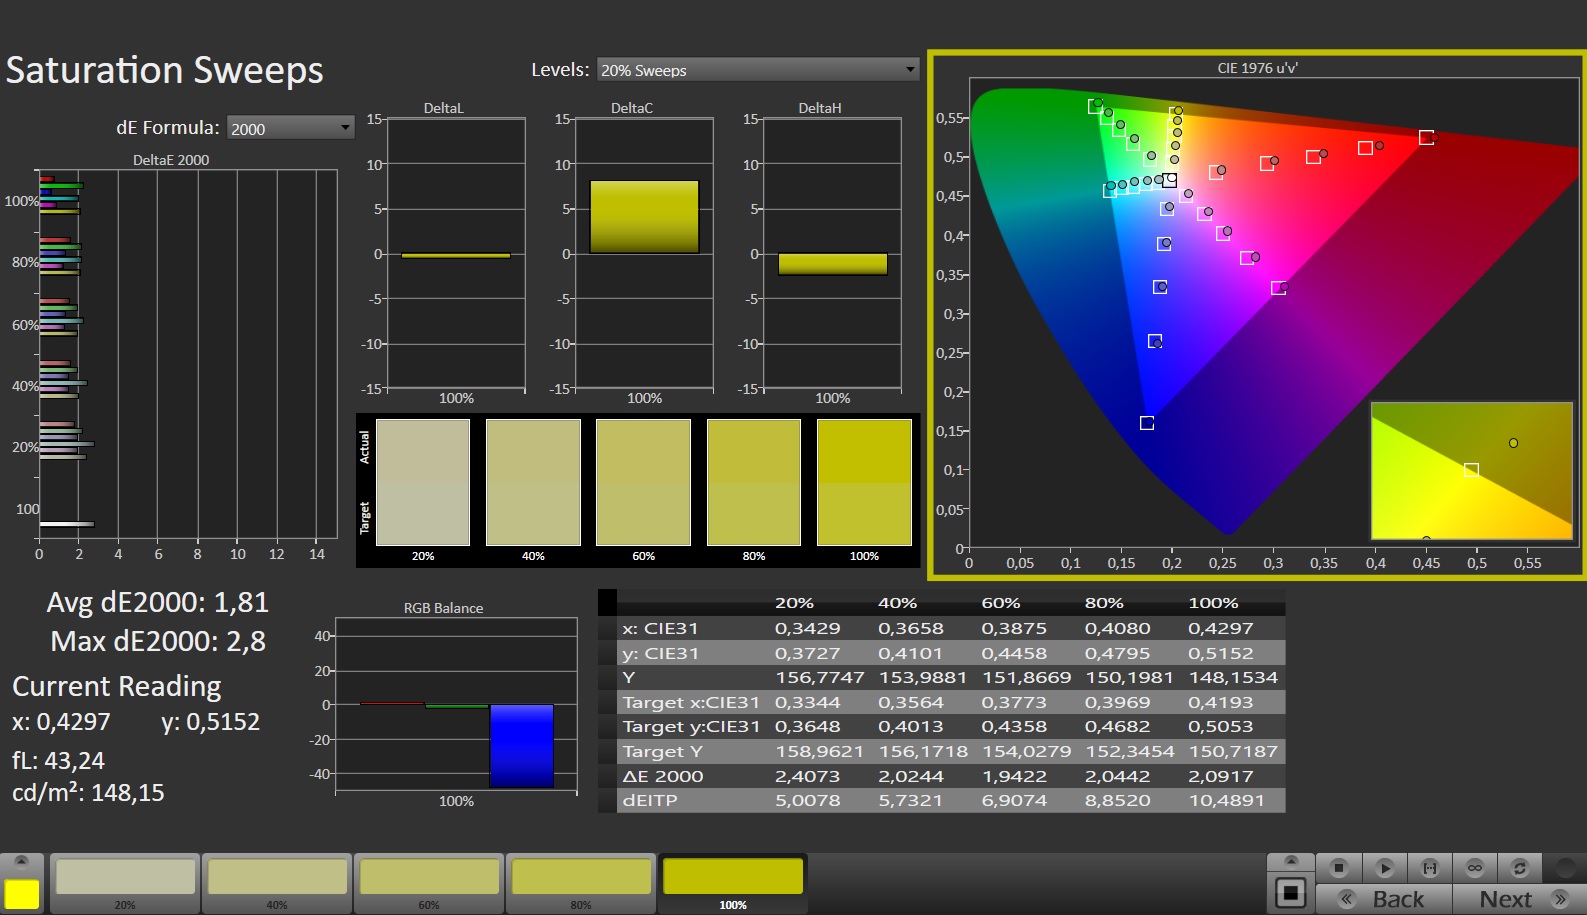
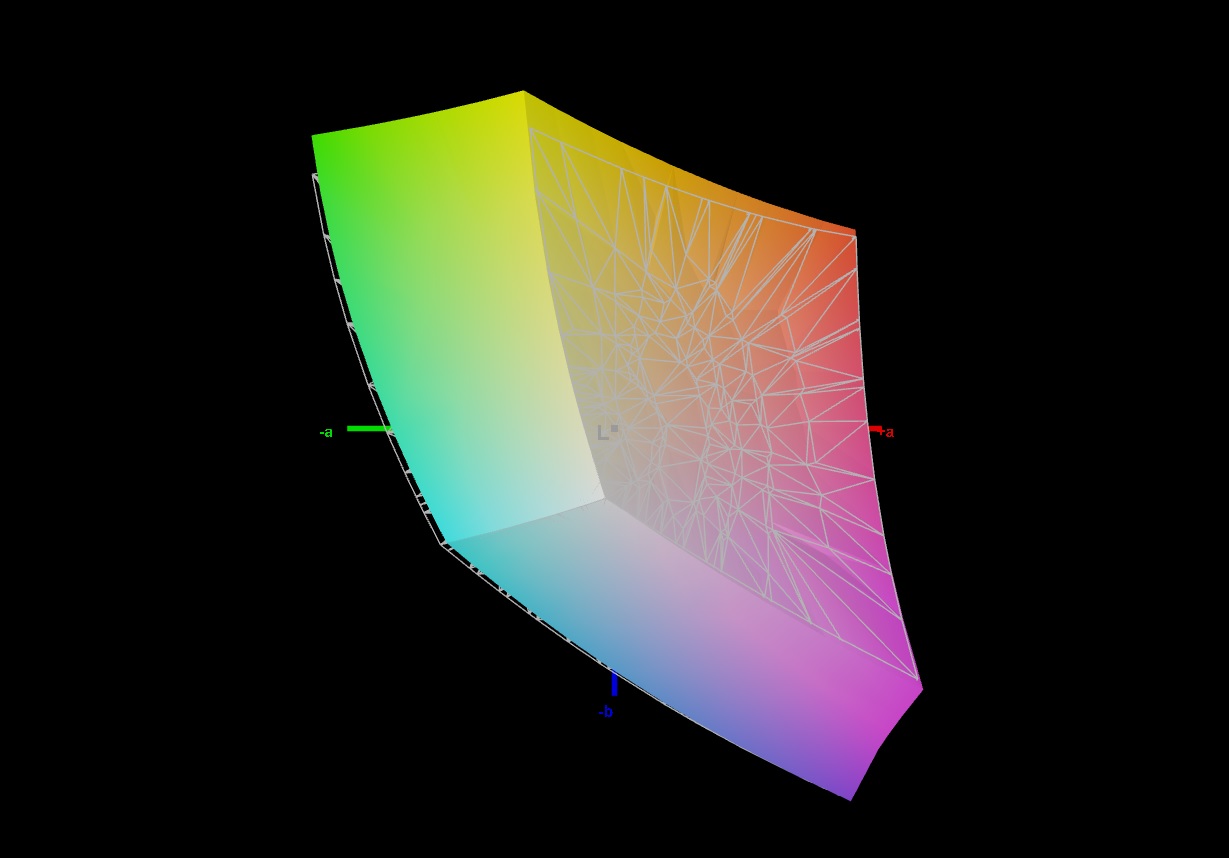
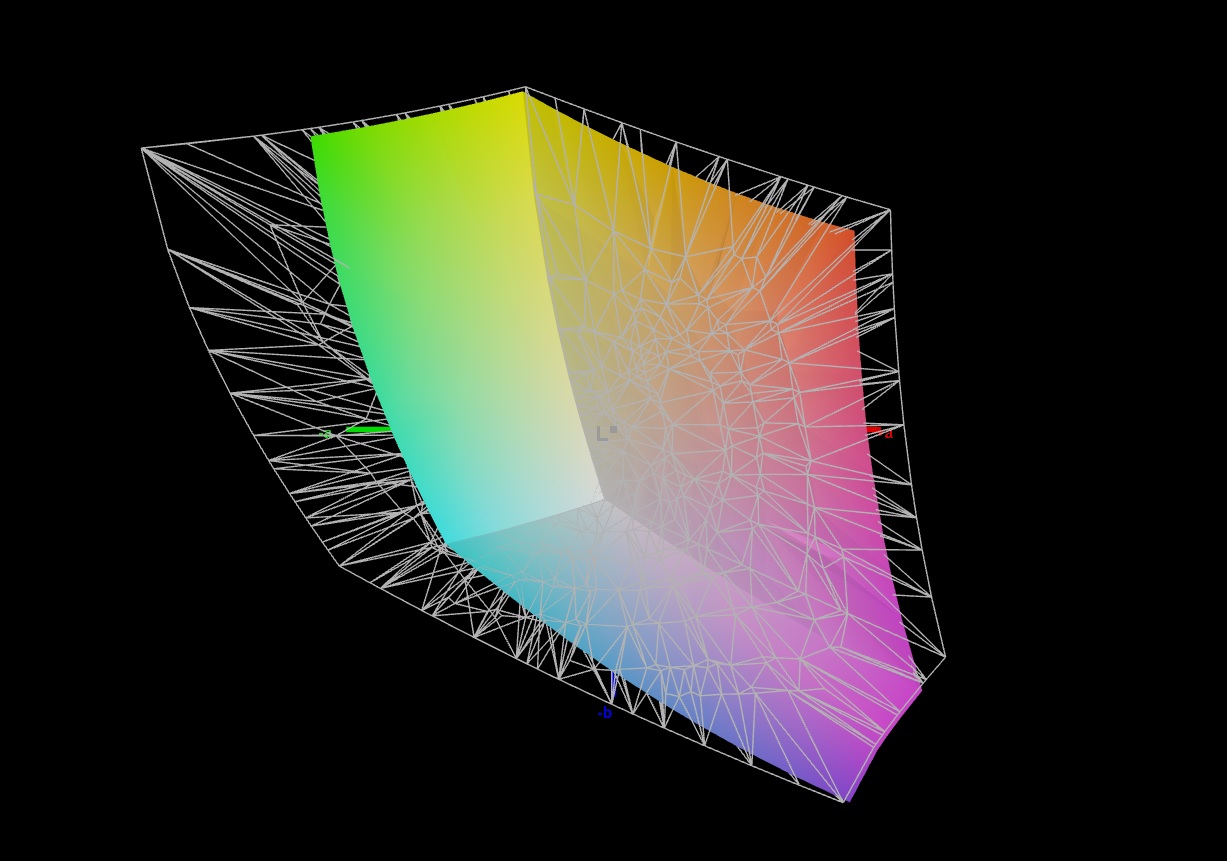
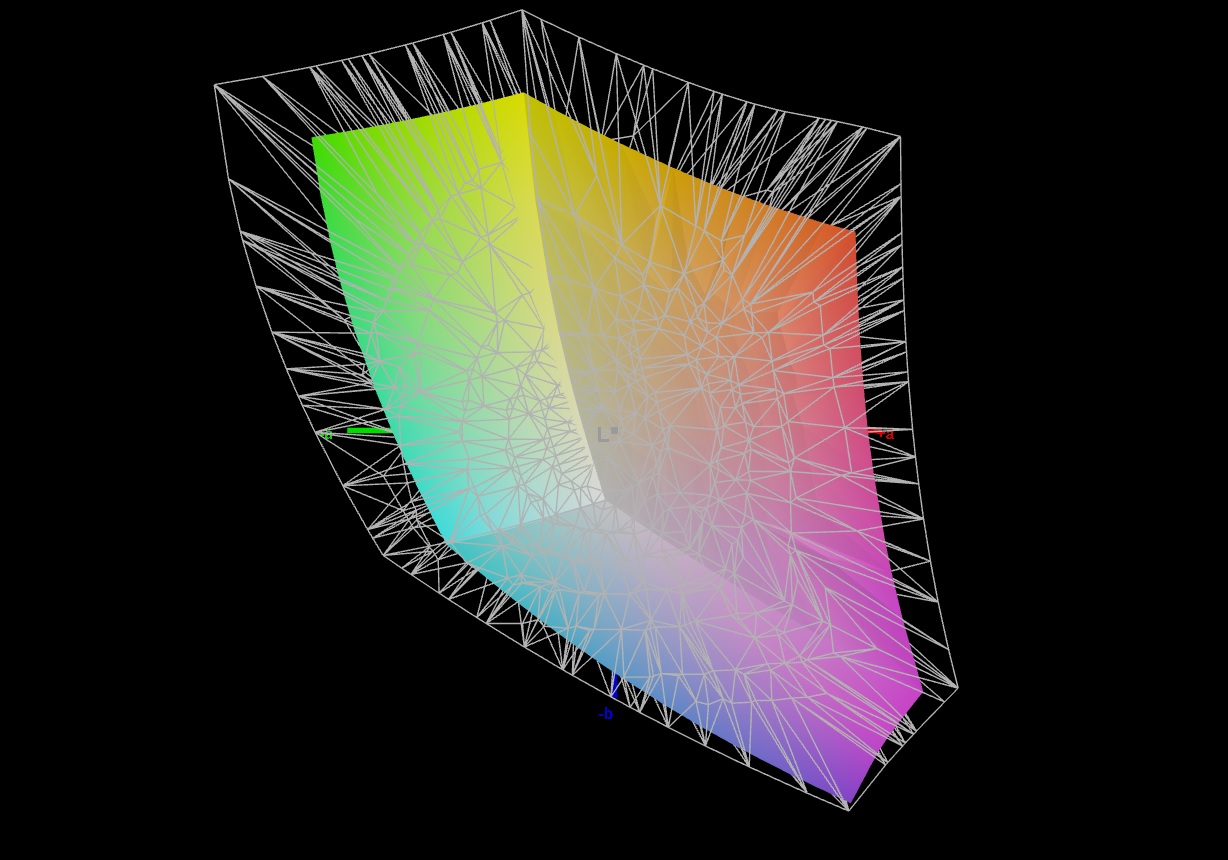
70.7% AdobeRGB 1998 (Argyll 3D)
97.3% sRGB (Argyll 3D)
69.3% Display P3 (Argyll 3D)
Gamma: 2.265
CCT: 6157 K
| Asus TUF Gaming A16 FA617XS BOE NE160WUM-NX2, IPS, 1920x1200, 16" | Lenovo Legion Pro 5 16IRX8 AU Optronics B160QAN03.1, IPS, 2560x1600, 16" | MSI Katana 15 B12VEK AUOAF90 (B156HAN08.4), IPS, 1920x1080, 15.6" | Medion Erazer Defender P40 BOE CQ NE173QHM-NZ3, IPS, 2560x1440, 17.3" | Gigabyte G5 KE Chi Mei N156HRA-EA1, IPS, 1920x1080, 15.6" | Asus TUF Gaming A16 FA617 NE160WUM-NX2 (BOE0B33), IPS-Level, 1920x1200, 16" | |
|---|---|---|---|---|---|---|
| Display | 3% | -44% | -0% | -39% | 0% | |
| Display P3 Coverage (%) | 69.3 | 71.2 3% | 38.1 -45% | 68.3 -1% | 40.7 -41% | 69.4 0% |
| sRGB Coverage (%) | 97.3 | 98.8 2% | 56.8 -42% | 98.1 1% | 61 -37% | 97.8 1% |
| AdobeRGB 1998 Coverage (%) | 70.7 | 73.3 4% | 39.3 -44% | 69.8 -1% | 42.1 -40% | 70.9 0% |
| Response Times | 2% | -159% | 10% | -79% | -5% | |
| Response Time Grey 50% / Grey 80% * (ms) | 15.6 ? | 14.5 ? 7% | 38.8 ? -149% | 14.6 ? 6% | 26.64 ? -71% | 17 ? -9% |
| Response Time Black / White * (ms) | 10 ? | 10.4 ? -4% | 26.8 ? -168% | 8.7 ? 13% | 18.65 ? -87% | 10.1 ? -1% |
| PWM Frequency (Hz) | ||||||
| Screen | 5% | -115% | 7% | -113% | 4% | |
| Brightness middle (cd/m²) | 301 | 405.7 35% | 261 -13% | 364 21% | 269 -11% | 308 2% |
| Brightness (cd/m²) | 294 | 368 25% | 258 -12% | 343 17% | 248 -16% | 293 0% |
| Brightness Distribution (%) | 94 | 87 -7% | 92 -2% | 86 -9% | 85 -10% | 90 -4% |
| Black Level * (cd/m²) | 0.21 | 0.38 -81% | 0.19 10% | 0.28 -33% | 0.5 -138% | 0.23 -10% |
| Contrast (:1) | 1433 | 1068 -25% | 1374 -4% | 1300 -9% | 538 -62% | 1339 -7% |
| Colorchecker dE 2000 * | 1.79 | 1.65 8% | 5.57 -211% | 1.67 7% | 4.54 -154% | 1.47 18% |
| Colorchecker dE 2000 max. * | 3.48 | 4.2 -21% | 20.6 -492% | 2.78 20% | 17.28 -397% | 2.98 14% |
| Colorchecker dE 2000 calibrated * | 1.2 | 0.53 56% | 4.63 -286% | 1.14 5% | 3.34 -178% | 1.02 15% |
| Greyscale dE 2000 * | 2.5 | 1.2 52% | 3.19 -28% | 1.4 44% | 3.8 -52% | 2.2 12% |
| Gamma | 2.265 97% | 2.3 96% | 2.45 90% | 2.091 105% | 2.17 101% | 2.228 99% |
| CCT | 6157 106% | 6453 101% | 6146 106% | 6568 99% | 7408 88% | 6228 104% |
| Total Average (Program / Settings) | 3% /
4% | -106% /
-106% | 6% /
6% | -77% /
-92% | -0% /
2% |
* ... smaller is better
Ex works, the screen features good color depiction: A deviation of around 1.8 is acceptable (DeltaE < 3). Calibration lowers this rate to 1.2 and leads to more balanced gray tones. The panel can depict the entire sRGB color space, but not the AdobeRGB and DCI P3 spaces. This is similar to most of its competitors' displays.
Display Response Times
| ↔ Response Time Black to White | ||
|---|---|---|
| 10 ms ... rise ↗ and fall ↘ combined | ↗ 5.7 ms rise | 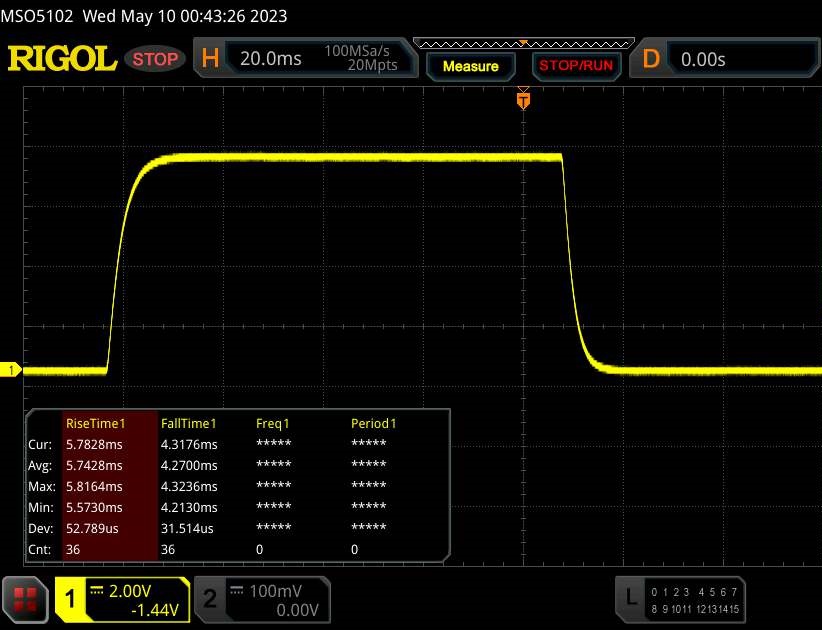 |
| ↘ 4.3 ms fall | ||
| The screen shows good response rates in our tests, but may be too slow for competitive gamers. In comparison, all tested devices range from 0.1 (minimum) to 240 (maximum) ms. » 26 % of all devices are better. This means that the measured response time is better than the average of all tested devices (20.2 ms). | ||
| ↔ Response Time 50% Grey to 80% Grey | ||
| 15.6 ms ... rise ↗ and fall ↘ combined | ↗ 7.3 ms rise | 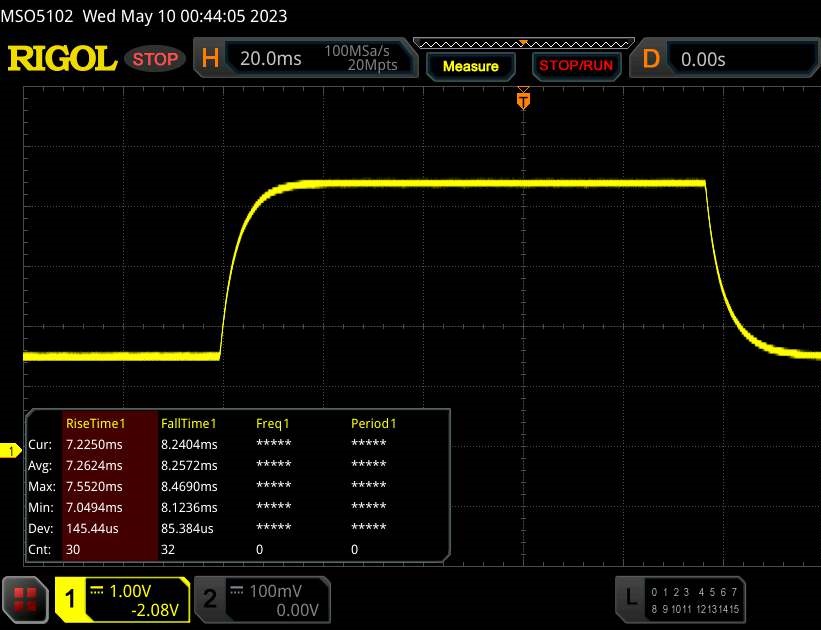 |
| ↘ 8.3 ms fall | ||
| The screen shows good response rates in our tests, but may be too slow for competitive gamers. In comparison, all tested devices range from 0.165 (minimum) to 636 (maximum) ms. » 29 % of all devices are better. This means that the measured response time is better than the average of all tested devices (31.6 ms). | ||
Screen Flickering / PWM (Pulse-Width Modulation)
| Screen flickering / PWM not detected |  | ||
In comparison: 53 % of all tested devices do not use PWM to dim the display. If PWM was detected, an average of 8108 (minimum: 5 - maximum: 343500) Hz was measured. | |||
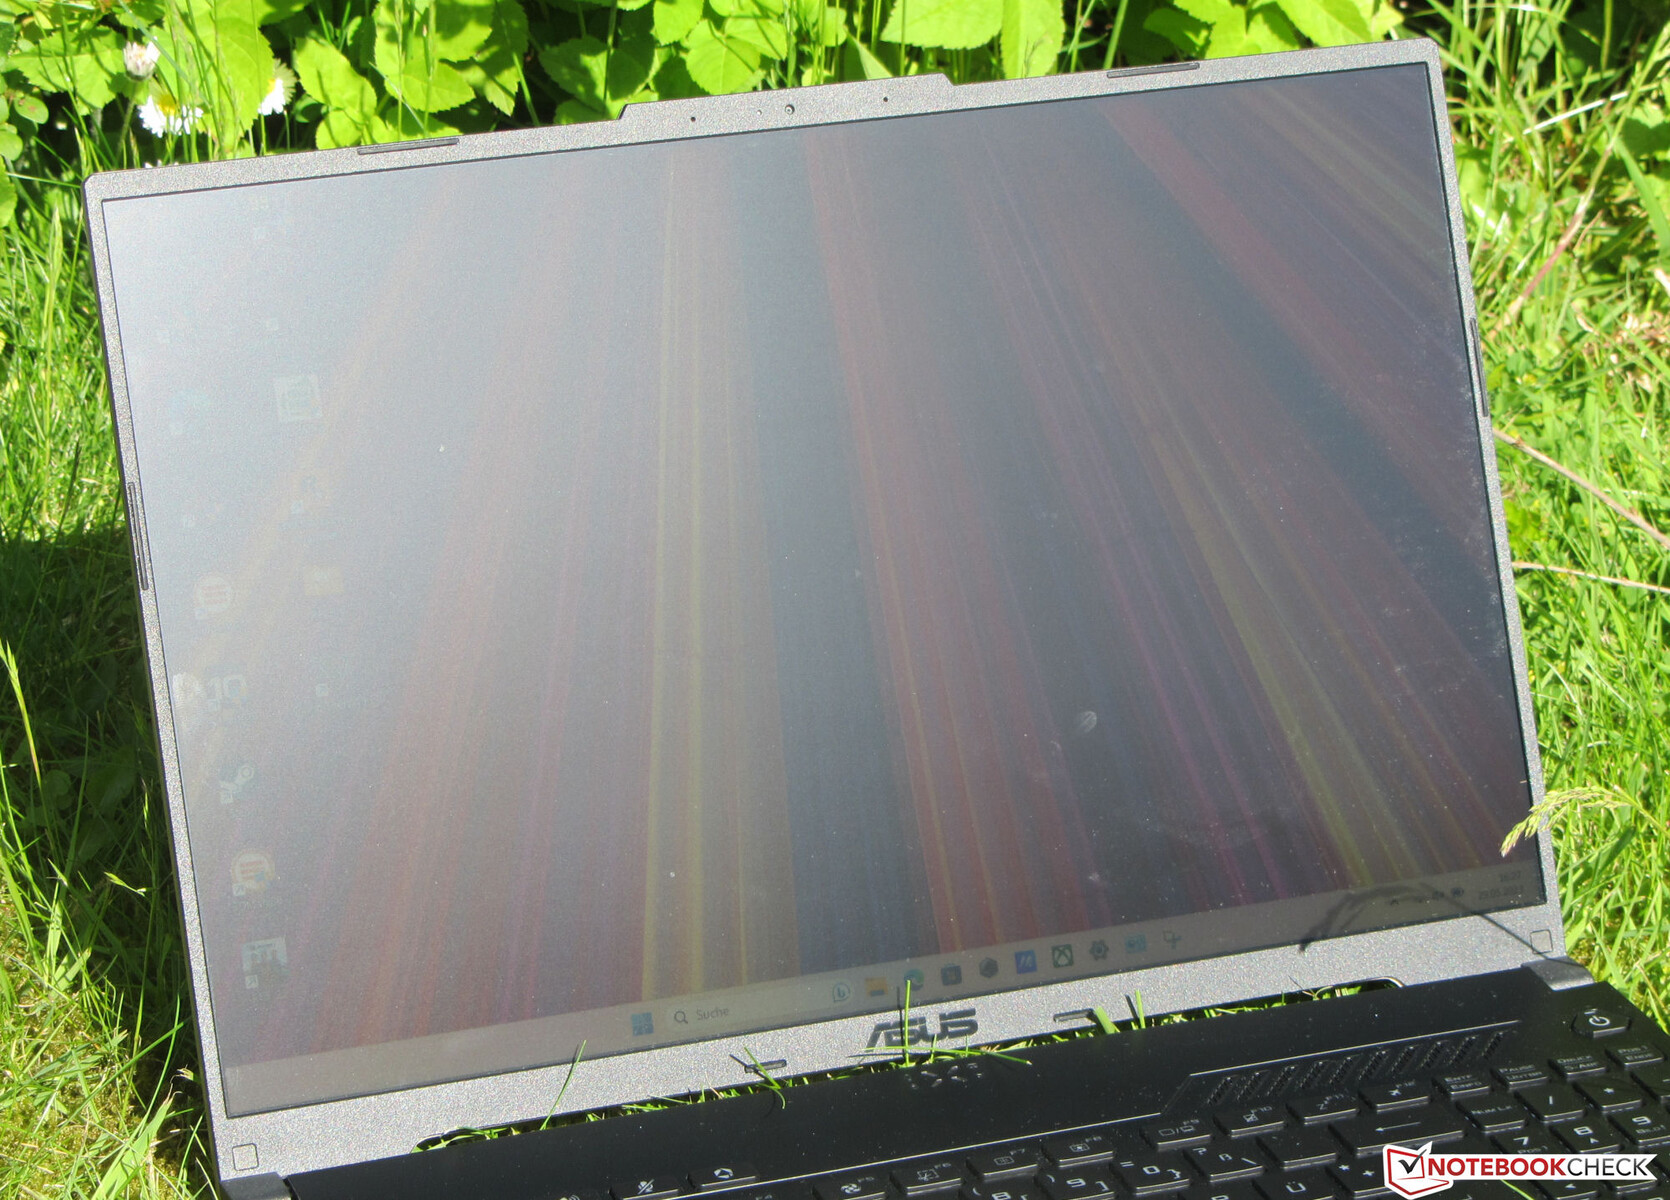
The laptop's viewing-angle stable IPS panel remains legible from every angle. It is possible to view the panel outside - as long as the sun isn't shining too brightly.

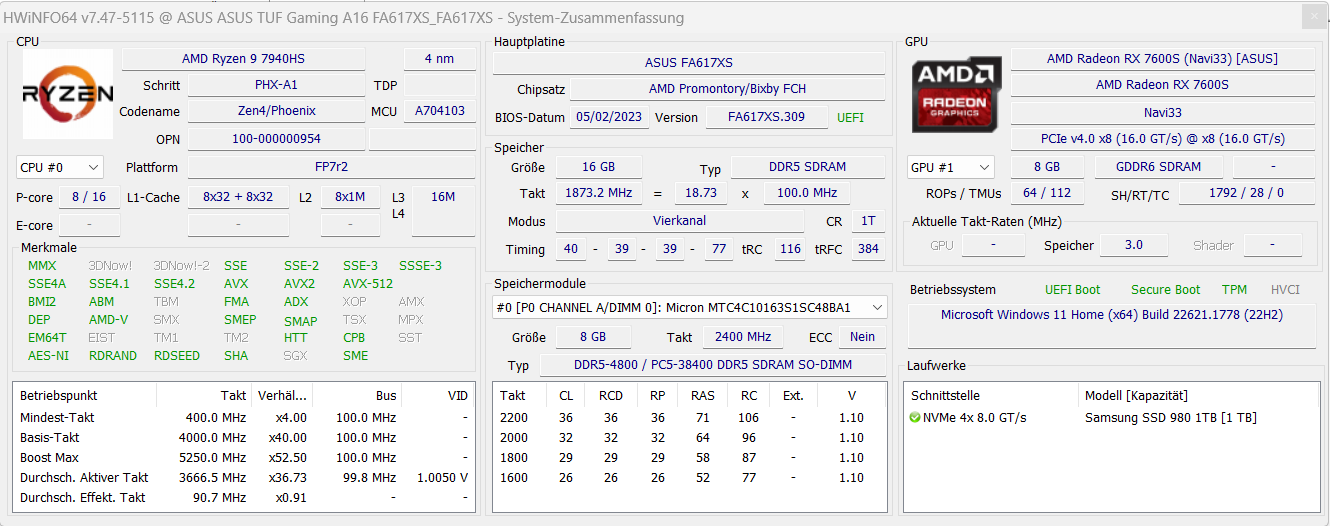
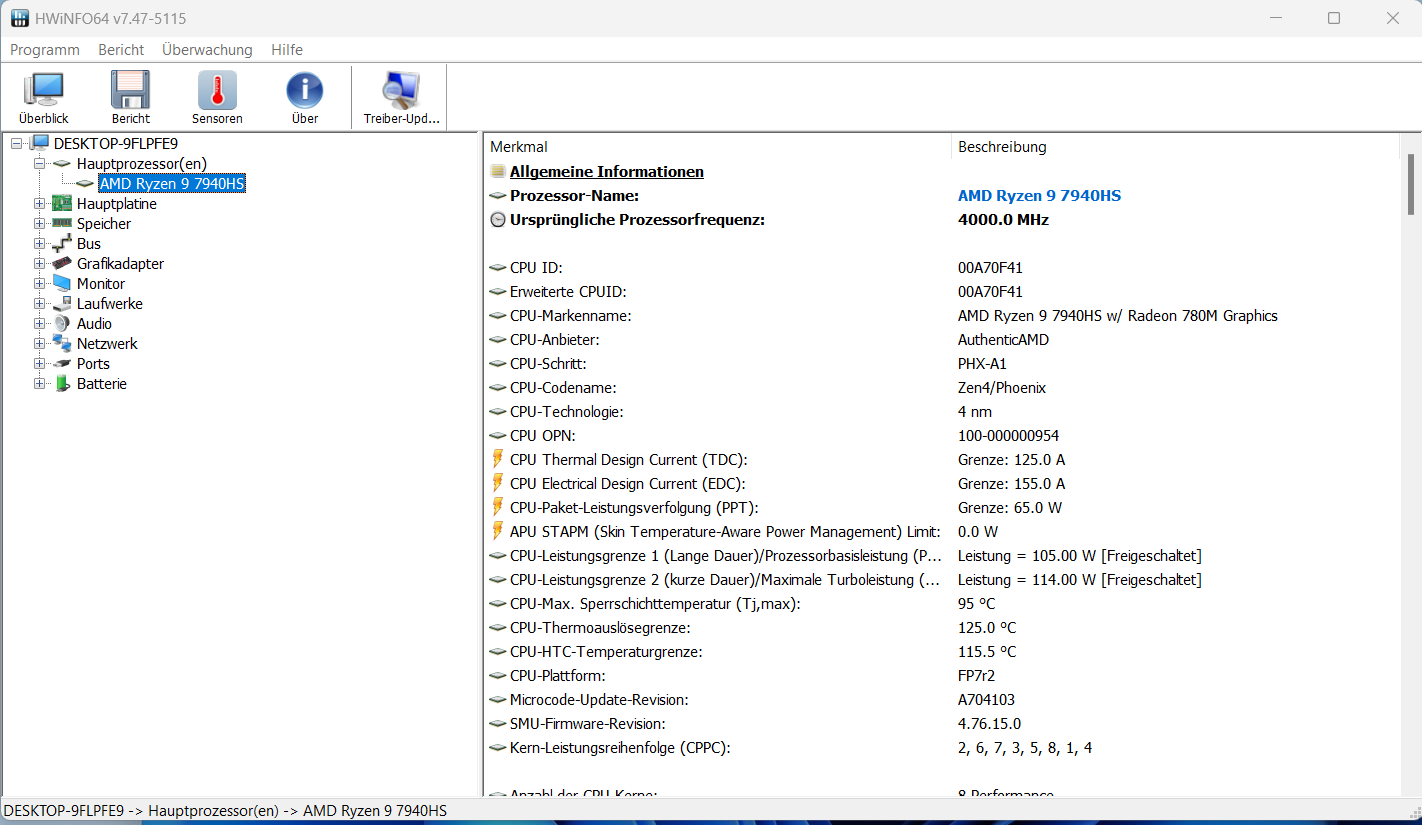
Performance - Asus make use of AMD power
The Asus TUF Gaming A16 Advantage Edition FA617XS is a mid-range gaming laptop. AMD hardware delivers the necessary computing power. The present model can be purchased for around $1,700.
Testing conditions
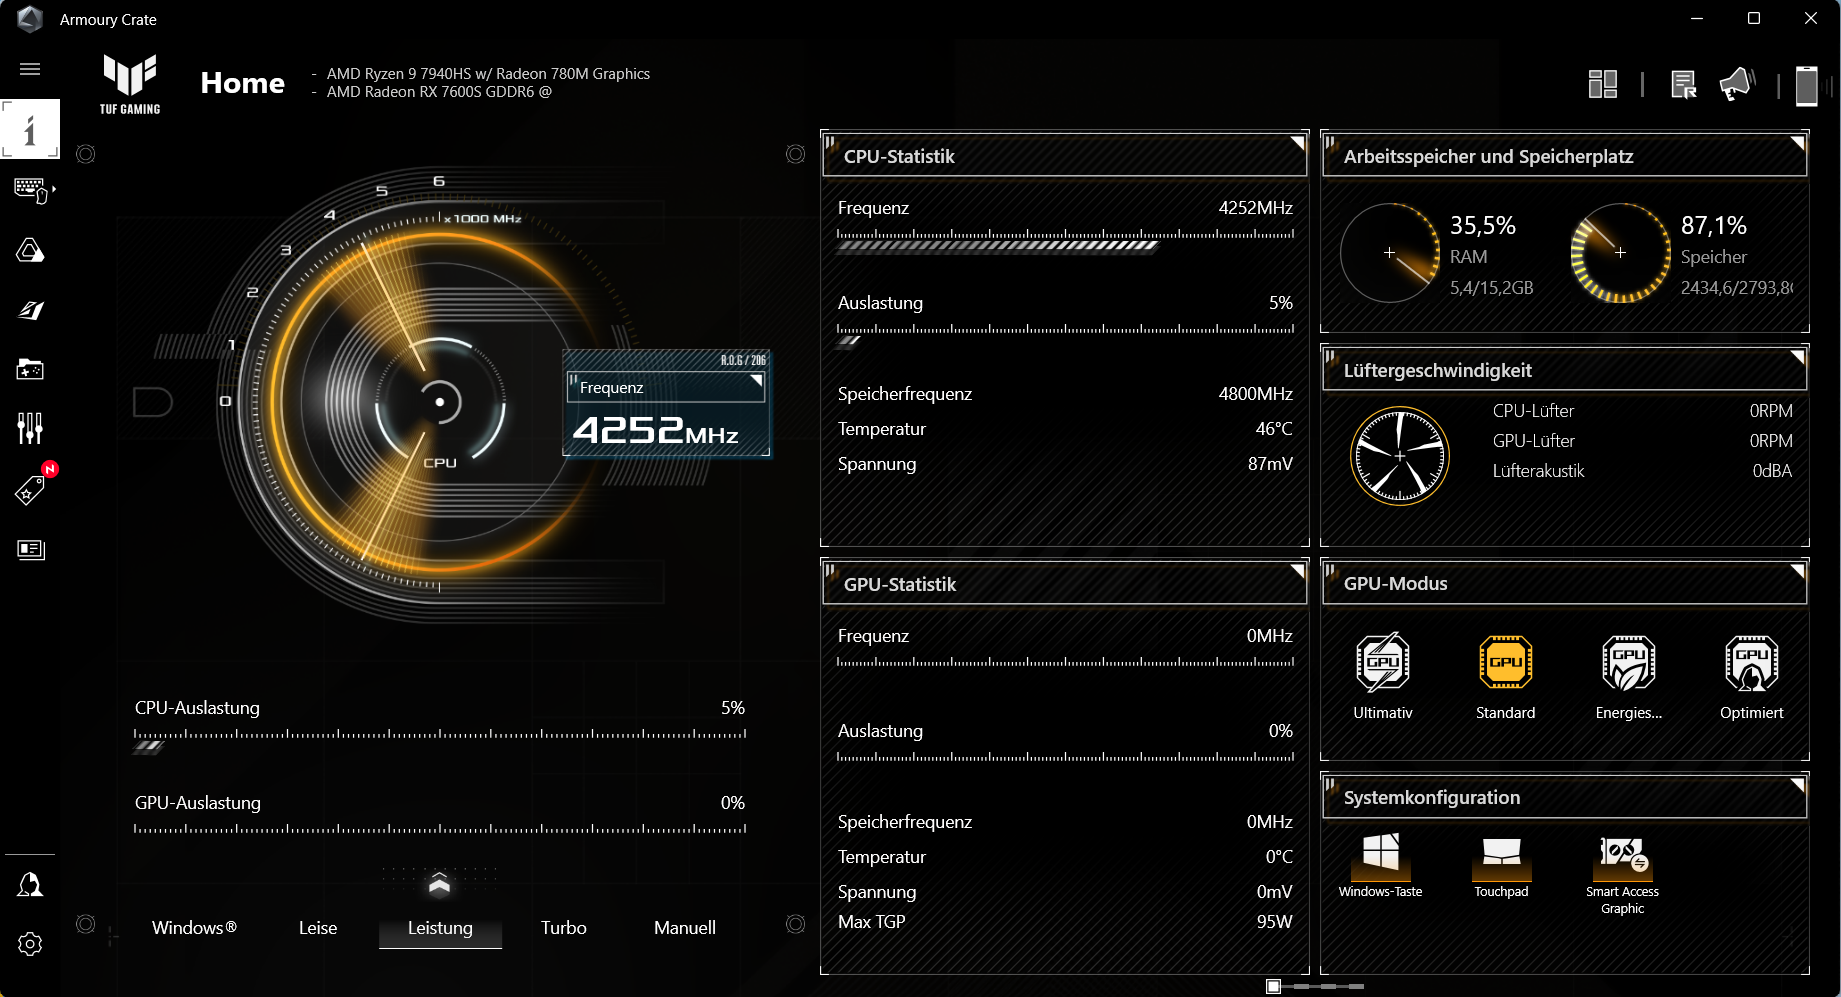
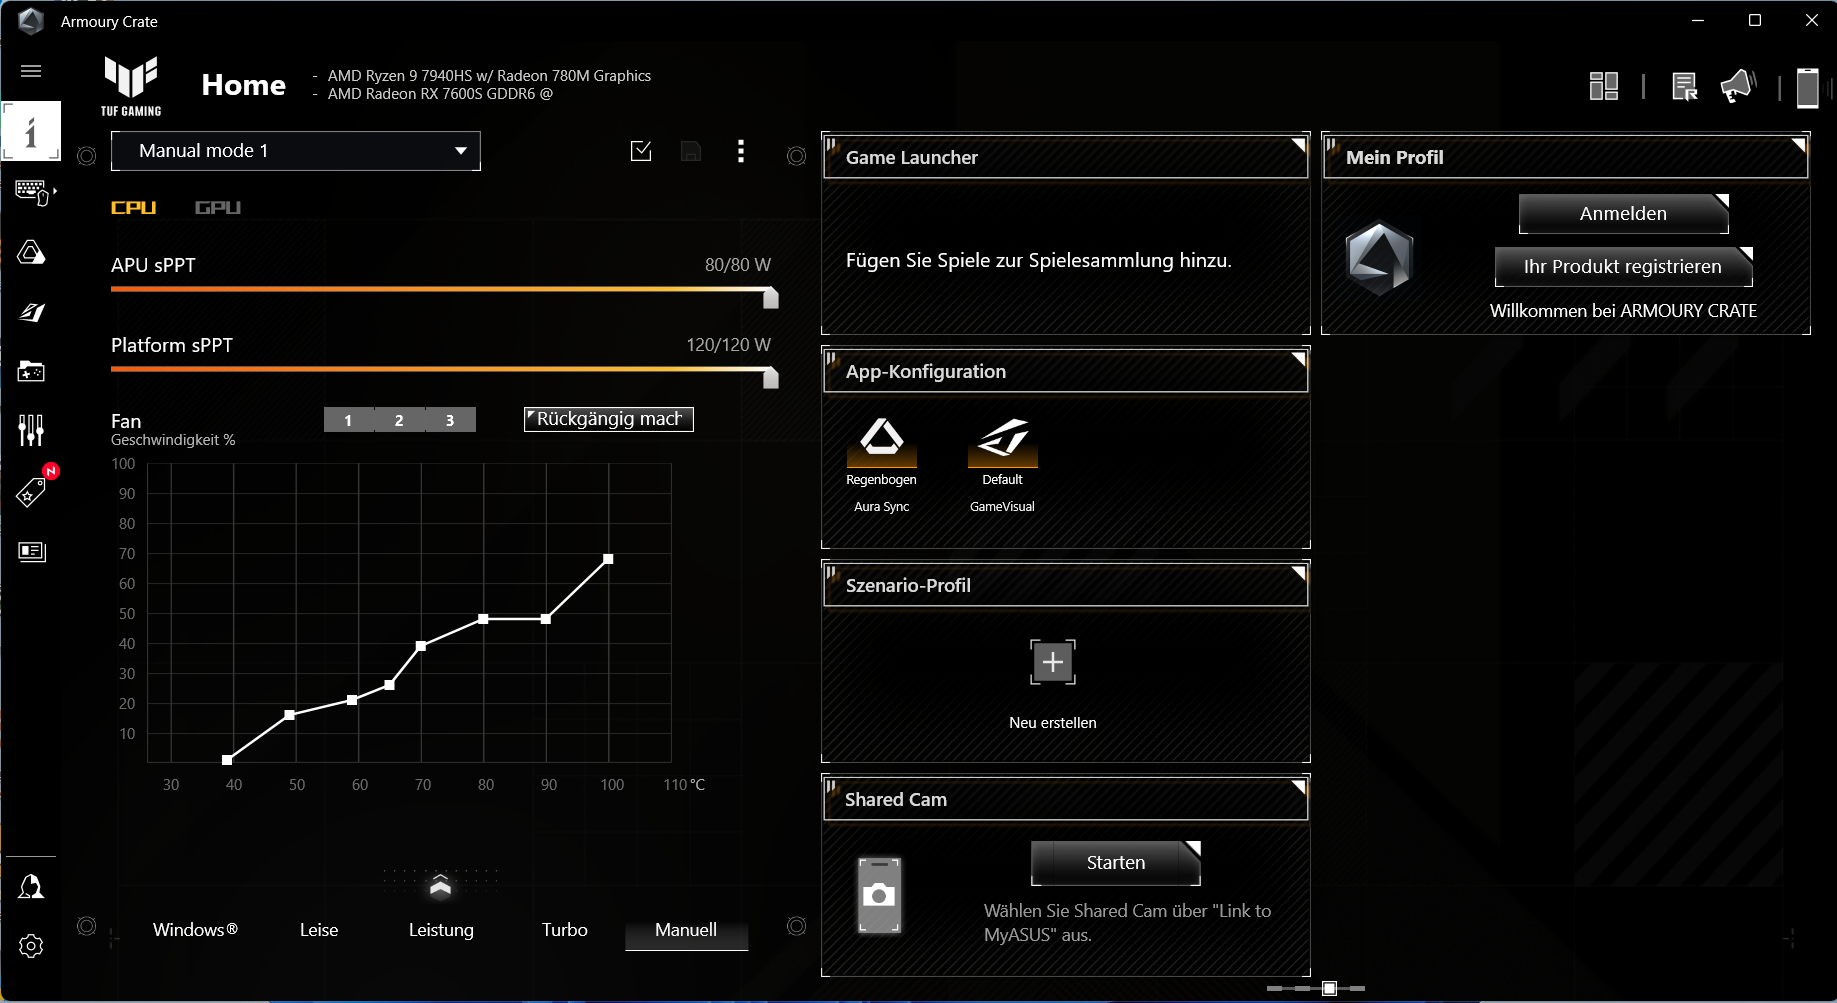
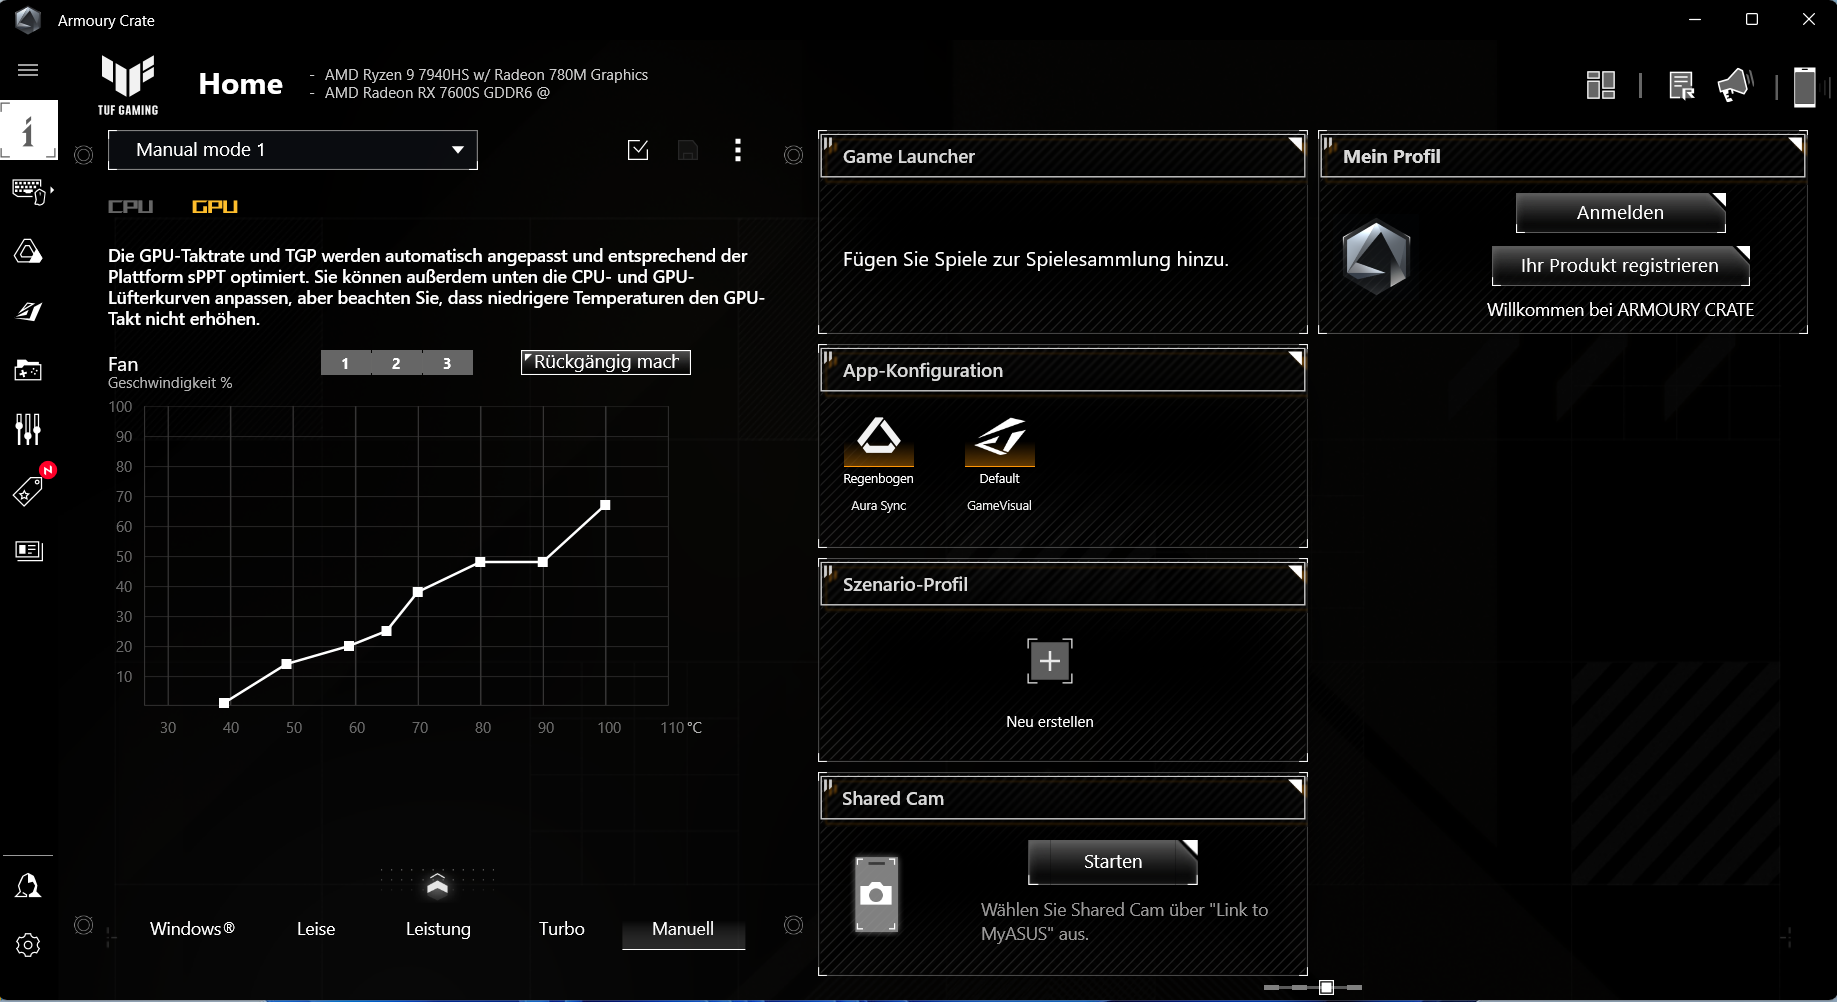
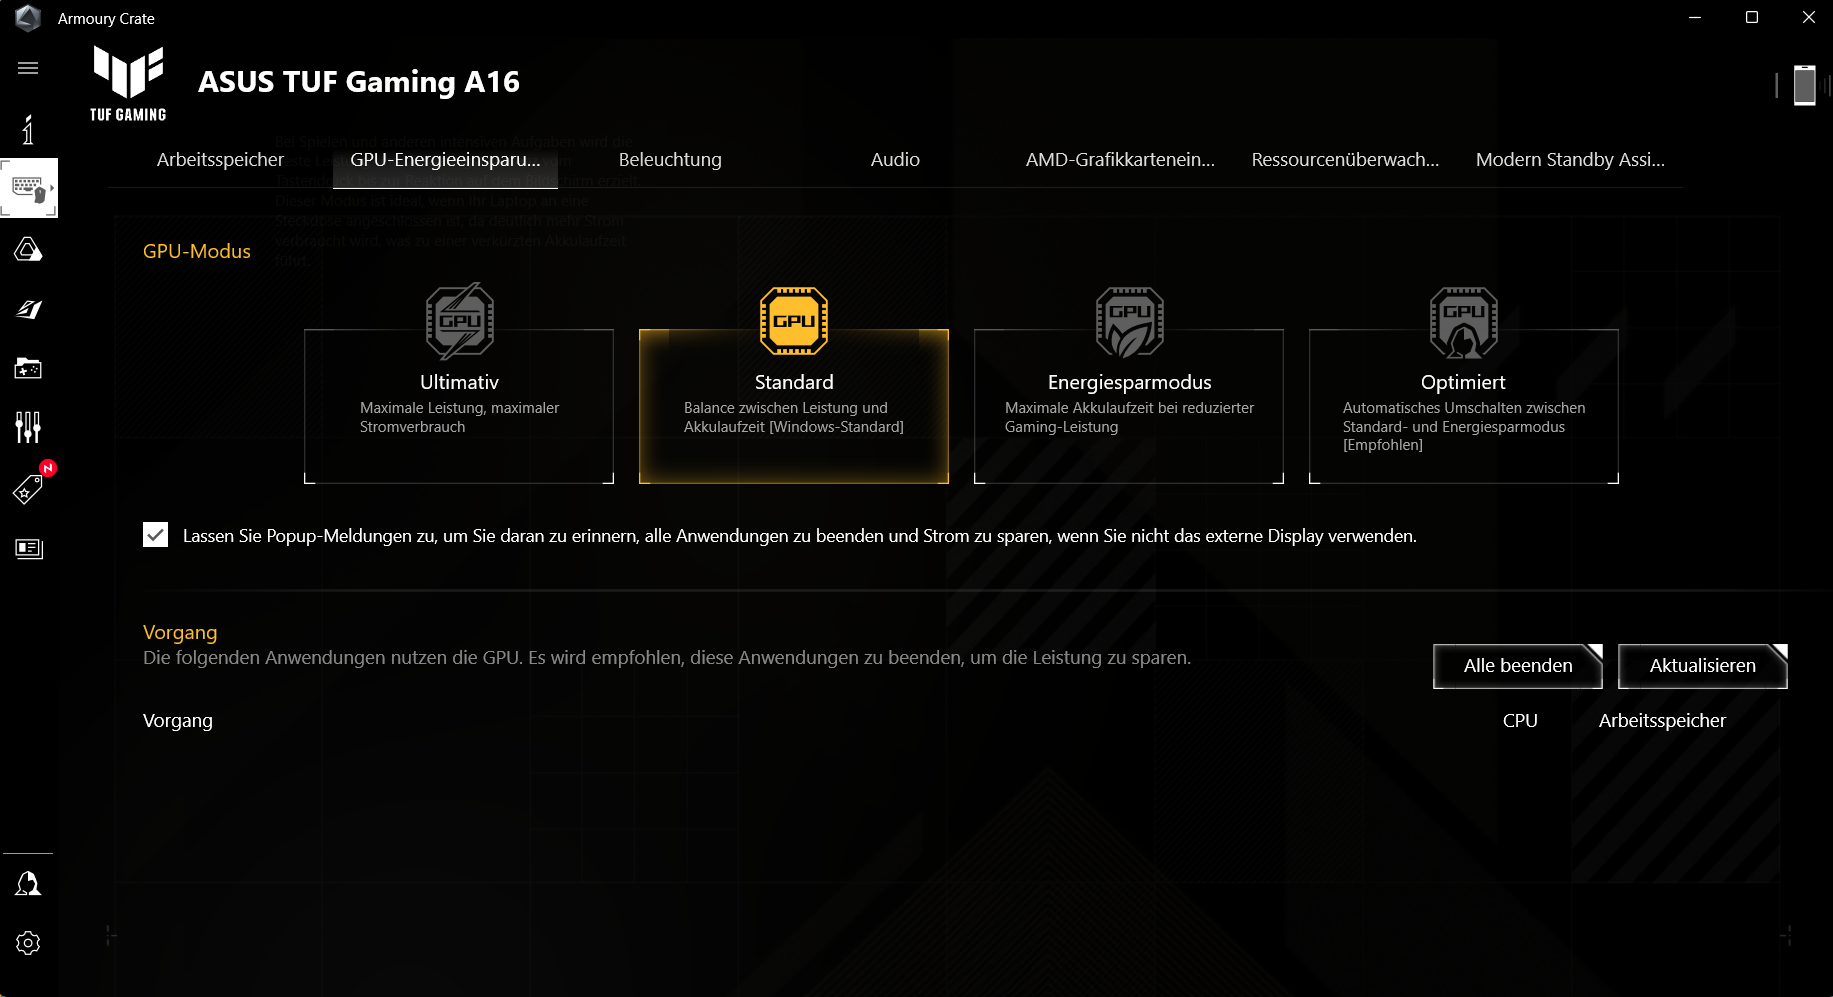
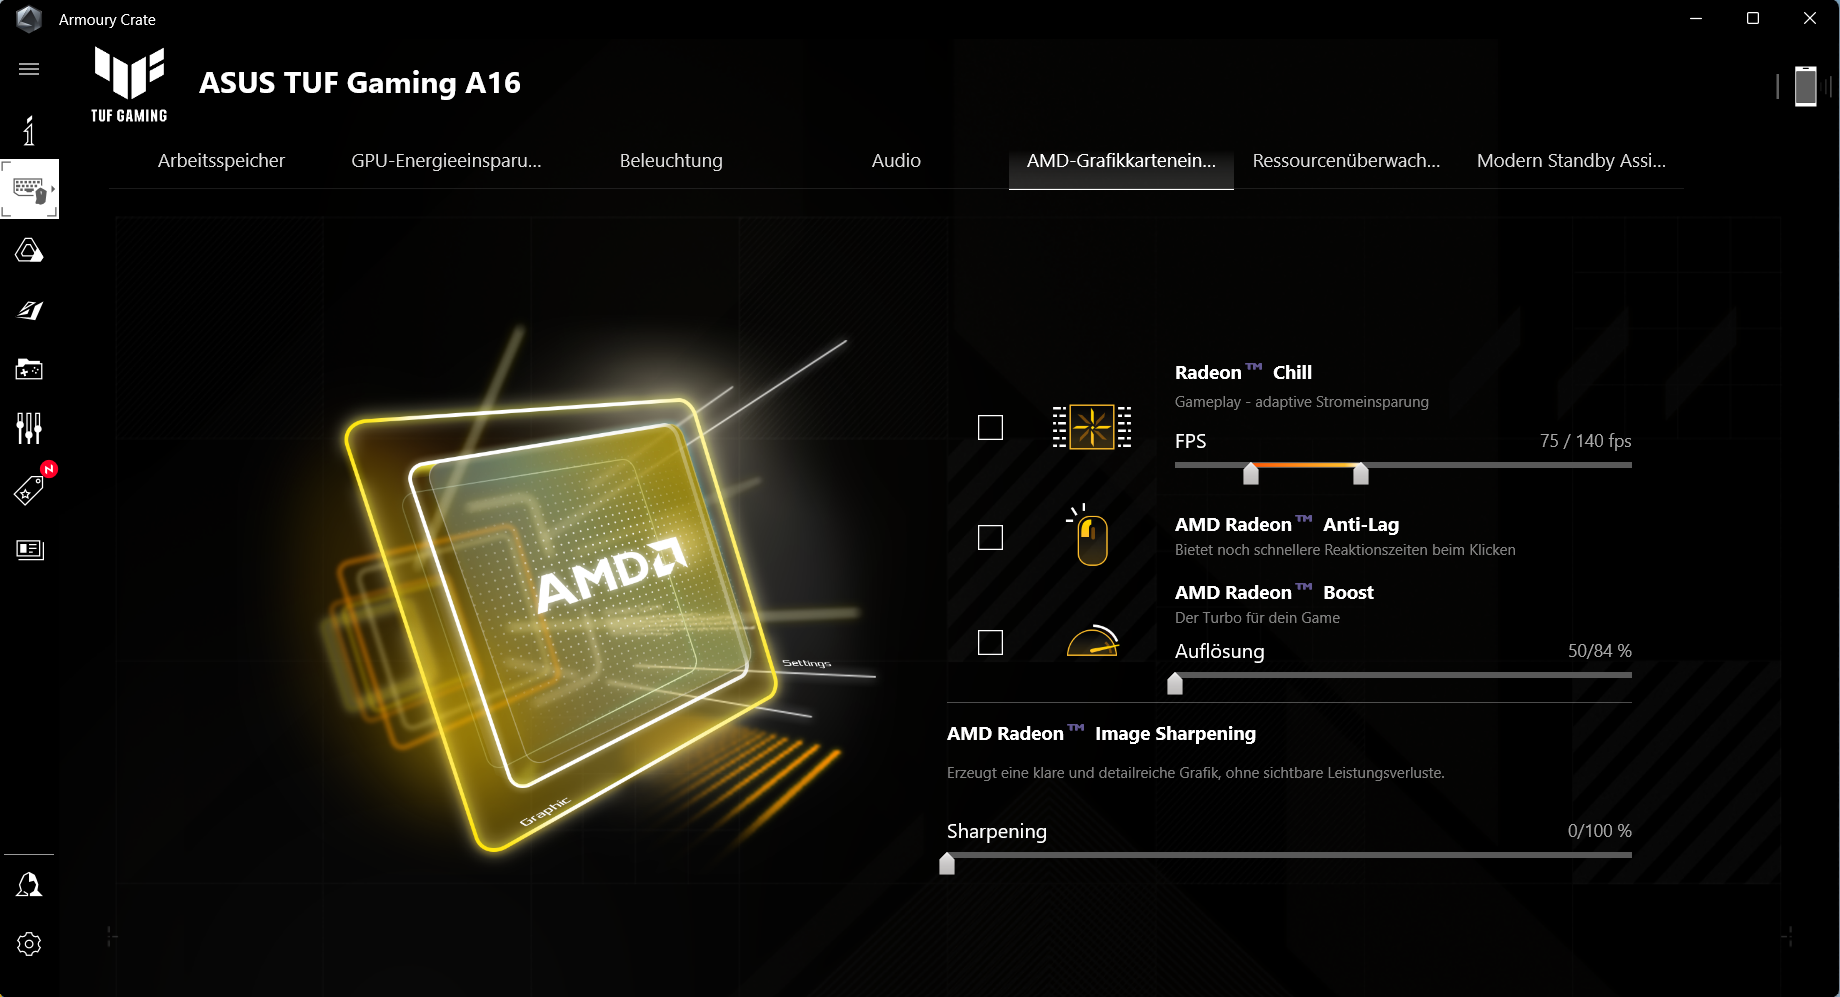
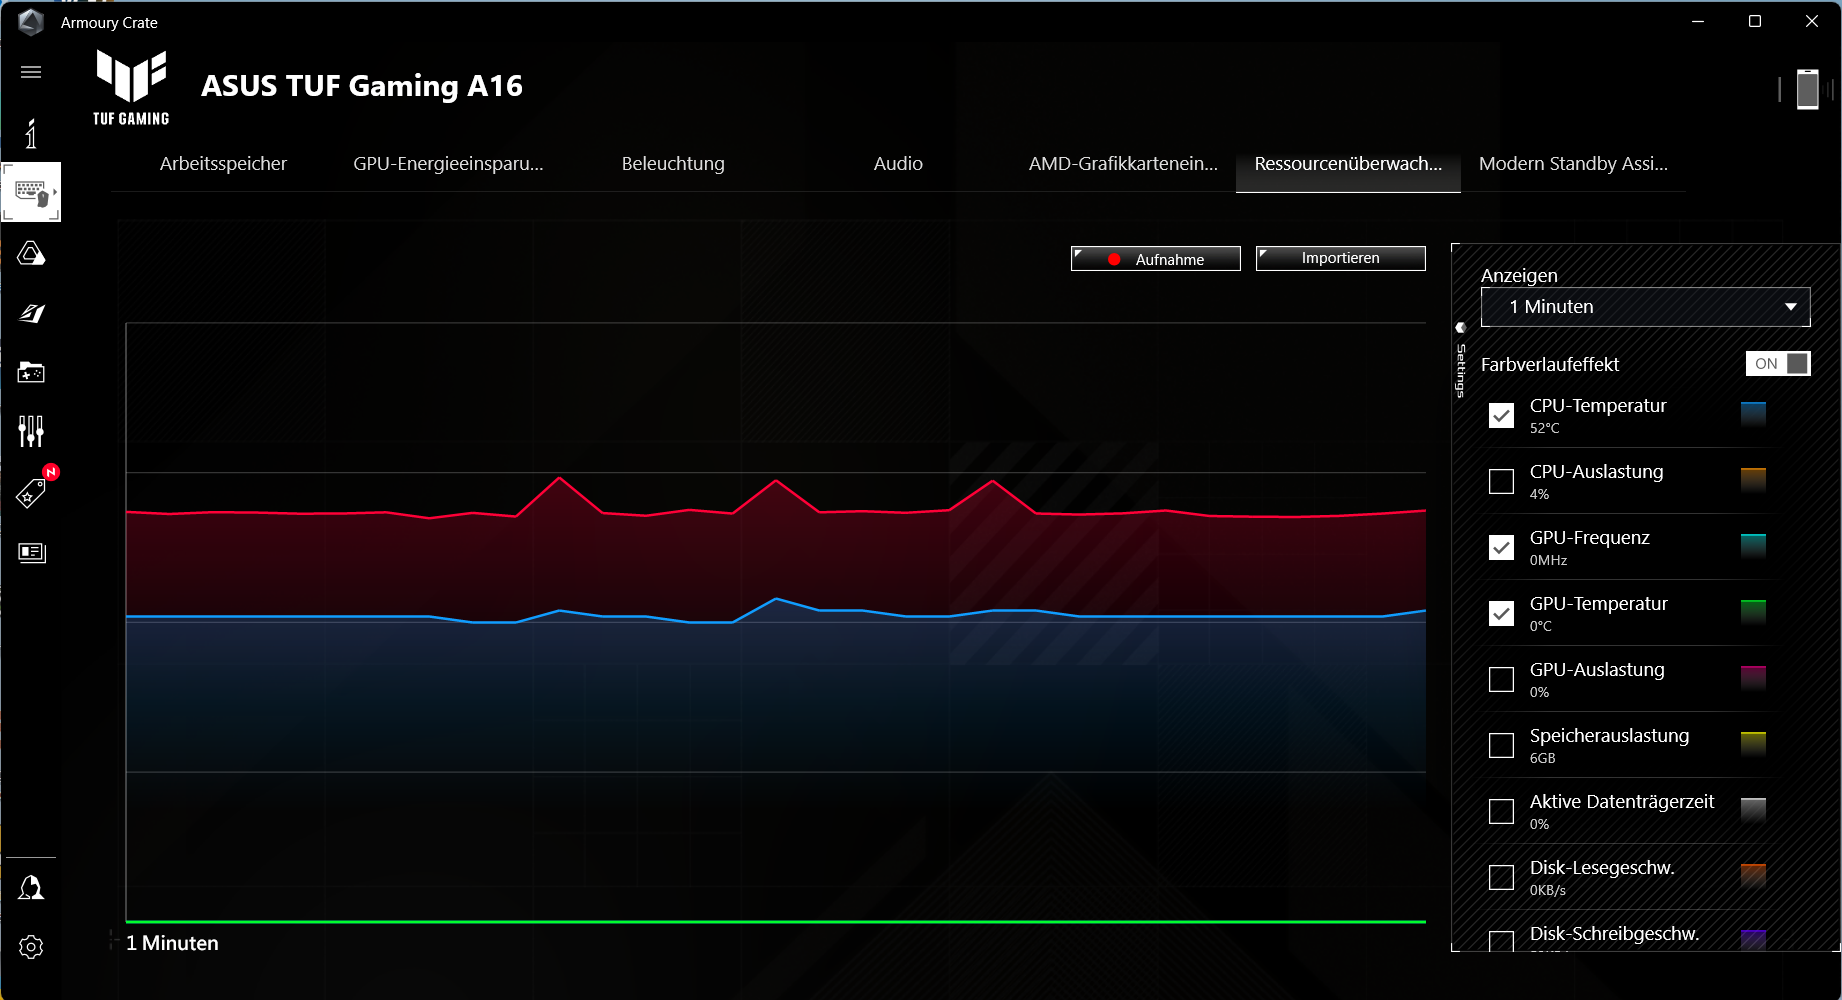
You can switch between the three manufacturer-specific performance profiles (see table) via the key combination "Fn" + "F5". The profiles "Performance" (benchmarks) and "Quiet" (battery tests) were used. The GPU mode was set to "Standard" (= switching graphics). The notebook's control center ("Armoury Crate") allows you to create individual profiles ("Manual"), which includes setting the PPT and fan curves.
| Turbo | Performance | Quiet | |
|---|---|---|---|
| Power Limit 1 (HWInfo) | 120 watts | 105 watts | 75 watts |
| Power Limit 2 (HWInfo) | 144 watts | 114 watts | 90 watts |
| Noise (Wichter 3) | 53 dB(A) | 51 dB(A) | 46 dB(A) |
| Performance (Witcher 3) | ~100 fps | ~100 fps | ~94 fps |
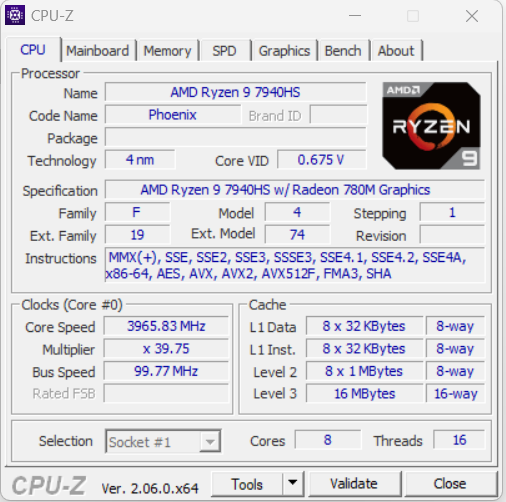
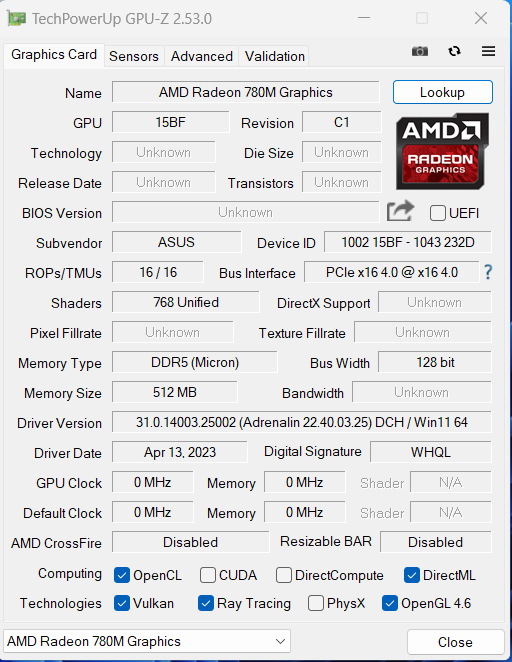
Processor
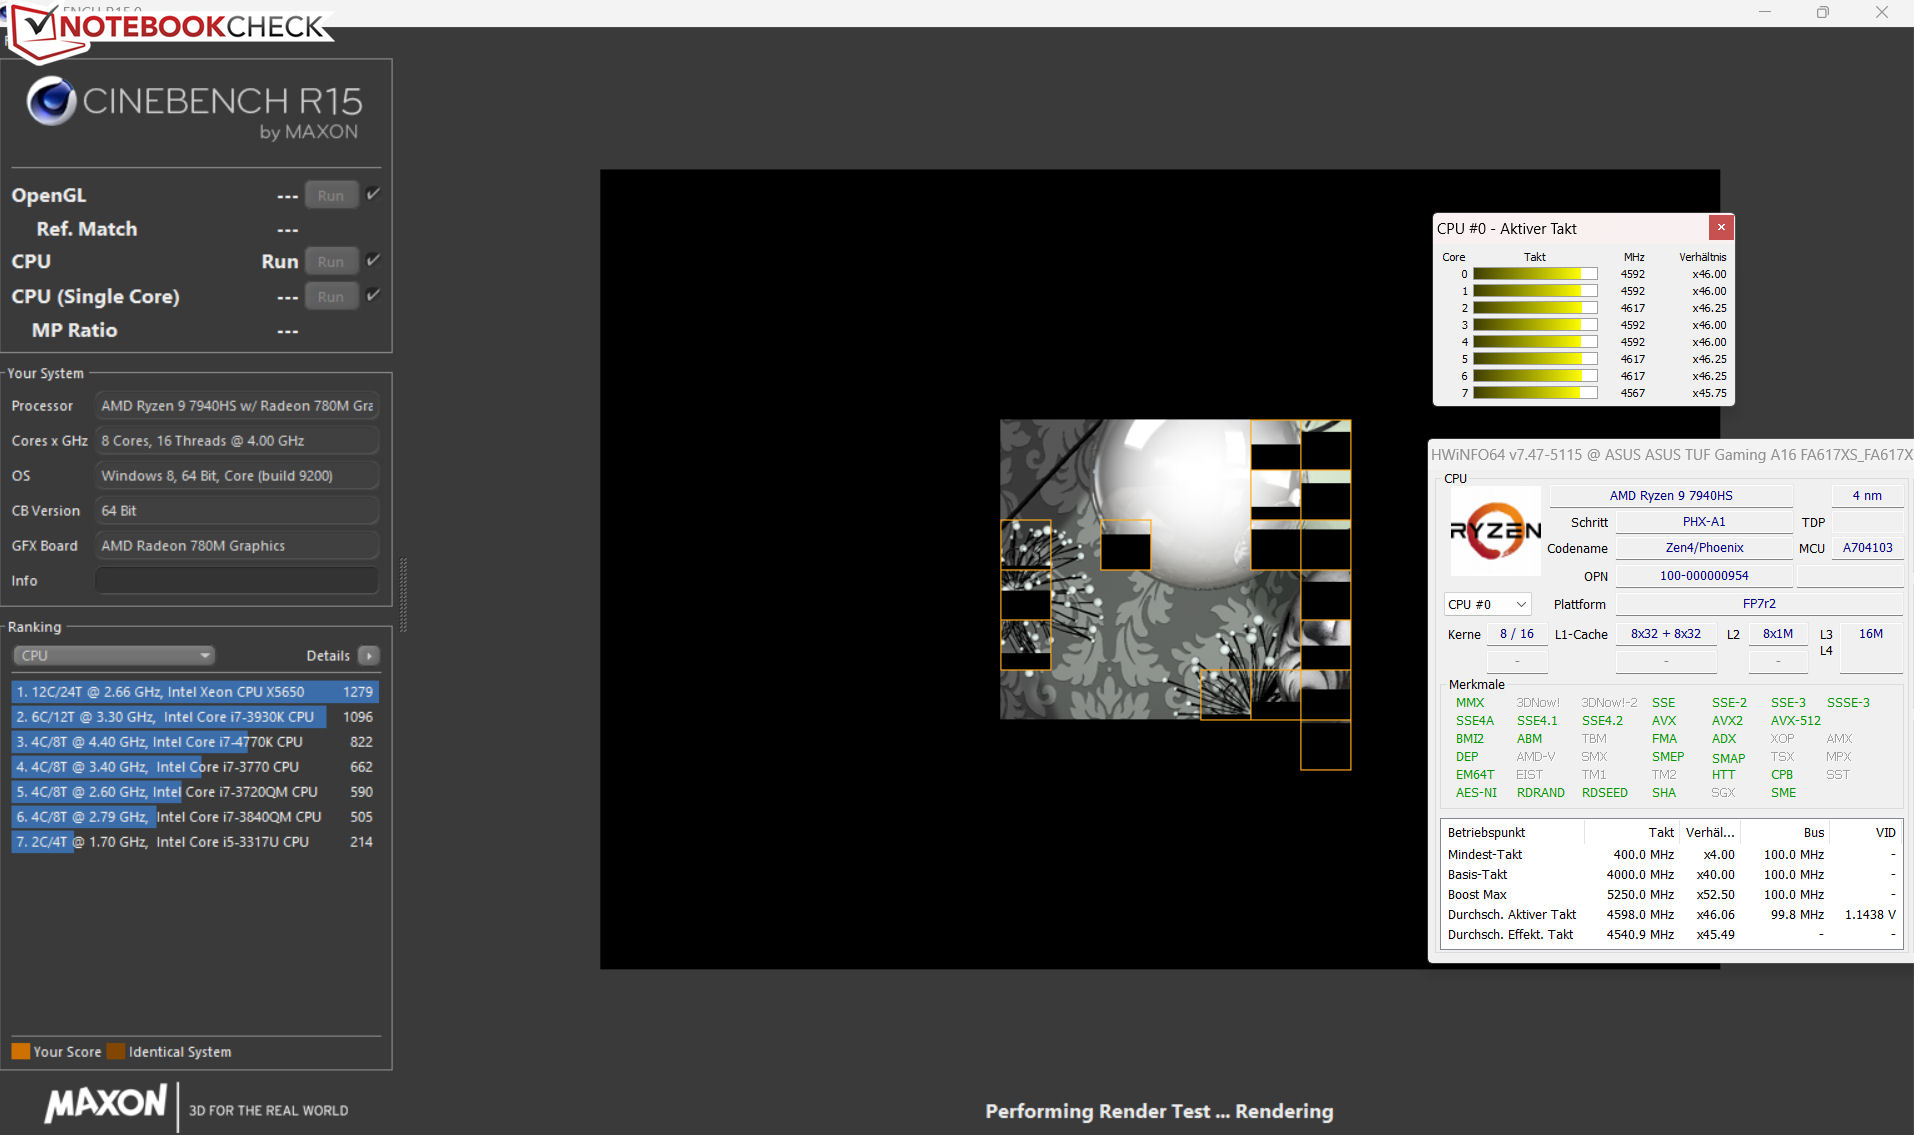
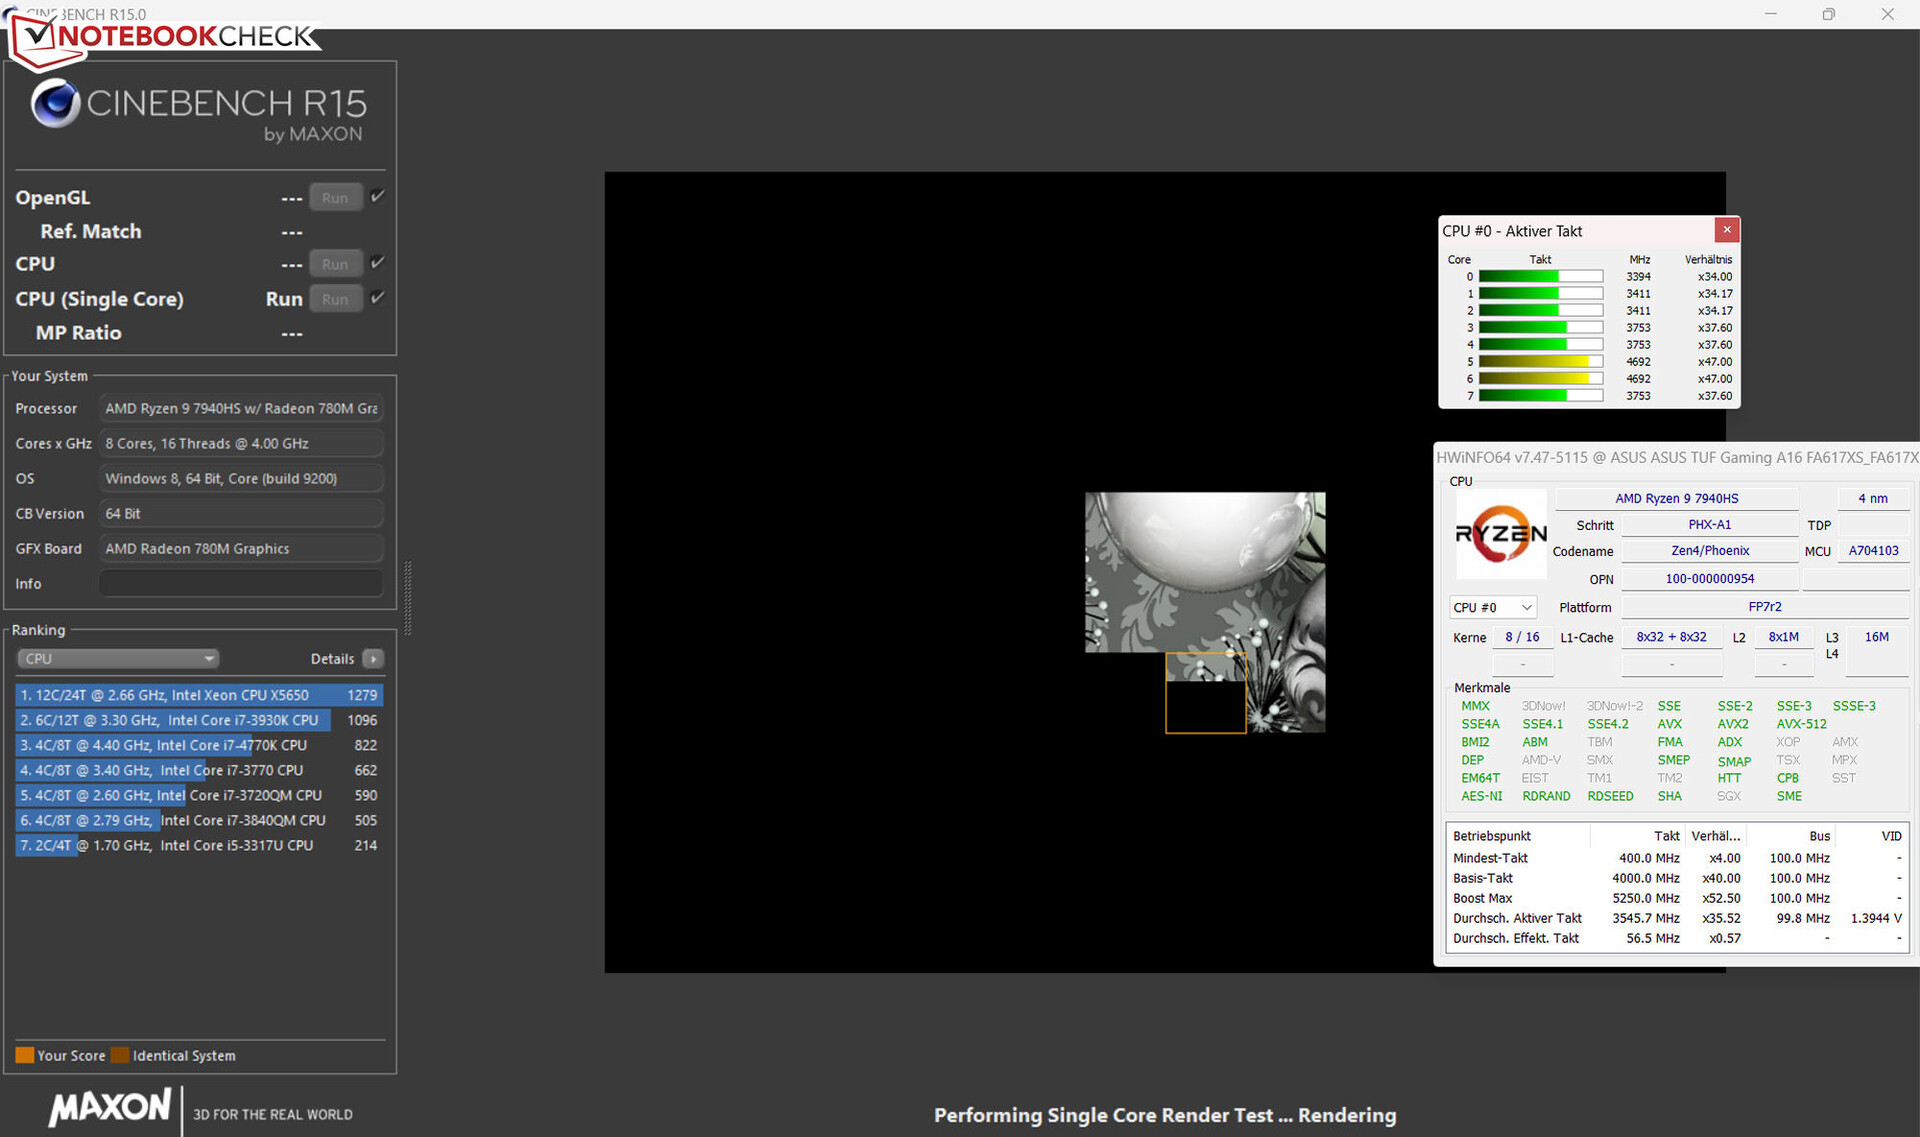
The CPU part of the Ryzen-9-7940HS-APU (Phoenix, Zen 4) features eight processing cores with 16 threads. A base clock rate of 4 GHz can be raised to up to 5.25 GHz (one core). Our measured benchmark results are about the same as the previously tested 7940HS laptops. Using the profile "Turbo" leads to a little better performance (4-5 per cent).
The sister model's Ryzen-7-7735HS-APU (Rembrandt R, Zen 3+) is clearly beaten by the Ryzen 9, even with the same number of cores and the same power limits. Thanks to its better architecture and higher clock rates, its per-watt performance is greater.
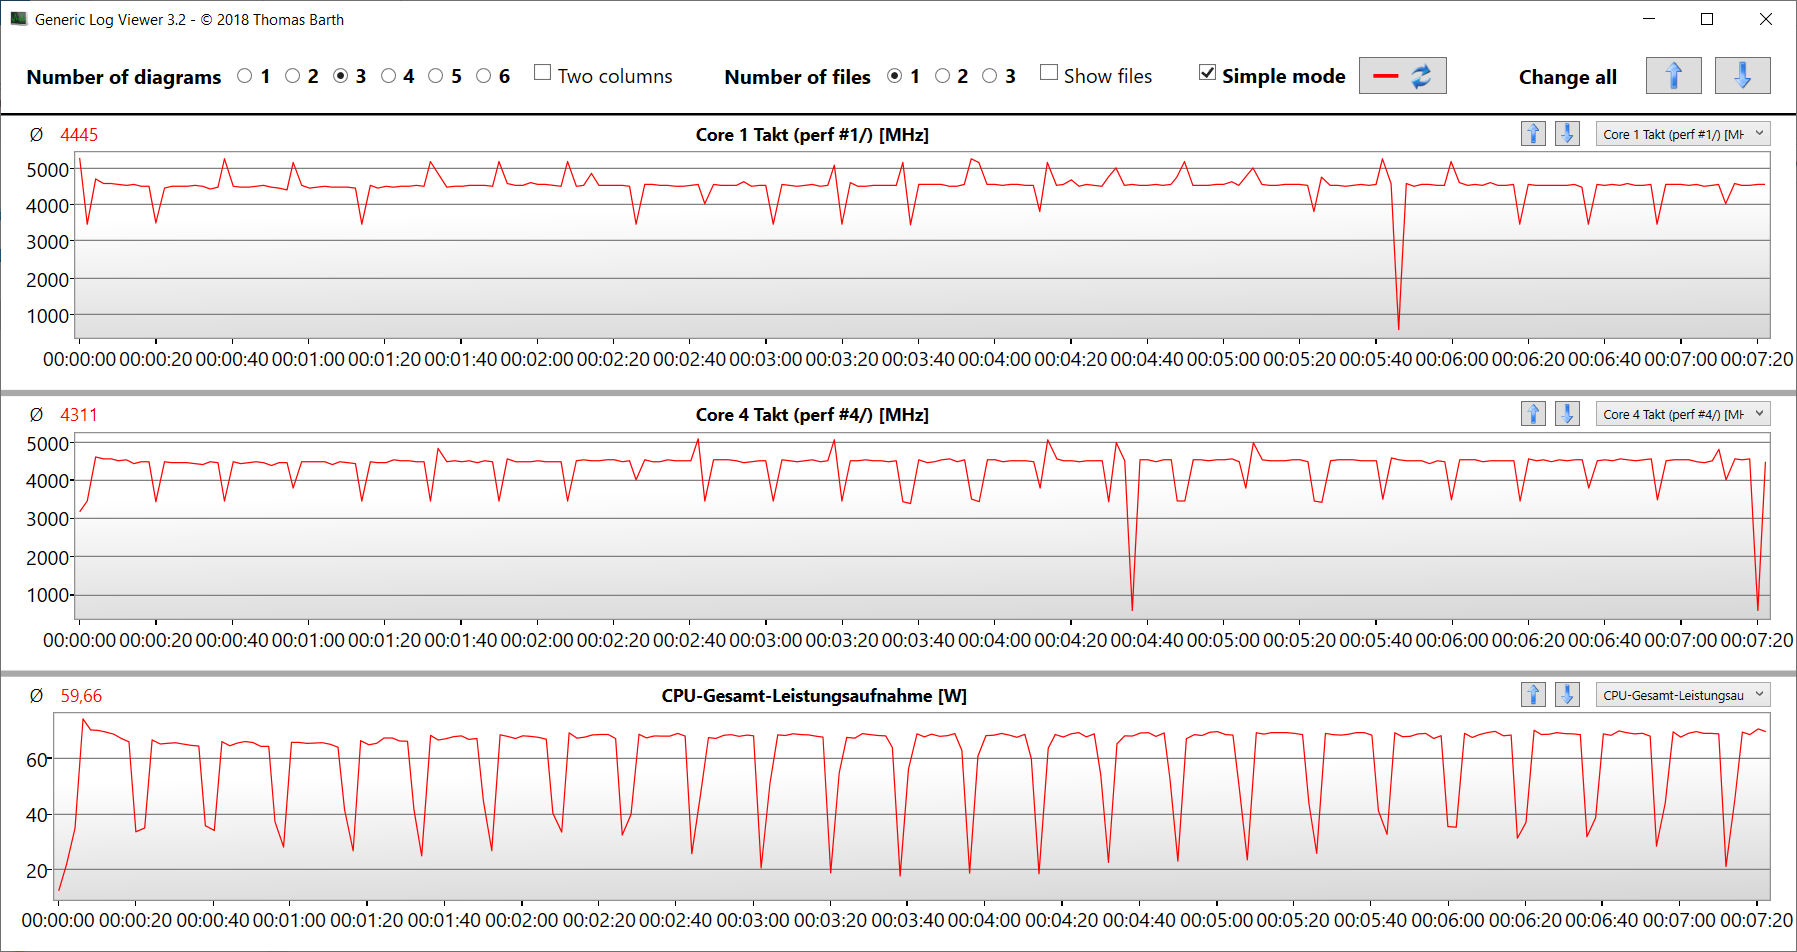
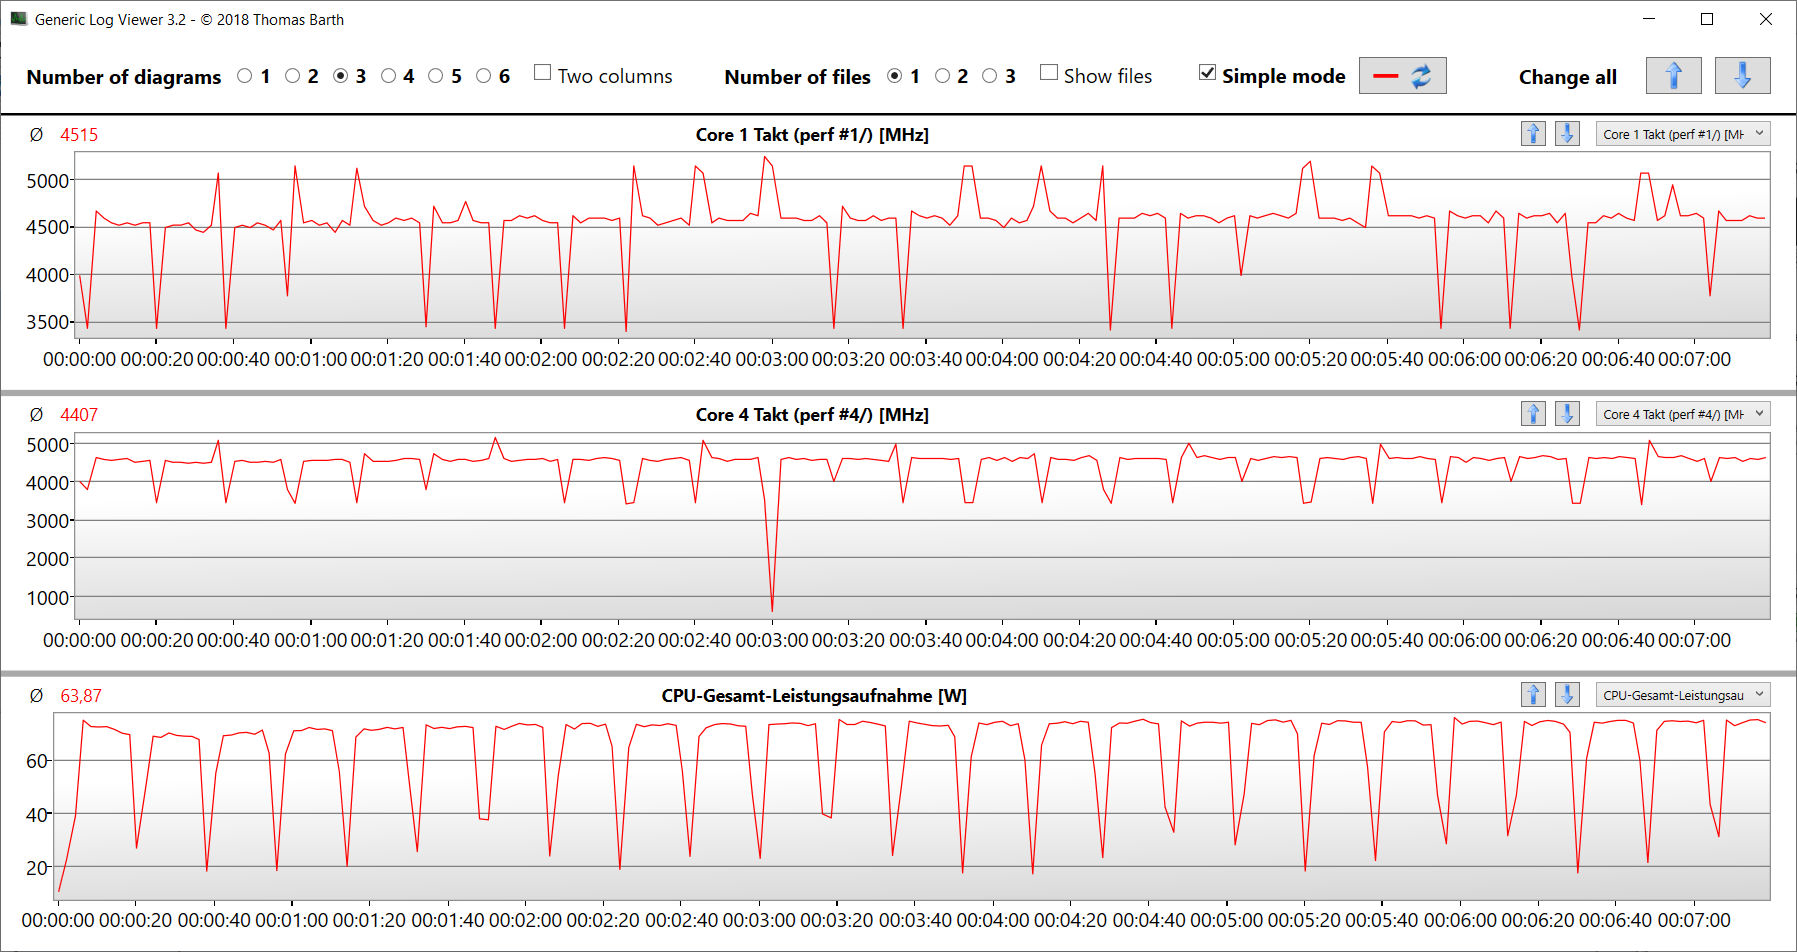
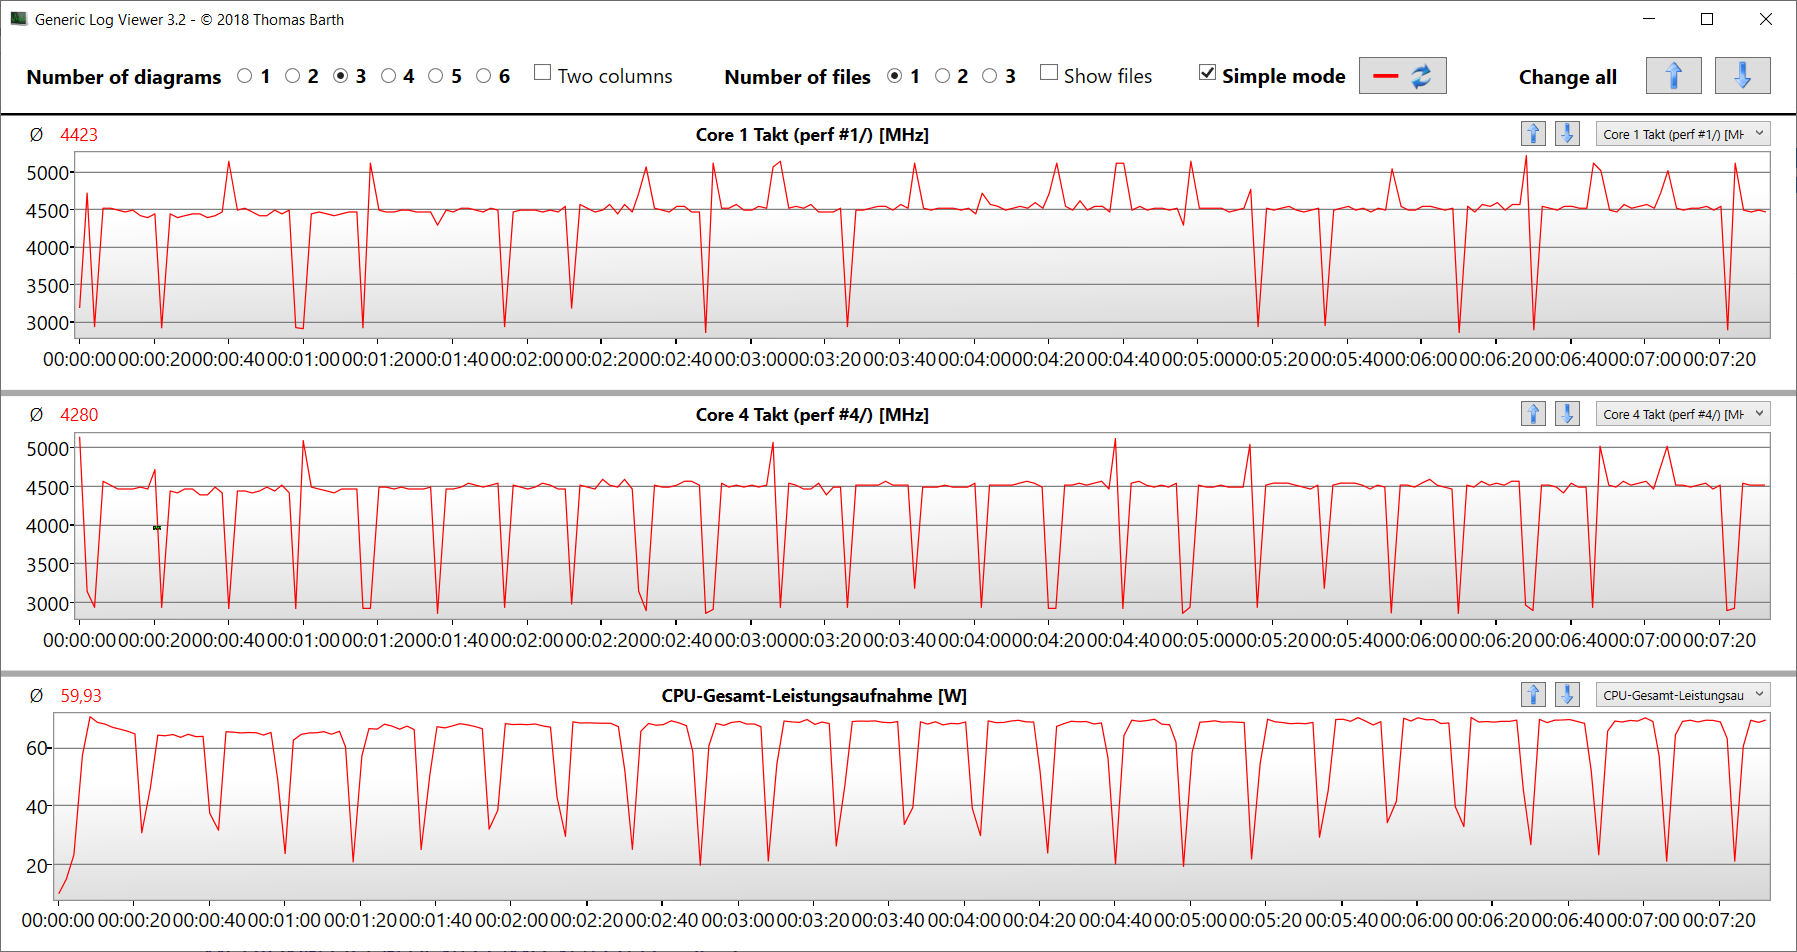
The CB15 loop test shows: Continuous multi-thread load leads the CPU to work with consistently high turbo clock rates - regardless of the chosen performance profile.
Please note: Detailed information about the installed APU and its architecture can be read in our Zen4 analysis article.
Cinebench R15 multi continuous test
* ... smaller is better
AIDA64: FP32 Ray-Trace | FPU Julia | CPU SHA3 | CPU Queen | FPU SinJulia | FPU Mandel | CPU AES | CPU ZLib | FP64 Ray-Trace | CPU PhotoWorxx
| Performance rating | |
| Average of class Gaming | |
| Average AMD Ryzen 9 7940HS | |
| Asus TUF Gaming A16 FA617XS | |
| Lenovo Legion Pro 5 16IRX8 | |
| Asus TUF Gaming A16 FA617 | |
| Medion Erazer Defender P40 | |
| MSI Katana 15 B12VEK | |
| Gigabyte G5 KE | |
| AIDA64 / FP32 Ray-Trace | |
| Average of class Gaming (7192 - 85542, n=141, last 2 years) | |
| Asus TUF Gaming A16 FA617XS (v6.75.6100) | |
| Average AMD Ryzen 9 7940HS (25226 - 29109, n=9) | |
| Lenovo Legion Pro 5 16IRX8 (v6.85.6300) | |
| Asus TUF Gaming A16 FA617 (v6.85.6300) | |
| MSI Katana 15 B12VEK (v6.85.6300) | |
| Medion Erazer Defender P40 (v6.75.6100) | |
| Gigabyte G5 KE (v6.75.6100) | |
| AIDA64 / FPU Julia | |
| Average of class Gaming (35040 - 238426, n=141, last 2 years) | |
| Asus TUF Gaming A16 FA617XS (v6.75.6100) | |
| Average AMD Ryzen 9 7940HS (106512 - 123214, n=9) | |
| Lenovo Legion Pro 5 16IRX8 (v6.85.6300) | |
| Asus TUF Gaming A16 FA617 (v6.85.6300) | |
| Medion Erazer Defender P40 (v6.75.6100) | |
| MSI Katana 15 B12VEK (v6.85.6300) | |
| Gigabyte G5 KE (v6.75.6100) | |
| AIDA64 / CPU SHA3 | |
| Average of class Gaming (1728 - 9817, n=141, last 2 years) | |
| Average AMD Ryzen 9 7940HS (4566 - 5119, n=9) | |
| Lenovo Legion Pro 5 16IRX8 (v6.85.6300) | |
| Asus TUF Gaming A16 FA617XS (v6.75.6100) | |
| Asus TUF Gaming A16 FA617 (v6.85.6300) | |
| Medion Erazer Defender P40 (v6.75.6100) | |
| MSI Katana 15 B12VEK (v6.85.6300) | |
| Gigabyte G5 KE (v6.75.6100) | |
| AIDA64 / CPU Queen | |
| Asus TUF Gaming A16 FA617XS (v6.75.6100) | |
| Average AMD Ryzen 9 7940HS (118174 - 124783, n=9) | |
| Average of class Gaming (50699 - 173351, n=141, last 2 years) | |
| Lenovo Legion Pro 5 16IRX8 (v6.85.6300) | |
| Medion Erazer Defender P40 (v6.75.6100) | |
| Asus TUF Gaming A16 FA617 (v6.85.6300) | |
| MSI Katana 15 B12VEK (v6.85.6300) | |
| Gigabyte G5 KE (v6.75.6100) | |
| AIDA64 / FPU SinJulia | |
| Asus TUF Gaming A16 FA617XS (v6.75.6100) | |
| Average AMD Ryzen 9 7940HS (14663 - 15551, n=9) | |
| Average of class Gaming (5020 - 33636, n=141, last 2 years) | |
| Lenovo Legion Pro 5 16IRX8 (v6.85.6300) | |
| Asus TUF Gaming A16 FA617 (v6.85.6300) | |
| Medion Erazer Defender P40 (v6.75.6100) | |
| MSI Katana 15 B12VEK (v6.85.6300) | |
| Gigabyte G5 KE (v6.75.6100) | |
| AIDA64 / FPU Mandel | |
| Average of class Gaming (17585 - 128721, n=141, last 2 years) | |
| Asus TUF Gaming A16 FA617XS (v6.75.6100) | |
| Average AMD Ryzen 9 7940HS (56839 - 66238, n=9) | |
| Asus TUF Gaming A16 FA617 (v6.85.6300) | |
| Lenovo Legion Pro 5 16IRX8 (v6.85.6300) | |
| Medion Erazer Defender P40 (v6.75.6100) | |
| MSI Katana 15 B12VEK (v6.85.6300) | |
| Gigabyte G5 KE (v6.75.6100) | |
| AIDA64 / CPU AES | |
| Average AMD Ryzen 9 7940HS (86309 - 171350, n=9) | |
| Gigabyte G5 KE (v6.75.6100) | |
| Average of class Gaming (19065 - 247074, n=141, last 2 years) | |
| Lenovo Legion Pro 5 16IRX8 (v6.85.6300) | |
| Asus TUF Gaming A16 FA617XS (v6.75.6100) | |
| Medion Erazer Defender P40 (v6.75.6100) | |
| MSI Katana 15 B12VEK (v6.85.6300) | |
| Asus TUF Gaming A16 FA617 (v6.85.6300) | |
| AIDA64 / CPU ZLib | |
| Average of class Gaming (373 - 2531, n=141, last 2 years) | |
| Lenovo Legion Pro 5 16IRX8 (v6.85.6300) | |
| Asus TUF Gaming A16 FA617XS (v6.75.6100) | |
| Average AMD Ryzen 9 7940HS (866 - 1152, n=9) | |
| Medion Erazer Defender P40 (v6.75.6100) | |
| Gigabyte G5 KE (v6.75.6100) | |
| Asus TUF Gaming A16 FA617 (v6.85.6300) | |
| MSI Katana 15 B12VEK (v6.85.6300) | |
| AIDA64 / FP64 Ray-Trace | |
| Asus TUF Gaming A16 FA617XS (v6.75.6100) | |
| Average of class Gaming (3856 - 45446, n=141, last 2 years) | |
| Average AMD Ryzen 9 7940HS (13175 - 15675, n=9) | |
| Lenovo Legion Pro 5 16IRX8 (v6.85.6300) | |
| Asus TUF Gaming A16 FA617 (v6.85.6300) | |
| MSI Katana 15 B12VEK (v6.85.6300) | |
| Medion Erazer Defender P40 (v6.75.6100) | |
| Gigabyte G5 KE (v6.75.6100) | |
| AIDA64 / CPU PhotoWorxx | |
| Average of class Gaming (10805 - 62916, n=141, last 2 years) | |
| MSI Katana 15 B12VEK (v6.85.6300) | |
| Lenovo Legion Pro 5 16IRX8 (v6.85.6300) | |
| Medion Erazer Defender P40 (v6.75.6100) | |
| Average AMD Ryzen 9 7940HS (29922 - 41567, n=9) | |
| Asus TUF Gaming A16 FA617XS (v6.75.6100) | |
| Gigabyte G5 KE (v6.75.6100) | |
| Asus TUF Gaming A16 FA617 (v6.85.6300) | |
System performance
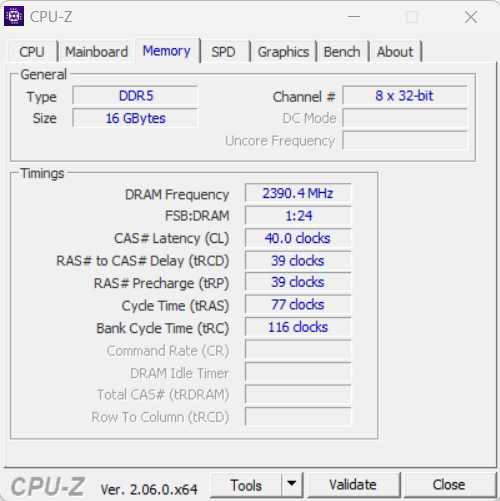
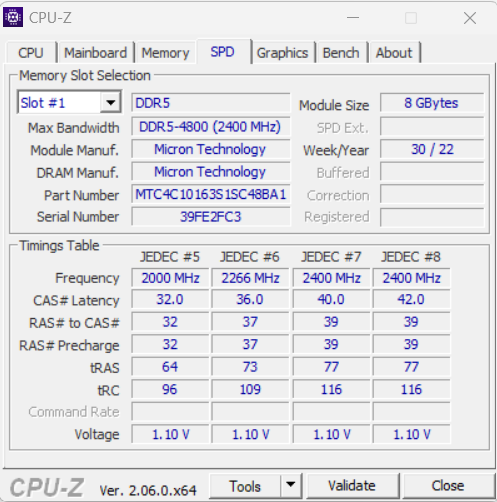
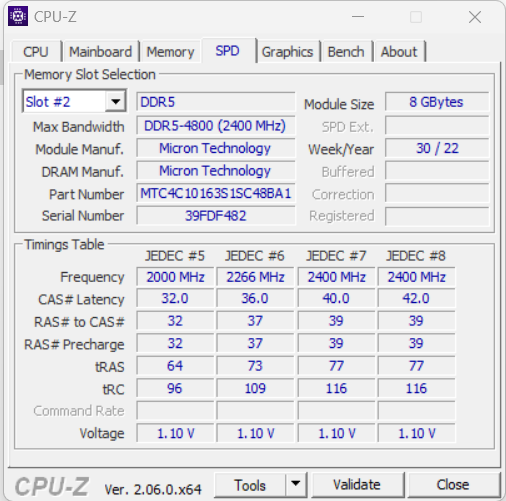
The smoothly running system provides enough performance for demanding areas of use, such as rendering, video editing and gaming - the good PCMark results can confirm this. The RAM's transfer rates are on a normal level for DDR5 4800 RAM. It is important to note: The automated switch between dGPU and iGPU (Smart Access Graphic) always takes a second or two. During this time, the system freezes.
CrossMark: Overall | Productivity | Creativity | Responsiveness
| PCMark 10 / Score | |
| Average of class Gaming (5776 - 9647, n=120, last 2 years) | |
| Asus TUF Gaming A16 FA617XS | |
| Average AMD Ryzen 9 7940HS, AMD Radeon RX 7600S (n=1) | |
| Lenovo Legion Pro 5 16IRX8 | |
| Asus TUF Gaming A16 FA617 | |
| Gigabyte G5 KE | |
| Medion Erazer Defender P40 | |
| MSI Katana 15 B12VEK | |
| PCMark 10 / Essentials | |
| Gigabyte G5 KE | |
| Lenovo Legion Pro 5 16IRX8 | |
| Asus TUF Gaming A16 FA617XS | |
| Average AMD Ryzen 9 7940HS, AMD Radeon RX 7600S (n=1) | |
| Average of class Gaming (8840 - 12600, n=124, last 2 years) | |
| Asus TUF Gaming A16 FA617 | |
| MSI Katana 15 B12VEK | |
| Medion Erazer Defender P40 | |
| PCMark 10 / Productivity | |
| Asus TUF Gaming A16 FA617XS | |
| Average AMD Ryzen 9 7940HS, AMD Radeon RX 7600S (n=1) | |
| Average of class Gaming (6662 - 14612, n=120, last 2 years) | |
| Medion Erazer Defender P40 | |
| MSI Katana 15 B12VEK | |
| Gigabyte G5 KE | |
| Asus TUF Gaming A16 FA617 | |
| Lenovo Legion Pro 5 16IRX8 | |
| PCMark 10 / Digital Content Creation | |
| Average of class Gaming (7440 - 19351, n=120, last 2 years) | |
| Lenovo Legion Pro 5 16IRX8 | |
| Asus TUF Gaming A16 FA617XS | |
| Average AMD Ryzen 9 7940HS, AMD Radeon RX 7600S (n=1) | |
| Asus TUF Gaming A16 FA617 | |
| Gigabyte G5 KE | |
| Medion Erazer Defender P40 | |
| MSI Katana 15 B12VEK | |
| CrossMark / Overall | |
| Average of class Gaming (1247 - 2344, n=115, last 2 years) | |
| Medion Erazer Defender P40 | |
| Asus TUF Gaming A16 FA617XS | |
| Average AMD Ryzen 9 7940HS, AMD Radeon RX 7600S (n=1) | |
| Gigabyte G5 KE | |
| MSI Katana 15 B12VEK | |
| Lenovo Legion Pro 5 16IRX8 | |
| CrossMark / Productivity | |
| Average of class Gaming (1299 - 2211, n=115, last 2 years) | |
| Gigabyte G5 KE | |
| Asus TUF Gaming A16 FA617XS | |
| Average AMD Ryzen 9 7940HS, AMD Radeon RX 7600S (n=1) | |
| MSI Katana 15 B12VEK | |
| Medion Erazer Defender P40 | |
| Lenovo Legion Pro 5 16IRX8 | |
| CrossMark / Creativity | |
| Average of class Gaming (1275 - 2729, n=115, last 2 years) | |
| Medion Erazer Defender P40 | |
| Asus TUF Gaming A16 FA617XS | |
| Average AMD Ryzen 9 7940HS, AMD Radeon RX 7600S (n=1) | |
| MSI Katana 15 B12VEK | |
| Gigabyte G5 KE | |
| Lenovo Legion Pro 5 16IRX8 | |
| CrossMark / Responsiveness | |
| Gigabyte G5 KE | |
| Average of class Gaming (1030 - 2330, n=115, last 2 years) | |
| Lenovo Legion Pro 5 16IRX8 | |
| Medion Erazer Defender P40 | |
| MSI Katana 15 B12VEK | |
| Asus TUF Gaming A16 FA617XS | |
| Average AMD Ryzen 9 7940HS, AMD Radeon RX 7600S (n=1) | |
| PCMark 8 Home Score Accelerated v2 | 5937 points | |
| PCMark 8 Work Score Accelerated v2 | 6458 points | |
| PCMark 10 Score | 7927 points | |
Help | ||
| AIDA64 / Memory Copy | |
| Average of class Gaming (21750 - 104987, n=141, last 2 years) | |
| Average AMD Ryzen 9 7940HS (59712 - 78739, n=9) | |
| Asus TUF Gaming A16 FA617XS | |
| Lenovo Legion Pro 5 16IRX8 | |
| Medion Erazer Defender P40 | |
| MSI Katana 15 B12VEK | |
| Asus TUF Gaming A16 FA617 | |
| Gigabyte G5 KE | |
| AIDA64 / Memory Read | |
| Average of class Gaming (22956 - 104349, n=141, last 2 years) | |
| Lenovo Legion Pro 5 16IRX8 | |
| Medion Erazer Defender P40 | |
| MSI Katana 15 B12VEK | |
| Asus TUF Gaming A16 FA617XS | |
| Average AMD Ryzen 9 7940HS (50399 - 61836, n=9) | |
| Asus TUF Gaming A16 FA617 | |
| Gigabyte G5 KE | |
| AIDA64 / Memory Write | |
| Average AMD Ryzen 9 7940HS (72541 - 91567, n=9) | |
| Average of class Gaming (22297 - 133486, n=141, last 2 years) | |
| Asus TUF Gaming A16 FA617XS | |
| Lenovo Legion Pro 5 16IRX8 | |
| Medion Erazer Defender P40 | |
| MSI Katana 15 B12VEK | |
| Asus TUF Gaming A16 FA617 | |
| Gigabyte G5 KE | |
| AIDA64 / Memory Latency | |
| Average of class Gaming (59.5 - 259, n=141, last 2 years) | |
| Gigabyte G5 KE | |
| MSI Katana 15 B12VEK | |
| Average AMD Ryzen 9 7940HS (87.6 - 111.1, n=9) | |
| Medion Erazer Defender P40 | |
| Asus TUF Gaming A16 FA617XS | |
| Asus TUF Gaming A16 FA617 | |
| Lenovo Legion Pro 5 16IRX8 | |
* ... smaller is better
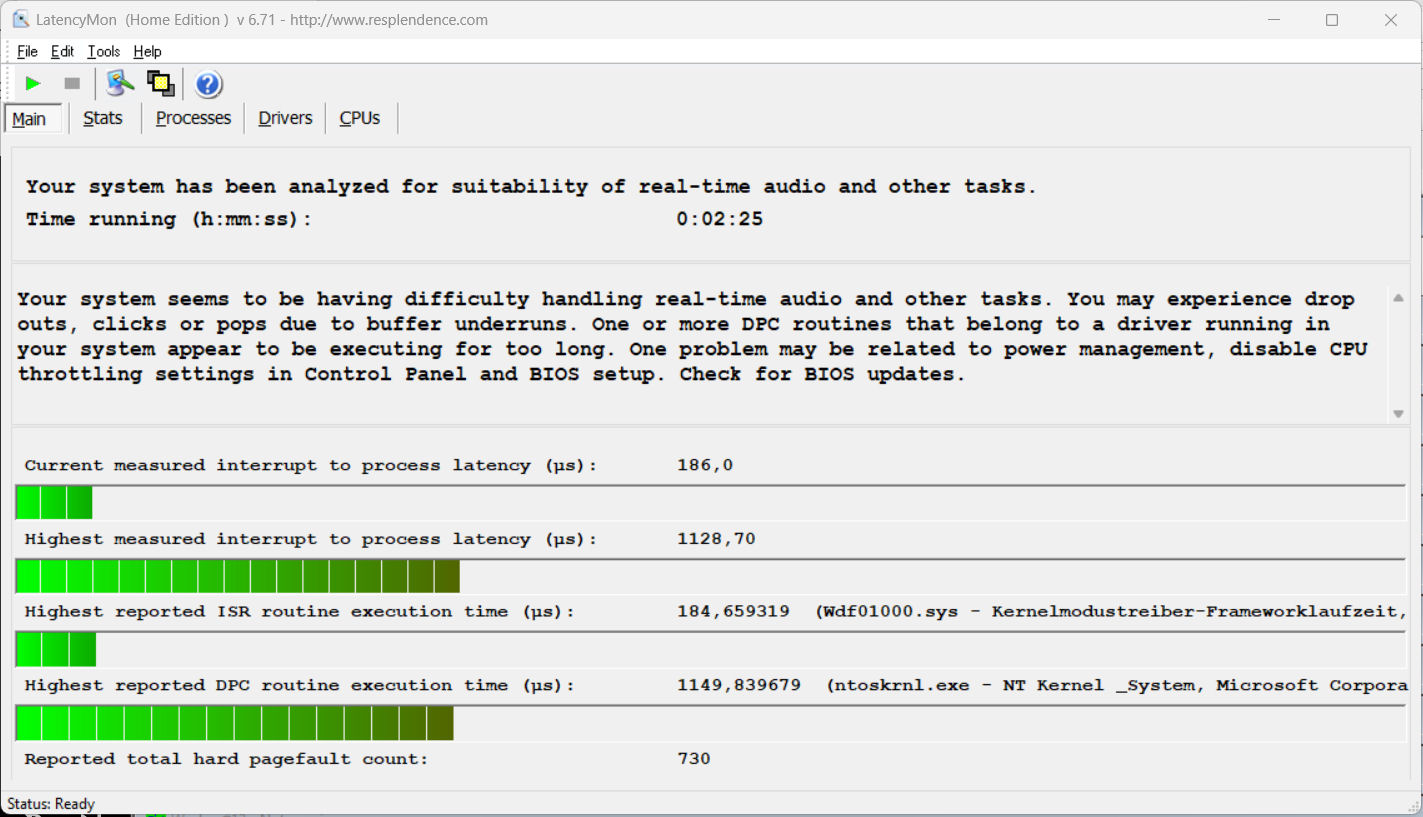
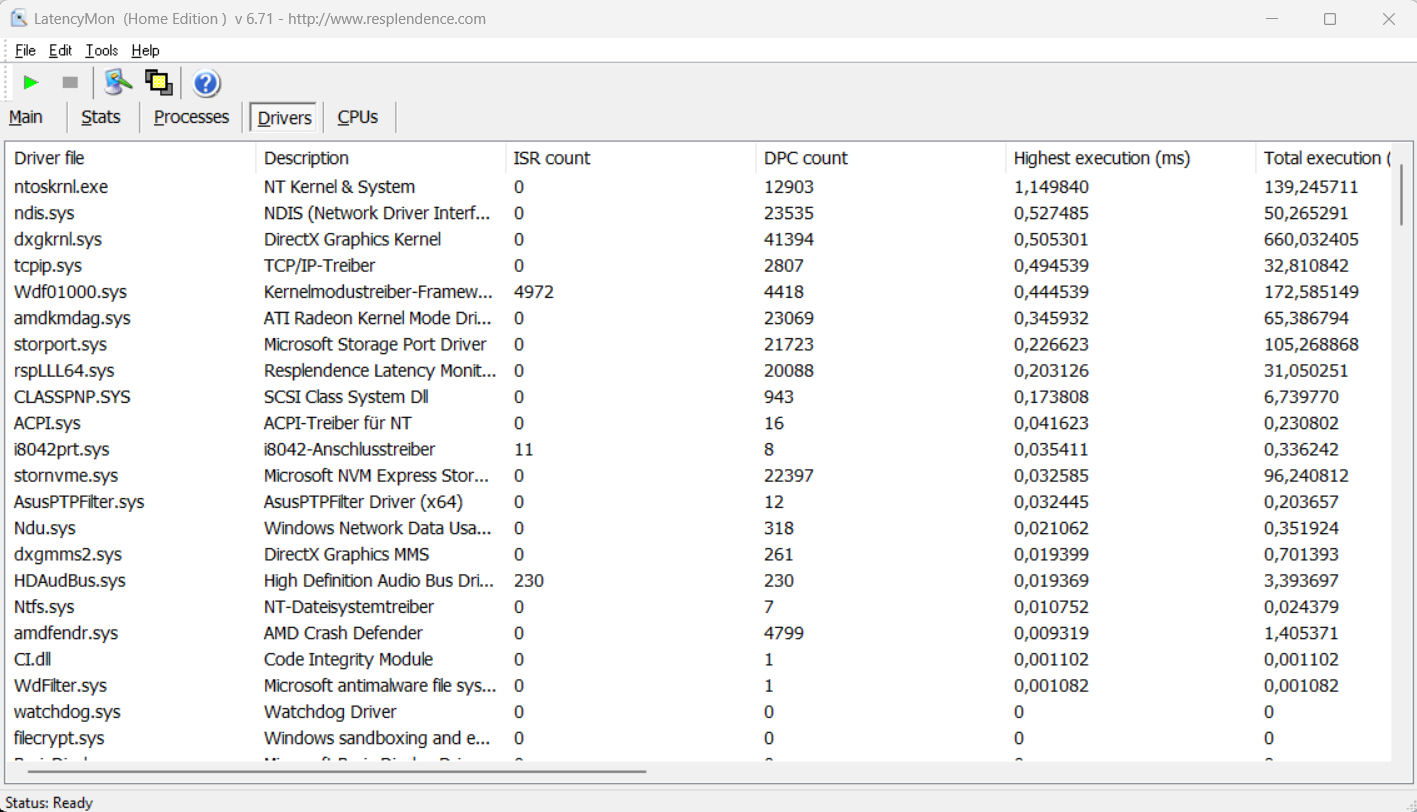
DPC latency
The standardized latency monitor test (web surfing, 4k video playback, Prime95 high-load) revealed some anomalies. The system does not seem to be suitable for real-time video and audio editing. Future software updates could lead to improvements or even degradations.
| DPC Latencies / LatencyMon - interrupt to process latency (max), Web, Youtube, Prime95 | |
| MSI Katana 15 B12VEK | |
| Medion Erazer Defender P40 | |
| Asus TUF Gaming A16 FA617XS | |
| Gigabyte G5 KE | |
| Lenovo Legion Pro 5 16IRX8 | |
| Asus TUF Gaming A16 FA617 | |
* ... smaller is better
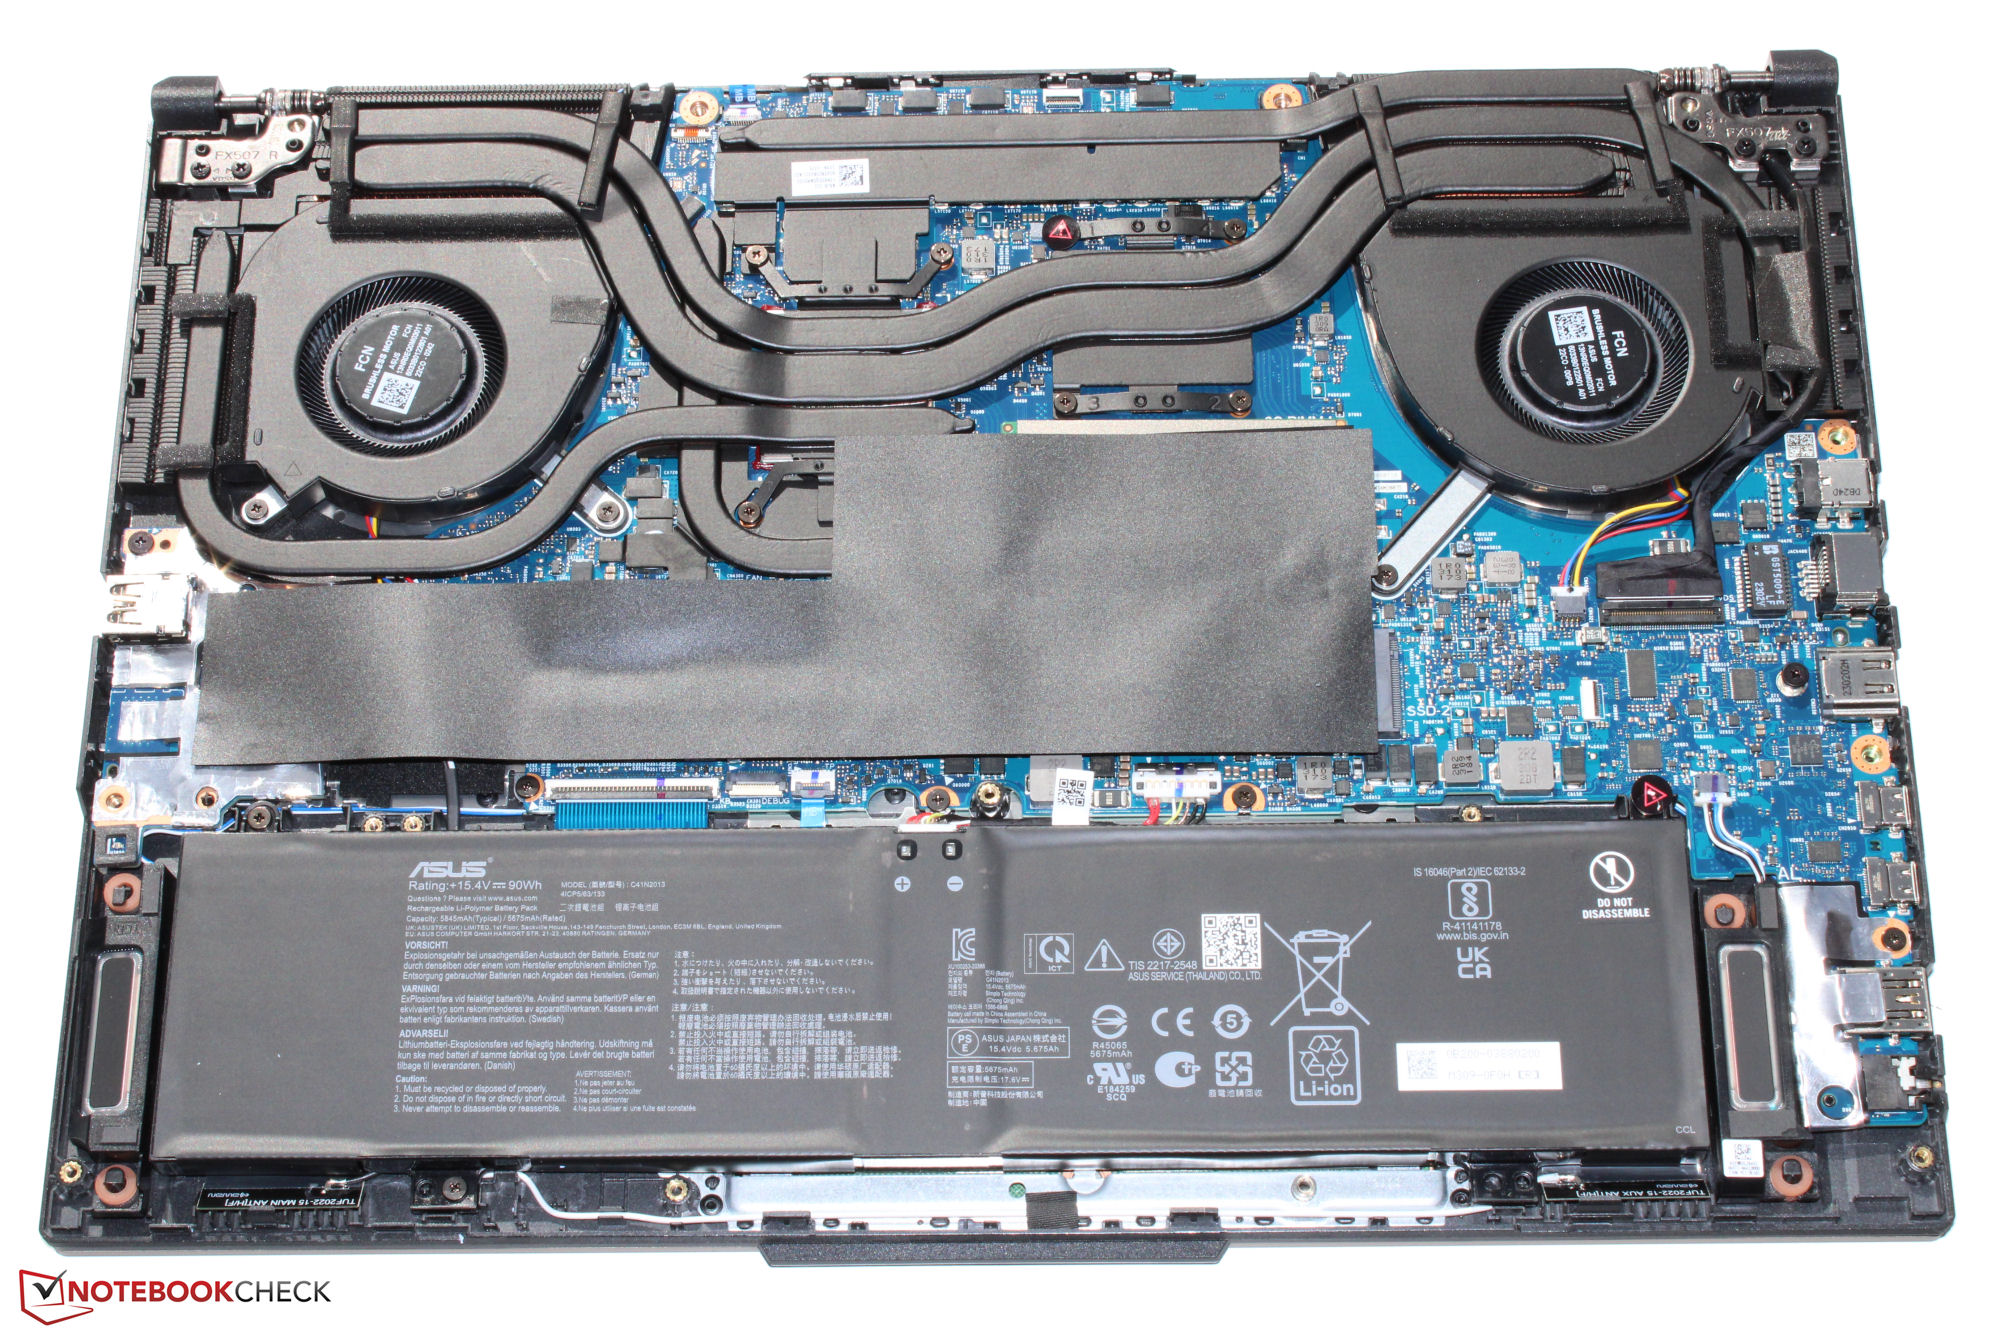
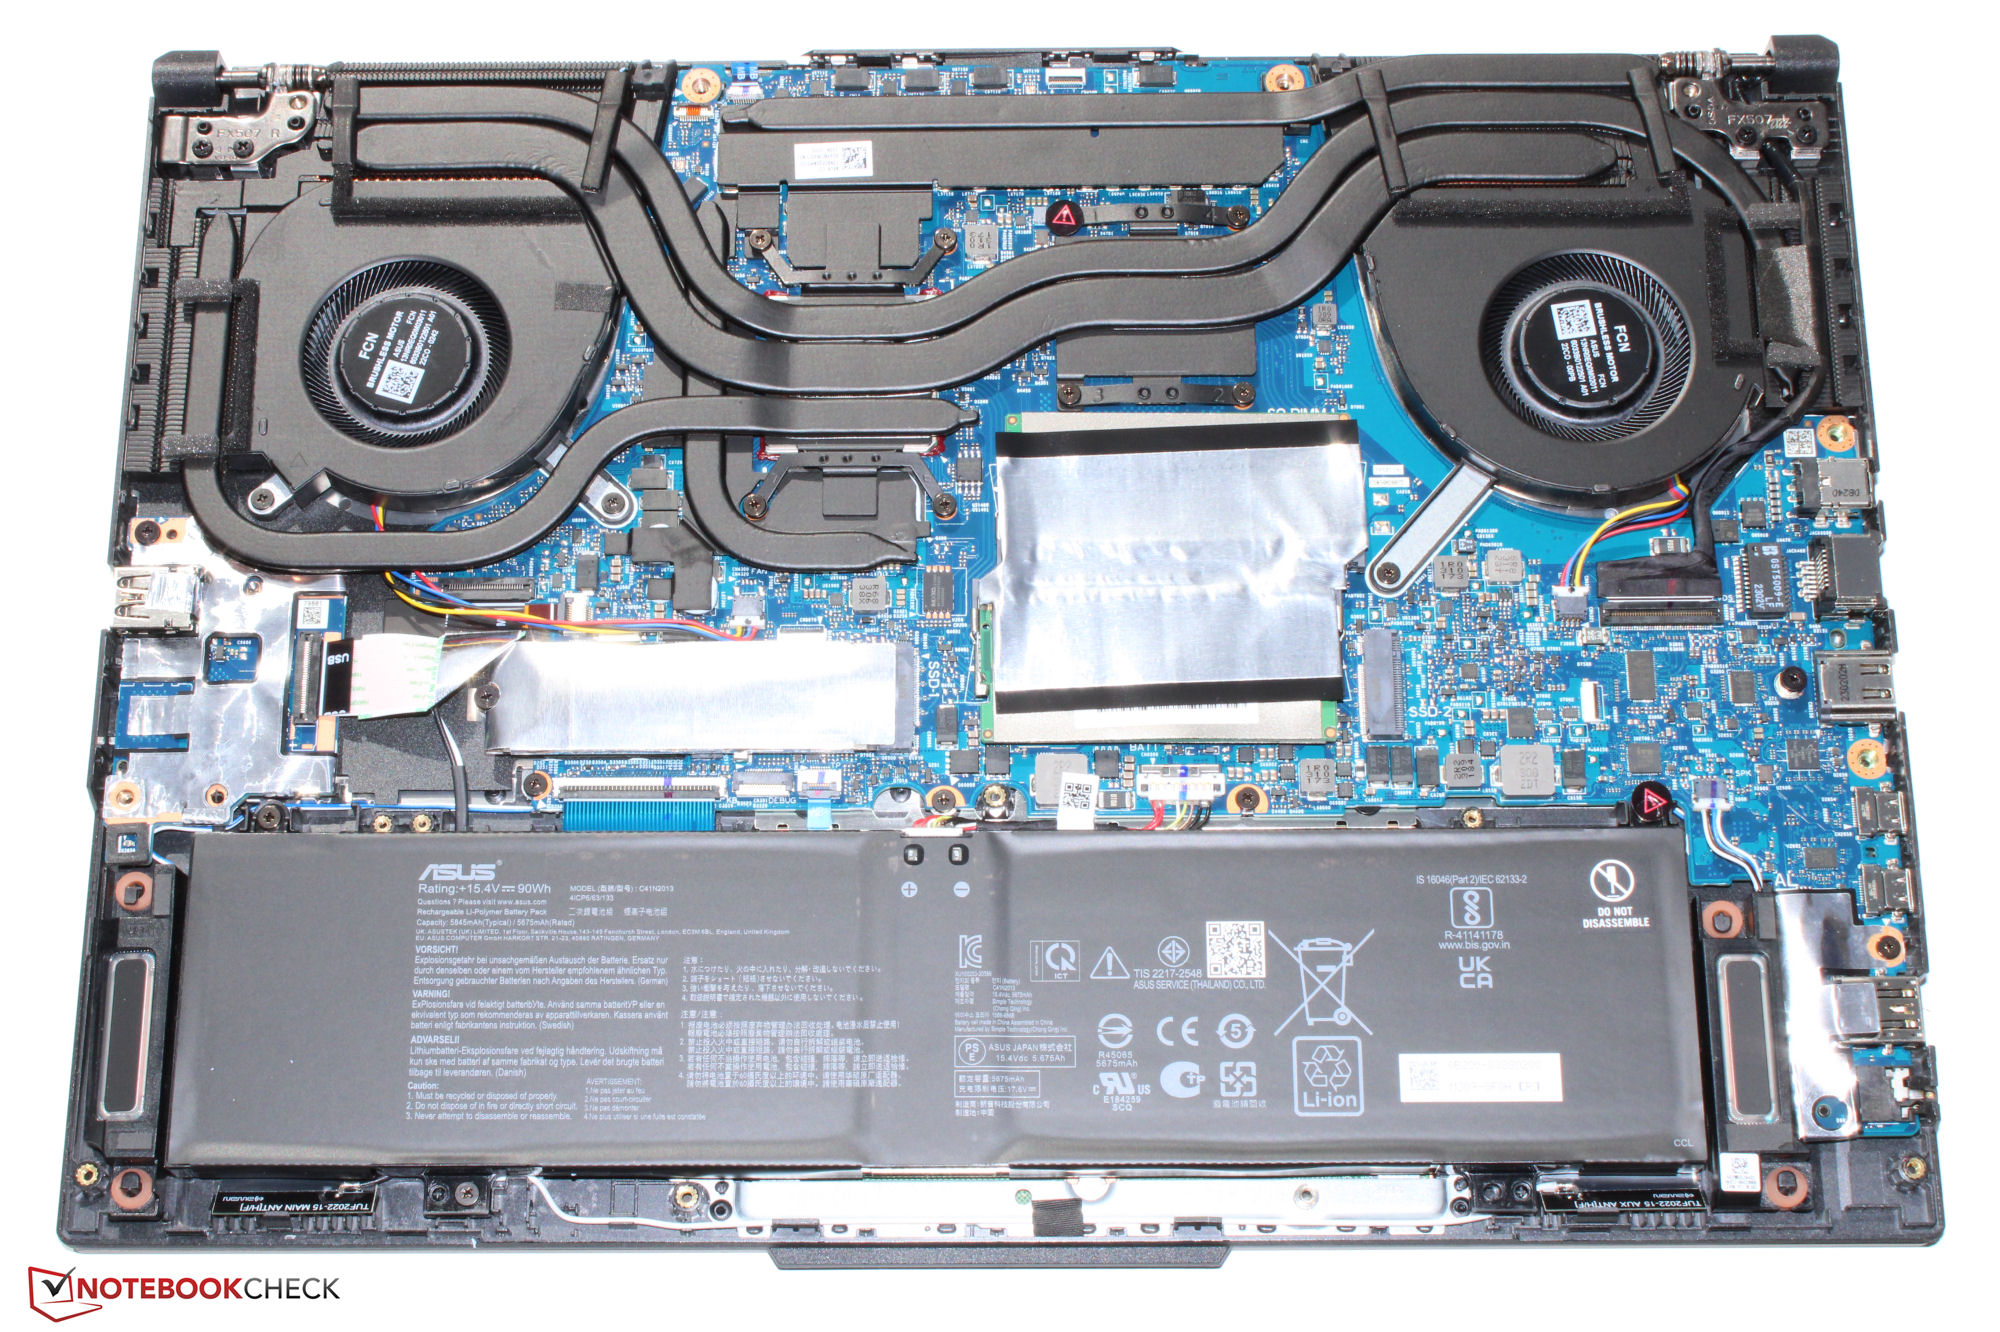
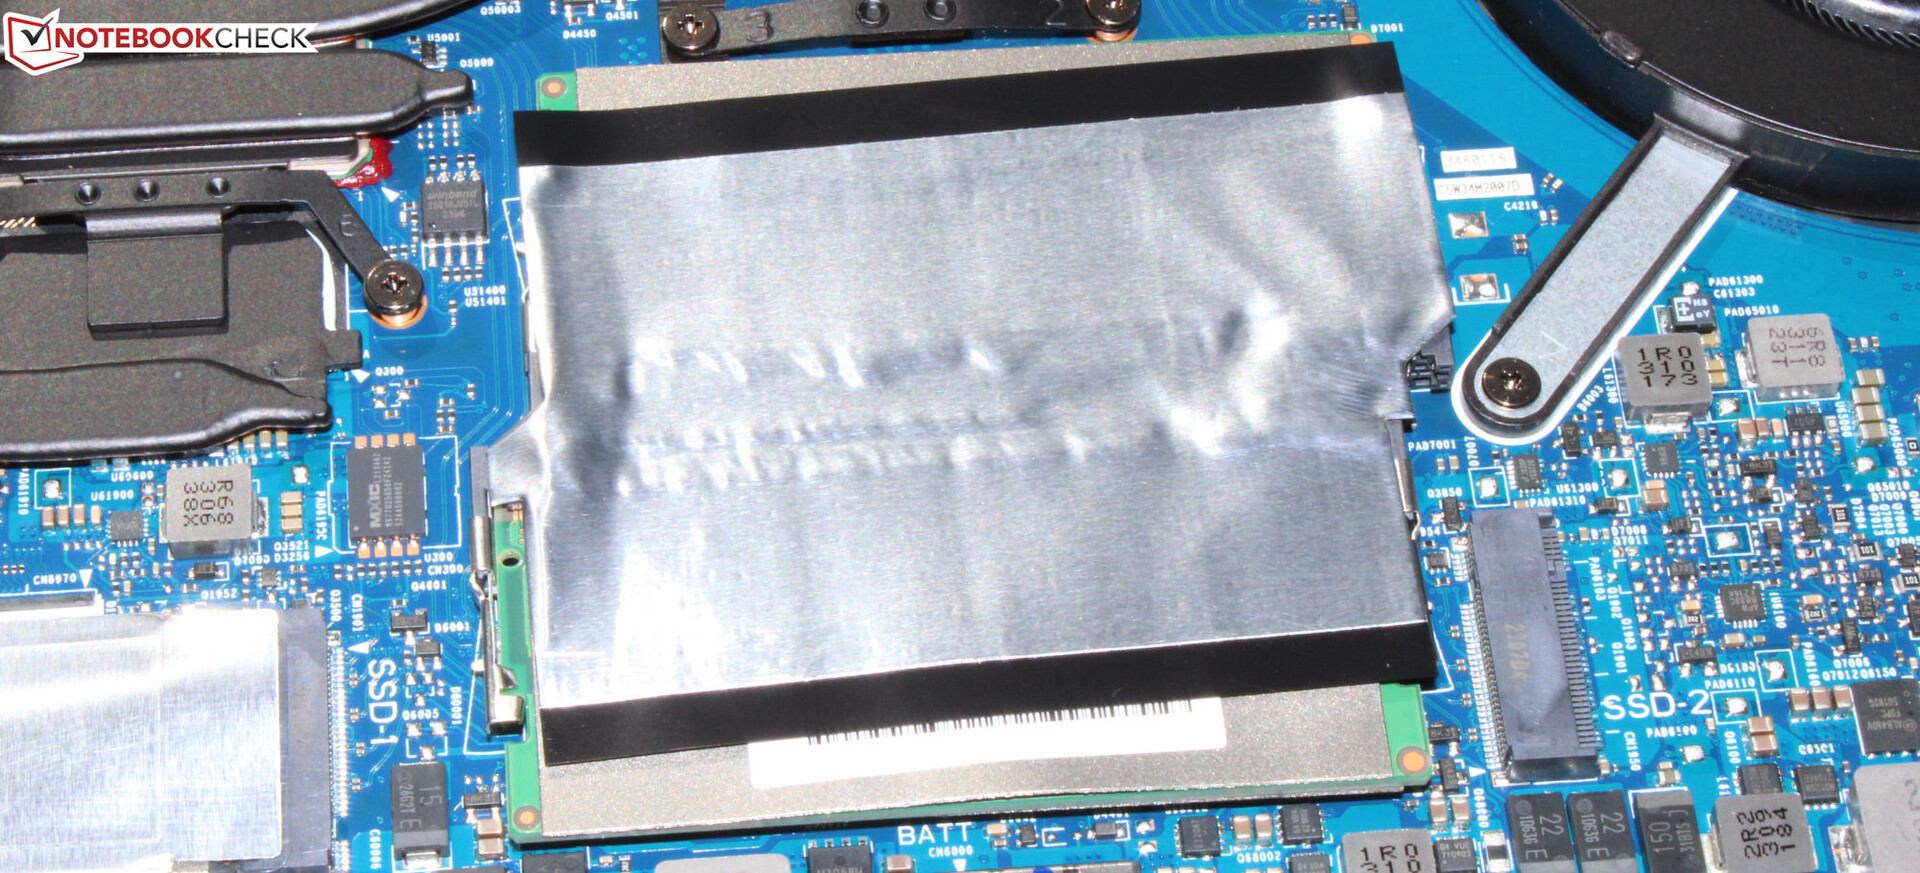
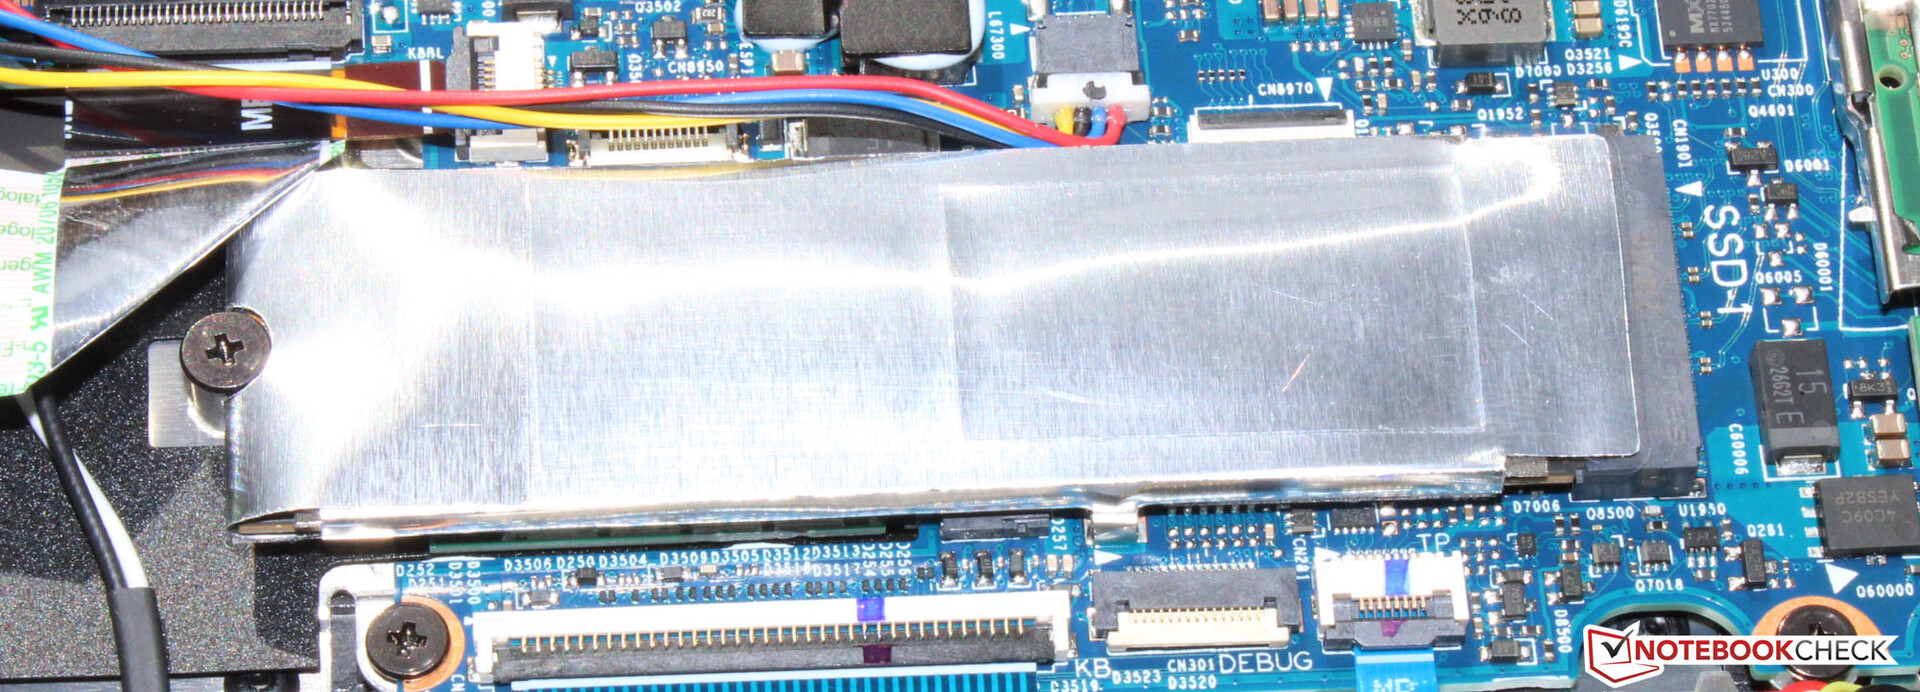
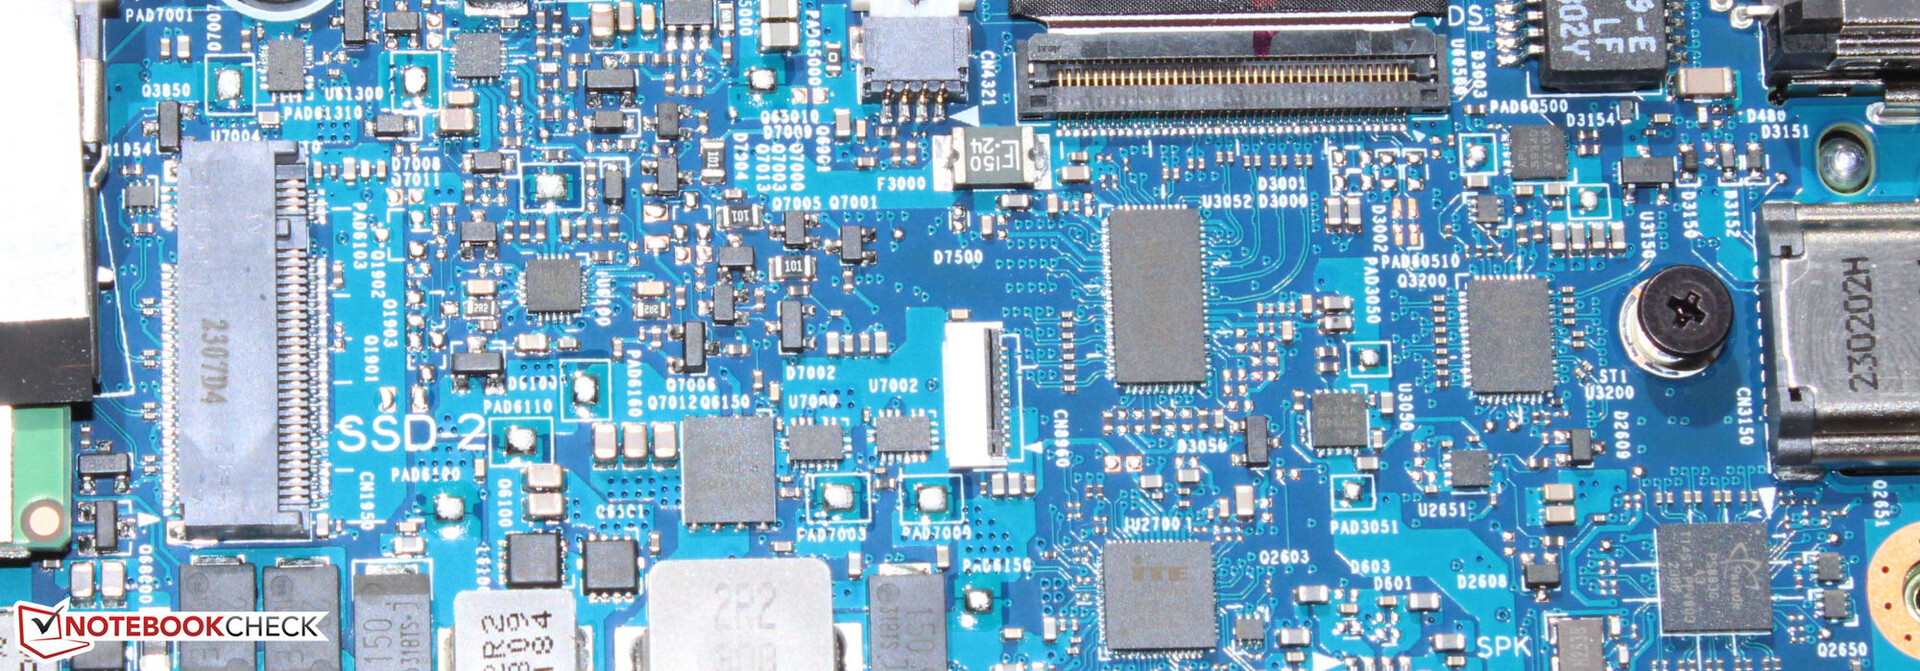
Storage devices
Asus has equipped the A16 with a 512 GB SSD (PCIe 4, M.2-2280) from Micron - (too) little storage space for a gaming notebook. It delivers decent data rates but is not one of the top models among all the available SSDs. Especially the write rates are far below today's possibilities.

* ... smaller is better
reading continuous performance: DiskSpd Read Loop, Queue Depth 8
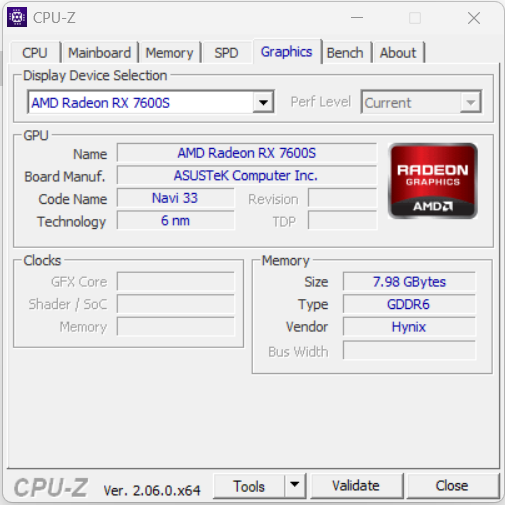
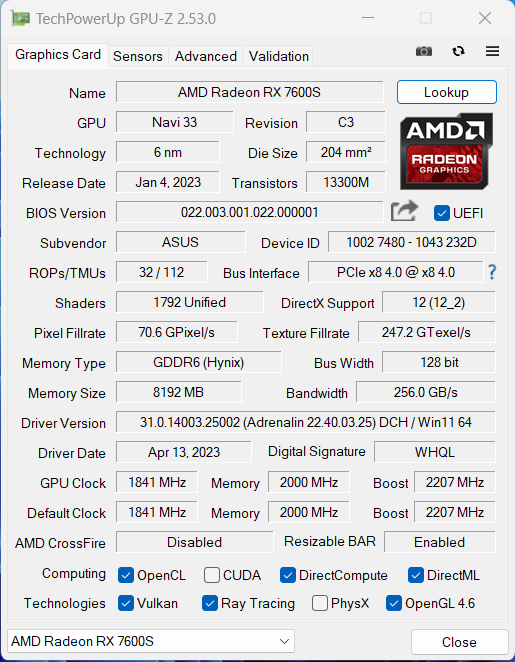
Graphics card
AMD's Radeon RX 7600S features 1,792 shaders, one 128-bit wide bus and fast GDDR6 storage (8,192 MB). Its maximum TGP (95 watts) isn't utilized to its full potential according to the Witcher 3 test. The benchmark results are exactly as expected and using the profile "Turbo" doesn't lead to any improved performance.
The mid-range GPU's competitors can be found in the GeForce models RTX 4060, RTX 4050 and RTX 3060's full configurations (= maximum TGP). While it can't quite keep up with the RTX 4060, it still did better in the 3DMark benchmarks than both of the other GeForce models. In practical gaming use, we couldn't get a consistent picture: Depending on the game, sometimes one GPU did better, sometimes the other - at least in the games we tested.

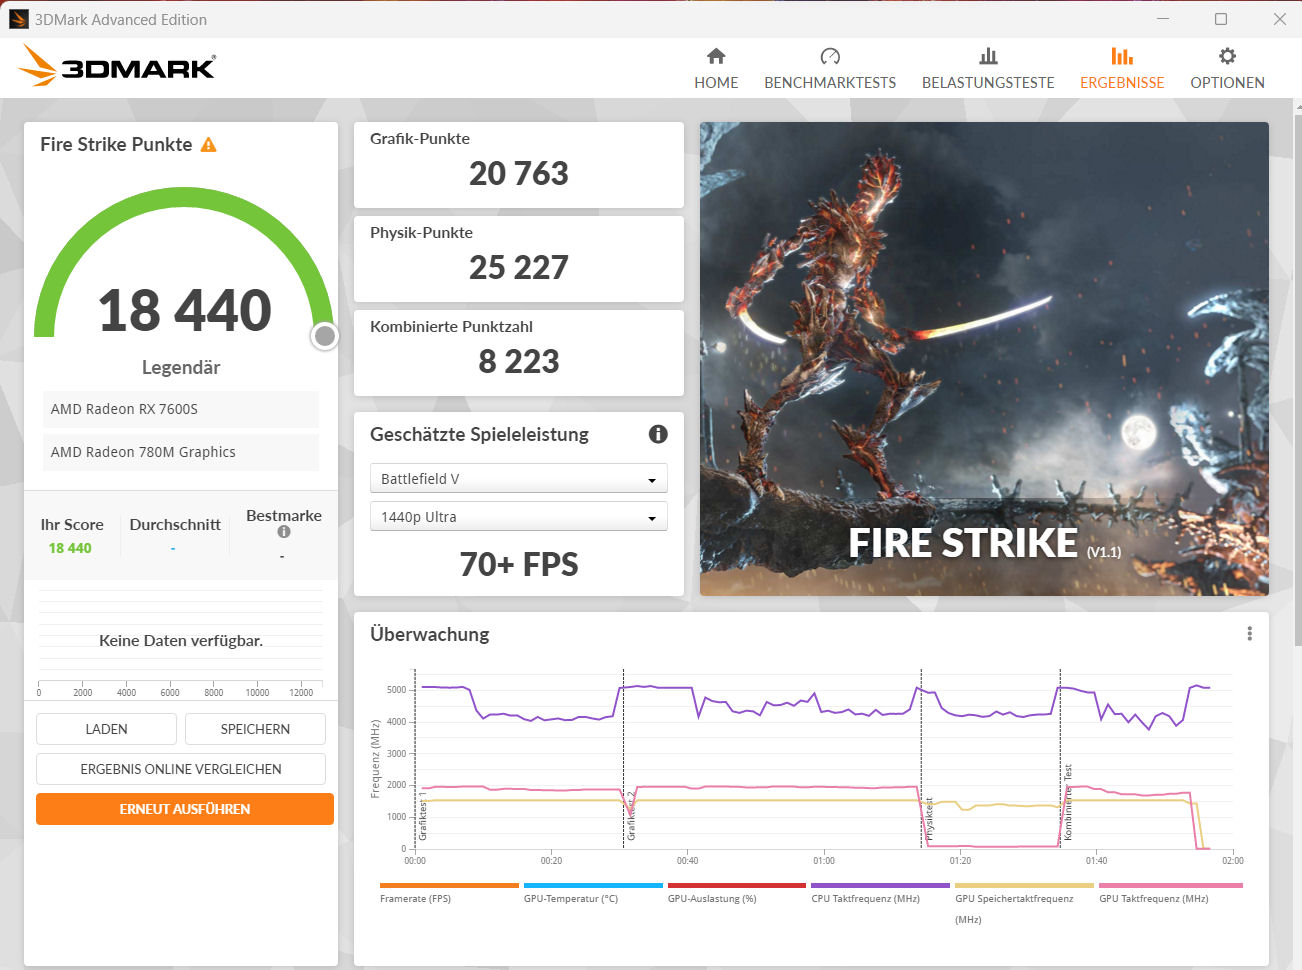


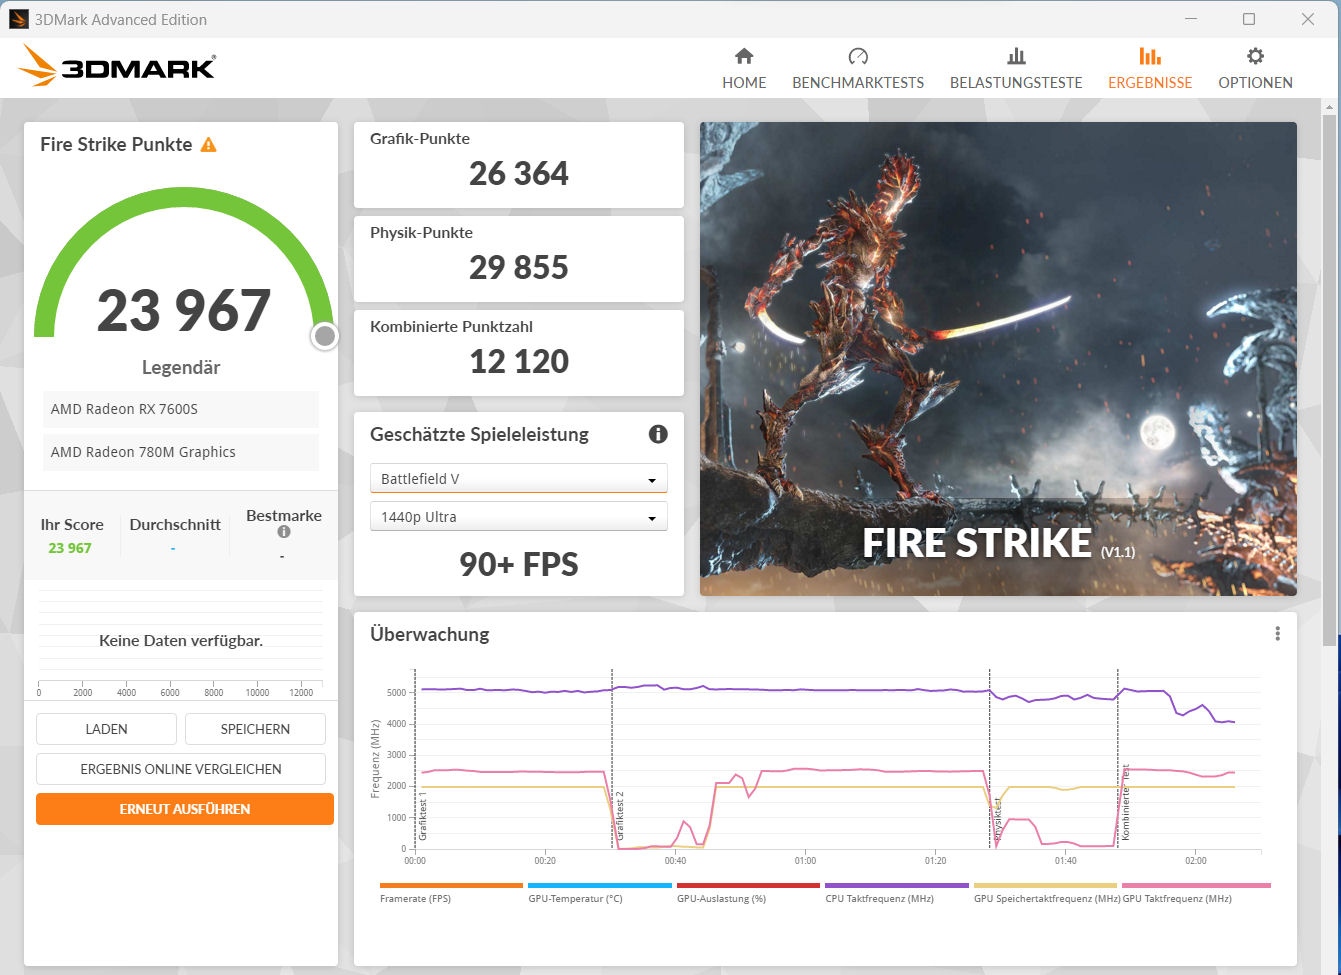
| 3DMark 06 Standard Score | 55435 points | |
| 3DMark 11 Performance | 28721 points | |
| 3DMark Cloud Gate Standard Score | 64441 points | |
| 3DMark Fire Strike Score | 23346 points | |
| 3DMark Time Spy Score | 9530 points | |
Help | ||
| V-Ray 5 Benchmark | |
| GPU RTX | |
| Average of class Gaming (556 - 4077, n=66, last 2 years) | |
| Lenovo Legion Pro 5 16IRX8 (5.0.1) | |
| Medion Erazer Defender P40 (5.0.1) | |
| Gigabyte G7 KE (5.0.1) | |
| GPU CUDA | |
| Average of class Gaming (425 - 3288, n=67, last 2 years) | |
| Lenovo Legion Pro 5 16IRX8 (5.0.1) | |
| Medion Erazer Defender P40 (5.0.1) | |
| Gigabyte G7 KE (5.0.1) | |
| Asus TUF Gaming A16 FA617XS (5.0.1) | |
| Average AMD Radeon RX 7600S (n=1) | |
| CPU | |
| Average of class Gaming (4081 - 30302, n=68, last 2 years) | |
| Lenovo Legion Pro 5 16IRX8 (5.0.1) | |
| Medion Erazer Defender P40 (5.0.1) | |
| Asus TUF Gaming A16 FA617XS (5.0.1) | |
| Average AMD Radeon RX 7600S (n=1) | |
| Gigabyte G7 KE (5.0.1) | |
| V-Ray Benchmark Next 4.10 | |
| GPU | |
| Average of class Gaming (54 - 1333, n=128, last 2 years) | |
| Medion Erazer Defender P40 (v4.10.07 ) | |
| MSI Katana 15 B12VEK (v4.10.07 ) | |
| Gigabyte G5 KE (v4.10.07 ) | |
| Gigabyte G7 KE (v4.10.07 ) | |
| Asus TUF Gaming A16 FA617XS (v4.10.07 ) | |
| Average AMD Radeon RX 7600S (83 - 96, n=2) | |
| Asus TUF Gaming A16 FA617 (v4.10.07 ) | |
| CPU | |
| Average of class Gaming (6122 - 45327, n=128, last 2 years) | |
| Medion Erazer Defender P40 (v4.10.07 ) | |
| Asus TUF Gaming A16 FA617XS (v4.10.07 ) | |
| Average AMD Radeon RX 7600S (14759 - 17623, n=2) | |
| Asus TUF Gaming A16 FA617 (v4.10.07 ) | |
| Gigabyte G7 KE (v4.10.07 ) | |
| Gigabyte G5 KE (v4.10.07 ) | |
| MSI Katana 15 B12VEK (v4.10.07 ) | |
Gaming performance
The FA617 is designed for gaming at high to maximum settings. The full screen resolution (1,920 x 1,200 pixels) can be used. Higher resolutions would be usable when a corresponding display is connected - with partly reduced settings. The "Turbo" profile does not increase the frame rates.
| The Witcher 3 - 1920x1080 Ultra Graphics & Postprocessing (HBAO+) | |
| Average of class Gaming (18.4 - 240, n=55, last 2 years) | |
| Lenovo Legion Pro 5 16IRX8 | |
| Medion Erazer Defender P40 | |
| Asus TUF Gaming A16 FA617XS (neu) | |
| Average AMD Radeon RX 7600S (91 - 98.1, n=2) | |
| Asus TUF Gaming A16 FA617 | |
| Gigabyte G5 KE | |
| MSI Katana 15 B12VEK | |
| Final Fantasy XV Benchmark - 1920x1080 High Quality | |
| Average of class Gaming (19.2 - 215, n=140, last 2 years) | |
| Lenovo Legion Pro 5 16IRX8 (1.3) | |
| Medion Erazer Defender P40 (1.3) | |
| Gigabyte G5 KE (1.3) | |
| Asus TUF Gaming A16 FA617XS (1.3) | |
| MSI Katana 15 B12VEK (1.3) | |
| Average AMD Radeon RX 7600S (78.2 - 85.2, n=2) | |
| Asus TUF Gaming A16 FA617 (1.3) | |
| Strange Brigade - 1920x1080 ultra AA:ultra AF:16 | |
| Average of class Gaming (38.9 - 456, n=128, last 2 years) | |
| Medion Erazer Defender P40 (1.47.22.14 D3D12) | |
| Asus TUF Gaming A16 FA617XS (1.47.22.14 D3D12) | |
| Average AMD Radeon RX 7600S (162.7 - 163.3, n=2) | |
| Asus TUF Gaming A16 FA617 (1.47.22.14 D3D12) | |
| Gigabyte G5 KE (1.47.22.14 D3D12) | |
| MSI Katana 15 B12VEK (1.47.22.14 D3D12) | |
| Returnal | |
| 1920x1080 Epic Preset | |
| Lenovo Legion Pro 5 16IRX8 | |
| Asus TUF Gaming A16 FA617XS | |
| Average AMD Radeon RX 7600S (n=1) | |
| Average of class Gaming (44 - 55, n=2, last 2 years) | |
| 1920x1080 Epic Preset + Epic Ray-Tracing | |
| Asus TUF Gaming A16 FA617XS | |
| Average AMD Radeon RX 7600S (n=1) | |
| Average of class Gaming (n=1last 2 years) | |
| Atomic Heart - 1920x1080 Atomic Preset | |
| Asus TUF Gaming A16 FA617XS | |
| Average AMD Radeon RX 7600S (n=1) | |
| Average of class Gaming (38 - 44.4, n=2, last 2 years) | |
| Sons of the Forest - 1920x1080 Ultra Preset AA:T | |
| Asus TUF Gaming A16 FA617XS | |
| Average AMD Radeon RX 7600S (n=1) | |
| Average of class Gaming (54 - 61.3, n=2, last 2 years) | |
| Resident Evil 4 Remake - 1920x1080 Max Preset | |
| Medion Erazer Defender P40 | |
| Asus TUF Gaming A16 FA617XS | |
| Average AMD Radeon RX 7600S (n=1) | |
| Average of class Gaming (42.5 - 43.6, n=2, last 2 years) | |
| The Last of Us - 1920x1080 Ultra Preset | |
| Asus TUF Gaming A16 FA617XS | |
| Average AMD Radeon RX 7600S (n=1) | |
| Average of class Gaming (n=1last 2 years) | |
| Hogwarts Legacy | |
| 1920x1080 Ultra Preset AA:High T | |
| Average of class Gaming (35.4 - 108.3, n=4, last 2 years) | |
| Asus TUF Gaming A16 FA617XS | |
| Average AMD Radeon RX 7600S (n=1) | |
| 1920x1080 Ultra Preset + Full Ray Tracing AA:High T | |
| Asus TUF Gaming A16 FA617XS | |
| Average AMD Radeon RX 7600S (n=1) | |
| Company of Heroes 3 - 1920x1080 Maximum Settings | |
| Asus TUF Gaming A16 FA617XS | |
| Average AMD Radeon RX 7600S (n=1) | |
| Average of class Gaming (52.7 - 90.1, n=2, last 2 years) | |
| Dead Island 2 - 1920x1080 Ultra Preset AA:High T | |
| Medion Erazer Defender P40 | |
| Asus TUF Gaming A16 FA617XS | |
| Average AMD Radeon RX 7600S (n=1) | |
| Average of class Gaming (52.1 - 63.9, n=2, last 2 years) | |
| Flight Simulator 2020 - 1920x1080 Ultra AA:TAA AF:16x | |
| Asus TUF Gaming A16 FA617XS | |
| Average AMD Radeon RX 7600S (n=1) | |
| Average of class Gaming (n=1last 2 years) | |
| Far Cry 6 | |
| 1920x1080 Ultra Graphics Quality + HD Textures AA:T | |
| Average of class Gaming (96.3 - 156, n=4, last 2 years) | |
| Asus TUF Gaming A16 FA617XS | |
| Average AMD Radeon RX 7600S (n=1) | |
| 1920x1080 Ultra Graphics Quality + HD Textures + DXR AA:T | |
| Average of class Gaming (n=1last 2 years) | |
| Asus TUF Gaming A16 FA617XS | |
| Average AMD Radeon RX 7600S (n=1) | |
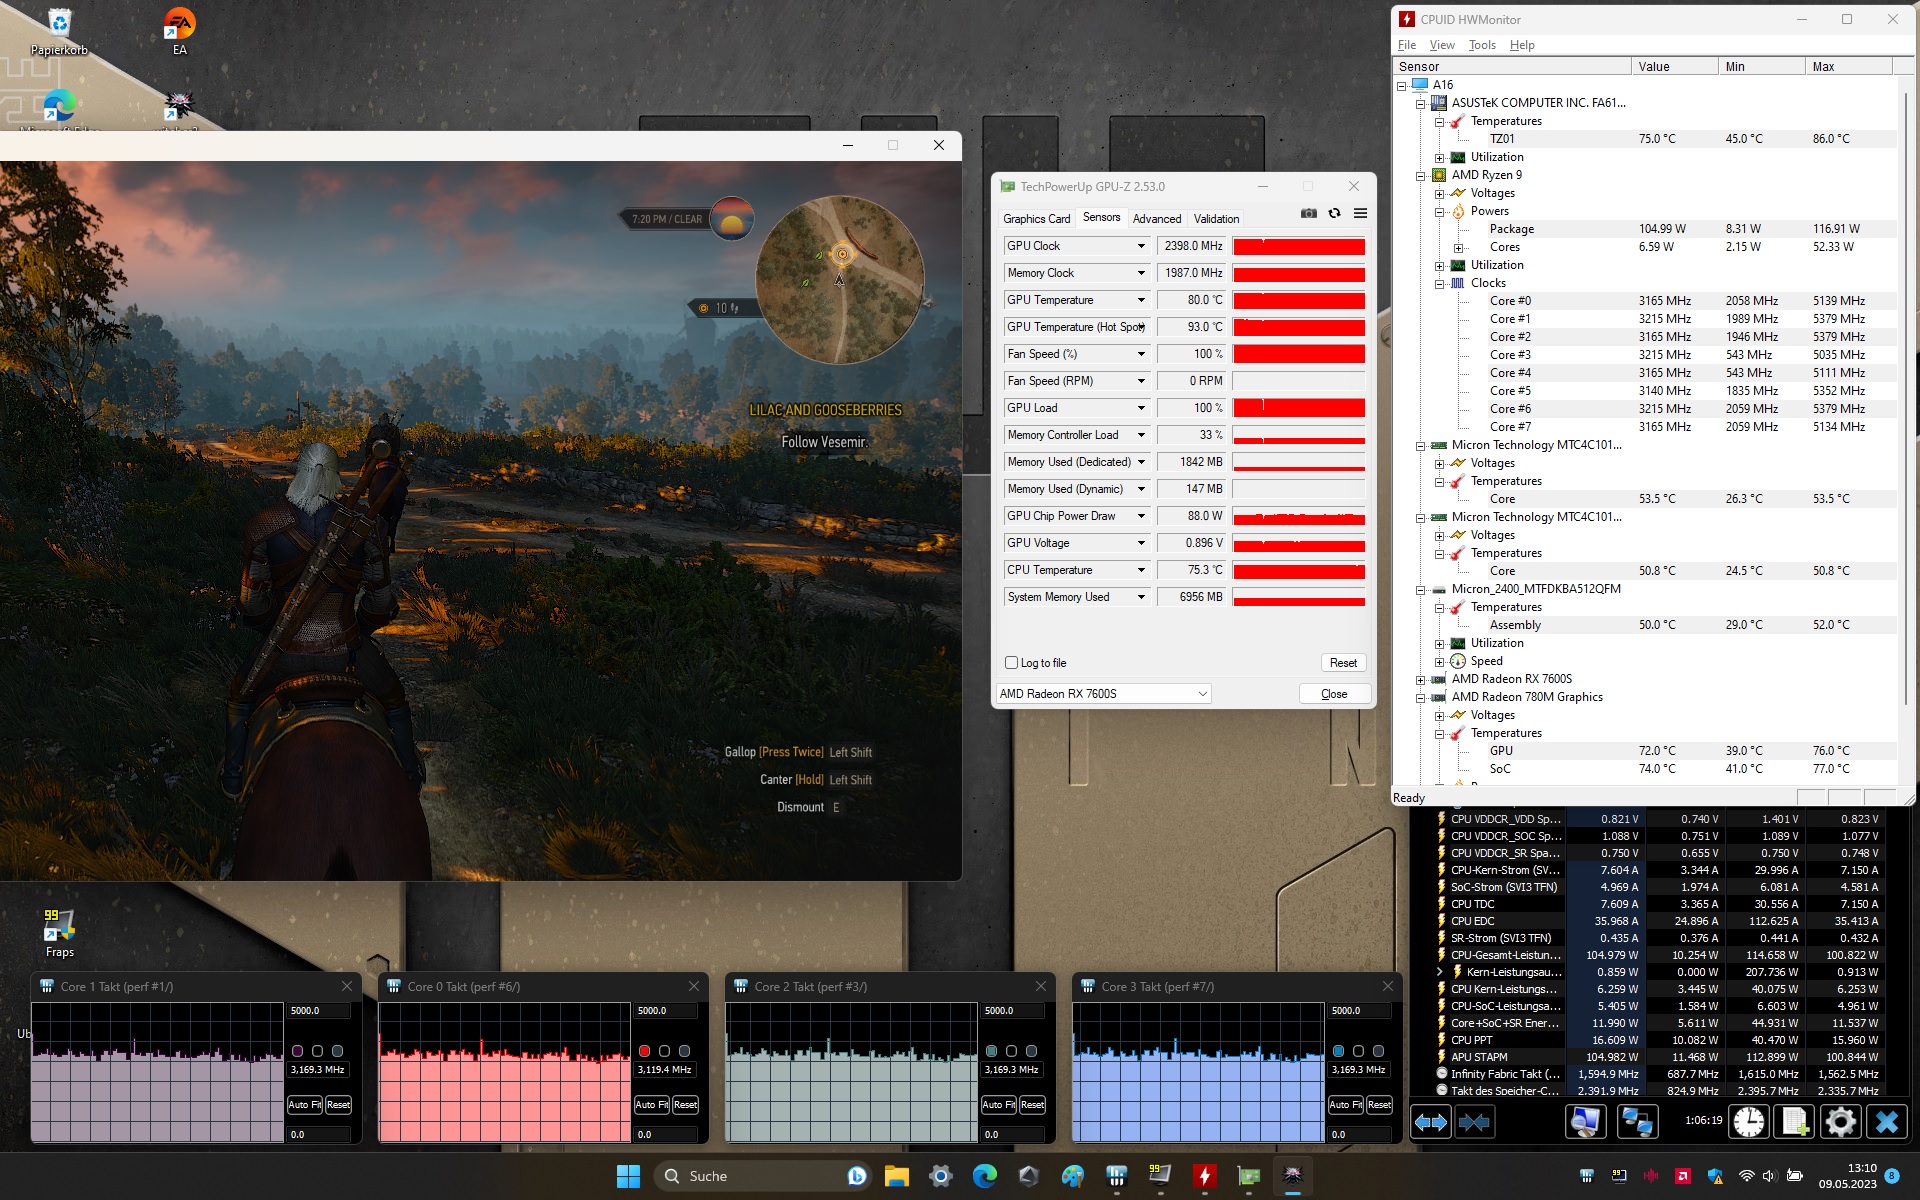
To check whether the frame rates remain largely constant over a longer period, we ran the game The Witcher 3 for about 60 minutes in Full HD resolution and maximum quality settings. The game character was not moved. A drop in performance was not noted.
Witcher 3 FPS diagram
| low | med. | high | ultra | |
|---|---|---|---|---|
| GTA V (2015) | 184.7 | 171.7 | 92.9 | |
| The Witcher 3 (2015) | 382 | 166.5 | 98.1 | |
| Dota 2 Reborn (2015) | 157.5 | 143.1 | 132.2 | 121.6 |
| Final Fantasy XV Benchmark (2018) | 215 | 117.2 | 85.2 | |
| X-Plane 11.11 (2018) | 85.1 | 72 | 57.3 | |
| Far Cry 5 (2018) | 135 | 120 | 115 | 108 |
| Strange Brigade (2018) | 440 | 228 | 190.8 | 163.3 |
| Metro Exodus (2019) | 187.3 | 116.5 | ||
| The Division 2 (2019) | 232 | 167 | 131 | 95 |
| Control (2019) | 235 | 116.6 | 83.5 | |
| Doom Eternal (2020) | 376 | 209 | 184.3 | 179 |
| Gears Tactics (2020) | 381.4 | 216.1 | 138.1 | 95.4 |
| Death Stranding (2020) | 189.5 | 144.1 | 133.6 | 129.6 |
| Flight Simulator 2020 (2020) | 134.9 | 85.5 | 60.1 | 42.7 |
| Crysis Remastered (2020) | 294 | 190.9 | 90.6 | 38.6 |
| Watch Dogs Legion (2020) | 122.6 | 118.5 | 106.6 | 69.5 |
| Assassin´s Creed Valhalla (2020) | 203 | 124 | 102 | 88 |
| Hitman 3 (2021) | 270 | 178.2 | 157.4 | 145.7 |
| Far Cry 6 (2021) | 151 | 133 | 119 | 104.7 |
| Forza Horizon 5 (2021) | 197 | 144 | 135 | 74 |
| GRID Legends (2022) | 214.9 | 182.8 | 156.5 | 129.3 |
| Tiny Tina's Wonderlands (2022) | 198.1 | 156.8 | 105.7 | 82.2 |
| F1 22 (2022) | 263 | 244 | 190 | 50.5 |
| A Plague Tale Requiem (2022) | 98.2 | 78 | 66.1 | 55.4 |
| Hogwarts Legacy (2023) | 118.4 | 88.7 | 72 | 55.4 |
| Returnal (2023) | 91 | 88 | 78 | 67 |
| Atomic Heart (2023) | 167.1 | 125.5 | 71.6 | 56.6 |
| Company of Heroes 3 (2023) | 143.4 | 125.9 | 97.4 | 97.2 |
| Sons of the Forest (2023) | 93.2 | 81.4 | 78 | 76.7 |
| Resident Evil 4 Remake (2023) | 107.4 | 83.2 | 78.9 | 52.3 |
| The Last of Us (2023) | 81.4 | 67.6 | 60.2 | 51.5 |
| Dead Island 2 (2023) | 201 | 168.1 | 122.7 | 113.1 |
Emissions - The FA617XS can get quite loud
Noise emissions
In everyday use (office, internet etc), the A16 usually works quietly, often silently - regardless of the selected profile. The sound pressure level can rise up to 53 dB(A) ("Turbo") or 51 dB(A) ("Performance") in gaming mode. Overall lower noise emissions can be achieved by using the "Quiet" profile. The computing power is then only reduced to a very small extent.
Noise level
| Idle |
| 25 / 26 / 28 dB(A) |
| Load |
| 43 / 53 dB(A) |
 | ||
30 dB silent 40 dB(A) audible 50 dB(A) loud |
||
min: | ||
| Asus TUF Gaming A16 FA617XS R9 7940HS, Radeon RX 7600S | Lenovo Legion Pro 5 16IRX8 i7-13700HX, GeForce RTX 4060 Laptop GPU | MSI Katana 15 B12VEK i7-12650H, GeForce RTX 4050 Laptop GPU | Medion Erazer Defender P40 i7-13700HX, GeForce RTX 4060 Laptop GPU | Gigabyte G5 KE i5-12500H, GeForce RTX 3060 Laptop GPU | Asus TUF Gaming A16 FA617 R7 7735HS, Radeon RX 7600S | |
|---|---|---|---|---|---|---|
| Noise | 8% | 7% | -11% | -11% | 3% | |
| off / environment * (dB) | 25 | 23 8% | 24 4% | 25 -0% | 19.52 22% | 24 4% |
| Idle Minimum * (dB) | 25 | 23.1 8% | 24 4% | 26 -4% | 31.05 -24% | 24 4% |
| Idle Average * (dB) | 26 | 23.1 11% | 24 8% | 27 -4% | 31.05 -19% | 25 4% |
| Idle Maximum * (dB) | 28 | 26.6 5% | 24 14% | 32 -14% | 31.05 -11% | 28 -0% |
| Load Average * (dB) | 43 | 34.7 19% | 37.71 12% | 53 -23% | 55.66 -29% | 42 2% |
| Witcher 3 ultra * (dB) | 51 | 47.6 7% | 45.75 10% | 56 -10% | 55.7 -9% | 50 2% |
| Load Maximum * (dB) | 53 | 54.8 -3% | 54.55 -3% | 64 -21% | 55.51 -5% | 50 6% |
* ... smaller is better
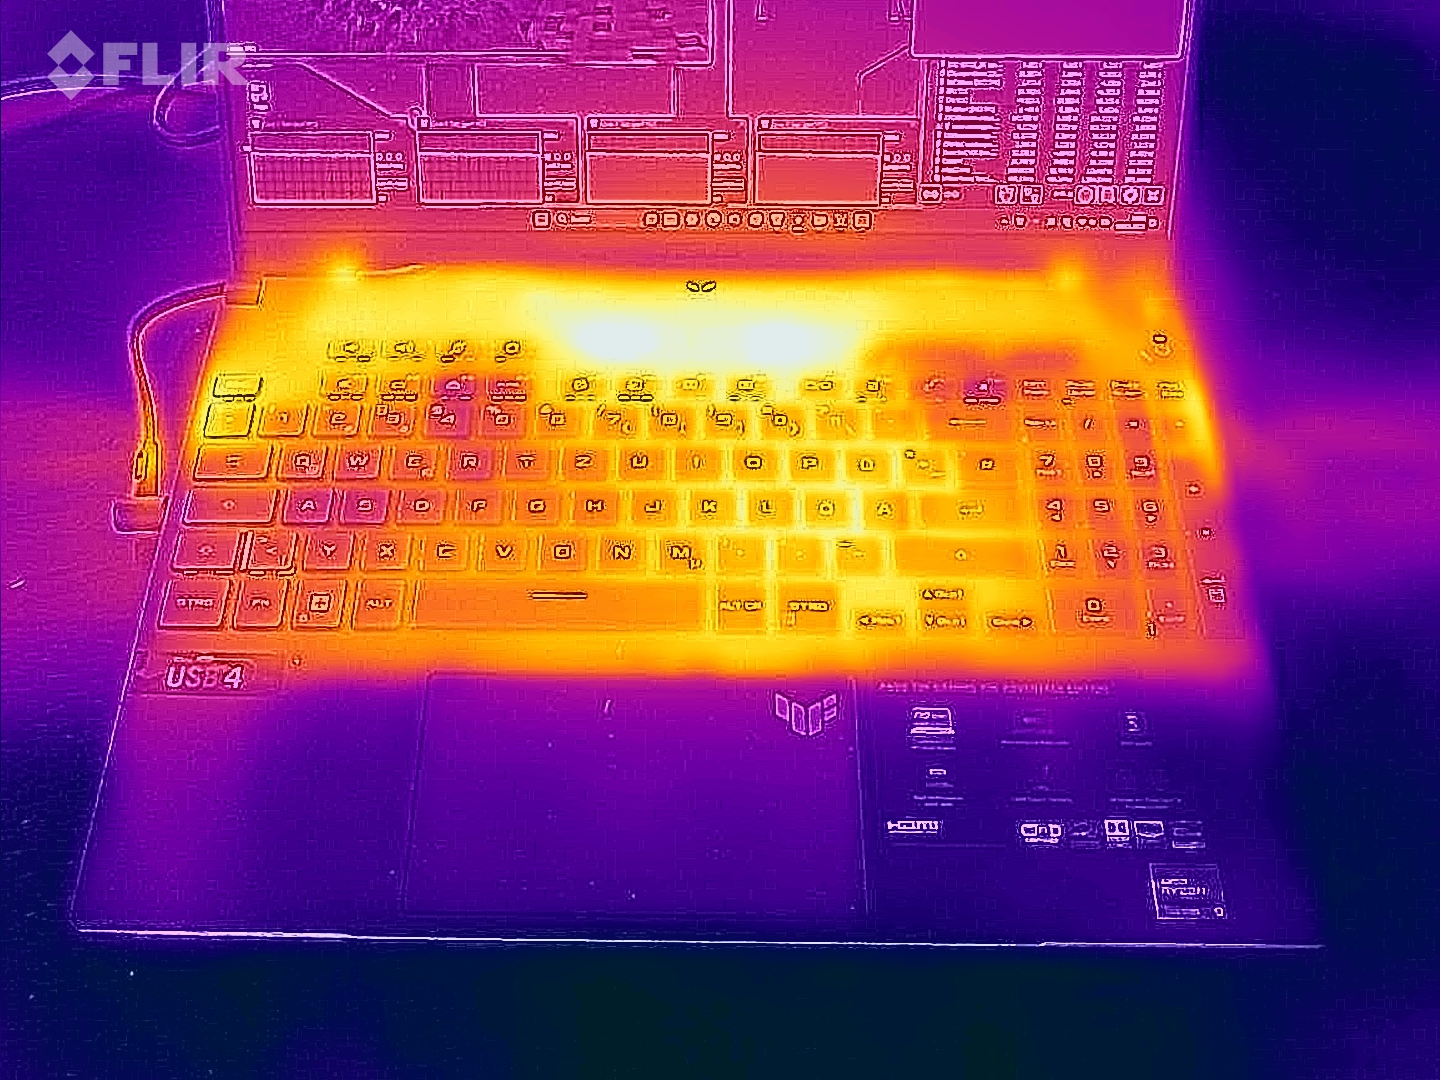
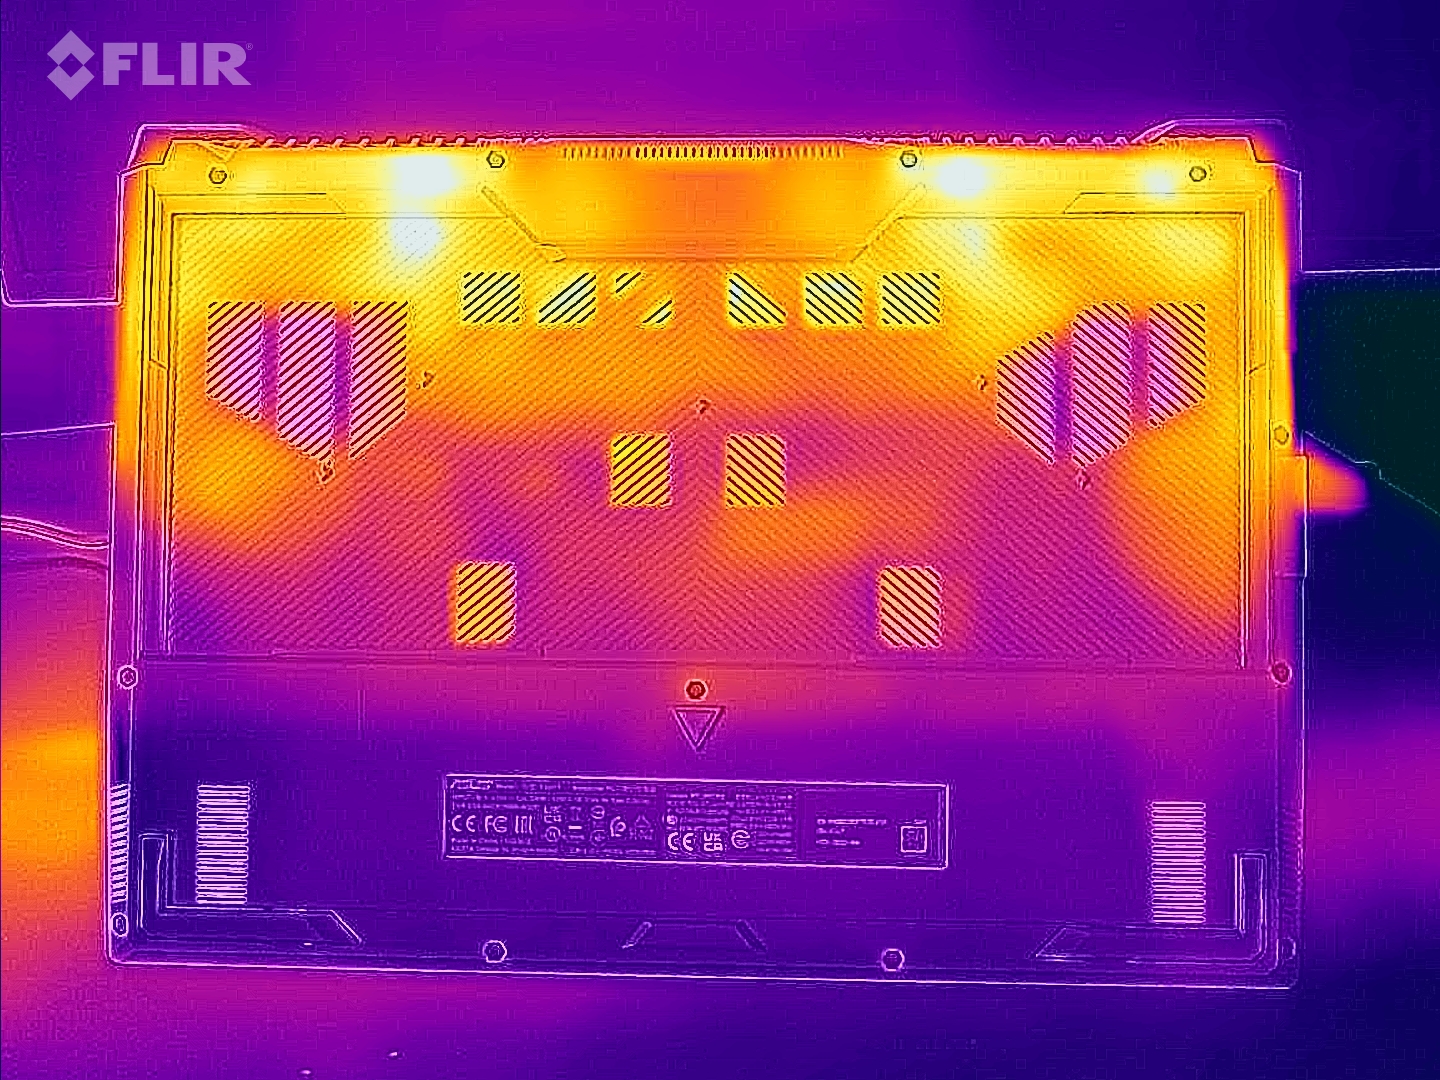
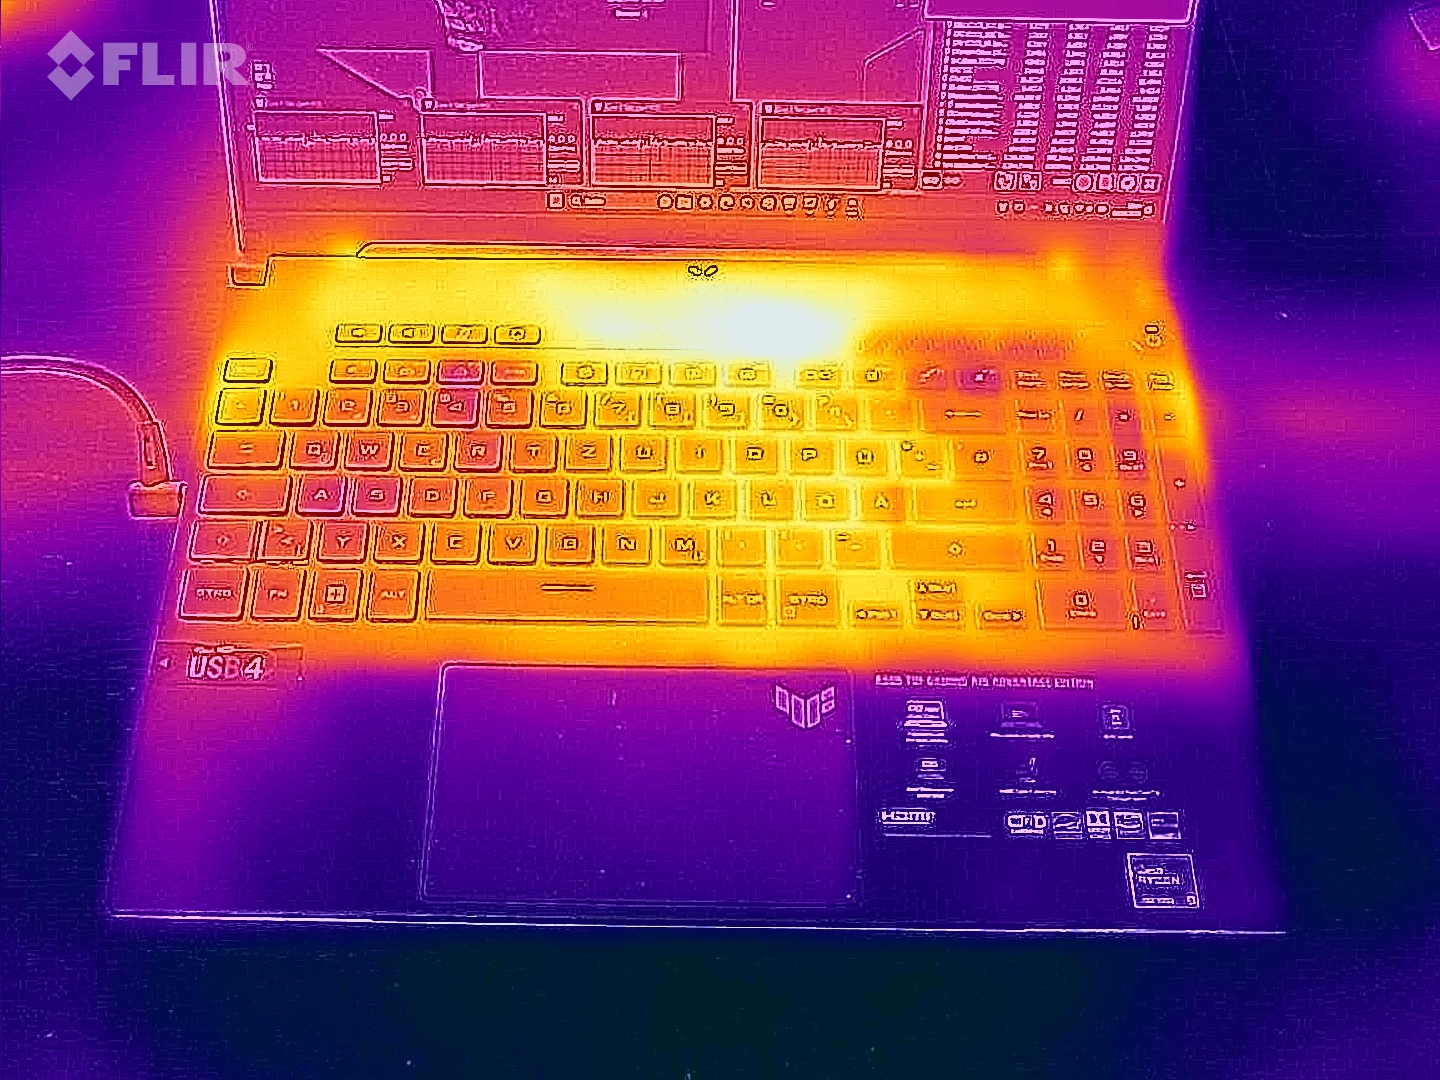
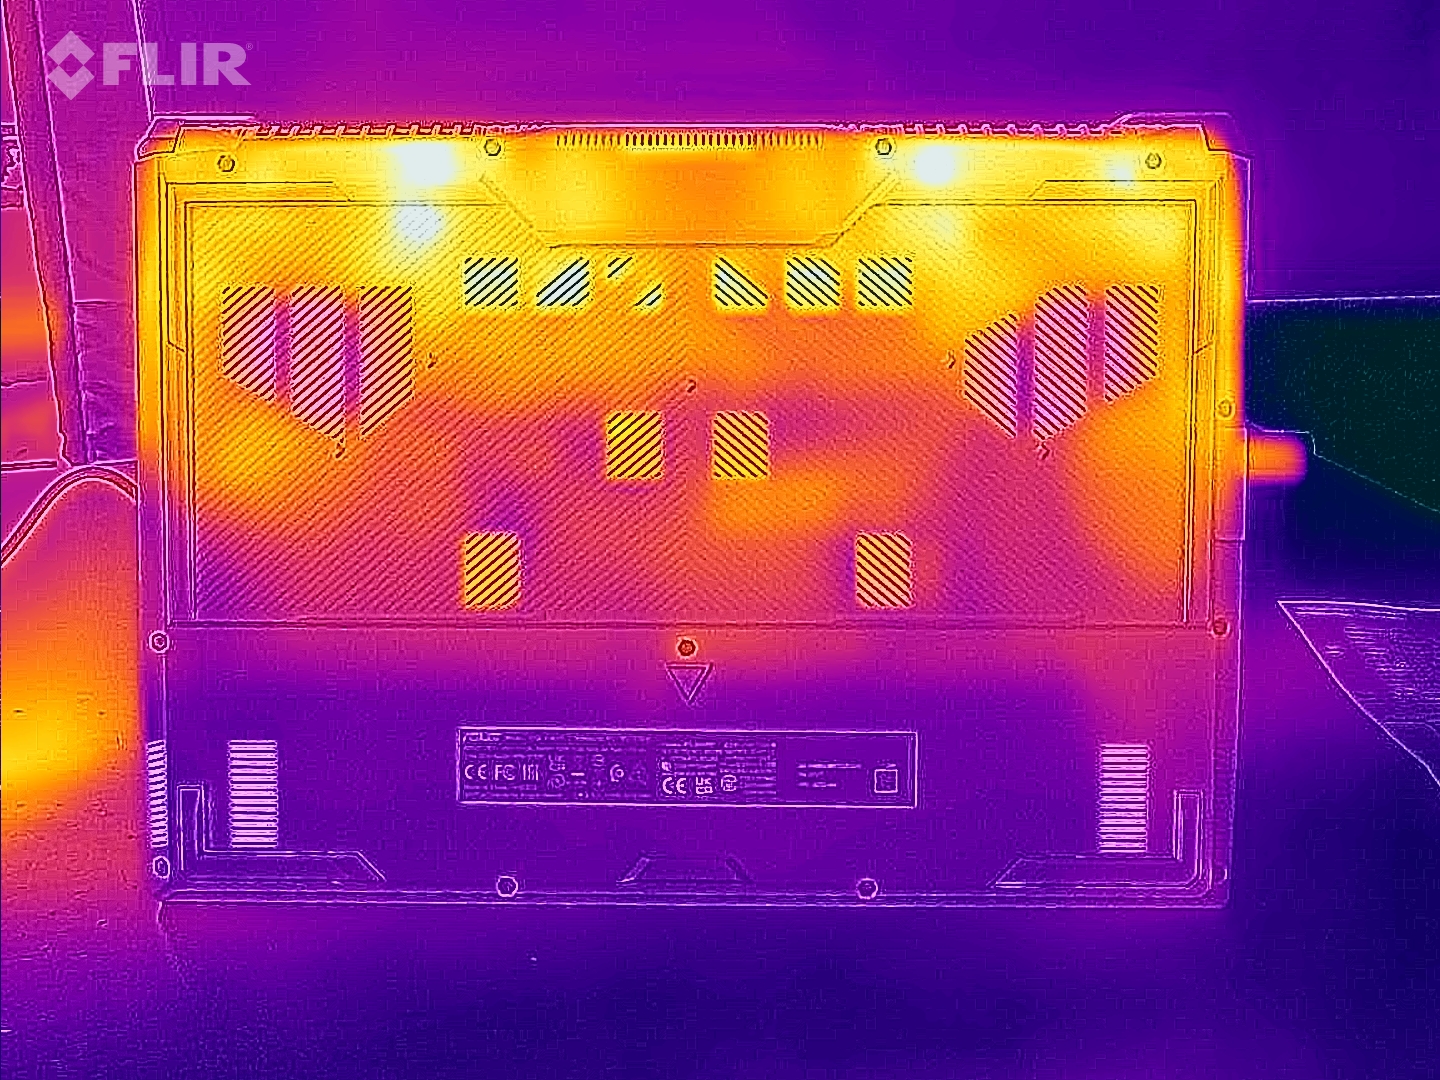
Temperature
The notebook heats up noticeably under load, but not excessively. The temperatures are within a green zone in everyday use. The latter was not the case in the sister model - we assume an error/defect of the device.
(-) The maximum temperature on the upper side is 53 °C / 127 F, compared to the average of 40.4 °C / 105 F, ranging from 21.2 to 68.8 °C for the class Gaming.
(-) The bottom heats up to a maximum of 48 °C / 118 F, compared to the average of 43.3 °C / 110 F
(+) In idle usage, the average temperature for the upper side is 28.8 °C / 84 F, compared to the device average of 33.9 °C / 93 F.
(-) Playing The Witcher 3, the average temperature for the upper side is 40 °C / 104 F, compared to the device average of 33.9 °C / 93 F.
(±) The palmrests and touchpad can get very hot to the touch with a maximum of 38 °C / 100.4 F.
(-) The average temperature of the palmrest area of similar devices was 28.9 °C / 84 F (-9.1 °C / -16.4 F).
| Asus TUF Gaming A16 FA617XS AMD Ryzen 9 7940HS, AMD Radeon RX 7600S | Lenovo Legion Pro 5 16IRX8 Intel Core i7-13700HX, NVIDIA GeForce RTX 4060 Laptop GPU | MSI Katana 15 B12VEK Intel Core i7-12650H, NVIDIA GeForce RTX 4050 Laptop GPU | Medion Erazer Defender P40 Intel Core i7-13700HX, NVIDIA GeForce RTX 4060 Laptop GPU | Gigabyte G5 KE Intel Core i5-12500H, NVIDIA GeForce RTX 3060 Laptop GPU | Asus TUF Gaming A16 FA617 AMD Ryzen 7 7735HS, AMD Radeon RX 7600S | |
|---|---|---|---|---|---|---|
| Heat | 1% | -8% | 9% | -14% | -17% | |
| Maximum Upper Side * (°C) | 53 | 42.8 19% | 47 11% | 42 21% | 52.6 1% | 54 -2% |
| Maximum Bottom * (°C) | 48 | 50 -4% | 48 -0% | 45 6% | 62.4 -30% | 47 2% |
| Idle Upper Side * (°C) | 30 | 29.6 1% | 35 -17% | 28 7% | 33.6 -12% | 40 -33% |
| Idle Bottom * (°C) | 30 | 34 -13% | 38 -27% | 30 -0% | 34.8 -16% | 40 -33% |
* ... smaller is better
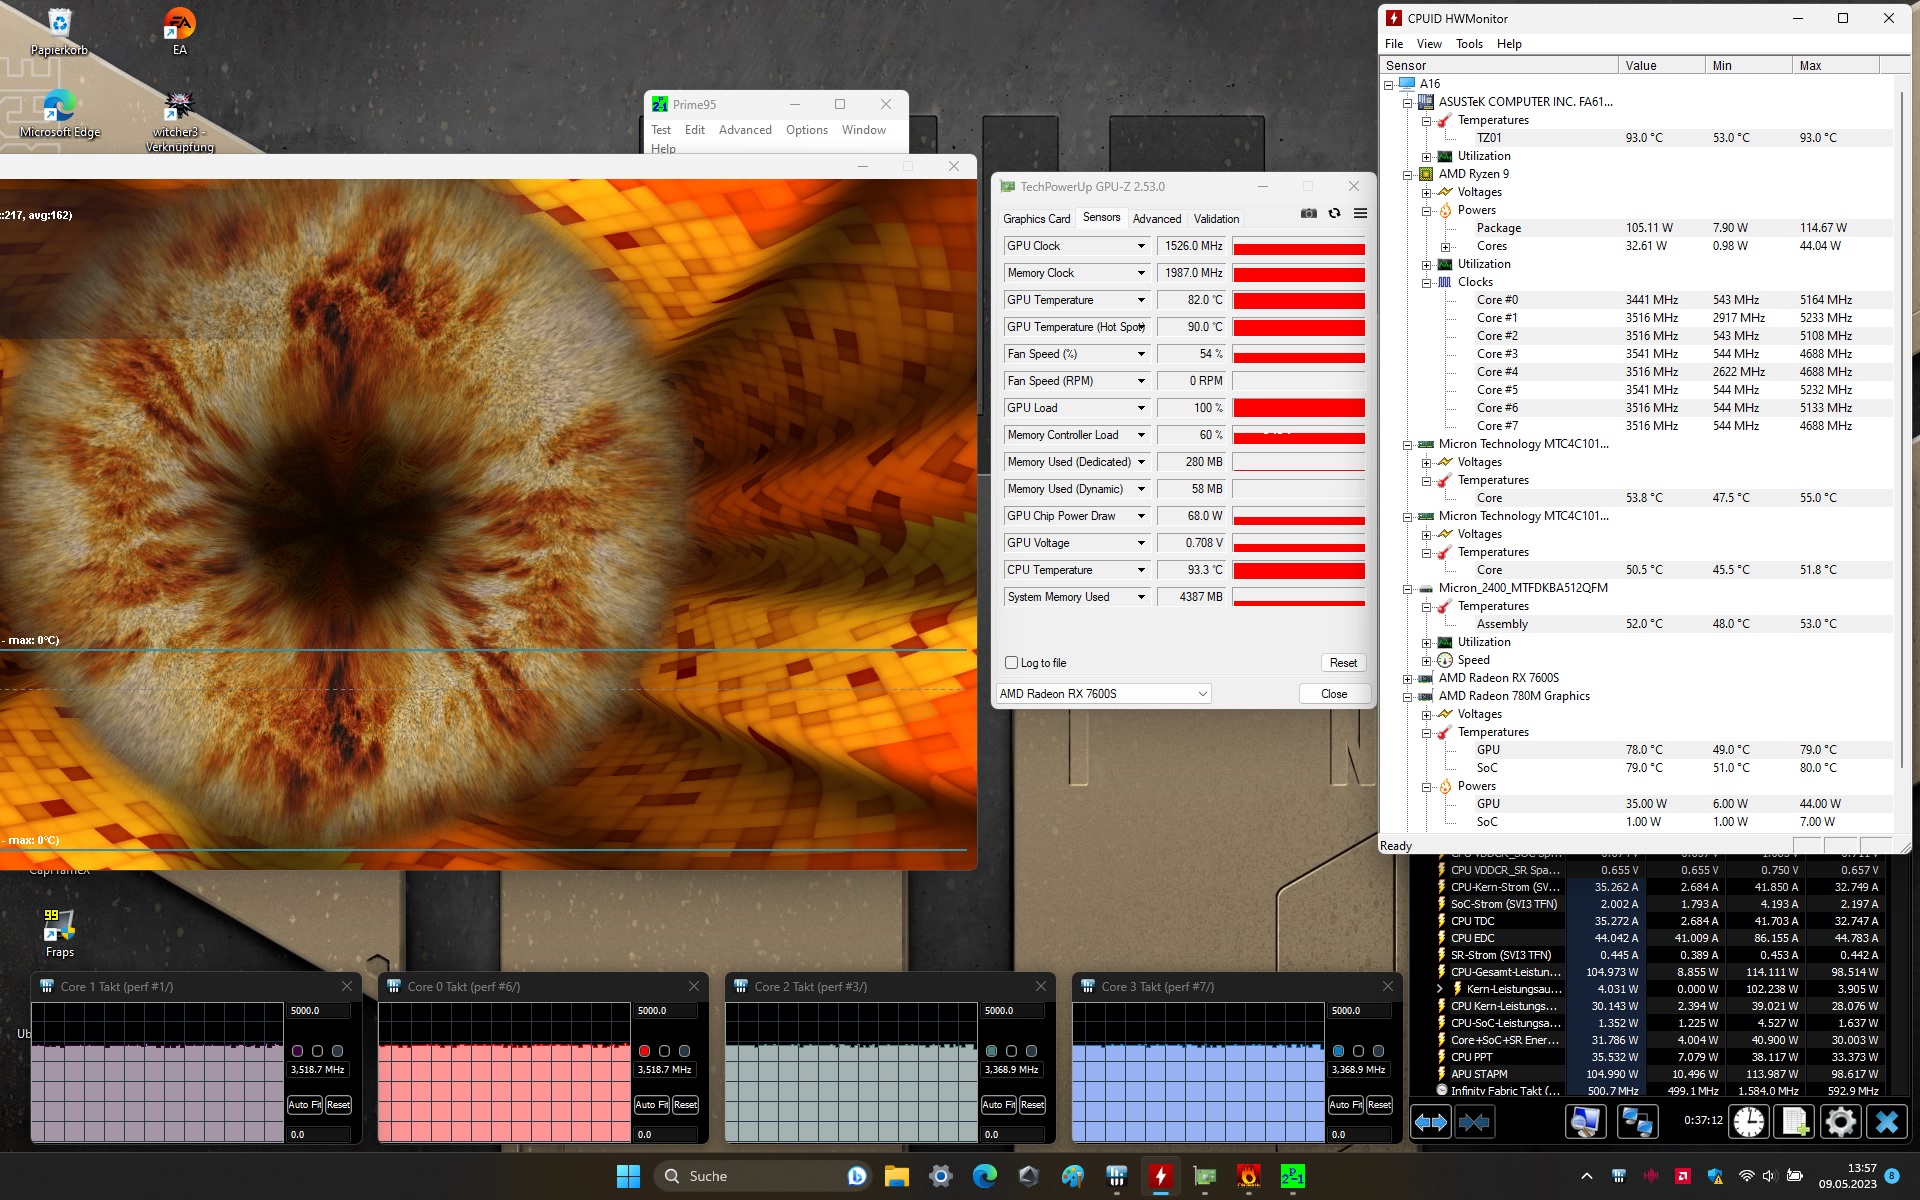
Stress test
The stress test (Prime95 and Furmark in continuous operation) simulates an extreme scenario in order to test the system's stability under full load. CPU (3.4 to 3.5 GHz) and GPU (~1,500 MHz) ran through the test with clock rates below the respective base clock.
Speakers
The stereo speakers produce a decent sound overall.
Asus TUF Gaming A16 FA617XS audio analysis
(±) | speaker loudness is average but good (79 dB)
Bass 100 - 315 Hz
(±) | reduced bass - on average 11.6% lower than median
(±) | linearity of bass is average (7% delta to prev. frequency)
Mids 400 - 2000 Hz
(±) | higher mids - on average 5.7% higher than median
(+) | mids are linear (3.8% delta to prev. frequency)
Highs 2 - 16 kHz
(+) | balanced highs - only 2.6% away from median
(+) | highs are linear (6.5% delta to prev. frequency)
Overall 100 - 16.000 Hz
(±) | linearity of overall sound is average (15.4% difference to median)
Compared to same class
» 34% of all tested devices in this class were better, 7% similar, 59% worse
» The best had a delta of 6%, average was 18%, worst was 132%
Compared to all devices tested
» 22% of all tested devices were better, 4% similar, 74% worse
» The best had a delta of 4%, average was 24%, worst was 134%
Lenovo Legion Pro 5 16IRX8 audio analysis
(±) | speaker loudness is average but good (72.7 dB)
Bass 100 - 315 Hz
(-) | nearly no bass - on average 23.7% lower than median
(±) | linearity of bass is average (10.7% delta to prev. frequency)
Mids 400 - 2000 Hz
(+) | balanced mids - only 3.8% away from median
(±) | linearity of mids is average (7.1% delta to prev. frequency)
Highs 2 - 16 kHz
(+) | balanced highs - only 3.7% away from median
(+) | highs are linear (6.7% delta to prev. frequency)
Overall 100 - 16.000 Hz
(±) | linearity of overall sound is average (21.9% difference to median)
Compared to same class
» 78% of all tested devices in this class were better, 6% similar, 16% worse
» The best had a delta of 6%, average was 18%, worst was 132%
Compared to all devices tested
» 62% of all tested devices were better, 7% similar, 31% worse
» The best had a delta of 4%, average was 24%, worst was 134%
Power management - The gaming laptop with great runtimes
Power consumption
There are no abnormalities in terms of power consumption. The rates are on a normal level for the installed hardware. The stress test and Witcher 3 test were run with constant power consumption. The power supply (240 watts) is more than sufficiently sized.
| Off / Standby | |
| Idle | |
| Load |
|
Key:
min: | |
| Asus TUF Gaming A16 FA617XS R9 7940HS, Radeon RX 7600S | Lenovo Legion Pro 5 16IRX8 i7-13700HX, GeForce RTX 4060 Laptop GPU | MSI Katana 15 B12VEK i7-12650H, GeForce RTX 4050 Laptop GPU | Medion Erazer Defender P40 i7-13700HX, GeForce RTX 4060 Laptop GPU | Gigabyte G5 KE i5-12500H, GeForce RTX 3060 Laptop GPU | Asus TUF Gaming A16 FA617 R7 7735HS, Radeon RX 7600S | Average AMD Radeon RX 7600S | Average of class Gaming | |
|---|---|---|---|---|---|---|---|---|
| Power Consumption | -107% | 2% | -25% | -16% | -7% | -4% | -69% | |
| Idle Minimum * (Watt) | 7 | 24.5 -250% | 8.5 -21% | 8 -14% | 7.66 -9% | 8 -14% | 7.5 ? -7% | 13.6 ? -94% |
| Idle Average * (Watt) | 10 | 29.2 -192% | 10.2 -2% | 12 -20% | 10.3 -3% | 11 -10% | 10.5 ? -5% | 19.5 ? -95% |
| Idle Maximum * (Watt) | 15 | 34.3 -129% | 11.3 25% | 18 -20% | 16.05 -7% | 16 -7% | 15.5 ? -3% | 26.1 ? -74% |
| Load Average * (Watt) | 86 | 98.7 -15% | 84 2% | 101 -17% | 115.8 -35% | 97 -13% | 91.5 ? -6% | 110.9 ? -29% |
| Witcher 3 ultra * (Watt) | 160.6 | 178.6 -11% | 128 20% | 180.8 -13% | 168.7 -5% | 161.5 -1% | ||
| Load Maximum * (Watt) | 172 | 249.6 -45% | 189 -10% | 284 -65% | 234.6 -36% | 168 2% | 170 ? 1% | 262 ? -52% |
* ... smaller is better
power consumption Witcher 3 / stress test
power consumption with external monitor
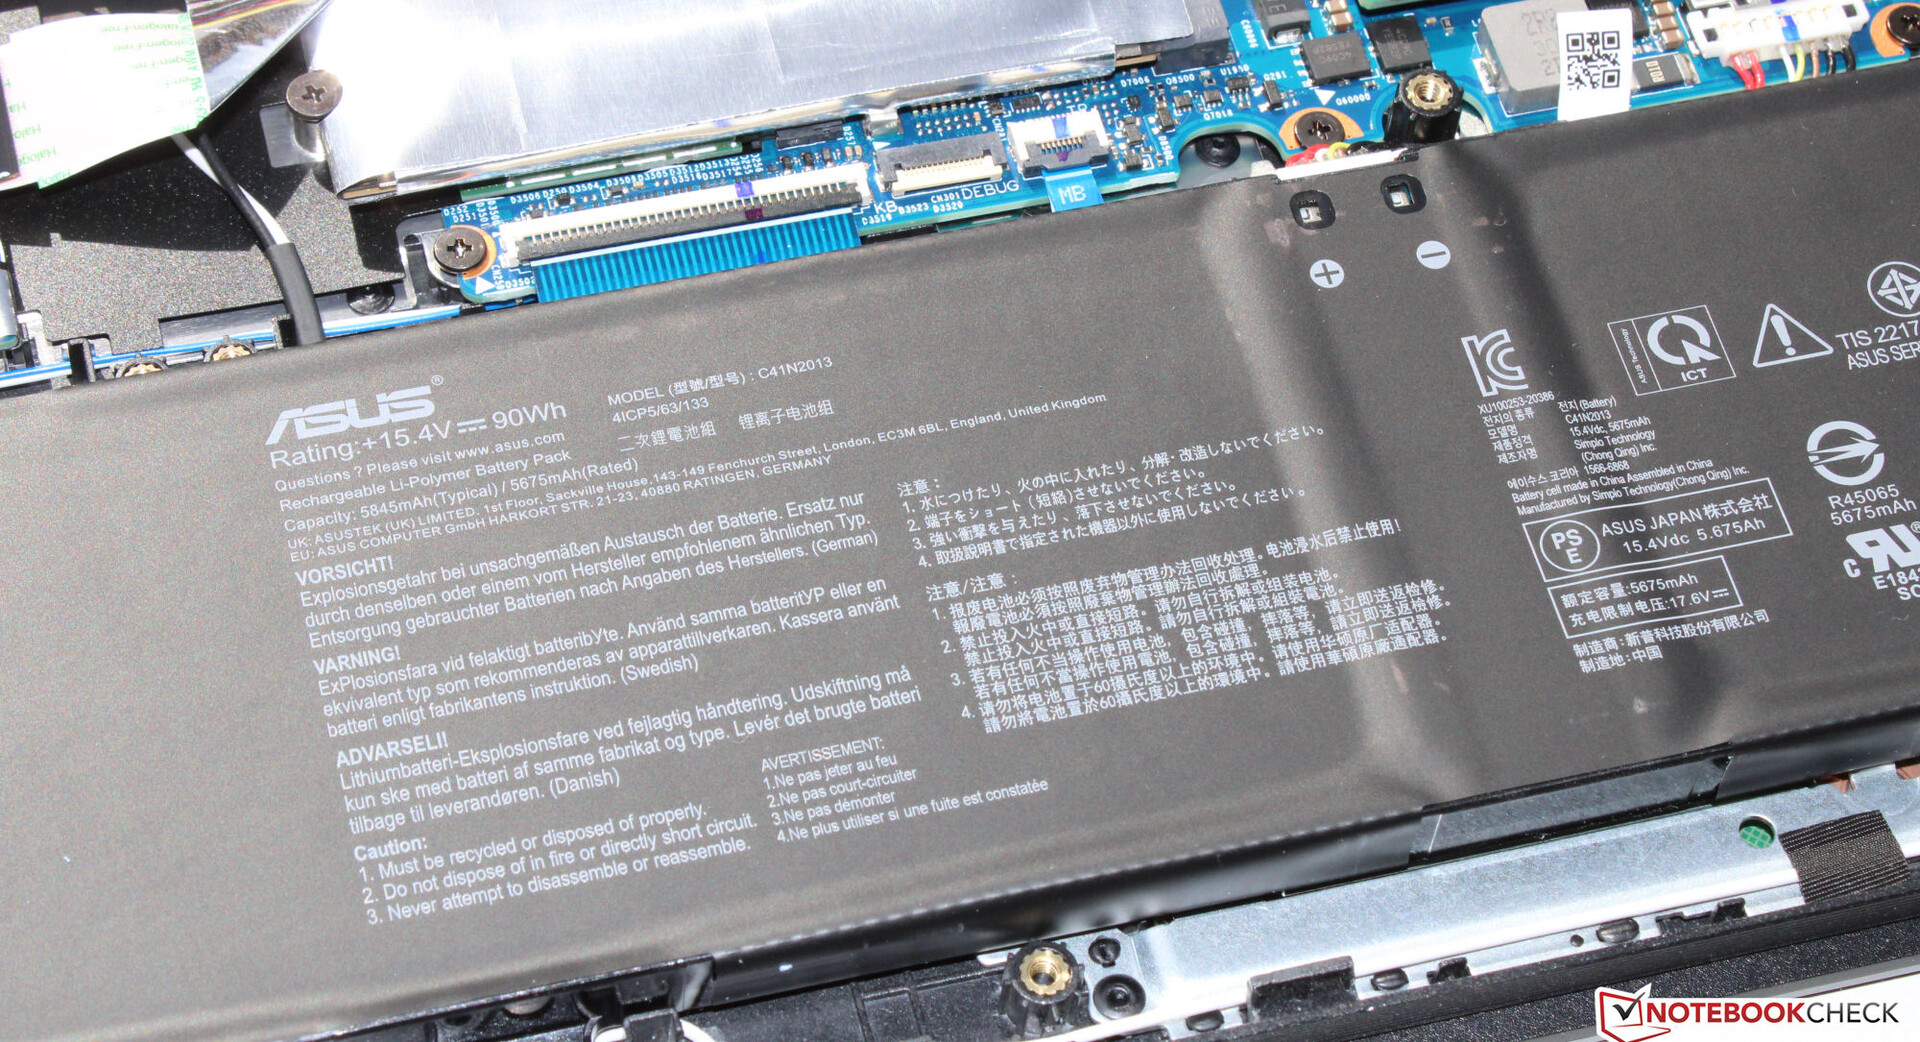
Battery life
The 16-inch device achieved runtimes of 12:25 h and 12:26 h in our WLAN test (calling up websites via a script) and video test (short movie Big Buck Bunny (H.264 encoding, FHD) in a loop), respectively. During both tests, the laptop's energy-saving features were disabled and the display brightness was set to about 150 cd/m². The wireless modules were also disabled for the video test
The FA617 delivered excellent runtimes and left the competition in the dust. The combination of a frugal APU and large battery capacity definitely pays off here.
| Asus TUF Gaming A16 FA617XS R9 7940HS, Radeon RX 7600S, 90 Wh | Lenovo Legion Pro 5 16IRX8 i7-13700HX, GeForce RTX 4060 Laptop GPU, 80 Wh | MSI Katana 15 B12VEK i7-12650H, GeForce RTX 4050 Laptop GPU, 53.5 Wh | Medion Erazer Defender P40 i7-13700HX, GeForce RTX 4060 Laptop GPU, 73 Wh | Gigabyte G5 KE i5-12500H, GeForce RTX 3060 Laptop GPU, 54 Wh | Asus TUF Gaming A16 FA617 R7 7735HS, Radeon RX 7600S, 90 Wh | Average of class Gaming | |
|---|---|---|---|---|---|---|---|
| Battery runtime | -54% | -21% | -29% | -42% | 22% | -18% | |
| Reader / Idle (h) | 20.3 | 6.7 -67% | 8.8 -57% | 20.2 0% | 9.99 ? -51% | ||
| H.264 (h) | 12.4 | 4.4 -65% | 5.7 -54% | 2.2 -82% | 8.1 ? -35% | ||
| WiFi v1.3 (h) | 12.4 | 3.4 -73% | 4.3 -65% | 6.2 -50% | 5.7 -54% | 12.1 -2% | 6.76 ? -45% |
| Load (h) | 0.9 | 0.7 -22% | 1.5 67% | 1.3 44% | 1 11% | 1.5 67% | 1.435 ? 59% |
| Witcher 3 ultra (h) | 1.3 | 0.958 ? |
Pros
Cons
Verdict - The Asus laptop with (too) little storage
The A16 is set up for WUXGA gaming at high to maximum settings, but it should be useful in many other fields such as video editing and rendering. An AMD team consisting of a Ryzen 9 7940HS and Radeon RX 7600S provide the laptop with its necessary performance. Both components run with consistently high clock rates.
The Asus TUF Gaming A16 Advantage Edition is a well-rounded mid-range gaming laptop whose impressive battery runtimes are its pride and joy.
Compared to the Ryzen-7-7735HS APU found in its sister model, the 7940HS-APU has considerably better CPU performance to offer despite it having the same number of cores and the same power limits. Here, its modern architecture (Zen 4 vs. Zen 3+) and higher clock rates make themselves known.
The device's amazing runtimes are certainly its unique selling point: Its practical measurements of around 12.5 h are generally not achieved by many other office laptops. A positive: The battery can be charged using a USB-C power supply (min. 65 watts, 20 V) - one USB-C port supports Power Delivery. The proprietary power supply wouldn't necessarily have to be carried around with you.
The installed IPS display (16 inches, 1,920 x 1,200 pixels) has a work-friendly ratio of 16:10 and generally left a good impression on us - if anything, the brightness could do with being a little stronger. The installed entry-level SSD would be perfectly suited for a simple office laptop - but not for a $1,700 gaming laptop. The offered storage (512 GB) and data neither live up to users' requirements nor does it live up to their expectations.
The Legion Pro 5 16IRX8 could be a suitable alternative. It features better performance and a brighter screen than the A16 - but it clearly doesn't have the same impressive runtimes to offer. The Gigabyte G5 KE could be a good budget alternative: You get a similar level of graphics performance for a much smaller price. Although: This laptop doesn't come with a Windows operating system pre-installed.
Price and availability
The version of the A16 with 16 GB RAM and a 512 GB SSD can be purchased on Asus' website for around $1,371.
Asus TUF Gaming A16 FA617XS
- 06/05/2023 v7 (old)
Sascha Mölck
Transparency
The selection of devices to be reviewed is made by our editorial team. The test sample was provided to the author as a loan by the manufacturer or retailer for the purpose of this review. The lender had no influence on this review, nor did the manufacturer receive a copy of this review before publication. There was no obligation to publish this review. As an independent media company, Notebookcheck is not subjected to the authority of manufacturers, retailers or publishers.
This is how Notebookcheck is testing
Every year, Notebookcheck independently reviews hundreds of laptops and smartphones using standardized procedures to ensure that all results are comparable. We have continuously developed our test methods for around 20 years and set industry standards in the process. In our test labs, high-quality measuring equipment is utilized by experienced technicians and editors. These tests involve a multi-stage validation process. Our complex rating system is based on hundreds of well-founded measurements and benchmarks, which maintains objectivity. Further information on our test methods can be found here.
Price comparison

