Notebookcheck Logo

Intel Core i9-11900H vs Apple M3 Pro 12-Core vs Intel Core i7-11850H

Intel Core i9-11900H

► remove from comparison Intel i9-11900H

The Intel Core i9-11900H is a high end octa core SoC for gaming laptops and mobile workstations. It is based on the Tiger Lake H45 generation and was announced in mid 2021. It integrates eight Willow Cove processor cores (16 threads thanks to HyperThreading). The base clock speed depends on the TDP setting and at 45 Watt is at 2.5 GHz. The single core boost speed can reach up to 4.9 GHz, all cores can reach up to 4.5 GHz. The CPU offers 24 MB level 3 cache and supports DDR4-3200 memory. 

Thanks to the new Tiger Lake architecture, the i9-11900H should be similar or faster than the old Intel Core i9-10885H (Comet Lake-H, 2.4 - 5.3 GHz, 16 MB L3) in single and multi threaded performance and similar to the Ryzen 9 5800H (Zen 3, 3.2 - 4.4 GHz, 16 MB L3). Therefore, the i9 should be one of the fastest laptop CPUs in 2021 and well suited for even very demanding tasks.

The SoC also included the improved Xe graphics card called UHD graphics with all 32 EUs.

Furthermore, Tiger Lake SoCs add PCIe 4 support (20 lanes in the H45 series), AI hardware acceleration, and the partial integration of Thunderbolt 4/USB 4 and Wi-Fi 6E in the chip.

The chip is produced on the improved 10nm process (called 10nm SuperFin) at Intel, which should be comparable to the 7nm process at TSMC (e.g. Ryzen 4000 series). The default TDP is rated at 45 W at 2.5 GHz base speed, at 35 Watt the base clock speed decreases to 2.1 GHz (cTDP down).

All articles on Tiger Lake can be found on our Tiger Lake architecture hub.

Apple M3 Pro 12-Core

► remove from comparison Apple Apple M3 Pro 12-Core

The Apple M3 Pro (12 Core) is a system on a chip (SoC) from Apple for notebooks that was launched in late 2023. It integrates a new 12-core CPU with 6 performance cores with up to 4.06 GHz and 6 efficiency cores with 2.8 GHz. There is also a slimmed-down 11-core variant with a 14-core GPU.

Compared to the M2 Pro the M3 Pro has been slimmed down somewhat and swaps two performance cores for efficiency cores. This is due to the changed core configuration, as 6 cores are now used per cluster (the M2 Pro and M3 still have 4 cores per cluster). Furthermore, the memory bus has been reduced from 256 bits to 192 bits (150 GB/s vs. 200 GB/s). However, thanks to the new architecture and higher clock rates, the new M3 Pro is still slightly faster.

The M3 Pro also integrates a new graphics card with dynamic caching, mesh shading and ray tracing acceleration via hardware. In the top model, all 18 cores of the chip are used and support up to 3 displays simultaneously (internal and 2 external).

GPU and CPU can jointly access the shared memory on the package (unified memory). This is available in 18 or 36 GB variants and offers 150 GB/s maximum bandwidth (192 bit bus).

The integrated 16-core Neural Engine has also been revised and now offers 18 TOPS peak performance (compared to 15.8 TOPS in the M2 but 35 TOPS in the new A17 Pro). The video engine now also supports AV1 decoding in hardware. H.264, HEVC and ProRes (RAW) can still be decoded and encoded.

Unfortunately, the integrated WLAN only continues to support WiFi 6E (no WiFi 7), unlike the small M3 SoC thunderbolt 4 is also supported (max 40 Gbit/s).

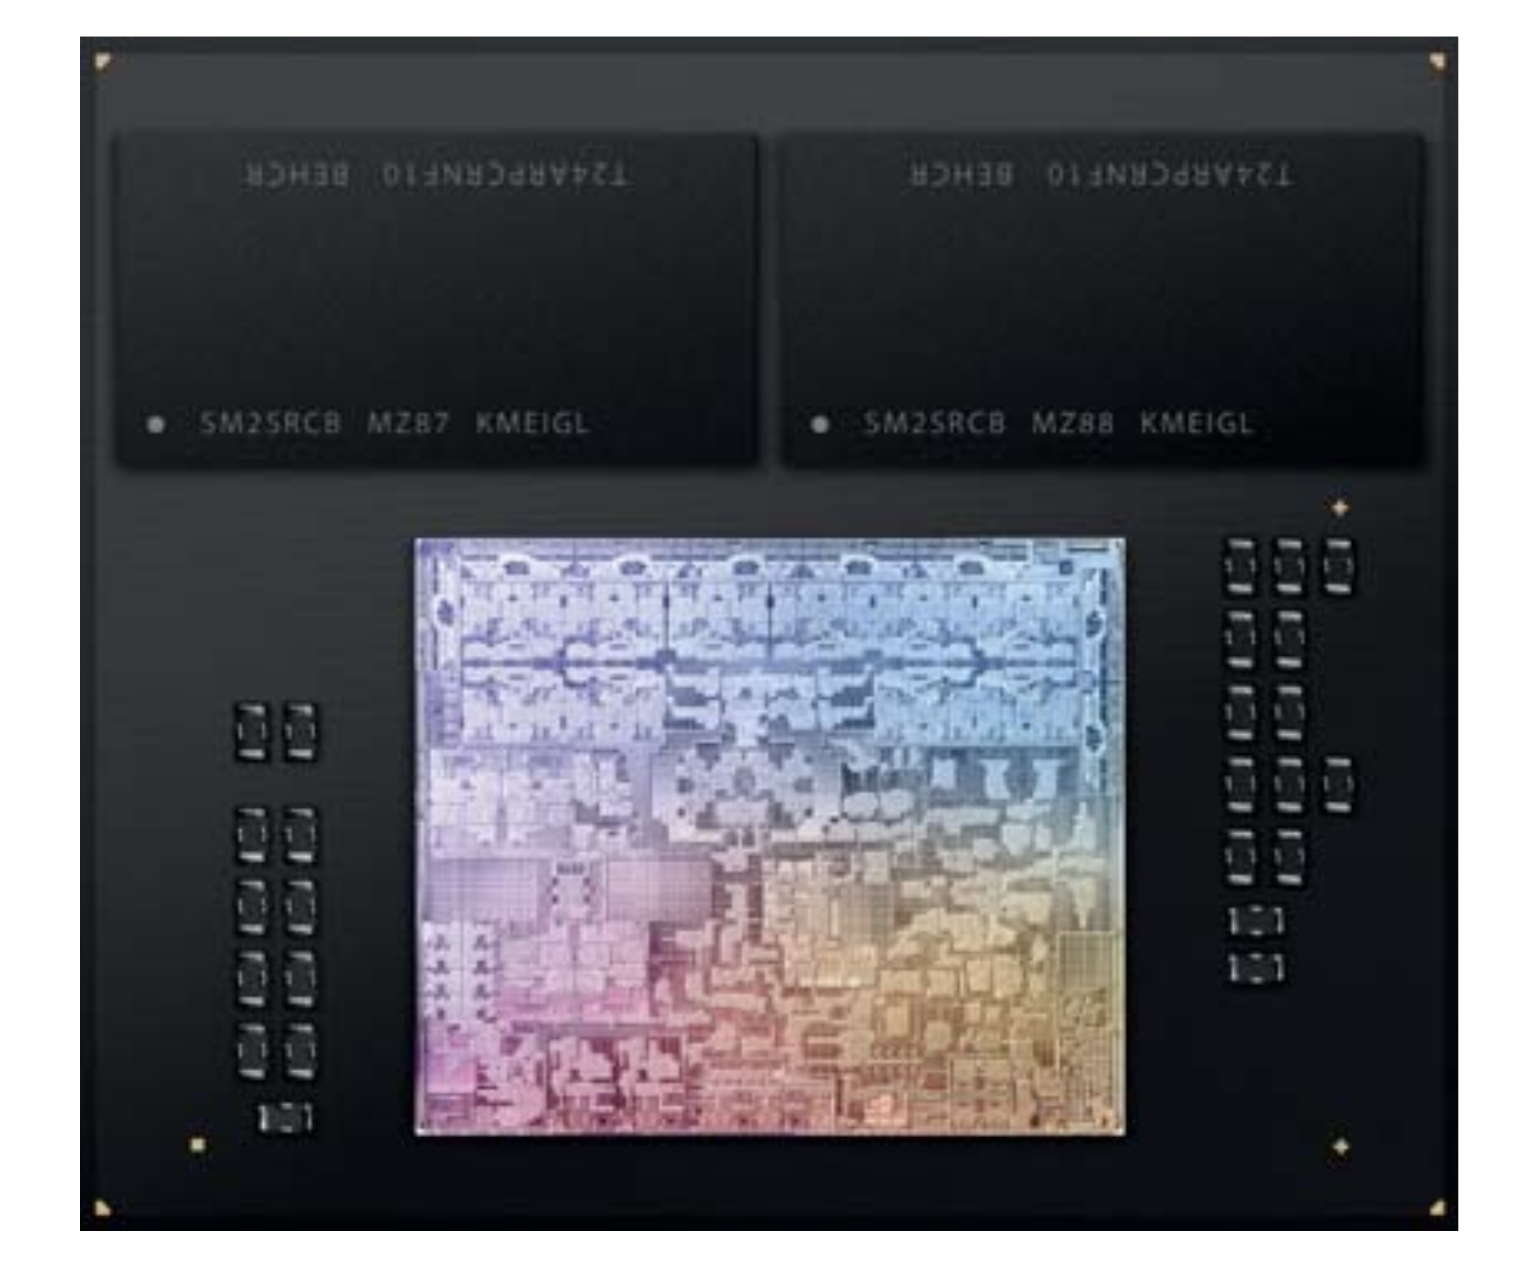
The chip is manufactured in the current 3nm process (N3B) at TSMC and contains 37 billion transistors (-7.5% vs. Apple M2 Pro).

Intel Core i7-11850H

► remove from comparison Intel i7-11850H

The Intel Core i7-11800H is a high end octa core SoC for gaming laptops and mobile workstations. It is based on the Tiger Lake H45 generation and will be announced in mid 2021. It integrates eight Willow Cove processor cores (16 threads thanks to HyperThreading). The base clock speed depends on the TDP setting and at 45 Watt is at 2.4 GHz. The single core boost speed can reach up to 4.6 GHz, all cores can reach up to 4.2 GHz. The CPU offers 24 MB level 3 cache and supports DDR4-3200 memory. Compared to the slower clocked i7-11800H, the 11850H offers professional management features like Intel vPro, SIPP or TXT.

Thanks to the new Tiger Lake architecture, the i9-11850H should be similar or faster than the old Intel Core i9-10875H (Comet Lake-H, 2.3 - 5.1 GHz, 16 MB L3) in single and multi threaded performance and similar to the Ryzen 9 5800H (Zen 3, 3.2 - 4.4 GHz, 16 MB L3). Therefore, the i7 is well suited for even very demanding tasks.

The SoC also includes the improved Xe graphics card called UHD graphics with all 32 EUs.

Furthermore, Tiger Lake SoCs add PCIe 4 support (20 lanes in the H45 series), AI hardware acceleration, and the partial integration of Thunderbolt 4/USB 4 and Wi-Fi 6E in the chip.

The chip is produced on the improved 10nm process (called 10nm SuperFin) at Intel, which should be comparable to the 7nm process at TSMC (e.g. Ryzen 4000 series). The default TDP is rated at 45 W at 2.4 GHz base speed, at 35 Watt the base clock speed decreases to 2 GHz (cTDP down).

All articles on Tiger Lake can be found on our Tiger Lake architecture hub.

ModelIntel Core i9-11900HApple M3 Pro 12-CoreIntel Core i7-11850H
SeriesIntel Tiger LakeApple Apple M3Intel Tiger Lake
CodenameTiger Lake-HTiger Lake-H
Series: Tiger Lake Tiger Lake-H
Intel Core i9-11900KB3.3 - 5.3 GHz8 / 16 cores24 MB L3
Intel Core i9-11900H « 2.5 - 4.9 GHz8 / 16 cores24 MB L3
Intel Core i9-11950H2.6 - 5 GHz8 / 16 cores24 MB L3
Intel Xeon W-11955M2.6 - 5 GHz8 / 16 cores24 MB L3
Intel Core i7-11850H2.5 - 4.8 GHz8 / 16 cores24 MB L3
Intel Core i7-11800H2.3 - 4.6 GHz8 / 16 cores24 MB L3
Intel Xeon W-11855M3.2 - 4.9 GHz6 / 12 cores18 MB L3
Intel Core i5-11500B3.3 - 4.6 GHz6 / 12 cores12 MB L3
Intel Core i5-11400H2.7 - 4.5 GHz6 / 12 cores12 MB L3
Intel Core i5-11260H2.6 - 4.4 GHz6 / 12 cores12 MB L3
Apple M3 Max 16-Core2.75 - 4.06 GHz16 / 16 cores
Apple M3 Max 14-Core2.75 - 4.06 GHz14 / 14 cores
Apple M3 Pro 12-Core « 2.75 - 4.06 GHz12 / 12 cores
Apple M3 Pro 11-Core2.75 - 4.06 GHz11 / 11 cores
Apple M32.75 - 4.06 GHz8 / 8 cores
Intel Core i9-11900KB3.3 - 5.3 GHz8 / 16 cores24 MB L3
Intel Core i9-11900H2.5 - 4.9 GHz8 / 16 cores24 MB L3
Intel Core i9-11950H2.6 - 5 GHz8 / 16 cores24 MB L3
Intel Xeon W-11955M2.6 - 5 GHz8 / 16 cores24 MB L3
Intel Core i7-11850H « 2.5 - 4.8 GHz8 / 16 cores24 MB L3
Intel Core i7-11800H2.3 - 4.6 GHz8 / 16 cores24 MB L3
Intel Xeon W-11855M3.2 - 4.9 GHz6 / 12 cores18 MB L3
Intel Core i5-11500B3.3 - 4.6 GHz6 / 12 cores12 MB L3
Intel Core i5-11400H2.7 - 4.5 GHz6 / 12 cores12 MB L3
Intel Core i5-11260H2.6 - 4.4 GHz6 / 12 cores12 MB L3
Clock2500 - 4900 MHz2748 - 4056 MHz2500 - 4800 MHz
L1 Cache640 KB640 KB
L2 Cache10 MB10 MB
L3 Cache24 MB24 MB
Cores / Threads8 / 1612 / 12
6 x 4.1 GHz Apple M3 P-Core
6 x 2.7 GHz Apple M3 E-Core
8 / 16
TDP45 Watt27 Watt45 Watt
Technology10 nm3 nm10 nm
max. Temp.100 °C100 °C
SocketBGA1787BGA1787
FeaturesDDR4-3200 RAM, PCIe 4, 8 GT/s bus, DL Boost, GNA, RPE, MMX, SSE, SSE2, SSE3, SSSE3, SSE4.1, SSE4.2, AVX, AVX2, AVX-512, BMI2, ABM, FMA, ADX, VMX, SMEP, SMAP, EIST, TM1, TM2, HT, Turbo, SST, AES-NI, RDRAND, RDSEED, SHAARMv8 Instruction SetDDR4-3200 RAM, PCIe 4, 8 GT/s bus, DL Boost, GNA, vPro, MMX, SSE, SSE2, SSE3, SSSE3, SSE4.1, SSE4.2, AVX, AVX2, AVX-512, BMI2, ABM, FMA, ADX, SMX, SMEP, SMAP, EIST, TM1, TM2, HT, Turbo, SST, AES-NI, RDRAND, RDSEED, SHA, TME
iGPUIntel UHD Graphics Xe 32EUs (Tiger Lake-H) (350 - 1450 MHz)Apple M3 Pro 18-Core GPUIntel UHD Graphics Xe 32EUs (Tiger Lake-H) (350 - 1450 MHz)
Architecturex86ARMx86
Announced
Manufacturerark.intel.comwww.apple.comark.intel.com
Transistors37000 Million

Benchmarks

Performance Rating - CB R15 + R20 + 7-Zip + X265 + Blender + 3DM11 CPU - i9-11900H
40.5 pt (56%)
Performance Rating - CB R15 + R20 + 7-Zip + X265 + Blender + 3DM11 CPU - i7-11850H
39.1 pt (54%)
Cinebench 2024 - CB24 CPU Single Core
143 Points (99%)
Cinebench 2024 - CB24 CPU Multi Core
1059 Points (20%)
Cinebench R23 - Cinebench R23 Multi Core
min: 11135     avg: 12109     median: 12143.5 (11%)     max: 13012 Points
15106 Points (14%)
min: 9779     avg: 10857     median: 10857 (10%)     max: 11935 Points
Cinebench R23 - Cinebench R23 Single Core
min: 1574     avg: 1585     median: 1580.5 (67%)     max: 1605 Points
1977 Points (84%)
min: 1513     avg: 1533     median: 1532.5 (65%)     max: 1552 Points
Cinebench R20 - Cinebench R20 CPU (Single Core)
min: 600     avg: 607     median: 608 (68%)     max: 615 Points
min: 583     avg: 595     median: 595 (66%)     max: 607 Points
Cinebench R20 - Cinebench R20 CPU (Multi Core)
min: 4324     avg: 4758     median: 4878 (12%)     max: 5160 Points
min: 3826     avg: 4245     median: 4244.5 (10%)     max: 4663 Points
Cinebench R15 - Cinebench R15 CPU Multi 64 Bit
min: 1770     avg: 2068     median: 2148 (14%)     max: 2211 Points
2163 Points (14%)
min: 1547     avg: 1768     median: 1767.5 (11%)     max: 1988 Points
Cinebench R15 - Cinebench R15 CPU Single 64 Bit
min: 236     avg: 239.8     median: 241 (73%)     max: 243 Points
min: 232     avg: 232.5     median: 232.5 (70%)     max: 233 Points
7-Zip 18.03 - 7-Zip 18.03 Multli Thread 4 runs
min: 49486     avg: 52910     median: 53205 (31%)     max: 57263 MIPS
min: 44890     avg: 47721     median: 47721 (27%)     max: 50552 MIPS
7-Zip 18.03 - 7-Zip 18.03 Single Thread 4 runs
min: 5582     avg: 5781     median: 5795 (69%)     max: 6018 MIPS
min: 5727     avg: 5745     median: 5744.5 (69%)     max: 5762 MIPS
HWBOT x265 Benchmark v2.2 - HWBOT x265 4k Preset
min: 13.6     avg: 15     median: 15 (26%)     max: 16.7 fps
min: 12.6     avg: 13.5     median: 13.5 (24%)     max: 14.4 fps
Blender - Blender 3.3 Classroom CPU *
479 Seconds (6%)
314 Seconds (4%)
Blender - Blender 2.79 BMW27 CPU *
min: 231     avg: 247     median: 243 (2%)     max: 270 Seconds
327 Seconds (2%)
min: 257     avg: 285     median: 285 (2%)     max: 313 Seconds
R Benchmark 2.5 - R Benchmark 2.5 *
min: 0.52     avg: 0.5     median: 0.5 (11%)     max: 0.544 sec
min: 0.541     avg: 0.5     median: 0.5 (12%)     max: 0.543 sec
3DMark 11 - 3DM11 Performance Physics
min: 14467     avg: 17623     median: 18686 (51%)     max: 19231 Points
min: 15788     avg: 16156     median: 16156 (44%)     max: 16524 Points
3DMark - 3DMark Cloud Gate Physics
min: 13550     avg: 15637     median: 16364 (41%)     max: 17649 Points
14425 Points (36%)
3DMark - 3DMark Fire Strike Standard Physics
min: 21513     avg: 24434     median: 24867 (44%)     max: 26502 Points
min: 19959     avg: 19972     median: 19972 (36%)     max: 19985 Points
3DMark - 3DMark Time Spy CPU
min: 9050     avg: 9865     median: 9631.5 (41%)     max: 11145 Points
min: 5654     avg: 7159     median: 7159 (30%)     max: 8664 Points
Geekbench 6.2 - Geekbench 6.2 Single-Core
2355 Points (63%)
3138 Points (84%)
Geekbench 6.2 - Geekbench 6.2 Multi-Core
9401 Points (37%)
15480 Points (61%)
Geekbench 5.5 - Geekbench 5.1 - 5.4 64 Bit Single-Core
min: 1576     avg: 1634     median: 1632 (69%)     max: 1692 Points
2327 Points (98%)
min: 1659     avg: 1673     median: 1672.5 (71%)     max: 1686 Points
Geekbench 5.5 - Geekbench 5.1 - 5.4 64 Bit Multi-Core
min: 7725     avg: 9140     median: 9628 (17%)     max: 9856 Points
15298 Points (27%)
min: 9049     avg: 9250     median: 9250 (17%)     max: 9451 Points
Mozilla Kraken 1.1 - Kraken 1.1 Total Score *
min: 603     avg: 606     median: 606 (1%)     max: 608 ms
376.2 ms (0%)
min: 600     avg: 602     median: 601.5 (1%)     max: 603 ms
Octane V2 - Octane V2 Total Score
96501 Points (87%)
WebXPRT 4 - WebXPRT 4 Score
227 Points (65%)
WebXPRT 3 - WebXPRT 3 Score
min: 272     avg: 275.2     median: 273 (57%)     max: 286 Points
427 Points (89%)
min: 272     avg: 274.5     median: 274.5 (57%)     max: 277 Points
CrossMark - CrossMark Overall
1632 Points (63%)
1977 Points (76%)
1644 Points (63%)
Power Consumption - Prime95 Power Consumption - external Monitor *
min: 88.9     avg: 110.4     median: 116 (20%)     max: 122 Watt
min: 86.1     avg: 90.8     median: 90.8 (16%)     max: 95.4 Watt
Power Consumption - Cinebench R15 Multi Power Consumption - external Monitor *
min: 89.3     avg: 137.7     median: 152 (28%)     max: 159 Watt
47.9 Watt (9%)
min: 90     avg: 98.5     median: 98.5 (18%)     max: 107 Watt
Power Consumption - Idle Power Consumption - external Monitor *
17.3 Watt (11%)
5.8 Watt (4%)
Power Consumption - Idle Power Consumption 150cd 1min *
7.5 Watt (8%)
Power Consumption - Cinebench R15 Multi Power Efficiency - external Monitor
min: 13.3     avg: 14.4     median: 14.1 (10%)     max: 16 Points per Watt
45.2 Points per Watt (34%)
min: 17.2     avg: 17.9     median: 17.9 (13%)     max: 18.6 Points per Watt

Average Benchmarks Intel Core i9-11900H → 100% n=9

Average Benchmarks Apple M3 Pro 12-Core → 125% n=9

Average Benchmarks Intel Core i7-11850H → 96% n=9

- Range of benchmark values for this graphics card
- Average benchmark values for this graphics card
* Smaller numbers mean a higher performance
1 This benchmark is not used for the average calculation

v1.27
log 16. 19:57:36

#0 checking url part for id 13143 +0s ... 0s

#1 checking url part for id 15115 +0s ... 0s

#2 checking url part for id 13205 +0s ... 0s

#3 not redirecting to Ajax server +0s ... 0s

#4 did not recreate cache, as it is less than 5 days old! Created at Sun, 16 Jun 2024 05:37:17 +0200 +0.001s ... 0.001s

#5 composed specs +0.036s ... 0.037s

#6 did output specs +0s ... 0.037s

#7 getting avg benchmarks for device 13143 +0.019s ... 0.056s

#8 got single benchmarks 13143 +0.035s ... 0.091s

#9 getting avg benchmarks for device 15115 +0.004s ... 0.094s

#10 got single benchmarks 15115 +0.007s ... 0.101s

#11 getting avg benchmarks for device 13205 +0.016s ... 0.118s

#12 got single benchmarks 13205 +0.016s ... 0.133s

#13 got avg benchmarks for devices +0s ... 0.133s

#14 min, max, avg, median took s +0.209s ... 0.343s

#15 return log +0s ... 0.343s

Please share our article, every link counts!
> Expert Reviews and News on Laptops, Smartphones and Tech Innovations > Benchmarks / Tech > Processor Comparison - Head 2 Head
Redaktion, 2017-09- 8 (Update: 2023-07- 1)