Notebookcheck Logo

Intel Atom x5-Z8350 vs Qualcomm Snapdragon 625 vs Qualcomm Snapdragon 439

Intel Atom x5-Z8350

► remove from comparison Intel Z8350

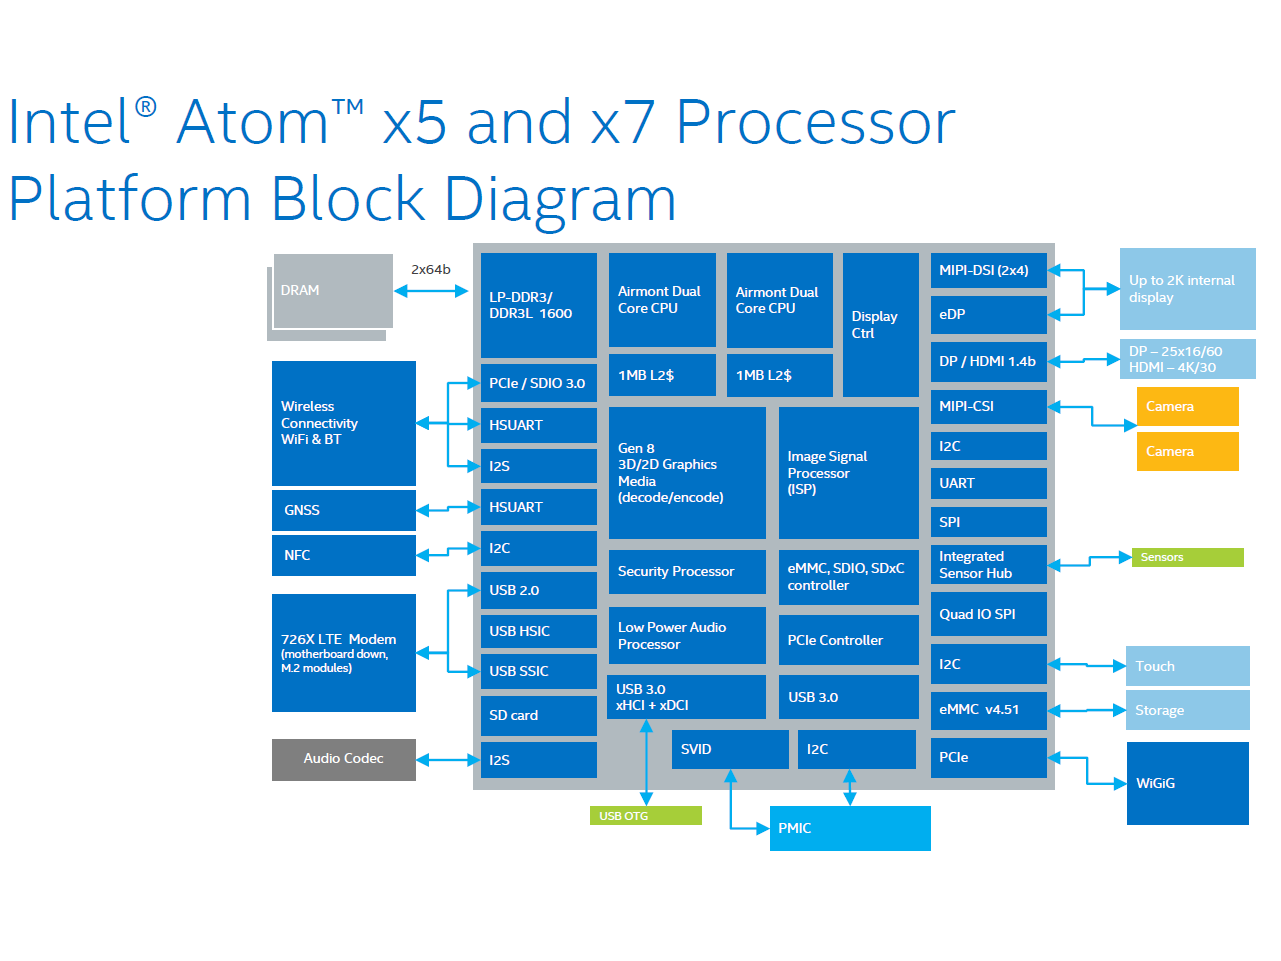
The Intel Atom x5-Z8350 is a power efficient quad-core SoC for Windows and Android devices (tablets and convertibles), which has been presented in February 2016. It is clocked at 1.44 - 1.92 GHz and part of the Cherry Trail platform. Thanks to its new 14 nanometer low-power process (P1273) with tri-gate transistors, energy efficiency has been significantly improved over its predecessor Bay Trail-T (e.g. Atom Z3795). In addition to the CPU cores, the SoC offers a DirectX 11.2-capable GPU as well as a LPDDR3 Memory Controller (2x 64 bit, 25.6 GB/s).

Architecture

The processor cores are based on the Airmont architecture, which is basically a slightly modified shrink of the previous Silvermont core. While performance per clock has not been improved, the more efficient 14 nm process leads to a better utilization of the CPU Burst (alias Turbo Boost) and a therefore somewhat higher overall performance.

Performance

Compared to the Atom x5-Z8500, the Atom x5-Z8350 is clocked slightly lower and therefore about 10 percent slower. However, the x5 still beats many ARM-based SoCs and offers a performance similar to a Qualcomm Snapdragon 801. Compared to the older x5-Z8300, the Z8350 offers 80 MHz higher boost clock and therefore a similar performance. See our X5-Z8300 site for detailed benchmarks.

Using Windows, the chip is adequate for simple everyday tasks such as light browsing or Office, but not for complex software or modern games.

Graphics

The HD Graphics (Cherry Trail) is based on the Intel Gen8 architecture, which supports DirectX 11.2 and is also found in the Broadwell series (e.g. HD Graphics 5300). With 12 EUs (Execution Units) and a clock speed of up to 500 MHz, the GPU is significantly faster as the HD Graphics (Bay Trail) and can handle at least some older and less demandig Windows games in very low settings. The GPU also supports 4K/H.265 video acceleration.

Compared to ARM SoCs, the HD Graphics offers a performance sligthly below a Qualcomm Adreno 330 or PowerVR G6430.

Power Consumption

The entire SoC is rated at an SDP of 2 watts, which indicates a TDP of less than 4 watts. Thus, the chip can be used in passively cooled tablets.

Qualcomm Snapdragon 625

► remove from comparison Qualcomm 625

The Qualcomm Snapdragon 625 (SD625) is a mid-range octa-core SoC with eight ARM Cortex-A53 cpu cores at up to 2 GHz, an Adreno 506 GPU, a DDR3L-1866 memory controller and a X9 LTE (Cat 7, 4G+, 300 Mbps down, 150 Mbps up) modem. Furthermore, the chip supports 802.11ac WiFi and Bluetooth 4.1. It is manufactured in 14nm FinFet. The processor performance should be similar to a HiSilicon Kirin 650, which also offers 8 Cortex A53 cores at up to 2 GHz. However, due to the modern manufacturing process, power consumption and throttling should be better with the Snapdragon 625.

Qualcomm Snapdragon 439

► remove from comparison Qualcomm SD 439

The Qualcomm Snapdragon 439 (SD439) is a lower mainstream SoC for (Android based) smartphones and tablets. Compared to the older Snapdragon 435, the 439 is now manufactured in the current 12nm FinFET process and offers higher clock speeds of 2 GHz of the eight ARM Cortex-A53 cores (compared to 1.4 GHz). Wifi (now ac Wave 2 / Wifi 5) and Bluetooth (v5) were also updated, however the GPU still is the rather slow Adreno 505 and the LTE modem was even downgraded to a X6 with only Cat. 4/5 (max. 150 Mbps download, 75 Mbps upload).

Thanks to the higher maximum clock speed, the performance of the Snapdragon 439 mobile platform can reach the old Snapdragon 625 (also 2 GHz with 8x Cortex-A53). However, there is still a big gap to the SoCs with bigger performance cores.

ModelIntel Atom x5-Z8350Qualcomm Snapdragon 625Qualcomm Snapdragon 439
SeriesIntel Atom x5Qualcomm SnapdragonQualcomm Snapdragon
CodenameCherry TrailCortex-A53Cortex-A53
Series: Snapdragon Cortex-A53
Intel Atom x5-Z85501.44 - 2.4 GHz4 / 4 cores
Intel Atom x5-Z85001.44 - 2.24 GHz4 / 4 cores
Intel Atom x5-Z8350 « 1.44 - 1.92 GHz4 / 4 cores
Intel Atom x5-Z83001.44 - 1.84 GHz4 / 4 cores
Intel Atom x5-E80001.04 - 2 GHz4 / 4 cores
Qualcomm Snapdragon 6302.2 GHz8 / 8 cores Cortex-A53
Qualcomm Snapdragon 6262.2 GHz8 / 8 cores Cortex-A53
Qualcomm Snapdragon 625 « 2 GHz8 / 8 cores Cortex-A53
Qualcomm Snapdragon 4392 GHz8 / 8 cores Cortex-A53
Qualcomm Snapdragon 4501.8 GHz8 / 8 cores Cortex-A53
Qualcomm Snapdragon 4292 GHz4 / 4 cores Cortex-A53
Qualcomm Snapdragon 617 MSM89521.5 GHz8 / 8 cores Cortex-A53
Qualcomm Snapdragon 616 MSM8939v21.7 GHz8 / 8 cores Cortex-A53
Qualcomm Snapdragon 615 MSM89391.7 GHz8 / 8 cores Cortex-A53
Qualcomm Snapdragon 610 MSM89361.7 GHz4 / 4 cores Cortex-A53
Qualcomm Snapdragon 4351.4 GHz8 / 8 cores Cortex-A53
Qualcomm Snapdragon 430 (MSM8937)1.4 GHz8 / 8 cores Cortex-A53
Qualcomm Snapdragon 415 MSM89291.4 GHz8 / 8 cores Cortex-A53
Qualcomm Snapdragon 425 (MSM8917)1.4 GHz4 / 4 cores Cortex-A53
Qualcomm Snapdragon 410 MSM89161.4 GHz4 / 4 cores Cortex-A53
Qualcomm Snapdragon 410 APQ80161.2 GHz4 / 4 cores Cortex-A53
Qualcomm Snapdragon 6302.2 GHz8 / 8 cores Cortex-A53
Qualcomm Snapdragon 6262.2 GHz8 / 8 cores Cortex-A53
Qualcomm Snapdragon 6252 GHz8 / 8 cores Cortex-A53
Qualcomm Snapdragon 439 « 2 GHz8 / 8 cores Cortex-A53
Qualcomm Snapdragon 4501.8 GHz8 / 8 cores Cortex-A53
Qualcomm Snapdragon 4292 GHz4 / 4 cores Cortex-A53
Qualcomm Snapdragon 617 MSM89521.5 GHz8 / 8 cores Cortex-A53
Qualcomm Snapdragon 616 MSM8939v21.7 GHz8 / 8 cores Cortex-A53
Qualcomm Snapdragon 615 MSM89391.7 GHz8 / 8 cores Cortex-A53
Qualcomm Snapdragon 610 MSM89361.7 GHz4 / 4 cores Cortex-A53
Qualcomm Snapdragon 4351.4 GHz8 / 8 cores Cortex-A53
Qualcomm Snapdragon 430 (MSM8937)1.4 GHz8 / 8 cores Cortex-A53
Qualcomm Snapdragon 415 MSM89291.4 GHz8 / 8 cores Cortex-A53
Qualcomm Snapdragon 425 (MSM8917)1.4 GHz4 / 4 cores Cortex-A53
Qualcomm Snapdragon 410 MSM89161.4 GHz4 / 4 cores Cortex-A53
Qualcomm Snapdragon 410 APQ80161.2 GHz4 / 4 cores Cortex-A53
Clock1440 - 1920 MHz2000 MHz2000 MHz
L2 Cache2 MB
Cores / Threads4 / 48 / 88 / 8
Technology14 nm14 nm12 nm
max. Temp.90 °C
FeaturesIntel HD Graphics (Cherry Trail, 200 - 500 MHz), Wireless Display, AES-NI, max. 2 GB Single-Channel DDR3L-RS-1600 (12,8 GB/s), USB 3.0, 1x PCIe 2.0Adreno 506 GPU, 802.11ac WLAN, Bluetooth 4.1, LTE Cat. 7, Dual-Channel LPDDR3-1866 Memory ControllerAdreno 505 GPU, 802.11ac Wave 2WLAN, Bluetooth 5.0, X6 LTE Cat 4/5 (150 / 75 Mbps),
iGPUIntel HD Graphics (Cherry Trail) (200 - 500 MHz)Qualcomm Adreno 506Qualcomm Adreno 505
Architecturex86ARMARM
Announced
Manufacturerark.intel.comwww.qualcomm.comwww.qualcomm.com

Benchmarks

Performance Rating - Geekbench 5.5, PCM Work, Sling Shot Physics, Antutu v8 CPU - SD 439
0.3 pt (23%)
Cinebench R11.5 - Cinebench R11.5 CPU Multi 64 Bit
100%
1 Z8350 +
1.2 Points (2%)
Cinebench R11.5 - Cinebench R11.5 CPU Single 64 Bit
100%
1 Z8350 +
0.4 Points (9%)
Cinebench R10 - Cinebench R10 Rend. Single (32bit)
100%
1 Z8350 +
min: 817     avg: 901     median: 902.5 (5%)     max: 999 Points
Cinebench R10 - Cinebench R10 Rend. Multi (32bit)
100%
1 Z8350 +
min: 2575     avg: 2939     median: 2978.5 (2%)     max: 3130 Points
wPrime 2.10 - wPrime 2.0 1024m *
100%
1 Z8350 +
1108 s (13%)
wPrime 2.10 - wPrime 2.0 32m *
100%
1 Z8350 +
36.2 s (7%)
3DMark 11 - 3DM11 Performance Physics
100%
1 Z8350 +
min: 987     avg: 1267     median: 1313 (4%)     max: 1418 Points
3DMark - 3DMark Ice Storm Physics
100%
1 Z8350 +
12990 Points (11%)
105%
1 625 +
13607 Points (11%)
3DMark - 3DMark Ice Storm Extreme Physics
100%
1 625 +
min: 13538     avg: 13679     median: 13678.5 (11%)     max: 13819 Points
3DMark - 3DMark Ice Storm Unlimited Physics
min: 8436     avg: 12570     median: 14078 (12%)     max: 15195 Points
112%
625 +
min: 14195     avg: 15727     median: 15836.5 (13%)     max: 16267 Points
min: 12096     avg: 12492     median: 12492.5 (11%)     max: 12809 Points
3DMark - 3DMark Cloud Gate Physics
100%
1 Z8350 +
min: 929     avg: 1036     median: 1071 (3%)     max: 1109 Points
3DMark - 3DMark Fire Strike Standard Physics
100%
1 Z8350 +
1588 Points (3%)
3DMark - 3DMark Sling Shot Extreme (ES 3.1) Unlimited Physics
1126 Points (13%)
min: 1500     avg: 1597     median: 1608 (19%)     max: 1657 Points
3DMark - 3DMark Sling Shot (ES 3.0) Unlimited Physics
1151 Points (13%)
min: 1516     avg: 1588     median: 1598 (18%)     max: 1618 Points
Geekbench 5.5 - Geekbench 5.1 - 5.4 64 Bit Single-Core
100%
1 SD 439 +
176 Points (7%)
Geekbench 5.5 - Geekbench 5.1 - 5.4 64 Bit Multi-Core
100%
1 SD 439 +
823 Points (1%)
Geekbench 5.0 - Geekbench 5.0 64 Bit Single-Core
100%
1 625 +
171 Points (1%)
104%
1 SD 439 +
min: 176     avg: 176.7     median: 177 (1%)     max: 177 Points
Geekbench 5.0 - Geekbench 5.0 64 Bit Multi-Core
100%
1 625 +
1023 Points (3%)
79%
1 SD 439 +
min: 809     avg: 819     median: 812 (3%)     max: 836 Points
Geekbench 4.4 - Geekbench 4.1 - 4.4 64 Bit Single-Core
min: 880     avg: 903     median: 903 (9%)     max: 926 Points
min: 863     avg: 880     median: 877.5 (9%)     max: 903 Points
Geekbench 4.4 - Geekbench 4.1 - 4.4 64 Bit Multi-Core
min: 2296     avg: 2393     median: 2393 (3%)     max: 2490 Points
181%
625 +
min: 3148     avg: 4171     median: 4319.5 (5%)     max: 4396 Points
min: 2987     avg: 3141     median: 3154 (4%)     max: 3267 Points
Geekbench 4.0 - Geekbench 4.0 64 Bit Single-Core
min: 836     avg: 888     median: 890.5 (12%)     max: 934 Points
92%
625 +
min: 795     avg: 824     median: 820 (11%)     max: 845 Points
863 Points (12%)
Geekbench 4.0 - Geekbench 4.0 64 Bit Multi-Core
min: 1980     avg: 2227     median: 2264.5 (6%)     max: 2399 Points
132%
625 +
min: 2525     avg: 3116     median: 2984 (7%)     max: 4042 Points
3218 Points (8%)
Geekbench 3 - Geekbench 3 32 Bit Multi-Core
100%
1 Z8350 +
min: 2130     avg: 2247     median: 2289 (4%)     max: 2332 Points
209%
1 625 +
4792 Points (9%)
Geekbench 3 - Geekbench 3 32 Bit Single-Core
100%
1 Z8350 +
min: 709     avg: 755     median: 760 (15%)     max: 796 Points
122%
1 625 +
925 Points (18%)
Geekbench 3 - Geekbench 3 64 Bit Multi-Core
100%
1 SD 439 +
3636 Points (6%)
Geekbench 3 - Geekbench 3 64 Bit Single-Core
100%
1 SD 439 +
792 Points (12%)
Geekbench 2 - 32 Bit - Geekbench Stream
100%
1 SD 439 +
712 Points (6%)
Geekbench 2 - 32 Bit - Geekbench Memory
100%
1 SD 439 +
1563 Points (14%)
Geekbench 2 - 32 Bit - Geekbench Floating Point
100%
1 SD 439 +
5986 Points (12%)
Geekbench 2 - 32 Bit - Geekbench Integer
100%
1 SD 439 +
3444 Points (7%)
Geekbench 2 - 32 Bit - Geekbench Total Score
100%
1 SD 439 +
3684 Points (10%)
Mozilla Kraken 1.1 - Kraken 1.1 Total Score *
min: 5047     avg: 5908     median: 5630 (7%)     max: 7230 ms
95%
625 +
min: 8028     avg: 9289     median: 9316 (11%)     max: 12194 ms
min: 9768     avg: 9963     median: 9952.5 (12%)     max: 10143 ms
Octane V2 - Octane V2 Total Score
min: 4722     avg: 6393     median: 6494 (6%)     max: 7265 Points
69%
625 +
min: 3781     avg: 4524     median: 4502 (4%)     max: 4979 Points
min: 4512     avg: 4731     median: 4755.5 (4%)     max: 4958 Points
WebXPRT 3 - WebXPRT 3 Score
100%
1 625 +
min: 35     avg: 36.5     median: 36.5 (8%)     max: 38 Points
97%
1 SD 439 +
min: 32     avg: 35.2     median: 35.5 (7%)     max: 38 Points
Vellamo 3.x - Vellamo 3.x Metal
100%
1 625 +
1578 Points (42%)
Vellamo 3.x - Vellamo 3.x Multicore Beta
100%
1 625 +
2404 Points (54%)
Vellamo 3.x - Vellamo 3.x Browser
100%
1 625 +
3475 Points (46%)
Quadrant Standard Edition 2.0 - Quadrant Standard 2.0 Total Score
100%
1 625 +
37065 points (86%)
AnTuTu v6 - AnTuTu v6 Total Score
58565 Points (20%)
min: 59539     avg: 60585     median: 60585 (21%)     max: 61631 Points
AnTuTu v7 - AnTuTu v7 MEM
100%
1 625 +
min: 4570     avg: 5923     median: 5907.5 (18%)     max: 7431 Points
86%
1 SD 439 +
min: 4849     avg: 5390     median: 5051 (16%)     max: 6271 Points
AnTuTu v7 - AnTuTu v7 UX
100%
1 625 +
min: 19447     avg: 20817     median: 20902.5 (26%)     max: 21974 Points
109%
1 SD 439 +
min: 19841     avg: 21900     median: 22846 (28%)     max: 23014 Points
AnTuTu v7 - AnTuTu v7 GPU
100%
1 625 +
min: 12718     avg: 12942     median: 12832.5 (4%)     max: 13599 Points
98%
1 SD 439 +
min: 12224     avg: 12439     median: 12514 (4%)     max: 12579 Points
AnTuTu v7 - AnTuTu v7 CPU
100%
1 625 +
min: 25992     avg: 36737     median: 38406.5 (24%)     max: 40836 Points
98%
1 SD 439 +
min: 37733     avg: 37810     median: 37769 (23%)     max: 37928 Points
AnTuTu v7 - AnTuTu v7 Total Score
100%
1 625 +
min: 65759     avg: 76418     median: 77841.5 (14%)     max: 81789 Points
100%
1 SD 439 +
min: 75175     avg: 77540     median: 77652 (14%)     max: 79792 Points
AnTuTu v8 - AnTuTu v8 UX
100%
1 SD 439 +
min: 6969     avg: 12860     median: 13894 (12%)     max: 16684 Points
AnTuTu v8 - AnTuTu v8 MEM
100%
1 SD 439 +
min: 27672     avg: 29440     median: 29676.5 (24%)     max: 30734 Points
AnTuTu v8 - AnTuTu v8 GPU
100%
1 SD 439 +
min: 9258     avg: 10049     median: 10067 (2%)     max: 10803 Points
AnTuTu v8 - AnTuTu v8 CPU
100%
1 SD 439 +
min: 40746     avg: 41220     median: 41221.5 (15%)     max: 41690 Points
AnTuTu v8 - AnTuTu v8 Total Score
100%
1 SD 439 +
min: 84645     avg: 93569     median: 95218 (9%)     max: 99193 Points
AndEBench - AndEBench Java
100%
1 625 +
2429 Iter./s (75%)
AndEBench - AndEBench Native
100%
1 625 +
24869 Iter./s (82%)
PassMark PerformanceTest Mobile V1 - PerformanceTest Mobile V1 CPU Tests
100%
1 625 +
156240 Points (21%)
68%
1 SD 439 +
105520 Points (14%)
PCMark for Android - PCM f. Android Work Score 2.0
3376 Points (22%)
min: 4412     avg: 4632     median: 4643.5 (30%)     max: 4791 Points
PCMark for Android - PCM f. Android Work Score
4671 Points (23%)
min: 5880     avg: 6095     median: 6115 (31%)     max: 6228 Points
PCMark for Android - PCM f. Android Computer Vision
100%
1 625 +
min: 2400     avg: 2450     median: 2424 (13%)     max: 2520 Points
105%
1 SD 439 +
min: 2490     avg: 2557     median: 2556.5 (14%)     max: 2623 Points
PCMark for Android - PCM f. Android Storage
100%
1 625 +
min: 2335     avg: 4177     median: 4267 (9%)     max: 5580 Points
122%
1 SD 439 +
min: 4775     avg: 5213     median: 5212.5 (11%)     max: 5650 Points

Average Benchmarks Intel Atom x5-Z8350 → 100% n=12

Average Benchmarks Qualcomm Snapdragon 625 → 125% n=12

Average Benchmarks Qualcomm Snapdragon 439 → 115% n=12

- Range of benchmark values for this graphics card
- Average benchmark values for this graphics card
* Smaller numbers mean a higher performance
1 This benchmark is not used for the average calculation

v1.26
log 06. 22:18:44

#0 checking url part for id 8088 +0s ... 0s

#1 checking url part for id 8168 +0s ... 0s

#2 checking url part for id 11405 +0s ... 0s

#3 not redirecting to Ajax server +0s ... 0s

#4 did not recreate cache, as it is less than 5 days old! Created at Sat, 04 May 2024 05:40:37 +0200 +0.001s ... 0.001s

#5 composed specs +0.041s ... 0.042s

#6 did output specs +0s ... 0.042s

#7 getting avg benchmarks for device 8088 +0.003s ... 0.045s

#8 got single benchmarks 8088 +0.05s ... 0.095s

#9 getting avg benchmarks for device 8168 +0.003s ... 0.097s

#10 got single benchmarks 8168 +0.049s ... 0.146s

#11 getting avg benchmarks for device 11405 +0.013s ... 0.159s

#12 got single benchmarks 11405 +0.018s ... 0.177s

#13 got avg benchmarks for devices +0s ... 0.177s

#14 min, max, avg, median took s +0.28s ... 0.456s

#15 return log +0s ... 0.456s

Please share our article, every link counts!
> Expert Reviews and News on Laptops, Smartphones and Tech Innovations > Benchmarks / Tech > Processor Comparison - Head 2 Head
Redaktion, 2017-09- 8 (Update: 2023-07- 1)