

Intel Atom Z3735F vs Intel Atom x5-Z8350 vs Intel Celeron N3350
Intel Atom Z3735F
► remove from comparison
The Intel Atom Z3735F is a power-efficient quad-core SoC for tablets (mainly Android). It is clocked at 1.33 - 1.83 GHz and is part of the Bay Trail-T platform. Thanks to the specially optimized 22nm low-power design process (P1271) with Tri-Gate transistors, performance and energy efficiency have been significantly improved compared to its predecessor. In contrast to the Z3735D, the Z3735F comes in a different BGA package.
Architecture
The processor cores are based on the new Silvermont architecture, which is an out-of-order design for the first time. The increased utilization of the pipeline and many other improvements (optimized branch prediction, increased buffers, and enhanced decoders) have increased the performance per clock by about 50 percent. At the same time, however, the Hyper-Threading feature of the previous generation has been removed. Other major additions are the support for new instruction set extensions such as SSE 4.1 and 4.2 as well as AES-NI (depending on the model).
Performance
Thanks to 4 CPU cores and the improved performance per clock, the Z3735F is significantly faster than previous Intel Atoms like the Z2760. Depending on the benchmark, the Z3735F competes with AMDs Temash and Kabini APUs like the A6-1450 and A4-5000. For everyday tasks such as Internet or Office the performance is adequate, but not for very complex software or modern games. Compared to ARM SoCs for Android systems, the Z3735F is placed in the upper mid-range segment.
Graphics
The HD Graphics (Bay Trail) is based on the Intel Gen7 architecture, which supports DirectX 11 and is also found in the Ivy Bridge series (e.g. HD Graphics 4000). With only 4 EUs (Execution Units) and a relatively low clock speed of up to 646 MHz, the GPU is even slower than the HD Graphics (Ivy Bridge). Therefore, only older and less demanding games (like simple Android titles) will run fluently. However, video acceleration and other multimedia applications are no problem for the chip.
Power Consumption
The entire SoC is rated at an SDP of 2.2 W, which indicates a TDP of less than 4 W. Thus, the chip can be used in passively cooled tablets.
Intel Atom x5-Z8350
► remove from comparison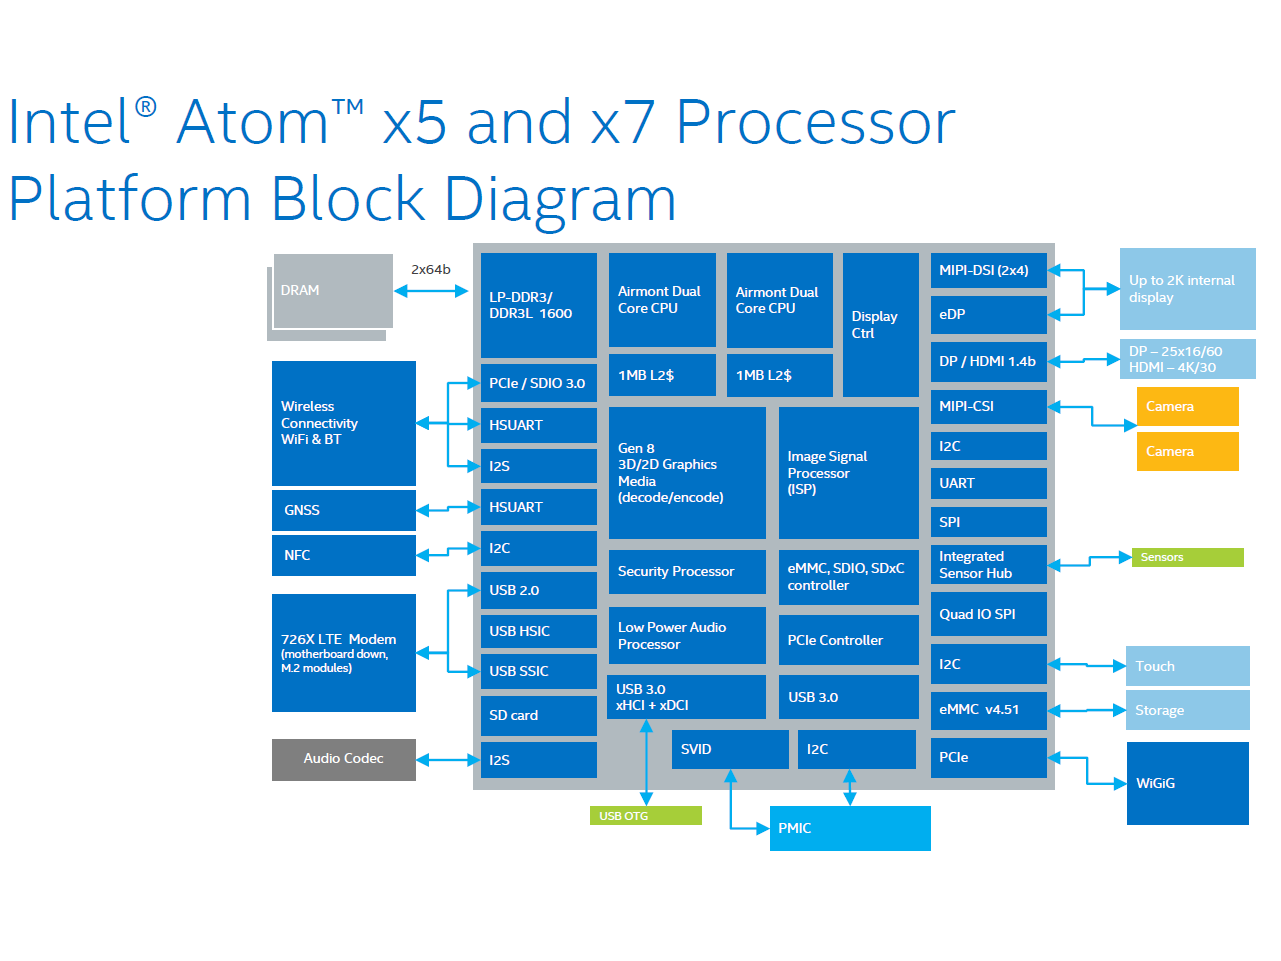
The Intel Atom x5-Z8350 is a power efficient quad-core SoC for Windows and Android devices (tablets and convertibles), which has been presented in February 2016. It is clocked at 1.44 - 1.92 GHz and part of the Cherry Trail platform. Thanks to its new 14 nanometer low-power process (P1273) with tri-gate transistors, energy efficiency has been significantly improved over its predecessor Bay Trail-T (e.g. Atom Z3795). In addition to the CPU cores, the SoC offers a DirectX 11.2-capable GPU as well as a LPDDR3 Memory Controller (2x 64 bit, 25.6 GB/s).
Architecture
The processor cores are based on the Airmont architecture, which is basically a slightly modified shrink of the previous Silvermont core. While performance per clock has not been improved, the more efficient 14 nm process leads to a better utilization of the CPU Burst (alias Turbo Boost) and a therefore somewhat higher overall performance.
Performance
Compared to the Atom x5-Z8500, the Atom x5-Z8350 is clocked slightly lower and therefore about 10 percent slower. However, the x5 still beats many ARM-based SoCs and offers a performance similar to a Qualcomm Snapdragon 801. Compared to the older x5-Z8300, the Z8350 offers 80 MHz higher boost clock and therefore a similar performance. See our X5-Z8300 site for detailed benchmarks.
Using Windows, the chip is adequate for simple everyday tasks such as light browsing or Office, but not for complex software or modern games.
Graphics
The HD Graphics (Cherry Trail) is based on the Intel Gen8 architecture, which supports DirectX 11.2 and is also found in the Broadwell series (e.g. HD Graphics 5300). With 12 EUs (Execution Units) and a clock speed of up to 500 MHz, the GPU is significantly faster as the HD Graphics (Bay Trail) and can handle at least some older and less demandig Windows games in very low settings. The GPU also supports 4K/H.265 video acceleration.
Compared to ARM SoCs, the HD Graphics offers a performance sligthly below a Qualcomm Adreno 330 or PowerVR G6430.
Power Consumption
The entire SoC is rated at an SDP of 2 watts, which indicates a TDP of less than 4 watts. Thus, the chip can be used in passively cooled tablets.
Intel Celeron N3350
► remove from comparisonThe Intel Celeron N3350 is an Apollo Lake family, dual-core, ultra-low-power processor (SoC) that saw the light of day in 2016. Its two cores run at 1.1 GHz to 2.4 GHz; these are not Hyper-Threading-enabled meaning there are no additional threads. This chip has a fairly competent integrated graphics solution, the Intel HD Graphics 500, and eats very little (~6 W).
Amusingly enough, Intel keeps making and selling the Celeron as of late 2022, albeit the price has dropped from about $100 to about $20 per unit making the CPU even more popular with ultra-budget nettop and laptop makers.
Architecture & Features
Just like other Celeron N, Celeron J, Pentium N, Pentium J processors, this Celeron is notable for its small die size. It is easy to manufacture, lowering the costs and enabling Intel to compete with various ARM-based products (hello, Raspberry Pi).
The Celeron N3350 features the Goldmont CPU microarchitecture. This replaces the dated Silvermont (2013), bringing with it several welcome improvements and making for a double-digit IPC improvement. There is still no L3 cache to be found here, however, it now takes less cycles to perform many operations.
The Celeron is compatible with DDR3L-1866, LPDDR3-1866, LPDDR4-2400 RAM. Intel's guidelines state that up to 8 GB are supported; that being said, various forum users report that the CPU functions just fine if mated to 16 GB and even 32 GB of RAM. The chip features six PCI-Express 2.0 lanes for connecting various devices, meaning a four-lane NVMe SSD will not be able to deliver a data transfer rate of more than 2 GB/s. eMMC and SATA storage is supported natively, too.
This Intel CPU is Secure Boot-compatible; technically, it will have no issue running 64-bit Windows 11. However, Microsoft only allows Windows 11 to be installed on systems with CPUs released in 2017 or later, making 64-bit Windows 10 the only OS that the Celeron is officially compatible with.
Last but not the least, please keep in mind that this is not a user-replaceable CPU. It gets permanently soldered to the motherboard (BGA1296 socket interface).
Performance
The average N3350 in our database is just as fast as the Atom x5-Z8300 and the Core 2 Duo SU7300, as far as multi-thread benchmark scores are concerned. Which is not fast at all. In fact, the two cores of this Celeron trail behind a single core of any half-decent CPU such as Intel's very own Core i3-7130U. A proper x86 CPU, Celeron N3350 will let you run nearly any Windows app, the caveat being that you will have to wait for several seconds every time you click on something. Windows 10 takes nearly a minute to fully boot with this CPU.
Graphics
The Intel HD Graphics 500 (Apollo Lake) is the highlight of this little Celeron. As far as the feature set is concerned, the HD Graphics 500 is not much different from the HD Graphics 520 or any other graphics adapter that full-blown six-generation Intel Core i3/i5/i7 chips have. This iGPU is compatible with DX12; it will drive up to 3 monitors with resolutions as high as 2160p60. It will happily decode VP9 and AVC-encoded videos, too. These are the two codecs that YouTube mostly relies on, as of 2021.
It's not all roses and sunshine. To keep power consumption under control, the number of Execution Units was reduced to 12 (the HD Graphics 520 has 24 EUs at its disposal, for reference). Besides, the UHD Graphics runs at up to 650 MHz which is not a lot. Very few games will be playable on this graphics solution - mostly, ones that were released in the 2000s or even in the 1990s.
Power consumption
The Celeron's default TDP (also known as the Power Limit 1) is 6 W, making it a great option for passively cooled systems. Increasing the PL1 by one or two watts, which many systems built around Apollo Lake allow one to do, makes for a much more responsive user experience, speaking subjectively.
Energy efficiency isn't great here, as Intel's 14 nm processes are very old as of mid 2022.
| Model | Intel Atom Z3735F | Intel Atom x5-Z8350 | Intel Celeron N3350 | ||||||||||||||||||||||||||||||||||||||||||||||||||||||||||||||||||||||||||||||||||||||||||||||||||||||||||||
| Codename | Bay Trail-T | Cherry Trail | Apollo Lake | ||||||||||||||||||||||||||||||||||||||||||||||||||||||||||||||||||||||||||||||||||||||||||||||||||||||||||||
| Series | Intel Atom | Intel Atom x5 | Intel Celeron | ||||||||||||||||||||||||||||||||||||||||||||||||||||||||||||||||||||||||||||||||||||||||||||||||||||||||||||
| Series: Celeron Apollo Lake |
|
|
| ||||||||||||||||||||||||||||||||||||||||||||||||||||||||||||||||||||||||||||||||||||||||||||||||||||||||||||
| Clock | 1330 - 1830 MHz | 1440 - 1920 MHz | 1100 - 2400 MHz | ||||||||||||||||||||||||||||||||||||||||||||||||||||||||||||||||||||||||||||||||||||||||||||||||||||||||||||
| L1 Cache | 224 KB | ||||||||||||||||||||||||||||||||||||||||||||||||||||||||||||||||||||||||||||||||||||||||||||||||||||||||||||||
| L2 Cache | 2 MB | 2 MB | 2 MB | ||||||||||||||||||||||||||||||||||||||||||||||||||||||||||||||||||||||||||||||||||||||||||||||||||||||||||||
| Cores / Threads | 4 / 4 | 4 / 4 | 2 / 2 | ||||||||||||||||||||||||||||||||||||||||||||||||||||||||||||||||||||||||||||||||||||||||||||||||||||||||||||
| TDP | 4 Watt | 6 Watt | |||||||||||||||||||||||||||||||||||||||||||||||||||||||||||||||||||||||||||||||||||||||||||||||||||||||||||||
| Technology | 22 nm | 14 nm | 14 nm | ||||||||||||||||||||||||||||||||||||||||||||||||||||||||||||||||||||||||||||||||||||||||||||||||||||||||||||
| Socket | UTFCBGA592 | BGA1296 | |||||||||||||||||||||||||||||||||||||||||||||||||||||||||||||||||||||||||||||||||||||||||||||||||||||||||||||
| Features | Intel HD Graphics (Bay Trail, 313 - 646 MHz), Quick Sync, Wireless Display, Clear Video HD, Intel 64, SSE 4.1, SSE 4.2, AES-NI, Secure Key, Anti-Theft, Identify-Protection, max. 2 GB Single-Channel DDR3L-RS 1333, Quick Sync | Intel HD Graphics (Cherry Trail, 200 - 500 MHz), Wireless Display, AES-NI, max. 2 GB Single-Channel DDR3L-RS-1600 (12,8 GB/s), USB 3.0, 1x PCIe 2.0 | DDR3L-1866/LPDDR3-1866/LPDDR4-2400 RAM, PCIe 2, MMX, SSE, SSE2, SSE3, SSSE3, SSE4.1, SSE4.2, AES | ||||||||||||||||||||||||||||||||||||||||||||||||||||||||||||||||||||||||||||||||||||||||||||||||||||||||||||
| iGPU | Intel HD Graphics (Bay Trail) (311 - 646 MHz) | Intel HD Graphics (Cherry Trail) (200 - 500 MHz) | Intel HD Graphics 500 (200 - 650 MHz) | ||||||||||||||||||||||||||||||||||||||||||||||||||||||||||||||||||||||||||||||||||||||||||||||||||||||||||||
| Architecture | x86 | x86 | x86 | ||||||||||||||||||||||||||||||||||||||||||||||||||||||||||||||||||||||||||||||||||||||||||||||||||||||||||||
| $17 U.S. | $24 U.S. | ||||||||||||||||||||||||||||||||||||||||||||||||||||||||||||||||||||||||||||||||||||||||||||||||||||||||||||||
| Announced | |||||||||||||||||||||||||||||||||||||||||||||||||||||||||||||||||||||||||||||||||||||||||||||||||||||||||||||||
| Manufacturer | ark.intel.com | ark.intel.com | ark.intel.com | ||||||||||||||||||||||||||||||||||||||||||||||||||||||||||||||||||||||||||||||||||||||||||||||||||||||||||||
| max. Temp. | 90 °C | 105 °C |

Benchmarks

Average Benchmarks Intel Atom Z3735F → 100% n=16
Average Benchmarks Intel Atom x5-Z8350 → 112% n=16
Average Benchmarks Intel Celeron N3350 → 135% n=16
* Smaller numbers mean a higher performance
1 This benchmark is not used for the average calculation