Notebookcheck Logo

AMD Ryzen 7 5700G vs Intel Core i7-1360P vs Intel Core i5-1340P

AMD Ryzen 7 5700G

► remove from comparison AMD R7 5700G

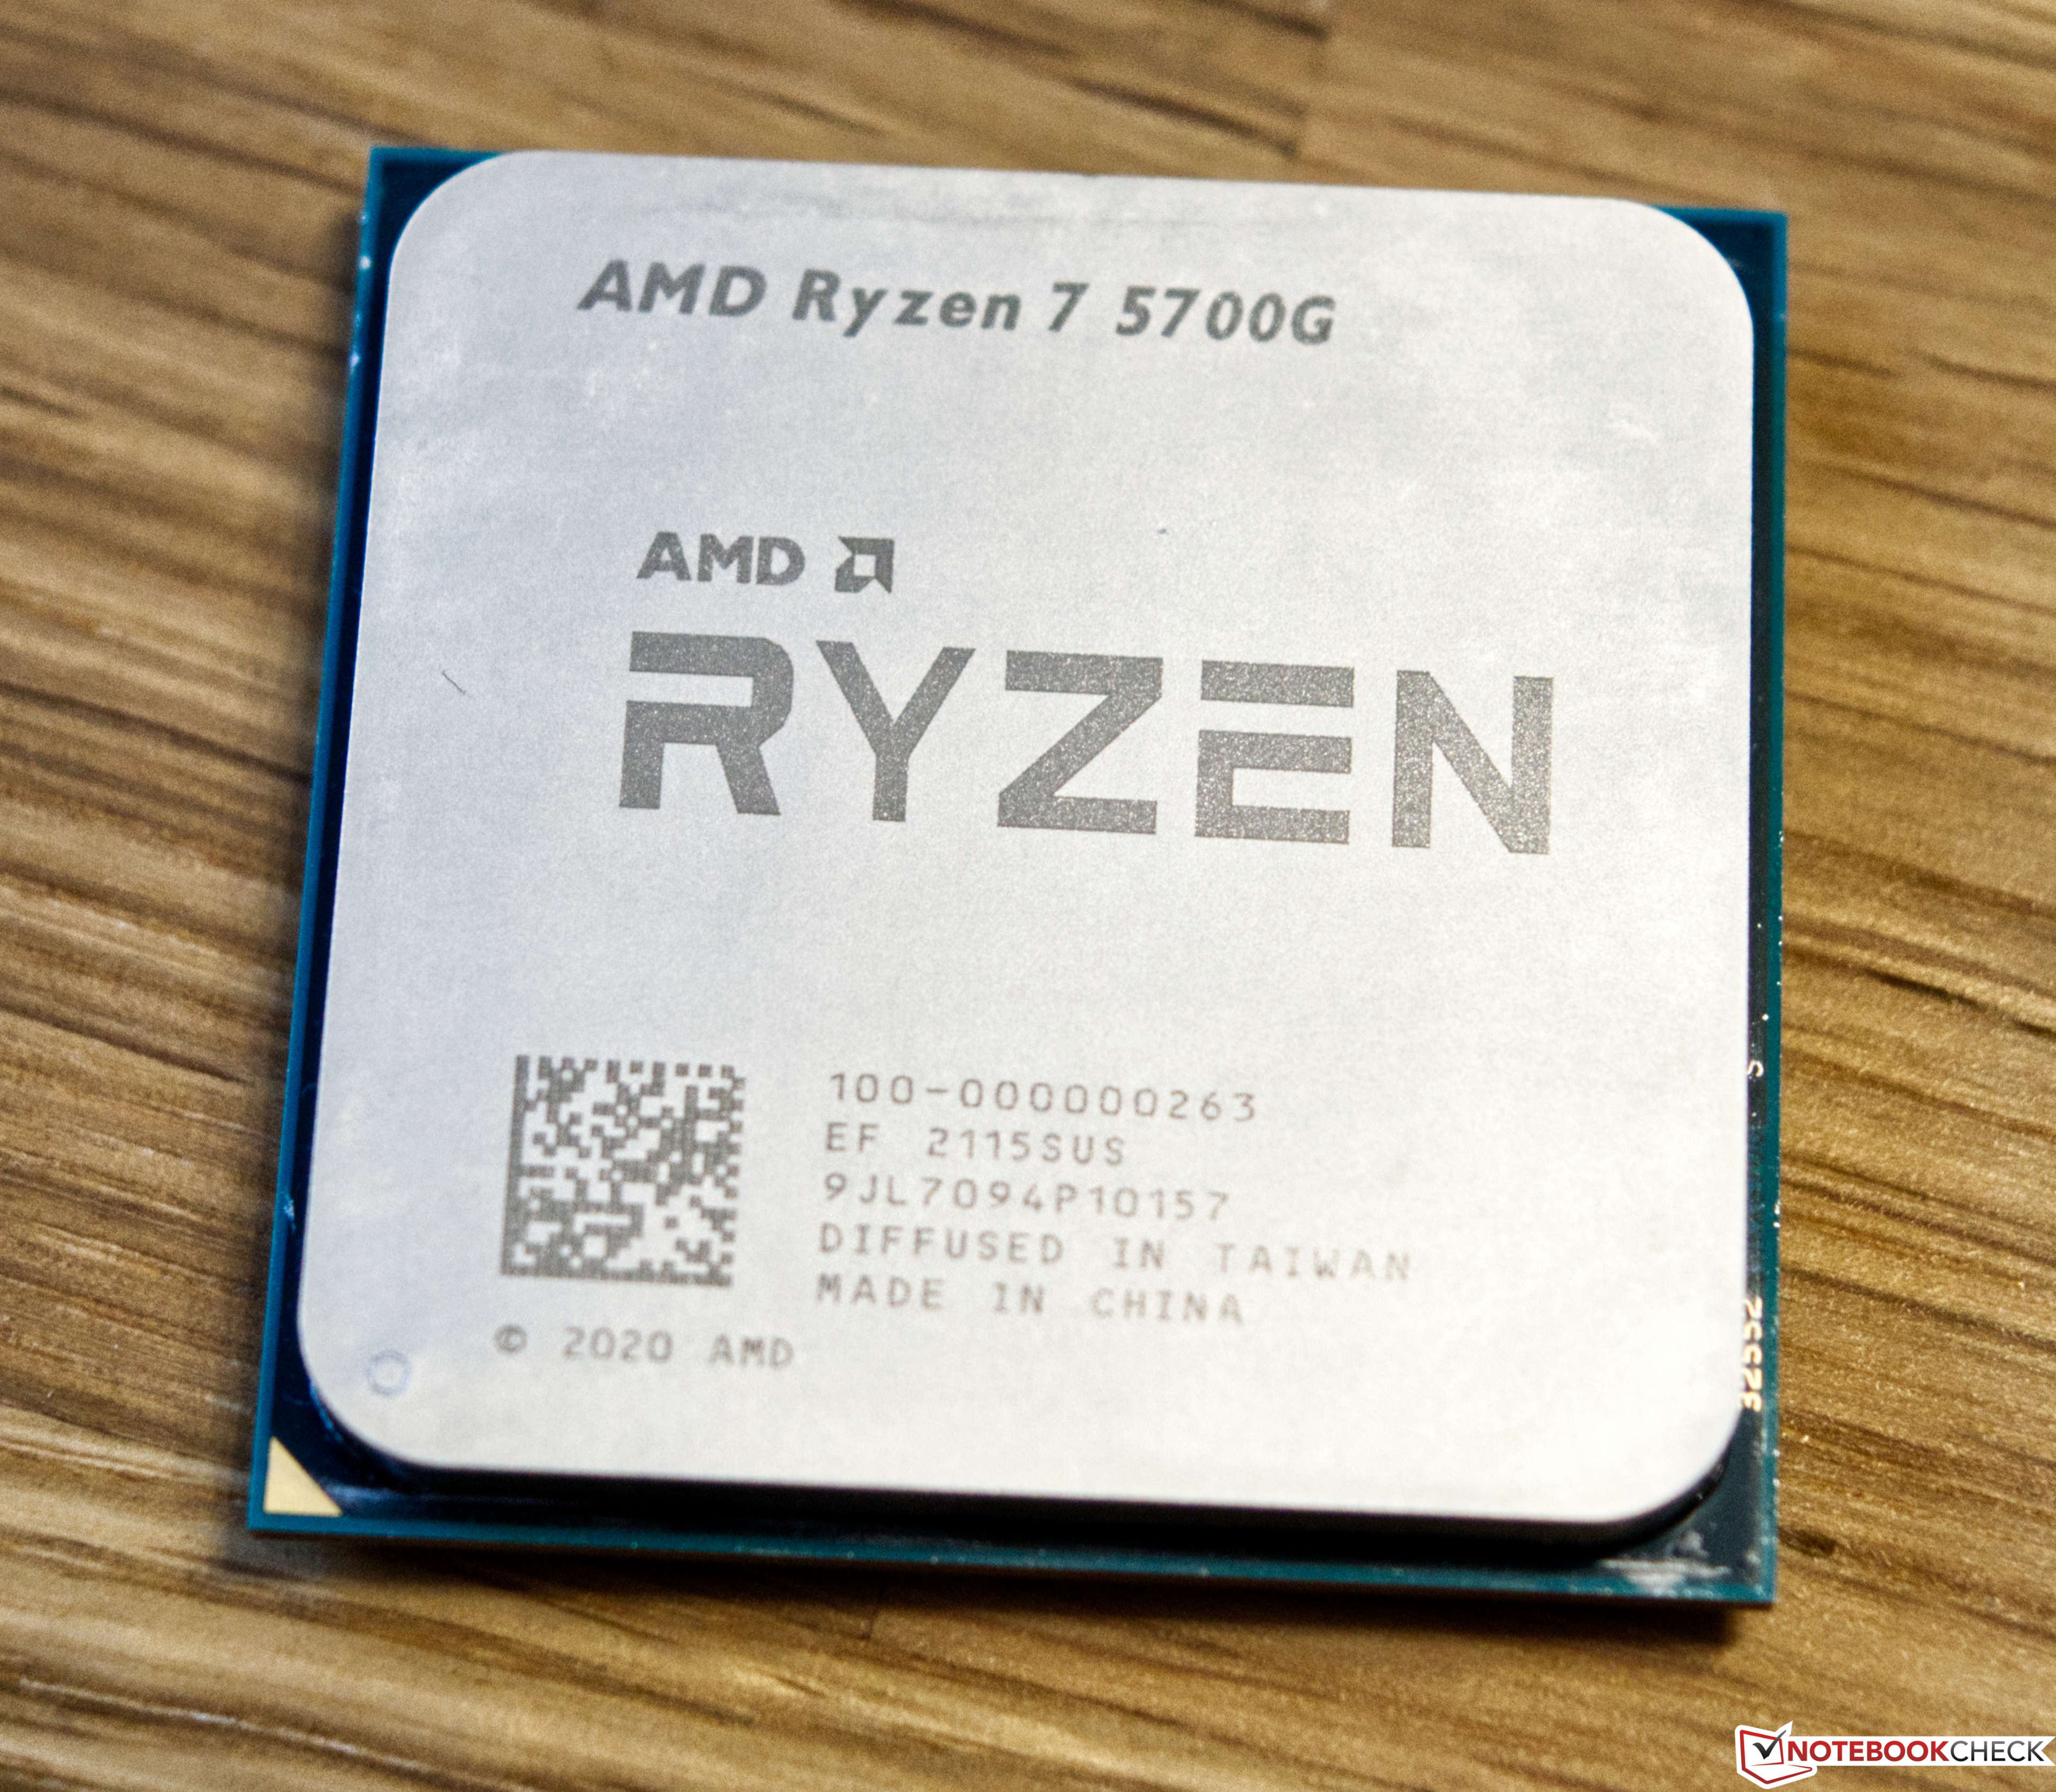
The AMD Ryzen 7 5700G is a desktop APU with 8 cores and part of the Cezanne product family. The 8 cores are based on the Zen 3 architecture and can clock between 3.8 to 4.6 GHz. Thanks to Simultaneous Multithreading (SMT), the CPU supports up to 16 threads at once. At time of the launch, the 5700G is the fastest 8-core-CPU with an iGPU from AMD.

The integrated AMD Radeon RX Vega 8 is currently one of the fastest iGPUs and capable of 1080p gaming at low details.

Performance

The 5700G delivers very serviceable multi-thread performance, as of mid 2022, trading blows with upper mid-range chips such as the Ryzen 7 3700X and the Core i5-12500H. Besides, the consumer is officially allowed to overclock the thing, creating a bit of a performance gain out of thin air. Find out more by reading our full Ryzen 7 5700G review.

Power consumption

This Ryzen 7 series APU has a default TDP, also known as the long-term power limit, of 65 W. PC makers are free to reduce that somewhat with 45 W being the minimum AMD-recommended value. Clock speeds and performance would take a hit as a result.

The R7 5700G is built with TSMC's 7 nm manufacturing process for average, as of mid 2023, energy efficiency.

Intel Core i7-1360P

► remove from comparison Intel i7-1360P

The Intel Core i7-1360P is a higher-end Raptor Lake-P (Alder Lake-P refresh) family CPU, an expensive 28 W part meant for use in ultra-light, ultra-thin (yet actively cooled) laptops. This CPU was announced in early 2023 and it has 4 of the 6 performance cores (P-cores, Golden Cove architecture) and 8 efficient cores (E-cores, Gracemont architecture). The P-cores are Hyper-Threading-enabled for a total of 16 threads when combined with the E-cores. The P-cores clock from 2.2 GHz (base) to 5 GHz (single core boost) and the E-Cores from 1.6 to 3.7 GHz.

Performance

The average 1360P in our extensive database is in the same league as the Ryzen 7 PRO 6850U, as far as multi-thread benchmark scores are concerned. Which is a pretty good result, as of mid 2023.

Thanks to its decent cooling solution and a long-term CPU power limit of 40 W, the NUC 13 Pro Kit NUC13ANK is among the fastest systems built around the 1360P that we know of. It can be more than two times as fast in CPU-bound workloads as the slowest system featuring the same chip in our database, as of August 2023.

The CPU still only supports PCIe 4.0 x8 for a GPU and two PCIe 4.0 x4 for SSDs.

The i7-1360P is rated at 28 Watt tDP (PL1, 64 Watt PL2 for short bursts). The CPU is manufactured in the further improved Intel 7 process (10nm SuperFin).

Intel Core i5-1340P

► remove from comparison Intel i5-1340P

The Intel Core i5-1340P is a mid-range Raptor Lake-P (Alder Lake-P refresh) family CPU, a 28 W part meant for use in ultra-light, ultra-thin (yet actively cooled) laptops. This CPU was announced in early 2023 and it has 4 of the 6 performance cores (P-cores, Golden Cove architecture) and 8 efficient cores (E-cores, Gracemont architecture). The P-cores are Hyper-Threading-enabled and clock from 1.9 GHz (base) up to 4.6 GHz (single core boost) for a total of 16 threads when combined with the E-cores. The clock speeds of the E-cores ranges from 1.4 to 3.4 GHz and offer a similar performance as the old Skylake cores.

The performance should be similar to the old Core i7-1250P and therefore well suited for even demanding tasks.

The CPU still only supports PCIe 4.0 x8 for a GPU and two PCIe 4.0 x4 for SSDs.

The i5-1340P is rated at 28 Watt tDP (PL1, 64 Watt PL2 for short bursts). The CPU is manufactured in the further improved Intel 7 process (10nm SuperFin).

ModelAMD Ryzen 7 5700GIntel Core i7-1360PIntel Core i5-1340P
CodenameCezanne (Zen 3)Raptor Lake-PRaptor Lake-P
SeriesAMD Cezanne (Zen 3, Ryzen 5000)Intel Raptor Lake-PIntel Raptor Lake-P
Clock3800 - 4600 MHz1600 - 5000 MHz1400 - 4600 MHz
L1 Cache512 KB1.1 MB1.1 MB
L2 Cache4 MB10 MB9 MB
L3 Cache16 MB18 MB12 MB
Cores / Threads8 / 1612 / 16
4 x 5.0 GHz Intel Golden Cove P-Core
8 x 3.7 GHz Intel Gracemont E-Core
12 / 16
TDP65 Watt28 Watt28 Watt
Technology7 nm10 nm10 nm
max. Temp.95 °C100 °C100 °C
SocketAM4BGA1744FCBGA1744
FeaturesDDR4-3200 RAM, PCIe 3, MMX, SSE, SSE2, SSE3, SSSE3, SSE4A, SSE4.1, SSE4.2, AVX, AVX2, BMI2, ABM, FMA, ADX, SMEP, SMAP, SMT, CPB, AES-NI, RDRAND, RDSEED, SHA, SMEDDR4-3200/LPDDR4x-4266/DDR5-5200/LPDDR5-6400/LPDDR5x-6400 RAM, PCIe 4, Thr. Dir., DL B., GNA, vPro Ess., MMX, SSE, SSE2, SSE3, SSSE3, SSE4.1, SSE4.2, AVX, AVX2, BMI2, ABM, FMA, ADX, SMEP, SMAP, EIST, TM1, TM2, HT, Turbo, SST, AES-NI, RDRAND, RDSEED, SHAThread Director
iGPUAMD Radeon RX Vega 8 (Ryzen 4000/5000) ( - 2000 MHz)Intel Iris Xe Graphics G7 96EUs ( - 1500 MHz)Intel Iris Xe Graphics G7 80EUs ( - 1450 MHz)
Architecturex86x86x86
$359 U.S.$353 U.S.
Announced
Manufacturerwww.amd.comark.intel.comwww.intel.com
Series: Raptor Lake-P Raptor Lake-P
Intel Core i7-1370P1.4 - 5.2 GHz14 / 20 cores24 MB L3
Intel Core i7-1360P « 1.6 - 5 GHz12 / 16 cores18 MB L3
Intel Core i5-1350P1.4 - 4.7 GHz12 / 16 cores18 MB L3
Intel Core i5-1340P1.4 - 4.6 GHz12 / 16 cores12 MB L3
Intel Core i7-1370P1.4 - 5.2 GHz14 / 20 cores24 MB L3
Intel Core i7-1360P1.6 - 5 GHz12 / 16 cores18 MB L3
Intel Core i5-1350P1.4 - 4.7 GHz12 / 16 cores18 MB L3
Intel Core i5-1340P « 1.4 - 4.6 GHz12 / 16 cores12 MB L3

Benchmarks

Performance Rating - CB R15 + R20 + 7-Zip + X265 + Blender + 3DM11 CPU - R7 5700G
36.1 pt (60%)
Restrict / Search: Model: Max. age: years
Performance Rating - CB R15 + R20 + 7-Zip + X265 + Blender + 3DM11 CPU - i7-1360P
37.5 pt (62%)
Restrict / Search: Model: Max. age: years
Performance Rating - CB R15 + R20 + 7-Zip + X265 + Blender + 3DM11 CPU - i5-1340P
35.7 pt (59%)
Restrict / Search: Model: Max. age: years
Cinebench 2024 - Cinebench 2024 CPU Single Core
113 Points (63%)
Cinebench 2024 - Cinebench 2024 CPU Multi Core
560 Points (10%)
Cinebench R23 - Cinebench R23 Multi Core
min: 11873     avg: 12831     median: 12830.5 (12%)     max: 13788 Points
min: 6390     avg: 10472     median: 11266.5 (10%)     max: 12637 Points
min: 10660     avg: 10921     median: 10920.5 (10%)     max: 11181 Points
Cinebench R23 - Cinebench R23 Single Core
min: 1493     avg: 1494     median: 1494 (63%)     max: 1495 Points
min: 1596     avg: 1787     median: 1829 (77%)     max: 1909 Points
min: 1701     avg: 1710     median: 1710 (72%)     max: 1719 Points
Cinebench R20 - Cinebench R20 CPU (Single Core)
min: 583     avg: 584     median: 584 (64%)     max: 585 Points
min: 611     avg: 689     median: 705.5 (77%)     max: 736 Points
min: 653     avg: 655     median: 655 (71%)     max: 657 Points
Cinebench R20 - Cinebench R20 CPU (Multi Core)
min: 4660     avg: 5016     median: 5015.5 (12%)     max: 5371 Points
min: 2474     avg: 4033     median: 4199 (10%)     max: 4887 Points
min: 3974     avg: 4202     median: 4114 (10%)     max: 4517 Points
Cinebench R15 - Cinebench R15 CPU Multi 64 Bit
min: 1980     avg: 2107     median: 2107 (13%)     max: 2234 Points
min: 1079     avg: 1793     median: 1858 (12%)     max: 2214 Points
min: 1684     avg: 1756     median: 1756 (11%)     max: 1828 Points
Cinebench R15 - Cinebench R15 CPU Single 64 Bit
min: 242     avg: 242.5     median: 242.5 (67%)     max: 243 Points
min: 180     avg: 247.8     median: 258 (71%)     max: 271 Points
min: 238     avg: 240.5     median: 240.5 (67%)     max: 243 Points
Cinebench R11.5 - Cinebench R11.5 CPU Multi 64 Bit
min: 22.79     avg: 23.6     median: 23.6 (31%)     max: 24.37 Points
min: 19.54     avg: 23.3     median: 24.7 (32%)     max: 25.12 Points
19.9 Points (26%)
Cinebench R11.5 - Cinebench R11.5 CPU Single 64 Bit
min: 2.84     avg: 2.9     median: 2.9 (68%)     max: 2.87 Points
min: 3.19     avg: 3.3     median: 3.3 (77%)     max: 3.3 Points
1.9 Points (44%)
Cinebench R10 - Cinebench R10 Rend. Single (32bit)
min: 6183     avg: 6196     median: 6196 (37%)     max: 6209 Points
min: 10300     avg: 10476     median: 10473 (63%)     max: 10631 Points
Cinebench R10 - Cinebench R10 Rend. Multi (32bit)
min: 37541     avg: 38827     median: 38826.5 (28%)     max: 40112 Points
min: 42685     avg: 49949     median: 51246 (37%)     max: 53525 Points
Cinebench R10 - Cinebench R10 Rend. Multi (64bit)
min: 66237     avg: 68700     median: 68699.5 (44%)     max: 71162 Points
min: 61639     avg: 70180     median: 71168.5 (45%)     max: 76744 Points
58815 Points (38%)
Cinebench R10 - Cinebench R10 Rend. Single (64bit)
min: 11351     avg: 11732     median: 11732 (14%)     max: 12113 Points
min: 14974     avg: 15212     median: 15201.5 (19%)     max: 15471 Points
8098 Points (10%)
wPrime 2.10 - wPrime 2.0 1024m *
min: 90.5     avg: 94.6     median: 94.6 (1%)     max: 98.635 s
min: 240.083     avg: 512     median: 304.7 (4%)     max: 1260.3 s
wPrime 2.10 - wPrime 2.0 32m *
min: 3.595     avg: 4.3     median: 4.3 (1%)     max: 5.067 s
min: 3.735     avg: 8.6     median: 3.9 (1%)     max: 26.5 s
WinRAR - WinRAR 4.0
min: 6960     avg: 7681     median: 7680.5 (12%)     max: 8401 Points
min: 4933     avg: 5590     median: 5759 (9%)     max: 6079 Points
3503 Points (6%)
7-Zip 18.03 - 7-Zip 18.03 Multi Thread 4 runs
min: 55046     avg: 59702     median: 59702 (34%)     max: 64358 MIPS
min: 26534     avg: 42429     median: 43043.5 (25%)     max: 52959 MIPS
min: 39353     avg: 43382     median: 44767 (26%)     max: 46027 MIPS
7-Zip 18.03 - 7-Zip 18.03 Single Thread 4 runs
min: 5809     avg: 5814     median: 5813.5 (69%)     max: 5818 MIPS
min: 4647     avg: 5625     median: 5742.5 (68%)     max: 5973 MIPS
min: 5294     avg: 5317     median: 5317 (63%)     max: 5340 MIPS
X264 HD Benchmark 4.0 - x264 Pass 2
min: 116.8     avg: 123.4     median: 123.4 (3%)     max: 130 fps
min: 94.7     avg: 108.1     median: 110.7 (3%)     max: 116.4 fps
95.2 fps (2%)
X264 HD Benchmark 4.0 - x264 Pass 1
min: 263.5     avg: 273.8     median: 273.8 (7%)     max: 284 fps
min: 273     avg: 294.6     median: 296.5 (8%)     max: 312.5 fps
228.9 fps (6%)
HWBOT x265 Benchmark v2.2 - HWBOT x265 4k Preset
min: 14.8     avg: 15.8     median: 15.8 (28%)     max: 16.8 fps
min: 6.9     avg: 11.6     median: 11.9 (21%)     max: 14.2 fps
min: 12     avg: 12.4     median: 12.4 (22%)     max: 12.8 fps
TrueCrypt - TrueCrypt Serpent
min: 1     avg: 1.1     median: 1.1 (31%)     max: 1.1 GB/s
min: 0.935     avg: 1.1     median: 1.2 (35%)     max: 1.2 GB/s
0.9 GB/s (26%)
TrueCrypt - TrueCrypt Twofish
min: 1.5     avg: 1.6     median: 1.6 (28%)     max: 1.7 GB/s
min: 1.7     avg: 2     median: 2.1 (35%)     max: 2.3 GB/s
1.6 GB/s (28%)
TrueCrypt - TrueCrypt AES
min: 7.6     avg: 10.5     median: 10.5 (27%)     max: 13.4 GB/s
min: 9.5     avg: 11.8     median: 12.4 (32%)     max: 12.9 GB/s
9.3 GB/s (24%)
Blender - Blender 3.3 Classroom CPU *
min: 464     avg: 619     median: 607 (8%)     max: 922 Seconds
min: 559     avg: 570     median: 570 (7%)     max: 581 Seconds
Blender - Blender 2.79 BMW27 CPU *
min: 213.6     avg: 232.9     median: 232.9 (2%)     max: 252.1 Seconds
min: 268     avg: 331     median: 324 (2%)     max: 496 Seconds
min: 290     avg: 299.5     median: 299.5 (2%)     max: 309 Seconds
R Benchmark 2.5 - R Benchmark 2.5 *
min: 0.4896     avg: 0.5     median: 0.5 (11%)     max: 0.4975 sec
min: 0.445     avg: 0.5     median: 0.5 (10%)     max: 0.583 sec
min: 0.502     avg: 0.5     median: 0.5 (11%)     max: 0.514 sec
3DMark 06 - CPU - 3DMark 06 - CPU
min: 14162     avg: 14372     median: 14324 (30%)     max: 14631 Points
min: 9236     avg: 12529     median: 12800.5 (27%)     max: 14879 Points
11552 Points (25%)
Super Pi mod 1.5 XS 1M - Super Pi mod 1.5 XS 1M *
min: 7.685     avg: 7.8     median: 7.8 (2%)     max: 7.905 s
min: 6.7     avg: 6.8     median: 6.8 (1%)     max: 6.817 s
13.2 s (3%)
Super Pi mod 1.5 XS 2M - Super Pi mod 1.5 XS 2M *
min: 16.699     avg: 16.9     median: 16.9 (1%)     max: 17.15 s
min: 14.7     avg: 14.8     median: 14.8 (1%)     max: 14.863 s
28 s (1%)
Super Pi Mod 1.5 XS 32M - Super Pi mod 1.5 XS 32M *
min: 411.3     avg: 415.3     median: 415.3 (2%)     max: 419.234 s
min: 331.676     avg: 373.8     median: 383.3 (2%)     max: 391.05 s
731 s (3%)
3DMark Vantage - 3DM Vant. Perf. CPU no Physx
min: 68538     avg: 68808     median: 68807.5 (53%)     max: 69077 Points
min: 55221     avg: 62499     median: 63451.5 (49%)     max: 67460 Points
3DMark 11 - 3DM11 Performance Physics
min: 14277     avg: 16199     median: 15947 (39%)     max: 18372 Points
min: 7898     avg: 15116     median: 15563.5 (38%)     max: 19777 Points
min: 14045     avg: 15838     median: 15837.5 (39%)     max: 17630 Points
3DMark - 3DMark Ice Storm Physics
min: 86274     avg: 89153     median: 87786 (71%)     max: 93399 Points
min: 66722     avg: 87344     median: 89713 (73%)     max: 99266 Points
3DMark - 3DMark Ice Storm Extreme Physics
min: 83584     avg: 88301     median: 87869 (71%)     max: 93449 Points
min: 64127     avg: 86400     median: 89464 (73%)     max: 99134 Points
3DMark - 3DMark Ice Storm Unlimited Physics
min: 88825     avg: 92226     median: 90430 (73%)     max: 97422 Points
min: 74085     avg: 89264     median: 90430 (73%)     max: 97983 Points
3DMark - 3DMark Cloud Gate Physics
min: 16256     avg: 18080     median: 18640 (47%)     max: 19345 Points
min: 7227     avg: 13243     median: 13170 (33%)     max: 17150 Points
min: 11793     avg: 13472     median: 13472 (34%)     max: 15151 Points
3DMark - 3DMark Fire Strike Standard Physics
min: 25160     avg: 26172     median: 26056 (46%)     max: 27300 Points
min: 10060     avg: 19646     median: 20678 (37%)     max: 26448 Points
min: 18914     avg: 20040     median: 20039.5 (36%)     max: 21165 Points
3DMark - 3DMark Time Spy CPU
min: 7087     avg: 8705     median: 9285 (39%)     max: 9743 Points
min: 4251     avg: 7369     median: 7388 (31%)     max: 10701 Points
min: 7248     avg: 7616     median: 7616 (32%)     max: 7984 Points
Geekbench 6.5 - Geekbench 6.5 Single-Core
1948 Points (47%)
min: 2003     avg: 2497     median: 2564 (62%)     max: 2646 Points
2342 Points (57%)
Geekbench 6.5 - Geekbench 6.5 Multi-Core
9407 Points (37%)
min: 8909     avg: 10779     median: 10968 (43%)     max: 11781 Points
8404 Points (33%)
Geekbench 6.0 - Geekbench 6.0 Single-Core
min: 2371     avg: 2448     median: 2449 (78%)     max: 2516 Points
2262 Points (72%)
Geekbench 6.0 - Geekbench 6.0 Multi-Core
min: 9448     avg: 10103     median: 10214.5 (42%)     max: 10802 Points
10794 Points (44%)
Geekbench 5.5 - Geekbench 5.1 - 5.5 64 Bit Single-Core
min: 1560     avg: 1579     median: 1579 (60%)     max: 1598 Points
min: 1435     avg: 1788     median: 1824 (69%)     max: 1871 Points
min: 1714     avg: 1722     median: 1721.5 (65%)     max: 1729 Points
Geekbench 5.5 - Geekbench 5.1 - 5.5 64 Bit Multi-Core
min: 7818     avg: 8681     median: 8681 (16%)     max: 9544 Points
min: 7549     avg: 9644     median: 9967 (18%)     max: 10817 Points
min: 9602     avg: 10021     median: 10020.5 (18%)     max: 10439 Points
Geekbench 5.0 - Geekbench 5.0 64 Bit Single-Core
min: 1518     avg: 1522     median: 1521.5 (7%)     max: 1525 Points
min: 1557     avg: 1745     median: 1773 (8%)     max: 1826 Points
967 Points (4%)
Geekbench 5.0 - Geekbench 5.0 64 Bit Multi-Core
min: 7806     avg: 8685     median: 8684.5 (27%)     max: 9563 Points
min: 8908     avg: 9815     median: 10000.5 (32%)     max: 10729 Points
7117 Points (22%)
Geekbench 4.4 - Geekbench 4.1 - 4.4 64 Bit Single-Core
min: 6517     avg: 6630     median: 6630 (66%)     max: 6743 Points
min: 6698     avg: 7562     median: 7635 (76%)     max: 8084 Points
min: 4196     avg: 4246     median: 4246 (42%)     max: 4296 Points
Geekbench 4.4 - Geekbench 4.1 - 4.4 64 Bit Multi-Core
min: 31835     avg: 34403     median: 34402.5 (34%)     max: 36970 Points
min: 31629     avg: 36185     median: 37274 (37%)     max: 39852 Points
min: 28140     avg: 29296     median: 29296 (29%)     max: 30452 Points
Mozilla Kraken 1.1 - Kraken 1.1 Total Score *
min: 587     avg: 596     median: 595.5 (1%)     max: 604 ms
min: 494     avg: 523     median: 501 (1%)     max: 633 ms
min: 547     avg: 553     median: 553 (1%)     max: 559 ms
Sunspider - Sunspider 1.0 Total Score *
110.6 ms (1%)
Octane V2 - Octane V2 Total Score
74010 Points (54%)
min: 80242     avg: 85555     median: 83850 (61%)     max: 92146 Points
85504 Points (63%)
WebXPRT 4 - WebXPRT 4 Score
min: 218     avg: 255.6     median: 265 (73%)     max: 328 Points
min: 191.5     avg: 215.3     median: 215.3 (59%)     max: 239 Points
WebXPRT 3 - WebXPRT 3 Score
min: 284     avg: 289.5     median: 289.5 (52%)     max: 295 Points
min: 249     avg: 289.9     median: 301 (54%)     max: 316 Points
min: 221     avg: 241.5     median: 241.5 (43%)     max: 262 Points
CrossMark - CrossMark Overall
min: 1424     avg: 1450     median: 1449.5 (54%)     max: 1475 Points
min: 1527     avg: 1710     median: 1744 (65%)     max: 1891 Points
min: 1579     avg: 1596     median: 1595.5 (60%)     max: 1612 Points
Power Consumption - Prime95 Power Consumption - external Monitor *
min: 88.3     avg: 106.7     median: 106.7 (18%)     max: 125 Watt
min: 34.9     avg: 48.2     median: 46.8 (8%)     max: 67.4 Watt
min: 44.9     avg: 51.5     median: 51.5 (9%)     max: 58.1 Watt
Power Consumption - Cinebench R15 Multi Power Consumption - external Monitor *
min: 76.1     avg: 104.6     median: 104.6 (19%)     max: 133 Watt
min: 40.5     avg: 63     median: 59.2 (11%)     max: 92.2 Watt
min: 58.9     avg: 60.7     median: 60.7 (11%)     max: 62.4 Watt
Power Consumption - Idle Power Consumption - external Monitor *
min: 9.64     avg: 27.6     median: 27.6 (18%)     max: 45.6 Watt
min: 3.69     avg: 7.4     median: 6.9 (5%)     max: 13.5 Watt
min: 4.62     avg: 5     median: 5 (3%)     max: 5.37 Watt
Power Consumption - Idle Power Consumption 150cd 1min *
min: 4.55     avg: 7.5     median: 6.8 (8%)     max: 14.3 Watt
min: 4.21     avg: 5.2     median: 5.2 (6%)     max: 6.24 Watt
Power Consumption - Power Efficiency - Cinebench R15 Multi external Monitor
min: 16.8     avg: 21.4     median: 21.4 (16%)     max: 26 Points per Watt
min: 24     avg: 28.9     median: 27.7 (21%)     max: 36.3 Points per Watt

Average Benchmarks AMD Ryzen 7 5700G → 100% n=41

Average Benchmarks Intel Core i7-1360P → 104% n=41

Average Benchmarks Intel Core i5-1340P → 86% n=41

- Range of benchmark values for this graphics card
red legend - Average benchmark values for this graphics card
* Smaller numbers mean a higher performance
1 This benchmark is not used for the average calculation

v1.34
log 14. 17:02:51

#0 ran 0s before starting gpusingle class +0s ... 0s

#1 checking url part for id 14050 +0s ... 0s

#2 checking url part for id 14731 +0s ... 0s

#3 checking url part for id 14735 +0s ... 0s

#4 redirected to Ajax server, took 1760454171s time from redirect:0 +0s ... 0s

#5 did not recreate cache, as it is less than 5 days old! Created at Mon, 13 Oct 2025 05:18:33 +0200 +0s ... 0s

#6 composed specs +0.007s ... 0.007s

#7 did output specs +0s ... 0.007s

#8 getting avg benchmarks for device 14050 +0.005s ... 0.012s

#9 got single benchmarks 14050 +0.007s ... 0.019s

#10 getting avg benchmarks for device 14731 +0.004s ... 0.023s

#11 got single benchmarks 14731 +0.026s ... 0.049s

#12 getting avg benchmarks for device 14735 +0.004s ... 0.053s

#13 got single benchmarks 14735 +0.008s ... 0.061s

#14 got avg benchmarks for devices +0s ... 0.061s

#15 min, max, avg, median took s +0.091s ... 0.153s

#16 return log +0s ... 0.153s

Please share our article, every link counts!
Mail Logo
> Expert Reviews and News on Laptops, Smartphones and Tech Innovations > Benchmarks / Tech > Processor Comparison - Head 2 Head
Redaktion, 2017-09- 8 (Update: 2023-07- 1)