

Phison PS5013 311CD0512GB vs WDC PC SN530 SDBPNPZ-512G
Phison PS5013 311CD0512GB
► remove from comparison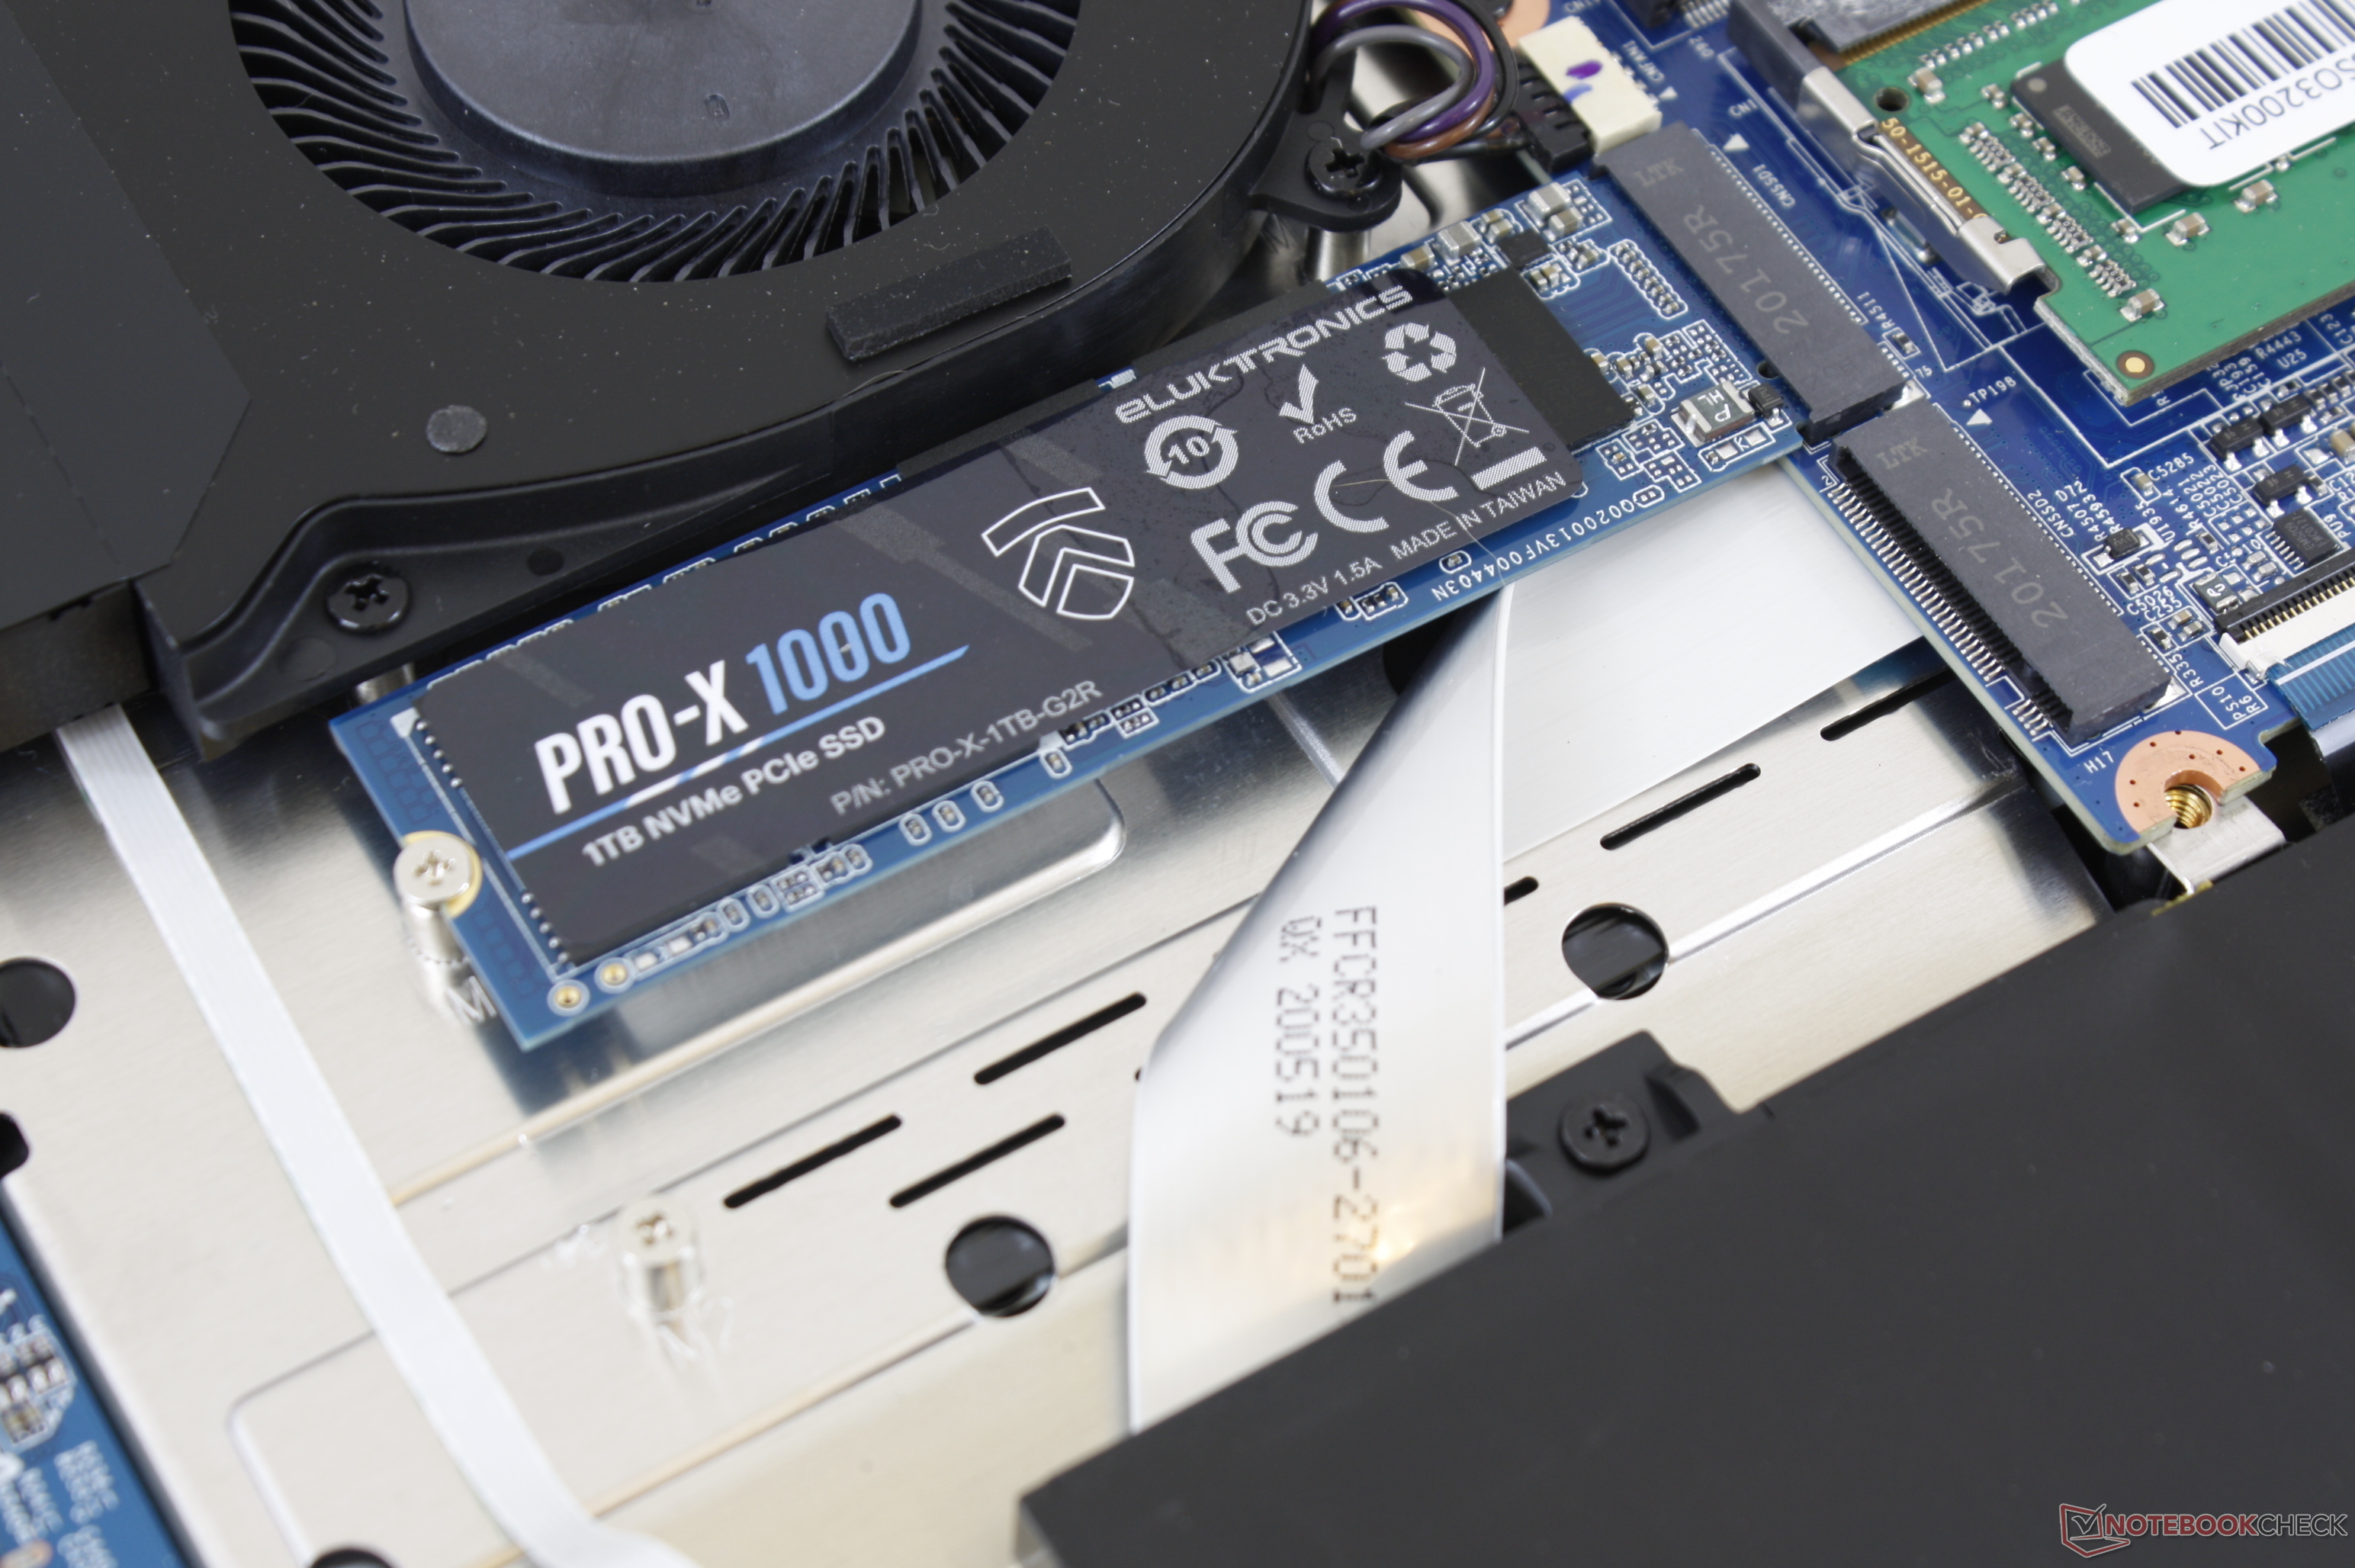
The Phison PS5013 PRO-X-1TB-G2R is a fast NVMe SSD in the M.2 2280 form factor. It can use 3D TLC or QLC NAND flash and is specified with 2500 MB/s / 2100 MB/s sequ. read and write. On average it should use 3.7W in active and 2 mW in low power PS4 state.
WDC PC SN530 SDBPNPZ-512G
The Western Digital PC SN530 NVMe SSD 512GB, M.2 2280 (SDBPNPZ-512G) is a mid-range NVMe drive using Toshiba/WD 3D-NAND TLC with 96 Layers. It is specified at 2400 MB/s read and 1750 MB/s write and 315 k / 230k IOPS 4K read / write. According to WDC the TBW is 300 TB and the MTBF 1.75 Million hours. The consumer warranty is 5 years or reaching the TBW.
| Phison PS5013 311CD0512GB | WDC PC SN530 SDBPNPZ-512G | |
| Type | SSD | SSD |
| Size | M.2 2280 | M.2 |
| Capacity | 512 GB | 512 GB |
| Interface | NVMe | NVMe |
| Announced | 20.08.2020 | 23.04.2020 |
Benchmarks
Performance Rating - DiskSpd - PS5013 311CD0512GB
23.1 pt (26%)
Seagate ST1000LM014 Solid State Hybrid Drive
...
Netac NS512GSSD530
2x Intel SSD 660p SSDPEKNW512G8 (RAID 0)
Lexar NM620 512GB
Kingston OM8SEP4512N-A0
Phison PS5013 311CD0512GB
Samsung SSD PM981 MZVLB512HAJQ
Intel SSD 760p SSDPEKKW512G8
SK Hynix PC401 512GB M.2 (HFS512GD9TNG)
...
Kingston Fury Renegade G5
0%
100%
Performance Rating - DiskSpd - SDBPNPZ-512G
20.8 pt (24%)
Seagate ST1000LM014 Solid State Hybrid Drive
...
Rayson RS512GSSD510 512 GB PCIe 4.0 NVMe
2x Micron 2200S 512 GB (RAID 0)
SK Hynix HFM512GD3JX013N
WDC PC SN530 SDBPNPZ-512G
Foresee XP1000F512G
ESO512GYLCT
Samsung PM991a MZ9LQ1T0HBLB-00BKN
...
Kingston Fury Renegade G5
0%
100%
144%
SDBPNPZ-512G +min: 532 avg: 1001 median: 1043 (17%) max: 1453 MB/s
AS SSD - Copy Program
100%
PS5013 311CD0512GB +min: 236.15 avg: 279.9 median: 237.6 (9%) max: 365.9 MB/s
247%
SDBPNPZ-512G +min: 277.6 avg: 612 median: 588 (22%) max: 1038 MB/s
90%
SDBPNPZ-512G +min: 710 avg: 1427 median: 1434.5 (13%) max: 1828 MB/s
AS SSD - Score Total
100%
PS5013 311CD0512GB +min: 3215 avg: 3582 median: 3751 (23%) max: 3779 Points
73%
SDBPNPZ-512G +min: 1795 avg: 2738 median: 2732 (17%) max: 3507 Points
AS SSD - Score Write
100%
PS5013 311CD0512GB +min: 1322 avg: 1684 median: 1851 (26%) max: 1878 Points
67%
SDBPNPZ-512G +min: 684 avg: 1179 median: 1245.5 (17%) max: 1654 Points
86%
SDBPNPZ-512G +min: 581 avg: 1041 median: 1093 (17%) max: 1322 Points
44%
SDBPNPZ-512G +min: 0.04 avg: 0.1 median: 0.1 (0%) max: 0.167 ms
AS SSD - Access Time Read *
100%
PS5013 311CD0512GB +min: 0.033 avg: 0.1 median: 0 (0%) max: 0.112 ms
61%
SDBPNPZ-512G +min: 0.045 avg: 0.1 median: 0.1 (0%) max: 0.132 ms
AS SSD - 4K-64 Write
100%
PS5013 311CD0512GB +min: 1034.85 avg: 1375 median: 1538.5 (26%) max: 1553 MB/s
61%
SDBPNPZ-512G +min: 396.1 avg: 876 median: 937 (16%) max: 1385 MB/s
83%
SDBPNPZ-512G +min: 406 avg: 813 median: 834 (16%) max: 1067 MB/s
99%
SDBPNPZ-512G +min: 102.9 avg: 163.8 median: 143.5 (28%) max: 238.9 MB/s
84%
SDBPNPZ-512G +min: 27.8 avg: 42.1 median: 43.1 (14%) max: 48.77 MB/s
AS SSD - Sequential Write
100%
PS5013 311CD0512GB +min: 1418.06 avg: 1614 median: 1706 (15%) max: 1719 MB/s
89%
SDBPNPZ-512G +min: 956 avg: 1392 median: 1516 (13%) max: 1755 MB/s
AS SSD - Sequential Read
100%
PS5013 311CD0512GB +min: 2130 avg: 2151 median: 2136 (17%) max: 2188.47 MB/s
97%
SDBPNPZ-512G +min: 1007 avg: 1862 median: 2063.5 (16%) max: 2228 MB/s
CrystalDiskMark 5.2 / 6 - CDM 5/6 Write 4K
100%
PS5013 311CD0512GB +min: 91.67 avg: 144.6 median: 112.7 (10%) max: 229.4 MB/s
143%
SDBPNPZ-512G +min: 118 avg: 170.1 median: 161.1 (15%) max: 269.4 MB/s
CrystalDiskMark 5.2 / 6 - CDM 5/6 Read 4K
100%
PS5013 311CD0512GB +min: 37.78 avg: 44.3 median: 41.2 (1%) max: 53.98 MB/s
119%
SDBPNPZ-512G +min: 43.18 avg: 49.4 median: 49.2 (1%) max: 57.3 MB/s
195%
SDBPNPZ-512G +min: 1355 avg: 1731 median: 1775 (10%) max: 1829 MB/s
101%
SDBPNPZ-512G +min: 1095 avg: 1643 median: 1676 (20%) max: 1983 MB/s
CrystalDiskMark 5.2 / 6 - CDM 5/6 Write 4K Q32T1
100%
PS5013 311CD0512GB +min: 364.47 avg: 405.8 median: 394.4 (13%) max: 458.6 MB/s
118%
SDBPNPZ-512G +min: 208.3 avg: 453.5 median: 467.4 (15%) max: 580 MB/s
CrystalDiskMark 5.2 / 6 - CDM 5/6 Read 4K Q32T1
100%
PS5013 311CD0512GB +min: 533 avg: 589 median: 548 (9%) max: 685 MB/s
89%
SDBPNPZ-512G +min: 319.6 avg: 488.2 median: 485.4 (8%) max: 708 MB/s
CrystalDiskMark 5.2 / 6 - CDM 5/6 Write Seq Q32T1
100%
PS5013 311CD0512GB +min: 923.4 avg: 1575 median: 1859.1 (12%) max: 1943 MB/s
98%
SDBPNPZ-512G +min: 1467 avg: 1791 median: 1821.5 (12%) max: 1841 MB/s
CrystalDiskMark 5.2 / 6 - CDM 5/6 Read Seq Q32T1
100%
PS5013 311CD0512GB +min: 2358.7 avg: 2417 median: 2430 (13%) max: 2461 MB/s
101%
SDBPNPZ-512G +min: 1334 avg: 2272 median: 2446 (13%) max: 2485 MB/s
CrystalDiskMark 5.2 / 6 - CDM 6 Write 4K Q8T8
100%
1 PS5013 311CD0512GB +min: 1166.7 avg: 1246 median: 1246.4 (25%) max: 1326 MB/s
CrystalDiskMark 5.2 / 6 - CDM 6 Read 4K Q8T8
100%
1 PS5013 311CD0512GB +min: 998.39 avg: 1104 median: 1103.7 (17%) max: 1209 MB/s
DiskSpd - DiskSpd 4k_q1t1_write
100%
PS5013 311CD0512GB +min: 160.2 avg: 188.4 median: 165 (38%) max: 240 MB/s
98%
SDBPNPZ-512G +min: 111 avg: 167.1 median: 162.5 (37%) max: 277 MB/s
DiskSpd - DiskSpd 4k_q1t1_read
100%
PS5013 311CD0512GB +min: 33.5 avg: 42.4 median: 42.9 (12%) max: 50.8 MB/s
102%
SDBPNPZ-512G +min: 27.3 avg: 43.3 median: 43.7 (13%) max: 52.8 MB/s
DiskSpd - DiskSpd 4k_q32t16_write
100%
PS5013 311CD0512GB +min: 1284 avg: 1595 median: 1728 (28%) max: 1773 MB/s
57%
SDBPNPZ-512G +min: 448 avg: 898 median: 993.5 (16%) max: 1306 MB/s
DiskSpd - DiskSpd 4k_q32t16_read
100%
PS5013 311CD0512GB +min: 616 avg: 1021 median: 1205 (15%) max: 1243 MB/s
88%
SDBPNPZ-512G +min: 681 avg: 1034 median: 1056 (13%) max: 1315 MB/s
DiskSpd - DiskSpd seq_write
100%
PS5013 311CD0512GB +min: 1746 avg: 1829 median: 1868 (18%) max: 1873 MB/s
93%
SDBPNPZ-512G +min: 1356 avg: 1693 median: 1728.5 (17%) max: 1791 MB/s
DiskSpd - DiskSpd seq_read
100%
PS5013 311CD0512GB +min: 1527 avg: 1633 median: 1671 (22%) max: 1701 MB/s
104%
SDBPNPZ-512G +min: 1116 avg: 1637 median: 1729.5 (23%) max: 1862 MB/s
DiskSpd - DiskSpd seq_q8t1_write
100%
PS5013 311CD0512GB +min: 1814 avg: 1913 median: 1955 (13%) max: 1969 MB/s
92%
SDBPNPZ-512G +min: 1486 avg: 1780 median: 1808 (12%) max: 1838 MB/s
DiskSpd - DiskSpd seq_q8t1_read
100%
PS5013 311CD0512GB +min: 2050 avg: 2328 median: 2417 (15%) max: 2517 MB/s
103%
SDBPNPZ-512G +min: 1359 avg: 2248 median: 2482 (15%) max: 2488 MB/s
DiskSpd - DiskSpd Loop seq_q8t1_read
100%
PS5013 311CD0512GB +min: 2031 avg: 2275 median: 2297 (14%) max: 2498 MB/s
108%
SDBPNPZ-512G +min: 1223 avg: 2280 median: 2477 (15%) max: 2481 MB/s
Average Benchmarks Phison PS5013 311CD0512GB → 100% n=31
Average Benchmarks WDC PC SN530 SDBPNPZ-512G → 101% n=31
- Range of benchmark values for this graphics card
 - Average benchmark values for this graphics card
* Smaller numbers mean a higher performance
1 This benchmark is not used for the average calculation
* Smaller numbers mean a higher performance
1 This benchmark is not used for the average calculation
v1.33