Notebookcheck Logo

Apple M4 (10 cores) vs Intel Core Ultra 9 288V vs AMD Ryzen AI 9 HX 370

Apple M4 (10 cores)

► remove from comparison Apple M4 (10 cores)

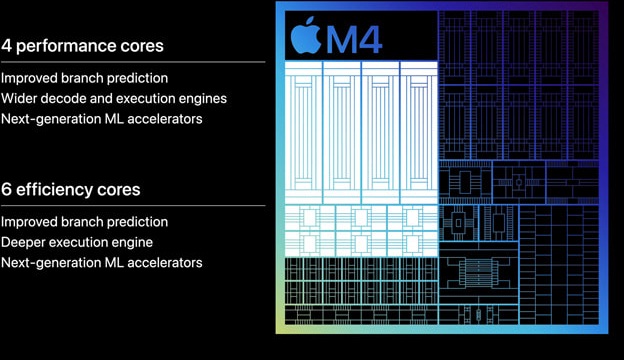
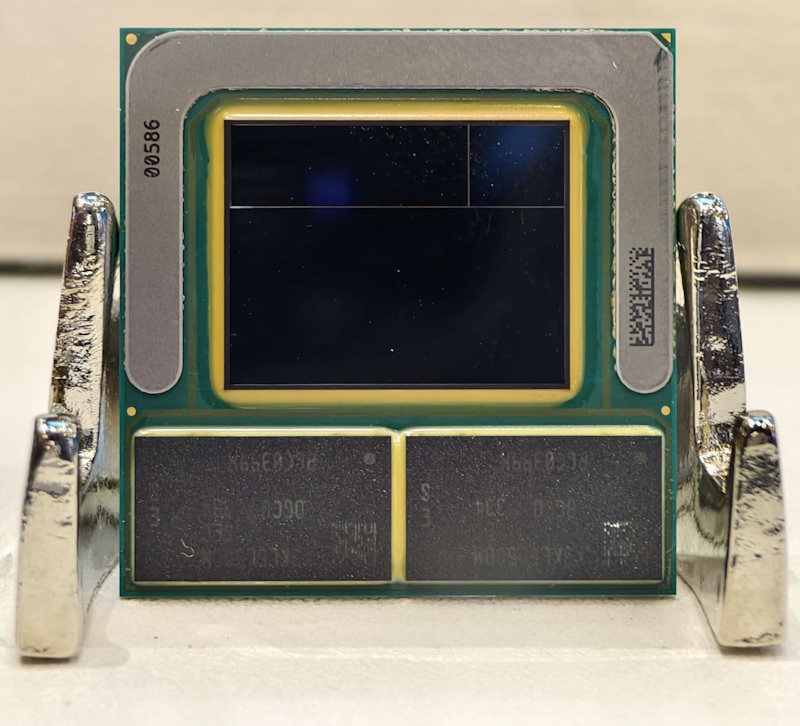
The 10-core Apple M4 is an impressively fast ARM architecture processor (SoC) sporting 4 performance and 6 efficient CPU cores along with a 16-core neural engine and a 10-core GPU with hardware RT support and other modern features. On-package 7500 MT/s LPDDR5x RAM, USB 4 support and Thunderbolt 4 support are onboard as well, as are Wi-Fi 6E and Bluetooth 5.3.

The M4 debuted in May 2024 as part of an iPad launch event; its 4 performance cores run at up to 4.4 GHz, representing a healthy improvement over the M3 (10-core GPU) and its 4.06 GHz top clock speed. Besides, this new chip also has 6 efficient cores at its disposal that run at up to 2.9 GHz. The M3 had to make do with 4 performance cores and 4 efficient cores, for reference.

Architecture and Features

The new CPU cores run at faster clock speeds than what the M3 was capable of while also featuring some minor architectural improvements. A heavily customized version of ARM's v9.4-A microarchitecture is reportedly employed here. The M4 comes with on-package LPDDR5x-7500 RAM (120 GB/s) whereas the M3 was limited to 6400 MT/s. The updated NPU delivers up to 38 TOPS of performance for AI workloads.

Performance

In 2024 iPad Pros, the 3 nm chip is 10% to 20% faster than the M3 (10 GPU cores) in both multi-thread and single-thread short-term workloads. It also delivers about 10% higher multi-thread performance than the 9-core M4. This puts the 10-core part on an equal footing with the Ryzen 7 7745HX, Core i7-13705H and other higher-end x86 processors released in 2023 and 2024.

iPad Pros come with no active cooling solution however Mac minis and MacBook Pros do have one and the latest iMacs probably do as well. As our Fall 2024 Mac mini review shows, the M4's short-term performance doesn't benefit much from the presence of a fan, however its sustained performance benefits tremendously.

Graphics

The M4 GPU (10 cores) has hardware support for ray tracing as well as mesh shading and other modern technologies. It supports external displays with resolutions as high as 8K.

The graphics adapter runs at higher clock speeds than what the (otherwise identical) 10-core GPU built into the 9-core M4 can muster. As our Mac mini 2024 review confirmed, its performance is good enough to run many 2023 and 2024 games at 1080p on low or medium quality settings.

Much like it is with CPU performance, M4-powered iPad Pros will be much slower in long-term GPU-intensive workloads than iMacs, Mac minis and MacBook Pros due to the lack of proper cooling.

Power consumption

This specific M4 chip is found in 2024 iPad Pros, 2024 iMacs, 2024 Mac minis and 2024 MacBook Pros. Within the thin metal cases of the iPads - no active cooling - the chip's sustained power consumption hovers in the 4 W - 5 W area, with short-term peaks of up to 14 W possible. However, Mac minis and MacBook Pros do have an active cooling solution (and the new iMacs probably do, too) meaning the power consumption figures are several times higher. In our Fall 2024 Mac mini review, the SoC consumed 30 W to 40 W when under high loads.

The M4 is built with a "second generation" 3 nm TSMC process which is still cutting-edge as of late 2024.

Intel Core Ultra 9 288V

► remove from comparison Intel Core Ultra 9 288V

The Intel Core Ultra 7 288V is the fastest Lunar Lake family processor as of Nov 2024 thanks to its higher TDP power target and higher clock speeds. This is an SoC for use in tablets and laptops of the slimmer kind that was unveiled in Autumn 2024. It sports 4 new Skymont E-cores and 4 new Lion Cove P-cores running at up to 3.7 GHz and 5.1 GHz respectively, along with the promising new Arc 140V iGPU and 32 GB of on-package, non-replaceable LPDDR5x-8533 RAM. A new 48 TOPS neural engine, Thunderbolt 4 and PCIe 5 SSD support are included as well. A vPro-enabled version of the CPU became available in early 2025.

Architecture and Features

Lunar Lake is built using the Foveros technology (stacking several dies on top of each other and next to each other), just like Meteor Lake was. The new chips make use of the enormous BGA2833 socket interface. Of the 8 cores, not a single one is Hyper-Threading-enabled which is the opposite of what AMD currently does with its Zen 5/5c chips.

Intel claims Lion Cove cores bring a 14% IPC improvement over Redwood Cove. For Skymont and Crestmont, the difference is much higher at 68%. Several tweaks and improvements are present here, such as the Low Latency Fabric that is supposed to make small data transfers between cores/caches a lot faster. The 288V has a very healthy 12 MB of level 3 cache; elsewhere, it has 4 PCIe 5 and 4 PCIe 4 lanes for connecting various kinds of devices, including NVMe SSDs at up to 15.75 GB/s. Thunderbolt 4 support is onboard by default, as is support for CNVi WiFi 7 + BT 5.4 cards from Intel. The 48 TOPS "AI Boost" neural engine is present along with technologies such as Threat Detection to make AI-enabled applications such as the Windows Defender more powerful.

Intel is predicted to get short of on-package RAM in subsequent CPU generations.

Performance

The 288V should be just a couple of percentage points faster than the Core Ultra 7 165U and Core i7-1360P in multi-threaded tasks.

Generally speaking, the 256V, 258V, 266V, 268V, 288V are faster than the 226V, 228V, 236V and 228V due to the difference in their last-level cache size (8 MB vs 12 MB) as well as clock speeds. However, the difference in performance between the slowest Lunar Lake chip, the 226V, and the fastest chip, the 288V is fairly small at around 10% to 15%. It depends on the TDP figures of the laptops being pitted against each other more than on anything else.

Graphics

The Arc Graphics 140V is here to replace the Arc 8 iGPU. Its 8 Xe² architecture "cores" run at up to 2,050 MHz and it also has 8 ray tracing units at its disposal. The adapter is DirectX 12 Ultimate-enabled and able to HW-decode a long list of popular video codecs such as h.266 VVC, h.265 HEVC, h.264 AVC, AV1 and VP9. Three SUHD 4320p monitors can be used simultaneously with this iGPU.

All 2023 and 2024 games are playable at 1080p on low graphics settings or higher with this iGPU. We got well over 30 fps in Ghost of Tsushima and almost 40 fps in Baldur's Gate 3. This means the Radeon 780M gets left behind while the Radeon 890M reigns supreme.

Power consumption

Unlike the slower 268V, 266V, 258V, 256V, 238V, 236V, 228V and 226V, this 2nd generation Core Ultra processor is supposed to consume 30 W when under long-term workloads rather than 17 W. The Intel-recommended short-term power limit for all of them is identical: 37 W.

AMD Ryzen AI 9 HX 370

► remove from comparison AMD Ryzen AI 9 HX 370

The AMD Ryzen AI 9 HX 370 is a powerful Strix Point family processor that debuted in June 2024. The APU comes with 12 CPU cores running at 2.0 GHz to 5.1 GHz, the 16 CU RDNA 3+ Radeon 890M graphics adapter and the 50 TOPS XDNA 2 neural engine. Other noteworthy features include PCIe 4, USB 4 and LPDDR5x-8000 RAM support.

Of the 12 CPU cores, 4 are full Zen 5 cores and 8 are smaller Zen 5c cores. The latter run at significantly lower clock speeds than the former.

Architecture and Features

Strix Point family APUs are powered by Zen 5 and Zen 5c microarchitecture cores, the latter being a slightly slower, smaller and more energy-efficient version of the former. One of the differences between Zen 5 and Zen 5c is cache size; Zen 5 cores have larger caches to work with. According to AMD, Zen 5 delivers a 16% IPC improvement over Zen 4 thanks to branch prediction improvements and other refinements.

Elsewhere, the HX 370 supports LPDDR5x-8000 and DDR5-5600 RAM, and is natively compatible with USB 4 (and therefore Thunderbolt). It has PCIe 4.0 support for a throughput of 1.9 GB/s per lane, just like its 8000 series predecessors did. The integrated XDNA 2 NPU delivers up to 50 INT8 TOPS for accelerating various AI workloads.

Performance

Given the IPC improvement, we expect 4 Zen 5 cores combined with 8 Zen 5c cores to perform about as well as 16 Zen 4 cores meaning there is a real chance of the HX 370 dethroning the Ryzen 9 7945HX3D. We'll make sure to update this section once we get our hands on a laptop powered by the HX 370.

Graphics

The Radeon 890M is the most powerful iGPU that AMD has on offer right now. It features 16 RDNA 3+ architecture CUs (1024 unified shaders) running at up to 2,900 MHz. We expect the graphics adapter to deliver gaming performance good enough for playing 2023 and 2024 games in 1080p (Low detail settings).

Naturally, the 890M is capable of driving four SUHD 4320p60 monitors. It can also efficiently encode and decode the most popular video codecs including AVC, HEVC, VP9 and AV1. The latest addition to that list, the VVC codec, is not supported unlike it is with Intel Lunar Lake chips.

Power consumption

The HX 370 is supposed to have a base TDP of 28 W, with laptop makers free to crank it up to up to 54 W. Which they will most likely do to maximize performance.

The 4 nm TSMC process that the CPU cores are built with make for decent, as of mid 2024, energy efficiency.

ModelApple M4 (10 cores)Intel Core Ultra 9 288VAMD Ryzen AI 9 HX 370
SeriesApple M4Intel Lunar LakeAMD Strix Halo/Point (Zen 5/5c, Ryzen AI 300)
Series: Lunar Lake Lunar Lake
Apple M4 Max (16 cores)2.59 - 4.51 GHz16 / 16 cores
Apple M4 Max (14 cores)2.59 - 4.51 GHz14 / 14 cores
Apple M4 Pro (14 cores)2.59 - 4.51 GHz14 / 14 cores
Apple M4 Pro (12 cores)2.59 - 4.51 GHz12 / 12 cores
Apple M4 (10 cores) « 2.89 - 4.46 GHz10 / 10 cores
Apple M4 (9 cores)2.9 - 4.4 GHz9 / 9 cores
Apple M4 (8 cores)2.9 - 4 GHz8 / 8 cores
Intel Core Ultra 9 288V « 3.3 - 5.1 GHz8 / 8 cores12 MB L3
Intel Core Ultra 7 268V2.2 - 5 GHz8 / 8 cores12 MB L3
Intel Core Ultra 7 266V2.2 - 5 GHz8 / 8 cores12 MB L3
Intel Core Ultra 7 258V2.2 - 4.8 GHz8 / 8 cores12 MB L3
Intel Core Ultra 7 256V2.2 - 4.8 GHz8 / 8 cores12 MB L3
Intel Core Ultra 5 238V2.1 - 4.7 GHz8 / 8 cores8 MB L3
Intel Core Ultra 5 236V2.1 - 4.7 GHz8 / 8 cores8 MB L3
Intel Core Ultra 5 228V2.1 - 4.5 GHz8 / 8 cores8 MB L3
Intel Core Ultra 5 226V2.1 - 4.5 GHz8 / 8 cores8 MB L3
Clock2890 - 4464 MHz3300 - 5100 MHz2000 - 5100 MHz
L2 Cache4 MB14 MB12 MB
Cores / Threads10 / 10
4 x 4.5 GHz Apple M4 P-Core
6 x 2.9 GHz Apple M4 E-Core
8 / 8
4 x 5.1 GHz Intel Lion Cove P-core
4 x 3.7 GHz Intel Skymont E-core
12 / 24
4 x 5.1 GHz AMD Zen 5
8 x 3.3 GHz AMD Zen 5c
TDP40 Watt30 Watt28 Watt
TDP Turbo PL240 Watt37 Watt54 Watt
Transistors28 Million
Technology3 nm3 nm4 nm
FeaturesUnified Memory LPDDR5X-7500 (120 GB/s), 16-Core Neural Engine, Media Engine (Encoding / Decoding: H.264, HEVC, ProRes, ProRes RAW, AV1 Decoding only)LPDDR5x-8533 RAM, PCIe 5 + PCIe 4, USB 4, AI Boost NPU (48 TOPS), Thread Director, PSE, Threat Detection, MMX, SSE, SSE2, SSE3, SSSE3, SSE4.1, SSE4.2, AES, AVX, AVX2, AVX-VNNi, FMA3, SHADDR5-5600/LPDDR5x-8000 RAM, PCIe 4, USB 4, XDNA 2 NPU (50 TOPS), SMT, AES, AVX, AVX2, AVX512, FMA3, MMX (+), SHA, SSE, SSE2, SSE3, SSSE3, SSE4.1, SSE4.2, SSE4A
iGPUApple M4 10-core GPUIntel Arc Graphics 140V ( - 2050 MHz)AMD Radeon 890M ( - 2900 MHz)
ArchitectureARMx86x86
Announced
CodenameLunar LakeStrix Point-HX (Zen 5/5c)
L1 Cache1.4 MB
L3 Cache12 MB24 MB
max. Temp.100 °C100 °C
SocketBGA2833FP8
Manufacturerark.intel.comwww.amd.com

Benchmarks

Performance Rating - CB R15 + R20 + 7-Zip + X265 + Blender + 3DM11 CPU - Core Ultra 9 288V
38.5 pt (64%)
Restrict / Search: Model: Max. age: years
Performance Rating - CB R15 + R20 + 7-Zip + X265 + Blender + 3DM11 CPU - Ryzen AI 9 HX 370
43.2 pt (72%)
Restrict / Search: Model: Max. age: years
Cinebench 2024 - Cinebench 2024 CPU Single Core
min: 173     avg: 174.2     median: 174 (98%)     max: 177 Points
min: 122     avg: 122.1     median: 122.2 (69%)     max: 122.2 Points
min: 113.6     avg: 116.4     median: 116 (65%)     max: 121 Points
Cinebench 2024 - Cinebench 2024 CPU Multi Core
min: 815     avg: 921     median: 958 (18%)     max: 986 Points
min: 493     avg: 551     median: 561 (10%)     max: 598 Points
min: 621     avg: 1054     median: 1121 (21%)     max: 1284 Points
Cinebench R23 - Cinebench R23 Multi Core
min: 12335     avg: 13338     median: 13833 (13%)     max: 13845 Points
min: 9091     avg: 9814     median: 9867 (9%)     max: 10484 Points
min: 10435     avg: 20440     median: 21761 (20%)     max: 23902 Points
Cinebench R23 - Cinebench R23 Single Core
min: 2165     avg: 2202     median: 2173 (91%)     max: 2269 Points
min: 1940     avg: 1947     median: 1950 (82%)     max: 1950 Points
min: 1921     avg: 2010     median: 2018 (85%)     max: 2049 Points
Cinebench R20 - Cinebench R20 CPU (Single Core)
565 Points (62%)
min: 645     avg: 697     median: 696.5 (76%)     max: 748 Points
min: 753     avg: 789     median: 791 (86%)     max: 804 Points
Cinebench R20 - Cinebench R20 CPU (Multi Core)
3642 Points (9%)
min: 2683     avg: 3558     median: 3901 (10%)     max: 4091 Points
min: 6449     avg: 8372     median: 8830 (22%)     max: 9280 Points
Cinebench R15 - Cinebench R15 CPU Multi 64 Bit
min: 1901     avg: 1907     median: 1907 (12%)     max: 1913 Points
min: 1500     avg: 1542     median: 1541.5 (10%)     max: 1583 Points
min: 2498.13     avg: 3220     median: 3409.5 (22%)     max: 3551 Points
Cinebench R15 - Cinebench R15 CPU Single 64 Bit
min: 300     avg: 302     median: 302 (84%)     max: 304 Points
294 Points (82%)
min: 192.1     avg: 299.8     median: 307 (86%)     max: 315 Points
Cinebench R11.5 - Cinebench R11.5 CPU Multi 64 Bit
19.8 Points (26%)
min: 38.84     avg: 40.2     median: 40.7 (53%)     max: 41.17 Points
Cinebench R11.5 - Cinebench R11.5 CPU Single 64 Bit
3.6 Points (85%)
min: 3.68     avg: 3.7     median: 3.7 (88%)     max: 3.7 Points
Cinebench R10 - Cinebench R10 Rend. Single (32bit)
10697 Points (65%)
min: 8639     avg: 8701     median: 8668 (52%)     max: 8797 Points
Cinebench R10 - Cinebench R10 Rend. Multi (32bit)
45377 Points (33%)
min: 53766     avg: 55510     median: 56074 (41%)     max: 56689 Points
Cinebench R10 - Cinebench R10 Rend. Multi (64bit)
min: 96857     avg: 100361     median: 100569 (64%)     max: 103657 Points
Cinebench R10 - Cinebench R10 Rend. Single (64bit)
min: 15698     avg: 15853     median: 15927 (19%)     max: 15935 Points
wPrime 2.10 - wPrime 2.0 1024m *
min: 50.536     avg: 69.8     median: 79.4 (1%)     max: 79.442 s
wPrime 2.10 - wPrime 2.0 32m *
min: 2.701     avg: 3.1     median: 2.7 (1%)     max: 3.743 s
WinRAR - WinRAR 4.0
8613 Points (14%)
min: 4008     avg: 4286     median: 4090 (6%)     max: 4759 Points
7-Zip 18.03 - 7-Zip 18.03 Multi Thread 4 runs
min: 32105     avg: 33861     median: 33743 (19%)     max: 35851 MIPS
min: 66154     avg: 78114     median: 80572.5 (46%)     max: 83714 MIPS
7-Zip 18.03 - 7-Zip 18.03 Single Thread 4 runs
min: 5734     avg: 5905     median: 5945.5 (70%)     max: 5993 MIPS
min: 5859     avg: 6144     median: 6135 (72%)     max: 6497 MIPS
X264 HD Benchmark 4.0 - x264 Pass 2
77.1 fps (26%)
min: 169.8     avg: 175.5     median: 171.5 (57%)     max: 185.1 fps
X264 HD Benchmark 4.0 - x264 Pass 1
265.5 fps (61%)
min: 304.5     avg: 313.5     median: 306 (71%)     max: 330 fps
HWBOT x265 Benchmark v2.2 - HWBOT x265 4k Preset
min: 11.2     avg: 12.2     median: 12.2 (21%)     max: 13.1 fps
min: 20.3     avg: 25.1     median: 26.1 (46%)     max: 28.7 fps
TrueCrypt - TrueCrypt Serpent
0.7 GB/s (21%)
min: 1.6     avg: 1.6     median: 1.6 (47%)     max: 1.7 GB/s
TrueCrypt - TrueCrypt Twofish
1.4 GB/s (24%)
min: 2.5     avg: 2.6     median: 2.6 (45%)     max: 2.7 GB/s
TrueCrypt - TrueCrypt AES
7.7 GB/s (20%)
min: 15.3     avg: 15.7     median: 15.3 (40%)     max: 16.6 GB/s
Blender - Blender 3.3 Classroom CPU *
min: 389     avg: 397     median: 397 (5%)     max: 405 Seconds
min: 541     avg: 611     median: 611 (8%)     max: 681 Seconds
min: 208     avg: 239.2     median: 221 (3%)     max: 306 Seconds
Blender - Blender 2.79 BMW27 CPU *
min: 330     avg: 404     median: 441 (3%)     max: 441 Seconds
min: 139     avg: 156.2     median: 147.5 (1%)     max: 192 Seconds
R Benchmark 2.5 - R Benchmark 2.5 *
min: 0.4218     avg: 0.4     median: 0.4 (9%)     max: 0.4503 sec
min: 0.3892     avg: 0.4     median: 0.4 (9%)     max: 0.529 sec
3DMark 06 - CPU - 3DMark 06 - CPU
12505 Points (27%)
min: 13761     avg: 16184     median: 16571.5 (35%)     max: 17466 Points
Super Pi mod 1.5 XS 1M - Super Pi mod 1.5 XS 1M *
7.7 s (2%)
min: 8.224     avg: 8.3     median: 8.4 (2%)     max: 8.43 s
Super Pi mod 1.5 XS 2M - Super Pi mod 1.5 XS 2M *
16.8 s (1%)
min: 17.504     avg: 17.6     median: 17.6 (1%)     max: 17.767 s
Super Pi Mod 1.5 XS 32M - Super Pi mod 1.5 XS 32M *
624 s (3%)
3DMark Vantage - 3DM Vant. Perf. CPU no Physx
min: 66119     avg: 73944     median: 75793 (58%)     max: 77565 Points
3DMark 11 - 3DM11 Performance Physics
min: 15218     avg: 15328     median: 15327.5 (38%)     max: 15437 Points
min: 17129     avg: 20222     median: 20686 (51%)     max: 23282 Points
3DMark - 3DMark Ice Storm Physics
min: 50952     avg: 59510     median: 61220 (50%)     max: 67655 Points
3DMark - 3DMark Ice Storm Extreme Physics
min: 50955     avg: 60322     median: 61072 (50%)     max: 67802 Points
3DMark - 3DMark Ice Storm Unlimited Physics
min: 48351     avg: 58447     median: 59313.5 (49%)     max: 66810 Points
3DMark - 3DMark Cloud Gate Physics
min: 14279     avg: 14312     median: 14311.5 (36%)     max: 14344 Points
min: 16960     avg: 19395     median: 19571 (50%)     max: 21349 Points
3DMark - 3DMark Fire Strike Standard Physics
min: 20839     avg: 21315     median: 21315 (38%)     max: 21791 Points
min: 24918     avg: 29596     median: 29958 (53%)     max: 33255 Points
3DMark - 3DMark Time Spy CPU
min: 7143     avg: 7639     median: 7638.5 (32%)     max: 8134 Points
min: 8866     avg: 10421     median: 10519 (44%)     max: 12293 Points
Geekbench 6.4 - Geekbench 6.4 Single-Core
min: 3655     avg: 3747     median: 3748.5 (94%)     max: 3838 Points
min: 2797     avg: 2831     median: 2830.5 (71%)     max: 2864 Points
min: 2780     avg: 2881     median: 2876 (72%)     max: 2965 Points
Geekbench 6.4 - Geekbench 6.4 Multi-Core
min: 14690     avg: 14978     median: 14987.5 (58%)     max: 15173 Points
min: 10969     avg: 11003     median: 10972 (43%)     max: 11069 Points
min: 11973     avg: 14488     median: 14896 (58%)     max: 15994 Points
Geekbench 6.0 - Geekbench 6.0 Single-Core
min: 2645     avg: 2952     median: 3105 (99%)     max: 3105 Points
Geekbench 6.0 - Geekbench 6.0 Multi-Core
min: 12664     avg: 18473     median: 21003 (86%)     max: 21003 Points
Geekbench 5.5 - Geekbench 5.1 - 5.5 64 Bit Single-Core
min: 2024     avg: 2069     median: 2069 (81%)     max: 2114 Points
min: 1957     avg: 2083     median: 2098 (82%)     max: 2160 Points
Geekbench 5.5 - Geekbench 5.1 - 5.5 64 Bit Multi-Core
min: 9588     avg: 9610     median: 9609.5 (17%)     max: 9631 Points
min: 11394     avg: 14057     median: 14301 (26%)     max: 15759 Points
Geekbench 5.0 - Geekbench 5.0 64 Bit Single-Core
min: 1827     avg: 1941     median: 1947 (8%)     max: 2041 Points
Geekbench 5.0 - Geekbench 5.0 64 Bit Multi-Core
min: 12962     avg: 14070     median: 14244 (45%)     max: 14828 Points
Geekbench 4.4 - Geekbench 4.1 - 4.4 64 Bit Single-Core
min: 7480     avg: 8044     median: 8033.5 (80%)     max: 8628 Points
Geekbench 4.4 - Geekbench 4.1 - 4.4 64 Bit Multi-Core
min: 42842     avg: 52269     median: 54586.5 (54%)     max: 57060 Points
Mozilla Kraken 1.1 - Kraken 1.1 Total Score *
min: 262     avg: 277.7     median: 265.4 (0%)     max: 318.8 ms
466 ms (1%)
min: 419     avg: 441.1     median: 438 (1%)     max: 503 ms
Sunspider - Sunspider 1.0 Total Score *
54.1 ms (1%)
Octane V2 - Octane V2 Total Score
min: 105178     avg: 111471     median: 110817 (84%)     max: 118492 Points
min: 64079     avg: 107304     median: 107598 (81%)     max: 124105 Points
WebXPRT 4 - WebXPRT 4 Score
min: 315     avg: 335     median: 334 (92%)     max: 348 Points
min: 282     avg: 312     median: 312 (86%)     max: 342 Points
min: 210     avg: 256.3     median: 262 (72%)     max: 277 Points
WebXPRT 3 - WebXPRT 3 Score
min: 430     avg: 467.6     median: 478 (86%)     max: 482 Points
min: 297     avg: 359     median: 359 (64%)     max: 421 Points
min: 252     avg: 307     median: 319 (57%)     max: 347 Points
Antutu v10 - AnTuTu v10 Total Score
2716980 Points (90%)
Antutu v10 - AnTuTu v10 CPU
743583 Points (22%)
CrossMark - CrossMark Overall
min: 1944     avg: 2015     median: 2038 (76%)     max: 2066 Points
min: 1654     avg: 1701     median: 1712 (64%)     max: 1725 Points
min: 1402     avg: 1766     median: 1778 (66%)     max: 1981 Points
Power Consumption - Prime95 Power Consumption - external Monitor *
min: 45.6     avg: 90.8     median: 90.8 (16%)     max: 133.7 Watt
Power Consumption - Cinebench R15 Multi Power Consumption - external Monitor *
min: 46.3     avg: 94.2     median: 104 (19%)     max: 130.3 Watt
Power Consumption - Geekbench 5.5 Power Consumption 150cd *
6.8 Watt (3%)
Power Consumption - Idle Power Consumption - external Monitor *
min: 2.68     avg: 3.1     median: 2.8 (2%)     max: 4.09 Watt
min: 4.89     avg: 9.1     median: 7.6 (5%)     max: 19.6 Watt
Power Consumption - Idle Power Consumption 150cd 1min *
min: 2.68     avg: 3.9     median: 4.1 (5%)     max: 4.76 Watt
6.6 Watt (7%)
min: 6.31     avg: 9.5     median: 9.2 (10%)     max: 12.8 Watt
Power Consumption - Power Efficiency - Cinebench R15 Multi external Monitor
min: 26.9     avg: 36.1     median: 31.4 (23%)     max: 54.9 Points per Watt

Average Benchmarks Apple M4 (10 cores) → 100% n=15

Average Benchmarks Intel Core Ultra 9 288V → 81% n=15

Average Benchmarks AMD Ryzen AI 9 HX 370 → 116% n=15

- Range of benchmark values for this graphics card
red legend - Average benchmark values for this graphics card
* Smaller numbers mean a higher performance
1 This benchmark is not used for the average calculation

v1.33
log 28. 20:15:41

#0 ran 0s before starting gpusingle class +0s ... 0s

#1 checking url part for id 17538 +0s ... 0s

#2 checking url part for id 17915 +0s ... 0s

#3 checking url part for id 17543 +0s ... 0s

#4 redirected to Ajax server, took 1751134541s time from redirect:0 +0s ... 0s

#5 did not recreate cache, as it is less than 5 days old! Created at Sat, 28 Jun 2025 05:20:10 +0200 +0s ... 0s

#6 composed specs +0.008s ... 0.009s

#7 did output specs +0s ... 0.009s

#8 getting avg benchmarks for device 17538 +0s ... 0.009s

#9 got single benchmarks 17538 +0.001s ... 0.01s

#10 getting avg benchmarks for device 17915 +0.004s ... 0.013s

#11 got single benchmarks 17915 +0.005s ... 0.018s

#12 getting avg benchmarks for device 17543 +0.004s ... 0.023s

#13 got single benchmarks 17543 +0.026s ... 0.049s

#14 got avg benchmarks for devices +0s ... 0.049s

#15 min, max, avg, median took s +0.064s ... 0.113s

#16 return log +0s ... 0.113s

Please share our article, every link counts!
Mail Logo
> Expert Reviews and News on Laptops, Smartphones and Tech Innovations > Benchmarks / Tech > Processor Comparison - Head 2 Head
Redaktion, 2017-09- 8 (Update: 2023-07- 1)