

Dell Latitude 9510 2-in-1 Review: A 5G 15-inch Convertible That Isn't Huge Or Unwieldy
In previous years, the Dell Latitude family would consist of only the budget Latitude 3000 series, mid-range Latitude 5000 series, and the high-end Latitude 7000 series. For 2020, Dell has introduced the Latitude 9000 series with the intent of offering the absolute thinnest and most feature-packed business laptops that the manufacturer can produce.
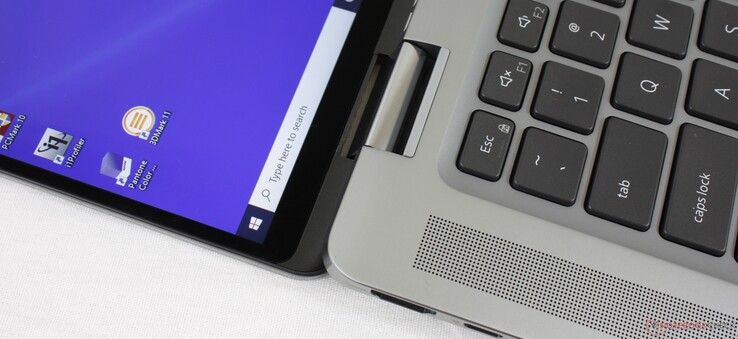
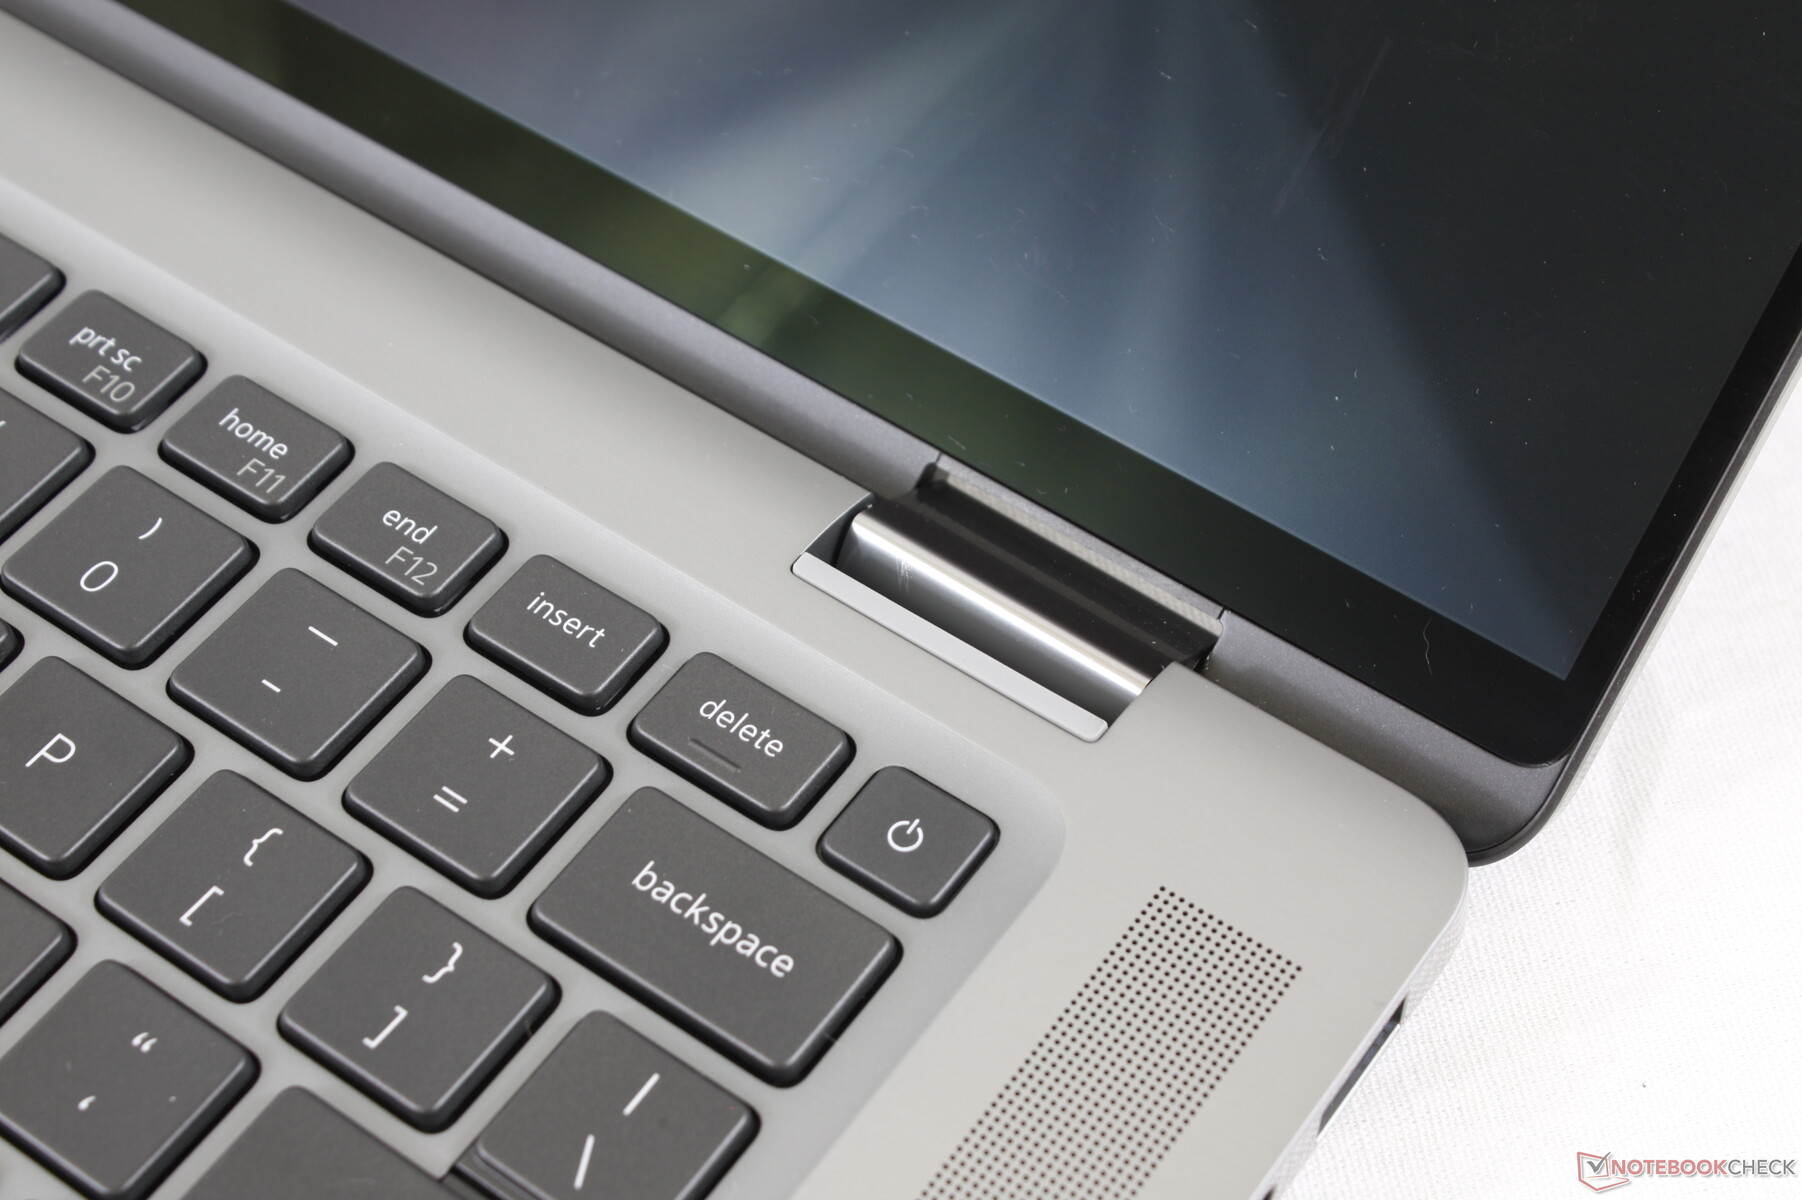
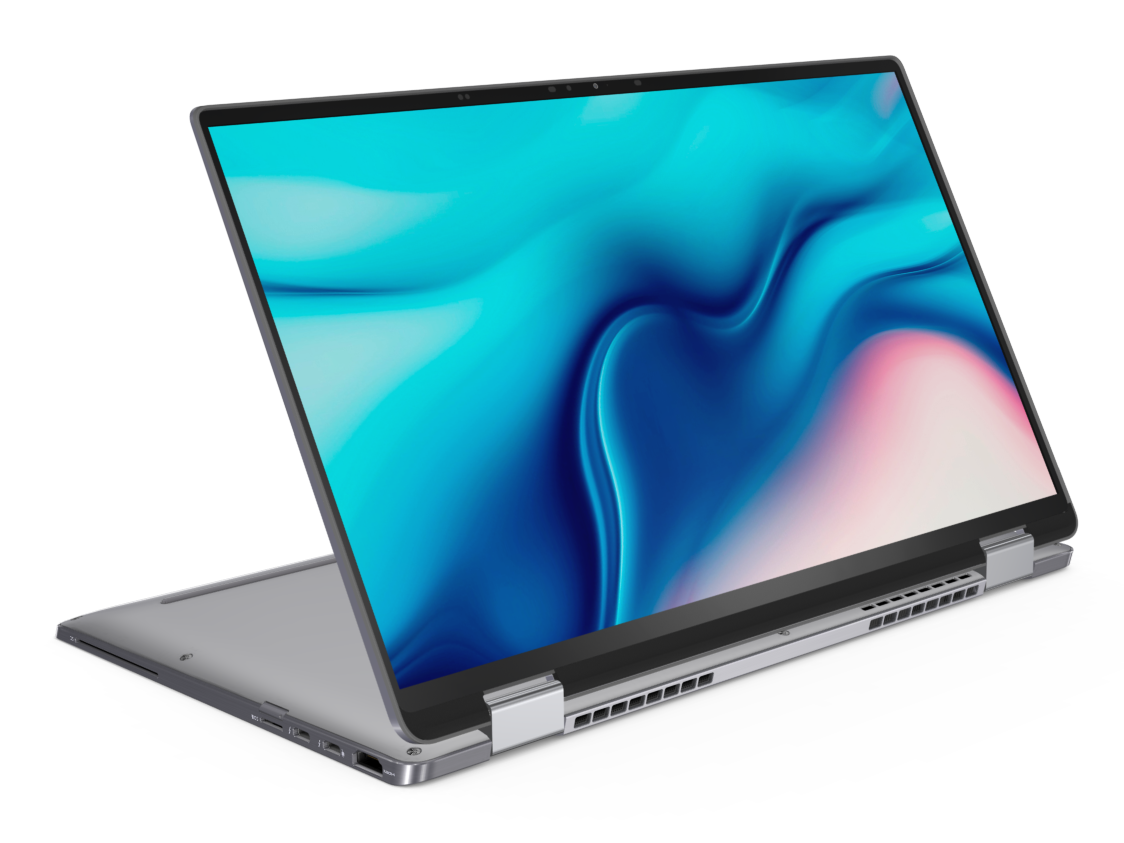
Kicking off the new Latitude 9000 line are the 15.0-inch Latitude 9510 clamshell and Latitude 9510 2-in-1. These systems inherit characteristics from the Latitude 7000 series including the unique proximity sensor albeit in an even thinner and sleeker chassis design. Users who prefer a smaller screen size can go with the 14-inch version instead called the Latitude 9410.
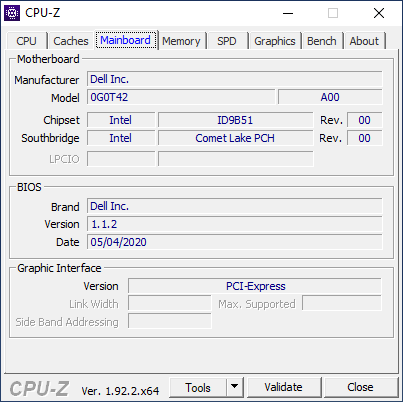
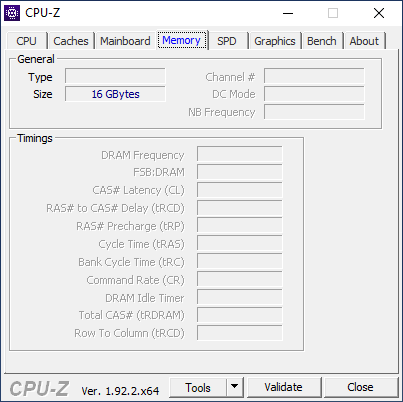
SKUs range from the 10th gen Comet Lake-U Core i5-10210U CPU, 8 GB LPDDR3-2133 RAM, 128 GB SSD, and 1080p display for $1600 up to the Core i7-10810U, 16 GB LPDDR3-2133 RAM, 1 TB SSD, and same 1080p display for $2900 USD. Our test unit is a higher-end configuration but without the optional 5G WAN or Smart Card reader.
Competitors in this space include ultra-thin business laptops like the Lenovo X1 Carbon, ThinkPad T15, or the HP EliteBook series.
More Dell reviews:
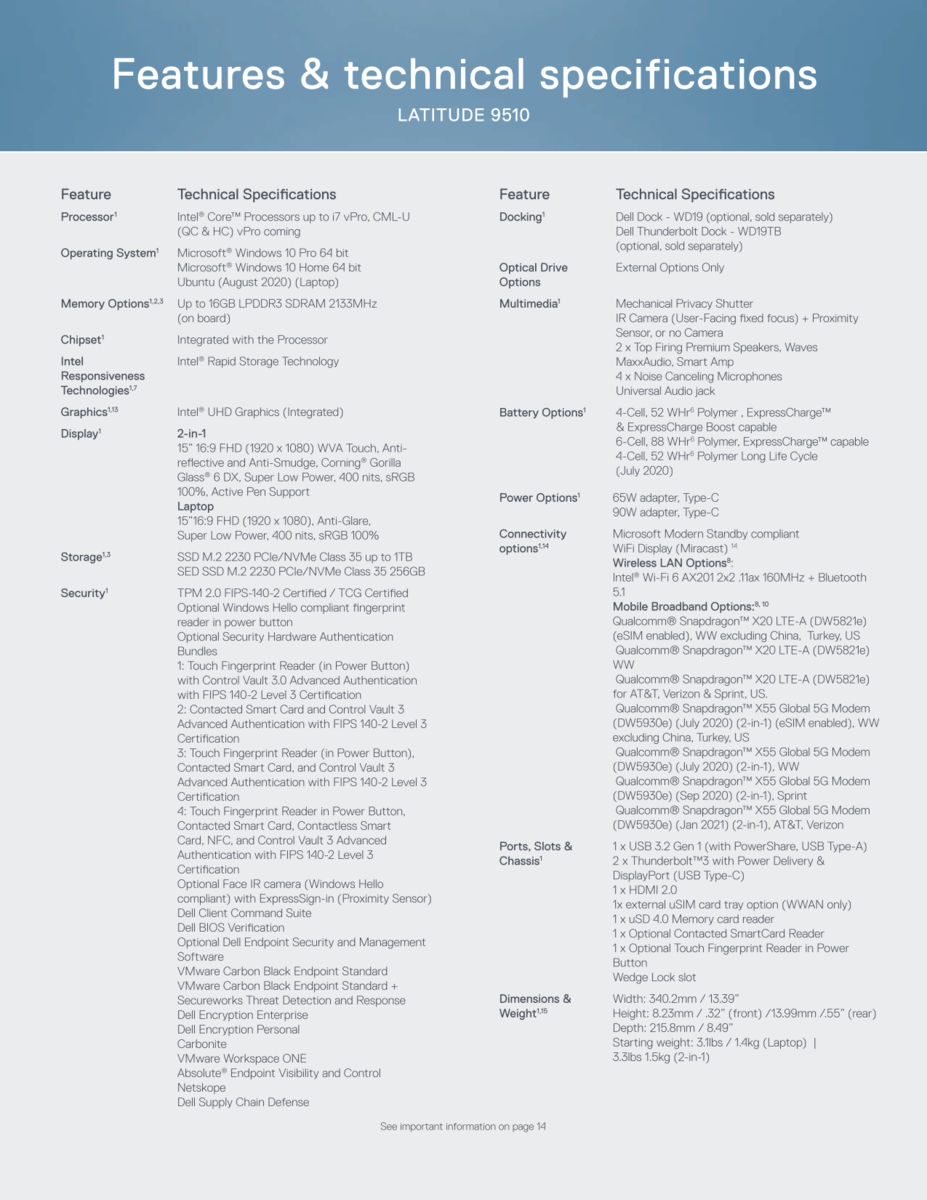

Rating | Date | Model | Weight | Height | Size | Resolution | Price |
|---|---|---|---|---|---|---|---|
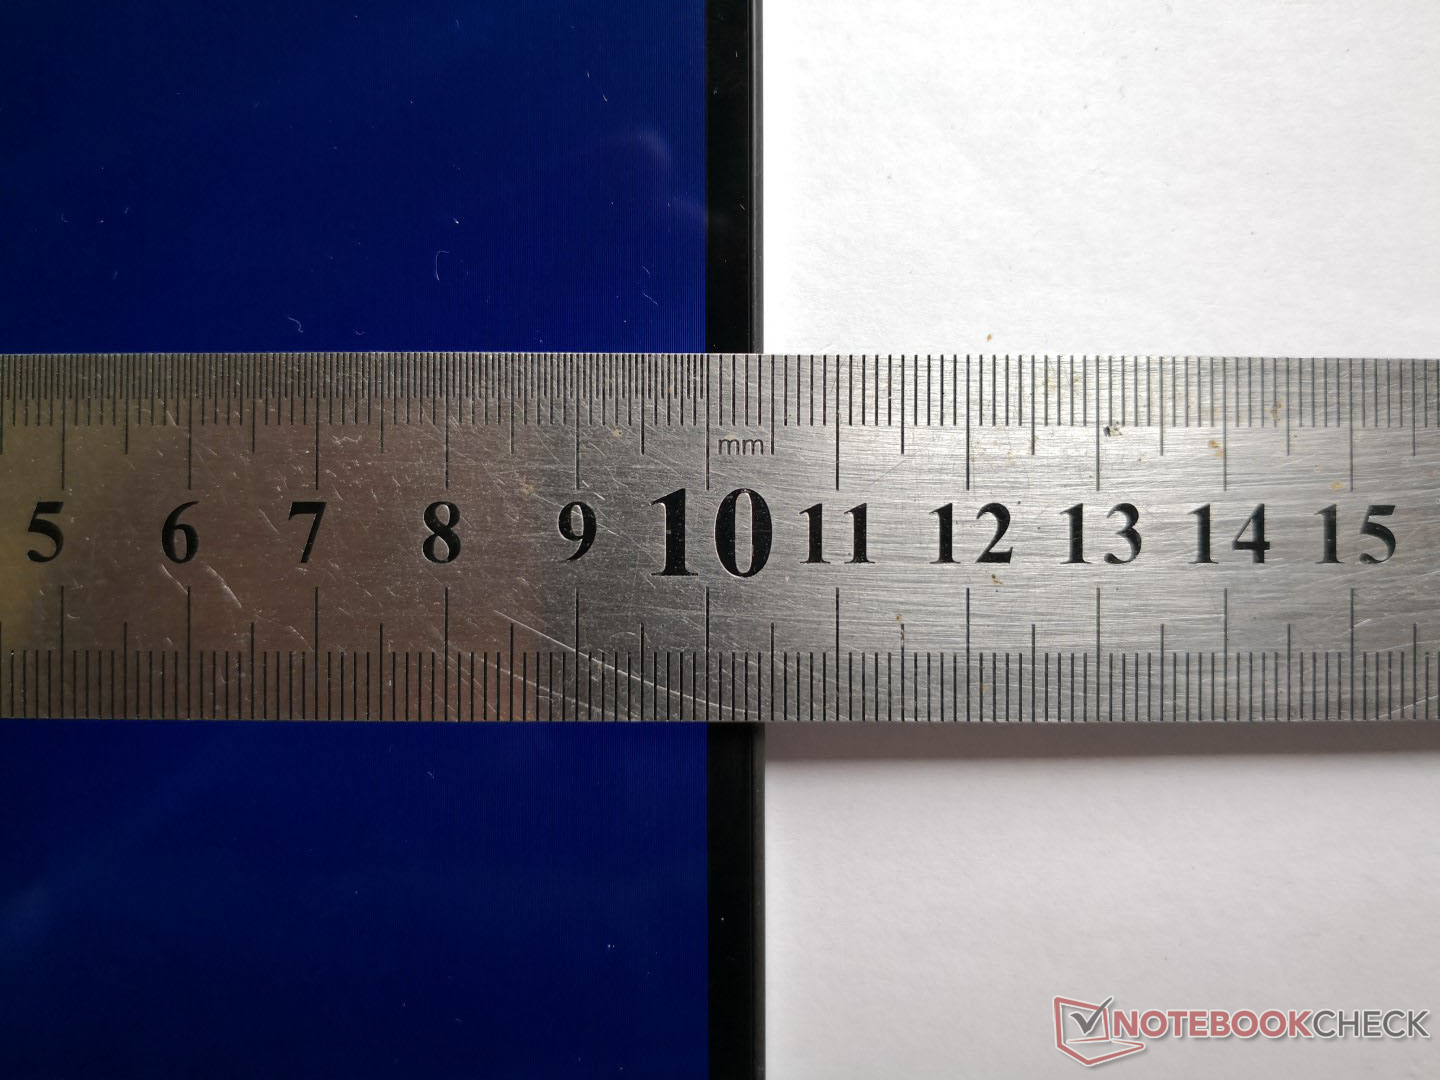
| 88.6 % v7 (old) | 07 / 2020 | Dell Latitude 9510 2-in-1 i7-10810U, UHD Graphics 620 | 1.7 kg | 13.99 mm | 15.00" | 1920x1080 | |
| 87.2 % v7 (old) | 07 / 2020 | Lenovo ThinkPad T15 Gen1-20S7S02U00 i7-10510U, GeForce MX330 | 1.8 kg | 19.95 mm | 15.60" | 3840x2160 | |
| 81.8 % v7 (old) | 02 / 2020 | Lenovo ThinkBook 15 i5-10210U, UHD Graphics 620 | 1.9 kg | 18.9 mm | 15.60" | 1920x1080 | |
| 82.9 % v7 (old) | 11 / 2019 | Dynabook Tecra X50-F i7-8665U, UHD Graphics 620 | 1.4 kg | 17.6 mm | 15.60" | 1920x1080 | |
| 80.4 % v7 (old) | 06 / 2020 | HP Envy x360 15-dr1679cl i7-10510U, UHD Graphics 620 | 2.1 kg | 17.2 mm | 15.60" | 1920x1080 | |
| 84.2 % v6 (old) | 08 / 2018 | Dell Latitude 5591 i7-8850H, GeForce MX130 | 2.3 kg | 24.3 mm | 15.60" | 1920x1080 |
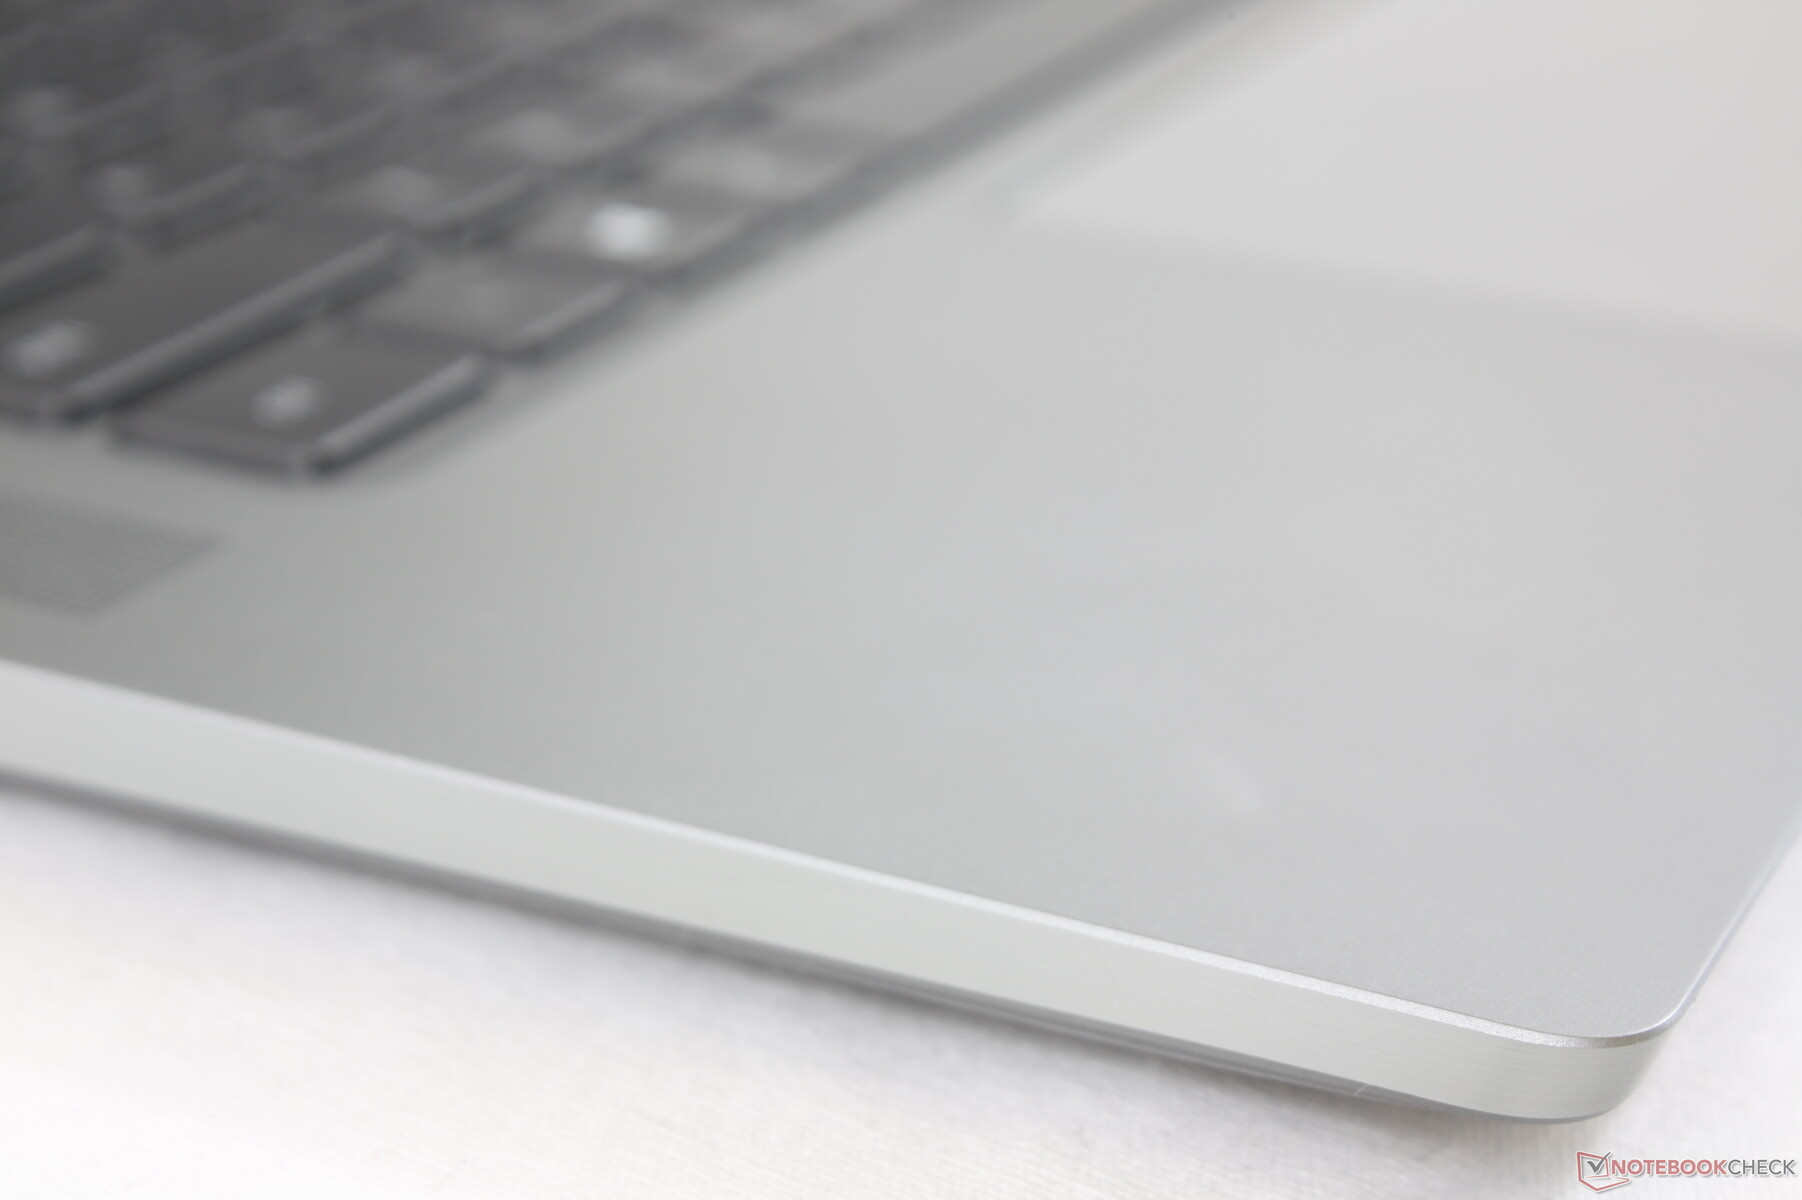
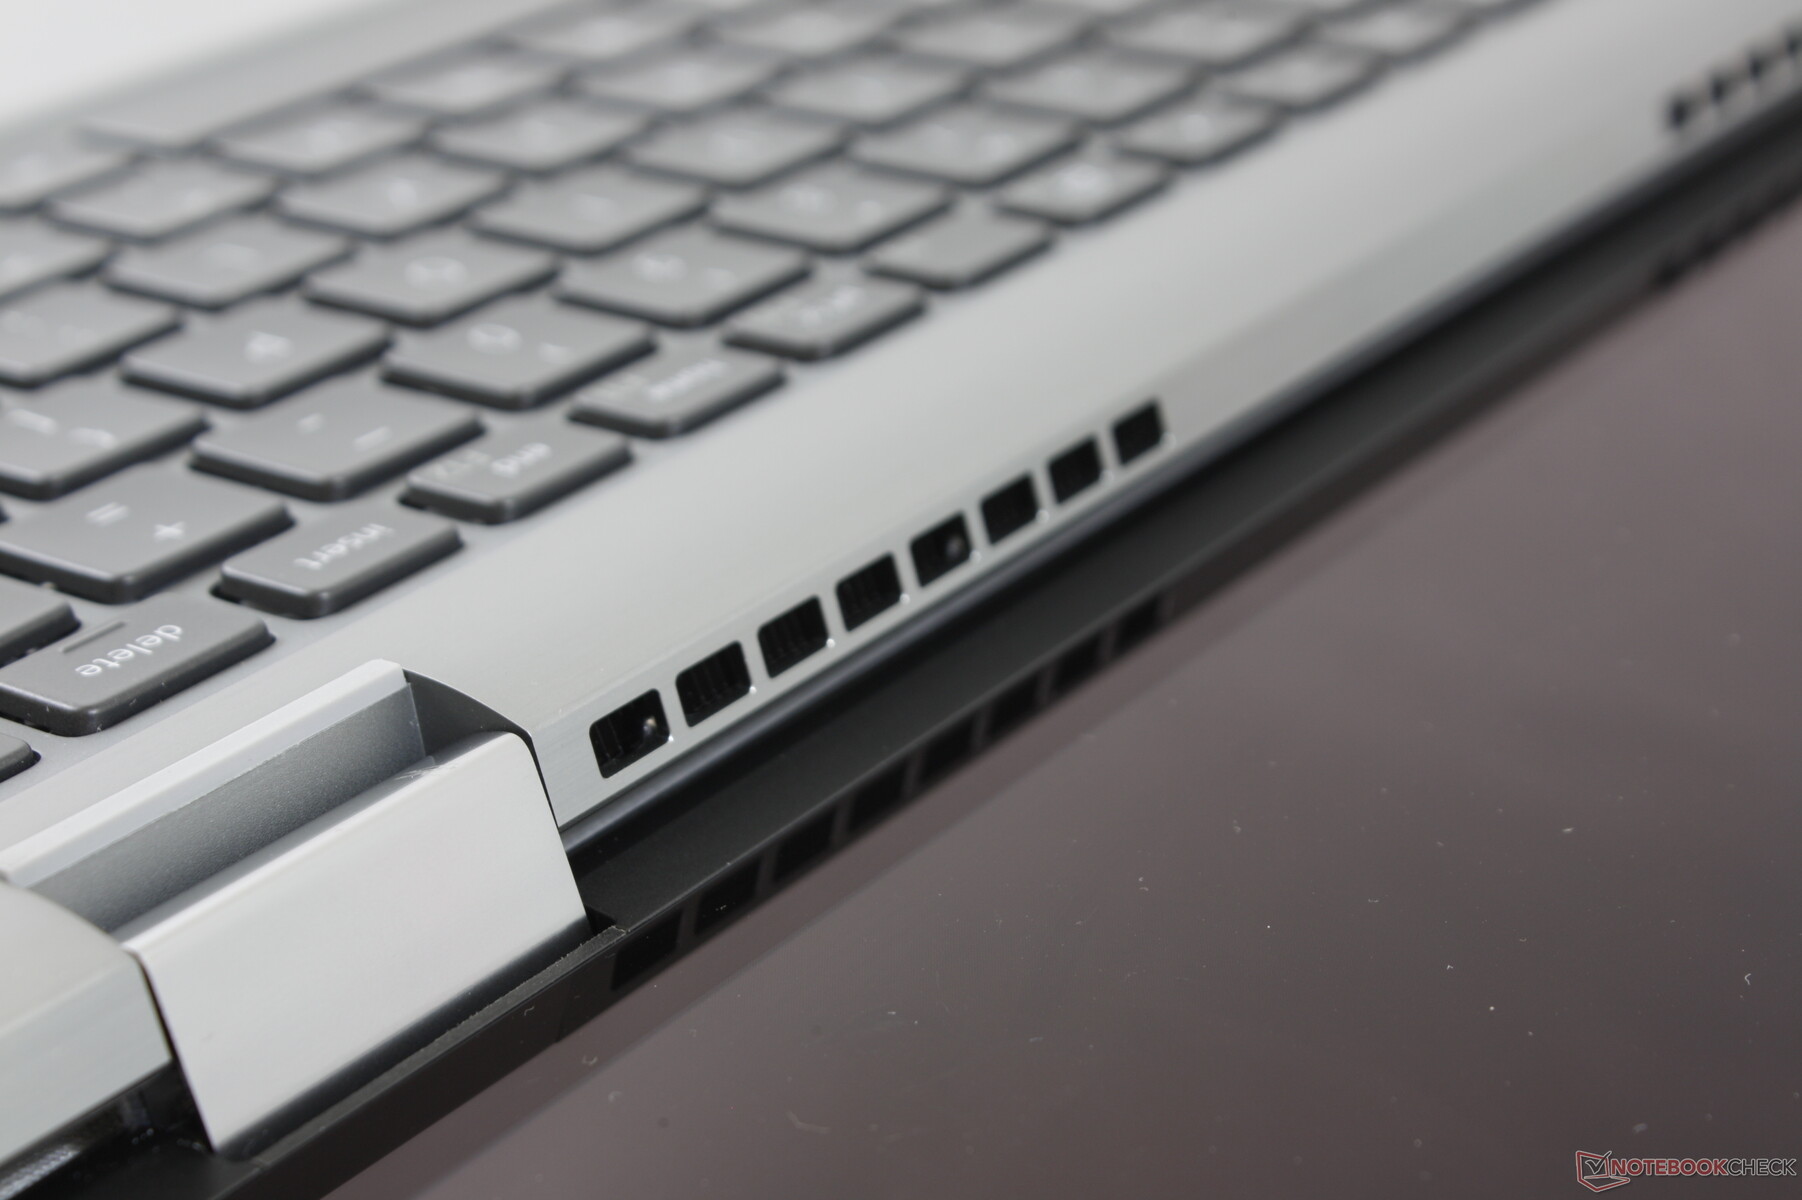
Case
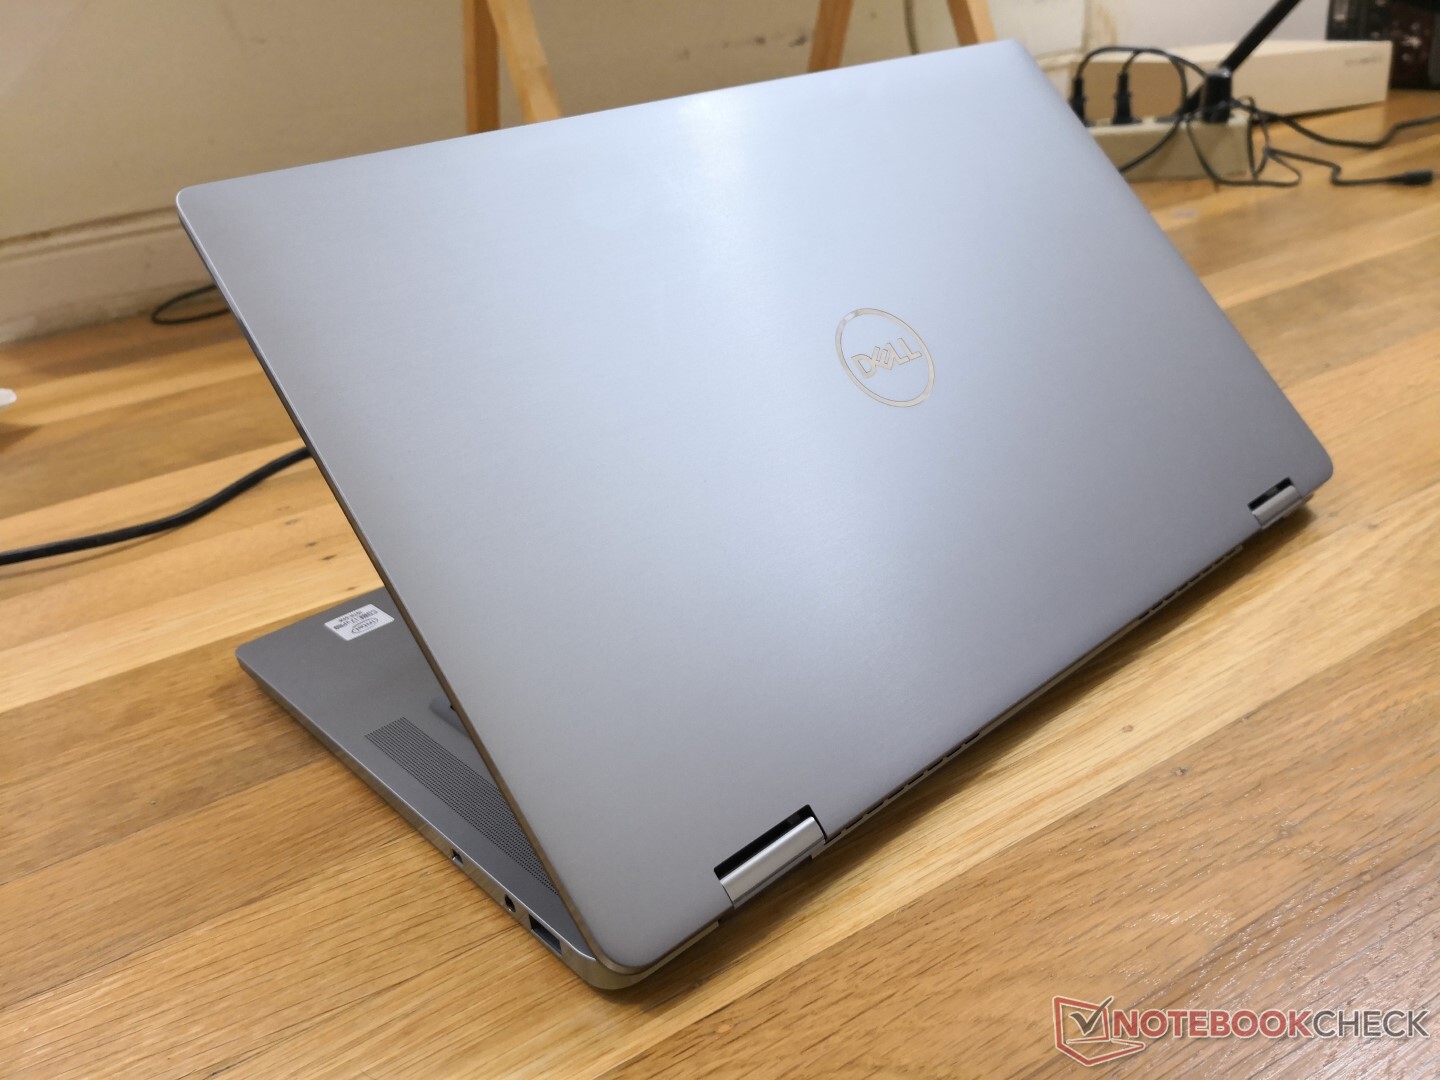
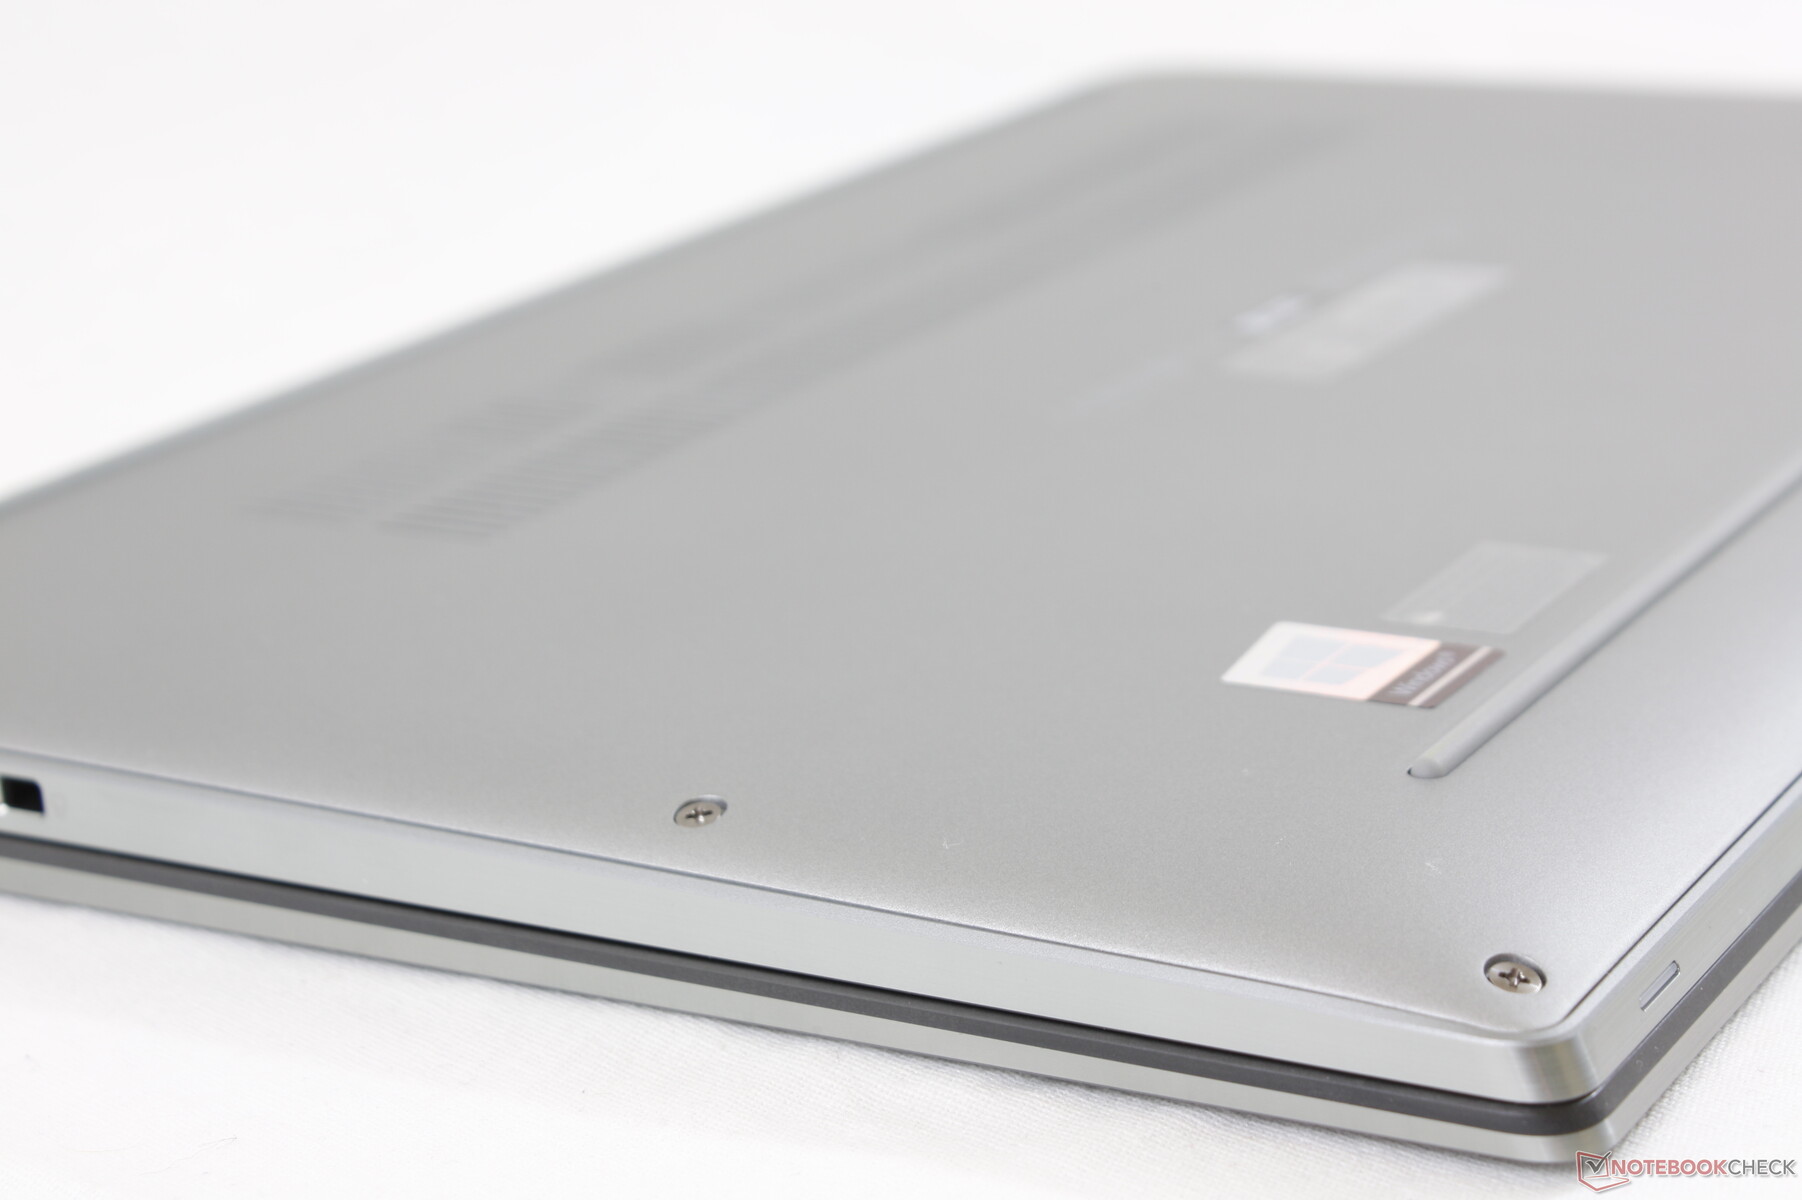
Unlike the Latitude 7310 or 7410 which come in carbon fiber or aluminum options, the Latitude 9510 comes only in aluminum alloy. Its keyboard base feels more rigid than the Lenovo X1 Carbon with only minimal flexing when applying pressure on the keyboard center. Hinges feel firm with no creaking as well especially when compared to what we just experienced on the XPS 17.
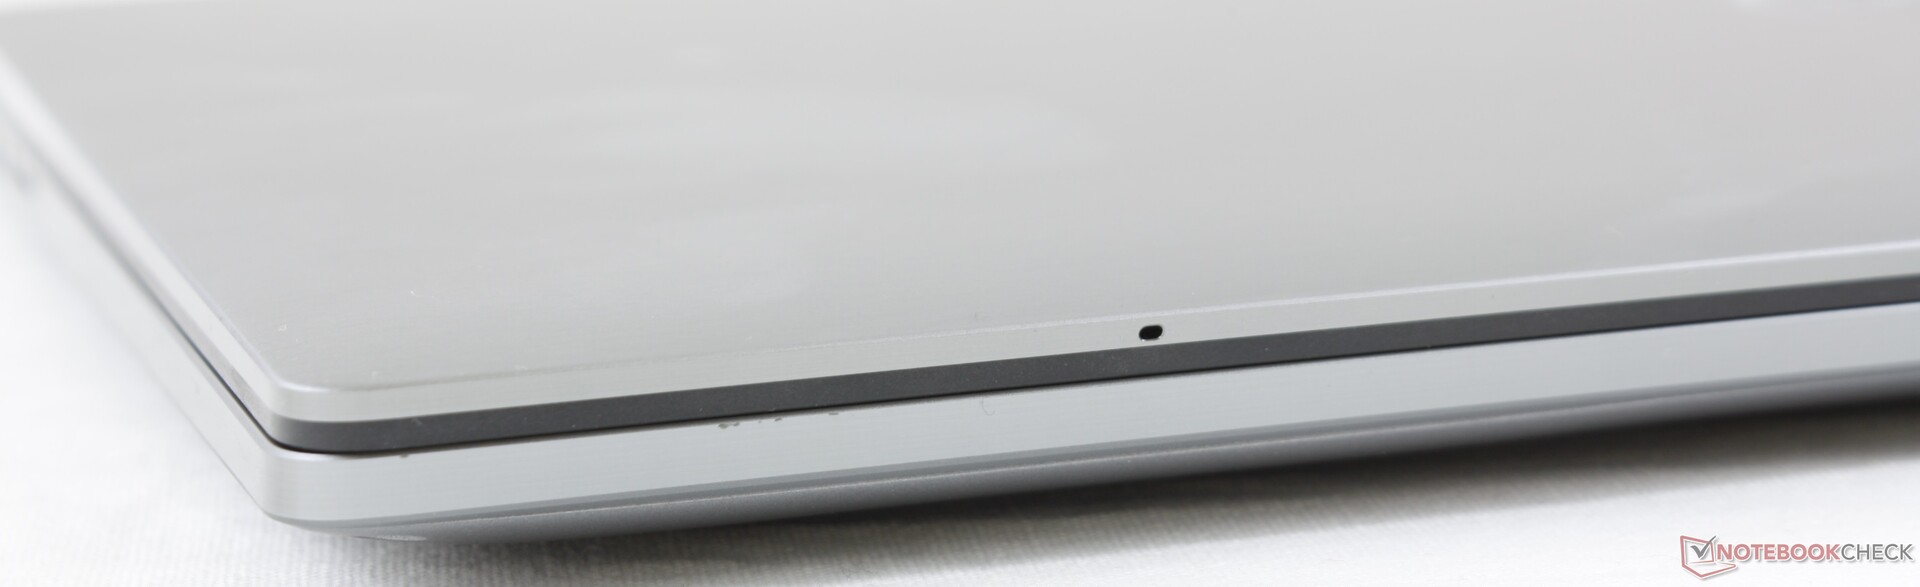
We're able to notice slight creaking and flexing when attempting to twist the lid from its two corners. The chassis isn't perfect as a result, but it's still impressive given the limited dimensions.
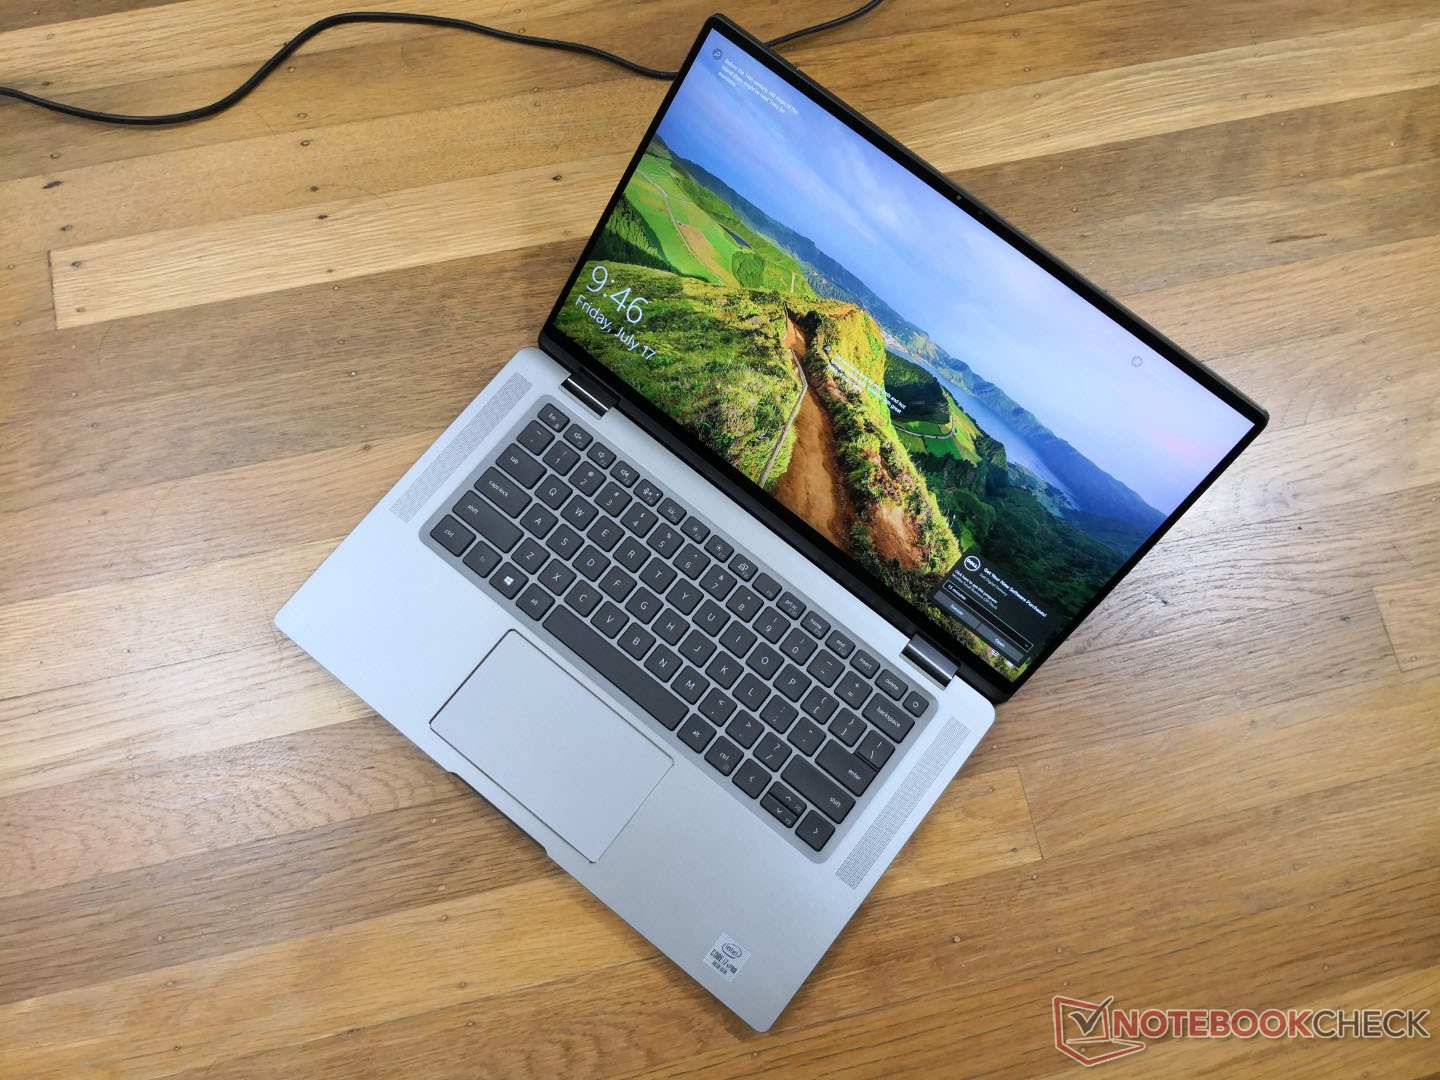
The system is lighter and smaller than many 15.6-inch business laptops including the Lenovo ThinkPad T15 due to the very narrow bezels and smaller 15.0-inch screen size. Dell is sort of cheating in a way with the smaller display, but we think it works in their favor since it makes tablet mode easier to handle.
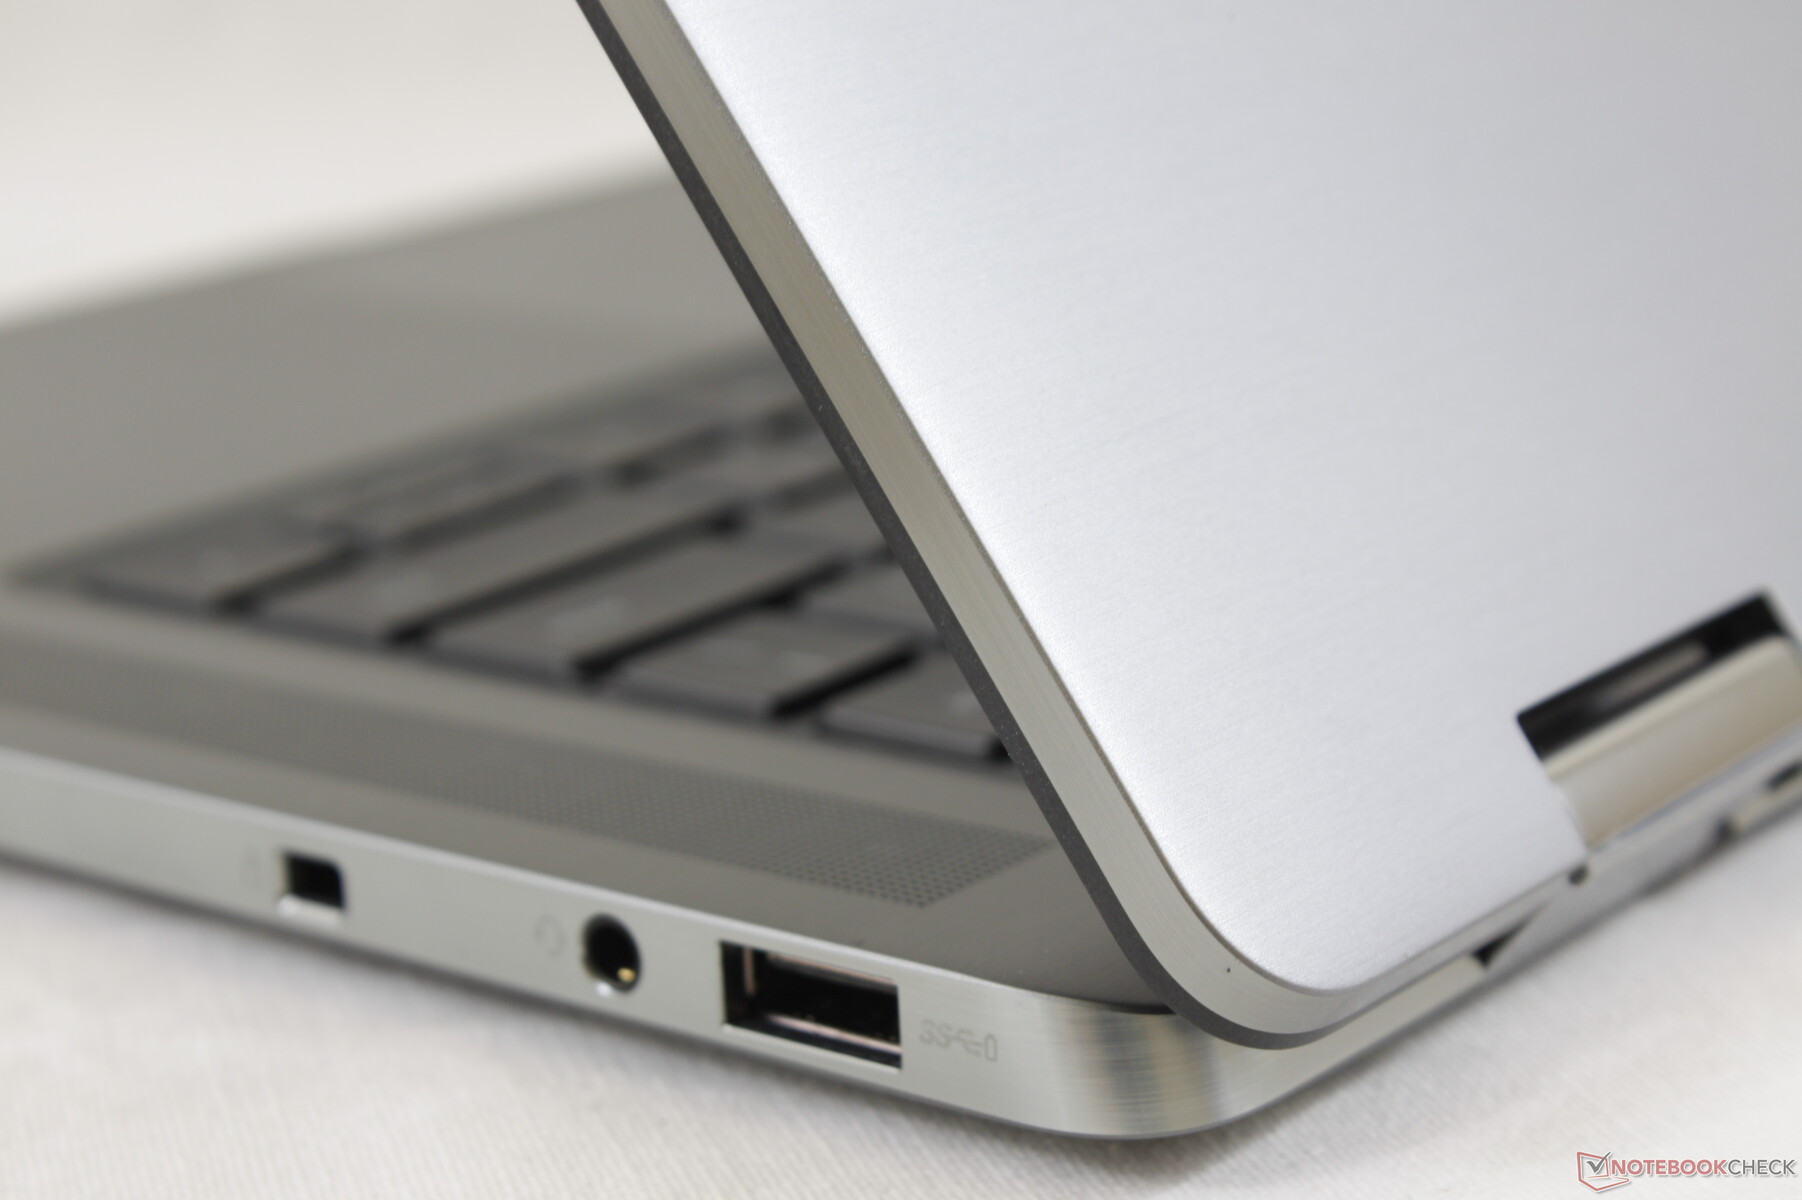
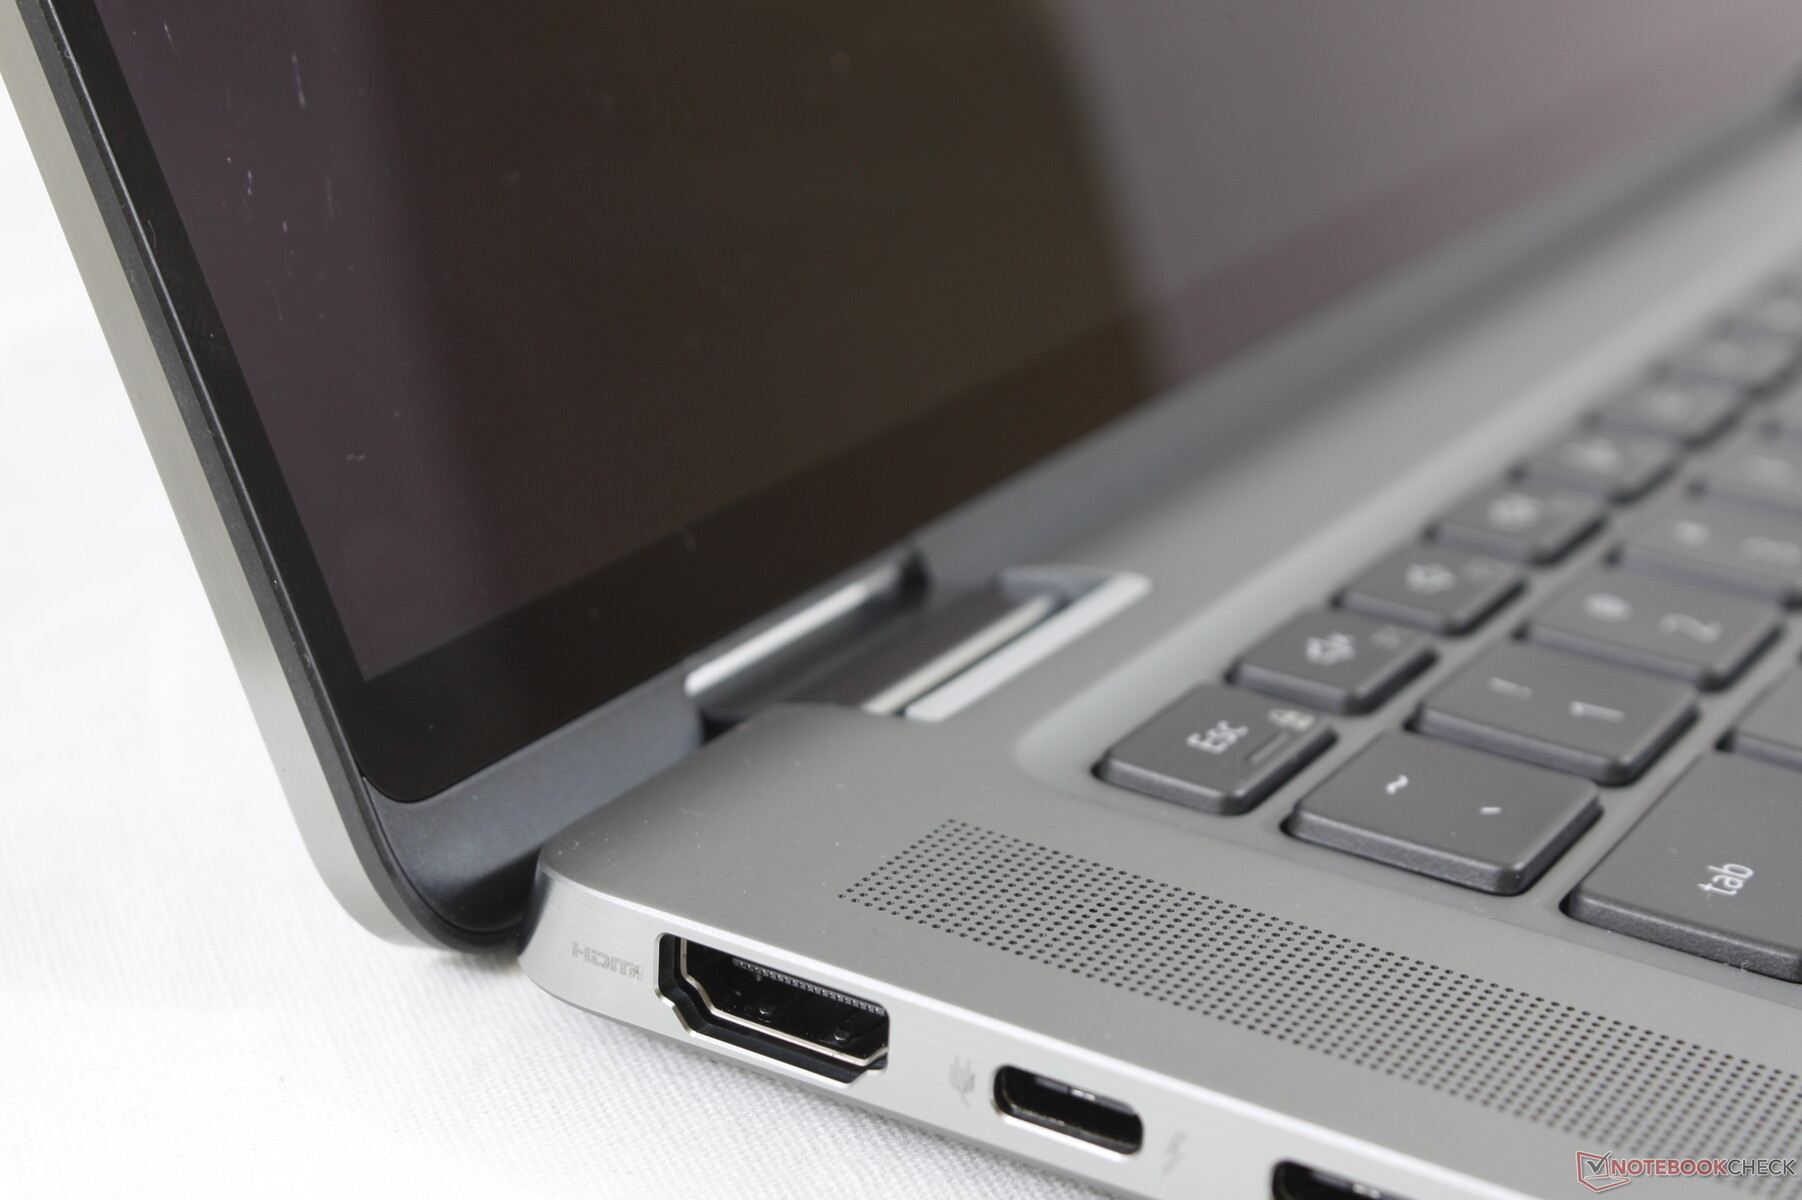

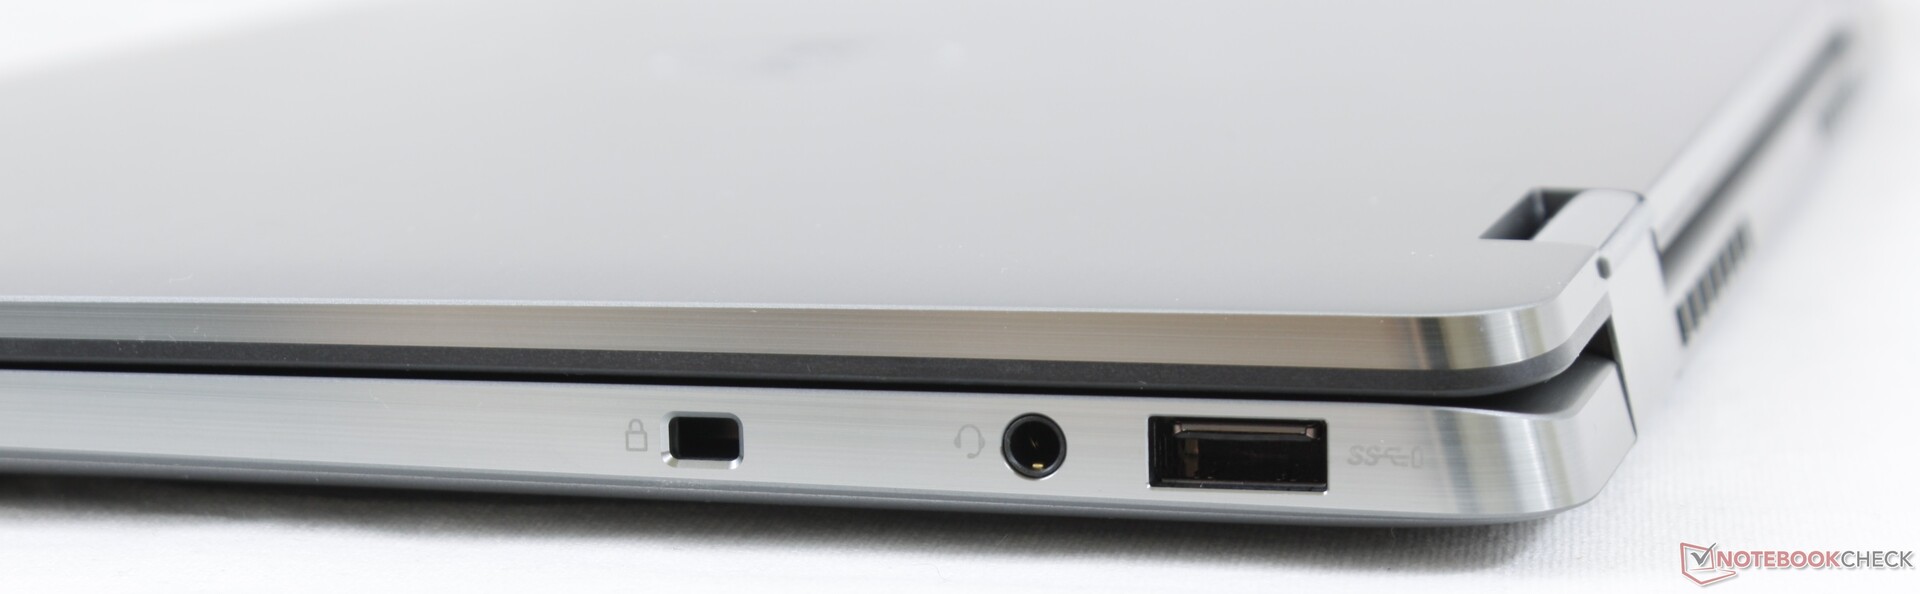
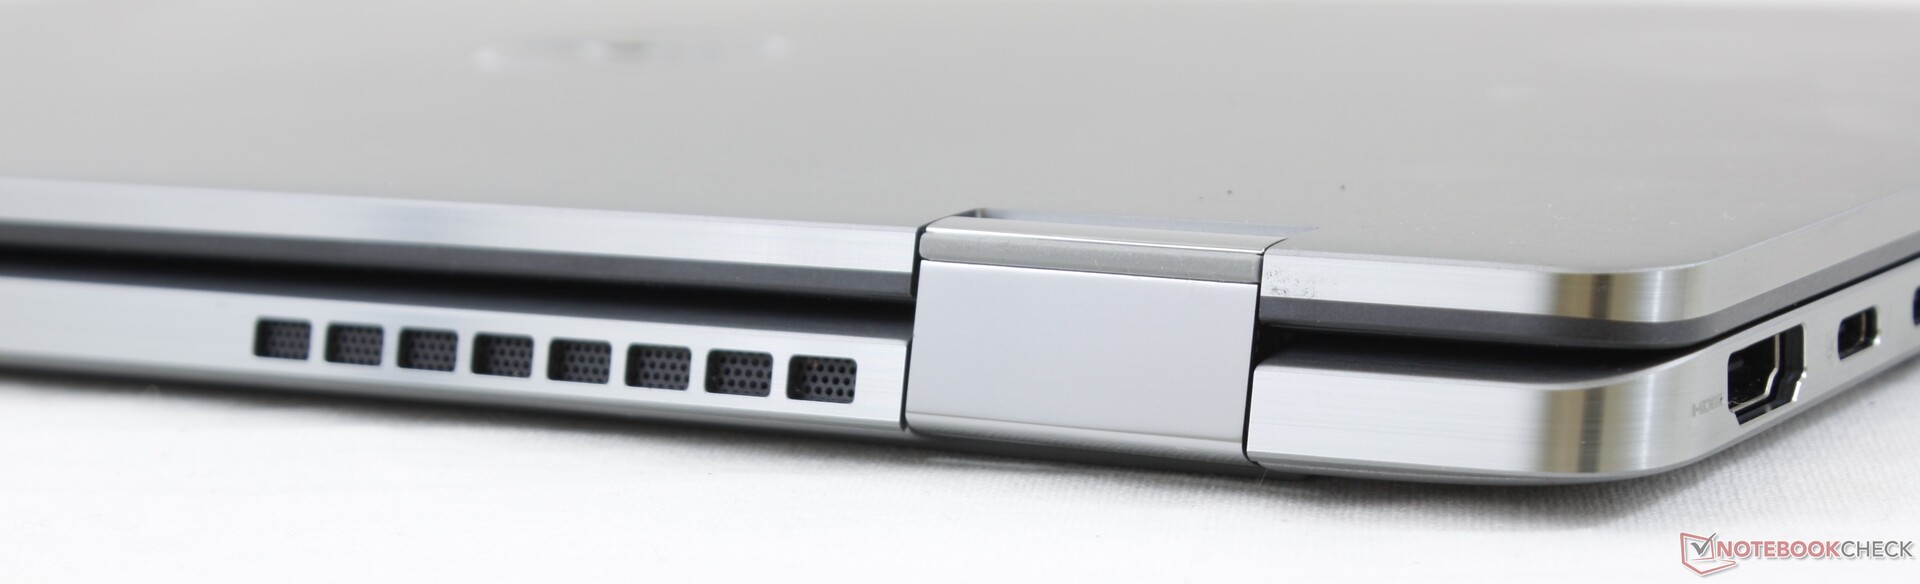
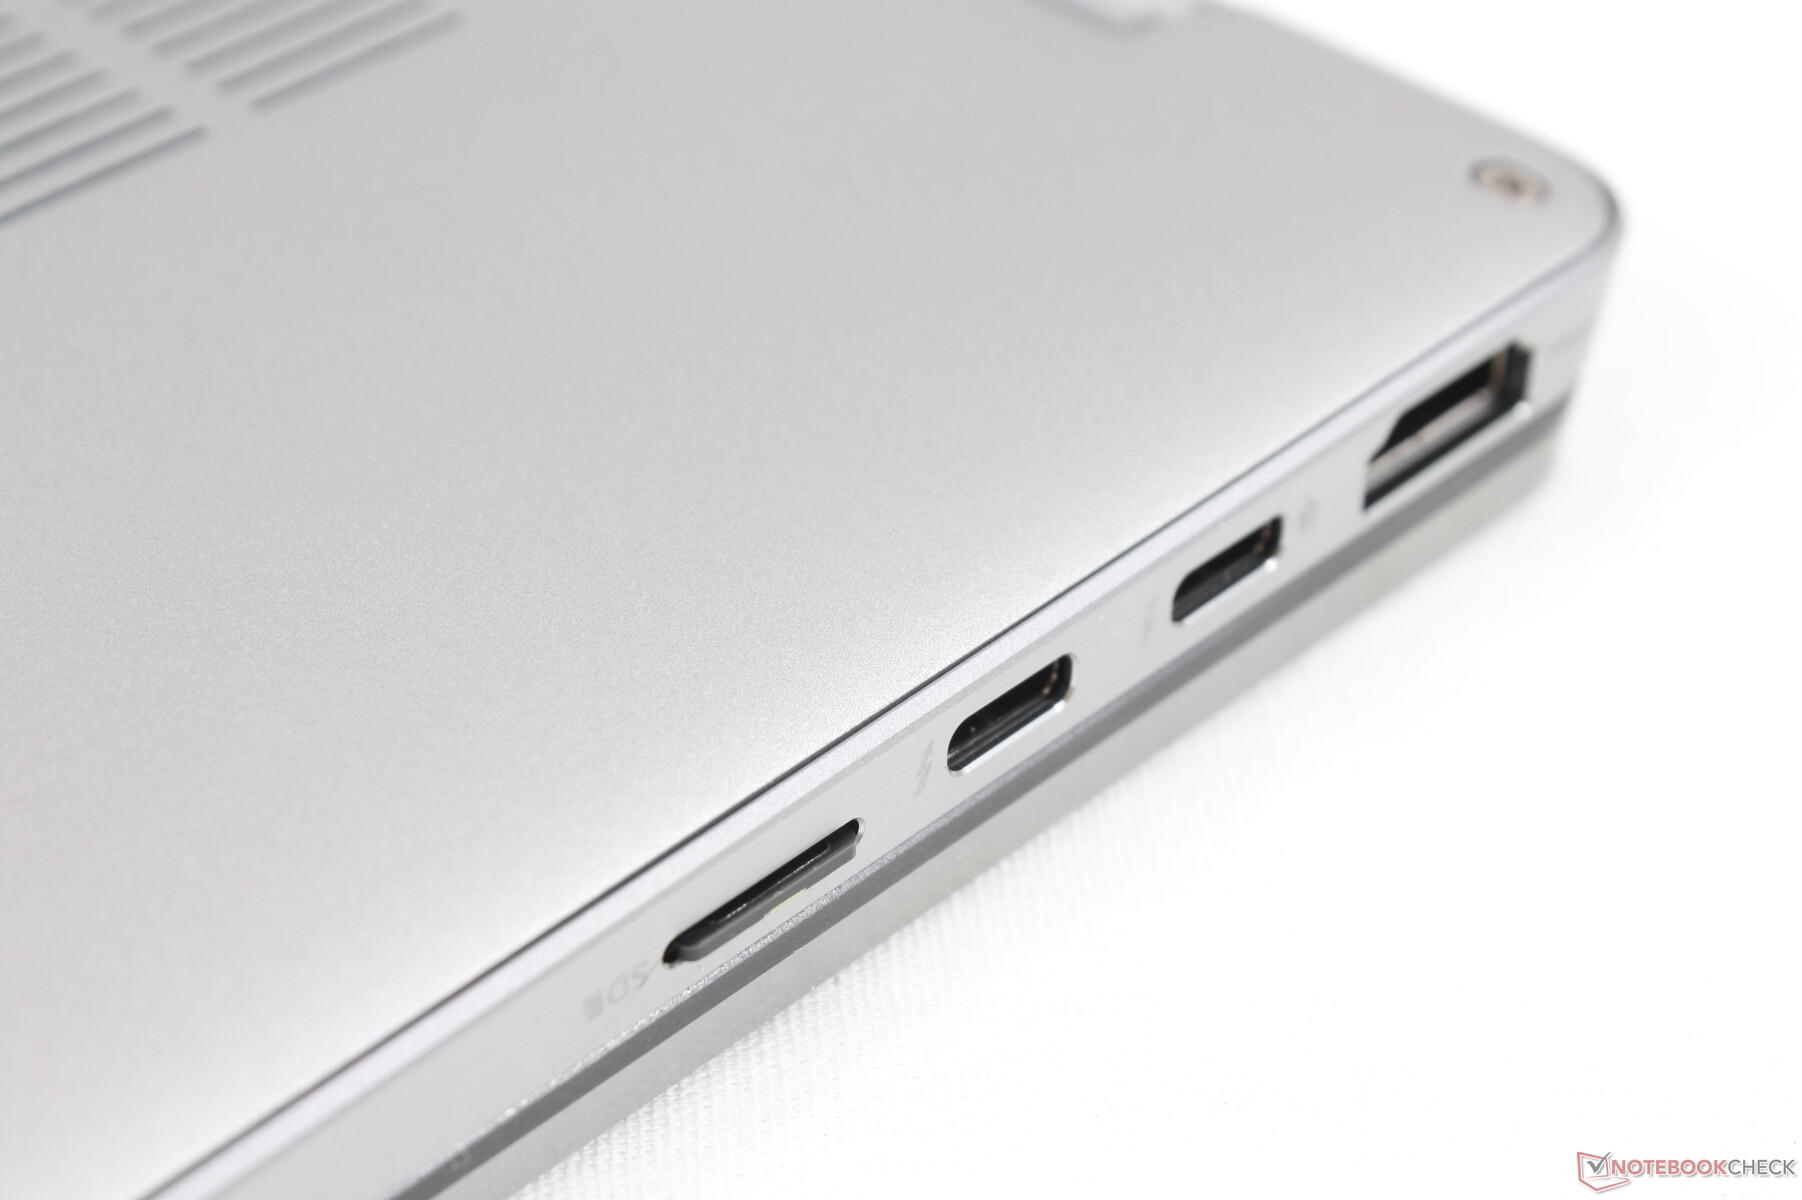
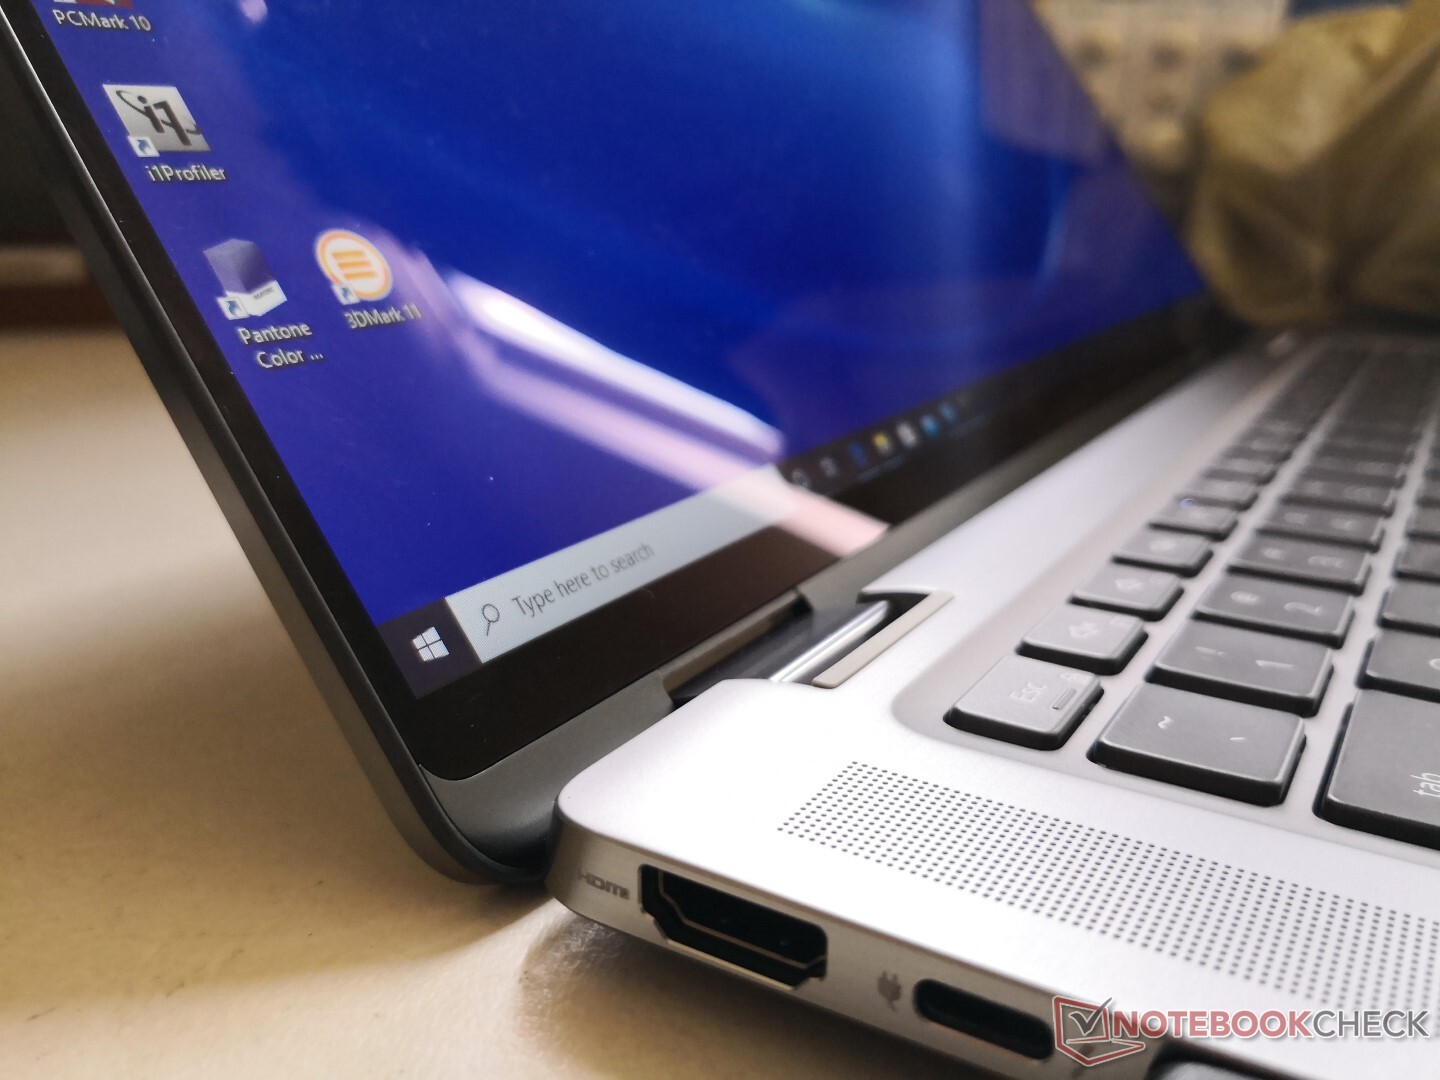
Connectivity
We're glad to see a variety of ports available instead of relying solely on USB-C like what's currently happening on the latest XPS laptops. Our main complaint is that both USB-C ports are along the same edge whereas we would have preferred them to be on opposite edges to accommodate charging on either side.
A Smart Card reader is optional, but its presence will preclude the larger 88 Wh battery option.
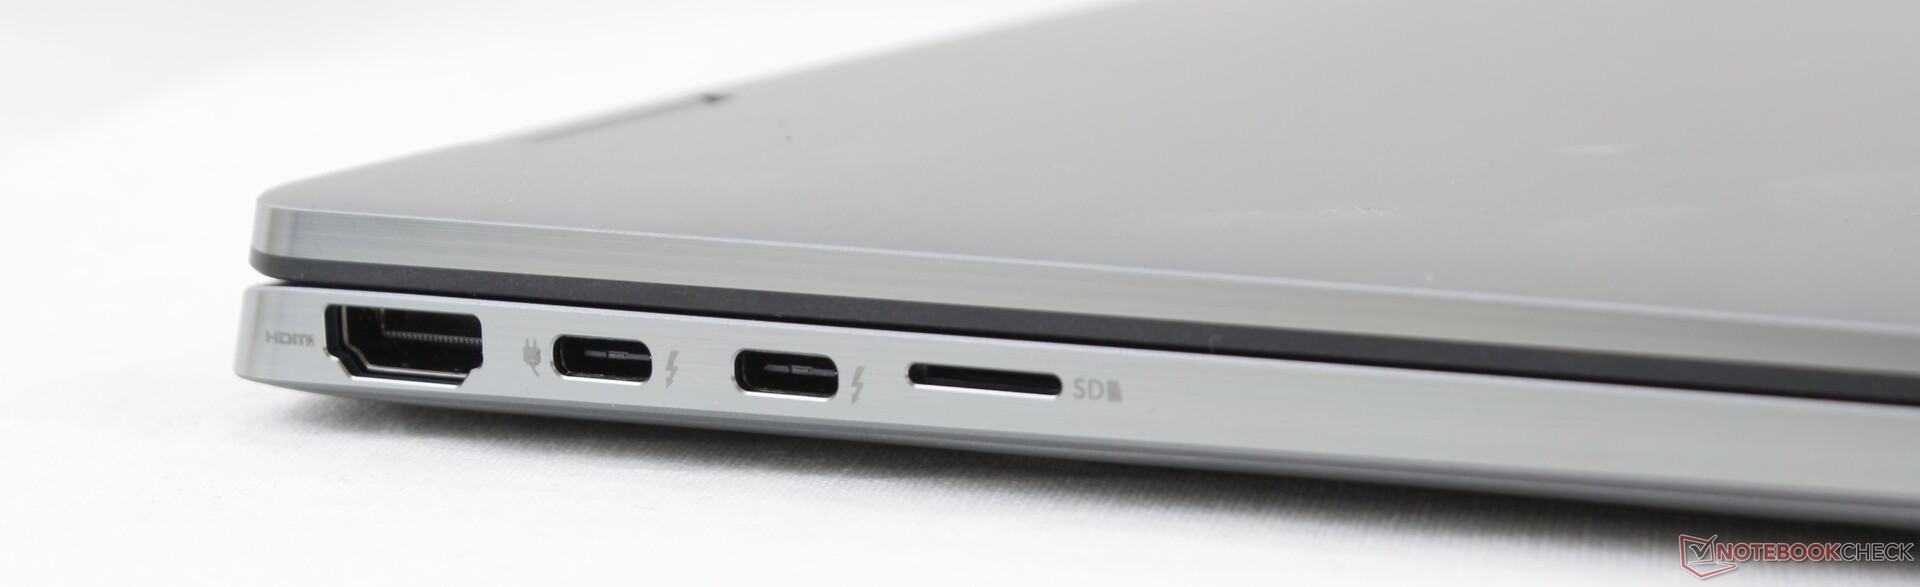
SD Card Reader
Dell Latitude and XPS systems have some of the fastest SD card readers in the market. Moving 1 GB of pictures from our UHS-II test card to desktop takes about 6 to 7 seconds compared to 14 seconds on the ThinkPad T15.
| SD Card Reader | |
| average JPG Copy Test (av. of 3 runs) | |
| Dell Latitude 5591 (Toshiba Exceria Pro SDXC 64 GB UHS-II) | |
| Dell Latitude 9510 2-in-1 (Toshiba Exceria Pro M501 64 GB UHS-II) | |
| Lenovo ThinkPad T15 Gen1-20S7S02U00 (Toshiba Exceria Pro M501 64 GB UHS-II) | |
| HP Envy x360 15-dr1679cl (Toshiba Exceria Pro SDXC 64 GB UHS-II) | |
| Lenovo ThinkBook 15 (Toshiba Exceria Pro SDXC 64 GB UHS-II) | |
| Dynabook Tecra X50-F | |
| maximum AS SSD Seq Read Test (1GB) | |
| Dell Latitude 5591 (Toshiba Exceria Pro SDXC 64 GB UHS-II) | |
| Dell Latitude 9510 2-in-1 (Toshiba Exceria Pro M501 64 GB UHS-II) | |
| Lenovo ThinkPad T15 Gen1-20S7S02U00 (Toshiba Exceria Pro M501 64 GB UHS-II) | |
| Lenovo ThinkBook 15 (Toshiba Exceria Pro SDXC 64 GB UHS-II) | |
| HP Envy x360 15-dr1679cl (Toshiba Exceria Pro SDXC 64 GB UHS-II) | |
| Dynabook Tecra X50-F | |
Communication
The Intel AX201 comes standard for Wi-Fi 6 compatibility. We experienced no connectivty issues when paired to our Netgear RAX200 test router.
4G LTE and 5G are supported alongside eSIM. The Qualcomm X20 and X55 are included if configured with 4G or 5G, respectively.
| Networking | |
| iperf3 transmit AX12 | |
| HP Envy x360 15-dr1679cl | |
| Dell Latitude 9510 2-in-1 | |
| Lenovo ThinkPad T15 Gen1-20S7S02U00 | |
| Honor MagicBook 15 | |
| iperf3 receive AX12 | |
| Lenovo ThinkPad T15 Gen1-20S7S02U00 | |
| Dell Latitude 9510 2-in-1 | |
| HP Envy x360 15-dr1679cl | |
| Honor MagicBook 15 | |
Webcam


Security
Smart Card, fingerprint reader, TPM, vPro, Wedge lock, IR camera, and proximity sensor for Dell ExpressSign-In are all available here. The one option that is not available is a physical webcam shutter which Dell has omitted on the Latitude 9510 2-in-1 but not the Latitude 9510 clamshell.
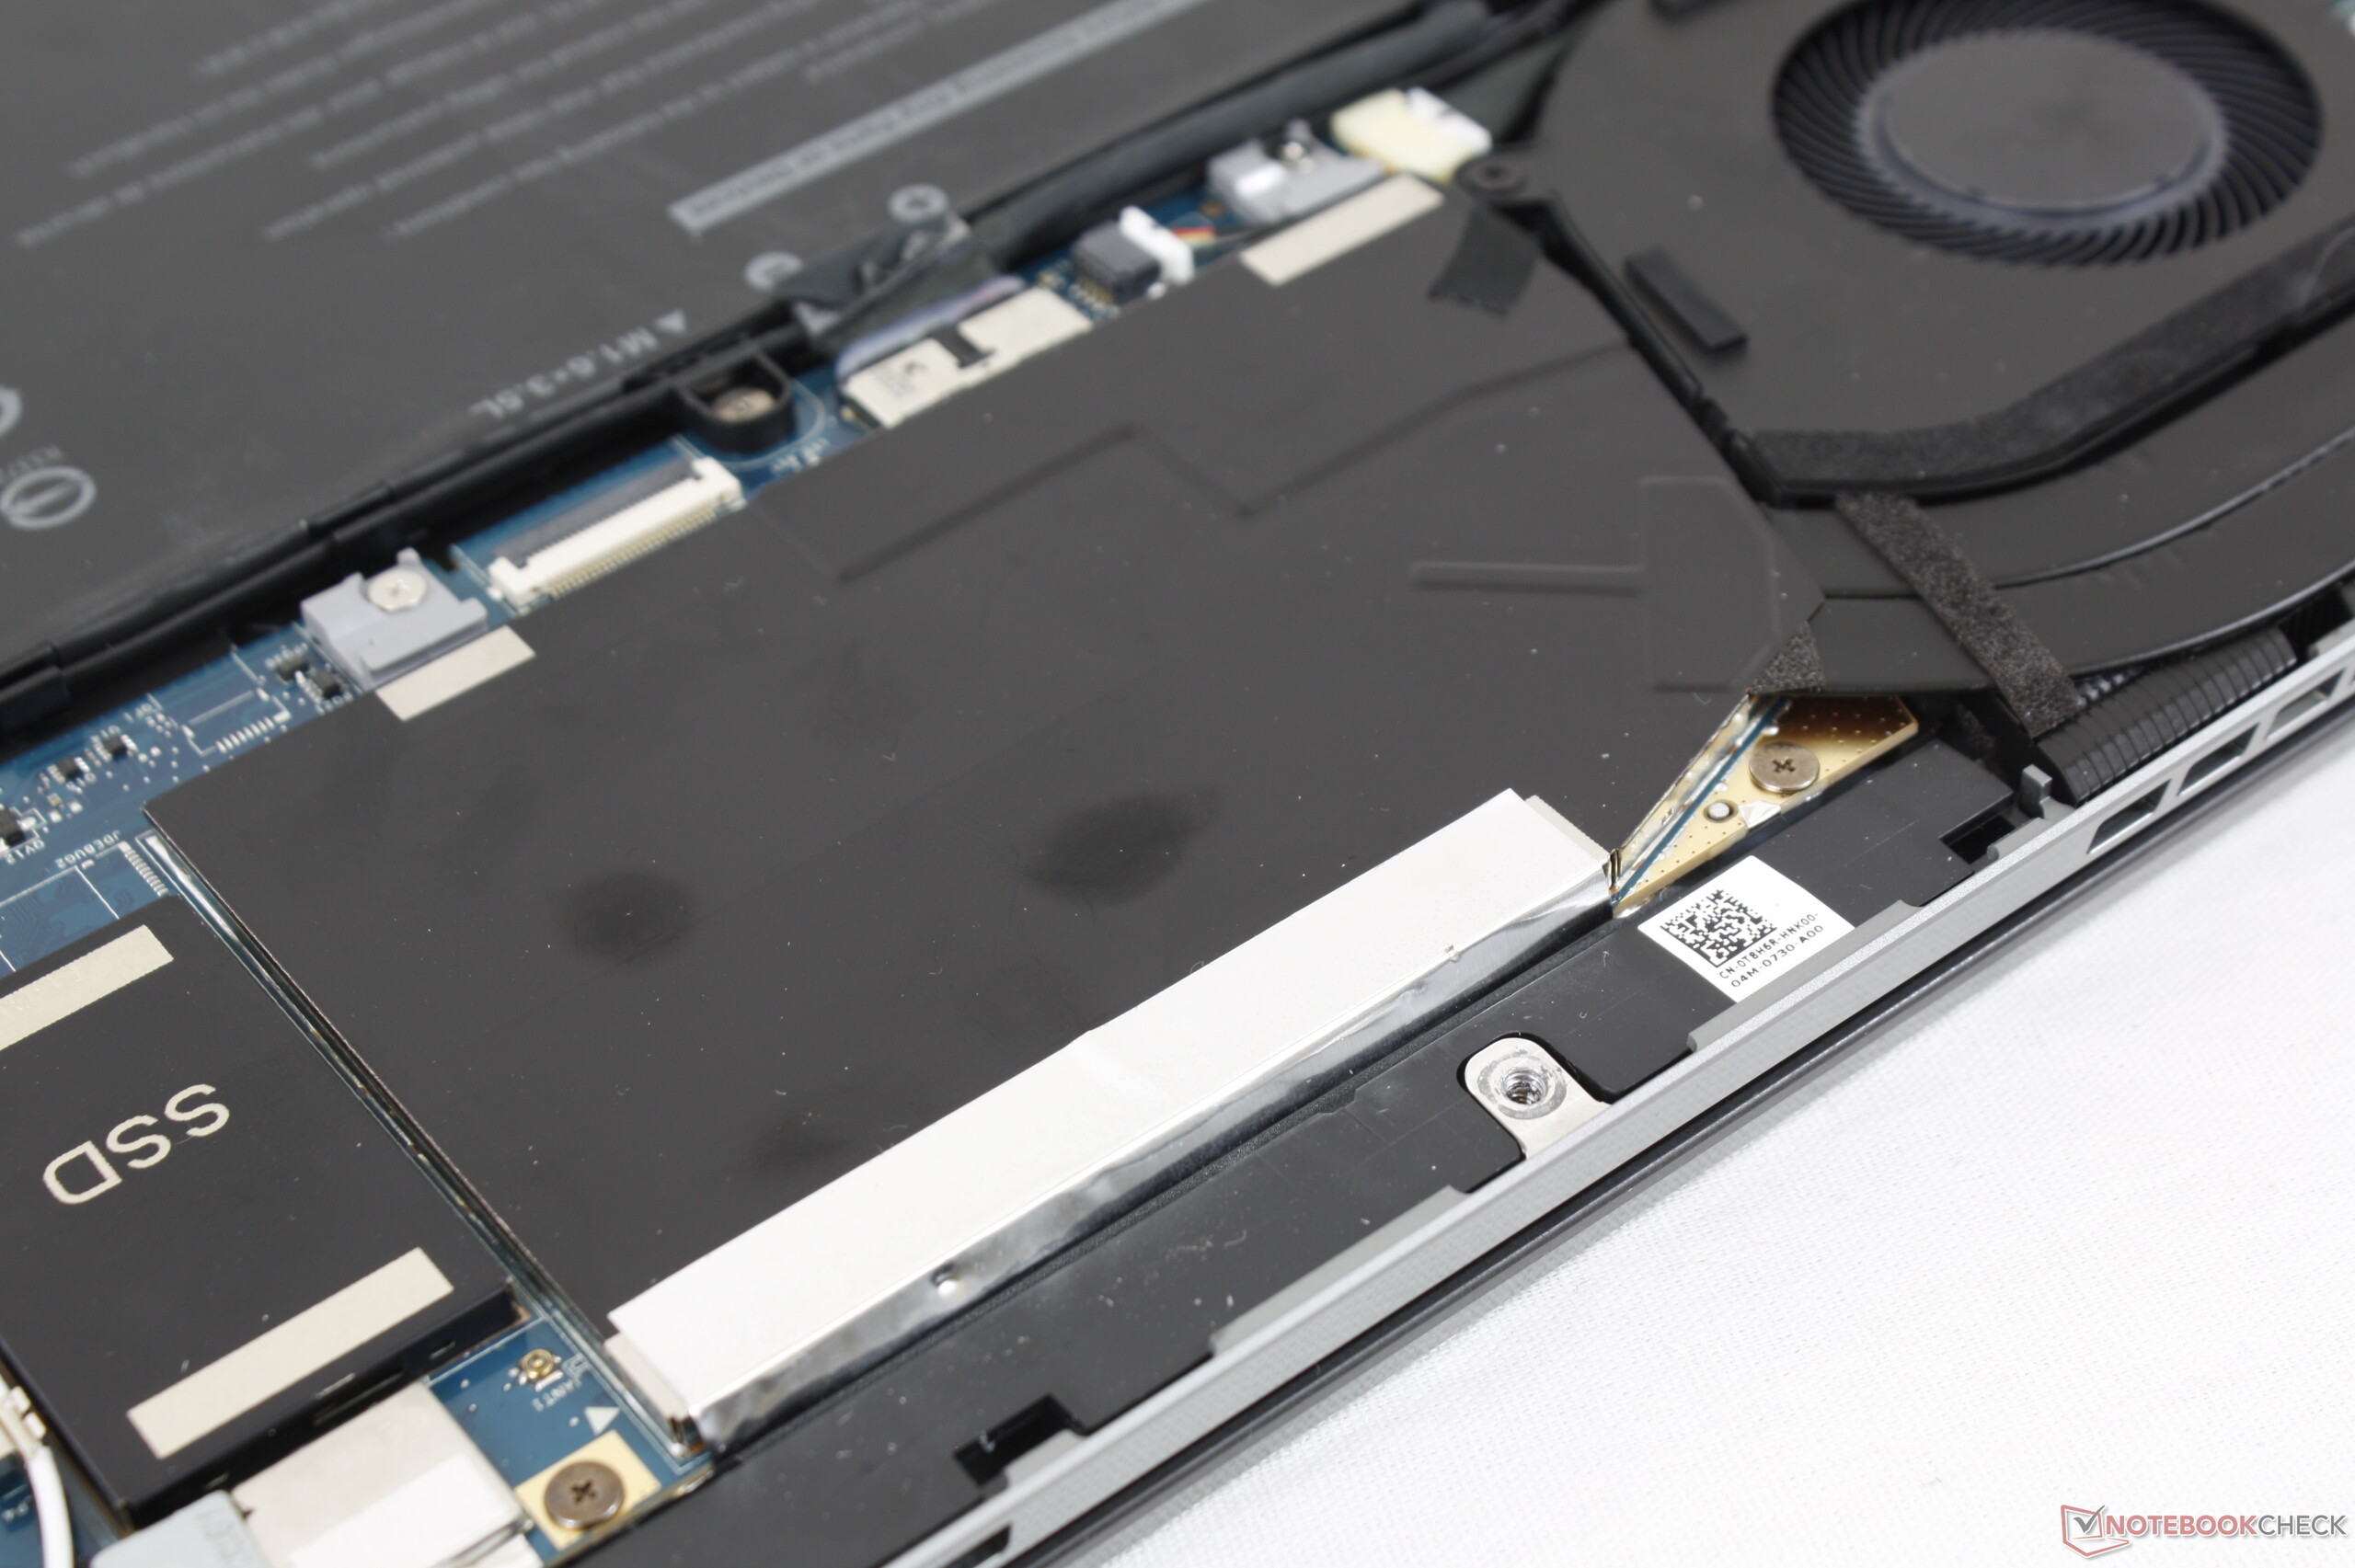
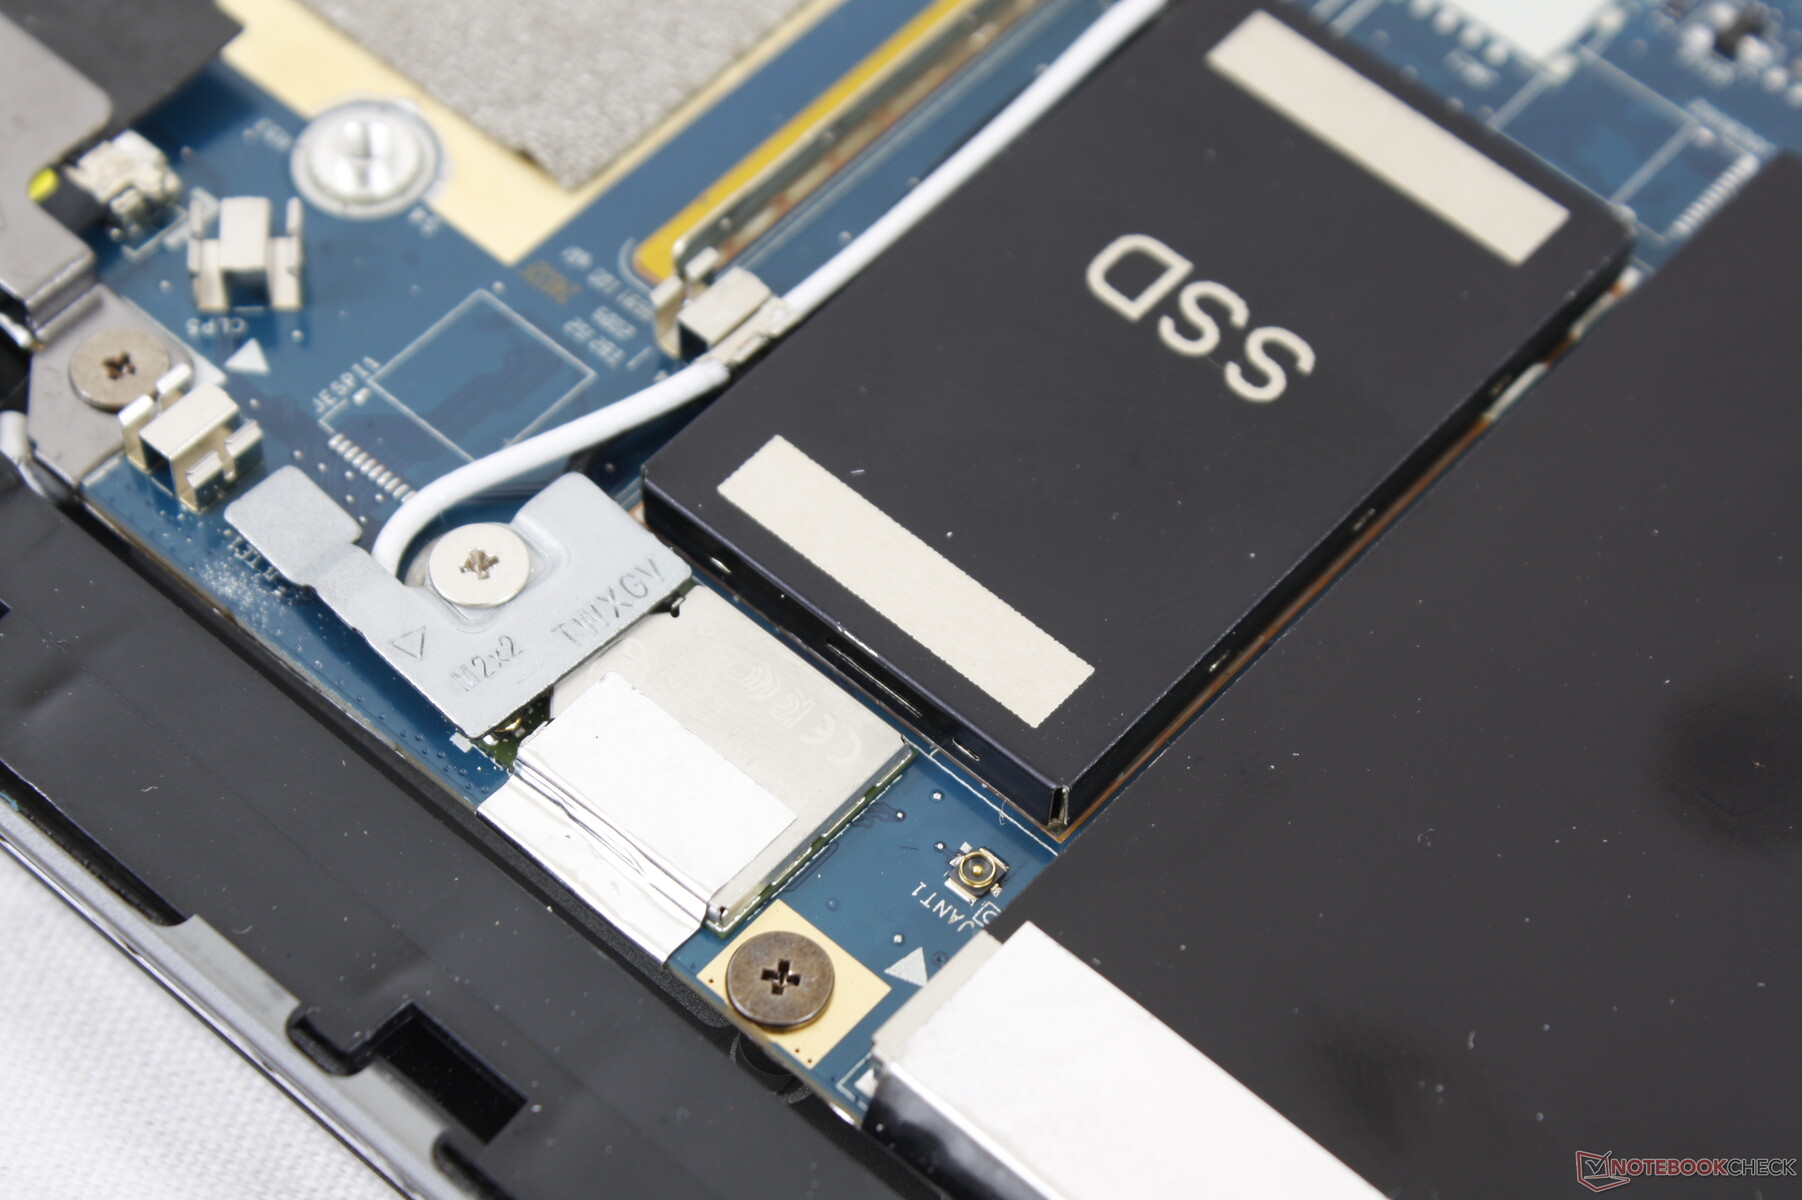
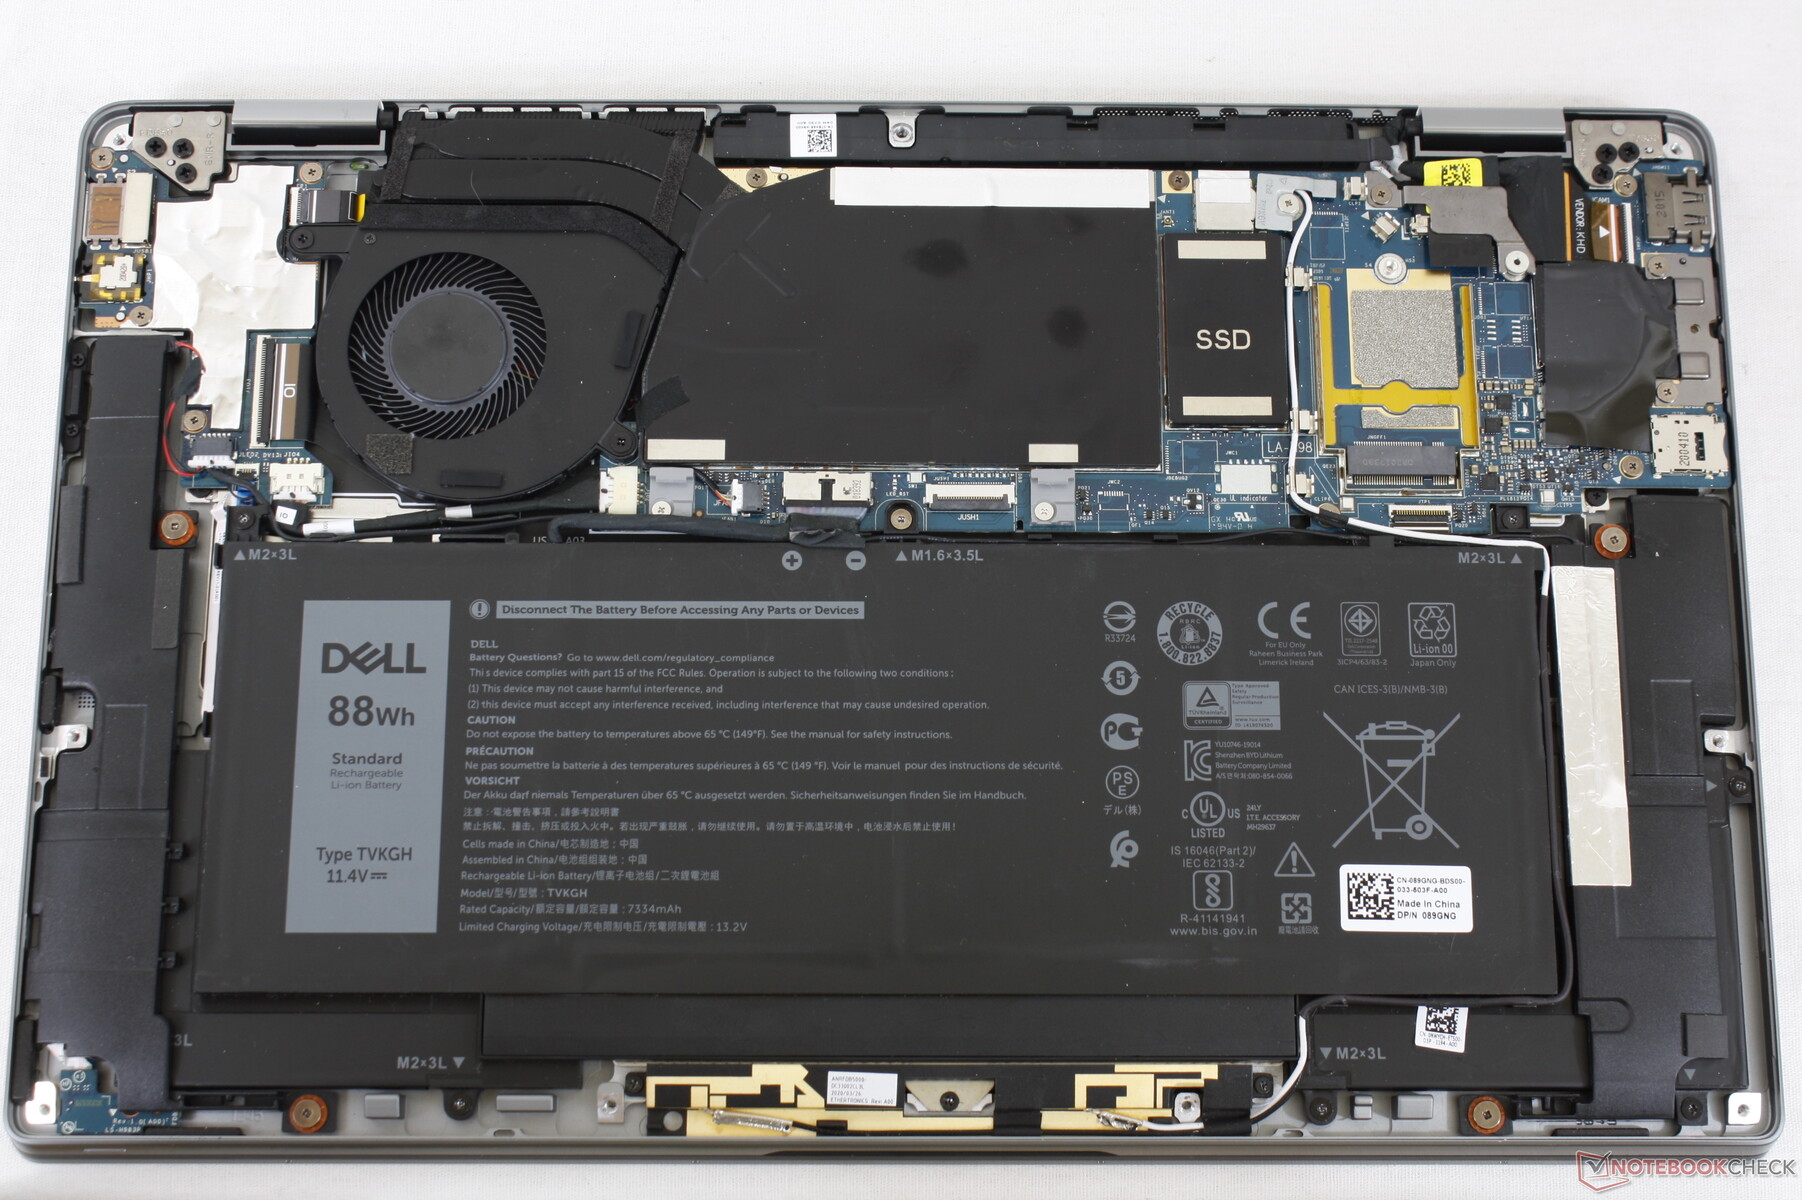
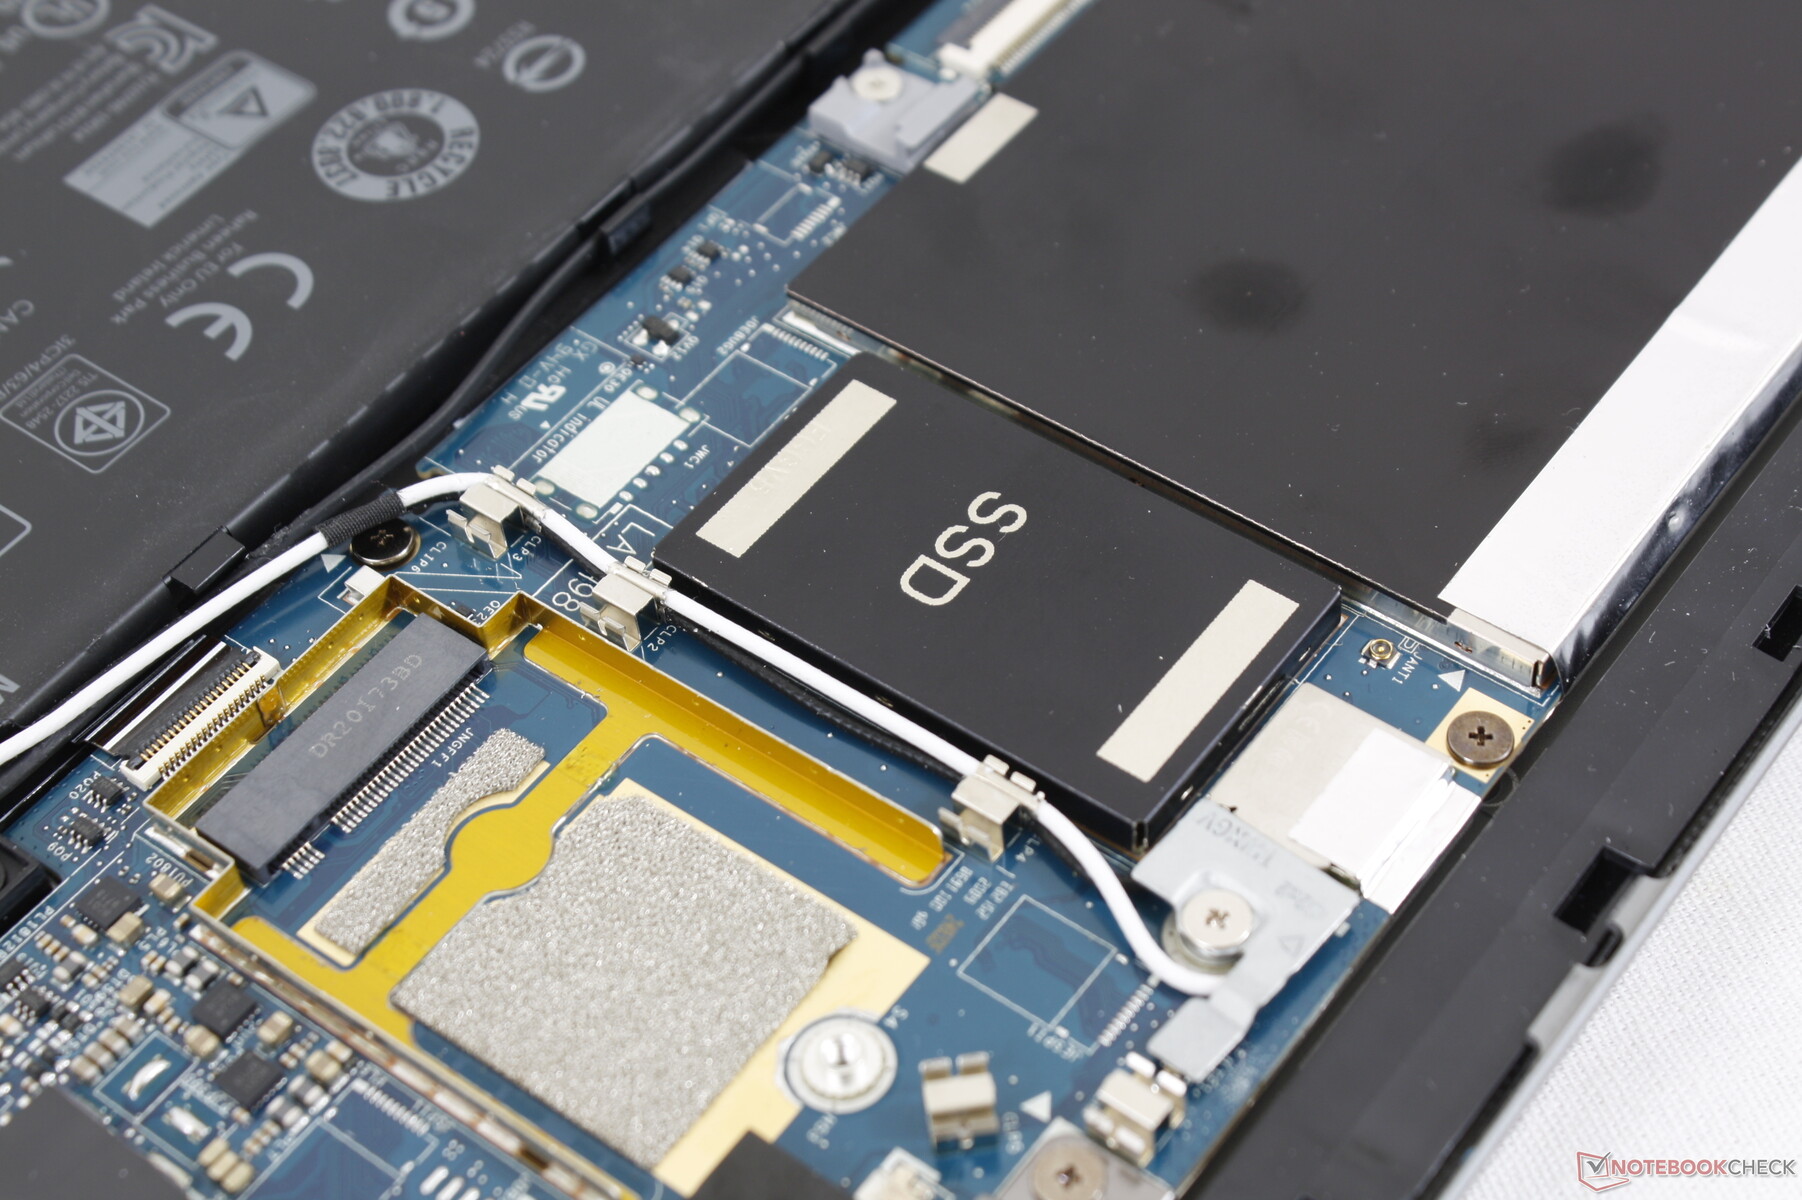
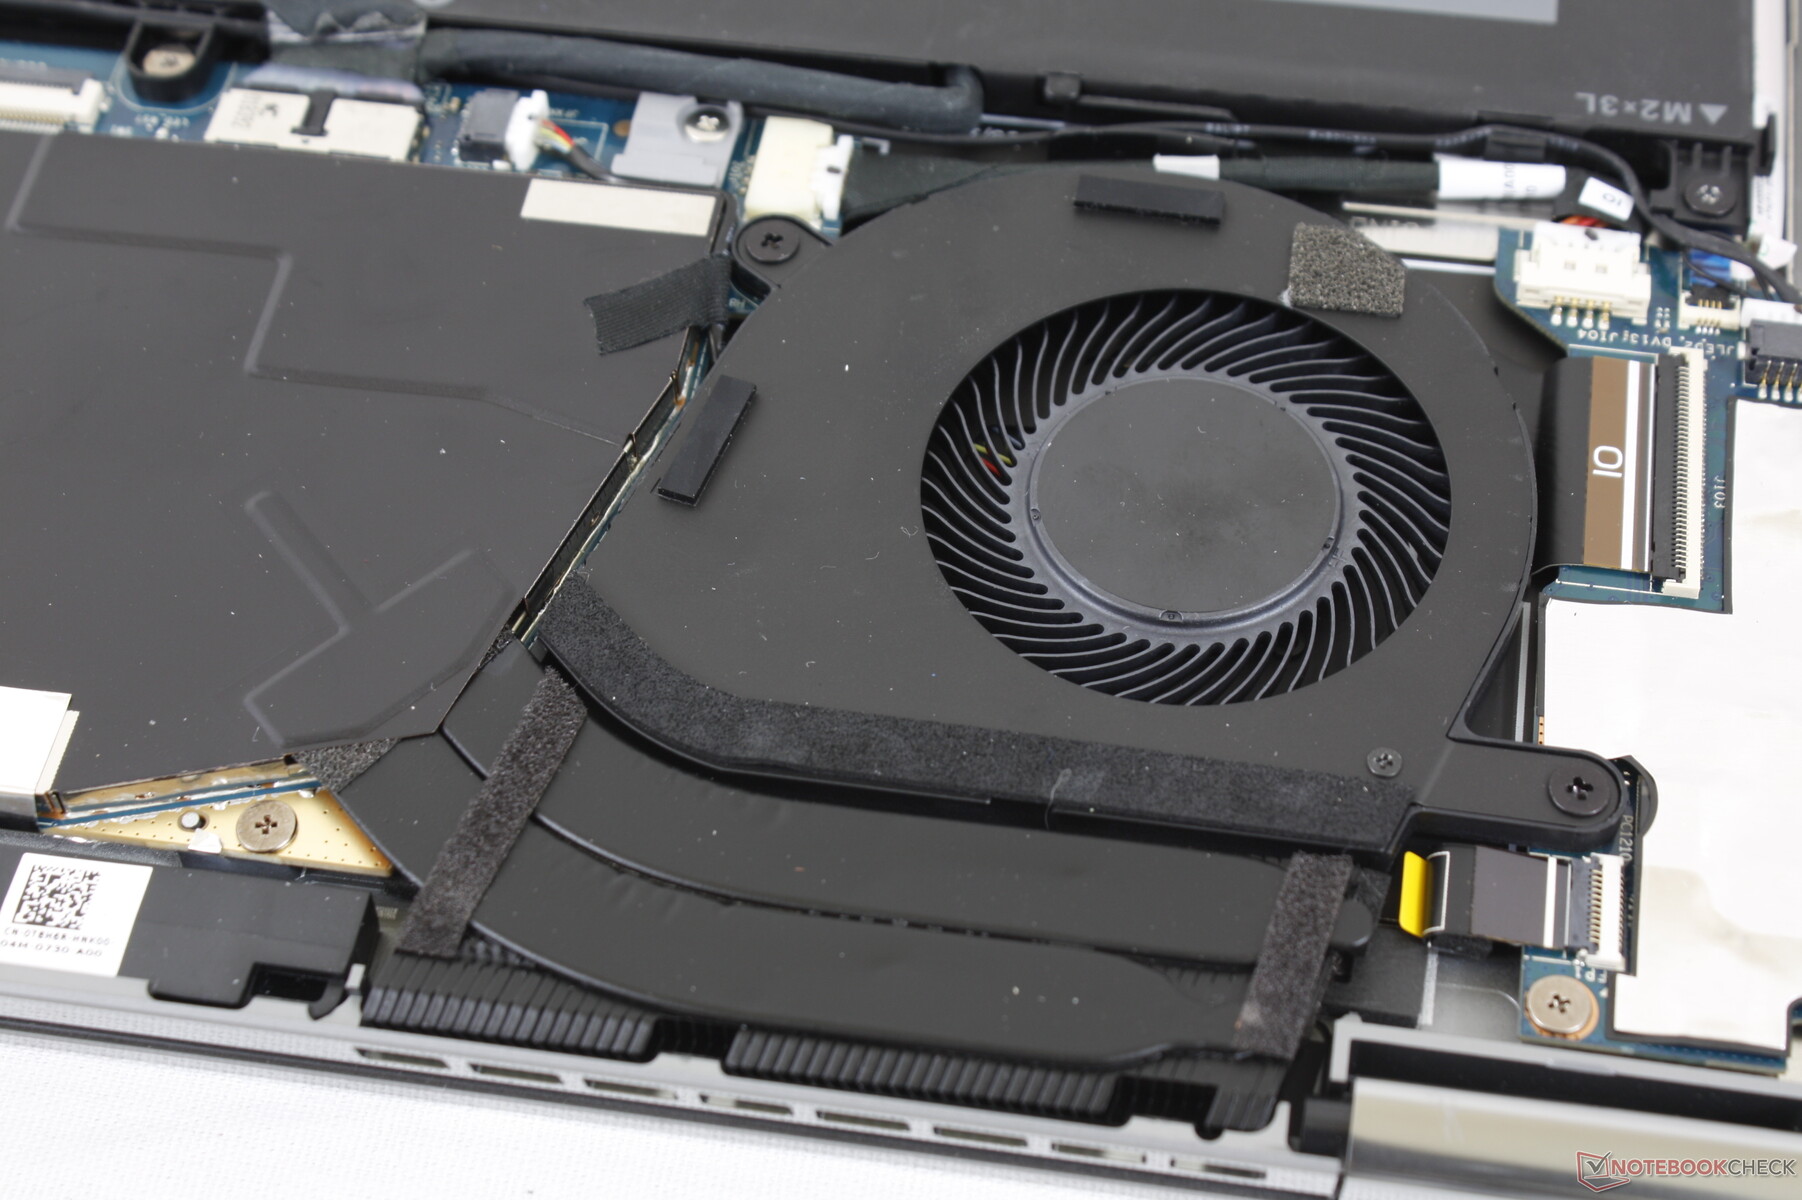
Maintenance
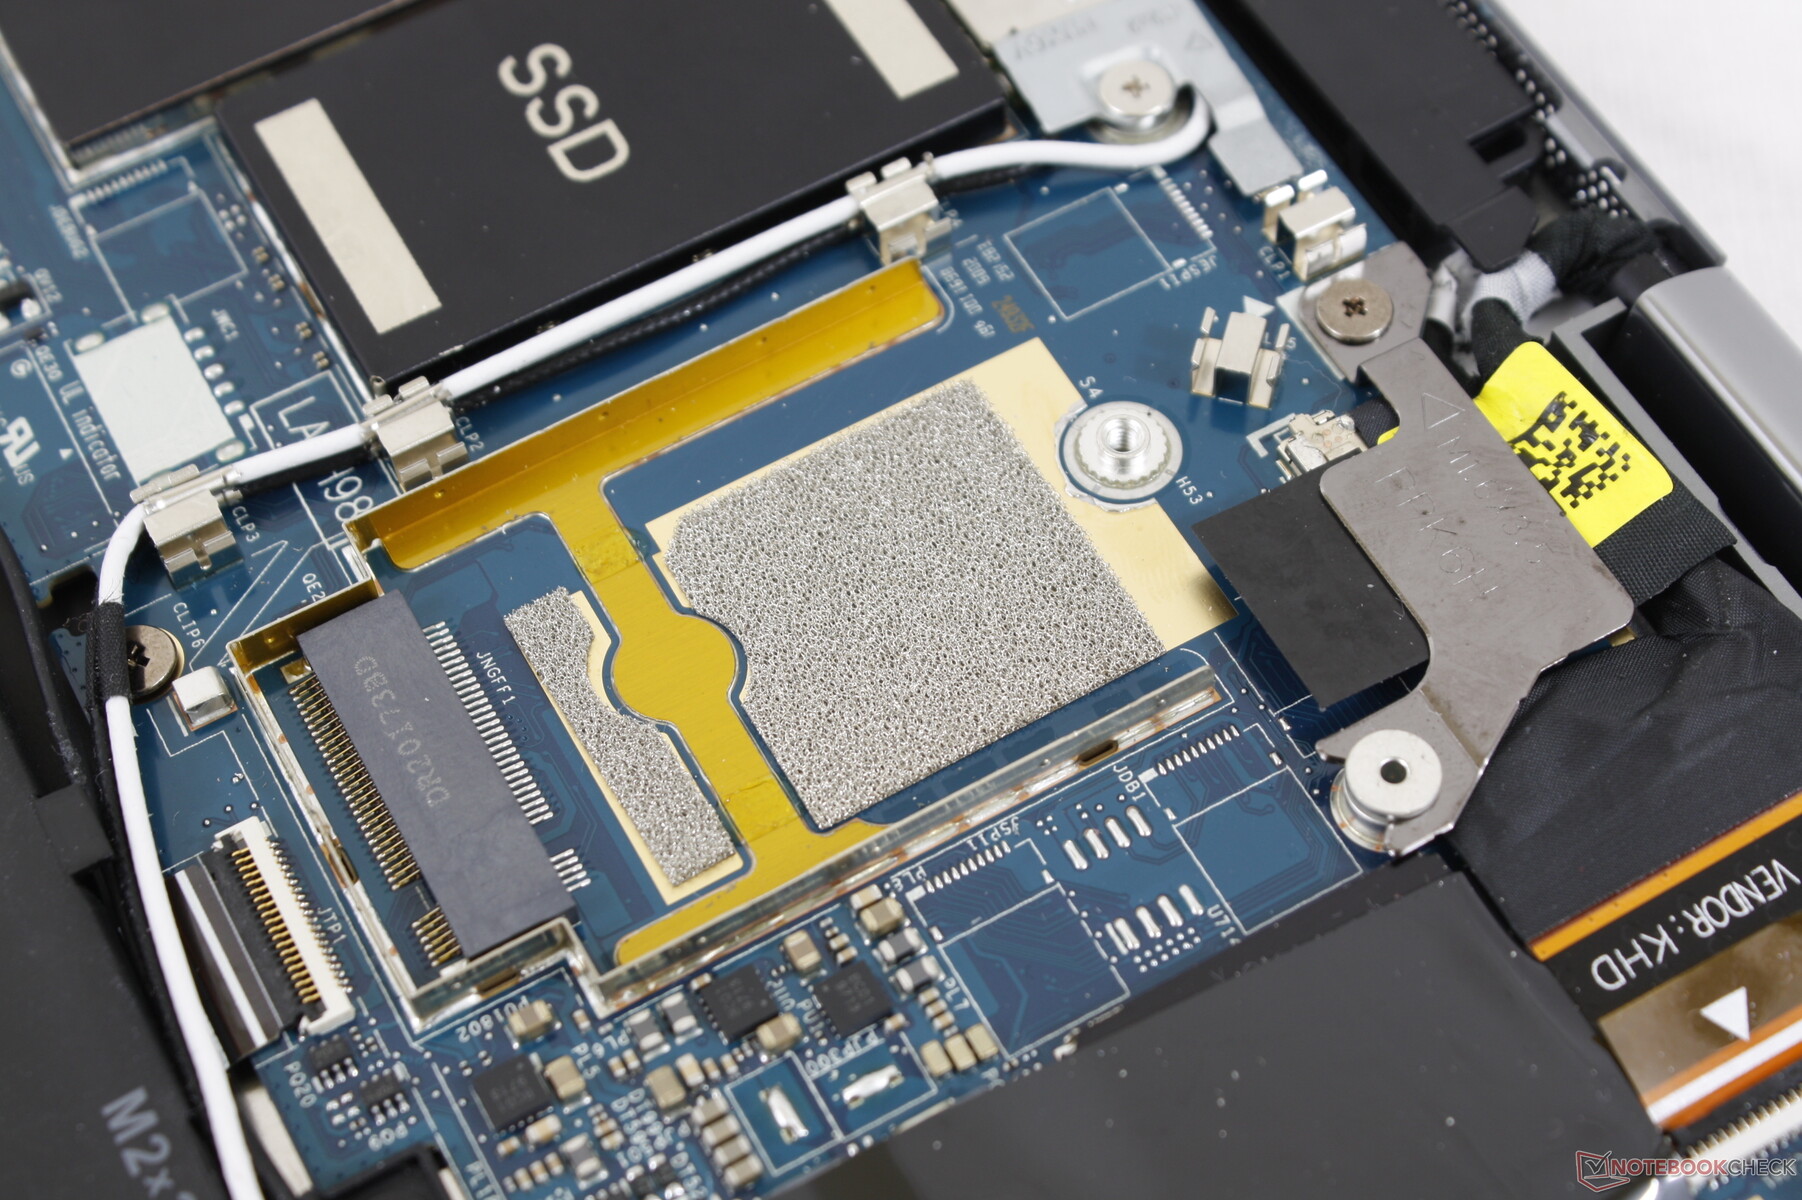
The bottom panel is secured by 9 Phillips screws for easy servicing. Unfortunately, both RAM and WLAN are soldered and the M.2 SSD itself is protected by a hard-to-remove cover. The second M.2 slot for WAN is missing the antenna meaning users cannot configure a WAN-less SKU at checkout and then install their own WAN module at a future date.
Accessories and Warranty
There are no included extras in the box. Optional accessories are otherwise plentiful ranging from the Dell Premium Active Pen to Thunderbolt 3 docking stations and a carrying sleeve.
Three-year warranty comes standard with options to extend up to five years.
Input Devices
Keyboard
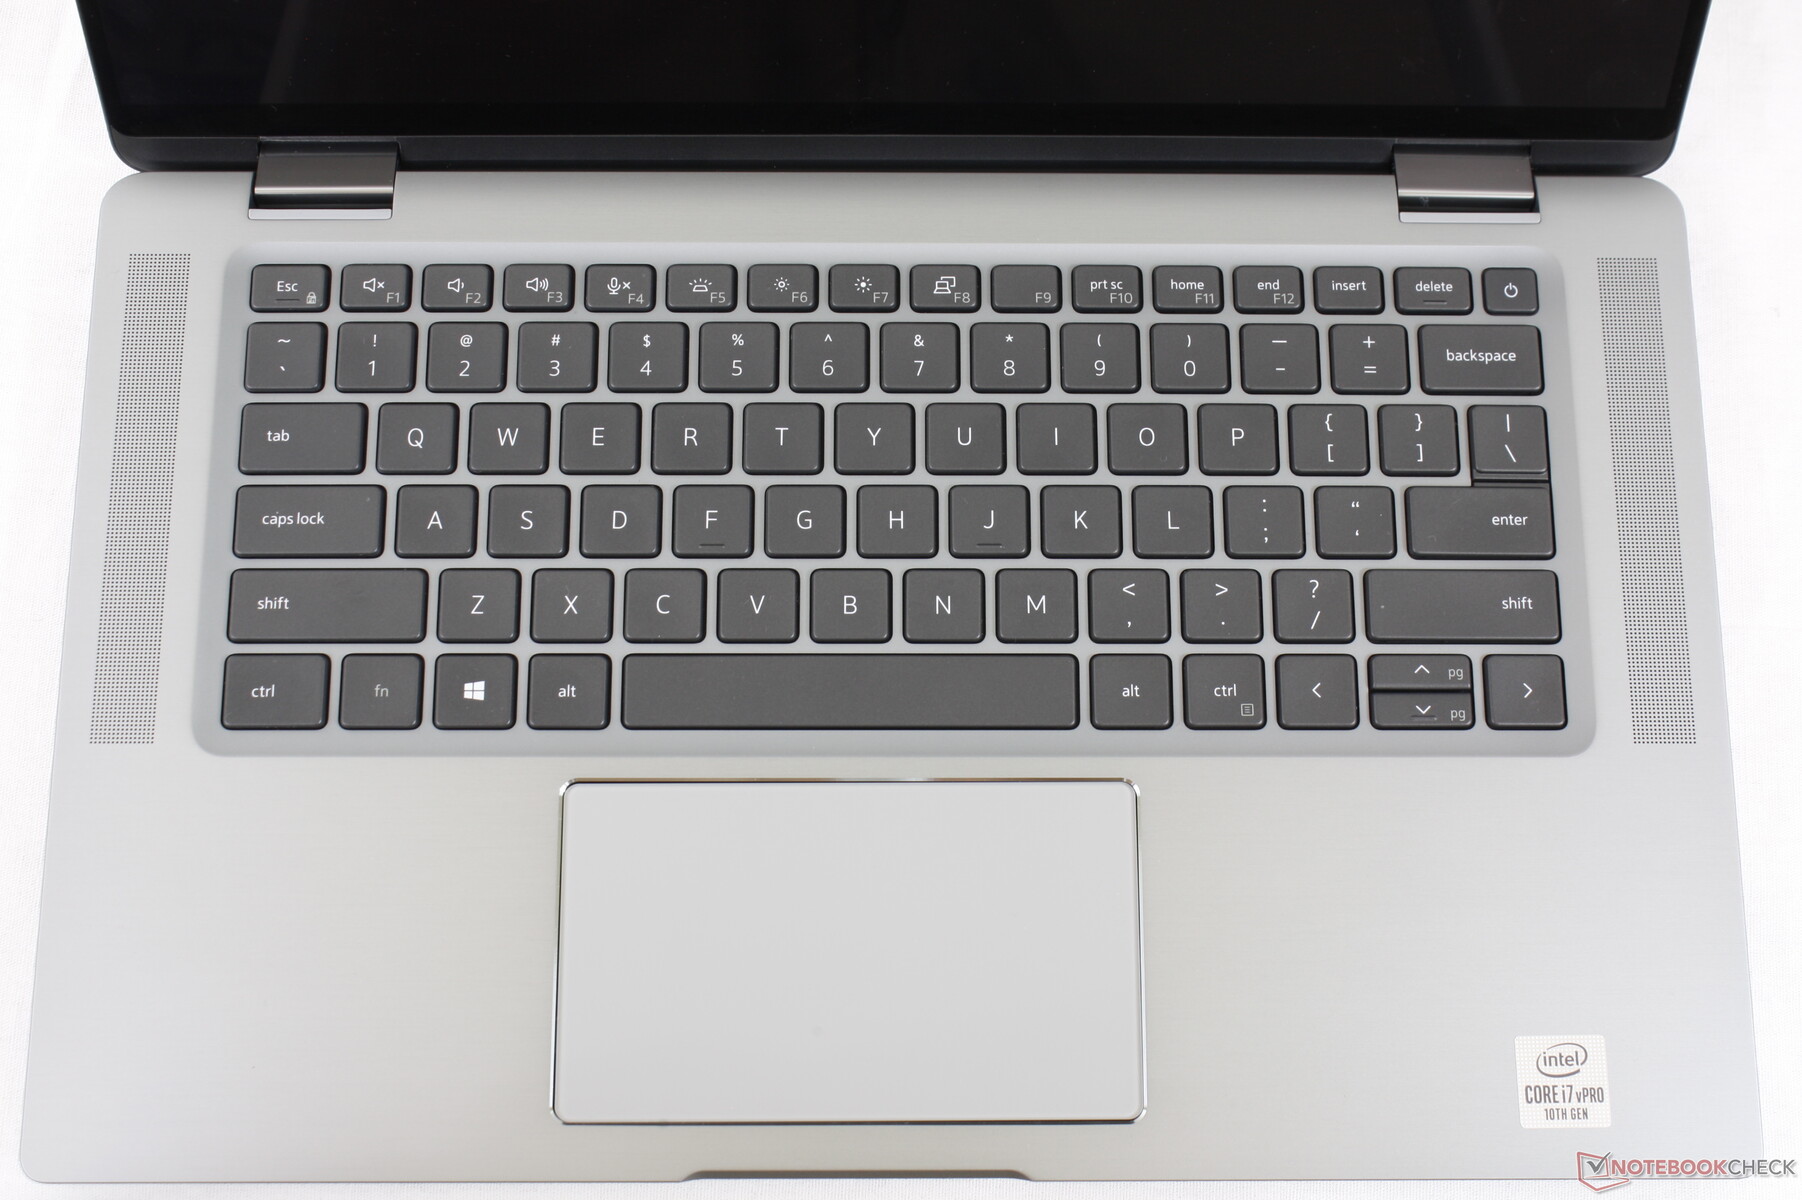
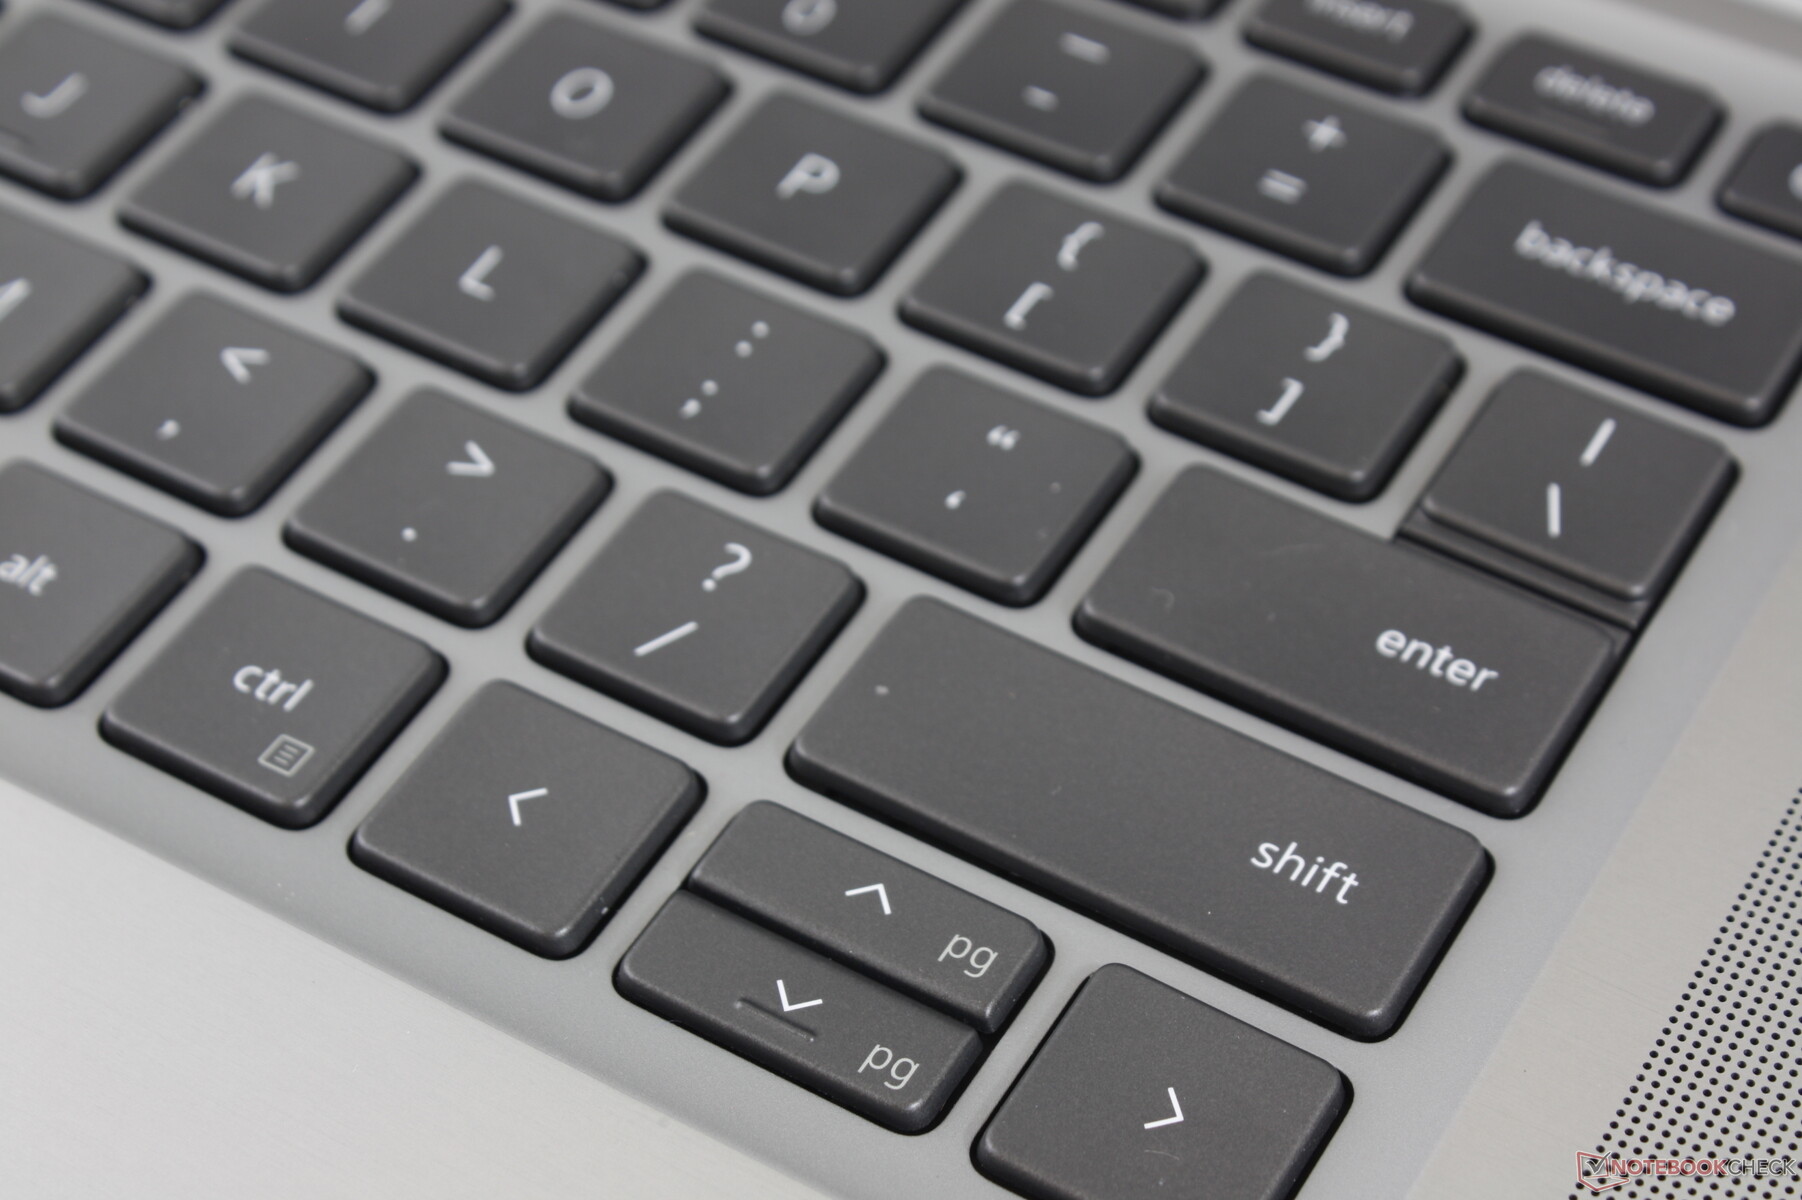
Dell uses the same backlit keyboard across the Latitude 7310, 7410, and 9510 for a sense of consistency between its latest high-end Latitude models. Keys feel uniform in terms of feedback with quiet clatter, but the Space and Enter keys in particular are too loud much like what we experienced on the aforementioned Latitude 7000 models.
Touchpad
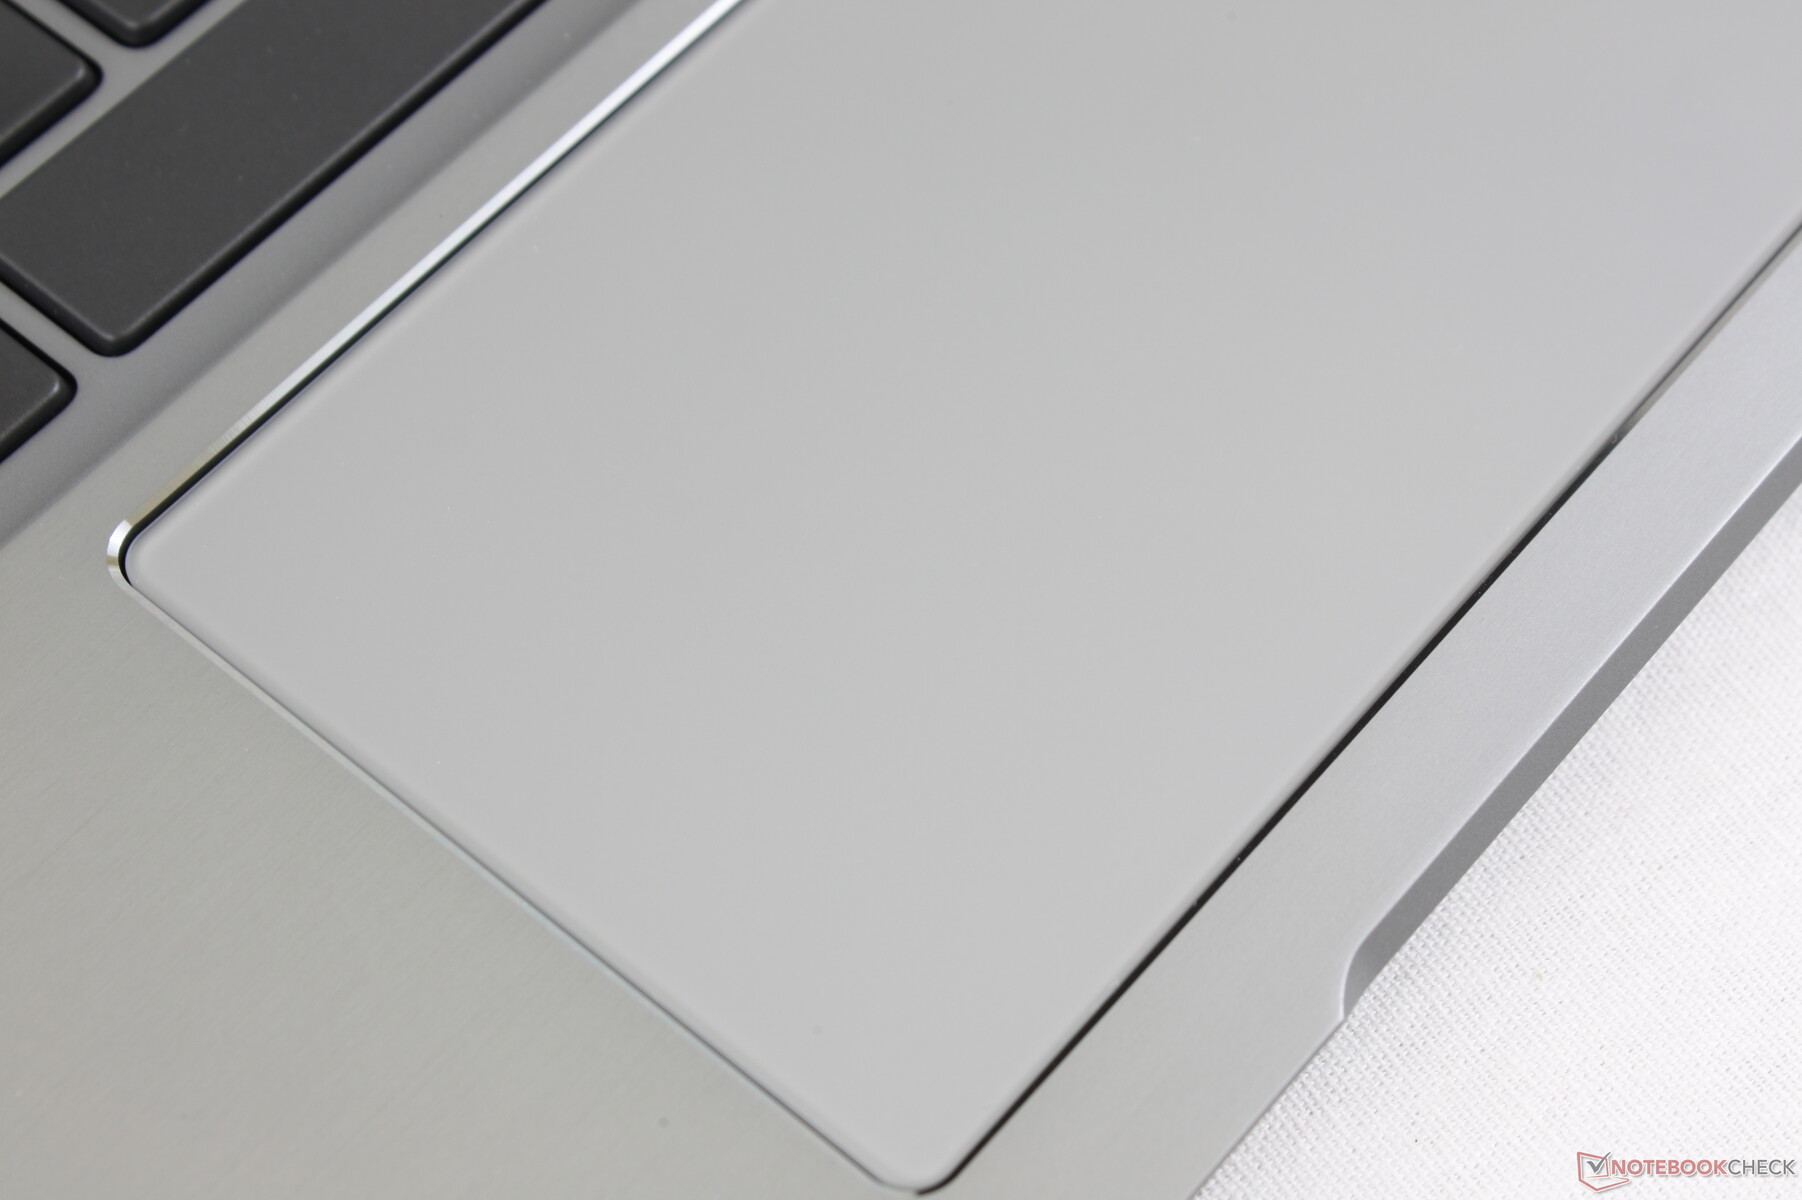
The Precision clickpad (~11.5 x 6.8 cm) is slightly larger than the one on the HP Envy x360 15 even though our Dell is the smaller system. The glass surface is smooth with only a bit of sticking for better accuracy when gliding at slower speeds. Feedback from the integrated mouse keys is firmer than on most other laptops including the XPS 15 with both shallow travel and an audible click when pressed.

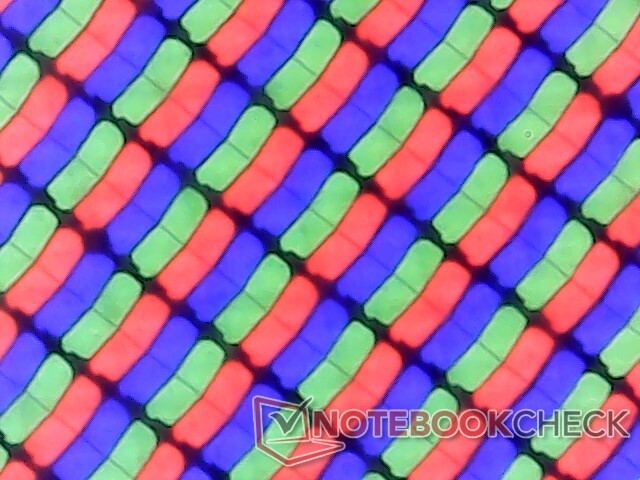
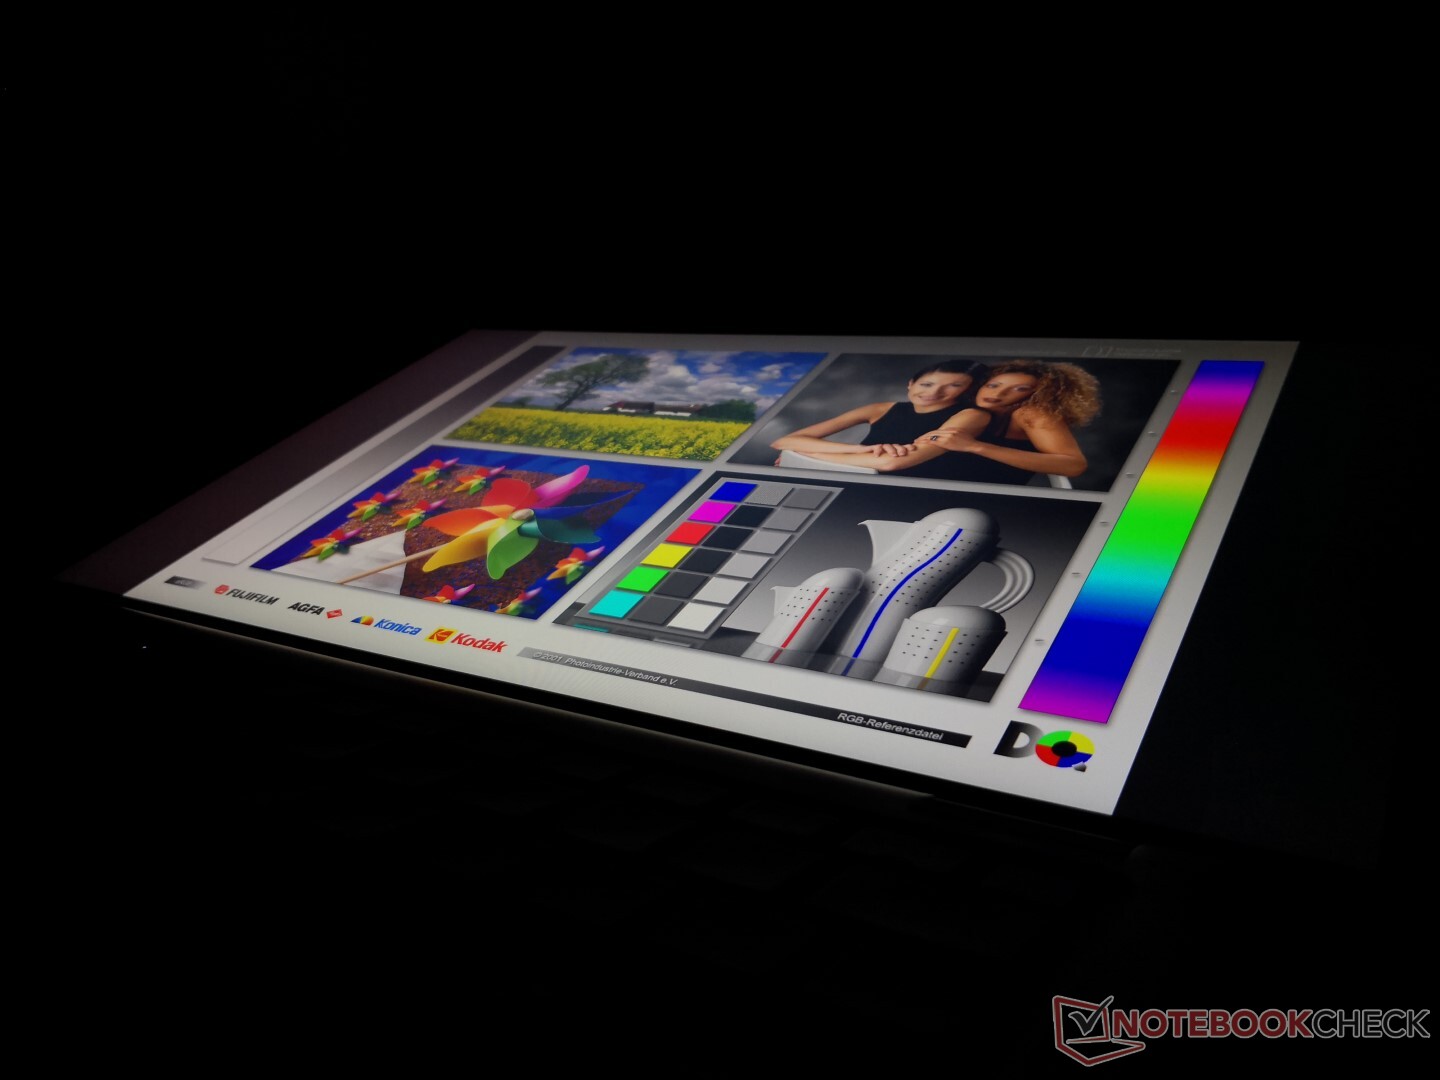
Display
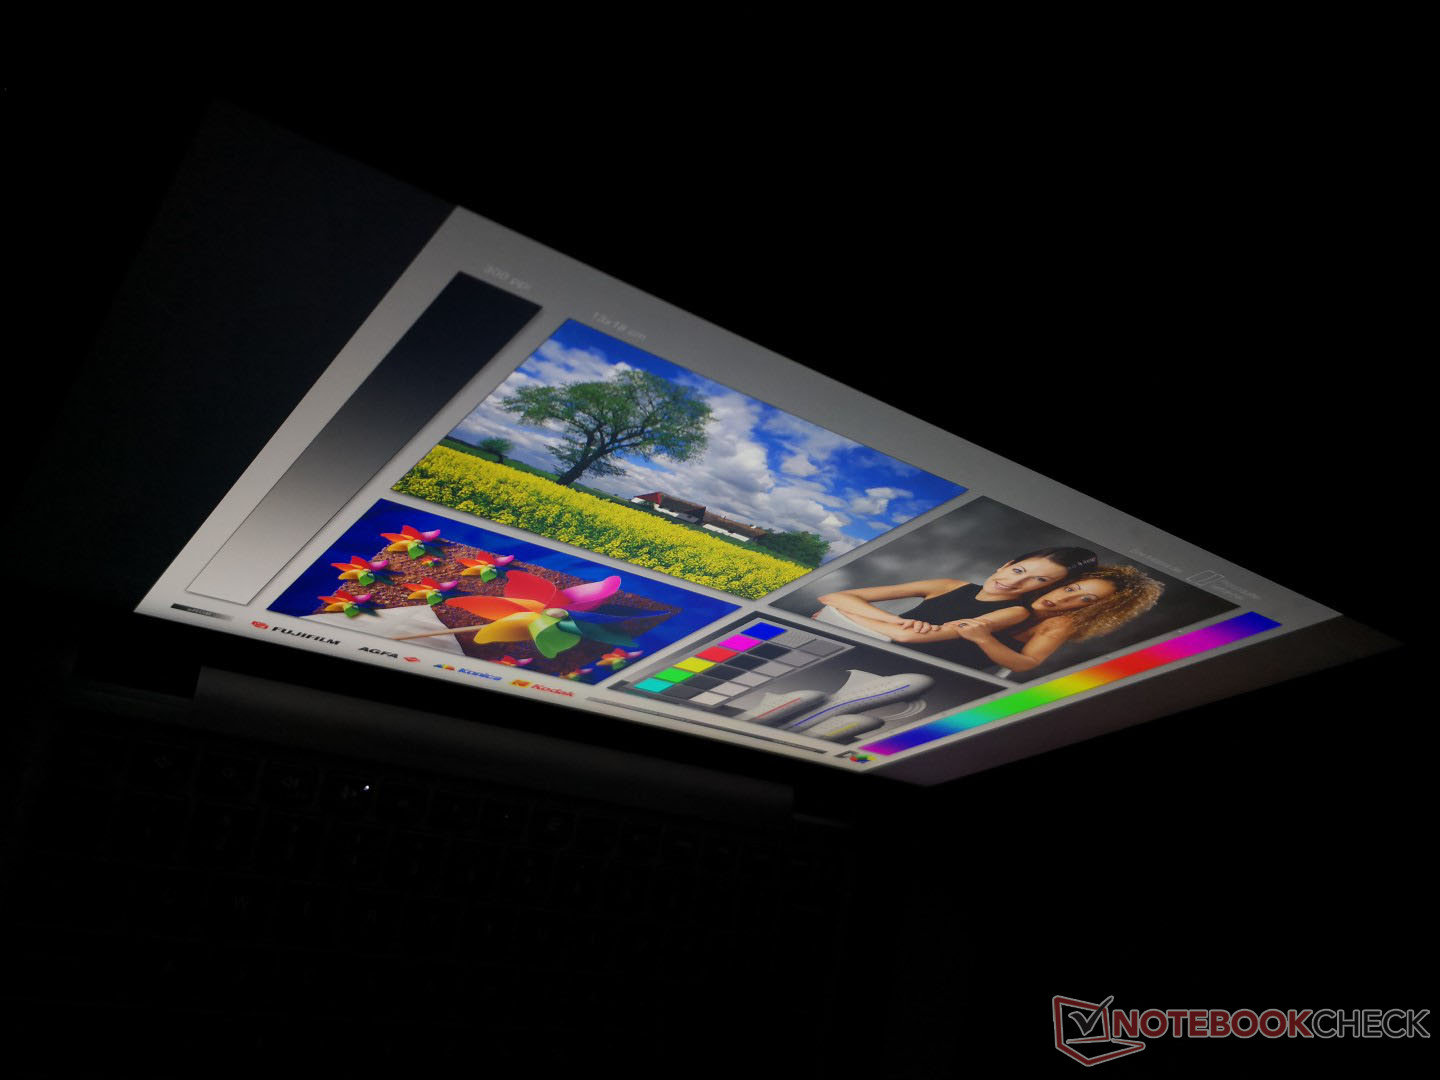
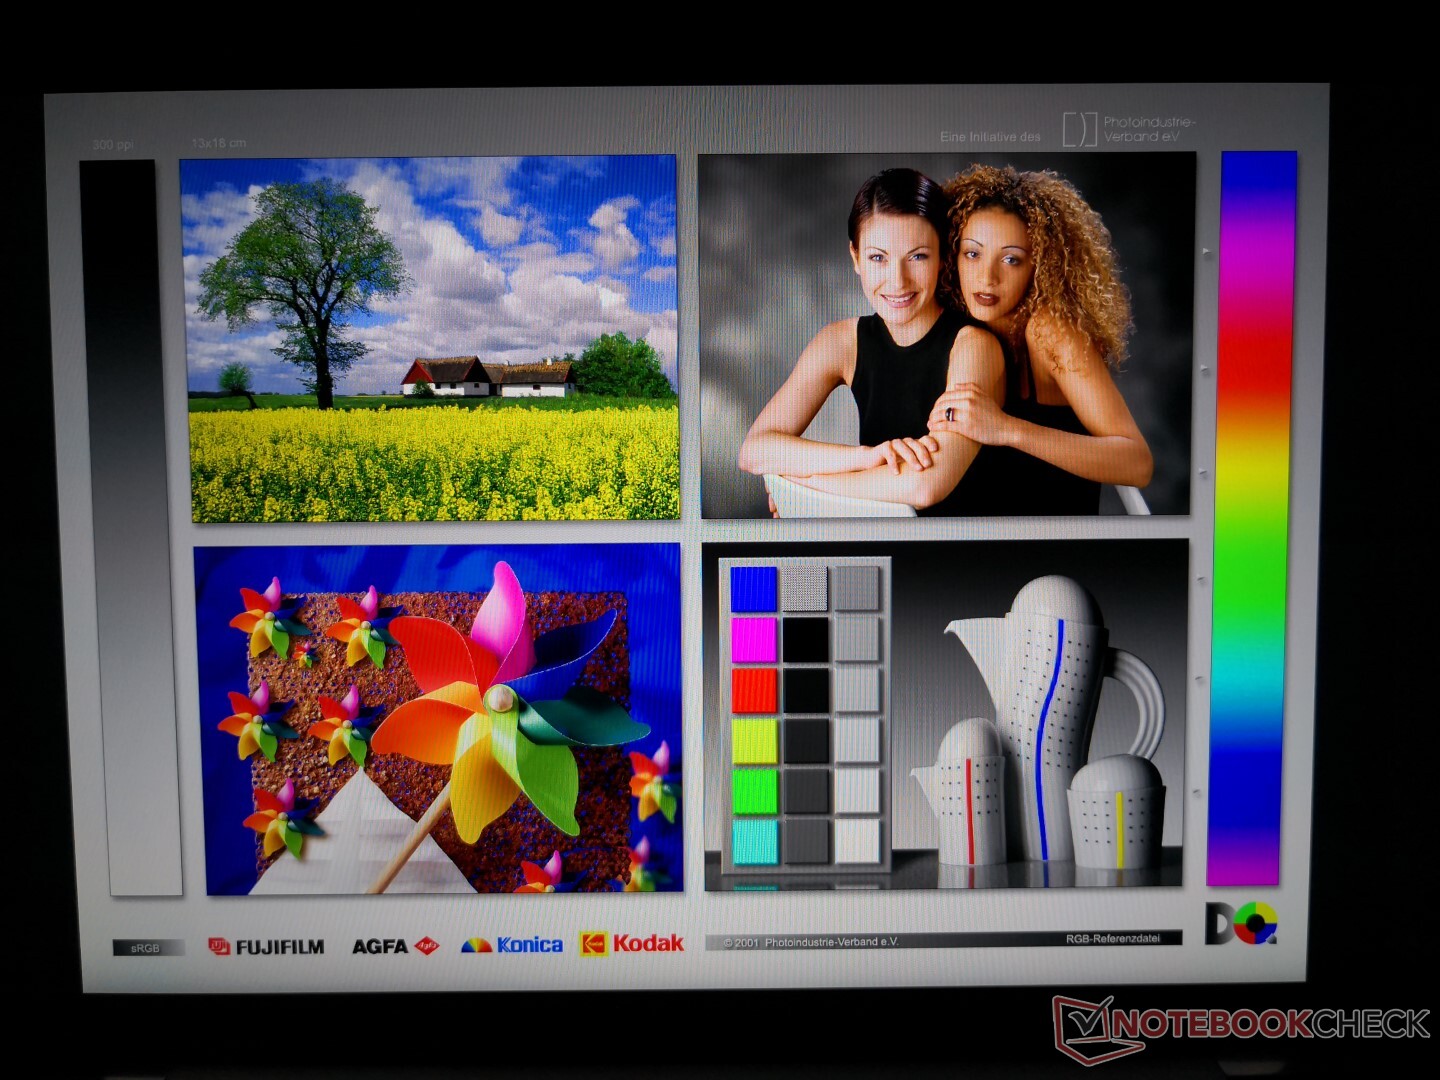
As Dell's top-of-the-line 15.6-inch business laptop, our system comes with a top-of-the-line 1080p touchscreen that's both brighter and with deeper colors than most less expensive alternatives like the ThinkBook 15. Response times are slower than expected, however, meaning that ghosting is more noticeable even if texts and images are crisp.
| |||||||||||||||||||||||||
Brightness Distribution: 87 %
Center on Battery: 426.7 cd/m²
Contrast: 1422:1 (Black: 0.3 cd/m²)
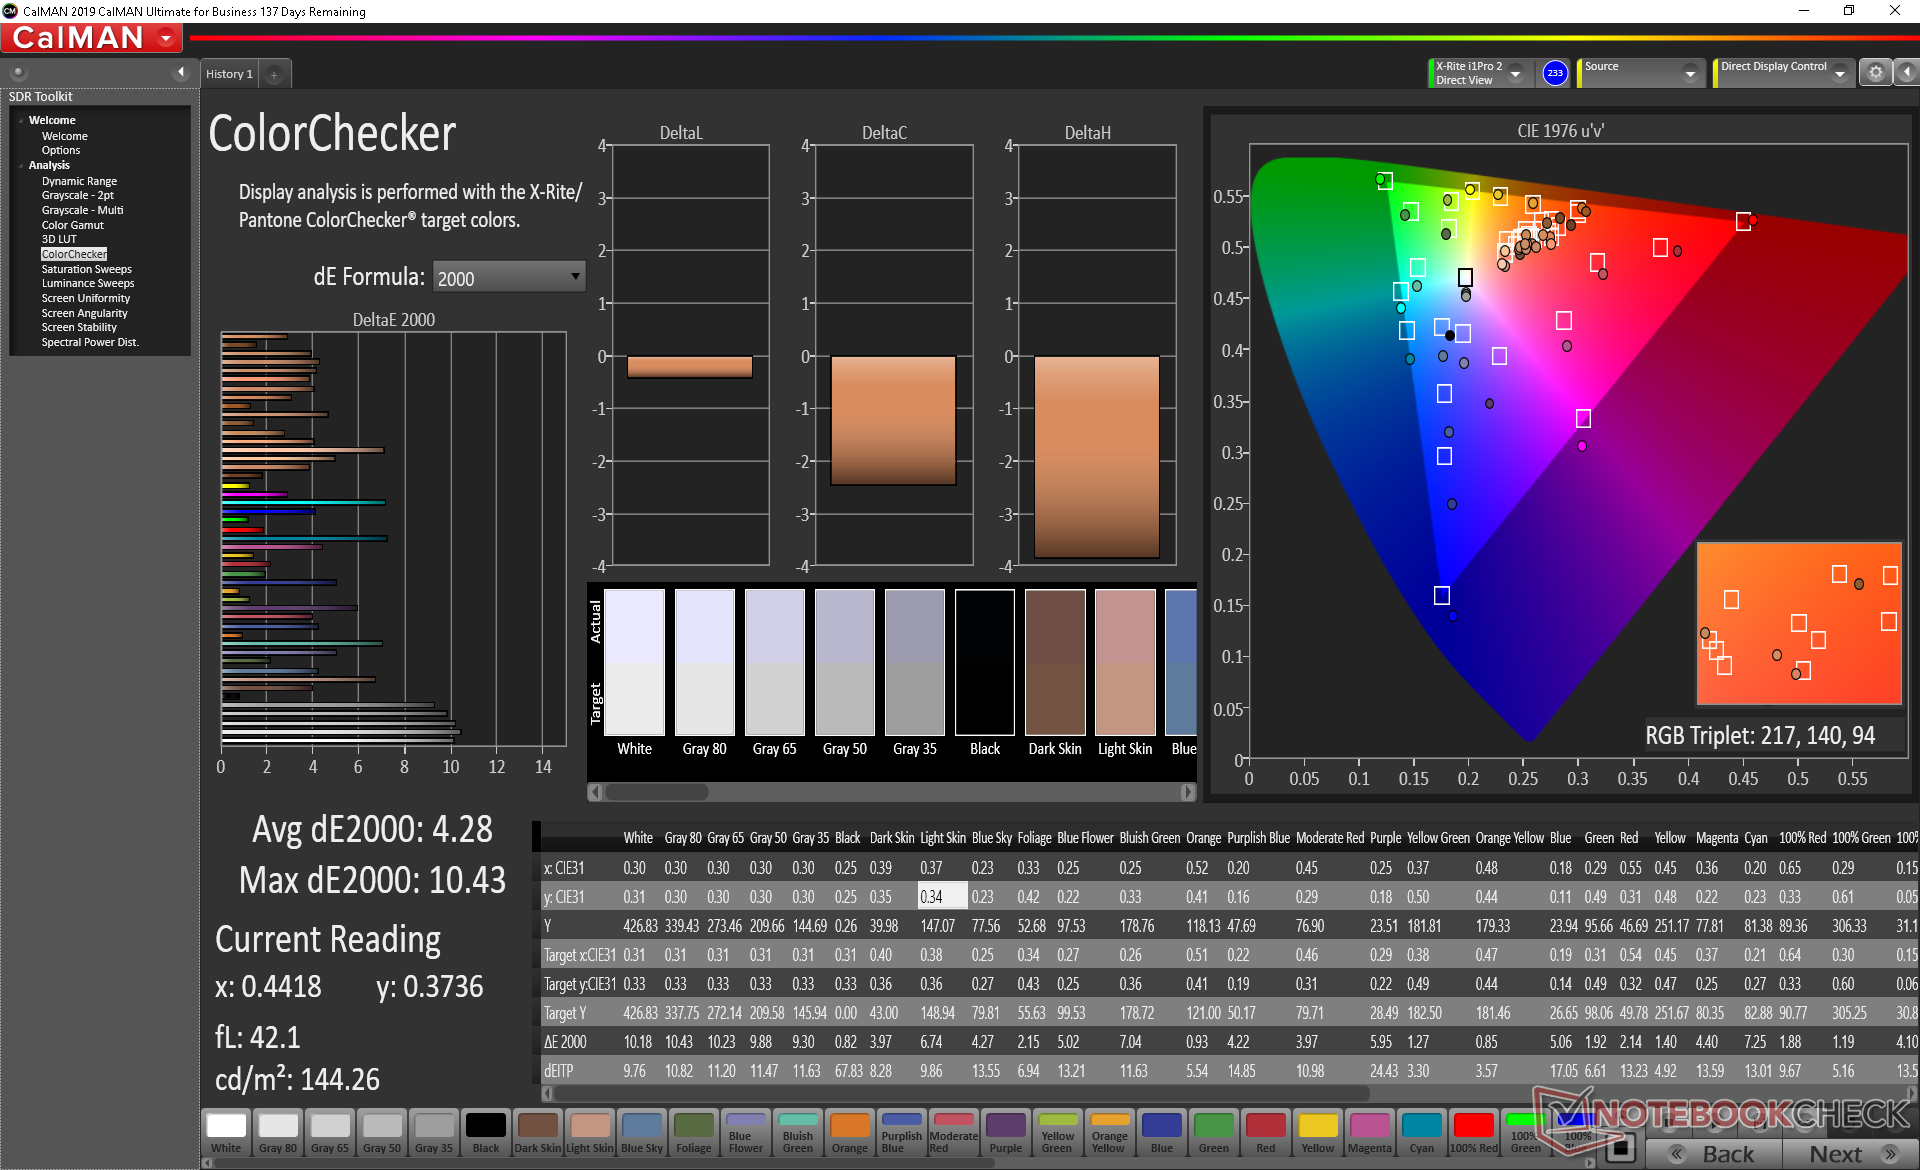
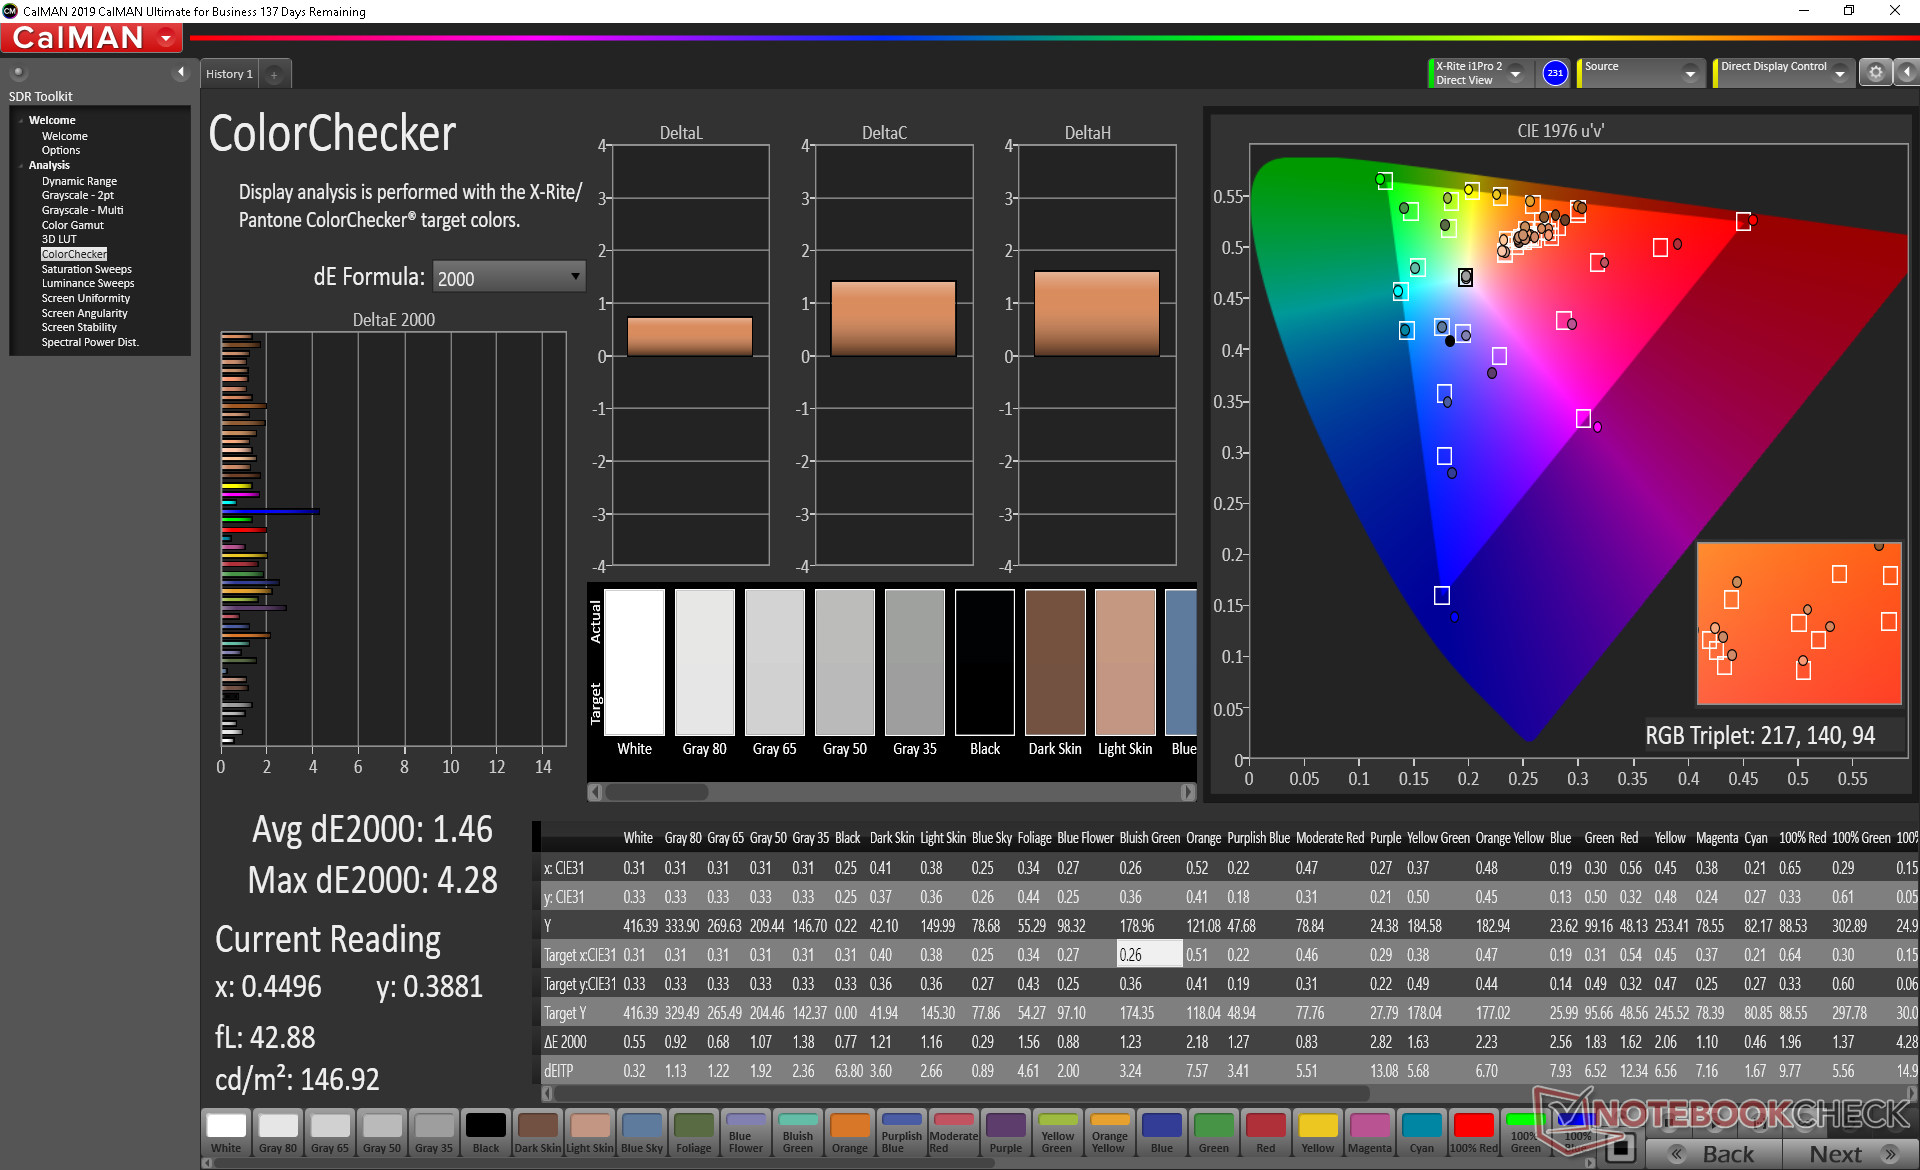
ΔE ColorChecker Calman: 4.28 | ∀{0.5-29.43 Ø4.79}
calibrated: 1.46
ΔE Greyscale Calman: 8.1 | ∀{0.09-98 Ø5}
99.2% sRGB (Argyll 1.6.3 3D)
65.2% AdobeRGB 1998 (Argyll 1.6.3 3D)
71.3% AdobeRGB 1998 (Argyll 3D)
99.3% sRGB (Argyll 3D)
71.2% Display P3 (Argyll 3D)
Gamma: 2.26
CCT: 7993 K
| Dell Latitude 9510 2-in-1 AU Optronics B150HAN, IPS, 15", 1920x1080 | Lenovo ThinkPad T15 Gen1-20S7S02U00 NE156QUM-N66, IPS LED, 15.6", 3840x2160 | Lenovo ThinkBook 15 LP156WFC-SPD1, IPS, 15.6", 1920x1080 | Dynabook Tecra X50-F Toshiba TOS508F, IPS, 15.6", 1920x1080 | HP Envy x360 15-dr1679cl AU Optronics B156HW02, IPS, 15.6", 1920x1080 | Dell Latitude 5591 AU Optronics B156HW03, IPS, 15.6", 1920x1080 | |
|---|---|---|---|---|---|---|
| Display | 15% | -44% | -47% | -43% | -44% | |
| Display P3 Coverage (%) | 71.2 | 80.7 13% | 38.38 -46% | 36.68 -48% | 39.28 -45% | 38.74 -46% |
| sRGB Coverage (%) | 99.3 | 98.1 -1% | 57.7 -42% | 55 -45% | 58.8 -41% | 58.1 -41% |
| AdobeRGB 1998 Coverage (%) | 71.3 | 95.5 34% | 39.67 -44% | 37.92 -47% | 40.58 -43% | 40.03 -44% |
| Response Times | 26% | 21% | 24% | 26% | 17% | |
| Response Time Grey 50% / Grey 80% * (ms) | 52.8 ? | 42 ? 20% | 37.6 ? 29% | 38 ? 28% | 39.6 ? 25% | 45.2 ? 14% |
| Response Time Black / White * (ms) | 32 ? | 21.6 ? 32% | 28 ? 12% | 25.6 ? 20% | 23.6 ? 26% | 26 ? 19% |
| PWM Frequency (Hz) | ||||||
| Screen | 21% | -40% | -54% | -39% | -38% | |
| Brightness middle (cd/m²) | 426.7 | 489 15% | 245 -43% | 295.9 -31% | 261.2 -39% | 245.4 -42% |
| Brightness (cd/m²) | 394 | 501 27% | 239 -39% | 270 -31% | 248 -37% | 234 -41% |
| Brightness Distribution (%) | 87 | 91 5% | 82 -6% | 86 -1% | 92 6% | 88 1% |
| Black Level * (cd/m²) | 0.3 | 0.35 -17% | 0.25 17% | 0.3 -0% | 0.38 -27% | 0.26 13% |
| Contrast (:1) | 1422 | 1397 -2% | 980 -31% | 986 -31% | 687 -52% | 944 -34% |
| Colorchecker dE 2000 * | 4.28 | 3 30% | 5.6 -31% | 6.55 -53% | 5.4 -26% | 5.36 -25% |
| Colorchecker dE 2000 max. * | 10.43 | 5.1 51% | 15.6 -50% | 21.52 -106% | 16.31 -56% | 19.31 -85% |
| Colorchecker dE 2000 calibrated * | 1.46 | 0.8 45% | 4.8 -229% | 5.73 -292% | 3.81 -161% | 4.06 -178% |
| Greyscale dE 2000 * | 8.1 | 4 51% | 3.4 58% | 4.3 47% | 4.1 49% | 3.5 57% |
| Gamma | 2.26 97% | 2.24 98% | 2.3 96% | 2.475 89% | 2.53 87% | 2.53 87% |
| CCT | 7993 81% | 7400 88% | 7156 91% | 7002 93% | 6611 98% | 6430 101% |
| Color Space (Percent of AdobeRGB 1998) (%) | 65.2 | 84.7 30% | 36.5 -44% | 35 -46% | 37.4 -43% | 40 -39% |
| Color Space (Percent of sRGB) (%) | 99.2 | 98.1 -1% | 57.5 -42% | 54 -46% | 58.7 -41% | 58.1 -41% |
| Total Average (Program / Settings) | 21% /
21% | -21% /
-33% | -26% /
-43% | -19% /
-32% | -22% /
-32% |
* ... smaller is better
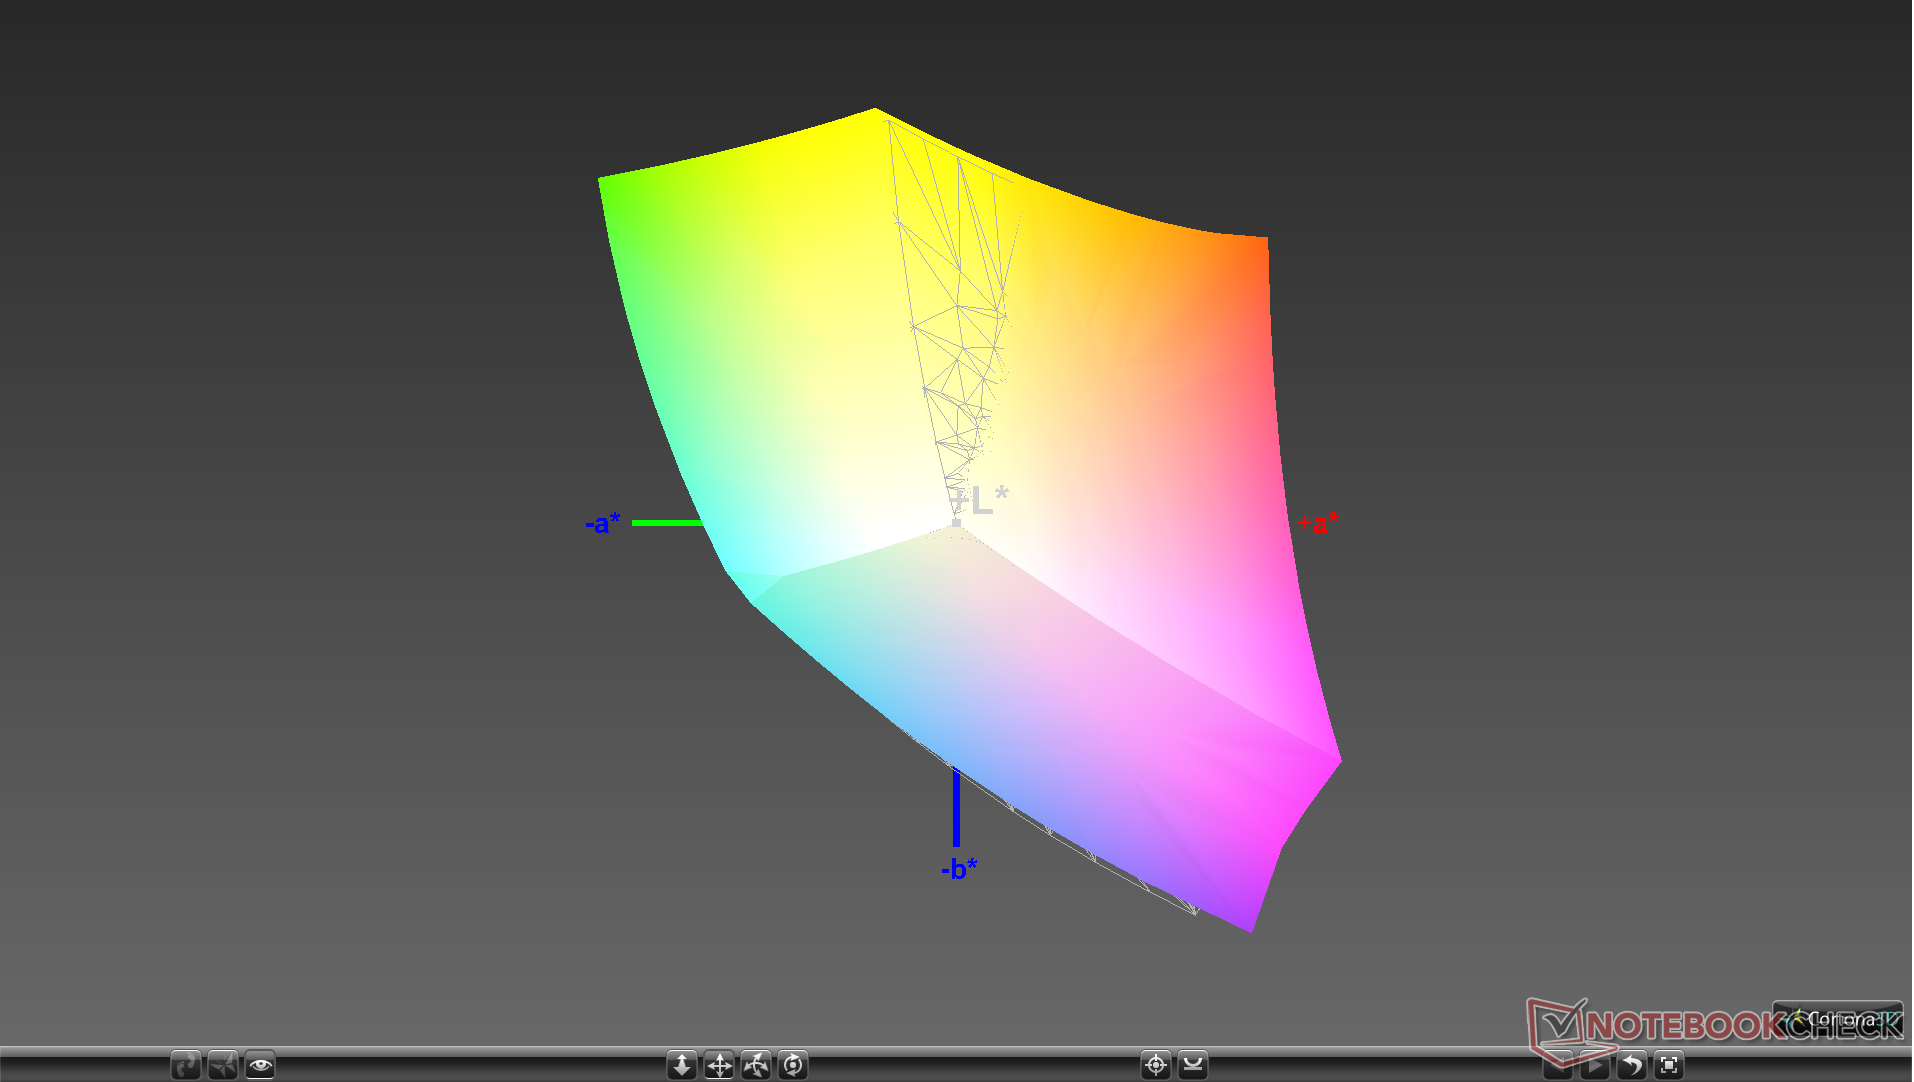
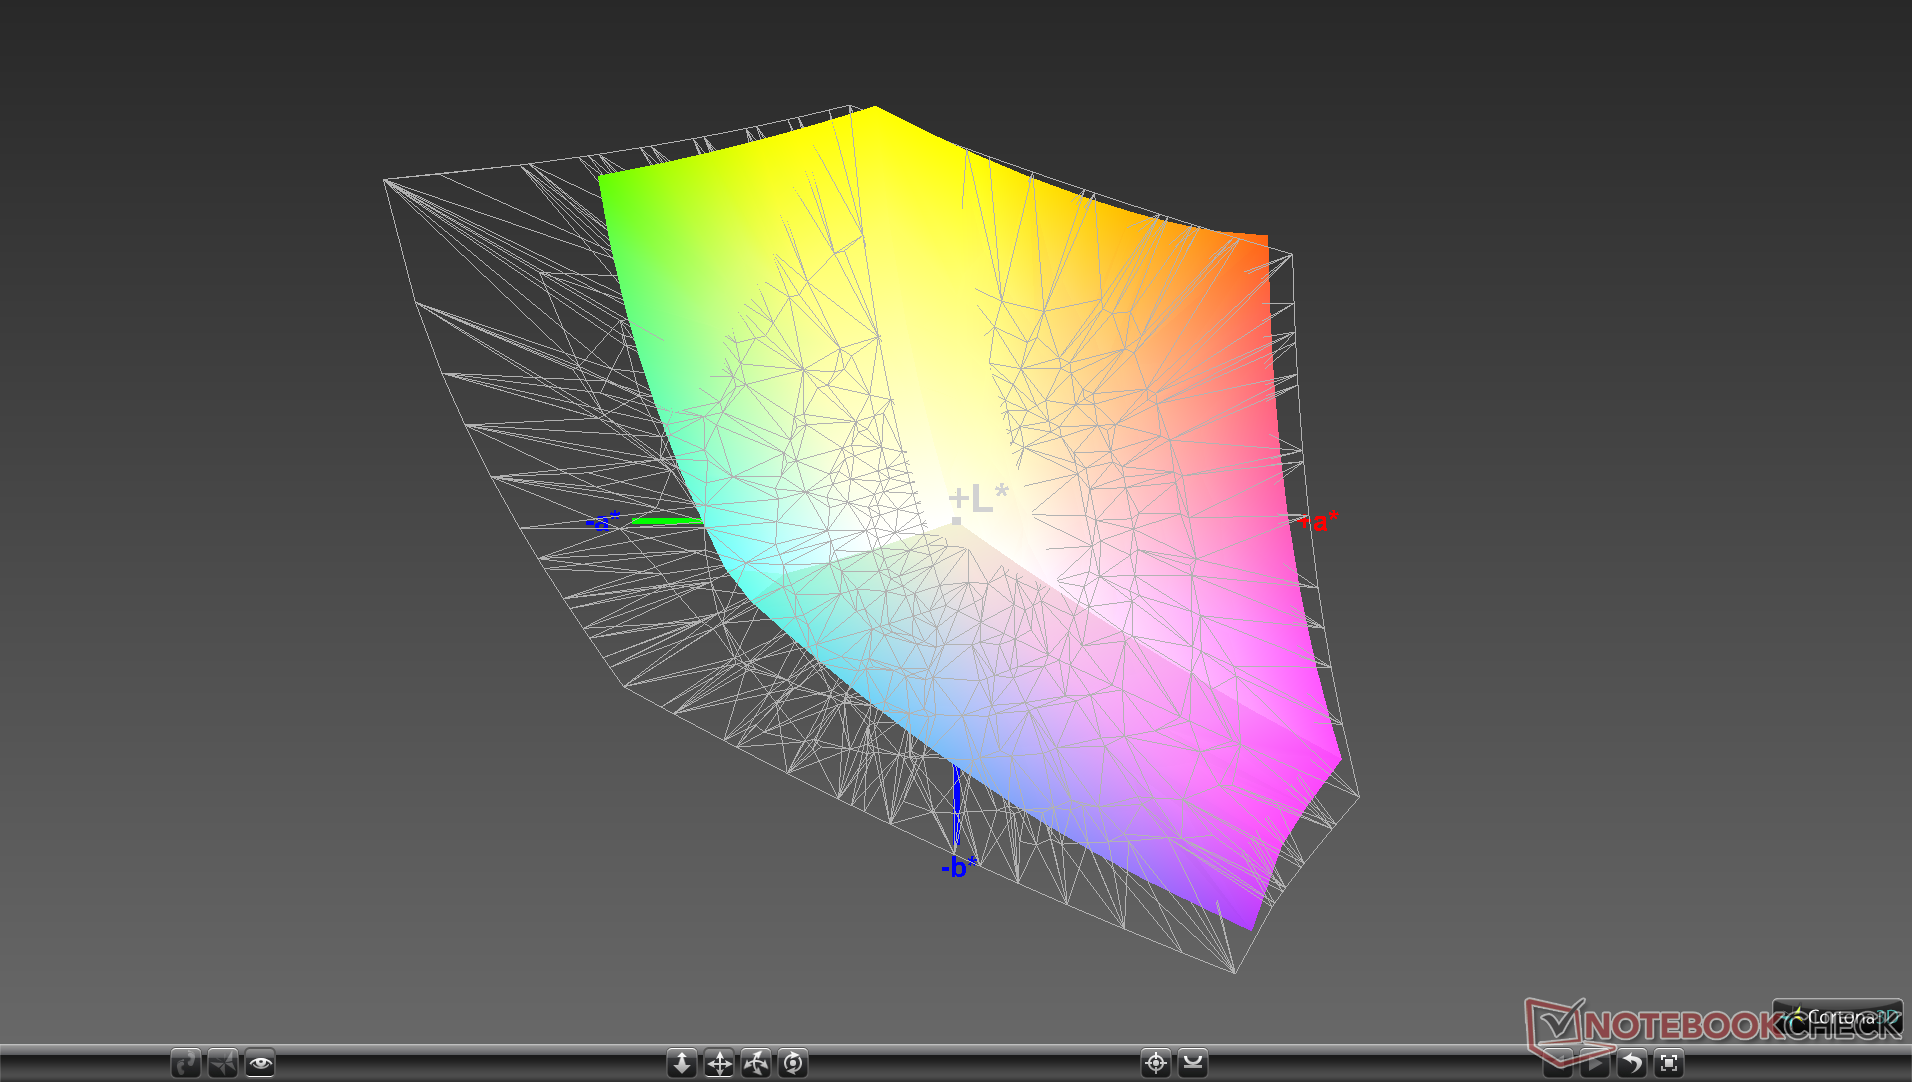
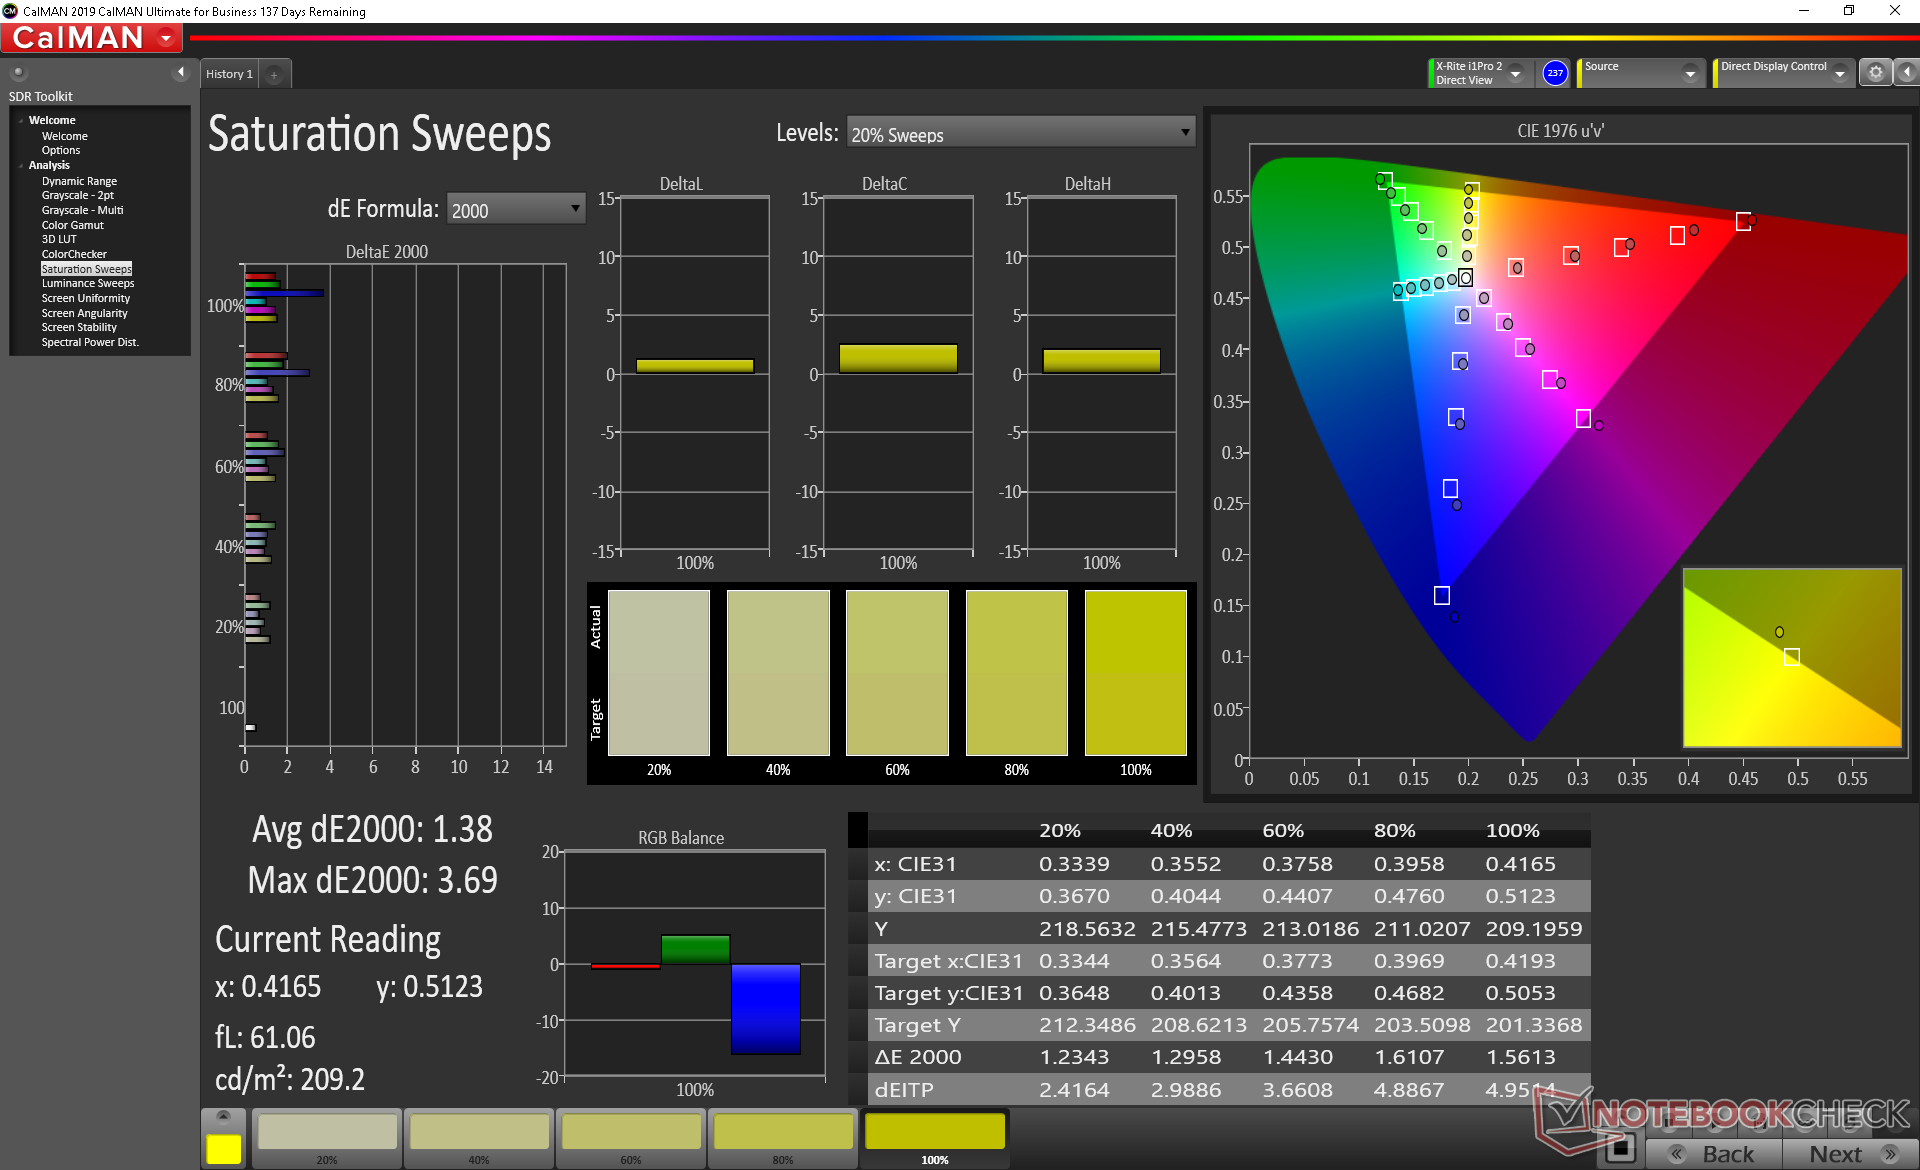
Color space covers sRGB entirely and about 65 percent of AdobeRGB to be similar to most consumer Ultrabooks including Dell's own XPS series. The Latitude 9510 isn't a system for creators or video editors so the lack of full AdobeRGB coverage isn't a huge problem.
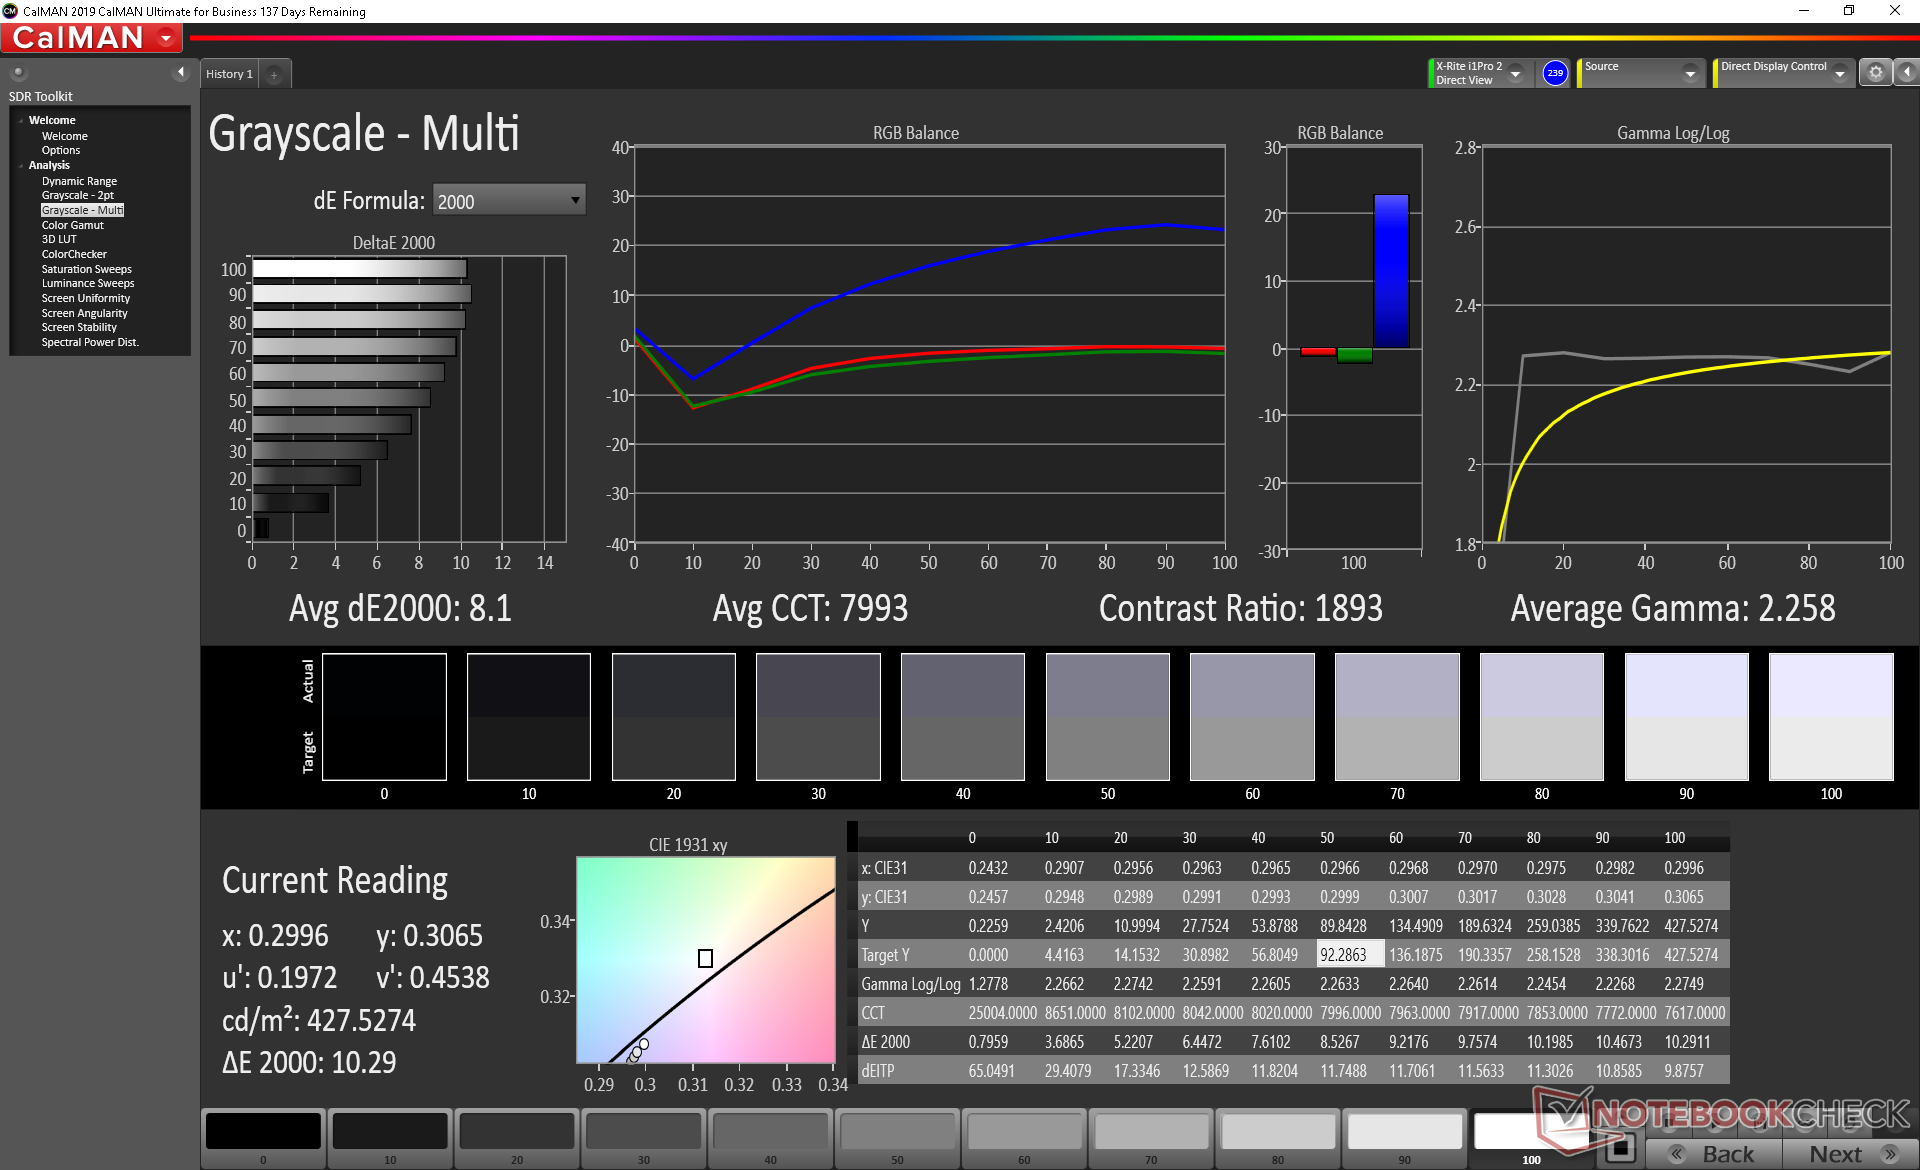
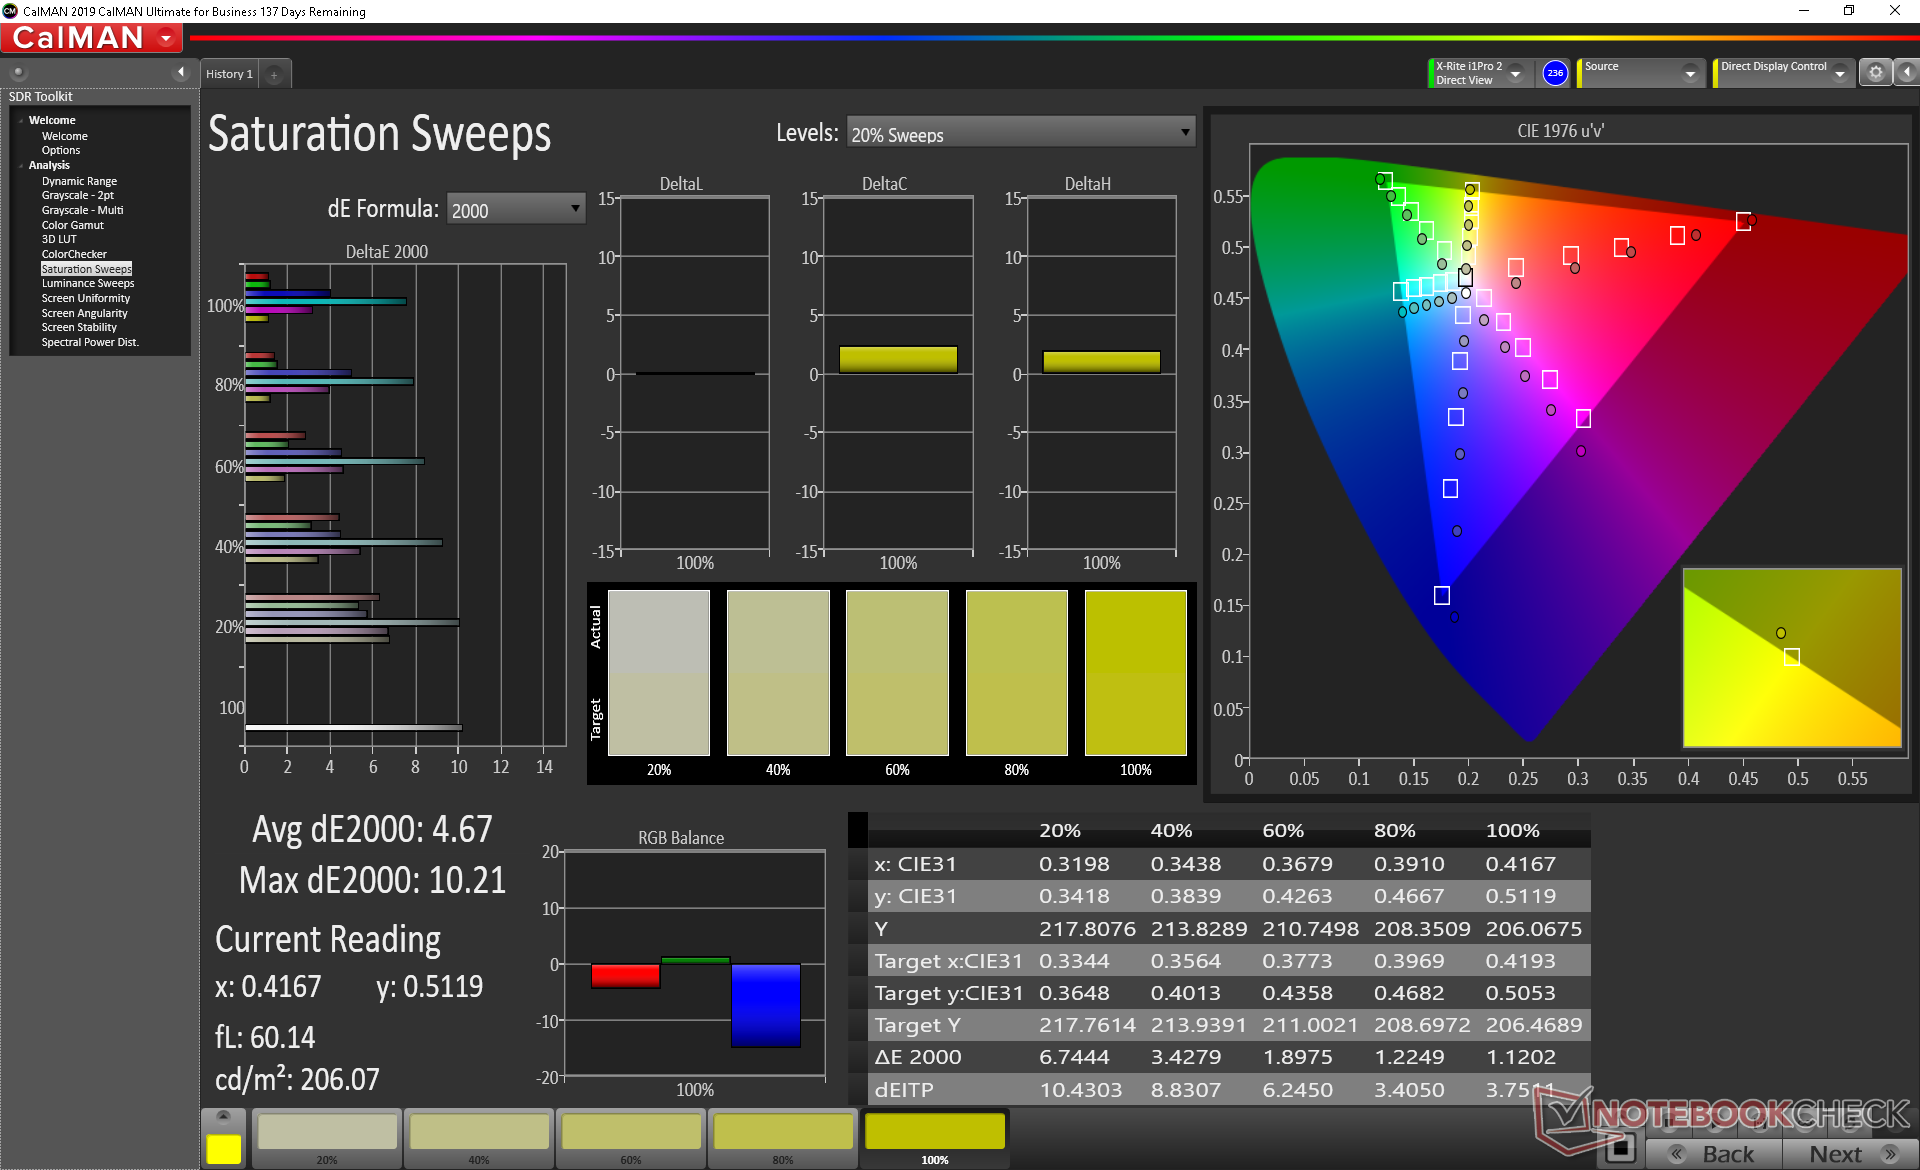
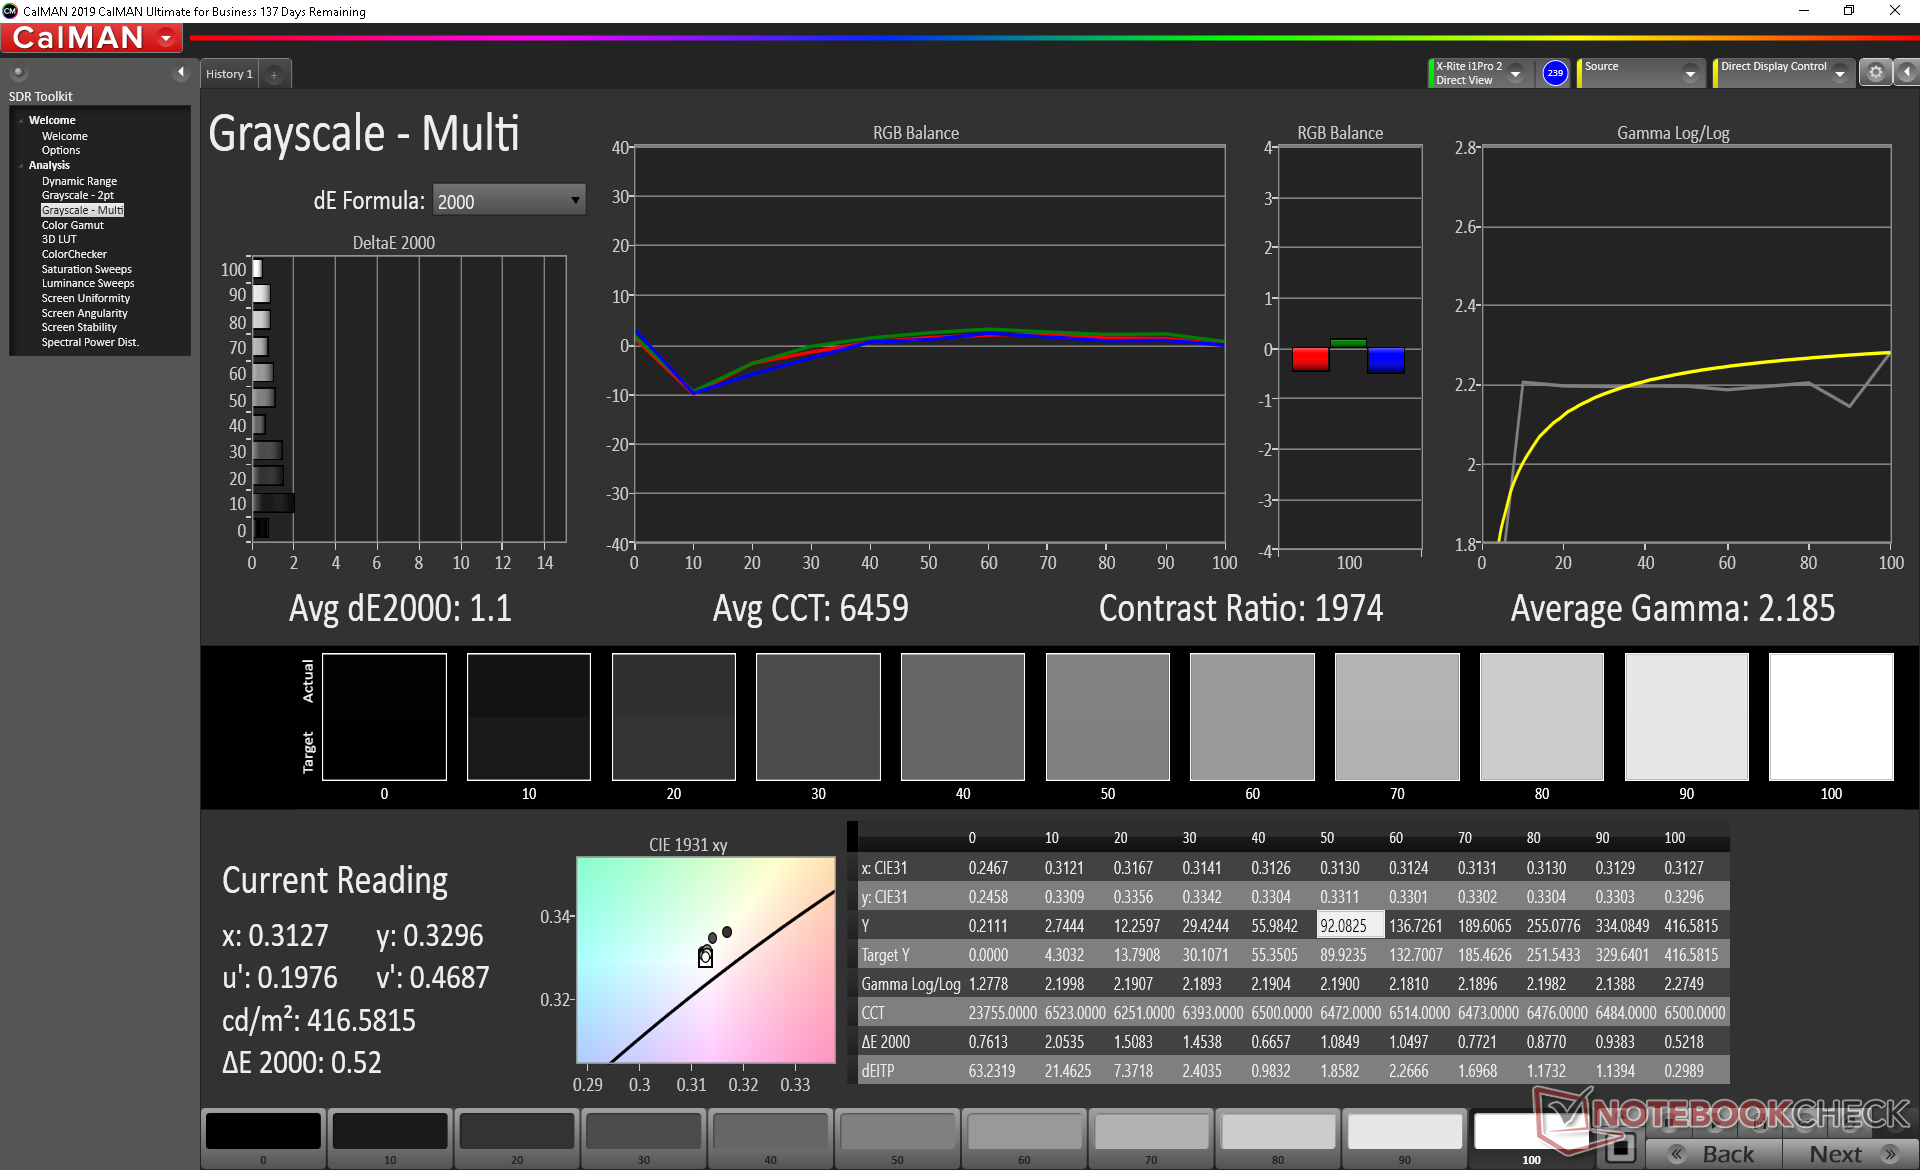
Further measurements with an X-Rite colorimeter show a poorly calibrated display out of the box with color temperature being far too cool and the color teal being unusually inaccurate. Calibrating the panel ourselves addresses the problem for noticeably better colors and grayscale. We recommend an end-user calibration to get the most out of the display especially since it is capable of accurately reproducing sRGB.
Display Response Times
| ↔ Response Time Black to White | ||
|---|---|---|
| 32 ms ... rise ↗ and fall ↘ combined | ↗ 16.4 ms rise | 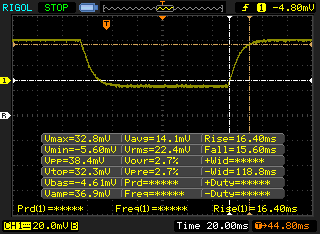 |
| ↘ 15.6 ms fall | ||
| The screen shows slow response rates in our tests and will be unsatisfactory for gamers. In comparison, all tested devices range from 0.1 (minimum) to 240 (maximum) ms. » 85 % of all devices are better. This means that the measured response time is worse than the average of all tested devices (20.3 ms). | ||
| ↔ Response Time 50% Grey to 80% Grey | ||
| 52.8 ms ... rise ↗ and fall ↘ combined | ↗ 25.2 ms rise | 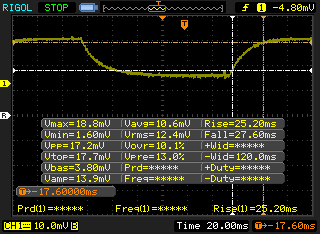 |
| ↘ 27.6 ms fall | ||
| The screen shows slow response rates in our tests and will be unsatisfactory for gamers. In comparison, all tested devices range from 0.165 (minimum) to 636 (maximum) ms. » 89 % of all devices are better. This means that the measured response time is worse than the average of all tested devices (31.7 ms). | ||
Screen Flickering / PWM (Pulse-Width Modulation)
| Screen flickering / PWM not detected | 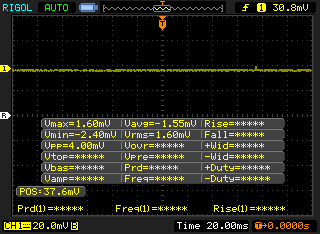 | ||
In comparison: 53 % of all tested devices do not use PWM to dim the display. If PWM was detected, an average of 8160 (minimum: 5 - maximum: 343500) Hz was measured. | |||
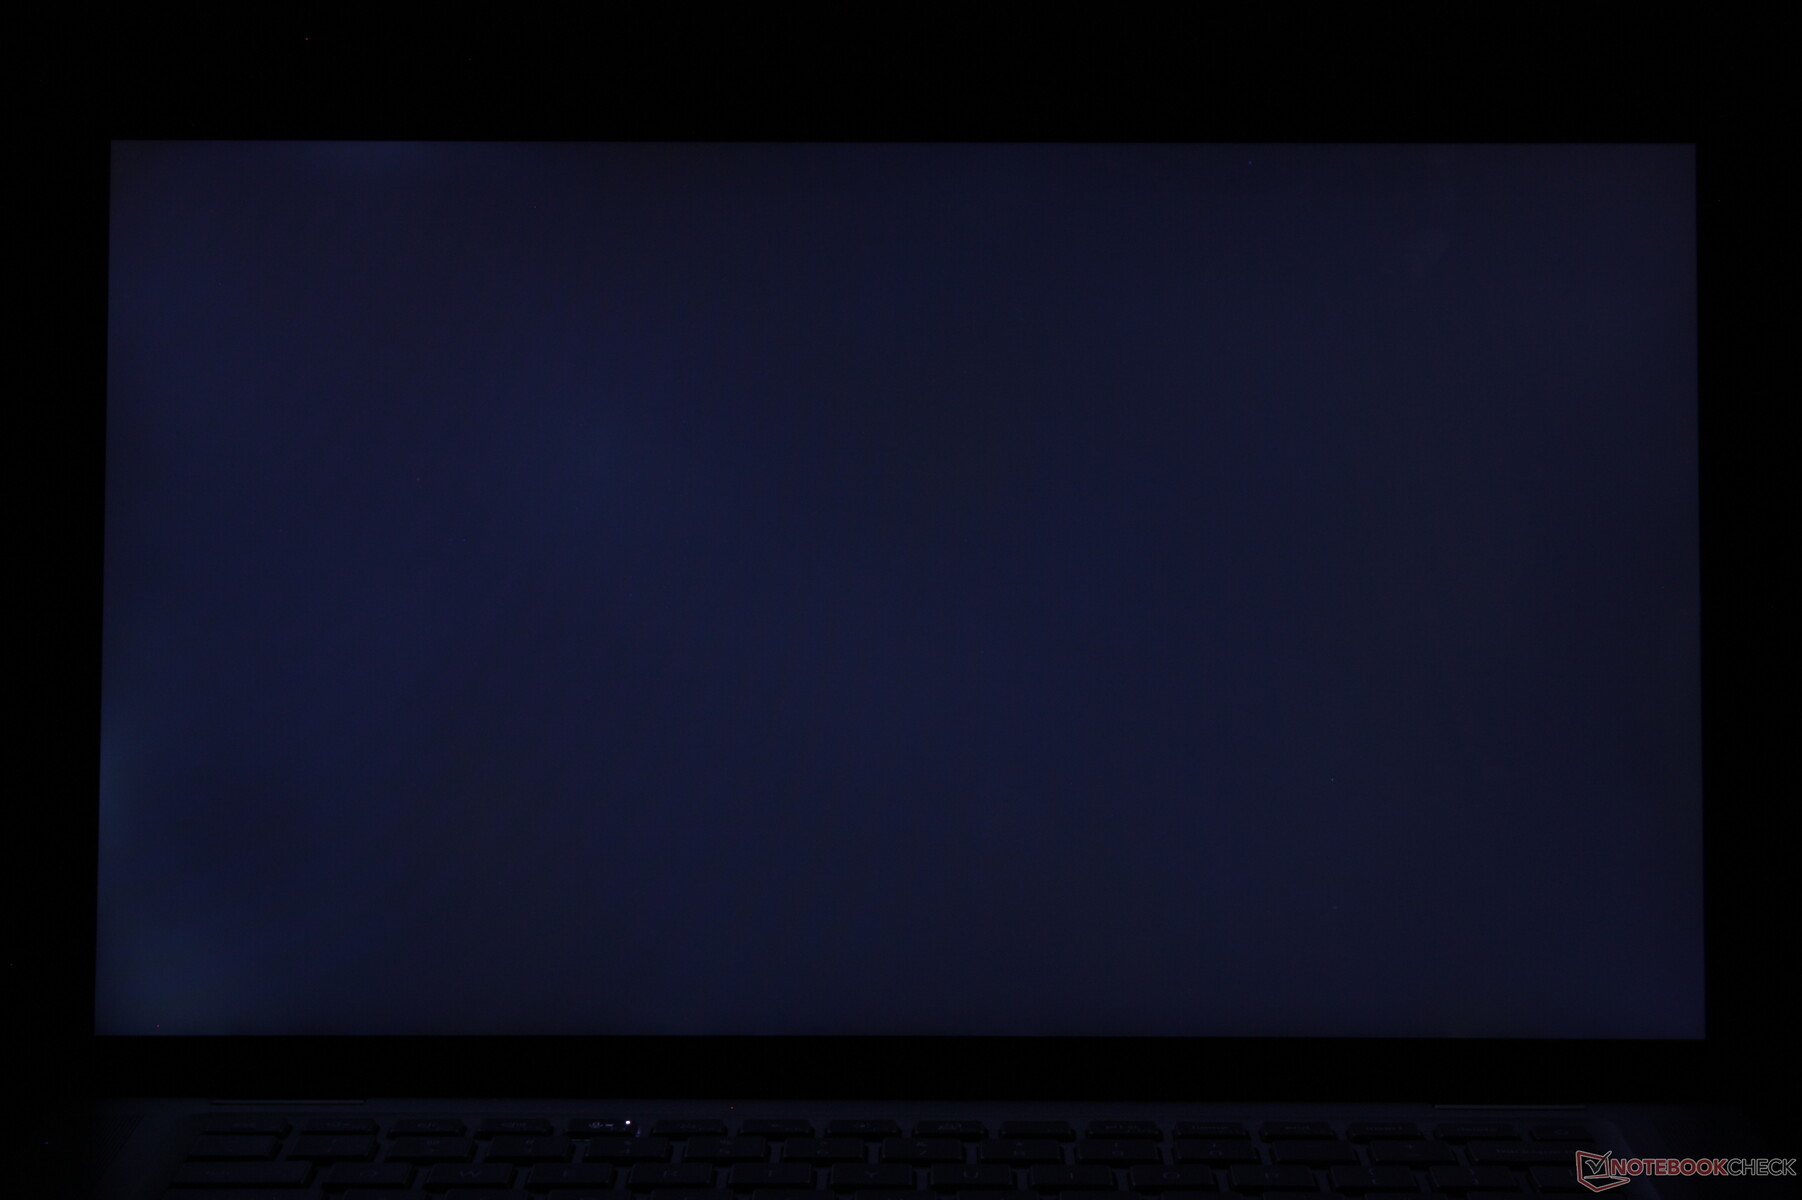
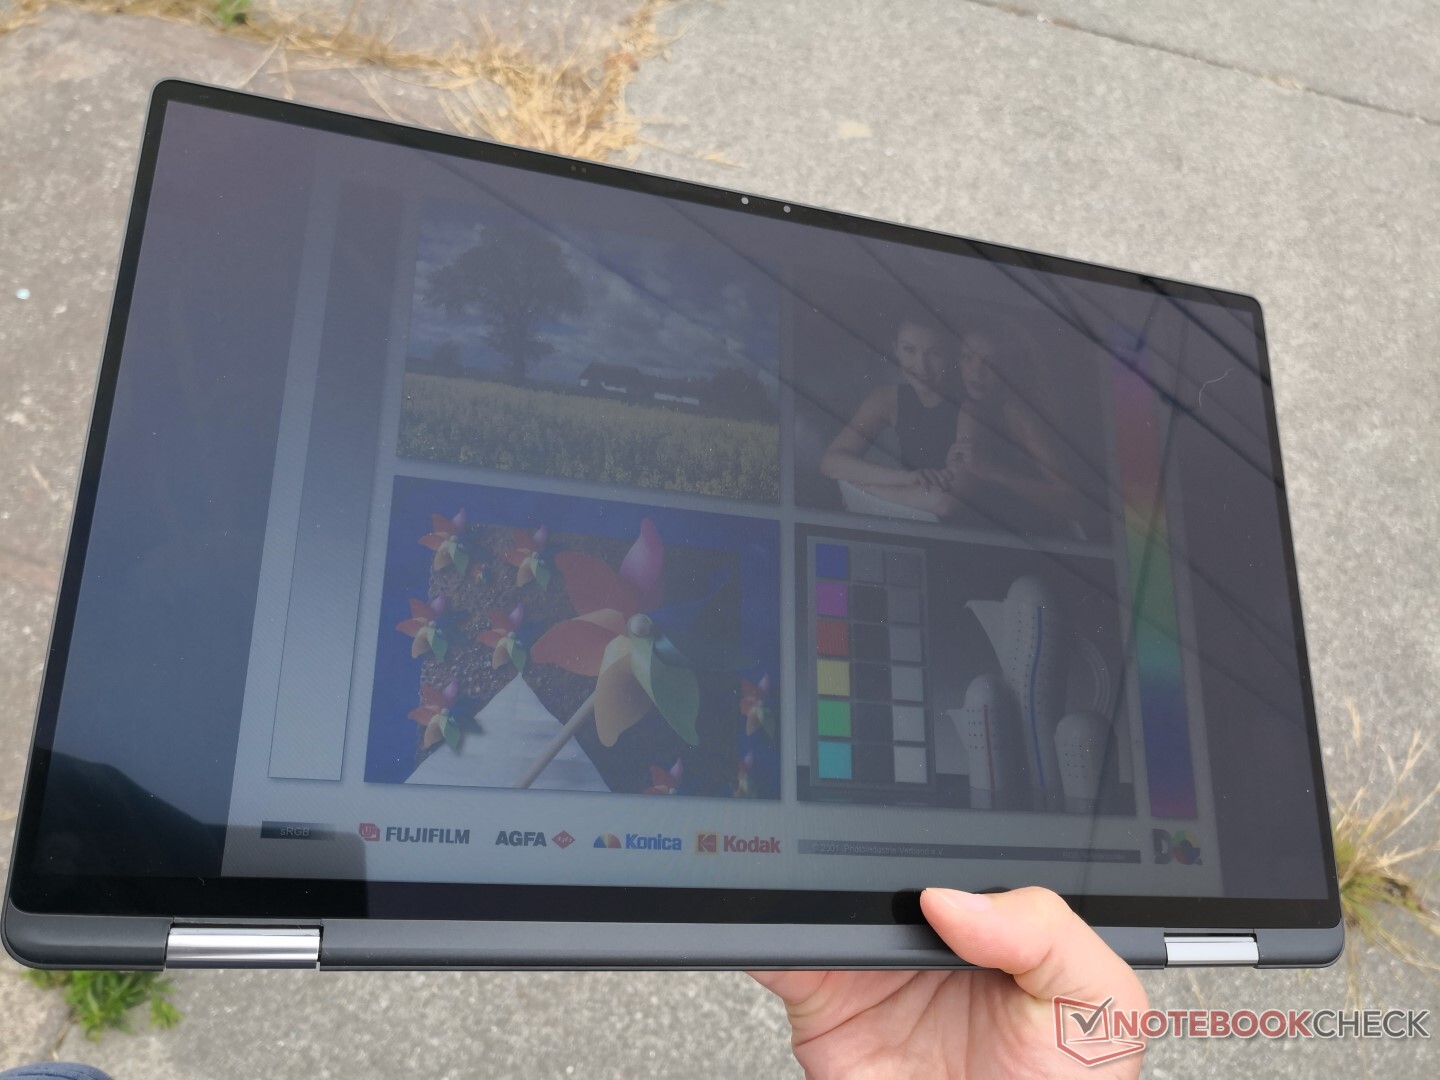
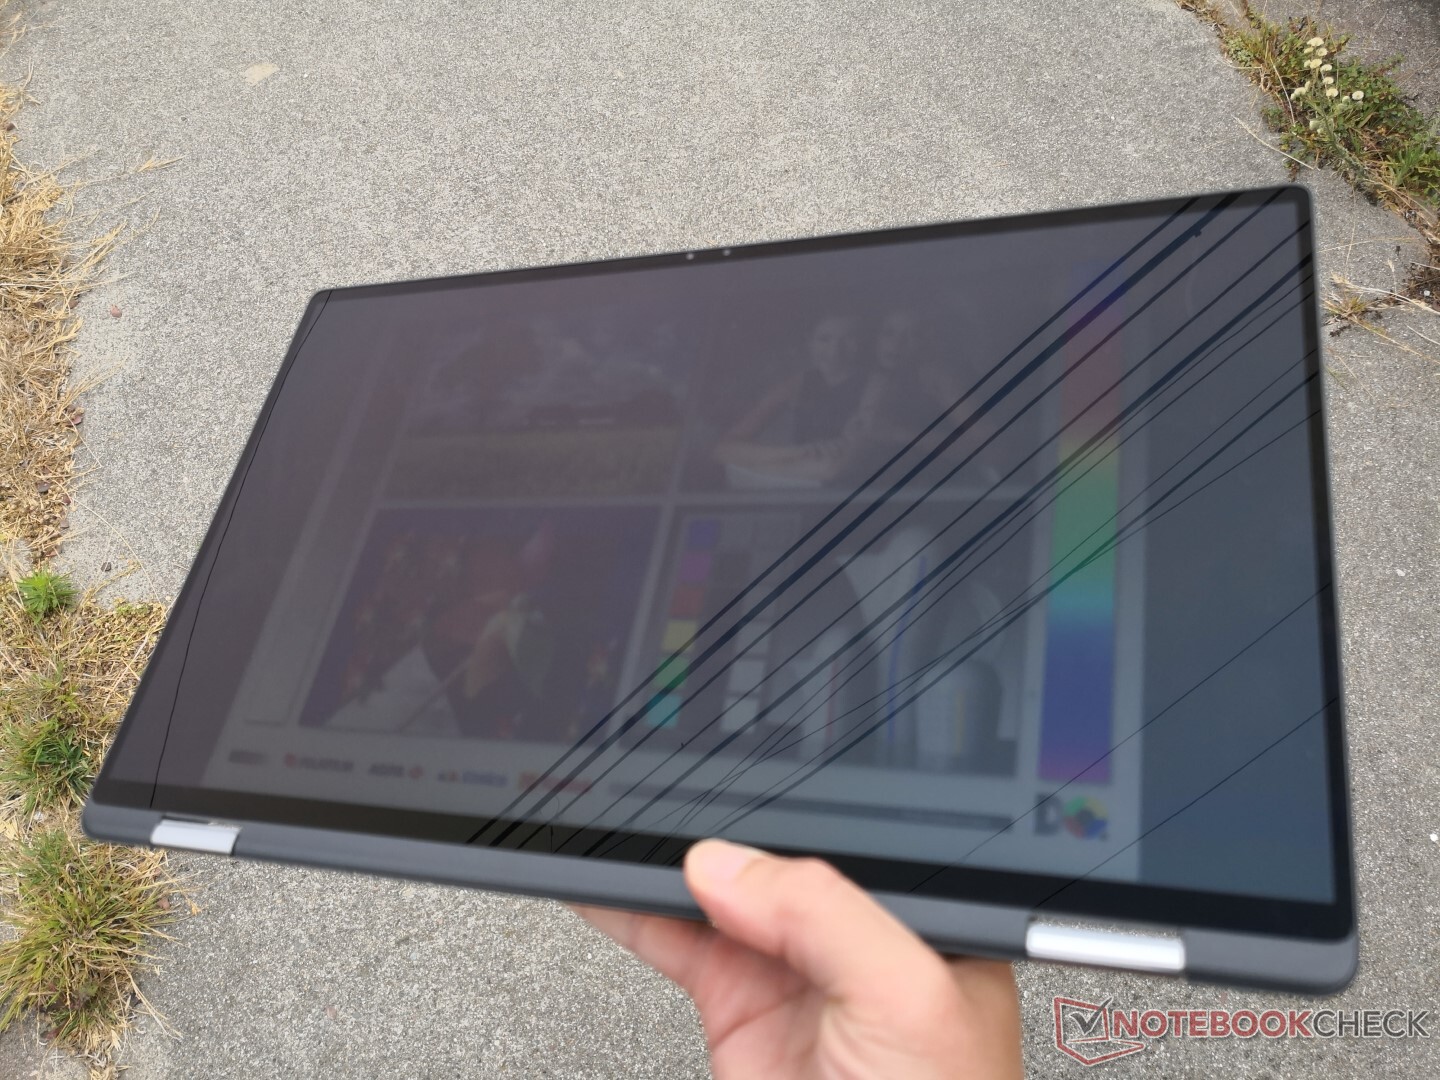
Outdoor visibility is average despite the 400-nit display because of the glossy and glare-heavy screen. Dell should consider adding 1000-nit panel options like on some HP EliteBook models to aid in outdoor conditions. Stay in the shade whenever possible to avoid squinting at texts and images.

Performance
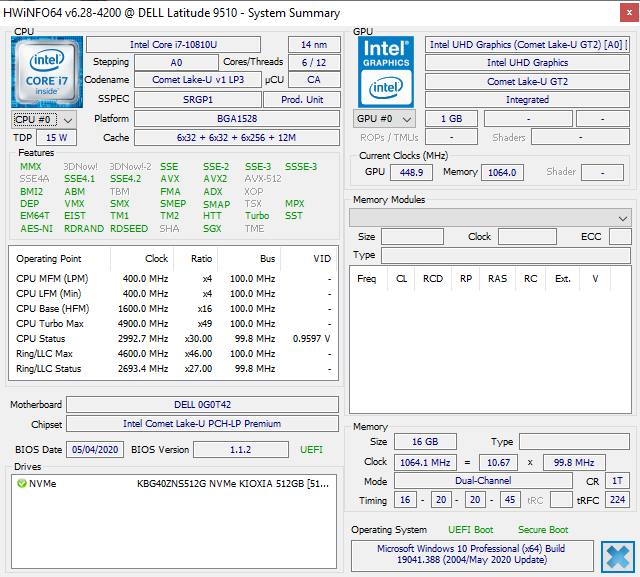
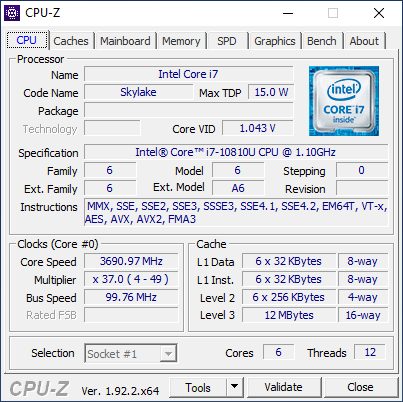
Processor options include only Comet Lake-U up to the uncommon 6-core Core i7-10810U. This processor is essentially the Core i7-10710U but with integrated vPro support so users shouldn't expect it to be run faster. Sadly, there are no AMD Ryzen or Iris Pro options which would have boosted GPU performance significantly.
We didn't experience any software or hardware issues during our time with the test unit. However, we recommend becoming accustomed to the pre-installed Dell Command, Optimizer, Power Manager, and Digital Delivery applications as their settings directly impact system performance and behavior including the unique proximity sensor.
We ran all benchmarks below on Dell's Ultra Performance mode to get the best scores possible. This setting can be found on the Dell Power Manager application.
Processor
CPU performance is a mixed bag as shown by our graph below when running CineBench R15 Multi-Thread in a loop. The initial high score of 1064 points would drop to just 640 points by the third loop to represent a significant 40 percent dip in performance. This ultimately means that the system is best for "bursty" workloads instead of high loads for long periods. The unsteady results are reflected by the unsteady clock rates that we will detail in the Stress Test section below. Thus, while the Core i7-10810U is most similar to the Core i7-10710U on paper, it may not perform nearly as well as one might expect on the Latitude 9510 2-in-1.
See our dedicated page on the Core i7-10810U for more technical information and benchmark comparisons.
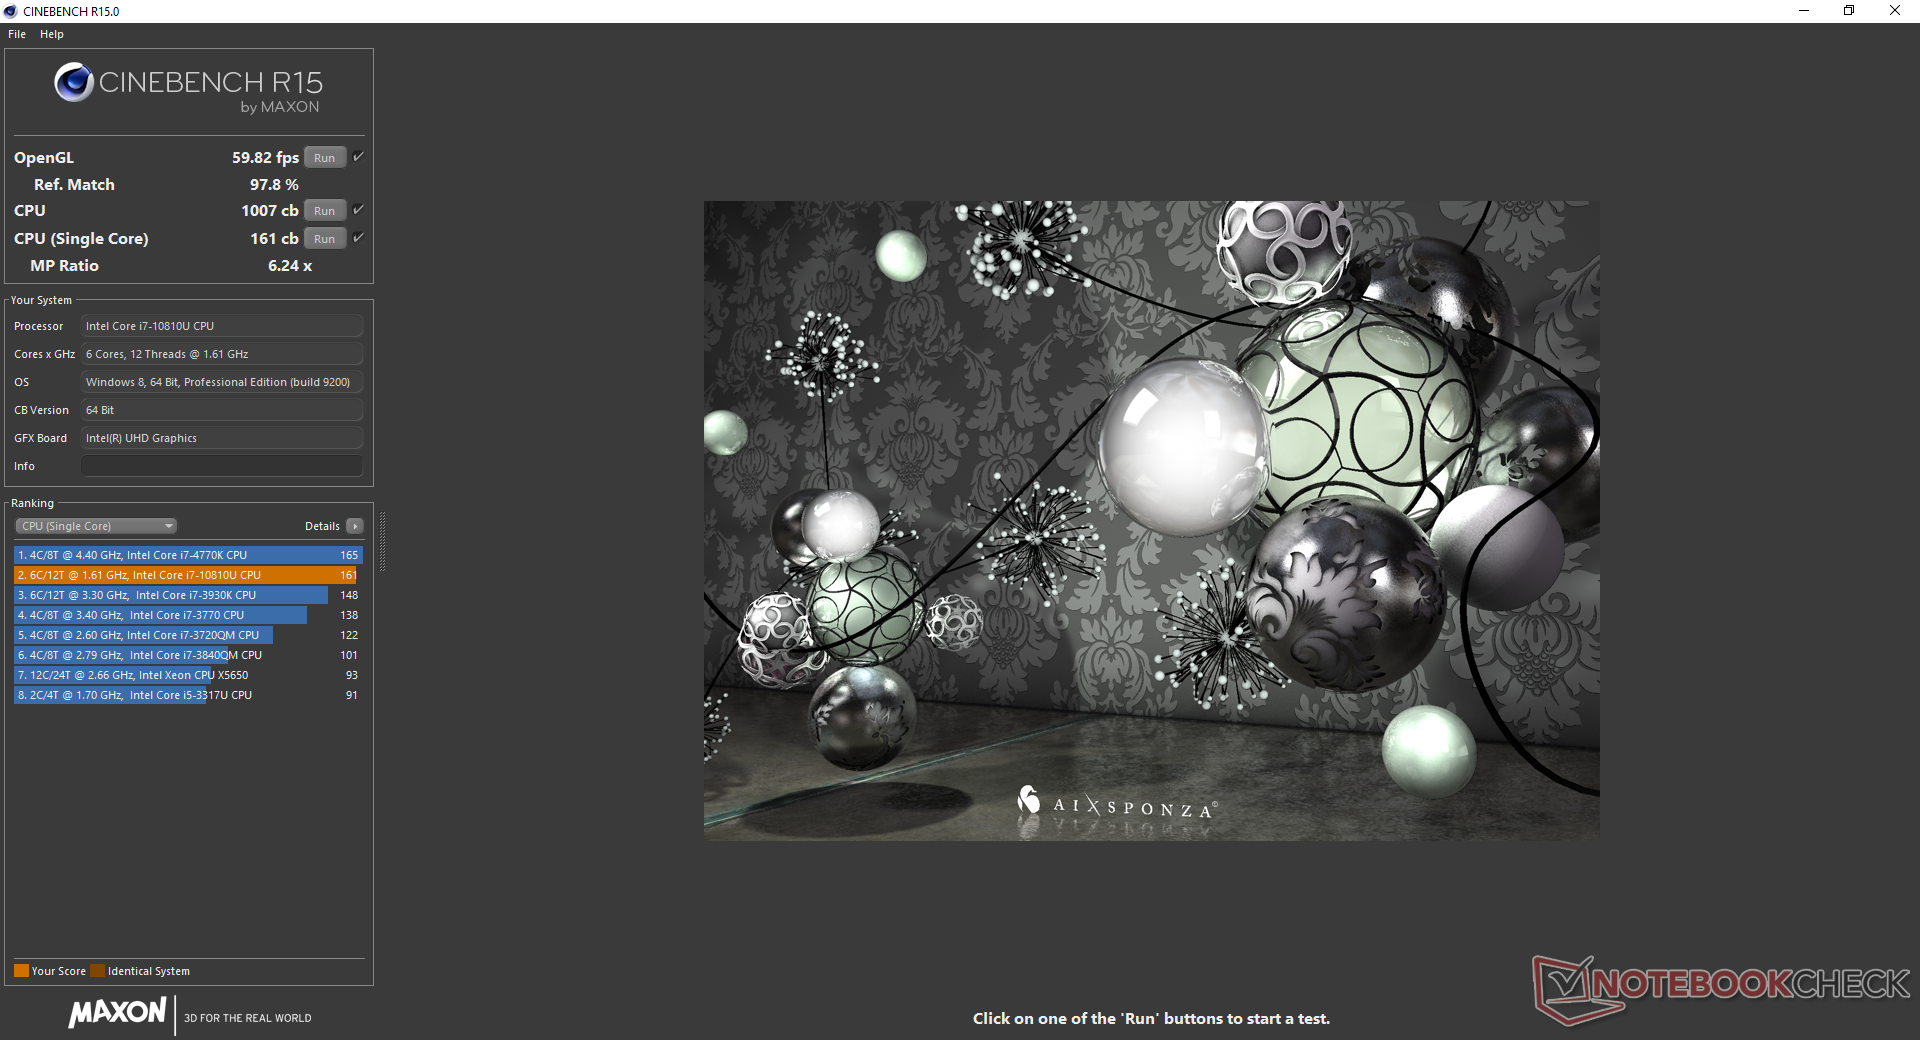
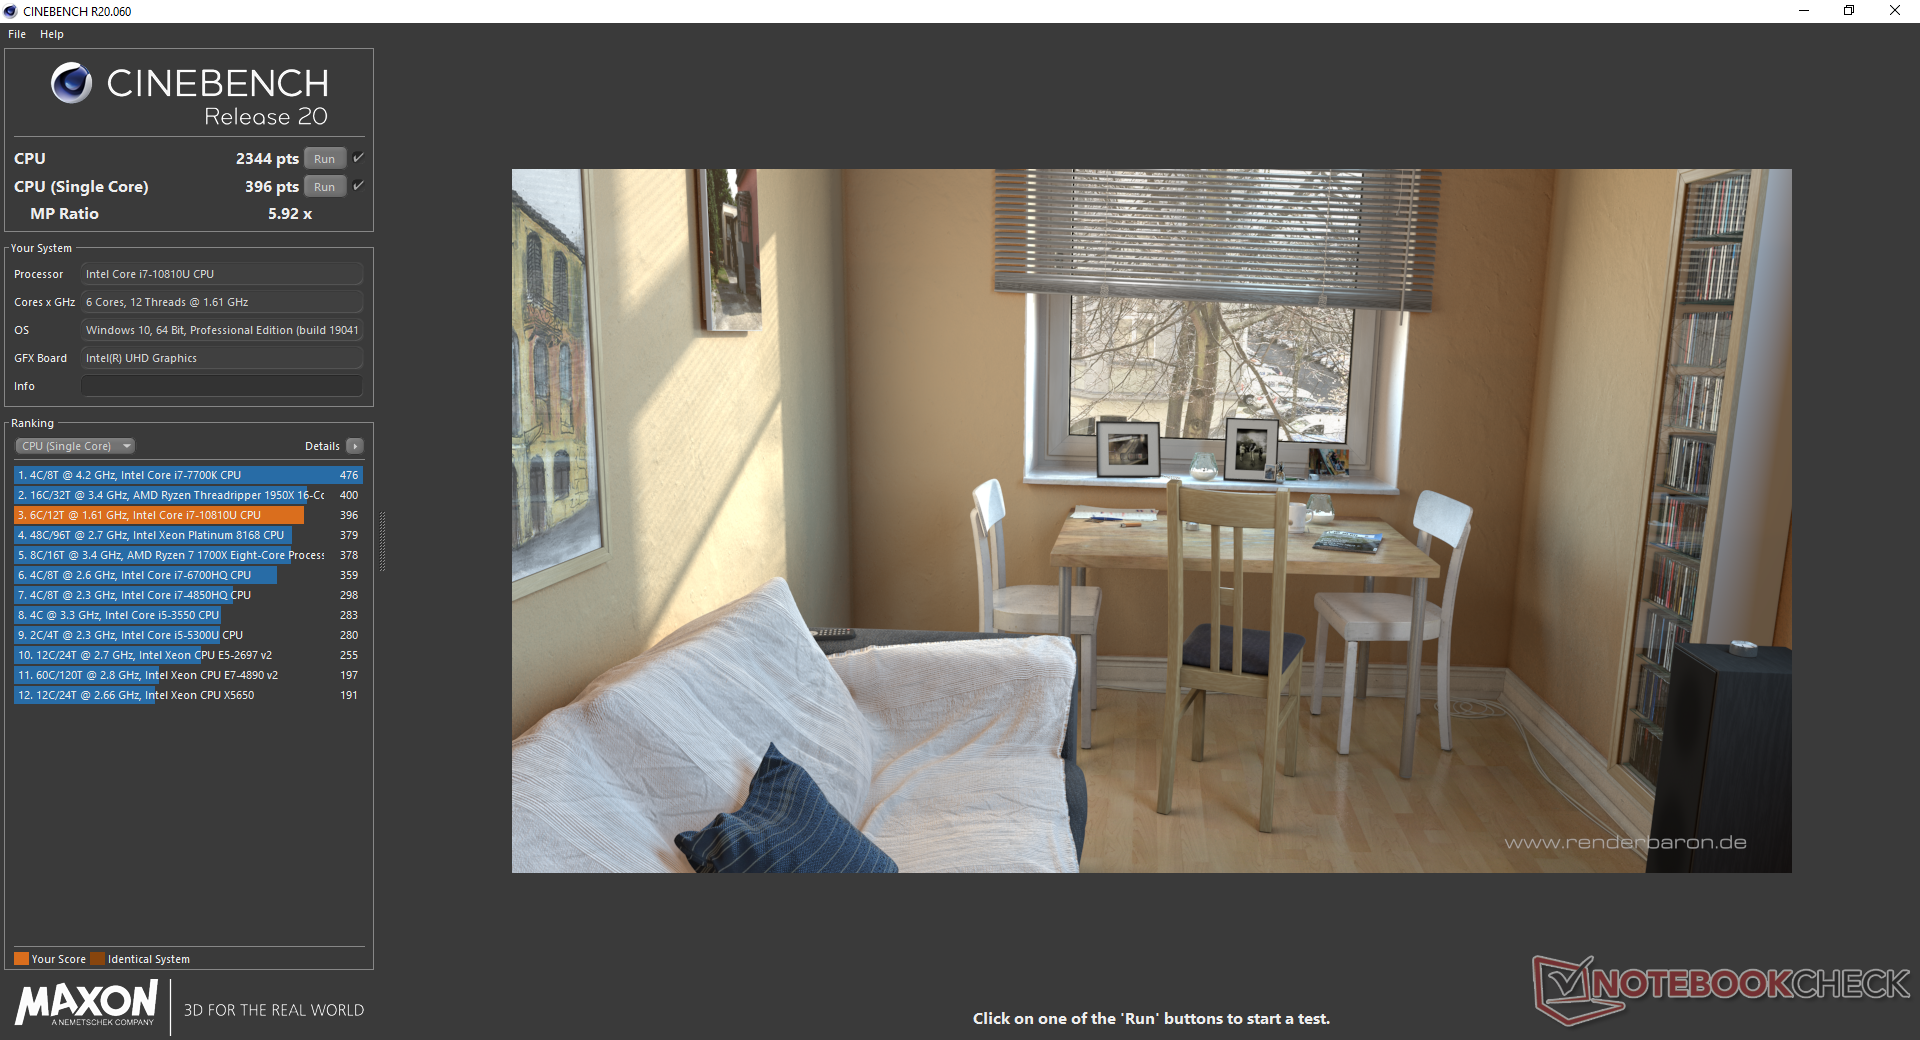
Cinebench R15: CPU Multi 64Bit | CPU Single 64Bit
Blender: v2.79 BMW27 CPU
7-Zip 18.03: 7z b 4 -mmt1 | 7z b 4
Geekbench 5.5: Single-Core | Multi-Core
HWBOT x265 Benchmark v2.2: 4k Preset
LibreOffice : 20 Documents To PDF
R Benchmark 2.5: Overall mean
Cinebench R15: CPU Multi 64Bit | CPU Single 64Bit
Blender: v2.79 BMW27 CPU
7-Zip 18.03: 7z b 4 -mmt1 | 7z b 4
Geekbench 5.5: Single-Core | Multi-Core
HWBOT x265 Benchmark v2.2: 4k Preset
LibreOffice : 20 Documents To PDF
R Benchmark 2.5: Overall mean
* ... smaller is better
System Performance
| PCMark 8 | |
| Home Score Accelerated v2 | |
| Lenovo ThinkBook 15 | |
| Dell Latitude 5591 | |
| Dell Latitude 9510 2-in-1 | |
| HP Envy x360 15-dr1679cl | |
| Lenovo ThinkPad T15 Gen1-20S7S02U00 | |
| Work Score Accelerated v2 | |
| Dell Latitude 5591 | |
| HP Envy x360 15-dr1679cl | |
| Dell Latitude 9510 2-in-1 | |
| Lenovo ThinkBook 15 | |
| Lenovo ThinkPad T15 Gen1-20S7S02U00 | |
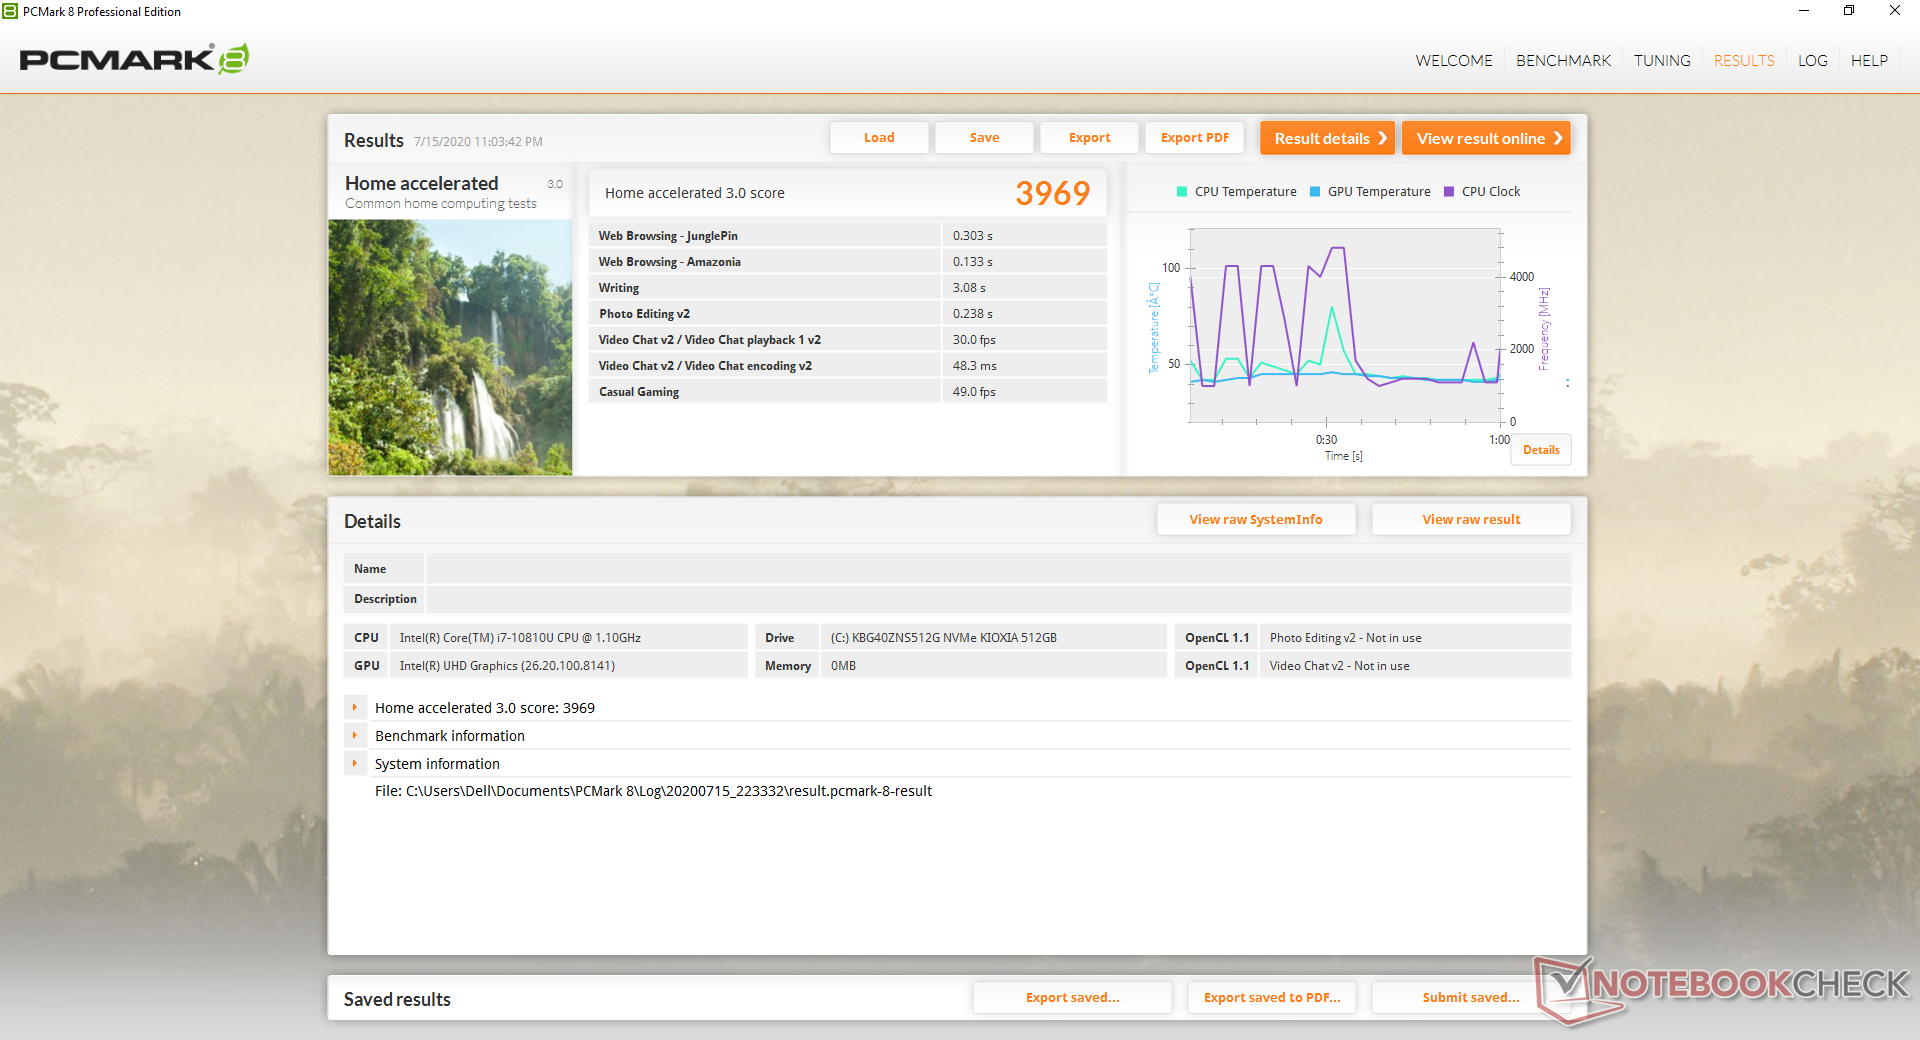
| PCMark 8 Home Score Accelerated v2 | 3969 points | |
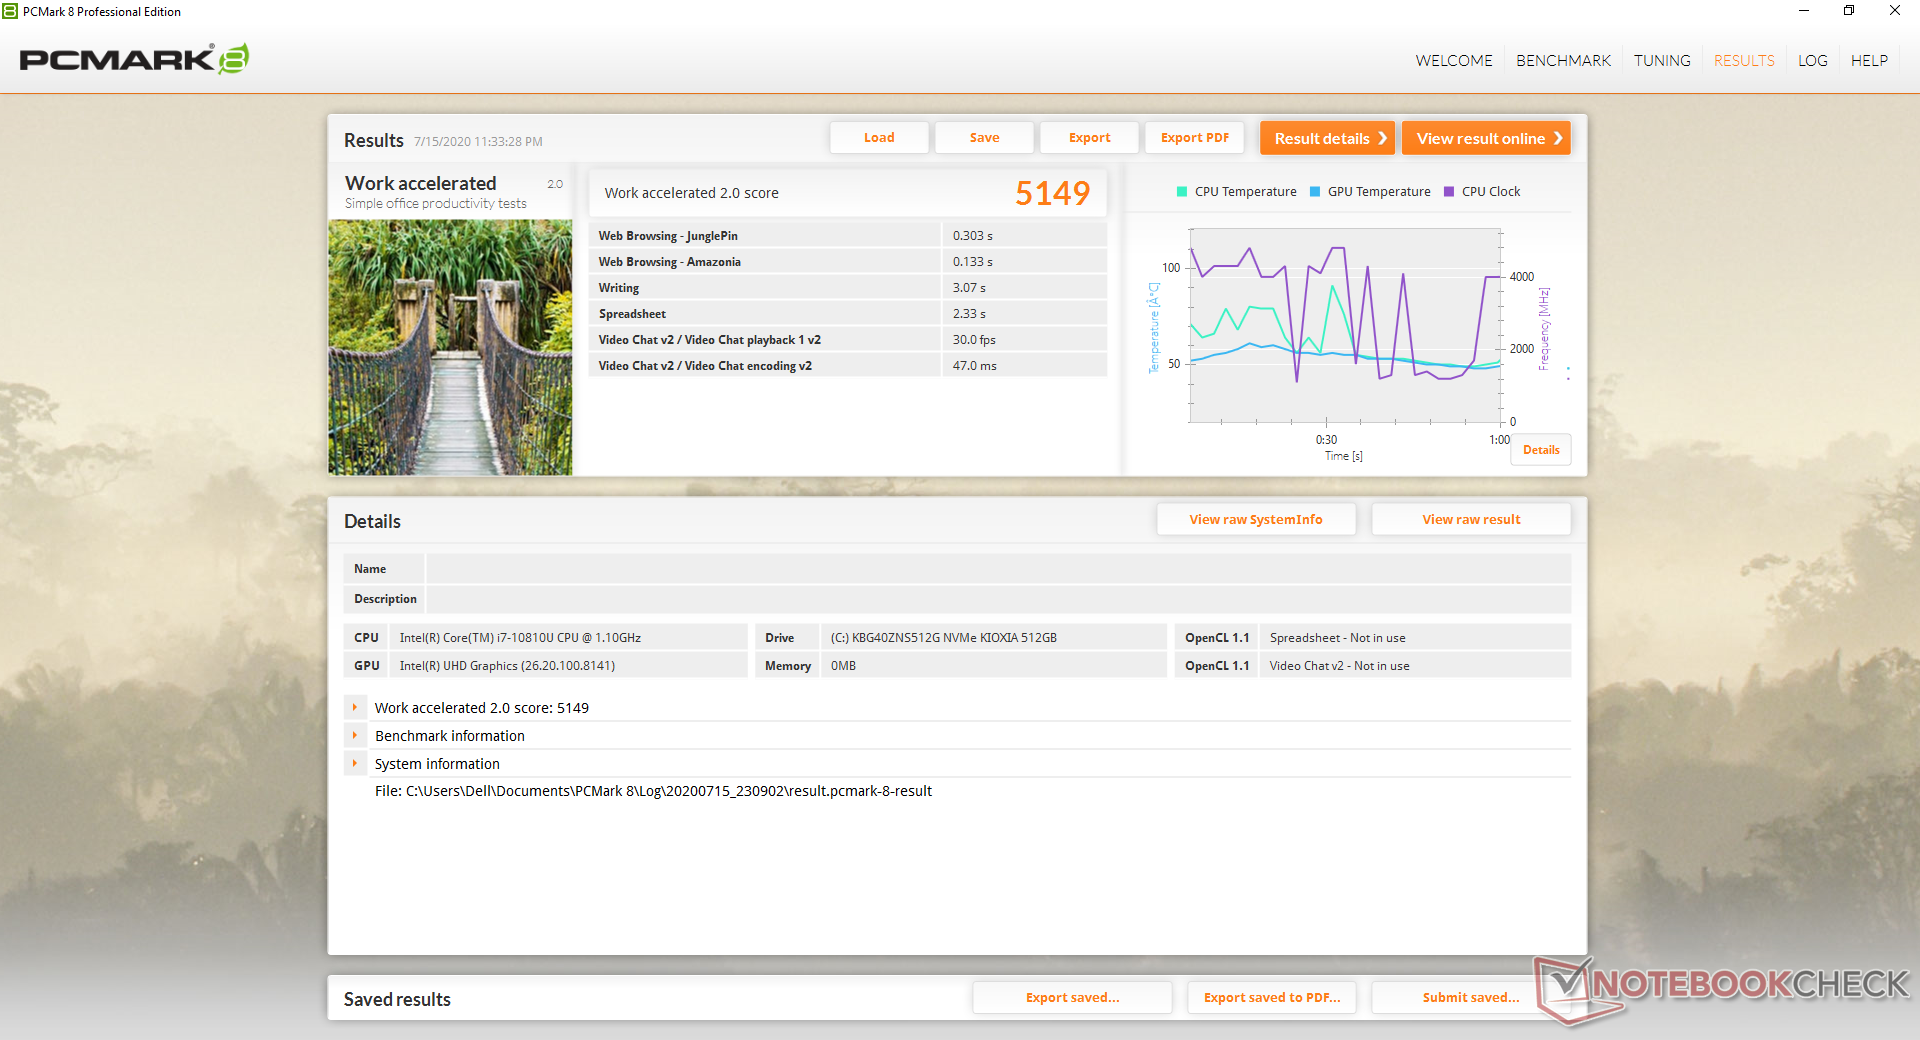
| PCMark 8 Work Score Accelerated v2 | 5149 points | |
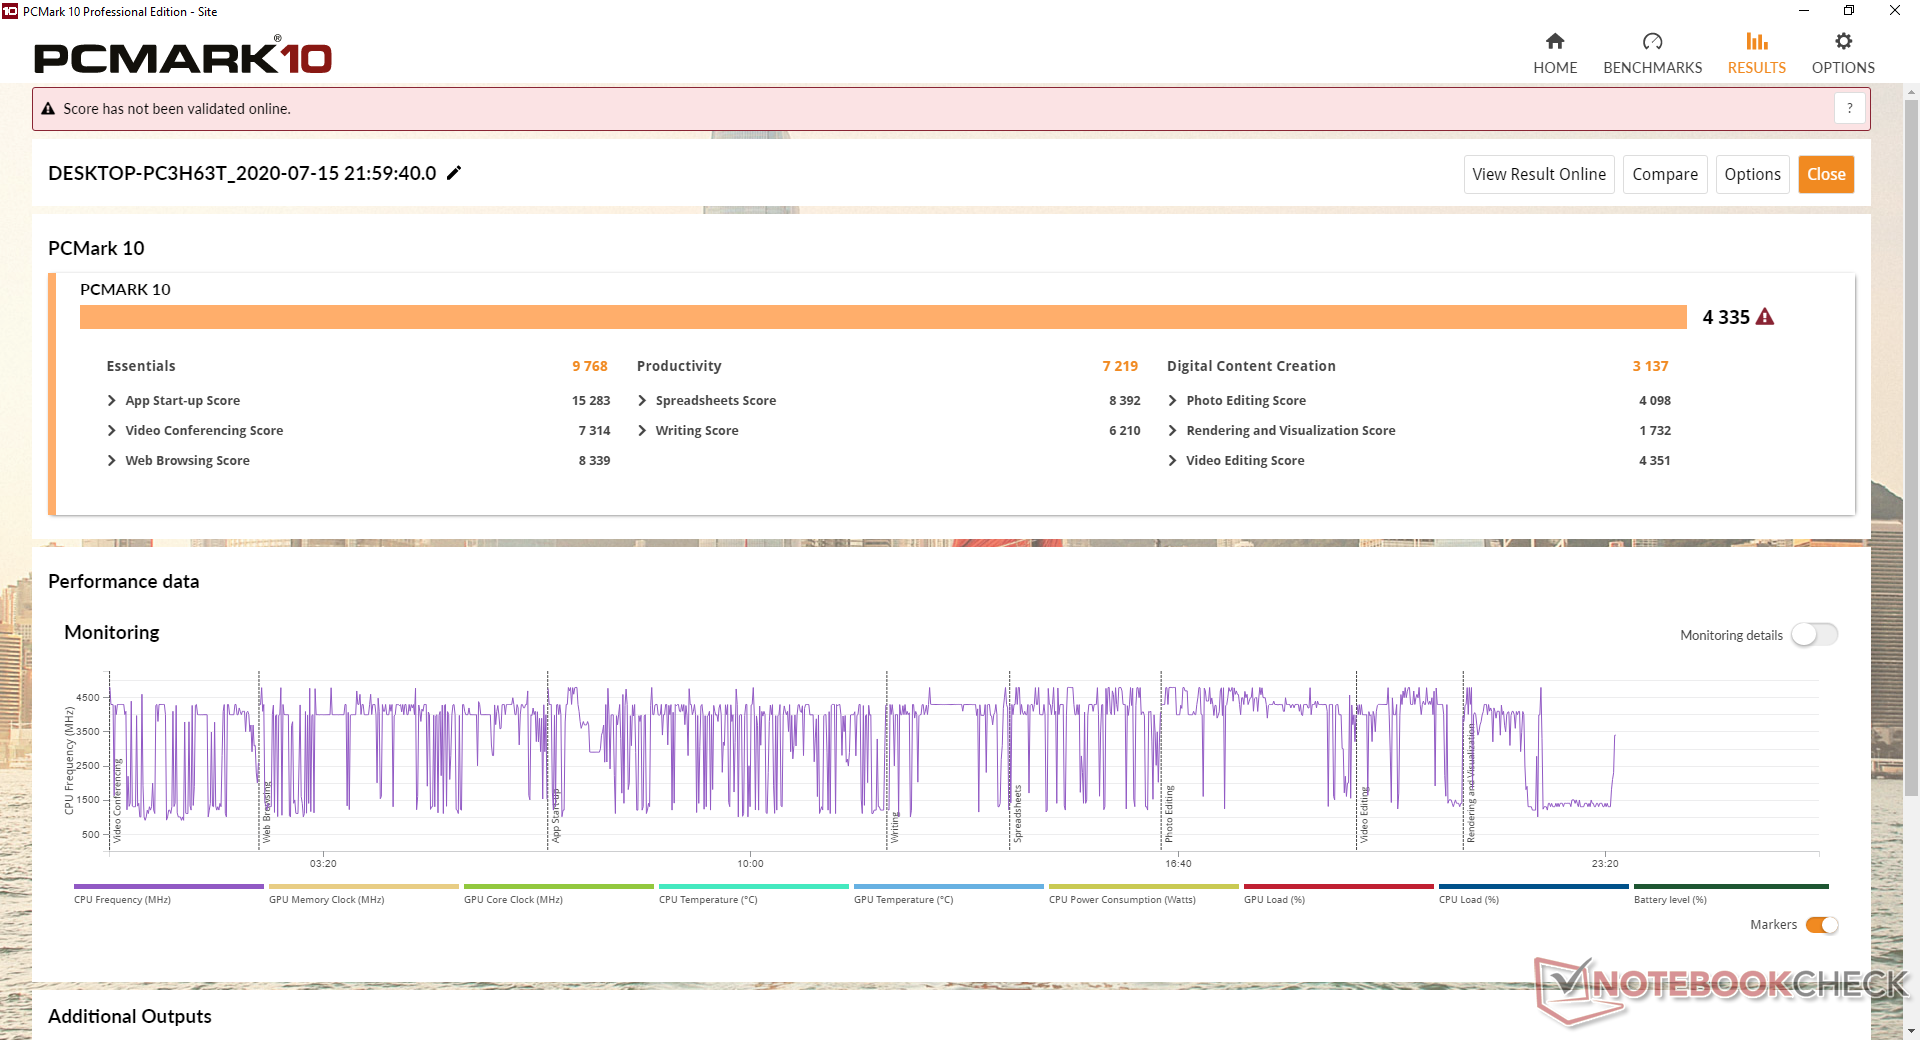
| PCMark 10 Score | 4335 points | |
Help | ||
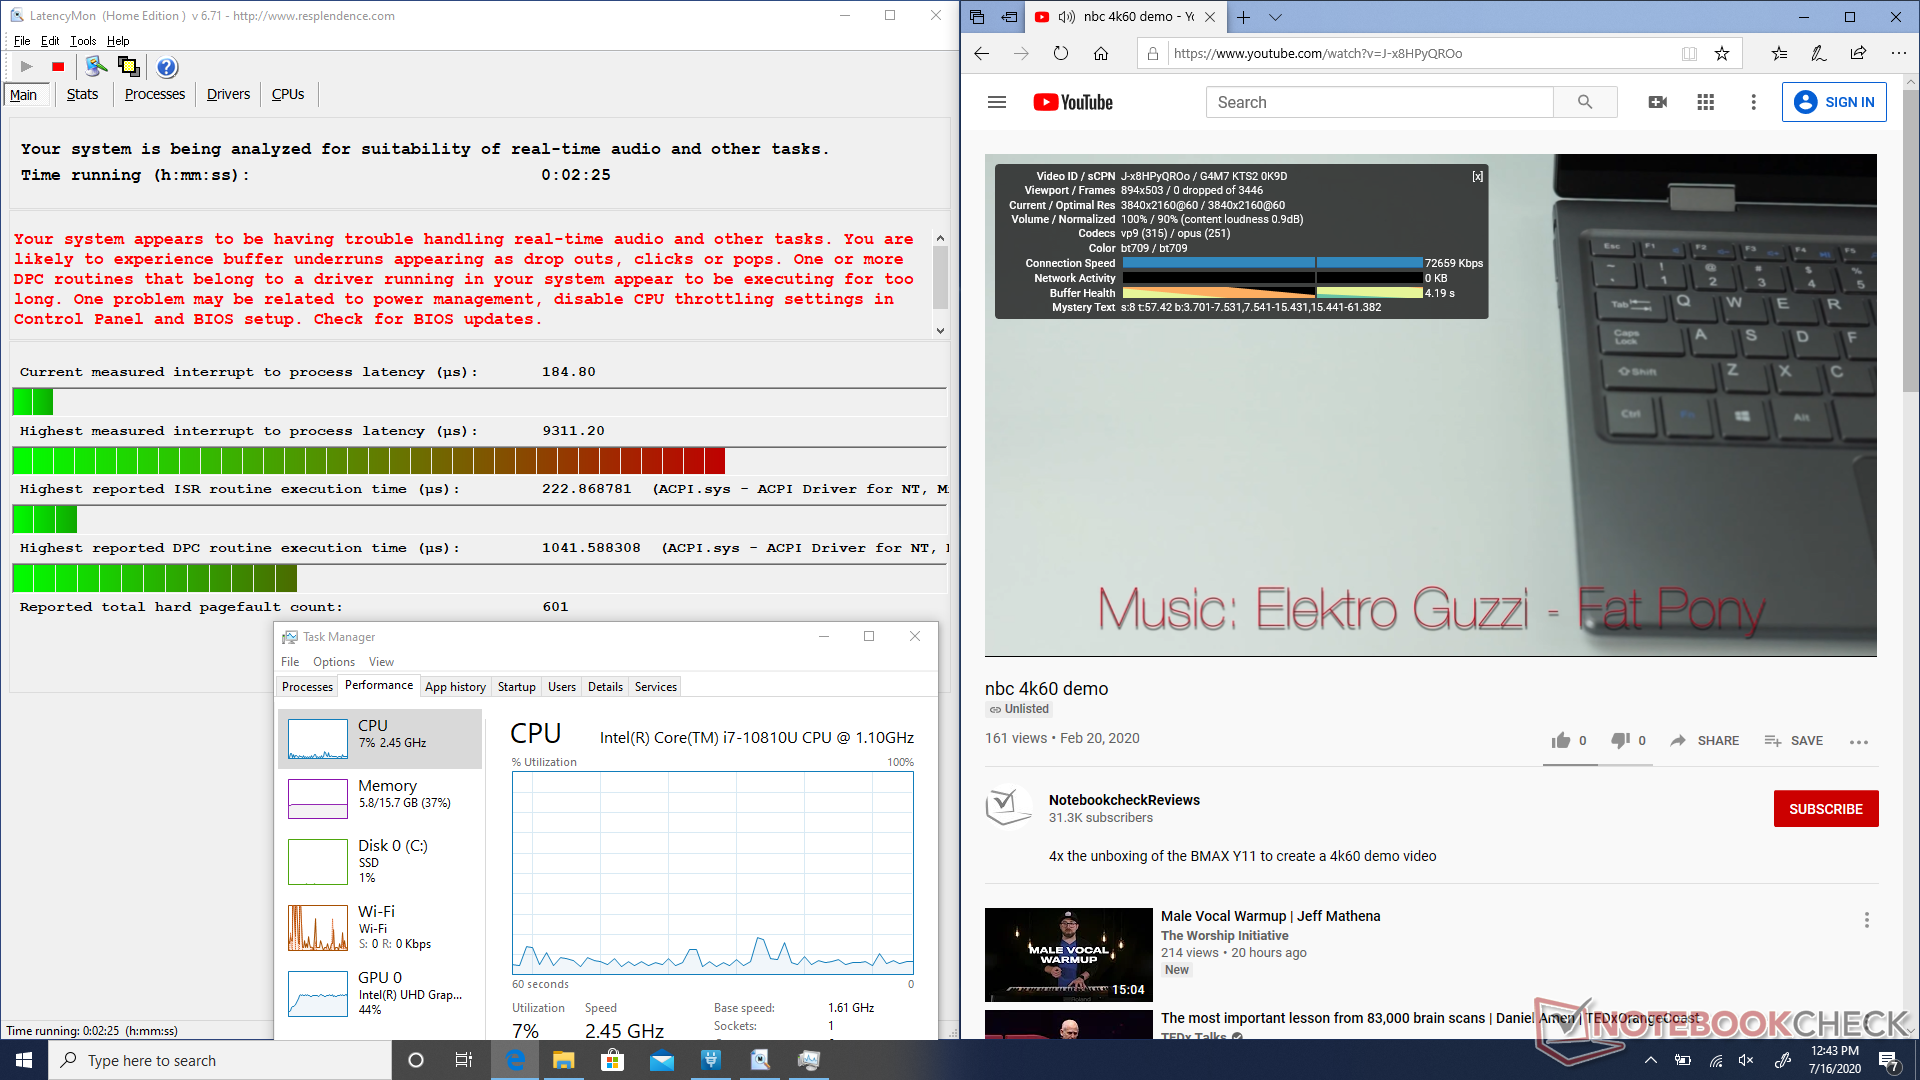
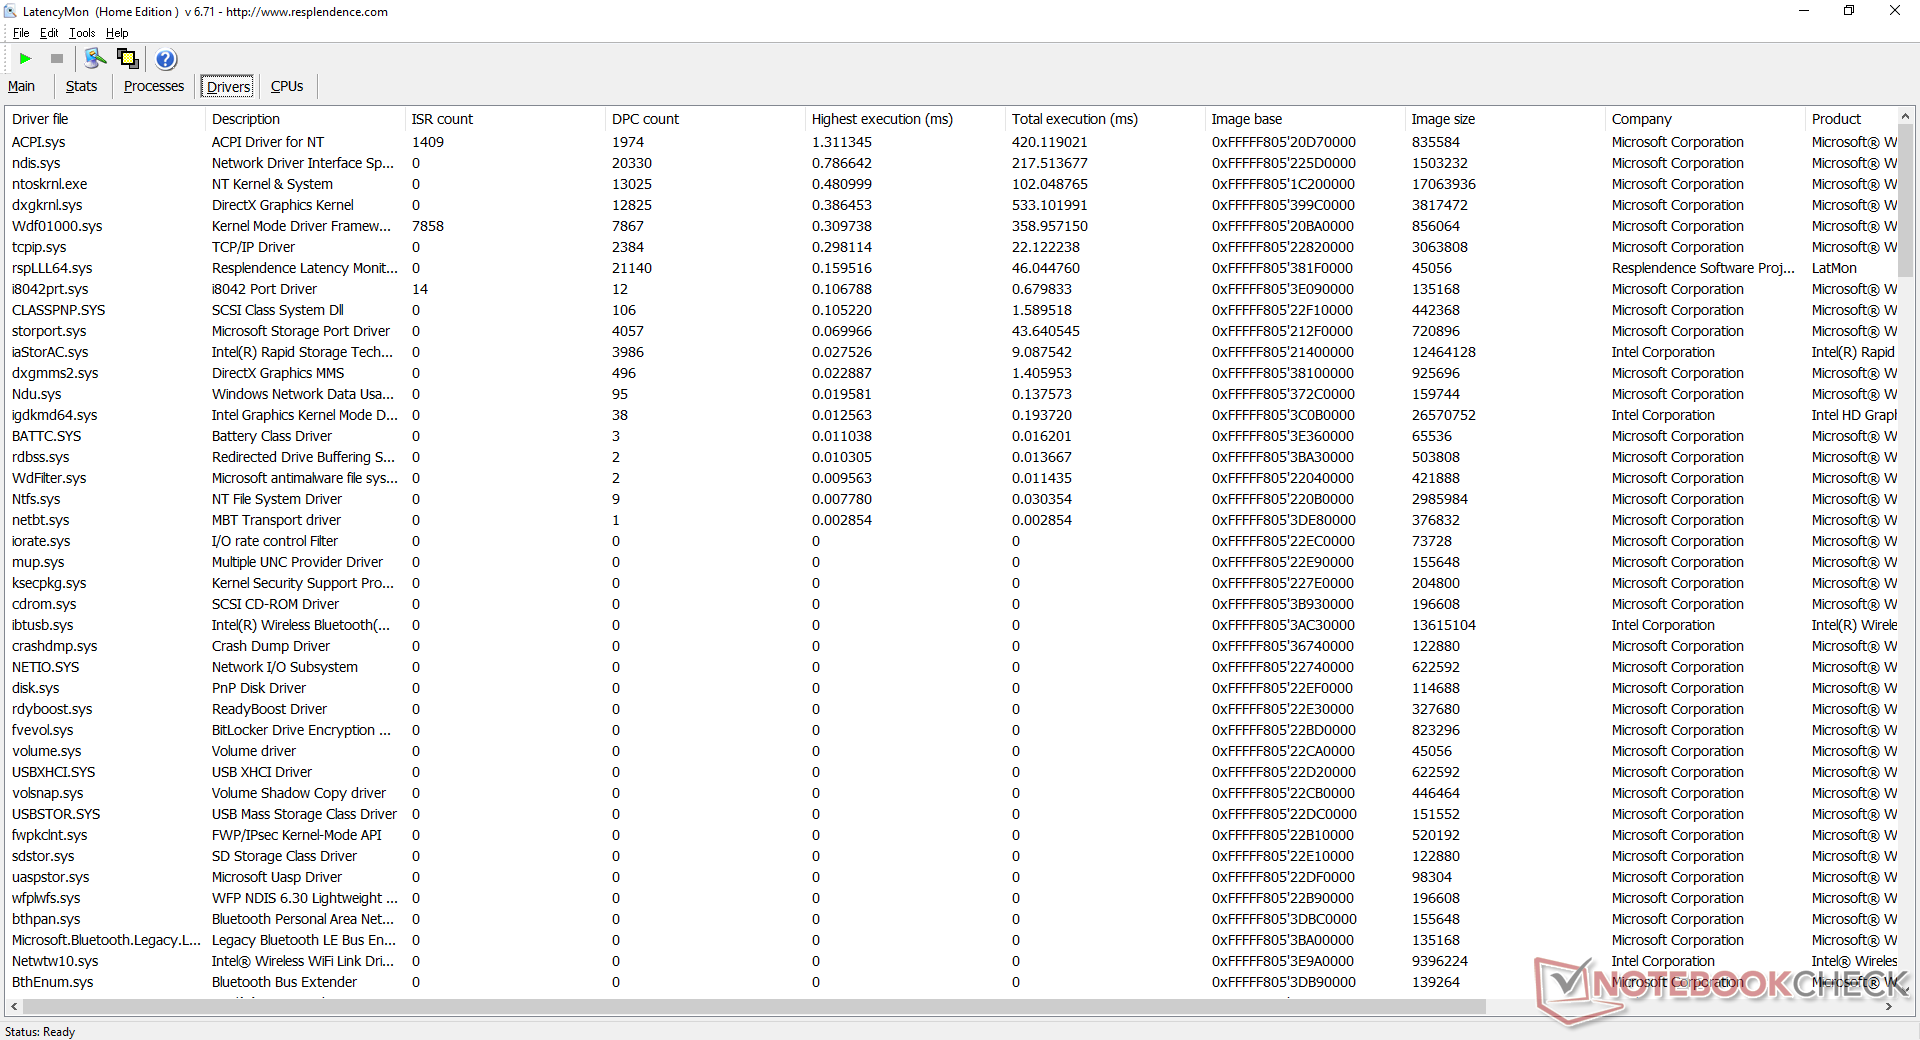
DPC Latency
LatencyMon shows issues related to ACPI.sys, but 4K video playback on YouTube is otherwise smooth and with no dropped frames.
| DPC Latencies / LatencyMon - interrupt to process latency (max), Web, Youtube, Prime95 | |
| Dell Latitude 9510 2-in-1 | |
| HP Envy x360 15-dr1679cl | |
| Lenovo ThinkPad T15 Gen1-20S7S02U00 | |
| Honor Magicbook 14 | |
| HP EliteBook 735 G6 7KN29EA | |
| Honor MagicBook 15 | |
| HP Envy x360 13-ay0010nr | |
| Microsoft Surface Book 3 15 | |
| HP ProBook 455 G7-175W8EA | |
* ... smaller is better
Storage Devices
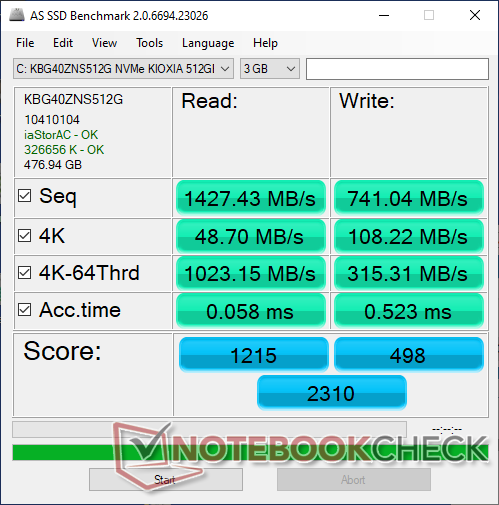
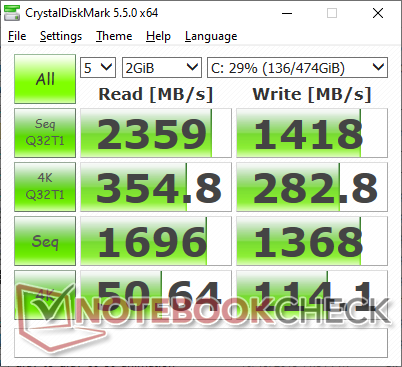
The Latitude 9510 utilizes the smaller and less common M.2 2230 slot whereas most other laptops use M.2 2280. The 512 GB Toshiba BG4 NVMe drive in our unit offers theoretical sequential read and write speeds of up to 2200 MB/s and 1400 MB/s, respectively, which we are able to confirm with AS SSD. The more popular Samsung SSD PM981 as found on laptops like the ThinkBook 15 is even faster.
| Dell Latitude 9510 2-in-1 Toshiba KBG40ZNS512G NVMe | Lenovo ThinkPad T15 Gen1-20S7S02U00 Toshiba XG6 KXG6AZNV1T02 | Lenovo ThinkBook 15 Samsung SSD PM981 MZVLB512HAJQ | Dynabook Tecra X50-F Samsung SSD PM981 MZVLB512HAJQ | HP Envy x360 15-dr1679cl Intel Optane Memory H10 with Solid State Storage 32GB + 512GB HBRPEKNX0202A(L/H) | Dell Latitude 5591 Toshiba XG5 KXG50ZNV512G | |
|---|---|---|---|---|---|---|
| AS SSD | 88% | 105% | 49% | -5% | -11% | |
| Seq Read (MB/s) | 1427 | 2372 66% | 2564 80% | 1461 2% | 931 -35% | 2573 80% |
| Seq Write (MB/s) | 741 | 2230 201% | 2268 206% | 1039 40% | 331.5 -55% | 426.5 -42% |
| 4K Read (MB/s) | 48.7 | 50.2 3% | 57 17% | 45.98 -6% | 72.8 49% | 21.95 -55% |
| 4K Write (MB/s) | 108.2 | 139.8 29% | 141.4 31% | 125.5 16% | 119 10% | 97.2 -10% |
| 4K-64 Read (MB/s) | 1023 | 1430 40% | 1175 15% | 560 -45% | 389.7 -62% | 719 -30% |
| 4K-64 Write (MB/s) | 315.3 | 1368 334% | 1665 428% | 1162 269% | 573 82% | 430.3 36% |
| Access Time Read * (ms) | 0.058 | 0.059 -2% | 0.032 45% | 0.045 22% | 0.07 -21% | 0.122 -110% |
| Access Time Write * (ms) | 0.523 | 0.03 94% | 0.025 95% | 0.032 94% | 0.138 74% | 0.065 88% |
| Score Read (Points) | 1215 | 1718 41% | 1488 22% | 752 -38% | 556 -54% | 998 -18% |
| Score Write (Points) | 498 | 1731 248% | 2033 308% | 1391 179% | 725 46% | 570 14% |
| Score Total (Points) | 2310 | 4325 87% | 4279 85% | 2521 9% | 1565 -32% | 1971 -15% |
| Copy ISO MB/s (MB/s) | 1090 | 1540 41% | 2118 94% | 593 -46% | 782 -28% | |
| Copy Program MB/s (MB/s) | 406.8 | 583 43% | 495.6 22% | 495.5 22% | 365.7 -10% | |
| Copy Game MB/s (MB/s) | 1008 | 1046 4% | 1174 16% | 566 -44% | 457.9 -55% | |
| CrystalDiskMark 5.2 / 6 | 36% | 43% | 1% | 18% | ||
| Write 4K (MB/s) | 114.1 | 159.1 39% | 176.3 55% | 100.1 -12% | 125.6 10% | |
| Read 4K (MB/s) | 50.6 | 55.6 10% | 48.98 -3% | 42.4 -16% | 145.8 188% | |
| Write Seq (MB/s) | 1368 | 1435 5% | 1789 31% | 509 -63% | ||
| Read Seq (MB/s) | 1696 | 1435 -15% | 1671 -1% | 1536 -9% | ||
| Write 4K Q32T1 (MB/s) | 282.8 | 512 81% | 433.5 53% | 245.9 -13% | 362.4 28% | |
| Read 4K Q32T1 (MB/s) | 354.8 | 541 52% | 526 48% | 230.3 -35% | 307.3 -13% | |
| Write Seq Q32T1 (MB/s) | 1418 | 2682 89% | 2983 110% | 1910 35% | 1320 -7% | |
| Read Seq Q32T1 (MB/s) | 2359 | 2902 23% | 3555 51% | 3454 46% | 2489 6% | |
| Write 4K Q8T8 (MB/s) | 1688 | |||||
| Read 4K Q8T8 (MB/s) | 1036 | |||||
| Total Average (Program / Settings) | 62% /
69% | 74% /
82% | 25% /
32% | 7% /
3% | -11% /
-11% |
* ... smaller is better

Disk Throttling: DiskSpd Read Loop, Queue Depth 8
GPU Performance
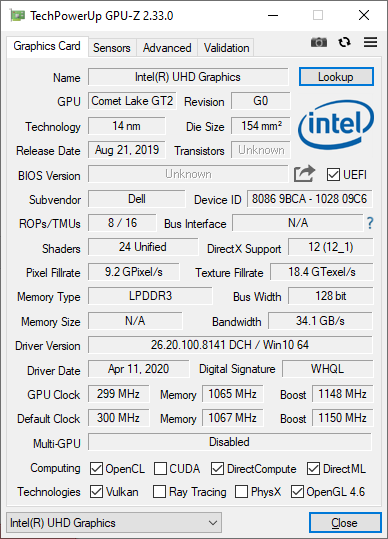
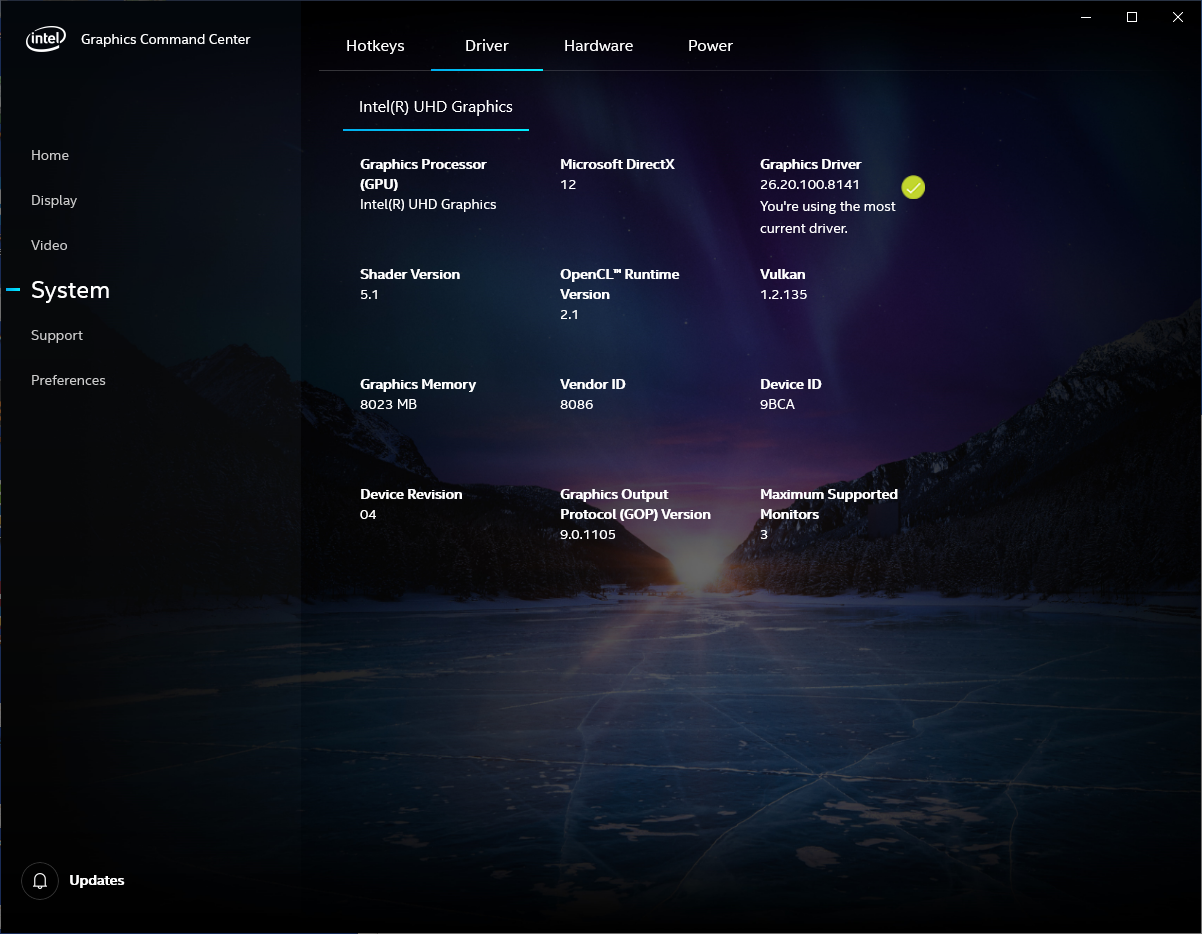
The old UHD Graphics 620 is still chugging along in 2020 which is perfectly fine for browsing, word processing, Flash games, and 4K video playback. For anything more, we recommend looking elsewhere for dedicated GeForce options or at least an Ice Lake Iris Pro or Zen 2 Radeon RX Vega for significantly better graphics performance.
See our dedicated page on the UHD Graphics 620 for more technical information and benchmark comparisons.
| 3DMark 06 Standard Score | 12453 points | |
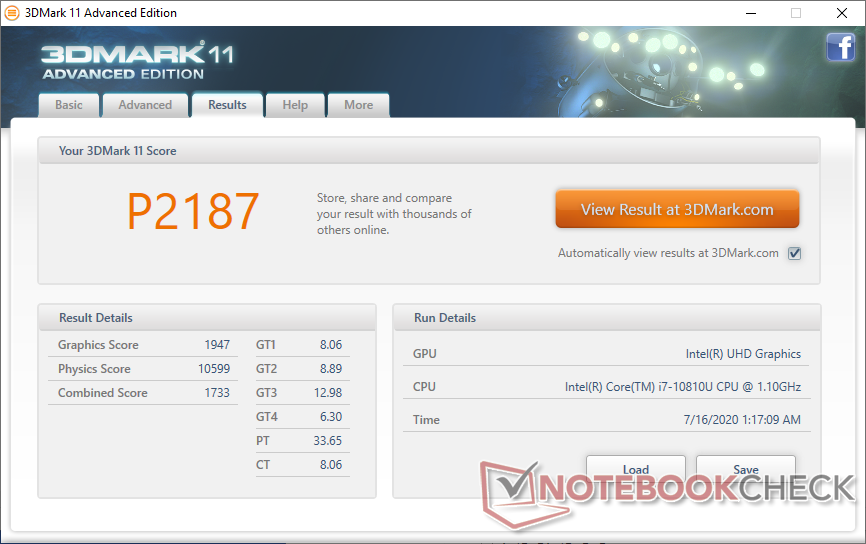
| 3DMark 11 Performance | 2187 points | |
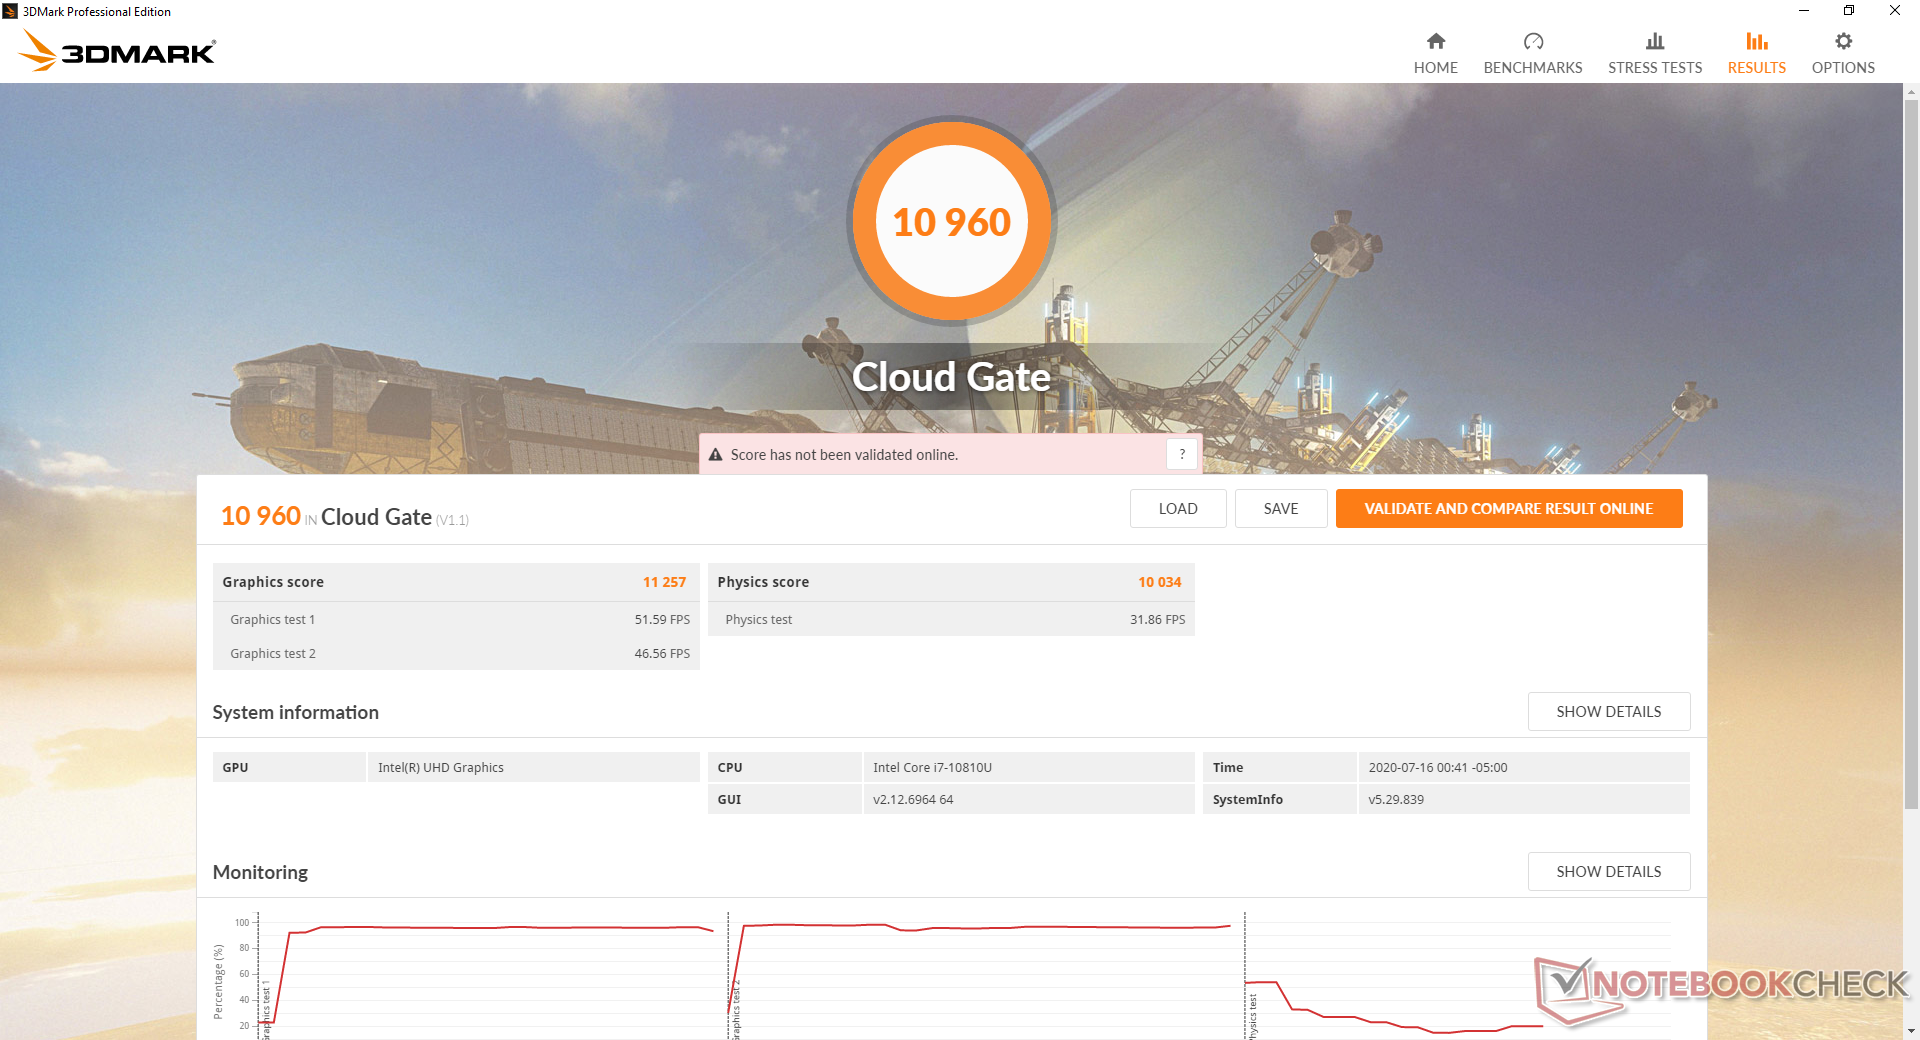
| 3DMark Cloud Gate Standard Score | 10960 points | |
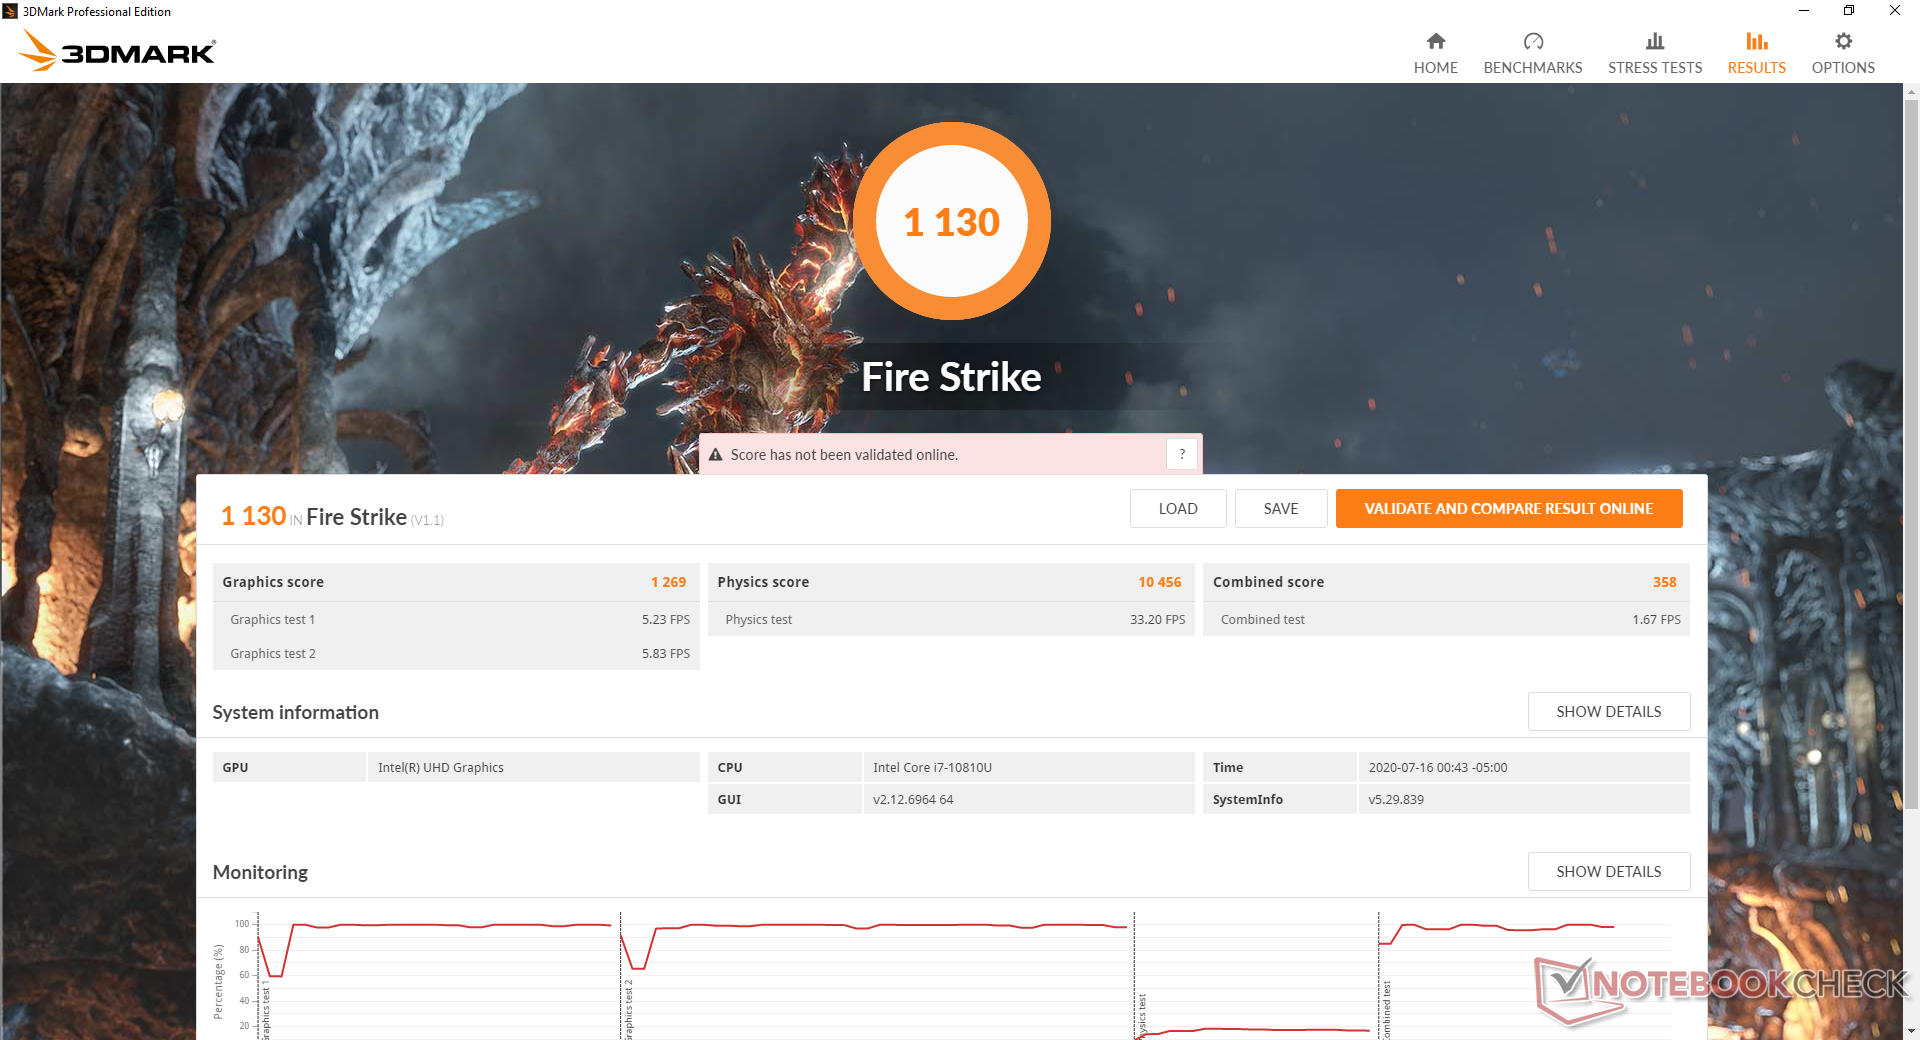
| 3DMark Fire Strike Score | 1130 points | |
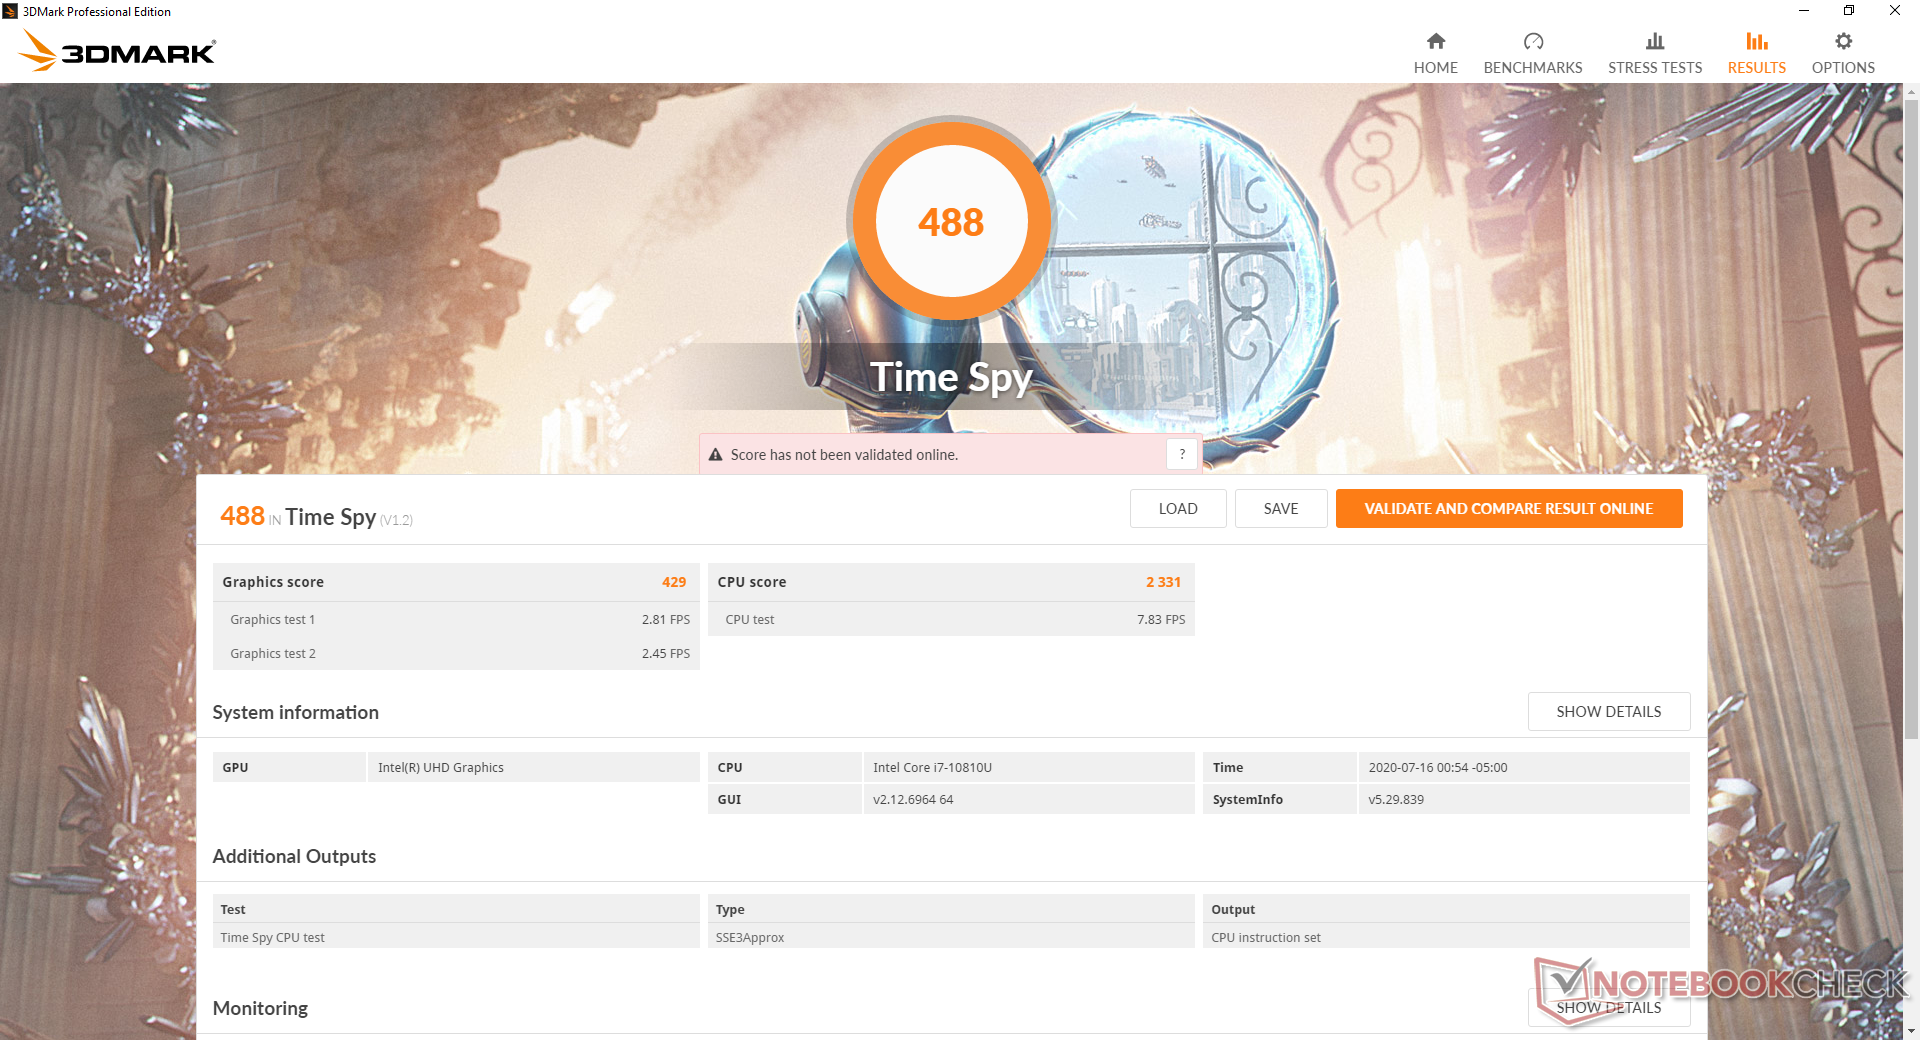
| 3DMark Time Spy Score | 488 points | |
Help | ||
| low | med. | high | ultra | |
|---|---|---|---|---|
| The Witcher 3 (2015) | 19.9 | 12.1 | ||
| Dota 2 Reborn (2015) | 71.7 | 44.1 | 19 | 17 |
| X-Plane 11.11 (2018) | 12.9 | 13.1 | 11.7 |
Emissions
System Noise
Latitude 7000 laptops are generally very quiet machines and the Latitude 9510 2-in-1 is no different. Expect the fan to be silent during common loads like browsing or word processing. Running the first benchmark scene of 3DMark 06 would cause fan noise to jump to 33.4 dB(A) halfway through while Prime95 induces a maximum of 39.5 dB(A). Fortunately, the fan powers down rather quickly once the demanding load stops. Unless if you plan on running such high loads on a daily basis, then the laptop will be inaudible almost all of the time.
All fan modes can be found on the Dell Power Manager software.
| Dell Latitude 9510 2-in-1 UHD Graphics 620, i7-10810U, Toshiba KBG40ZNS512G NVMe | Lenovo ThinkPad T15 Gen1-20S7S02U00 GeForce MX330, i7-10510U, Toshiba XG6 KXG6AZNV1T02 | Lenovo ThinkBook 15 UHD Graphics 620, i5-10210U, Samsung SSD PM981 MZVLB512HAJQ | Dynabook Tecra X50-F UHD Graphics 620, i7-8665U, Samsung SSD PM981 MZVLB512HAJQ | HP Envy x360 15-dr1679cl UHD Graphics 620, i7-10510U, Intel Optane Memory H10 with Solid State Storage 32GB + 512GB HBRPEKNX0202A(L/H) | Dell Latitude 5591 GeForce MX130, i7-8850H, Toshiba XG5 KXG50ZNV512G | |
|---|---|---|---|---|---|---|
| Noise | -4% | -2% | -7% | -8% | -16% | |
| off / environment * (dB) | 27.2 | 29.4 -8% | 29.2 -7% | 30.2 -11% | 28 -3% | 29 -7% |
| Idle Minimum * (dB) | 27.2 | 29.4 -8% | 29.2 -7% | 30.2 -11% | 28 -3% | 29 -7% |
| Idle Average * (dB) | 27.2 | 29.4 -8% | 29.2 -7% | 30.2 -11% | 30.2 -11% | 29 -7% |
| Idle Maximum * (dB) | 27.2 | 29.4 -8% | 29.9 -10% | 30.2 -11% | 31.5 -16% | 30.3 -11% |
| Load Average * (dB) | 33.4 | 34.2 -2% | 30.6 8% | 33.4 -0% | 35.7 -7% | 46.5 -39% |
| Load Maximum * (dB) | 39.5 | 34.2 13% | 33.8 14% | 39 1% | 43.1 -9% | 48.6 -23% |
| Witcher 3 ultra * (dB) | 34.2 |
* ... smaller is better
Noise level
| Idle |
| 27.2 / 27.2 / 27.2 dB(A) |
| Load |
| 33.4 / 39.5 dB(A) |
 | ||
30 dB silent 40 dB(A) audible 50 dB(A) loud |
||
min: | ||
Temperature
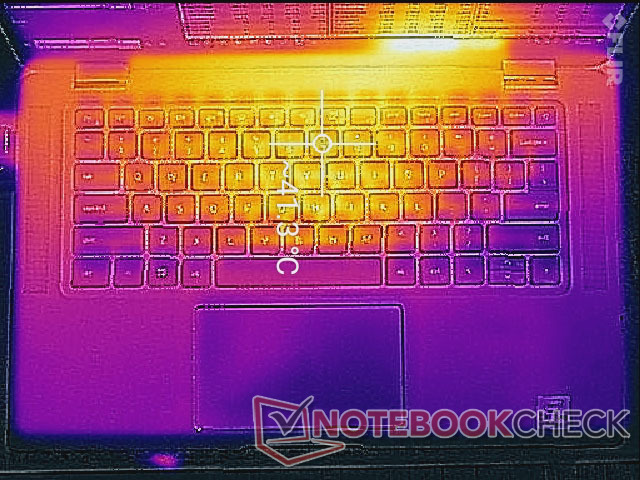
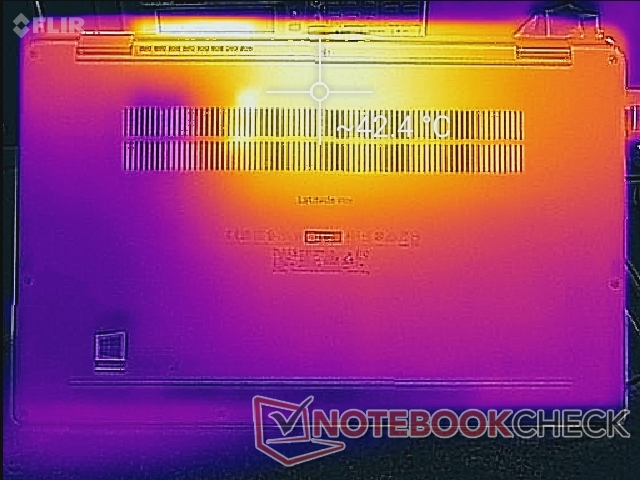
Surface temperature gradient is mostly symmetrical with hot spots near the center top row of keyboard keys. This area can reach over 40 C when running extreme loads while the palm rests remain relatively cool. In comparison, the Lenovo ThinkBook 15 is always warmest on its left half but with a similar maximum surface temperature of around 42 C.
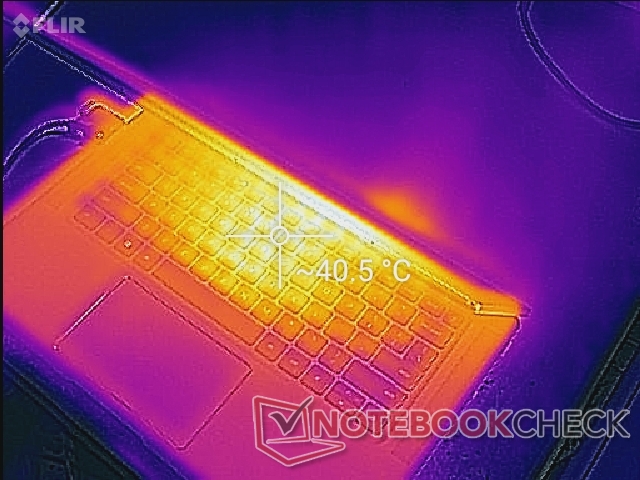
(±) The maximum temperature on the upper side is 42.8 °C / 109 F, compared to the average of 34.3 °C / 94 F, ranging from 21.2 to 62.5 °C for the class Office.
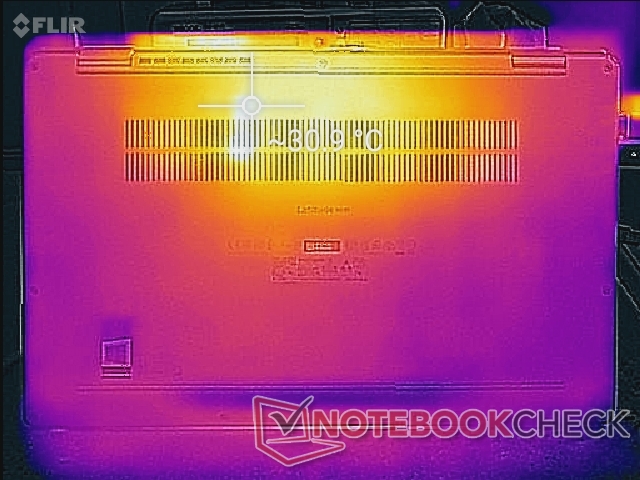
(±) The bottom heats up to a maximum of 41.8 °C / 107 F, compared to the average of 36.8 °C / 98 F
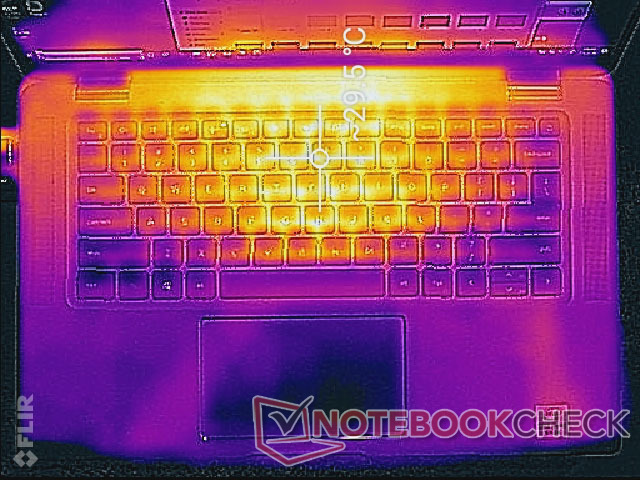
(+) In idle usage, the average temperature for the upper side is 27.2 °C / 81 F, compared to the device average of 29.5 °C / 85 F.
(+) The palmrests and touchpad are cooler than skin temperature with a maximum of 30.6 °C / 87.1 F and are therefore cool to the touch.
(-) The average temperature of the palmrest area of similar devices was 27.6 °C / 81.7 F (-3 °C / -5.4 F).
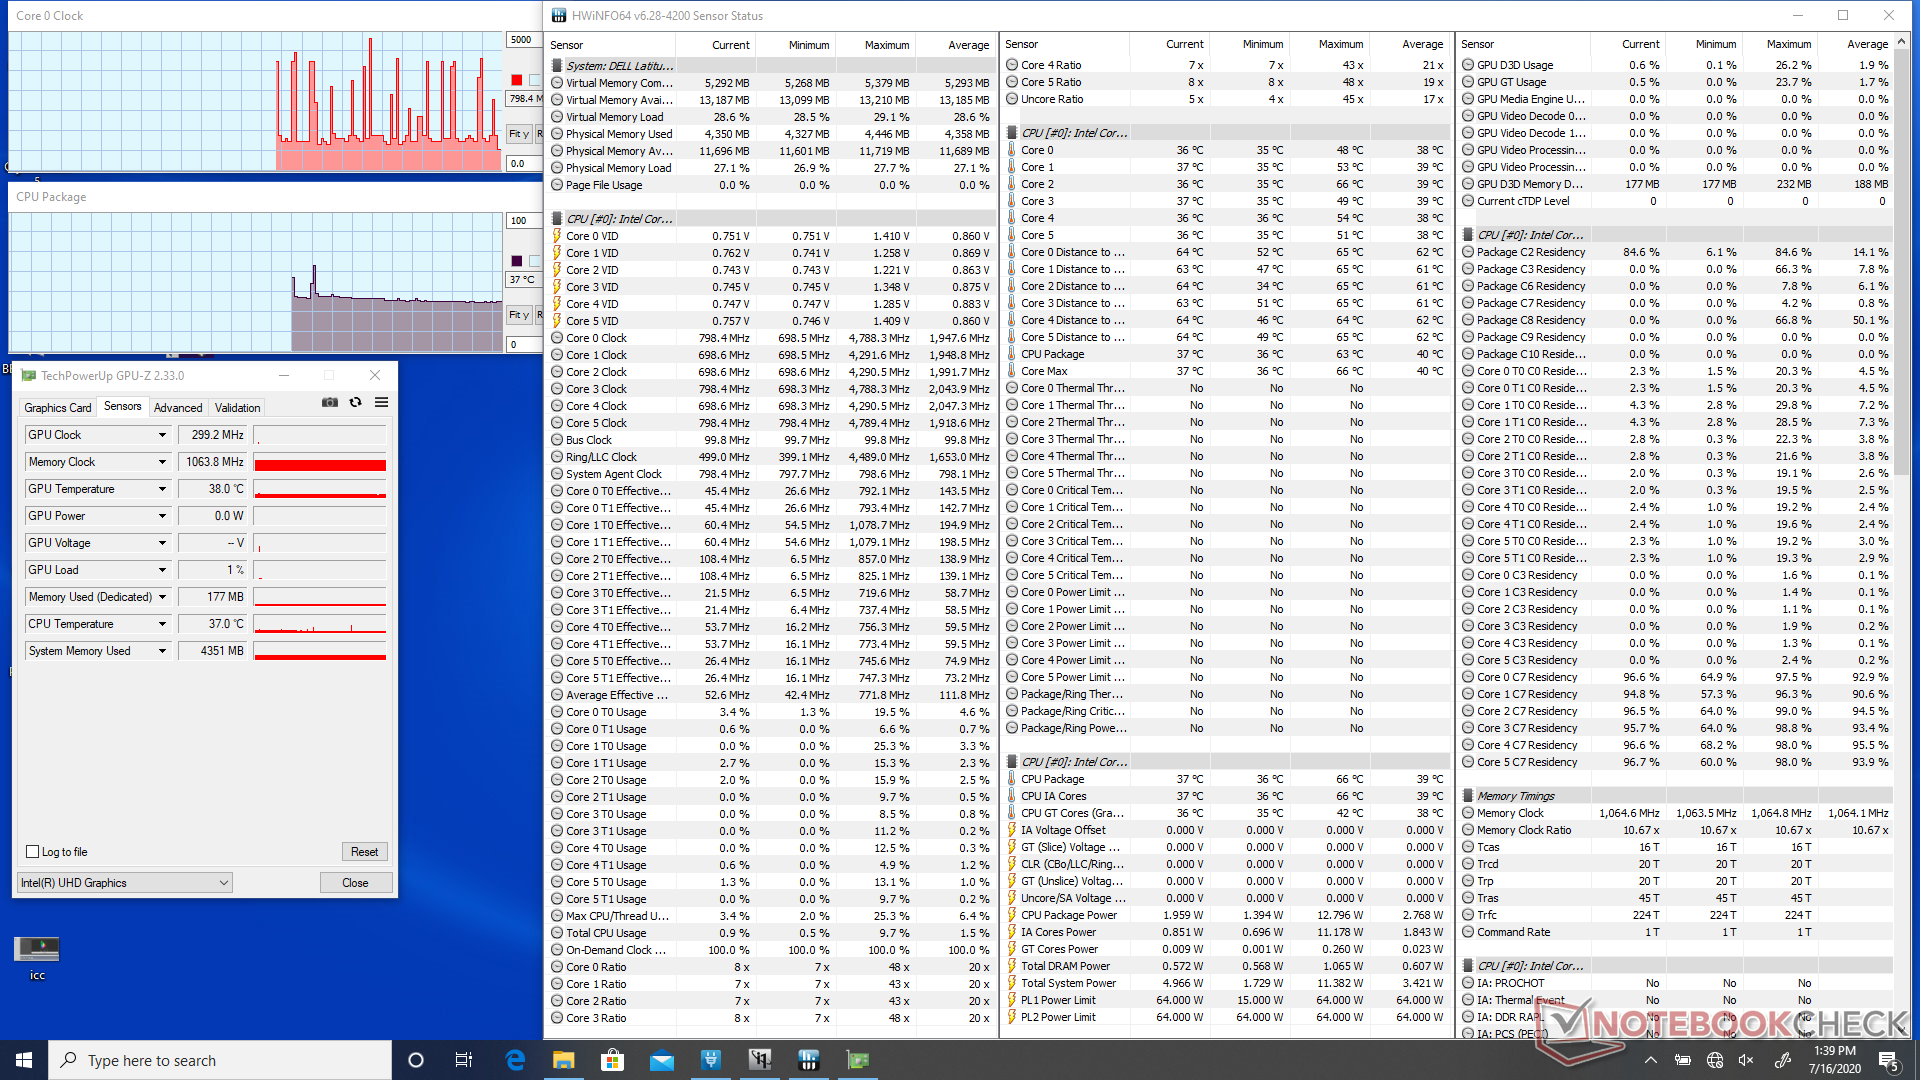
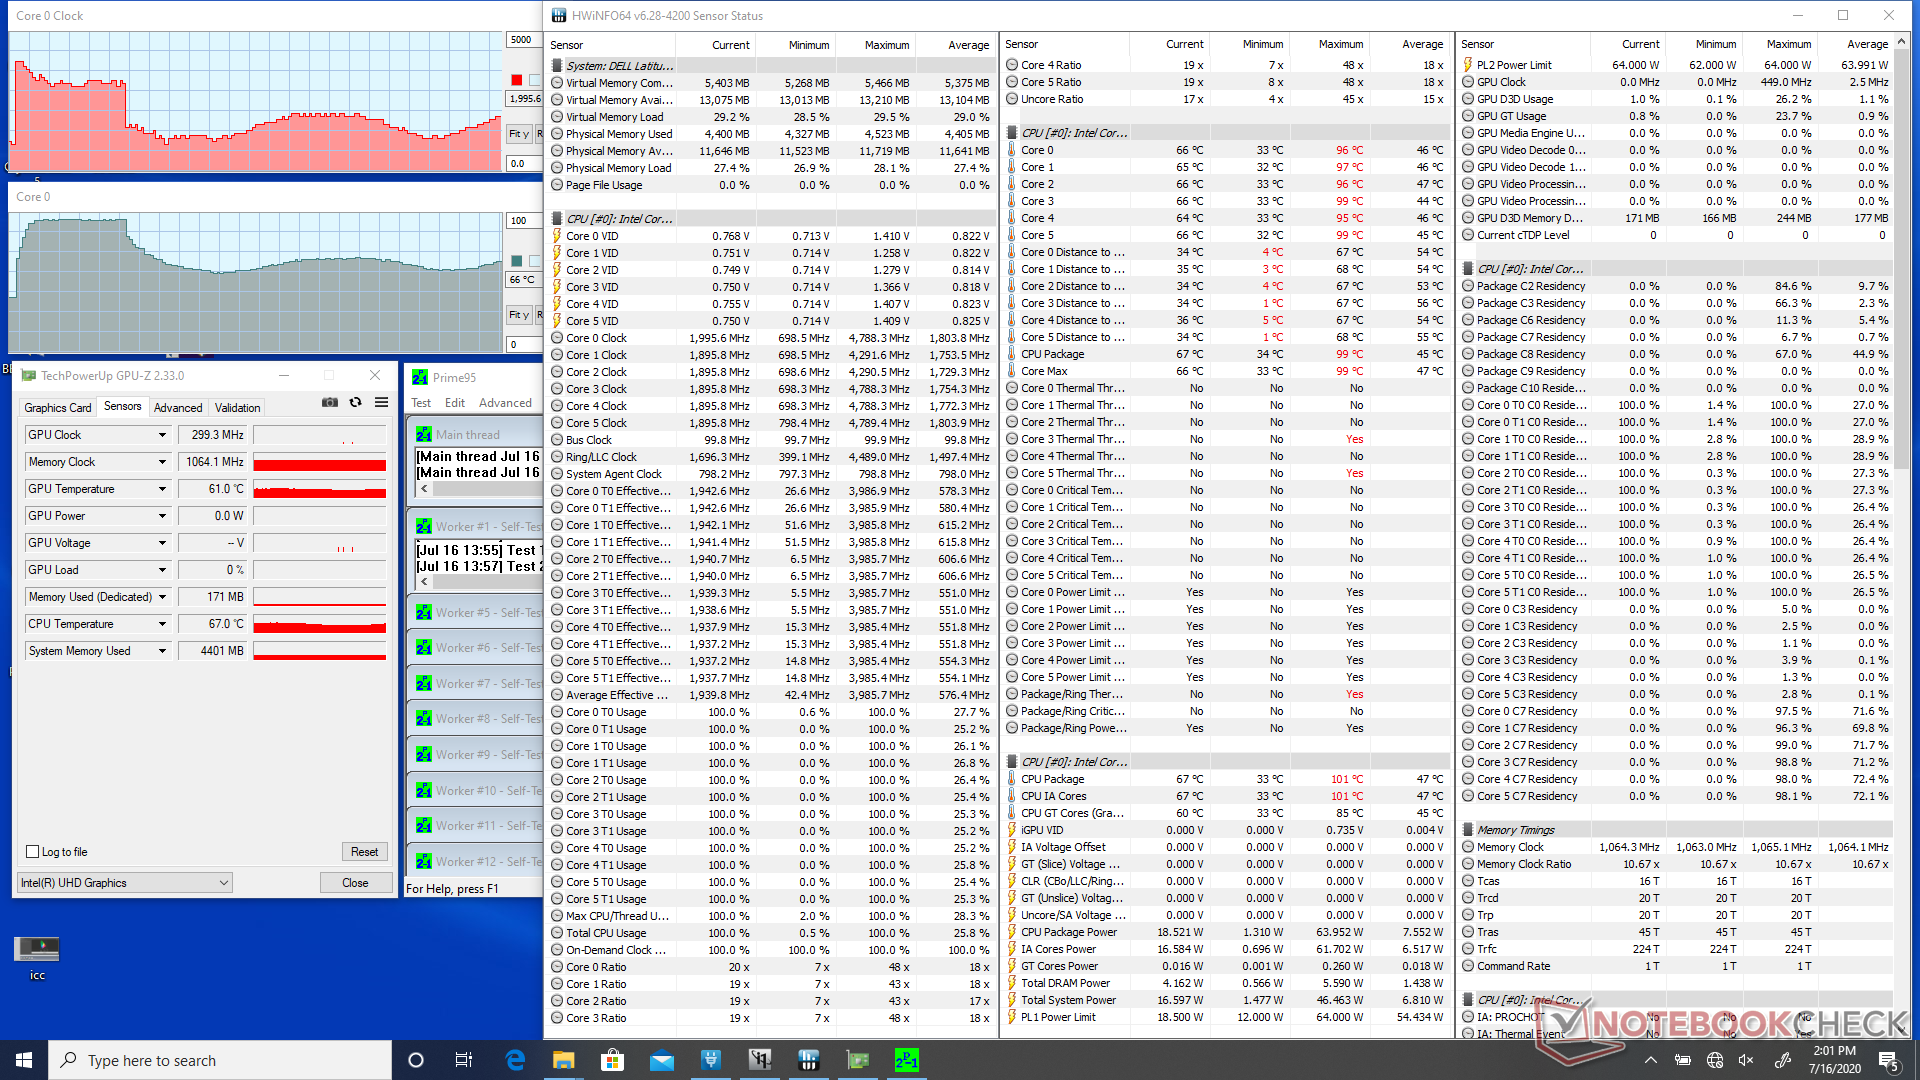
Stress Test
We stress the system with synthetic loads to identify for any potential throttling or stability issues. When running Prime95, clock rates would boost to 4 GHz for about 10 seconds until hitting 96 C and then drop to 3.2 GHz thereafter. After another minute or so, clock rates and temperature would begin cycling between 1.2 GHz to 2 GHz and 57 C to 68 C, respectively. The roller coaster clock rates when under high processing stress reflect our CineBench loop test results above.
Running on battery power results in slightly slower CPU performance. A 3DMark 11 test on batteries would return Physics and Graphics scores of 8112 and 1952 points, respectively, compared to 10599 and 1947 points when on mains.
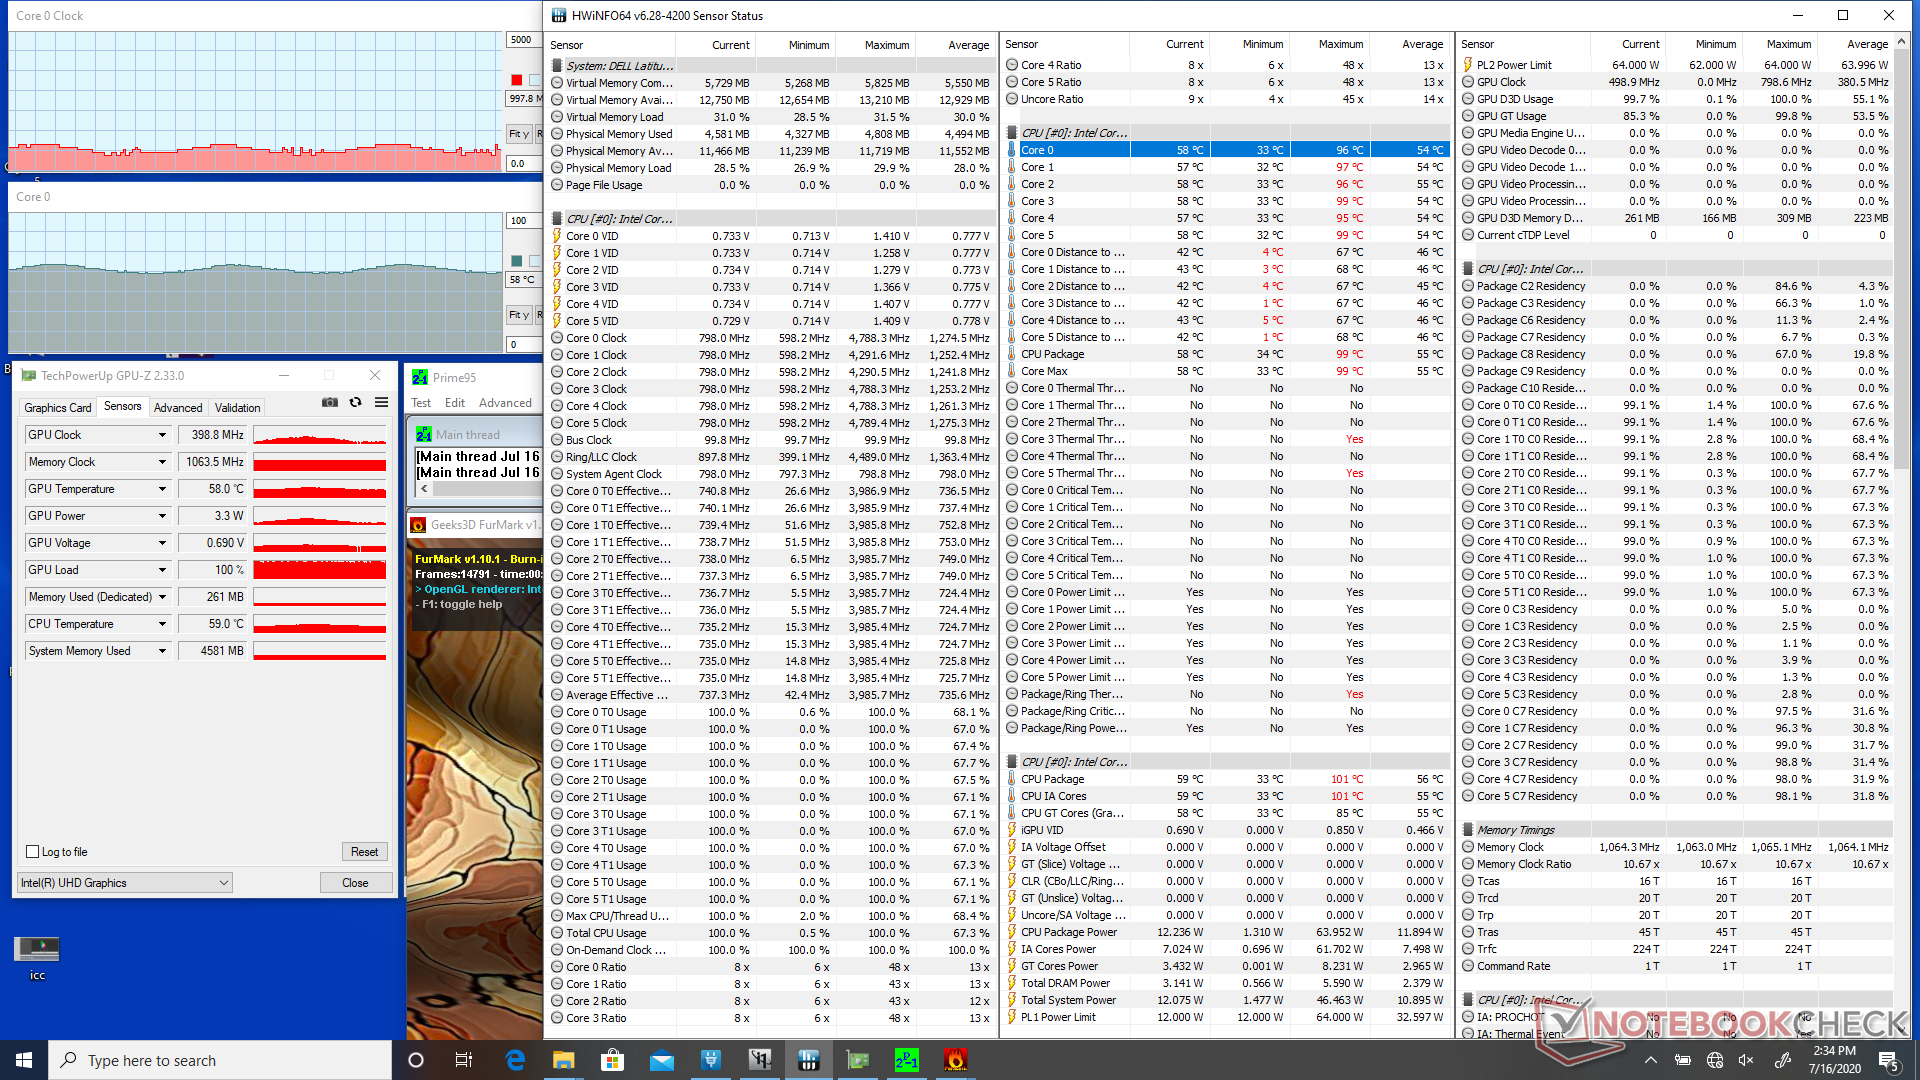
| CPU Clock (GHz) | GPU Clock (MHz) | Average CPU Temperature (°C) | |
| System Idle | -- | -- | 37 |
| Prime95 Stress | 1.2 - 2.0 | -- | 57 - 68 |
| Prime95 + FurMark Stress | 0.6 - 1.0 | 300 - 800 | 57 - 64 |
Speakers


Dell Latitude 9510 2-in-1 audio analysis
(±) | speaker loudness is average but good (77.9 dB)
Bass 100 - 315 Hz
(+) | good bass - only 3% away from median
(±) | linearity of bass is average (9.6% delta to prev. frequency)
Mids 400 - 2000 Hz
(+) | balanced mids - only 3.5% away from median
(±) | linearity of mids is average (7.1% delta to prev. frequency)
Highs 2 - 16 kHz
(+) | balanced highs - only 4.9% away from median
(±) | linearity of highs is average (12.2% delta to prev. frequency)
Overall 100 - 16.000 Hz
(+) | overall sound is linear (10% difference to median)
Compared to same class
» 1% of all tested devices in this class were better, 0% similar, 99% worse
» The best had a delta of 7%, average was 21%, worst was 53%
Compared to all devices tested
» 4% of all tested devices were better, 1% similar, 95% worse
» The best had a delta of 4%, average was 24%, worst was 134%
Apple MacBook 12 (Early 2016) 1.1 GHz audio analysis
(+) | speakers can play relatively loud (83.6 dB)
Bass 100 - 315 Hz
(±) | reduced bass - on average 11.3% lower than median
(±) | linearity of bass is average (14.2% delta to prev. frequency)
Mids 400 - 2000 Hz
(+) | balanced mids - only 2.4% away from median
(+) | mids are linear (5.5% delta to prev. frequency)
Highs 2 - 16 kHz
(+) | balanced highs - only 2% away from median
(+) | highs are linear (4.5% delta to prev. frequency)
Overall 100 - 16.000 Hz
(+) | overall sound is linear (10.2% difference to median)
Compared to same class
» 7% of all tested devices in this class were better, 2% similar, 91% worse
» The best had a delta of 5%, average was 18%, worst was 53%
Compared to all devices tested
» 4% of all tested devices were better, 1% similar, 94% worse
» The best had a delta of 4%, average was 24%, worst was 134%
Energy Management
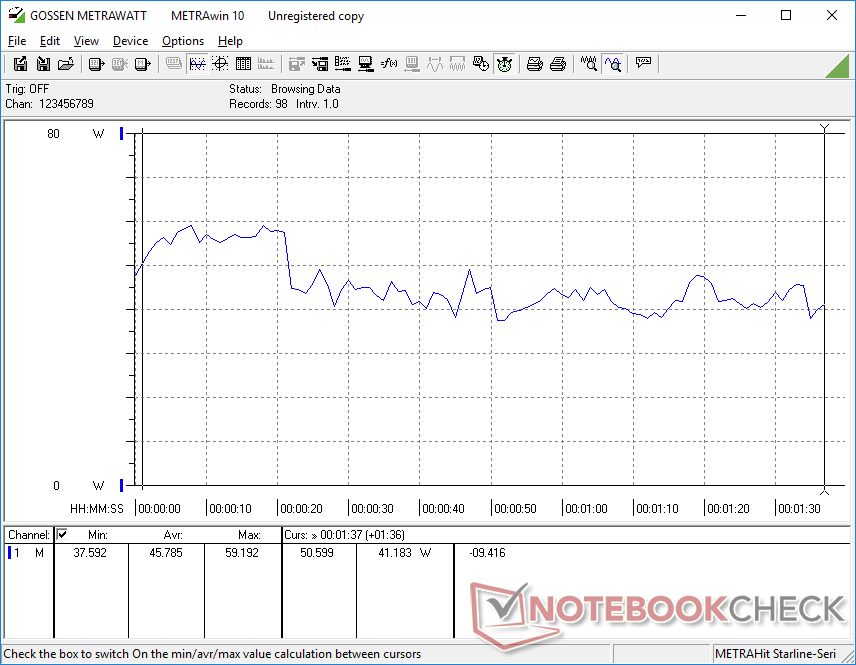
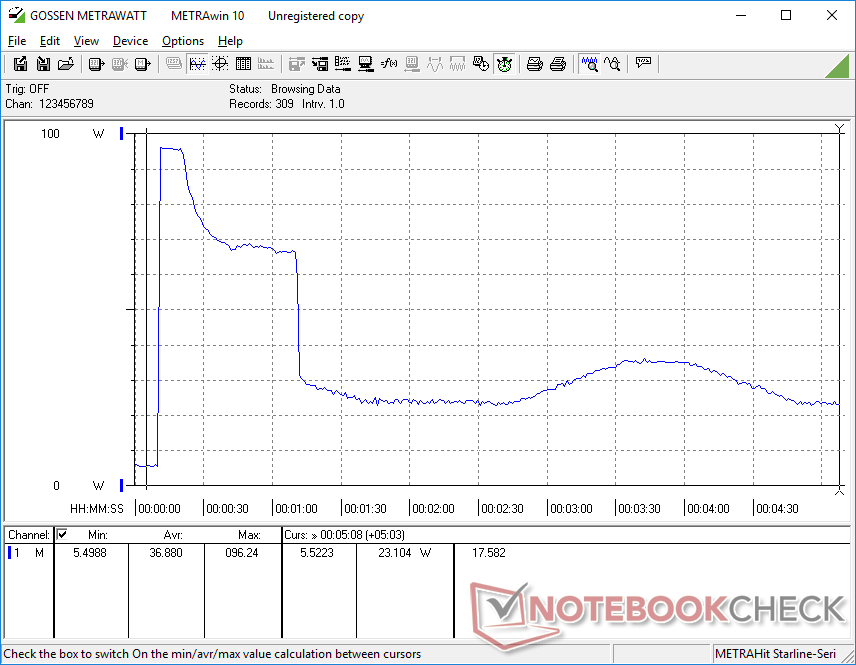
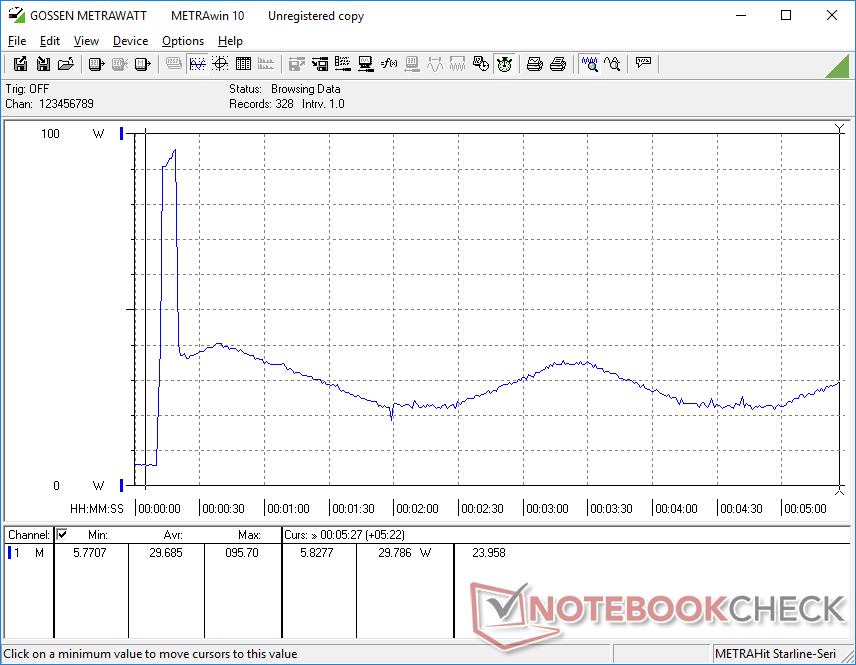
Power Consumption
The system is very power efficient during low loads. When idling on desktop, consumption is only about 2 W to 6 W even when set to the maximum display brightness.
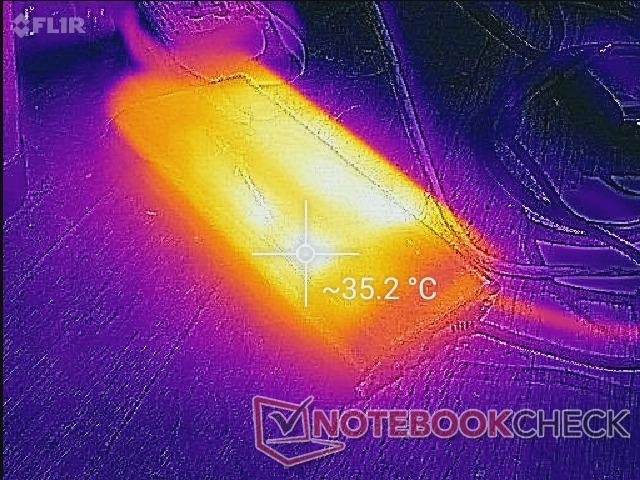
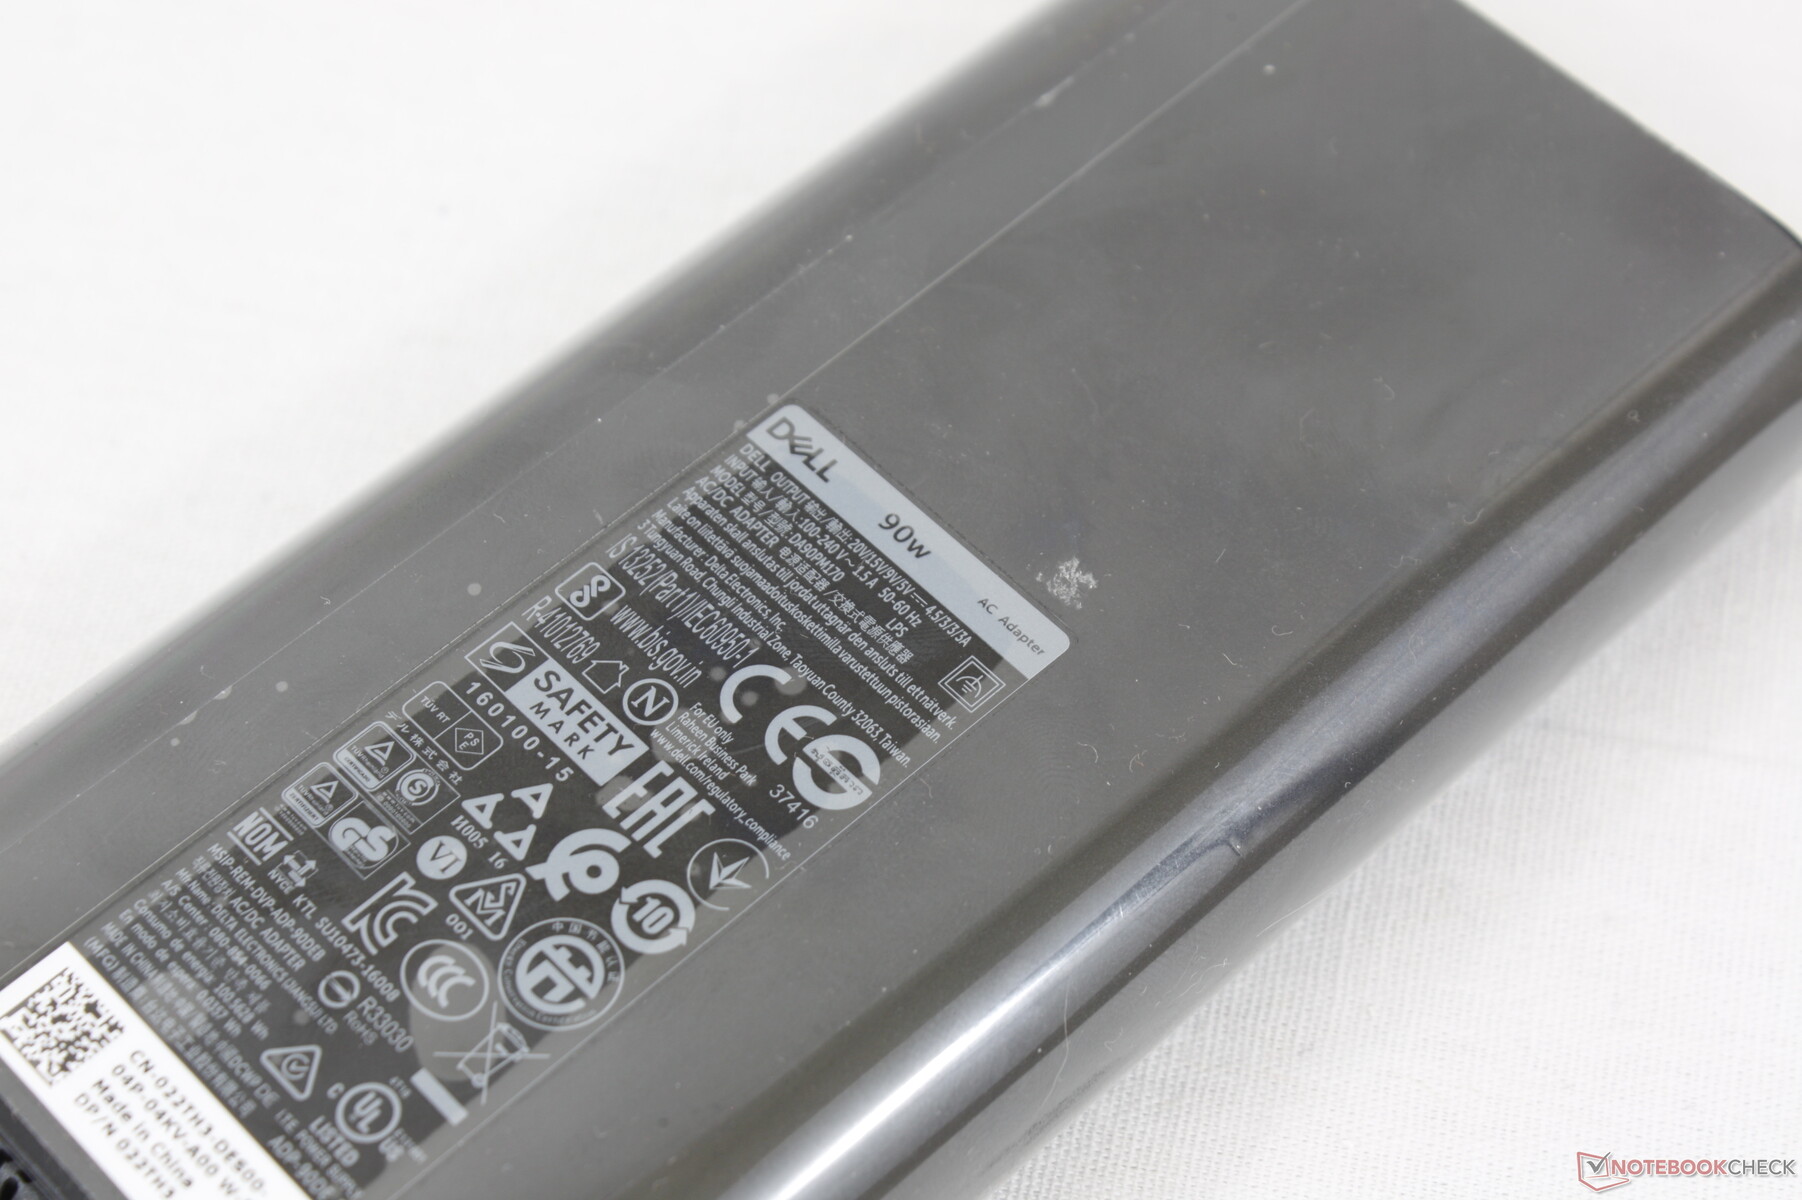
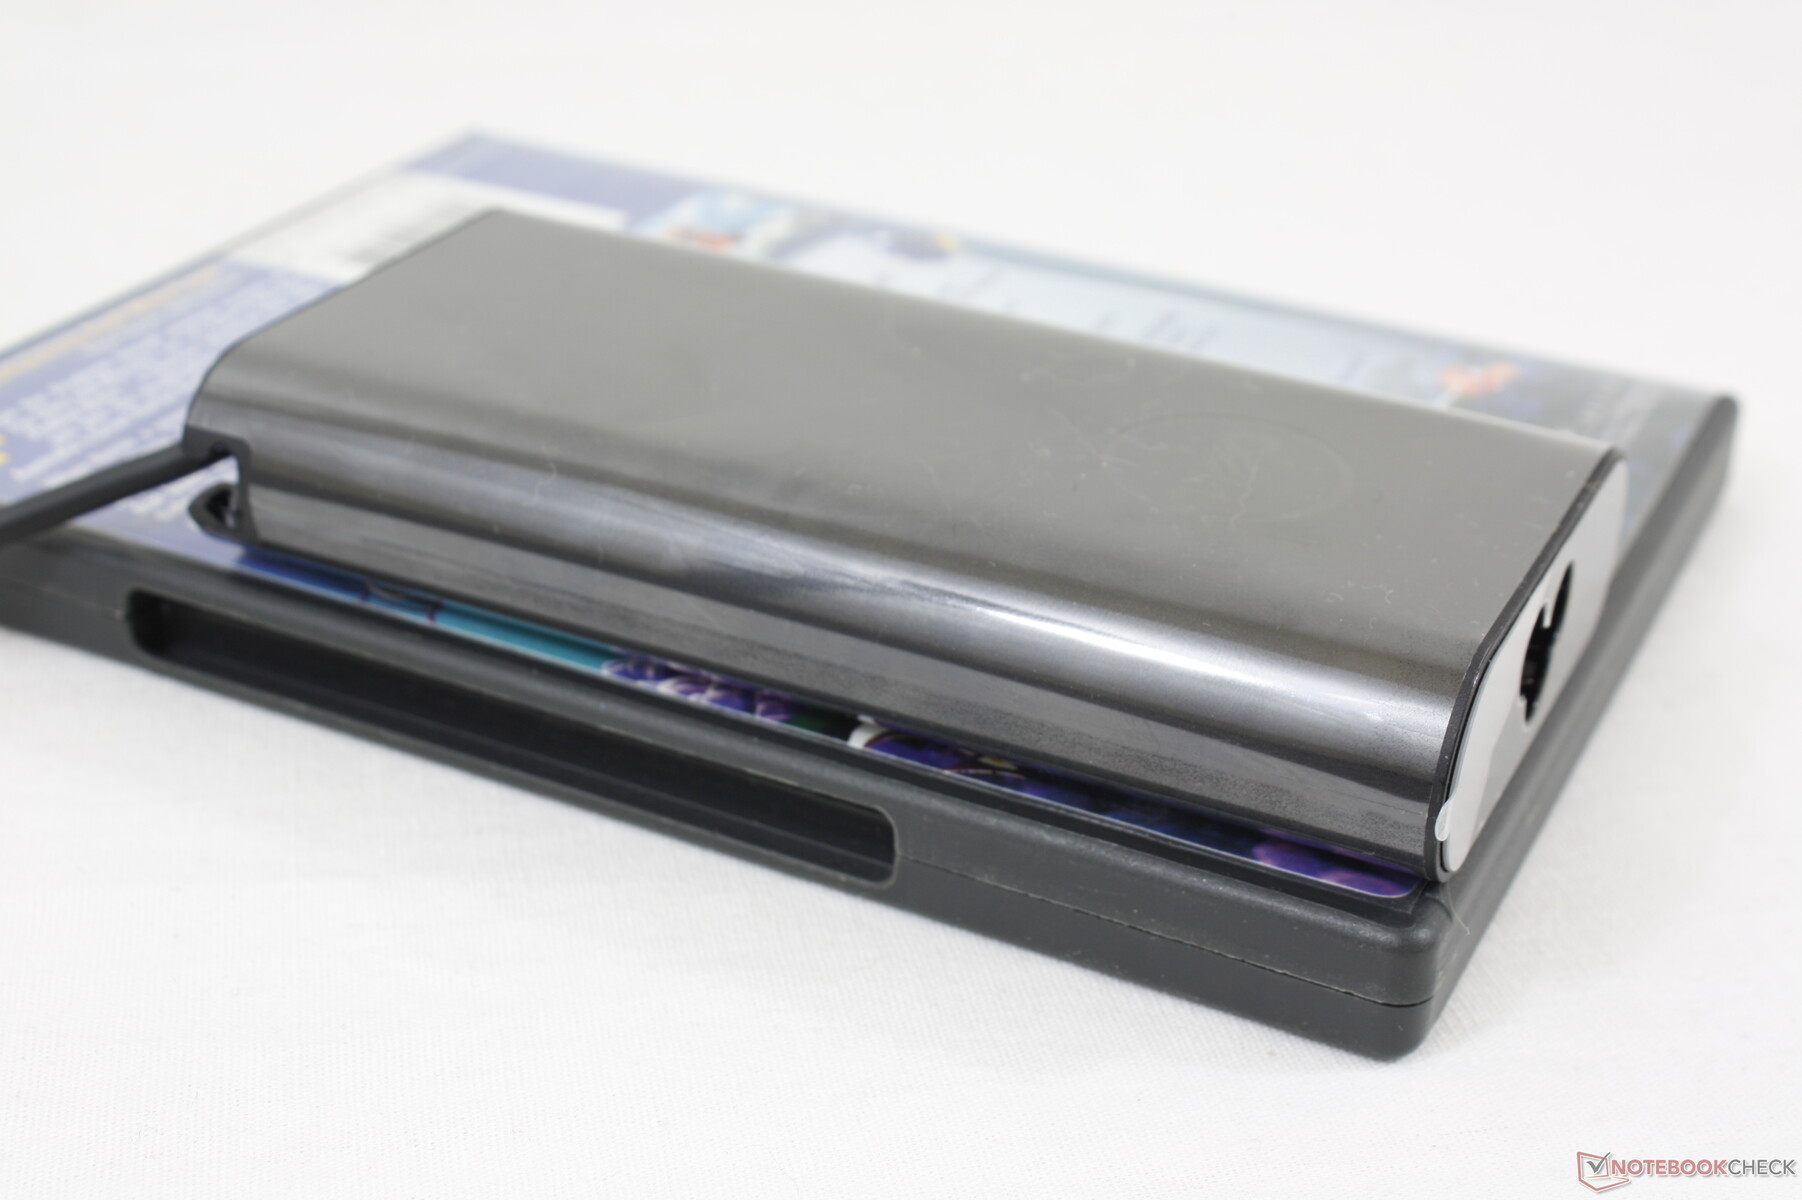
We're able to record a maximum consumption of 96.3 W from the small-medium (~13 x 6.5 x 2.3 cm) 90 W AC adapter which is a lot higher than usual for a laptop powered by a Core U-series CPU. However this falls quickly over time due to thermal limits as shown by our graphs below.
| Off / Standby | |
| Idle | |
| Load |
|
Key:
min: | |
| Dell Latitude 9510 2-in-1 i7-10810U, UHD Graphics 620, Toshiba KBG40ZNS512G NVMe, IPS, 1920x1080, 15" | Lenovo ThinkPad T15 Gen1-20S7S02U00 i7-10510U, GeForce MX330, Toshiba XG6 KXG6AZNV1T02, IPS LED, 3840x2160, 15.6" | Lenovo ThinkBook 15 i5-10210U, UHD Graphics 620, Samsung SSD PM981 MZVLB512HAJQ, IPS, 1920x1080, 15.6" | Dynabook Tecra X50-F i7-8665U, UHD Graphics 620, Samsung SSD PM981 MZVLB512HAJQ, IPS, 1920x1080, 15.6" | HP Envy x360 15-dr1679cl i7-10510U, UHD Graphics 620, Intel Optane Memory H10 with Solid State Storage 32GB + 512GB HBRPEKNX0202A(L/H), IPS, 1920x1080, 15.6" | Dell Latitude 5591 i7-8850H, GeForce MX130, Toshiba XG5 KXG50ZNV512G, IPS, 1920x1080, 15.6" | |
|---|---|---|---|---|---|---|
| Power Consumption | -105% | -24% | -21% | -32% | -69% | |
| Idle Minimum * (Watt) | 2.1 | 4.3 -105% | 3.5 -67% | 3.9 -86% | 4.3 -105% | 4.4 -110% |
| Idle Average * (Watt) | 4.6 | 13.8 -200% | 7.1 -54% | 7 -52% | 7.2 -57% | 8.4 -83% |
| Idle Maximum * (Watt) | 5.3 | 16.2 -206% | 7.8 -47% | 7.3 -38% | 7.5 -42% | 10.2 -92% |
| Load Average * (Watt) | 45.8 | 66 -44% | 38.9 15% | 32.7 29% | 40.4 12% | 71 -55% |
| Load Maximum * (Watt) | 96.3 | 67.4 30% | 65.4 32% | 57.8 40% | 65.7 32% | 100.1 -4% |
| Witcher 3 ultra * (Watt) | 53 |
* ... smaller is better
Battery Life
52 Wh and 88 Wh capacity options are available with the latter being particularly huge considering the 2-in-1 form factor and power-efficient CPU. Keep in mind that the Smart Card reader is compatible only with the 52 Wh option due to space limitations.
Runtimes are extraordinarily long at over 18 hours of constant real-world WLAN use on our 88 Wh test unit. Runtimes should be about 40 percent shorter with the 52 Wh configuration, but 10 hours of runtime is still more than a full work day. Charging from empty to full capacity takes just 1.5 hours.
| Dell Latitude 9510 2-in-1 i7-10810U, UHD Graphics 620, 88 Wh | Lenovo ThinkPad T15 Gen1-20S7S02U00 i7-10510U, GeForce MX330, 57 Wh | Lenovo ThinkBook 15 i5-10210U, UHD Graphics 620, 45 Wh | Dynabook Tecra X50-F i7-8665U, UHD Graphics 620, 48 Wh | HP Envy x360 15-dr1679cl i7-10510U, UHD Graphics 620, 55.67 Wh | Dell Latitude 5591 i7-8850H, GeForce MX130, 92 Wh | |
|---|---|---|---|---|---|---|
| Battery runtime | -66% | -65% | -74% | -50% | -52% | |
| Reader / Idle (h) | 59 | 17.9 -70% | 5.8 -90% | 25.4 -57% | 22.4 -62% | |
| WiFi v1.3 (h) | 18.7 | 7.1 -62% | 6.8 -64% | 4.6 -75% | 9.2 -51% | 12.5 -33% |
| Load (h) | 4 | 1.2 -70% | 1.5 -62% | 1.7 -57% | 2.3 -42% | 1.5 -62% |
Pros
Cons
Verdict
The most distinguishing features of the Latitude 9510 2-in-1 are its extraordinarily long runtimes, 5G-enabled wireless, metal chassis, and ease of handling especially for a 15-inch convertible. These attributes make it fit for travelers who want something larger than the typical 13-inch or 14-inch business subnotebook like the HP EliteBook x360 1040 or Lenovo X1 Carbon without sacrificing too much in the way of portability and weight in the process. It's still heavier and larger than the aforementioned HP or Lenovo, but it's definitely smaller than any 15.6-inch convertible for a comfortable middle-ground solution.
As featured-packed as it may be, there are still a couple of options missing. The lack of a webcam shutter for the convertible model is strange especially for a series that focuses so much on security. Additionally, a 1000-nit panel option would help put the system on par with the HP EliteBook x360 series in terms of outdoor viewability.
Users intending to run long and demanding loads should look elsewhere. CPU performance drops sharply after just a few minutes of extreme processing loads and the lack of any Ryzen or additional GPU options will become obvious after running graphics-intensive tasks. The system runs very quietly and with long battery life as result, but the middling processor performance is the price to pay.
Versatile for almost all your in-office and out-of-office needs.. so long as your needs don't involve intensive processing loads. The uncommon 15.0-inch screen size works well for a convertible form factor to be both larger than 14-inch subnotebooks and yet smaller and more portable than the common 15.6-inch alternatives.
Dell Latitude 9510 2-in-1
- 07/20/2020 v7 (old)
Allen Ngo
More articles related to this device
Dell Latitude 9510 2-in-1 (Latitude 15 9500 Series)Related Articles


Price comparison
