

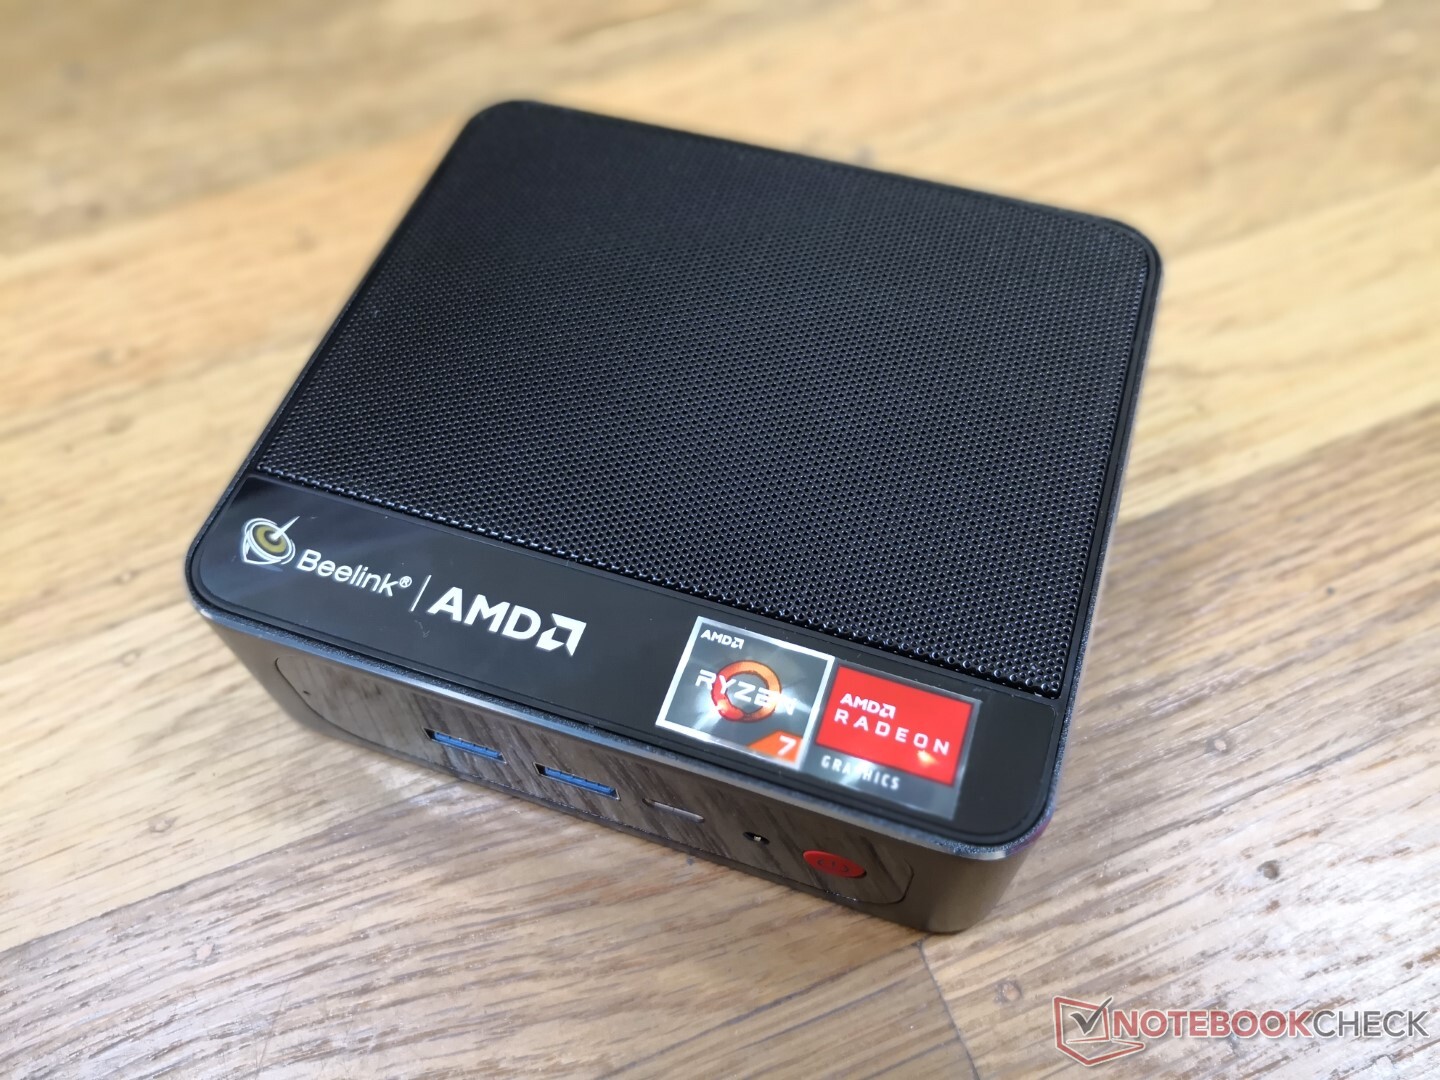
Beelink SER3 mini PC review: The older Ryzen 7 3750H has its uses

Beelink carries several mini PCs powered by older Intel and AMD CPUs as cheaper alternatives to the newest Intel NUCs powered by the latest generation of processors. Nearly all HTPC applications ranging from web browsing to 4K video streaming don't require the fastest and greatest CPUs which mean most users can get away with less expensive hardware.
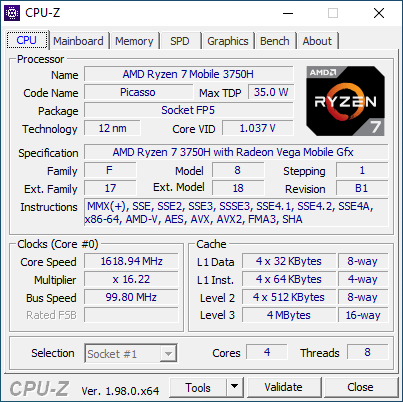
Our Beelink SER3 test unit comes equipped with the two-year old AMD Zen+ Ryzen 7 3750H CPU that has since been replaced by the newer Zen 2 4000H and Zen 3 5000H series.
More Beelink reviews:
Potential Competitors in Comparison
Rating | Date | Model | Weight | Height | Size | Resolution | Price |
|---|---|---|---|---|---|---|---|
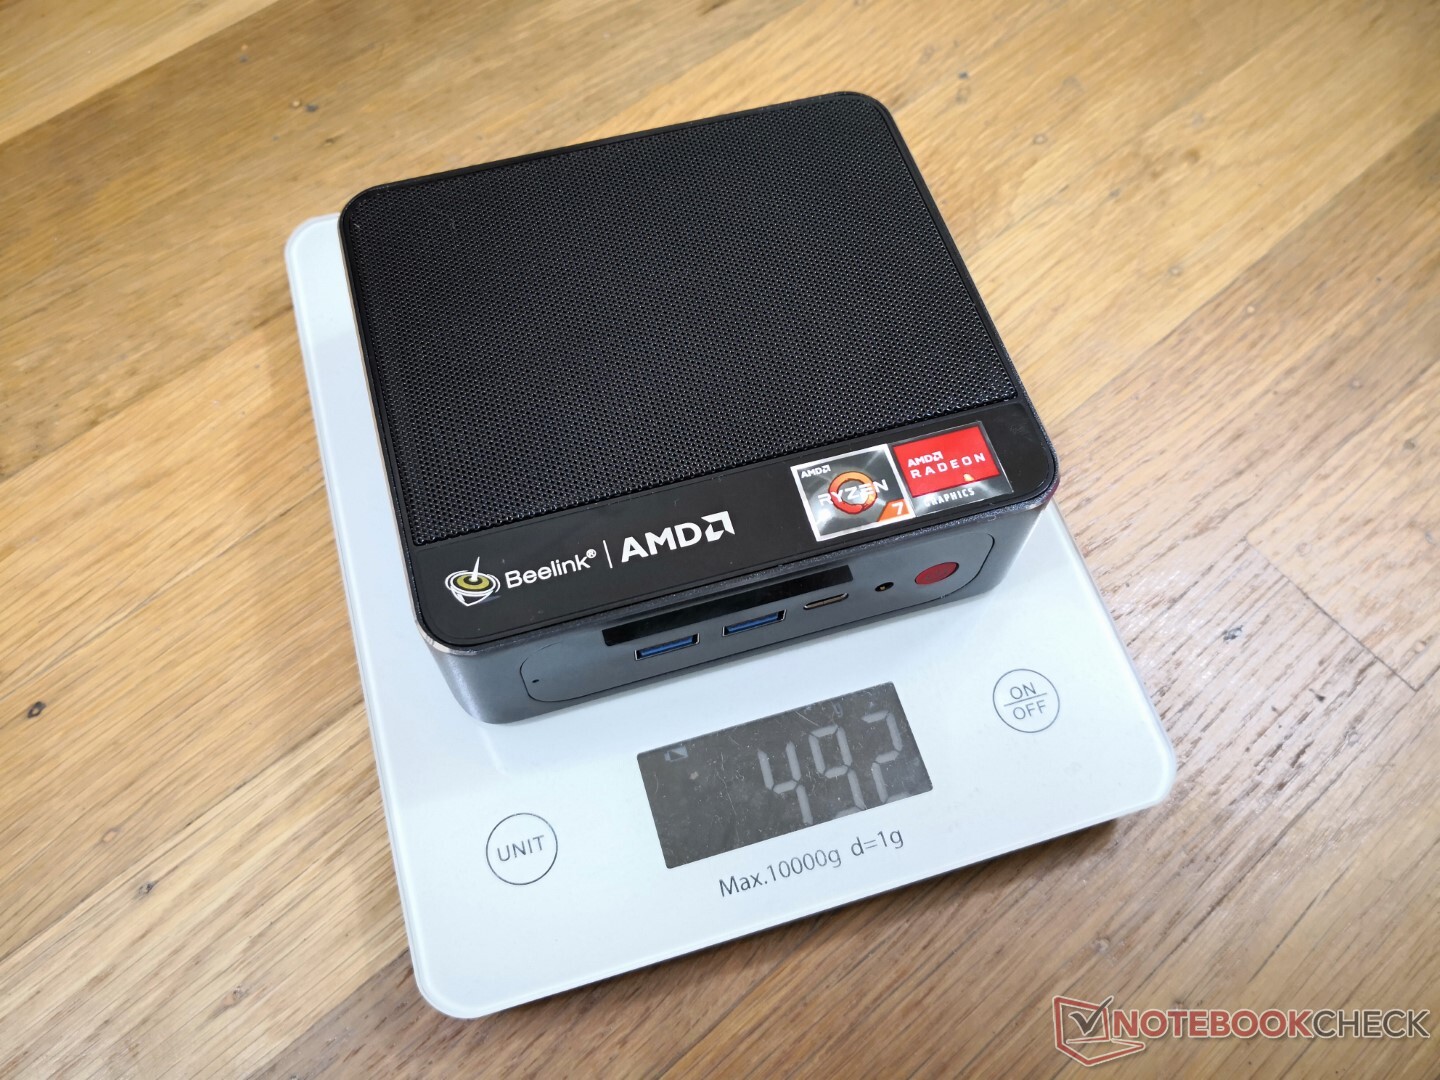
v (old) | 11 / 2021 | Beelink SER3 R7 3750H, Vega 10 | 492 g | 40 mm | x | ||
v (old) | 12 / 2020 | Beelink SEi10 i3-1005G1, UHD Graphics G1 (Ice Lake 32 EU) | 350 g | 41 mm | x | ||
v (old) | 11 / 2018 | Intel NUC8i7BE i7-8559U, Iris Plus Graphics 655 | 683 g | 51 mm | x | ||
v (old) | 03 / 2021 | GMK NucBox 2 i5-8259U, Iris Plus Graphics 655 | 430 g | 50 mm | x | ||
v (old) | 07 / 2020 | Zotac ZBox MI643 i5-10210U, UHD Graphics 620 | 550 g | 28.5 mm | x | ||
v (old) | 04 / 2021 | Intel NUC11TNKi5 i5-1135G7, Iris Xe G7 80EUs | 504 g | 37 mm | x |
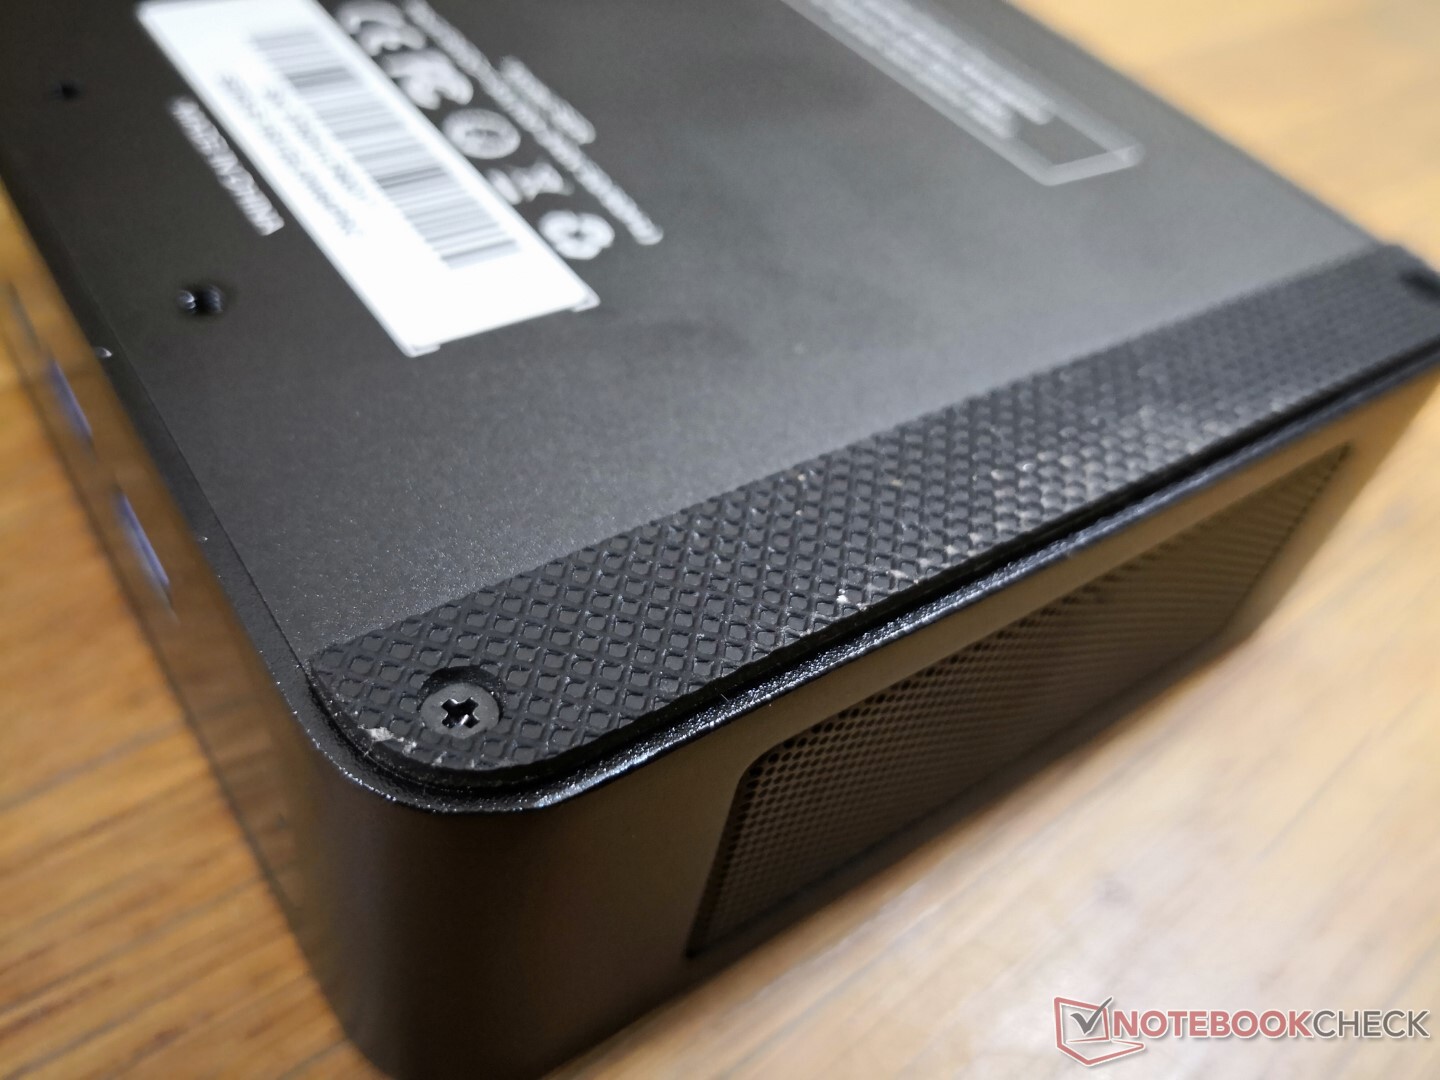
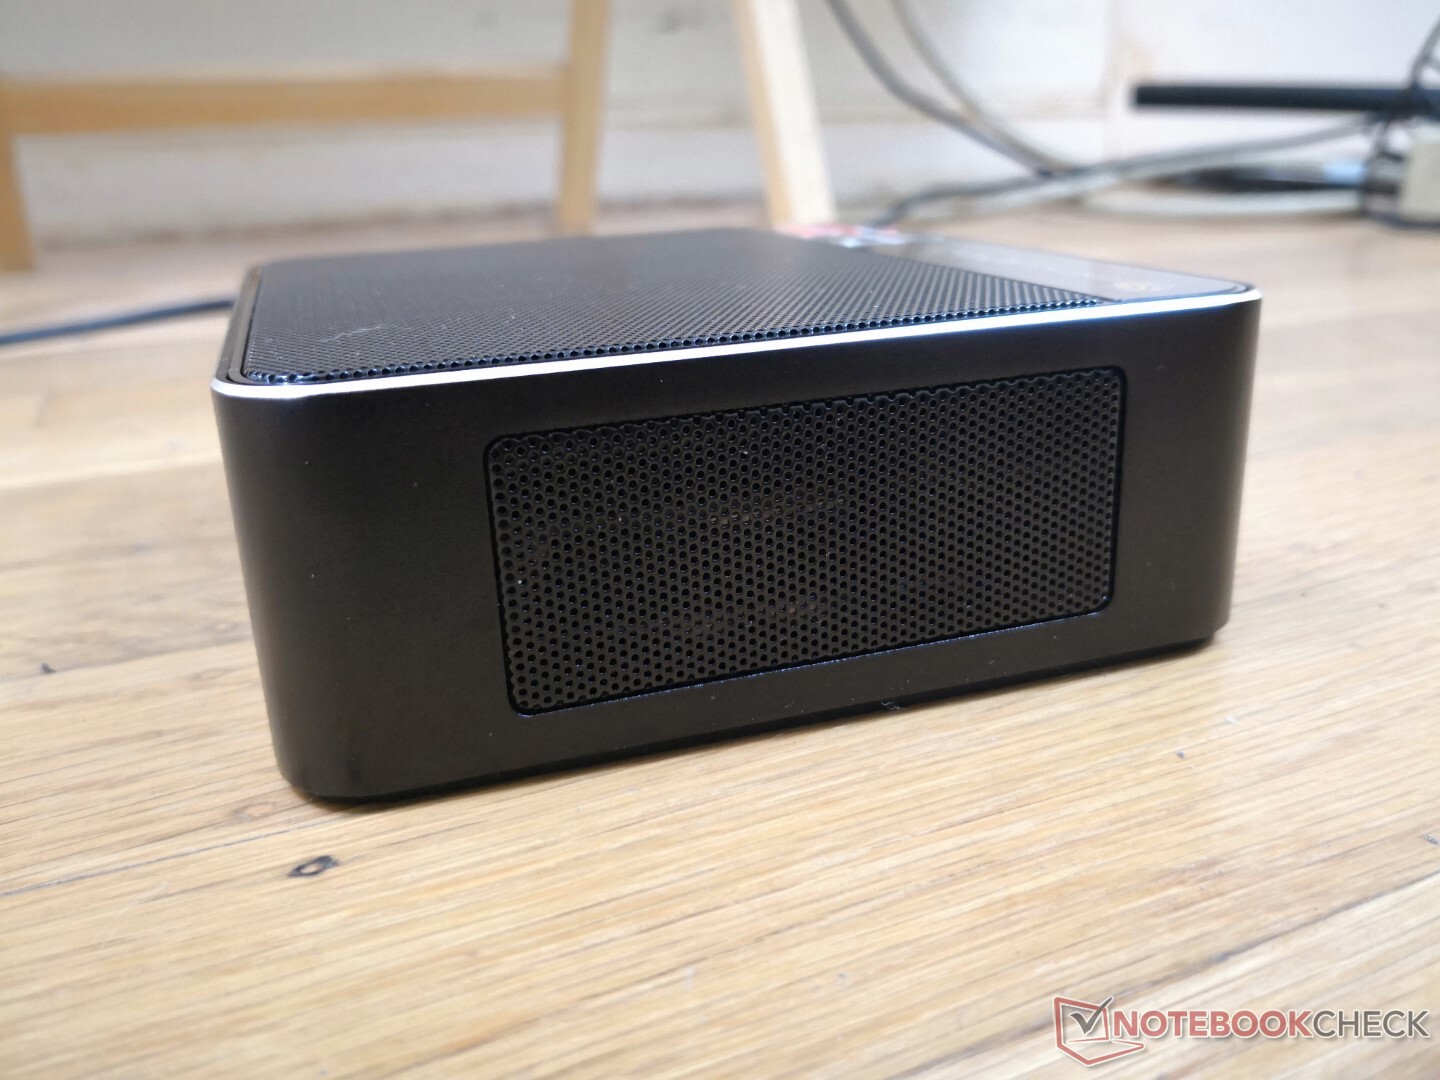
Case
The chassis is mostly matte metal with a bit of glossy plastic on the front and part of the top. First impressions are strong albeit not as rigid as an Intel NUC which utilizes thicker and heavier metal materials.
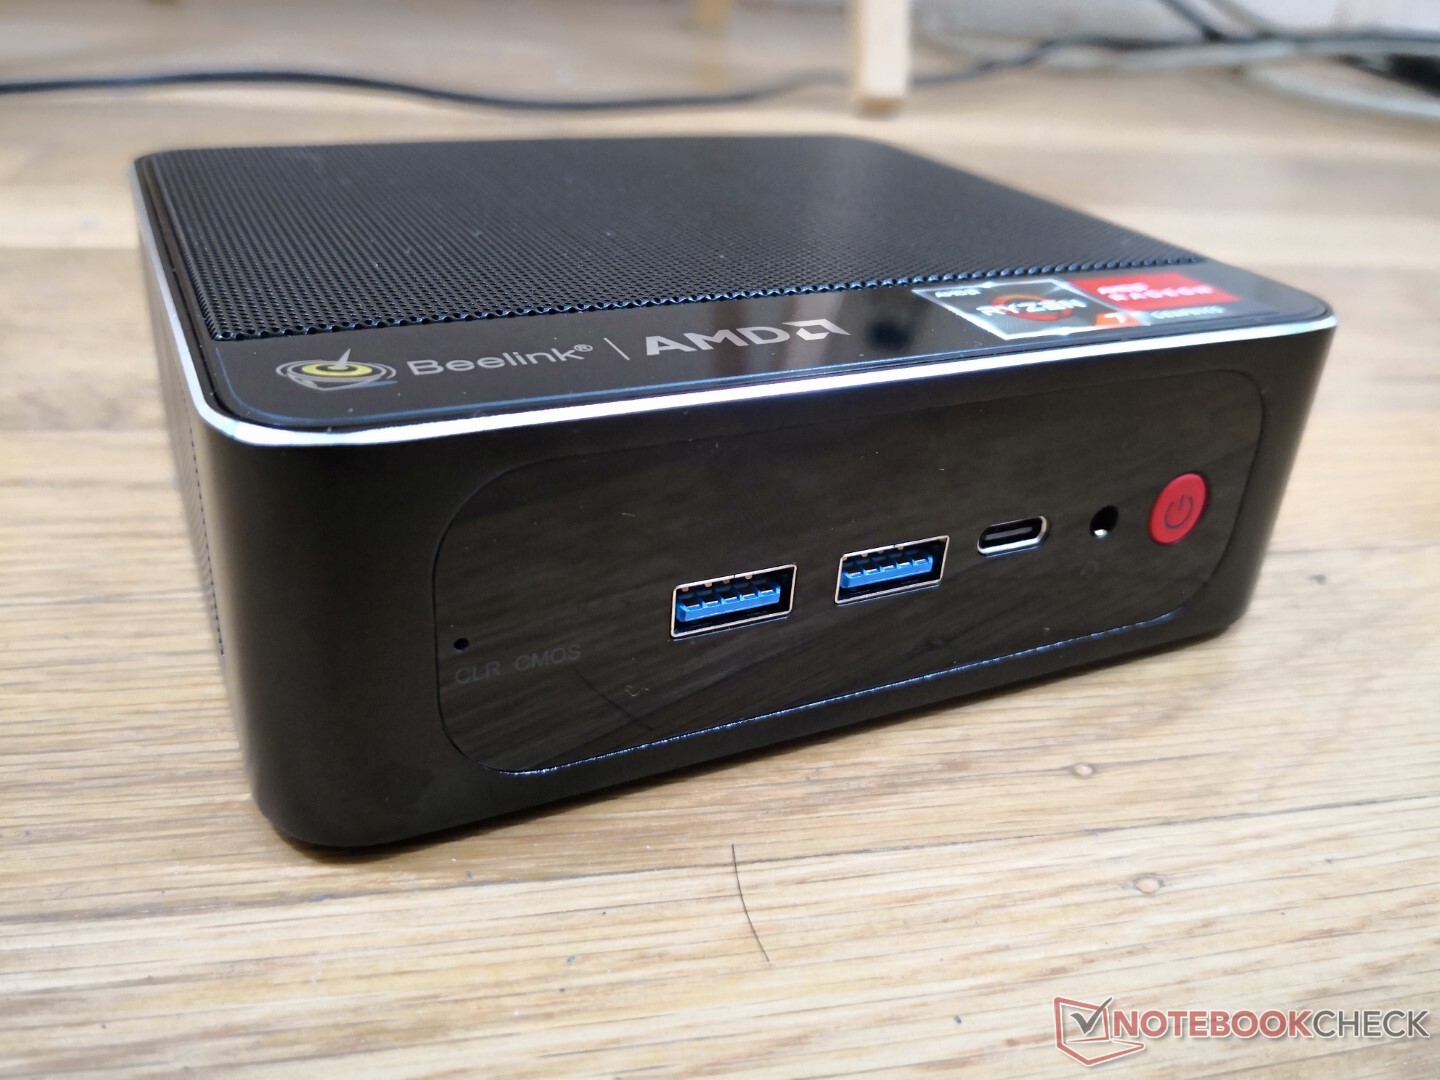
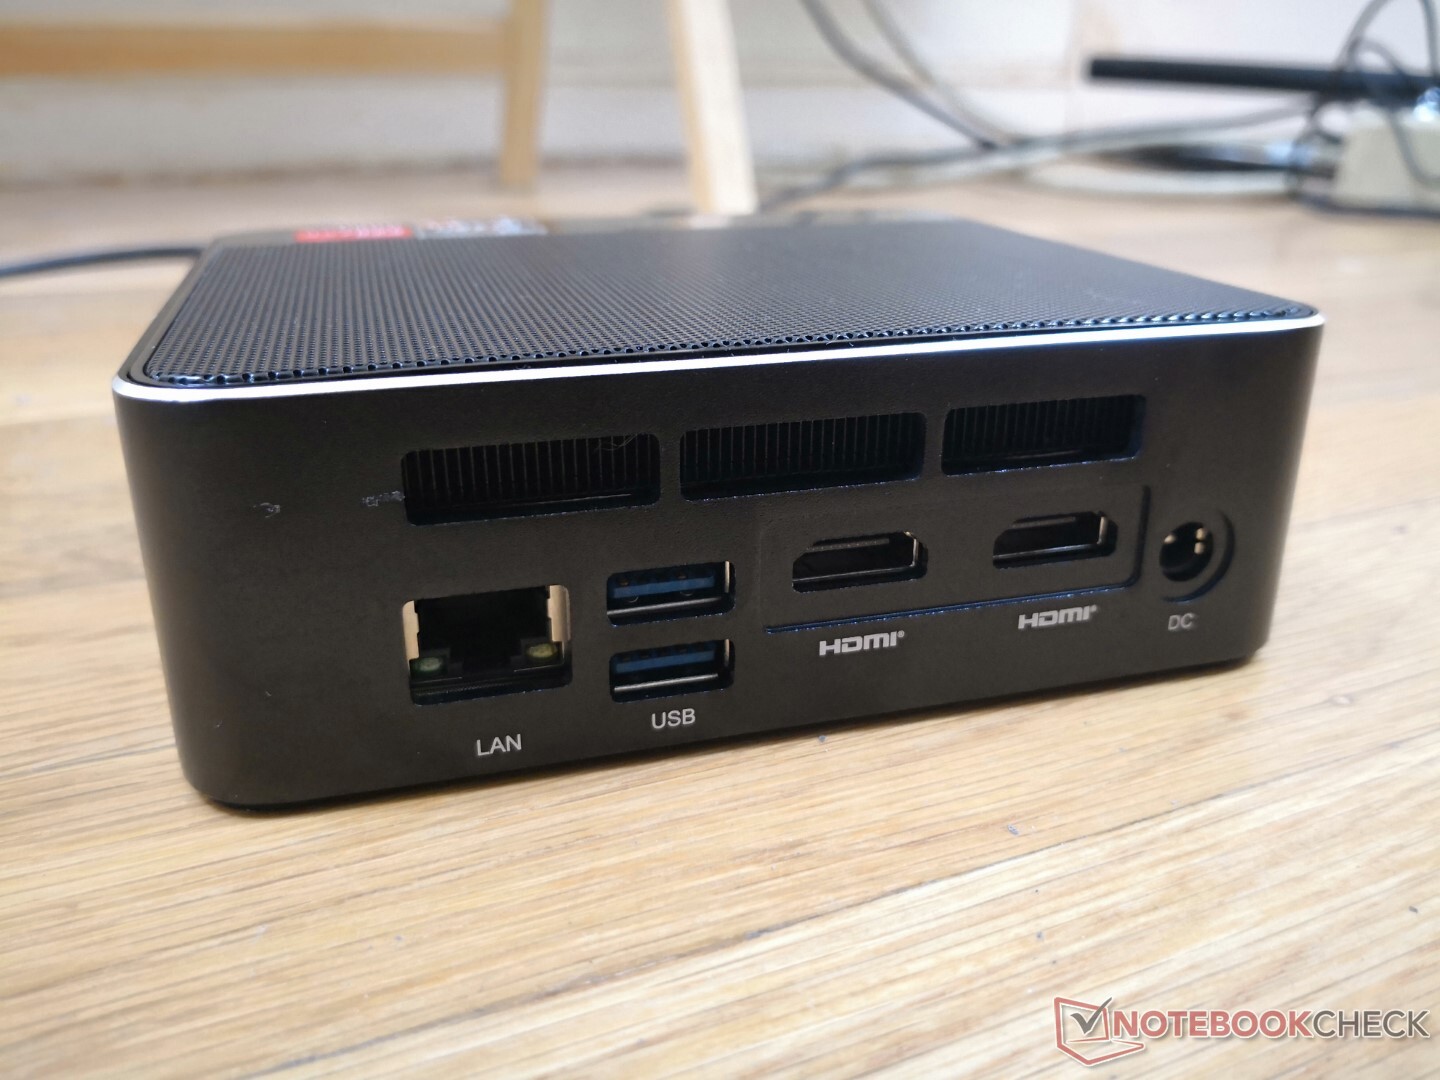
Connectivity
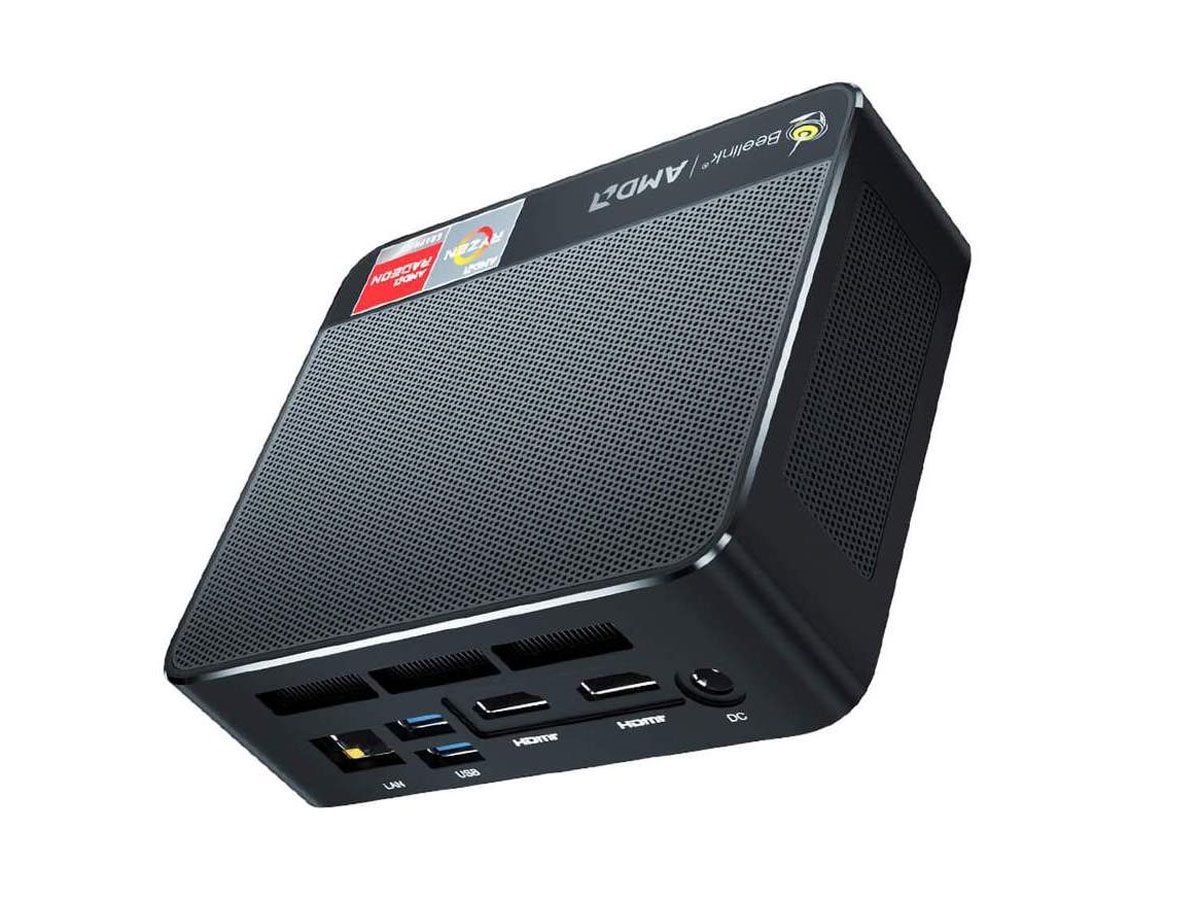
Port options are exactly the same as on the Beelink SEi10. However, keep in mind that there is no Thunderbolt on the SER3 since its AMD CPU does not natively support the interface.
The USB-C port supports DisplayPort-out, but it would strangely only work with some and not all of our external monitors.
Communication
| Networking | |
| iperf3 transmit AX12 | |
| Intel NUC11TNKi5 | |
| Beelink SEi10 | |
| Intel NUC8i7BE | |
| GMK NucBox 2 | |
| Beelink SER3 | |
| Zotac ZBox MI643 | |
| iperf3 receive AX12 | |
| Intel NUC11TNKi5 | |
| Beelink SEi10 | |
| Beelink SER3 | |
| GMK NucBox 2 | |
| Intel NUC8i7BE | |
| Zotac ZBox MI643 | |
Maintenance
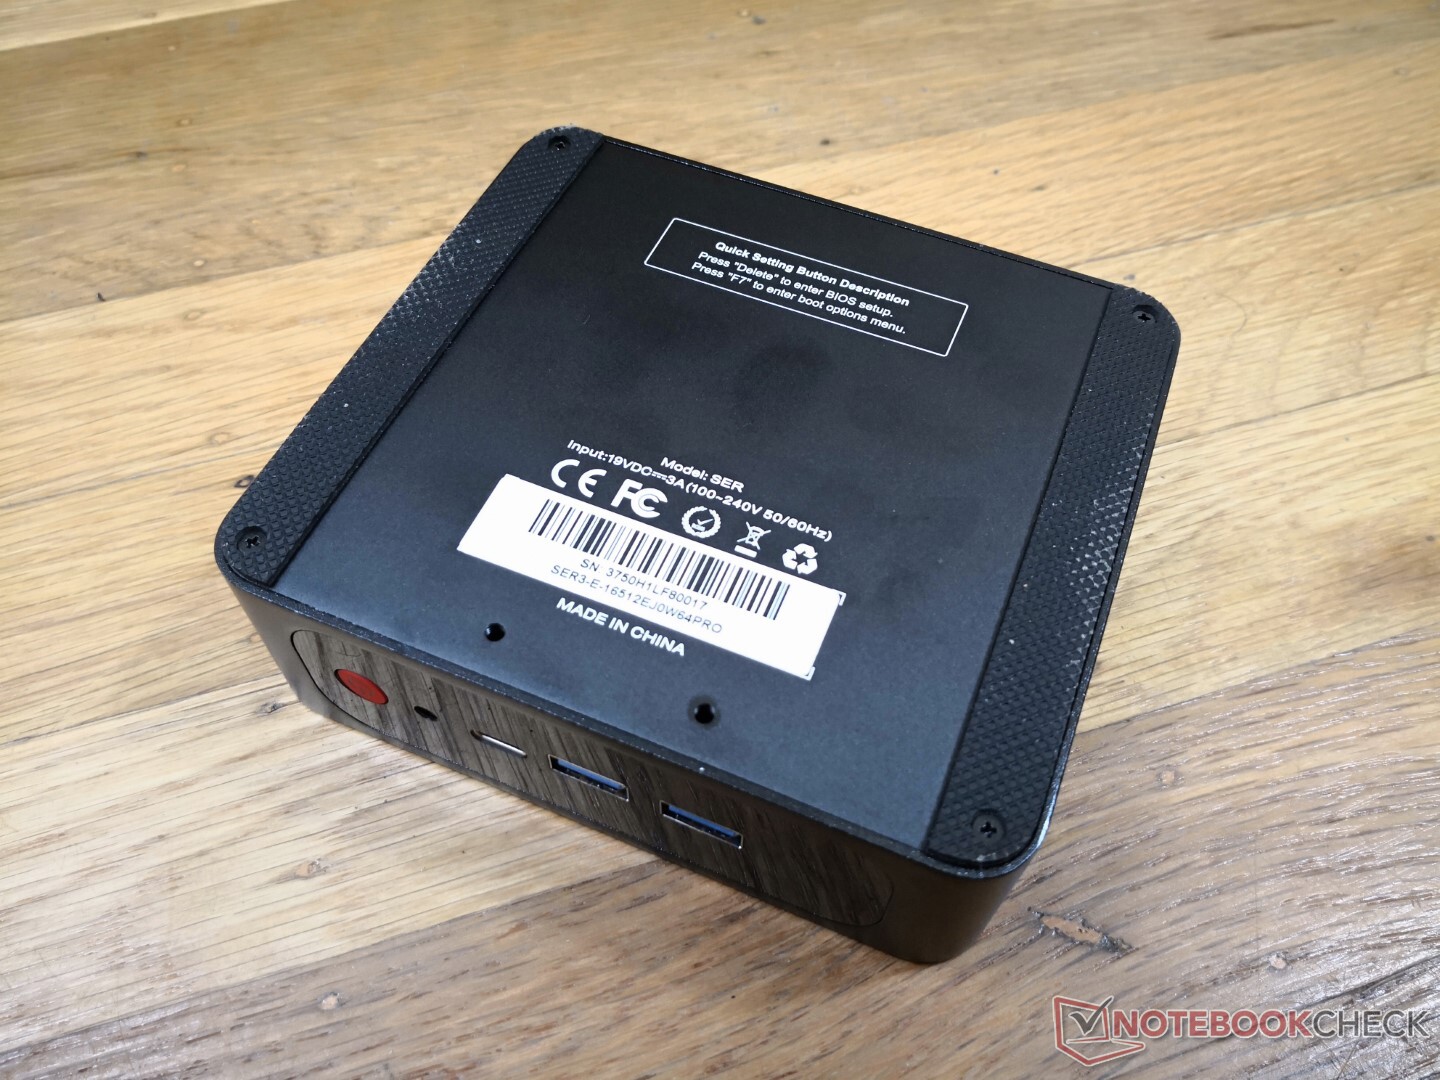
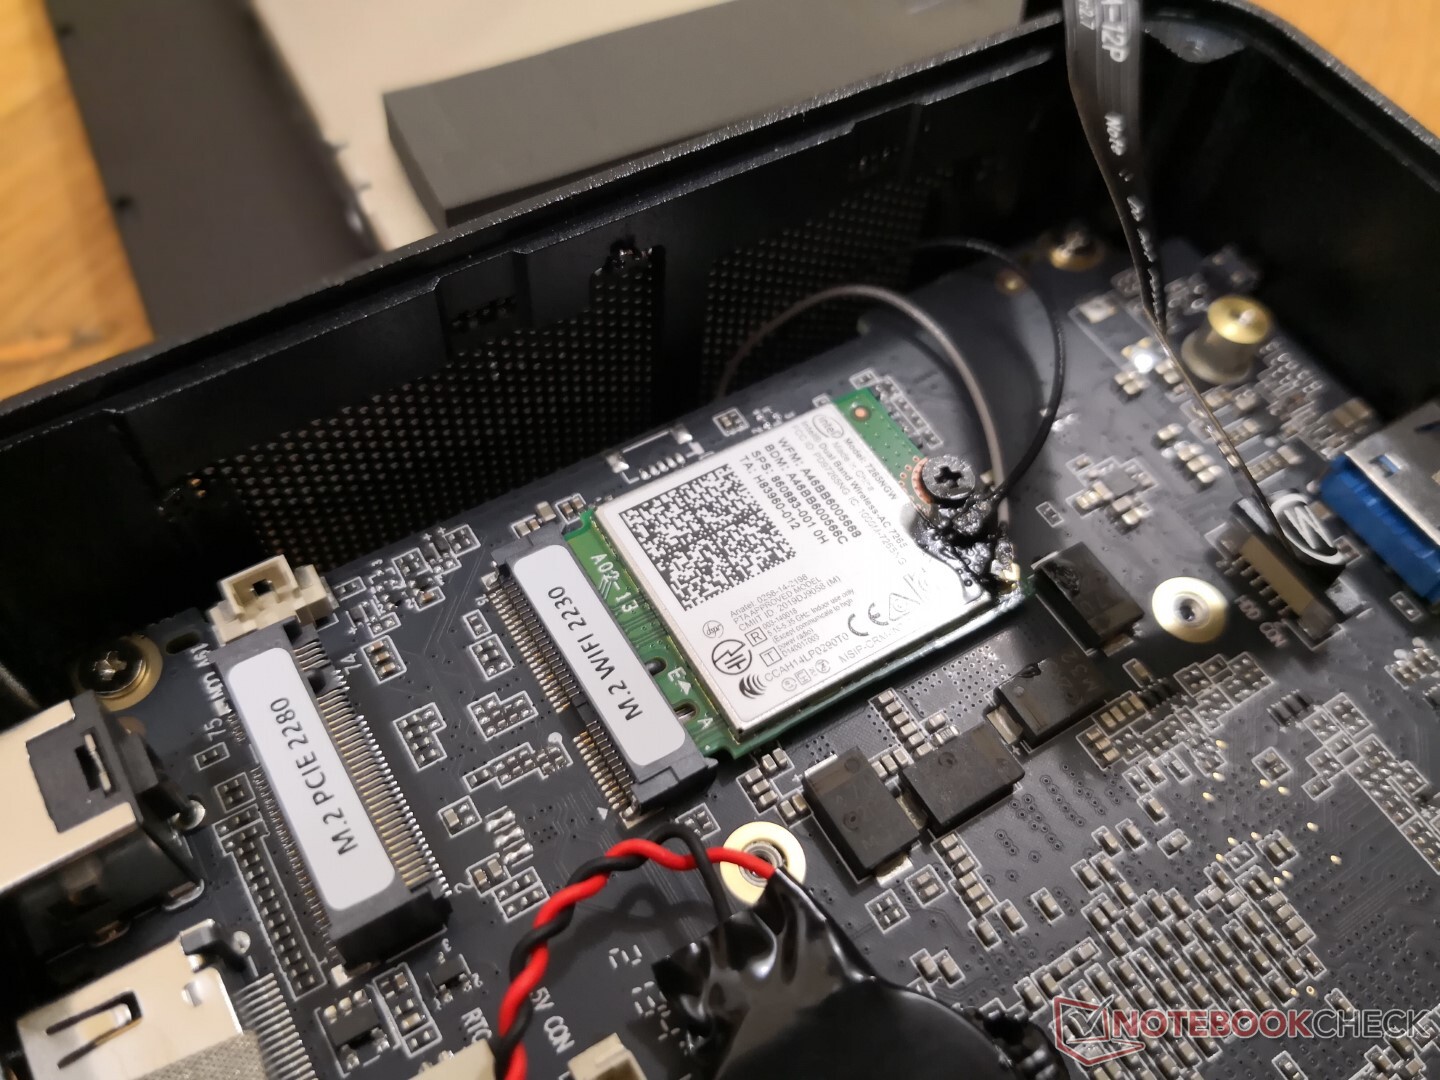
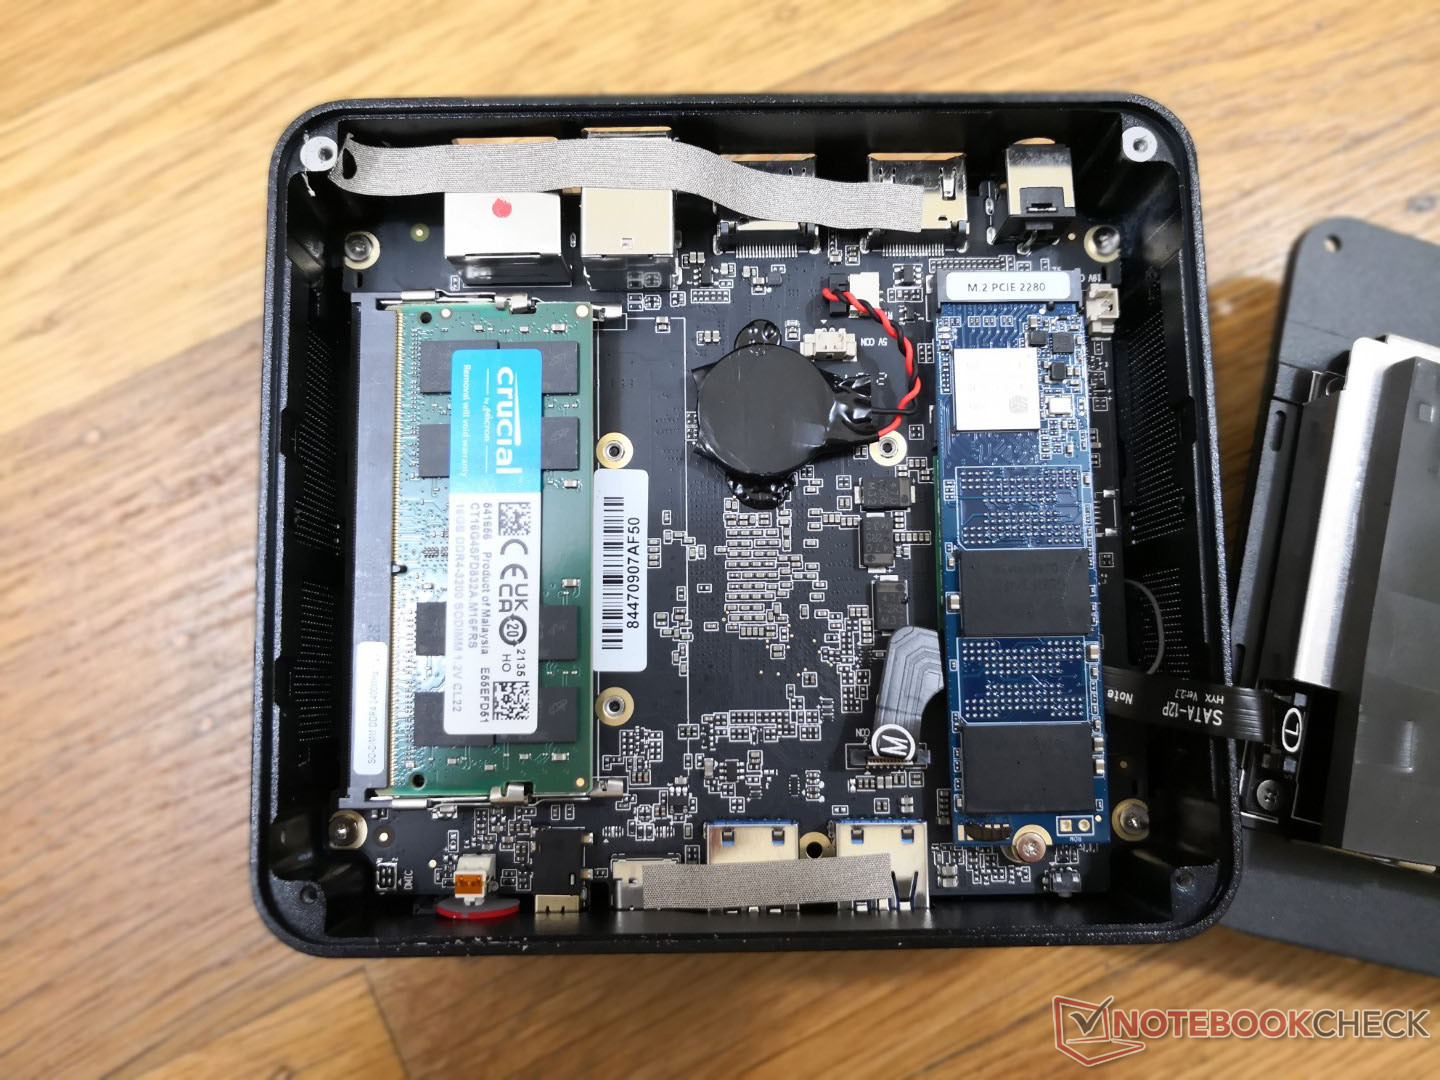
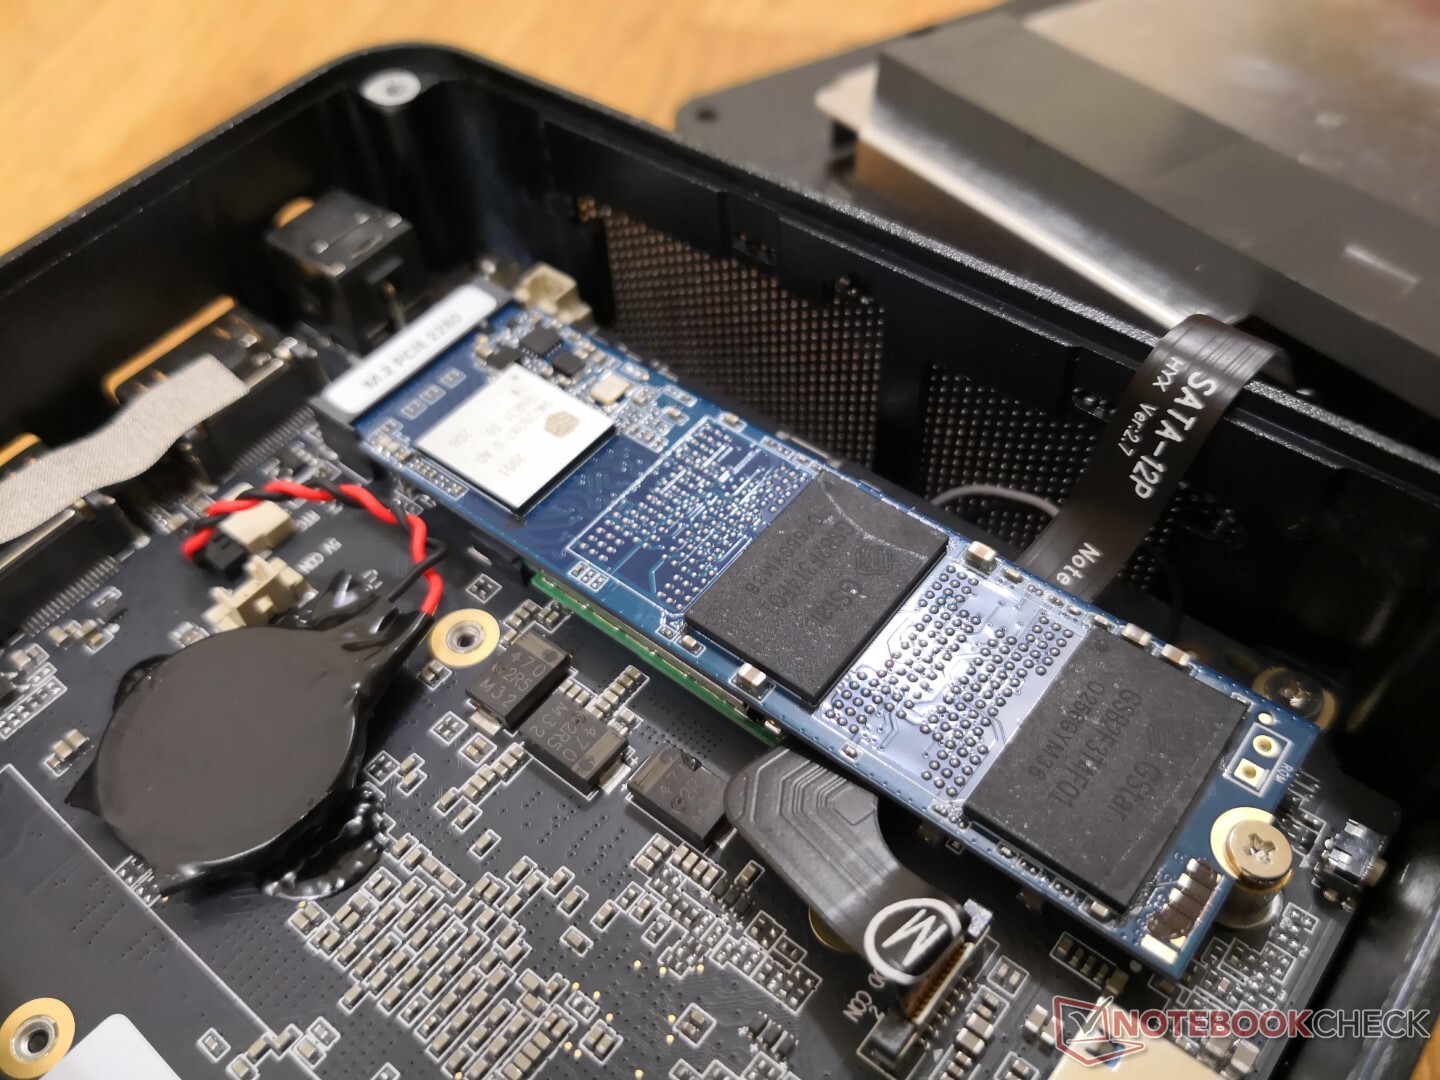
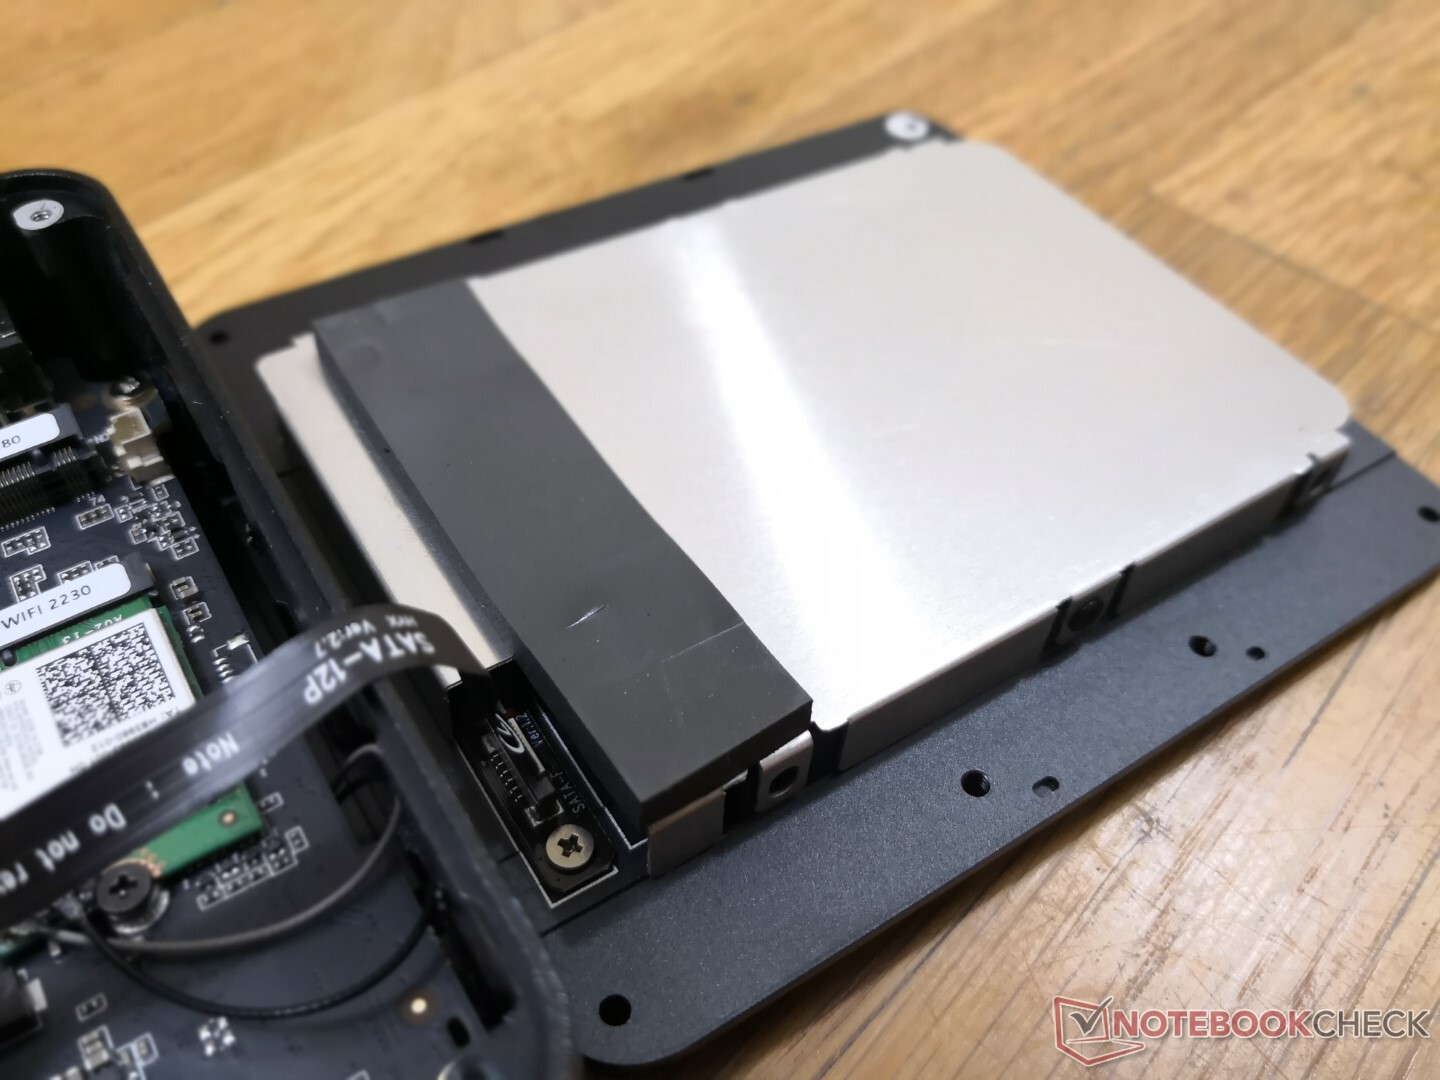
The bottom panel can be easily removed with just a Philips screwdriver to reveal a removable WLAN module, removable M.2 2280 NVMe SSD, and 2x SODIMM slots.
Accessories and Warranty
The retail packaging includes two short HDMI cables, a 50 mm or 100 mm mounting bracket, and extra screws in addition to the usual manual and AC adapter. A one-year manufacturer warranty applies
Performance
Testing Conditions
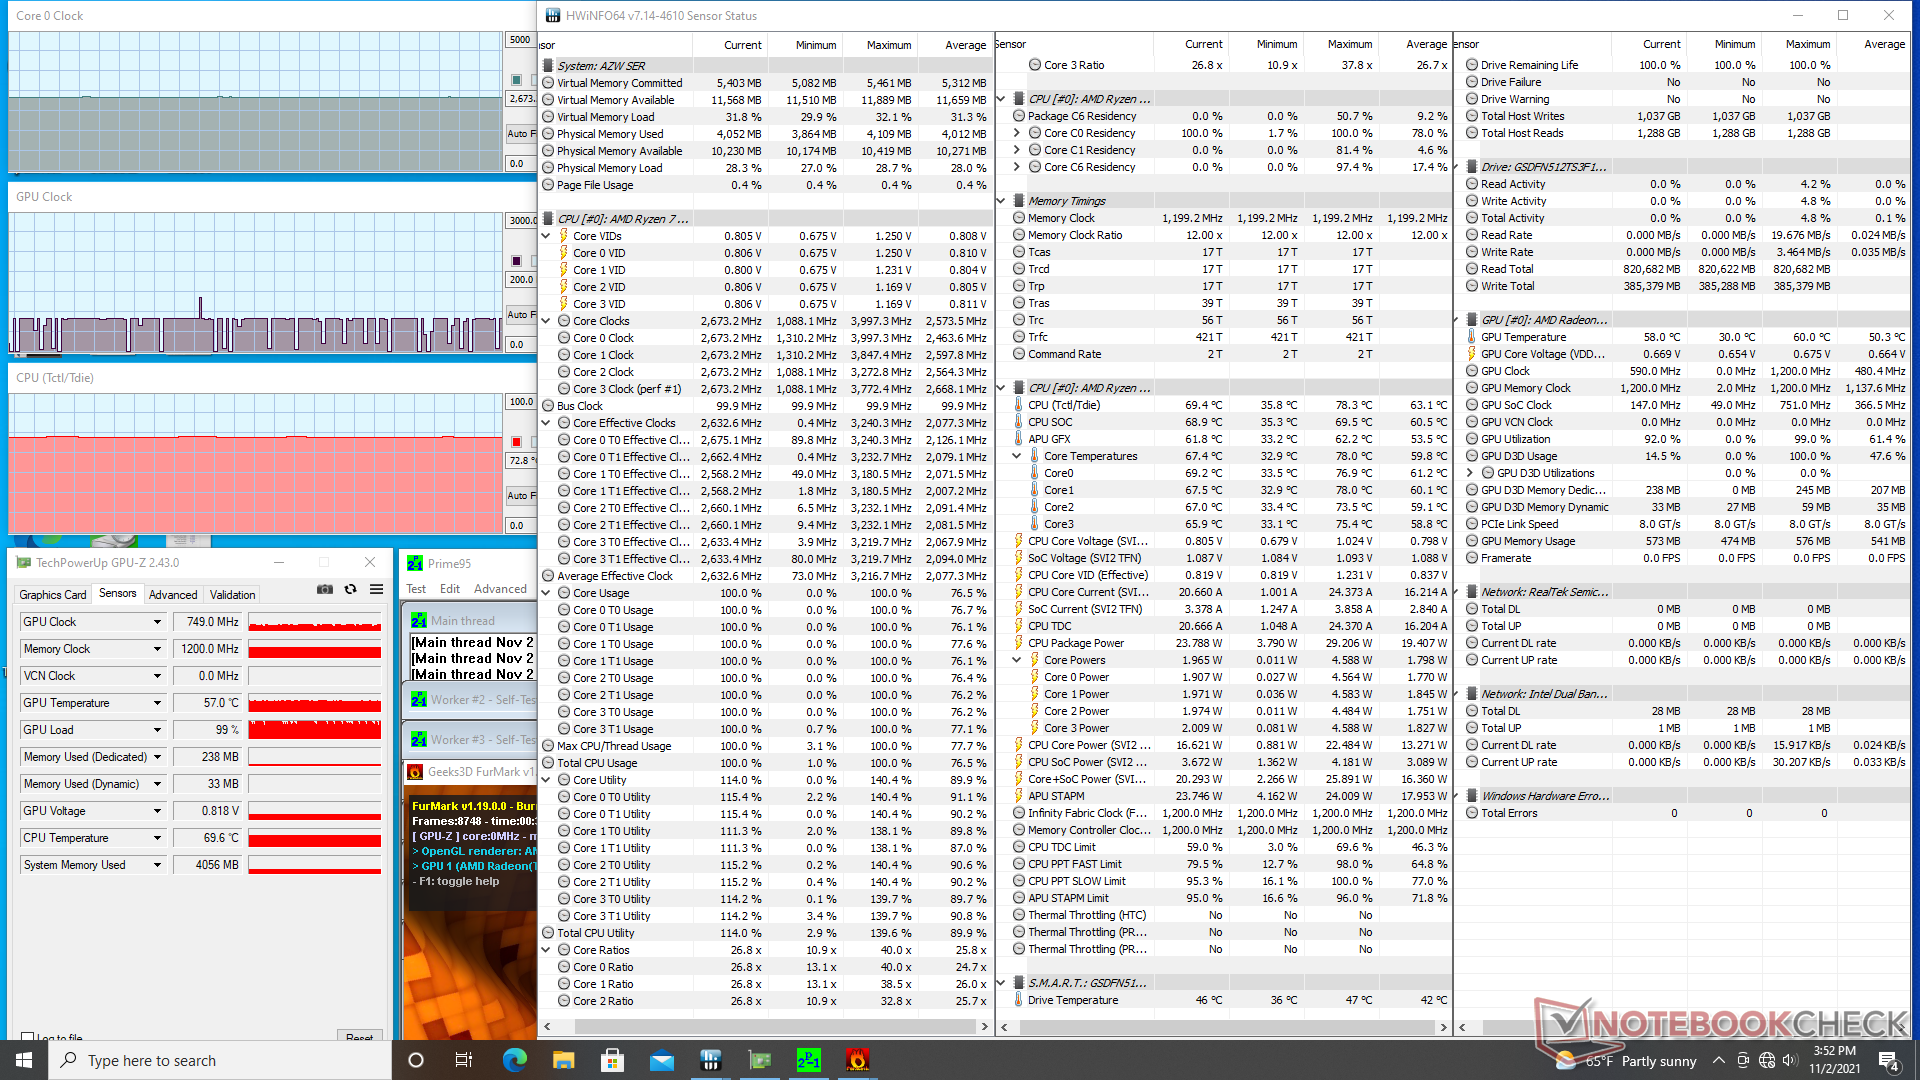
Our unit was set to Performance mode prior to running any benchmarks below for the highest possible scores.
Processor
Raw CPU performance is comparable to the Core i5-8259U in the competing GMK NucBox 2. It doesn't quite reach the performance of newer Zen 2 or Tiger Lake U-series CPUs like the Ryzen 7 5700U or Core i5-1135G7 commonly found on the latest Ultrabooks. Performance when under high loads for long periods is consistent nonetheless with no major throttling issues.
Cinebench R15 Multi Loop
Cinebench R23: Multi Core | Single Core
Cinebench R20: CPU (Multi Core) | CPU (Single Core)
Cinebench R15: CPU Multi 64Bit | CPU Single 64Bit
Blender: v2.79 BMW27 CPU
7-Zip 18.03: 7z b 4 | 7z b 4 -mmt1
Geekbench 5.5: Multi-Core | Single-Core
HWBOT x265 Benchmark v2.2: 4k Preset
LibreOffice : 20 Documents To PDF
R Benchmark 2.5: Overall mean
| CPU Performance rating | |
| Intel NUC11TNKi5 | |
| Intel NUC8i7BE -3! | |
| GMK NucBox 2 | |
| Average AMD Ryzen 7 3750H | |
| Zotac ZBox MI643 -2! | |
| Beelink SER3 -2! | |
| Beelink SEi10 -2! | |
| Cinebench R23 / Multi Core | |
| Intel NUC11TNKi5 | |
| Beelink SER3 | |
| Average AMD Ryzen 7 3750H (n=1) | |
| GMK NucBox 2 | |
| Cinebench R23 / Single Core | |
| Intel NUC11TNKi5 | |
| GMK NucBox 2 | |
| Beelink SER3 | |
| Average AMD Ryzen 7 3750H (n=1) | |
| Cinebench R20 / CPU (Multi Core) | |
| Intel NUC11TNKi5 | |
| Intel NUC8i7BE | |
| Average AMD Ryzen 7 3750H (1514 - 1825, n=4) | |
| Beelink SER3 | |
| GMK NucBox 2 | |
| Zotac ZBox MI643 | |
| Beelink SEi10 | |
| Cinebench R20 / CPU (Single Core) | |
| Intel NUC11TNKi5 | |
| Intel NUC8i7BE | |
| Zotac ZBox MI643 | |
| Beelink SEi10 | |
| GMK NucBox 2 | |
| Beelink SER3 | |
| Average AMD Ryzen 7 3750H (340 - 386, n=4) | |
| Cinebench R15 / CPU Multi 64Bit | |
| Intel NUC8i7BE | |
| Intel NUC11TNKi5 | |
| Average AMD Ryzen 7 3750H (672 - 805, n=7) | |
| Beelink SER3 | |
| GMK NucBox 2 | |
| Zotac ZBox MI643 | |
| Beelink SEi10 | |
| Cinebench R15 / CPU Single 64Bit | |
| Intel NUC11TNKi5 | |
| Intel NUC8i7BE | |
| Zotac ZBox MI643 | |
| Beelink SEi10 | |
| GMK NucBox 2 | |
| Beelink SER3 | |
| Average AMD Ryzen 7 3750H (135 - 157, n=7) | |
| Blender / v2.79 BMW27 CPU | |
| Beelink SEi10 | |
| Zotac ZBox MI643 | |
| GMK NucBox 2 | |
| Intel NUC8i7BE | |
| Intel NUC8i7BE | |
| Beelink SER3 | |
| Average AMD Ryzen 7 3750H (584 - 672, n=3) | |
| Intel NUC11TNKi5 | |
| 7-Zip 18.03 / 7z b 4 | |
| Intel NUC8i7BE | |
| Intel NUC8i7BE | |
| Intel NUC11TNKi5 | |
| GMK NucBox 2 | |
| Average AMD Ryzen 7 3750H (17077 - 19187, n=3) | |
| Beelink SER3 | |
| Zotac ZBox MI643 | |
| Beelink SEi10 | |
| 7-Zip 18.03 / 7z b 4 -mmt1 | |
| Intel NUC8i7BE | |
| Intel NUC8i7BE | |
| Intel NUC11TNKi5 | |
| Zotac ZBox MI643 | |
| Beelink SEi10 | |
| GMK NucBox 2 | |
| Beelink SER3 | |
| Average AMD Ryzen 7 3750H (3511 - 3752, n=3) | |
| Geekbench 5.5 / Multi-Core | |
| Intel NUC11TNKi5 | |
| Zotac ZBox MI643 | |
| Intel NUC8i7BE | |
| Average AMD Ryzen 7 3750H (n=1) | |
| GMK NucBox 2 | |
| Beelink SEi10 | |
| Geekbench 5.5 / Single-Core | |
| Intel NUC11TNKi5 | |
| Zotac ZBox MI643 | |
| Beelink SEi10 | |
| GMK NucBox 2 | |
| Average AMD Ryzen 7 3750H (n=1) | |
| Intel NUC8i7BE | |
| HWBOT x265 Benchmark v2.2 / 4k Preset | |
| Intel NUC11TNKi5 | |
| Intel NUC8i7BE | |
| Intel NUC8i7BE | |
| GMK NucBox 2 | |
| Average AMD Ryzen 7 3750H (4.14 - 4.4, n=3) | |
| Zotac ZBox MI643 | |
| Beelink SER3 | |
| Beelink SEi10 | |
| LibreOffice / 20 Documents To PDF | |
| Beelink SER3 | |
| Average AMD Ryzen 7 3750H (n=1) | |
| GMK NucBox 2 | |
| Zotac ZBox MI643 | |
| Beelink SEi10 | |
| Intel NUC11TNKi5 | |
| R Benchmark 2.5 / Overall mean | |
| GMK NucBox 2 | |
| Beelink SEi10 | |
| Beelink SER3 | |
| Average AMD Ryzen 7 3750H (0.69 - 0.723, n=2) | |
| Zotac ZBox MI643 | |
| Intel NUC8i7BE | |
| Intel NUC11TNKi5 | |
* ... smaller is better
AIDA64: FP32 Ray-Trace | FPU Julia | CPU SHA3 | CPU Queen | FPU SinJulia | FPU Mandel | CPU AES | CPU ZLib | FP64 Ray-Trace | CPU PhotoWorxx
| Performance rating | |
| Intel NUC11TNKi5 | |
| Intel NUC8i7BE -1! | |
| GMK NucBox 2 | |
| Average AMD Ryzen 7 3750H | |
| Zotac ZBox MI643 | |
| Beelink SER3 | |
| AIDA64 / FP32 Ray-Trace | |
| Intel NUC11TNKi5 | |
| Intel NUC8i7BE | |
| GMK NucBox 2 | |
| Zotac ZBox MI643 | |
| Average AMD Ryzen 7 3750H (3338 - 3668, n=2) | |
| Beelink SER3 | |
| AIDA64 / FPU Julia | |
| Intel NUC11TNKi5 | |
| Intel NUC8i7BE | |
| GMK NucBox 2 | |
| Zotac ZBox MI643 | |
| Average AMD Ryzen 7 3750H (16912 - 19132, n=2) | |
| Beelink SER3 | |
| AIDA64 / CPU SHA3 | |
| Intel NUC11TNKi5 | |
| GMK NucBox 2 | |
| Average AMD Ryzen 7 3750H (897 - 1001, n=2) | |
| Zotac ZBox MI643 | |
| Beelink SER3 | |
| AIDA64 / CPU Queen | |
| Intel NUC8i7BE | |
| Zotac ZBox MI643 | |
| Average AMD Ryzen 7 3750H (43632 - 50328, n=2) | |
| Intel NUC11TNKi5 | |
| Beelink SER3 | |
| GMK NucBox 2 | |
| AIDA64 / FPU SinJulia | |
| Average AMD Ryzen 7 3750H (5639 - 6478, n=2) | |
| Beelink SER3 | |
| Intel NUC8i7BE | |
| Intel NUC11TNKi5 | |
| GMK NucBox 2 | |
| Zotac ZBox MI643 | |
| AIDA64 / FPU Mandel | |
| Intel NUC11TNKi5 | |
| Intel NUC8i7BE | |
| GMK NucBox 2 | |
| Zotac ZBox MI643 | |
| Average AMD Ryzen 7 3750H (8846 - 9928, n=2) | |
| Beelink SER3 | |
| AIDA64 / CPU AES | |
| Intel NUC11TNKi5 | |
| Average AMD Ryzen 7 3750H (28977 - 32668, n=2) | |
| Beelink SER3 | |
| Intel NUC8i7BE | |
| GMK NucBox 2 | |
| Zotac ZBox MI643 | |
| AIDA64 / CPU ZLib | |
| Intel NUC11TNKi5 | |
| Intel NUC8i7BE | |
| Average AMD Ryzen 7 3750H (313 - 350, n=2) | |
| Beelink SER3 | |
| GMK NucBox 2 | |
| Zotac ZBox MI643 | |
| AIDA64 / FP64 Ray-Trace | |
| Intel NUC11TNKi5 | |
| Intel NUC8i7BE | |
| GMK NucBox 2 | |
| Zotac ZBox MI643 | |
| Average AMD Ryzen 7 3750H (1758 - 1935, n=2) | |
| Beelink SER3 | |
| AIDA64 / CPU PhotoWorxx | |
| Zotac ZBox MI643 | |
| Intel NUC8i7BE | |
| Intel NUC11TNKi5 | |
| Average AMD Ryzen 7 3750H (10338 - 18898, n=2) | |
| Beelink SER3 | |
| GMK NucBox 2 | |
System Performance
| PCMark 10 / Score | |
| Intel NUC8i7BE | |
| Intel NUC11TNKi5 | |
| Zotac ZBox MI643 | |
| GMK NucBox 2 | |
| Beelink SER3 | |
| Average AMD Ryzen 7 3750H, AMD Radeon RX Vega 10 (n=1) | |
| Beelink SEi10 | |
| PCMark 10 / Essentials | |
| Zotac ZBox MI643 | |
| Intel NUC11TNKi5 | |
| Intel NUC8i7BE | |
| GMK NucBox 2 | |
| Beelink SEi10 | |
| Beelink SER3 | |
| Average AMD Ryzen 7 3750H, AMD Radeon RX Vega 10 (n=1) | |
| PCMark 10 / Productivity | |
| Intel NUC8i7BE | |
| Zotac ZBox MI643 | |
| GMK NucBox 2 | |
| Intel NUC11TNKi5 | |
| Beelink SER3 | |
| Average AMD Ryzen 7 3750H, AMD Radeon RX Vega 10 (n=1) | |
| Beelink SEi10 | |
| PCMark 10 / Digital Content Creation | |
| Intel NUC11TNKi5 | |
| Intel NUC8i7BE | |
| GMK NucBox 2 | |
| Beelink SER3 | |
| Average AMD Ryzen 7 3750H, AMD Radeon RX Vega 10 (n=1) | |
| Zotac ZBox MI643 | |
| Beelink SEi10 | |
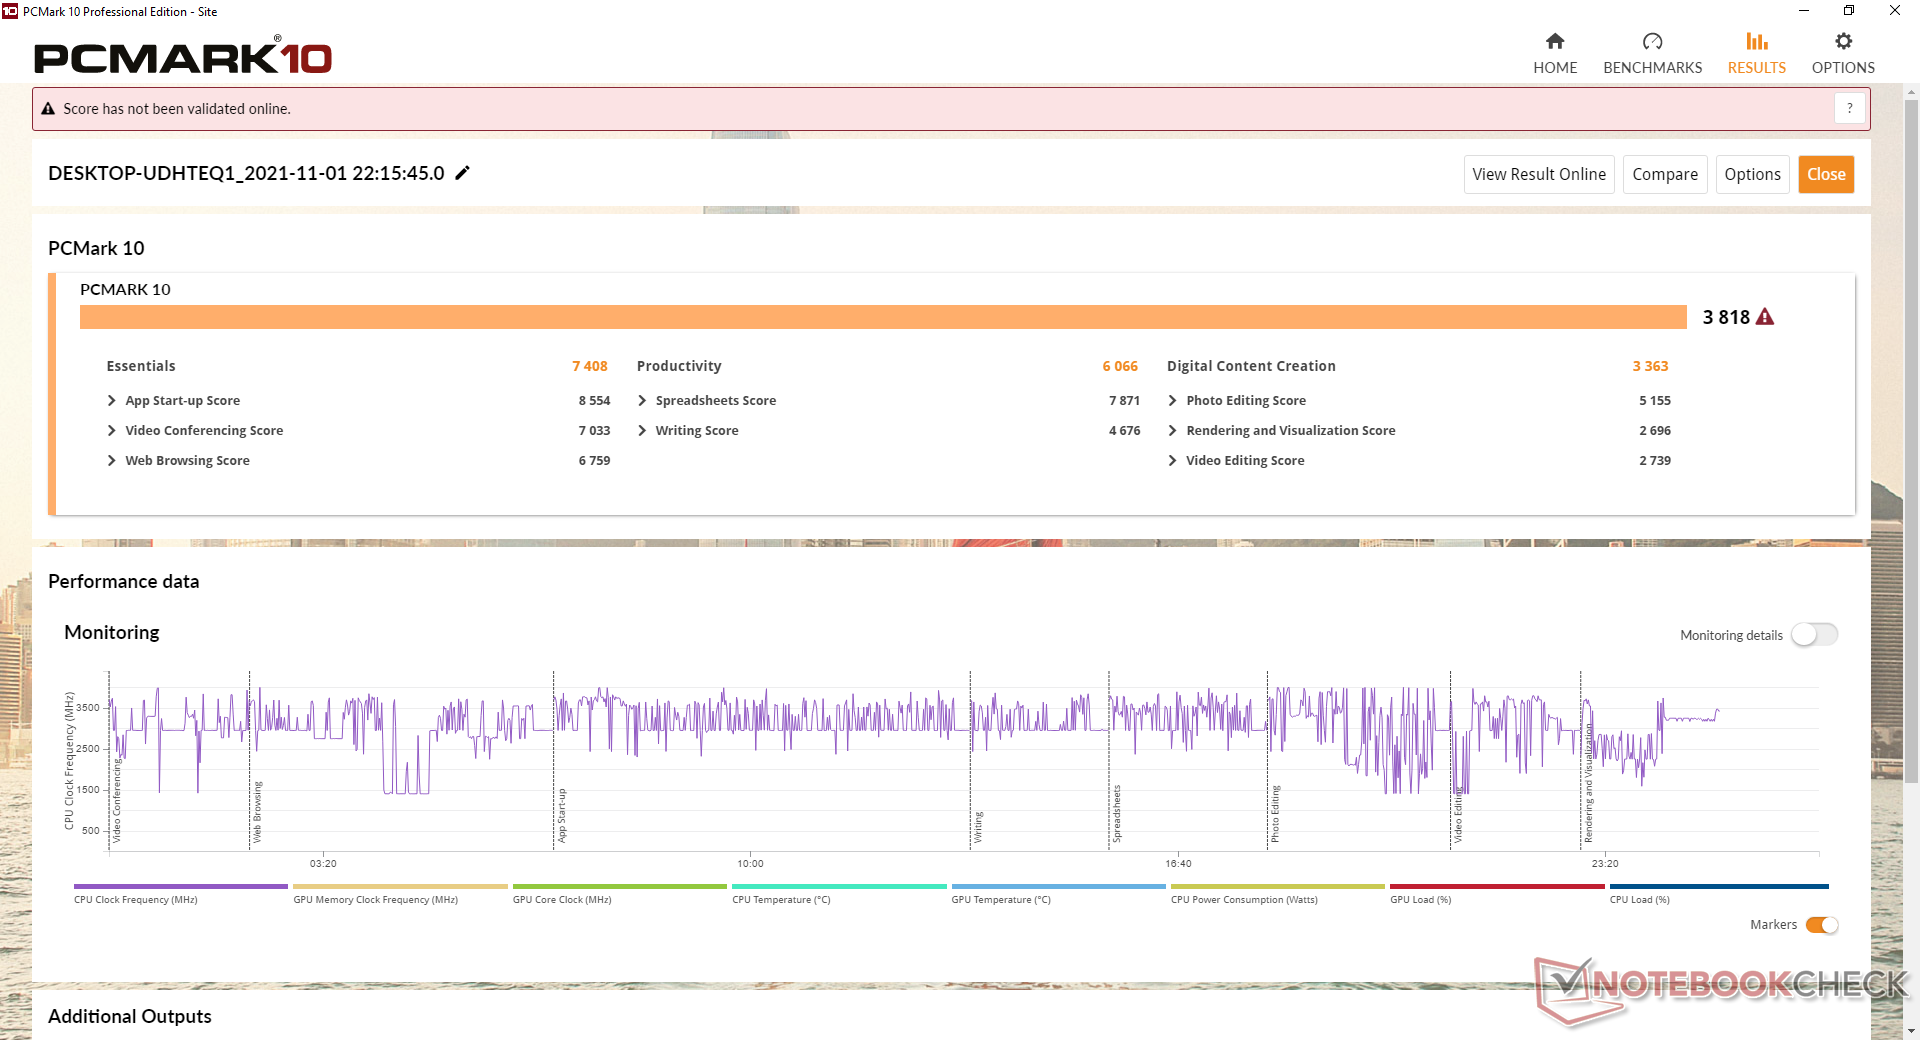
| PCMark 10 Score | 3818 points | |
Help | ||
| AIDA64 / Memory Copy | |
| Intel NUC8i7BE | |
| GMK NucBox 2 | |
| Zotac ZBox MI643 | |
| Average AMD Ryzen 7 3750H (16249 - 30963, n=2) | |
| Intel NUC11TNKi5 | |
| Beelink SER3 | |
| AIDA64 / Memory Read | |
| Intel NUC8i7BE | |
| GMK NucBox 2 | |
| Zotac ZBox MI643 | |
| Average AMD Ryzen 7 3750H (18268 - 35218, n=2) | |
| Intel NUC11TNKi5 | |
| Beelink SER3 | |
| AIDA64 / Memory Write | |
| Intel NUC8i7BE | |
| GMK NucBox 2 | |
| Zotac ZBox MI643 | |
| Average AMD Ryzen 7 3750H (18455 - 35988, n=2) | |
| Intel NUC11TNKi5 | |
| Beelink SER3 | |
| AIDA64 / Memory Latency | |
| Average AMD Ryzen 7 3750H (95.8 - 118, n=2) | |
| Beelink SER3 | |
| Intel NUC11TNKi5 | |
| Zotac ZBox MI643 | |
| GMK NucBox 2 | |
| Intel NUC8i7BE | |
* ... smaller is better
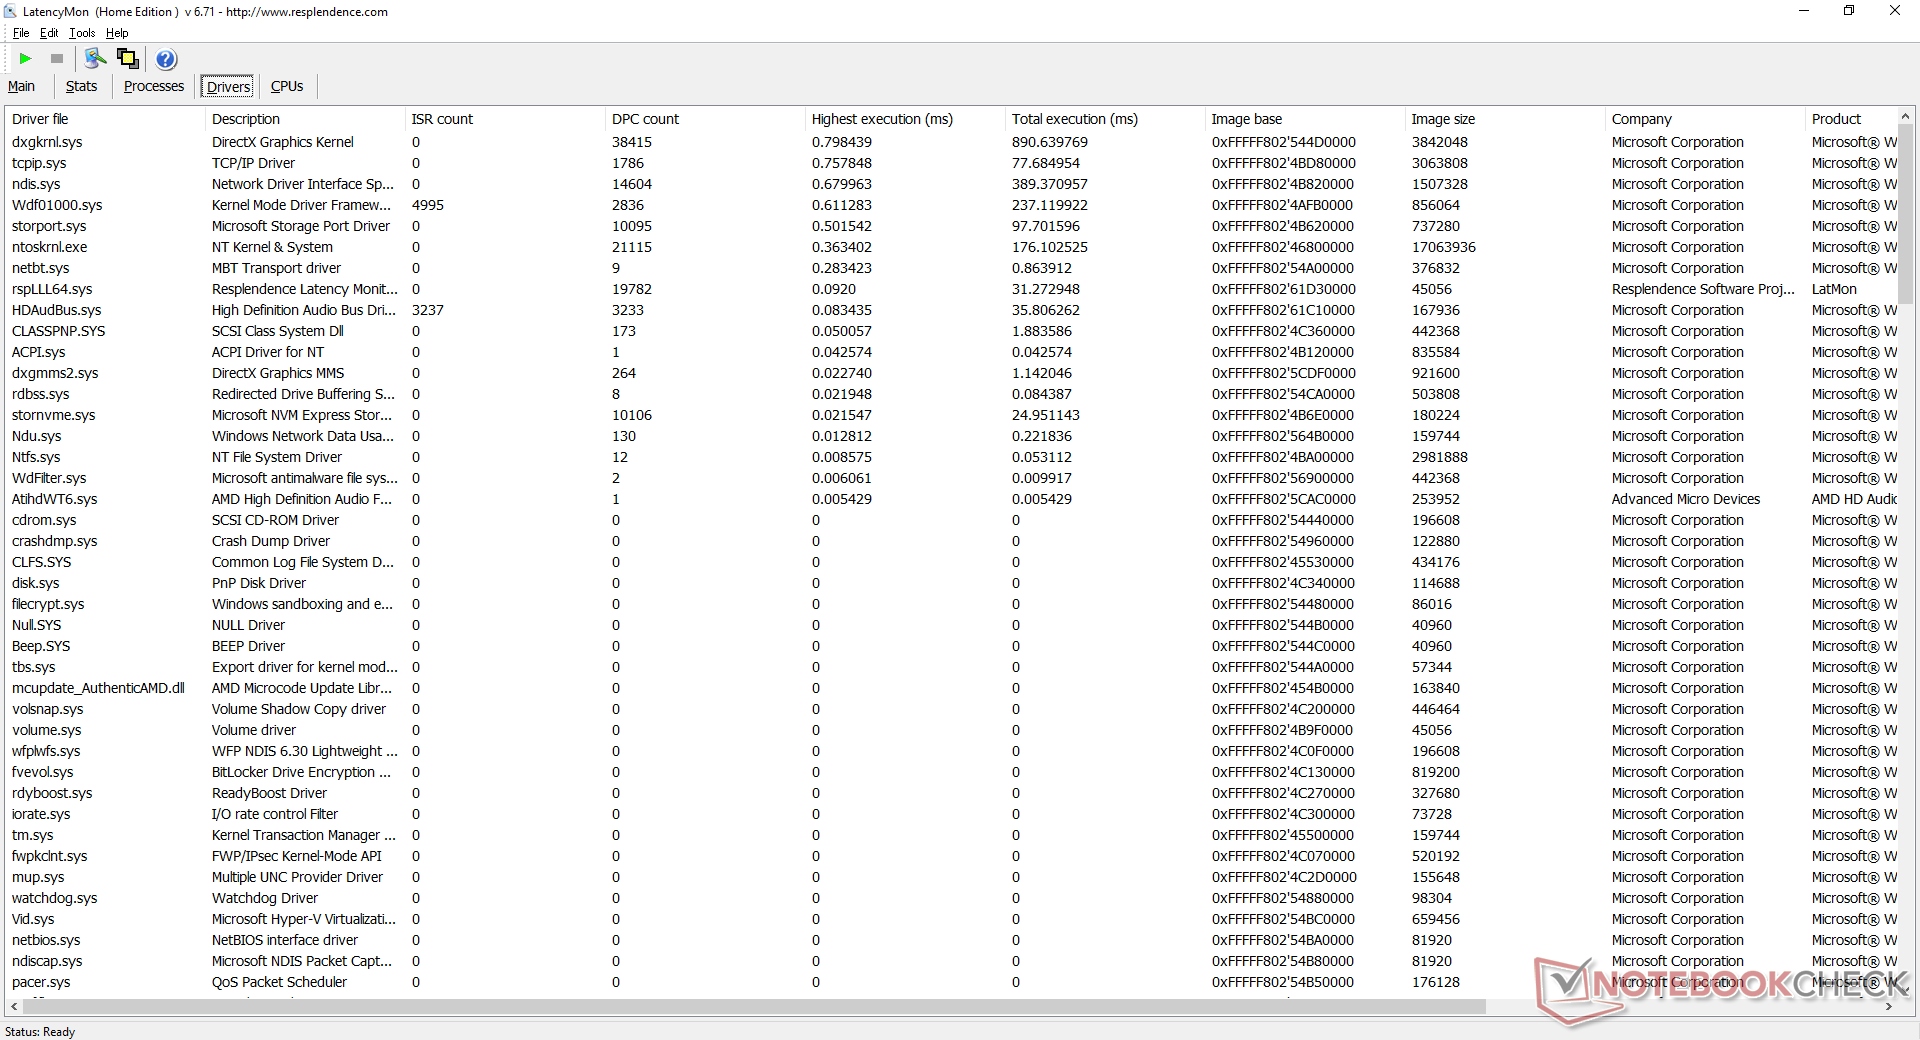
DPC Latency
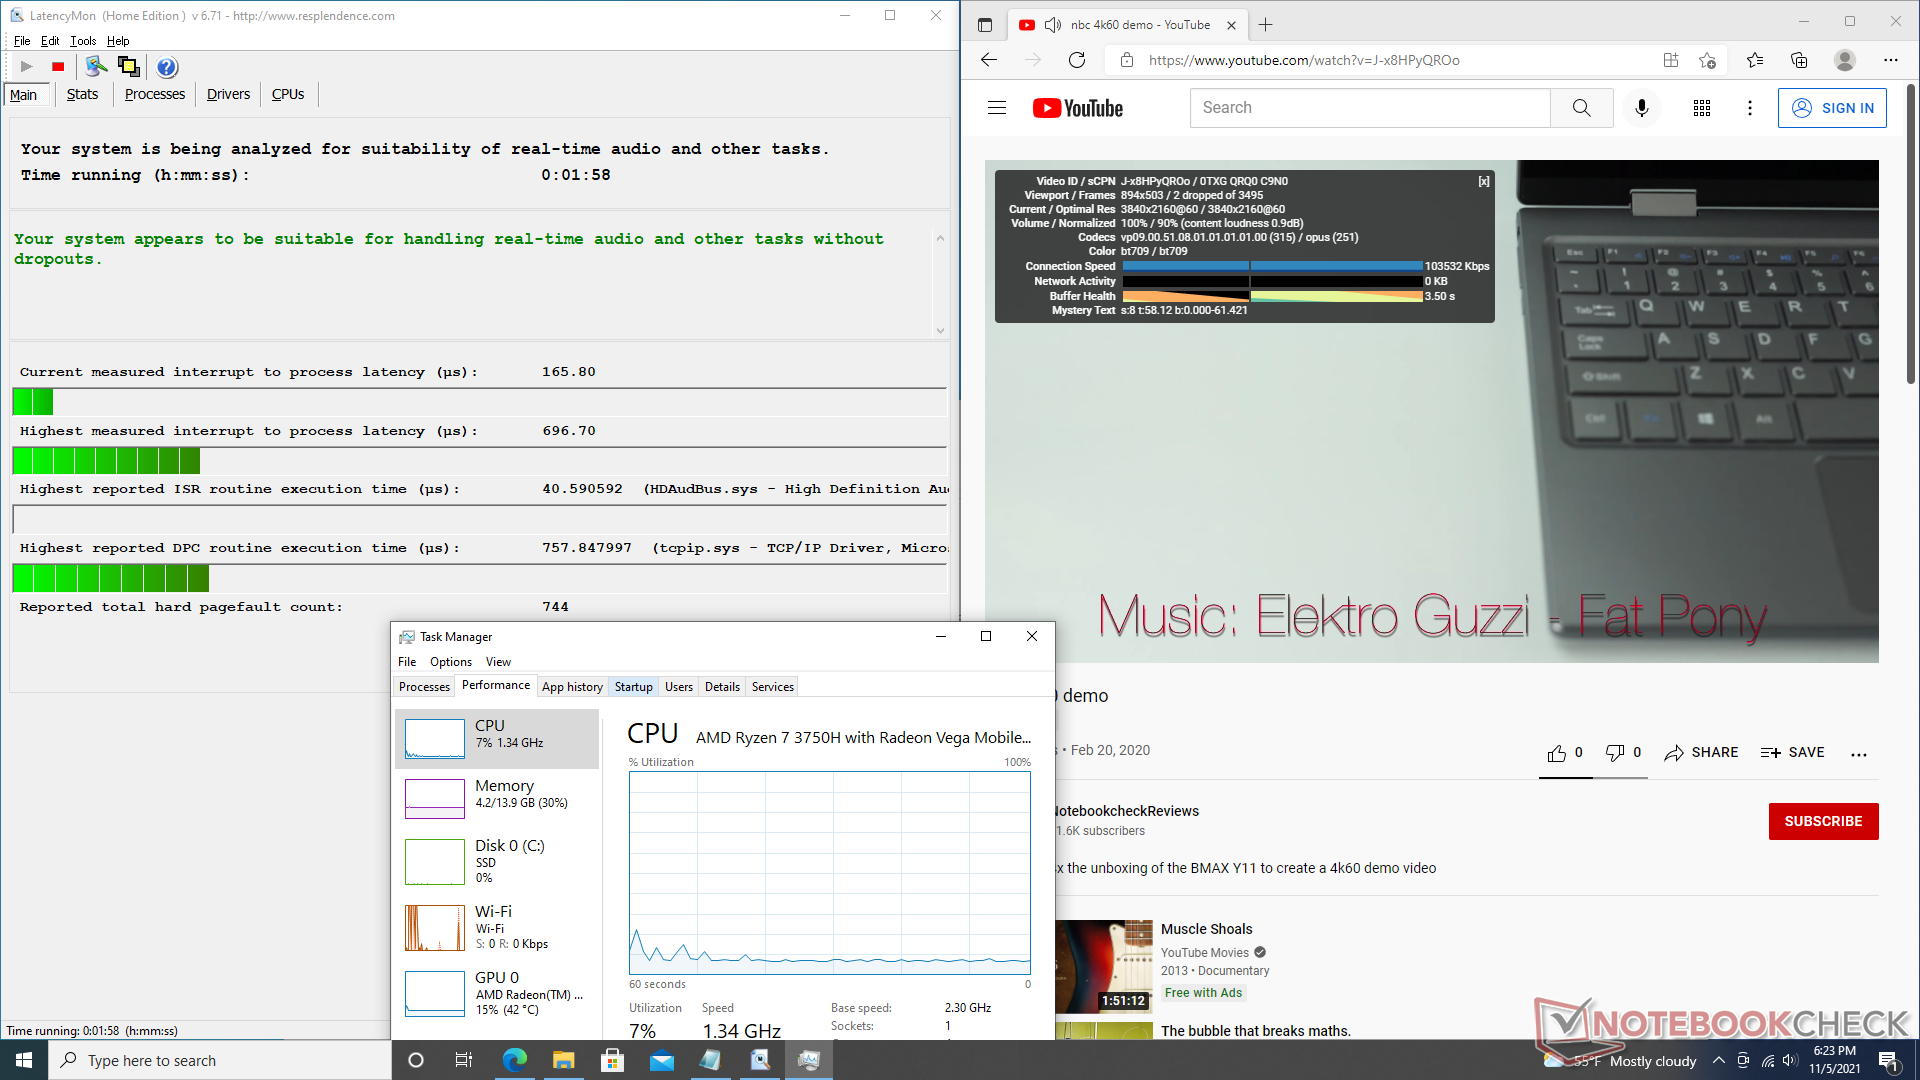
LatencyMon shows no DPC issues when opening multiple browser tabs on our homepage or when running Prime95 stress. 4K video playback at 60 FPS is smooth and with almost no dropped frames.
| DPC Latencies / LatencyMon - interrupt to process latency (max), Web, Youtube, Prime95 | |
| Beelink SEi10 | |
| GMK NucBox 2 | |
| Zotac ZBox MI643 | |
| Beelink SER3 | |
| Intel NUC11TNKi5 | |
* ... smaller is better
Storage Devices
Whereas our SEi10 comes with a 256 GB Silicon Motion AZW NVMe SSD, our SER3 comes with the 512 GB version instead. Sequential read and write rates reveal the drive to be a midrange NVMe offering. Transfer rates will slow over time when stressed from 1900 MB/s to 1400 MB/s or slower due to thermal limitations. Many Intel NUCs integrate a heat spreader on top of the NVMe SSD for cooling to prevent or delay the performance slowdown.
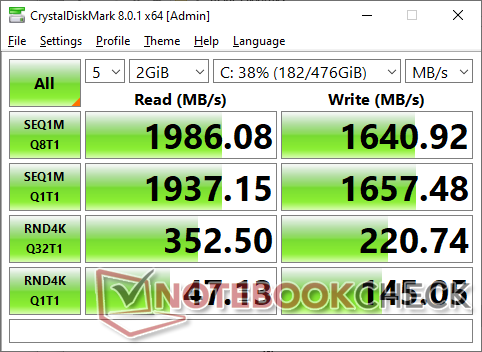
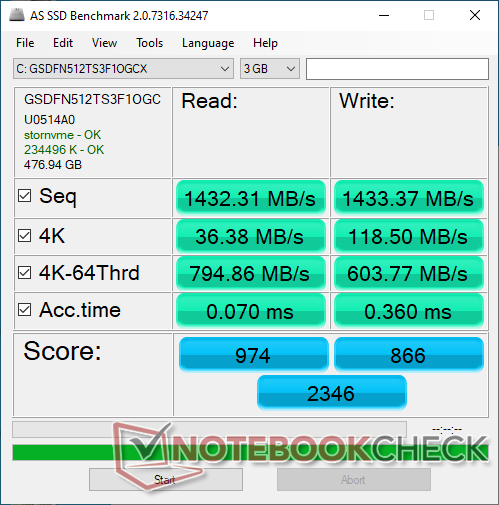

| Drive Performance rating - Percent | |
| Zotac ZBox MI643 | |
| Beelink SER3 | |
| GMK NucBox 2 | |
| Beelink SEi10 | |
| Intel NUC11TNKi5 | |
* ... smaller is better
Disk Throttling: DiskSpd Read Loop, Queue Depth 8
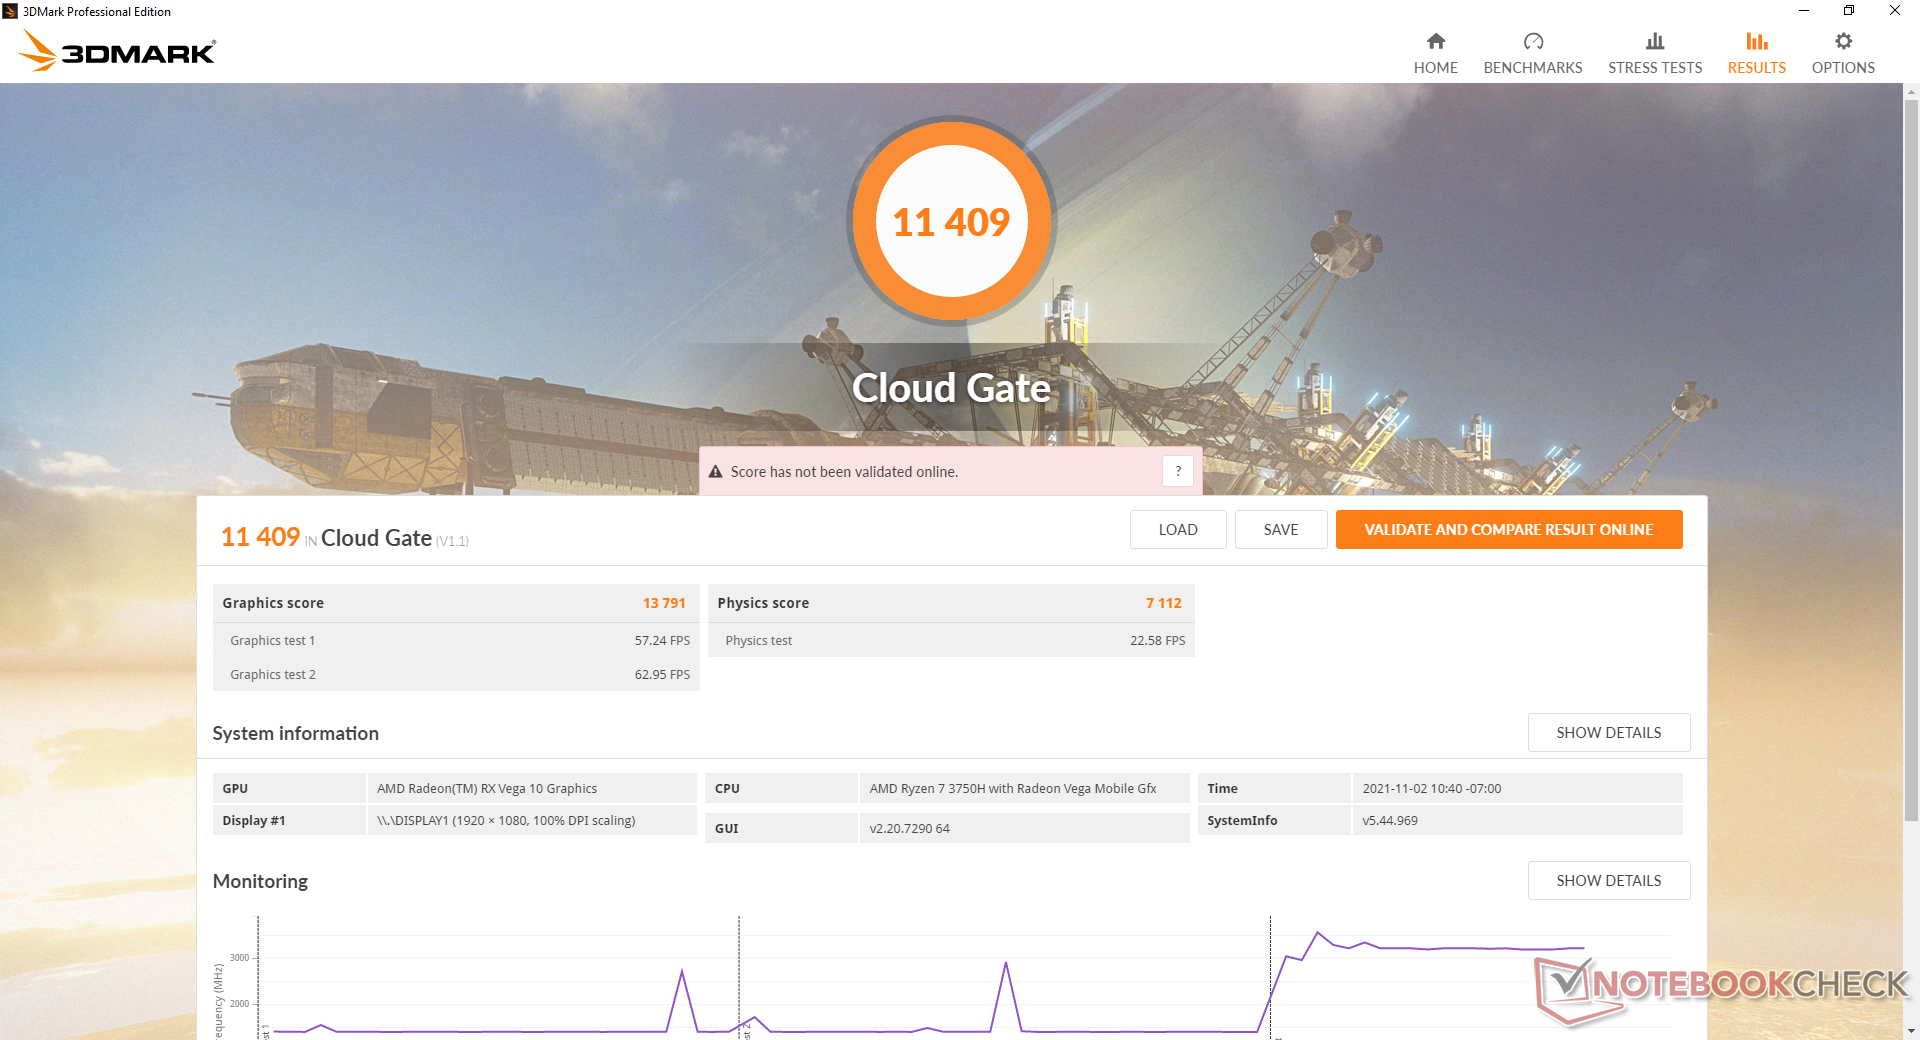
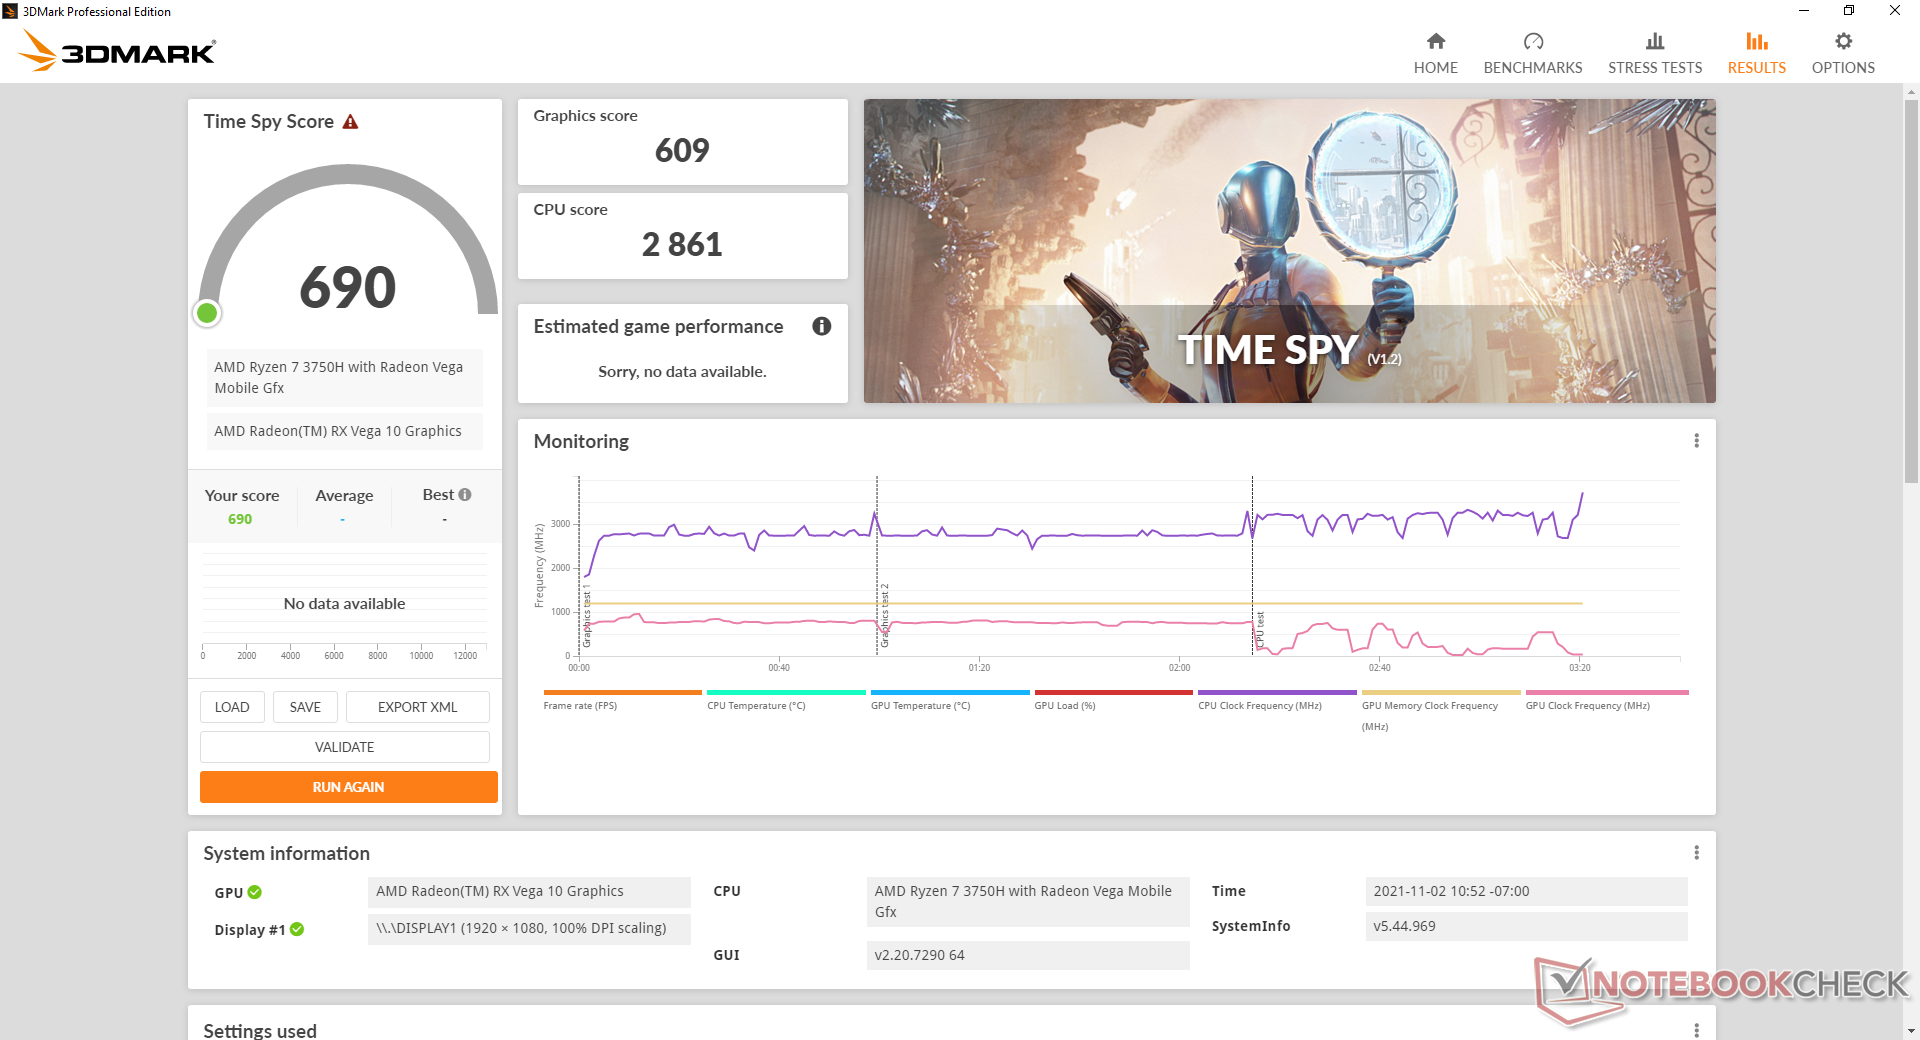
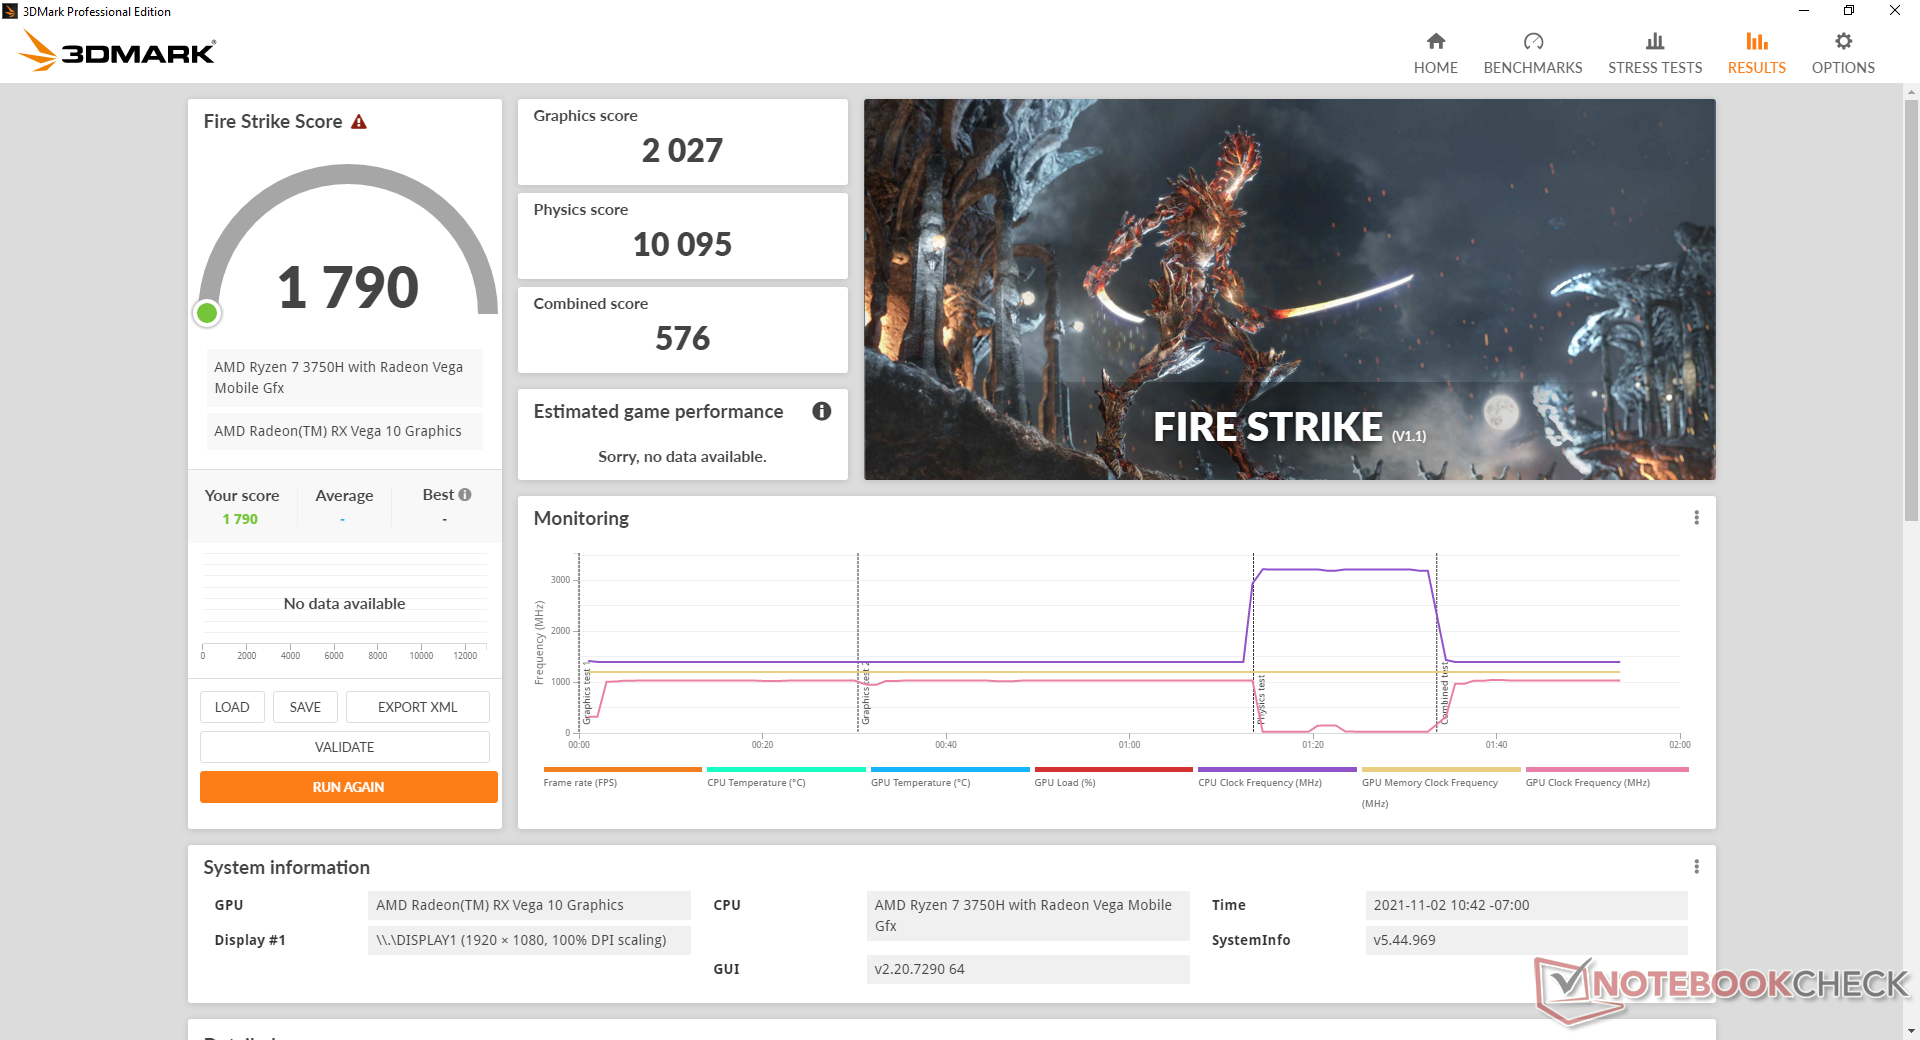
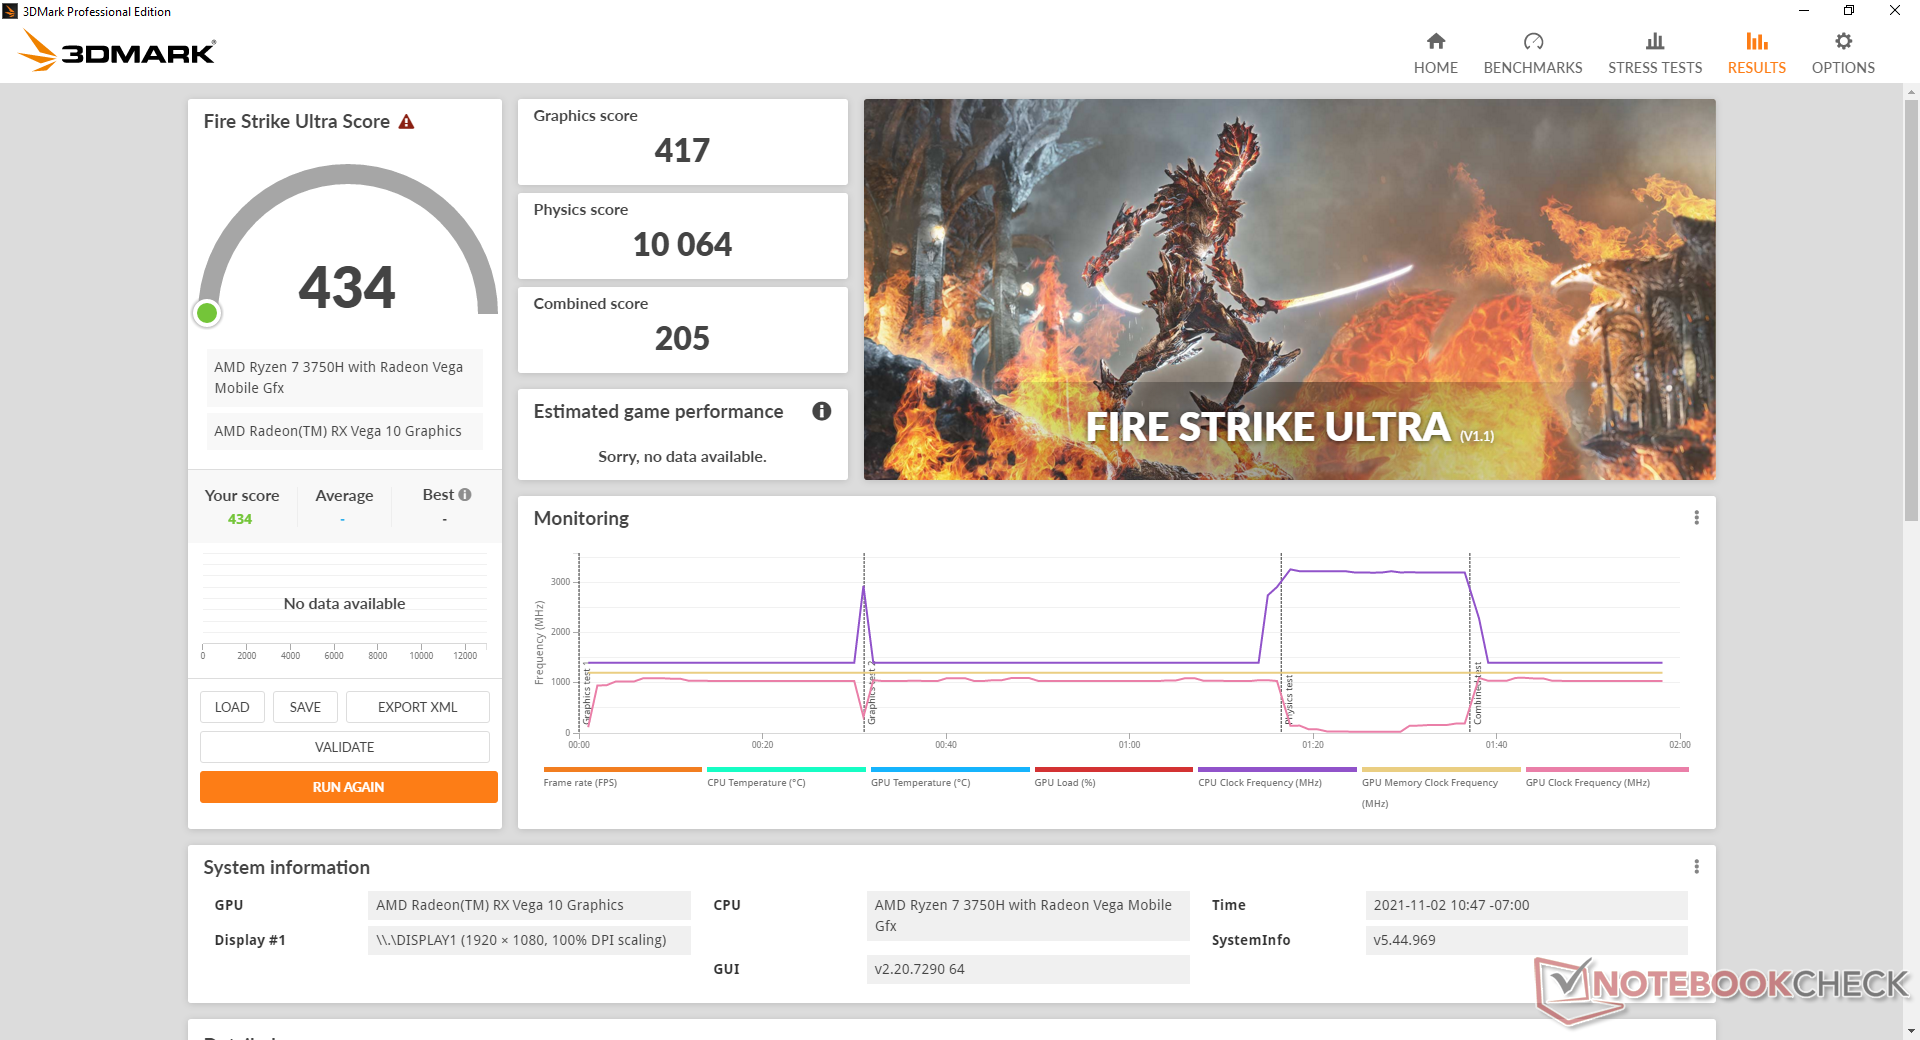
GPU Performance
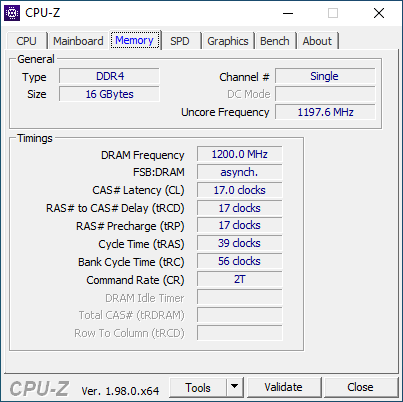
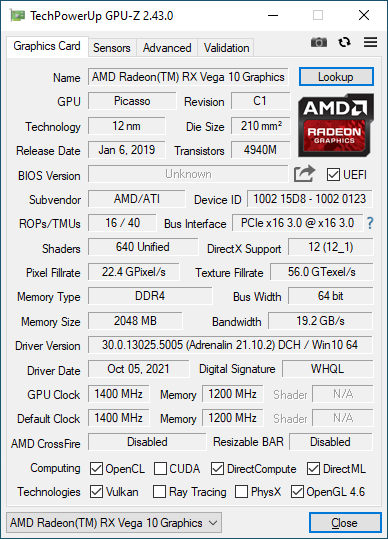
Graphics performance is most similar to the Iris Plus Graphics 655. While our Radeon RX Vega 10 is a decent upgrade over the UHD Graphics 620, it's still significantly slower than the latest Iris Xe NUC options from Intel. Overall performance is slightly slower than the average RX Vega 10 in our database because our SER3 test unit comes with single-channel RAM only. Users can squeeze more performance from the GPU if configured with dual-channel RAM.
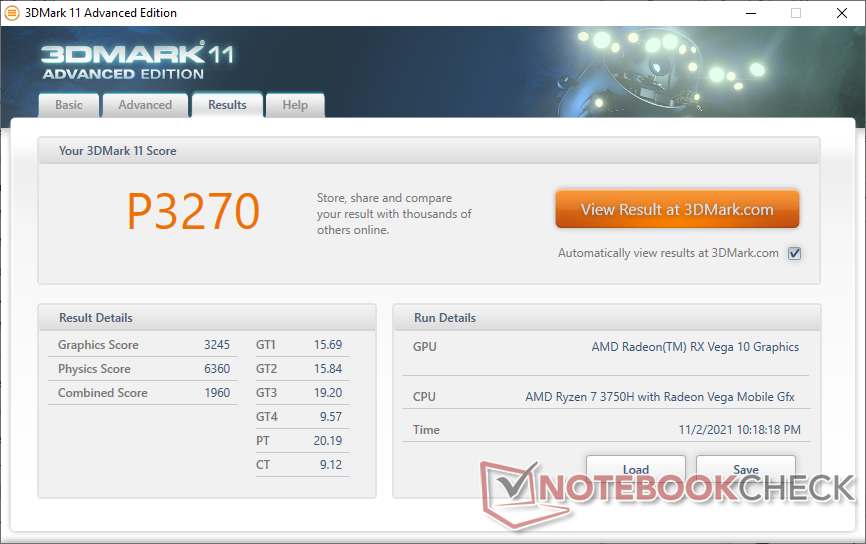
| 3DMark 11 Performance | 3270 points | |
| 3DMark Cloud Gate Standard Score | 11409 points | |
| 3DMark Fire Strike Score | 1790 points | |
| 3DMark Time Spy Score | 690 points | |
Help | ||
Witcher 3 FPS Chart
| low | med. | high | ultra | |
|---|---|---|---|---|
| GTA V (2015) | 51.8 | 46.3 | 13.2 | 6.76 |
| The Witcher 3 (2015) | 35.7 | 22.9 | 12.2 | 8 |
| Dota 2 Reborn (2015) | 67.4 | 52 | 30.1 | 28.3 |
| Final Fantasy XV Benchmark (2018) | 19 | 9.98 | 6.8 | |
| X-Plane 11.11 (2018) | 23.8 | 18.5 | 16.7 | |
| Far Cry 5 (2018) | 23 | 12 | 11 | 10 |
| Strange Brigade (2018) | 37.9 | 15.1 | 12.6 | 10.9 |
Emissions
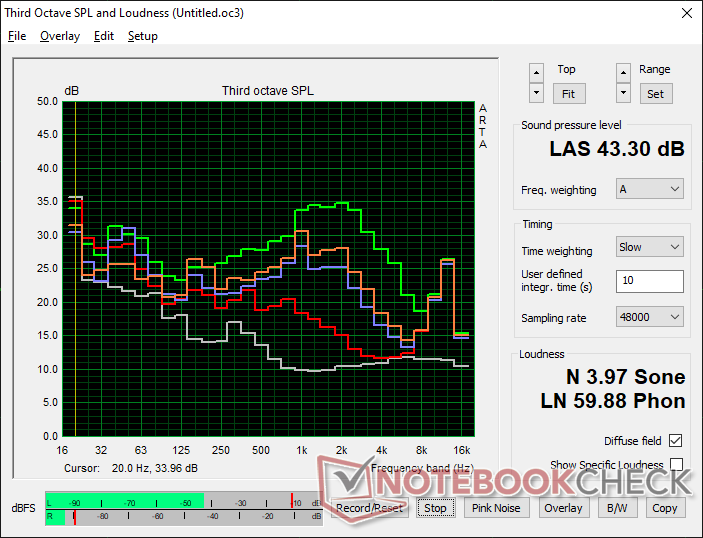
System Noise
The fan pulses frequently when running typical HTPC loads like browsing or video streaming. The pulsing isn't extreme at only up to 29.4 dB(A) against a silent background of 23.4 dB(A), but it's noticeable in a quiet office setting. It's thankfully not loud enough to be distracting during louder music or video playback.
Running higher loads like games can induce a fan noise of up to 37 to 43 dB(A) not unlike many U-series-powered Ultrabooks or the older Intel NUC8i7BE.
Noise level
| Idle |
| 23.4 / 23.4 / 29.4 dB(A) |
| Load |
| 35.2 / 43.3 dB(A) |
 | ||
30 dB silent 40 dB(A) audible 50 dB(A) loud |
||
min: | ||
| Beelink SER3 Vega 10, R7 3750H, GSemi AZW GSDFN512TS3F1OGCX | Beelink SEi10 UHD Graphics G1 (Ice Lake 32 EU), i3-1005G1, Silicon Motion AZW 256G M.2280 NVMe 4X 200725 D | Intel NUC8i7BE Iris Plus Graphics 655, i7-8559U | GMK NucBox 2 Iris Plus Graphics 655, i5-8259U, Netac S930E8/256GPN | Zotac ZBox MI643 UHD Graphics 620, i5-10210U, Lexar NM610 1TB | Intel NUC11TNKi5 Iris Xe G7 80EUs, i5-1135G7, Transcend M.2 SSD 430S TS512GMTS430S | |
|---|---|---|---|---|---|---|
| Noise | -23% | -13% | 1% | -4% | -21% | |
| off / environment * (dB) | 23.4 | 27.5 -18% | 28.7 -23% | 25.6 -9% | 26.1 -12% | 24.8 -6% |
| Idle Minimum * (dB) | 23.4 | 30.9 -32% | 28.7 -23% | 25.7 -10% | 27.5 -18% | 35.6 -52% |
| Idle Average * (dB) | 23.4 | 33.5 -43% | 29.3 -25% | 25.7 -10% | 27.5 -18% | 35.6 -52% |
| Idle Maximum * (dB) | 29.4 | 33.5 -14% | 31.8 -8% | 25.7 13% | 27.5 6% | 35.6 -21% |
| Load Average * (dB) | 35.2 | 38.5 -9% | 39 -11% | 35.3 -0% | 28.9 18% | 36.2 -3% |
| Witcher 3 ultra * (dB) | 37.2 | 39 -5% | 38 -2% | |||
| Load Maximum * (dB) | 43.3 | 51.6 -19% | 41.4 4% | 35.1 19% | 42 3% | 47.6 -10% |
* ... smaller is better
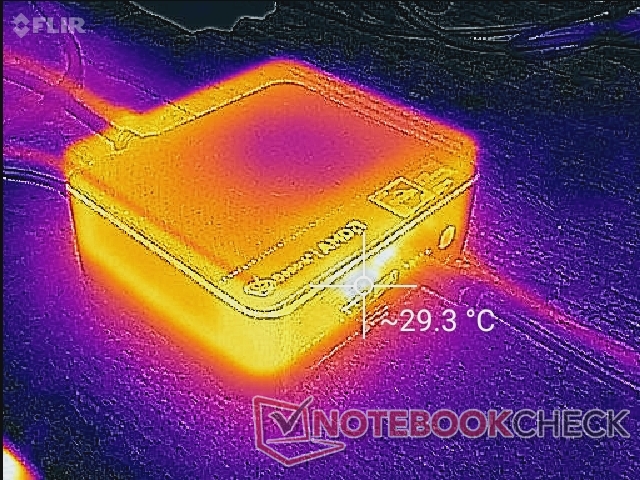
Temperature
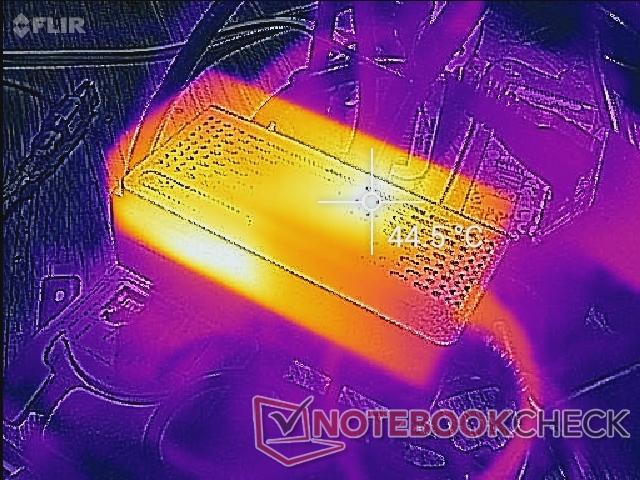
Surface temperatures are not an issue for the SER3. Warm air exits from the rear while cool air enters from atop and so we don't recommend stacking any books or papers on the mini PC.
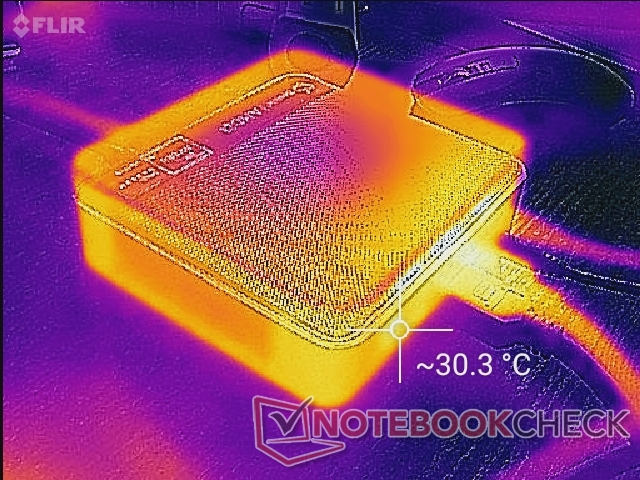
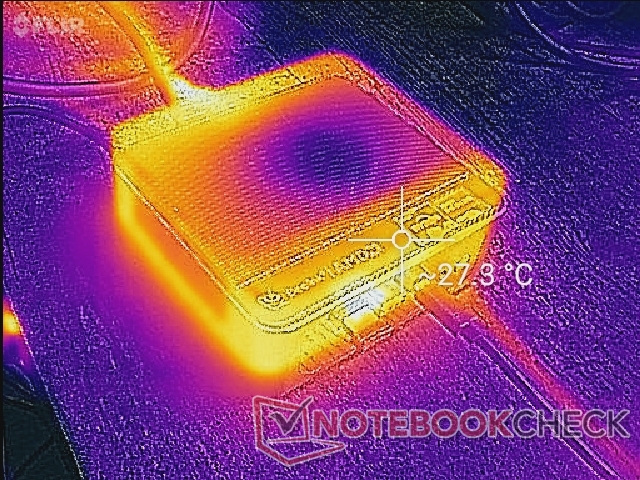
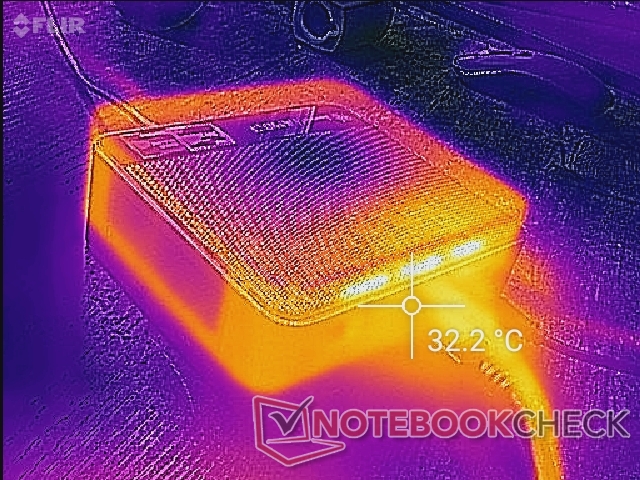
The AC adapter can get warmer than the mini PC itself when running high loads as shown by our temperature maps.
Stress Test
When running Prime95, CPU clock rates would boost to 3.3 GHz for the first minute or so until reaching a core temperature of 78 C. Clock rates would then fall to 3.0 GHz in order to maintain a cooler core temperature of 72 C.
Core temperature is relatively cool at only 56 C when running Witcher 3 compared to 62 C on the Intel NUC11TNKi5 Pro.
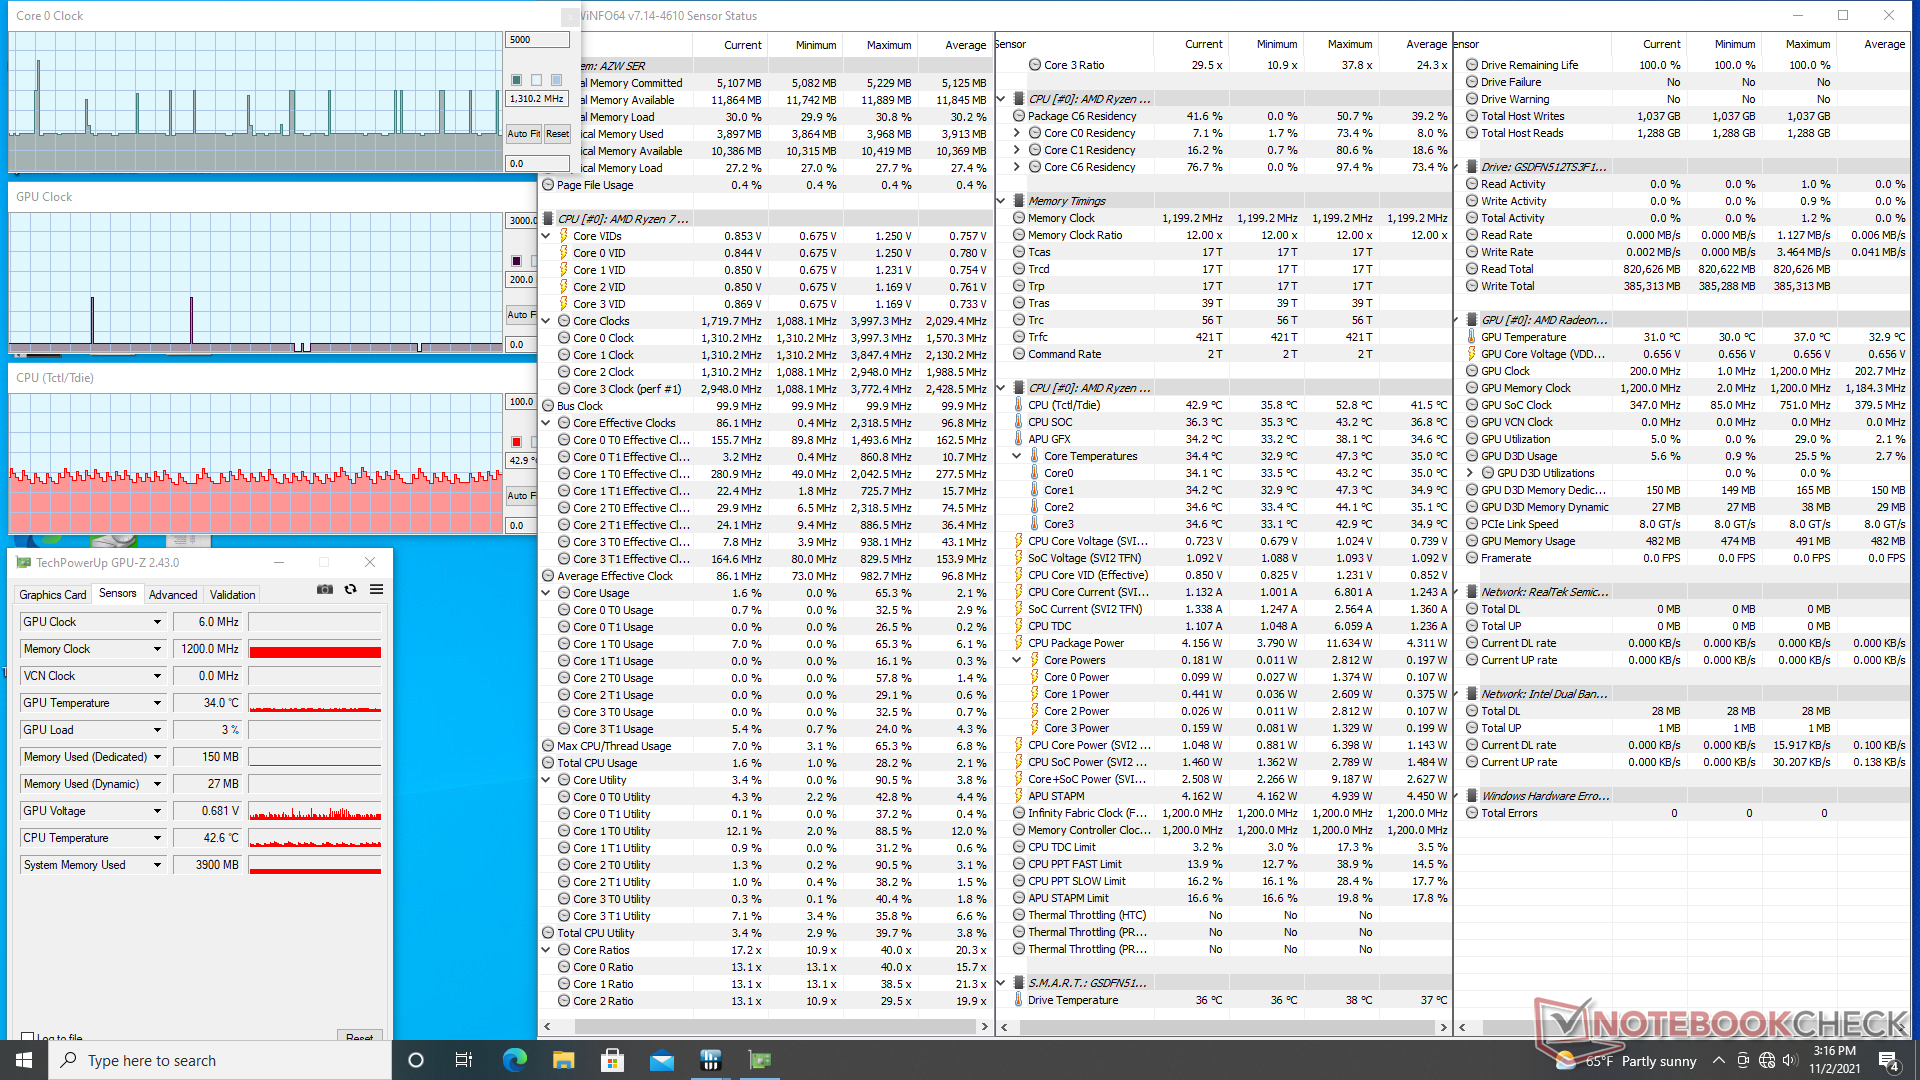
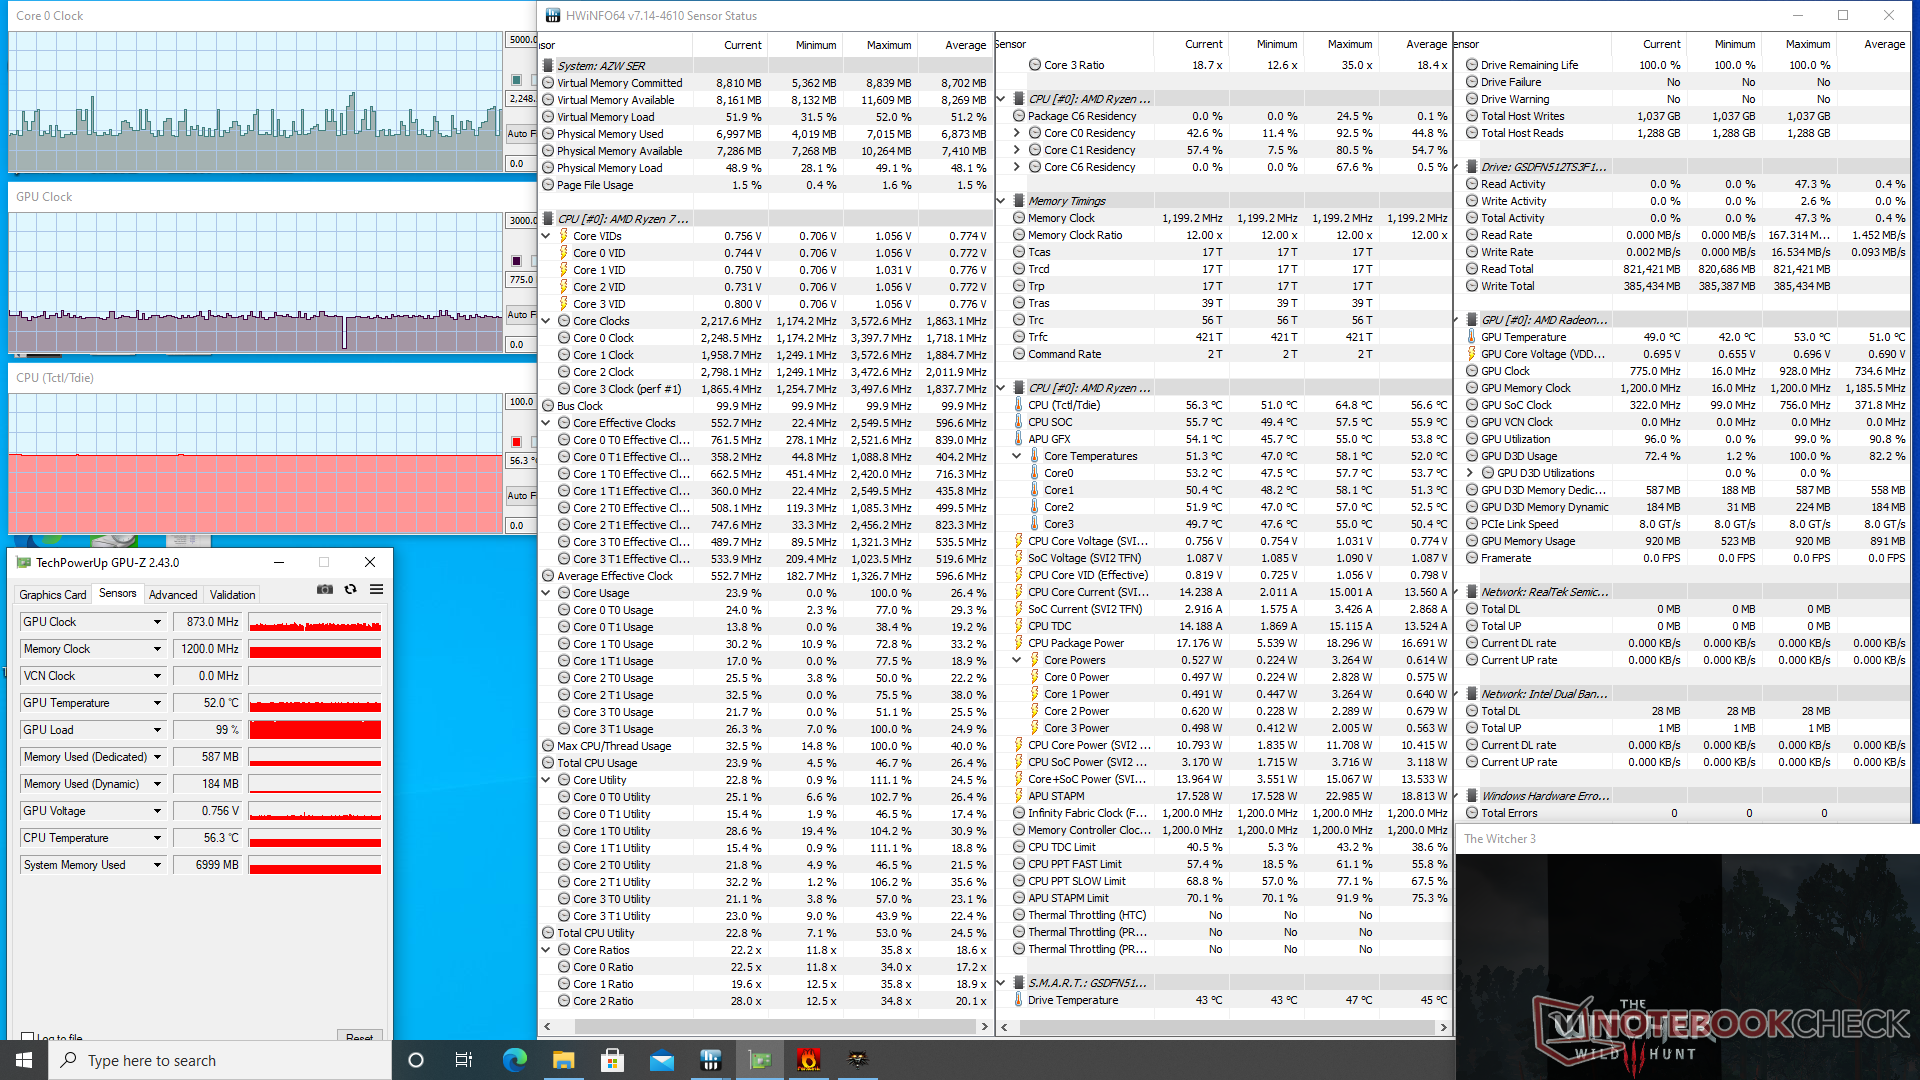
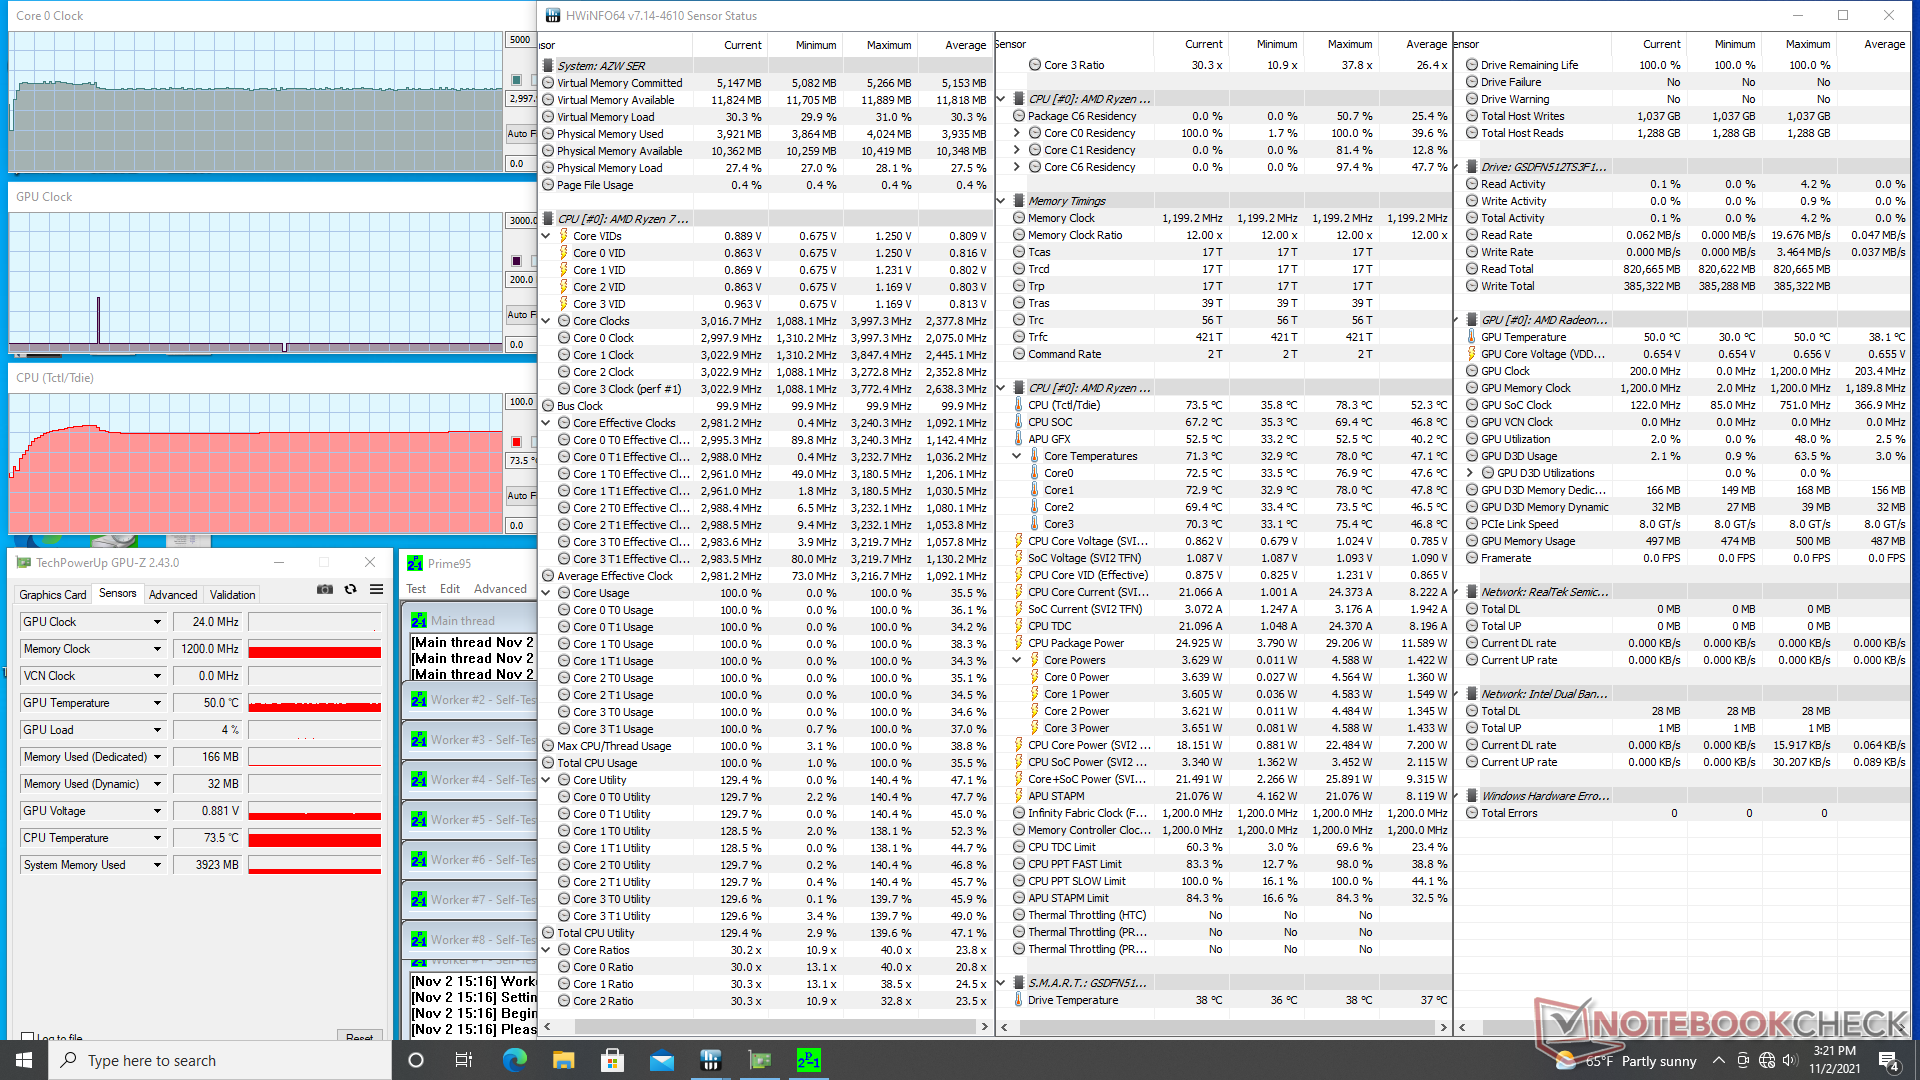
| CPU Clock (GHz) | GPU Clock (MHz) | Average CPU Temperature Tctl/Tdie (°C) | |
| System Idle | -- | -- | 43 |
| Prime95 Stress | 3.0 | -- | 74 |
| Prime95 + FurMark Stress | 2.7 | 749 | 73 |
| Witcher 3 Stress | 0.3 - 0.8 | ~873 | 56 |
Energy Management
Power Consumption
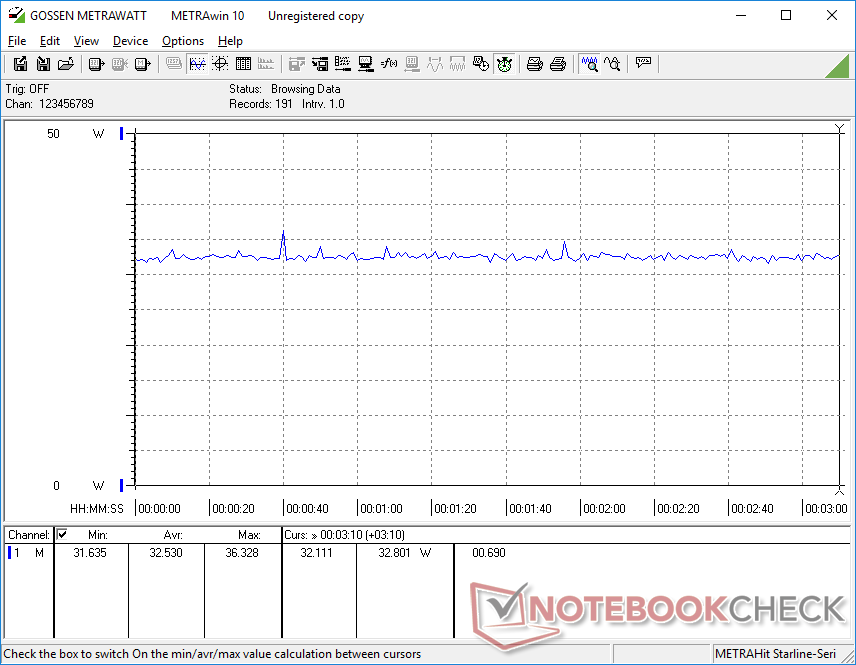
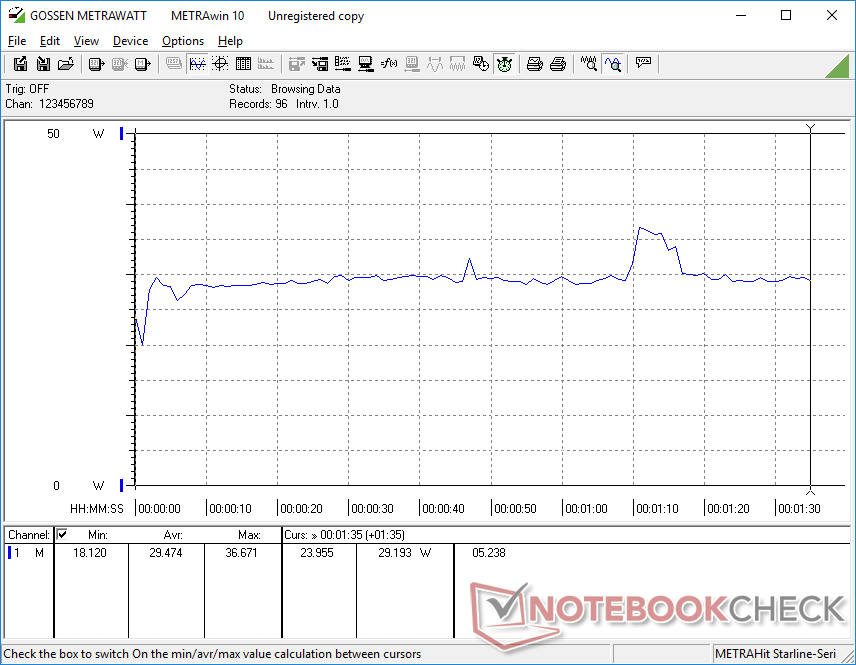
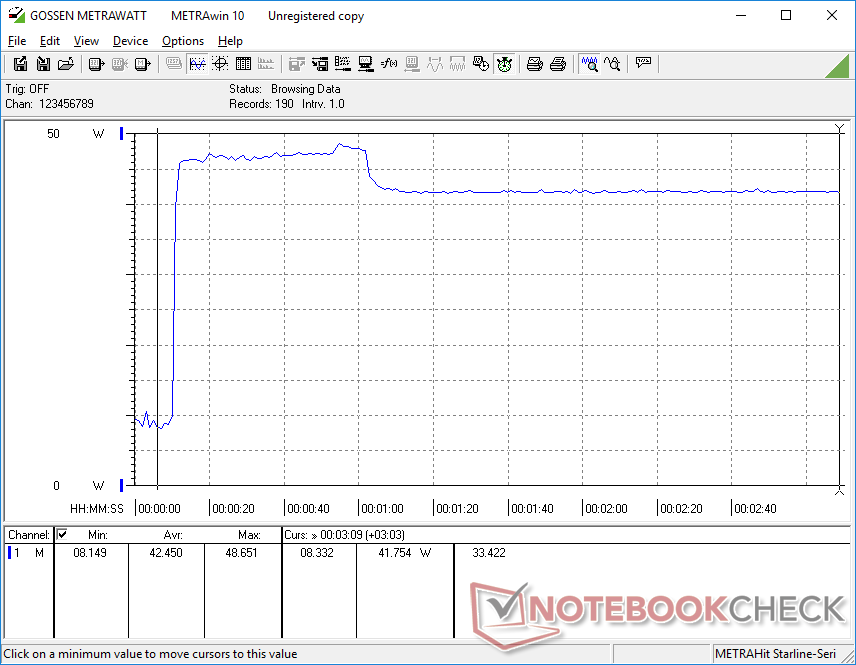
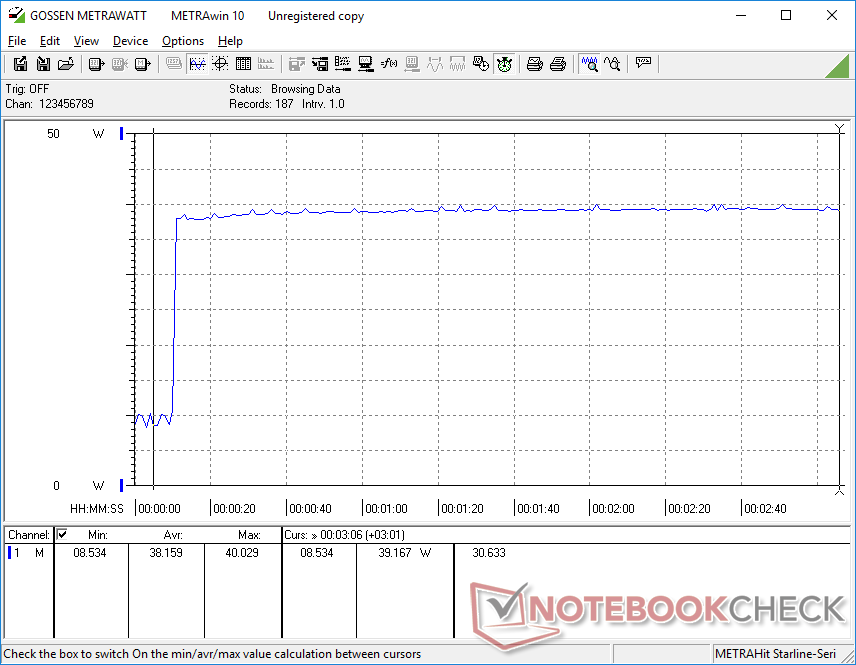
Power consumption when idling on desktop is slightly higher than most other mini PCs running on Core U-series CPUs since our SER3 utilizes a more demanding H-series processor. Nonetheless, power consumption when running higher loads is lower than expected at just 30 W to 40 W on average.
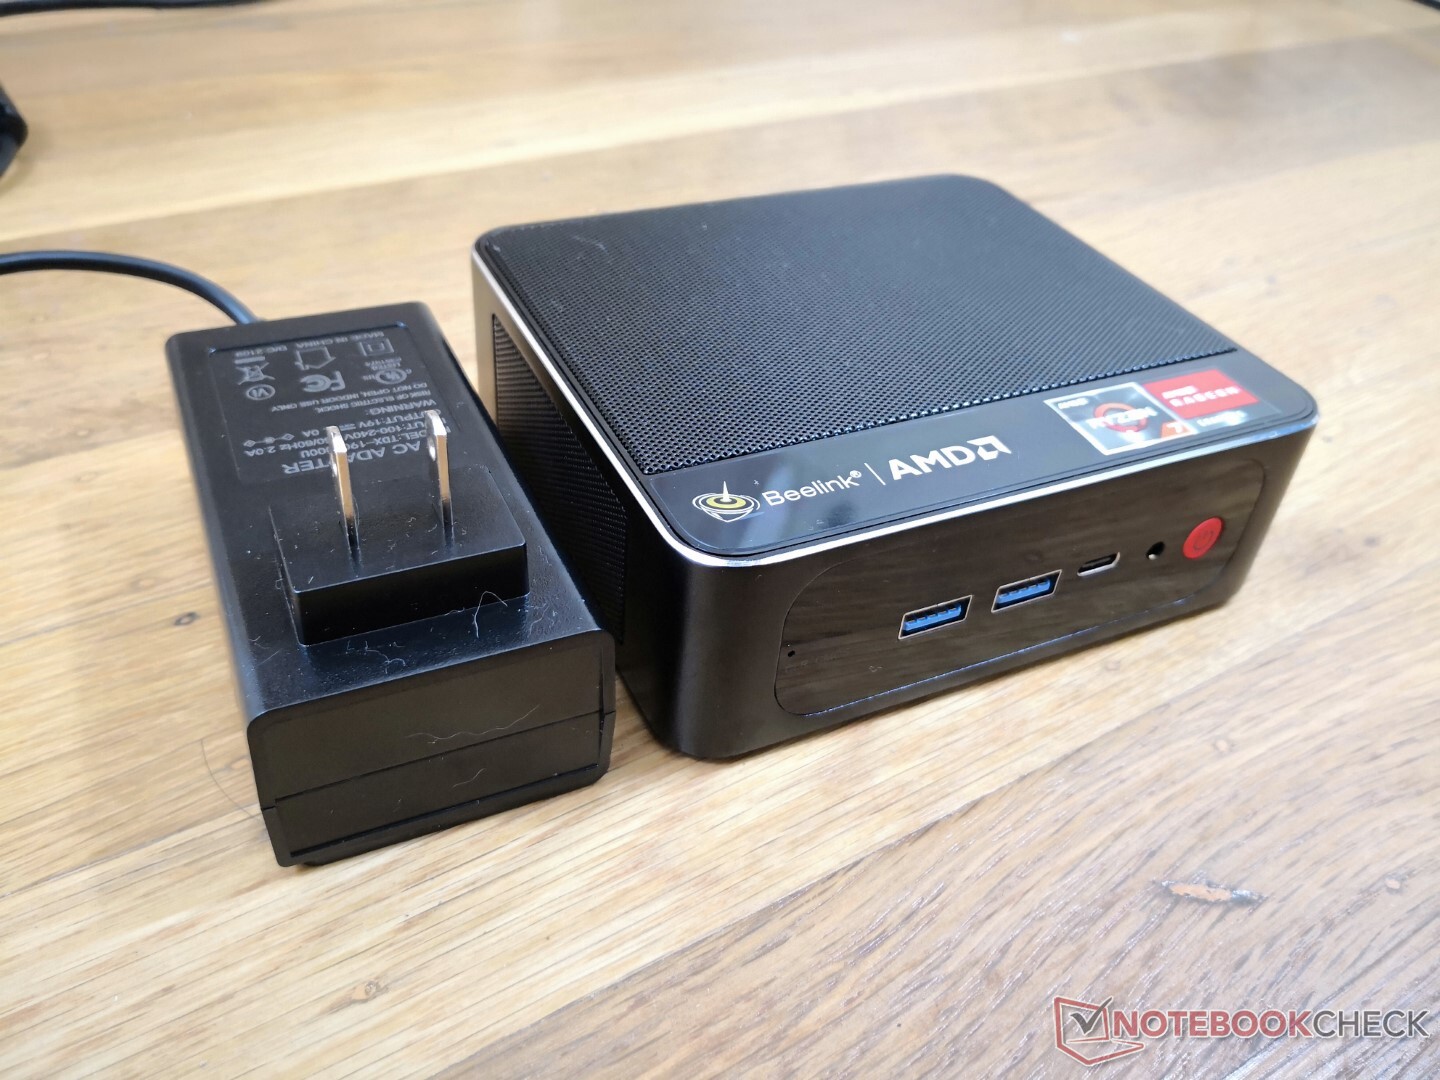
We're able to record a maximum of just under 49 W from the medium-sized (~10 x 5 x 6 cm including prongs) 57 W AC adapter when at 100 percent CPU utilization. This rate falls after about a minute due to thermal limitations.
| Off / Standby | |
| Idle | |
| Load |
|
Key:
min: | |
| Beelink SER3 R7 3750H, Vega 10, GSemi AZW GSDFN512TS3F1OGCX, , x, | Beelink SEi10 i3-1005G1, UHD Graphics G1 (Ice Lake 32 EU), Silicon Motion AZW 256G M.2280 NVMe 4X 200725 D, , x, | Intel NUC8i7BE i7-8559U, Iris Plus Graphics 655, , , x, | GMK NucBox 2 i5-8259U, Iris Plus Graphics 655, Netac S930E8/256GPN, , x, | Zotac ZBox MI643 i5-10210U, UHD Graphics 620, Lexar NM610 1TB, , x, | Intel NUC11TNKi5 i5-1135G7, Iris Xe G7 80EUs, Transcend M.2 SSD 430S TS512GMTS430S, , x, | |
|---|---|---|---|---|---|---|
| Power Consumption | 17% | -8% | 0% | -10% | -43% | |
| Idle Minimum * (Watt) | 7 | 6.3 10% | 2.7 61% | 6.1 13% | 7.5 -7% | 11.5 -64% |
| Idle Average * (Watt) | 9.1 | 6.6 27% | 3.1 66% | 6.8 25% | 9.2 -1% | 12.4 -36% |
| Idle Maximum * (Watt) | 9.7 | 6.7 31% | 6.3 35% | 7.3 25% | 9.6 1% | 12.9 -33% |
| Load Average * (Watt) | 29.5 | 25.9 12% | 59.7 -102% | 46.3 -57% | 34.4 -17% | 40.7 -38% |
| Witcher 3 ultra * (Watt) | 32.5 | 47.2 -45% | 43.9 -35% | |||
| Load Maximum * (Watt) | 48.7 | 46.7 4% | 78 -60% | 50.7 -4% | 60.6 -24% | 73.5 -51% |
* ... smaller is better
Power Consumption Witcher 3 / Stresstest
Pros
Cons
Verdict
For less than $500 USD, users are getting an HTPC-ready mini PC with a performance level similar to the Core i5-8259U in some Intel NUCs. The system is several steps up from other inexpensive mini PCs running on Atom or Celeron CPUs like the Chuwi LarkBox or GBox which are notoriously slow even when running undemanding applications. We appreciate that Beelink is offering the SER3 as ready-to-go PCs complete with RAM and storage whereas Intel NUCs are almost always sold as barebone SKUs.
The Beelink SER3 is an easy-to-use discreet HTPC with accessible upgrade options. Be prepared for a bit of fan noise especially when running very demanding applications.
Buyers should be aware that the SER3 omits a handful of auxiliary features likely to keep costs low. There is no Kensington lock, SD reader, IR receiver, or Thunderbolt support while DP-over-USB-C can be unreliable. The fan pulses frequently and the wall wart AC adapter is both thick and short. The included NVMe SSD, while decently fast, will throttle in performance when stressed due to the lack of a built-in heat spreader.
Price and Availability
The Beelink SER3 can be found on Amazon for $479 USD with 8 GB RAM and 256 GB SSD or $559 USD with double the RAM and storage.
Price comparison
