

Beelink GT-R Mini Desktop Review
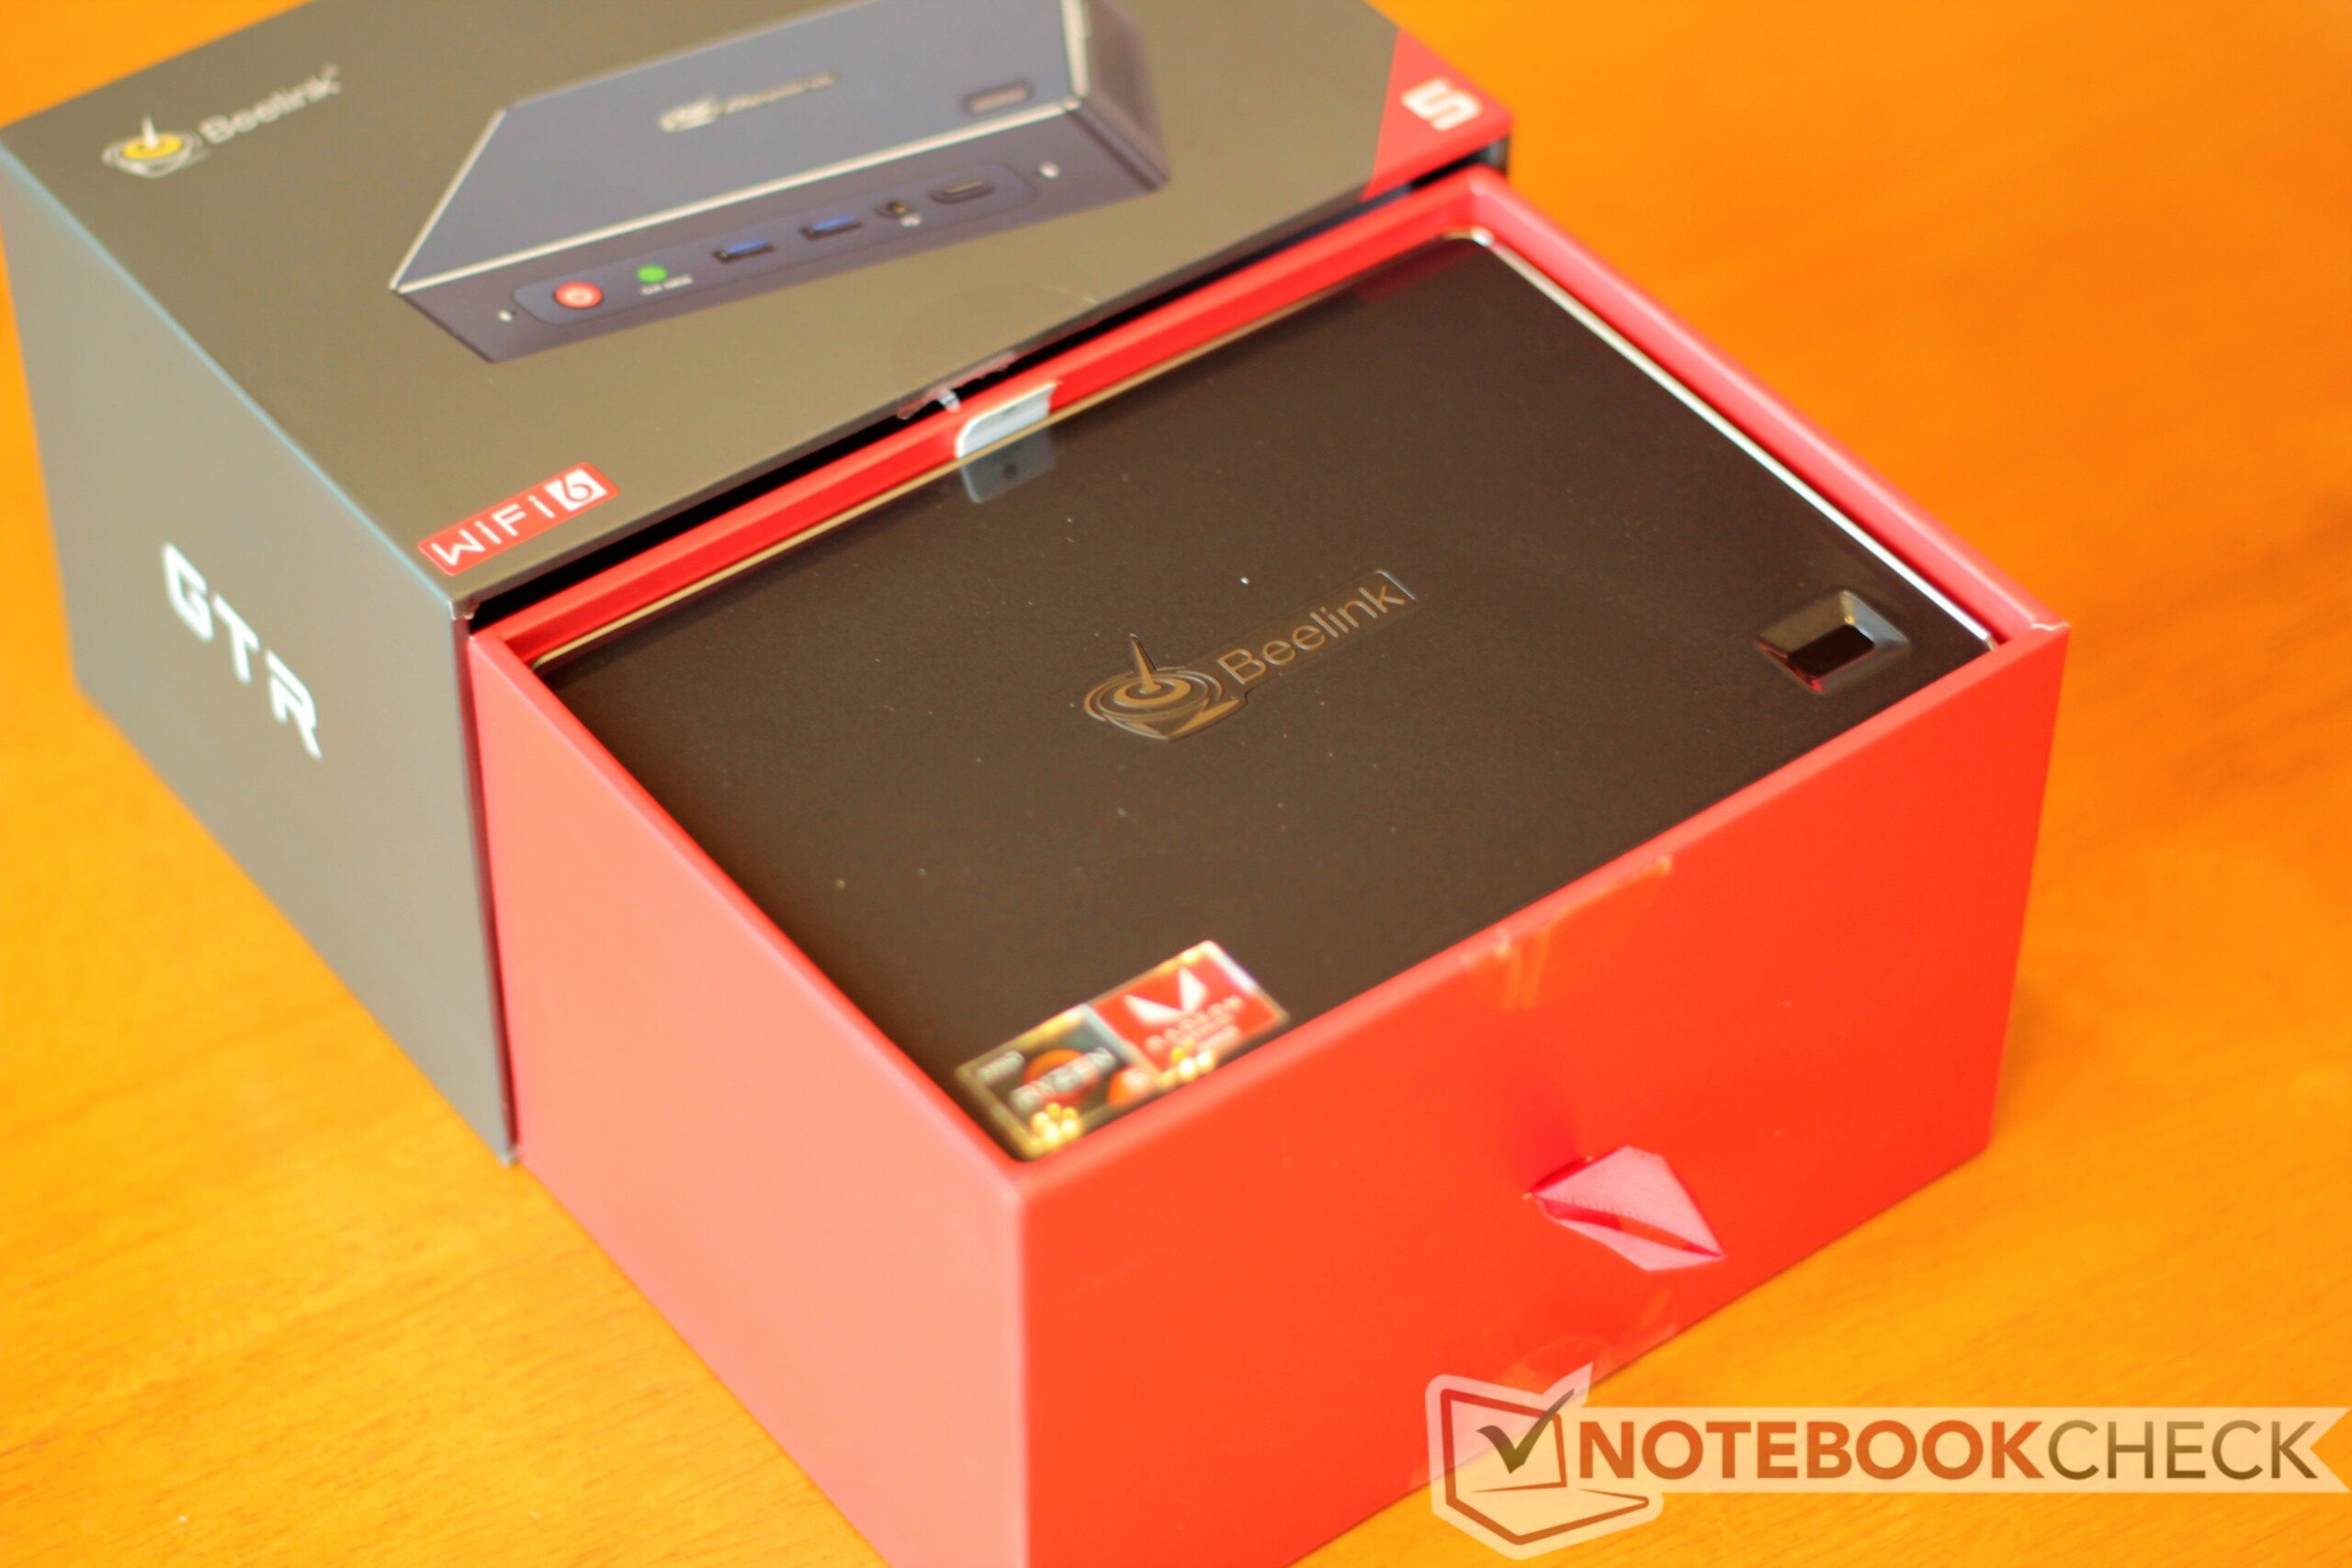
Beelink is a small Shenzen-based company that manufactures mini desktop PCs and tiny Android TV boxes. Today's review device, the GT-R, is one of their latest small form factor (SFF) Windows desktops. While technically one of the largest devices Beelink makes, the GT-R is a compact computer that takes up about a third of the desk space of a full-sized keyboard.
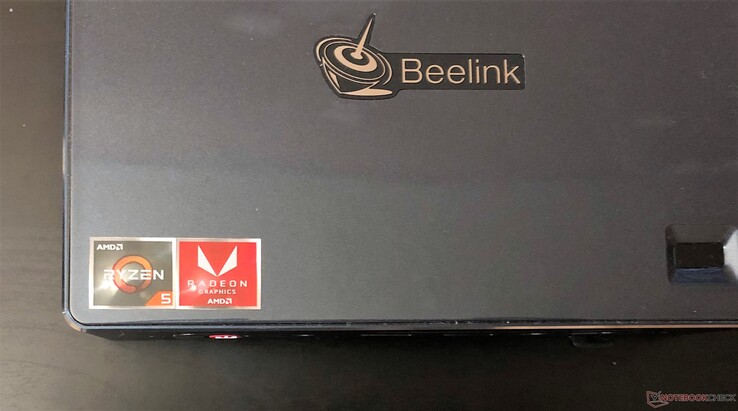
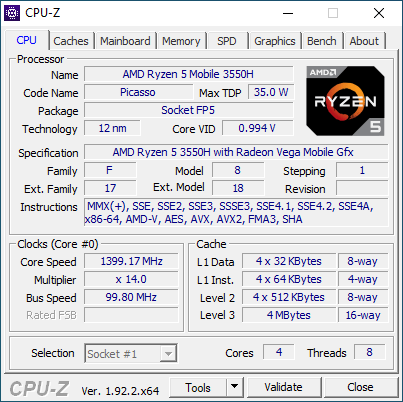
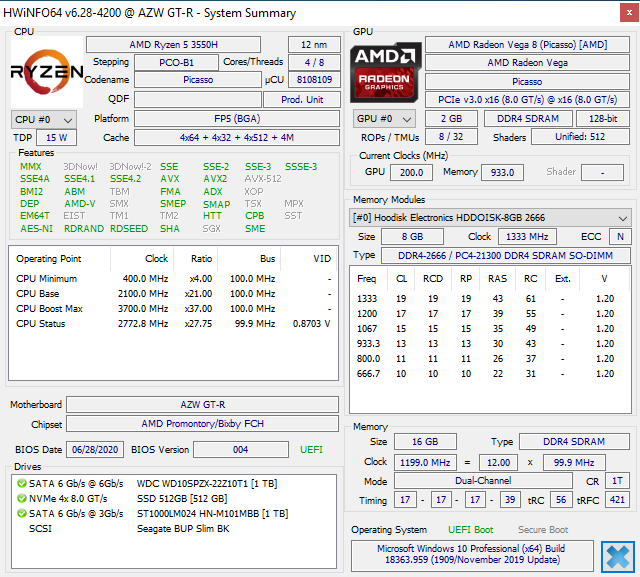
The GT-R runs on an AMD Ryzen 5 3550H with an embedded Radeon RX Vega 8 GPU. This APU is designed for laptops, notably the Asus TUF Gaming FX705, but we will see if it feels at home in a small desktop PC and examine how much power can fit in such a small case.
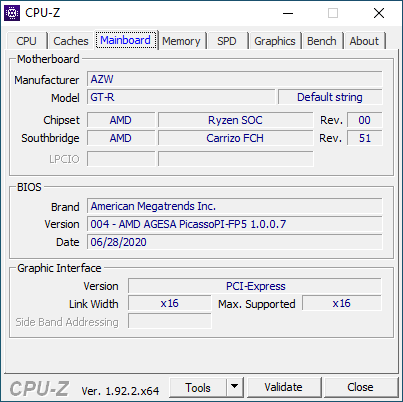
Beelink does not sell the GT-R directly, opting instead for third-party sellers like Geekbuying and Gearbest. Most of these sellers offer the GT-R in various configurations, allowing buyers to choose what RAM and storage options they want. The GT-R can also be bought as a barebones kit for about US $400. This option requires the buyer to provide their own RAM and storage drives. All options come with the Ryzen 5 3550H/Radeon RX Vega 8 APU, which is soldered to the motherboard.
The mini PC market has some notable devices that stack up well against the GT-R. We will compare the Zotac ZBOX-CI660 Nano (i7-8550U), Intel NUC Kit NUC8i7BEH (i7-8559U), and the Intel Hades Canyon NUC8i7HVK (i7-8809G).
Rating | Date | Model | Weight | Height | Size | Resolution | Price |
|---|---|---|---|---|---|---|---|
v (old) | 08 / 2020 | Beelink GTR35 II-G-16512D00W64PRO-1T R5 3550H, Vega 8 | 843 g | 39 mm | x | ||
v (old) | 09 / 2018 | Zotac ZBOX-CI660 Nano i5-8550U, UHD Graphics 620 | 1.1 kg | 68 mm | x | ||
v (old) | 02 / 2020 | Intel NUC10i7FNH i7-10710U, UHD Graphics 620 | 697 g | 51 mm | 0.00" | 0x0 | |
v (old) | 02 / 2020 | Intel NUC10i5FNK i5-10210U, UHD Graphics 620 | 493 g | 36 mm | 0.00" | 0x0 | |
v (old) | 11 / 2018 | Intel NUC8i7BE i7-8559U, Iris Plus Graphics 655 | 683 g | 51 mm | x | ||
v (old) | 03 / 2018 | Intel Hades Canyon NUC8i7HVK i7-8809G, Vega M GH | 1.3 kg | 39 mm | x |
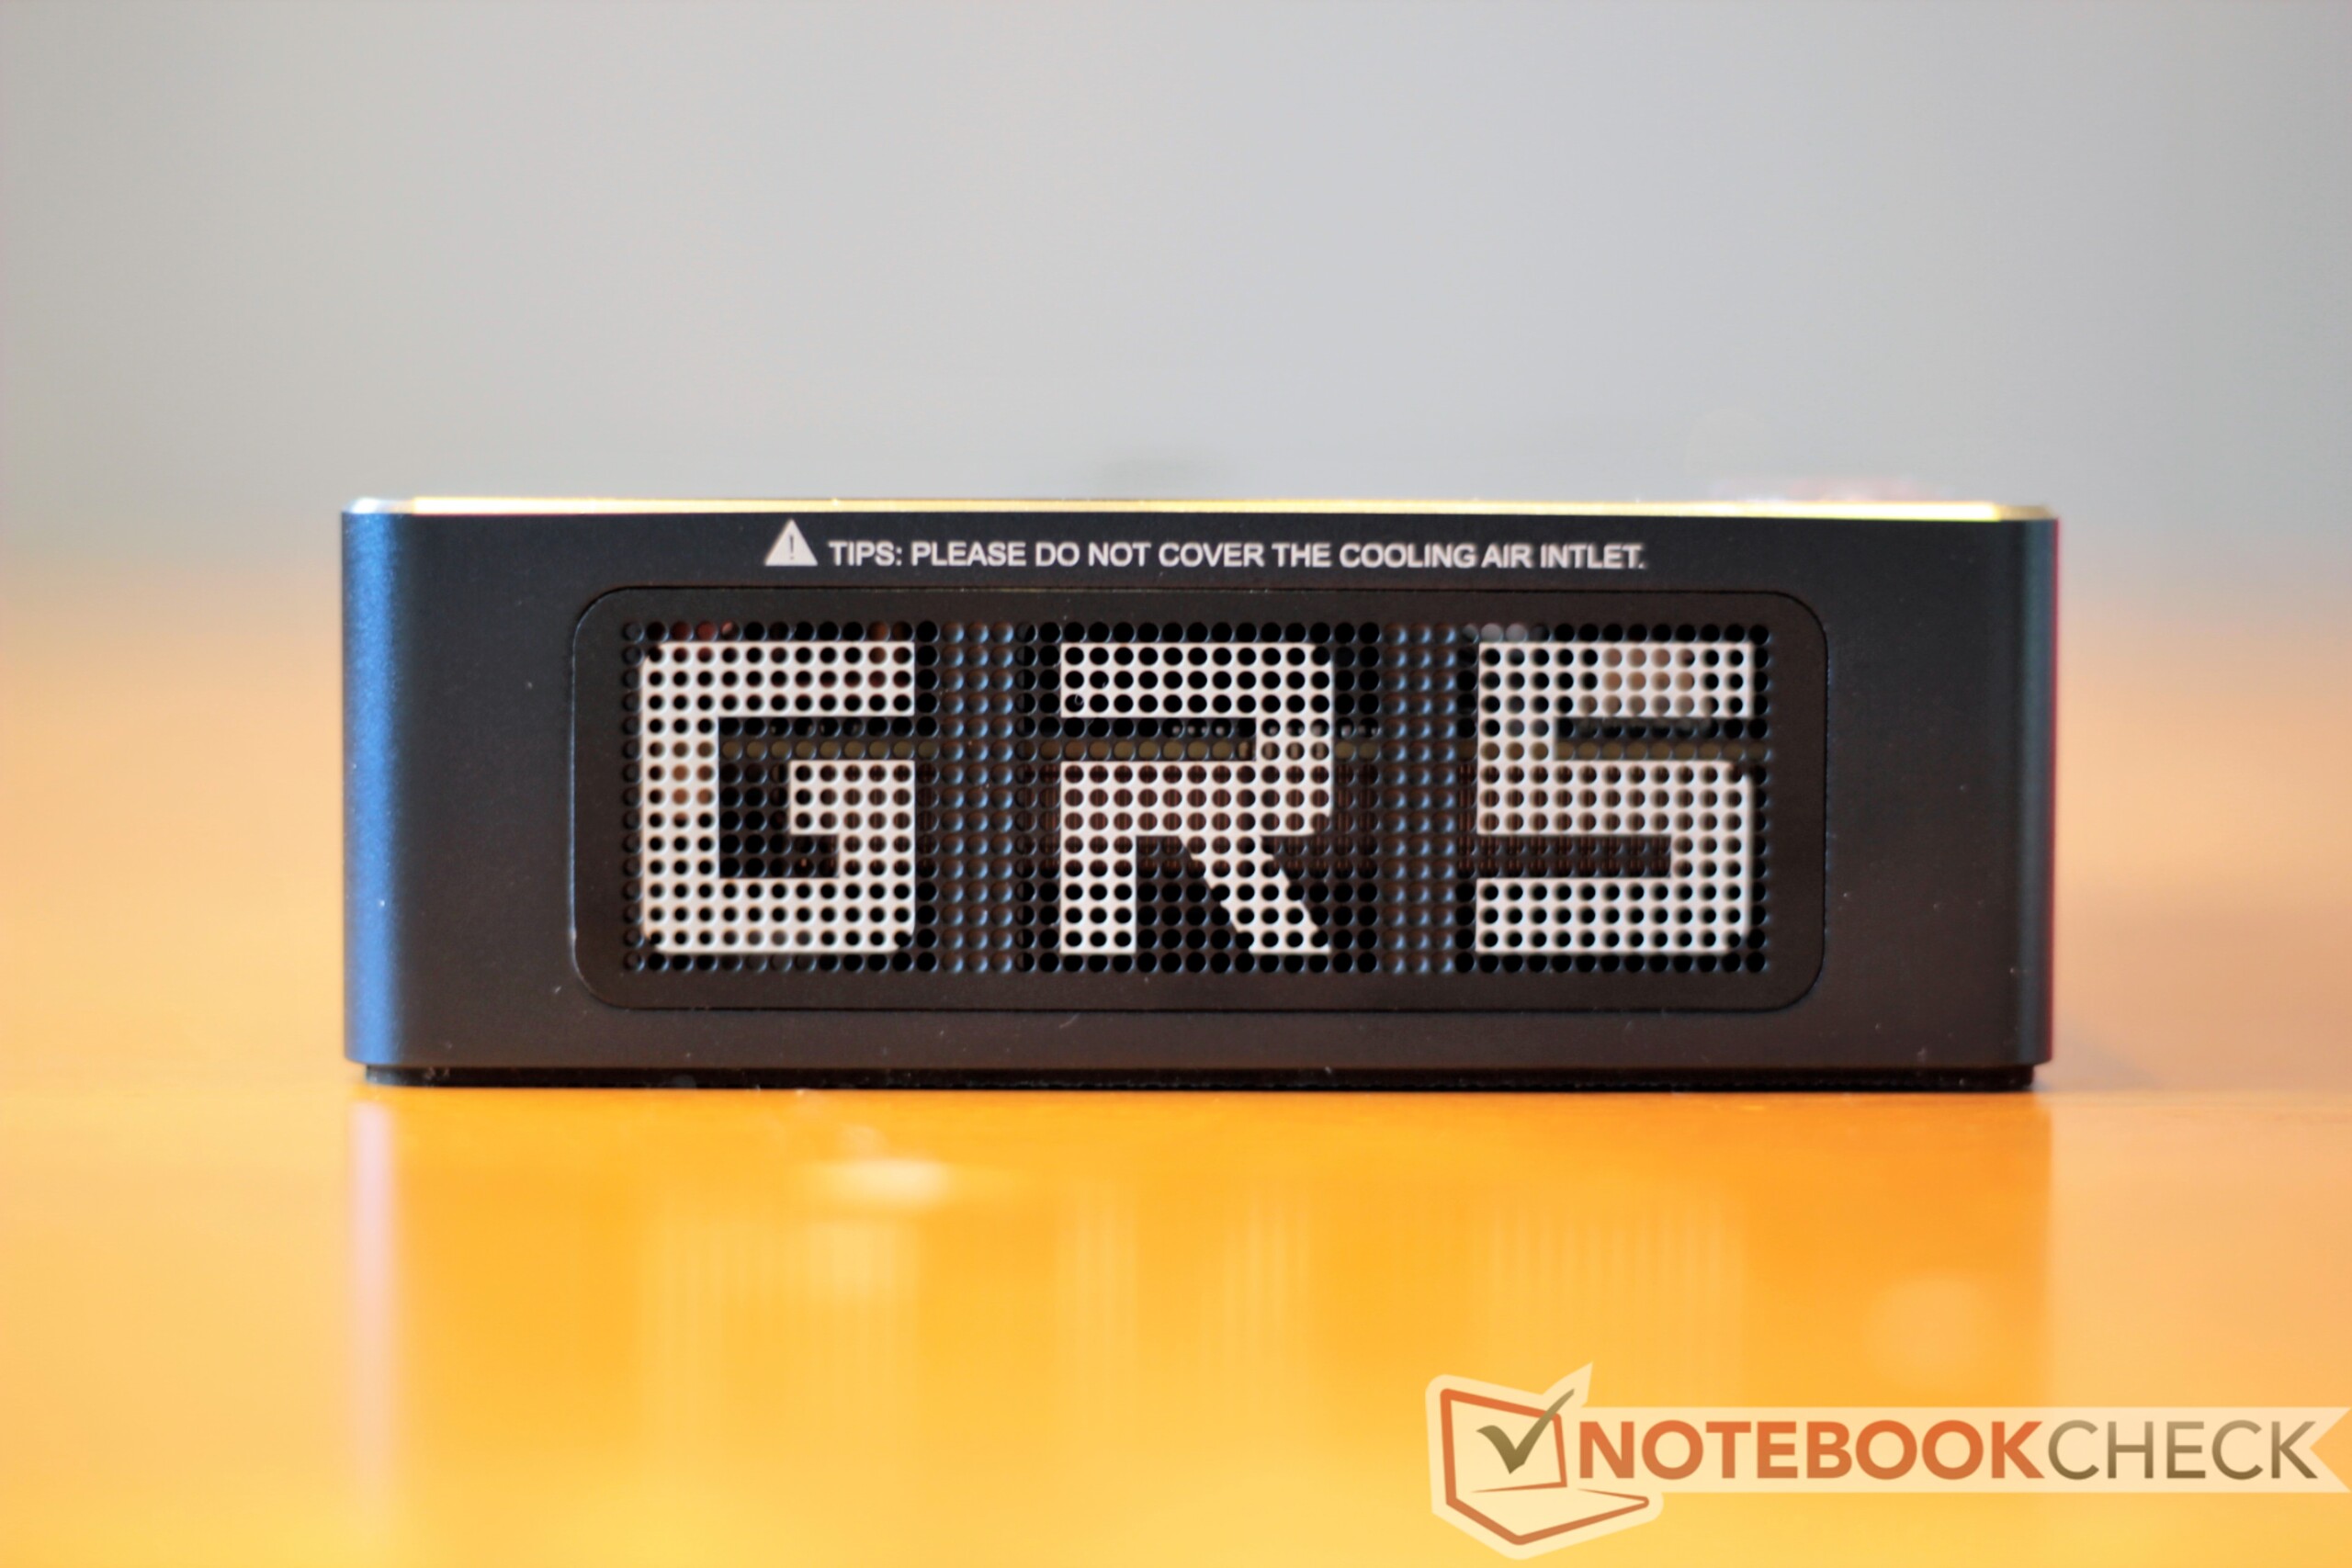
Case and Connectivity
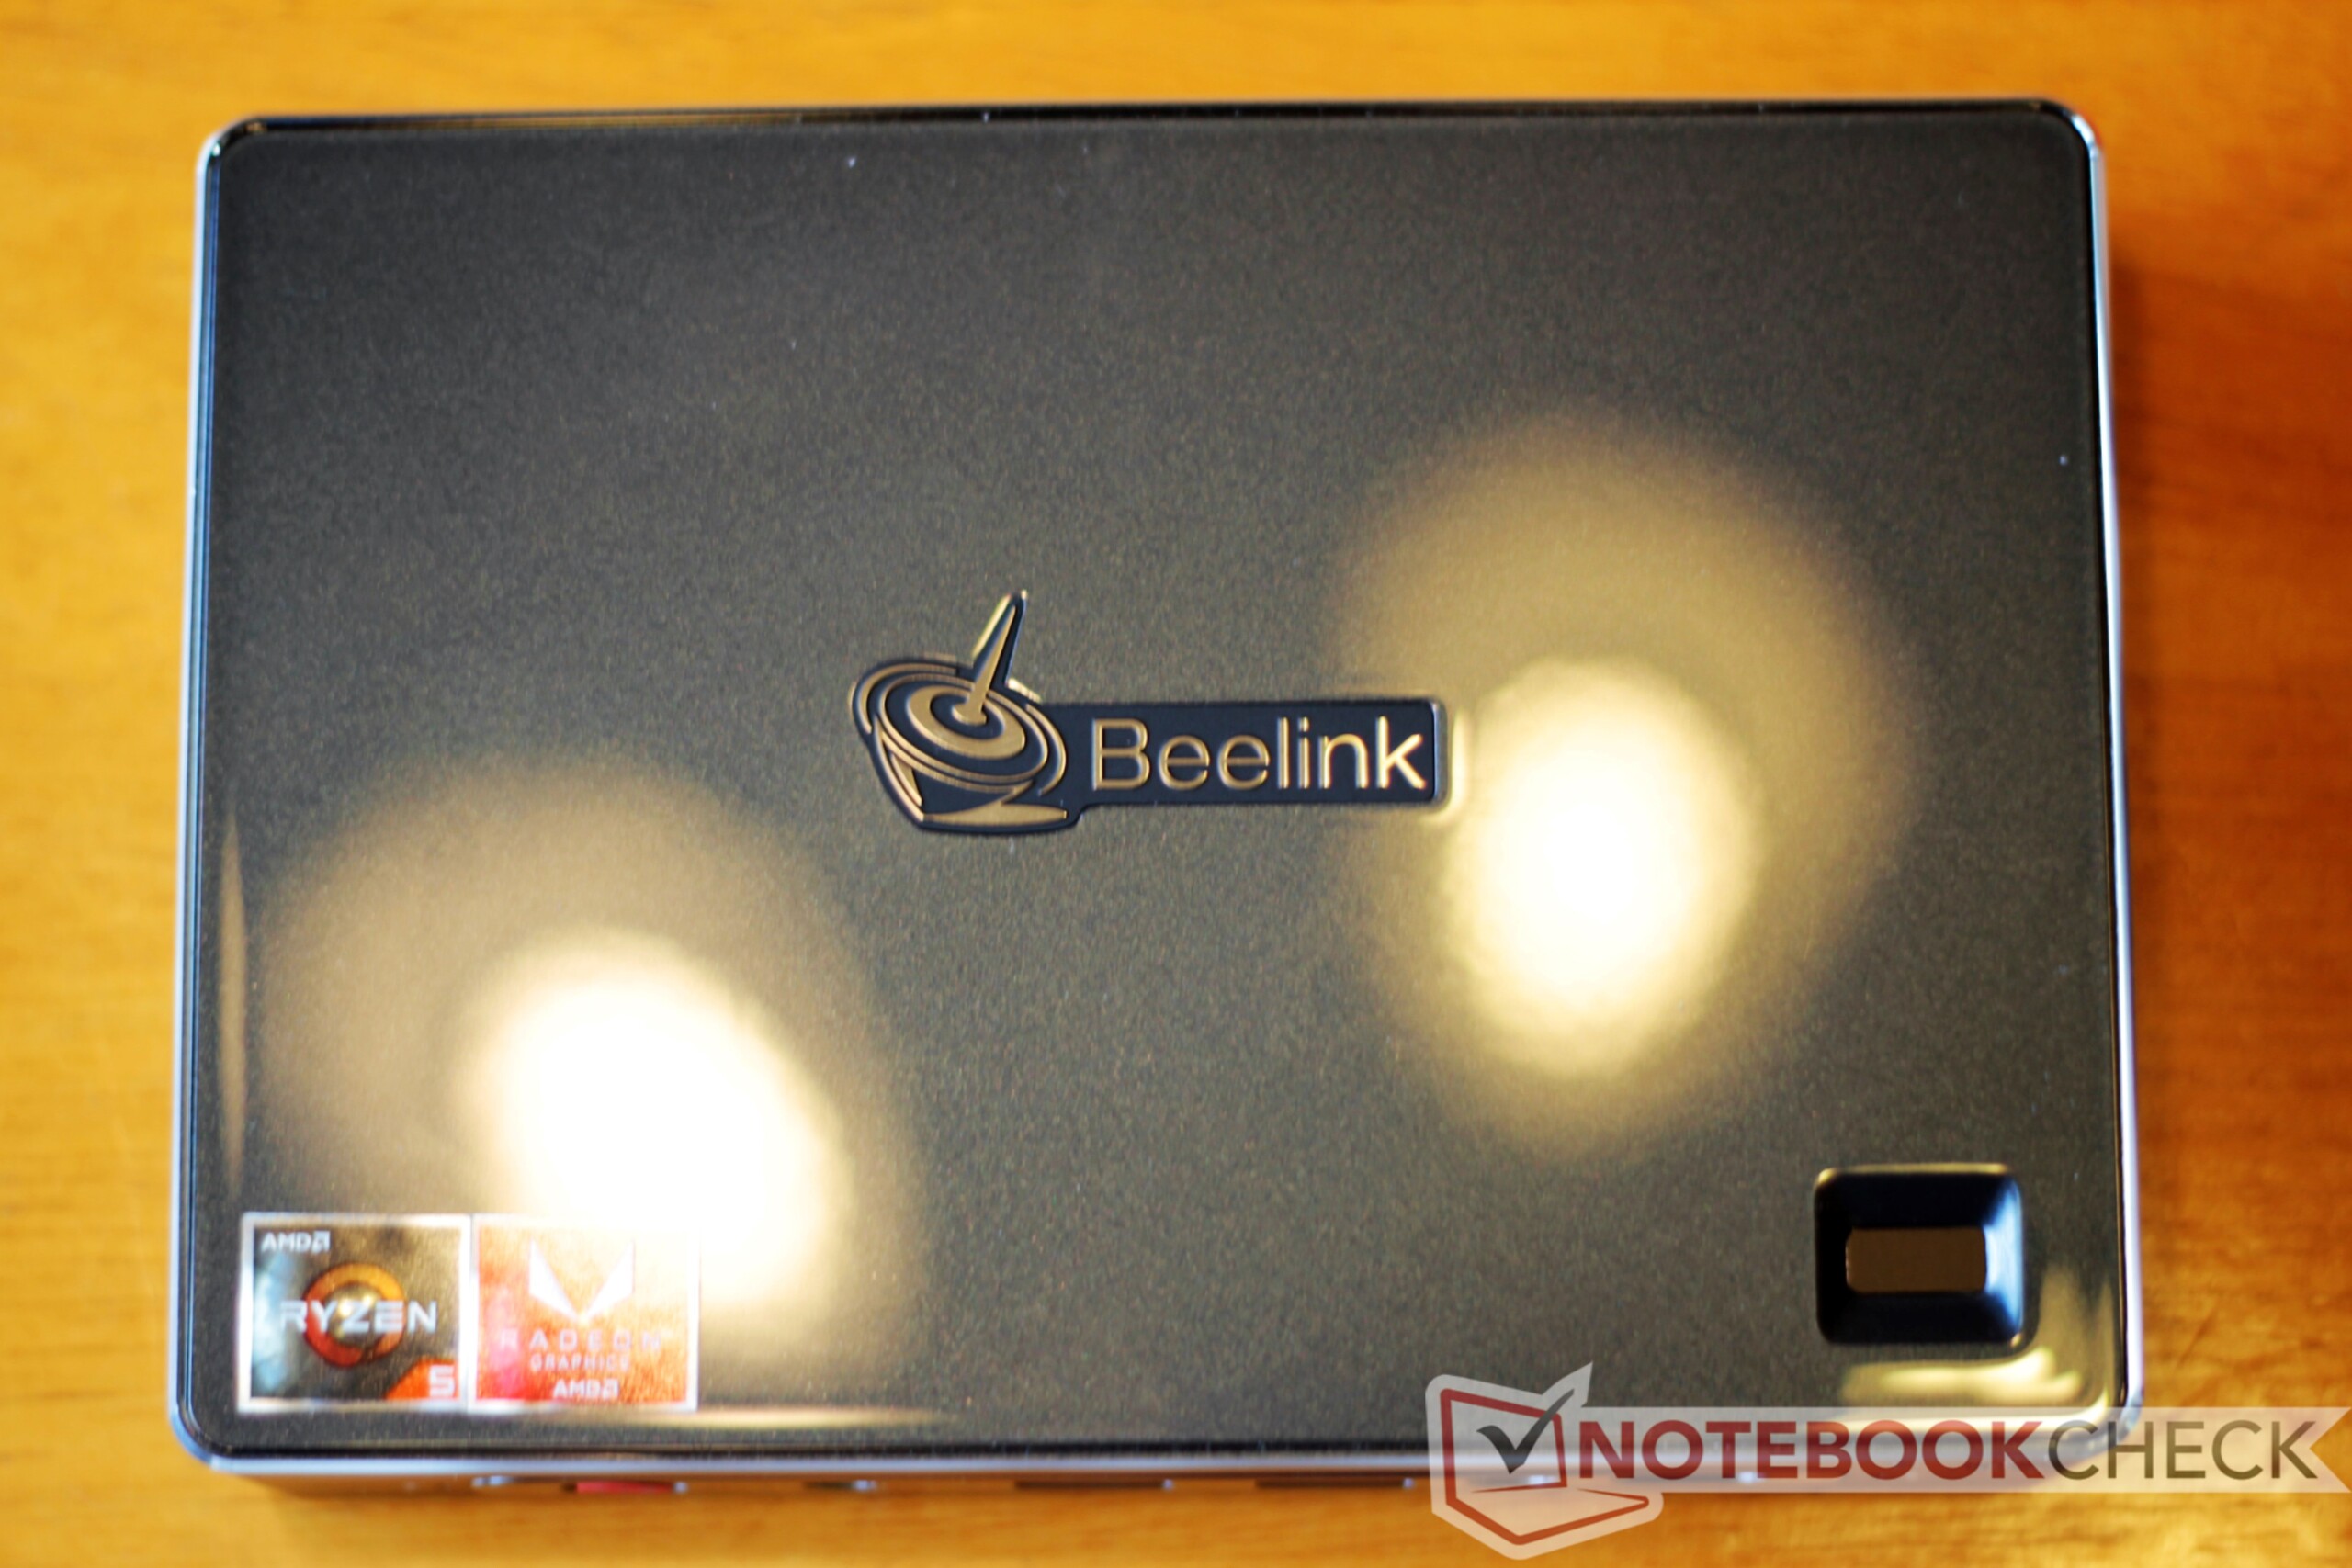
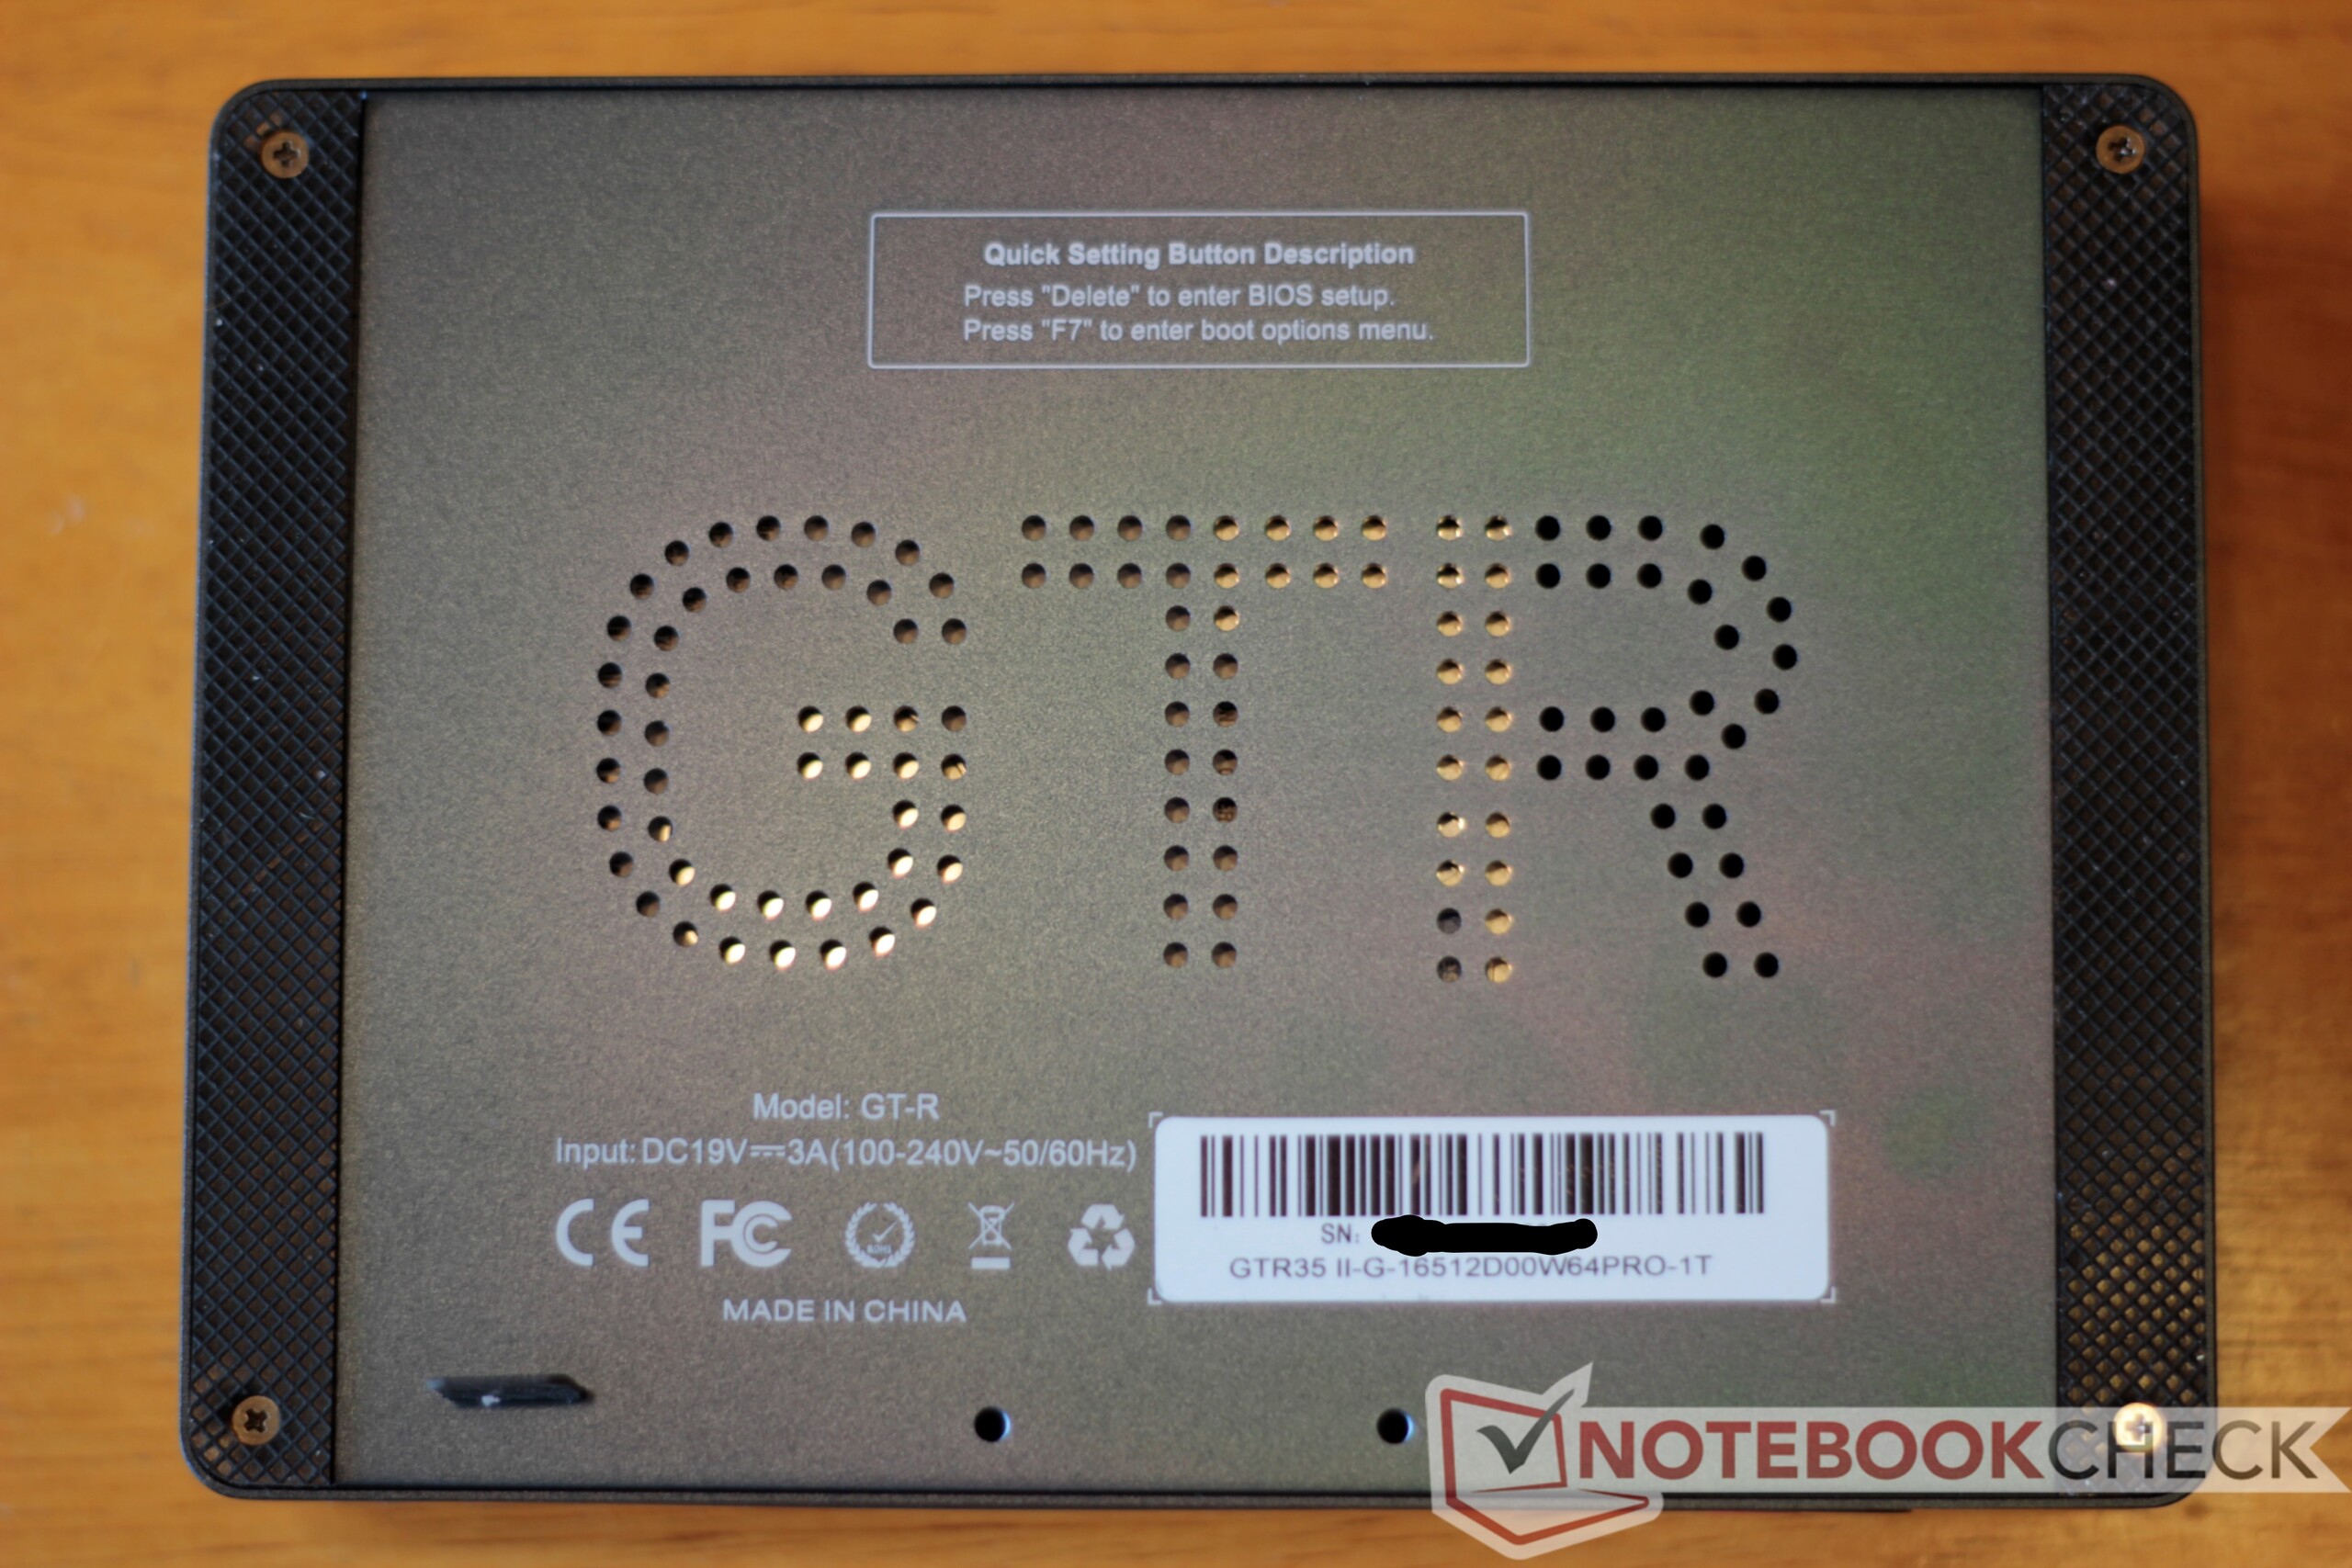
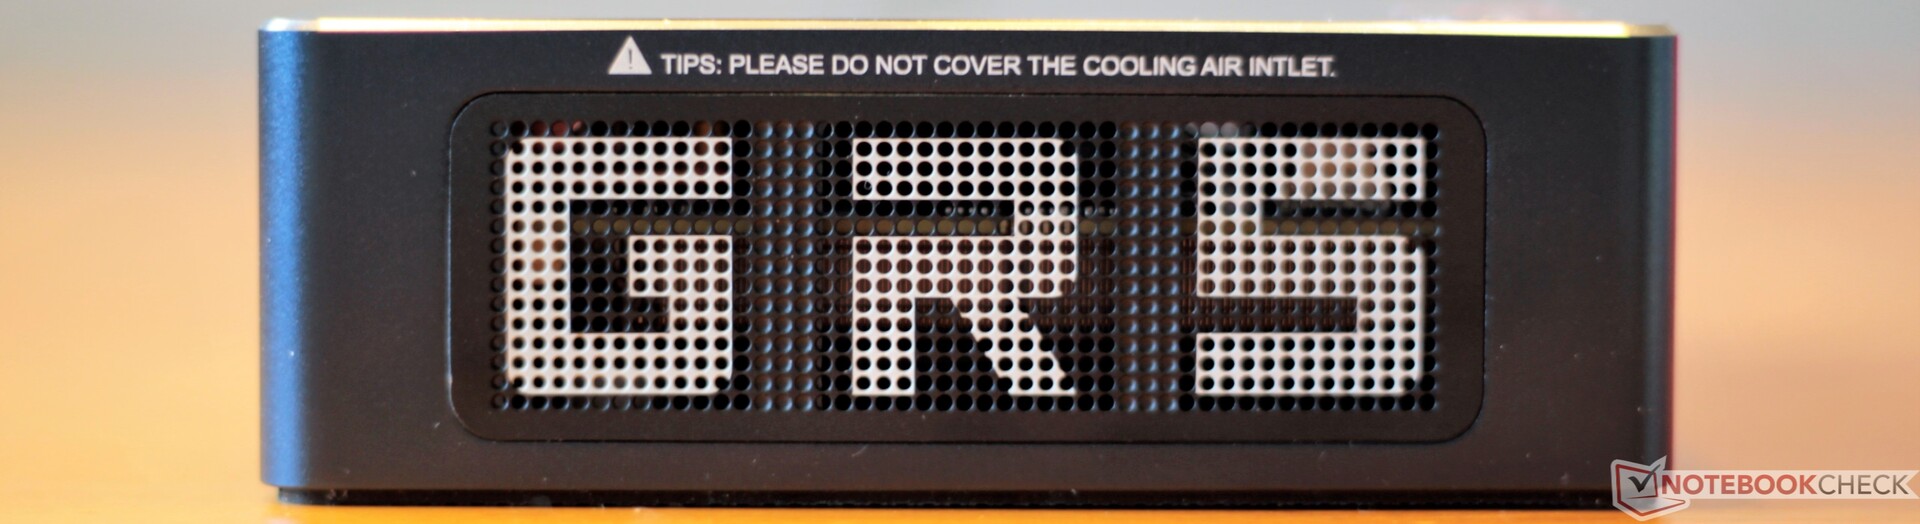
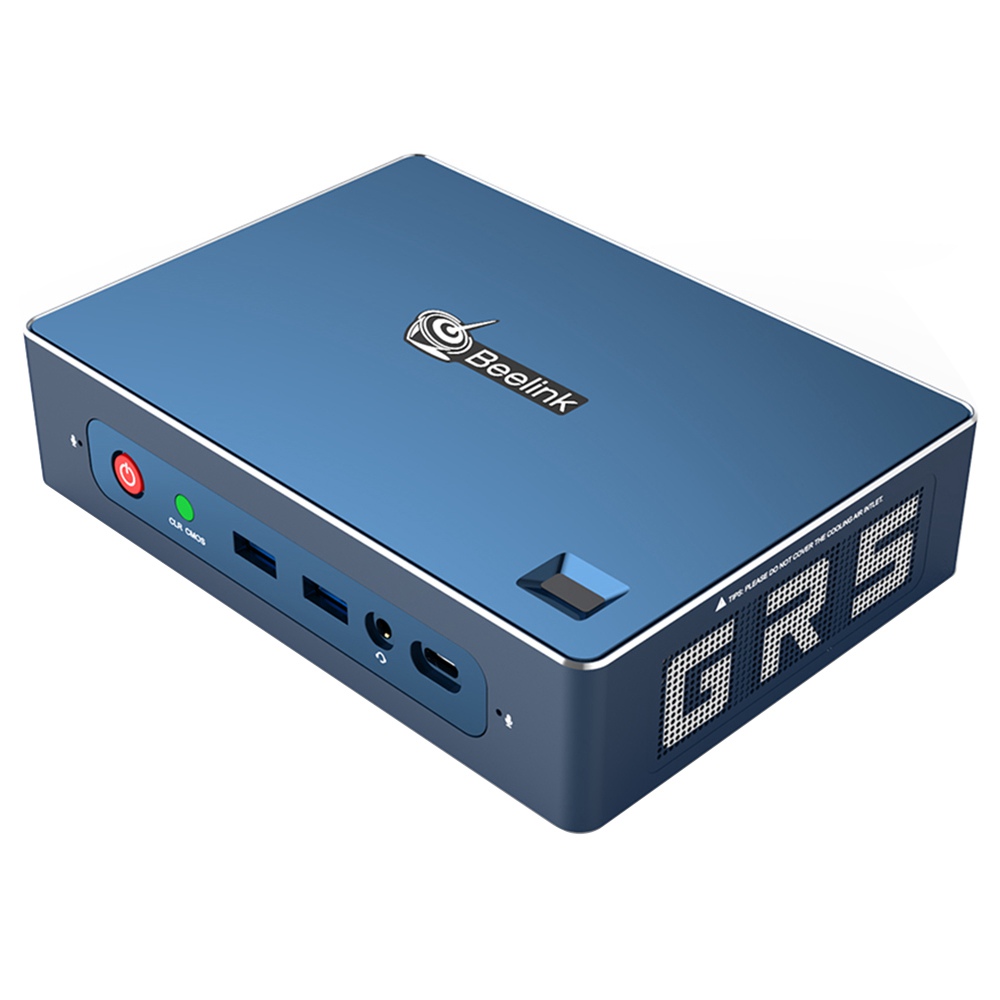
The GT-R's case is well-made, aesthetically pleasing, and hewn from a magnesium alloy. The top panel is covered with glass, giving a bit of extra pop. The case feels sturdy and holds firm under direct pressure. Its neutral gray color gives a professional look, and the matte finish on the side panels resists fingerprints. The top glass shows smudges easily, though. The GT-R's case is beautiful and strong.
The GT-R's footprint is fairly small, taking up about a third of the space of a standard-sized keyboard. It's smaller than some mini PCs, like the Hades Canyon NUC and Zotac ZBOX Nano, but it is a fair bit larger than most Intel NUCs.
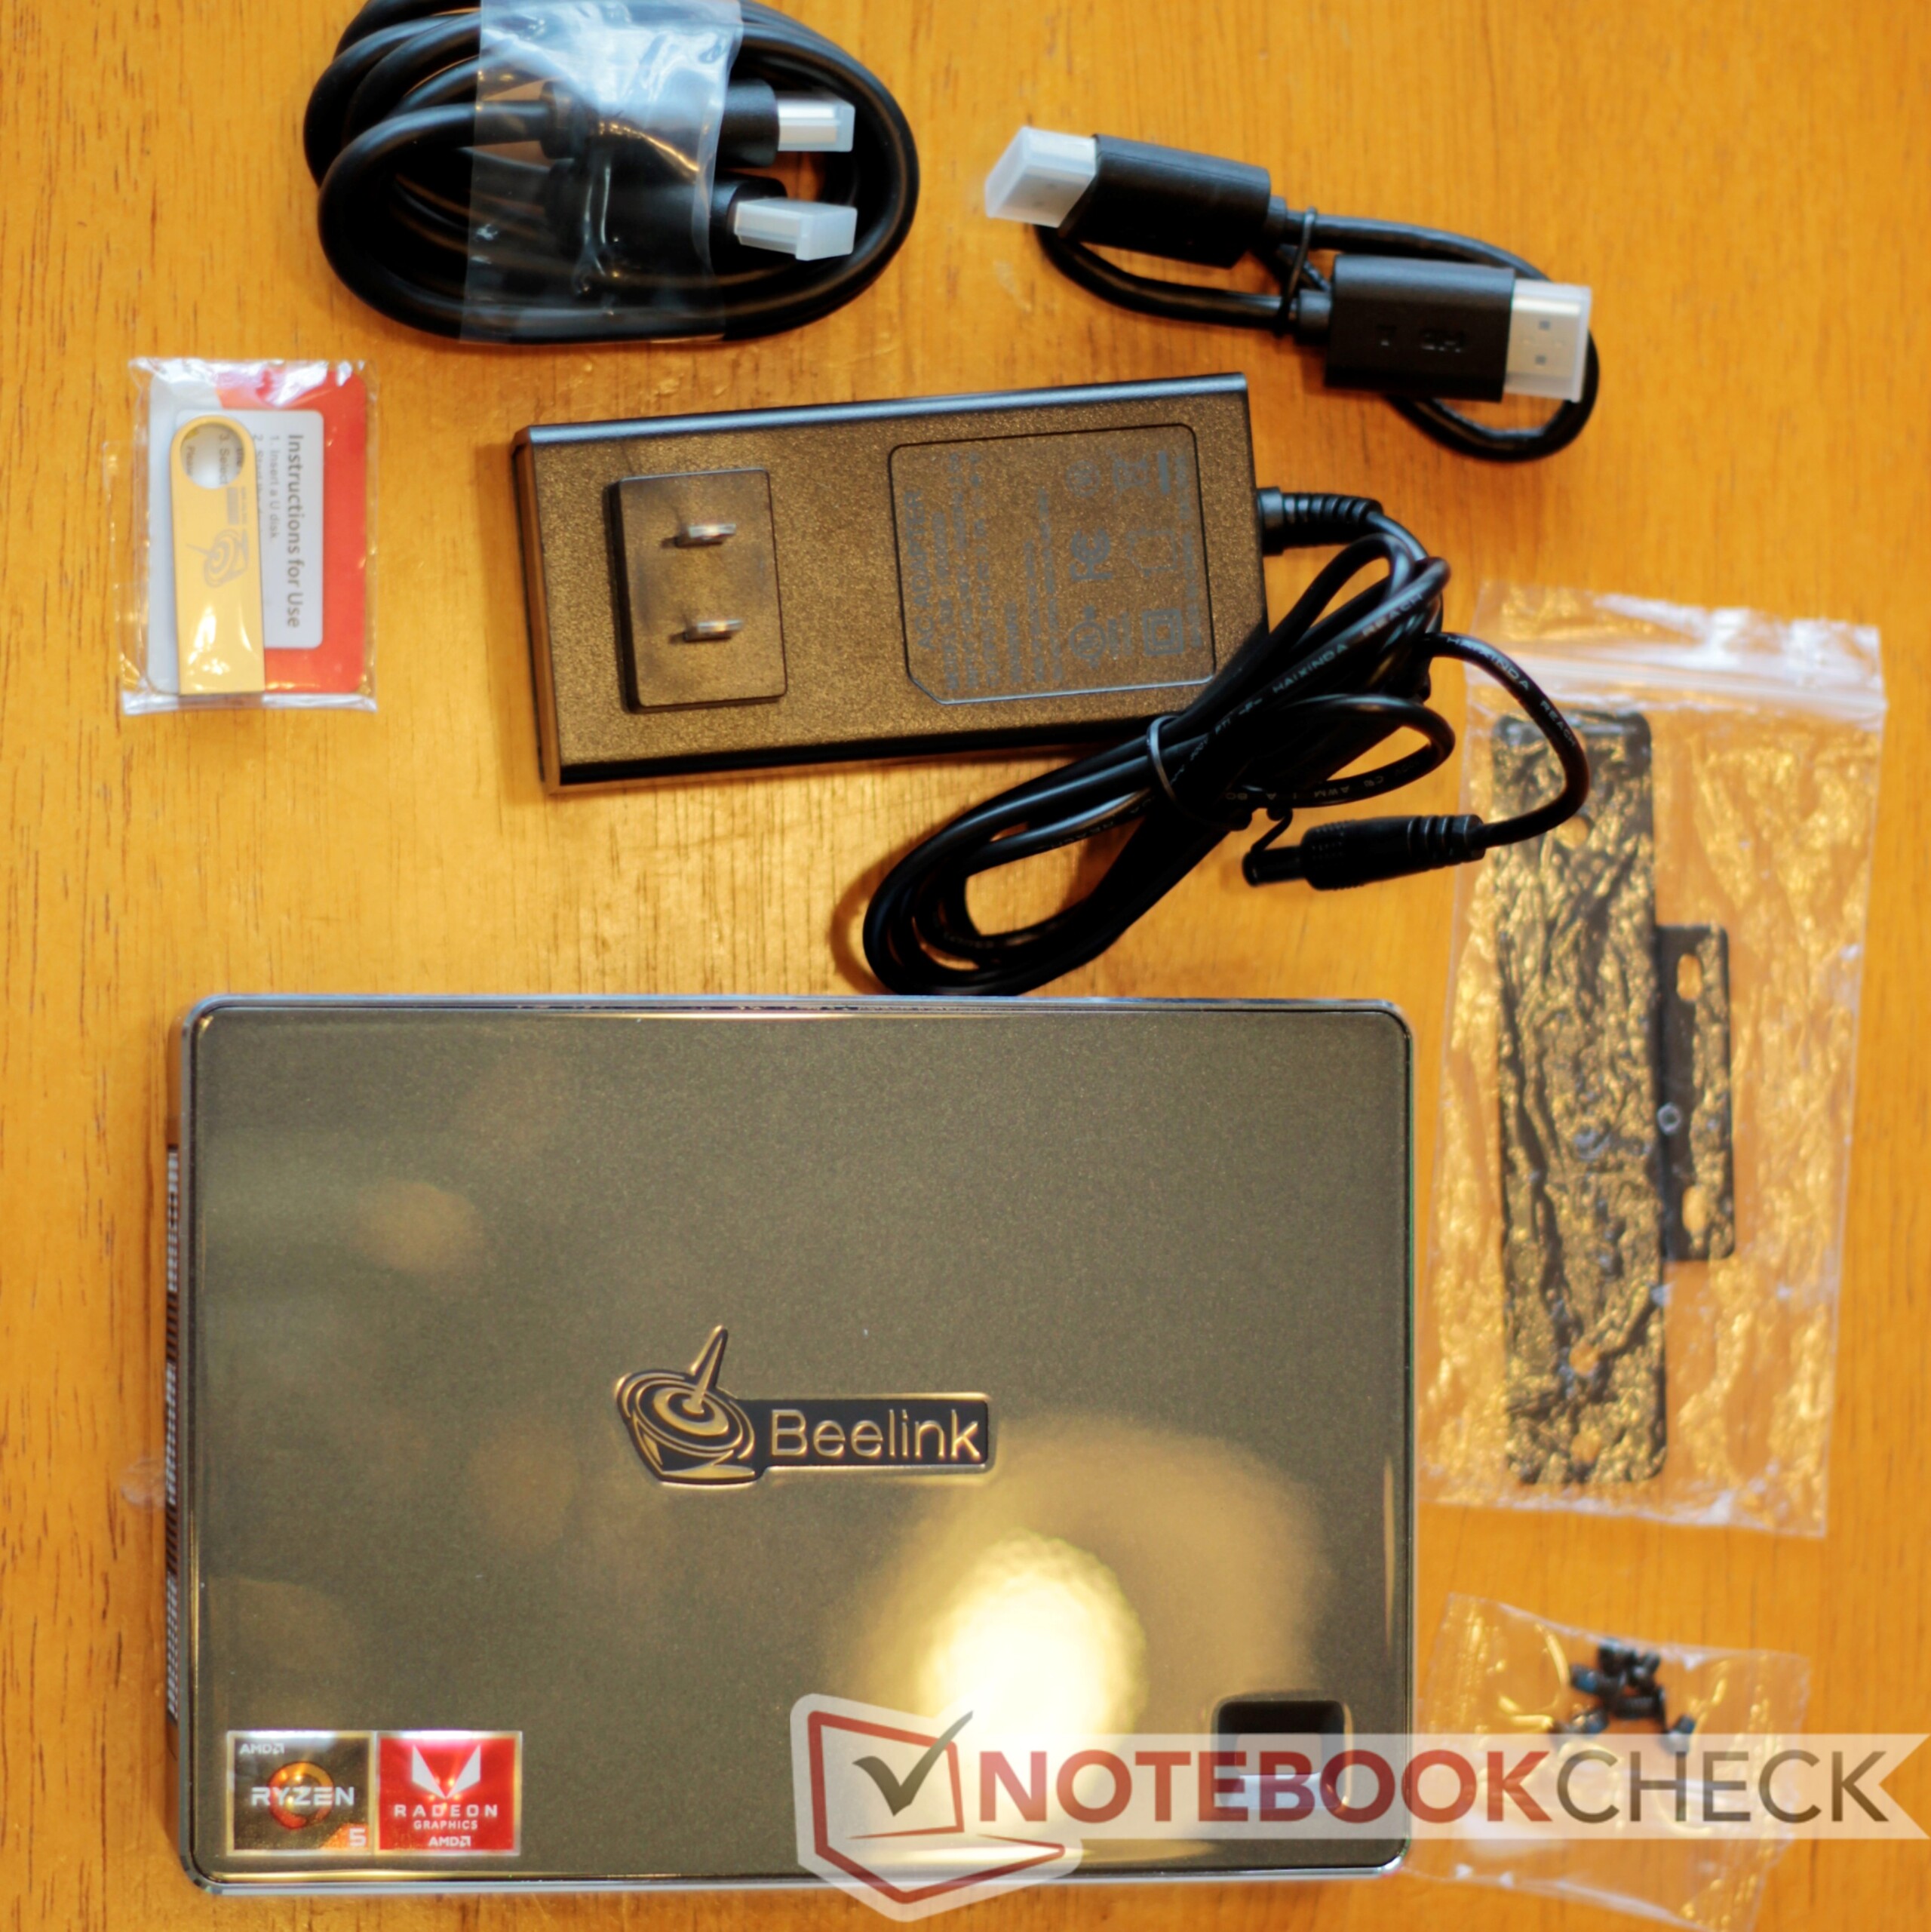
Beelink includes a VESA mounting bracket with the GT-R for mounting the device to the back of a monitor.
Connectivity
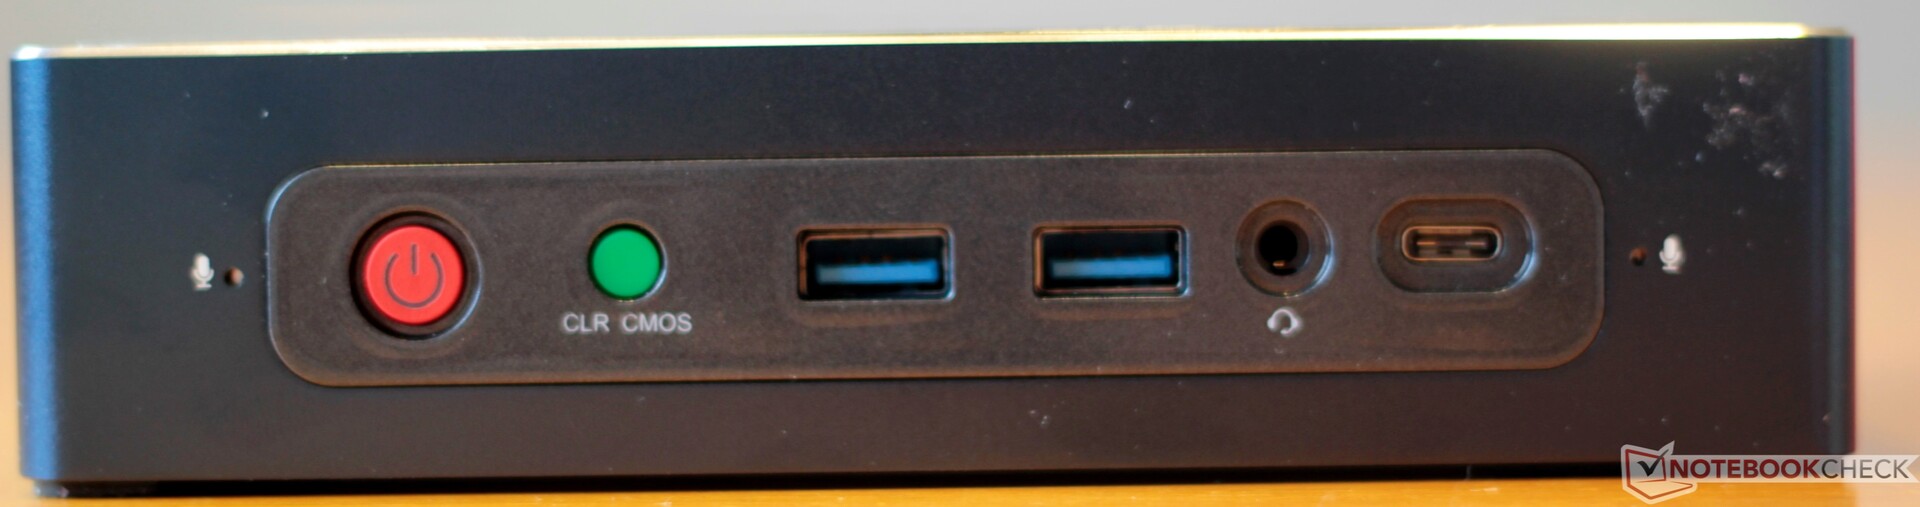
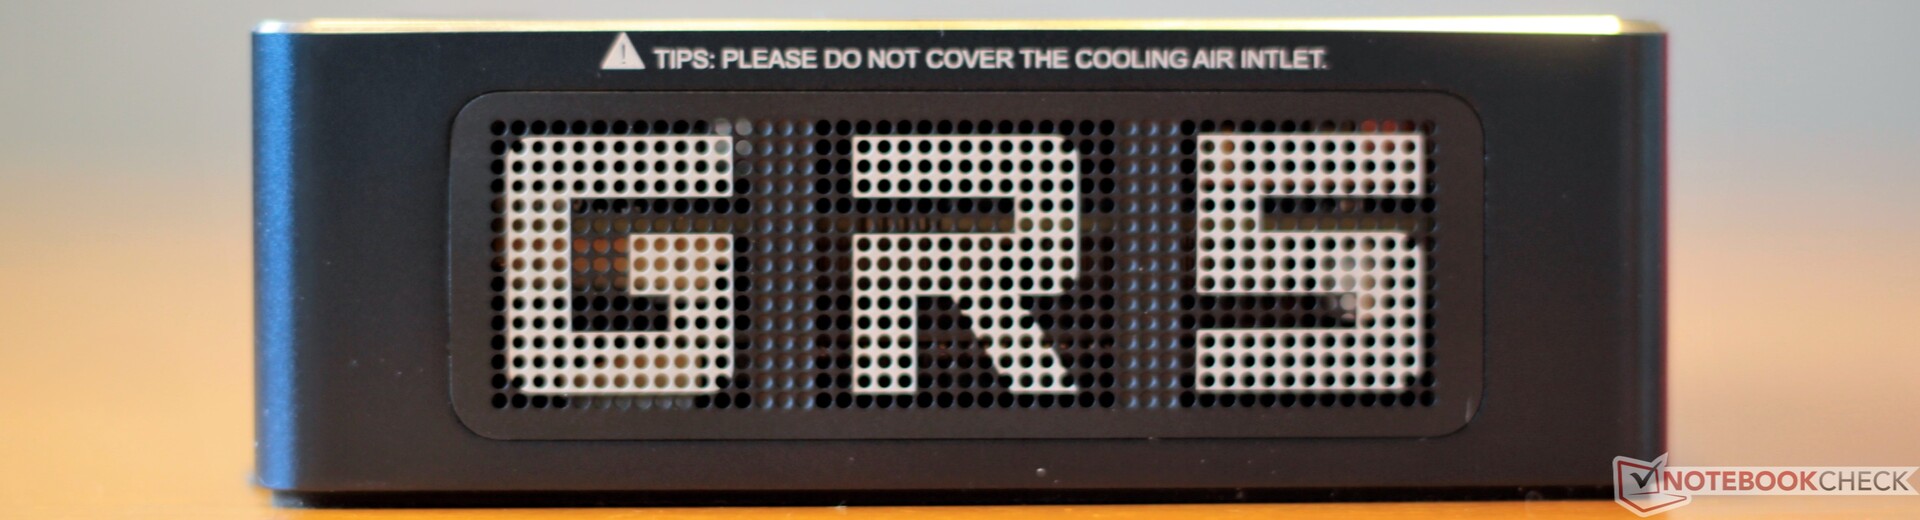
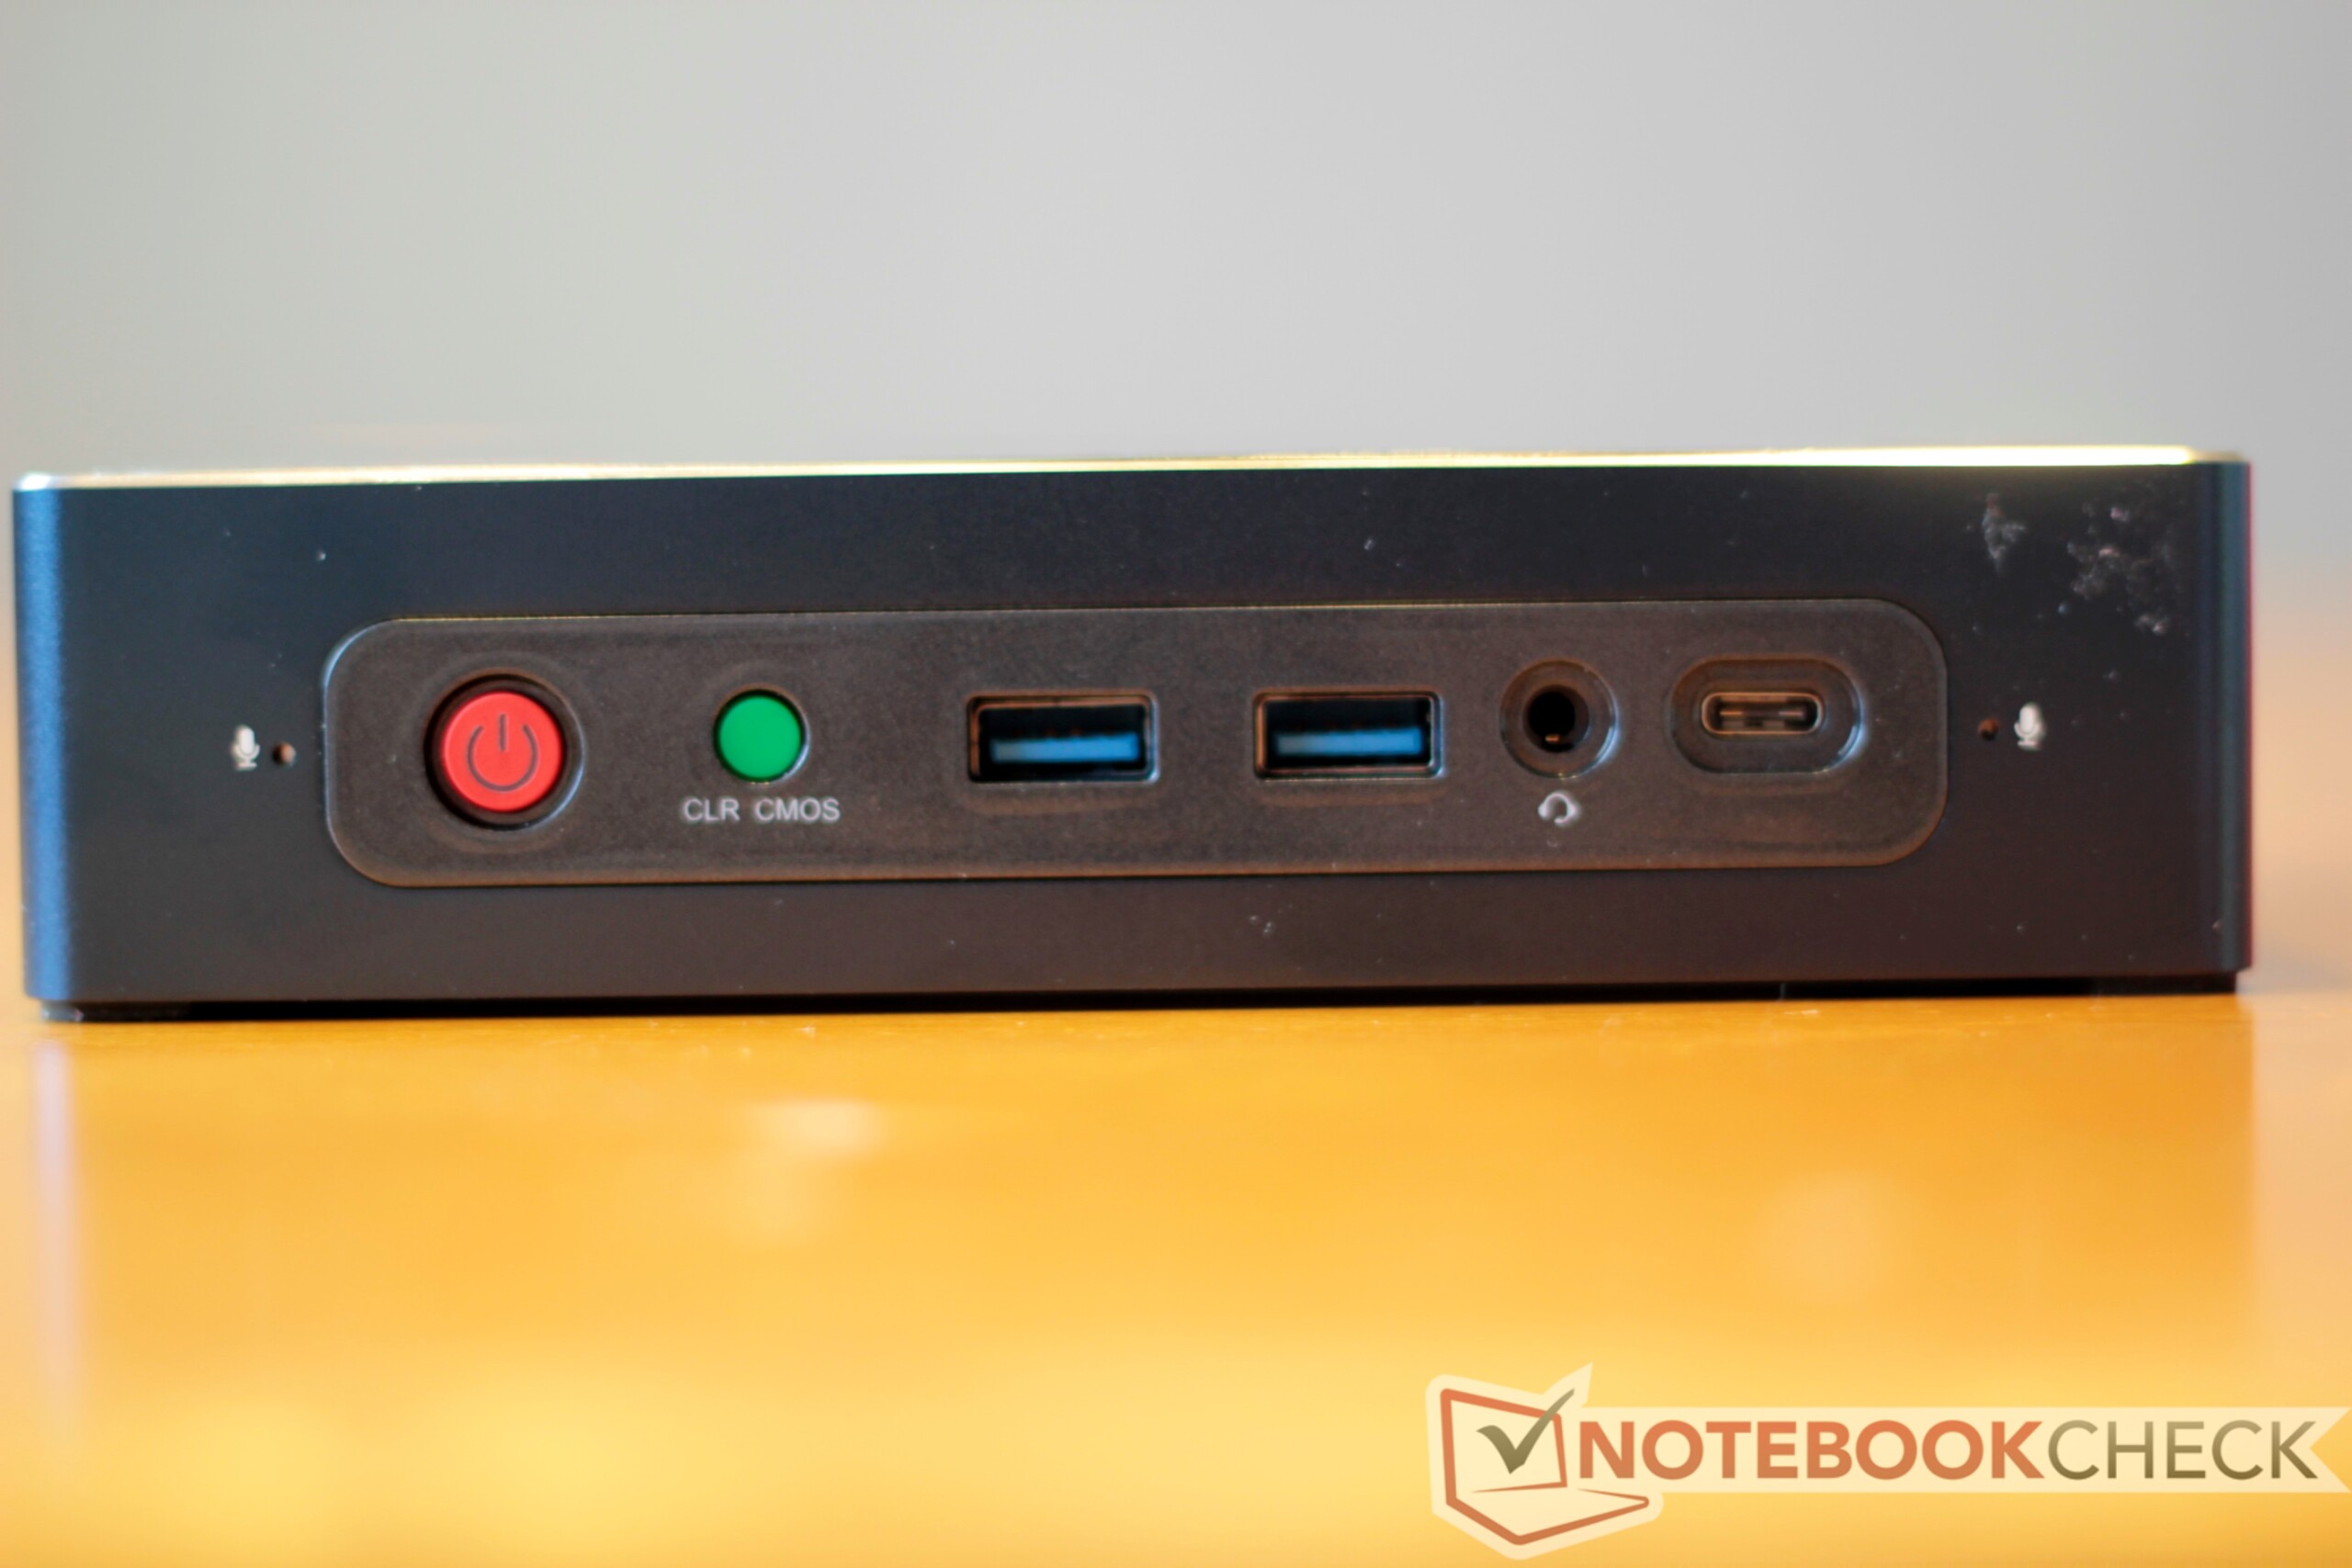
Beelink fit quite a few ports onto the device. The front of the GT-R has two USB 3.0 Type-A ports, a headset jack, and a single USB 3.0 Type-C port that supports display out. To the left of these are a bright red power button and a small green button for clearing the CMOS (more on that later). There are also two microphones flanking the front I/O.
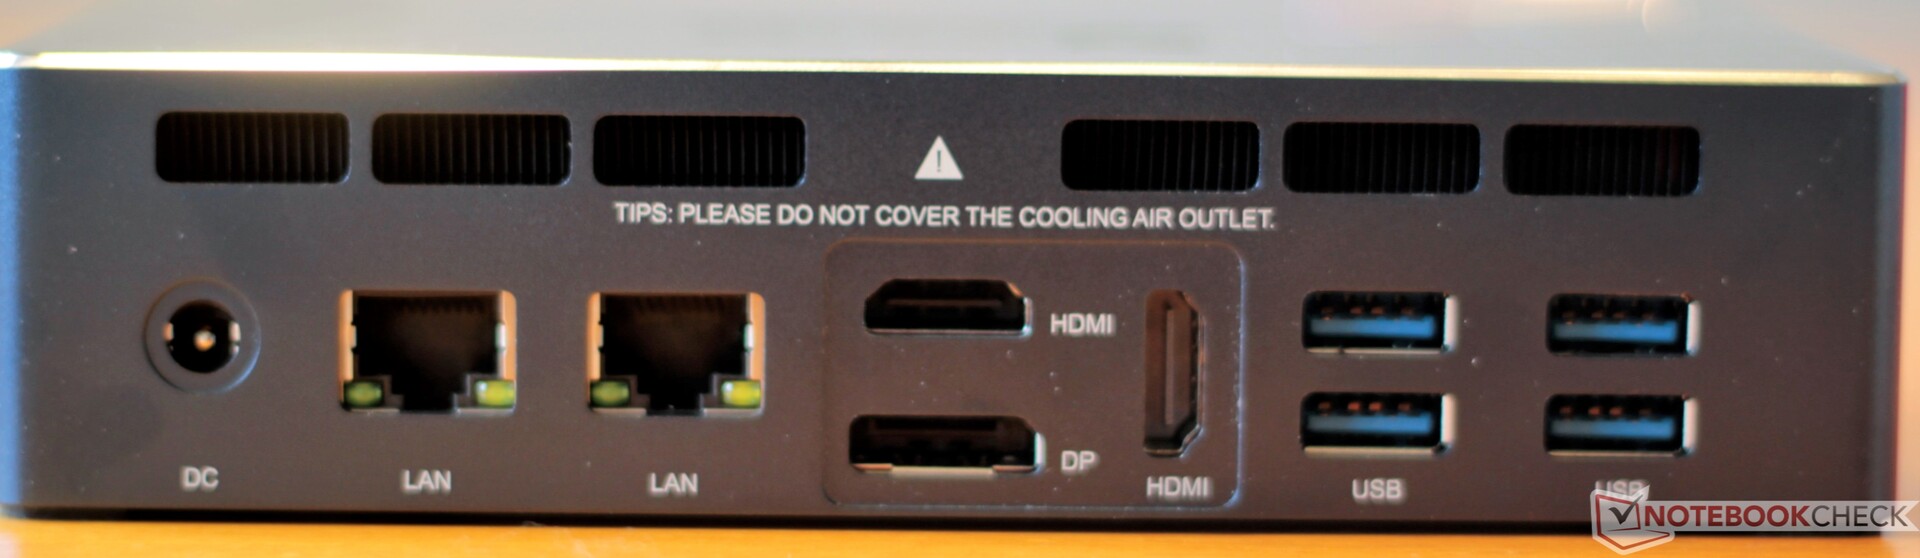
The rear boasts two gigabit LAN ports and three display hookups (two HDMI, one DisplayPort), and four more USB 3.0 Type-A ports. With the three display outputs on the back and the USB-C port on the front, Beelink says that the GT-R can support up to four displays.
The GT-R features a fingerprint reader on the front panel. Unfortunately, our unit appears to be defective; the reader does not work reliably and consistently registers phantom swipes.
| Networking | |
| iperf3 transmit AX12 | |
| Beelink GTR35 II-G-16512D00W64PRO-1T | |
| Intel NUC8i7BE | |
| Intel Hades Canyon NUC8i7HVK | |
| Zotac ZBOX-CI660 Nano | |
| iperf3 receive AX12 | |
| Beelink GTR35 II-G-16512D00W64PRO-1T | |
| Intel NUC8i7BE | |
| Intel Hades Canyon NUC8i7HVK | |
| Zotac ZBOX-CI660 Nano | |
Maintenance
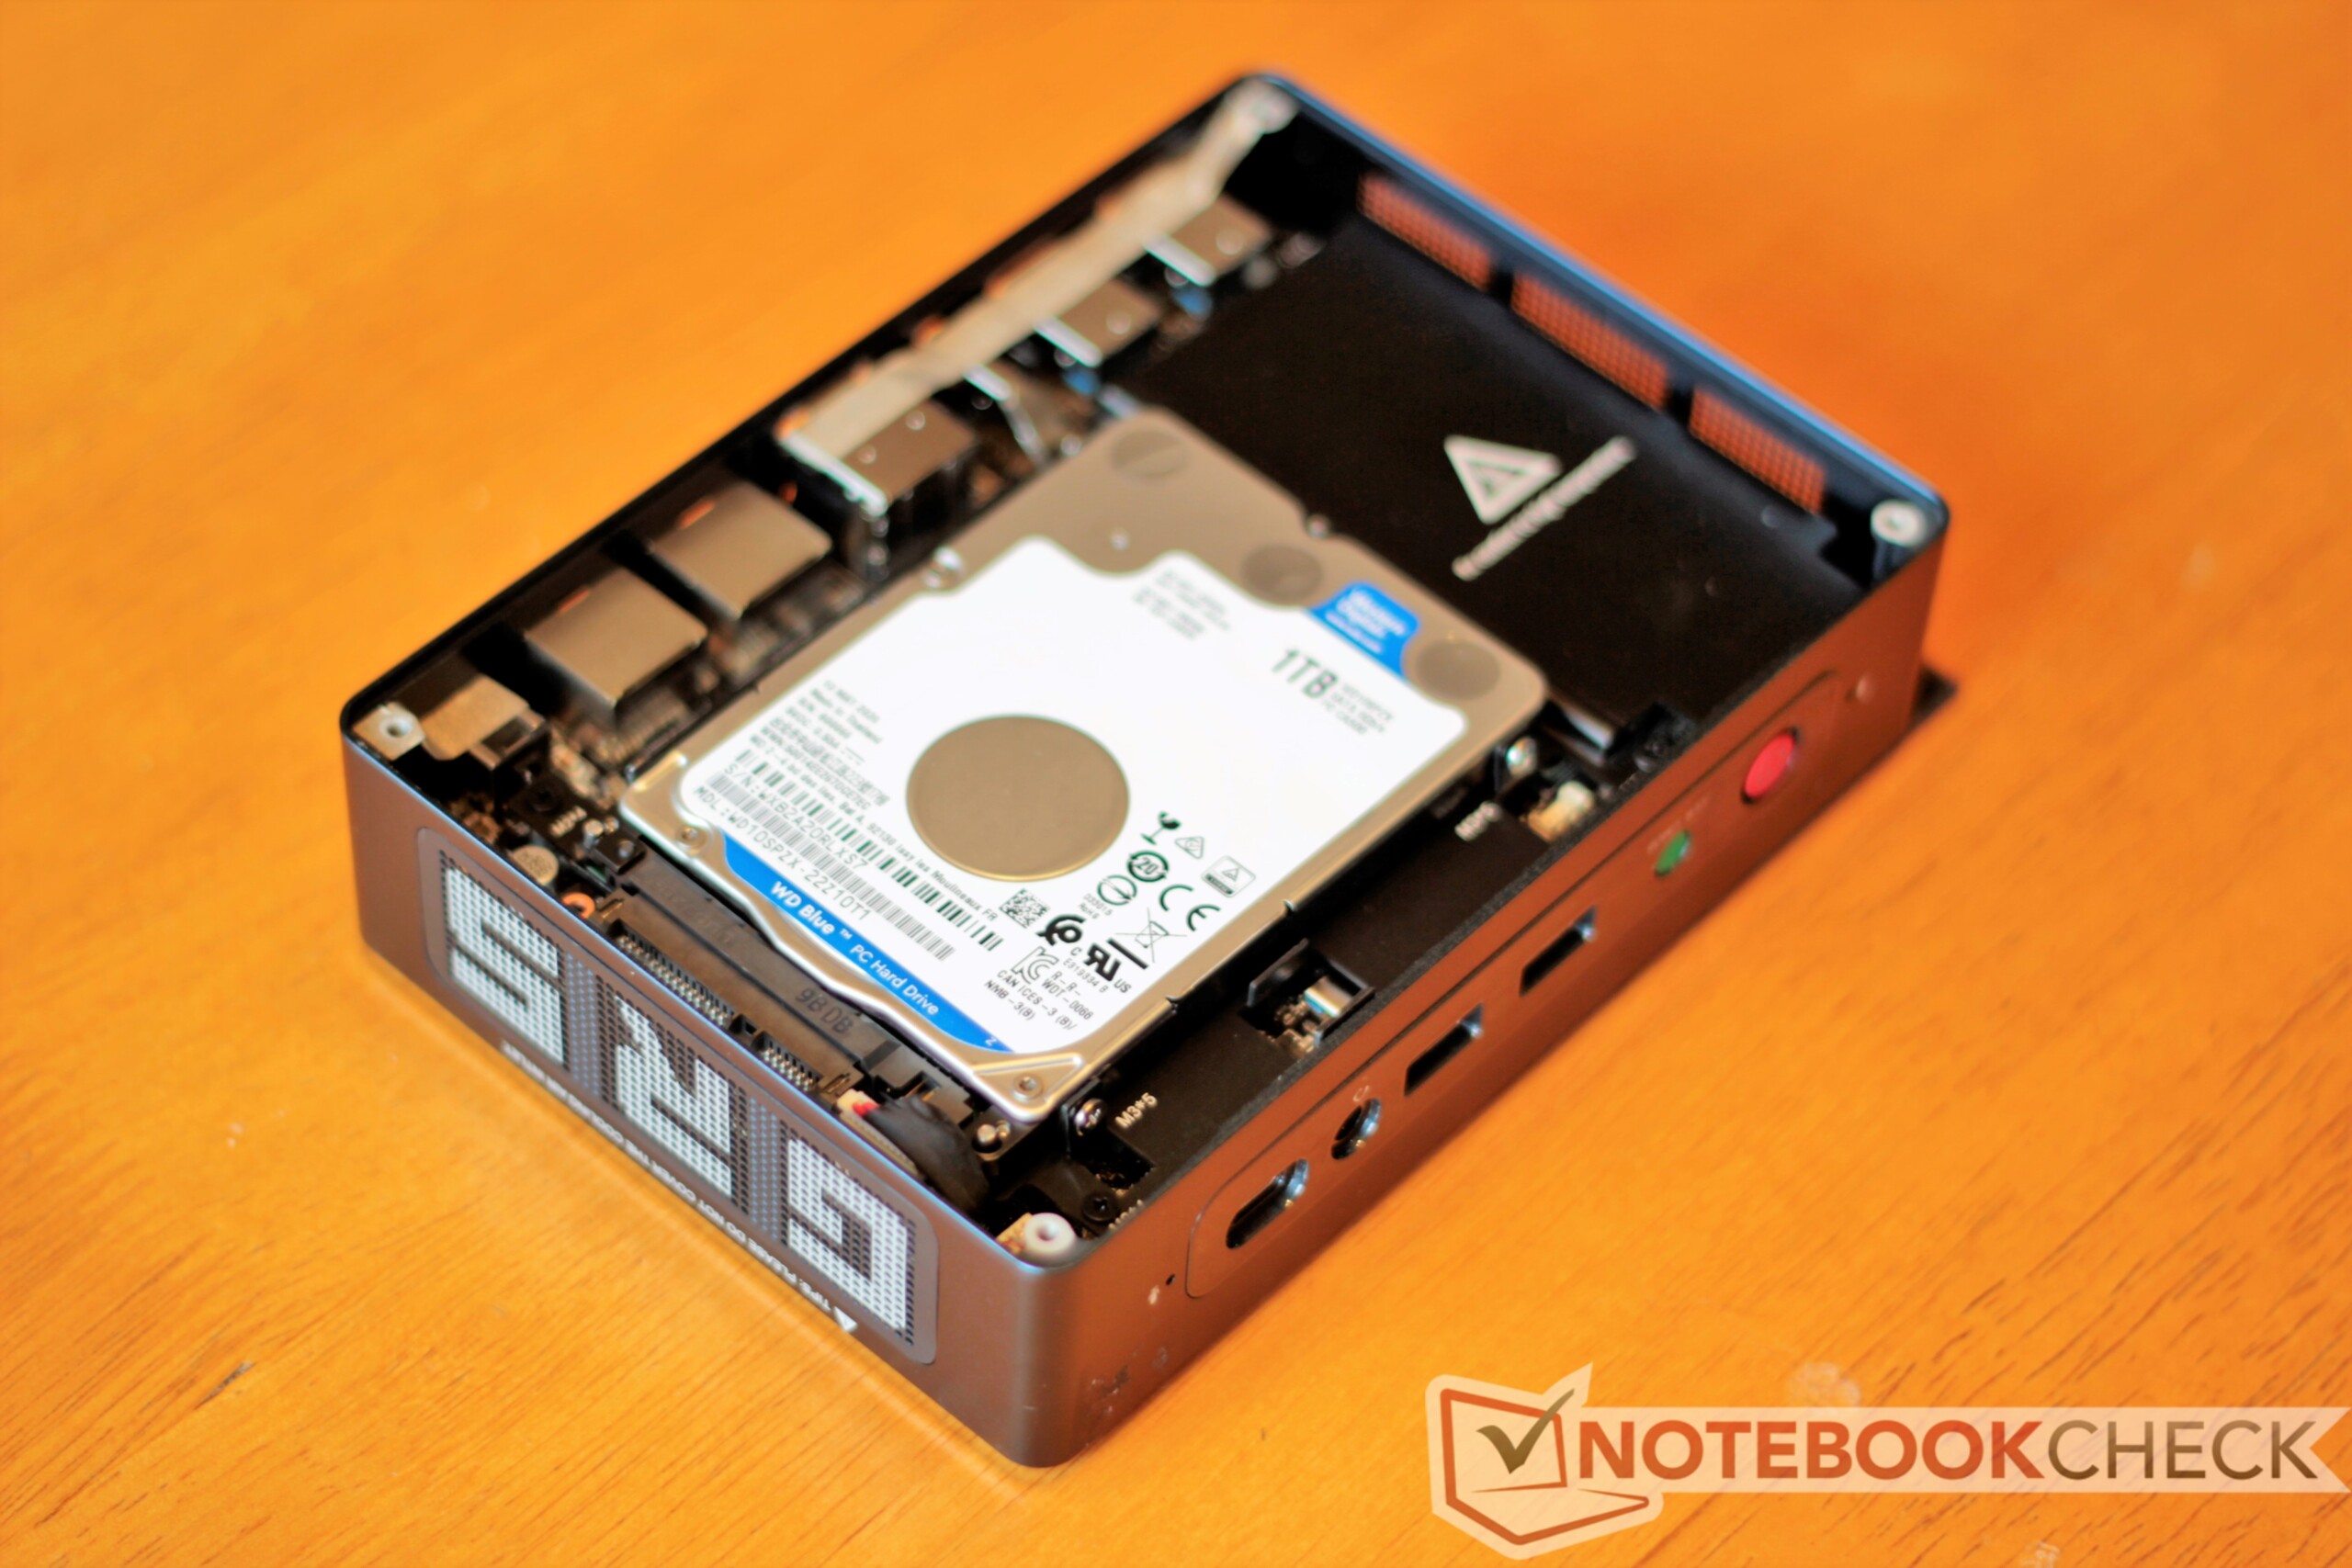
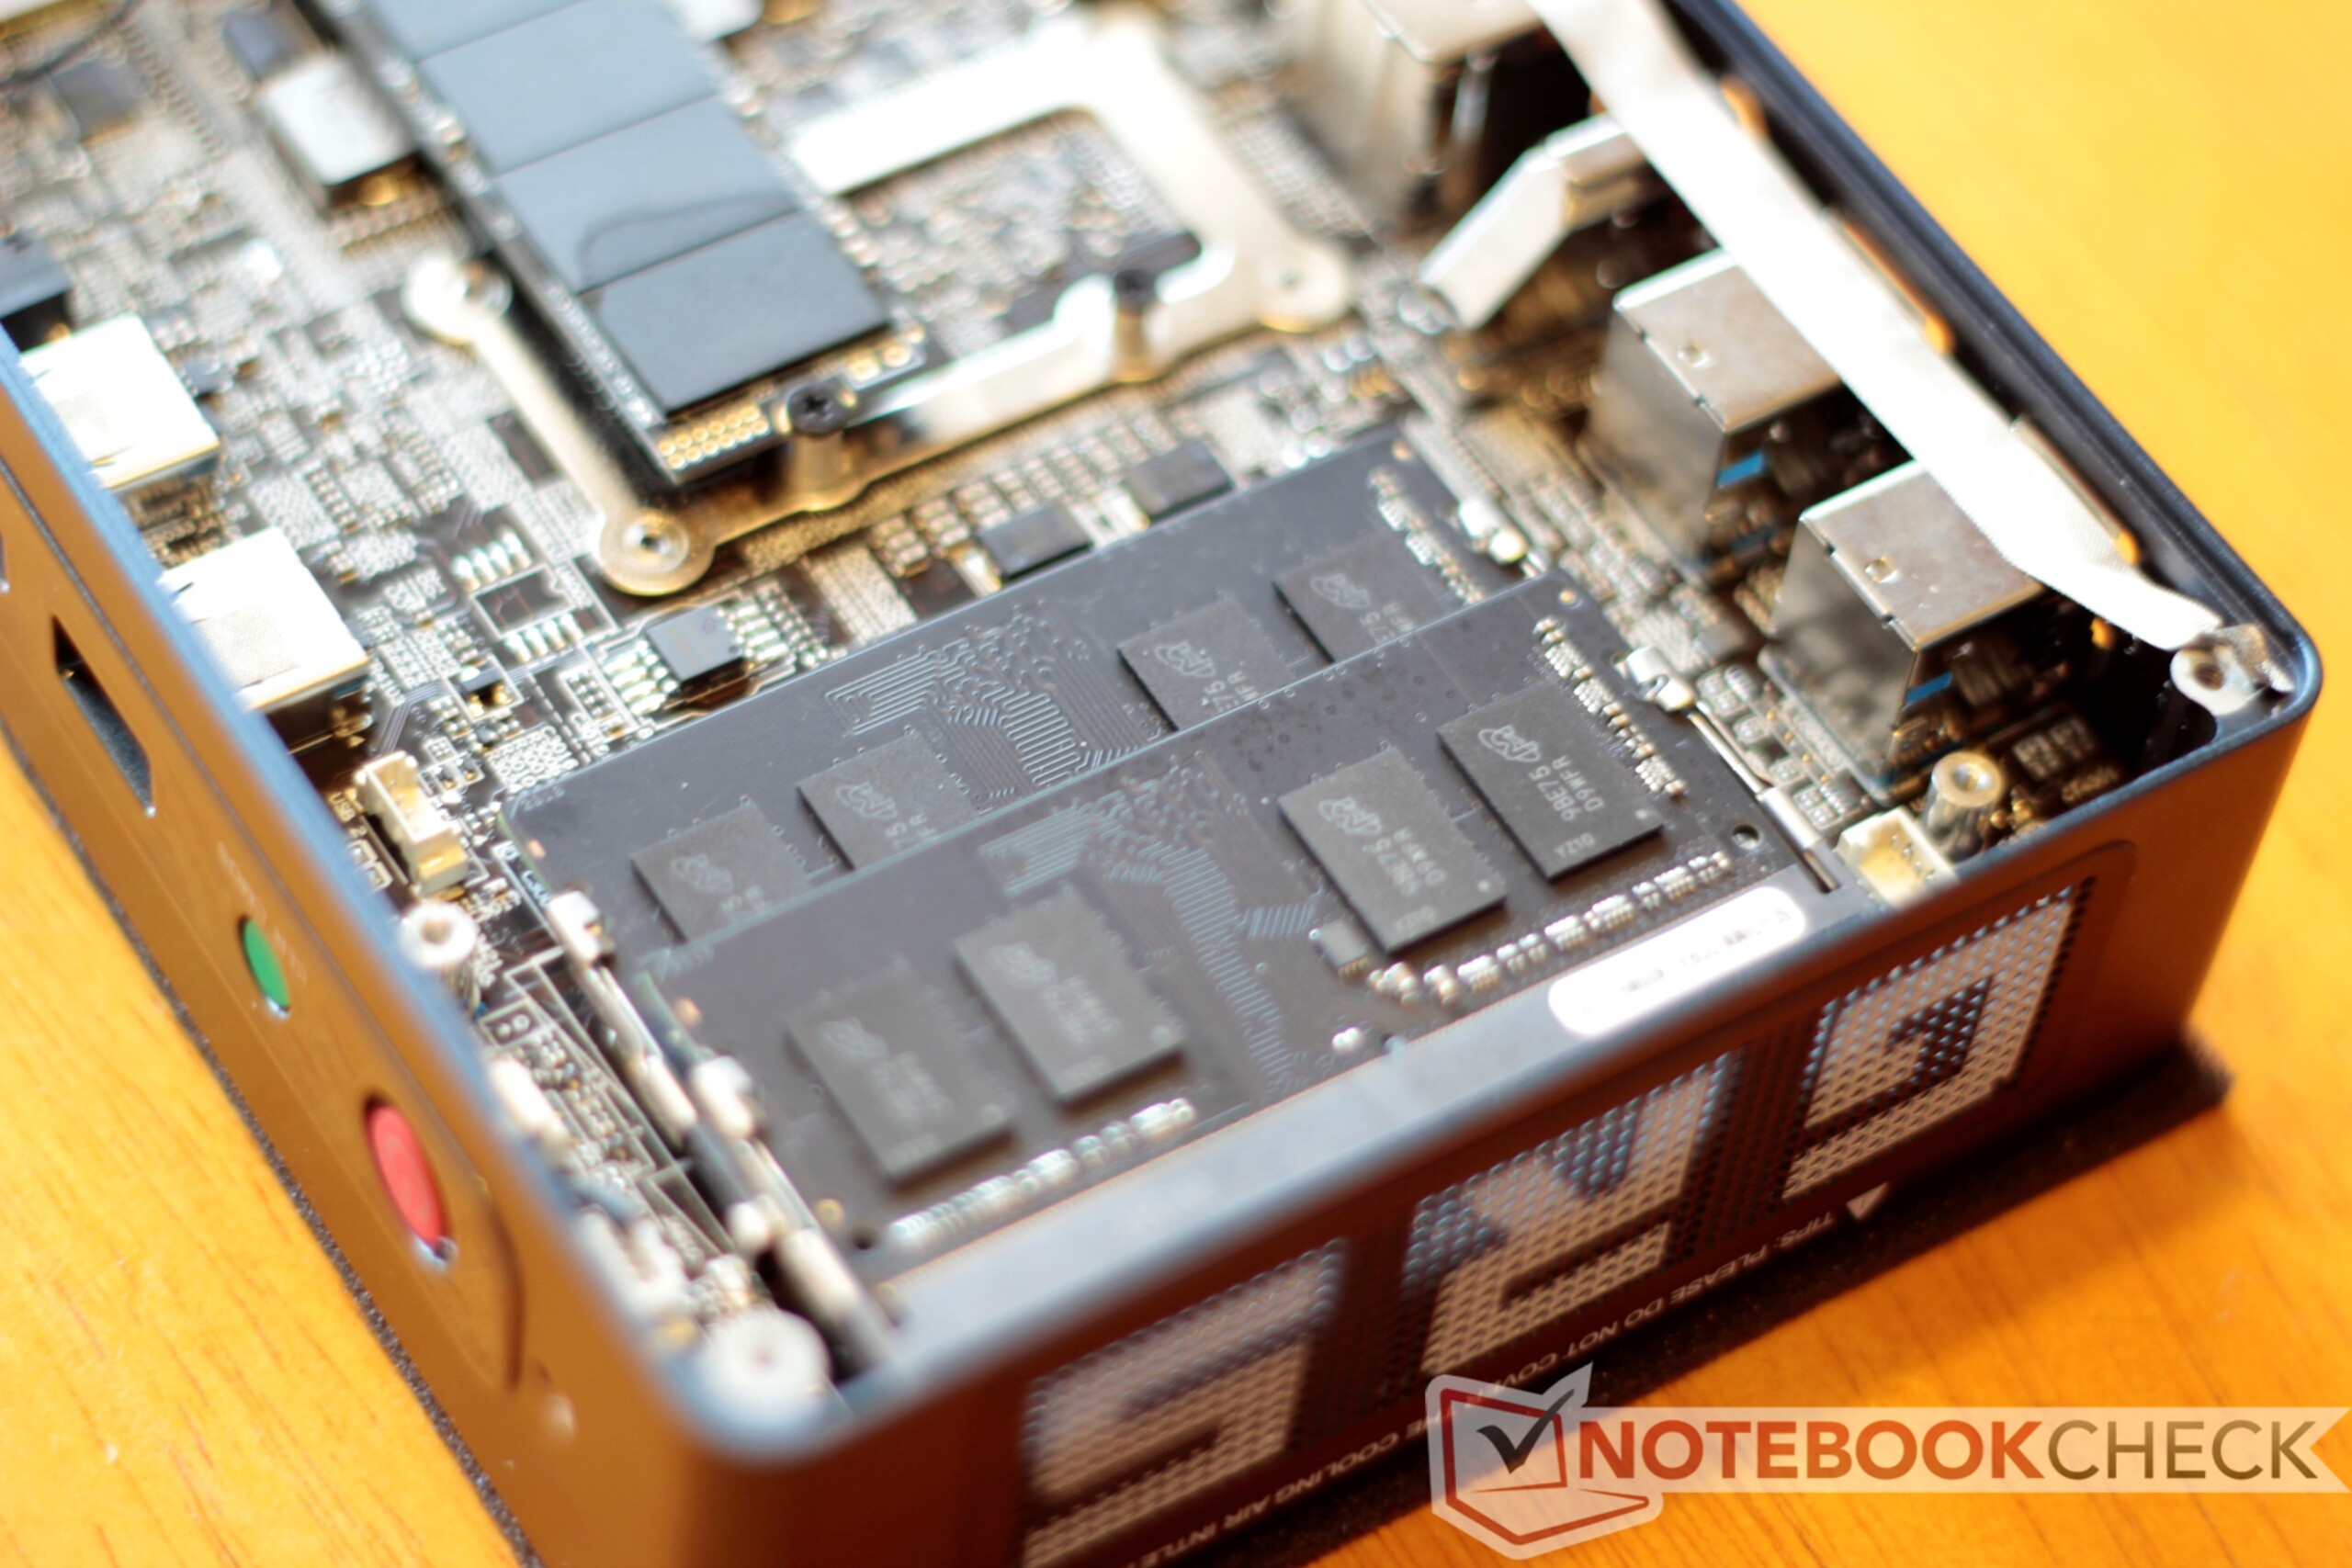
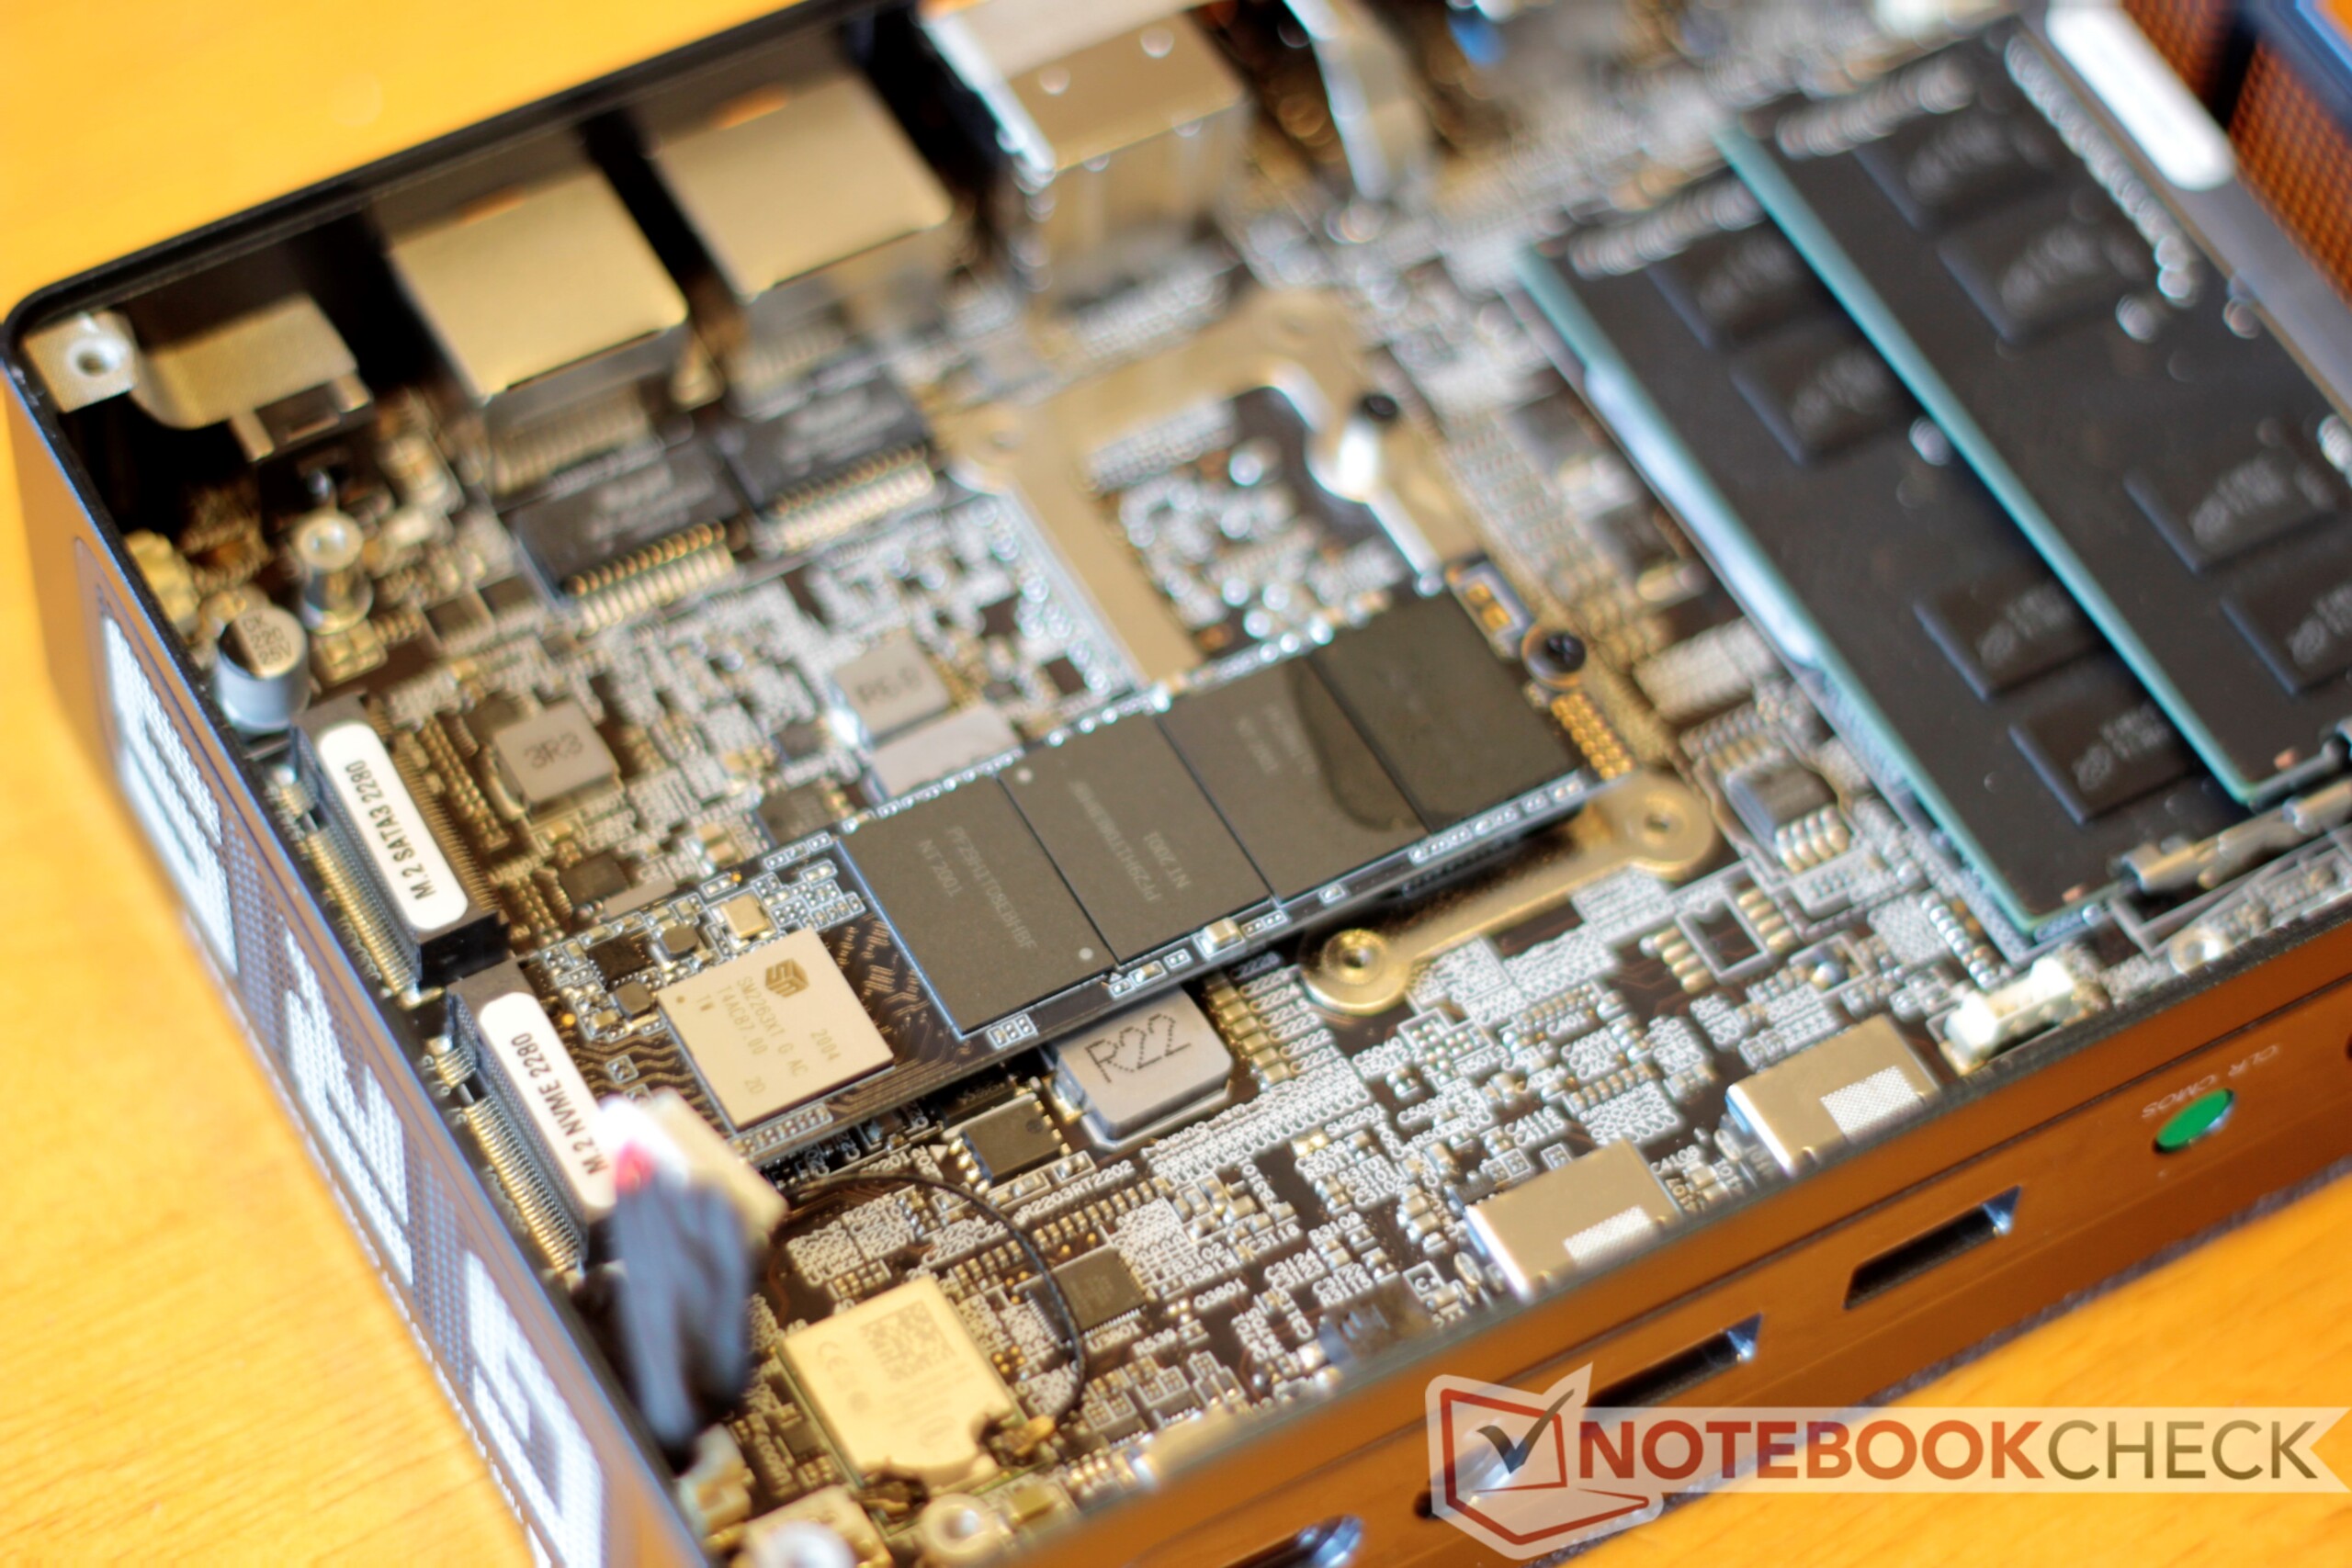
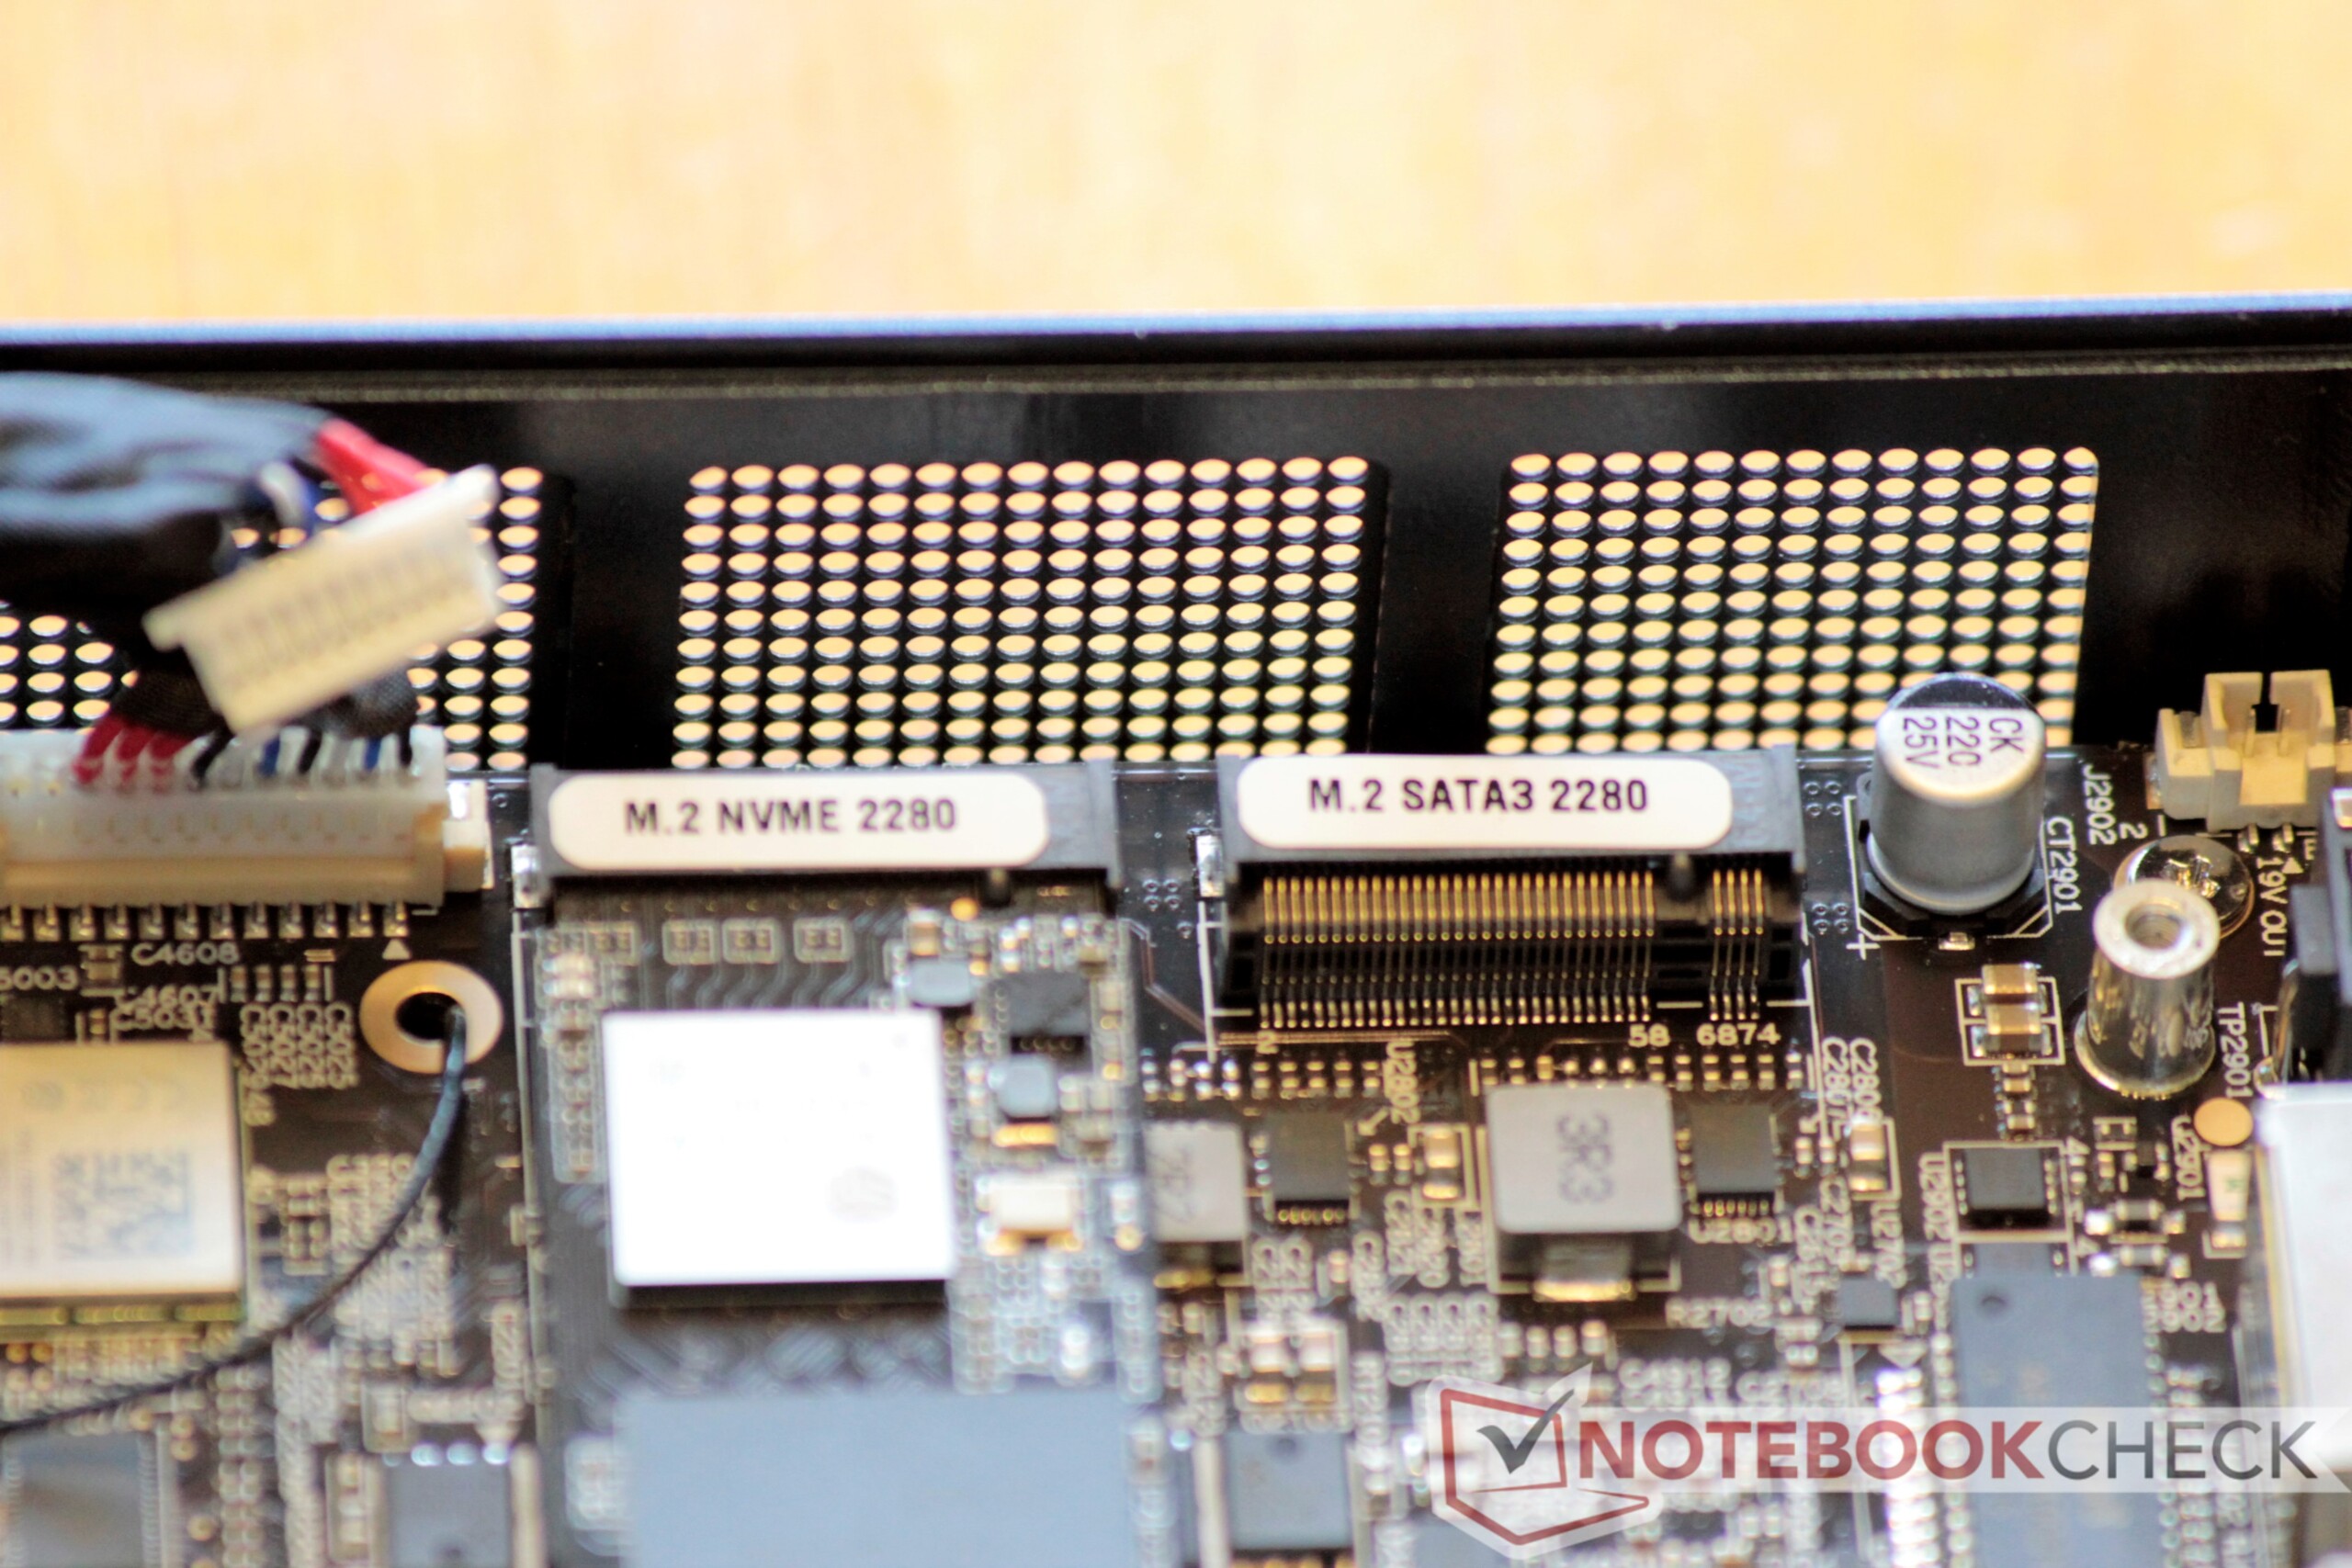
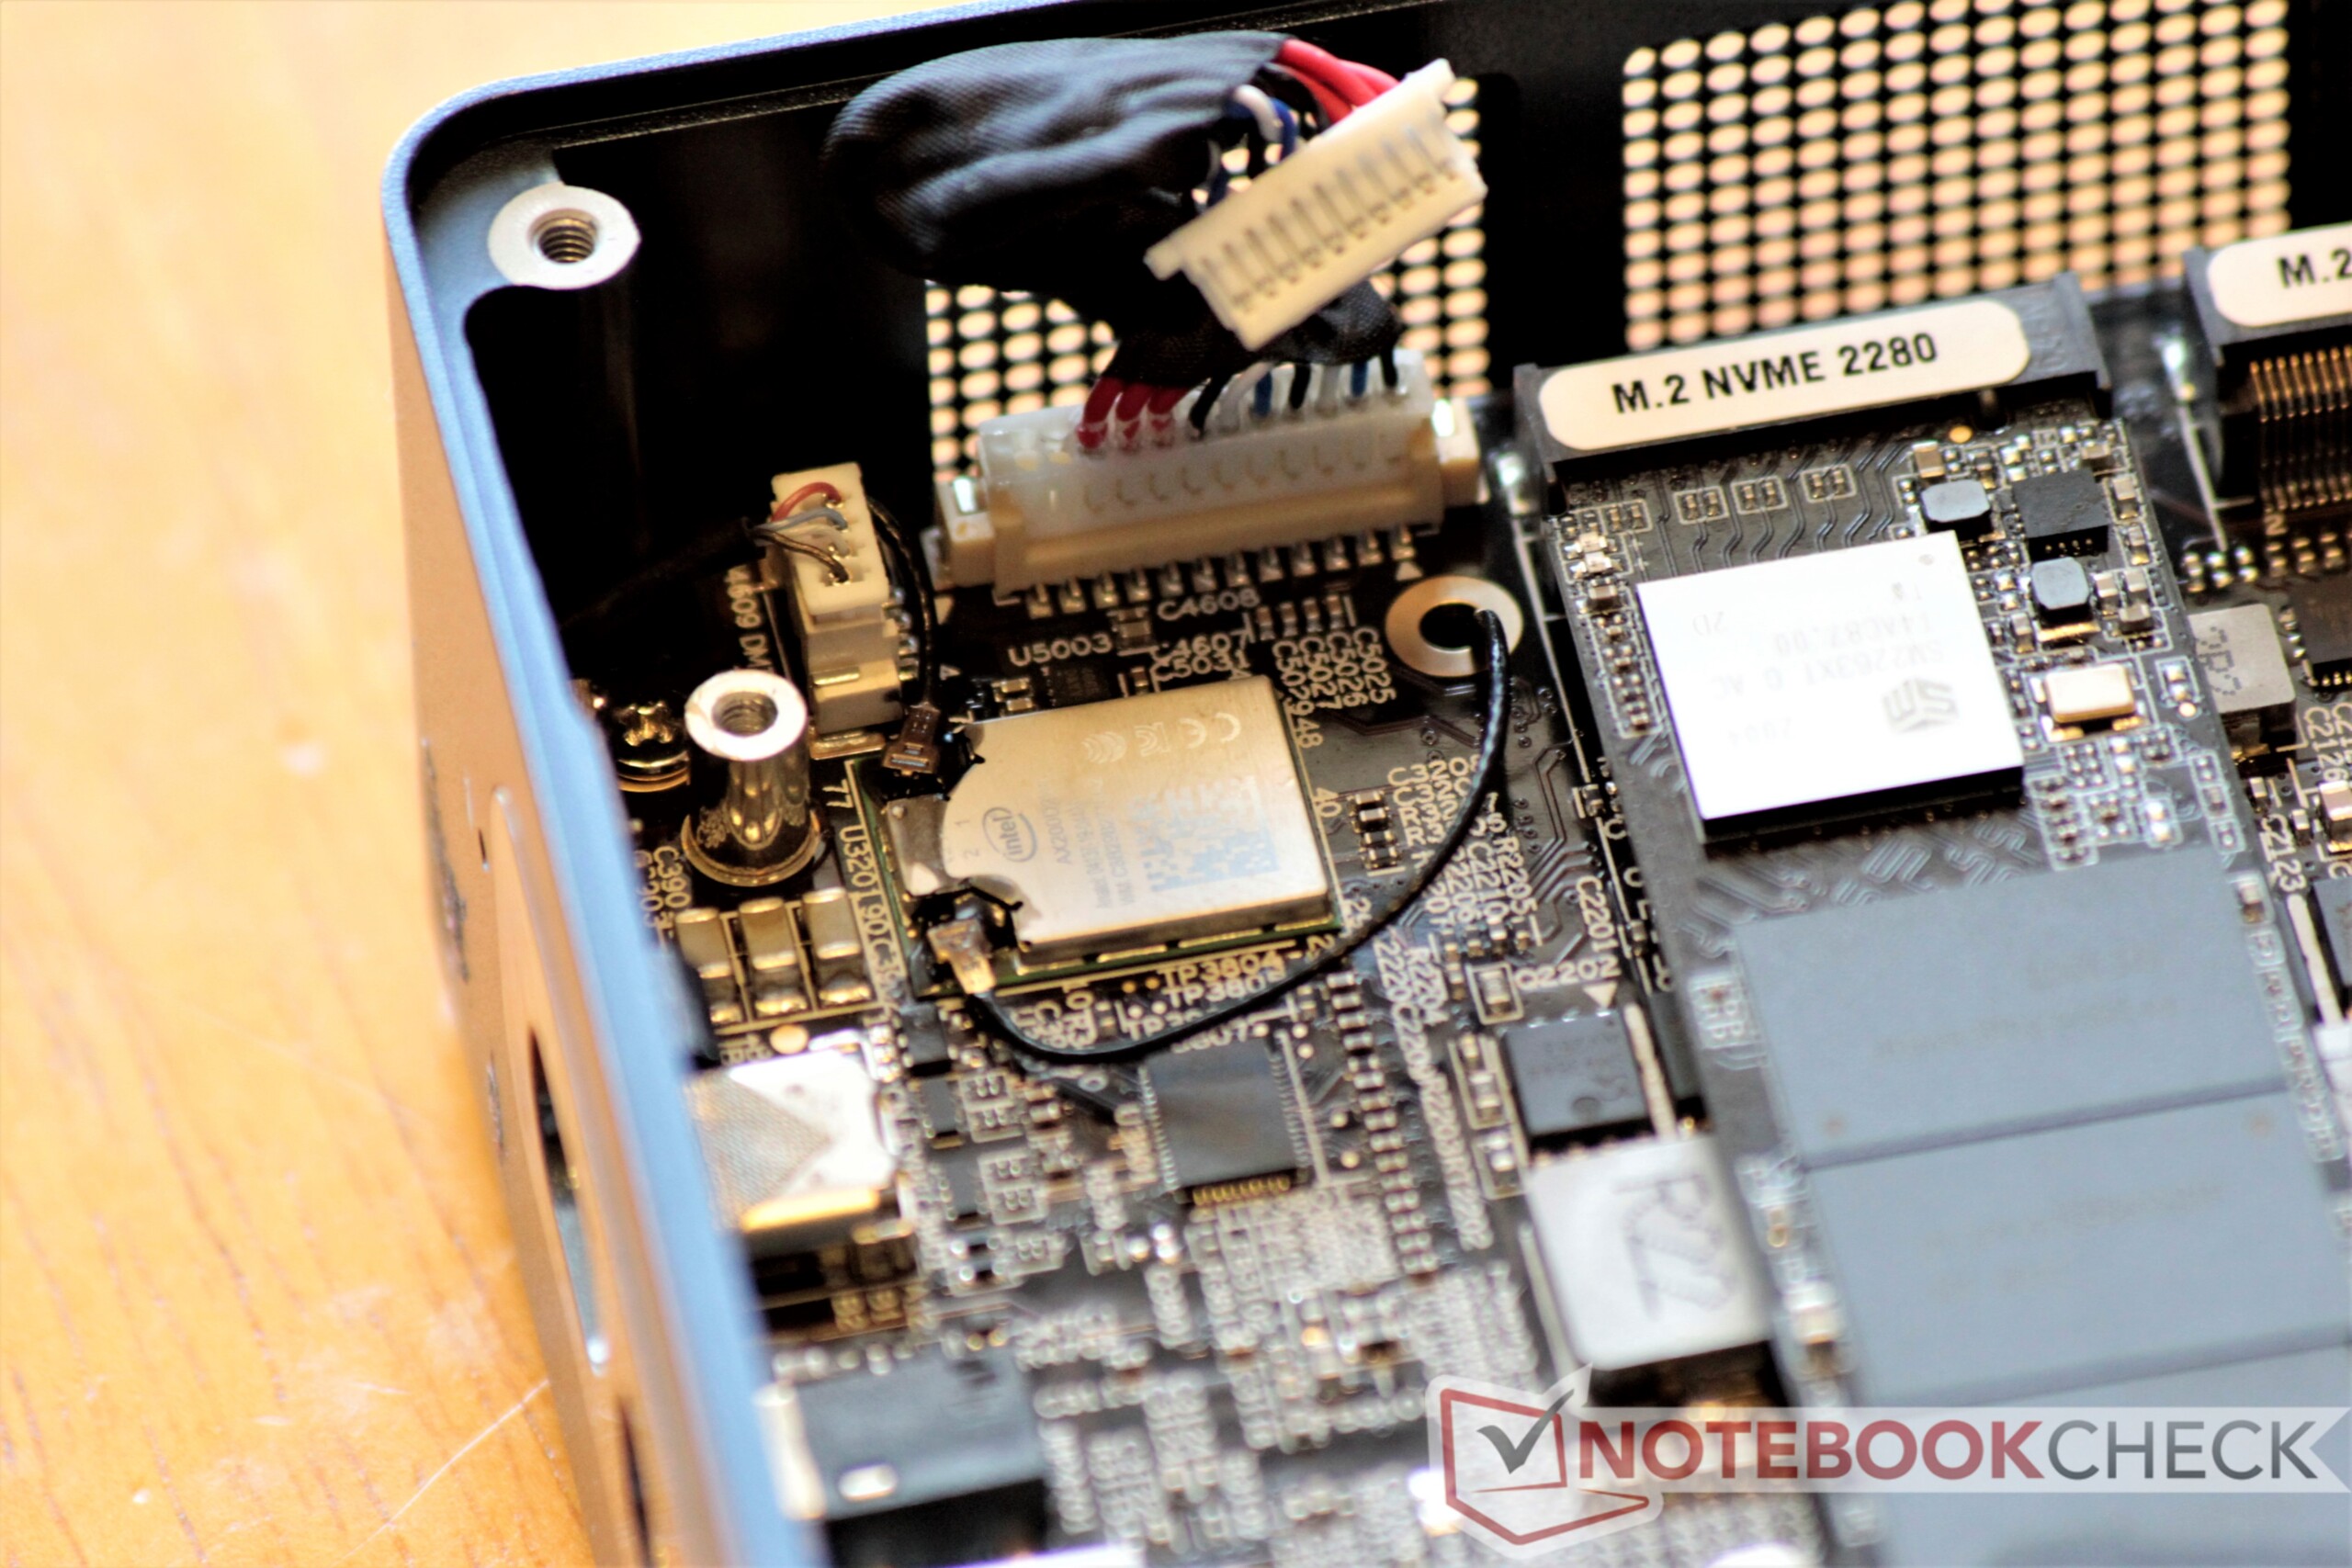
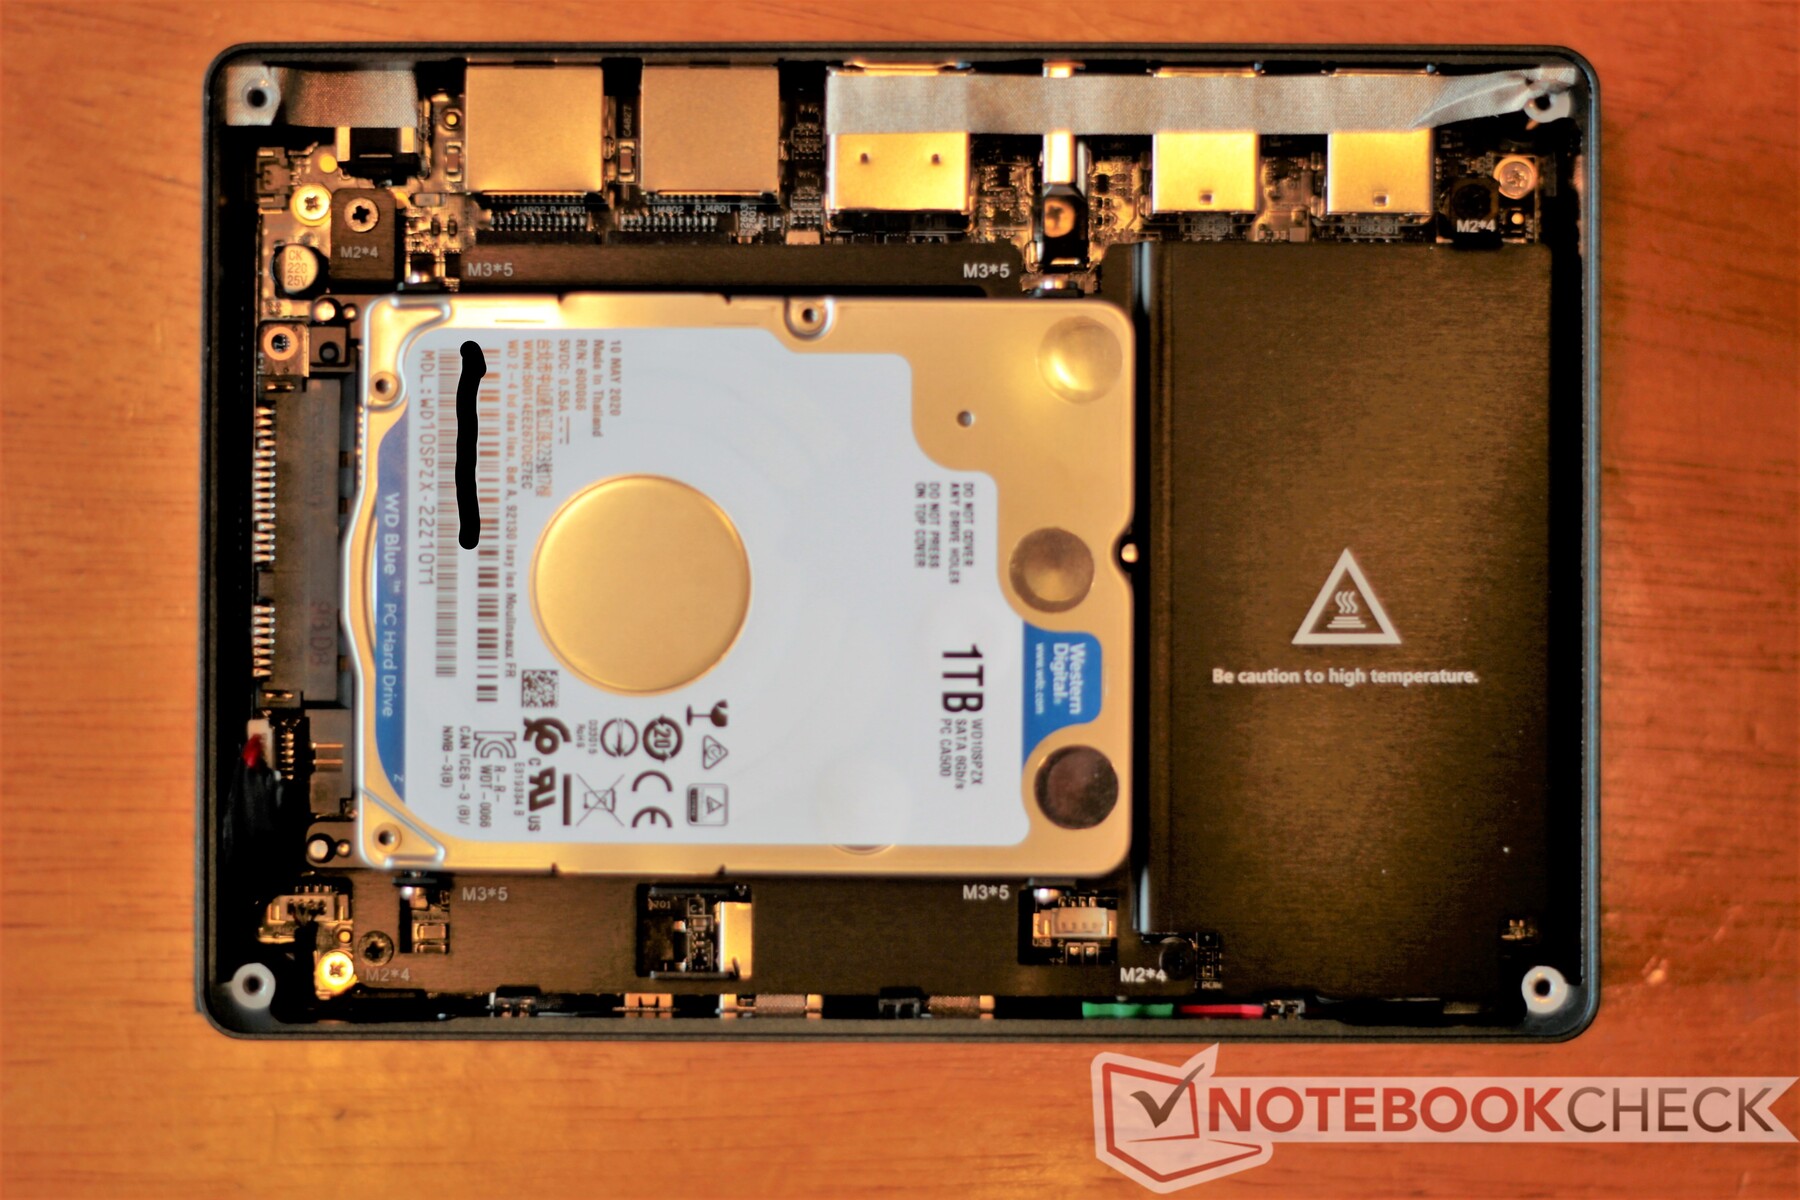
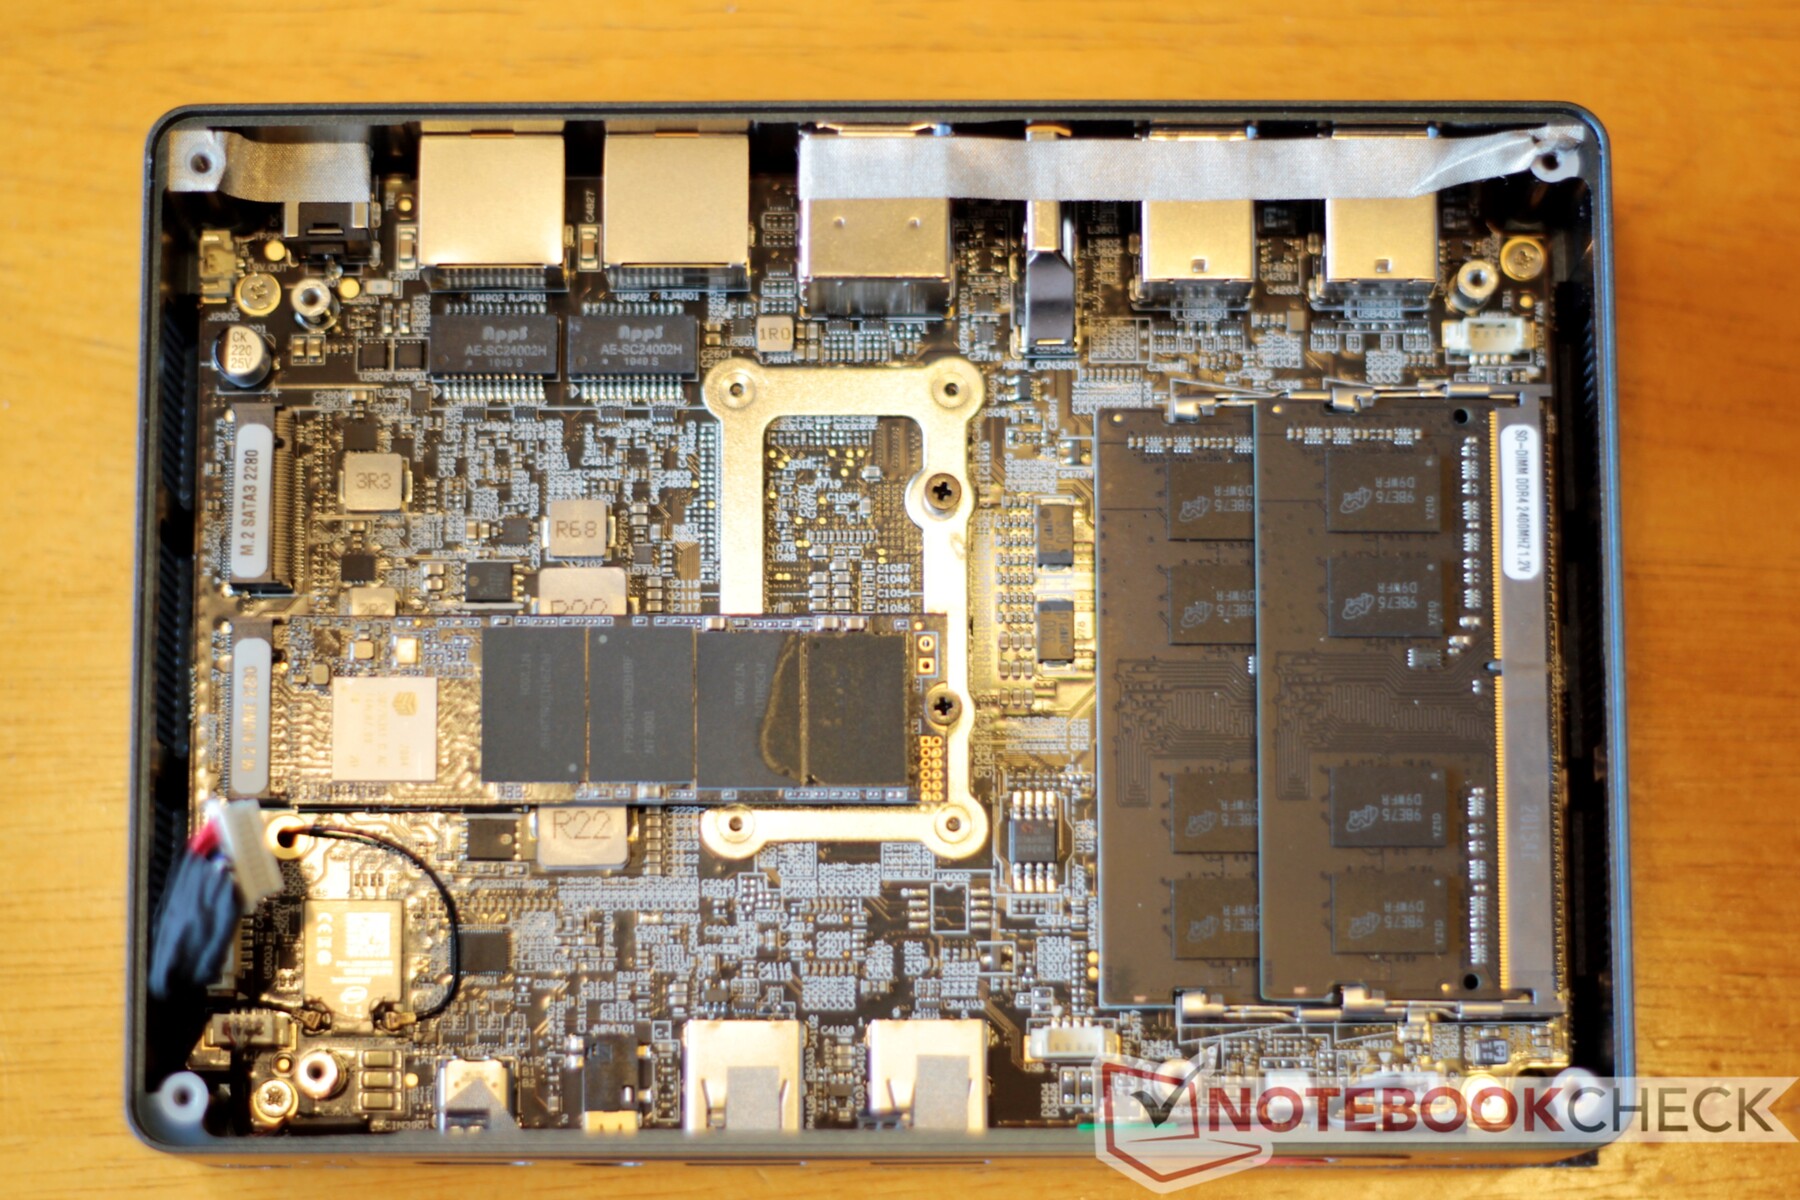
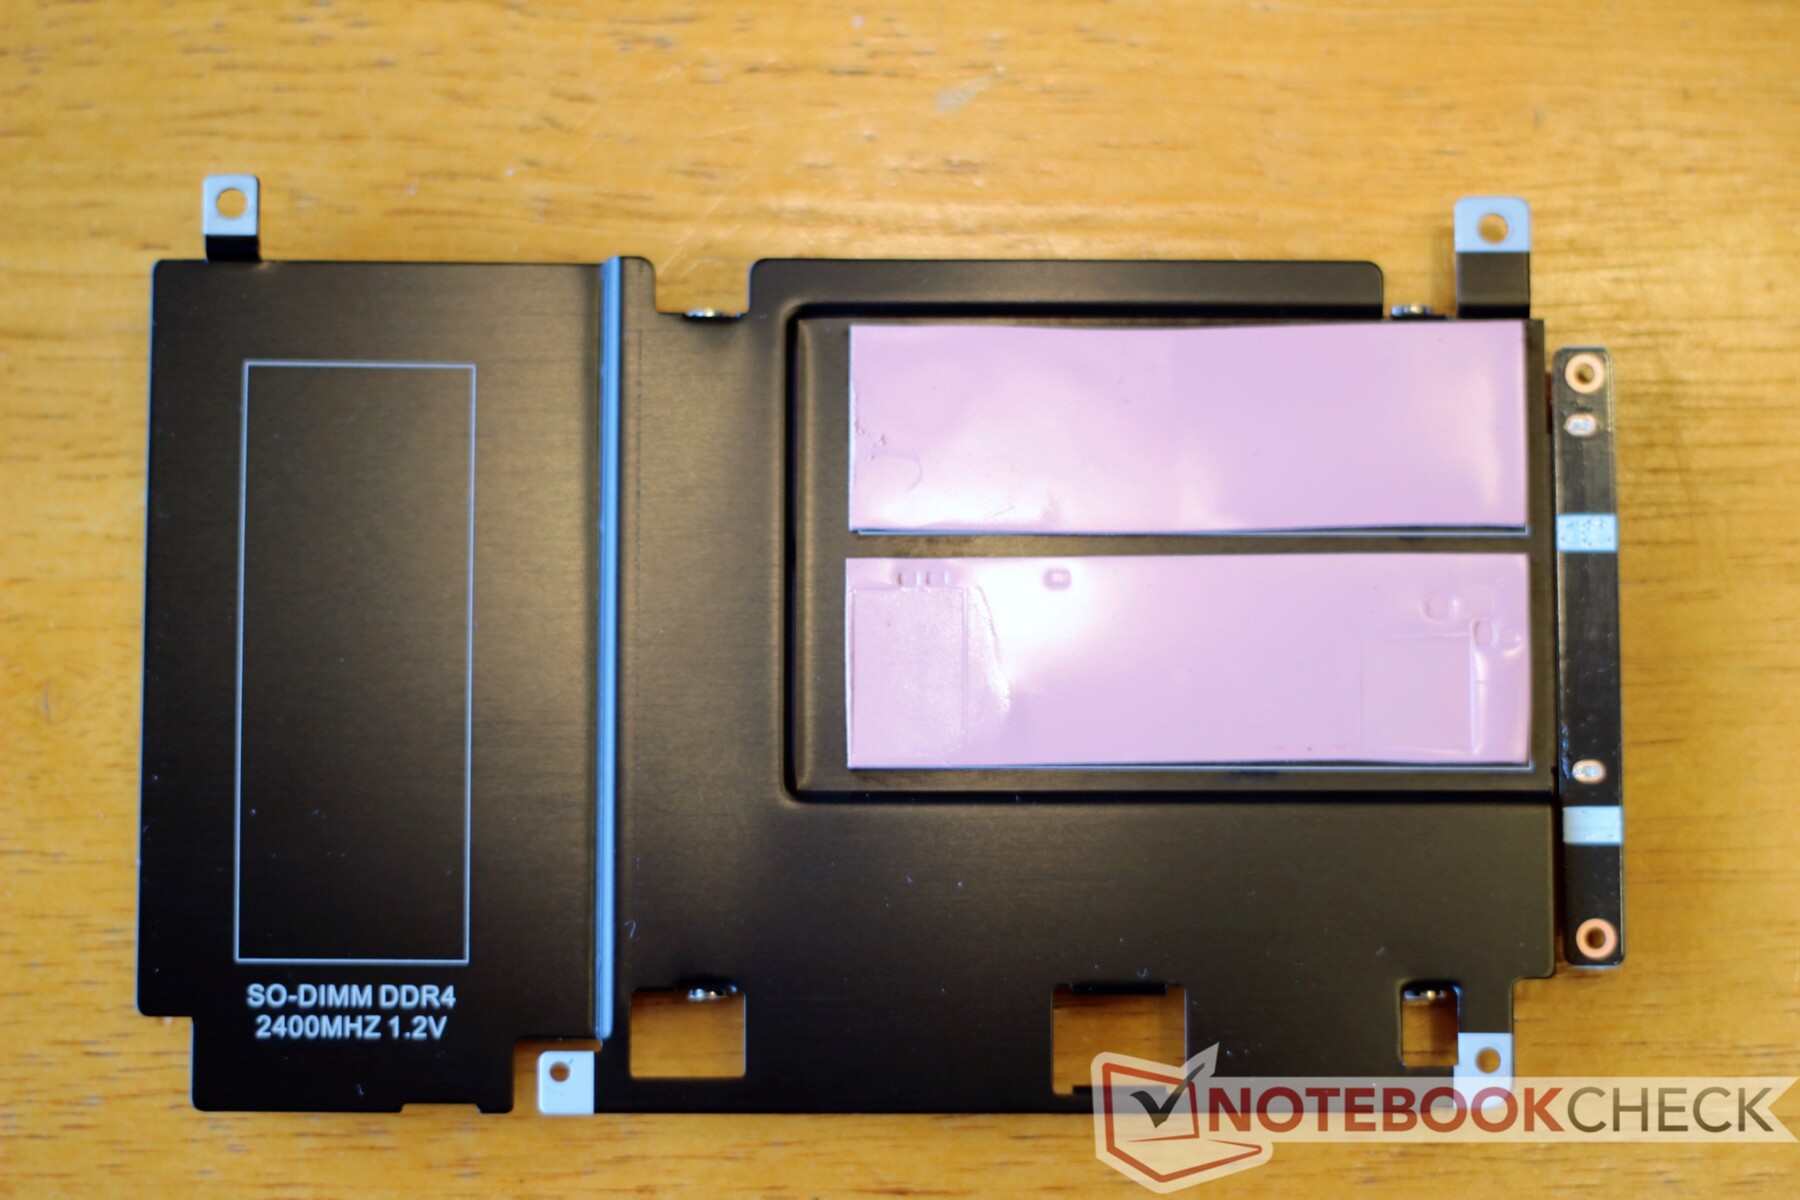
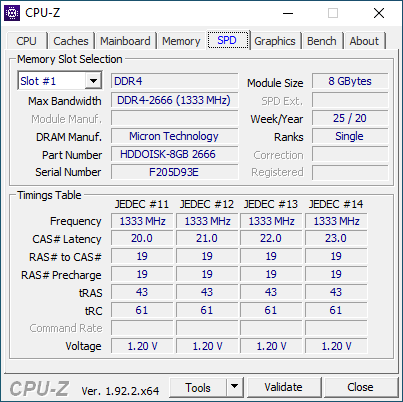
The GT-R has several options for upgrades. After removing four #00 Phillips Head screws, the bottom panel easily lifts away thanks to a handy built-in pull tab. Once inside, users are first greeted with a 2.5-inch drive bay (populated in our review unit). Unplugging a cable and removing a few more screws, users can then lift the shelf for this drive out of the way and gain access to two M.2 drive bays and two DDR4 RAM slots. Keep in mind that the left M.2 drive slot is for NVMe SSDs; the right slot only supports SATA III.
The wireless card appears to be soldered on. The Ryzen 5 3550H is also soldered and requires further disassembly to access it.

Performance
Beating at the heart of the Beelink GT-R is an AMD Ryzen 5 3550H mobile APU. The quad-core, 8-thread chip is coupled with a Radeon RX Vega 8 GPU and offers decent performance for such a small package. Beelink mixes in speedy NVMe storage, two additional bays for SATA drives, and support for up to 64 GB of RAM. In sum, the GT-R makes for a fine office machine with some media skills and light gaming chops.
Processor
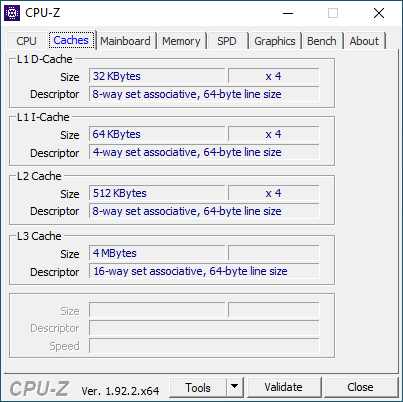
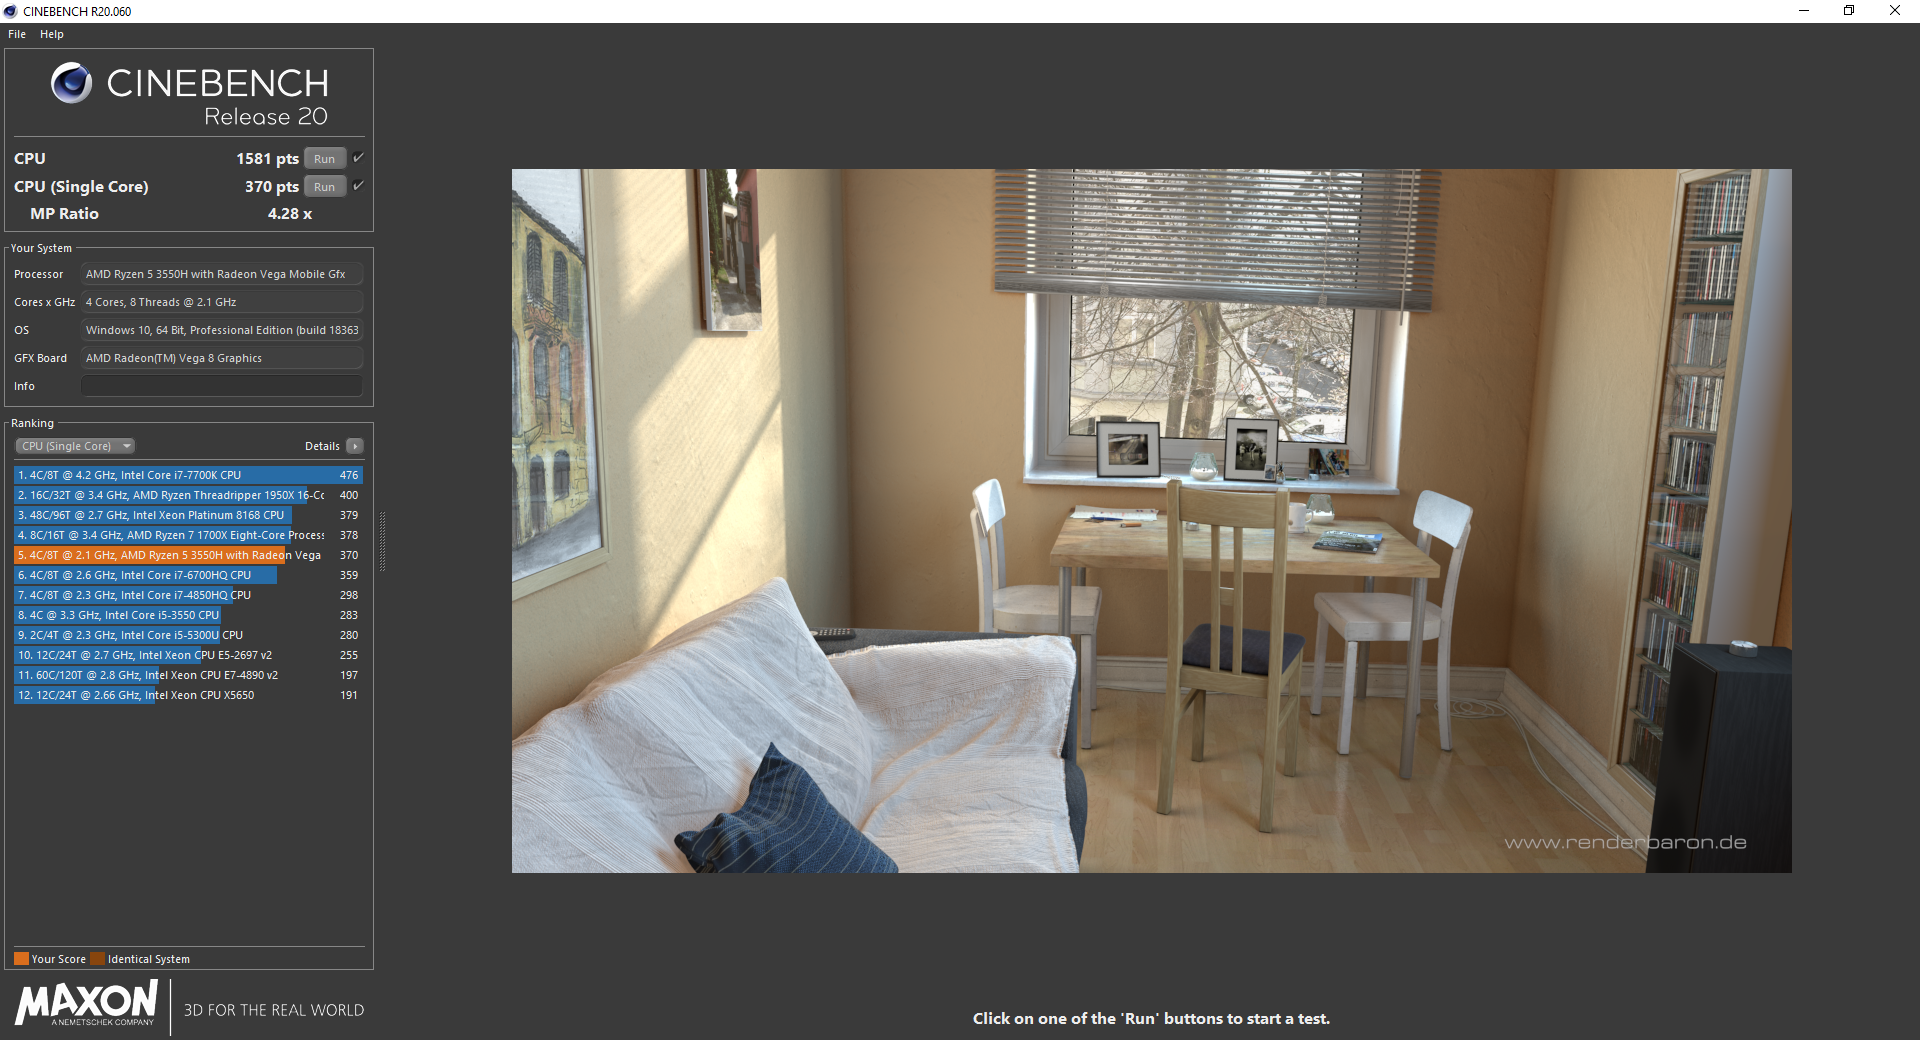
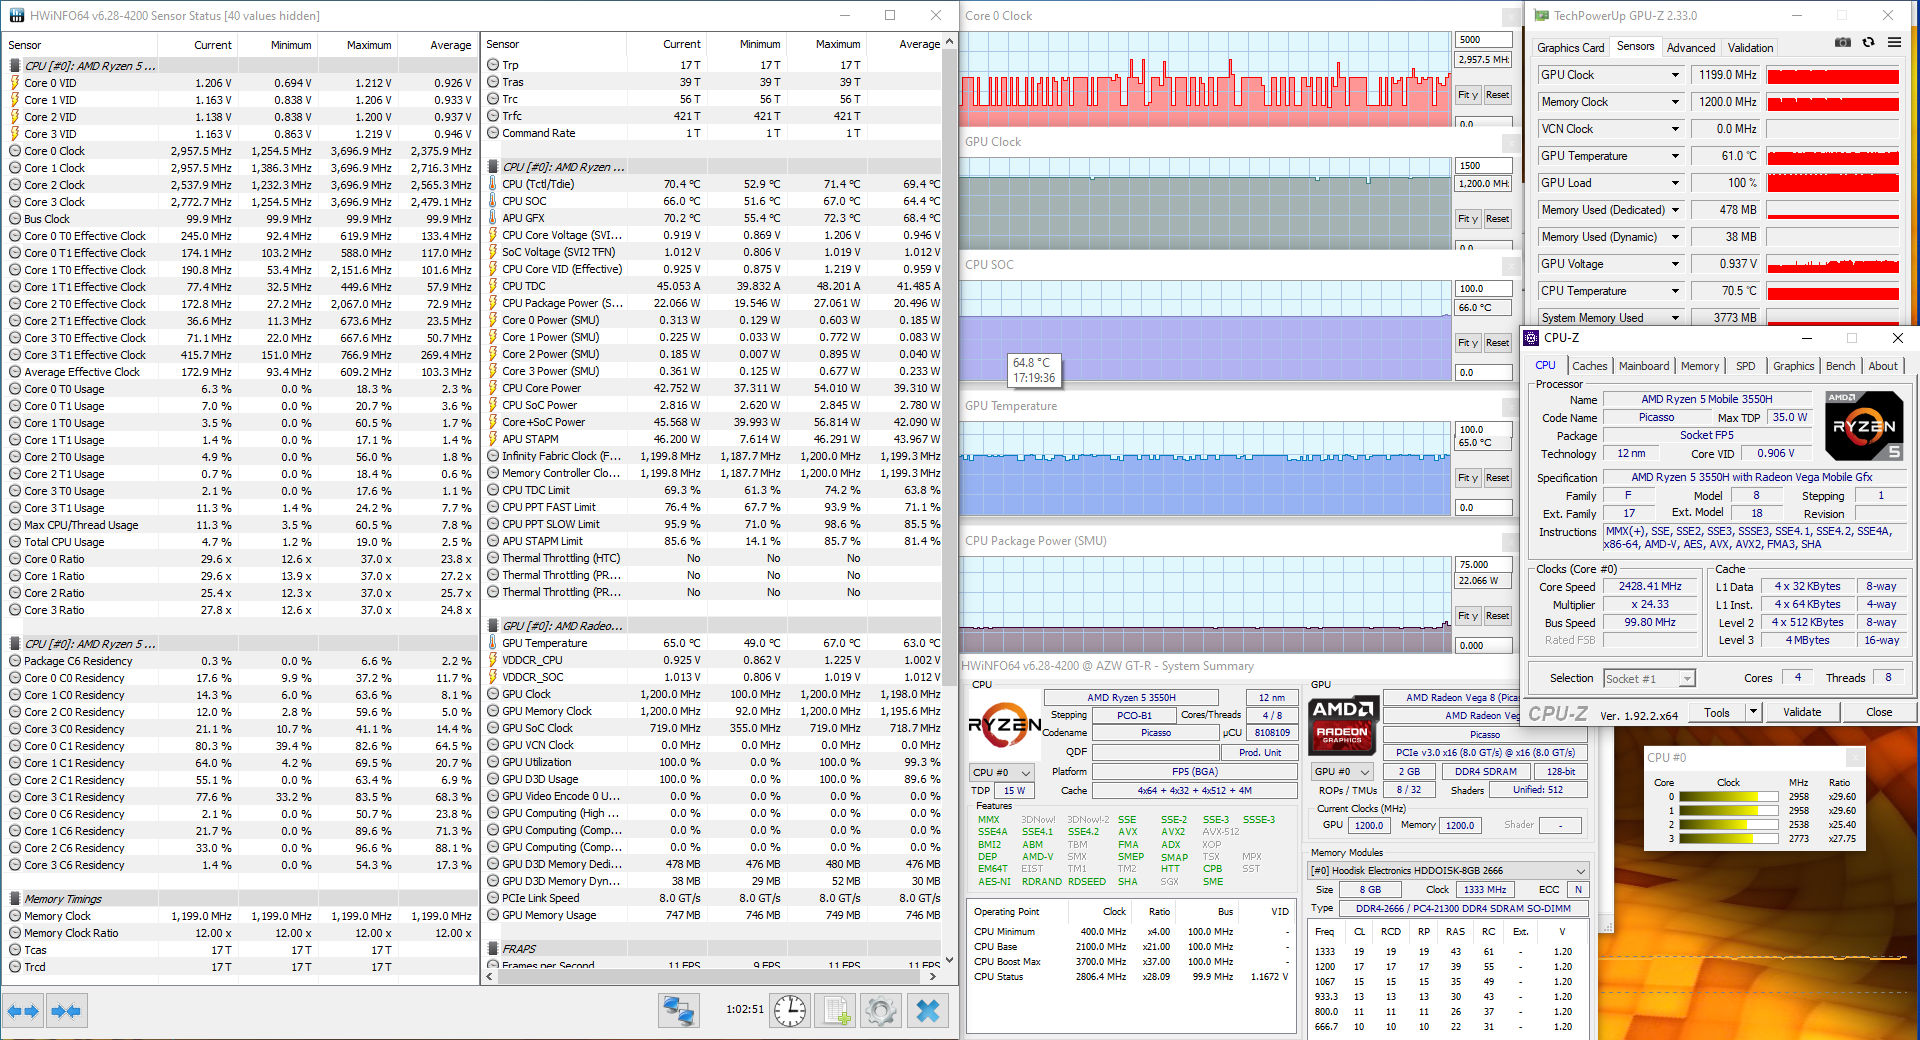
While designed for laptops, the AMD Ryzen 5 3550H performs well in the mini desktop. The 3550H utilizes four multithreaded Zen+ (12 nm) cores clocked at 2.1 GHz. The CPU can burst to 3.7 GHz on a single core for short periods.
The GT-R allows users to easily "overclock" the system through the BIOS. Essentially, the BIOS contains settings to increase the overall power envelope from the stock 35 Watts to 54 Watts with a single option change. Users can also lower the TDP to 12 Watts if desired. We will measure performance in some benchmarks at both 35 Watt and 54 Watt.
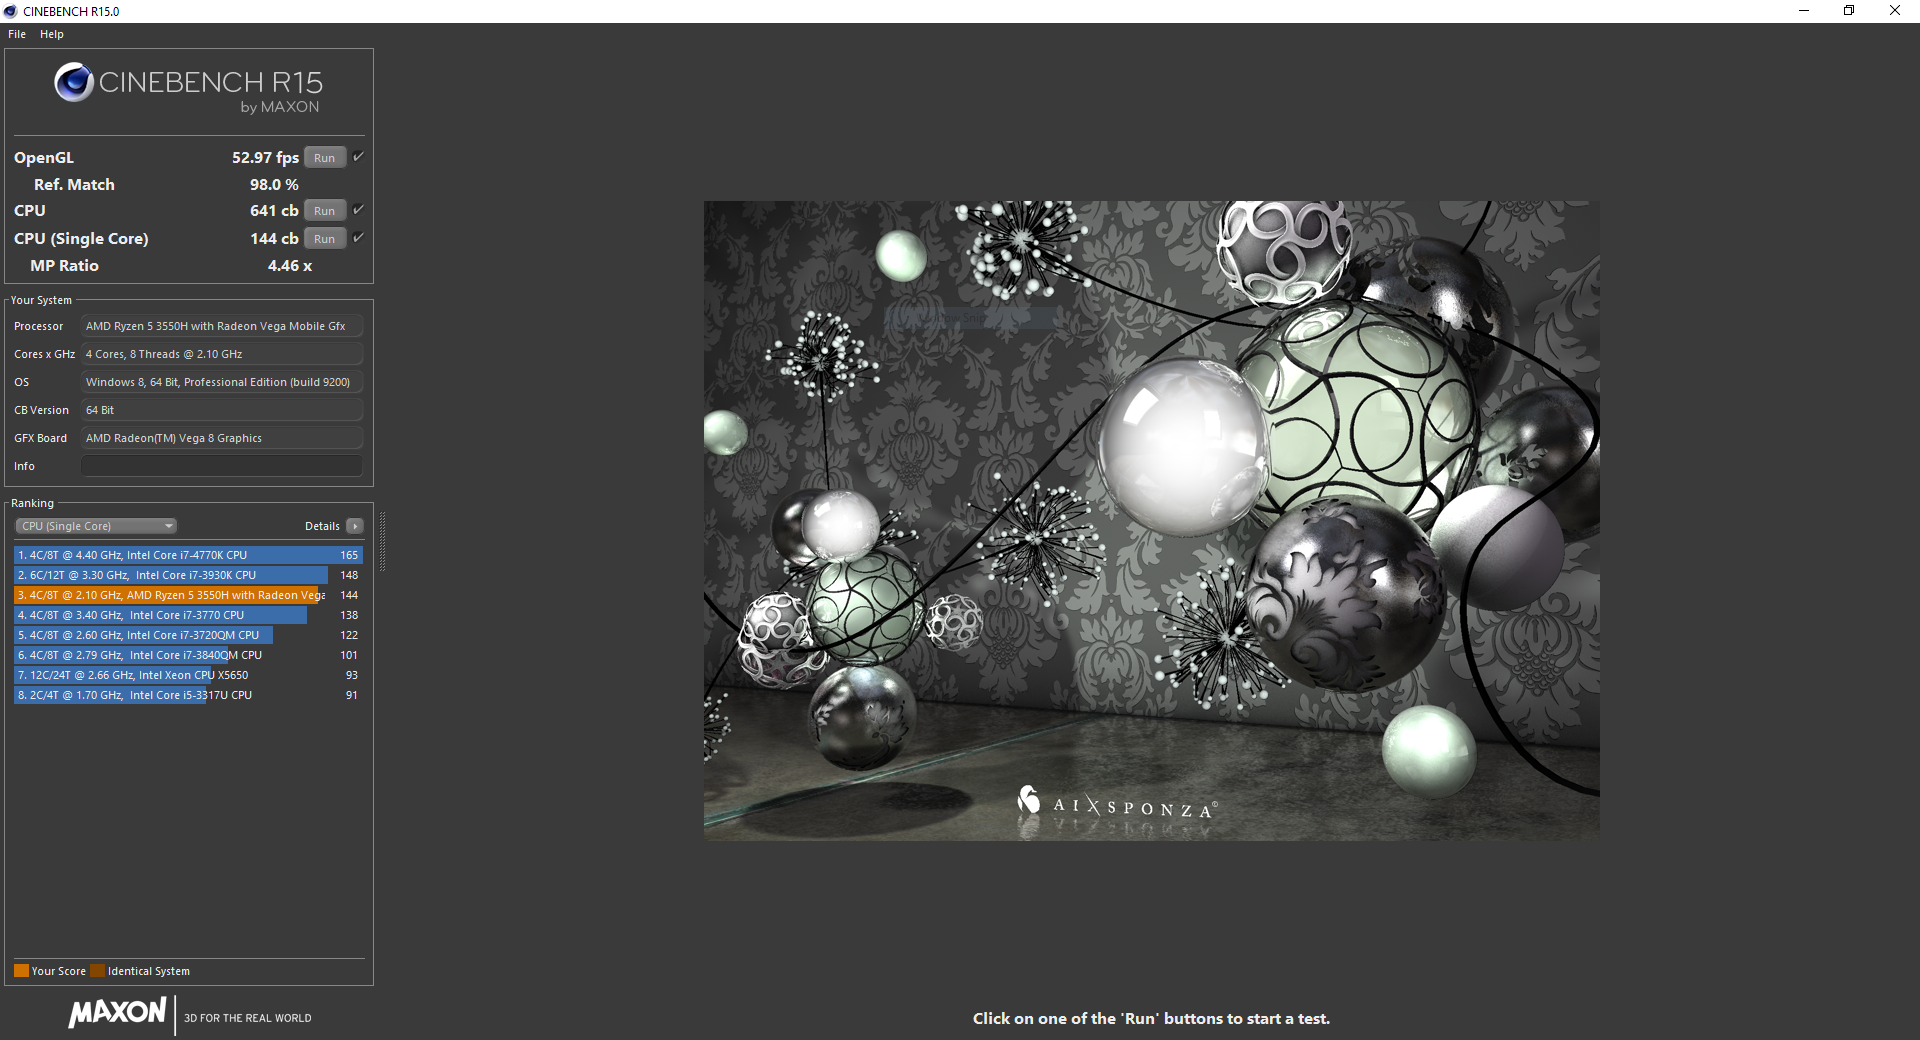
The GT-R is in line with most 3550H-powered devices in the single-core test in both Cinebench R20 and R15. However, it falls behind in multi-core tests by about 7-10%. Upping the power limit to 54 Watts grants about a 7% bump in Cinebench R15 and roughly 11% in Cinebench R20.
These numbers fall behind Intel's Comet Lake-U platform; the GT-R performs about 15-20% worse than the Intel Core i5-10210U in the Intel NUC10i5FNK and about 20-30% worse than the Core i7-10710U used in the Intel NUC10i7FNH.
Over long workloads, tested by looping Cinebench R15's single-core test 50 times, the GT-R sees an initial dip in performance before spiking back up to about 670 cb and staying steady. When set to 54 W, the CPU remains stable at about 740 cb with on dip about halfway through the test.
Cinebench R15: CPU Single 64Bit | CPU Multi 64Bit
Blender: v2.79 BMW27 CPU
7-Zip 18.03: 7z b 4 -mmt1 | 7z b 4
Geekbench 5.5: Single-Core | Multi-Core
HWBOT x265 Benchmark v2.2: 4k Preset
LibreOffice : 20 Documents To PDF
R Benchmark 2.5: Overall mean
| Cinebench R20 / CPU (Single Core) | |
| Average of class Desktop (674 - 902, n=13, last 2 years) | |
| Intel NUC10i7FNH | |
| Lenovo ThinkPad X13-20UGS00800 | |
| Lenovo ThinkPad E14 Gen2-20T7S00W00 | |
| Intel NUC10i5FNK | |
| Intel Hades Canyon NUC8i7HVK | |
| Honor MagicBook 15 | |
| Beelink GTR35 II-G-16512D00W64PRO-1T 54 Watt | |
| Lenovo IdeaPad S540-13API | |
| Average AMD Ryzen 5 3550H (331 - 370, n=8) | |
| Beelink GTR35 II-G-16512D00W64PRO-1T | |
| HP Pavilion Gaming 15-ec0002ng | |
| Cinebench R20 / CPU (Multi Core) | |
| Average of class Desktop (5710 - 16722, n=13, last 2 years) | |
| Lenovo ThinkPad X13-20UGS00800 | |
| Intel NUC10i7FNH | |
| Lenovo ThinkPad E14 Gen2-20T7S00W00 | |
| Intel Hades Canyon NUC8i7HVK | |
| Intel NUC10i5FNK | |
| HP Pavilion Gaming 15-ec0002ng | |
| Beelink GTR35 II-G-16512D00W64PRO-1T 54 Watt | |
| Average AMD Ryzen 5 3550H (1421 - 1728, n=8) | |
| Beelink GTR35 II-G-16512D00W64PRO-1T | |
| Honor MagicBook 15 | |
| Lenovo IdeaPad S540-13API | |
| Cinebench R15 / CPU Single 64Bit | |
| Average of class Desktop (246 - 356, n=17, last 2 years) | |
| Intel NUC10i7FNH | |
| Lenovo ThinkPad X13-20UGS00800 | |
| Intel Hades Canyon NUC8i7HVK | |
| Lenovo ThinkPad E14 Gen2-20T7S00W00 | |
| Intel NUC10i5FNK | |
| Zotac ZBOX-CI660 Nano | |
| Beelink GTR35 II-G-16512D00W64PRO-1T | |
| Beelink GTR35 II-G-16512D00W64PRO-1T 54 Watt | |
| Beelink GTR35 II-G-16512D00W64PRO-1T 54 Watt | |
| HP Pavilion Gaming 15-ec0002ng | |
| Honor MagicBook 15 | |
| Lenovo IdeaPad S540-13API | |
| Average AMD Ryzen 5 3550H (77 - 146, n=11) | |
| Cinebench R15 / CPU Multi 64Bit | |
| Average of class Desktop (2652 - 6588, n=17, last 2 years) | |
| Lenovo ThinkPad X13-20UGS00800 | |
| Intel NUC10i7FNH | |
| Lenovo ThinkPad E14 Gen2-20T7S00W00 | |
| Intel Hades Canyon NUC8i7HVK | |
| Intel NUC10i5FNK | |
| HP Pavilion Gaming 15-ec0002ng | |
| Beelink GTR35 II-G-16512D00W64PRO-1T 54 Watt | |
| Beelink GTR35 II-G-16512D00W64PRO-1T 54 Watt | |
| Average AMD Ryzen 5 3550H (635 - 769, n=11) | |
| Zotac ZBOX-CI660 Nano | |
| Beelink GTR35 II-G-16512D00W64PRO-1T | |
| Honor MagicBook 15 | |
| Lenovo IdeaPad S540-13API | |
| Blender / v2.79 BMW27 CPU | |
| Lenovo IdeaPad S540-13API | |
| Honor MagicBook 15 | |
| Average AMD Ryzen 5 3550H (612 - 759, n=6) | |
| Beelink GTR35 II-G-16512D00W64PRO-1T | |
| Beelink GTR35 II-G-16512D00W64PRO-1T 54 Watt | |
| Intel NUC10i5FNK | |
| Lenovo ThinkPad E14 Gen2-20T7S00W00 | |
| Intel Hades Canyon NUC8i7HVK | |
| Intel NUC10i7FNH | |
| Lenovo ThinkPad X13-20UGS00800 | |
| Average of class Desktop (75 - 218, n=15, last 2 years) | |
| 7-Zip 18.03 / 7z b 4 -mmt1 | |
| Average of class Desktop (5092 - 8392, n=15, last 2 years) | |
| Intel NUC10i7FNH | |
| Lenovo ThinkPad X13-20UGS00800 | |
| Lenovo ThinkPad E14 Gen2-20T7S00W00 | |
| Intel NUC10i5FNK | |
| Intel Hades Canyon NUC8i7HVK | |
| Average AMD Ryzen 5 3550H (3472 - 3652, n=6) | |
| Lenovo IdeaPad S540-13API | |
| Beelink GTR35 II-G-16512D00W64PRO-1T | |
| Honor MagicBook 15 | |
| Beelink GTR35 II-G-16512D00W64PRO-1T 54 Watt | |
| 7-Zip 18.03 / 7z b 4 | |
| Average of class Desktop (54166 - 163125, n=15, last 2 years) | |
| Lenovo ThinkPad X13-20UGS00800 | |
| Intel NUC10i7FNH | |
| Lenovo ThinkPad E14 Gen2-20T7S00W00 | |
| Intel NUC10i5FNK | |
| Intel Hades Canyon NUC8i7HVK | |
| Beelink GTR35 II-G-16512D00W64PRO-1T 54 Watt | |
| Average AMD Ryzen 5 3550H (16683 - 19409, n=6) | |
| Honor MagicBook 15 | |
| Lenovo IdeaPad S540-13API | |
| Beelink GTR35 II-G-16512D00W64PRO-1T | |
| Geekbench 5.5 / Single-Core | |
| Average of class Desktop (1755 - 2559, n=28, last 2 years) | |
| Intel NUC10i7FNH | |
| Lenovo ThinkPad X13-20UGS00800 | |
| Lenovo ThinkPad E14 Gen2-20T7S00W00 | |
| Intel NUC10i5FNK | |
| Honor MagicBook 15 | |
| Beelink GTR35 II-G-16512D00W64PRO-1T | |
| Beelink GTR35 II-G-16512D00W64PRO-1T 54 Watt | |
| Average AMD Ryzen 5 3550H (880 - 907, n=5) | |
| HP Pavilion Gaming 15-ec0002ng | |
| Geekbench 5.5 / Multi-Core | |
| Average of class Desktop (12626 - 26186, n=28, last 2 years) | |
| Intel NUC10i7FNH | |
| Lenovo ThinkPad X13-20UGS00800 | |
| Lenovo ThinkPad E14 Gen2-20T7S00W00 | |
| Intel NUC10i5FNK | |
| HP Pavilion Gaming 15-ec0002ng | |
| Average AMD Ryzen 5 3550H (3162 - 3486, n=5) | |
| Beelink GTR35 II-G-16512D00W64PRO-1T | |
| Honor MagicBook 15 | |
| Beelink GTR35 II-G-16512D00W64PRO-1T 54 Watt | |
| HWBOT x265 Benchmark v2.2 / 4k Preset | |
| Average of class Desktop (18.6 - 48.5, n=13, last 2 years) | |
| Lenovo ThinkPad X13-20UGS00800 | |
| Intel NUC10i7FNH | |
| Intel Hades Canyon NUC8i7HVK | |
| Lenovo ThinkPad E14 Gen2-20T7S00W00 | |
| Intel NUC10i5FNK | |
| Beelink GTR35 II-G-16512D00W64PRO-1T 54 Watt | |
| Honor MagicBook 15 | |
| Beelink GTR35 II-G-16512D00W64PRO-1T | |
| Average AMD Ryzen 5 3550H (3.7 - 4.43, n=5) | |
| Lenovo IdeaPad S540-13API | |
| LibreOffice / 20 Documents To PDF | |
| Average AMD Ryzen 5 3550H (73.3 - 92.7, n=4) | |
| Honor MagicBook 15 | |
| Beelink GTR35 II-G-16512D00W64PRO-1T | |
| Beelink GTR35 II-G-16512D00W64PRO-1T 54 Watt | |
| Lenovo ThinkPad E14 Gen2-20T7S00W00 | |
| Lenovo ThinkPad X13-20UGS00800 | |
| Average of class Desktop (35.5 - 79.2, n=14, last 2 years) | |
| R Benchmark 2.5 / Overall mean | |
| Honor MagicBook 15 | |
| Average AMD Ryzen 5 3550H (0.732 - 0.752, n=4) | |
| Beelink GTR35 II-G-16512D00W64PRO-1T | |
| Beelink GTR35 II-G-16512D00W64PRO-1T 54 Watt | |
| Intel NUC10i5FNK | |
| Intel NUC10i7FNH | |
| Lenovo ThinkPad E14 Gen2-20T7S00W00 | |
| Lenovo ThinkPad X13-20UGS00800 | |
| Average of class Desktop (0.3307 - 0.4909, n=14, last 2 years) | |
* ... smaller is better
System Performance
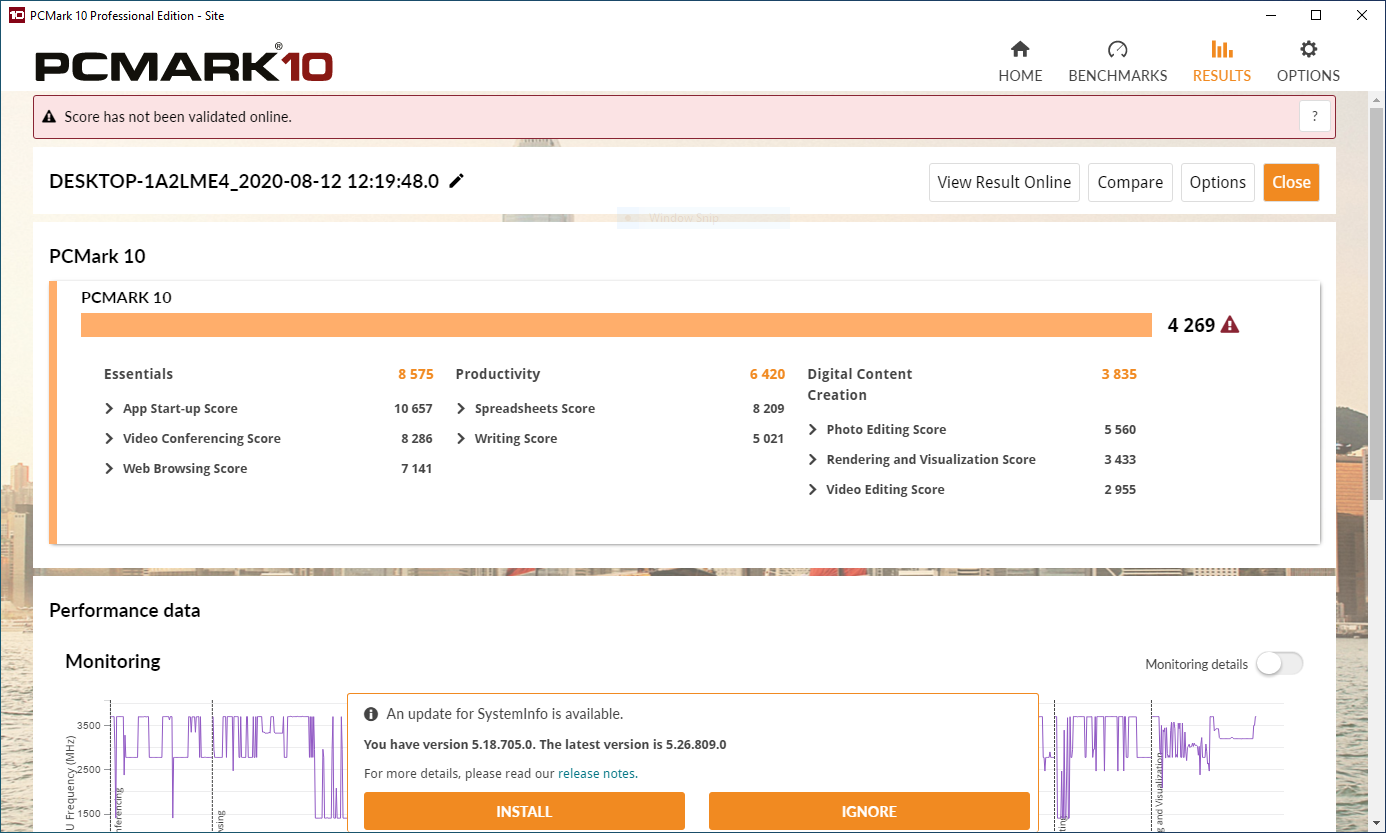
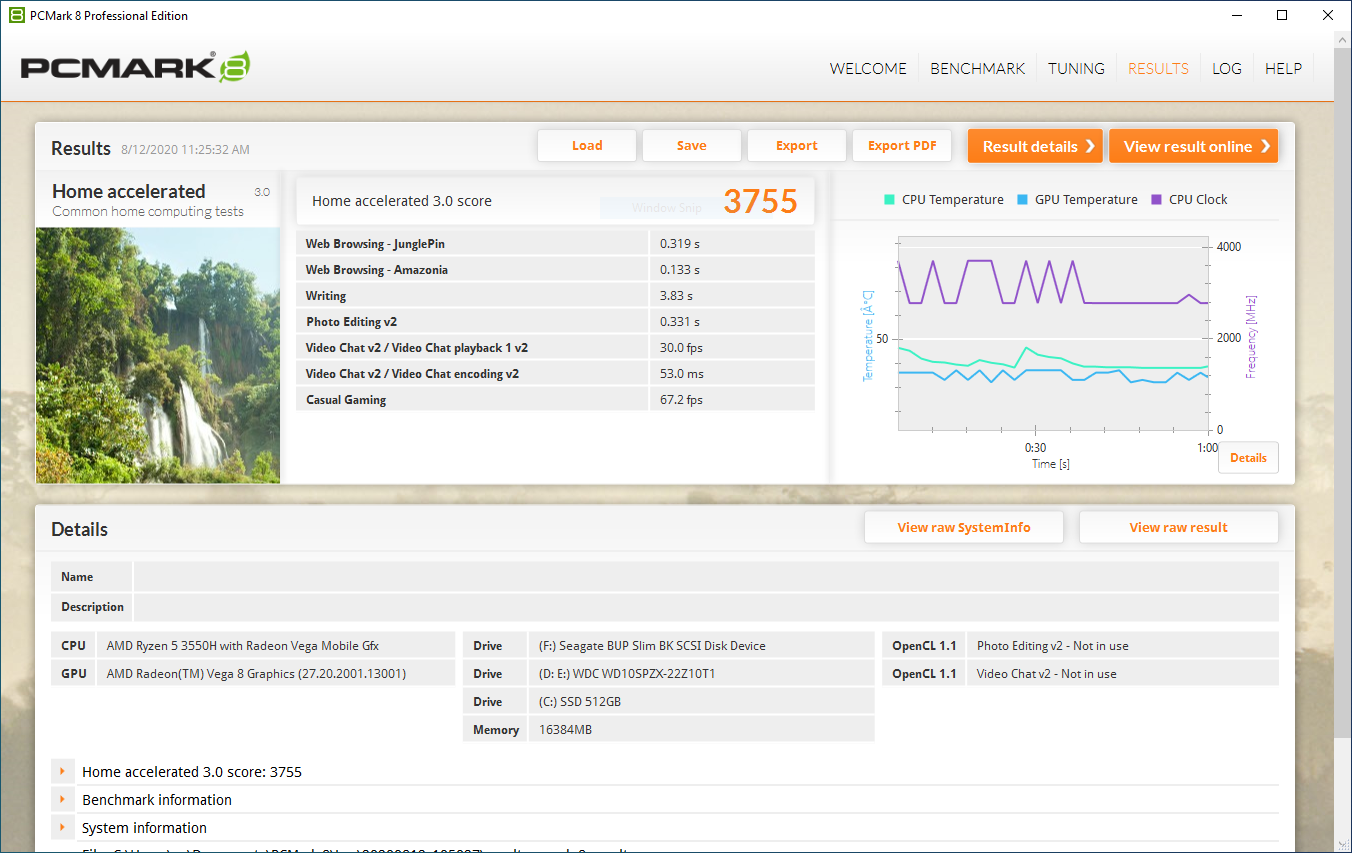
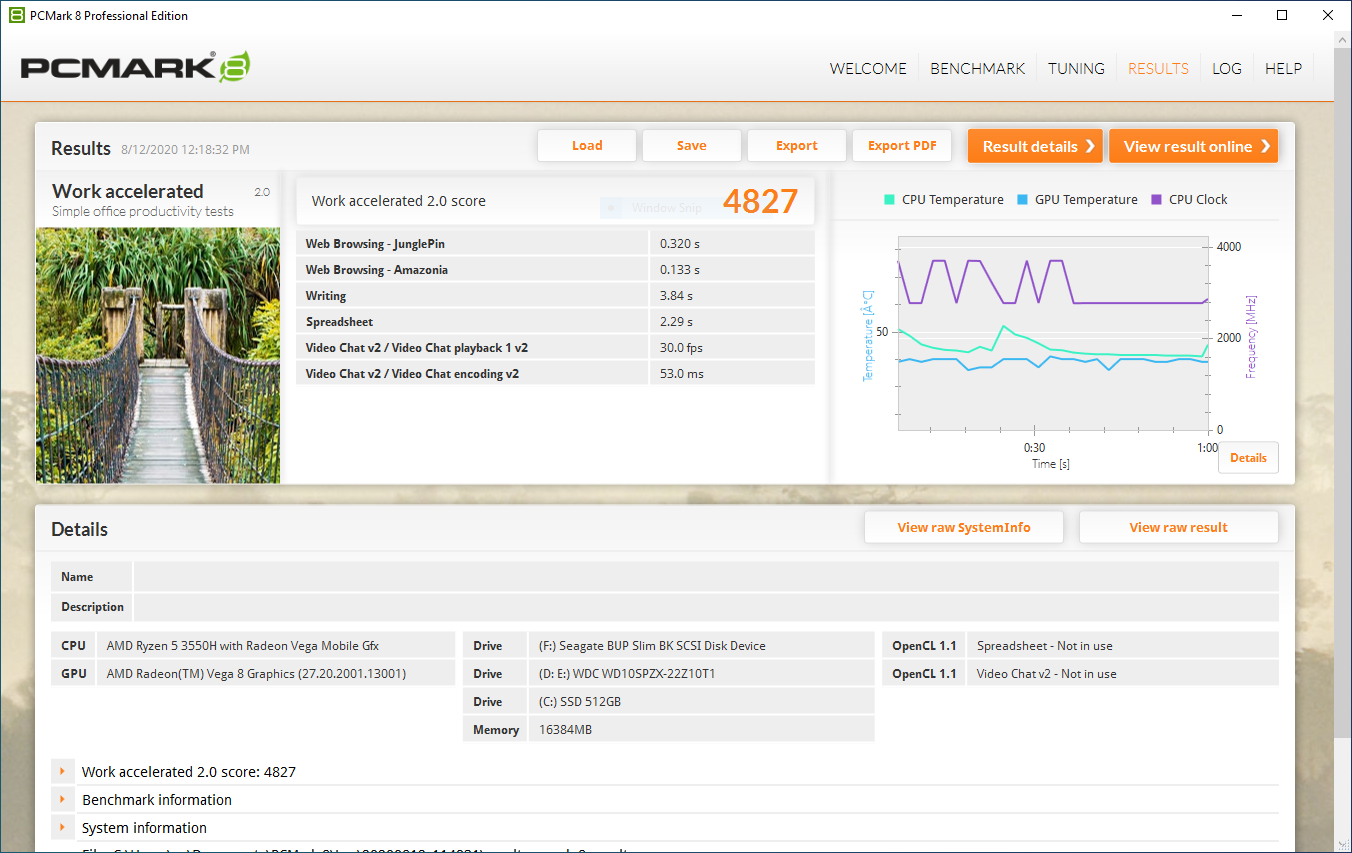
Overall system performance is good. Applications open quickly thanks to the speedy NVMe drive, and office tasks are easily handled. The GT-R can chew through some lighter graphical work thanks to the onboard Radeon RX Vega 8 GPU, but heavier workloads will slow it down.
The 54 Watt mode offers negligible improvements in overall system performance as measured by PCMark.
| PCMark 8 - Home Score Accelerated v2 | |
| Average of class Desktop (n=1last 2 years) | |
| Intel Hades Canyon NUC8i7HVK | |
| Intel NUC8i7BE | |
| Intel NUC10i7FNH | |
| Beelink GTR35 II-G-16512D00W64PRO-1T 54 Watt | |
| Average AMD Ryzen 5 3550H, AMD Radeon RX Vega 8 (Ryzen 2000/3000) (3755 - 3846, n=2) | |
| Beelink GTR35 II-G-16512D00W64PRO-1T | |
| Zotac ZBOX-CI660 Nano | |
| Intel NUC10i5FNK | |
| PCMark 8 Home Score Accelerated v2 | 3755 points | |
| PCMark 8 Work Score Accelerated v2 | 4827 points | |
| PCMark 10 Score | 4269 points | |
Help | ||
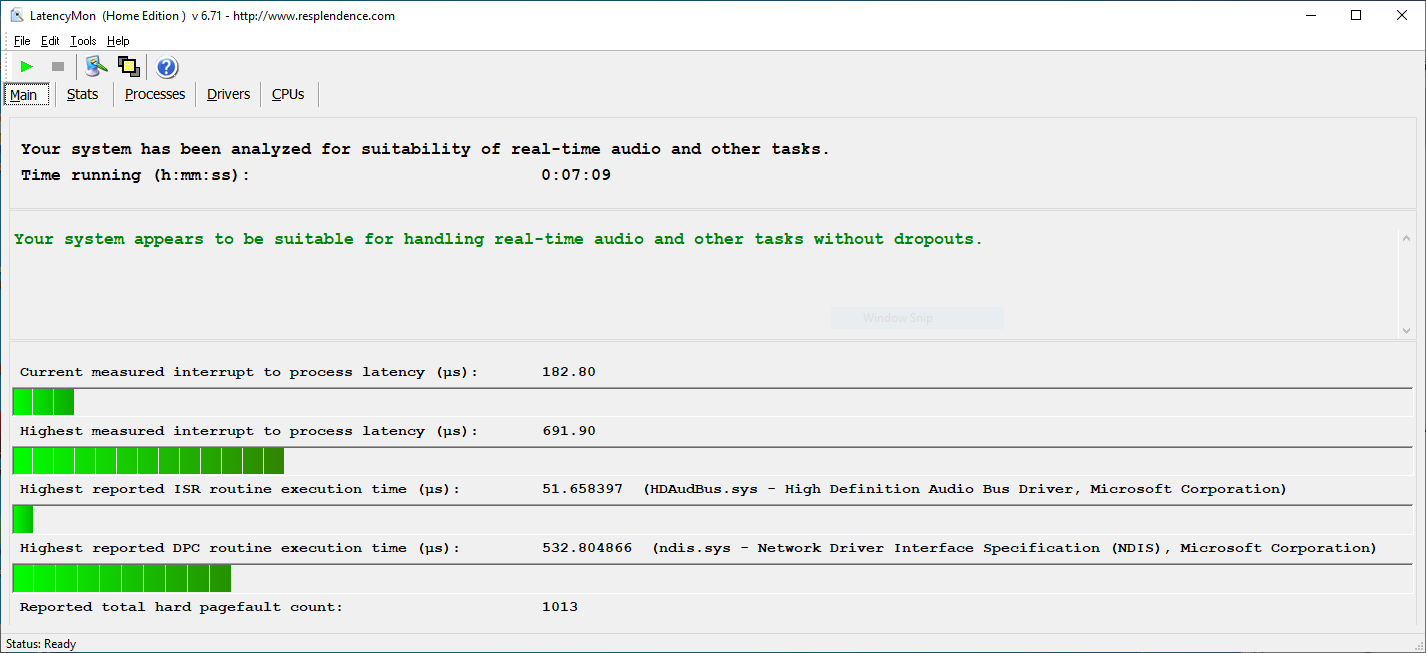
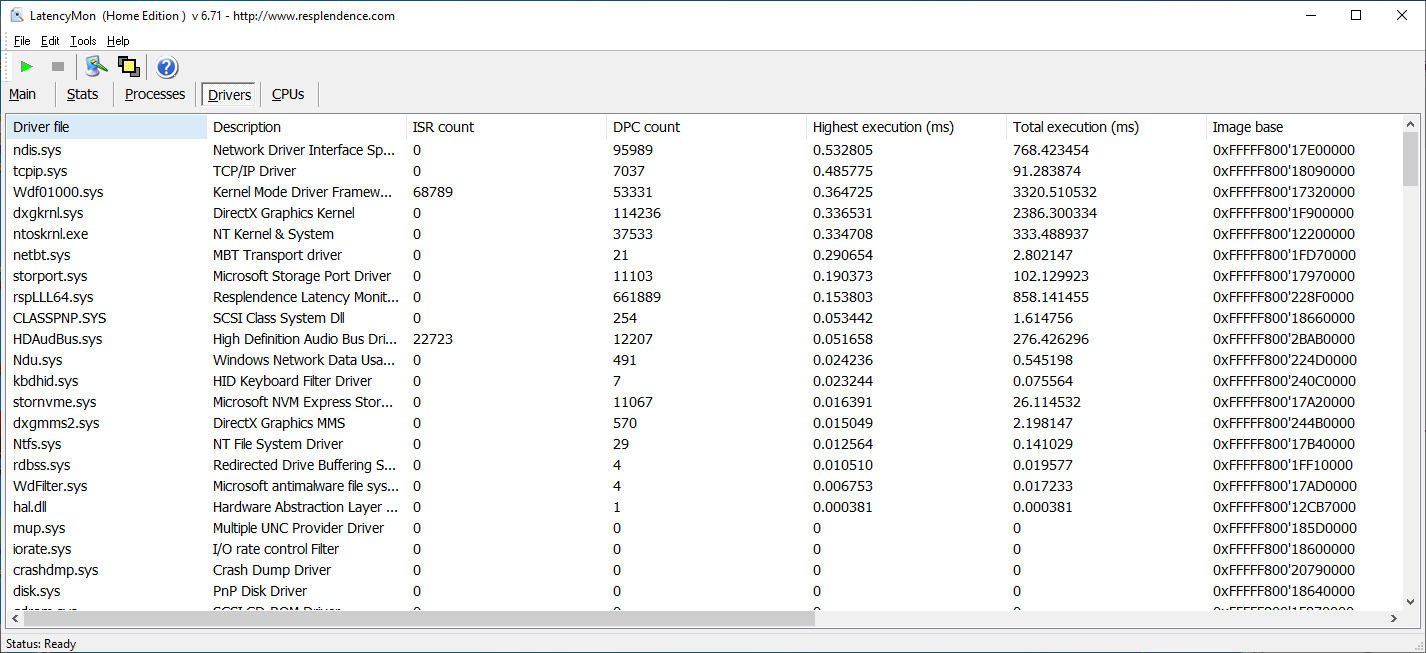
DPC Latency
Audio latency doesn't present a significant problem. In our standardized latency test (streaming a 4K YouTube video, web browsing, and running Prime95), the GT-R shows reasonable numbers. However, the GT-R dropped 35 out of the 3683 frames during our 4K YouTube video stream test. As such, users may notice some choppiness when streaming 4K media.
| DPC Latencies / LatencyMon - interrupt to process latency (max), Web, Youtube, Prime95 | |
| Lenovo ThinkPad T14s-20T00044GE | |
| Lenovo ThinkPad X13-20UGS00800 | |
| Lenovo ThinkPad T14s-20UJS00K00 | |
| HP Envy x360 13-ay0010nr | |
| Dell Latitude 7410 | |
| Beelink GTR35 II-G-16512D00W64PRO-1T | |
| Lenovo IdeaPad 5 14ARE05 | |
* ... smaller is better
Storage Devices
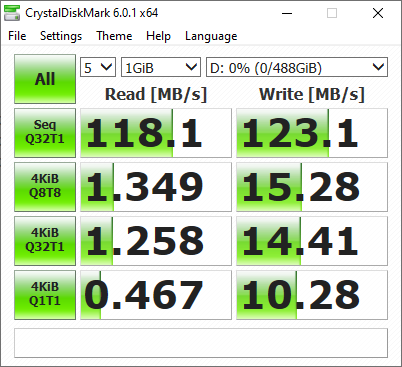
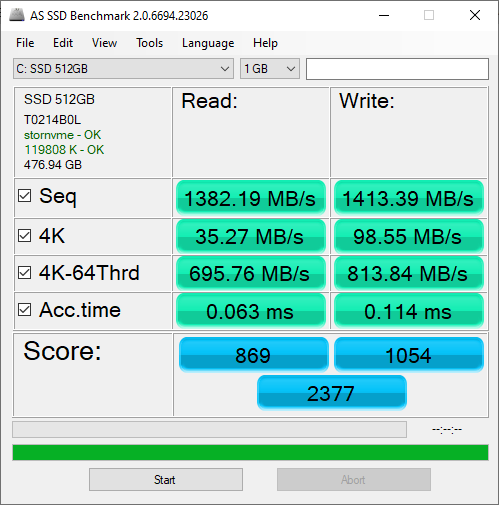
The GT-R supports an M.2 NVMe SSD, and M.2 SATA drive, and a 2.5-inch SATA drive. The generic NVMe drive included with our review unit is lightning fast and offers performance on par with high-end drives from Samsung and Kingston. Beelink also included a 1 TB Western Digital Blue 7200 RPM drive (2.5") for mass storage. It performs as expected.
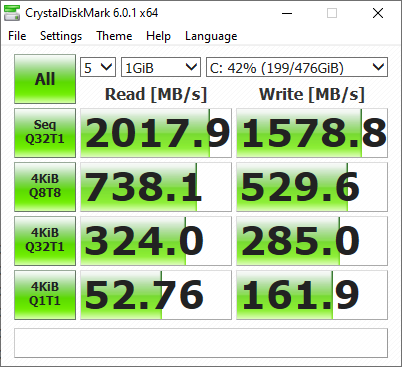
| Beelink GTR35 II-G-16512D00W64PRO-1T Silicon Motion AZW 512G NV428 | Intel NUC10i7FNH Kingston RBUSNS8154P3256GJ1 | Intel NUC10i5FNK Kingston RBUSNS8154P3256GJ1 | Intel Hades Canyon NUC8i7HVK Intel Optane 120 GB SSDPEK1W120GA | |
|---|---|---|---|---|
| CrystalDiskMark 5.2 / 6 | 91% | -16% | 23% | |
| Write 4K (MB/s) | 161.9 | 442.4 173% | 58.4 -64% | 133.7 -17% |
| Read 4K (MB/s) | 52.8 | 371.1 603% | 30.24 -43% | 178.6 238% |
| Write Seq (MB/s) | 900 | 773 | 608 | |
| Read Seq (MB/s) | 1582 | 712 | 1428 | |
| Write 4K Q32T1 (MB/s) | 285 | 373.8 31% | 448.5 57% | 323.6 14% |
| Read 4K Q32T1 (MB/s) | 324 | 374.9 16% | 391.4 21% | 282.3 -13% |
| Write Seq Q32T1 (MB/s) | 1579 | 893 -43% | 914 -42% | 627 -60% |
| Read Seq Q32T1 (MB/s) | 2018 | 1582 -22% | 1583 -22% | 1521 -25% |
| Write 4K Q8T8 (MB/s) | 530 | 399.1 -25% | 402.3 -24% | |
| Read 4K Q8T8 (MB/s) | 738 | 688 -7% | 680 -8% | |
| AS SSD | -18% | -21% | 36% | |
| Seq Read (MB/s) | 1382 | 1306 -5% | 1318 -5% | 1379 0% |
| Seq Write (MB/s) | 1413 | 611 -57% | 616 -56% | 553 -61% |
| 4K Read (MB/s) | 35.27 | 21.53 -39% | 26.44 -25% | 127.9 263% |
| 4K Write (MB/s) | 98.6 | 53.5 -46% | 61.3 -38% | 103.5 5% |
| 4K-64 Read (MB/s) | 696 | 652 -6% | 650 -7% | 1258 81% |
| 4K-64 Write (MB/s) | 814 | 648 -20% | 642 -21% | 556 -32% |
| Access Time Read * (ms) | 0.063 | 0.114 -81% | 0.11 -75% | 0.025 60% |
| Access Time Write * (ms) | 0.114 | 0.07 39% | 0.07 39% | 0.033 71% |
| Score Read (Points) | 869 | 804 -7% | 808 -7% | 1524 75% |
| Score Write (Points) | 1054 | 762 -28% | 765 -27% | 714 -32% |
| Score Total (Points) | 2377 | 1944 -18% | 1955 -18% | 3023 27% |
| Copy ISO MB/s (MB/s) | 1228 | 976 -21% | 576 -53% | 1125 -8% |
| Copy Program MB/s (MB/s) | 261.7 | 346 32% | 328.9 26% | 342.4 31% |
| Copy Game MB/s (MB/s) | 658 | 735 12% | 471.2 -28% | 768 17% |
| Total Average (Program / Settings) | 37% /
22% | -19% /
-19% | 30% /
32% |
* ... smaller is better

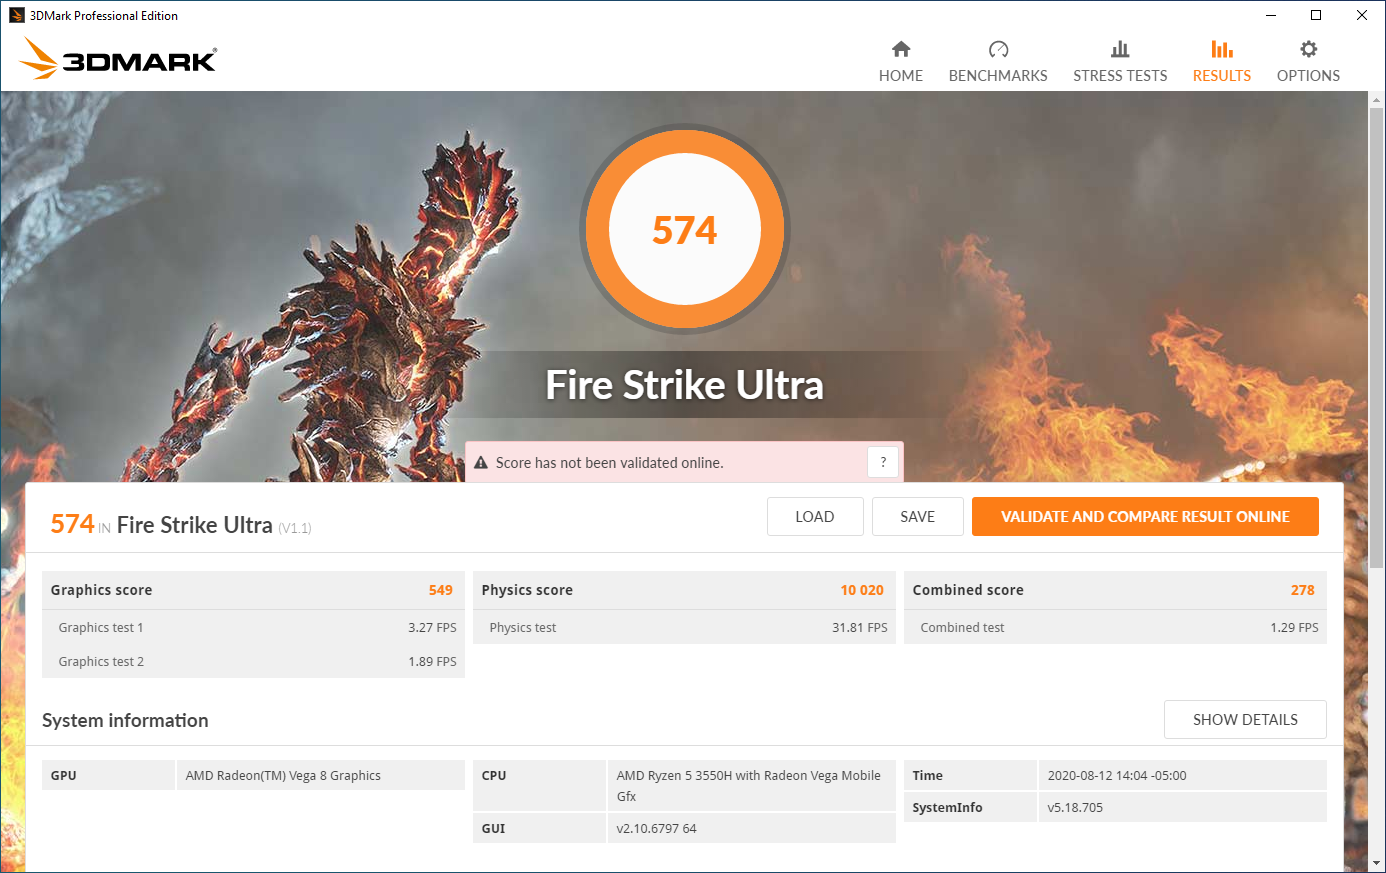
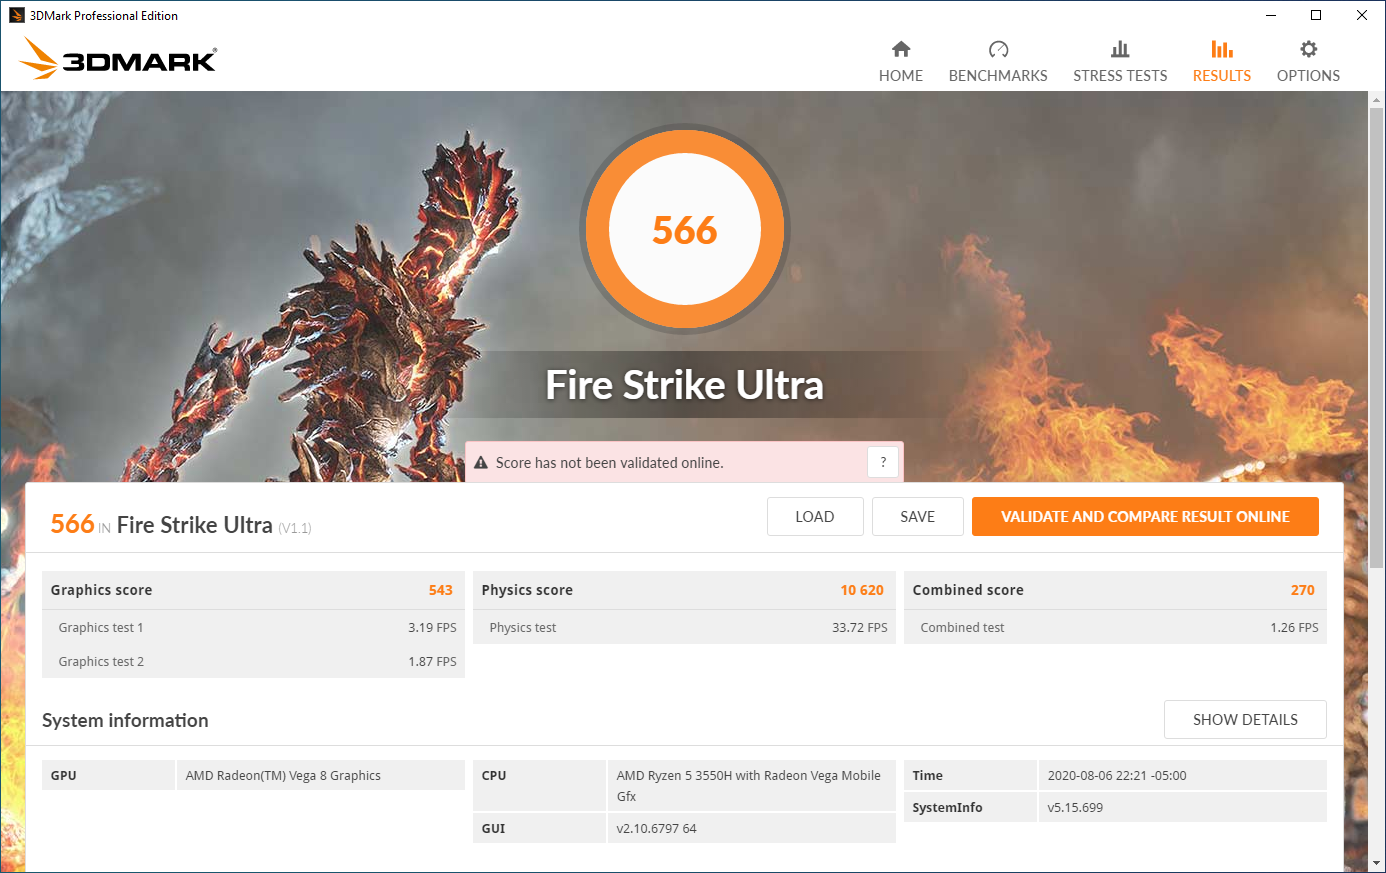
GPU Performance
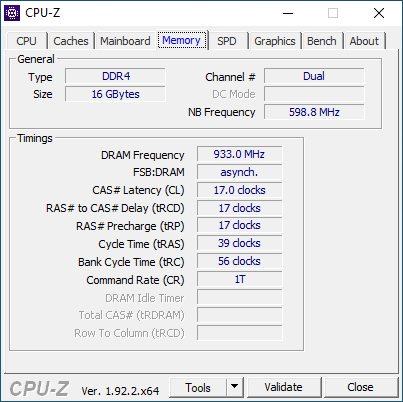
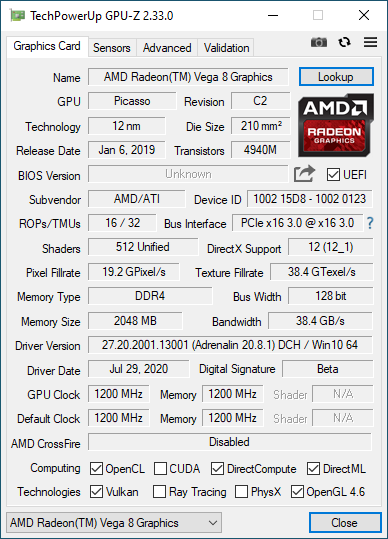
The Radeon RX Vega 8 GPU is a decent option for lighter graphical work. The GPU features 8 CUs clocked at 1200 MHz. As it is built onto the CPU die, the Vega 8 GPU relies on the PC's RAM for its video memory; as such, faster RAM in a dual-channel configuration generally increases performance.
The Vega 8 GPU is about twice as fast as Intel's UHD Graphics 620, which is used in most Comet Lake Ultrabooks and NUCs. It even bests the more powerful Intel Iris Plus Graphics 655 by a fair margin (21%) in 3DMark's Fire Strike. However, the Vega 8 graphics cannot keep up with entry-level GPUs like the Nvidia GeForce MX330. More powerful GPUs, like the Radeon RX 5300M used in the MSI Bravo 15, blow the Vega 8 out of the water.
Interestingly, switching the GT-R to its 54 Watt mode does not increase GPU power in any noticeable way; the Vega 8's max clock speed stays locked at 1200 MHz. In fact, increasing the wattage to the CPU seems to hinder graphical performance, perhaps due to thermal throttling; Fire Strike recorded lower scores when the CPU was set to 54 Watts.
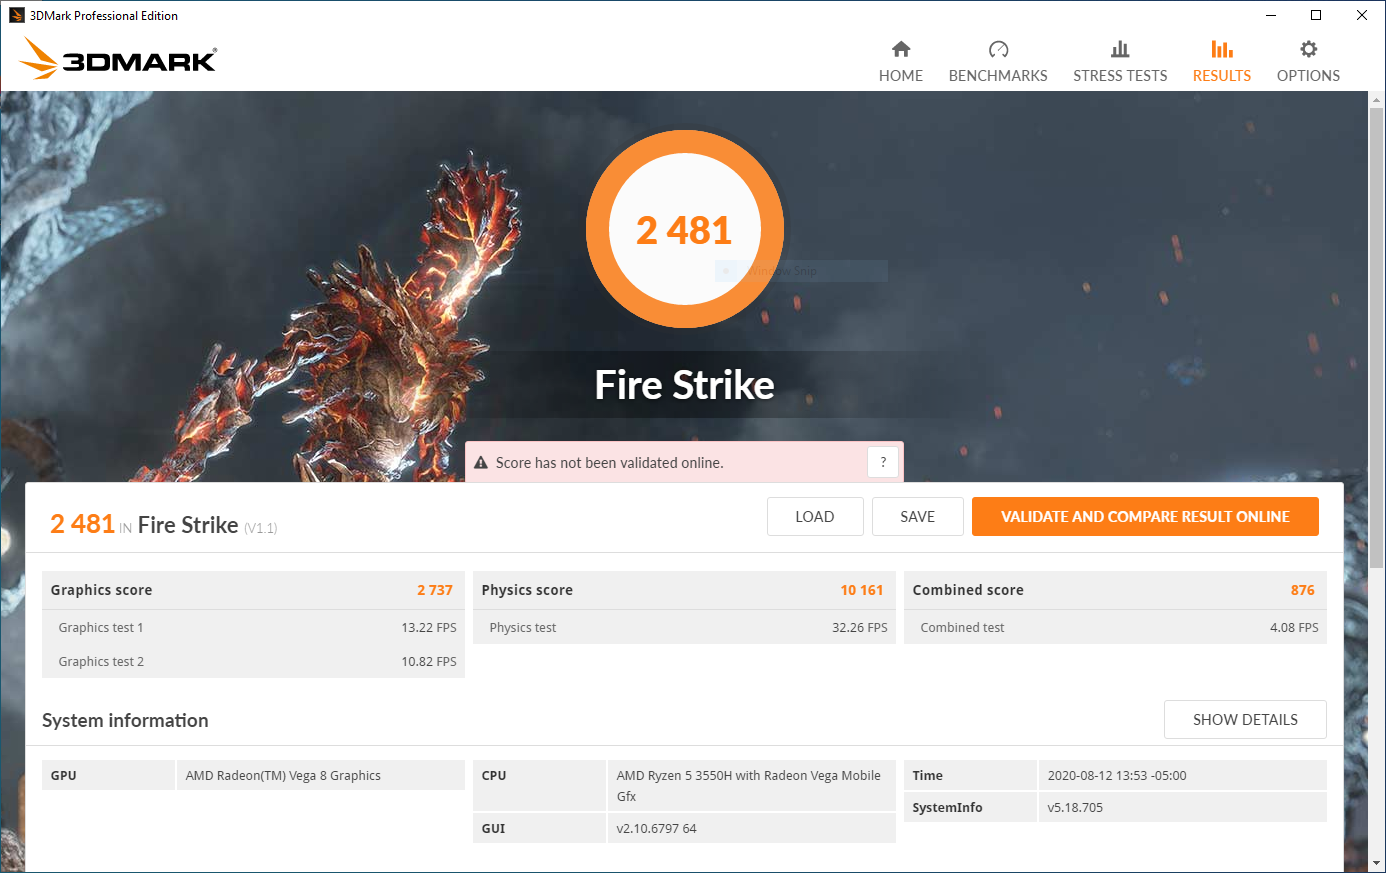
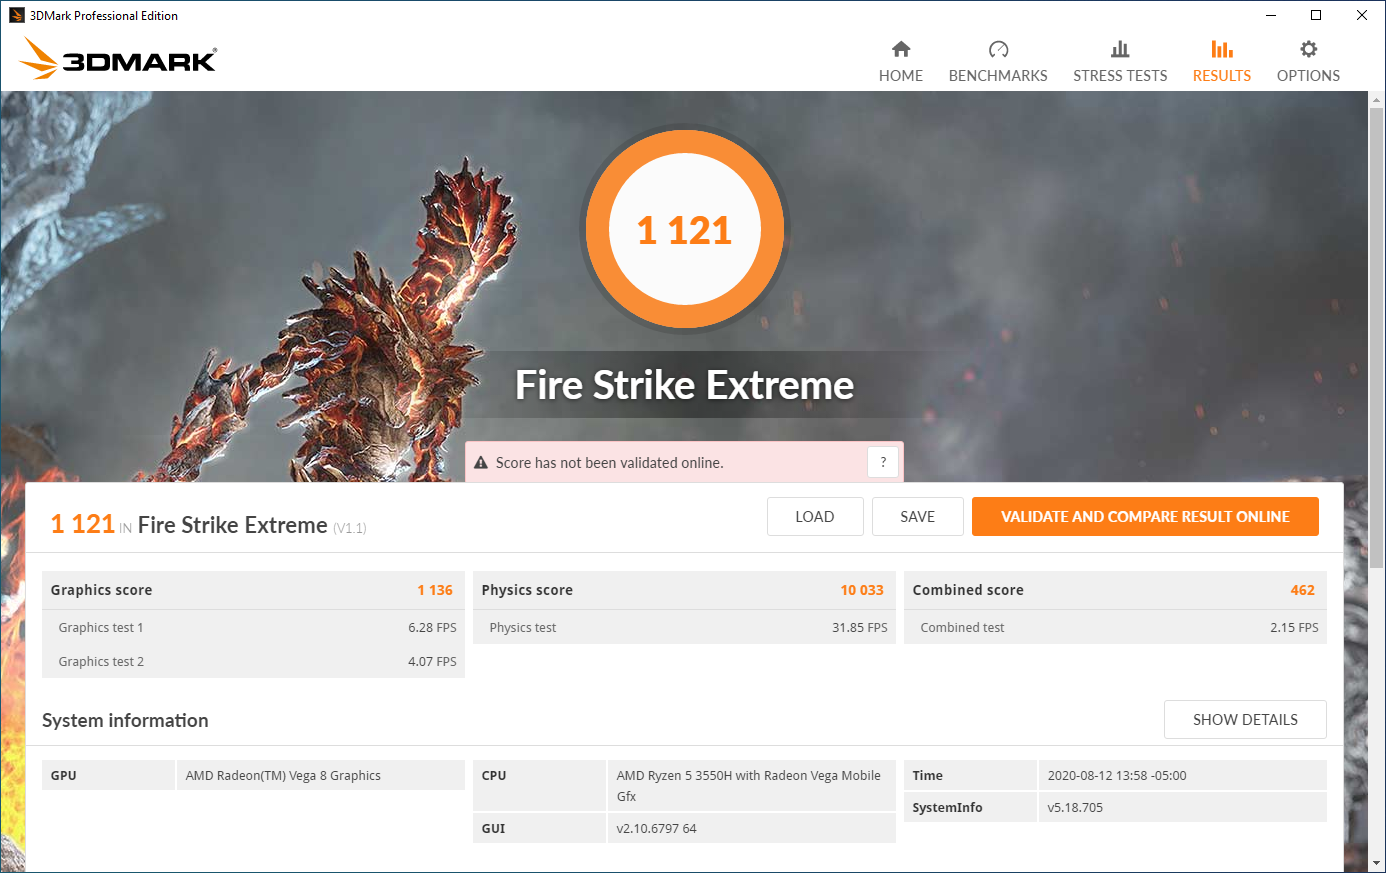


| 3DMark 11 Performance | 4138 points | |
| 3DMark Cloud Gate Standard Score | 13339 points | |
| 3DMark Fire Strike Score | 2481 points | |
| 3DMark Fire Strike Extreme Score | 1121 points | |
Help | ||
Gaming Performance
The Radeon RX Vega 8 GPU is adequate for light gaming. Older titles like Bioshock Infinite can be played at Medium/High settings at 1080p and still hit 30 fps or more. For a solid 60 fps, the resolution will need to be turned down to 1366x768. Lighter titles like Rocket League are likewise enjoyable at reduced settings and lower resolutions. Newer and more demanding titles like Doom Eternal struggle on the GT-R at all but the lowest settings.
As mentioned above, pushing the CPU to 54 Watts does little, if anything, to improve framerates in games. Some CPU-reliant titles may benefit, but GPU-driven games see no benefit.
Long-term gameplay is steady as shown by an hour-long playthrough of The Witcher 3. There are no unexpected frame drops or stutter.
| BioShock Infinite | |
| 1280x720 Very Low Preset | |
| Intel Hades Canyon NUC8i7HVK | |
| Intel NUC8i7BE | |
| Beelink GTR35 II-G-16512D00W64PRO-1T 54 Watt | |
| Beelink GTR35 II-G-16512D00W64PRO-1T | |
| Average AMD Radeon RX Vega 8 (Ryzen 2000/3000) (68.9 - 122.8, n=29) | |
| 1366x768 Medium Preset | |
| Intel Hades Canyon NUC8i7HVK | |
| Beelink GTR35 II-G-16512D00W64PRO-1T | |
| Beelink GTR35 II-G-16512D00W64PRO-1T 54 Watt | |
| Average AMD Radeon RX Vega 8 (Ryzen 2000/3000) (50.2 - 83, n=15) | |
| Intel NUC8i7BE | |
| 1366x768 High Preset | |
| Intel Hades Canyon NUC8i7HVK | |
| Beelink GTR35 II-G-16512D00W64PRO-1T | |
| Beelink GTR35 II-G-16512D00W64PRO-1T 54 Watt | |
| Intel NUC8i7BE | |
| Average AMD Radeon RX Vega 8 (Ryzen 2000/3000) (17.2 - 68, n=16) | |
| 1920x1080 Ultra Preset, DX11 (DDOF) | |
| Intel Hades Canyon NUC8i7HVK | |
| Beelink GTR35 II-G-16512D00W64PRO-1T 54 Watt | |
| Beelink GTR35 II-G-16512D00W64PRO-1T | |
| Average AMD Radeon RX Vega 8 (Ryzen 2000/3000) (7.6 - 28, n=30) | |
| Intel NUC8i7BE | |
| Rocket League | |
| 1280x720 Performance | |
| Intel NUC8i7BE | |
| Beelink GTR35 II-G-16512D00W64PRO-1T 54 Watt | |
| Beelink GTR35 II-G-16512D00W64PRO-1T | |
| Average AMD Radeon RX Vega 8 (Ryzen 2000/3000) (52.9 - 107.3, n=6) | |
| 1920x1080 Performance | |
| Intel NUC8i7BE | |
| Beelink GTR35 II-G-16512D00W64PRO-1T | |
| Beelink GTR35 II-G-16512D00W64PRO-1T 54 Watt | |
| Average AMD Radeon RX Vega 8 (Ryzen 2000/3000) (60 - 60, n=2) | |
| 1920x1080 Quality AA:Medium FX | |
| Intel NUC8i7BE | |
| Beelink GTR35 II-G-16512D00W64PRO-1T 54 Watt | |
| Average AMD Radeon RX Vega 8 (Ryzen 2000/3000) (42.7 - 45.8, n=5) | |
| Beelink GTR35 II-G-16512D00W64PRO-1T | |
| 1920x1080 High Quality AA:High FX | |
| Intel Hades Canyon NUC8i7HVK | |
| Intel NUC8i7BE | |
| Beelink GTR35 II-G-16512D00W64PRO-1T 54 Watt | |
| Average AMD Radeon RX Vega 8 (Ryzen 2000/3000) (27.9 - 32.1, n=5) | |
| Beelink GTR35 II-G-16512D00W64PRO-1T | |
| Doom Eternal | |
| 1280x720 Low Preset | |
| Beelink GTR35 II-G-16512D00W64PRO-1T | |
| Beelink GTR35 II-G-16512D00W64PRO-1T 54 Watt | |
| Average AMD Radeon RX Vega 8 (Ryzen 2000/3000) (39.6 - 45, n=3) | |
| Intel NUC8i7BE | |
| 1920x1080 Medium Preset | |
| Beelink GTR35 II-G-16512D00W64PRO-1T 54 Watt | |
| Average AMD Radeon RX Vega 8 (Ryzen 2000/3000) (19.9 - 25, n=3) | |
| Beelink GTR35 II-G-16512D00W64PRO-1T | |
| 1920x1080 High Preset | |
| Beelink GTR35 II-G-16512D00W64PRO-1T 54 Watt | |
| Beelink GTR35 II-G-16512D00W64PRO-1T | |
| Average AMD Radeon RX Vega 8 (Ryzen 2000/3000) (17.6 - 21, n=3) | |
| 1920x1080 Ultra Preset | |
| Beelink GTR35 II-G-16512D00W64PRO-1T | |
| Average AMD Radeon RX Vega 8 (Ryzen 2000/3000) (14 - 16, n=2) | |
| Beelink GTR35 II-G-16512D00W64PRO-1T 54 Watt | |
| low | med. | high | ultra | |
|---|---|---|---|---|
| BioShock Infinite (2013) | 109 | 83 | 68 | 22 |
| The Witcher 3 (2015) | 46 | 29 | 13 | 9 |
| Dota 2 Reborn (2015) | 84.7 | 66.9 | 41.9 | 39.2 |
| Rocket League (2017) | 93 | 43 | 29 | |
| Final Fantasy XV Benchmark (2018) | 26.6 | 13.6 | 8.26 | |
| X-Plane 11.11 (2018) | 32.5 | 25.3 | 22.8 | |
| Doom Eternal (2020) | 45 | 22 | 20 | 16 |
Emissions & Power
System Noise
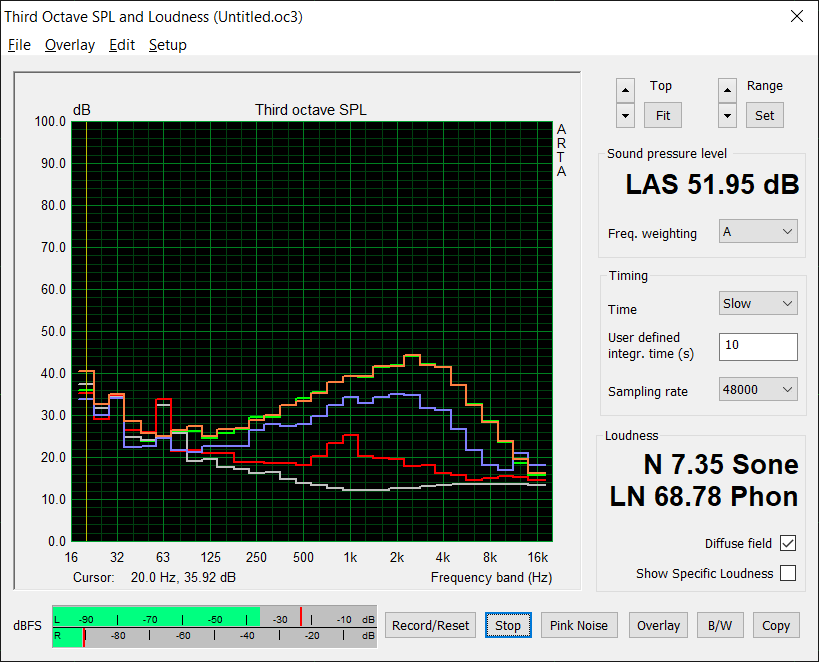
One of the shortcomings of the GT-R is its loud fan noise. The dual fans work well in keeping the system cool under load, but the noise generated is a heavy cost. When stressed, the fans ramp up aggressively to over 50 dB(A). Under extended load, they rarely come down. Even after a heavy workload is finished, the fans will continue blowing at full speed for half a minute to exhaust all heat. When the machine is set to its 54 Watt mode, the fans ramp up earlier and stay loud for longer. Worse still, the fans have a very high pitch; the fans' screech easily cuts through ambient noise in a room.
| Beelink GTR35 II-G-16512D00W64PRO-1T Vega 8, R5 3550H, Silicon Motion AZW 512G NV428 | Intel NUC8i7BE Iris Plus Graphics 655, i7-8559U | Intel Hades Canyon NUC8i7HVK Vega M GH, i7-8809G, Intel Optane 120 GB SSDPEK1W120GA | |
|---|---|---|---|
| Noise | 8% | 8% | |
| off / environment * (dB) | 25.4 | 28.7 -13% | 28.7 -13% |
| Idle Minimum * (dB) | 31.5 | 28.7 9% | 29 8% |
| Idle Average * (dB) | 31.5 | 29.3 7% | 29 8% |
| Idle Maximum * (dB) | 31.5 | 31.8 -1% | 29 8% |
| Load Average * (dB) | 43.9 | 39 11% | 36 18% |
| Witcher 3 ultra * (dB) | 51.9 | 39 25% | 42 19% |
| Load Maximum * (dB) | 52 | 41.4 20% | 49.4 5% |
* ... smaller is better
Noise level
| Idle |
| 31.5 / 31.5 / 31.5 dB(A) |
| Load |
| 43.9 / 52 dB(A) |
 | ||
30 dB silent 40 dB(A) audible 50 dB(A) loud |
||
min: | ||
Temperature
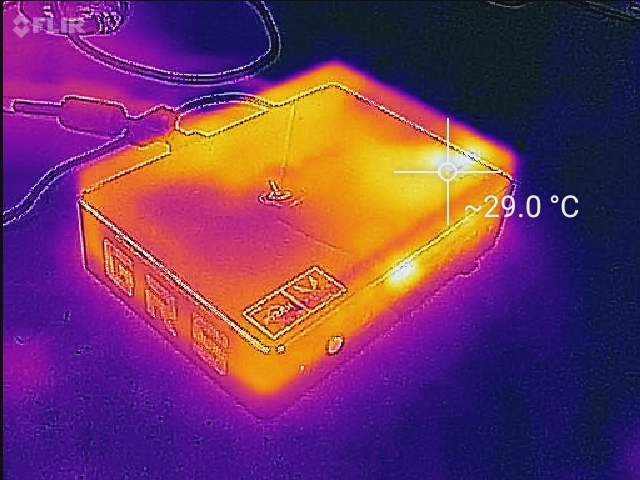
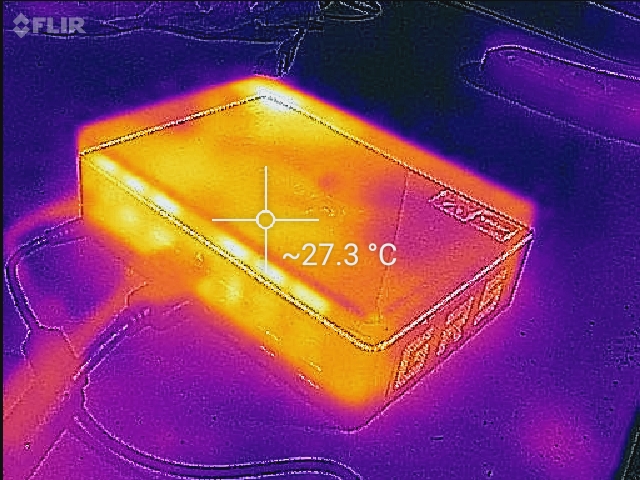
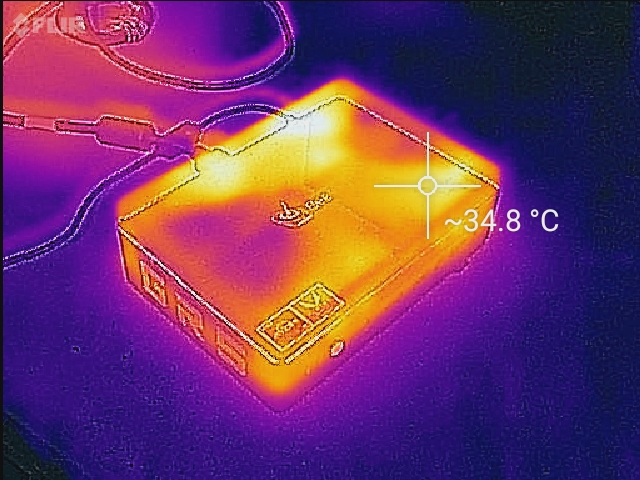
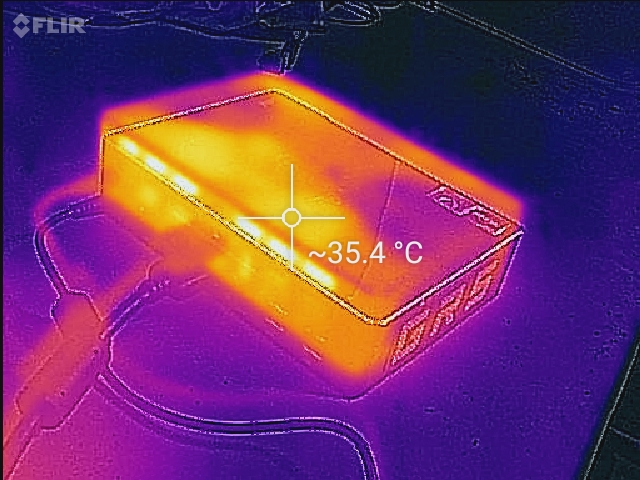
Temperatures across the case stay fairly cool, peaking at about 35° C under full load.
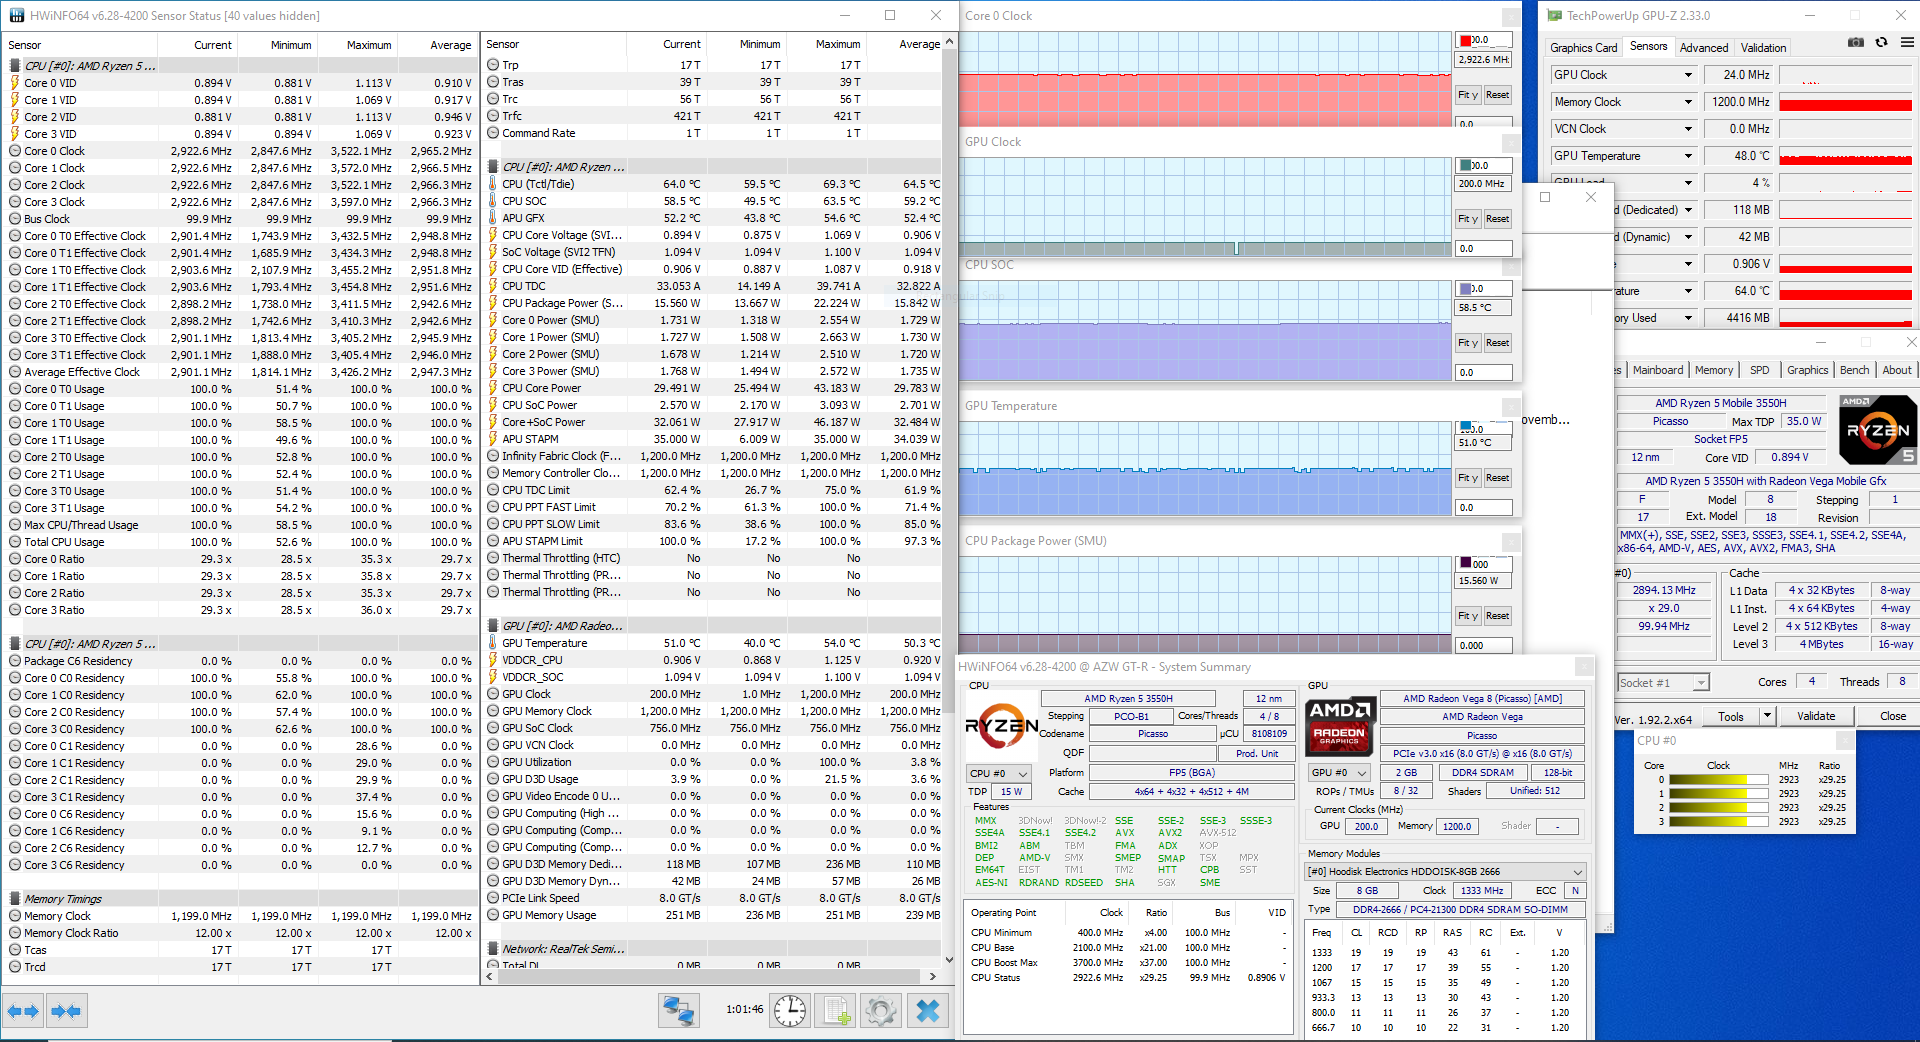
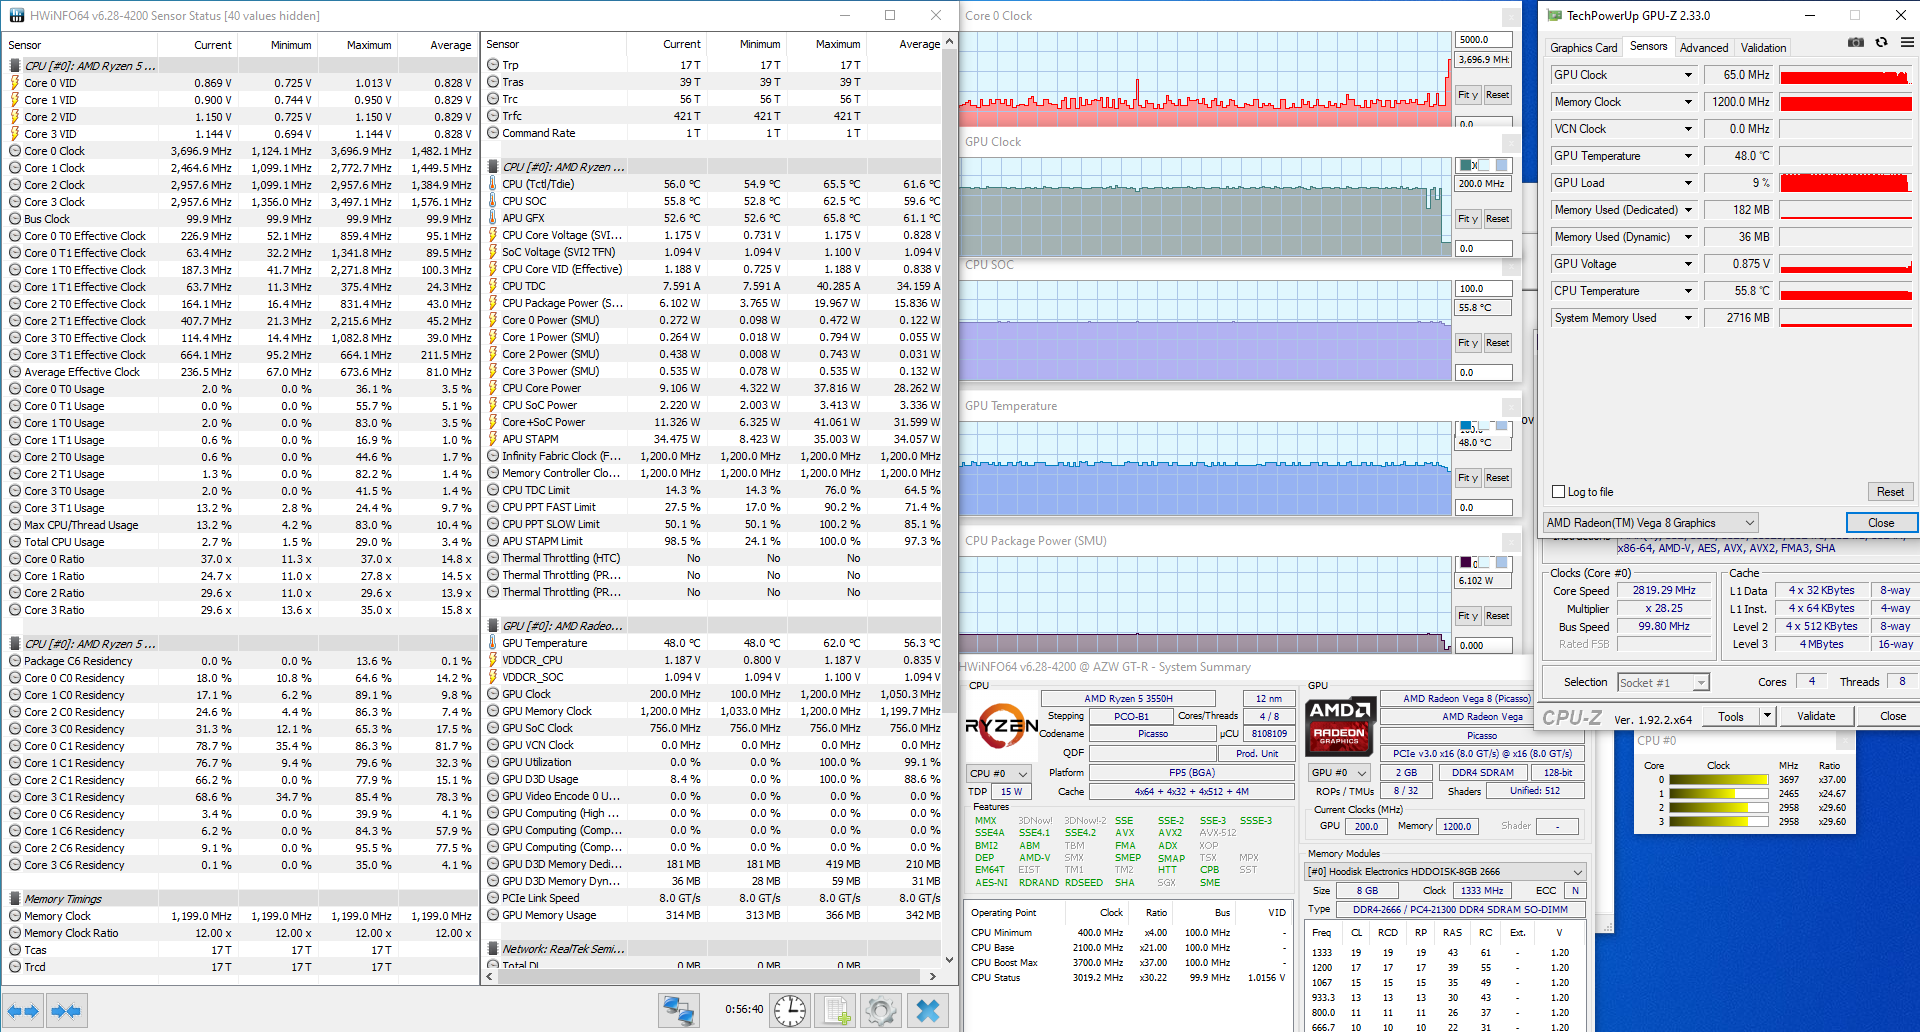
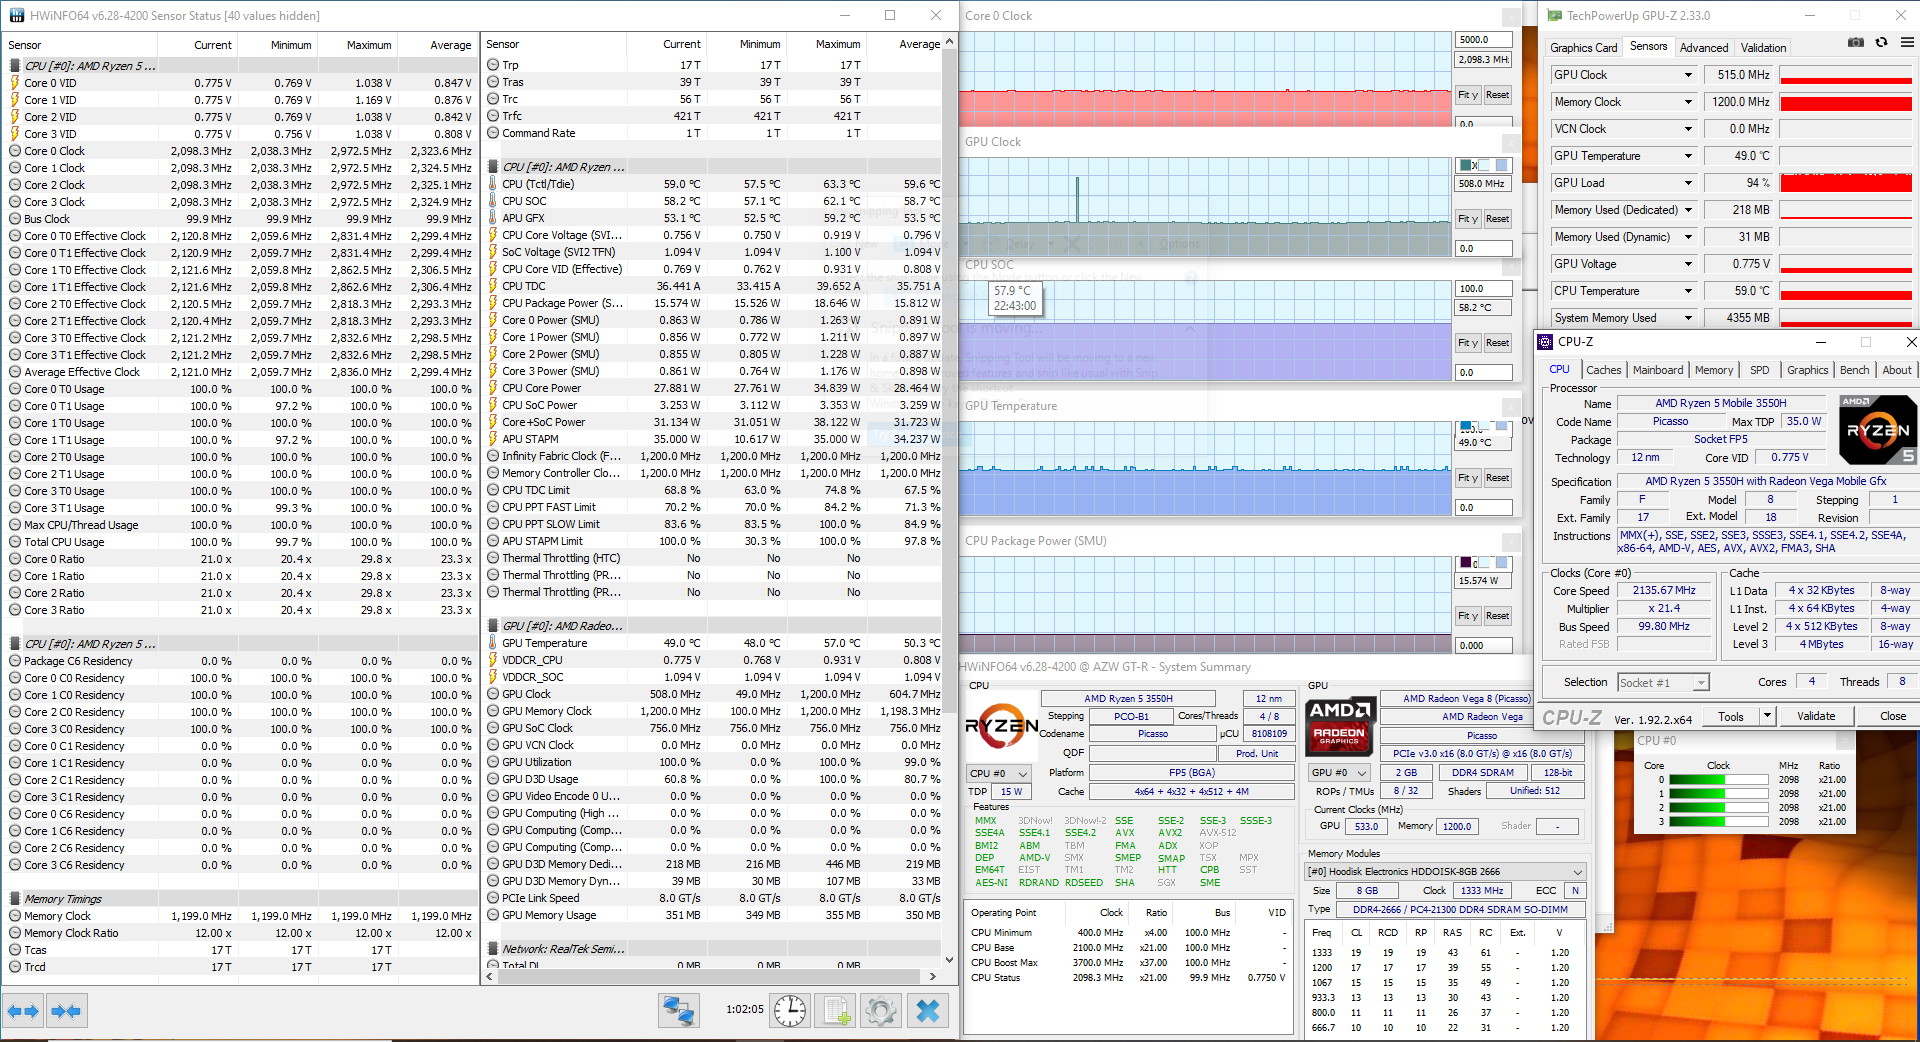
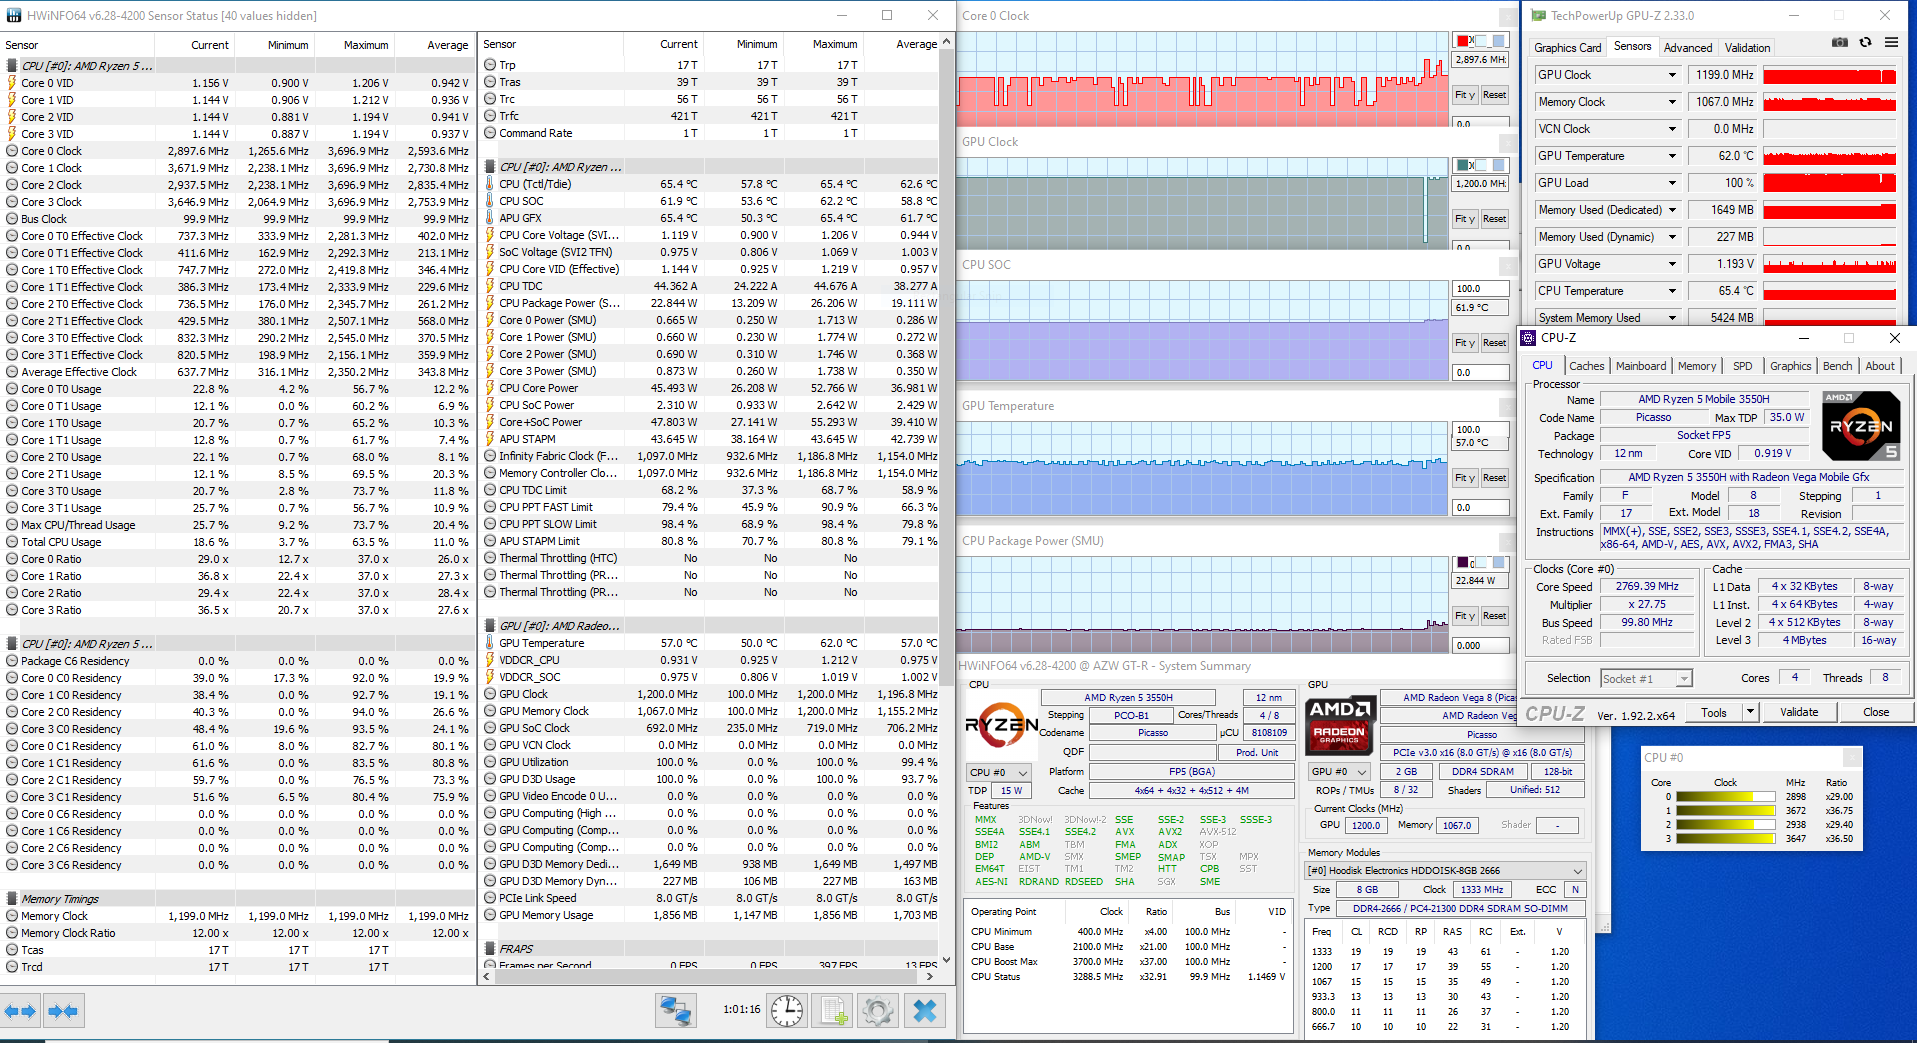
The GT-R handles stress very well. Under full synthetic load, the CPU never breaks 60° C. Likewise, the GPU stays at or below 50° C in our stress tests. We do notice some thermal limitations, particularly with the CPU. In our hour-long run of Prime95, the CPU manages to hover around 3.0 GHz on all cores. However, when running Prime95 and FurMark concurrently, the CPU is unable to reliably boost. Instead, it stays at its base clock of 2.1 GHz. In our real-world test (running The Witcher 3 for an hour), the CPU hangs between 1.6-2.0 GHz. The GPU averages about 1100 MHz, which is below its rated maximum clock of 1200 MHz.
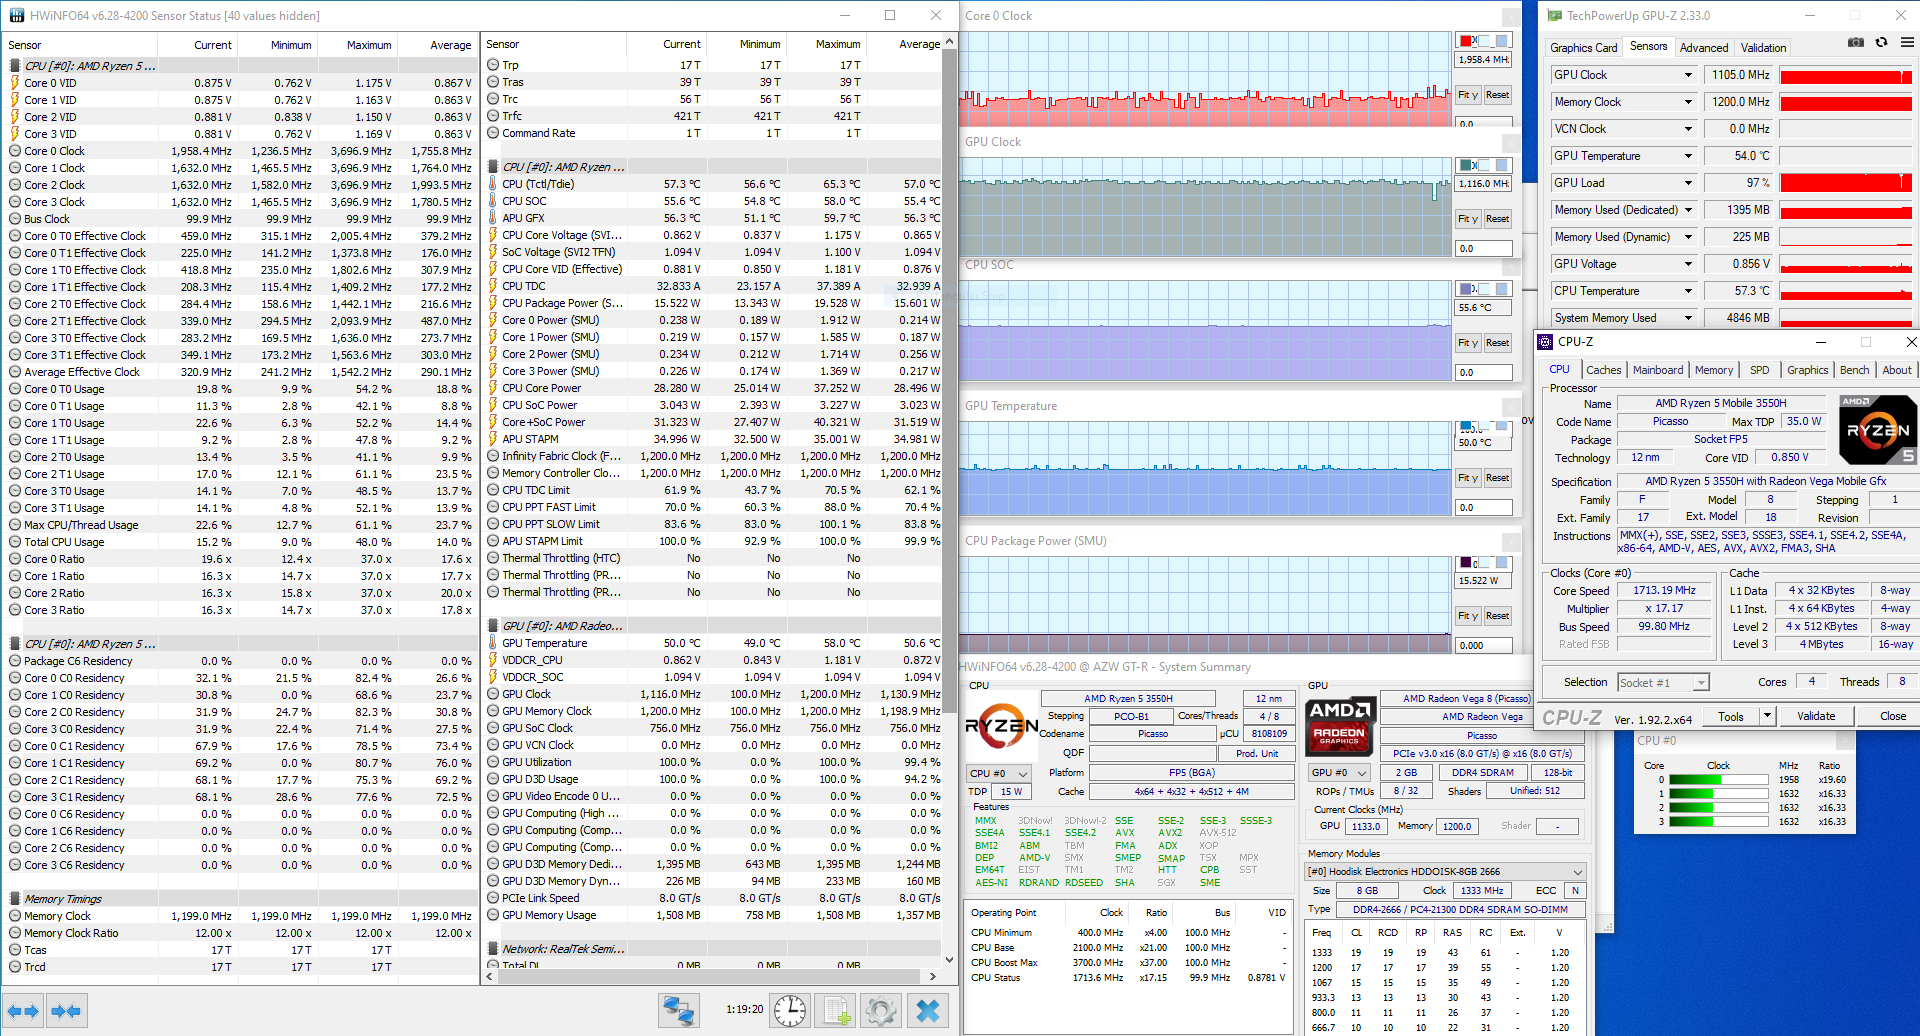
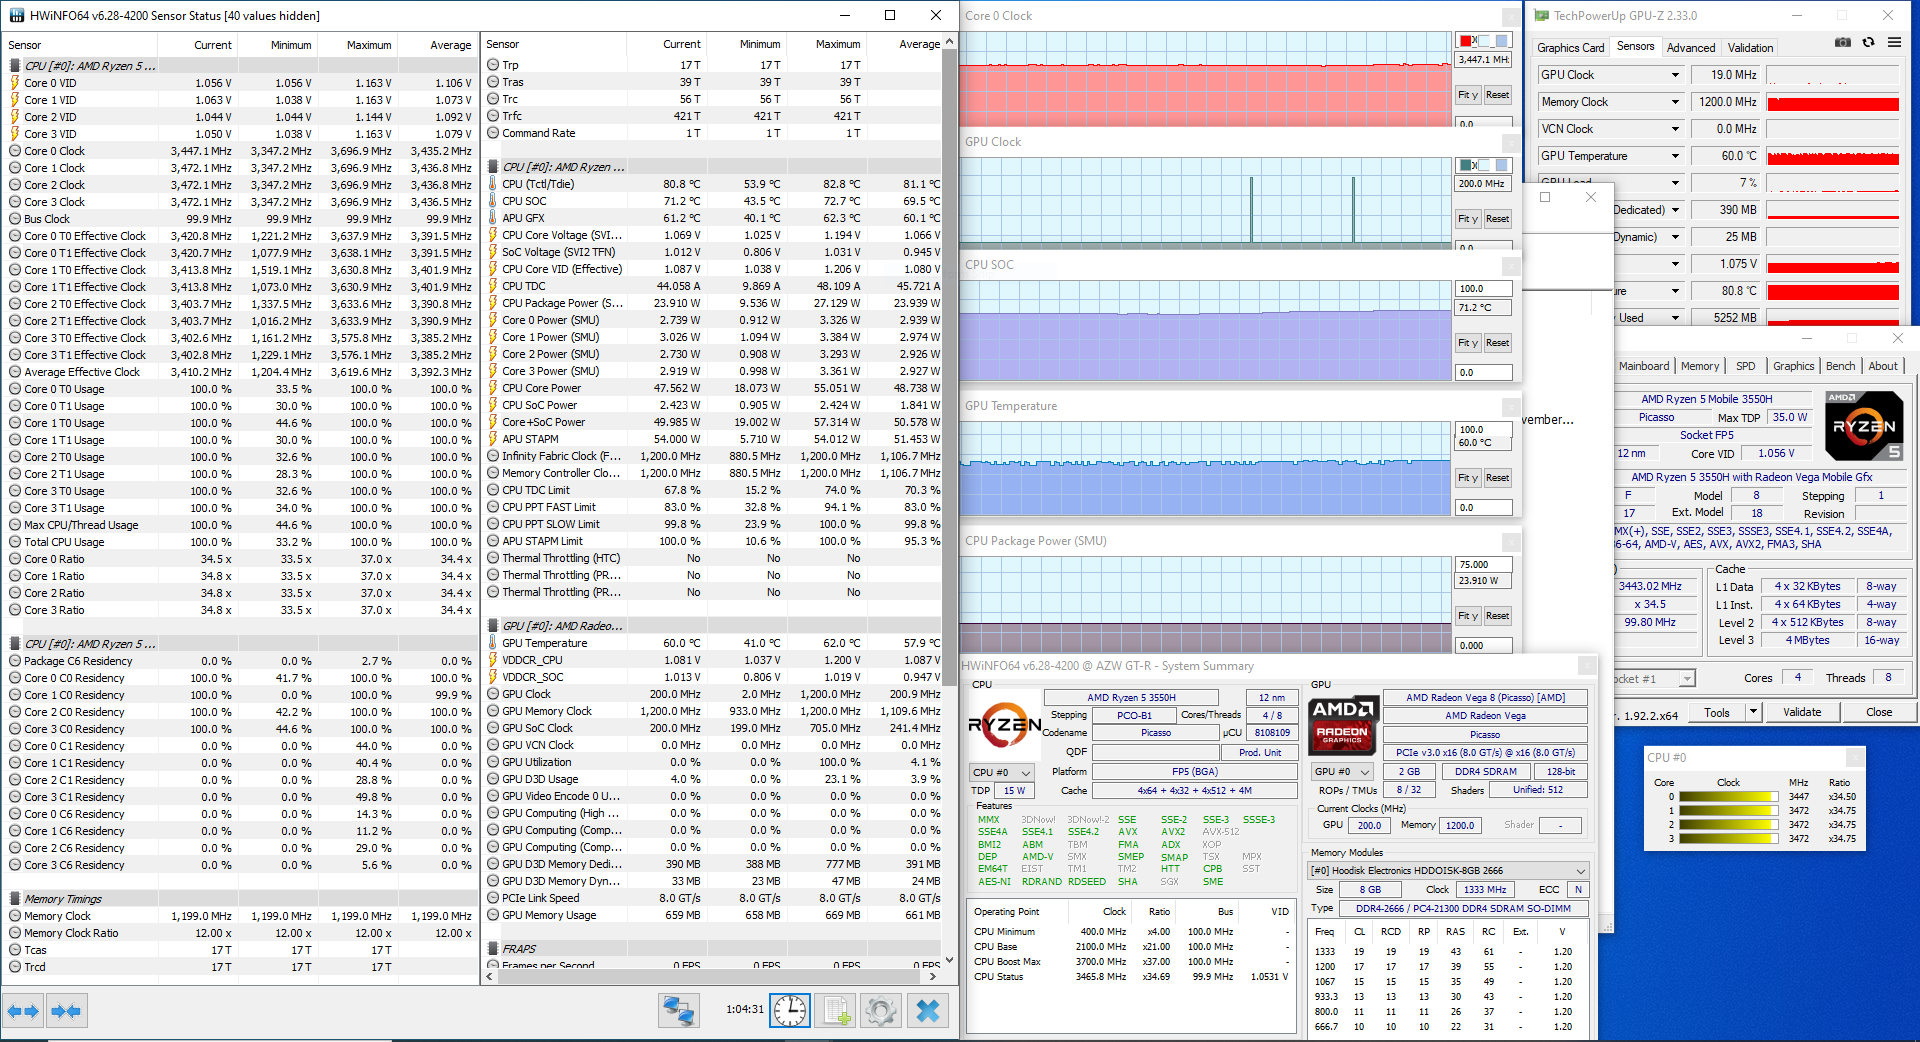
Setting the CPU to 54 Watts results in much better performance in our stress tests, albeit with higher temperatures. The CPU manages to maintain a steady 3.45 GHz clock on all four cores in Prime95, though CPU temps shoot up to 71° C. The 3550H manages to stay at about 3.1 GHz when running FurMark and Prime95 together. The GPU averages 942 MHz. Again, temperatures are higher, averaging 71° C on the CPU and 61° C on the GPU. Gaming presents less of a problem; during an hour-long playthrough of The Witcher 3, the CPU is able to boost to 3.7 GHz as needed. The GPU maintains a steady 1200 MHz clock. Temperatures are better managed during gaming; the CPU and GPU average 62° C and 57° C, respectively, during this test.
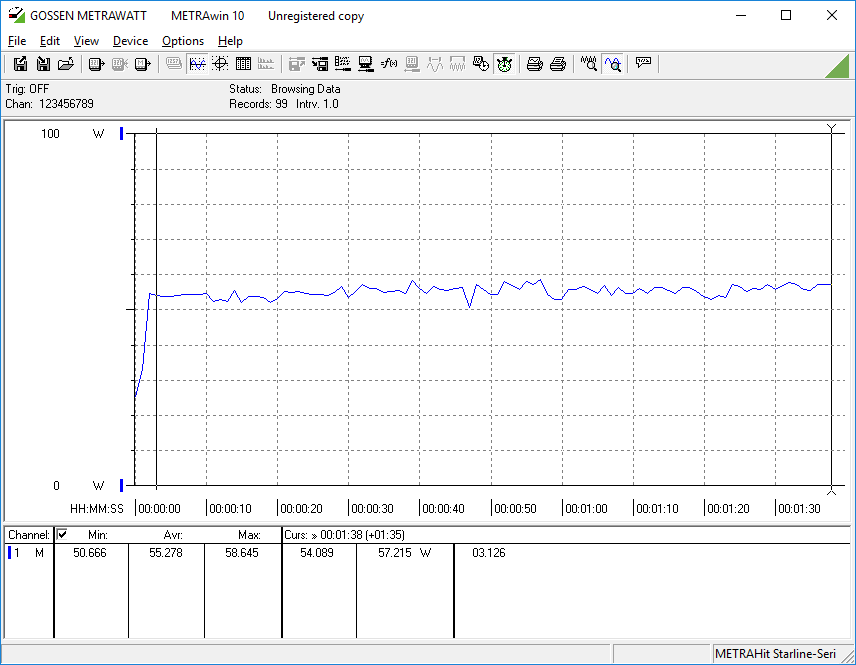
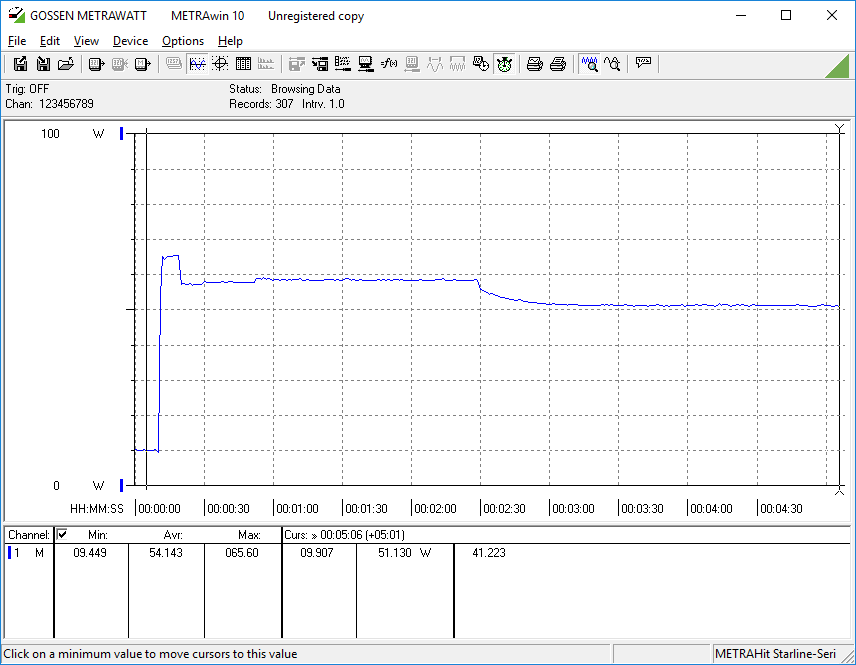
Power Consumption
The GT-R draws a steady 55 Watts from the wall under heavy loads without any noticeable spikes or drops. When idle, the GT-R pulls about 9 Watts. We did not test the GT-R's power draw in its 54 Watt configuration, but it will likely draw about 20 more Watts under load.

| Off / Standby | |
| Idle | |
| Load |
|
Key:
min: | |
Pros
Cons
Verdict
The Beelink GT-R is a beautifully crafted mini PC that packs a decent processing punch. The machine offers a bevy of ports and good upgrade options. Its compact size makes it easy to fit onto or under a desk. Lastly, performance is decent for general use and light gaming, though there are some restrictions in terms of graphical power.
The biggest drawbacks are the loud fans, which can be grating during heavy workloads (e.g., gaming, photo editing, streaming 4K video), and the high price tag considering the specifications. At over US$600 for our configuration, users are paying a pretty penny for a pretty design. However, compared to other mini PCs like Intel's NUCs, the GT-R's price tag is not unreasonable.
Some other small quirks, such as the fingerprint reader in our unit, are noticeable annoyances but are not dealbreakers.
All said, the Beelink GT-R makes for a good tiny office or home theater PC. It handles general tasks perfectly well, can handle some light gaming, and looks beautiful sitting on top of a desk or shelf.
Price comparison
