Beelink SEi10 Mini PC Review: A Cheaper Intel NUC

Beelink offers at least half a dozen different mini PCs designed for HTPC or light office use. Their options aren't as ridiculously wide as the ones from Zotac, but their focus on models with integrated GPUs only helps streamline the designs and keep prices low.
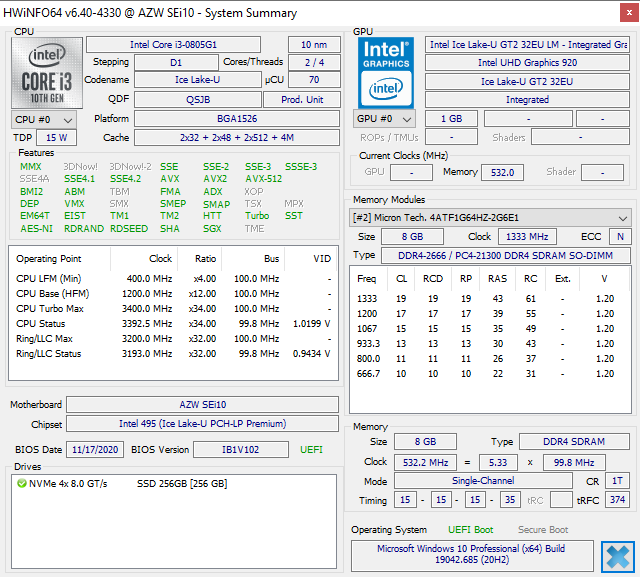
The unit in review here is the new SEi10 equipped with Intel's 10th generation Core i3 Ice Lake CPU for about $390 USD on Amazon. It's notable for including expandable RAM, Thunderbolt 3, and an NVMe SSD in contrast to most cheaper mini PCs out there that aren't expandable at all.
More mini PC reviews:
potential competitors in comparison
Rating | Date | Model | Weight | Height | Size | Resolution | Price |
|---|---|---|---|---|---|---|---|
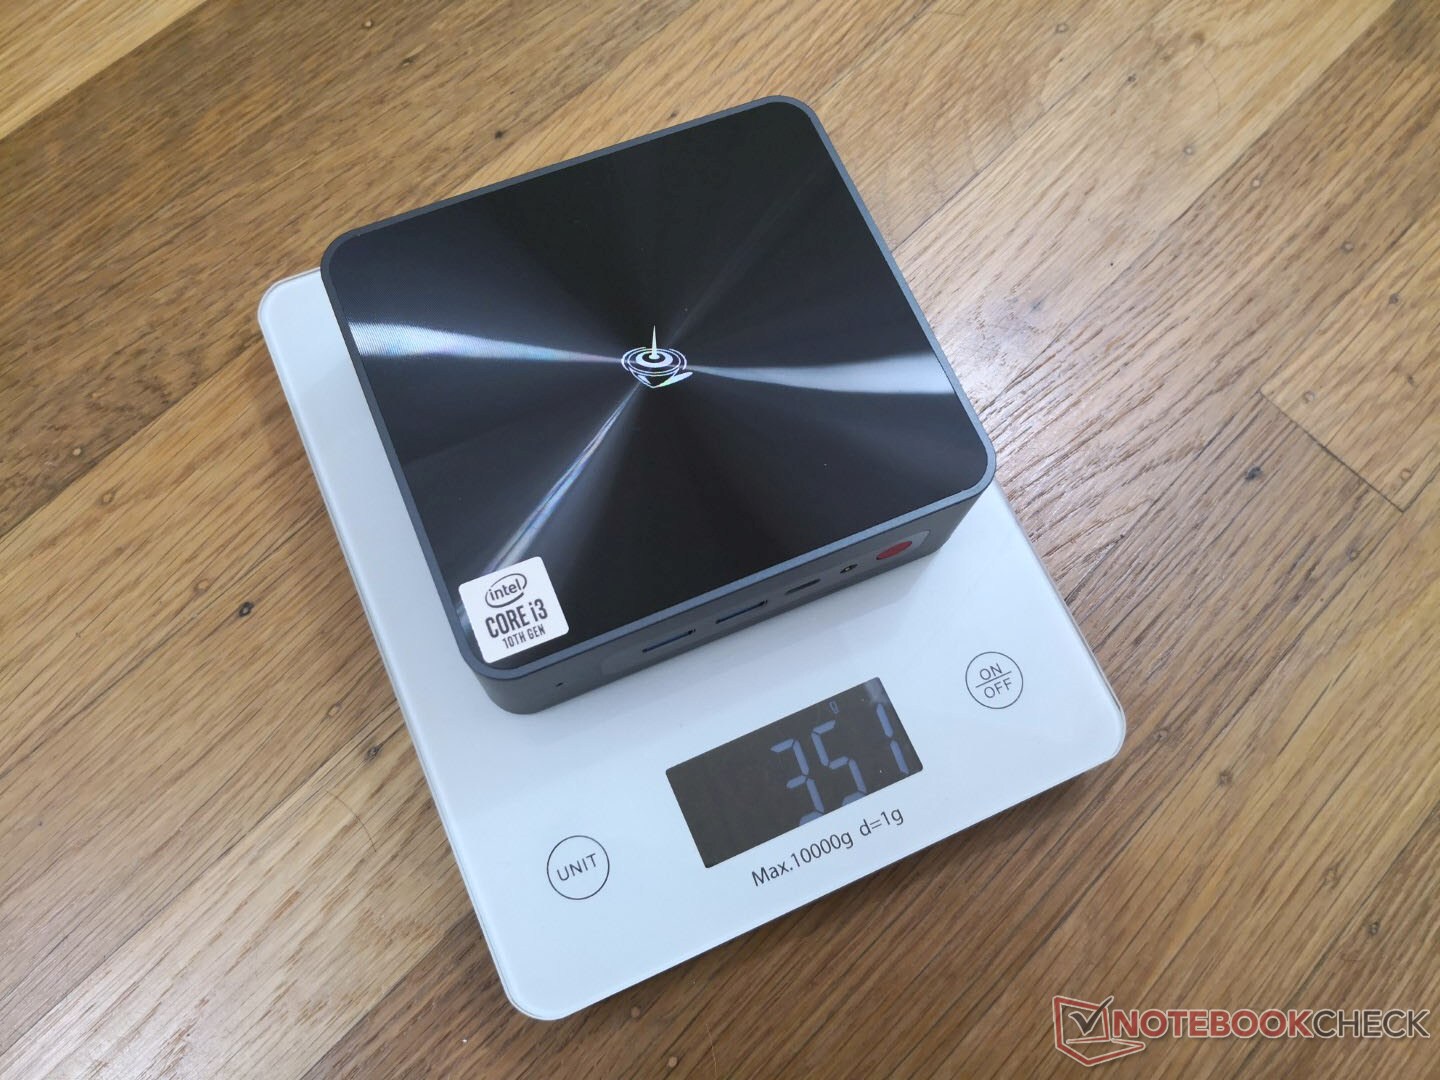
v (old) | 12 / 2020 | Beelink SEi10 i3-1005G1, UHD Graphics G1 (Ice Lake 32 EU) | 350 g | 41 mm | x | ||
v (old) | 08 / 2020 | Beelink GTR35 II-G-16512D00W64PRO-1T R5 3550H, Vega 8 | 843 g | 39 mm | x | ||
v (old) | 07 / 2020 | Zotac ZBox MI643 i5-10210U, UHD Graphics 620 | 550 g | 28.5 mm | x | ||
v (old) | 02 / 2020 | Intel NUC10i5FNK i5-10210U, UHD Graphics 620 | 493 g | 36 mm | 0.00" | 0x0 | |
v (old) | 12 / 2019 | Lenovo ThinkCentre M90n-1 Nano i5-8265U, UHD Graphics 620 | 499 g | 22 mm | 0.00" | x |
Case
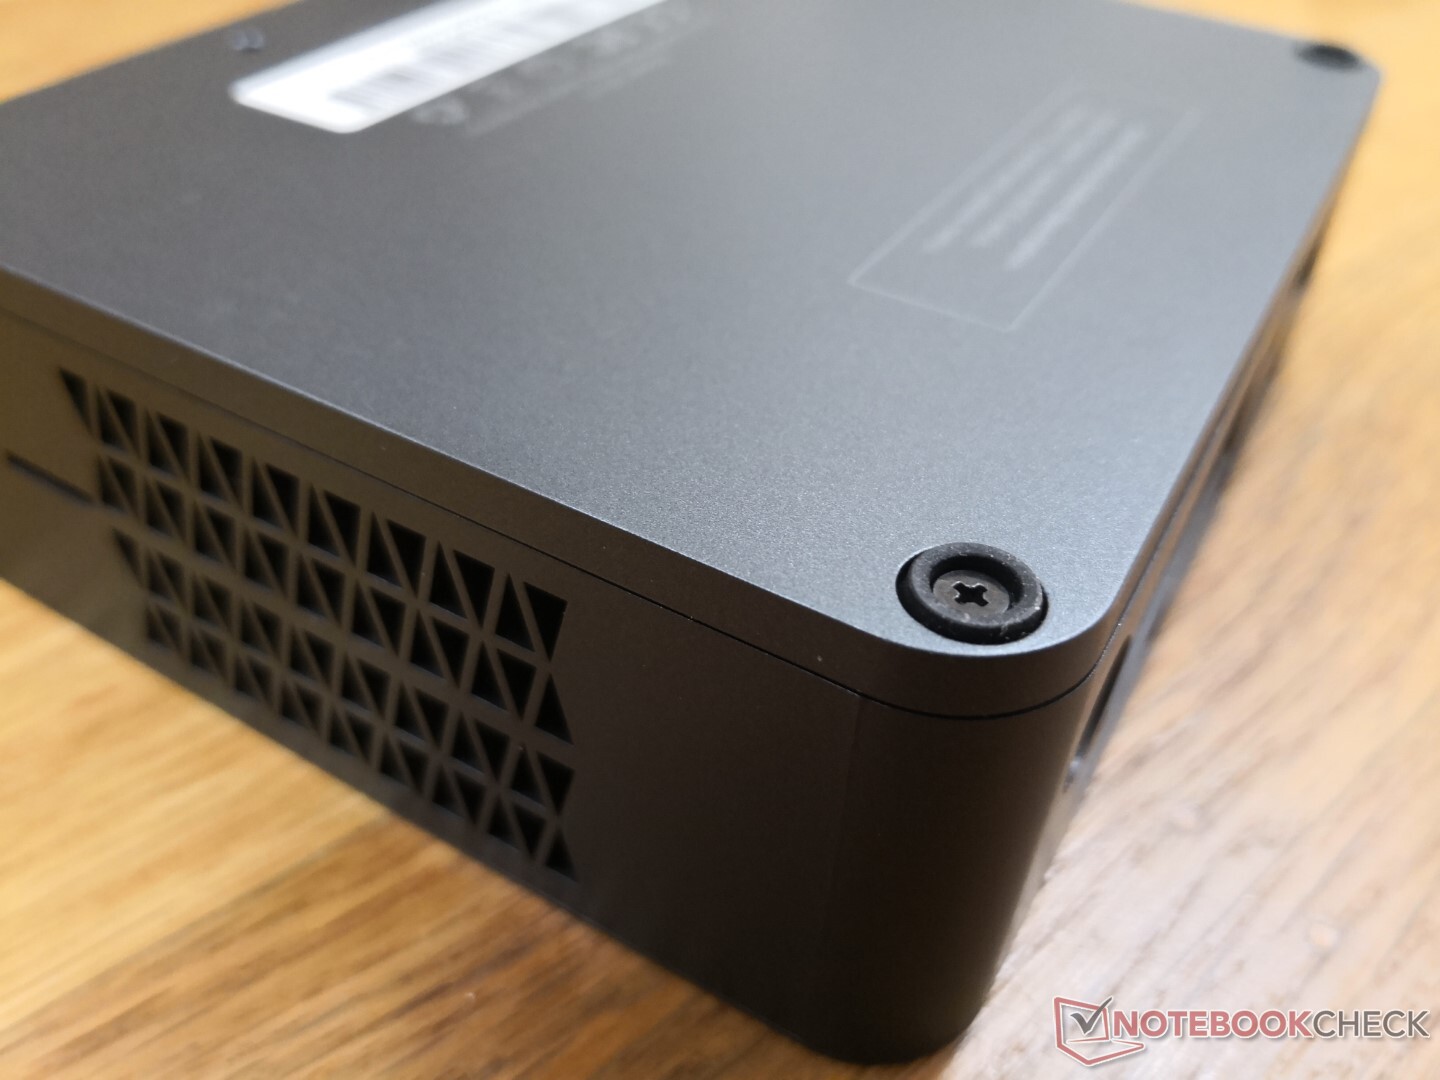
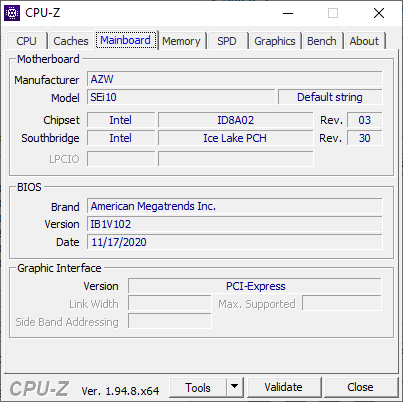
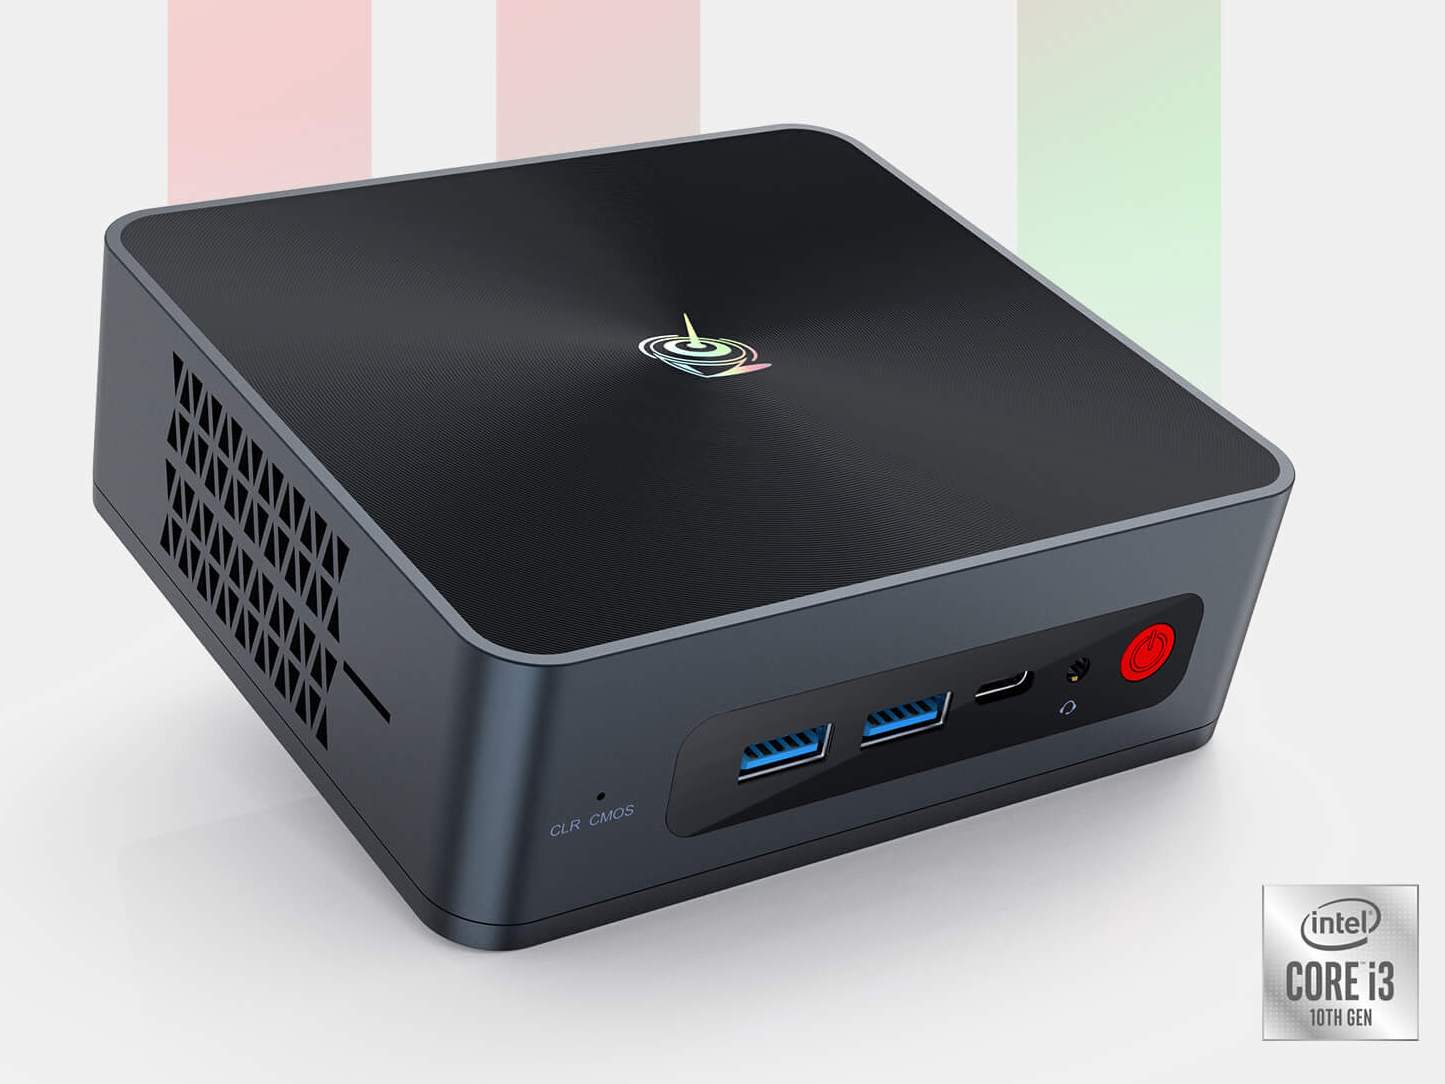
It's pretty clear that Beelink is aiming to emulate the success of the Intel NUC series just based on the looks of the system. Overall dimensions are very similar to the NUC10 while being much lighter due to it using thinner metal materials.
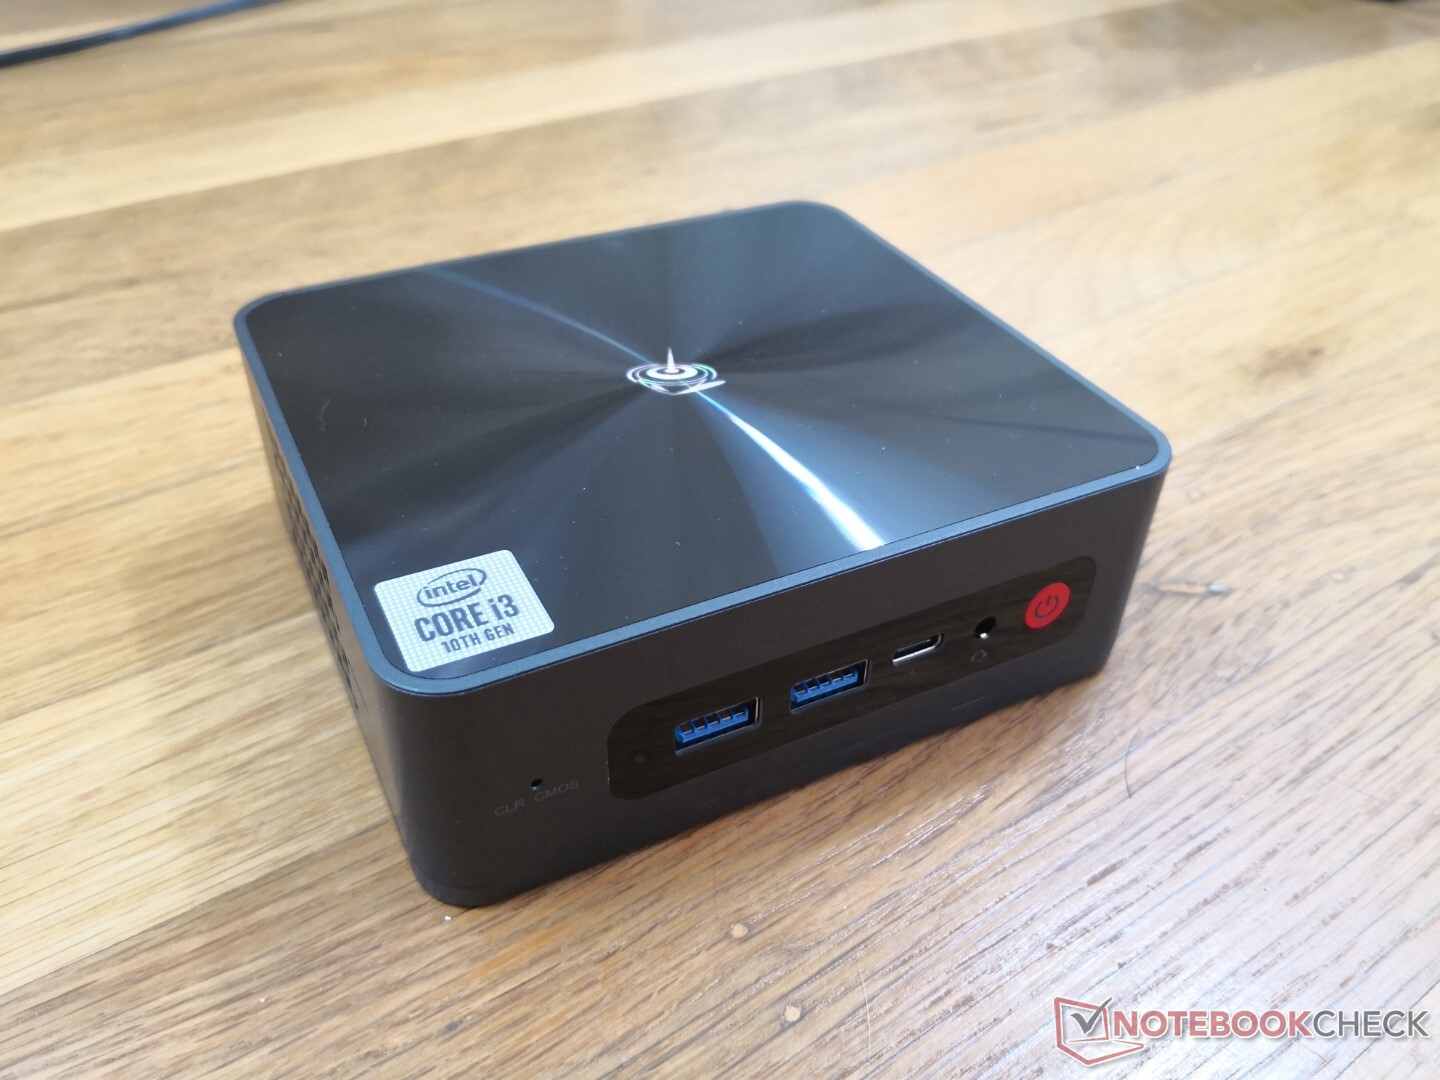
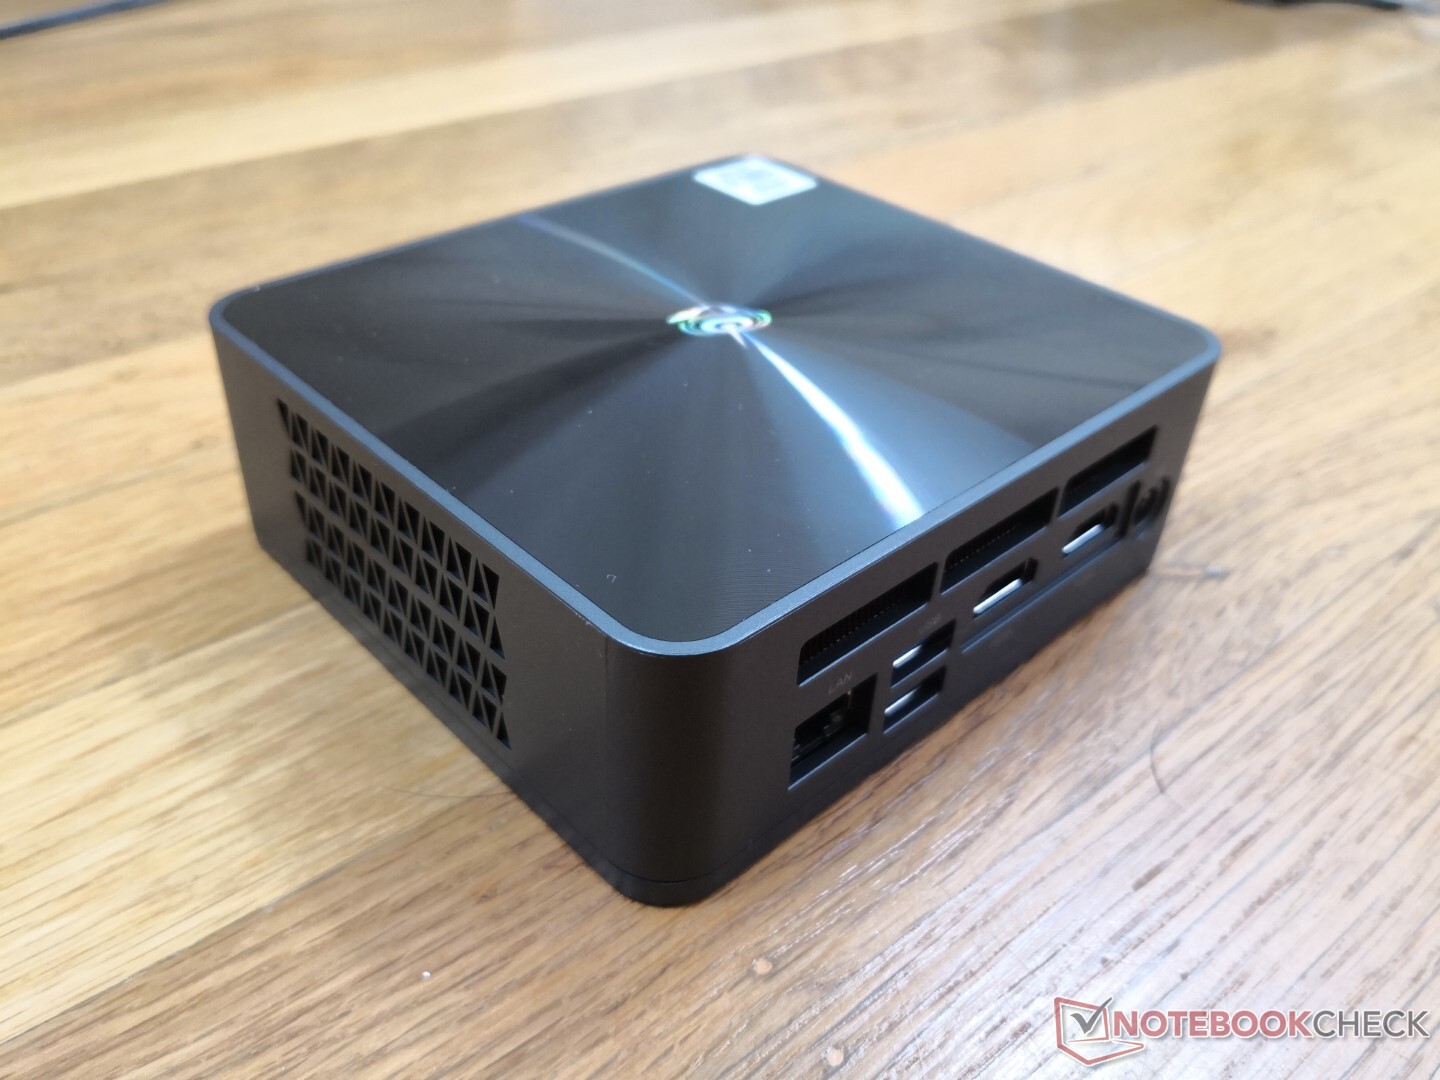
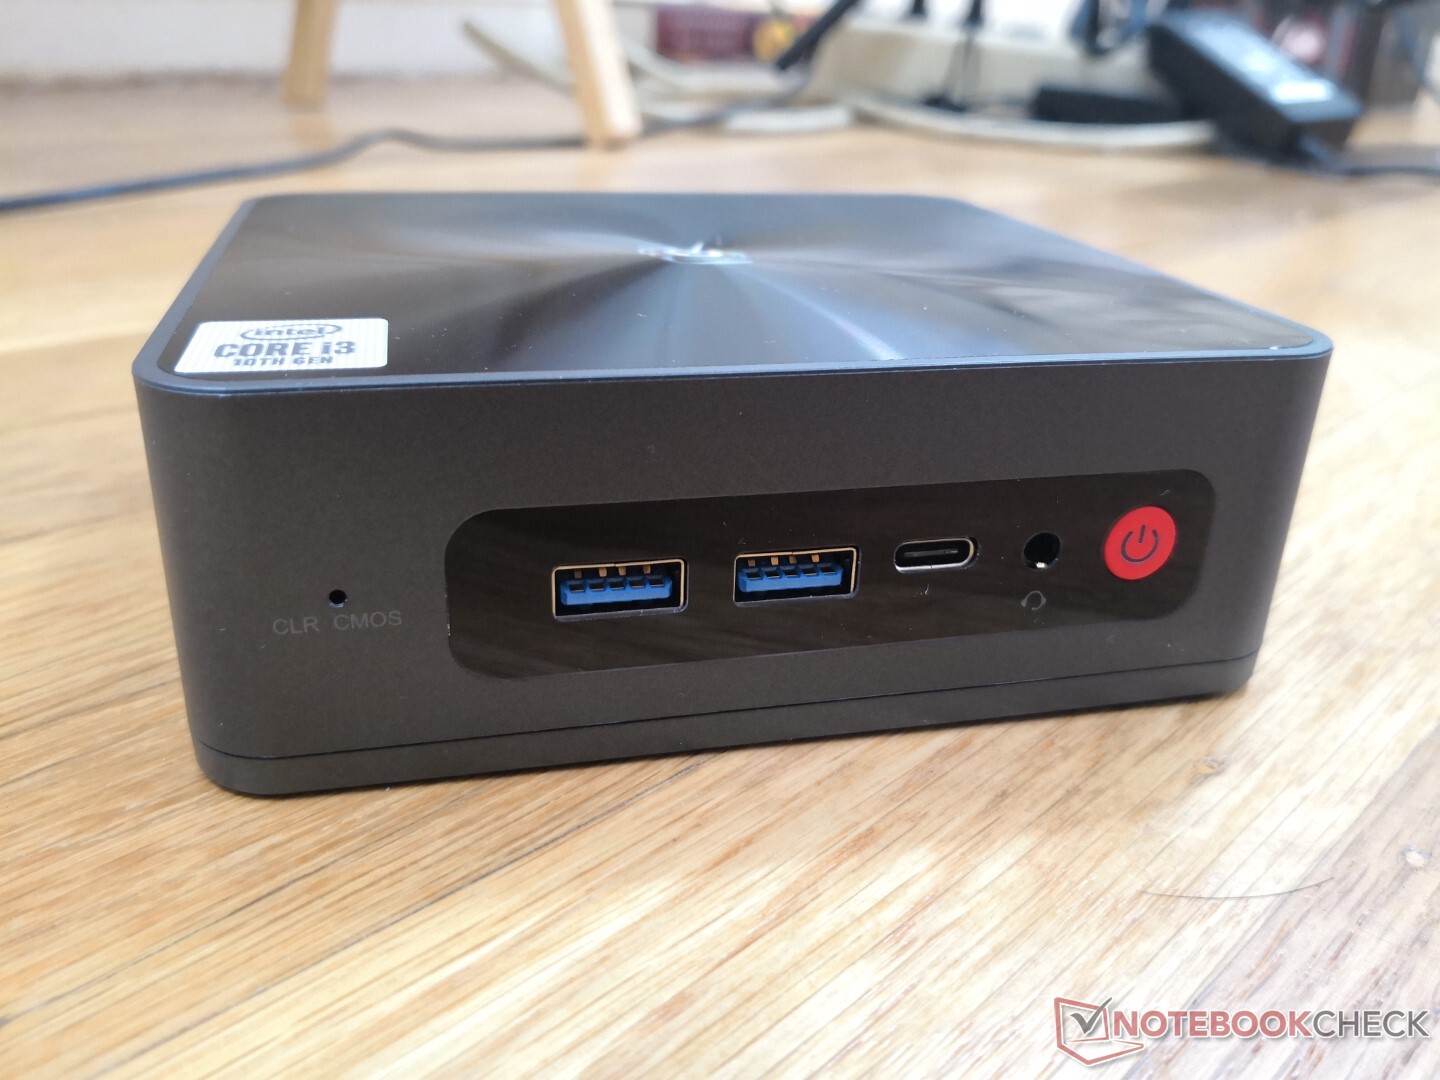
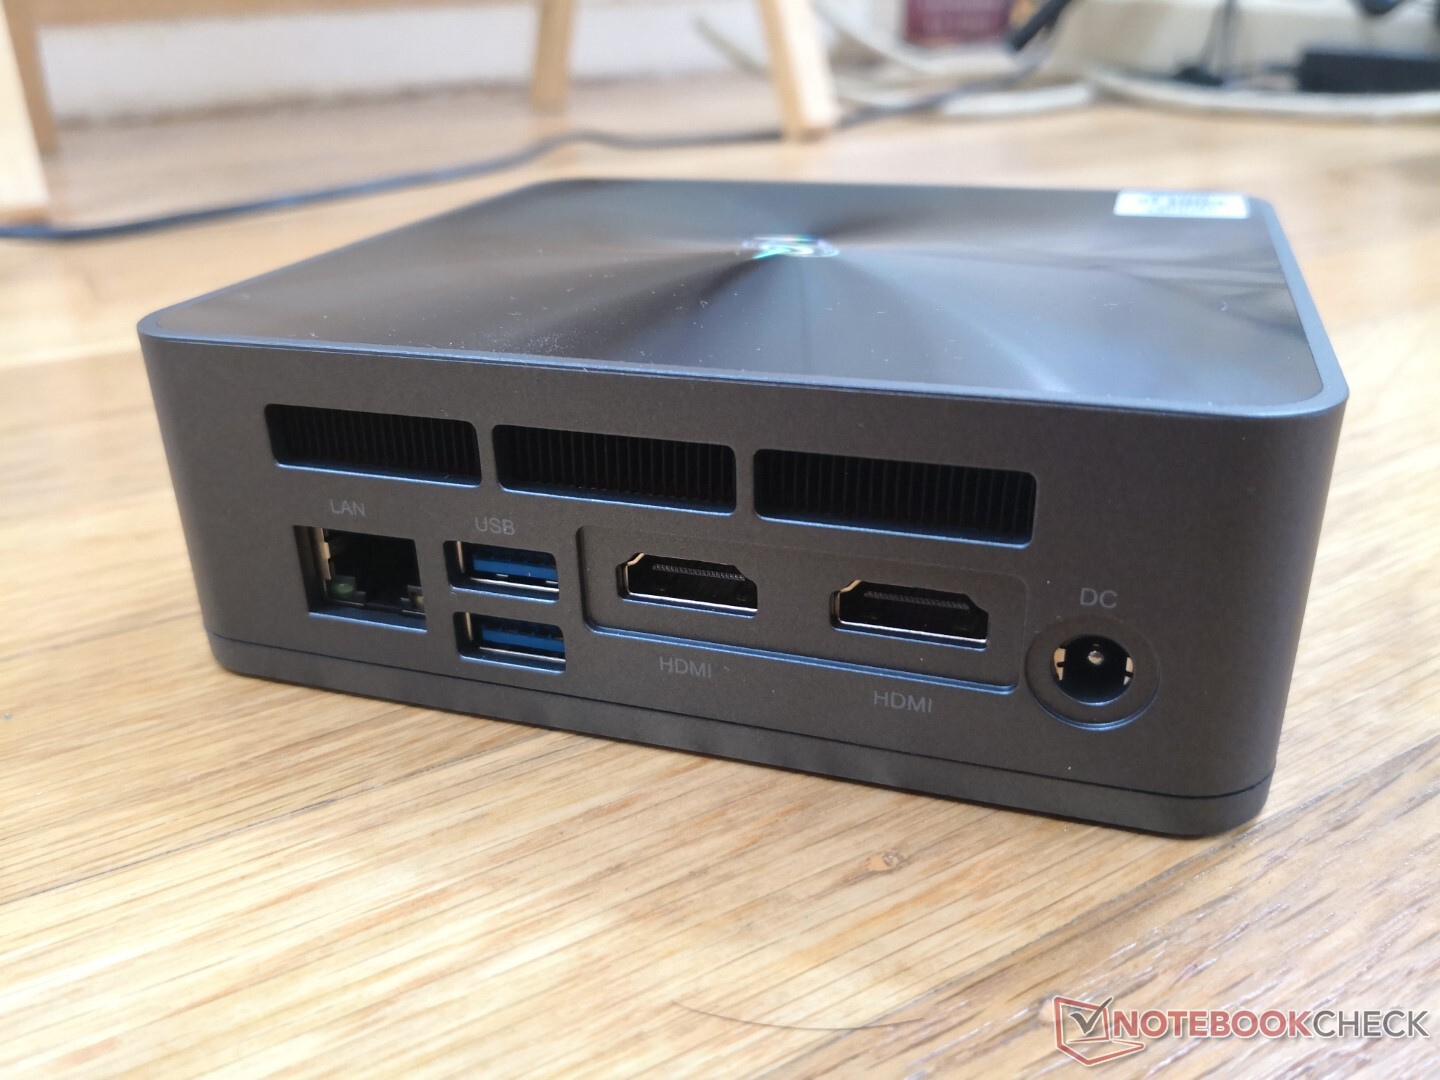
Connectivity
Port options are plentiful, but the highlight is Thunderbolt 3 compatibility. Intel made an effort to integrate the feature onto its Ice Lake die in contrast to AMD. The costlier Beelink GT-R, for example, omits the feature.
Note that all the ports are upside-down save for the RJ-45 port due to how the motherboard is oriented inside.
SD Card Reader
| SD Card Reader | |
| average JPG Copy Test (av. of 3 runs) | |
| Zotac ZBox MI643 (Toshiba Exceria Pro M501 UHS-II) | |
| Beelink SEi10 (Toshiba Exceria Pro M501 UHS-II) | |
| maximum AS SSD Seq Read Test (1GB) | |
| Zotac ZBox MI643 (Toshiba Exceria Pro M501 UHS-II) | |
| Beelink SEi10 (Toshiba Exceria Pro M501 UHS-II) | |
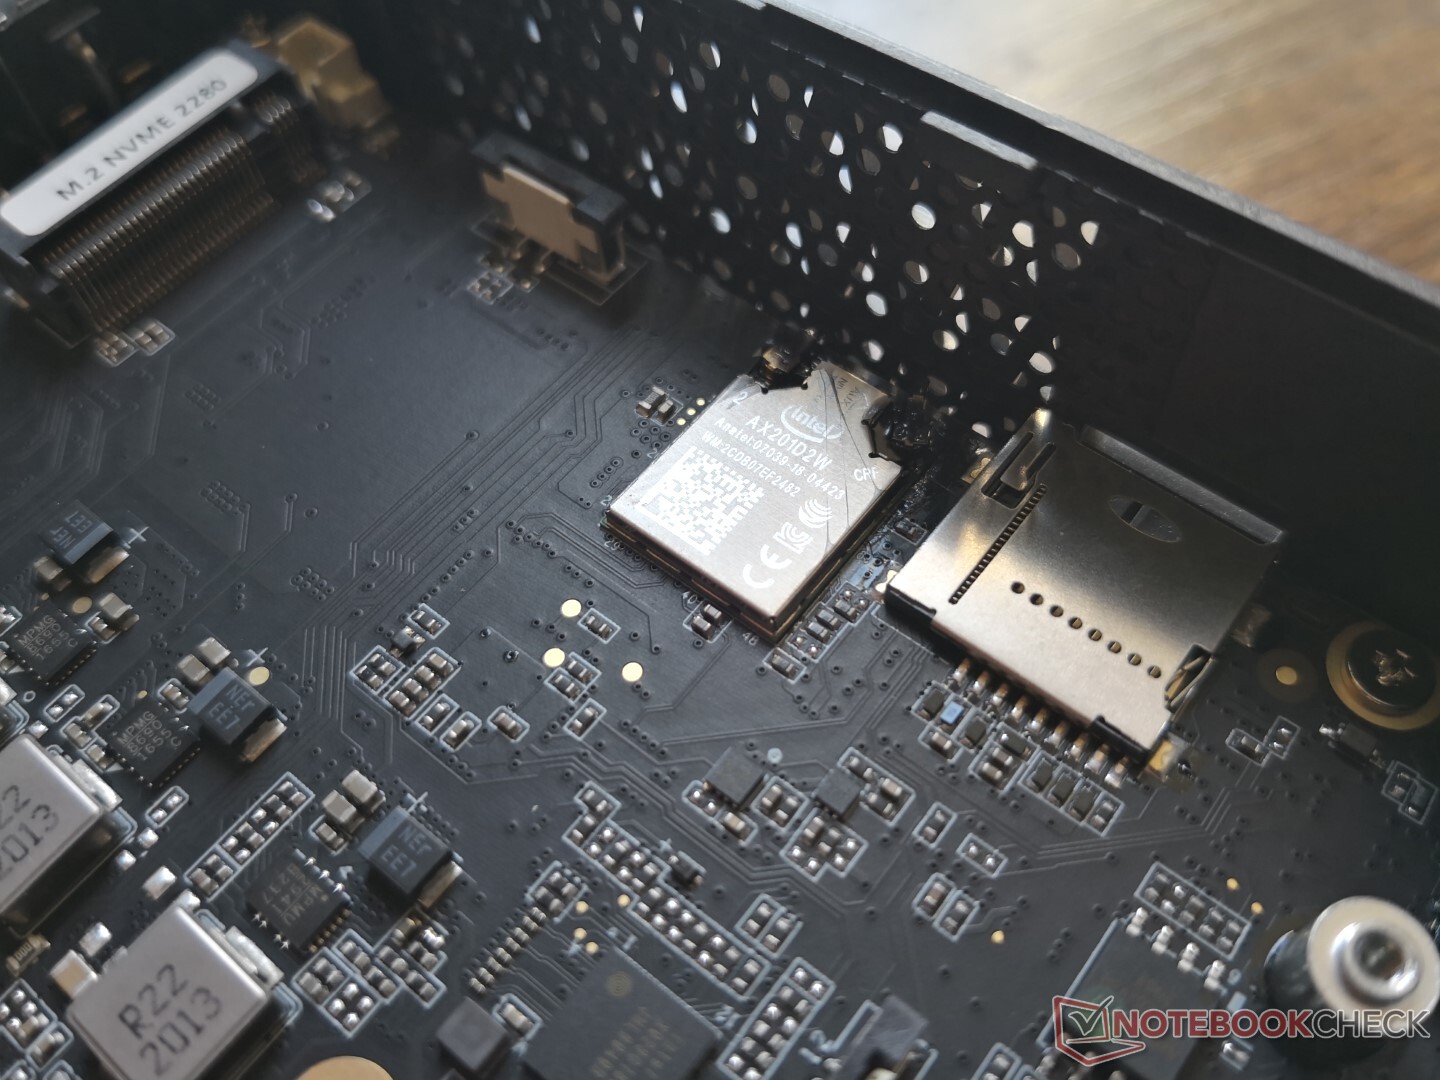
Communication
| Networking | |
| iperf3 transmit AX12 | |
| Beelink GTR35 II-G-16512D00W64PRO-1T | |
| Beelink SEi10 | |
| Lenovo ThinkCentre M90n-1 Nano | |
| Zotac ZBox MI643 | |
| iperf3 receive AX12 | |
| Beelink GTR35 II-G-16512D00W64PRO-1T | |
| Beelink SEi10 | |
| Lenovo ThinkCentre M90n-1 Nano | |
| Zotac ZBox MI643 | |
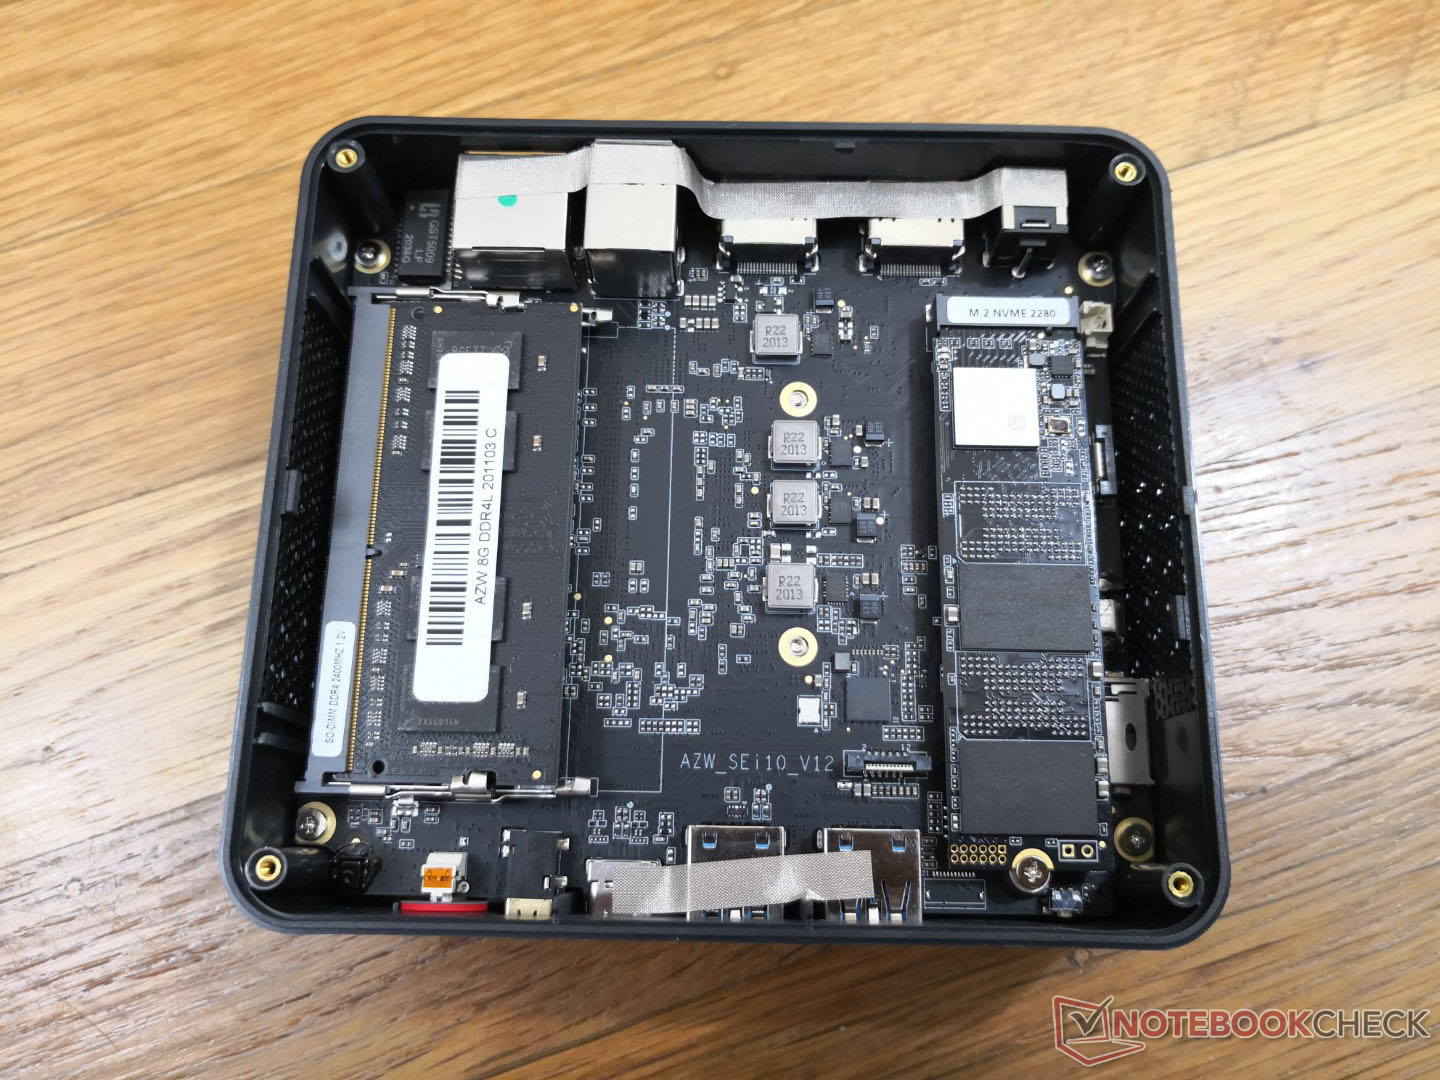
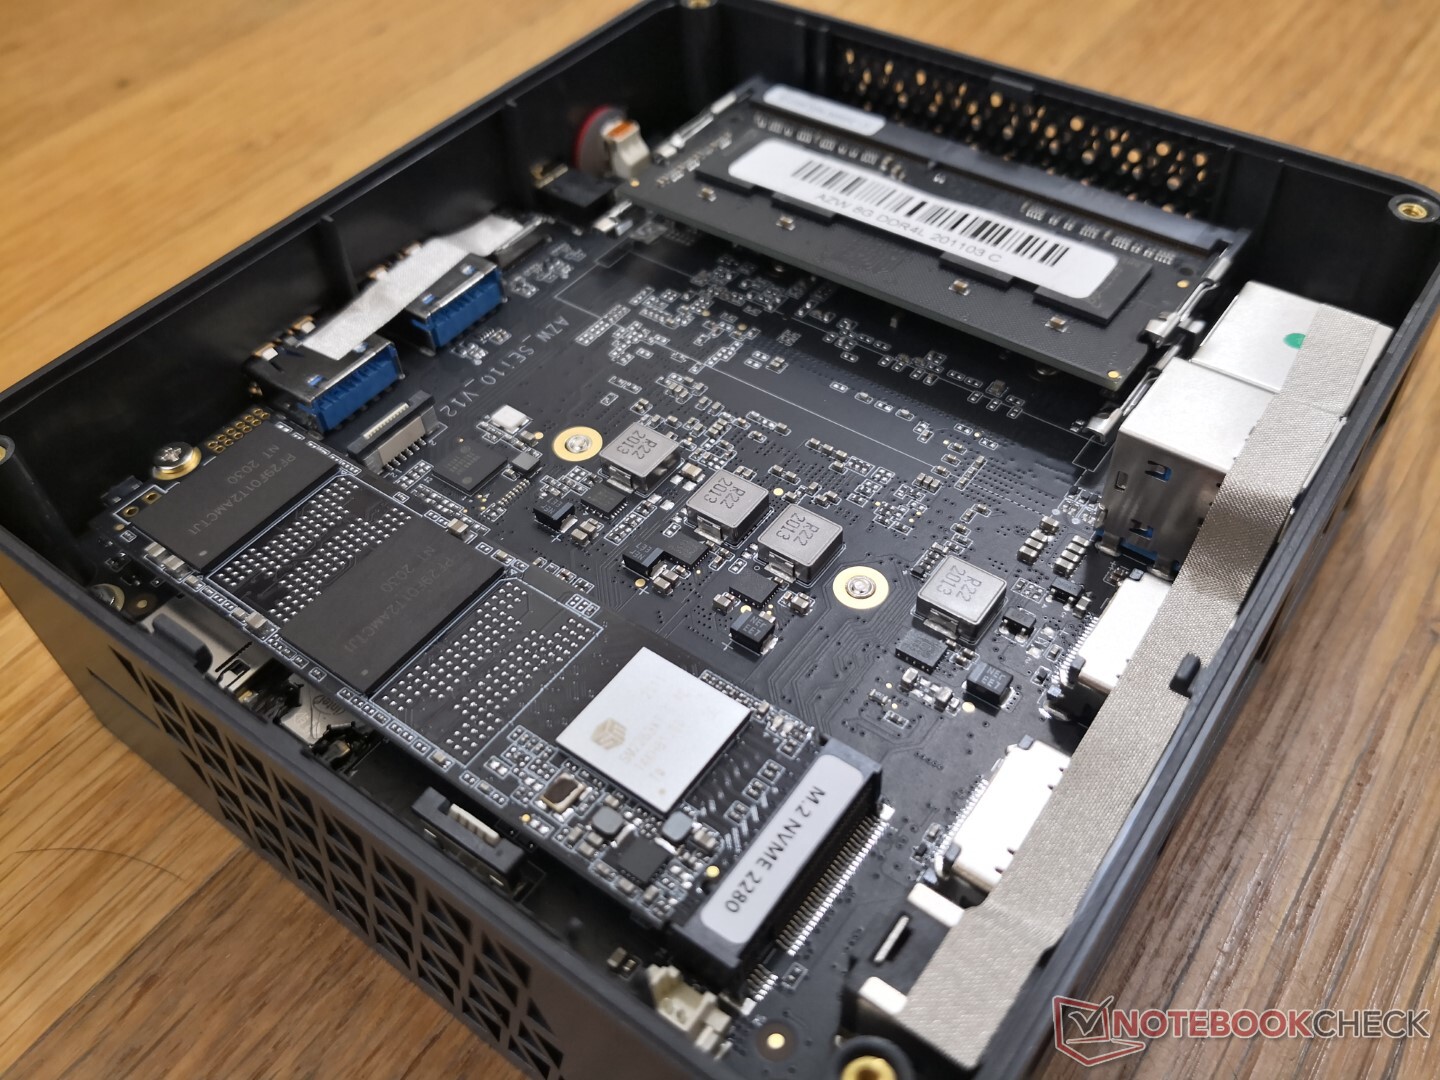
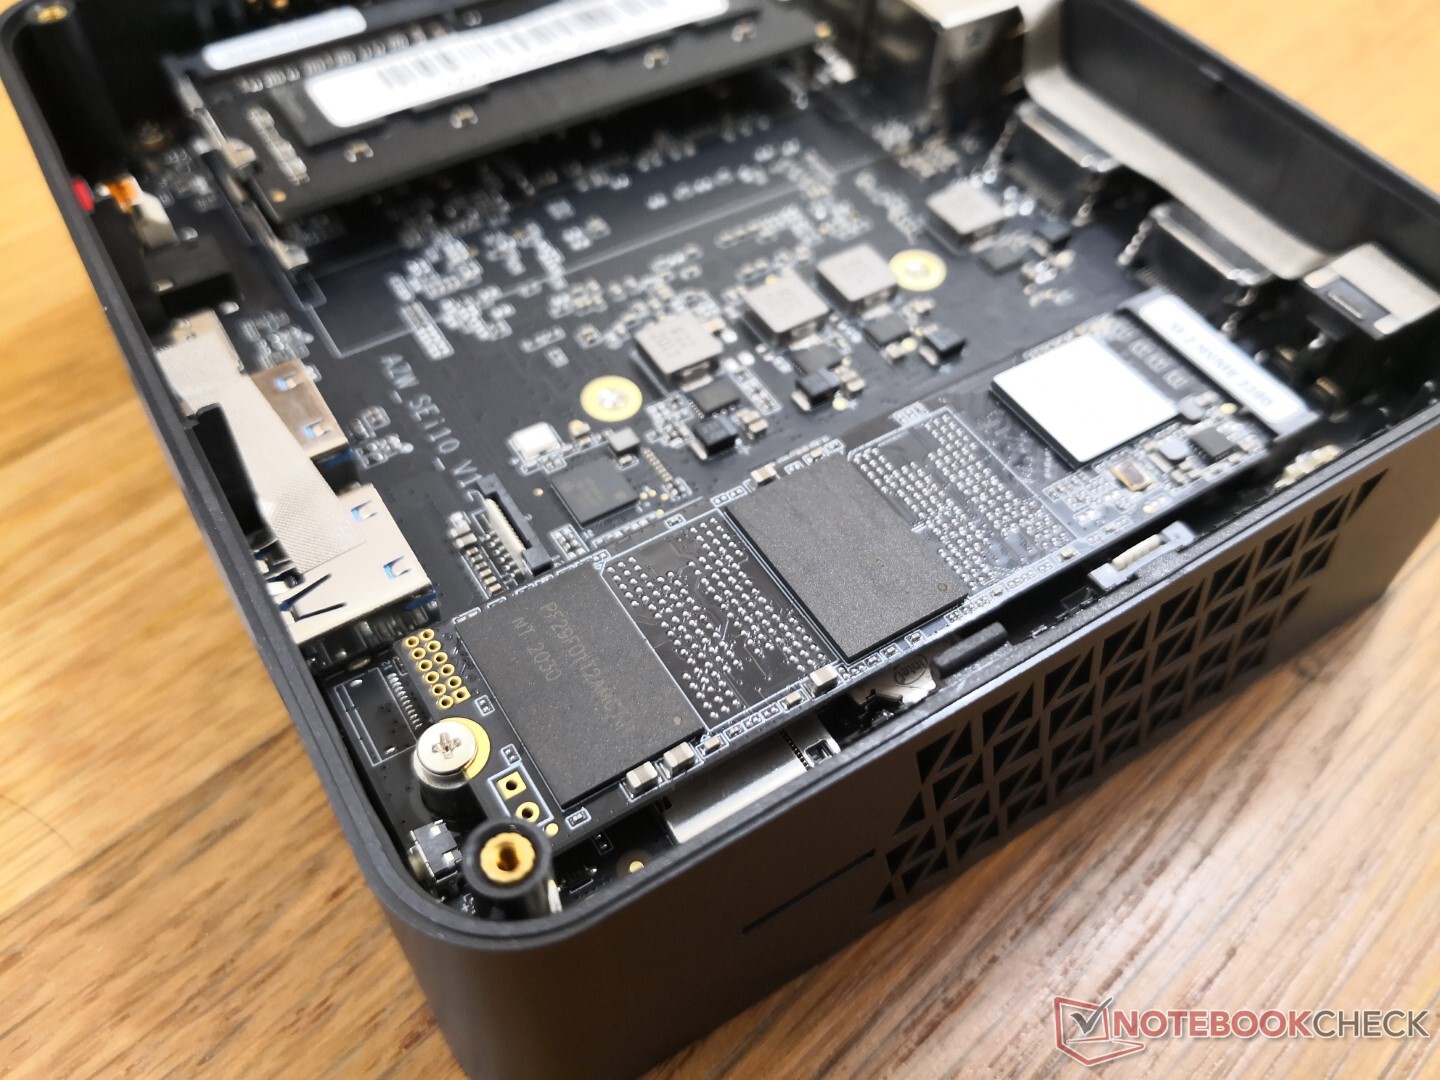
Maintenance
Accessories and Warranty

Performance
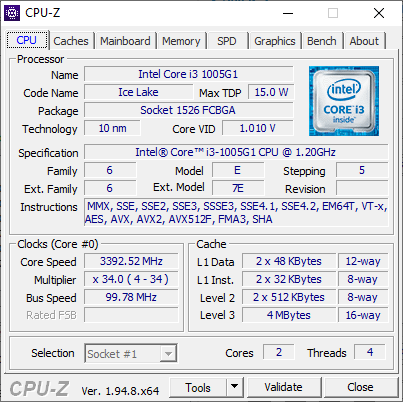
Processor
CPU performance is steady and with essentially no long-lasting Turbo Boost potential as to be expected from a Core i3 processor. Beelink could have probably offered a Ryzen 3 4300U option for both faster performance and a cheaper price than our Intel, but the final SKU would have likely not have included Thunderbolt 3 support.
More technical details and benchmarks on the Core i3-1005G1 can be found here.
Cinebench R15: CPU Multi 64Bit | CPU Single 64Bit
Blender: v2.79 BMW27 CPU
7-Zip 18.03: 7z b 4 -mmt1 | 7z b 4
Geekbench 5.5: Single-Core | Multi-Core
HWBOT x265 Benchmark v2.2: 4k Preset
LibreOffice : 20 Documents To PDF
R Benchmark 2.5: Overall mean
| Cinebench R20 / CPU (Multi Core) | |
| Intel Hades Canyon NUC8i7HVK | |
| Intel NUC10i5FNK | |
| Beelink GTR35 II-G-16512D00W64PRO-1T | |
| Acer Swift 3 SF314-42-R27B | |
| Zotac ZBox MI643 | |
| Average Intel Core i3-1005G1 (820 - 1015, n=7) | |
| Beelink SEi10 | |
| Apple MacBook Air 2020 i3 | |
| HP ProBook x360 11 G4 | |
| Cinebench R20 / CPU (Single Core) | |
| Intel NUC10i5FNK | |
| Acer Swift 3 SF314-42-R27B | |
| Zotac ZBox MI643 | |
| Intel Hades Canyon NUC8i7HVK | |
| Beelink SEi10 | |
| Average Intel Core i3-1005G1 (338 - 407, n=7) | |
| Apple MacBook Air 2020 i3 | |
| Beelink GTR35 II-G-16512D00W64PRO-1T | |
| HP ProBook x360 11 G4 | |
| Blender / v2.79 BMW27 CPU | |
| Apple MacBook Air 2020 i3 | |
| Average Intel Core i3-1005G1 (1123 - 1388, n=7) | |
| Beelink SEi10 | |
| Acer Swift 3 SF314-42-R27B | |
| Zotac ZBox MI643 | |
| Beelink GTR35 II-G-16512D00W64PRO-1T | |
| Intel NUC10i5FNK | |
| Intel Hades Canyon NUC8i7HVK | |
| 7-Zip 18.03 / 7z b 4 -mmt1 | |
| Zotac ZBox MI643 | |
| Intel NUC10i5FNK | |
| Intel Hades Canyon NUC8i7HVK | |
| Beelink SEi10 | |
| Acer Swift 3 SF314-42-R27B | |
| Average Intel Core i3-1005G1 (3789 - 4057, n=8) | |
| Beelink GTR35 II-G-16512D00W64PRO-1T | |
| Apple MacBook Air 2020 i3 | |
| 7-Zip 18.03 / 7z b 4 | |
| Intel NUC10i5FNK | |
| Intel Hades Canyon NUC8i7HVK | |
| Zotac ZBox MI643 | |
| Beelink GTR35 II-G-16512D00W64PRO-1T | |
| Acer Swift 3 SF314-42-R27B | |
| Average Intel Core i3-1005G1 (9731 - 11135, n=8) | |
| Beelink SEi10 | |
| Apple MacBook Air 2020 i3 | |
| Geekbench 5.5 / Single-Core | |
| Average Intel Core i3-1005G1 (1118 - 1194, n=6) | |
| Zotac ZBox MI643 | |
| Beelink SEi10 | |
| Intel NUC10i5FNK | |
| Apple MacBook Air 2020 i3 | |
| Acer Swift 3 SF314-42-R27B | |
| Beelink GTR35 II-G-16512D00W64PRO-1T | |
| Geekbench 5.5 / Multi-Core | |
| Zotac ZBox MI643 | |
| Intel NUC10i5FNK | |
| Acer Swift 3 SF314-42-R27B | |
| Beelink GTR35 II-G-16512D00W64PRO-1T | |
| Average Intel Core i3-1005G1 (2153 - 2595, n=6) | |
| Beelink SEi10 | |
| Apple MacBook Air 2020 i3 | |
| HWBOT x265 Benchmark v2.2 / 4k Preset | |
| Intel Hades Canyon NUC8i7HVK | |
| Intel NUC10i5FNK | |
| Acer Swift 3 SF314-42-R27B | |
| Zotac ZBox MI643 | |
| Beelink GTR35 II-G-16512D00W64PRO-1T | |
| Beelink SEi10 | |
| Average Intel Core i3-1005G1 (2.42 - 3.59, n=7) | |
| Apple MacBook Air 2020 i3 | |
| LibreOffice / 20 Documents To PDF | |
| Apple MacBook Air 2020 i3 | |
| Beelink GTR35 II-G-16512D00W64PRO-1T | |
| Average Intel Core i3-1005G1 (55.8 - 81.7, n=6) | |
| Acer Swift 3 SF314-42-R27B | |
| Zotac ZBox MI643 | |
| Beelink SEi10 | |
| R Benchmark 2.5 / Overall mean | |
| Apple MacBook Air 2020 i3 | |
| Beelink SEi10 | |
| Average Intel Core i3-1005G1 (0.746 - 0.763, n=6) | |
| Beelink GTR35 II-G-16512D00W64PRO-1T | |
| Intel NUC10i5FNK | |
| Acer Swift 3 SF314-42-R27B | |
| Zotac ZBox MI643 | |
* ... smaller is better
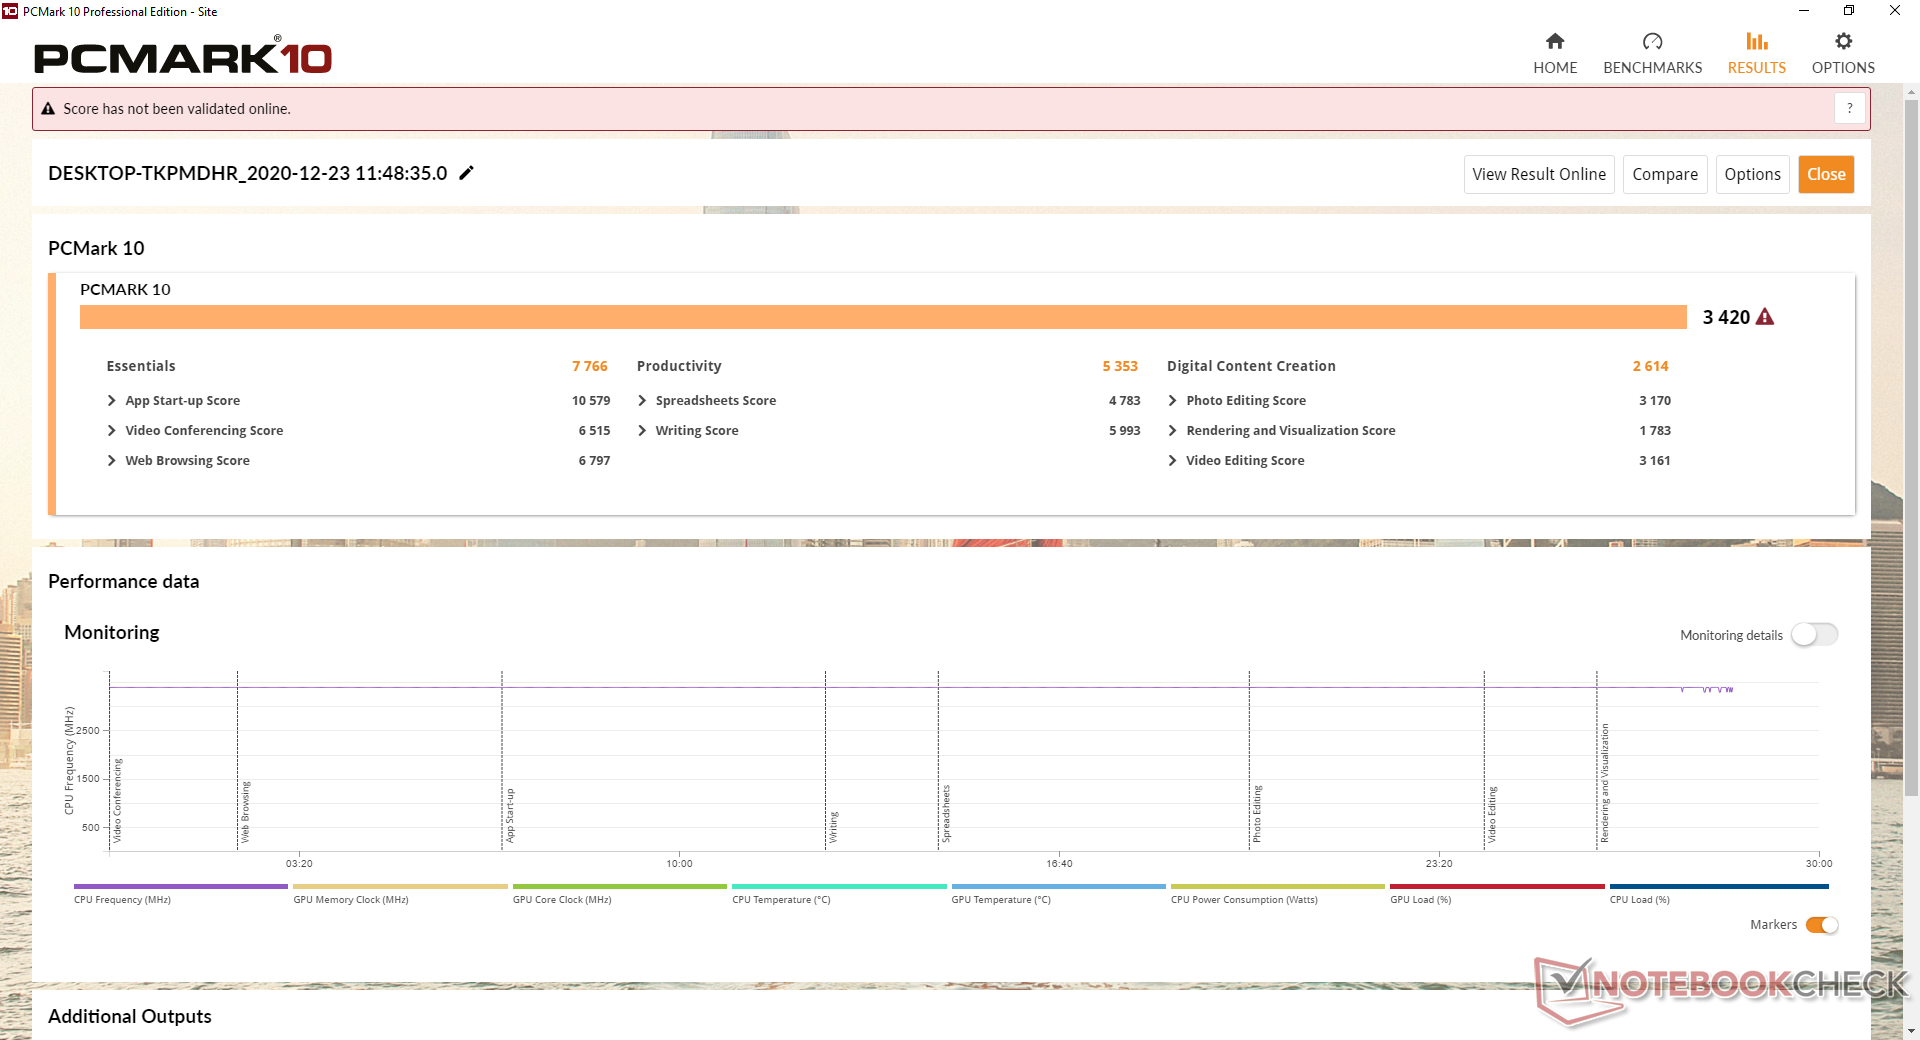
System Performance
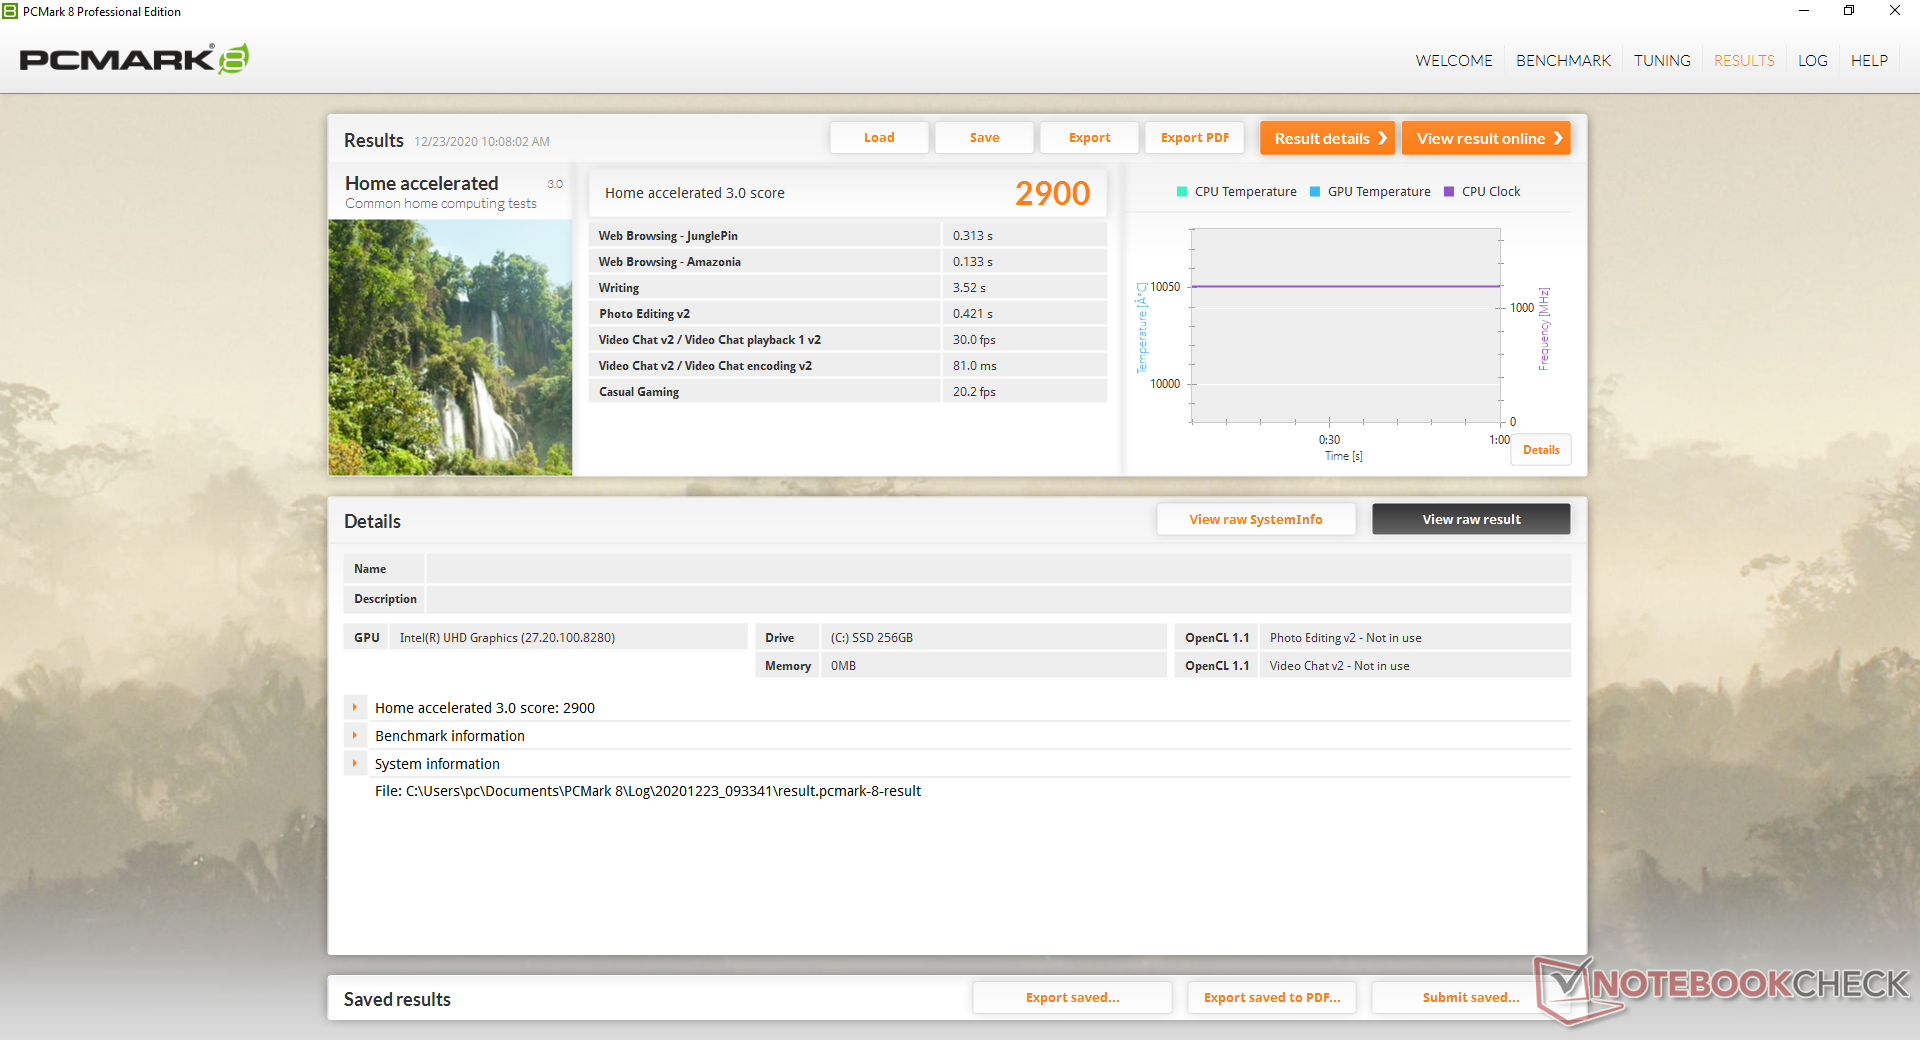
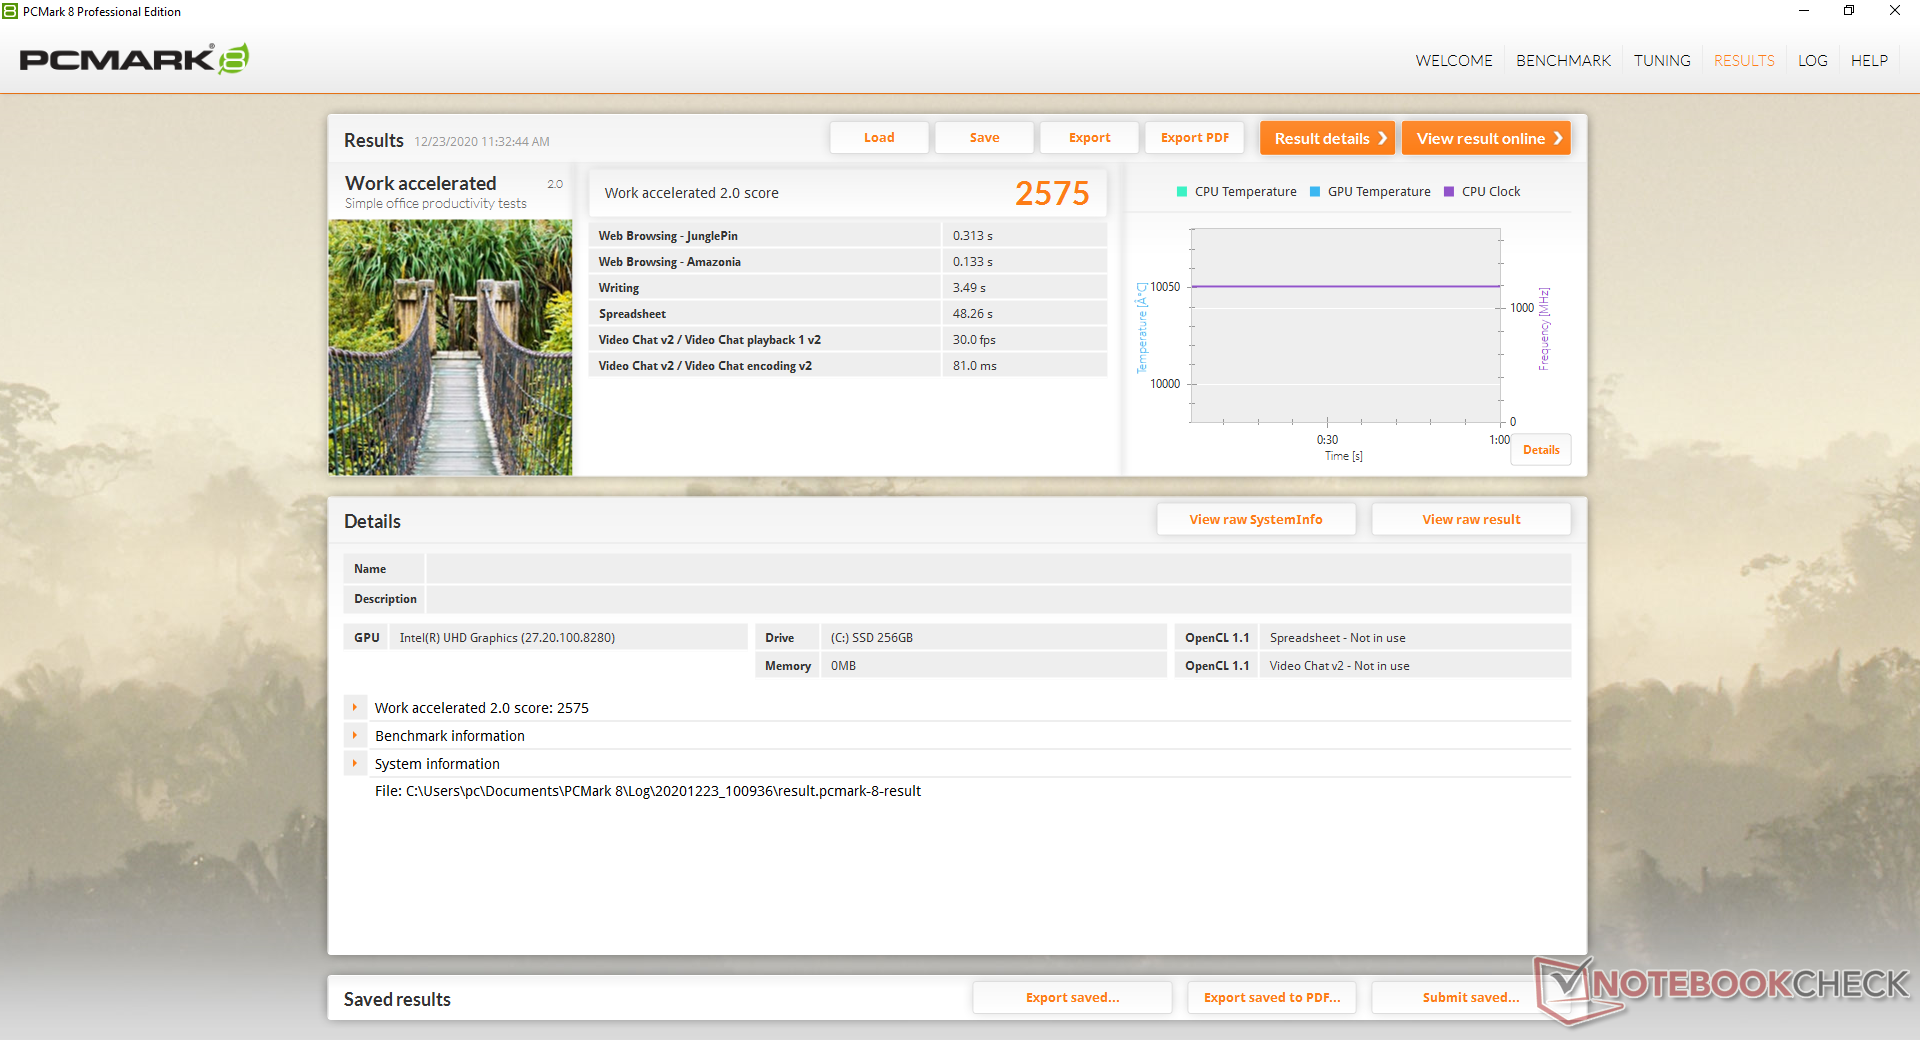
| PCMark 8 Home Score Accelerated v2 | 2900 points | |
| PCMark 8 Work Score Accelerated v2 | 2575 points | |
| PCMark 10 Score | 3420 points | |
Help | ||
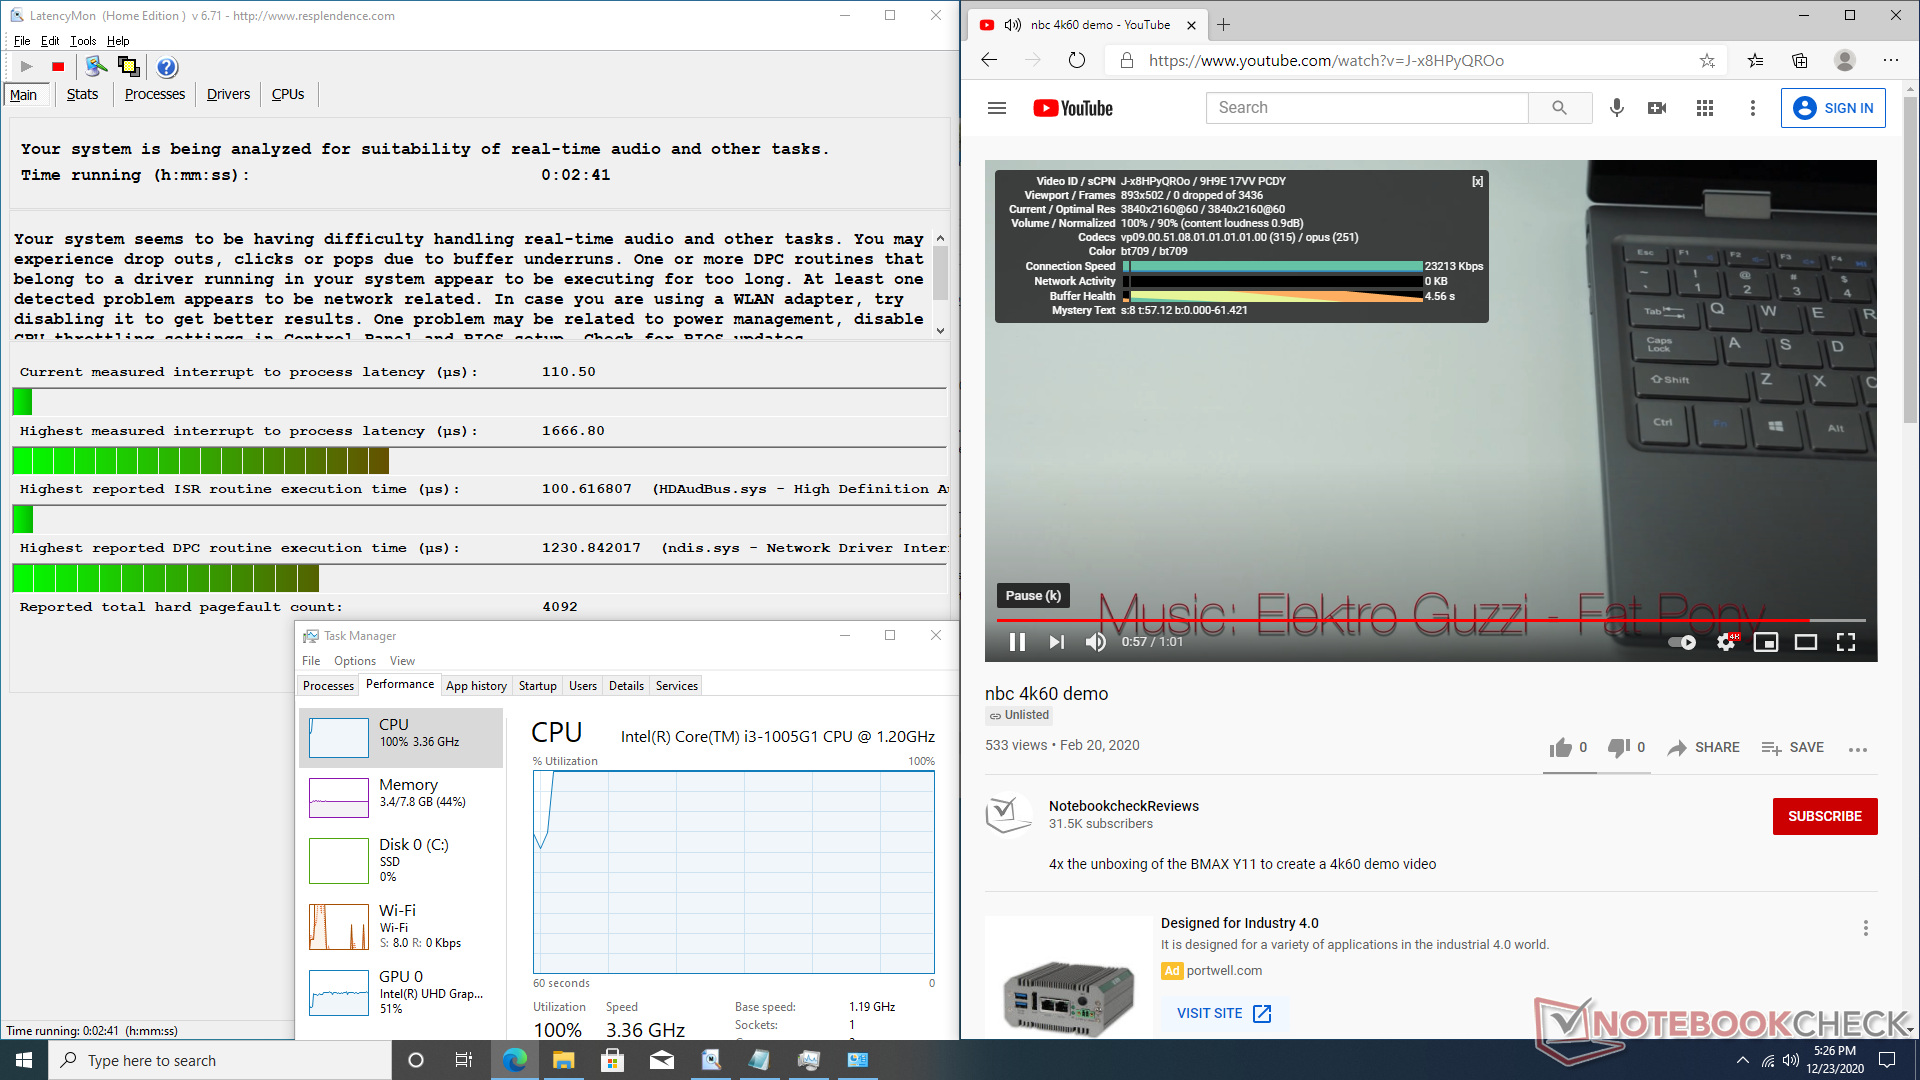
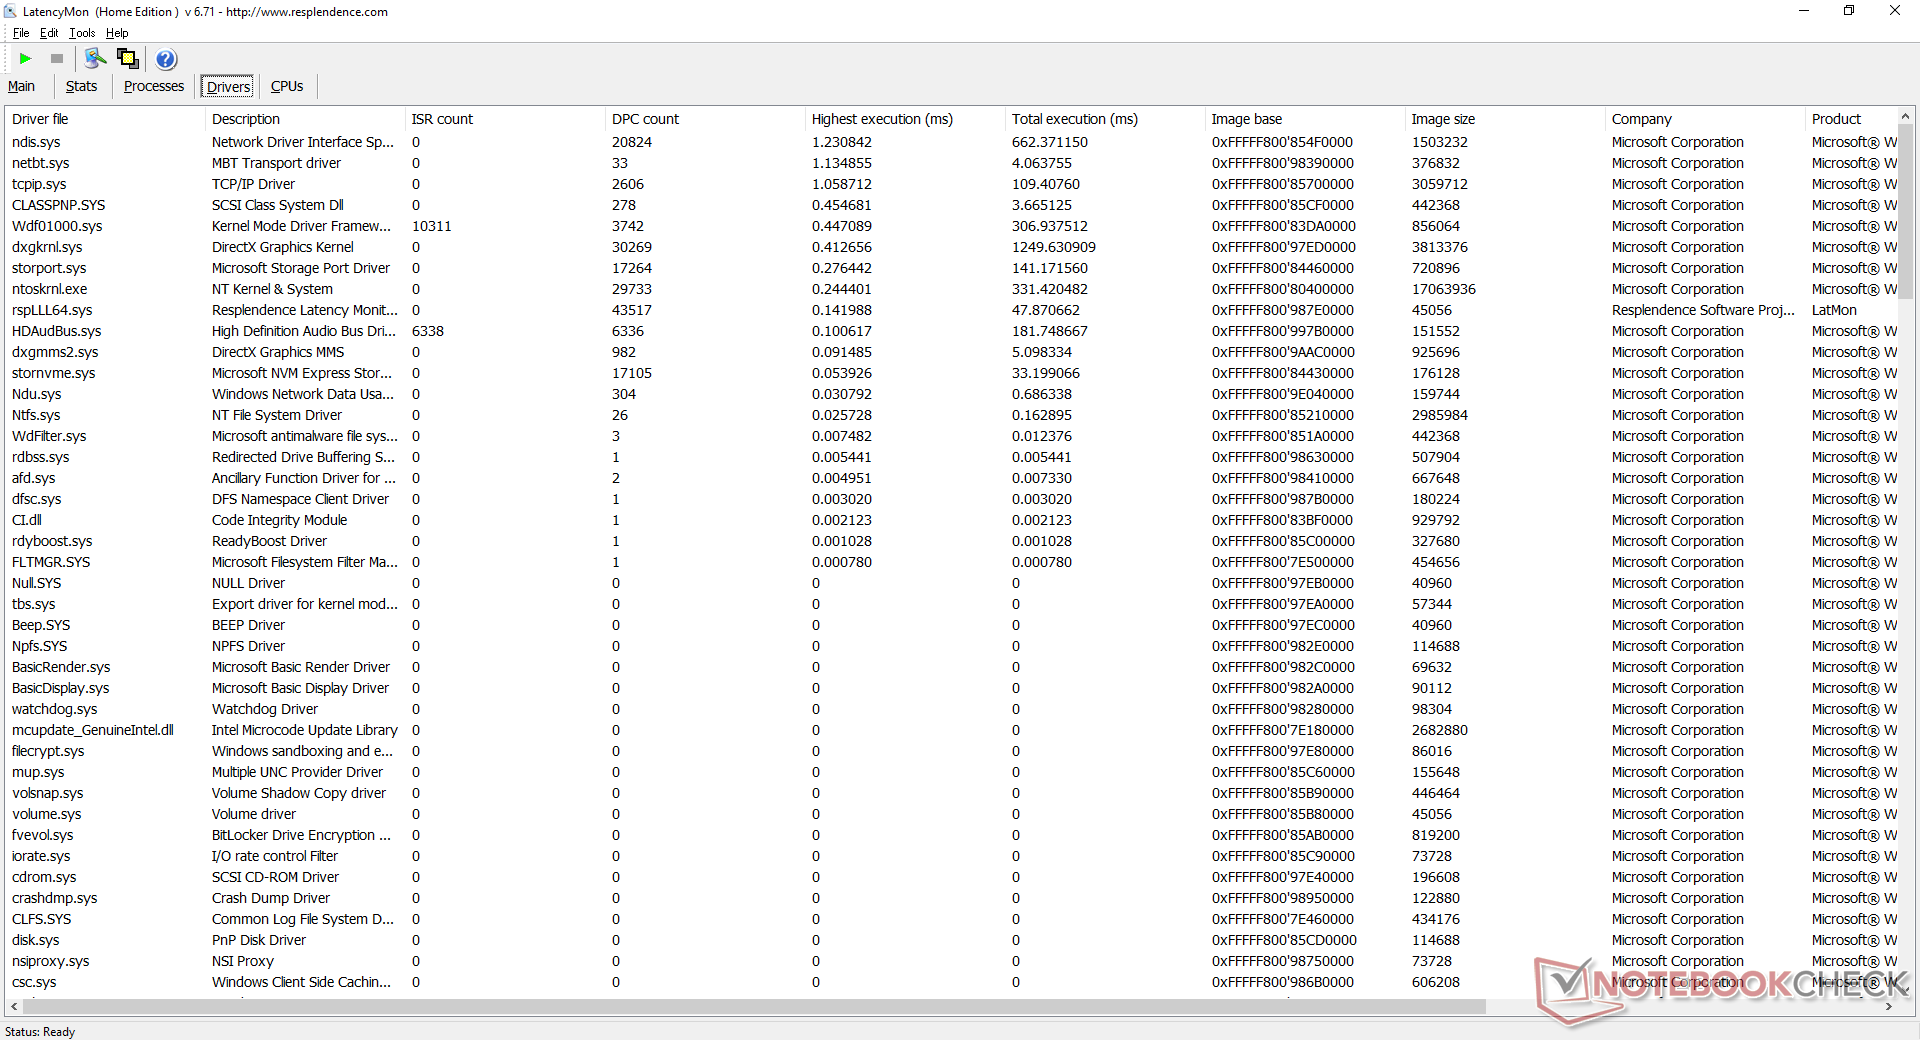
DPC Latency
LatencyMon reports minor DPC latency issues related to NDIS.SYS. 4K60 video playback is otherwise smooth and with no dropped frames during our minute-long YouTube test. However, CPU utilization would sometimes jump from 31 percent to 100 percent meaning there will be some stutters if users are multi-tasking while streaming 4K.
| DPC Latencies / LatencyMon - interrupt to process latency (max), Web, Youtube, Prime95 | |
| Beelink SEi10 | |
| Acer Swift 3 SF314-42-R27B | |
| Chuwi LarkBox 4K Mini PC | |
| Zotac ZBox MI643 | |
| Beelink GTR35 II-G-16512D00W64PRO-1T | |
* ... smaller is better
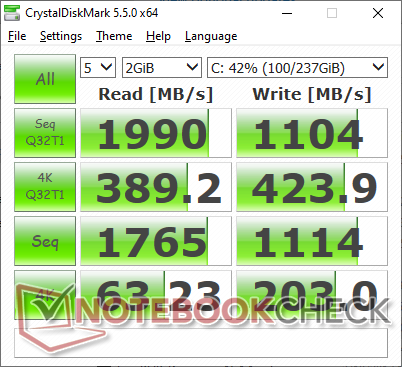
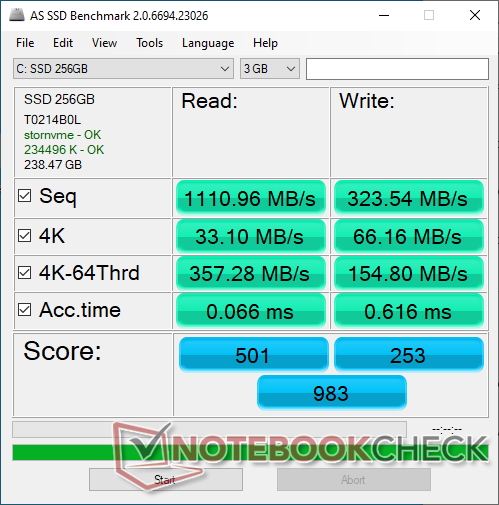
Storage Devices
Much like on the Beelink GT-R, our SEi10 uses an M.2 NVMe drive from Silicon Motion. Transfer rates show that this is a budget PCIe x2 drive with write rates slower than many SATA III SSDs. For the target audience and price, however, this shouldn't be an issue. HWiNFO reports a PCIe x4 controller if users want to upgrade to a faster drive.
| Beelink SEi10 Silicon Motion AZW 256G M.2280 NVMe 4X 200725 D | Beelink GTR35 II-G-16512D00W64PRO-1T Silicon Motion AZW 512G NV428 | Intel NUC10i5FNK Kingston RBUSNS8154P3256GJ1 | Lenovo ThinkCentre M90n-1 Nano Samsung SSD PM981 MZVLB512HAJQ | |
|---|---|---|---|---|
| AS SSD | 126% | 72% | 176% | |
| Seq Read (MB/s) | 1111 | 1382 24% | 1318 19% | 1668 50% |
| Seq Write (MB/s) | 323.5 | 1413 337% | 616 90% | 1150 255% |
| 4K Read (MB/s) | 33.1 | 35.27 7% | 26.44 -20% | 48.46 46% |
| 4K Write (MB/s) | 66.2 | 98.6 49% | 61.3 -7% | 116.5 76% |
| 4K-64 Read (MB/s) | 357.3 | 696 95% | 650 82% | 726 103% |
| 4K-64 Write (MB/s) | 154.8 | 814 426% | 642 315% | 1074 594% |
| Access Time Read * (ms) | 0.066 | 0.063 5% | 0.11 -67% | 0.039 41% |
| Access Time Write * (ms) | 0.616 | 0.114 81% | 0.07 89% | 0.032 95% |
| Score Read (Points) | 501 | 869 73% | 808 61% | 942 88% |
| Score Write (Points) | 253 | 1054 317% | 765 202% | 1305 416% |
| Score Total (Points) | 983 | 2377 142% | 1955 99% | 2716 176% |
| Copy ISO MB/s (MB/s) | 1160 | 1228 6% | 576 -50% | |
| Copy Program MB/s (MB/s) | 121.1 | 261.7 116% | 328.9 172% | |
| Copy Game MB/s (MB/s) | 364.4 | 658 81% | 471.2 29% | |
| CrystalDiskMark 5.2 / 6 | -7% | -31% | 27% | |
| Write 4K (MB/s) | 203 | 161.9 -20% | 58.4 -71% | 130 -36% |
| Read 4K (MB/s) | 63.2 | 52.8 -16% | 30.24 -52% | 45.61 -28% |
| Write Seq (MB/s) | 1114 | 773 -31% | ||
| Read Seq (MB/s) | 1765 | 712 -60% | ||
| Write 4K Q32T1 (MB/s) | 423.9 | 285 -33% | 448.5 6% | 365.3 -14% |
| Read 4K Q32T1 (MB/s) | 389.2 | 324 -17% | 391.4 1% | 350.2 -10% |
| Write Seq Q32T1 (MB/s) | 1104 | 1579 43% | 914 -17% | 2986 170% |
| Read Seq Q32T1 (MB/s) | 1990 | 2018 1% | 1583 -20% | 3565 79% |
| Write 4K Q8T8 (MB/s) | 530 | 402.3 | 368.7 | |
| Read 4K Q8T8 (MB/s) | 738 | 680 | 790 | |
| Total Average (Program / Settings) | 60% /
86% | 21% /
35% | 102% /
124% |
* ... smaller is better

Disk Throttling: DiskSpd Read Loop, Queue Depth 8
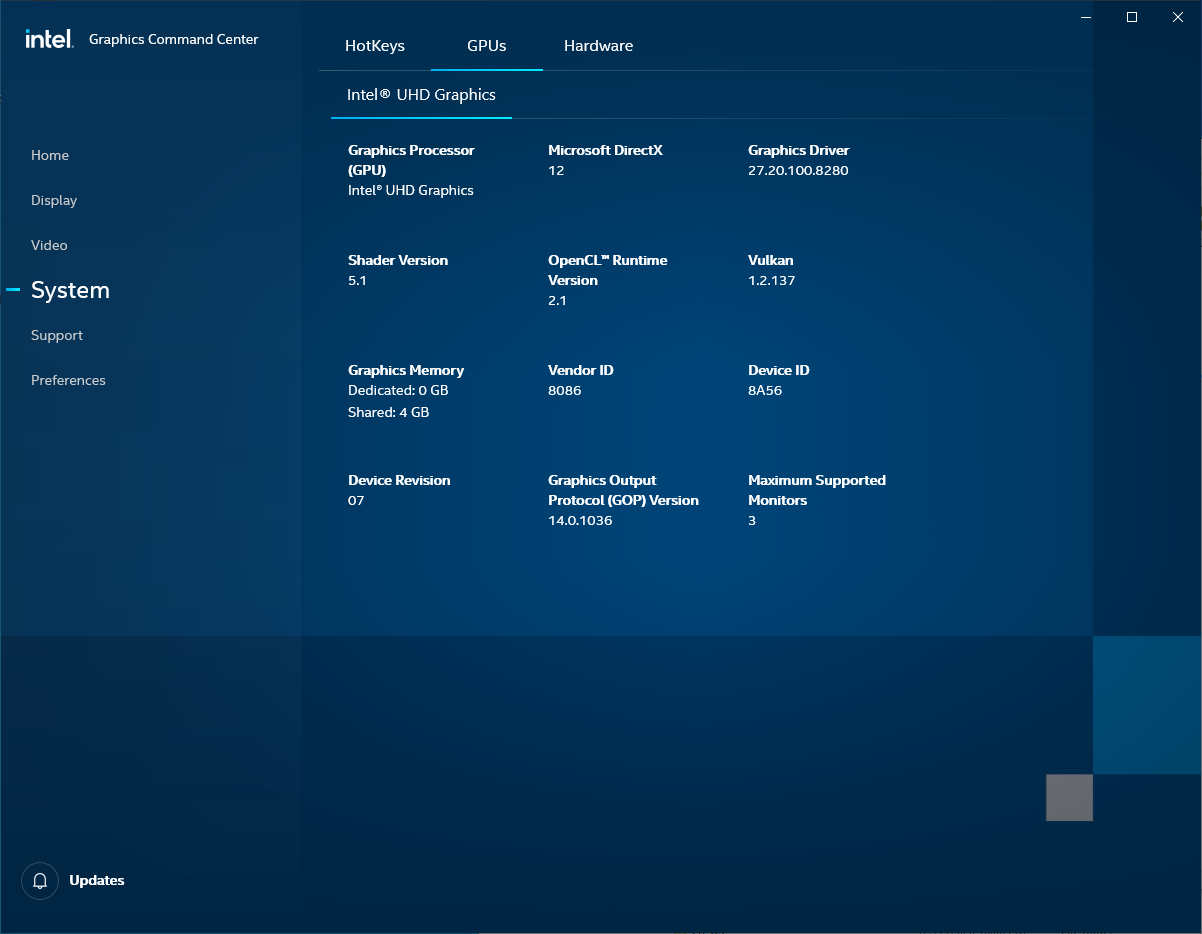
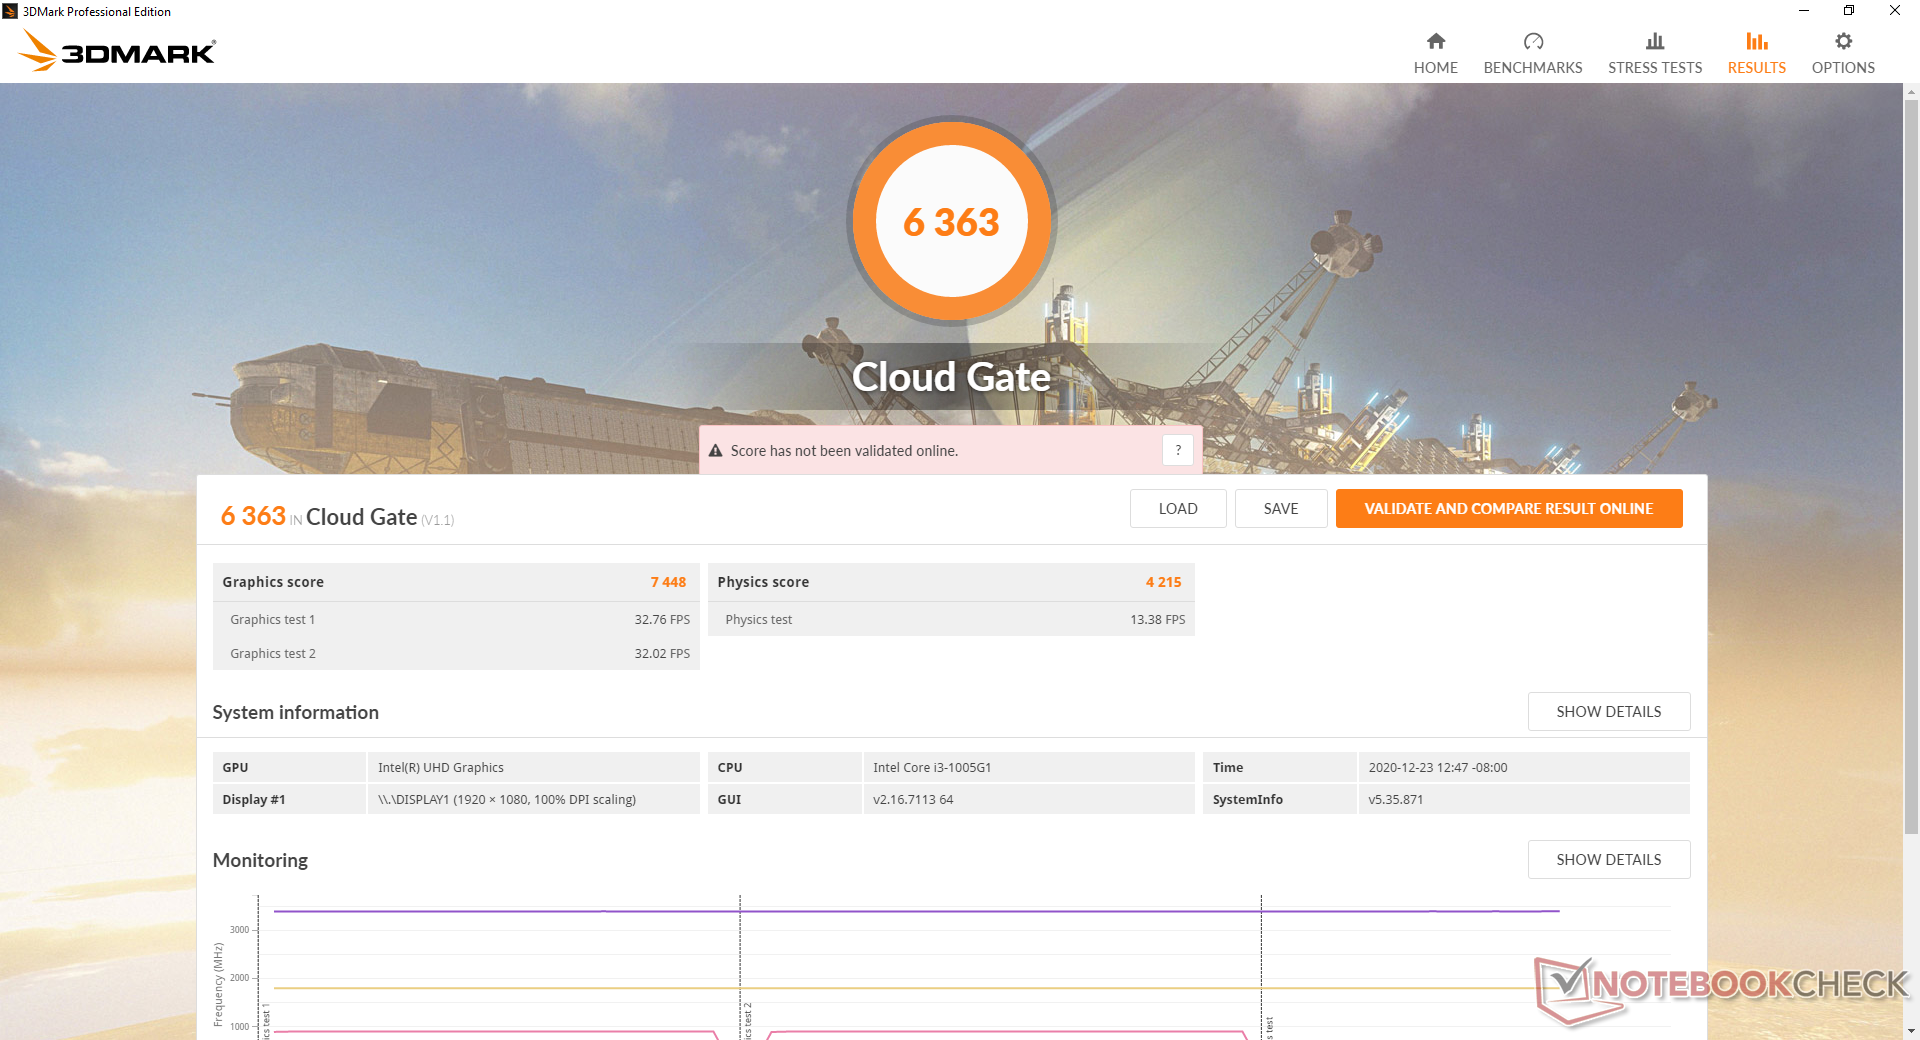
GPU Performance
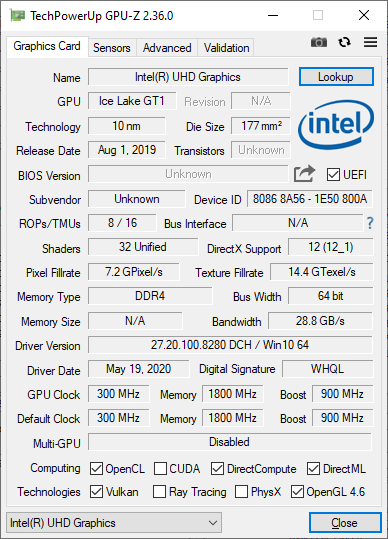
Graphics performance is even slower than the half-decade old HD Graphics 620. Again, this shouldn't be an issue for the target audience as the system is still capable of smooth 4K video playback.
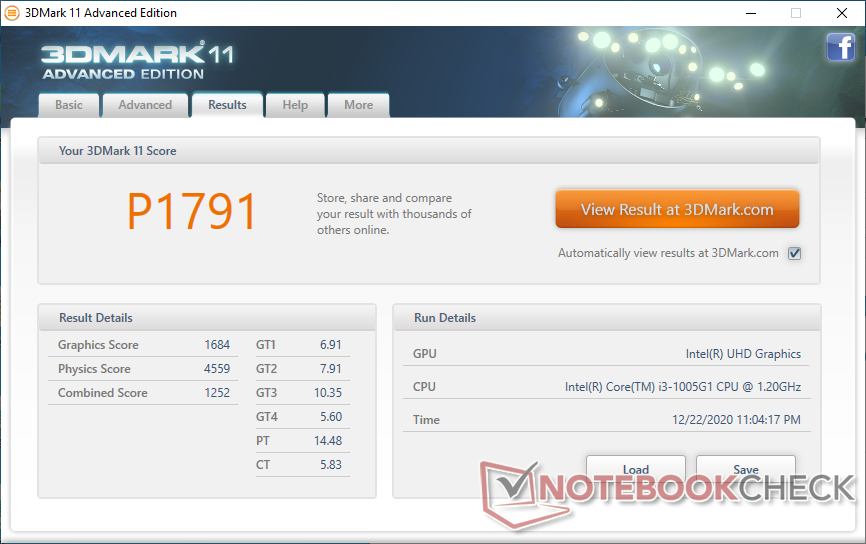
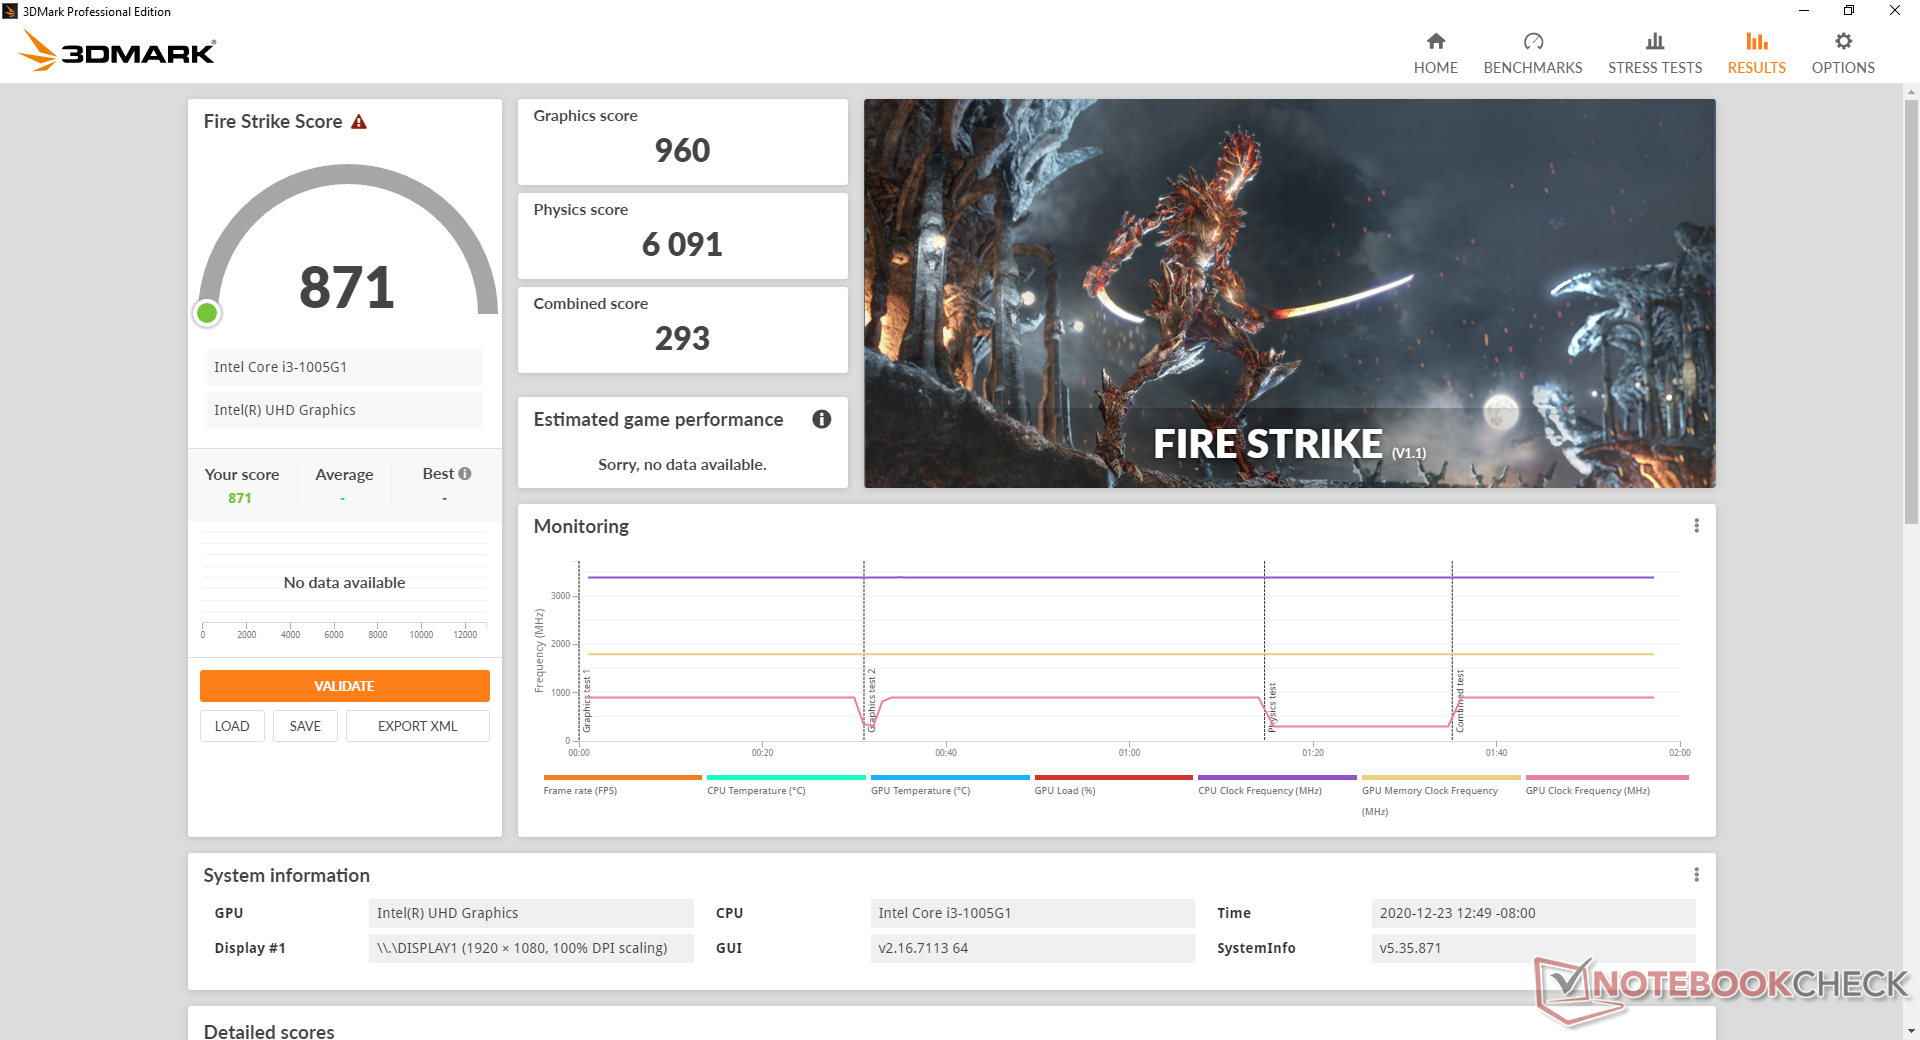
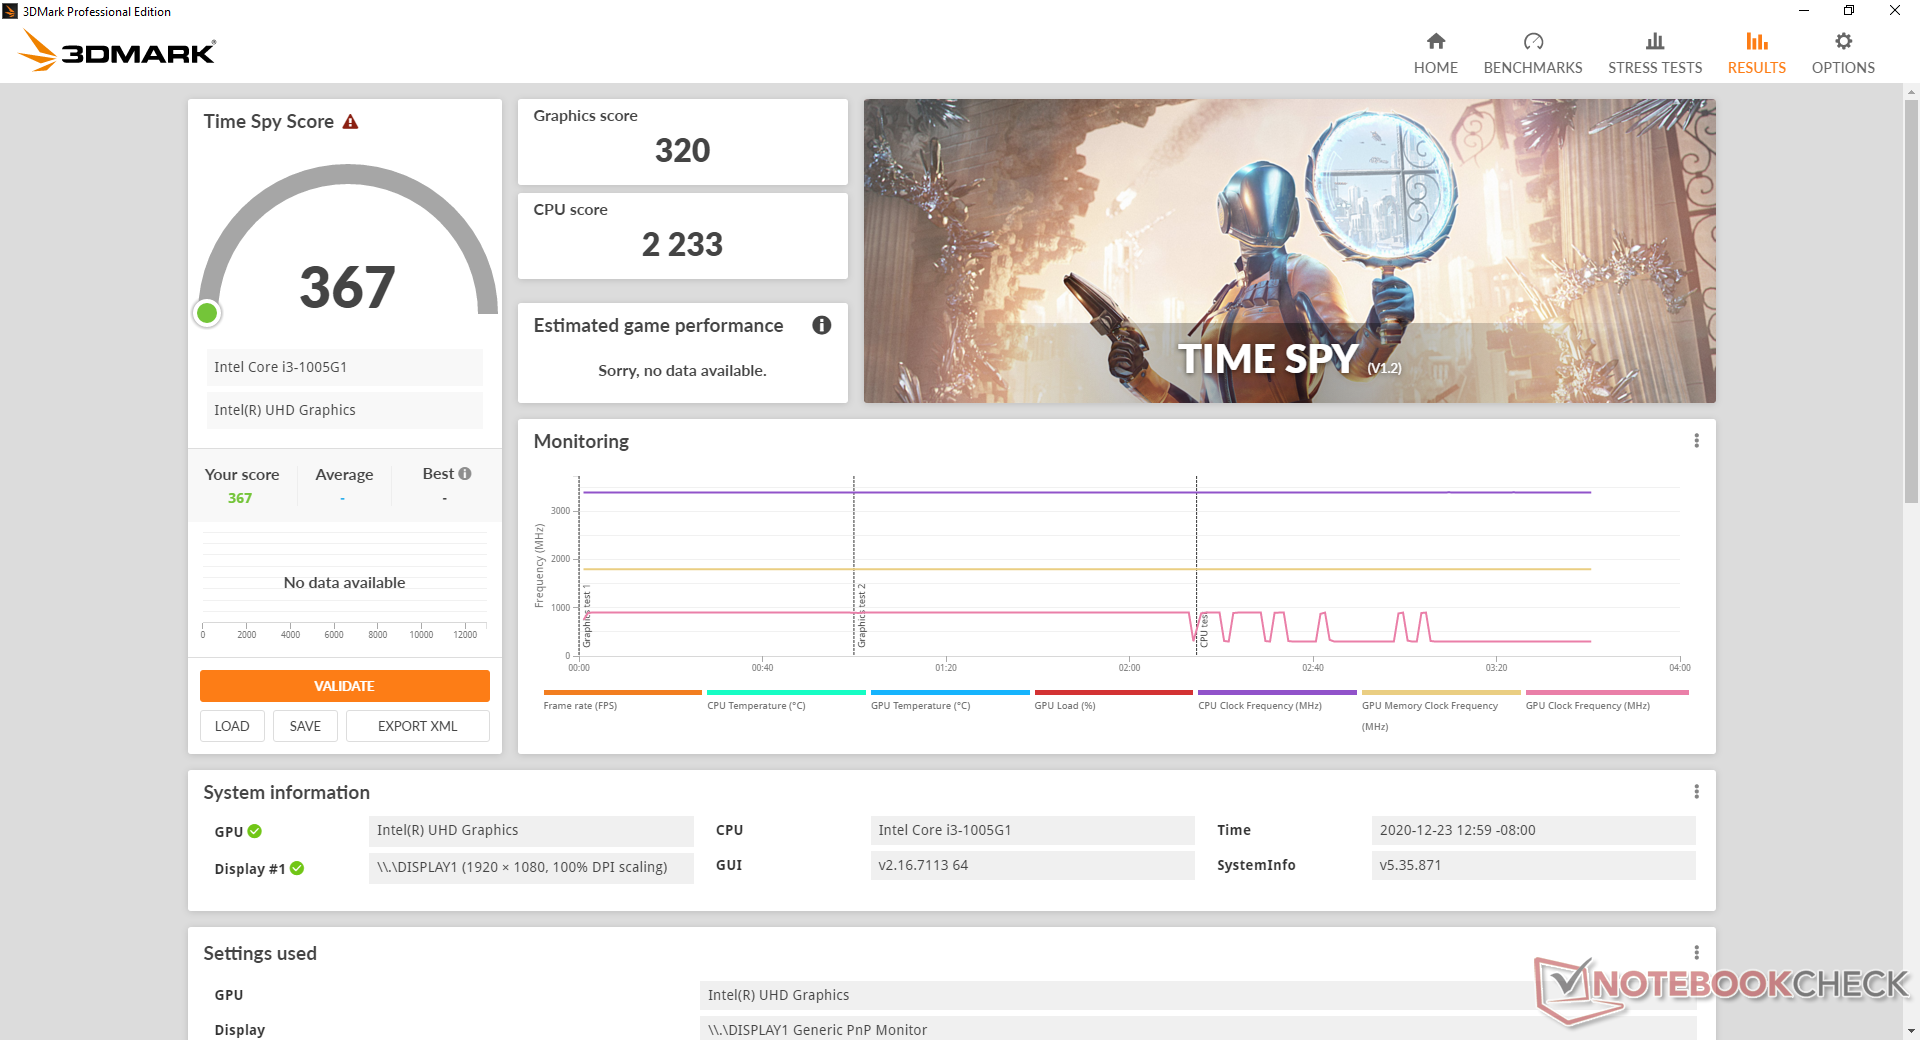
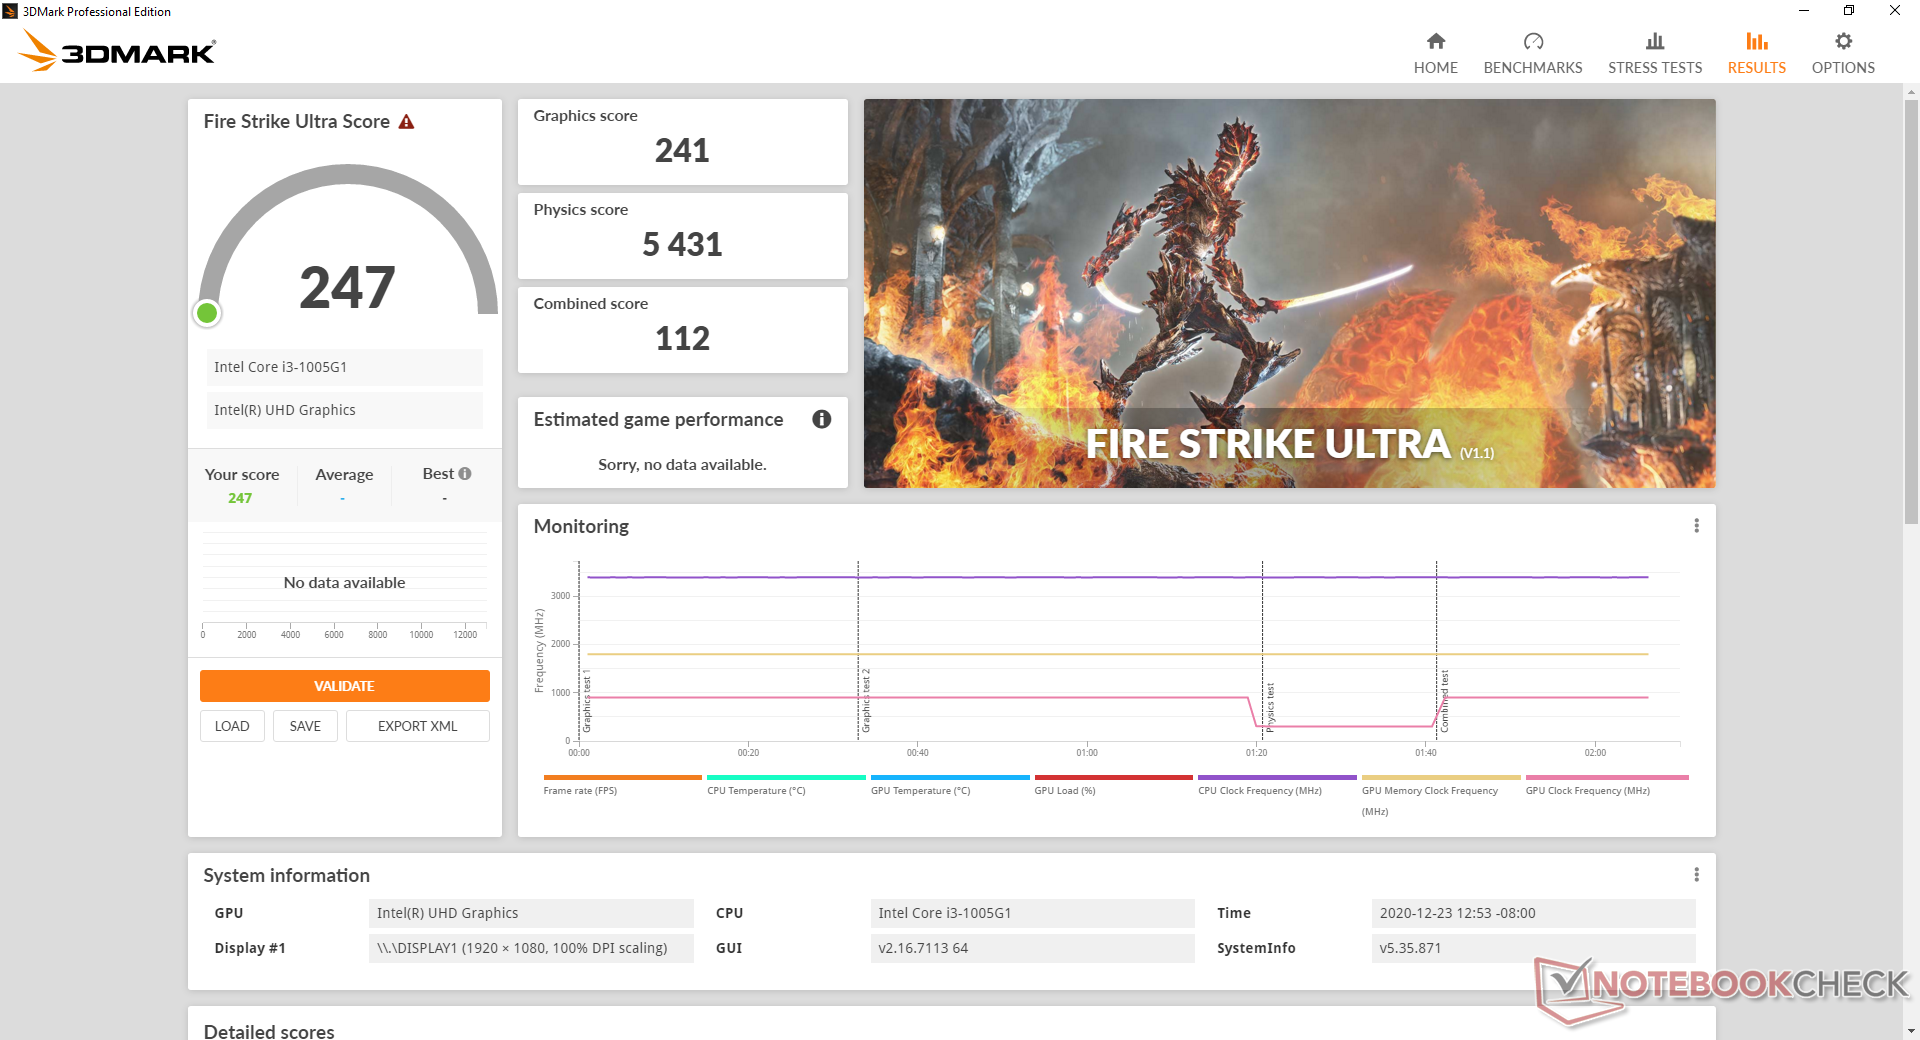
| 3DMark 11 Performance | 1791 points | |
| 3DMark Cloud Gate Standard Score | 6363 points | |
| 3DMark Fire Strike Score | 871 points | |
| 3DMark Time Spy Score | 367 points | |
Help | ||
| low | med. | high | ultra | |
|---|---|---|---|---|
| Dota 2 Reborn (2015) | 61.2 | 25 | 15.3 | 14.2 |
Emissions
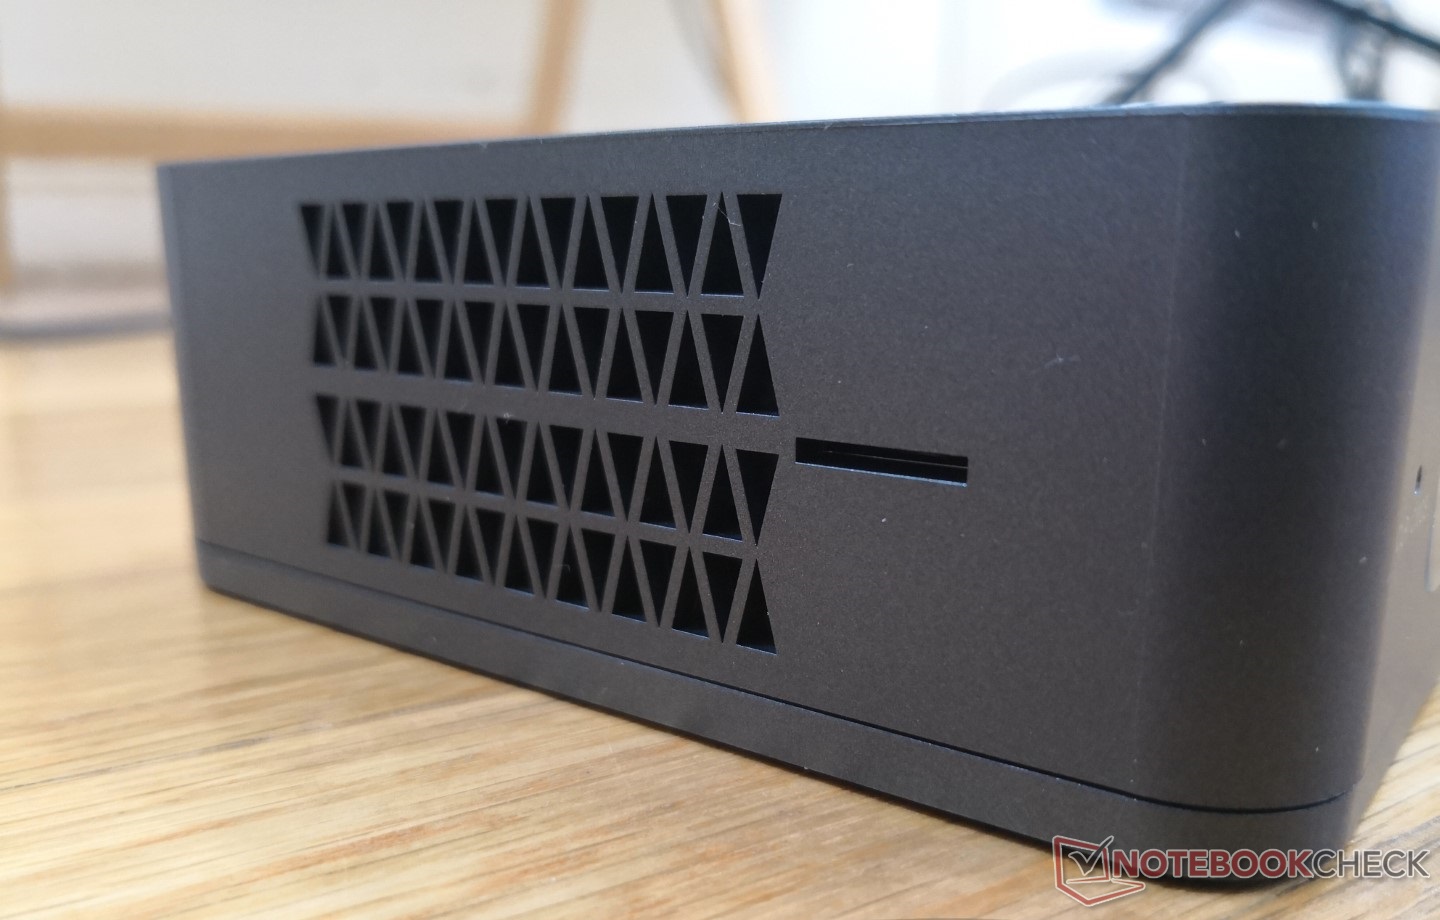
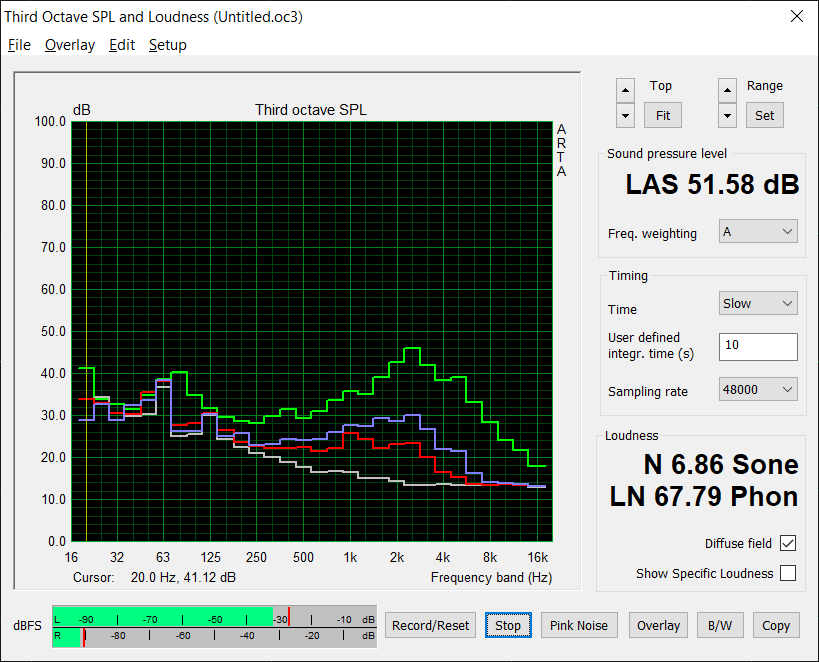
System Noise
The internal fan is always active and never truly silent. It tends to pulse between 31 dB(A) and 34 dB(A) when browsing or video streaming which is loud enough to be audible but not distracting. High loads like 3DMark 06 will bump fan noise up to 39 dB(A).
Extreme loads like Prime95 will induce a fan noise of 52 dB(A) to be louder than most other mini PCs.
| Beelink SEi10 UHD Graphics G1 (Ice Lake 32 EU), i3-1005G1, Silicon Motion AZW 256G M.2280 NVMe 4X 200725 D | Beelink GTR35 II-G-16512D00W64PRO-1T Vega 8, R5 3550H, Silicon Motion AZW 512G NV428 | Zotac ZBox MI643 UHD Graphics 620, i5-10210U, Lexar NM610 1TB | Intel Hades Canyon NUC8i7HVK Vega M GH, i7-8809G, Intel Optane 120 GB SSDPEK1W120GA | Chuwi LarkBox 4K Mini PC UHD Graphics 600, Celeron J4115, 128 GB eMMC Flash | |
|---|---|---|---|---|---|
| Noise | 1% | 16% | 6% | 3% | |
| off / environment * (dB) | 27.5 | 25.4 8% | 26.1 5% | 28.7 -4% | 26 5% |
| Idle Minimum * (dB) | 30.9 | 31.5 -2% | 27.5 11% | 29 6% | 26 16% |
| Idle Average * (dB) | 33.5 | 31.5 6% | 27.5 18% | 29 13% | 26 22% |
| Idle Maximum * (dB) | 33.5 | 31.5 6% | 27.5 18% | 29 13% | 43.3 -29% |
| Load Average * (dB) | 38.5 | 43.9 -14% | 28.9 25% | 36 6% | 43.3 -12% |
| Load Maximum * (dB) | 51.6 | 52 -1% | 42 19% | 49.4 4% | 43.5 16% |
| Witcher 3 ultra * (dB) | 51.9 | 42 |
* ... smaller is better
Noise level
| Idle |
| 30.9 / 33.5 / 33.5 dB(A) |
| Load |
| 38.5 / 51.6 dB(A) |
 | ||
30 dB silent 40 dB(A) audible 50 dB(A) loud |
||
min: | ||
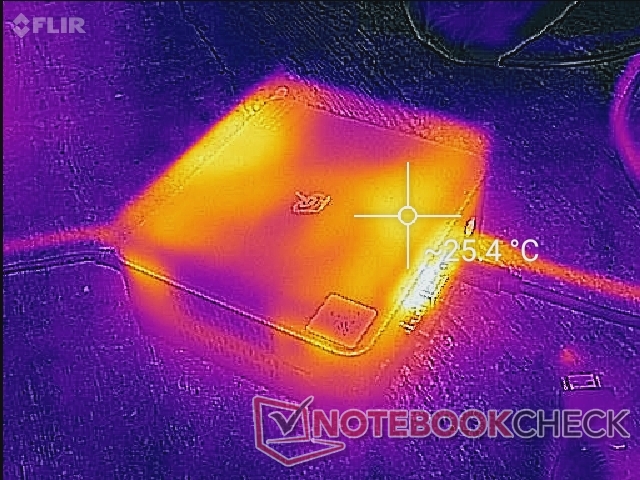
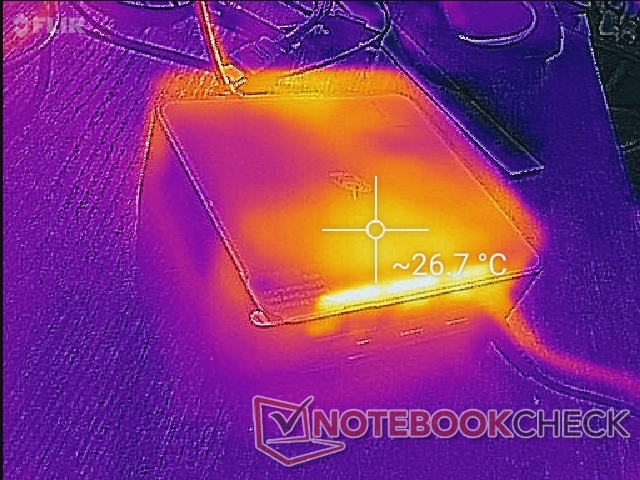
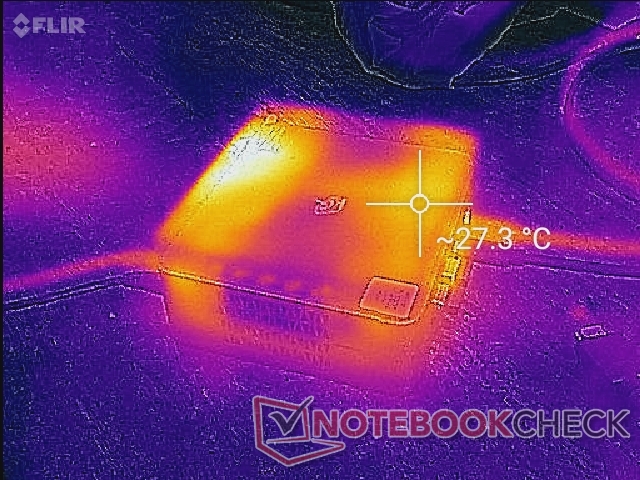
Temperature
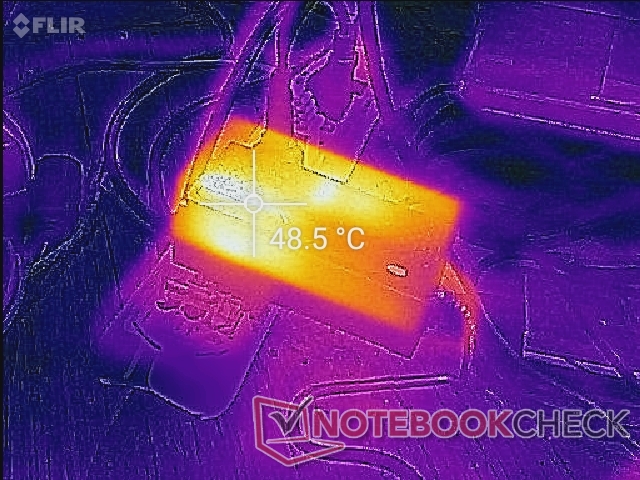
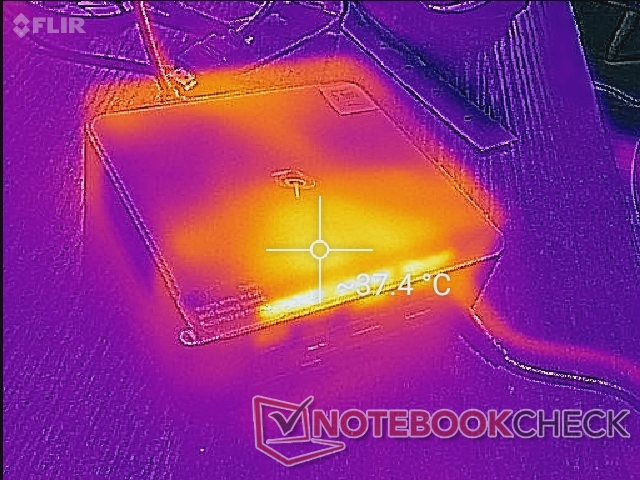
Surface temperatures are never hazardous as we're only able to measure a maximum of just 37 C. Positioning the mini PC vertically will block a section of the ventilation grilles which will cause warmer core temperatures or more noticeable fan noise.
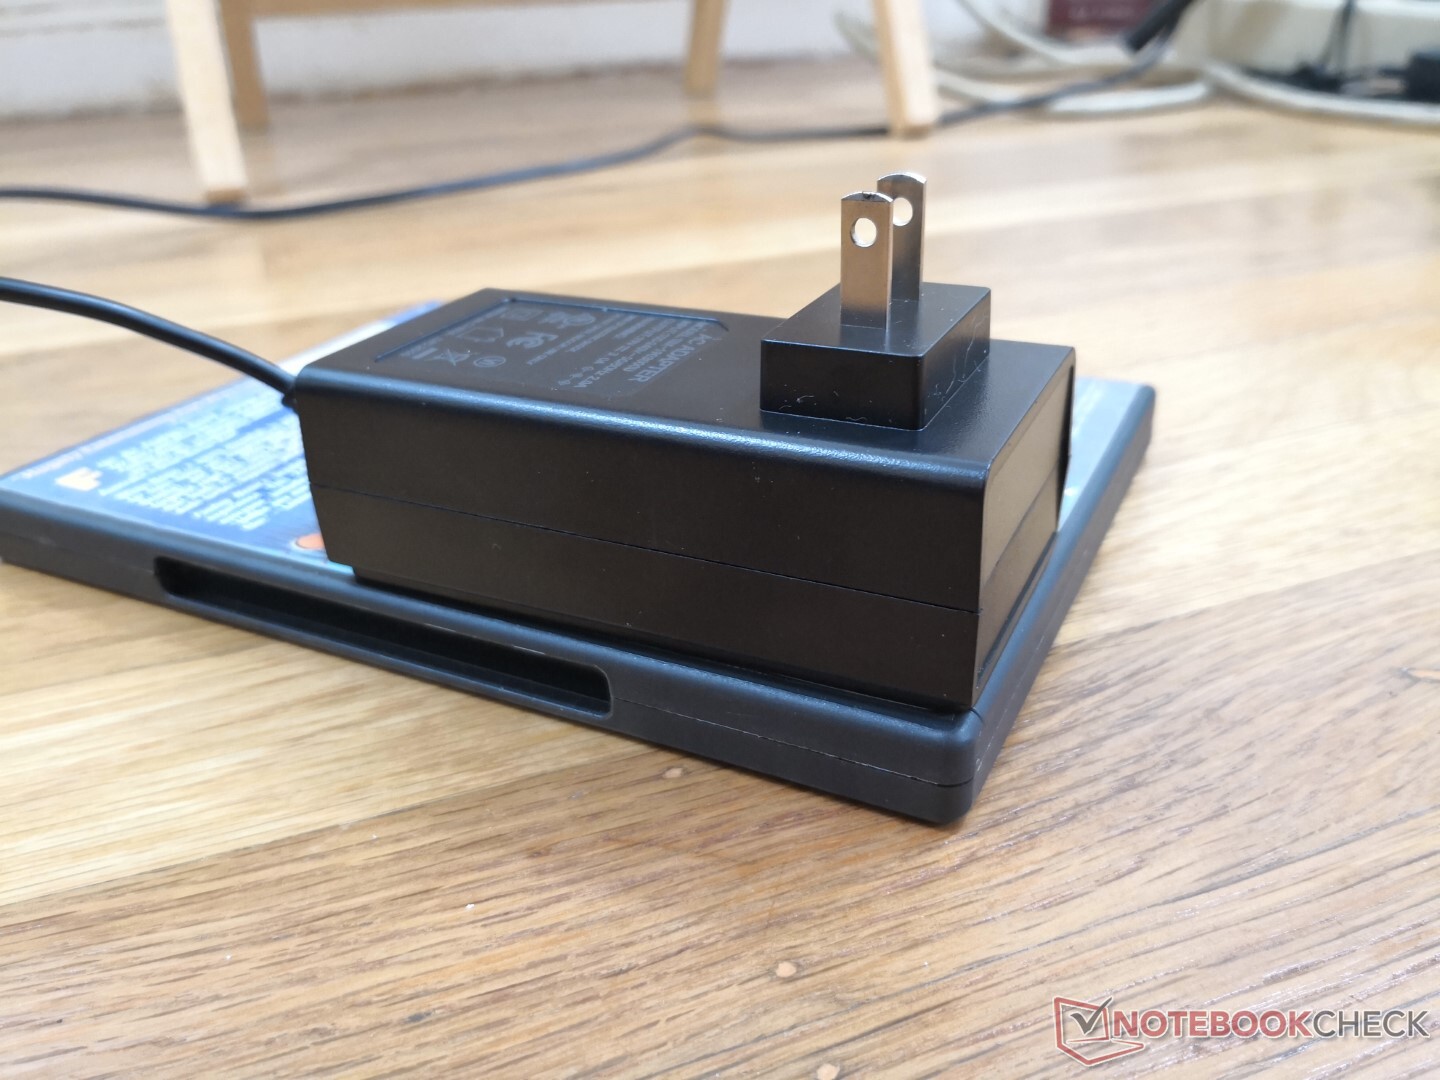
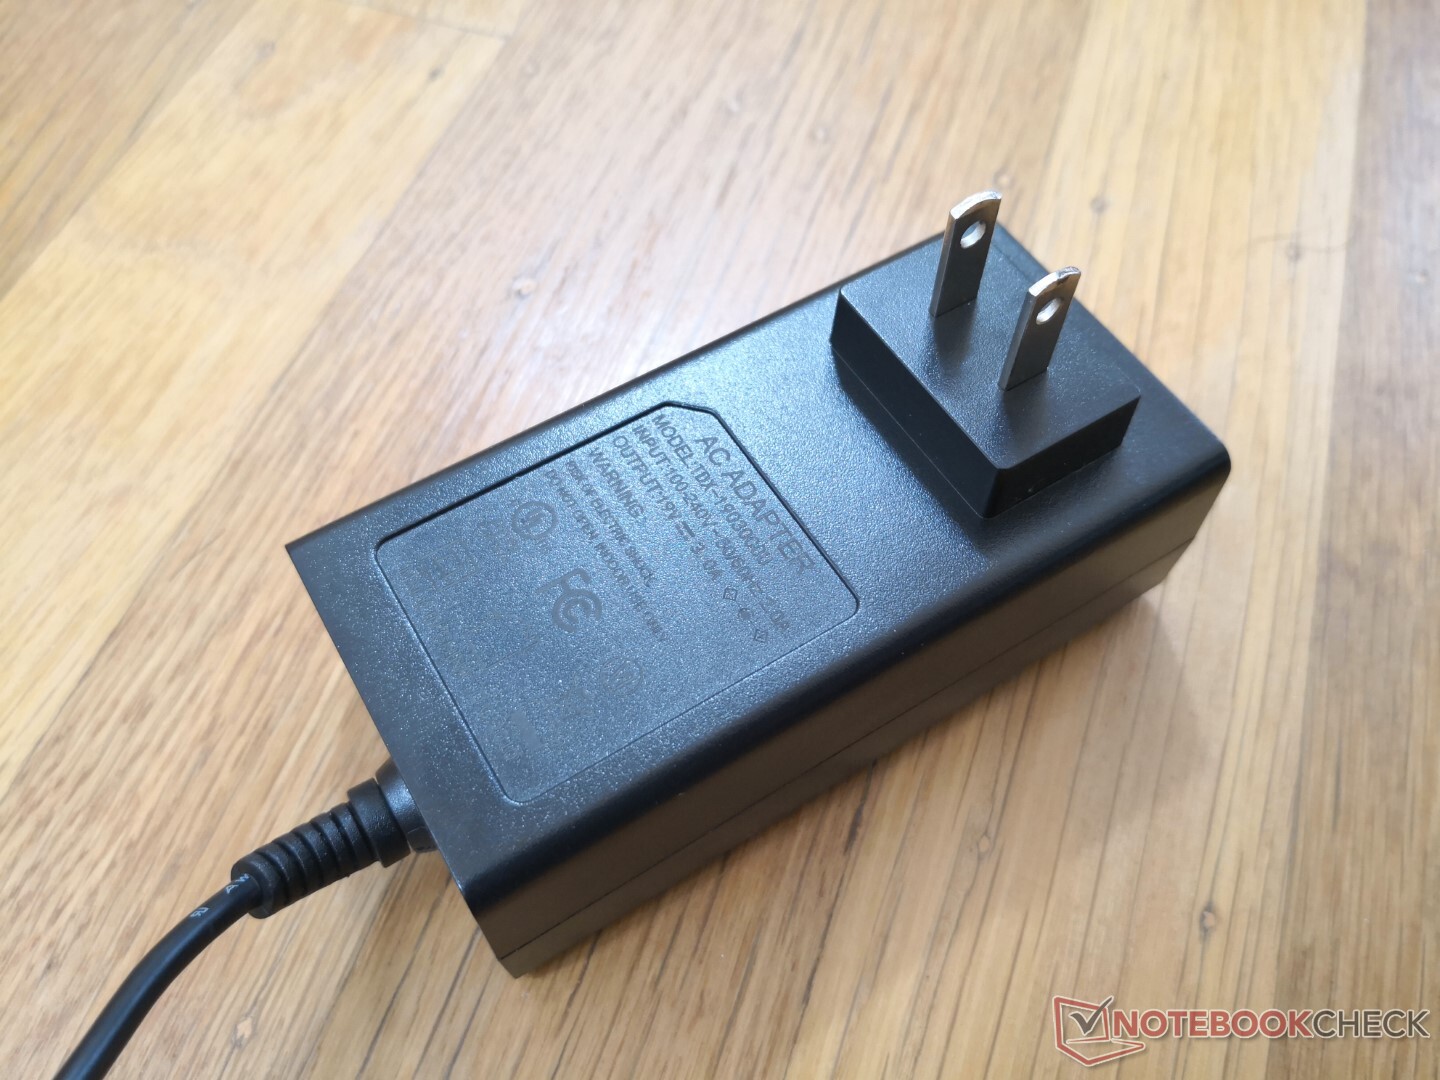
Note that the AC adapter is quite large and it can become even warmer than the actual mini PC at almost 44 C.
Stress Test
When stressed with Prime95, the CPU would run steady at 3.4 GHz but at a high core temperature of 90 C. We expected a cooler temperature since the fan can be quite loud.
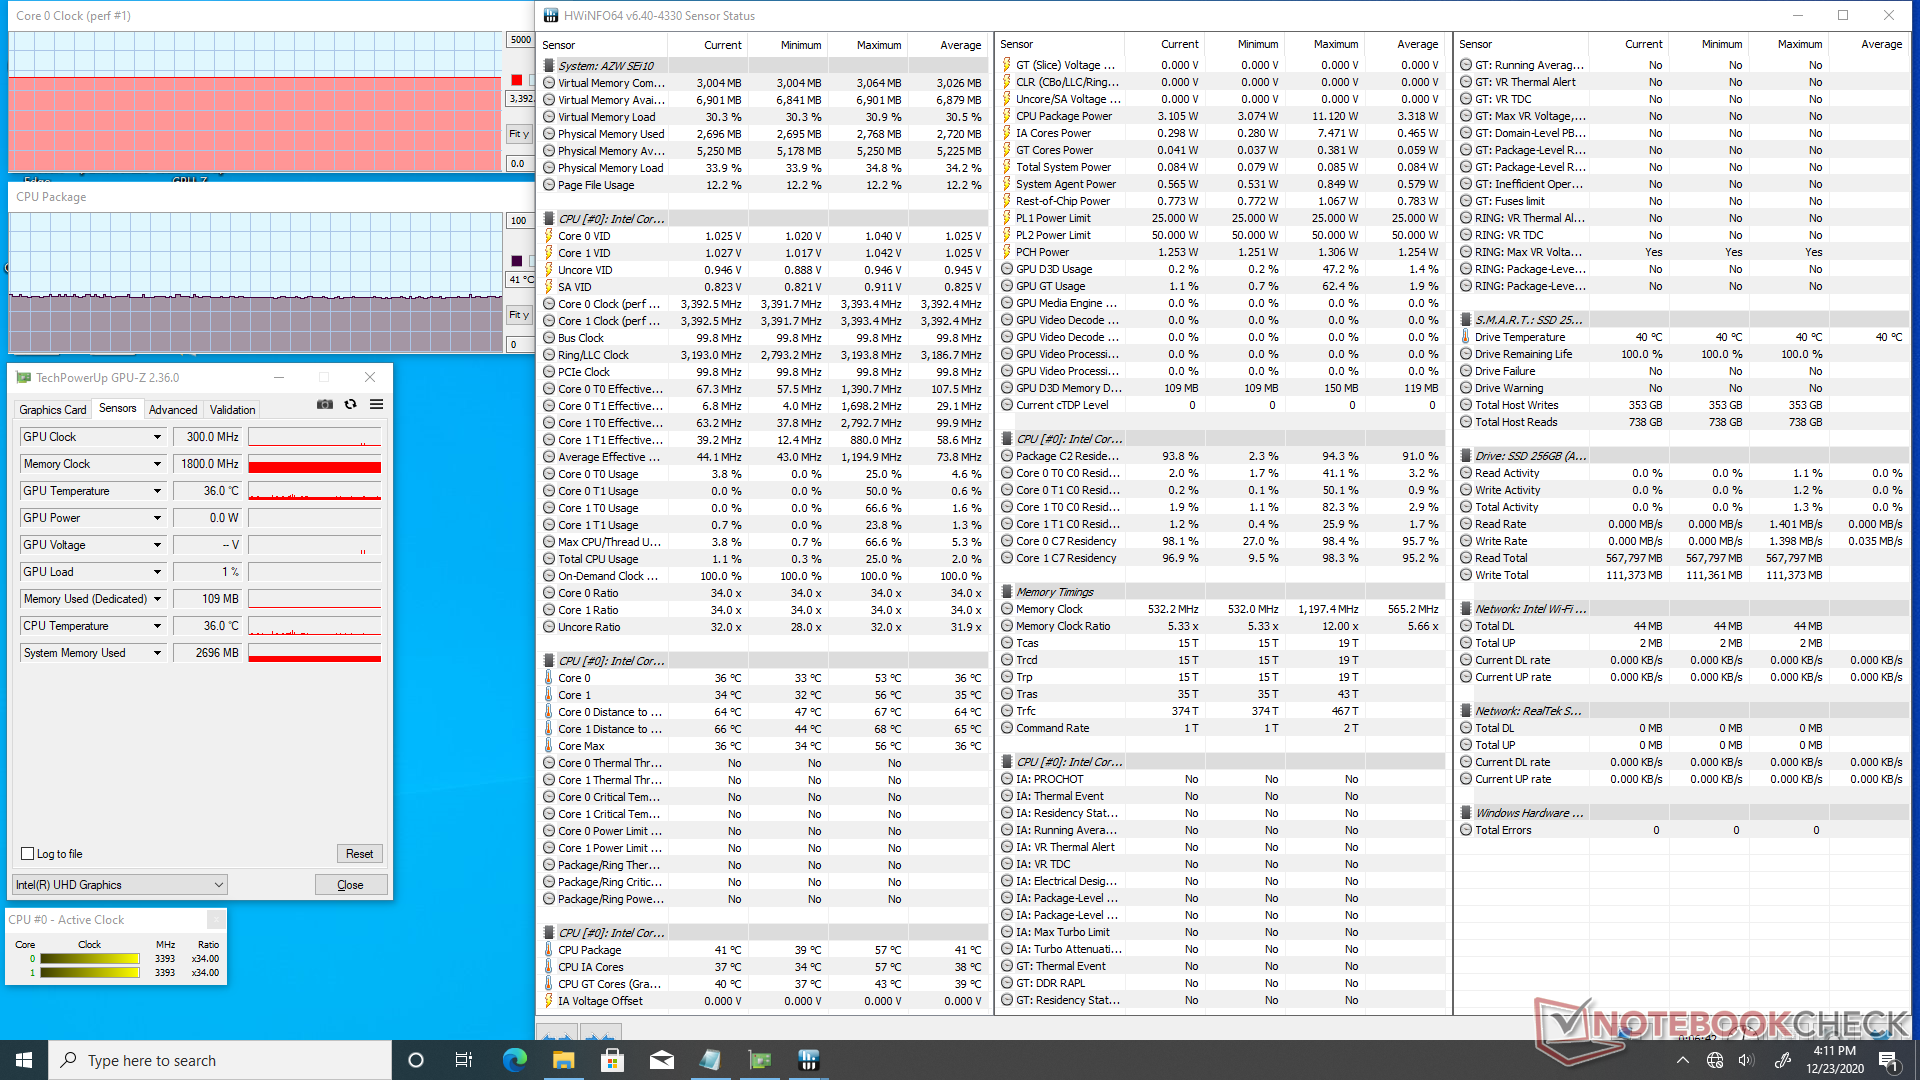
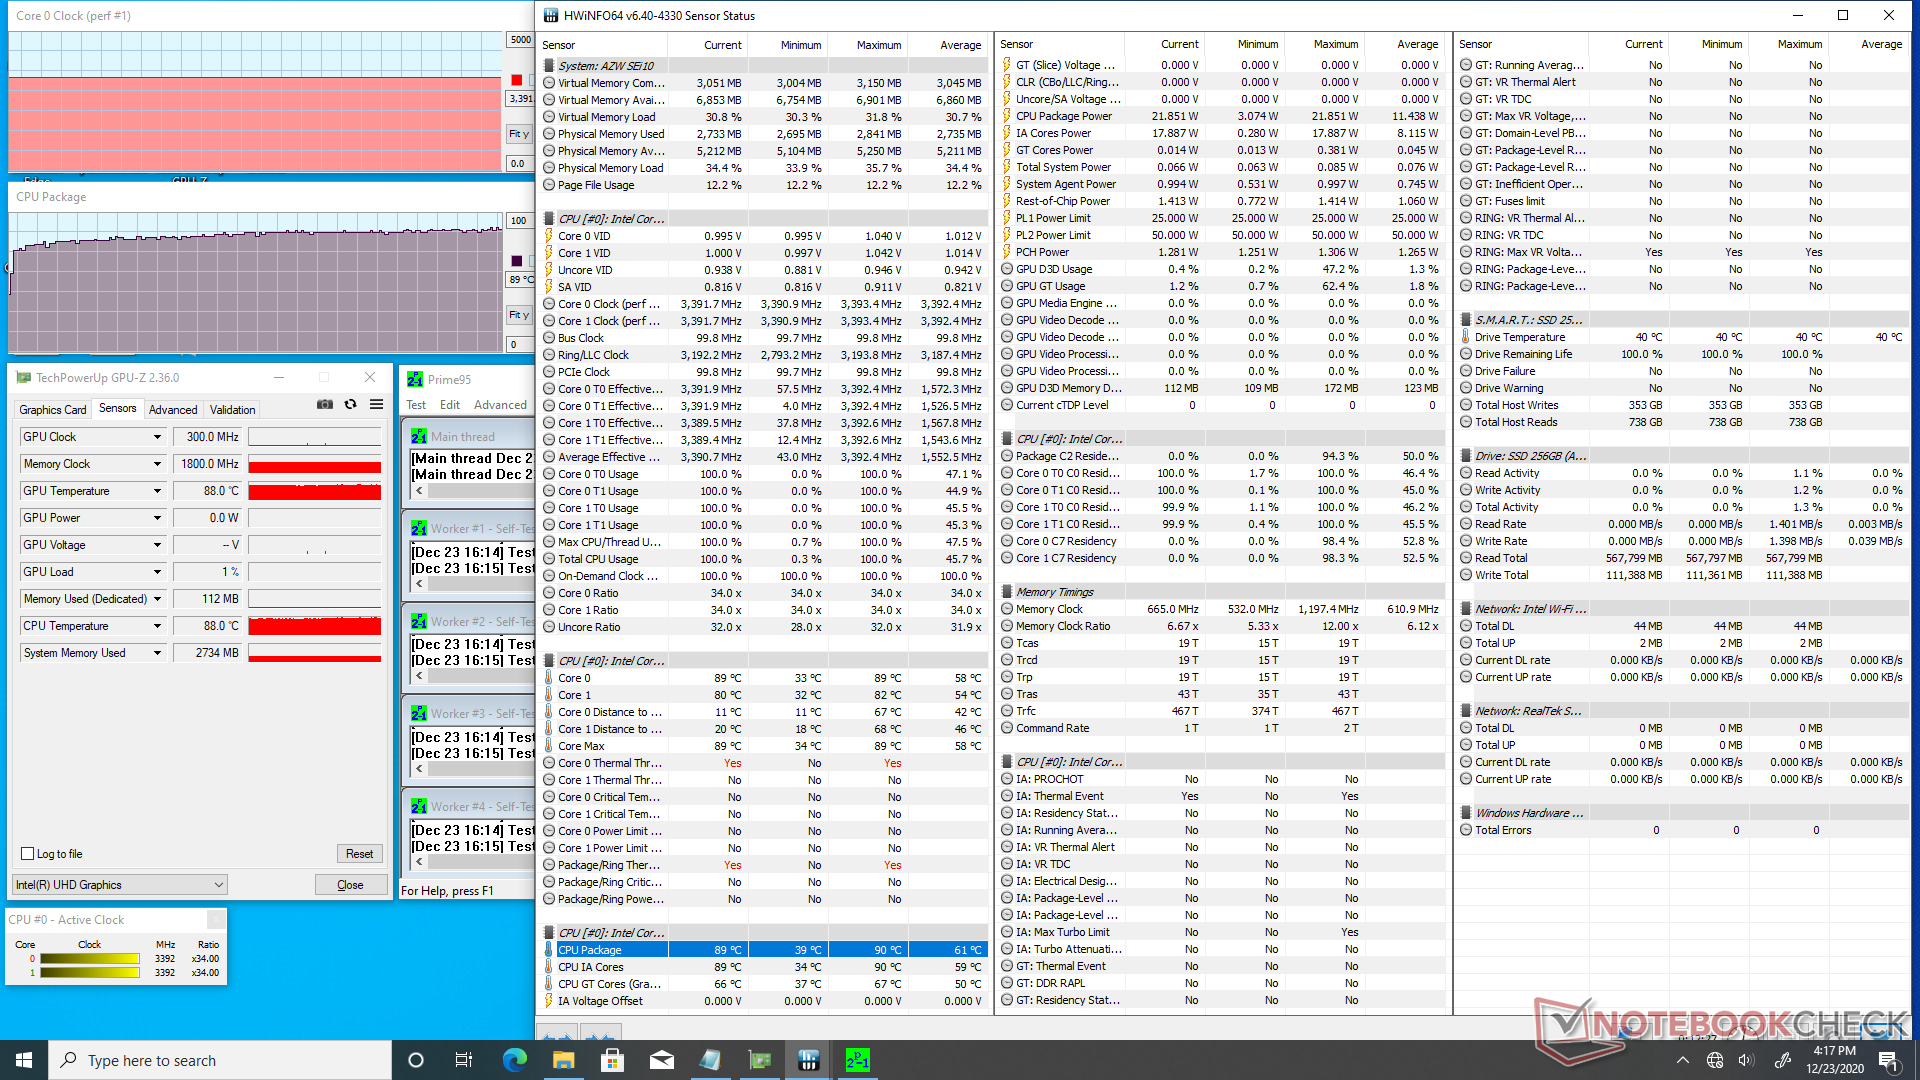
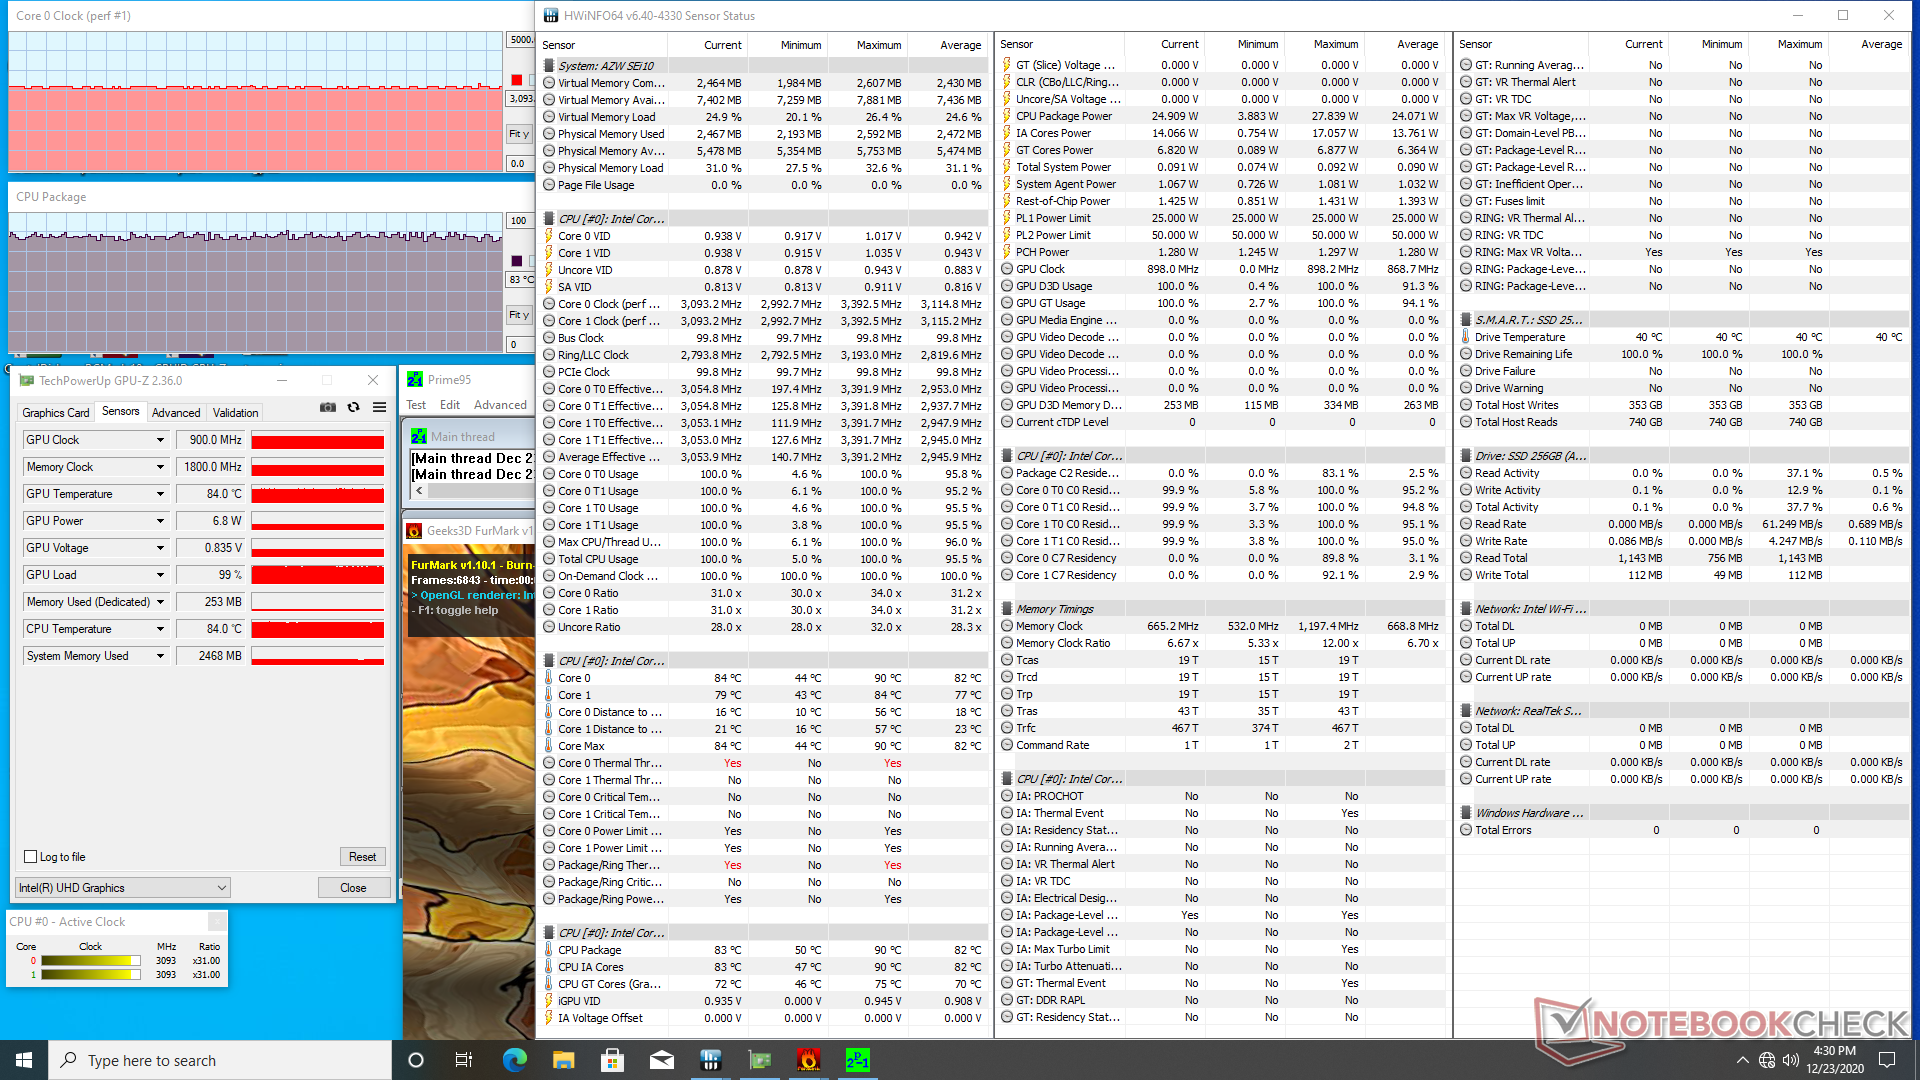
| CPU Clock (GHz) | GPU Clock (MHz) | Average CPU Temperature (°C) | |
| System Idle | -- | -- | 41 |
| Prime95 Stress | 3.4 | -- | 90 |
| Prime95 + FurMark Stress | 3.0 - 3.1 | 900 | 83 |
Energy Management
Power Consumption
Consumption is similar to the Lenovo ThinkCentre M90n-1 powered by an older Whiskey Lake-U CPU. Interestingly, the system consumes more power when powered off than when on standby mode.
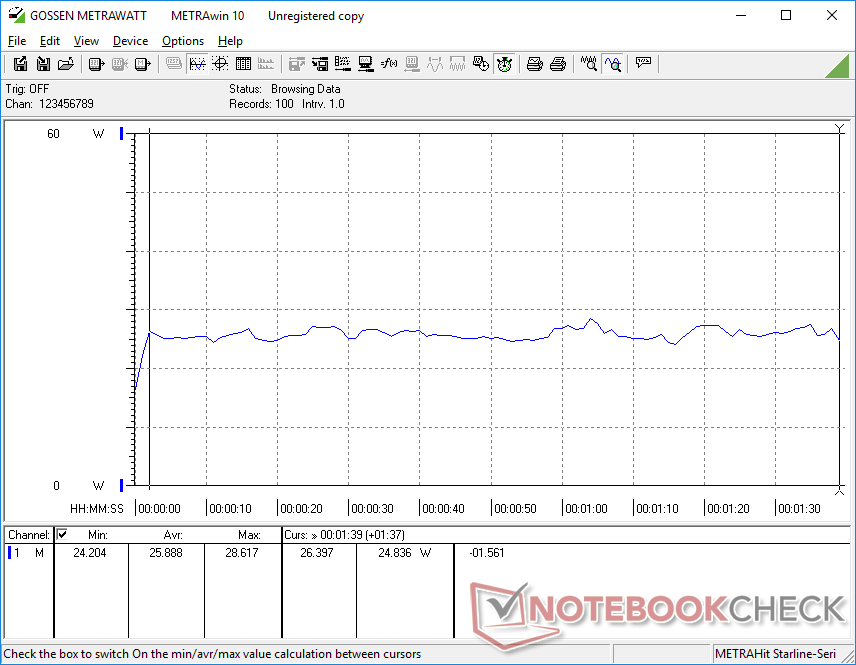
| Off / Standby | |
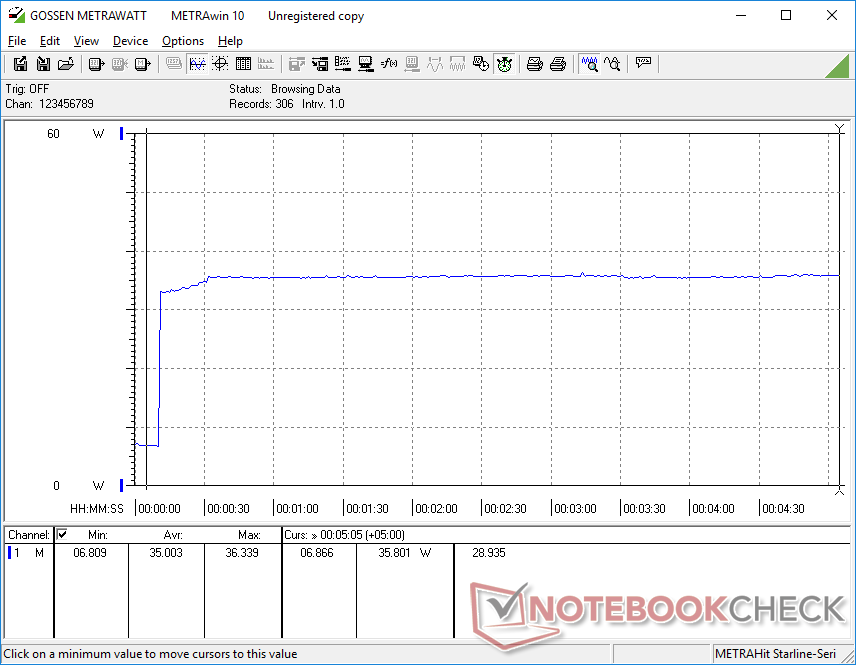
| Idle | |
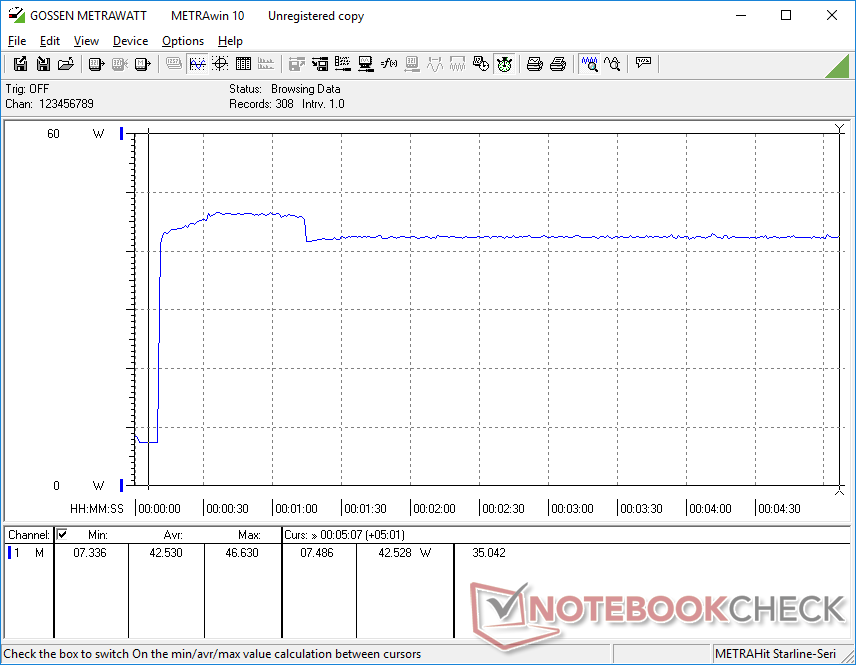
| Load |
|
Key:
min: | |
| Beelink SEi10 i3-1005G1, UHD Graphics G1 (Ice Lake 32 EU), Silicon Motion AZW 256G M.2280 NVMe 4X 200725 D, , x, | Beelink GTR35 II-G-16512D00W64PRO-1T R5 3550H, Vega 8, Silicon Motion AZW 512G NV428, , x, | Intel NUC10i5FNK i5-10210U, UHD Graphics 620, Kingston RBUSNS8154P3256GJ1, , 0x0, 0" | Lenovo ThinkCentre M90n-1 Nano i5-8265U, UHD Graphics 620, Samsung SSD PM981 MZVLB512HAJQ, , x, 0" | Intel NUC10i7FNH i7-10710U, UHD Graphics 620, Kingston RBUSNS8154P3256GJ1, , 0x0, 0" | |
|---|---|---|---|---|---|
| Power Consumption | -55% | -82% | 16% | -56% | |
| Idle Minimum * (Watt) | 6.3 | 8.8 -40% | 4.4 30% | ||
| Idle Average * (Watt) | 6.6 | 9.1 -38% | 15.7 -138% | 4.4 33% | 8.4 -27% |
| Idle Maximum * (Watt) | 6.7 | 9.6 -43% | 4.7 30% | ||
| Load Average * (Watt) | 25.9 | 55.3 -114% | 27.7 -7% | ||
| Load Maximum * (Watt) | 46.7 | 65.6 -40% | 58.6 -25% | 49.9 -7% | 86 -84% |
| Witcher 3 ultra * (Watt) | 50.3 |
* ... smaller is better
Pros
Cons
Verdict
The Beelink SEi10 excels in offering a lot of modern features relative to its asking price. Owners get M.2 NVMe storage, secondary SATA III storage, expandable RAM, a 10th gen Intel Core i3 CPU, and even Thunderbolt 3 support. The mini PC becomes worthwhile if you can exploit these features to make the most of what's available.
We would love to see AMD Ryzen options in the future as their CPUs have proven to be significantly faster than Intel Ice Lake under the same power envelope and price. A denser and more efficient cooling solution would help aid in reducing the high core temperatures and fan noise when under high processing stress. The 2.5-inch SATA adapter is also inelegant as it would have been better built-in much like on the an Intel NUC. And finally, power-over-USB could have been handy in case if owners lose the proprietary AC adapter or would rather use their own power source.
A well-made, well-balanced, and well-priced mini PC with a strong set of features. Power users will have to deal with the loud fan noise and high temperatures.
Price and availability
Price comparison
