Notebookcheck Logo

Intel Atom x7-Z8750 vs Intel Celeron N4100 vs Intel Atom x7-Z8700

Intel Atom x7-Z8750

► remove from comparison Intel Z8750

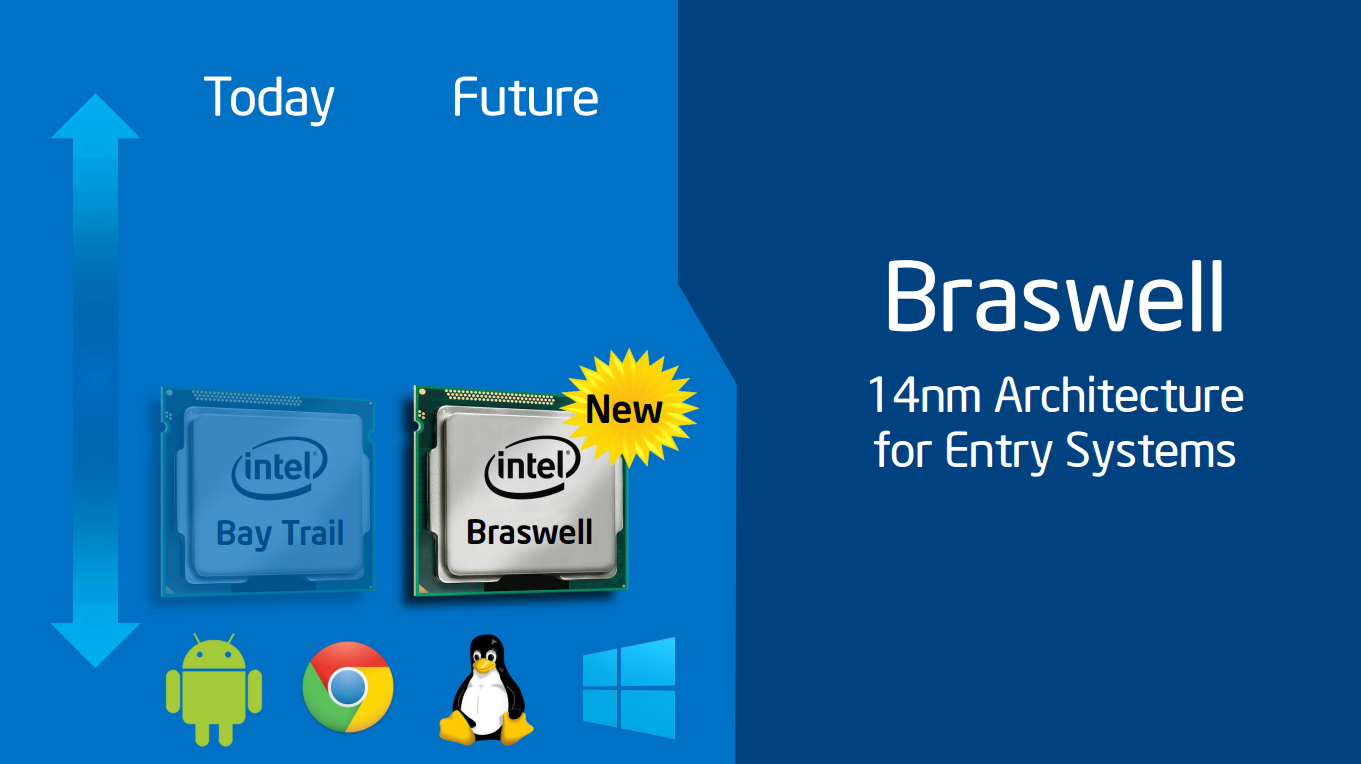
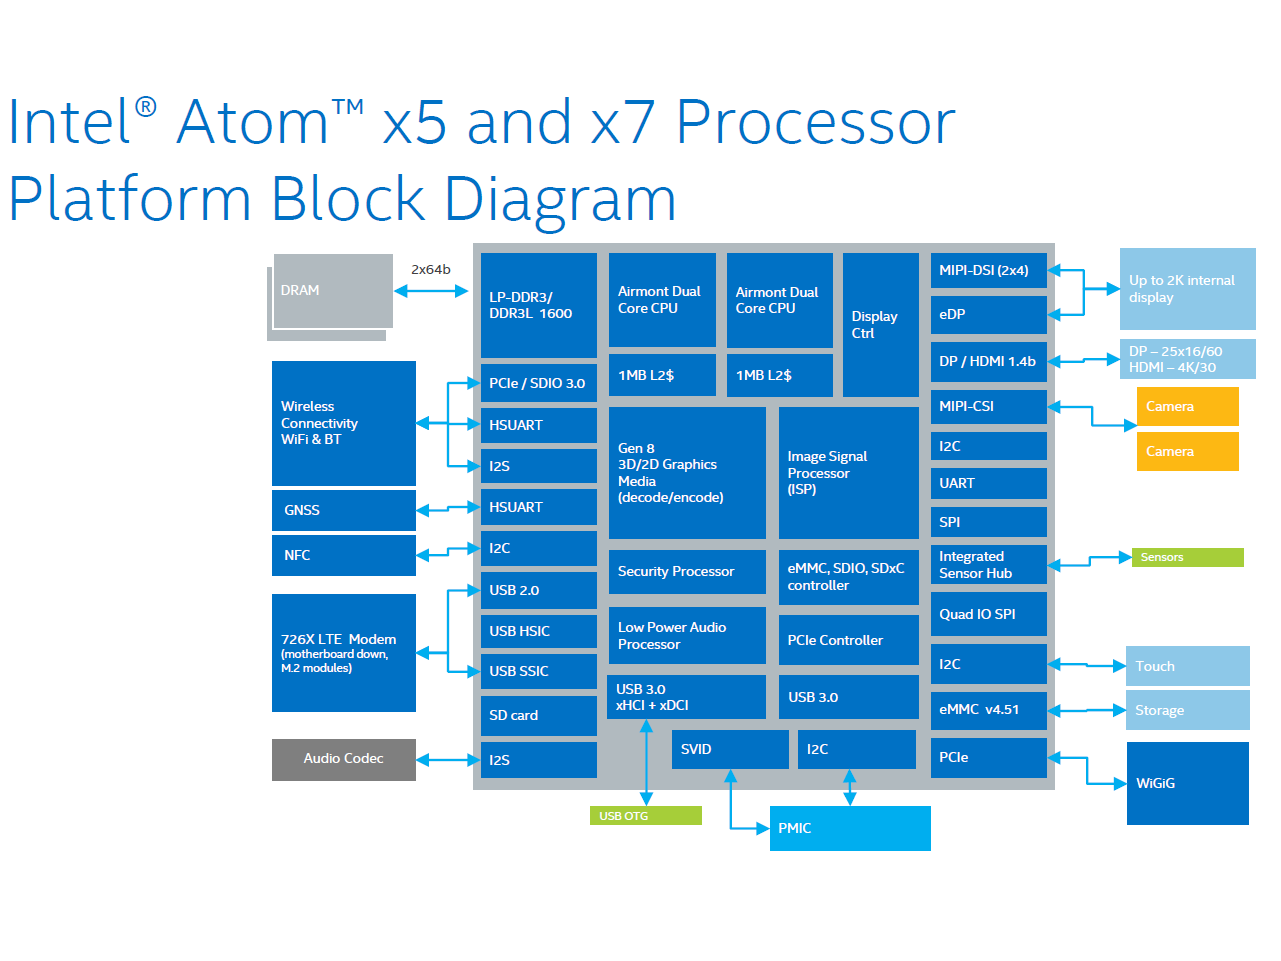
The Atom x7-Z8750 is a quad-core SoC for entry-level laptops and passive-cooled tablets, which has been presented in early 2016. It is clocked at 1.1 - 2.56 GHz and part of the Cherry Trail platform. Thanks to its new 14 nanometer low-power process (P1273) with tri-gate transistors, energy efficiency has been significantly improved compared to its predecessor Bay Trail. In addition to the CPU cores, the SoC offers a DirectX 11.2-capable GPU as well as a DDR3L Memory Controller (2x 64 bit, 25.6 GB/s).

Compared to the similar Pentium N3710, the Atom x7-Z8750 is tuned for less power consumption and offers less PCI-Express lanes (2 instead of 4) and less USB 3.0 ports (3 instead of 5). Furthermore, the integrated GPU clocks only at 600 (instead of 700) MHz and the memory controller supports LPDDR3-1600.

Architecture

The processor cores are based on the Airmont architecture, which is basically a slightly modified shrink of the previous Silvermont core. While performance per clock has not been improved, the more efficient 14 nm process leads to a better utilization of the CPU Burst (alias Turbo Boost) and a therefore somewhat higher overall performance.

Performance

Due to the passive cooling and lower TDP, the Atom x7-Z8750 is a bit slower than the similar clocked Pentium N3710. The boost frequency of the CPU cores wont be used as long as in an average Pentium based laptop. However, if TDP and cooling are similar, the performance should be comparable. Using Windows, the CPU is adequate for everyday tasks such as Internet browsing or office applications, but may struggle in more demanding software or multitasking.

Graphics

The HD Graphics 405 (Braswell) is based on the Intel Gen8 architecture, which supports DirectX 11.2 and is also found in the Broadwell series (e.g. HD Graphics 5300). With 16 EUs (Execution Units) and a clock speed of up to 600 MHz, the GPU is about twice as fast as the HD Graphics (Bay Trail), but still not powerful enough to handle demanding 3D games of 2015. The GPU also supports 4K/H.265 video acceleration.

Power Consumption

The entire SoC is not rated with a TDP, but only an SDP (Scenario Design Power) of 2 Watt (N3710 SDP 4 Watt, TDP 6 Watt). Thus, the chip can be cooled passively.

Intel Celeron N4100

► remove from comparison Intel Celeron N4100

The Intel Celeron N4100 is a quad-core SoC primarily for inexpensive notebooks and was announced late 2017. It runs at 1.1-2.4 GHz (Single Core Burst, Multi Core Burst max 2.3 GHz) and is based on the Gemini Lake platform. Similar to the Apollo Lake predecessor, the chip is manufactured on a 14 nm process with FinFETs but offers slightly improved processor cores, double the amount of L2 cache, a smaller package, a new generation of monitor outputs (Gen 10) and a partly integrated WiFi chip. Besides four CPU cores, the chip also includes a DirectX 12 capable GPU as well as a DDR4/LPDDR4 memory controller (dual-channel, up to 2400 MHz). The SoC is not replaceable as it is permanently soldered to the mainboard.

Architecture

The processor architecture was slightly reworked and is now called Goldmont Plus. It features an increased Level 2 cache (to 4 MB). That means the per-clock-performance should be a bit better, but not near the Core CPUs like Kaby Lake Y.

Performance

The average N4100 in our database directly competes with AMD's 3020e and 3050e, as far as multi-thread benchmark scores are concerned. The Intel Core m3-8100Y and the Celeron 6305 are close nearby as well. Routinely described as "entry-level" in 2019 and 2020, the Celeron N4100 is a slow processor that is good for the most basic tasks only such as Web browsing with no more than two or three tabs open at a time.

The LapBook Pro is among the fastest systems built around the N4100 that we know of. It can be around 50% faster in CPU-bound workloads than the slowest system featuring the same chip in our database, as of August 2023.

Graphics

The UHD Graphics 600 (Gemini Lake) is based on Intel's Gen9 architecture, which supports DirectX 12 and is also used for the Kaby Lake / Skylake / Apollo Lake graphics adapters (like HD Graphics 520). Equipped with 12 EUs and a clock of up to 700 MHz, the performance should be roughly on par with the older HD Graphics 500 (Apollo Lake).

The chip also includes an advanced video engine with hardware support for the playback of VP9 and H.265 material (8-bit color-depth).

Power Consumption

Celeron N4100 has a default TDP of 6 W (also known as PL1), making it a great option for passively cooled setups.

The fairly old 14 nm process this Celeron is built with makes for so-so, as of mid-2022, energy efficiency.

Intel Atom x7-Z8700

► remove from comparison Intel Z8700

The Intel Atom x7-Z8700 is a power efficient quad-core SoC for Windows and Android devices (tablets and convertibles), which has been presented in March 2015. It is clocked at 1.6 - 2.4 GHz and part of the Cherry Trail platform. Thanks to its new 14 nanometer low-power process (P1273) with tri-gate transistors, energy efficiency has been significantly improved compared to its predecessor Bay Trail-T (e.g. Atom Z3795). In addition to the CPU cores, the SoC offers a DirectX 11.2-capable GPU as well as a LPDDR3 Memory Controller (2x 64 bit, 25.6 GB/s).

Architecture

The processor cores are based on the Airmont architecture, which is basically a slightly modified shrink of the previous Silvermont core. While performance per clock has not been improved, the more efficient 14 nm process leads to a better utilization of the CPU Burst (alias Turbo Boost) and a therefore somewhat higher overall performance.

Performance

Compared to the Atom Z3795, the Atom x7-Z8700 offers about 5 percent more performance and is similar fast as an AMD A6-6210 APU or high-end ARM SoCs, e.g. the Snapdragon 810 or Exynos 7420.

Using Windows, the performance is adequate for everyday tasks such as Internet or Office, but not for very complex software or modern games.

Graphics

The HD Graphics (Cherry Trail) is based on the Intel Gen8 architecture, which supports DirectX 11.2 and is also found in the Broadwell series (e.g. HD Graphics 5300). With 16 EUs (Execution Units) and a clock speed of up to 600 MHz, the GPU is about twice as fast as the HD Graphics (Bay Trail) and will handle older and less demandig Windows games (e.g. Counter-Strike: GO) in low settings at decent frame rates. The GPU also supports 4K/H.265 video acceleration.

Compared to ARM SoCs, the HD Graphics offers a performance somewhere between the Qualcomm Adreno 330 / PowerVR G6430 and the Adreno 420 / PowerVR GX6450.

Power Consumption

The entire SoC is rated at an SDP of 2 watts, which indicates a TDP of less than 4 watts. Thus, the chip can be used in passively cooled tablets.

ModelIntel Atom x7-Z8750Intel Celeron N4100Intel Atom x7-Z8700
SeriesIntel Atom x7Intel Gemini LakeIntel Atom x7
CodenameCherry TrailGemini LakeCherry Trail
Series: Atom x7 Cherry Trail
Intel Atom x7-Z8750 « 1.6 - 2.56 GHz4 / 4 cores
Intel Atom x7-Z87001.6 - 2.4 GHz4 / 4 cores
Intel Celeron J41051.5 - 2.5 GHz4 / 4 cores
Intel Pentium Silver N50001.1 - 2.7 GHz4 / 4 cores
Intel Celeron J40052 - 2.7 GHz2 / 2 cores
Intel Celeron J41151.8 - 2.5 GHz4 / 4 cores
Intel Celeron N4100 « 1.1 - 2.4 GHz4 / 4 cores
Intel Celeron N40001.1 - 2.6 GHz2 / 2 cores
Intel Atom x7-Z87501.6 - 2.56 GHz4 / 4 cores
Intel Atom x7-Z8700 « 1.6 - 2.4 GHz4 / 4 cores
Clock1600 - 2560 MHz1100 - 2400 MHz1600 - 2400 MHz
L2 Cache2 MB4 MB2 MB
Cores / Threads4 / 44 / 44 / 4
Technology14 nm14 nm14 nm
max. Temp.90 °C105 °C90 °C
SocketUTFCBGA1380BGA1090
FeaturesIntel HD Graphics 405 (Braswell, 600 MHz), Wireless Display, Quick Sync, AES-NI, max. 8 GB Dual-Channel DDR3L-1600 (25,6 GB/s), 3x USB 3.0, 4x PCIe 2.0, 2x SATA 6.0 Gbit/sDDR4-2400/LPDDR4-2400 RAM, PCIe 2, MMX, SSE, SSE2, SSE3, SSSE3, SSE4.1, SSE4.2, VMX, SMEP, SMAP, MPX, EIST, TM1, TM2, Turbo, AES-NI, RDRAND, RDSEED, SHA, SGXIntel HD Graphics (Cherry Trail, 200 - 600 MHz), Wireless Display, AES-NI, max. 8 GB Dual-Channel LPDDR3-1600 (25,6 GB/s), 3x USB 3.0, 2x PCIe 2.0
iGPUIntel HD Graphics 405 (Braswell) (400 - 600 MHz)Intel UHD Graphics 600 (200 - 700 MHz)Intel HD Graphics (Cherry Trail) (200 - 600 MHz)
Architecturex86x86x86
$37 U.S.$107 U.S.
Announced
Manufacturerark.intel.comark.intel.comark.intel.com
TDP6 Watt

Benchmarks

Performance Rating - CB R15 + R20 + 7-Zip + X265 + Blender + 3DM11 CPU - Celeron N4100
16.3 pt (23%)
Cinebench R23 - Cinebench R23 Multi Core
100%
1 Z8750 +
612 Points (1%)
min: 955     avg: 961     median: 960.5 (1%)     max: 966 Points
Cinebench R23 - Cinebench R23 Single Core
100%
1 Z8750 +
208 Points (9%)
min: 382     avg: 386.5     median: 386.5 (16%)     max: 391 Points
Cinebench R20 - Cinebench R20 CPU (Single Core)
100%
1 Z8750 +
78 Points (9%)
Cinebench R20 - Cinebench R20 CPU (Multi Core)
100%
1 Z8750 +
220 Points (1%)
Cinebench R15 - Cinebench R15 CPU Multi 64 Bit
133 Points (1%)
min: 98     avg: 116     median: 116 (1%)     max: 134 Points
Cinebench R15 - Cinebench R15 CPU Single 64 Bit
38.9 Points (12%)
min: 37     avg: 37.5     median: 37.5 (11%)     max: 38 Points
Cinebench R11.5 - Cinebench R11.5 CPU Multi 64 Bit
min: 2.13     avg: 2.4     median: 2.2 (3%)     max: 2.9 Points
58%
1 Z8700 +
min: 0.72     avg: 1.3     median: 1.3 (2%)     max: 1.79 Points
Cinebench R11.5 - Cinebench R11.5 CPU Single 64 Bit
min: 0.8     avg: 0.8     median: 0.8 (21%)     max: 0.83 Points
49%
1 Z8700 +
min: 0.36     avg: 0.4     median: 0.4 (10%)     max: 0.46 Points
Cinebench R10 - Cinebench R10 Rend. Single (32bit)
min: 1664     avg: 1951     median: 2013 (12%)     max: 2049 Points
55%
1 Z8700 +
min: 1003     avg: 1114     median: 1114 (7%)     max: 1225 Points
Cinebench R10 - Cinebench R10 Rend. Multi (32bit)
min: 4915     avg: 5999     median: 5904 (4%)     max: 7123 Points
53%
1 Z8700 +
min: 1876     avg: 3116     median: 3116 (2%)     max: 4356 Points
Cinebench R10 - Cinebench R10 Rend. Multi (64bit)
10929 Points (8%)
22%
1 Z8700 +
2458 Points (2%)
Cinebench R10 - Cinebench R10 Rend. Single (64bit)
3337 Points (4%)
39%
1 Z8700 +
1311 Points (2%)
wPrime 2.10 - wPrime 2.0 1024m *
100%
1 Z8750 +
772 s (9%)
min: 591     avg: 724     median: 790 (9%)     max: 790 s
wPrime 2.10 - wPrime 2.0 32m *
24.7 s (5%)
min: 18.97     avg: 20.3     median: 19.4 (4%)     max: 22.5 s
24.5 s (5%)
WinRAR - WinRAR 4.0
100%
1 Z8750 +
807 Points (1%)
min: 1093     avg: 1148     median: 1139 (2%)     max: 1212 Points
7-Zip 18.03 - 7-Zip 18.03 Multli Thread 4 runs
min: 5620     avg: 6674     median: 6608 (4%)     max: 7835 MIPS
7-Zip 18.03 - 7-Zip 18.03 Single Thread 4 runs
min: 2125     avg: 2209     median: 2158 (26%)     max: 2459 MIPS
X264 HD Benchmark 4.0 - x264 Pass 2
10 fps (3%)
min: 11.8     avg: 13.3     median: 11.8 (4%)     max: 16.3 fps
10.3 fps (4%)
X264 HD Benchmark 4.0 - x264 Pass 1
48 fps (11%)
min: 57.7     avg: 64.5     median: 58.2 (13%)     max: 77.7 fps
50.8 fps (12%)
HWBOT x265 Benchmark v2.2 - HWBOT x265 4k Preset
100%
1 Z8750 +
0.6 fps (1%)
TrueCrypt - TrueCrypt Serpent
100%
1 Z8750 +
0.1 GB/s (0%)
min: 0.156     avg: 0.2     median: 0.2 (0%)     max: 0.162 GB/s
TrueCrypt - TrueCrypt Twofish
100%
1 Z8750 +
0.2 GB/s (4%)
min: 0.222     avg: 0.2     median: 0.2 (4%)     max: 0.236 GB/s
TrueCrypt - TrueCrypt AES
100%
1 Z8750 +
1 GB/s (2%)
Blender - Blender 2.79 BMW27 CPU *
100%
1 Z8750 +
4929 Seconds (35%)
R Benchmark 2.5 - R Benchmark 2.5 *
100%
1 Z8750 +
2.7 sec (59%)
3DMark 06 - CPU - 3DMark 06 - CPU
100%
1 Z8750 +
2426 Points (5%)
min: 2748     avg: 2985     median: 2805 (6%)     max: 3580 Points
Super Pi mod 1.5 XS 1M - Super Pi mod 1.5 XS 1M *
36.4 s (8%)
min: 27.42     avg: 28.3     median: 28.5 (6%)     max: 28.94 s
49.8 s (11%)
Super Pi mod 1.5 XS 2M - Super Pi mod 1.5 XS 2M *
80.3 s (3%)
min: 61.9     avg: 63.1     median: 62.6 (3%)     max: 64.8 s
96.7 s (4%)
Super Pi Mod 1.5 XS 32M - Super Pi mod 1.5 XS 32M *
100%
1 Z8750 +
1734 s (8%)
min: 1381     avg: 1462     median: 1474 (7%)     max: 1532 s
3DMark 11 - 3DM11 Performance Physics
1499 Points (4%)
min: 493     avg: 1186     median: 1186 (3%)     max: 1879 Points
3DMark - 3DMark Ice Storm Physics
min: 12964     avg: 20919     median: 19160 (16%)     max: 31380 Points
13%
1 Z8700 +
2570 Points (2%)
3DMark - 3DMark Ice Storm Extreme Physics
min: 12613     avg: 20195     median: 19086 (15%)     max: 29271 Points
3DMark - 3DMark Ice Storm Unlimited Physics
100%
1 Z8750 +
19651 Points (17%)
min: 19890     avg: 24471     median: 23934 (20%)     max: 32203 Points
3DMark - 3DMark Cloud Gate Physics
1664 Points (4%)
237 Points (1%)
3DMark - 3DMark Fire Strike Standard Physics
min: 2146     avg: 2954     median: 2910 (5%)     max: 3799 Points
3DMark - 3DMark Time Spy CPU
min: 611     avg: 711     median: 706 (3%)     max: 841 Points
Geekbench 5.5 - Geekbench 5.1 - 5.4 64 Bit Single-Core
100%
1 Z8750 +
233 Points (10%)
Geekbench 5.5 - Geekbench 5.1 - 5.4 64 Bit Multi-Core
100%
1 Z8750 +
770 Points (1%)
Geekbench 5.0 - Geekbench 5.0 64 Bit Single-Core
min: 377     avg: 400.5     median: 408 (2%)     max: 409 Points
Geekbench 5.0 - Geekbench 5.0 64 Bit Multi-Core
min: 1078     avg: 1238     median: 1232 (4%)     max: 1409 Points
Geekbench 4.4 - Geekbench 4.1 - 4.4 64 Bit Single-Core
min: 1731     avg: 1779     median: 1795 (18%)     max: 1799 Points
Geekbench 4.4 - Geekbench 4.1 - 4.4 64 Bit Multi-Core
min: 4713     avg: 5188     median: 5259 (6%)     max: 5404 Points
Geekbench 4.0 - Geekbench 4.0 64 Bit Single-Core
min: 1813     avg: 1825     median: 1825 (25%)     max: 1837 Points
Geekbench 4.0 - Geekbench 4.0 64 Bit Multi-Core
min: 5056     avg: 5123     median: 5122.5 (12%)     max: 5189 Points
Geekbench 3 - Geekbench 3 32 Bit Multi-Core
min: 4998     avg: 5042     median: 5041.5 (9%)     max: 5085 Points
65%
1 Z8700 +
3300 Points (6%)
Geekbench 3 - Geekbench 3 32 Bit Single-Core
min: 1623     avg: 1629     median: 1629 (32%)     max: 1635 Points
60%
1 Z8700 +
970 Points (19%)
Geekbench 3 - Geekbench 3 64 Bit Multi-Core
5490 Points (9%)
61%
1 Z8700 +
3350 Points (5%)
Geekbench 3 - Geekbench 3 64 Bit Single-Core
1762 Points (26%)
56%
1 Z8700 +
990 Points (15%)
Geekbench 2 - 32 Bit - Geekbench Stream
100%
1 Z8700 +
2675 Points (22%)
Geekbench 2 - 32 Bit - Geekbench Memory
100%
1 Z8700 +
2440 Points (22%)
Geekbench 2 - 32 Bit - Geekbench Floating Point
100%
1 Z8700 +
3867 Points (8%)
Geekbench 2 - 32 Bit - Geekbench Integer
100%
1 Z8700 +
3767 Points (8%)
Geekbench 2 - 32 Bit - Geekbench Total Score
100%
1 Z8700 +
3427 Points (9%)
Mozilla Kraken 1.1 - Kraken 1.1 Total Score *
4386 ms (5%)
min: 2561     avg: 3127     median: 3214 (4%)     max: 3865 ms
4370 ms (5%)
Sunspider - Sunspider 1.0 Total Score *
233 ms (3%)
99%
1 Z8700 +
348.7 ms (4%)
Octane V2 - Octane V2 Total Score
min: 10309     avg: 11163     median: 11328 (10%)     max: 11852 Points
74%
1 Z8700 +
8408 Points (8%)
WebXPRT 3 - WebXPRT 3 Score
100%
1 Z8750 +
48.1 Points (10%)
min: 71.4     avg: 77     median: 75.2 (16%)     max: 84 Points
AnTuTu v7 - AnTuTu v7 MEM
100%
1 Z8750 +
3482 Points (11%)
AnTuTu v7 - AnTuTu v7 UX
100%
1 Z8750 +
19372 Points (24%)
AnTuTu v7 - AnTuTu v7 GPU
100%
1 Z8750 +
21698 Points (7%)
AnTuTu v7 - AnTuTu v7 CPU
100%
1 Z8750 +
43532 Points (27%)
AnTuTu v7 - AnTuTu v7 Total Score
100%
1 Z8750 +
88084 Points (16%)
PCMark for Android - PCM f. Android Work Score 2.0
7616 Points (50%)
Power Consumption - Prime95 Power Consumption - external Monitor *
min: 6.4     avg: 11.3     median: 11.3 (2%)     max: 16.1 Watt
Power Consumption - Cinebench R15 Multi Power Consumption - external Monitor *
100%
1 Z8750 +
9.8 Watt (2%)
6.7 Watt (1%)
Power Consumption - Idle Power Consumption - external Monitor *
100%
1 Z8750 +
6.8 Watt (4%)
Power Consumption - Cinebench R15 Multi Power Efficiency - external Monitor
100%
1 Z8750 +
13.6 Points per Watt (10%)
24 Points per Watt (18%)

Average Benchmarks Intel Atom x7-Z8750 → 100% n=10

Average Benchmarks Intel Celeron N4100 → 123% n=10

Average Benchmarks Intel Atom x7-Z8700 → 88% n=10

- Range of benchmark values for this graphics card
- Average benchmark values for this graphics card
* Smaller numbers mean a higher performance
1 This benchmark is not used for the average calculation

v1.26
log 06. 01:54:44

#0 checking url part for id 9070 +0s ... 0s

#1 checking url part for id 9424 +0s ... 0s

#2 checking url part for id 6670 +0s ... 0s

#3 not redirecting to Ajax server +0s ... 0s

#4 did not recreate cache, as it is less than 5 days old! Created at Sat, 04 May 2024 05:40:37 +0200 +0.001s ... 0.001s

#5 composed specs +0.051s ... 0.052s

#6 did output specs +0s ... 0.052s

#7 getting avg benchmarks for device 9070 +0.003s ... 0.054s

#8 got single benchmarks 9070 +0.008s ... 0.062s

#9 getting avg benchmarks for device 9424 +0.016s ... 0.078s

#10 got single benchmarks 9424 +0.034s ... 0.112s

#11 getting avg benchmarks for device 6670 +0.003s ... 0.115s

#12 got single benchmarks 6670 +0.01s ... 0.125s

#13 got avg benchmarks for devices +0s ... 0.125s

#14 min, max, avg, median took s +0.35s ... 0.475s

#15 return log +0s ... 0.475s

Please share our article, every link counts!
> Expert Reviews and News on Laptops, Smartphones and Tech Innovations > Benchmarks / Tech > Processor Comparison - Head 2 Head
Redaktion, 2017-09- 8 (Update: 2023-07- 1)