Notebookcheck Logo

AMD Ryzen 7 7840HS vs Qualcomm Snapdragon X Plus X1P-42-100

AMD Ryzen 7 7840HS

► remove from comparison AMD R7 7840HS

The Ryzen 7 7840HS is a powerful Phoenix family chip that saw the light of day in H1 2023. The processor features 8 cores (16 threads thanks to SMT support) running at 3.8 GHz. The highest Boost clock speed achievable is 5.1 GHz.

Not only does this APU has full might of the Zen 4 architecture at its disposal, it also comes with the new Ryzen AI technology that's set to make generative AI more ubiquitous than ever before. Last but not the least, the Radeon 780M serves as the integrated GPU.

Architecture & Features

Phoenix family chips are powered by the Zen 4 architecture, much like Dragon Range family chips are. The latter however lacks hardware AI workload acceleration capabilities that Phoenix has. Ryzen AI is coming after Intel's DL Boost and GNA technologies; time will tell if this move by AMD is a good idea.

Perhaps more importantly, Zen 4 introduces AVX512 support (which Zen 3 chips did not have) and, thanks to a plethora of other improvements including larger caches/registers/buffers across the board, is set to bring a double-digit IPC improvement.

Elsewhere, the 7840HS has 16 MB of L3 cache and a seriously fast RAM controller (up to LPDDR5x-7500 and up to DDR5-5600, ECC-enabled memory included). PCI-Express speeds are capped at 1.97 GB/s per lane which corresponds to the 4.0 spec.

This Ryzen 7 series chip is designed to run 64-bit Windows 11, 64-bit Windows 10 or Linux; please note that it isn't overclockable and neither is it user-replaceable. It gets soldered down for good instead (FP7, FP7r2, FP8 socket interfaces).

Performance

The average 7840HS in our database is in the same league as the Core i7-12700H, Core i7-12850HX, Core i9-12900H, Core i9-13900H and also the Ryzen 9 7940HS, as far as multi-thread benchmark scores are concerned. This is a very fast chip, as of Q3 2023.

Your mileage may vary depending on how high the CPU power limits are and how competent the cooling solution of your system is.

Graphics

The Radeon 780M (12 CUs / 768 shaders, up to 2,700 MHz) is capable of powering 4 monitors simultaneously with resolutions as high as SUHD 4320p. It will also have little issue hardware-encoding and hardware-decoding the most widely used video codecs (AV1, HEVC, AVC). As far as gaming is concerned, the thing will let you play most games at 1080p as long as you are fine with moderate quality settings. Long story short, this is the best iGPU money can buy, as of H2 2023.

Your mileage may vary depending on how high the CPU power limits are, how competent the cooling solution of your system is, how fast the RAM of your system is (there is no dedicated VRAM here).

Power consumption

This Ryzen 7 series chip has a long-term power limit (default TDP) of 35 W to 54 W, giving system makers a choice between improving battery life and making the system they're designing insanely fast. Either way, an active cooling solution is a must for a laptop or a mini-PC built around this APU.

The 7840HS is built with TSMC's 4 nm process for high, as of late 2023, energy efficiency.

Qualcomm Snapdragon X Plus X1P-42-100

► remove from comparison Qualcomm SD X Plus X1P-42-100

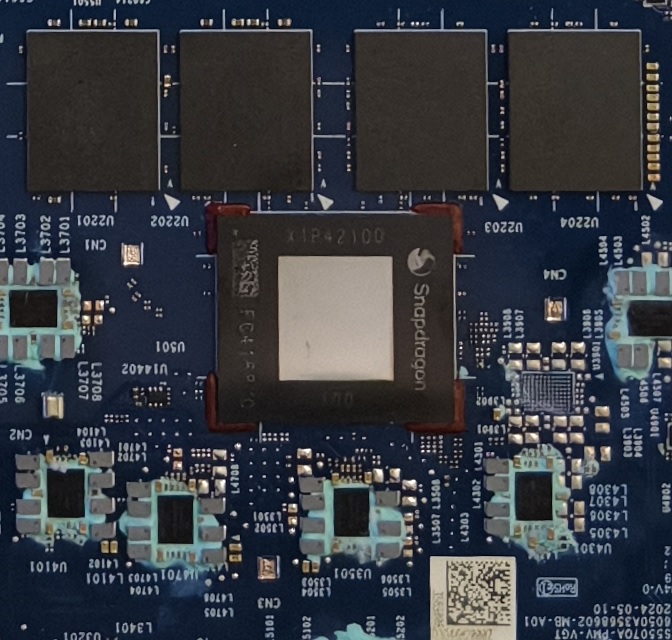
The Snapdragon X Plus 8-core (X1P-42-100) is a relatively affordable ARM architecture processor for use in Windows laptops that was unveiled in Sep 2024. This Qualcomm SoC features 8 Oryon CPU cores running at up to 3.4 GHz, along with the 1.7 TFLOPS X1-45 iGPU and the 45 TOPS Hexagon NPU. The super-fast LPDDR5x-8448 memory controller, USB 4.0 support, TB 4 support and PCIe 4 support are all onboard as well.

Architecture and Features

The Oryon cores (2 clusters of essentially identical cores; 8 threads) are mostly based on Nuvia IP and they reportedly make use of the ARM v8.7 microarchitecture. Much like modern AMD and Intel processors, the Snapdragon chip is compatible with USB 4 and thus with Thunderbolt 4 however it does not appear to support eGPUs as of September 2024.

The X1P-42-100 is based on the smaller die codenamed Purwa, unlike most X Elite and X Plus processors. It is believed to have at least 8 PCIe 4 and 4 PCIe 3 lanes for connecting various kinds of devices. NVMe SSDs are supported with a throughput of up to 7.9 GB/s; furthermore, most laptops built around the chip are expected to have 16 GB of LPDDR5x-8448 RAM. There is also a 45 TOPS NPU present for accelerating AI workloads.

Performance

A lot depends on the power targets of a specific system, just like it is with AMD, Intel and Nvidia products. That being said, the average X1P-42-100 competes with older chips such as the Core i5-1245U when executing multi-threaded x86 code. With apps compiled specifically with Windows on ARM in mind, a Core i7-1360P-like performance level is to be expected which is not bad at all for what is supposed to be a budget CPU.

The 3.4 GHz clock speed is only achievable in single-thread workloads. When under multi-threaded load, the CPU cores will run at no more than 3.2 GHz.

Graphics

The X1-45 used here delivers up to 1.7 TFLOPS of performance. Unlike the much faster 3.8 TFLOPS and 4.6 TFLOPS X1-85 iGPUs, this little guy here has much fewer unified shaders and runs at lower clock speeds, too. Games put it a little behind the GeForce MX350; this kind of performance is sufficient for older games and sub-900p resolutions only.

AVC, HEVC and AV1 video codecs can be both hardware-decoded and hardware-encoded whereas with VP9, only decoding is possible. The highest monitor resolution supported is UHD 2160p.

Power consumption

Expect to see anything between 15 W and 30 W under long-term workloads depending on the system and the power profile chosen. The number includes RAM.

The SoC is built with TSMC's N4P process for better-than-average power efficiency, as of H2 2024.

ModelAMD Ryzen 7 7840HSQualcomm Snapdragon X Plus X1P-42-100
CodenamePhoenix-HS (Zen 4)Oryon
SeriesAMD Phoenix (Zen 4)Qualcomm Snapdragon X
Series: Snapdragon X Oryon
AMD Ryzen 9 7940HS compare4 - 5.2 GHz8 / 16 cores16 MB L3
AMD Ryzen 9 PRO 7940HS compare4 - 5.2 GHz8 / 16 cores16 MB L3
AMD Ryzen 7 7840HS « 3.8 - 5.1 GHz8 / 16 cores16 MB L3
AMD Ryzen 7 7840S compare3.8 - 5.1 GHz8 / 16 cores16 MB L3
AMD Ryzen 5 7640HS compare4.3 - 5 GHz6 / 12 cores16 MB L3
Qualcomm Snapdragon X Elite X1E-00-1DE compare3.8 - 4.3 GHz12 / 12 cores6 MB L3 Oryon
Qualcomm Snapdragon X Elite X1E-84-100 compare3.8 - 4.2 GHz12 / 12 cores6 MB L3 Oryon
Qualcomm Snapdragon X Elite X1E-80-100 compare - 4 GHz12 / 12 cores6 MB L3 Oryon
Qualcomm Snapdragon X Elite X1E-78-100 compare - 3.4 GHz12 / 12 cores6 MB L3 Oryon
Qualcomm Snapdragon X Plus X1P-64-100 compare - 3.4 GHz10 / 10 cores6 MB L3 Oryon
Qualcomm Snapdragon X Plus X1P-46-100 compare - 4 GHz8 / 8 cores6 MB L3 Oryon
Qualcomm Snapdragon X Plus X1P-42-100 « - 3.4 GHz8 / 8 cores6 MB L3 Oryon
Qualcomm Snapdragon X X1-26-100 compare - 2.98 GHz8 / 8 cores6 MB L3 Oryon
Clock3800 - 5100 MHz <=3400 MHz
L1 Cache512 KB2.3 MB
L2 Cache8 MB12 MB
L3 Cache16 MB6 MB
Cores / Threads8 / 168 / 8
8 x 3.4 GHz Qualcomm Oryon
TDP35 Watt30 Watt
Technology4 nm4 nm
Die Size178 mm2
max. Temp.100 °C
SocketFP7/FP7r2/FP8
FeaturesDDR5-5600/LPDDR5x-7500 RAM (incl. ECC), PCIe 4, Ryzen AI, MMX, SSE, SSE2, SSE3, SSSE3, SSE4A, SSE4.1, SSE4.2, AVX, AVX2, AVX-512, BMI2, ABM, FMA, ADX, SMEP, SMAP, SMT, CPB, AES-NI, RDRAND, RDSEED, SHA, SME
iGPUAMD Radeon 780M ( - 2700 MHz)Qualcomm SD X Adreno X1-45 1.7 TFLOPS
Architecturex86ARM
Announced
Manufacturerwww.amd.comwww.qualcomm.com

Benchmarks

Performance Rating - CB R15 + R20 + 7-Zip + X265 + Blender + 3DM11 CPU - R7 7840HS
40.3 pt (67%)
Restrict / Search: Model: Max. age: years
Performance Rating - CB R15 + R20 + 7-Zip + X265 + Blender + 3DM11 CPU - SD X Plus X1P-42-100
30.2 pt (50%)
Restrict / Search: Model: Max. age: years
Cinebench 2024 - Cinebench 2024 CPU Single Core
min: 101     avg: 104.6     median: 105 (59%)     max: 107 Points
min: 107     avg: 108.1     median: 108 (61%)     max: 109 Points
Cinebench 2024 - Cinebench 2024 CPU Multi Core
min: 880     avg: 912     median: 913 (17%)     max: 956 Points
Cinebench R23 - Cinebench R23 Multi Core
min: 15515     avg: 16343     median: 16188 (15%)     max: 17214 Points
min: 6062     avg: 7312     median: 7422 (7%)     max: 8284 Points
Cinebench R23 - Cinebench R23 Single Core
min: 1718     avg: 1769     median: 1774 (75%)     max: 1812 Points
min: 1065     avg: 1110     median: 1109 (47%)     max: 1134 Points
Cinebench R20 - Cinebench R20 CPU (Single Core)
min: 668     avg: 687     median: 688 (75%)     max: 705 Points
min: 406     avg: 419.3     median: 421 (46%)     max: 425 Points
Cinebench R20 - Cinebench R20 CPU (Multi Core)
min: 6061     avg: 6387     median: 6344 (15%)     max: 6744 Points
min: 2361     avg: 2787     median: 2801 (7%)     max: 3097 Points
Cinebench R15 - Cinebench R15 CPU Multi 64 Bit
min: 2473     avg: 2587     median: 2565 (16%)     max: 2729 Points
min: 1191     avg: 1427     median: 1419 (9%)     max: 1556 Points
Cinebench R15 - Cinebench R15 CPU Single 64 Bit
min: 270     avg: 277.2     median: 278 (77%)     max: 286 Points
min: 206     avg: 210.1     median: 211 (58%)     max: 215 Points
Cinebench R11.5 - Cinebench R11.5 CPU Multi 64 Bit
min: 29.59     avg: 29.9     median: 29.7 (38%)     max: 30.25 Points
Cinebench R11.5 - Cinebench R11.5 CPU Single 64 Bit
min: 3.29     avg: 3.3     median: 3.3 (78%)     max: 3.33 Points
Cinebench R10 - Cinebench R10 Rend. Single (32bit)
min: 7515     avg: 7599     median: 7574 (46%)     max: 7709 Points
Cinebench R10 - Cinebench R10 Rend. Multi (32bit)
min: 45602     avg: 48003     median: 48144 (35%)     max: 50264 Points
Cinebench R10 - Cinebench R10 Rend. Multi (64bit)
min: 83726     avg: 85254     median: 84973 (54%)     max: 87064 Points
Cinebench R10 - Cinebench R10 Rend. Single (64bit)
min: 14015     avg: 14130     median: 14177 (17%)     max: 14197 Points
wPrime 2.10 - wPrime 2.0 1024m *
min: 71.922     avg: 73.4     median: 72.8 (1%)     max: 75.535 s
wPrime 2.10 - wPrime 2.0 32m *
min: 2.626     avg: 2.8     median: 2.7 (1%)     max: 3.244 s
WinRAR - WinRAR 4.0
min: 6428     avg: 7133     median: 7271 (12%)     max: 7699 Points
7-Zip 18.03 - 7-Zip 18.03 Multi Thread 4 runs
min: 59538     avg: 69163     median: 70243 (40%)     max: 73035 MIPS
min: 29238     avg: 31053     median: 30828 (18%)     max: 32811 MIPS
7-Zip 18.03 - 7-Zip 18.03 Single Thread 4 runs
min: 6049     avg: 6558     median: 6604 (78%)     max: 6754 MIPS
min: 4087     avg: 4504     median: 4561 (54%)     max: 4675 MIPS
X264 HD Benchmark 4.0 - x264 Pass 2
min: 142.85     avg: 145.4     median: 144.1 (48%)     max: 149.3 fps
X264 HD Benchmark 4.0 - x264 Pass 1
min: 280     avg: 286.5     median: 281.5 (65%)     max: 298 fps
HWBOT x265 Benchmark v2.2 - HWBOT x265 4k Preset
min: 11.7     avg: 19.9     median: 20.4 (36%)     max: 21.8 fps
min: 3.16     avg: 4.9     median: 5 (9%)     max: 6.02 fps
TrueCrypt - TrueCrypt Serpent
min: 1.2     avg: 1.3     median: 1.3 (38%)     max: 1.3 GB/s
TrueCrypt - TrueCrypt Twofish
min: 1.9     avg: 2     median: 2.1 (36%)     max: 2.1 GB/s
TrueCrypt - TrueCrypt AES
min: 10.2     avg: 13.3     median: 14.7 (38%)     max: 14.9 GB/s
Blender - Blender 3.3 Classroom CPU *
min: 298     avg: 324.6     median: 319 (4%)     max: 463 Seconds
min: 711     avg: 898     median: 856 (11%)     max: 1226 Seconds
Blender - Blender 2.79 BMW27 CPU *
min: 185     avg: 198.7     median: 196 (1%)     max: 229 Seconds
min: 399     avg: 496.3     median: 466 (3%)     max: 683 Seconds
R Benchmark 2.5 - R Benchmark 2.5 *
min: 0.4184     avg: 0.4     median: 0.4 (9%)     max: 0.4739 sec
min: 0.728     avg: 0.8     median: 0.7 (16%)     max: 0.777 sec
3DMark 06 - CPU - 3DMark 06 - CPU
min: 14213     avg: 15469     median: 15583 (33%)     max: 16073 Points
Super Pi mod 1.5 XS 1M - Super Pi mod 1.5 XS 1M *
min: 7.112     avg: 7.7     median: 7.2 (2%)     max: 8.774 s
Super Pi mod 1.5 XS 2M - Super Pi mod 1.5 XS 2M *
min: 17.676     avg: 18.9     median: 17.7 (1%)     max: 21.271 s
Super Pi Mod 1.5 XS 32M - Super Pi mod 1.5 XS 32M *
min: 655.388     avg: 690     median: 689.9 (3%)     max: 724.411 s
3DMark Vantage - 3DM Vant. Perf. CPU no Physx
min: 72488     avg: 81330     median: 82000.5 (63%)     max: 85884 Points
3DMark 11 - 3DM11 Performance Physics
min: 17320     avg: 22264     median: 22611 (56%)     max: 25584 Points
min: 11743     avg: 12416     median: 12523 (31%)     max: 12625 Points
3DMark - 3DMark Ice Storm Physics
min: 77280     avg: 88106     median: 89565 (73%)     max: 93910 Points
3DMark - 3DMark Ice Storm Extreme Physics
min: 80023     avg: 88577     median: 88981 (72%)     max: 93208 Points
3DMark - 3DMark Ice Storm Unlimited Physics
min: 83382     avg: 90268     median: 91995 (76%)     max: 95508 Points
3DMark - 3DMark Cloud Gate Physics
min: 13602     avg: 19552     median: 20556.5 (52%)     max: 21602 Points
min: 8737     avg: 8919     median: 8996 (23%)     max: 9024 Points
3DMark - 3DMark Fire Strike Standard Physics
min: 24338     avg: 27634     median: 27816 (50%)     max: 29343 Points
min: 13147     avg: 13554     median: 13563 (24%)     max: 13780 Points
3DMark - 3DMark Time Spy CPU
min: 8903     avg: 10918     median: 11131 (47%)     max: 12218 Points
min: 3282     avg: 4225     median: 3306 (14%)     max: 5699 Points
Geekbench 6.4 - Geekbench 6.4 Single-Core
min: 2585     avg: 2660     median: 2670 (67%)     max: 2721 Points
min: 2287     avg: 2384     median: 2393.5 (60%)     max: 2442 Points
Geekbench 6.4 - Geekbench 6.4 Multi-Core
min: 12111     avg: 12998     median: 13088 (51%)     max: 13498 Points
min: 10833     avg: 11258     median: 11384 (44%)     max: 11508 Points
Geekbench 6.0 - Geekbench 6.0 Single-Core
min: 2488     avg: 2682     median: 2603 (83%)     max: 3105 Points
Geekbench 6.0 - Geekbench 6.0 Multi-Core
min: 12439     avg: 14395     median: 12823.5 (53%)     max: 21003 Points
Geekbench 5.5 - Geekbench 5.1 - 5.5 64 Bit Single-Core
min: 1837     avg: 1962     median: 1957.5 (76%)     max: 2017 Points
min: 1486     avg: 1531     median: 1531 (60%)     max: 1576 Points
Geekbench 5.5 - Geekbench 5.1 - 5.5 64 Bit Multi-Core
min: 8446     avg: 11688     median: 11859.5 (21%)     max: 12339 Points
min: 4457     avg: 5351     median: 5350.5 (10%)     max: 6244 Points
Geekbench 5.0 - Geekbench 5.0 64 Bit Single-Core
min: 1834     avg: 1886     median: 1887 (8%)     max: 1936 Points
Geekbench 5.0 - Geekbench 5.0 64 Bit Multi-Core
min: 8572     avg: 11542     median: 11888 (37%)     max: 12278 Points
Geekbench 4.4 - Geekbench 4.1 - 4.4 64 Bit Single-Core
min: 7879     avg: 8077     median: 8144.5 (81%)     max: 8166 Points
Geekbench 4.4 - Geekbench 4.1 - 4.4 64 Bit Multi-Core
min: 47599     avg: 48497     median: 48725.5 (49%)     max: 48906 Points
Mozilla Kraken 1.1 - Kraken 1.1 Total Score *
min: 485     avg: 511     median: 516 (1%)     max: 544 ms
min: 407.5     avg: 640     median: 472.1 (1%)     max: 1145 ms
Octane V2 - Octane V2 Total Score
min: 91356     avg: 91588     median: 91577 (67%)     max: 91831 Points
min: 78058     avg: 81387     median: 79536 (58%)     max: 88419 Points
WebXPRT 4 - WebXPRT 4 Score
min: 232     avg: 263.8     median: 263 (72%)     max: 319 Points
min: 130.3     avg: 251.9     median: 270 (74%)     max: 284 Points
WebXPRT 3 - WebXPRT 3 Score
min: 288     avg: 316.9     median: 320 (57%)     max: 339 Points
min: 129.9     avg: 356.4     median: 401 (72%)     max: 426 Points
CrossMark - CrossMark Overall
min: 1566     avg: 1769     median: 1802 (67%)     max: 1891 Points
min: 1061     avg: 1186     median: 1161 (43%)     max: 1463 Points
Power Consumption - Prime95 Power Consumption - external Monitor *
min: 64.7     avg: 92.2     median: 86.6 (15%)     max: 137.9 Watt
min: 32.2     avg: 43.1     median: 44.3 (8%)     max: 58.5 Watt
Power Consumption - Cinebench R15 Multi Power Consumption - external Monitor *
min: 74.7     avg: 97.6     median: 88.7 (16%)     max: 135.7 Watt
min: 37.5     avg: 50.7     median: 51.8 (9%)     max: 60.1 Watt
Power Consumption - Idle Power Consumption - external Monitor *
min: 4.73     avg: 13.6     median: 11.5 (8%)     max: 59.2 Watt
min: 2.95     avg: 4.9     median: 4.2 (3%)     max: 9.3 Watt
Power Consumption - Idle Power Consumption 150cd 1min *
min: 7.09     avg: 13.7     median: 12.6 (14%)     max: 35.5 Watt
min: 2.56     avg: 4.5     median: 4.9 (5%)     max: 6.14 Watt
Power Consumption - Power Efficiency - Cinebench R15 Multi external Monitor
min: 20.1     avg: 28.3     median: 30.3 (23%)     max: 33.2 Points per Watt
min: 25.9     avg: 28     median: 27.3 (20%)     max: 31.8 Points per Watt

Average Benchmarks AMD Ryzen 7 7840HS → 100% n=27

Average Benchmarks Qualcomm Snapdragon X Plus X1P-42-100 → 65% n=27

- Range of benchmark values for this graphics card
red legend - Average benchmark values for this graphics card
* Smaller numbers mean a higher performance
1 This benchmark is not used for the average calculation

Add one or more devices and compare

In the following list you can select (and also search for) devices that should be added to the comparison. You can select more than one device.

restrict list:
v1.33
log 07. 02:11:57

#0 ran 0s before starting gpusingle class +0s ... 0s

#1 checking url part for id 14948 +0s ... 0s

#2 checking url part for id 17591 +0s ... 0s

#3 redirected to Ajax server, took 1754525516s time from redirect:0 +0s ... 0s

#4 did not recreate cache, as it is less than 5 days old! Created at Wed, 06 Aug 2025 11:23:17 +0200 +0s ... 0s

#5 composed specs +0.007s ... 0.007s

#6 did output specs +0s ... 0.007s

#7 getting avg benchmarks for device 14948 +0.004s ... 0.011s

#8 got single benchmarks 14948 +0.031s ... 0.043s

#9 getting avg benchmarks for device 17591 +0.004s ... 0.046s

#10 got single benchmarks 17591 +0.01s ... 0.056s

#11 got avg benchmarks for devices +0s ... 0.056s

#12 min, max, avg, median took s +0.051s ... 0.108s

#13 return log +0.002s ... 0.109s

Please share our article, every link counts!
Mail Logo
> Expert Reviews and News on Laptops, Smartphones and Tech Innovations > Benchmarks / Tech > Processor Comparison - Head 2 Head
Redaktion, 2017-09- 8 (Update: 2023-07- 1)