Notebookcheck Logo

AMD Ryzen 5 6600H vs Intel Core i9-11900H vs Intel Core i5-11500B

AMD Ryzen 5 6600H

► remove from comparison AMD R5 6600H

The AMD Ryzen 5 6600H is a processor for big (gaming) laptops based of the Rembrandt generation. The R5 6600H integrates six of the eight cores based on the Zen 3+ microarchitecture. They are clocked at 3.3 (guaranteed base clock) to 4.5 GHz (Turbo) and support SMT / Hyperthreading (12 threads). The chip is manufactured on the modern 6 nm TSMC process. 

The new Zen 3+ is a refresh of the Zen 3 architecture and should not offer a lot of changes. The chip itself however, offers a lot of new features, like support for USB 4 (40 Gbps), PCI-E Gen 4, DDR5-4800MT/s or LPDDR5-6400MT/s, WiFi 6E, Bluetooth LE 5.2, DisplayPort 2, and AV1 decode.

In the 6000 series, AMD finally switched to the current RDNA 2 graphics architecture for the iGPU. The 6600H only offers the slower Radeon 660M with 6 of the 12 CUs enabled and 1.9 GHz max. clock speed.

Performance

The average 6600H in our database is in the same league as the R7 5825U, the R7 6800U and also the Core i5-1340P, as far as multi-thread benchmark scores are concerned. This is a very decent result, as of late 2022.

Your mileage may vary depending on how high the CPU power limits are, and how competent the cooling solution of your system is.

Power consumption

This Ryzen 5 series APU has a default TDP, also known as the long-term power limit, of 45 W. A high-performance cooling solution is a must for a system built around such a chip.

The R5 6600H is built with TSMC's 6 nm process for great, as of early 2023, energy efficiency.

Intel Core i9-11900H

► remove from comparison Intel i9-11900H

The Intel Core i9-11900H is a high end octa core SoC for gaming laptops and mobile workstations. It is based on the Tiger Lake H45 generation and was announced in mid 2021. It integrates eight Willow Cove processor cores (16 threads thanks to HyperThreading). The base clock speed depends on the TDP setting and at 45 Watt is at 2.5 GHz. The single core boost speed can reach up to 4.9 GHz, all cores can reach up to 4.5 GHz. The CPU offers 24 MB level 3 cache and supports DDR4-3200 memory. 

Thanks to the new Tiger Lake architecture, the i9-11900H should be similar or faster than the old Intel Core i9-10885H (Comet Lake-H, 2.4 - 5.3 GHz, 16 MB L3) in single and multi threaded performance and similar to the Ryzen 9 5800H (Zen 3, 3.2 - 4.4 GHz, 16 MB L3). Therefore, the i9 should be one of the fastest laptop CPUs in 2021 and well suited for even very demanding tasks.

The SoC also included the improved Xe graphics card called UHD graphics with all 32 EUs.

Furthermore, Tiger Lake SoCs add PCIe 4 support (20 lanes in the H45 series), AI hardware acceleration, and the partial integration of Thunderbolt 4/USB 4 and Wi-Fi 6E in the chip.

The chip is produced on the improved 10nm process (called 10nm SuperFin) at Intel, which should be comparable to the 7nm process at TSMC (e.g. Ryzen 4000 series). The default TDP is rated at 45 W at 2.5 GHz base speed, at 35 Watt the base clock speed decreases to 2.1 GHz (cTDP down).

All articles on Tiger Lake can be found on our Tiger Lake architecture hub.

Intel Core i5-11500B

► remove from comparison Intel i5-11500B

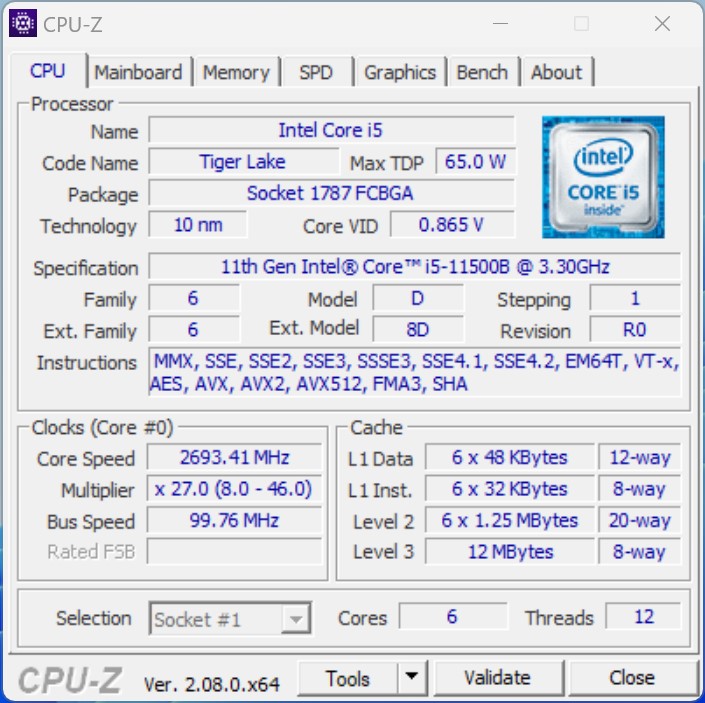
The Intel Core i5-11500B is a hexa-core processor for desktops and mini PCs. It is based on the Tiger Lake architecture (H45) and was presented in Q2 2021. The chip offers a TDP of 65 watts (configurable). The six processor cores can clock from 3.3 to 4.6 GHz (single-core turbo). The processor offers 12 MB level 3 cache and supports DDR4 RAM with up to 3,200 MT/s. The integrated graphics are based on the Xe architecture and are named UHD Graphics (32 EUs). In the 11500B it clocks from 350 to 1,450 MHz. The chip is manufactured using the 10 nm SuperFin process.

Performance

The performance of the Intel Core i5-11500B depends primarily on the performance of the installed cooling unit. The TDP of the SoC can also be lowered. In principle, however, the Intel Core i5-11500B should offer slightly more performance than an Intel Core i5-11400H (6 cores 2.7 - 4.5 GHz).

Features

As with the smaller Tiger Lake chips, Wi-Fi (Wi-Fi 6E) and Thunderbolt 4 / USB 4 are (partially) integrated into the chip for faster, cheaper and space-saving implementations in desktops and mini-PCs. The i5-11500B also offers 20 PCIe 4.0 lanes.

ModelAMD Ryzen 5 6600HIntel Core i9-11900HIntel Core i5-11500B
CodenameRembrandt-H (Zen 3+)Tiger Lake-HTiger Lake-H
SeriesAMD Rembrandt (Zen 3+)Intel Tiger LakeIntel Tiger Lake
Series: Tiger Lake Tiger Lake-H
AMD Ryzen 9 6980HX3.3 - 5 GHz8 / 16 cores16 MB L3
AMD Ryzen 9 PRO 6950H3.3 - 4.9 GHz8 / 16 cores16 MB L3
AMD Ryzen 9 6900HX3.3 - 4.9 GHz8 / 16 cores16 MB L3
AMD Ryzen 9 6900HS3.3 - 4.9 GHz8 / 16 cores16 MB L3
AMD Ryzen 7 6800H3.2 - 4.7 GHz8 / 16 cores16 MB L3
AMD Ryzen 7 PRO 6850H3.2 - 4.7 GHz8 / 16 cores16 MB L3
AMD Ryzen 5 6600H « 3.3 - 4.5 GHz6 / 12 cores16 MB L3
Intel Core i9-11900KB3.3 - 5.3 GHz8 / 16 cores24 MB L3
Intel Core i9-11900H « 2.5 - 4.9 GHz8 / 16 cores24 MB L3
Intel Core i9-11950H2.6 - 5 GHz8 / 16 cores24 MB L3
Intel Xeon W-11955M2.6 - 5 GHz8 / 16 cores24 MB L3
Intel Core i7-11850H2.5 - 4.8 GHz8 / 16 cores24 MB L3
Intel Core i7-11800H2.3 - 4.6 GHz8 / 16 cores24 MB L3
Intel Xeon W-11855M3.2 - 4.9 GHz6 / 12 cores18 MB L3
Intel Core i5-11500B3.3 - 4.6 GHz6 / 12 cores12 MB L3
Intel Core i5-11400H2.7 - 4.5 GHz6 / 12 cores12 MB L3
Intel Core i5-11260H2.6 - 4.4 GHz6 / 12 cores12 MB L3
Intel Core i9-11900KB3.3 - 5.3 GHz8 / 16 cores24 MB L3
Intel Core i9-11900H2.5 - 4.9 GHz8 / 16 cores24 MB L3
Intel Core i9-11950H2.6 - 5 GHz8 / 16 cores24 MB L3
Intel Xeon W-11955M2.6 - 5 GHz8 / 16 cores24 MB L3
Intel Core i7-11850H2.5 - 4.8 GHz8 / 16 cores24 MB L3
Intel Core i7-11800H2.3 - 4.6 GHz8 / 16 cores24 MB L3
Intel Xeon W-11855M3.2 - 4.9 GHz6 / 12 cores18 MB L3
Intel Core i5-11500B « 3.3 - 4.6 GHz6 / 12 cores12 MB L3
Intel Core i5-11400H2.7 - 4.5 GHz6 / 12 cores12 MB L3
Intel Core i5-11260H2.6 - 4.4 GHz6 / 12 cores12 MB L3
Clock3300 - 4500 MHz2500 - 4900 MHz3300 - 4600 MHz
L1 Cache384 KB640 KB480 KB
L2 Cache3 MB10 MB7.5 MB
L3 Cache16 MB24 MB12 MB
Cores / Threads6 / 128 / 166 / 12
TDP45 Watt45 Watt65 Watt
Technology6 nm10 nm10 nm
max. Temp.95 °C100 °C100 °C
SocketFP7/FP7r2BGA1787BGA1787
FeaturesDDR5-4800/LPDDR5-6400 RAM (incl. ECC), PCIe 4, MMX, SSE, SSE2, SSE3, SSSE3, SSE4A, SSE4.1, SSE4.2, AVX, AVX2, BMI2, ABM, FMA, ADX, SMEP, SMAP, SMT, CPB, AES-NI, RDRAND, RDSEED, SHA, SMEDDR4-3200 RAM, PCIe 4, 8 GT/s bus, DL Boost, GNA, RPE, MMX, SSE, SSE2, SSE3, SSSE3, SSE4.1, SSE4.2, AVX, AVX2, AVX-512, BMI2, ABM, FMA, ADX, VMX, SMEP, SMAP, EIST, TM1, TM2, HT, Turbo, SST, AES-NI, RDRAND, RDSEED, SHADDR4-3200 RAM, PCIe 4, 8 GT/s bus, DL Boost, GNA, MMX, SSE, SSE2, SSE3, SSSE3, SSE4.1, SSE4.2, AVX, AVX2, AVX-512, BMI2, ABM, FMA, ADX, VMX, SMEP, SMAP, EIST, TM1, TM2, HT, Turbo, SST, AES-NI, RDRAND, RDSEED, SHA
iGPUAMD Radeon 660M ( - 1900 MHz)Intel UHD Graphics Xe 32EUs (Tiger Lake-H) (350 - 1450 MHz)Intel UHD Graphics Xe 32EUs (Tiger Lake-H) (350 - 1450 MHz)
Architecturex86x86x86
Announced
Manufacturerwww.amd.comark.intel.com

Benchmarks

Performance Rating - CB R15 + R20 + 7-Zip + X265 + Blender + 3DM11 CPU - R5 6600H
34.9 pt (58%)
Restrict / Search: Model: Max. age: years
Performance Rating - CB R15 + R20 + 7-Zip + X265 + Blender + 3DM11 CPU - i9-11900H
36.3 pt (60%)
Restrict / Search: Model: Max. age: years
Performance Rating - CB R15 + R20 + 7-Zip + X265 + Blender + 3DM11 CPU - i5-11500B
33.7 pt (56%)
Restrict / Search: Model: Max. age: years
Cinebench 2024 - Cinebench 2024 CPU Single Core
88 Points (44%)
Cinebench 2024 - Cinebench 2024 CPU Multi Core
451 Points (8%)
Cinebench R23 - Cinebench R23 Multi Core
min: 10226     avg: 10454     median: 10418 (10%)     max: 10717 Points
min: 11135     avg: 12109     median: 12143.5 (11%)     max: 13012 Points
8318 Points (8%)
Cinebench R23 - Cinebench R23 Single Core
min: 1458     avg: 1467     median: 1458 (59%)     max: 1486 Points
min: 1574     avg: 1585     median: 1580.5 (64%)     max: 1605 Points
1484 Points (60%)
Cinebench R20 - Cinebench R20 CPU (Single Core)
min: 564     avg: 574     median: 575 (63%)     max: 584 Points
min: 600     avg: 607     median: 608 (66%)     max: 615 Points
566 Points (62%)
Cinebench R20 - Cinebench R20 CPU (Multi Core)
min: 3965     avg: 4071     median: 4106 (10%)     max: 4141 Points
min: 4324     avg: 4758     median: 4878 (12%)     max: 5160 Points
3236 Points (8%)
Cinebench R15 - Cinebench R15 CPU Multi 64 Bit
min: 1626     avg: 1701     median: 1737 (11%)     max: 1740 Points
min: 1770     avg: 2068     median: 2148 (14%)     max: 2211 Points
1322 Points (8%)
Cinebench R15 - Cinebench R15 CPU Single 64 Bit
min: 231     avg: 236.7     median: 236 (65%)     max: 243 Points
min: 236     avg: 239.8     median: 241 (67%)     max: 243 Points
223 Points (62%)
Cinebench R11.5 - Cinebench R11.5 CPU Multi 64 Bit
15 Points (19%)
Cinebench R11.5 - Cinebench R11.5 CPU Single 64 Bit
2.6 Points (62%)
Cinebench R10 - Cinebench R10 Rend. Single (32bit)
9000 Points (54%)
Cinebench R10 - Cinebench R10 Rend. Multi (32bit)
41001 Points (30%)
Cinebench R10 - Cinebench R10 Rend. Multi (64bit)
54928 Points (35%)
Cinebench R10 - Cinebench R10 Rend. Single (64bit)
11802 Points (14%)
wPrime 2.10 - wPrime 2.0 1024m *
152 s (2%)
wPrime 2.10 - wPrime 2.0 32m *
4.6 s (1%)
WinRAR - WinRAR 4.0
6789 Points (11%)
7-Zip 18.03 - 7-Zip 18.03 Multi Thread 4 runs
min: 39886     avg: 45692     median: 47836 (27%)     max: 49353 MIPS
min: 49486     avg: 52910     median: 53205 (31%)     max: 57263 MIPS
36194 MIPS (21%)
7-Zip 18.03 - 7-Zip 18.03 Single Thread 4 runs
min: 5466     avg: 5580     median: 5553 (65%)     max: 5720 MIPS
min: 5582     avg: 5781     median: 5795 (68%)     max: 6018 MIPS
5498 MIPS (65%)
X264 HD Benchmark 4.0 - x264 Pass 2
68.7 fps (2%)
X264 HD Benchmark 4.0 - x264 Pass 1
234.5 fps (6%)
HWBOT x265 Benchmark v2.2 - HWBOT x265 4k Preset
min: 11.5     avg: 13.2     median: 13.9 (24%)     max: 14.2 fps
min: 13.6     avg: 15     median: 15 (26%)     max: 16.7 fps
10.3 fps (18%)
TrueCrypt - TrueCrypt Serpent
0.8 GB/s (24%)
TrueCrypt - TrueCrypt Twofish
1.3 GB/s (22%)
TrueCrypt - TrueCrypt AES
8.3 GB/s (22%)
Blender - Blender 3.3 Classroom CPU *
min: 497     avg: 512     median: 508 (6%)     max: 532 Seconds
479 Seconds (6%)
673 Seconds (9%)
Blender - Blender 2.79 BMW27 CPU *
min: 291     avg: 296.7     median: 293 (2%)     max: 306 Seconds
min: 231     avg: 247     median: 243 (2%)     max: 270 Seconds
379 Seconds (3%)
R Benchmark 2.5 - R Benchmark 2.5 *
min: 0.4995     avg: 0.5     median: 0.5 (11%)     max: 0.532 sec
min: 0.52     avg: 0.5     median: 0.5 (11%)     max: 0.544 sec
0.6 sec (12%)
3DMark 06 - CPU - 3DMark 06 - CPU
12580 Points (27%)
Super Pi mod 1.5 XS 1M - Super Pi mod 1.5 XS 1M *
7.3 s (2%)
Super Pi mod 1.5 XS 2M - Super Pi mod 1.5 XS 2M *
16 s (1%)
Super Pi Mod 1.5 XS 32M - Super Pi mod 1.5 XS 32M *
373 s (2%)
3DMark Vantage - 3DM Vant. Perf. CPU no Physx
47824 Points (37%)
3DMark 11 - 3DM11 Performance Physics
min: 12022     avg: 14220     median: 14220 (35%)     max: 16418 Points
min: 14467     avg: 17623     median: 18686 (46%)     max: 19231 Points
13784 Points (34%)
3DMark - 3DMark Ice Storm Physics
70795 Points (58%)
3DMark - 3DMark Ice Storm Extreme Physics
70878 Points (58%)
3DMark - 3DMark Ice Storm Unlimited Physics
74085 Points (59%)
3DMark - 3DMark Cloud Gate Physics
min: 12692     avg: 13364     median: 13363.5 (34%)     max: 14035 Points
min: 13550     avg: 15637     median: 16364 (41%)     max: 17649 Points
12557 Points (32%)
3DMark - 3DMark Fire Strike Standard Physics
min: 20214     avg: 21091     median: 21252 (38%)     max: 21808 Points
min: 21513     avg: 24434     median: 24867 (44%)     max: 26502 Points
19930 Points (36%)
3DMark - 3DMark Time Spy CPU
min: 6569     avg: 6979     median: 7023 (30%)     max: 7345 Points
min: 9050     avg: 9865     median: 9631.5 (41%)     max: 11145 Points
7021 Points (30%)
Geekbench 6.5 - Geekbench 6.5 Single-Core
2042 Points (47%)
2355 Points (54%)
2173 Points (50%)
Geekbench 6.5 - Geekbench 6.5 Multi-Core
9240 Points (36%)
9401 Points (36%)
8148 Points (32%)
Geekbench 6.0 - Geekbench 6.0 Single-Core
2058 Points (65%)
Geekbench 6.0 - Geekbench 6.0 Multi-Core
7760 Points (32%)
Geekbench 5.5 - Geekbench 5.1 - 5.5 64 Bit Single-Core
min: 1446     avg: 1478     median: 1474 (50%)     max: 1513 Points
min: 1576     avg: 1634     median: 1632 (55%)     max: 1692 Points
1566 Points (53%)
Geekbench 5.5 - Geekbench 5.1 - 5.5 64 Bit Multi-Core
min: 6403     avg: 7442     median: 7729 (14%)     max: 8195 Points
min: 7725     avg: 9140     median: 9628 (17%)     max: 9856 Points
7132 Points (13%)
Geekbench 5.0 - Geekbench 5.0 64 Bit Single-Core
min: 1417     avg: 1447     median: 1447 (6%)     max: 1477 Points
1535 Points (7%)
Geekbench 5.0 - Geekbench 5.0 64 Bit Multi-Core
min: 6219     avg: 7173     median: 7172.5 (23%)     max: 8126 Points
7012 Points (22%)
Geekbench 4.4 - Geekbench 4.1 - 4.4 64 Bit Single-Core
6663 Points (67%)
Geekbench 4.4 - Geekbench 4.1 - 4.4 64 Bit Multi-Core
28454 Points (28%)
Mozilla Kraken 1.1 - Kraken 1.1 Total Score *
min: 604     avg: 637     median: 637 (1%)     max: 670 ms
min: 603     avg: 606     median: 606 (1%)     max: 608 ms
649 ms (1%)
WebXPRT 4 - WebXPRT 4 Score
min: 193.4     avg: 201.2     median: 201.2 (52%)     max: 209 Points
227 Points (59%)
WebXPRT 3 - WebXPRT 3 Score
min: 233     avg: 245.7     median: 244 (44%)     max: 260 Points
min: 272     avg: 275.2     median: 273 (49%)     max: 286 Points
271 Points (49%)
CrossMark - CrossMark Overall
min: 1399     avg: 1460     median: 1460 (55%)     max: 1521 Points
1632 Points (61%)
1416 Points (53%)
Power Consumption - Prime95 Power Consumption - external Monitor *
min: 78.3     avg: 78.6     median: 78.6 (14%)     max: 78.8 Watt
min: 88.9     avg: 110.4     median: 116 (20%)     max: 122 Watt
75.7 Watt (13%)
Power Consumption - Cinebench R15 Multi Power Consumption - external Monitor *
min: 75.1     avg: 82.8     median: 82.8 (15%)     max: 90.4 Watt
min: 89.3     avg: 137.7     median: 152 (28%)     max: 159 Watt
95 Watt (17%)
Power Consumption - Idle Power Consumption - external Monitor *
8.1 Watt (5%)
17.3 Watt (11%)
14.5 Watt (10%)
Power Consumption - Power Efficiency - Cinebench R15 Multi external Monitor
min: 18     avg: 20.6     median: 20.6 (15%)     max: 23.1 Points per Watt
min: 13.3     avg: 14.4     median: 14.1 (10%)     max: 16 Points per Watt
13.9 Points per Watt (10%)

Average Benchmarks AMD Ryzen 5 6600H → 100% n=23

Average Benchmarks Intel Core i9-11900H → 113% n=23

Average Benchmarks Intel Core i5-11500B → 91% n=23

- Range of benchmark values for this graphics card
red legend - Average benchmark values for this graphics card
* Smaller numbers mean a higher performance
1 This benchmark is not used for the average calculation

v1.34
log 30. 10:25:17

#0 ran 0s before starting gpusingle class +0s ... 0s

#1 checking url part for id 14086 +0s ... 0s

#2 checking url part for id 13143 +0s ... 0s

#3 checking url part for id 17400 +0s ... 0s

#4 redirected to Ajax server, took 1761816317s time from redirect:0 +0s ... 0s

#5 did not recreate cache, as it is less than 5 days old! Created at Tue, 28 Oct 2025 05:18:51 +0100 +0s ... 0s

#6 composed specs +0.005s ... 0.005s

#7 did output specs +0s ... 0.005s

#8 getting avg benchmarks for device 14086 +0.001s ... 0.007s

#9 got single benchmarks 14086 +0.001s ... 0.007s

#10 getting avg benchmarks for device 13143 +0.003s ... 0.011s

#11 got single benchmarks 13143 +0.01s ... 0.02s

#12 getting avg benchmarks for device 17400 +0.001s ... 0.022s

#13 got single benchmarks 17400 +0s ... 0.022s

#14 got avg benchmarks for devices +0s ... 0.022s

#15 min, max, avg, median took s +0.033s ... 0.055s

#16 return log +0s ... 0.055s

Please share our article, every link counts!
Mail Logo
> Expert Reviews and News on Laptops, Smartphones and Tech Innovations > Benchmarks / Tech > Processor Comparison - Head 2 Head
Redaktion, 2017-09- 8 (Update: 2023-07- 1)